
UNITED STATES
SECURITIES AND EXCHANGE COMMISSION
Washington, D.C. 20549
FORM N-CSR
CERTIFIED SHAREHOLDER REPORT OF REGISTERED
MANAGEMENT INVESTMENT COMPANIES
Investment Company Act file number: 811-09689
Wells Fargo Master Trust
(Exact name of registrant as specified in charter)
525 Market St., San Francisco, CA 94105
(Address of principal executive offices) (Zip code)
Catherine Kennedy
Wells Fargo Funds Management, LLC
525 Market St., San Francisco, CA 94105
(Name and address of agent for service)
Registrant’s telephone number, including area code: 800-222-8222
Date of fiscal year end: May 31
Registrant is making a filing for 13 of its series:
Wells Fargo C&B Large Cap Value Portfolio, Wells Fargo Emerging Growth Portfolio, Wells Fargo Index Portfolio, Wells Fargo International Value Portfolio, Wells Fargo Small Company Growth Portfolio, Wells Fargo Small Company Value Portfolio, Wells Fargo Core Bond Portfolio, Wells Fargo Real Return Portfolio, Wells Fargo Diversified Large Cap Growth Portfolio, Wells Fargo Disciplined Large Cap Portfolio, Wells Fargo Disciplined International Developed Markets Portfolio, Wells Fargo Large Company Value Portfolio, and Wells Fargo Managed Fixed Income Portfolio.
Date of reporting period: May 31, 2020
ITEM 1. REPORT TO STOCKHOLDERS
Annual Report
May 31, 2020
Wells Fargo
Managed Fixed Income Portfolio
|
|
|
Reduce clutter. Save trees. |
Sign up for electronic delivery of prospectuses and
shareholder reports at wellsfargo.com/
advantagedelivery |
INVESTMENT PRODUCTS: NOT FDIC INSURED ◾ NO BANK GUARANTEE ◾ MAY LOSE VALUE
Wells Fargo Managed Fixed Income Portfolio | 1
Fund information (unaudited)
Investment objective
The Portfolio seeks long-term capital appreciation.
Manager
Wells Fargo Funds Management, LLC
Subadviser
Galliard Capital Management, Inc.
Portfolio managers
Andrea Johnson, CFA®‡
Brandon Kanz, CFA®‡
| | | | |
|
| Ten largest holdings (%) as of May 31, 20201 | |
| | |
FNMA, 4.50%, 1-1-2051 | | | 3.62 | |
| | |
U.S. Treasury Bond, 2.38%, 11-15-2049 | | | 3.19 | |
| | |
FNMA, 4.00%, 8-1-2051 | | | 3.05 | |
| | |
FNMA, 3.97%, 6-1-2025 | | | 1.67 | |
| | |
FHLMC Series 2018-3 Class MA, 3.50%, 8-25-2057 | | | 1.36 | |
| | |
FHLMC, 4.50%, 11-1-2048 | | | 1.26 | |
| | |
SBA Series 2018-10B Class 1, 3.55%, 9-10-2028 | | | 1.06 | |
| | |
WFRBS Commercial Mortgage Trust Series 2013-C17 Class A4, 4.02%, 12-15-2046 | | | 1.00 | |
| | |
JPMorgan Chase Commercial Mortgage Securities Trust Series 2014-C20 Class A5, 3.80%, 7-15-2047 | | | 0.94 | |
| | |
SBA Series 2018-20H Class 1, 3.58%, 8-1-2038 | | | 0.85 | |
|
|
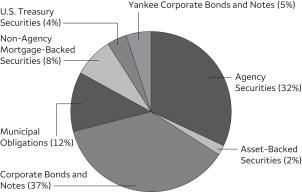
| Portfolio allocation as of May 31, 20202 |
|
 |
| ‡ | CFA® and Chartered Financial Analyst® are trademarks owned by CFA Institute. |
| 1 | The ten largest holdings, excluding cash, cash equivalents and any money market funds, are calculated based on the value of the investments divided by the total net assets of the Portfolio. Holdings are subject to change and may have changed since the date specified. |
| 2 | Amounts are calculated based on the total long-term investments of the Portfolio. These amounts are subject to change and may have changed since the date specified. |
2 | Wells Fargo Managed Fixed Income Portfolio
Portfolio of investments—May 31, 2020
| | | | | | | | | | | | | | | | |
| | | Interest rate | | | Maturity date | | | Principal | | | Value | |
| Agency Securities: 30.57% | |
FHLMC | | | 3.50 | % | | | 8-1-2049 | | | $ | 978,012 | | | $ | 1,030,932 | |
FHLMC | | | 3.00 | | | | 7-1-2046 | | | | 528,819 | | | | 569,594 | |
FHLMC | | | 3.00 | | | | 7-1-2046 | | | | 704,777 | | | | 754,379 | |
FHLMC | | | 3.00 | | | | 11-1-2049 | | | | 2,635,680 | | | | 2,790,932 | |
FHLMC | | | 3.50 | | | | 4-1-2043 | | | | 880,497 | | | | 955,743 | |
FHLMC | | | 3.50 | | | | 5-1-2044 | | | | 420,278 | | | | 460,297 | |
FHLMC | | | 3.50 | | | | 6-1-2046 | | | | 340,775 | | | | 367,642 | |
FHLMC | | | 3.50 | | | | 2-1-2047 | | | | 2,242,855 | | | | 2,439,146 | |
FHLMC | | | 3.50 | | | | 4-1-2047 | | | | 365,055 | | | | 399,659 | |
FHLMC | | | 3.50 | | | | 12-1-2047 | | | | 1,487,326 | | | | 1,628,316 | |
FHLMC | | | 3.50 | | | | 3-1-2048 | | | | 1,869,558 | | | | 2,014,020 | |
FHLMC | | | 4.00 | | | | 4-1-2044 | | | | 524,690 | | | | 590,860 | |
FHLMC | | | 4.00 | | | | 8-1-2044 | | | | 341,917 | | | | 379,500 | |
FHLMC | | | 4.00 | | | | 6-1-2048 | | | | 2,135,934 | | | | 2,332,260 | |
FHLMC | | | 4.50 | | | | 8-1-2048 | | | | 2,786,871 | | | | 3,015,098 | |
FHLMC | | | 4.50 | | | | 11-1-2048 | | | | 2,875,311 | | | | 3,163,070 | |
FHLMC | | | 4.50 | | | | 11-1-2048 | | | | 5,284,715 | | | | 5,832,805 | |
FHLMC Series 2018-3 Class MA | | | 3.50 | | | | 8-25-2057 | | | | 5,881,010 | | | | 6,276,074 | |
FHLMC Series 2019-3 Class M55D | | | 4.00 | | | | 10-25-2058 | | | | 1,022,928 | | | | 1,112,501 | |
FHLMC Structured Pass-Through Securities Series T-20 Class A6 | | | 7.49 | | | | 9-25-2029 | | | | 18,511 | | | | 19,575 | |
FHLMC Structured Pass-Through Securities Series T-58 Class 4A | | | 7.50 | | | | 9-25-2043 | | | | 668,697 | | | | 797,617 | |
FNMA | | | 3.00 | | | | 4-1-2047 | | | | 2,377,974 | | | | 2,514,422 | |
FNMA | | | 2.50 | | | | 8-1-2031 | | | | 296,807 | | | | 311,458 | |
FNMA | | | 2.50 | | | | 2-1-2035 | | | | 1,076,469 | | | | 1,133,603 | |
FNMA | | | 2.50 | | | | 2-1-2035 | | | | 1,490,815 | | | | 1,567,145 | |
FNMA ±± | | | 2.54 | | | | 5-1-2023 | | | | 293,152 | | | | 305,962 | |
FNMA | | | 2.73 | | | | 1-1-2023 | | | | 532,466 | | | | 554,908 | |
FNMA | | | 2.73 | | | | 9-1-2023 | | | | 550,472 | | | | 579,074 | |
FNMA | | | 3.00 | | | | 12-1-2032 | | | | 36,588 | | | | 38,952 | |
FNMA | | | 3.00 | | | | 7-1-2046 | | | | 415,300 | | | | 447,185 | |
FNMA | | | 3.00 | | | | 12-1-2049 | | | | 2,565,605 | | | | 2,716,734 | |
FNMA | | | 3.00 | | | | 12-1-2049 | | | | 2,201,314 | | | | 2,330,984 | |
FNMA ±± | | | 3.04 | | | | 9-1-2025 | | | | 3,469,112 | | | | 3,768,964 | |
FNMA | | | 3.07 | | | | 2-1-2026 | | | | 360,000 | | | | 396,163 | |
FNMA | | | 3.08 | | | | 1-1-2026 | | | | 480,000 | | | | 528,034 | |
FNMA ±± | | | 3.09 | | | | 11-1-2022 | | | | 206,683 | | | | 215,417 | |
FNMA | | | 3.35 | | | | 1-1-2028 | | | | 274,536 | | | | 314,034 | |
FNMA ±± | | | 3.35 | | | | 11-1-2026 | | | | 3,256,872 | | | | 3,588,572 | |
FNMA ±± | | | 3.40 | | | | 12-1-2027 | | | | 1,210,837 | | | | 1,376,562 | |
FNMA | | | 3.50 | | | | 10-1-2032 | | | | 537,438 | | | | 578,239 | |
FNMA | | | 3.50 | | | | 11-1-2042 | | | | 220,584 | | | | 241,235 | |
FNMA | | | 3.50 | | | | 11-1-2042 | | | | 260,895 | | | | 283,239 | |
FNMA | | | 3.50 | | | | 2-1-2043 | | | | 141,923 | | | | 154,078 | |
FNMA | | | 3.50 | | | | 11-1-2045 | | | | 1,306,770 | | | | 1,421,259 | |
FNMA | | | 3.50 | | | | 4-1-2046 | | | | 174,907 | | | | 190,239 | |
FNMA | | | 3.50 | | | | 7-1-2046 | | | | 493,248 | | | | 536,484 | |
FNMA | | | 3.50 | | | | 11-1-2046 | | | | 571,319 | | | | 621,401 | |
FNMA | | | 3.50 | | | | 8-1-2047 | | | | 2,651,370 | | | | 2,881,778 | |
FNMA | | | 3.62 | | | | 1-1-2026 | | | | 1,973,228 | | | | 2,202,028 | |
FNMA | | | 3.62 | | | | 1-1-2026 | | | | 1,660,637 | | | | 1,853,192 | |
FNMA | | | 3.97 | | | | 6-1-2025 | | | | 6,885,033 | | | | 7,729,046 | |
FNMA | | | 4.00 | | | | 11-1-2040 | | | | 258,167 | | | | 280,923 | |
FNMA | | | 4.00 | | | | 4-1-2041 | | | | 337,249 | | | | 366,971 | |
FNMA | | | 4.00 | | | | 8-1-2046 | | | | 369,995 | | | | 401,628 | |
FNMA | | | 4.00 | | | | 3-1-2049 | | | | 1,392,776 | | | | 1,516,992 | |
FNMA | | | 4.00 | | | | 8-1-2051 | | | | 12,848,845 | | | | 14,103,046 | |
The accompanying notes are an integral part of these financial statements.
Wells Fargo Managed Fixed Income Portfolio | 3
Portfolio of investments—May 31, 2020
| | | | | | | | | | | | | | | | |
| | | Interest rate | | | Maturity date | | | Principal | | | Value | |
| Agency Securities (continued) | |
FNMA | | | 4.00 | % | | | 7-1-2056 | | | $ | 476,346 | | | $ | 528,741 | |
FNMA | | | 4.50 | | | | 8-1-2048 | | | | 2,016,303 | | | | 2,183,953 | |
FNMA | | | 4.50 | | | | 1-1-2051 | | | | 14,962,156 | | | | 16,726,116 | |
FNMA | | | 4.50 | | | | 6-1-2056 | | | | 379,738 | | | | 425,585 | |
FNMA | | | 4.50 | | | | 6-1-2056 | | | | 570,260 | | | | 639,109 | |
FNMA | | | 4.50 | | | | 6-1-2056 | | | | 407,121 | | | | 456,276 | |
FNMA | | | 5.00 | | | | 9-1-2033 | | | | 108,154 | | | | 123,782 | |
FNMA | | | 5.50 | | | | 2-1-2036 | | | | 65,590 | | | | 71,656 | |
FNMA Series 2002-90 Class A2 | | | 6.50 | | | | 11-25-2042 | | | | 295,978 | | | | 346,600 | |
FNMA Series 2002-T4 Class A2 | | | 7.00 | | | | 12-25-2041 | | | | 114,844 | | | | 135,357 | |
FNMA Series 2002-W4 Class A4 | | | 6.25 | | | | 5-25-2042 | | | | 1,037,694 | | | | 1,218,287 | |
FNMA Series 2003-W4 Class 3A ±± | | | 5.63 | | | | 10-25-2042 | | | | 176,761 | | | | 205,454 | |
FNMA Series 2004-T2 Class 1A1 | | | 6.00 | | | | 11-25-2043 | | | | 382,036 | | | | 446,475 | |
FNMA Series 2004-T3 Class A1 | | | 6.00 | | | | 2-25-2044 | | | | 600,078 | | | | 707,164 | |
FNMA Series 2004-W01 Class 2A2 | | | 7.00 | | | | 12-25-2033 | | | | 98,238 | | | | 116,402 | |
FNMA Series 2004-W11 Class 1A3 | | | 7.00 | | | | 5-25-2044 | | | | 601,147 | | | | 691,367 | |
FNMA Series 2004-W8 Class 3A | | | 7.50 | | | | 6-25-2044 | | | | 170,634 | | | | 204,685 | |
GNMA | | | 6.50 | | | | 10-15-2023 | | | | 7,057 | | | | 7,754 | |
GNMA | | | 6.50 | | | | 11-15-2023 | | | | 3,931 | | | | 4,320 | |
GNMA | | | 6.50 | | | | 11-15-2023 | | | | 1,805 | | | | 1,983 | |
GNMA | | | 6.50 | | | | 12-15-2023 | | | | 6,533 | | | | 7,179 | |
GNMA | | | 6.50 | | | | 1-15-2024 | | | | 9,372 | | | | 10,298 | |
GNMA | | | 7.00 | | | | 8-15-2027 | | | | 41,237 | | | | 47,095 | |
SBA Series 2006-20B Class 1 | | | 5.35 | | | | 2-1-2026 | | | | 165,756 | | | | 178,720 | |
SBA Series 2006-20H Class 1 | | | 5.70 | | | | 8-1-2026 | | | | 75,522 | | | | 81,969 | |
SBA Series 2007-20J Class 1 | | | 5.57 | | | | 10-1-2027 | | | | 202,384 | | | | 218,379 | |
SBA Series 2013-20A Class 1 | | | 2.13 | | | | 1-1-2033 | | | | 248,592 | | | | 255,735 | |
SBA Series 2013-20J Class 1 | | | 3.37 | | | | 10-1-2033 | | | | 275,821 | | | | 293,633 | |
SBA Series 2014-10A Class 1 | | | 3.19 | | | | 3-10-2024 | | | | 208,050 | | | | 215,483 | |
SBA Series 2014-10B Class 1 | | | 3.02 | | | | 9-10-2024 | | | | 319,268 | | | | 331,960 | |
SBA Series 2014-20A Class 1 | | | 3.46 | | | | 1-1-2034 | | | | 254,048 | | | | 272,146 | |
SBA Series 2015-10B Class 1 | | | 2.83 | | | | 9-10-2025 | | | | 335,566 | | | | 351,694 | |
SBA Series 2015-20C Class 1 | | | 2.72 | | | | 3-1-2035 | | | | 339,394 | | | | 352,134 | |
SBA Series 2015-20E Class 1 | | | 2.77 | | | | 5-1-2035 | | | | 509,621 | | | | 535,286 | |
SBA Series 2015-20F Class 1 | | | 2.98 | | | | 6-1-2035 | | | | 372,646 | | | | 397,815 | |
SBA Series 2017-10A Class 1 | | | 2.85 | | | | 3-10-2027 | | | | 447,627 | | | | 468,529 | |
SBA Series 2017-20F Class 1 | | | 2.81 | | | | 6-1-2037 | | | | 243,448 | | | | 257,590 | |
SBA Series 2018-10B Class 1 | | | 3.55 | | | | 9-10-2028 | | | | 4,572,783 | | | | 4,896,162 | |
SBA Series 2018-20E Class 1 | | | 3.50 | | | | 5-1-2038 | | | | 2,135,919 | | | | 2,335,052 | |
SBA Series 2018-20G Class 1 | | | 3.54 | | | | 7-1-2038 | | | | 2,654,269 | | | | 2,906,250 | |
SBA Series 2018-20H Class 1 | | | 3.58 | | | | 8-1-2038 | | | | 3,586,863 | | | | 3,929,340 | |
SBA Series 2018-20K Class 1 | | | 3.87 | | | | 11-1-2038 | | | | 2,449,426 | | | | 2,730,753 | |
| |
Total Agency Securities (Cost $131,541,267) | | | | 141,294,239 | |
| | | | | | | | | | | | | | | | |
| | | | |
| Asset-Backed Securities: 1.66% | | | | | | | | | | | | |
ECMC Group Student Loan Trust Series 16-1A Class A (1 Month LIBOR +1.35%) 144A± | | | 1.52 | | | | 7-26-2066 | | | | 310,378 | | | | 301,876 | |
ECMC Group Student Loan Trust Series 18-2A Class A (1 Month LIBOR +0.80%) 144A± | | | 0.97 | | | | 9-25-2068 | | | | 2,355,093 | | | | 2,250,268 | |
Ford Credit Auto Owner Trust Series 2015-2 Class A 144A | | | 2.44 | | | | 1-15-2027 | | | | 600,000 | | | | 600,818 | |
Ford Credit Auto Owner Trust Series 2018-2 Class A 144A | | | 3.47 | | | | 1-15-2030 | | | | 3,200,000 | | | | 3,322,852 | |
MMAF Equipment Finance LLC Series 2017-AA Class A5 144A | | | 2.68 | | | | 7-16-2027 | | | | 695,000 | | | | 698,860 | |
South Carolina Student Loan Corporation Series 2014-1 Class B (1 Month LIBOR +1.50%) ± | | | 1.87 | | | | 8-1-2035 | | | | 500,000 | | | | 479,882 | |
| |
Total Asset-Backed Securities (Cost $7,638,552) | | | | 7,654,556 | |
| | | | | | | | | | | | | | | | |
The accompanying notes are an integral part of these financial statements.
4 | Wells Fargo Managed Fixed Income Portfolio
Portfolio of investments—May 31, 2020
| | | | | | | | | | | | | | | | |
| | | Interest rate | | | Maturity date | | | Principal | | | Value | |
Corporate Bonds and Notes: 36.69% | | | | | | | | | | | | | | | | |
| | | | |
Communication Services: 1.46% | | | | | | | | | | | | | | | | |
| | | | |
| Diversified Telecommunication Services: 0.91% | | | | | | | | | | | | |
AT&T Incorporated | | | 2.75 | % | | | 6-1-2031 | | | $ | 535,000 | | | $ | 538,690 | |
AT&T Incorporated | | | 4.75 | | | | 5-15-2046 | | | | 1,280,000 | | | | 1,492,292 | |
AT&T Incorporated | | | 5.25 | | | | 3-1-2037 | | | | 60,000 | | | | 73,299 | |
Verizon Communications Incorporated | | | 4.50 | | | | 8-10-2033 | | | | 40,000 | | | | 49,604 | |
Verizon Communications Incorporated | | | 4.81 | | | | 3-15-2039 | | | | 1,500,000 | | | | 1,924,830 | |
Verizon Communications Incorporated | | | 5.25 | | | | 3-16-2037 | | | | 110,000 | | | | 148,013 | |
| | | | |
| | | | | | | | | | | | | | | 4,226,728 | |
| | | | | | | | | | | | | | | | |
| | | | |
| Entertainment: 0.13% | | | | | | | | | | | | |
Walt Disney Company | | | 2.65 | | | | 1-13-2031 | | | | 540,000 | | | | 575,875 | |
| | | | | | | | | | | | | | | | |
| | | | |
| Media: 0.42% | | | | | | | | | | | | |
CCO Holdings LLC 144A | | | 5.75 | | | | 2-15-2026 | | | | 425,000 | | | | 443,139 | |
Comcast Corporation | | | 1.95 | | | | 1-15-2031 | | | | 550,000 | | | | 550,721 | |
Lamar Media Corporation | | | 5.75 | | | | 2-1-2026 | | | | 895,000 | | | | 931,919 | |
| | | | |
| | | | | | | | | | | | | | | 1,925,779 | |
| | | | | | | | | | | | | | | | |
| | | | |
Consumer Discretionary: 4.14% | | | | | | | | | | | | | | | | |
| | | | |
| Auto Components: 0.36% | | | | | | | | | | | | |
Allison Transmission Incorporated 144A | | | 5.00 | | | | 10-1-2024 | | | | 1,655,000 | | | | 1,667,413 | |
| | | | | | | | | | | | | | | | |
| | | | |
| Automobiles: 0.16% | | | | | | | | | | | | |
General Motors Company | | | 4.88 | | | | 10-2-2023 | | | | 400,000 | | | | 413,823 | |
Volkswagen Group of America Incorporated 144A | | | 2.85 | | | | 9-26-2024 | | | | 300,000 | | | | 308,731 | |
| | | | |
| | | | | | | | | | | | | | | 722,554 | |
| | | | | | | | | | | | | | | | |
| | | | |
| Diversified Consumer Services: 2.78% | | | | | | | | | | | | |
Duke University | | | 3.20 | | | | 10-1-2038 | | | | 1,175,000 | | | | 1,263,632 | |
Johns Hopkins University | | | 2.81 | | | | 1-1-2060 | | | | 420,000 | | | | 417,998 | |
Massachusetts Institute of Technology | | | 3.96 | | | | 7-1-2038 | | | | 1,780,000 | | | | 2,203,363 | |
Massachusetts Institute of Technology | | | 4.68 | | | | 7-1-2114 | | | | 120,000 | | | | 172,699 | |
Massachusetts Institute of Technology | | | 7.25 | | | | 11-2-2096 | | | | 500,000 | | | | 866,220 | |
Northwestern University | | | 3.66 | | | | 12-1-2057 | | | | 105,000 | | | | 129,715 | |
Northwestern University | | | 3.69 | | | | 12-1-2038 | | | | 1,915,000 | | | | 2,123,612 | |
President and Fellows of Harvard College | | | 3.62 | | | | 10-1-2037 | | | | 275,000 | | | | 321,800 | |
President and Fellows of Harvard College | | | 4.88 | | | | 10-15-2040 | | | | 183,000 | | | | 249,853 | |
President and Fellows of Harvard College | | | 5.63 | | | | 10-1-2038 | | | | 525,000 | | | | 754,826 | |
Princeton University | | | 5.70 | | | | 3-1-2039 | | | | 1,640,000 | | | | 2,492,988 | |
Service Corporation International | | | 7.50 | | | | 4-1-2027 | | | | 440,000 | | | | 488,400 | |
University of Southern California | | | 3.03 | | | | 10-1-2039 | | | | 1,250,000 | | | | 1,345,719 | |
| | | | |
| | | | | | | | | | | | | | | 12,830,825 | |
| | | | | | | | | | | | | | | | |
| | | | |
| Hotels, Restaurants & Leisure: 0.30% | | | | | | | | | | | | |
Cedar Fair LP | | | 5.38 | | | | 6-1-2024 | | | | 1,480,000 | | | | 1,406,311 | |
| | | | | | | | | | | | | | | | |
| | | | |
| Textiles, Apparel & Luxury Goods: 0.54% | | | | | | | | | | | | |
HanesBrands Incorporated 144A | | | 4.63 | | | | 5-15-2024 | | | | 200,000 | | | | 203,500 | |
HanesBrands Incorporated 144A | | | 4.88 | | | | 5-15-2026 | | | | 1,250,000 | | | | 1,265,625 | |
The William Carter Company 144A | | | 5.63 | | | | 3-15-2027 | | | | 100,000 | | | | 102,149 | |
Wolverine World Wide Incorporated 144A | | | 5.00 | | | | 9-1-2026 | | | | 1,000,000 | | | | 947,500 | |
| | | | |
| | | | | | | | | | | | | | | 2,518,774 | |
| | | | | | | | | | | | | | | | |
The accompanying notes are an integral part of these financial statements.
Wells Fargo Managed Fixed Income Portfolio | 5
Portfolio of investments—May 31, 2020
| | | | | | | | | | | | | | | | |
| | | Interest rate | | | Maturity date | | | Principal | | | Value | |
Consumer Staples: 0.31% | | | | | | | | | | | | | | | | |
| | | | |
| Beverages: 0.21% | | | | | | | | | | | | |
Anheuser-Busch InBev Worldwide Incorporated | | | 4.70 | % | | | 2-1-2036 | | | $ | 870,000 | | | $ | 991,963 | |
| | | | | | | | | | | | | | | | |
| | | | |
| Food Products: 0.10% | | | | | | | | | | | | |
Ingredion Incorporated | | | 2.90 | | | | 6-1-2030 | | | | 320,000 | | | | 334,352 | |
Kraft Heinz Foods Company | | | 4.63 | | | | 1-30-2029 | | | | 120,000 | | | | 129,449 | |
| | | | |
| | | | | | | | | | | | | | | 463,801 | |
| | | | | | | | | | | | | | | | |
| | | | |
Energy: 5.09% | | | | | | | | | | | | | | | | |
| | | | |
| Energy Equipment & Services: 0.52% | | | | | | | | | | | | |
Baker Hughes LLC | | | 3.34 | | | | 12-15-2027 | | | | 1,500,000 | | | | 1,557,197 | |
Halliburton Company | | | 2.92 | | | | 3-1-2030 | | | | 820,000 | | | | 751,377 | |
Halliburton Company | | | 3.80 | | | | 11-15-2025 | | | | 92,000 | | | | 97,339 | |
| | | | |
| | | | | | | | | | | | | | | 2,405,913 | |
| | | | | | | | | | | | | | | | |
| | | | |
| Oil, Gas & Consumable Fuels: 4.57% | | | | | | | | | | | | |
Antero Resources Corporation | | | 5.00 | | | | 3-1-2025 | | | | 1,750,000 | | | | 997,500 | |
Chevron Corporation | | | 2.24 | | | | 5-11-2030 | | | | 490,000 | | | | 516,404 | |
Cimarex Energy Company | | | 3.90 | | | | 5-15-2027 | | | | 500,000 | | | | 488,044 | |
Enable Midstream Partners | | | 4.95 | | | | 5-15-2028 | | | | 790,000 | | | | 669,264 | |
EnLink Midstream Partners LP | | | 4.85 | | | | 7-15-2026 | | | | 1,325,000 | | | | 1,066,625 | |
Enterprise Products Operating LLC | | | 3.75 | | | | 2-15-2025 | | | | 1,500,000 | | | | 1,649,932 | |
Enterprise Products Operating LLC | | | 4.15 | | | | 10-16-2028 | | | | 260,000 | | | | 296,406 | |
Florida Gas Transmission Company 144A | | | 4.35 | | | | 7-15-2025 | | | | 1,521,000 | | | | 1,704,431 | |
Gulfstream Natural Gas System LLC 144A | | | 6.19 | | | | 11-1-2025 | | | | 210,000 | | | | 243,986 | |
Hess Corporation | | | 4.30 | | | | 4-1-2027 | | | | 800,000 | | | | 804,893 | |
Magellan Midstream Partners LP | | | 5.00 | | | | 3-1-2026 | | | | 170,000 | | | | 192,119 | |
Marathon Oil Corporation | | | 3.85 | | | | 6-1-2025 | | | | 1,030,000 | | | | 975,689 | |
Marathon Petroleum Corporation | | | 5.13 | | | | 12-15-2026 | | | | 1,500,000 | | | | 1,685,616 | |
MPLX LP | | | 4.13 | | | | 3-1-2027 | | | | 1,500,000 | | | | 1,549,269 | |
Newfield Exploration Company | | | 5.38 | | | | 1-1-2026 | | | | 959,000 | | | | 849,985 | |
Newfield Exploration Company | | | 5.63 | | | | 7-1-2024 | | | | 249,000 | | | | 226,731 | |
NuStar Logistics LP | | | 6.00 | | | | 6-1-2026 | | | | 600,000 | | | | 576,000 | |
Occidental Petroleum Corporation | | | 3.20 | | | | 8-15-2026 | | | | 1,070,000 | | | | 780,779 | |
Range Resources Corporation | | | 5.00 | | | | 3-15-2023 | | | | 1,800,000 | | | | 1,628,262 | |
Southwestern Energy Company | | | 6.20 | | | | 1-23-2025 | | | | 945,000 | | | | 848,799 | |
Transcontinental Gas Pipe Line Company LLC 144A | | | 3.25 | | | | 5-15-2030 | | | | 790,000 | | | | 840,679 | |
Transcontinental Gas Pipe Line Company LLC | | | 7.85 | | | | 2-1-2026 | | | | 1,200,000 | | | | 1,522,828 | |
Western Midstream Operating LP | | | 4.05 | | | | 2-1-2030 | | | | 1,100,000 | | | | 986,920 | |
| | | | |
| | | | | | | | | | | | | | | 21,101,161 | |
| | | | | | | | | | | | | | | | |
| | | | |
Financials: 5.46% | | | | | | | | | | | | | | | | |
| | | | |
| Banks: 2.35% | | | | | | | | | | | | |
Bank of America Corporation (3 Month LIBOR +1.51%) ± | | | 3.71 | | | | 4-24-2028 | | | | 1,440,000 | | | | 1,585,334 | |
Bank of America Corporation | | | 3.88 | | | | 8-1-2025 | | | | 700,000 | | | | 784,843 | |
Citigroup Incorporated (U.S. SOFR +2.11%) %%± | | | 2.57 | | | | 6-3-2031 | | | | 370,000 | | | | 369,629 | |
Citigroup Incorporated | | | 3.30 | | | | 4-27-2025 | | | | 1,000,000 | | | | 1,090,052 | |
Citigroup Incorporated | | | 3.40 | | | | 5-1-2026 | | | | 1,000,000 | | | | 1,083,074 | |
Citigroup Incorporated | | | 4.40 | | | | 6-10-2025 | | | | 65,000 | | | | 71,900 | |
Citizens Bank NA | | | 2.25 | | | | 4-28-2025 | | | | 405,000 | | | | 413,234 | |
JPMorgan Chase & Company (U.S. SOFR +1.89%) ± | | | 2.18 | | | | 6-1-2028 | | | | 310,000 | | | | 311,934 | |
JPMorgan Chase & Company | | | 3.20 | | | | 6-15-2026 | | | | 500,000 | | | | 545,731 | |
JPMorgan Chase & Company (3 Month LIBOR +1.34%) ± | | | 3.78 | | | | 2-1-2028 | | | | 1,100,000 | | | | 1,215,342 | |
The accompanying notes are an integral part of these financial statements.
6 | Wells Fargo Managed Fixed Income Portfolio
Portfolio of investments—May 31, 2020
| | | | | | | | | | | | | | | | |
| | | Interest rate | | | Maturity date | | | Principal | | | Value | |
| | | | |
| Banks (continued) | | | | | | | | | | | | |
JPMorgan Chase & Company (3 Month LIBOR +1.26%) ± | | | 4.20 | % | | | 7-23-2029 | | | $ | 600,000 | | | $ | 686,205 | |
JPMorgan Chase & Company (3 Month LIBOR +1.33%) ± | | | 4.45 | | | | 12-5-2029 | | | | 470,000 | | | | 548,628 | |
KeyCorp | | | 2.25 | | | | 4-6-2027 | | | | 690,000 | | | | 690,002 | |
National Capital Commerce Incorporated (3 Month LIBOR +0.98%) ± | | | 2.41 | | | | 4-1-2027 | | | | 400,000 | | | | 344,108 | |
PNC Bank | | | 4.05 | | | | 7-26-2028 | | | | 1,000,000 | | | | 1,147,306 | |
| | | | |
| | | | | | | | | | | | | | | 10,887,322 | |
| | | | | | | | | | | | | | | | |
| | | | |
| Capital Markets: 1.25% | | | | | | | | | | | | |
Goldman Sachs Capital II (3 Month LIBOR +0.77%) ± | | | 4.00 | | | | 12-29-2049 | | | | 6,000 | | | | 5,090 | |
Goldman Sachs Group Incorporated | | | 3.50 | | | | 1-23-2025 | | | | 1,100,000 | | | | 1,180,681 | |
Goldman Sachs Group Incorporated | | | 3.75 | | | | 2-25-2026 | | | | 1,500,000 | | | | 1,646,737 | |
Goldman Sachs Group Incorporated | | | 4.25 | | | | 10-21-2025 | | | | 120,000 | | | | 133,355 | |
Morgan Stanley | | | 3.88 | | | | 1-27-2026 | | | | 1,000,000 | | | | 1,125,135 | |
Morgan Stanley | | | 3.95 | | | | 4-23-2027 | | | | 1,000,000 | | | | 1,113,432 | |
MSCI Incorporated 144A | | | 5.75 | | | | 8-15-2025 | | | | 535,000 | | | | 555,373 | |
| | | | |
| | | | | | | | | | | | | | | 5,759,803 | |
| | | | | | | | | | | | | | | | |
| | | | |
| Consumer Finance: 1.33% | | | | | | | | | | | | |
BMW US Capital LLC Company 144A | | | 3.15 | | | | 4-18-2024 | | | | 965,000 | | | | 1,008,945 | |
Capital One Financial Corporation | | | 3.20 | | | | 1-30-2023 | | | | 160,000 | | | | 165,841 | |
Capital One Financial Corporation | | | 3.30 | | | | 10-30-2024 | | | | 1,500,000 | | | | 1,573,655 | |
Daimler Finance North America LLC 144A | | | 2.70 | | | | 6-14-2024 | | | | 740,000 | | | | 740,907 | |
Daimler Finance North America LLC 144A | | | 3.35 | | | | 2-22-2023 | | | | 1,490,000 | | | | 1,523,386 | |
Ford Motor Credit Company LLC | | | 5.58 | | | | 3-18-2024 | | | | 1,130,000 | | | | 1,124,011 | |
| | | | |
| | | | | | | | | | | | | | | 6,136,745 | |
| | | | | | | | | | | | | | | | |
| | | | |
| Diversified Financial Services: 0.19% | | | | | | | | | | | | |
EMD Finance LLC 144A | | | 3.25 | | | | 3-19-2025 | | | | 830,000 | | | | 890,658 | |
| | | | | | | | | | | | | | | | |
| | | | |
| Insurance: 0.34% | | | | | | | | | | | | |
Minnesota Life Insurance Company 144A | | | 8.25 | | | | 9-15-2025 | | | | 650,000 | | | | 804,767 | |
NLV Financial Corporation 144A | | | 7.50 | | | | 8-15-2033 | | | | 565,000 | | | | 755,887 | |
| | | | |
| | | | | | | | | | | | | | | 1,560,654 | |
| | | | | | | | | | | | | | | | |
| | | | |
Health Care: 4.01% | | | | | | | | | | | | | | | | |
| | | | |
| Biotechnology: 0.31% | | | | | | | | | | | | |
AbbVie Incorporated 144A | | | 4.55 | | | | 3-15-2035 | | | | 1,200,000 | | | | 1,413,561 | |
| | | | | | | | | | | | | | | | |
| | | | |
| Health Care Equipment & Supplies: 0.29% | | | | | | | | | | | | |
Hill-Rom Holdings Incorporated 144A | | | 5.00 | | | | 2-15-2025 | | | | 1,065,000 | | | | 1,094,288 | |
Teleflex Incorporated | | | 4.88 | | | | 6-1-2026 | | | | 250,000 | | | | 257,500 | |
| | | | |
| | | | | | | | | | | | | | | 1,351,788 | |
| | | | | | | | | | | | | | | | |
| | | | |
| Health Care Providers & Services: 2.83% | | | | | | | | | | | | |
Advocate Health Corporation | | | 4.27 | | | | 8-15-2048 | | | | 290,000 | | | | 357,595 | |
BayCare Health System Incorporated | | | 3.83 | | | | 11-15-2050 | | | | 145,000 | | | | 169,745 | |
Cleveland Clinic Foundation | | | 4.86 | | | | 1-1-2114 | | | | 894,000 | | | | 1,270,279 | |
CVS Health Corporation | | | 4.30 | | | | 3-25-2028 | | | | 1,300,000 | | | | 1,482,304 | |
CVS Health Corporation | | | 5.05 | | | | 3-25-2048 | | | | 130,000 | | | | 166,901 | |
Kaiser Foundation Hospitals | | | 3.27 | | | | 11-1-2049 | | | | 480,000 | | | | 519,417 | |
Mayo Clinic | | | 4.13 | | | | 11-15-2052 | | | | 810,000 | | | | 958,382 | |
MEDNAX Incorporated 144A | | | 5.25 | | | | 12-1-2023 | | | | 1,380,000 | | | | 1,352,400 | |
Memorial Health Services | | | 3.45 | | | | 11-1-2049 | | | | 820,000 | | | | 809,022 | |
Memorial Sloan Kettering Cancer Center | | | 4.20 | | | | 7-1-2055 | | | | 788,000 | | | | 987,969 | |
The accompanying notes are an integral part of these financial statements.
Wells Fargo Managed Fixed Income Portfolio | 7
Portfolio of investments—May 31, 2020
| | | | | | | | | | | | | | | | |
| | | Interest rate | | | Maturity date | | | Principal | | | Value | |
| | | | |
| Health Care Providers & Services (continued) | | | | | | | | | | | | |
NYU Hospitals Center | | | 3.38 | % | | | 7-1-2055 | | | $ | 690,000 | | | $ | 644,251 | |
OhioHealth Corporation | | | 3.04 | | | | 11-15-2050 | | | | 320,000 | | | | 333,648 | |
Southern Baptist Hospital | | | 4.86 | | | | 7-15-2045 | | | | 625,000 | | | | 741,720 | |
Stanford Health Care | | | 3.80 | | | | 11-15-2048 | | | | 275,000 | | | | 322,802 | |
Texas Health Resources | | | 4.33 | | | | 11-15-2055 | | | | 1,115,000 | | | | 1,356,480 | |
The New York-Presbyterian Hospital | | | 3.56 | | | | 8-1-2036 | | | | 750,000 | | | | 780,132 | |
The New York-Presbyterian Hospital | | | 4.06 | | | | 8-1-2056 | | | | 570,000 | | | | 665,748 | |
UnitedHealth Group Incorporated | | | 1.25 | | | | 1-15-2026 | | | | 150,000 | | | | 152,186 | |
| | | | |
| | | | | | | | | | | | | | | 13,070,981 | |
| | | | | | | | | | | | | | | | |
| | | | |
| Health Care Technology: 0.10% | | | | | | | | | | | | |
IQVIA Incorporated 144A | | | 5.00 | | | | 10-15-2026 | | | | 445,000 | | | | 471,144 | |
| | | | | | | | | | | | | | | | |
| | | | |
| Life Sciences Tools & Services: 0.14% | | | | | | | | | | | | |
Agilent Technologies Incorporated | | | 2.75 | | | | 9-15-2029 | | | | 600,000 | | | | 633,228 | |
| | | | | | | | | | | | | | | | |
| | | | |
| Pharmaceuticals: 0.34% | | | | | | | | | | | | |
Bayer US Finance LLC 144A | | | 3.38 | | | | 10-8-2024 | | | | 240,000 | | | | 256,866 | |
Bayer US Finance LLC 144A | | | 4.38 | | | | 12-15-2028 | | | | 1,170,000 | | | | 1,338,796 | |
| | | | |
| | | | | | | | | | | | | | | 1,595,662 | |
| | | | | | | | | | | | | | | | |
| | | | |
Industrials: 4.05% | | | | | | | | | | | | | | | | |
| | | | |
| Aerospace & Defense: 1.08% | | | | | | | | | | | | |
BAE Systems Holdings Incorporated 144A | | | 3.80 | | | | 10-7-2024 | | | | 1,345,000 | | | | 1,454,128 | |
Boeing Company | | | 5.15 | | | | 5-1-2030 | | | | 155,000 | | | | 165,514 | |
Boeing Company | | | 5.71 | | | | 5-1-2040 | | | | 110,000 | | | | 120,401 | |
Hexcel Corporation | | | 3.95 | | | | 2-15-2027 | | | | 1,302,000 | | | | 1,339,803 | |
Lockheed Martin Corporation | | | 1.85 | | | | 6-15-2030 | | | | 80,000 | | | | 81,859 | |
Moog Incorporated 144A | | | 4.25 | | | | 12-15-2027 | | | | 700,000 | | | | 667,828 | |
Raytheon Tech Corporation | | | 2.25 | | | | 7-1-2030 | | | | 360,000 | | | | 368,788 | |
The Boeing Company | | | 2.70 | | | | 2-1-2027 | | | | 840,000 | | | | 782,039 | |
| | | | |
| | | | | | | | | | | | | | | 4,980,360 | |
| | | | | | | | | | | | | | | | |
| | | | |
| Air Freight & Logistics: 0.07% | | | | | | | | | | | | |
Fedex Corporation | | | 3.90 | | | | 2-1-2035 | | | | 280,000 | | | | 299,137 | |
| | | | | | | | | | | | | | | | |
| | | | |
| Building Products: 0.10% | | | | | | | | | | | | |
Fortune Brands Home & Security Incorporated | | | 4.00 | | | | 9-21-2023 | | | | 240,000 | | | | 259,886 | |
Masco Corporation | | | 6.50 | | | | 8-15-2032 | | | | 150,000 | | | | 176,310 | |
| | | | |
| | | | | | | | | | | | | | | 436,196 | |
| | | | | | | | | | | | | | | | |
| | | | |
| Commercial Services & Supplies: 0.32% | | | | | | | | | | | | |
ACCO Brands Corporation 144A | | | 5.25 | | | | 12-15-2024 | | | | 600,000 | | | | 603,000 | |
Clean Harbors Incorporated 144A | | | 4.88 | | | | 7-15-2027 | | | | 425,000 | | | | 439,875 | |
Stericycle Incorporated 144A | | | 5.38 | | | | 7-15-2024 | | | | 420,000 | | | | 429,450 | |
| | | | |
| | | | | | | | | | | | | | | 1,472,325 | |
| | | | | | | | | | | | | | | | |
| | | | |
| Construction & Engineering: 0.02% | | | | | | | | | | | | |
Valmont Industries Incorporated | | | 5.00 | | | | 10-1-2044 | | | | 110,000 | | | | 112,244 | |
| | | | | | | | | | | | | | | | |
| | | | |
| Electrical Equipment: 0.24% | | | | | | | | | | | | |
Carrier Global Corporation 144A | | | 2.49 | | | | 2-15-2027 | | | | 780,000 | | | | 756,533 | |
Emerson Electric Company | | | 1.95 | | | | 10-15-2030 | | | | 370,000 | | | | 371,924 | |
| | | | |
| | | | | | | | | | | | | | | 1,128,457 | |
| | | | | | | | | | | | | | | | |
The accompanying notes are an integral part of these financial statements.
8 | Wells Fargo Managed Fixed Income Portfolio
Portfolio of investments—May 31, 2020
| | | | | | | | | | | | | | | | |
| | | Interest rate | | | Maturity date | | | Principal | | | Value | |
| Industrial Conglomerates: 0.03% | | | | | | | | | | | | |
Honeywell International | | | 1.95 | % | | | 6-1-2030 | | | $ | 150,000 | | | $ | 153,490 | |
| | | | | | | | | | | | | | | | |
| | | | |
| Machinery: 0.96% | | | | | | | | | | | | |
Actuant Corporation | | | 5.63 | | | | 6-15-2022 | | | | 1,660,000 | | | | 1,659,751 | |
Briggs & Stratton Corporation | | | 6.88 | | | | 12-15-2020 | | | | 850,000 | | | | 278,375 | |
Caterpillar Financial Service Corporation | | | 1.45 | | | | 5-15-2025 | | | | 270,000 | | | | 276,752 | |
Fortive Corporation | | | 2.35 | | | | 6-15-2021 | | | | 215,000 | | | | 216,963 | |
Mueller Water Products Incorporated 144A | | | 5.50 | | | | 6-15-2026 | | | | 950,000 | | | | 978,500 | |
Oshkosh Corporation | | | 3.10 | | | | 3-1-2030 | | | | 490,000 | | | | 475,422 | |
Oshkosh Corporation | | | 4.60 | | | | 5-15-2028 | | | | 200,000 | | | | 213,829 | |
Vessel Management Services Incorporated | | | 3.43 | | | | 8-15-2036 | | | | 281,000 | | | | 326,445 | |
| | | | |
| | | | | | | | | | | | | | | 4,426,037 | |
| | | | | | | | | | | | | | | | |
| | | | |
| Professional Services: 0.49% | | | | | | | | | | | | |
Equifax Incorporated | | | 3.95 | | | | 6-15-2023 | | | | 1,700,000 | | | | 1,808,165 | |
Relx Capital Incorporated | | | 3.00 | | | | 5-22-2030 | | | | 70,000 | | | | 73,523 | |
Relx Capital Incorporated | | | 3.50 | | | | 3-16-2023 | | | | 110,000 | | | | 116,427 | |
Relx Capital Incorporated | | | 4.00 | | | | 3-18-2029 | | | | 240,000 | | | | 268,410 | |
| | | | |
| | | | | | | | | | | | | | | 2,266,525 | |
| | | | | | | | | | | | | | | | |
| | | | |
| Road & Rail: 0.35% | | | | | | | | | | | | |
Norfolk Southern Corporation | | | 5.10 | | | | 12-31-2049 | | | | 760,000 | | | | 975,555 | |
Ryder System Incorporated | | | 3.65 | | | | 3-18-2024 | | | | 620,000 | | | | 653,198 | |
| | | | |
| | | | | | | | | | | | | | | 1,628,753 | |
| | | | | | | | | | | | | | | | |
| | | | |
| Transportation Infrastructure: 0.39% | | | | | | | | | | | | |
Crowley Conro LLC | | | 4.18 | | | | 8-15-2043 | | | | 1,438,200 | | | | 1,809,825 | |
| | | | | | | | | | | | | | | | |
| | | | |
Information Technology: 1.81% | | | | | | | | | | | | | | | | |
| | | | |
| Electronic Equipment, Instruments & Components: 0.20% | | | | | | | | | | | | |
Jabil Incorporated | | | 3.95 | | | | 1-12-2028 | | | | 900,000 | | | | 930,207 | |
| | | | | | | | | | | | | | | | |
| | | | |
| IT Services: 0.20% | | | | | | | | | | | | |
Verisign Incorporated | | | 4.75 | | | | 7-15-2027 | | | | 900,000 | | | | 939,942 | |
| | | | | | | | | | | | | | | | |
| | | | |
| Semiconductors & Semiconductor Equipment: 0.81% | | | | | | | | | | | | |
Applied Materials Incorporated | | | 1.75 | | | | 6-1-2030 | | | | 320,000 | | | | 319,756 | |
KLA Tencor Corporation | | | 4.10 | | | | 3-15-2029 | | | | 150,000 | | | | 173,331 | |
Maxim Integrated Products Incorporated | | | 3.45 | | | | 6-15-2027 | | | | 1,550,000 | | | | 1,652,518 | |
Microchip Technology Incorporated | | | 4.33 | | | | 6-1-2023 | | | | 1,500,000 | | | | 1,571,049 | |
| | | | |
| | | | | | | | | | | | | | | 3,716,654 | |
| | | | | | | | | | | | | | | | |
| | | | |
| Software: 0.35% | | | | | | | | | | | | |
CDK Global Incorporated | | | 5.88 | | | | 6-15-2026 | | | | 185,000 | | | | 194,713 | |
Fair Isaac Corporation 144A | | | 5.25 | | | | 5-15-2026 | | | | 1,330,000 | | | | 1,433,979 | |
| | | | |
| | | | | | | | | | | | | | | 1,628,692 | |
| | | | | | | | | | | | | | | | |
| | | | |
| Technology Hardware, Storage & Peripherals: 0.25% | | | | | | | | | | | | |
Apple Incorporated | | | 1.65 | | | | 5-11-2030 | | | | 735,000 | | | | 744,132 | |
Hewlett Packard Enterprise Company | | | 4.90 | | | | 10-15-2025 | | | | 375,000 | | | | 421,992 | |
| | | | |
| | | | | | | | | | | | | | | 1,166,124 | |
| | | | | | | | | | | | | | | | |
The accompanying notes are an integral part of these financial statements.
Wells Fargo Managed Fixed Income Portfolio | 9
Portfolio of investments—May 31, 2020
| | | | | | | | | | | | | | | | |
| | | Interest rate | | | Maturity date | | | Principal | | | Value | |
Materials: 3.69% | | | | | | | | | | | | | | | | |
| | | | |
| Chemicals: 2.65% | | | | | | | | | | | | |
Air Products & Chemicals | | | 2.05 | % | | | 5-15-2030 | | | $ | 565,000 | | | $ | 585,863 | |
Albemarle Corporation | | | 4.15 | | | | 12-1-2024 | | | | 1,390,000 | | | | 1,475,647 | |
Axalta Coating Systems Limited 144A | | | 4.88 | | | | 8-15-2024 | | | | 550,000 | | | | 556,875 | |
DuPont de Nemours Incorporated | | | 4.73 | | | | 11-15-2028 | | | | 930,000 | | | | 1,104,747 | |
DuPont de Nemours Incorporated | | | 4.49 | | | | 11-15-2025 | | | | 430,000 | | | | 487,839 | |
FMC Corporation | | | 3.20 | | | | 10-1-2026 | | | | 1,120,000 | | | | 1,207,879 | |
Ingevity Corporation 144A | | | 4.50 | | | | 2-1-2026 | | | | 2,015,000 | | | | 1,949,513 | |
Mosaic Company | | | 4.05 | | | | 11-15-2027 | | | | 1,090,000 | | | | 1,108,825 | |
PPG Industries Incorporated | | | 2.55 | | | | 6-15-2030 | | | | 770,000 | | | | 786,608 | |
Scotts Miracle-Gro Company | | | 5.25 | | | | 12-15-2026 | | | | 1,410,000 | | | | 1,464,638 | |
The Sherwin-Williams Company | | | 2.95 | | | | 8-15-2029 | | | | 450,000 | | | | 477,167 | |
The Sherwin-Williams Company | | | 3.30 | | | | 2-1-2025 | | | | 100,000 | | | | 107,211 | |
Valvoline Incorporated 144A | | | 4.25 | | | | 2-15-2030 | | | | 720,000 | | | | 718,200 | |
W.R. Grace & Company 144A | | | 5.63 | | | | 10-1-2024 | | | | 200,000 | | | | 203,500 | |
| | | | |
| | | | | | | | | | | | | | | 12,234,512 | |
| | | | | | | | | | | | | | | | |
| | | | |
| Construction Materials: 0.10% | | | | | | | | | | | | |
CRH America Finance Incorporated 144A | | | 3.40 | | | | 5-9-2027 | | | | 200,000 | | | | 205,615 | |
Martin Marietta Material | | | 2.50 | | | | 3-15-2030 | | | | 280,000 | | | | 271,815 | |
| | | | |
| | | | | | | | | | | | | | | 477,430 | |
| | | | | | | | | | | | | | | | |
| | | | |
| Containers & Packaging: 0.69% | | | | | | | | | | | | |
Graphic Packaging International Company | | | 4.13 | | | | 8-15-2024 | | | | 500,000 | | | | 515,000 | |
Sealed Air Corporation 144A | | | 5.50 | | | | 9-15-2025 | | | | 200,000 | | | | 217,000 | |
Sealed Air Corporation 144A | | | 6.88 | | | | 7-15-2033 | | | | 100,000 | | | | 118,000 | |
Westrock Company | | | 3.00 | | | | 9-15-2024 | | | | 1,680,000 | | | | 1,721,361 | |
WRKCo Incorporated | | | 3.90 | | | | 6-1-2028 | | | | 560,000 | | | | 601,768 | |
| | | | |
| | | | | | | | | | | | | | | 3,173,129 | |
| | | | | | | | | | | | | | | | |
| | | | |
| Metals & Mining: 0.10% | | | | | | | | | | | | |
Freeport-McMoRan Copper & Gold Incorporated | | | 4.55 | | | | 11-14-2024 | | | | 475,000 | | | | 483,313 | |
| | | | | | | | | | | | | | | | |
| | | | |
| Paper & Forest Products: 0.15% | | | | | | | | | | | | |
Georgia Pacific LLC 144A | | | 2.30 | | | | 4-30-2030 | | | | 695,000 | | | | 709,956 | |
| | | | | | | | | | | | | | | | |
| | | | |
Real Estate: 3.32% | | | | | | | | | | | | | | | | |
| | | | |
| Equity REITs: 3.32% | | | | | | | | | | | | |
Alexandria Real Estate Equities Incorporated | | | 3.95 | | | | 1-15-2027 | | | | 240,000 | | | | 264,383 | |
Alexandria Real Estate Equities Incorporated | | | 4.30 | | | | 1-15-2026 | | | | 1,500,000 | | | | 1,669,496 | |
Boston Properties LP | | | 2.75 | | | | 10-1-2026 | | | | 1,500,000 | | | | 1,545,169 | |
Boston Properties LP | | | 3.20 | | | | 1-15-2025 | | | | 250,000 | | | | 262,380 | |
Digital Realty Trust LP | | | 4.45 | | | | 7-15-2028 | | | | 510,000 | | | | 598,626 | |
Duke Realty LP | | | 3.25 | | | | 6-30-2026 | | | | 1,500,000 | | | | 1,595,419 | |
Duke Realty LP | | | 4.00 | | | | 9-15-2028 | | | | 230,000 | | | | 258,462 | |
HCP Incorporated | | | 3.50 | | | | 7-15-2029 | | | | 560,000 | | | | 568,482 | |
Healthcare Trust of America Incorporated | | | 3.50 | | | | 8-1-2026 | | | | 255,000 | | | | 262,511 | |
Host Hotels & Resorts Incorporated | | | 3.88 | | | | 4-1-2024 | | | | 265,000 | | | | 262,717 | |
Kimco Realty Corporation | | | 3.30 | | | | 2-1-2025 | | | | 1,500,000 | | | | 1,519,168 | |
Mid-America Apartments LP | | | 3.60 | | | | 6-1-2027 | | | | 845,000 | | | | 902,401 | |
Mid-America Apartments LP | | | 4.20 | | | | 6-15-2028 | | | | 160,000 | | | | 177,483 | |
National Retail Properties Incorporated | | | 4.30 | | | | 10-15-2028 | | | | 370,000 | | | | 376,064 | |
UDR Incorporated | | | 3.75 | | | | 7-1-2024 | | | | 915,000 | | | | 955,001 | |
Ventas Realty LP | | | 3.50 | | | | 2-1-2025 | | | | 150,000 | | | | 149,315 | |
The accompanying notes are an integral part of these financial statements.
10 | Wells Fargo Managed Fixed Income Portfolio
Portfolio of investments—May 31, 2020
| | | | | | | | | | | | | | | | |
| | | Interest rate | | | Maturity date | | | Principal | | | Value | |
| | | | |
| Equity REITs (continued) | | | | | | | | | | | | |
Ventas Realty LP | | | 3.85 | % | | | 4-1-2027 | | | $ | 1,500,000 | | | $ | 1,482,733 | |
Vornado Realty Trust | | | 3.50 | | | | 1-15-2025 | | | | 1,500,000 | | | | 1,442,978 | |
Welltower Incorporated | | | 3.63 | | | | 3-15-2024 | | | | 580,000 | | | | 593,143 | |
Welltower Incorporated | | | 2.70 | | | | 2-15-2027 | | | | 460,000 | | | | 441,960 | |
| | | | |
| | | | | | | | | | | | | | | 15,327,891 | |
| | | | | | | | | | | | | | | | |
| | | | |
Utilities: 3.35% | | | | | | | | | | | | | | | | |
| | | | |
| Electric Utilities: 2.77% | | | | | | | | | | | | |
Duke Energy Carolinas LLC | | | 6.05 | | | | 4-15-2038 | | | | 830,000 | | | | 1,195,589 | |
Entergy Arkansas Incorporated | | | 3.05 | | | | 6-1-2023 | | | | 1,055,000 | | | | 1,108,323 | |
Evergy Metro Incorporated | | | 2.25 | | | | 6-1-2030 | | | | 350,000 | | | | 359,436 | |
Florida Power & Light Company | | | 4.95 | | | | 6-1-2035 | | | | 1,000,000 | | | | 1,391,901 | |
ITC Holdings Corporation | | | 3.65 | | | | 6-15-2024 | | | | 120,000 | | | | 129,645 | |
MidAmerican Energy Holdings Company | | | 5.80 | | | | 10-15-2036 | | | | 900,000 | | | | 1,231,594 | |
Monongahela Power Company 144A | | | 4.10 | | | | 4-15-2024 | | | | 1,660,000 | | | | 1,818,475 | |
Northern States Power Company of Minnesota | | | 5.35 | | | | 11-1-2039 | | | | 1,580,000 | | | | 2,222,352 | |
PacifiCorp | | | 3.35 | | | | 7-1-2025 | | | | 130,000 | | | | 142,086 | |
Public Service Electric & Gas Company | | | 5.70 | | | | 12-1-2036 | | | | 590,000 | | | | 807,995 | |
Rochester Gas & Electric Corporation 144A | | | 3.10 | | | | 6-1-2027 | | | | 1,790,000 | | | | 1,909,739 | |
Southern California Edison Company | | | 6.00 | | | | 1-15-2034 | | | | 188,000 | | | | 250,894 | |
Trans-Allegheny Interstate Line Company 144A | | | 3.85 | | | | 6-1-2025 | | | | 200,000 | | | | 221,927 | |
| | | | |
| | | | | | | | | | | | | | | 12,789,956 | |
| | | | | | | | | | | | | | | | |
| | | | |
| Gas Utilities: 0.33% | | | | | | | | | | | | |
AmeriGas Partners LP | | | 5.50 | | | | 5-20-2025 | | | | 450,000 | | | | 468,000 | |
AmeriGas Partners LP | | | 5.88 | | | | 8-20-2026 | | | | 500,000 | | | | 530,250 | |
Boardwalk Pipelines Company | | | 5.95 | | | | 6-1-2026 | | | | 550,000 | | | | 554,760 | |
| | | | |
| | | | | | | | | | | | | | | 1,553,010 | |
| | | | | | | | | | | | | | | | |
| | | | |
| Independent Power & Renewable Electricity Producers: 0.08% | | | | | | | | | | | | |
AES Corporation | | | 5.13 | | | | 9-1-2027 | | | | 335,000 | | | | 354,778 | |
| | | | | | | | | | | | | | | | |
| | | | |
| Multi-Utilities: 0.17% | | | | | | | | | | | | |
Black Hills Corporation | | | 4.35 | | | | 5-1-2033 | | | | 710,000 | | | | 791,269 | |
| | | | | | | | | | | | | | | | |
| | | | |
Total Corporate Bonds and Notes (Cost $159,724,600) | | | | | | | | | | | | | | | 169,598,855 | |
| | | | | | | | | | | | | | | | |
| | | | |
Municipal Obligations: 11.23% | | | | | | | | | | | | | | | | |
| | | | |
California: 1.38% | | | | | | | | | | | | | | | | |
| | | | |
| GO Revenue: 1.28% | | | | | | | | | | | | |
Alameda County CA Series A | | | 3.70 | | | | 8-1-2031 | | | | 275,000 | | | | 305,850 | |
Coast Community College District California | | | 2.89 | | | | 8-1-2035 | | | | 1,165,000 | | | | 1,218,695 | |
Oxnard CA Union High School District | | | 1.87 | | | | 8-1-2030 | | | | 800,000 | | | | 784,576 | |
San Diego CA Community College District Series B | | | 2.88 | | | | 8-1-2033 | | | | 1,935,000 | | | | 2,082,215 | |
San Jose CA Disaster Preparedness Taxable Bonds Series B | | | 2.60 | | | | 9-1-2027 | | | | 1,460,000 | | | | 1,535,015 | |
| | | | |
| | | | | | | | | | | | | | | 5,926,351 | |
| | | | | | | | | | | | | | | | |
| | | | |
| Tax Revenue: 0.10% | | | | | | | | | | | | |
San Jose CA RDA Senior Taxable Refunding Bonds Series A-T | | | 3.38 | | | | 8-1-2034 | | | | 455,000 | | | | 464,077 | |
| | | | | | | | | | | | | | | | |
| | | | |
| | | | | | | | | | | | | | | 6,390,428 | |
| | | | | | | | | | | | | | | | |
The accompanying notes are an integral part of these financial statements.
Wells Fargo Managed Fixed Income Portfolio | 11
Portfolio of investments—May 31, 2020
| | | | | | | | | | | | | | | | |
| | | Interest rate | | | Maturity date | | | Principal | | | Value | |
Delaware: 0.33% | | | | | | | | | | | | | | | | |
| | | | |
| Miscellaneous Revenue: 0.33% | | | | | | | | | | | | |
Delaware Bonds Series 2010C | | | 4.45 | % | | | 7-1-2028 | | | $ | 1,250,000 | | | $ | 1,520,963 | |
| | | | | | | | | | | | | | | | |
| | | | |
Florida: 0.44% | | | | | | | | | | | | | | | | |
| | | | |
| Airport Revenue: 0.17% | | | | | | | | | | | | |
Broward County FL Airport System Series C | | | 2.38 | | | | 10-1-2026 | | | | 775,000 | | | | 766,646 | |
| | | | | | | | | | | | | | | | |
| | | | |
| Water & Sewer Revenue: 0.27% | | | | | | | | | | | | |
Florida Water Pollution Control Financing Corporation Series A | | | 2.60 | | | | 1-15-2030 | | | | 1,175,000 | | | | 1,251,175 | |
| | | | | | | | | | | | | | | | |
| | | | |
| | | | | | | | | | | | | | | 2,017,821 | |
| | | | | | | | | | | | | | | | |
| | | | |
Georgia: 0.13% | | | | | | | | | | | | | | | | |
| | | | |
| GO Revenue: 0.13% | | | | | | | | | | | | |
Cherokee County GA School System Build America Bonds | | | 5.87 | | | | 8-1-2028 | | | | 500,000 | | | | 596,860 | |
| | | | | | | | | | | | | | | | |
| | | | |
Idaho: 0.04% | | | | | | | | | | | | | | | | |
| | | | |
| Miscellaneous Revenue: 0.04% | | | | | | | | | | | | |
Idaho Building Authority State Office Campus Project Series B | | | 3.28 | | | | 9-1-2028 | | | | 170,000 | | | | 184,363 | |
| | | | | | | | | | | | | | | | |
| | | | |
Illinois: 0.04% | | | | | | | | | | | | | | | | |
| | | | |
| GO Revenue: 0.04% | | | | | | | | | | | | |
Lake County IL Community Consolidated School District Series A | | | 3.40 | | | | 11-1-2027 | | | | 150,000 | | | | 164,714 | |
| | | | | | | | | | | | | | | | |
| | | | |
Indiana: 0.62% | | | | | | | | | | | | | | | | |
| | | | |
| Education Revenue: 0.27% | | | | | | | | | | | | |
Indiana University Taxable Consolidated Bonds Series B | | | 3.07 | | | | 6-1-2060 | | | | 1,195,000 | | | | 1,219,330 | |
| | | | | | | | | | | | | | | | |
| | | | |
| Health Revenue: 0.28% | | | | | | | | | | | | |
Indiana Finance Authority Community Foundation | | | 3.63 | | | | 3-1-2039 | | | | 1,235,000 | | | | 1,309,878 | |
| | | | | | | | | | | | | | | | |
| | | | |
| Miscellaneous Revenue: 0.07% | | | | | | | | | | | | |
Indianapolis IN Local Public Improvement Bonds Series A-2 | | | 6.00 | | | | 1-15-2040 | | | | 235,000 | | | | 328,147 | |
| | | | | | | | | | | | | | | | |
| | | | |
| | | | | | | | | | | | | | | 2,857,355 | |
| | | | | | | | | | | | | | | | |
| | | | |
Massachusetts: 0.23% | | | | | | | | | | | | | | | | |
| | | | |
| GO Revenue: 0.23% | | | | | | | | | | | | |
Boston MA Series C Qualified School Construction Bonds | | | 4.40 | | | | 4-1-2026 | | | | 380,000 | | | | 389,409 | |
Massachusetts Taxable Consolidated Loan Series H | | | 2.90 | | | | 9-1-2049 | | | | 650,000 | | | | 687,278 | |
| | | | |
| | | | | | | | | | | | | | | 1,076,687 | |
| | | | | | | | | | | | | | | | |
| | | | |
Michigan: 0.21% | | | | | | | | | | | | | | | | |
| | | | |
| Health Revenue: 0.21% | | | | | | | | | | | | |
Michigan Finance Authority Trinity Health Credit Group Series T | | | 3.08 | | | | 12-1-2034 | | | | 930,000 | | | | 994,709 | |
| | | | | | | | | | | | | | | | |
| | | | |
Mississippi: 0.07% | | | | | | | | | | | | | | | | |
| | | | |
| Education Revenue: 0.07% | | | | | | | | | | | | |
Mississippi Higher Education Assistance Corporation Series 2014-1 Class A1 (1 Month LIBOR +0.68%) ± | | | 0.85 | | | | 10-25-2035 | | | | 344,897 | | | | 333,216 | |
| | | | | | | | | | | | | | | | |
The accompanying notes are an integral part of these financial statements.
12 | Wells Fargo Managed Fixed Income Portfolio
Portfolio of investments—May 31, 2020
| | | | | | | | | | | | | | | | |
| | | Interest rate | | | Maturity date | | | Principal | | | Value | |
Missouri: 0.48% | | | | | | | | | | | | | | | | |
| | | | |
| Education Revenue: 0.48% | | | | | | | | | | | | |
Missouri HEFA Washington University Series A | | | 3.65 | % | | | 8-15-2057 | | | $ | 500,000 | | | $ | 585,960 | |
Missouri Higher Education Loan Authority Notes Class A-1 (3 Month LIBOR +0.85%) ± | | | 1.21 | | | | 8-27-2029 | | | | 162,966 | | | | 159,366 | |
Missouri Higher Education Loan Authority Notes Class A-1 (1 Month LIBOR +0.83%) ± | | | 1.32 | | | | 1-26-2026 | | | | 1,586,563 | | | | 1,451,880 | |
| | | | |
| | | | | | | | | | | | | | | 2,197,206 | |
| | | | | | | | | | | | | | | | |
| | | | |
New Jersey: 0.19% | | | | | | | | | | | | | | | | |
| | | | |
| Miscellaneous Revenue: 0.19% | | | | | | | | | | | | |
Hudson County NJ Improvement Authority Hudson County Lease Project (AGM Insured) | | | 7.40 | | | | 12-1-2025 | | | | 760,000 | | | | 870,527 | |
| | | | | | | | | | | | | | | | |
| | | | |
New York: 0.64% | | | | | | | | | | | | | | | | |
| | | | |
| GO Revenue: 0.35% | | | | | | | | | | | | |
New York Refunding Bond Series B | | | 2.65 | | | | 2-15-2030 | | | | 1,505,000 | | | | 1,603,322 | |
| | | | | | | | | | | | | | | | |
| | | | |
| Miscellaneous Revenue: 0.07% | | | | | | | | | | | | |
New York State Taxable Bonds Series 2010C | | | 5.62 | | | | 3-1-2040 | | | | 250,000 | | | | 344,925 | |
| | | | | | | | | | | | | | | | |
| | | | |
| Tax Revenue: 0.22% | | | | | | | | | | | | |
New York City NY Transitional Finance Authority | | | 2.21 | | | | 5-1-2027 | | | | 1,000,000 | | | | 1,019,160 | |
| | | | | | | | | | | | | | | | |
| | | | |
| | | | | | | | | | | | | | | 2,967,407 | |
| | | | | | | | | | | | | | | | |
| | | | |
North Carolina: 0.55% | | | | | | | | | | | | | | | | |
| | | | |
| Education Revenue: 0.55% | | | | | | | | | | | | |
North Carolina Education Assistance Authority Student Loan (3 Month LIBOR +0.90%) ± | | | 1.89 | | | | 7-25-2041 | | | | 1,569,373 | | | | 1,507,288 | |
North Carolina Education Assistance Authority Student Loan Series A-3 (3 Month LIBOR +0.90%) ± | | | 1.89 | | | | 10-25-2041 | | | | 470,856 | | | | 452,624 | |
University of North Carolina Chapel Hill Refunding Bonds Series C | | | 3.33 | | | | 12-1-2036 | | | | 500,000 | | | | 565,585 | |
| | | | |
| | | | | | | | | | | | | | | 2,525,497 | |
| | | | | | | | | | | | | | | | |
| | | | |
Ohio: 0.57% | | | | | | | | | | | | | | | | |
| | | | |
| Education Revenue: 0.30% | | | | | | | | | | | | |
Ohio State University Build America Bonds | | | 4.91 | | | | 6-1-2040 | | | | 1,000,000 | | | | 1,370,730 | |
| | | | | | | | | | | | | | | | |
| | | | |
| Health Revenue: 0.16% | | | | | | | | | | | | |
Ohio Hospital Facility Refunding Bond Cleveland Clinic | | | 3.28 | | | | 1-1-2042 | | | | 725,000 | | | | 744,394 | |
| | | | | | | | | | | | | | | | |
| | | | |
| Miscellaneous Revenue: 0.11% | | | | | | | | | | | | |
Jobsohio Beverage System Ohio Statewide Senior Lien Liquor Profits Series A | | | 2.83 | | | | 1-1-2038 | | | | 515,000 | | | | 533,782 | |
| | | | | | | | | | | | | | | | |
| | | | |
| | | | | | | | | | | | | | | 2,648,906 | |
| | | | | | | | | | | | | | | | |
| | | | |
Oklahoma: 0.17% | | | | | | | | | | | | | | | | |
| | | | |
| Water & Sewer Revenue: 0.17% | | | | | | | | | | | | |
Oklahoma Water Resources Board Refunding Bond Series 2019 (Oklahoma Credit Enhancement Reserve Fund Insured) | | | 2.56 | | | | 4-1-2031 | | | | 770,000 | | | | 793,832 | |
| | | | | | | | | | | | | | | | |
The accompanying notes are an integral part of these financial statements.
Wells Fargo Managed Fixed Income Portfolio | 13
Portfolio of investments—May 31, 2020
| | | | | | | | | | | | | | | | |
| | | Interest rate | | | Maturity date | | | Principal | | | Value | |
Oregon: 0.58% | | | | | | | | | | | | | | | | |
| | | | |
| Education Revenue: 0.44% | | | | | | | | | | | | |
Oregon State Taxable Higher Education Series A | | | 5.90 | % | | | 8-1-2038 | | | $ | 1,500,000 | | | $ | 2,014,755 | |
| | | | | | | | | | | | | | | | |
| | | | |
| GO Revenue: 0.14% | | | | | | | | | | | | |
Oregon Board of Higher Education Build America Bonds Series C | | | 5.38 | | | | 8-1-2039 | | | | 500,000 | | | | 657,800 | |
| | | | | | | | | | | | | | | | |
| | | | |
| | | | | | | | | | | | | | | 2,672,555 | |
| | | | | | | | | | | | | | | | |
| | | | |
Pennsylvania: 0.95% | | | | | | | | | | | | | | | | |
| | | | |
| Education Revenue: 0.69% | | | | | | | | | | | | |
Pennsylvania HEFAR Refunding Taxable Bonds Series B | | | 2.94 | | | | 8-15-2039 | | | | 1,000,000 | | | | 1,024,260 | |
Pennsylvania Higher Education Authority Class A (1 Month LIBOR +1.15%) 144A± | | | 1.32 | | | | 9-25-2065 | | | | 1,020,080 | | | | 985,561 | |
University Pittsburgh Pennsylvania Series A | | | 3.65 | | | | 9-15-2036 | | | | 1,100,000 | | | | 1,196,877 | |
| | | | |
| | | | | | | | | | | | | | | 3,206,698 | |
| | | | | | | | | | | | | | | | |
| | | | |
| GO Revenue: 0.26% | | | | | | | | | | | | |
Northampton County PA Series C | | | 2.54 | | | | 10-1-2028 | | | | 1,100,000 | | | | 1,183,061 | |
| | | | | | | | | | | | | | | | |
| | | | |
| | | | | | | | | | | | | | | 4,389,759 | |
| | | | | | | | | | | | | | | | |
| | | | |
Rhode Island: 0.52% | | | | | | | | | | | | | | | | |
| | | | |
| Education Revenue: 0.52% | | | | | | | | | | | | |
Rhode Island Student Loan Authority Class A-1 (1 Month LIBOR +0.90%) ± | | | 1.27 | | | | 7-1-2031 | | | | 2,425,979 | | | | 2,419,113 | |
| | | | | | | | | | | | | | | | |
| | | | |
Texas: 1.04% | | | | | | | | | | | | | | | | |
| | | | |
| Education Revenue: 0.27% | | | | | | | | | | | | |
University of Texas Build America Bonds Series A | | | 5.26 | | | | 7-1-2039 | | | | 550,000 | | | | 779,488 | |
University of Texas Build America Bonds Series C | | | 4.79 | | | | 8-15-2046 | | | | 120,000 | | | | 164,500 | |
University of Texas Build America Bonds Series D | | | 5.13 | | | | 8-15-2042 | | | | 215,000 | | | | 301,275 | |
| | | | |
| | | | | | | | | | | | | | | 1,245,263 | |
| | | | | | | | | | | | | | | | |
| | | | |
| GO Revenue: 0.50% | | | | | | | | | | | | |
Hidalgo County TX Refunding Bonds Series 2018C | | | 4.04 | | | | 8-15-2030 | | | | 1,270,000 | | | | 1,438,212 | |
Houston TX Pension Obligation Bonds Series 2017 | | | 3.73 | | | | 3-1-2030 | | | | 110,000 | | | | 122,420 | |
Stafford TX Municipal School District Refunding Bond Series B | | | 3.08 | | | | 8-15-2041 | | | | 750,000 | | | | 747,015 | |
| | | | |
| | | | | | | | | | | | | | | 2,307,647 | |
| | | | | | | | | | | | | | | | |
| | | | |
| Miscellaneous Revenue: 0.20% | | | | | | | | | | | | |
Texas Transportation Commission Highway Improvement Series A | | | 4.63 | | | | 4-1-2033 | | | | 750,000 | | | | 944,423 | |
| | | | | | | | | | | | | | | | |
| | | | |
| Tax Revenue: 0.07% | | | | | | | | | | | | |
Texas Transportation Commission Series B | | | 5.18 | | | | 4-1-2030 | | | | 250,000 | | | | 318,503 | |
| | | | | | | | | | | | | | | | |
| | | | |
| | | | | | | | | | | | | | | 4,815,836 | |
| | | | | | | | | | | | | | | | |
| | | | |
Utah: 0.57% | | | | | | | | | | | | | | | | |
| | | | |
| Education Revenue: 0.57% | | | | | | | | | | | | |
State Board of Regents of Utah Series 1-A (1 Month LIBOR +0.75%) ± | | | 1.24 | | | | 9-25-2056 | | | | 2,737,901 | | | | 2,654,669 | |
| | | | | | | | | | | | | | | | |
| | | | |
Vermont: 0.03% | | | | | | | | | | | | | | | | |
| | | | |
| Housing Revenue: 0.03% | | | | | | | | | | | | |
Vermont Housing Finance Agency | | | 3.80 | | | | 11-1-2037 | | | | 110,000 | | | | 121,156 | |
| | | | | | | | | | | | | | | | |
The accompanying notes are an integral part of these financial statements.
14 | Wells Fargo Managed Fixed Income Portfolio
Portfolio of investments—May 31, 2020
| | | | | | | | | | | | | | | | |
| | | Interest rate | | | Maturity date | | | Principal | | | Value | |
Virginia: 0.18% | | | | | | | | | | | | | | | | |
| | | | |
| Education Revenue: 0.15% | | | | | | | | | | | | |
University of Virginia Build America Bonds | | | 6.20 | % | | | 9-1-2039 | | | $ | 315,000 | | | $ | 487,018 | |
University of Virginia Revenue Bond Series C | | | 4.18 | | | | 9-1-2117 | | | | 155,000 | | | | 202,630 | |
| | | | |
| | | | | | | | | | | | | | | 689,648 | |
| | | | | | | | | | | | | | | | |
| | | | |
| Housing Revenue: 0.03% | | | | | | | | | | | | |
Virginia Housing Development Authority | | | 3.10 | | | | 6-25-2041 | | | | 136,655 | | | | 139,168 | |
| | | | | | | | | | | | | | | | |
| | | | |
| | | | | | | | | | | | | | | 828,816 | |
| | | | | | | | | | | | | | | | |
| | | | |
Washington: 0.74% | | | | | | | | | | | | | | | | |
| | | | |
| GO Revenue: 0.69% | | | | | | | | | | | | |
King County WA Build America Bonds Series B | | | 6.05 | | | | 12-1-2030 | | | | 350,000 | | | | 446,261 | |
King County WA Economic Development Taxable Bond Series C | | | 5.03 | | | | 12-1-2023 | | | | 230,000 | | | | 256,393 | |
Washington Build America Bonds Series D | | | 5.48 | | | | 8-1-2039 | | | | 1,000,000 | | | | 1,369,030 | |
Washington Series T | | | 3.45 | | | | 8-1-2029 | | | | 1,000,000 | | | | 1,135,150 | |
| | | | |
| | | | | | | | | | | | | | | 3,206,834 | |
| | | | | | | | | | | | | | | | |
| | | | |
| Tax Revenue: 0.05% | | | | | | | | | | | | |
Washington Build America Bonds | | | 5.09 | | | | 8-1-2033 | | | | 175,000 | | | | 224,198 | |
| | | | | | | | | | | | | | | | |
| | | | |
| | | | | | | | | | | | | | | 3,431,032 | |
| | | | | | | | | | | | | | | | |
| | | | |
West Virginia: 0.10% | | | | | | | | | | | | | | | | |
| | | | |
| Tax Revenue: 0.10% | | | | | | | | | | | | |
Ohio County WV Special District Excise Tax Series A | | | 8.25 | | | | 3-1-2035 | | | | 425,000 | | | | 463,480 | |
| | | | | | | | | | | | | | | | |
| | | | |
Wisconsin: 0.43% | | | | | | | | | | | | | | | | |
| | | | |
| GO Revenue: 0.37% | | | | | | | | | | | | |
Wisconsin State Refunding Bond Series 1 | | | 2.50 | | | | 5-1-2032 | | | | 1,705,000 | | | | 1,723,141 | |
| | | | | | | | | | | | | | | | |
| | | | |
| Miscellaneous Revenue: 0.06% | | | | | | | | | | | | |
Wisconsin General Fund Annual Appropriation Series A | | | 2.30 | | | | 5-1-2028 | | | | 250,000 | | | | 257,623 | |
| | | | | | | | | | | | | | | | |
| | | | |
| | | | | | | | | | | | | | | 1,980,764 | |
| | | | | | | | | | | | | | | | |
| | | | |
Total Municipal Obligations (Cost $49,199,494) | | | | | | | | | | | | | | | 51,917,671 | |
| | | | | | | | | | | | | | | | |
| | | | |
| Non-Agency Mortgage-Backed Securities: 7.46% | | | | | | | | | | | | |
Commercial Mortgage Pass-Through Certificate Series 2010-C1 Class A3 144A | | | 4.21 | | | | 7-10-2046 | | | | 49,880 | | | | 49,994 | |
Commercial Mortgage Pass-Through Certificate Series 2012-CR2 Class A4 | | | 3.15 | | | | 8-15-2045 | | | | 550,000 | | | | 564,631 | |
Commercial Mortgage Pass-Through Certificate Series 2012-UBS5 Class A3 | | | 3.55 | | | | 9-10-2047 | | | | 538,554 | | | | 557,679 | |
Commercial Mortgage Pass-Through Certificate Series 2013-CR12 Class ASB | | | 3.62 | | | | 10-10-2046 | | | | 388,273 | | | | 399,440 | |
Commercial Mortgage Pass-Through Certificate Series 2013-CR13 Class A4 ±± | | | 4.19 | | | | 11-10-2046 | | | | 600,000 | | | | 647,028 | |
Commercial Mortgage Pass-Through Certificate Series 2014-CR17 Class A5 | | | 3.98 | | | | 5-10-2047 | | | | 1,795,000 | | | | 1,936,700 | |
Commercial Mortgage Pass-Through Certificate Series 2014-CR21 Class A3 | | | 3.53 | | | | 12-10-2047 | | | | 2,684,674 | | | | 2,867,720 | |
Commercial Mortgage Pass-Through Certificate Series 2014-UBS5 Class A4 | | | 3.84 | | | | 9-10-2047 | | | | 620,000 | | | | 662,794 | |
Goldman Sachs Mortgage Securities Trust Series 2011-GC3 Class A4 144A | | | 4.75 | | | | 3-10-2044 | | | | 400,569 | | | | 405,088 | |
Goldman Sachs Mortgage Securities Trust Series 2011-GC5 Class A4 | | | 3.71 | | | | 8-10-2044 | | | | 545,000 | | | | 552,250 | |
Goldman Sachs Mortgage Securities Trust Series 2012-GCJ7 Class A4 | | | 3.38 | | | | 5-10-2045 | | | | 424,856 | | | | 431,023 | |
Goldman Sachs Mortgage Securities Trust Series 2013-GC14 Class A5 | | | 4.24 | | | | 8-10-2046 | | | | 615,000 | | | | 660,810 | |
Goldman Sachs Mortgage Securities Trust Series 2013-GC16 Class A4 | | | 4.27 | | | | 11-10-2046 | | | | 350,000 | | | | 376,400 | |
Goldman Sachs Mortgage Securities Trust Series 2014-GC26 Class A5 | | | 3.63 | | | | 11-10-2047 | | | | 2,565,000 | | | | 2,765,317 | |
JPMorgan Chase Commercial Mortgage Securities Trust Series 2010-C2 Class A3 144A | | | 4.07 | | | | 11-15-2043 | | | | 203,103 | | | | 203,081 | |
The accompanying notes are an integral part of these financial statements.
Wells Fargo Managed Fixed Income Portfolio | 15
Portfolio of investments—May 31, 2020
| | | | | | | | | | | | | | | | |
| | | Interest rate | | | Maturity date | | | Principal | | | Value | |
| | | | |
| Non-Agency Mortgage-Backed Securities (continued) | | | | | | | | | | | | |
JPMorgan Chase Commercial Mortgage Securities Trust Series 2014-C19 Class A4 | | | 4.00 | % | | | 4-15-2047 | | | $ | 450,000 | | | $ | 484,465 | |
JPMorgan Chase Commercial Mortgage Securities Trust Series 2014-C20 Class A5 | | | 3.80 | | | | 7-15-2047 | | | | 4,065,000 | | | | 4,359,828 | |
JPMorgan Chase Commercial Mortgage Securities Trust Series 2014-GC26 Class A4 | | | 3.49 | | | | 1-15-2048 | | | | 1,338,000 | | | | 1,429,685 | |
Morgan Stanley Bank of America Merrill Lynch Trust Series 2014-C15 Class ASB | | | 3.65 | | | | 4-15-2047 | | | | 441,785 | | | | 460,080 | |
Morgan Stanley Bank of America Merrill Lynch Trust Series 2014-C19 Class A4 | | | 3.53 | | | | 12-15-2047 | | | | 1,790,000 | | | | 1,902,549 | |
Morgan Stanley Capital I Trust Series 2011-C2 Class A4 144A | | | 4.66 | | | | 6-15-2044 | | | | 478,042 | | | | 489,820 | |
Morgan Stanley Capital I Trust Series 2011-C3 Class A4 | | | 4.12 | | | | 7-15-2049 | | | | 359,247 | | | | 366,240 | |
Towd Point Mortgage Trust Series 2016-2 Class A1A 144A±± | | | 2.75 | | | | 8-25-2055 | | | | 159,181 | | | | 161,888 | |
Towd Point Mortgage Trust Series 2016-3 Class A1 144A±± | | | 2.25 | | | | 4-25-2056 | | | | 197,078 | | | | 198,443 | |
Towd Point Mortgage Trust Series 2018-3 Class A1 144A±± | | | 3.75 | | | | 5-25-2058 | | | | 2,168,205 | | | | 2,279,118 | |
Towd Point Mortgage Trust Series 2019-4 Class A1 144A±± | | | 2.90 | | | | 10-25-2059 | | | | 2,559,500 | | | | 2,646,029 | |
WFRBS Commercial Mortgage Trust Series 2013-C17 Class A4 | | | 4.02 | | | | 12-15-2046 | | | | 4,370,000 | | | | 4,626,750 | |
WFRBS Commercial Mortgage Trust Series 2014-C20 Class A5 | | | 4.00 | | | | 5-15-2047 | | | | 1,876,047 | | | | 2,008,063 | |
| | | | |
Total Non-Agency Mortgage-Backed Securities (Cost $33,017,959) | | | | | | | | | | | | | | | 34,492,913 | |
| | | | | | | | | | | | | | | | |
| | | | |
| U.S. Treasury Securities: 4.34% | | | | | | | | | | | | |
U.S. Treasury Bond | | | 2.38 | | | | 11-15-2049 | | | | 11,953,000 | | | | 14,730,205 | |
U.S. Treasury Bond | | | 4.25 | | | | 5-15-2039 | | | | 1,890,000 | | | | 2,920,419 | |
U.S. Treasury Bond | | | 4.50 | | | | 5-15-2038 | | | | 1,540,000 | | | | 2,426,884 | |
| | | | |
Total U.S. Treasury Securities (Cost $19,620,301) | | | | | | | | | | | | | | | 20,077,508 | |
| | | | | | | | | | | | | | | | |
| | | | |
Yankee Corporate Bonds and Notes: 4.65% | | | | | | | | | | | | | | | | |
| | | | |
Consumer Staples: 0.12% | | | | | | | | | | | | | | | | |
| | | | |
| Beverages: 0.12% | | | | | | | | | | | | |
Diageo Capital plc | | | 2.00 | | | | 4-29-2030 | | | | 540,000 | | | | 548,565 | |
| | | | | | | | | | | | | | | | |
| | | | |
Energy: 0.50% | | | | | | | | | | | | | | | | |
| | | | |
| Oil, Gas & Consumable Fuels: 0.50% | | | | | | | | | | | | |
BP Capital Markets plc | | | 3.28 | | | | 9-19-2027 | | | | 155,000 | | | | 168,154 | |
Cenovus Energy Incorporated | | | 4.25 | | | | 4-15-2027 | | | | 1,025,000 | | | | 930,275 | |
Equinor ASA | | | 1.75 | | | | 1-22-2026 | | | | 70,000 | | | | 71,495 | |
Petroleos Mexicanos | | | 2.29 | | | | 2-15-2024 | | | | 110,000 | | | | 113,284 | |
Petroleos Mexicanos | | | 2.83 | | | | 2-15-2024 | | | | 230,000 | | | | 239,095 | |
Petroleos Mexicanos | | | 6.38 | | | | 1-23-2045 | | | | 1,080,000 | | | | 800,280 | |
| | | | |
| | | | | | | | | | | | | | | 2,322,583 | |
| | | | | | | | | | | | | | | | |
| | | | |
Financials: 1.97% | | | | | | | | | | | | | | | | |
| | | | |
| Banks: 1.16% | | | | | | | | | | | | |
Bank of Nova Scotia | | | 4.50 | | | | 12-16-2025 | | | | 80,000 | | | | 89,460 | |
BNP Paribas SA (3 Month LIBOR +1.11%) 144A± | | | 2.82 | | | | 11-19-2025 | | | | 820,000 | | | | 842,137 | |
BNP Paribas SA 144A | | | 4.40 | | | | 8-14-2028 | | | | 520,000 | | | | 593,601 | |
Cooperatieve Rabobank U.A. 144A | | | 3.88 | | | | 9-26-2023 | | | | 300,000 | | | | 325,287 | |
HSBC Holdings plc (3 Month LIBOR +1.06%) ± | | | 3.26 | | | | 3-13-2023 | | | | 220,000 | | | | 227,302 | |
HSBC Holdings plc (3 Month LIBOR +1.35%) ± | | | 4.29 | | | | 9-12-2026 | | | | 950,000 | | | | 1,049,708 | |
HSBC Holdings plc (3 Month LIBOR +1.53%) ± | | | 4.58 | | | | 6-19-2029 | | | | 1,500,000 | | | | 1,701,304 | |
Mitsubishi UFJ Financial Group Incorporated | | | 3.76 | | | | 7-26-2023 | | | | 350,000 | | | | 374,753 | |
Royal Bank of Canada | | | 4.65 | | | | 1-27-2026 | | | | 120,000 | | | | 137,845 | |
| | | | |
| | | | | | | | | | | | | | | 5,341,397 | |
| | | | | | | | | | | | | | | | |
The accompanying notes are an integral part of these financial statements.
16 | Wells Fargo Managed Fixed Income Portfolio
Portfolio of investments—May 31, 2020
| | | | | | | | | | | | | | | | |
| | | Interest rate | | | Maturity date | | | Principal | | | Value | |
| Capital Markets: 0.45% | | | | | | | | | | | | |
Credit Suisse Group AG (3 Month LIBOR +1.41%) 144A± | | | 3.87 | % | | | 1-12-2029 | | | $ | 1,500,000 | | | $ | 1,617,682 | |
Credit Suisse Group AG (3 Month LIBOR +1.24%) 144A± | | | 4.21 | | | | 6-12-2024 | | | | 450,000 | | | | 480,562 | |
| | | | |
| | | | | | | | | | | | | | | 2,098,244 | |
| | | | | | | | | | | | | | | | |
| | | | |
| Consumer Finance: 0.36% | | | | | | | | | | | | |
UBS Group Funding Switzerland 144A | | | 4.25 | | | | 3-23-2028 | | | | 1,500,000 | | | | 1,678,215 | |
| | | | | | | | | | | | | | | | |
| | | | |
Health Care: 0.28% | | | | | | | | | | | | | | | | |
| | | | |
| Pharmaceuticals: 0.28% | | | | | | | | | | | | |
Teva Pharmaceutical Finance BV | | | 2.20 | | | | 7-21-2021 | | | | 150,000 | | | | 147,068 | |
Teva Pharmaceutical Finance BV | | | 2.80 | | | | 7-21-2023 | | | | 900,000 | | | | 850,500 | |
Teva Pharmaceutical Finance BV | | | 3.15 | | | | 10-1-2026 | | | | 350,000 | | | | 314,405 | |
| | | | |
| | | | | | | | | | | | | | | 1,311,973 | |
| | | | | | | | | | | | | | | | |
| | | | |
Industrials: 0.60% | | | | | | | | | | | | | | | | |
| | | | |
| Aerospace & Defense: 0.24% | | | | | | | | | | | | |
Embraer Netherlands Finance BV | | | 5.05 | | | | 6-15-2025 | | | | 1,200,000 | | | | 1,092,240 | |
| | | | | | | | | | | | | | | | |
| | | | |
| Electrical Equipment: 0.06% | | | | | | | | | | | | |
Sensata Technologies BV 144A | | | 5.63 | | | | 11-1-2024 | | | | 265,000 | | | | 277,232 | |
| | | | | | | | | | | | | | | | |
| | | | |
| Machinery: 0.30% | | | | | | | | | | | | |
CNH Industrial NV | | | 4.50 | | | | 8-15-2023 | | | | 600,000 | | | | 628,303 | |
Ingersoll-Rand Luxembourg SA | | | 3.50 | | | | 3-21-2026 | | | | 700,000 | | | | 752,920 | |
| | | | |
| | | | | | | | | | | | | | | 1,381,223 | |
| | | | | | | | | | | | | | | | |
| | | | |
Information Technology: 0.18% | | | | | | | | | | | | | | | | |
| | | | |
| Software: 0.18% | | | | | | | | | | | | |
Experian Finance plc 144A | | | 4.25 | | | | 2-1-2029 | | | | 510,000 | | | | 569,157 | |
OpenText Corporation 144A | | | 3.88 | | | | 2-15-2028 | | | | 260,000 | | | | 256,602 | |
| | | | |
| | | | | | | | | | | | | | | 825,759 | |
| | | | | | | | | | | | | | | | |
| | | | |
Materials: 1.00% | | | | | | | | | | | | | | | | |
| | | | |
| Chemicals: 0.04% | | | | | | | | | | | | |
Nutrien Limited | | | 2.95 | | | | 5-13-2030 | | | | 180,000 | | | | 187,852 | |
| | | | | | | | | | | | | | | | |
| | | | |
| Metals & Mining: 0.96% | | | | | | | | | | | | |
Anglo American Capital plc 144A | | | 4.75 | | | | 4-10-2027 | | | | 1,000,000 | | | | 1,066,673 | |
ArcelorMittal SA | | | 6.13 | | | | 6-1-2025 | | | | 1,500,000 | | | | 1,628,374 | |
Vale Overseas Limited | | | 6.25 | | | | 8-10-2026 | | | | 1,500,000 | | | | 1,715,027 | |
| | | | |
| | | | | | | | | | | | | | | 4,410,074 | |
| | | | | | | | | | | | | | | | |
| | | | |
Total Yankee Corporate Bonds and Notes (Cost $20,509,079) | | | | | | | | | | | | | | | 21,475,357 | |
| | | | | | | | | | | | | | | | |
| | | | |
| | | | | | | | | | | | | | | | |
| | | Yield | | | | | | Shares | | | | |
| Short-Term Investments: 2.79% | | | | | | | | | | | | |
| | | | |
| Investment Companies: 2.79% | | | | | | | | | | | | |
Wells Fargo Government Money Market Fund Select Class (l)(u)## | | | 0.12 | | | | | | | | 12,907,842 | | | | 12,907,842 | |
| | | | | | | | | | | | | | | | |
| | | | |
Total Short-Term Investments (Cost $12,907,842) | | | | | | | | | | | | | | | 12,907,842 | |
| | | | | | | | | | | | | | | | |
| | | | | | | | |
| Total investments in securities (Cost $434,159,094) | | | 99.39 | % | | | 459,418,941 | |
| | |
Other assets and liabilities, net | | | 0.61 | | | | 2,829,721 | |
| | | | | | | | |
| Total net assets | | | 100.00 | % | | $ | 462,248,662 | |
| | | | | | | | |
The accompanying notes are an integral part of these financial statements.
Wells Fargo Managed Fixed Income Portfolio | 17
Portfolio of investments—May 31, 2020
| ±± | The coupon of the security is adjusted based on the principal and interest payments received from the underlying pool of mortgages as well as the credit quality and the actual prepayment speed of the underlying mortgages. |
| 144A | The security may be resold in transactions exempt from registration, normally to qualified institutional buyers, pursuant to Rule 144A under the Securities Act of 1933. |
| ± | Variable rate investment. The rate shown is the rate in effect at period end. |
| %% | The security is purchased on a when-issued basis. |
| (l) | The issuer of the security is an affiliated person of the Portfolio as defined in the Investment Company Act of 1940. |
| (u) | The rate represents the 7-day annualized yield at period end. |
| ## | All or a portion of this security is segregated for when-issued securities. |
Abbreviations:
| AGM | Assured Guaranty Municipal |
| FHLMC | Federal Home Loan Mortgage Corporation |
| FNMA | Federal National Mortgage Association |
| GNMA | Government National Mortgage Association |
| HEFA | Health & Educational Facilities Authority |
| HEFAR | Higher Educational Facilities Authority Revenue |
| LIBOR | London Interbank Offered Rate |
| RDA | Redevelopment Authority |
| REIT | Real Estate Investment Trust |
| SOFR | Secured Overnight Financing Rate |
Investments in Affiliates
An affiliated investment is an investment in which the Portfolio owns at least 5% of the outstanding voting shares of the issuer or as a result of other relationships, such as the Portfolio and the issuer having the same adviser or investment manager. Transactions with issuers that were either affiliated persons of the Portfolio at the beginning of the period or the end of the period were as follows:
| | | | | | | | | | | | | | | | | | | | | | | | | | | | | | | | | | | | |
| | | Shares, beginning of period | | | Shares purchased | | | Shares sold | | | Shares, end of period | | | Net realized gains (losses) | | | Net change in unrealized gains (losses) | | | Income from affiliated securities | | | Value, end of period | | | % of net assets | |
| | | | | | | | | |
| Short-Term Investments | | | | | | | | | | | | | | | | | | | | | | | | | | | |
Investment Companies | | | | | | | | | | | | | | | | | | | | | | | | | | | | | | | | | | | | |
Securities Lending Cash Investments LLC * | | | 5,121,429 | | | | 17,800,239 | | | | (22,921,668 | ) | | | 0 | | | $ | 25 | | | $ | 0 | | | $ | 50,250 | # | | $ | 0 | | | | | |
Wells Fargo Government Money Market Fund Select Class | | | 3,089,575 | | | | 190,947,911 | | | | (181,129,644 | ) | | | 12,907,842 | | | | 0 | | | | 0 | | | | 129,592 | | | | 12,907,842 | | | | | |
| | | | | | | | | | | | | | | | | | | | | | | | | | | | | | | | | | | | |
| | | | | | | | | | | | | | | | | | $ | 25 | | | $ | 0 | | | $ | 179,842 | | | $ | 12,907,842 | | | | 2.79 | % |
| | | | | | | | | | | | | | | | | | | | | | | | | | | | | | | | | | | | |
| * | No longer held at the end of the period |
| # | Amount shown represents income before fees and rebates. |
The accompanying notes are an integral part of these financial statements.
18 | Wells Fargo Managed Fixed Income Portfolio
Statement of assets and liabilities—May 31, 2020
| | | | |
| | | | |
| |
Assets | | | | |
Investments in unaffiliated securities, at value (cost $421,251,252) | | $ | 446,511,099 | |
Investments in affiliated securities, at value (cost $12,907,842) | | | 12,907,842 | |
Receivable for interest | | | 3,254,177 | |
Prepaid expenses and other assets | | | 88,941 | |
| | | | |
Total assets | | | 462,762,059 | |
| | | | |
| |
Liabilities | | | | |
Payable for investments purchased | | | 370,000 | |
Advisory fee payable | | | 142,615 | |
Trustees’ fees and expenses payable | | | 782 | |
| | | | |
Total liabilities | | | 513,397 | |
| | | | |
Total net assets | | $ | 462,248,662 | |
| | | | |
The accompanying notes are an integral part of these financial statements.
Wells Fargo Managed Fixed Income Portfolio | 19
Statement of operations—year ended May 31, 2020
| | | | |
| | | | |
| |
Investment income | | | | |
Interest | | $ | 18,803,085 | |
Income from affiliated securities | | | 144,586 | |
| | | | |
Total investment income | | | 18,947,671 | |
| | | | |
| |
Expenses | | | | |
Advisory fee | | | 2,161,564 | |
Custody and accounting fees | | | 17,101 | |
Professional fees | | | 53,740 | |
Shareholder report expenses | | | 2,581 | |
Trustees’ fees and expenses | | | 20,255 | |
Interest expense | | | 389 | |
Other fees and expenses | | | 5,327 | |
| | | | |
Total expenses | | | 2,260,957 | |
Less: Fee waivers and/or expense reimbursements | | | (147,196 | ) |
| | | | |
Net expenses | | | 2,113,761 | |
| | | | |
Net investment income | | | 16,833,910 | |
| | | | |
| |
Realized and unrealized gains (losses) on investments | | | | |
Net realized gains on | | | | |
Unaffiliated securities | | | 18,337,208 | |
Affiliated securities | | | 25 | |
| | | | |
Net realized gains on investments | | | 18,337,233 | |
Net change in unrealized gains (losses) on investments | | | 3,278,902 | |
| | | | |
Net realized and unrealized gains (losses) on investments | | | 21,616,135 | |
| | | | |
Net increase in net assets resulting from operations | | $ | 38,450,045 | |
| | | | |
The accompanying notes are an integral part of these financial statements.
20 | Wells Fargo Managed Fixed Income Portfolio
Statement of changes in net assets
| | | | | | | | |
| | | Year ended
May 31, 2020 | | | Year ended
May 31, 2019 | |
| | |
Operations | | | | | | | | |
Net investment income | | $ | 16,833,910 | | | $ | 20,432,930 | |
Net realized gains on investments | | | 18,337,233 | | | | 206,870 | |
Net change in unrealized gains (losses) on investments | | | 3,278,902 | | | | 22,412,280 | |
| | | | |
Net increase in net assets resulting from operations | | | 38,450,045 | | | | 43,052,080 | |
| | | | |
| | |
Capital transactions | | | | | | | | |
Transactions in investors’ beneficial interests | | | | | | | | |
Contributions | | | 23,945,990 | | | | 705,018,550 | |
Withdrawals | | | (183,068,121 | ) | | | (271,861,718 | ) |
| | | | |
Net increase (decrease) in net assets resulting from capital transactions | | | (159,122,131 | ) | | | 433,156,832 | |
| | | | |
Total increase (decrease) in net assets | | | (120,672,086 | ) | | | 476,208,912 | |
| | | | |
| | |
Net assets | | | | | | | | |
Beginning of period | | | 582,920,748 | | | | 106,711,836 | |
| | | | |
End of period | | $ | 462,248,662 | | | $ | 582,920,748 | |
| | | | |
The accompanying notes are an integral part of these financial statements.
Wells Fargo Managed Fixed Income Portfolio | 21
Financial highlights
| | | | | | | | | | | | | | | | | | | | |
| | | Year ended May 31 | |
| | | 2020 | | | 2019 | | | 2018 | | | 2017 | | | 2016 | |
Total return | | | 7.51 | % | | | 7.22 | % | | | 0.05 | % | | | 3.13 | % | | | 3.95 | % |
Ratios to average net assets (annualized) | | | | | | | | | | | | | | | | | | | | |
Gross expenses | | | 0.42 | % | | | 0.41 | % | | | 0.49 | % | | | 0.48 | % | | | 0.48 | % |
Net expenses | | | 0.39 | % | | | 0.39 | % | | | 0.39 | % | | | 0.39 | % | | | 0.39 | % |
Net investment income | | | 3.10 | % | | | 3.24 | % | | | 3.09 | % | | | 2.99 | % | | | 3.12 | % |
Supplemental data | | | | | | | | | | | | | | | | | | | | |
Portfolio turnover rate | | | 40 | % | | | 232 | % | | | 23 | % | | | 47 | % | | | 25 | % |
The accompanying notes are an integral part of these financial statements.
22 | Wells Fargo Managed Fixed Income Portfolio
Notes to financial statements
1. ORGANIZATION
Wells Fargo Master Trust (the “Trust”), a Delaware statutory trust organized on March 10, 1999, is an open-end management investment company registered under the Investment Company Act of 1940, as amended (the “1940 Act”). As an investment company, the Trust follows the accounting and reporting guidance in Financial Accounting Standards Board (“FASB”) Accounting Standards Codification Topic 946, Financial Services – Investment Companies. These financial statements report on the Wells Fargo Managed Fixed Income Portfolio (the “Portfolio”) which is a diversified series of the Trust.
2. SIGNIFICANT ACCOUNTING POLICIES
The following significant accounting policies, which are consistently followed in the preparation of the financial statements of the Portfolio, are in conformity with U.S. generally accepted accounting principles which require management to make estimates and assumptions that affect the reported amounts of assets and liabilities, disclosure of contingent assets and liabilities at the date of the financial statements, and the reported amounts of revenues and expenses during the reporting period. Actual results could differ from those estimates.
Securities valuation
All investments are valued each business day as of the close of regular trading on the New York Stock Exchange (generally 4 p.m. Eastern Time), although the Portfolio may deviate from this calculation time under unusual or unexpected circumstances.
Debt securities are valued at the evaluated bid price provided by an independent pricing service (e.g. taking into account various factors, including yields, maturities, or credit ratings) or, if a reliable price is not available, the quoted bid price from an independent broker-dealer.
Investments in registered open-end investment companies are valued at net asset value. Interests in non-registered investment companies that are redeemable at net asset value are fair valued normally at net asset value.
Investments which are not valued using any of the methods discussed above are valued at their fair value, as determined in good faith by the Board of Trustees of the Portfolio. The Board of Trustees has established a Valuation Committee comprised of the Trustees and has delegated to it the authority to take any actions regarding the valuation of portfolio securities that the Valuation Committee deems necessary or appropriate, including determining the fair value of portfolio securities, unless the determination has been delegated to the Wells Fargo Asset Management Pricing Committee at Wells Fargo Funds Management, LLC (“Funds Management”). The Board of Trustees retains the authority to make or ratify any valuation decisions or approve any changes to the Valuation Procedures as it deems appropriate. On a quarterly basis, the Board of Trustees receives reports on any valuation actions taken by the Valuation Committee or the Wells Fargo Asset Management Pricing Committee which may include items for ratification.
Securities lending
The Portfolio may lend its securities from time to time in order to earn additional income in the form of fees or interest on securities received as collateral or the investment of any cash received as collateral. When securities are on loan, the Portfolio receives interest or dividends on those securities. Cash collateral received in connection with its securities lending transactions is invested in Securities Lending Cash Investments, LLC (the “Securities Lending Fund”). Investments in Securities Lending Fund are valued at the evaluated bid price provided by an independent pricing service. Income earned from investment in the Securities Lending Fund (net of fees and rebates), if any, is included in income from affiliated securities on the Statement of Operations.
In a securities lending transaction, the net asset value of the Portfolio is affected by an increase or decrease in the value of the securities loaned and by an increase or decrease in the value of the instrument in which collateral is invested. The amount of securities lending activity undertaken by the Portfolio fluctuates from time to time. The Portfolio has the right under the lending agreement to recover the securities from the borrower on demand. In the event of default or bankruptcy by the borrower, the Portfolio may be prevented from recovering the loaned securities or gaining access to the collateral or may experience delays or costs in doing so. In such an event, the terms of the agreement allow the unaffiliated securities lending agent to use the collateral to purchase replacement securities on behalf of the Portfolio or pay the Portfolio the market value of the loaned securities. The Portfolio bears the risk of loss with respect to depreciation of its investment of the cash collateral.
When-issued transactions
The Portfolio may purchase securities on a forward commitment or when-issued basis. The Portfolio records a when-issued transaction on the trade date and will segregate assets in an amount at least equal in value to the Portfolio’s commitment to purchase when-issued securities. Securities purchased on a when-issued basis are marked-to-market daily and the Portfolio begins earning interest on the settlement date. Losses may arise due to changes in the market value of the underlying securities or if the counterparty does not perform under the contract.
Wells Fargo Managed Fixed Income Portfolio | 23
Notes to financial statements
Security transactions and income recognition
Securities transactions are recorded on a trade date basis. Realized gains or losses are recorded on the basis of identified cost.
Interest income is accrued daily and bond discounts are accreted and premiums are amortized daily. To the extent debt obligations are placed on non-accrual status, any related interest income may be reduced by writing off interest receivables when the collection of all or a portion of interest has been determined to be doubtful based on consistently applied procedures and the fair value has decreased. If the issuer subsequently resumes interest payments or when the collectability of interest is reasonably assured, the debt obligation is removed from non-accrual status.
Federal and other taxes
The Portfolio is treated as a separate entity for federal income tax purposes. The Portfolio is not required to pay federal income taxes on its net investment income and net capital gains as it is treated as a partnership for federal income tax purposes. All interest, gains and losses of the Portfolio are deemed to have been “passed through” to the interest holders in proportion to their holdings of the Portfolio regardless of whether interest and gains have been distributed by the Portfolio.
The Portfolio’s income tax returns and all financial records supporting those returns for the prior three fiscal years are subject to examination by the federal revenue authority. Management has analyzed the Portfolio’s tax positions taken on federal, state, and foreign tax returns for all open tax years and does not believe that there are any uncertain tax positions that require recognition of a tax liability.
As of May 31, 2020, the aggregate cost of all investments for federal income tax purposes was $434,293,877 and the unrealized gains (losses) consisted of:
| | | | |
| |
Gross unrealized gains | | $ | 29,988,339 | |
| |
Gross unrealized losses | | | (4,863,275 | ) |
| |
Net unrealized gains | | $ | 25,125,064 | |
3. FAIR VALUATION MEASUREMENTS
Fair value measurements of investments are determined within a framework that has established a fair value hierarchy based upon the various data inputs utilized in determining the value of the Portfolio’s investments. The three-level hierarchy gives the highest priority to unadjusted quoted prices in active markets for identical assets or liabilities (Level 1) and the lowest priority to unobservable inputs (Level 3). The Portfolio’s investments are classified within the fair value hierarchy based on the lowest level of input that is significant to the fair value measurement. The inputs are summarized into three broad levels as follows:
| ∎ | | Level 1 – quoted prices in active markets for identical securities |
| ∎ | | Level 2 – other significant observable inputs (including quoted prices for similar securities, interest rates, prepayment speeds, credit risk, etc.) |
| ∎ | | Level 3 – significant unobservable inputs (including the Portfolio’s own assumptions in determining the fair value of investments) |
The inputs or methodologies used for valuing investments in securities are not necessarily an indication of the risk associated with investing in those securities.
24 | Wells Fargo Managed Fixed Income Portfolio
Notes to financial statements
The following is a summary of the inputs used in valuing the Portfolio’s assets and liabilities as of May 31, 2020:
| | | | | | | | | | | | | | | | |
| | | | |
| | | Quoted prices (Level 1) | | | Other significant observable inputs (Level 2) | | | Significant unobservable inputs (Level 3) | | | Total | |
| | | | |
Assets | | | | | | | | | | | | | | | | |
Investments in: | | | | | | | | | | | | | | | | |
| | | | |
Agency securities | | $ | 0 | | | $ | 141,294,239 | | | $ | 0 | | | $ | 141,294,239 | |
| | | | |
Asset-backed securities | | | 0 | | | | 7,654,556 | | | | 0 | | | | 7,654,556 | |
| | | | |
Corporate bonds and notes | | | 0 | | | | 169,598,855 | | | | 0 | | | | 169,598,855 | |
| | | | |
Municipal obligations | | | 0 | | | | 51,917,671 | | | | 0 | | | | 51,917,671 | |
| | | | |
Non-agency mortgage-backed securities | | | 0 | | | | 34,492,913 | | | | 0 | | | | 34,492,913 | |
| | | | |
U.S. Treasury securities | | | 20,077,508 | | | | 0 | | | | 0 | | | | 20,077,508 | |
| | | | |
Yankee corporate bonds and notes | | | 0 | | | | 21,475,357 | | | | 0 | | | | 21,475,357 | |
| | | | |
Short-term investments | | | | | | | | | | | | | | | | |
| | | | |
Investment companies | | | 12,907,842 | | | | 0 | | | | 0 | | | | 12,907,842 | |
| | | | |
Total assets | | $ | 32,985,350 | | | $ | 426,433,591 | | | $ | 0 | | | $ | 459,418,941 | |
Additional sector, industry or geographic detail is included in the Portfolio of Investments.
For the year ended May 31, 2020, the Portfolio did not have any transfers into/out of Level 3.
4. TRANSACTIONS WITH AFFILIATES
Advisory fee
The Trust has entered into an advisory contract with Funds Management, an indirect wholly owned subsidiary of Wells Fargo & Company (“Wells Fargo”). The adviser is responsible for implementing investment policies and guidelines and for supervising the subadviser, who is responsible for day-to-day portfolio management of the Portfolio. Pursuant to the contract, Funds Management is entitled to receive an annual advisory fee at the following annual rate based on the Portfolio’s average daily net assets:
| | | | |
| |
| Average daily net assets | | Advisory fee | |
| |
First $500 million | | | 0.400 | % |
| |
Next $500 million | | | 0.375 | |
| |
Next $2 billion | | | 0.350 | |
| |
Next $2 billion | | | 0.325 | |
| |
Next $5 billion | | | 0.300 | |
| |
Over $10 billion | | | 0.290 | |
For the year ended May 31, 2020, the advisory fee was equivalent to an annual rate of 0.40% of the Portfolio’s average daily net assets.
Funds Management has retained the services of a subadviser to provide daily portfolio management to the Portfolio. The fee for subadvisory services is borne by Funds Management. Galliard Capital Management, Inc., an affiliate of Funds Management and an indirect wholly owned subsidiary of Wells Fargo, is the subadviser to the Portfolio and is entitled to receive a fee from Funds Management at an annual rate starting at 0.20% and declining to 0.10% as the average daily net assets of the Portfolio increase.
Funds Management has voluntarily waived and/or reimbursed advisory fees to reduce the net operating expense ratio of the Portfolio.
Wells Fargo Managed Fixed Income Portfolio | 25
Notes to financial statements
Interfund transactions
The Portfolio may purchase or sell portfolio investment securities to certain other Wells Fargo affiliates pursuant to Rule 17a-7 under the 1940 Act and under procedures adopted by the Board of Trustees. The procedures have been designed to ensure that these interfund transactions, which do not incur broker commissions, are effected at current market prices.
5. INVESTMENT PORTFOLIO TRANSACTIONS
Purchases and sales of investments, excluding short-term securities, for the year ended May 31, 2020 were as follows:
| | | | | | |
Purchases at cost | | Sales proceeds |
U.S. government | | Non-U.S. government | | U.S. government | | Non-U.S. government |
| $124,383,881 | | $87,757,842 | | $142,192,691 | | $190,542,658 |
6. SECURITIES LENDING TRANSACTIONS
The Portfolio lends its securities through an unaffiliated securities lending agent and receives collateral in the form of cash or securities with a value at least equal to the value of the securities on loan. The value of the loaned securities is determined at the close of each business day and any increases or decreases in the required collateral are exchanged between the Portfolio and the counterparty on the next business day. Cash collateral received is invested in the Securities Lending Fund which seeks to provide a positive return compared to the daily Fed Funds Open Rate by investing in high-quality, U.S. dollar-denominated short-term money market instruments and is exempt from registration under Section 3(c)(7) of the 1940 Act. Securities Lending Fund is managed by Funds Management and is subadvised by Wells Capital Management Incorporated (“WellsCap”), an affiliate of Funds Management and an indirect wholly owned subsidiary of Wells Fargo. Funds Management receives an advisory fee starting at 0.05% and declining to 0.01% as the average daily net assets of the Securities Lending Fund increase. All of the fees received by Funds Management are paid to WellsCap for its services as subadviser.
In the event of counterparty default or the failure of a borrower to return a loaned security, the Portfolio has the right to use the collateral to offset any losses incurred. As of May 31, 2020, the Portfolio did not have any securities on loan.
7. BANK BORROWINGS
The Trust, along with Wells Fargo Variable Trust and Wells Fargo Funds Trust (excluding the money market funds), are parties to a $280,000,000 revolving credit agreement whereby the Portfolio is permitted to use bank borrowings for temporary or emergency purposes, such as to fund shareholder redemption requests. Interest under the credit agreement is charged to the Portfolio based on a borrowing rate equal to the higher of the Federal Funds rate in effect on that day plus 1.25% or the overnight LIBOR rate in effect on that day plus 1.25%. In addition, an annual commitment fee equal to 0.25% of the unused balance is allocated to each participating fund.
During the year ended May 31, 2020, the Fund had average borrowings outstanding of $28,815 at an average rate of 1.35% and paid interest in the amount of $389.
8. INDEMNIFICATION
Under the Portfolio’s organizational documents, the officers and Trustees have been granted certain indemnification rights against certain liabilities that may arise out of performance of their duties to the Portfolio. The Portfolio has entered into a separate agreement with each Trustee that converts indemnification rights currently existing under the Portfolio’s organizational documents into contractual rights that cannot be changed in the future without the consent of the Trustee. Additionally, in the normal course of business, the Portfolio may enter into contracts with service providers that contain a variety of indemnification clauses. The Portfolio’s maximum exposure under these arrangements is dependent on future claims that may be made against the Portfolio and, therefore, cannot be estimated.
9. NEW ACCOUNTING PRONOUNCEMENTS
In August 2018, FASB issued Accounting Standards Update (“ASU”) No. 2018-13, Fair Value Measurement (Topic 820) Disclosure Framework—Changes to the Disclosure Requirements for Fair Value Measurement. ASU 2018-13 updates the disclosure requirements for fair value measurements by modifying or removing certain disclosures and adding certain new disclosures. The amendments are effective for fiscal years, and interim periods within those fiscal years, beginning after December 15, 2019. Early adoption is permitted. Management has adopted the removal and modification of disclosures early, as permitted, and will adopt the additional new disclosures at the effective date.
26 | Wells Fargo Managed Fixed Income Portfolio
Notes to financial statements
In March 2017, FASB issued ASU No. 2017-08, Premium Amortization on Purchased Callable Debt Securities. ASU 2017-08 shortens the amortization period for certain callable debt securities held at a premium and requires the premium to be amortized to the earliest call date. The amendments do not require an accounting change for securities held at a discount and discounts will continue to be accreted to the maturity date of the security. ASU 2017-08 is effective for fiscal years beginning after December 15, 2018 and for interim periods within those fiscal years. During the current reporting period, management of the Portfolio adopted the change in accounting policy which did not have a material impact to the Portfolio’s financial statements.
10. CORONAVIRUS (COVID-19) PANDEMIC
On March 11, 2020, the World Health Organization announced that it had made the assessment that coronavirus disease 2019 (“COVID-19”) is a pandemic. The impacts of COVID-19 are adversely affecting the entire global economy, individual companies and investment products, and the market in general. There is significant uncertainty around the extent and duration of business disruptions related to COVID-19 and the impacts may be short term or may last for an extended period of time. The risk of further spreading of COVID-19 has led to significant uncertainty and volatility in the financial markets. The value of the Portfolio and the securities in which the Portfolio invests have generally been adversely affected by impacts caused by COVID-19.
Wells Fargo Managed Fixed Income Portfolio | 27
Report of independent registered public accounting firm
TO THE INTEREST HOLDERS OF THE PORTFOLIO AND BOARD OF TRUSTEES
WELLS FARGO MASTER TRUST:
Opinion on the Financial Statements
We have audited the accompanying statement of assets and liabilities of Wells Fargo Managed Fixed Income Portfolio (the Portfolio), one of the portfolios constituting Wells Fargo Master Trust, including the portfolio of investments as of May 31, 2020, the related statement of operations for the year then ended, the statements of changes in net assets for each of the years in the two-year period then ended, and the related notes (collectively, the financial statements) and the financial highlights for each of the years in the five-year period then ended. In our opinion, the financial statements and financial highlights present fairly, in all material respects, the financial position of the Portfolio as of May 31, 2020, the results of its operations for the year then ended, the changes in its net assets for each of the years in the two-year period then ended, and the financial highlights for each of the years in the five-year period then ended, in conformity with U.S. generally accepted accounting principles.
Basis for Opinion
These financial statements and financial highlights are the responsibility of the Portfolio’s management. Our responsibility is to express an opinion on these financial statements and financial highlights based on our audits. We are a public accounting firm registered with the Public Company Accounting Oversight Board (United States) (PCAOB) and are required to be independent with respect to the Portfolio in accordance with the U.S. federal securities laws and the applicable rules and regulations of the Securities and Exchange Commission and the PCAOB.
We conducted our audits in accordance with the standards of the PCAOB. Those standards require that we plan and perform the audit to obtain reasonable assurance about whether the financial statements and financial highlights are free of material misstatement, whether due to error or fraud. Our audits included performing procedures to assess the risks of material misstatement of the financial statements and financial highlights, whether due to error or fraud, and performing procedures that respond to those risks. Such procedures included examining, on a test basis, evidence regarding the amounts and disclosures in the financial statements and financial highlights. Such procedures also included confirmation of securities owned as May 31, 2020, by correspondence with the custodian, transfer agent and brokers, or by other appropriate auditing procedures. Our audits also included evaluating the accounting principles used and significant estimates made by management, as well as evaluating the overall presentation of the financial statements and financial highlights. We believe that our audits provide a reasonable basis for our opinion.

We have not been able to determine the specific year that we began serving as the auditor of one or more Wells Fargo Funds investment companies; however we are aware that we have served as the auditor of one or more Wells Fargo Funds investment companies since at least 1955.
Boston, Massachusetts
July 29, 2020
28 | Wells Fargo Managed Fixed Income Portfolio
Other information (unaudited)
PROXY VOTING INFORMATION
A description of the policies and procedures used to determine how to vote proxies relating to portfolio securities is available, upon request, by calling 1-800-222-8222, visiting our website at wfam.com, or visiting the SEC website at sec.gov. Information regarding how the proxies related to portfolio securities were voted during the most recent 12-month period ended June 30 is available on the website at wfam.com or by visiting the SEC website at sec.gov.
QUARTERLY PORTFOLIO HOLDINGS INFORMATION
The Portfolio files its complete schedule of portfolio holdings with the SEC for the first and third quarters of each fiscal year as an exhibit to its reports on Form N-PORT. Shareholders may view the filed Form N-PORT by visiting the SEC website at sec.gov.
Wells Fargo Managed Fixed Income Portfolio | 29
Other information (unaudited)
BOARD OF TRUSTEES AND OFFICERS
Each of the Trustees and Officers1 listed in the table below acts in identical capacities for each fund in the Wells Fargo family of funds, which consists of 147 mutual funds comprising the Wells Fargo Funds Trust, Wells Fargo Variable Trust, Wells Fargo Master Trust and four closed-end funds (collectively the “Fund Complex”). This table should be read in conjunction with the Prospectus and the Statement of Additional Information2. The mailing address of each Trustee and Officer is 525 Market Street, 12th Floor, San Francisco, CA 94105. Each Trustee and Officer serves an indefinite term, however, each Trustee serves such term until reaching the mandatory retirement age established by the Trustees.
Independent Trustees
| | | | | | |
Name and year of birth | | Position held and length of service* | | Principal occupations during past five years or longer | | Current other public company or investment company directorships |
| | | |
William R. Ebsworth (Born 1957) | | Trustee, since 2015 | | Retired. From 1984 to 2013, equities analyst, portfolio manager, research director and chief investment officer at Fidelity Management and Research Company in Boston, Tokyo, and Hong Kong, and retired in 2013 as Chief Investment Officer of Fidelity Strategic Advisers, Inc. where he led a team of investment professionals managing client assets. Prior thereto, Board member of Hong Kong Securities Clearing Co., Hong Kong Options Clearing Corp., the Thailand International Fund, Ltd., Fidelity Investments Life Insurance Company, and Empire Fidelity Investments Life Insurance Company. Audit Committee Chair and Investment Committee Chair of the Vincent Memorial Hospital Endowment (non-profit organization). Mr. Ebsworth is a CFA® charterholder. | | N/A |
| | | |
Jane A. Freeman (Born 1953) | | Trustee, since 2015; Chair Liaison, since 2018 | | Retired. From 2012 to 2014 and 1999 to 2008, Chief Financial Officer of Scientific Learning Corporation. From 2008 to 2012, Ms. Freeman provided consulting services related to strategic business projects. Prior to 1999, Portfolio Manager at Rockefeller & Co. and Scudder, Stevens & Clark. Board member of the Harding Loevner Funds from 1996 to 2014, serving as both Lead Independent Director and chair of the Audit Committee. Board member of the Russell Exchange Traded Funds Trust from 2011 to 2012 and the chair of the Audit Committee. Ms. Freeman is also an inactive Chartered Financial Analyst. | | N/A |
| | | |
Isaiah Harris, Jr. (Born 1952) | | Trustee, since 2009; Audit Committee Chairman, since 2019 | | Retired. Chairman of the Board of CIGNA Corporation since 2009, and Director since 2005. From 2003 to 2011, Director of Deluxe Corporation. Prior thereto, President and CEO of BellSouth Advertising and Publishing Corp. from 2005 to 2007, President and CEO of BellSouth Enterprises from 2004 to 2005 and President of BellSouth Consumer Services from 2000 to 2003. Emeritus member of the Iowa State University Foundation Board of Governors. Emeritus Member of the Advisory Board of Iowa State University School of Business. Advisory Board Member, Palm Harbor Academy (private school). Advisory Board Member, Child Evangelism Fellowship (non-profit). Mr. Harris is a certified public accountant (inactive status). | | CIGNA Corporation |
| | | |
Judith M. Johnson (Born 1949) | | Trustee, since 2008; Audit Committee Chairman, from 2009 to 2018 | | Retired. Prior thereto, Chief Executive Officer and Chief Investment Officer of Minneapolis Employees Retirement Fund from 1996 to 2008. Ms. Johnson is an attorney, certified public accountant and a certified managerial accountant. | | N/A |
30 | Wells Fargo Managed Fixed Income Portfolio
Other information (unaudited)
| | | | | | |
Name and year of birth | | Position held and length of service* | | Principal occupations during past five years or longer | | Current other public company or investment company directorships |
| | | |
David F. Larcker (Born 1950) | | Trustee, since 2009 | | James Irvin Miller Professor of Accounting at the Graduate School of Business, Stanford University, Director of the Corporate Governance Research Initiative and Senior Faculty of The Rock Center for Corporate Governance since 2006. From 2005 to 2008, Professor of Accounting at the Graduate School of Business, Stanford University. Prior thereto, Ernst & Young Professor of Accounting at The Wharton School, University of Pennsylvania from 1985 to 2005. | | N/A |
| | | |
Olivia S. Mitchell (Born 1953) | | Trustee, since 2006; Nominating and Governance Committee Chair, since 2018 | | International Foundation of Employee Benefit Plans Professor, Wharton School of the University of Pennsylvania since 1993. Director of Wharton’s Pension Research Council and Boettner Center on Pensions & Retirement Research, and Research Associate at the National Bureau of Economic Research. Previously, Cornell University Professor from 1978 to 1993. | | N/A |
| | | |
Timothy J. Penny (Born 1951) | | Trustee, since 1996; Chairman, since 2018 | | President and Chief Executive Officer of Southern Minnesota Initiative Foundation, a non-profit organization, since 2007. Member of the Board of Trustees of NorthStar Education Finance, Inc., a non-profit organization, since 2007. | | N/A |
| | | |
James G. Polisson (Born 1959) | | Trustee, since 2018 | | Retired. Chief Marketing Officer, Source (ETF) UK Services, Ltd, from 2015 to 2017. From 2012 to 2015, Principal of The Polisson Group, LLC, a management consulting, corporate advisory and principal investing company. Chief Executive Officer and Managing Director at Russell Investments, Global Exchange Traded Funds from 2010 to 2012. Managing Director of Barclays Global Investors from 1998 to 2010 and Global Chief Marketing Officer for iShares and Barclays Global Investors from 2000 to 2010. Trustee of the San Francisco Mechanics’ Institute, a non-profit organization, from 2013 to 2015. Board member of the Russell Exchange Traded Fund Trust from 2011 to 2012. Director of Barclays Global Investors Holdings Deutschland GmbH from 2006 to 2009. Mr. Polisson is an attorney and has a retired status with the Massachusetts and District of Columbia Bar Associations. | | N/A |
| | | |
Pamela Wheelock (Born 1959) | | Trustee, since January 2020; previously Trustee from January 2018 to July 2019 | | Board member of the Destination Medical Center Economic Development Agency, Rochester, Minnesota since 2019 and Interim President of the McKnight Foundation since 2020. Acting Commissioner, Minnesota Department of Human Services, July 2019 through September 2019. Human Services Manager (part-time), Minnesota Department of Human Services, October 2019 through December 2019. Chief Operating Officer, Twin Cities Habitat for Humanity from 2017 to 2019. Vice President of University Services, University of Minnesota from 2012 to 2016. Prior thereto, on the Board of Directors, Governance Committee and Finance Committee for the Minnesota Philanthropy Partners (Saint Paul Foundation) from 2012 to 2018, Interim Chief Executive Officer of Blue Cross Blue Shield of Minnesota from 2011 to 2012, Chairman of the Board from 2009 to 2012 and Board Director from 2003 to 2015. Vice President, Leadership and Community Engagement, Bush Foundation, Saint Paul, Minnesota (a private foundation) from 2009 to 2011. Executive Vice President and Chief Financial Officer, Minnesota Sports and Entertainment from 2004 to 2009 and Senior Vice President from 2002 to 2004. Executive Vice President of the Minnesota Wild Foundation from 2004 to 2008. Commissioner of Finance, State of Minnesota, from 1999 to 2002. Currently Board Chair of the Minnesota Wild Foundation since 2010. | | N/A |
| * | Length of service dates reflect the Trustee’s commencement of service with the Trust’s predecessor entities, where applicable. |
Wells Fargo Managed Fixed Income Portfolio | 31
Other information (unaudited)
Officers
| | | | |
Name and year of birth | | Position held and length of service | | Principal occupations during past five years or longer |
| | |
Andrew Owen (Born 1960) | | President, since 2017 | | Executive Vice President of Wells Fargo & Company and Head of Affiliated Managers, Wells Fargo Asset Management, since 2014. In addition, Mr. Owen is currently President, Chief Executive Officer and Director of Wells Fargo Funds Management, LLC since 2017. Prior thereto, Executive Vice President responsible for marketing, investments and product development for Wells Fargo Funds Management, LLC, from 2009 to 2014. |
| | |
Nancy Wiser1 (Born 1967) | | Treasurer, since 2012 | | Executive Vice President of Wells Fargo Funds Management, LLC since 2011. Chief Operating Officer and Chief Compliance Officer at LightBox Capital Management LLC, from 2008 to 2011. |
| | |
Michelle Rhee (Born 1966) | | Chief Legal Officer, since 2019 | | Secretary of Wells Fargo Funds Management, LLC, Chief Legal Counsel of Wells Fargo Asset Management and Assistant General Counsel of Wells Fargo Bank, N.A. since 2018. Associate General Counsel and Managing Director of Bank of America Corporation from 2004 to 2018. |
| | |
Catherine Kennedy (Born 1969) | | Secretary, since 2019 | | Vice President of Wells Fargo Funds Management, LLC and Senior Counsel of the Wells Fargo Legal Department since 2010. Vice President and Senior Counsel of Evergreen Investment Management Company, LLC from 1998 to 2010. |
| | |
Michael H. Whitaker (Born 1967) | | Chief Compliance Officer, since 2016 | | Chief Compliance Officer of Wells Fargo Asset Management since 2016. Senior Vice President and Chief Compliance Officer for Fidelity Investments from 2007 to 2016. |
| | |
David Berardi (Born 1975) | | Assistant Treasurer, since 2009 | | Vice President of Wells Fargo Funds Management, LLC since 2009. Vice President of Evergreen Investment Management Company, LLC from 2008 to 2010. Manager of Fund Reporting and Control for Evergreen Investment Management Company, LLC from 2004 to 2010. |
| | |
Jeremy DePalma1 (Born 1974) | | Treasurer, since 2012 | | Senior Vice President of Wells Fargo Funds Management, LLC since 2009. Senior Vice President of Evergreen Investment Management Company, LLC from 2008 to 2010 and head of the Fund Reporting and Control Team within Fund Administration from 2005 to 2010. |
| 1 | Nancy Wiser acts as Treasurer of 65 funds in the Fund Complex. Jeremy DePalma acts as the Treasurer of 82 funds in the Fund Complex. |
| 2 | The Statement of Additional Information includes additional information about the Trustees and is available, without charge, upon request, by calling 1-800-222-8222 or by visiting the website at wfam.com. |
32 | Wells Fargo Managed Fixed Income Portfolio
Other information (unaudited)
BOARD CONSIDERATION OF INVESTMENT ADVISORY AND SUB-ADVISORY AGREEMENTS:
Wells Fargo Managed Fixed Income Portfolio
Under the Investment Company Act of 1940 (the “1940 Act”), the Board of Trustees (the “Board”) of Wells Fargo Master Trust (the “Trust”) must determine annually whether to approve the continuation of the Trust’s investment advisory and sub-advisory agreements. In this regard, at a Board meeting held on May 26, 2020 and May 28, 2020 (together, the “Meeting”), the Board, all the members of which have no direct or indirect interest in the investment advisory and sub-advisory agreements and are not “interested persons” of the Trust, as defined in the 1940 Act (the “Independent Trustees”), reviewed and approved for the Wells Fargo Managed Fixed Income Portfolio (the “Portfolio”): (i) an investment advisory agreement (the “Advisory Agreement”) with Wells Fargo Funds Management, LLC (“Funds Management”); and (ii) an investment sub-advisory agreement (the “Sub-Advisory Agreement”) with Galliard Capital Management, Inc. (the “Sub-Adviser”), an affiliate of Funds Management. The Advisory Agreement and the Sub-Advisory Agreement are collectively referred to as the “Advisory Agreements.”
At the Meeting, the Board considered the factors and reached the conclusions described below relating to the selection of Funds Management and the Sub-Adviser and the approval of the Advisory Agreements. Prior to the Meeting, including at a Board meeting held in April 2020, the Trustees conferred extensively among themselves and with representatives of Funds Management about these matters. Also, the Board has adopted a team-based approach, with each team consisting of a sub-set of Trustees, to assist the full Board in the discharge of its duties in reviewing investment performance and other matters throughout the year. The Independent Trustees were assisted in their evaluation of the Advisory Agreements by independent legal counsel, from whom they received separate legal advice and with whom they met separately.
In providing information to the Board, Funds Management and the Sub-Adviser were guided by a detailed set of requests for information submitted to them by independent legal counsel on behalf of the Independent Trustees at the start of the Board’s annual contract renewal process earlier in 2020. In considering and approving the Advisory Agreements, the Trustees considered the information they believed relevant, including but not limited to the information discussed below. The Board considered not only the specific information presented in connection with the Meeting, but also the knowledge gained over time through interaction with Funds Management and the Sub-Adviser about various topics. In this regard, the Board reviewed reports of Funds Management at each of its quarterly meetings, which included, among other things, portfolio reviews and investment performance reports. In addition, the Board and the teams mentioned above confer with portfolio managers at various times throughout the year. The Board did not identify any particular information or consideration that was all-important or controlling, and each individual Trustee may have attributed different weights to various factors.
After its deliberations, the Board unanimously approved the continuation of the Advisory Agreements for a one-year term and determined that the compensation payable to Funds Management and the Sub-Adviser under each of the Advisory Agreements was reasonable. The Board considered the approval of the Advisory Agreements for the Portfolio as part of its consideration of agreements for funds across the complex, but its approvals were made on a portfolio-by-portfolio basis. The following summarizes a number of important, but not necessarily all, factors considered by the Board in support of its approvals.
Nature, extent and quality of services
The Board received and considered various information regarding the nature, extent and quality of services provided to the Portfolio by Funds Management and the Sub-Adviser under the Advisory Agreements. This information included a description of the investment advisory services and Portfolio-level administrative services covered by the Advisory Agreement, as well as, among other things, a summary of the background and experience of senior management of Wells Fargo Asset Management (“WFAM”), of which Funds Management and the Sub-Adviser are a part, and a summary of investments made in the business of WFAM. The Board also received a description of Funds Management’s and the Sub-Adviser’s business continuity plans and of their approaches to data privacy and cybersecurity, and related testing. The Board also received and reviewed information about Funds Management’s role as administrator of the Portfolio’s liquidity risk management program, Funds Management’s approach to risk management, and Funds Management’s intermediary and vendor oversight program.
The Board also considered the qualifications, background, tenure and responsibilities of each of the portfolio managers primarily responsible for the day-to-day portfolio management of the Portfolio. The Board evaluated the ability of Funds Management and the Sub-Adviser to attract and retain qualified investment professionals, including research, advisory and supervisory personnel. The Board further considered the compliance programs and compliance records of Funds Management and the Sub-Adviser. In addition, the Board took into account the full range of services provided to the Portfolio by Funds Management and its affiliates.
Wells Fargo Managed Fixed Income Portfolio | 33
Other information (unaudited)
Portfolio investment performance and expenses
The Board considered the investment performance results for the Portfolio over various time periods ended December 31, 2019. The Board also considered more current results for various time periods ended March 31, 2020. The Board considered these results in comparison to the investment performance of funds in a universe that was determined by Broadridge Inc. (“Broadridge”) to be similar to the Portfolio (the “Universe”), and in comparison to the Portfolio’s benchmark index and to other comparative data. Broadridge is an independent provider of investment company data. The Board received a description of the methodology used by Broadridge to select the mutual funds in the performance Universe. The Board noted that the investment performance of the Portfolio was higher than the average investment performance of the Universe for the one-, three-, five- and ten-year periods ended December 31, 2019. The Board also noted that the investment performance of the Portfolio was higher than the average performance of the Universe for the three-, five- and ten-year periods ended March 31, 2020, and lower than the average investment performance of the Universe for the one-year period ended March 31, 2020. The Board also noted that the investment performance of the Portfolio was higher than its benchmark index, the Bloomberg Barclays U.S. Aggregate Bond Index, for all periods ended December 31, 2019. The Board also noted that the investment performance of the Portfolio was higher than its benchmark index, the Bloomberg Barclays U.S. Aggregate Bond Index, for the five- and ten-year periods ended March 31, 2020, and was lower than its benchmark index, the Bloomberg Barclays U.S. Aggregate Bond Index, for the one- and three-year periods ended March 31, 2020.
The Board received and considered information regarding the fee rates that are payable to Funds Management for investment advisory services (as discussed below), which are the only fees charged at the Portfolio level, relative to corresponding class-specific expense groups that were determined by Broadridge to be similar to the Portfolio (the “Groups”). The Board received a description of the methodology used by Broadridge to select the mutual funds in the expense Groups and an explanation of how funds comprising expense groups and their expense ratios may vary from year-to-year.
The Board took into account the Portfolio’s investment performance and expense information provided to it among the factors considered in deciding to re-approve the Advisory Agreements.
Investment advisory and sub-advisory fee rates
The Board reviewed and considered the contractual fee rates payable by the Portfolio to Funds Management under the Advisory Agreement (the “Advisory Agreement Rate ”). The Board also reviewed and considered the contractual investment sub-advisory fee rates that are payable by Funds Management to the Sub-Adviser for investment sub-advisory services.
The Board reviewed a comparison of the Advisory Agreement Rate of the Portfolio with those of other funds in the Portfolio’s expense Group at a common asset level. The Board noted that the Portfolio’s Advisory Agreement Rate was in range of the median rate for the Portfolio’s expense Groups.
The Board also received and considered information about the portion of the total advisory fee that was retained by Funds Management after payment of the fee to the Sub-Adviser for sub-advisory services. In assessing the reasonableness of this amount, the Board received and evaluated information about the nature and extent of responsibilities retained and risks assumed by Funds Management and not delegated to or assumed by the Sub-Adviser, and about Funds Management’s on-going oversight services. Given the affiliation between Funds Management and the Sub-Adviser, the Board ascribed limited relevance to the allocation of fees between them.
The Board also received and considered information about the nature and extent of services offered and fee rates charged by Funds Management and the Sub-Adviser to other types of clients with investment strategies similar to those of the Portfolio. In this regard, the Board received information about the significantly greater scope of services, and compliance, reporting and other legal burdens and risks of managing proprietary mutual funds compared with those associated with managing assets of other types of clients, including third-party sub-advised fund clients and non-mutual fund clients such as institutional separate accounts.
Based on its consideration of the factors and information it deemed relevant, including those described here, the Board determined that the compensation payable to Funds Management under the Advisory Agreement and to the Sub-Adviser under the Sub-Advisory Agreement was reasonable.
Profitability
The Board received and considered information concerning the profitability of Funds Management, as well as the profitability of both WFAM and Wells Fargo & Co. (“Wells Fargo”) from providing services to the fund family as a whole. The Board noted that the Sub-Adviser’s profitability information with respect to providing services to the Portfolio and other funds in the family was subsumed in the WFAM and Wells Fargo profitability analysis.
34 | Wells Fargo Managed Fixed Income Portfolio
Other information (unaudited)
Funds Management reported on the methodologies and estimates used in calculating profitability, including a description of the methodology used to allocate certain expenses. Among other things, the Board noted that the levels of profitability reported on a fund-by-fund basis varied widely, depending on factors such as the size, type and age of fund.
Based on its review, the Board did not deem the profits reported by Funds Management, WFAM or Wells Fargo from services provided to the Portfolio to be at a level that would prevent it from approving the continuation of the Advisory Agreements.
Economies of scale
The Board received and considered information about the potential for Funds Management to experience economies of scale in the provision of management services to the Portfolio, the difficulties of calculating economies of scale at an individual fund level, and the extent to which potential scale benefits are shared with shareholders. The Board noted the existence of breakpoints in the Portfolio’s advisory fee structure, which operate generally to reduce the Portfolio’s expense ratios as the Portfolio grows in size, and the size of the Portfolio in relation to such breakpoints. The Board considered that in addition to management fee breakpoints, Funds Management shares potential economies of scale from its management business in a variety of ways, including through fee waiver and expense reimbursement arrangements, services that benefit shareholders, competitive management fee rates set at the outset without regard to breakpoints, and investments in the business intended to enhance services available to shareholders.
The Board concluded that Funds Management’s arrangements with respect to the Portfolio, including contractual breakpoints, constituted a reasonable approach to sharing potential economies of scale with the Portfolio and its shareholders.
Other benefits to Funds Management and the Sub-Adviser
The Board received and considered information regarding potential “fall-out” or ancillary benefits received by Funds Management and its affiliates, including the Sub-Adviser, as a result of their relationships with the Portfolio. Ancillary benefits could include, among others, benefits directly attributable to other relationships with the Portfolio and benefits potentially derived from an increase in Funds Management’s and the Sub-Adviser’s business as a result of their relationships with the Portfolio. The Board noted that various affiliates of Funds Management may receive distribution-related fees, shareholder servicing payments and sub-transfer agency fees in respect of shares sold or held through them and services provided.
The Board also reviewed information about soft dollar credits earned and utilized by the Sub-Adviser, fees earned by Funds Management from managing a private investment vehicle for the fund family’s securities lending collateral, and commissions earned by an affiliated broker from portfolio transactions.
Based on its consideration of the factors and information it deemed relevant, including those described here, the Board did not find that any ancillary benefits received by Funds Management and its affiliates, including the Sub-Adviser, were unreasonable.
Conclusion
At the Meeting, after considering the above-described factors and based on its deliberations and its evaluation of the information described above, the Board unanimously approved the continuation of the Advisory Agreements for a one-year term and determined that the compensation payable to Funds Management and the Sub-Adviser under each of the Advisory Agreements was reasonable.
Wells Fargo Managed Fixed Income Portfolio | 35
Other information (unaudited)
LIQUIDITY RISK MANAGEMENT PROGRAM
In accordance with Rule 22e-4 under the Investment Company Act of 1940, as amended (the “Liquidity Rule”), Wells Fargo Master Trust (the “Trust”) has adopted and implemented a liquidity risk management program (the “Program”) on behalf of each of its series, including the Portfolio, which is reasonably designed to assess and manage the Portfolio’s liquidity risk. “Liquidity risk” is defined as the risk that the Portfolio is unable to meet redemption requests without significantly diluting remaining investors’ interests in the Portfolio. The Trust’s Board of Trustees (the “Board”) previously approved the designation of Wells Fargo Funds Management, LLC (“Funds Management”), the Portfolio’s investment adviser, as the administrator of the Program, and Funds Management has established a Liquidity Risk Management Council composed of personnel from multiple departments within Funds Management and its affiliates to assist Funds Management in the implementation and on-going administration of the Program.
The Program is comprised of various components designed to support the assessment and/or management of liquidity risk, including: (1) the periodic assessment (no less frequently than annually) of certain factors that influence the Portfolio’s liquidity risk; (2) the periodic classification (no less frequently than monthly) of the Portfolio’s investments into one of four liquidity categories that reflect an estimate of their liquidity under current market conditions; (3) a 15% limit on the acquisition of “illiquid investments” (as defined under the Liquidity Rule); (4) to the extent the Portfolio does not invest primarily in “highly liquid investments” (as defined under the Liquidity Rule), the determination of a minimum percentage of the Portfolio’s assets that generally will be invested in highly liquid investments (an “HLIM”); (5) if the Portfolio has established an HLIM, the periodic review (no less frequently than annually) of the HLIM and the adoption of policies and procedures for responding to a shortfall of the Portfolio’s “highly liquid investments” below its HLIM; and (6) periodic reporting to the Board.
At a meeting of the Board held on May 26 and 28, 2020, the Board received a written report (the “Report”) from Funds Management that addressed the operation of the Program and assessed its adequacy and effectiveness of implementation. The Report covered the initial period from December 1, 2018 through December 31, 2019 (the “Reporting Period”). No significant liquidity events impacting the Portfolio were noted in the Report. There were no material changes to the Program during the Reporting Period. The Report concluded that the Program is operating effectively to assess and manage the Portfolio’s liquidity risk, and that the Program has been and continues to be adequately and effectively implemented to monitor and, as applicable, respond to the Portfolio’s liquidity developments.
36 | Wells Fargo Managed Fixed Income Portfolio

For more information
More information about Wells Fargo Funds is available free upon request. To obtain literature, please write, visit the Fund’s website, or call:
Wells Fargo Funds
P.O. Box 219967
Kansas City, MO 64121-9967
Website: wfam.com
Individual investors: 1-800-222-8222
Retail investment professionals: 1-888-877-9275
Institutional investment professionals: 1-866-765-0778

This report and the financial statements contained herein are submitted for the general information of the shareholders of the Fund. If this report is used for promotional purposes, distribution of the report must be accompanied or preceded by a current prospectus. Before investing, please consider the investment objectives, risks, charges, and expenses of the investment. For a current prospectus and, if available, a summary prospectus, containing this information, call 1-800-222-8222 or visit the Fund’s website at wfam.com. Read the prospectus carefully before you invest or send money.
Wells Fargo Asset Management (WFAM) is the trade name for certain investment advisory/management firms owned by Wells Fargo & Company. These firms include but are not limited to Wells Capital Management Incorporated and Wells Fargo Funds Management, LLC. Certain products managed by WFAM entities are distributed by Wells Fargo Funds Distributor, LLC (a broker-dealer and Member FINRA).
This material is for general informational and educational purposes only and is NOT intended to provide investment advice or a recommendation of any kind—including a recommendation for any specific investment, strategy, or plan.
INVESTMENT PRODUCTS: NOT FDIC INSURED ◾ NO BANK GUARANTEE ◾ MAY LOSE VALUE
© 2020 Wells Fargo & Company. All rights reserved.
Annual Report
May 31, 2020
Wells Fargo Index Fund
Beginning on January 1, 2021, as permitted by new regulations adopted by the Securities and Exchange Commission, paper copies of the Wells Fargo Funds’ annual and semi-annual shareholder reports issued after this date will no longer be sent by mail, unless you specifically request paper copies of the reports. Instead, the reports will be made available on the Funds’ website, and you will be notified by mail each time a report is posted and provided with a website address to access the report.
If you already elected to receive shareholder reports electronically, you will not be affected by this change and you need not take any action. You may elect to receive shareholder reports and other communications from the Fund electronically at any time by contacting your financial intermediary (such as a broker-dealer or bank) or, if you are a direct investor, by calling 1-800-222-8222 or by enrolling at wellsfargo.com/advantagedelivery.
You may elect to receive all future reports in paper free of charge. If you invest through a financial intermediary, you can contact your financial intermediary to request that you continue to receive paper copies of your shareholder reports; if you invest directly with the Fund, you can call 1-800-222-8222. Your election to receive reports in paper will apply to all Wells Fargo Funds held in your account with your financial intermediary or, if you are a direct investor, to all Wells Fargo Funds that you hold.
|
|
|
Reduce clutter. Save trees. |
Sign up for electronic delivery of prospectuses and
shareholder reports at wellsfargo.com/
advantagedelivery |
The views expressed and any forward-looking statements are as of May 31, 2020, unless otherwise noted, and are those of the Fund managers and/or Wells Fargo Asset Management. Discussions of individual securities, or the markets generally, or any Wells Fargo Fund are not intended as individual recommendations. Future events or results may vary significantly from those expressed in any forward-looking statements. The views expressed are subject to change at any time in response to changing circumstances in the market. Wells Fargo Asset Management and the Fund disclaim any obligation to publicly update or revise any views expressed or forward-looking statements.
INVESTMENT PRODUCTS: NOT FDIC INSURED ◾ NO BANK GUARANTEE ◾ MAY LOSE VALUE
Wells Fargo Index Fund | 1
Letter to shareholders (unaudited)

Andrew Owen
President
Wells Fargo Funds
Dear Shareholder:
We are pleased to offer you this annual report for the Wells Fargo Index Fund for the 12-month period that ended May 31, 2020. Global stock markets saw earlier gains erased in February and March as governments around the world took unprecedented measures to stop the spread of the coronavirus at the expense of short-term economic output. However, markets rebounded in April and May to offset much of the losses as central banks attempted to bolster capital markets and confidence. Fixed-income markets generally performed better, achieving widespread gains.
For the 12-month period, fixed-income securities generally had positive total returns while non-U.S. equities had broad losses and U.S. stocks performed strongly despite sharp volatility since late February. For the period, U.S. stocks, based on the S&P 500 Index,1 gained 12.84%. International stocks, as measured by the MSCI ACWI ex USA Index (Net),2 returned -3.43%, while the MSCI EM Index (Net)3 trailed slightly, with a -4.39% return. For bond investors, the Bloomberg Barclays U.S. Aggregate Bond Index4 gained a robust 9.42%, the Bloomberg Barclays Global Aggregate ex-USD Index5 returned 2.67%, and the Bloomberg Barclays Municipal Bond Index6 gained a more modest 3.98%, while the ICE BofA U.S. High Yield Index7 had a slight gain of 0.35%.
The fiscal year began on a positive note.
The 12-month period began with U.S. equity market advances during June and July 2019. The gains, primarily driven by geopolitical and monetary policy events, pushed equity markets to new highs. European Central Bank (ECB) President Mario Draghi indicated the bank was ready to cut rates or buy more assets to prop up inflation if needed. President Trump backed off of earlier tariff threats against Mexico and China. In the U.S., the Federal Reserve (Fed) implemented a 0.25% federal funds rate cut in July.
Later in July, the U.S. reversed course and threatened to impose higher tariffs on China’s exports after talks failed. China responded with tariff threats of its own and devalued the renminbi, roiling global markets. Major U.S. stock market indices closed July with the worst weekly results of the year. Bond prices gained as Treasury yields fell to multiyear lows, and the yield curve inverted at multiple points along the 30-year arc, with shorter-term yields higher than longer-term.
In August, U.S.-China trade tensions continued with no signs of compromise. Evidence of a continued global economic slowdown mounted, and central banks in China, New Zealand, and Thailand cut interest rates. Industrial and manufacturing data declined in China, Canada, Japan, and Germany. Adding to global uncertainty, Italy’s prime minister resigned,
| 1 | The S&P 500 Index consists of 500 stocks chosen for market size, liquidity, and industry group representation. It is a market-value-weighted index with each stock’s weight in the index proportionate to its market value. You cannot invest directly in an index. |
| 2 | The Morgan Stanley Capital International (MSCI) All Country World Index (ACWI) ex USA Index (Net) is a free-float-adjusted market-capitalization-weighted index that is designed to measure the equity market performance of developed and emerging markets, excluding the United States. Source: MSCI. MSCI makes no express or implied warranties or representations and shall have no liability whatsoever with respect to any MSCI data contained herein. The MSCI data may not be further redistributed or used as a basis for other indices or any securities or financial products. This report is not approved, reviewed, or produced by MSCI. You cannot invest directly in an index. |
| 3 | The MSCI Emerging Markets (EM) Index (Net) is a free-float-adjusted market-capitalization-weighted index that is designed to measure equity market performance of emerging markets. You cannot invest directly in an index. |
| 4 | The Bloomberg Barclays U.S. Aggregate Bond Index is a broad-based benchmark that measures the investment-grade, U.S. dollar-denominated, fixed-rate taxable bond market, including Treasuries, government-related and corporate securities, mortgage-backed securities (agency fixed-rate and hybrid adjustable-rate mortgage pass-throughs), asset-backed securities, and commercial mortgage-backed securities. You cannot invest directly in an index. |
| 5 | The Bloomberg Barclays Global Aggregate ex-USD Index is an unmanaged index that provides a broad-based measure of the global investment-grade fixed-income markets excluding the U.S. dollar-denominated debt market. You cannot invest directly in an index. |
| 6 | The Bloomberg Barclays Municipal Bond Index is an unmanaged index composed of long-term tax-exempt bonds with a minimum credit rating of Baa. You cannot invest directly in an index. |
| 7 | The ICE BofA U.S. High Yield Index is a market-capitalization-weighted index of domestic and Yankee high-yield bonds. The index tracks the performance of high-yield securities traded in the U.S. bond market. You cannot invest directly in an index. Copyright 2020. ICE Data Indices, LLC. All rights reserved. |
2 | Wells Fargo Index Fund
Letter to shareholders (unaudited)
many feared a crackdown in Hong Kong as protestors sustained their calls for reform, and Prime Minister Boris Johnson planned to suspend the British Parliament as Brexit’s deadline neared.
In the U.S., the Fed cut interest rates a second time in September. U.S. manufacturing data disappointed investors. The U.S. Congress announced it would pursue an impeachment investigation of President Trump. Meanwhile, the Brexit impasse showed no signs of resolution. Officials in China said that hitting the country’s economic growth goals for the year would be difficult considering the weight of tariffs and trade restrictions. Although the S&P 500 Index finished the third quarter with the best year-to-date returns in more than 20 years, concerns about future returns remained.
The fourth quarter of 2019 started on a strong note, with U.S.-China trade tensions relaxing in October along with renewed optimism for a U.K. Brexit deal and positive macroeconomic data. The initial estimate of U.S. third-quarter gross domestic product growth was a resilient 1.9% annualized rate, while the U.S. unemployment rate fell to a 50-year low of 3.5% in September. However, despite resilience among U.S. consumers, business confidence declined and manufacturing activity contracted. Concerned with a potential economic slowdown, the Fed lowered interest rates another quarter point in late October—its third rate cut in four months. This helped push the S&P 500 Index to a new all-time high while emerging market equities rallied and global bonds declined overall, reflecting a broad pickup in risk appetite.
Equity markets continued to rally in November despite ongoing geopolitical risks. Hopes for a U.S.-China trade deal buoyed investor confidence. U.S. business sentiment improved slightly, and manufacturing and services activity picked up. While consumer confidence and purchasing manager activity rose in the eurozone, China reported weakening manufacturing and consumer data. Bond yields rose marginally, leading to slightly negative returns for global government and investment-grade corporate bonds.
Financial markets ended 2019 with a boost from the U.S. and China accord on a Phase One trade deal. That, along with the landslide win by the pro-Brexit U.K. Conservative Party in a national election and ongoing central bank support, gave investors greater confidence. U.S. economic indicators were generally positive, with the exception of manufacturing activity and business confidence. Consumer confidence was resilient, fed by a robust labor market, tame inflation, and lower interest rates, which boosted housing affordability and stimulated homebuyer activity. The impeachment of U.S. President Donald Trump had little impact on markets. Meanwhile, slowing Chinese economic activity, partly attributable to the trade war, led to further government stimulus at year-end through lower reserve ratios, allowing banks to lend more money.
The year-end rally continued in early January 2020. However, capital market volatility picked up sharply in late January on concerns over the potential impact of the coronavirus on the global economy and stock markets. With sentiment somewhat souring, perceived safe havens did well in January. The U.S. dollar and Japanese yen both rose, and government bonds outperformed equities. While the S&P 500 Index held its ground, emerging market equities tumbled, including those in Asia.
In February, the coronavirus became the major market focus. Fears of the virus’s impact on global growth led to expectations of increased global central bank monetary policy support. That led the 10-year U.S. Treasury yield to fall to an all-time low of 1.1% by the end of the month. Although equity markets initially shrugged off concerns about the outbreak, focusing instead on strong fourth-quarter earnings and improving business confidence in January, market sentiment turned sharply lower toward month-end and the S&P 500 Index lost 8.2% for the month. Oil prices tumbled as Russia and the Organization of the Petroleum Exporting Countries compounded a major decline in oil demand with a brutal price war, partly aimed at dissuading further U.S. shale production. As a result, the price of West Texas Intermediate crude oil fell 13% in February.
Wells Fargo Index Fund | 3
Letter to shareholders (unaudited)
“The global spread of the coronavirus led country after country to clamp down on social and business-related activity in order to contain the virus from causing even greater devastation and overwhelming health care systems.”
“Markets rebounded strongly in April after the earlier extreme volatility, with the S&P 500 Index gaining 12.8% for the month and the MSCI ACWI ex USA Index (Net) returning 7.6%.”
|
|
|
For further information about your Fund, contact your investment professional, visit our website at wfam.com, or call us directly at 1-800-222-8222. |
The global spread of the coronavirus led country after country to clamp down on social and business-related activity in order to contain the virus from causing even greater devastation and overwhelming health care systems. This abrupt stoppage of economic activity led to the sharp deceleration of global output, sending economies into a deep contraction. Central bank responses were swift, as they slashed interest rates and expanded quantitative easing programs to restore liquidity and confidence to the markets. In the U.S., the Fed introduced several new lending programs, funding investment-grade bonds, money market mutual funds, and commercial paper while purchasing Treasuries, mortgage-backed securities, and overnight repurchase agreements. Meanwhile, stock markets tumbled quickly into a bear market, ending the longest bull stock market in U.S. history.
Markets rebounded strongly in April after the earlier extreme volatility, with the S&P 500 Index gaining 12.8% for the month and the MSCI ACWI ex USA Index (Net) returning 7.6%. The rebound was fueled by unprecedented government and central bank stimulus measures taken to buffer the economic damage created by mass shutdowns enacted in order to contain the virus’s spread. The U.S. economy contracted by an annualized 4.8% pace in the first quarter, with 30 million new unemployment insurance claims in six weeks. In the eurozone, first-quarter real gross domestic product (GDP) shrank 3.8%, with the composite April Flash Purchasing Managers’ Index, a monthly survey of purchasing managers, falling to an all-time low of 13.5. The ECB expanded its quantitative easing to include the purchase of additional government bonds of countries with the greatest virus-related need, including Italy and Spain. China’s first-quarter GDP fell by 6.8% year over year. However, retail sales, production, and investment showed signs of recovery. Extreme oil price volatility continued as global supply far exceeded demand.
In May, the equity market rebound continued, with the S&P 500 Index climbing a further 4.8%. European and Japanese stock markets also had monthly gains. Investors regained confidence on reports of early signs of success in human trials of a coronavirus vaccine. Growth stocks continued to outperform value stocks while returns on global government bonds were generally flat. In the U.S., a gap grew between the stock market rebound and devastating economic data points, including an April unemployment rate of 14.7%, the highest level since World War II. Purchasing managers’ indices continued to reflect weakening activity in May in both the manufacturing and services sectors. U.S. corporate earnings reports indicated a 14% year-over-year contraction in earnings from the first quarter of 2019. However, high demand for technology, driven by remote activity, helped maintain robust information technology sector earnings, which helped drive powerful well-known technology stocks higher.
Don’t let short-term uncertainty derail long-term investment goals.
Periods of investment uncertainty can present challenges, but experience has taught us that maintaining long-term investment goals can be an effective way to plan for the future. To help you create a sound strategy based on your personal goals and risk tolerance, Wells Fargo Funds offers more than 100 mutual funds spanning a wide range of asset classes and investment styles. Although diversification cannot guarantee an investment profit or prevent losses, we believe it can be an effective way to manage investment risk and potentially smooth out overall portfolio performance. We encourage investors to know their investments and to understand that appropriate levels of risk-taking may unlock opportunities.
Thank you for choosing to invest with Wells Fargo Funds. We appreciate your confidence in us and remain committed to helping you meet your financial needs.
Sincerely,

Andrew Owen
President
Wells Fargo Funds
4 | Wells Fargo Index Fund
This page is intentionally left blank.
Performance highlights (unaudited)
Investment objective
The Fund seeks to replicate the total return of the S&P 500 Index, before fees and expenses.
Manager
Wells Fargo Funds Management, LLC
Subadviser for the affiliated master portfolio1
Wells Capital Management Incorporated
Portfolio managers
John R. Campbell, CFA®‡
David Neal, CFA®‡
Robert M. Wicentowski, CFA®‡
Average annual total returns (%) as of May 31, 20202
| | | | | | | | | | | | | | | | | | | | | | | | | | | | | | | | | | |
| | | | |
| | | | | Including sales charge | | | Excluding sales charge | | | Expense ratios3 (%) | |
| | | | | | | | | |
| | | Inception date | | 1 year | | | 5 year | | | 10 year | | | 1 year | | | 5 year | | | 10 year | | | Gross | | | Net4 | |
| | | | | | | | | | |
| Class A (WFILX) | | 11-4-1998 | | | 5.57 | | | | 8.02 | | | | 11.90 | | | | 12.02 | | | | 9.31 | | | | 12.57 | | | | 0.64 | | | | 0.45 | |
| | | | | | | | | | |
| Class C (WFINX) | | 4-30-1999 | | | 10.17 | | | | 8.48 | | | | 11.72 | | | | 11.17 | | | | 8.48 | | | | 11.72 | | | | 1.39 | | | | 1.20 | |
| | | | | | | | | | |
| Administrator Class (WFIOX) | | 2-14-1985 | | | – | | | | – | | | | – | | | | 12.25 | | | | 9.53 | | | | 12.86 | | | | 0.41 | | | | 0.25 | |
| | | | | | | | | | |
| S&P 500 Index5 | | – | | | – | | | | – | | | | – | | | | 12.84 | | | | 9.86 | | | | 13.15 | | | | – | | | | – | |
Figures quoted represent past performance, which is no guarantee of future results, and do not reflect taxes that a shareholder may pay on an investment in a fund. Investment return and principal value of an investment will fluctuate so that an investor’s shares, when redeemed, may be worth more or less than their original cost. Performance shown without sales charges would be lower if sales charges were reflected. Current performance may be lower or higher than the performance data quoted, which assumes the reinvestment of dividends and capital gains. Current month-end performance is available on the Fund’s website, wfam.com.
Index returns do not include transaction costs associated with buying and selling securities, any mutual fund fees or expenses, or any taxes. It is not possible to invest directly in an index.
For Class A shares, the maximum front-end sales charge is 5.75%. For Class C shares, the maximum contingent deferred sales charge is 1.00%. Performance including a contingent deferred sales charge assumes the sales charge for the corresponding time period. Administrator Class shares are sold without a front-end sales charge or contingent deferred sales charge.
Stock values fluctuate in response to the activities of individual companies and general market and economic conditions. The use of derivatives may reduce returns and/or increase volatility. Consult the Fund’s prospectus for additional information on these and other risks.
Please see footnotes on page 7.
6 | Wells Fargo Index Fund
Performance highlights (unaudited)
|
|
| Growth of $10,000 investment as of May 31, 20206 |
|
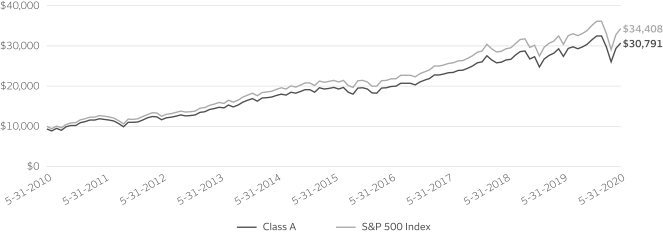
|
| ‡ | CFA® and Chartered Financial Analyst® are trademarks owned by CFA Institute. |
| 1 | The Fund is a feeder fund in a master-feeder structure that invests substantially all of its assets in a single affiliated master portfolio of the Wells Fargo Master Trust with a substantially identical investment objective and substantially similar investment strategies. References to the investment activities of the Fund are intended to refer to the investment activities of the affiliated master portfolio in which it invests. |
| 2 | Historical performance prior to July 19, 2010, is based on the performance of the Fund’s predecessor, Evergreen Equity Index Fund. |
| 3 | Reflects the expense ratios as stated in the most recent prospectuses. The expense ratios shown are subject to change and may differ from the annualized expense ratios shown in the financial highlights of this report. |
| 4 | The manager has contractually committed through September 30, 2020, to waive fees and/or reimburse expenses to the extent necessary to cap total annual fund operating expenses after fee waivers at 0.45% for Class A, 1.20% for Class C, and 0.25% for Administrator Class. Brokerage commissions, stamp duty fees, interest, taxes, acquired fund fees and expenses (if any) from funds in which the affiliated master portfolio invests, and extraordinary expenses are excluded from the expense caps. Net expenses from the affiliated master portfolio are included in the expense caps. Prior to or after the commitment expiration date, the caps may be increased or the commitment to maintain the caps may be terminated only with the approval of the Board of Trustees. Without these caps, the Fund’s returns would have been lower. The expense ratio paid by an investor is the net expense ratio (the total annual fund operating expenses after fee waivers) as stated in the prospectuses. |
| 5 | The S&P 500 Index consists of 500 stocks chosen for market size, liquidity, and industry group representation. It is a market-value-weighted index with each stock’s weight in the index proportionate to its market value. You cannot invest directly in an index. |
| 6 | The chart compares the performance of Class A shares for the most recent ten years with the S&P 500 Index. The chart assumes a hypothetical $10,000 investment in Class A shares and reflects all operating expenses and assumes the maximum initial sales charge of 5.75%. |
| 7 | The ten largest holdings, excluding cash, cash equivalents and any money market funds, are calculated based on the value of the securities of the affiliated master portfolio allocable to the Fund divided by the total net assets of the Fund. Holdings are subject to change and may have changed since the date specified. |
| 8 | Amounts represent the sector allocation of the affiliated master portfolio which are calculated based on the total long-term investments of the affiliated master portfolio. These amounts are subject to change and may have changed since the date specified. |
Wells Fargo Index Fund | 7
Performance highlights (unaudited)
MANAGER’S DISCUSSION
Fund highlights
| ∎ | | The Fund underperformed the S&P 500 Index for the 12-month period that ended May 31, 2020. |
| ∎ | | The energy sector was the S&P 500 Index’s worst-performing sector, followed by financials, industrials, and real estate. |
| ∎ | | The information technology, health care, communication services, and consumer discretionary sectors led the S&P 500 Index higher. |
The Fund’s management team rebalances the portfolio to reflect the ongoing changes in the constituents and their weightings within the index. One cannot invest directly in the benchmark, and timing of cash flows and other practical issues affect the Fund’s tracking error, which is a measure of how closely a portfolio tracks the index to which it is benchmarked. The team uses an investment process designed to control trading and implementation costs and reduce tracking error to the benchmark as much as possible.
| | | | |
|
| Ten largest holdings (%) as of May 31, 20207 | |
| | |
Microsoft Corporation | | | 5.33 | |
| | |
Apple Incorporated | | | 5.06 | |
| | |
Amazon.com Incorporated | | | 3.88 | |
| | |
Facebook Incorporated Class A | | | 2.07 | |
| | |
Alphabet Incorporated Class A | | | 1.64 | |
| | |
Alphabet Incorporated Class C | | | 1.63 | |
| | |
Johnson & Johnson | | | 1.49 | |
| | |
Berkshire Hathaway Incorporated Class B | | | 1.38 | |
| | |
Visa Incorporated Class A | | | 1.27 | |
| | |
JPMorgan Chase & Company | | | 1.16 | |
Energy was by far the worst performer for the period.
Over the past year, nearly every S&P 500 company in the energy sector experienced negative stock returns. Oil prices rose through much of 2019 on tensions between the U.S. and Iran as well as a drone strike on oil facilities in Saudi Arabia. Then, during first-quarter 2020, Saudi Arabia initiated an oil price war with Russia, causing the biggest one-day price crash since the Gulf War in 1991. Due to a combination of supply and demand shocks, West Texas Intermediate crude oil reached an 18-year low and fell 66%, its worst quarterly decline in history. In that quarter alone, the energy sector fell 50.5%.
|
|
| Sector allocation as of May 31, 20208 |
|
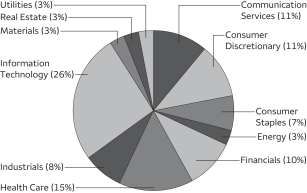 |
Despite weakness in the first quarter of 2020 and a weak August 2019, the S&P 500 Index delivered a positive return over the period.
The period began with reports of a year-over-year decline in earnings for the S&P 500 Index. U.S. economic data was favorable overall, but there were concerns about a slowing global economy, international tariffs, monetary policy actions, and tensions in the Middle East. Consumer spending was strong, but business confidence measures began to decline, and the U.S. Federal Reserve (Fed) began to reduce its federal funds rate target. Equity markets rose sharply in the fourth quarter of 2019 despite a third consecutive quarter of year-over-year earnings declines. In the first
quarter of 2020, economic disruptions from the coronavirus pandemic sparked a severe downturn in global equity markets, including a loss of about 20% in the S&P 500 Index. During that quarter, we saw significant emergency actions taken by the Fed and U.S. Congress and an oil price war between Saudi Arabia and Russia that caused oil prices to crash. Equity markets recovered much of their losses in April and May 2020.
The IT, health care, and communication services sectors led the S&P 500 Index.
Over the past year, investors have placed a premium on companies able to deliver sales and earnings growth and that have “safety” characteristics, including strong balance sheets and lower stock volatility. The IT, health care, and communication services sectors include many companies with these characteristics. Additionally, they also include some of the largest companies in the index, including Apple, Microsoft, Alphabet, Facebook, and Johnson & Johnson. These sectors were significant drivers of the dominant market themes favoring larger capitalization, growth over value, and low volatility over high volatility.
Please see footnotes on page 7.
8 | Wells Fargo Index Fund
Performance highlights (unaudited)
The economy is likely to present continued opportunities for growth, but with elevated risks.
The devastating impact of the pandemic should dissipate as daily coronavirus infections peak, new therapies prove successful, quarantines are lifted, and economies reopen. Although the initial collapse in economic activity and employment are stunning, the eventual rise in world economic output may also be unprecedented. The path to recovery is likely to be uneven and painful.
Wells Fargo Index Fund | 9
Fund expenses (unaudited)
As a shareholder of the Fund, you incur two types of costs: (1) transaction costs, including sales charges (loads) on purchase payments and contingent deferred sales charges (if any) on redemptions and (2) ongoing costs, including management fees, distribution (12b-1) and/or shareholder servicing fees, and other Fund expenses. This example is intended to help you understand your ongoing costs (in dollars) of investing in the Fund and to compare these costs with the ongoing costs of investing in other mutual funds.
The example is based on an investment of $1,000 invested at the beginning of the six-month period and held for the entire period from December 1, 2019 to May 31, 2020.
Actual expenses
The “Actual” line of the table below provides information about actual account values and actual expenses. You may use the information in this line, together with the amount you invested, to estimate the expenses that you paid over the period. Simply divide your account value by $1,000 (for example, an $8,600 account value divided by $1,000 = 8.6), then multiply the result by the number in the “Actual” line under the heading entitled “Expenses paid during period” for your applicable class of shares to estimate the expenses you paid on your account during this period.
Hypothetical example for comparison purposes
The “Hypothetical” line of the table below provides information about hypothetical account values and hypothetical expenses based on the Fund’s actual expense ratio and an assumed rate of return of 5% per year before expenses, which is not the Fund’s actual return. The hypothetical account values and expenses may not be used to estimate the actual ending account balance or expenses you paid for the period. You may use this information to compare the ongoing costs of investing in the Fund and other funds. To do so, compare this 5% hypothetical example with the 5% hypothetical examples that appear in the shareholder reports of the other funds.
Please note that the expenses shown in the table are meant to highlight your ongoing costs only and do not reflect any transactional costs, such as sales charges (loads) and contingent deferred sales charges. Therefore, the “Hypothetical” line of the table is useful in comparing ongoing costs only and will not help you determine the relative total costs of owning different funds. In addition, if these transactional costs were included, your costs would have been higher.
| | | | | | | | | | | | | | | | |
| | | Beginning account value 12-1-2019 | | | Ending account value 5-31-2020 | | | Expenses paid during the period1,2 | | | Annualized net expense ratio1 | |
| | | | | |
Class A | | | | | | | | | | | | | | | | |
| | | | |
Actual | | $ | 1,000.00 | | | $ | 974.08 | | | $ | 2.14 | | | | 0.43 | % |
| | | | |
Hypothetical (5% return before expenses) | | $ | 1,000.00 | | | $ | 1,022.83 | | | $ | 2.20 | | | | 0.43 | % |
| | | | | |
Class C | | | | | | | | | | | | | | | | |
| | | | |
Actual | | $ | 1,000.00 | | | $ | 970.31 | | | $ | 5.93 | | | | 1.20 | % |
| | | | |
Hypothetical (5% return before expenses) | | $ | 1,000.00 | | | $ | 1,018.98 | | | $ | 6.07 | | | | 1.20 | % |
| | | | | |
Administrator Class | | | | | | | | | | | | | | | | |
| | | | |
Actual | | $ | 1,000.00 | | | $ | 975.00 | | | $ | 1.22 | | | | 0.25 | % |
| | | | |
Hypothetical (5% return before expenses) | | $ | 1,000.00 | | | $ | 1,023.77 | | | $ | 1.25 | | | | 0.25 | % |
| 1 | Amounts reflect net expenses allocated from the affiliated Master Portfolio in which the Fund invests. |
| 2 | Expenses paid is equal to the annualized net expense ratio of each class multiplied by the average account value over the period, multiplied by the number of days in the most recent fiscal half-year divided by the number of days in the fiscal year (to reflect the one-half-year period). |
10 | Wells Fargo Index Fund
Portfolio of investments—May 31, 2020
| | | | | | | | | | | | | | | | |
| | | | | | | | | | | | Value | |
| Investment Companies: 99.99% | | | | | | | | | | | | | | | | |
| | | | |
| Affiliated Master Portfolio: 99.99% | | | | | | | | | | | | |
Wells Fargo Index Portfolio | | | | | | | | | | | | | | $ | 1,019,742,036 | |
| | | | | | | | | | | | | | | | |
| | | | |
Total Investment Companies (Cost $137,034,865) | | | | | | | | | | | | | | | 1,019,742,036 | |
| | | | | | | | | | | | | | | | |
| | | | | | | | |
| Total investments in securities (Cost $137,034,865) | | | 99.99 | % | | | 1,019,742,036 | |
| | |
Other assets and liabilities, net | | | 0.01 | | | | 70,330 | |
| | | | | | | | |
| Total net assets | | | 100.00 | % | | $ | 1,019,812,366 | |
| | | | | | | | |
Transactions with the affiliated Master Portfolio were as follows:
| | | | | | | | | | | | | | | | | | | | | | | | | | | | | | | | | | | | |
| | | % of ownership, beginning of period | | | % of ownership, end of period | | | Net realized gains (losses) on securities transactions allocated from affiliated Master Portfolio | | | Net change in unrealized gains (losses) on securities transactions allocated from affiliated Master Portfolio | | | Dividends allocated from affiliated Master Portfolio | | | Affiliated income allocated from affiliated Master Portfolio | | | Interest allocated from affiliated Master Portfolio | | | Value, end of period | | | % of net assets | |
Wells Fargo Index Portfolio | | | 97 | % | | | 97 | % | | $ | 181,564,933 | | | $ | (64,676,797 | ) | | $ | 20,631,449 | | | $ | 684,160 | | | $ | 29,383 | | | $ | 1,019,742,036 | | | | 99.99 | % |
The accompanying notes are an integral part of these financial statements.
Wells Fargo Index Fund | 11
Statement of assets and liabilities—May 31, 2020
| | | | |
| | | | |
| |
Assets | | | | |
Investments in affiliated Master Portfolio, at value (cost $137,034,865) | | $ | 1,019,742,036 | |
Receivable for Fund shares sold | | | 788,995 | |
Receivable from manager | | | 143,260 | |
Prepaid expenses and other assets | | | 52,514 | |
| | | | |
Total assets | | | 1,020,726,805 | |
| | | | |
| |
Liabilities | | | | |
Payable for Fund shares redeemed | | | 436,376 | |
Administration fees payable | | | 151,578 | |
Distribution fee payable | | | 9,935 | |
Shareholder servicing fees payable | | | 161,552 | |
Trustees’ fees and expenses payable | | | 319 | |
Accrued expenses and other liabilities | | | 154,679 | |
| | | | |
Total liabilities | | | 914,439 | |
| | | | |
Total net assets | | $ | 1,019,812,366 | |
| | | | |
| |
Net assets consist of | | | | |
Paid-in capital | | $ | 34,815,625 | |
Total distributable earnings | | | 984,996,741 | |
| | | | |
Total net assets | | $ | 1,019,812,366 | |
| | | | |
| |
Computation of net asset value and offering price per share | | | | |
Net assets – Class A | | $ | 660,100,644 | |
Shares outstanding – Class A1 | | | 15,995,828 | |
Net asset value per share – Class A | | | $41.27 | |
Maximum offering price per share – Class A2 | | | $43.79 | |
Net assets – Class C | | $ | 16,102,778 | |
Shares outstanding – Class C1 | | | 384,283 | |
Net asset value per share – Class C | | | $41.90 | |
Net assets – Administrator Class | | $ | 343,608,944 | |
Shares outstanding – Administrator Class1 | | | 8,152,962 | |
Net asset value per share – Administrator Class | | | $42.15 | |
| 1 | The Fund has an unlimited number of authorized shares. |
| 2 | Maximum offering price is computed as 100/94.25 of net asset value. On investments of $50,000 or more, the offering price is reduced. |
The accompanying notes are an integral part of these financial statements.
12 | Wells Fargo Index Fund
Statement of operations—year ended May 31, 2020
| | | | |
| | | | |
| |
Investment income | | | | |
Dividends allocated from affiliated Master Portfolio (net of foreign withholding taxes of $695,923) | | $ | 20,631,449 | |
Affiliated income allocated from affiliated Master Portfolio | | | 684,160 | |
Interest allocated from affiliated Master Portfolio | | | 29,383 | |
Expenses allocated from affiliated Master Portfolio | | | (1,306,096 | ) |
| | | | |
Total investment income | | | 20,038,896 | |
| | | | |
| |
Expenses | | | | |
Management fee | | | 557,469 | |
Administration fees | | | | |
Class A | | | 1,444,065 | |
Class C | | | 38,934 | |
Administrator Class | | | 531,371 | |
Shareholder servicing fees | | | | |
Class A | | | 1,719,125 | |
Class C | | | 46,350 | |
Administrator Class | | | 393,251 | |
Distribution fee | | | | |
Class C | | | 139,016 | |
Custody and accounting fees | | | 74,416 | |
Professional fees | | | 32,906 | |
Registration fees | | | 99,725 | |
Shareholder report expenses | | | 72,825 | |
Trustees’ fees and expenses | | | 21,592 | |
Other fees and expenses | | | 181,148 | |
| | | | |
Total expenses | | | 5,352,193 | |
Less: Fee waivers and/or expense reimbursements | | | | |
Fund-level | | | (2,047,191 | ) |
Class A | | | (335,246 | ) |
Class C | | | (6,035 | ) |
Administrator Class | | | (1,764 | ) |
| | | | |
Net expenses | | | 2,961,957 | |
| | | | |
Net investment income | | | 17,076,939 | |
| | | | |
| |
Realized and unrealized gains (losses) on investments | | | | |
Net realized gains on securities transactions allocated from affiliated Master Portfolio | | | 181,564,933 | |
Net change in unrealized gains (losses) on securities transactions allocated from affiliated Master Portfolio | | | (64,676,797 | ) |
| | | | |
Net realized and unrealized gains (losses) on investments | | | 116,888,136 | |
| | | | |
Net increase in net assets resulting from operations | | $ | 133,965,075 | |
| | | | |
The accompanying notes are an integral part of these financial statements.
Wells Fargo Index Fund | 13
Statement of changes in net assets
| | | | | | | | | | | | | | | | |
| | | Year ended
May 31, 2020 | | | Year ended
May 31, 2019 | |
| | | |
Operations | | | | | | | | | | | | |
Net investment income | | | | | | $ | 17,076,939 | | | | | | | $ | 22,631,565 | |
Net realized gains on investments | | | | | | | 181,564,933 | | | | | | | | 306,741,725 | |
Net change in unrealized gains (losses) on investments | | | | | | | (64,676,797 | ) | | | | | | | (284,064,839 | ) |
| | | | |
Net increase in net assets resulting from operations | | | | | | | 133,965,075 | | | | | | | | 45,308,451 | |
| | | | |
| | | |
Distributions to shareholders from net investment and net realized gains | | | | | | | | | | | | |
Class A | | | | | | | (189,301,116 | ) | | | | | | | (163,505,563 | ) |
Class C | | | | | | | (4,981,676 | ) | | | | | | | (13,933,913 | ) |
Administrator Class | | | | | | | (116,506,789 | ) | | | | | | | (171,863,037 | ) |
| | | | |
Total distributions to shareholders | | | | | | | (310,789,581 | ) | | | | | | | (349,302,513 | ) |
| | | | |
| | | | |
Capital share transactions | | | Shares | | | | | | | | Shares | | | | | |
Proceeds from shares sold | | | | | | | | | | | | | | | | |
Class A | | | 732,292 | | | | 32,317,931 | | | | 1,215,528 | | | | 63,105,358 | |
Class C | | | 57,399 | | | | 2,669,398 | | | | 101,602 | | | | 5,479,223 | |
Administrator Class | | | 1,814,601 | | | | 90,665,958 | | | | 1,223,311 | | | | 69,577,734 | |
| | | | |
| | | | | | | 125,653,287 | | | | | | | | 138,162,315 | |
| | | | |
Reinvestment of distributions | | | | | | | | | | | | | | | | |
Class A | | | 4,215,720 | | | | 183,009,568 | | | | 3,265,381 | | | | 156,770,222 | |
Class C | | | 89,742 | | | | 3,933,010 | | | | 255,848 | | | | 12,342,496 | |
Administrator Class | | | 2,338,163 | | | | 103,711,408 | | | | 2,487,498 | | | | 121,257,092 | |
| | | | |
| | | | | | | 290,653,986 | | | | | | | | 290,369,810 | |
| | | | |
Payment for shares redeemed | | | | | | | | | | | | | | | | |
Class A | | | (2,625,376 | ) | | | (122,456,063 | ) | | | (1,902,710 | ) | | | (106,045,189 | ) |
Class C | | | (145,585 | ) | | | (6,654,277 | ) | | | (1,013,120 | ) | | | (51,601,044 | ) |
Administrator Class | | | (5,173,988 | ) | | | (247,150,828 | ) | | | (7,480,787 | ) | | | (408,288,013 | ) |
| | | | |
| | | | | | | (376,261,168 | ) | | | | | | | (565,934,246 | ) |
| | | | |
Net increase (decrease) in net assets resulting from capital share transactions | | | | | | | 40,046,105 | | | | | | | | (137,402,121 | ) |
| | | | |
Total decrease in net assets | | | | | | | (136,778,401 | ) | | | | | | | (441,396,183 | ) |
| | | | |
| | |
Net assets | | | | | | | | |
Beginning of period | | | | | | | 1,156,590,767 | | | | | | | | 1,597,986,950 | |
| | | | |
End of period | | | | | | $ | 1,019,812,366 | | | | | | | $ | 1,156,590,767 | |
| | | | |
The accompanying notes are an integral part of these financial statements.
14 | Wells Fargo Index Fund
Financial highlights
(For a share outstanding throughout each period)
| | | | | | | | | | | | | | | | | | | | |
| | | Year ended May 31 | |
| CLASS A | | 2020 | | | 2019 | | | 2018 | | | 2017 | | | 2016 | |
Net asset value, beginning of period | | | $49.48 | | | | $63.35 | | | | $66.85 | | | | $62.85 | | | | $67.32 | |
Net investment income | | | 0.65 | | | | 0.82 | | | | 0.99 | 1 | | | 1.05 | | | | 0.81 | |
Net realized and unrealized gains (losses) on investments | | | 5.82 | | | | 0.54 | | | | 7.99 | | | | 9.09 | | | | (0.17 | ) |
| | | | | | | | | | | | | | | | | | | | |
Total from investment operations | | | 6.47 | | | | 1.36 | | | | 8.98 | | | | 10.14 | | | | 0.64 | |
Distributions to shareholders from | | | | | | | | | | | | | | | | | | | | |
Net investment income | | | (0.67 | ) | | | (0.90 | ) | | | (1.02 | ) | | | (1.16 | ) | | | (1.08 | ) |
Net realized gains | | | (14.01 | ) | | | (14.33 | ) | | | (11.46 | ) | | | (4.98 | ) | | | (4.03 | ) |
| | | | | | | | | | | | | | | | | | | | |
Total distributions to shareholders | | | (14.68 | ) | | | (15.23 | ) | | | (12.48 | ) | | | (6.14 | ) | | | (5.11 | ) |
Net asset value, end of period | | | $41.27 | | | | $49.48 | | | | $63.35 | | | | $66.85 | | | | $62.85 | |
Total return2 | | | 12.02 | % | | | 3.32 | % | | | 13.87 | % | | | 16.94 | % | | | 1.24 | % |
Ratios to average net assets (annualized) | | | | | | | | | | | | | | | | | | | | |
Gross expenses3 | | | 0.67 | % | | | 0.65 | % | | | 0.63 | % | | | 0.62 | % | | | 0.63 | % |
Net expenses3 | | | 0.44 | % | | | 0.45 | % | | | 0.45 | % | | | 0.45 | % | | | 0.48 | % |
Net investment income3 | | | 1.47 | % | | | 1.51 | % | | | 1.49 | % | | | 1.68 | % | | | 1.78 | % |
Supplemental data | | | | | | | | | | | | | | | | | | | | |
Portfolio turnover rate4 | | | 3 | % | | | 4 | % | | | 3 | % | | | 9 | % | | | 4 | % |
Net assets, end of period (000s omitted) | | | $660,101 | | | | $676,511 | | | | $702,866 | | | | $684,004 | | | | $639,496 | |
| 1 | Calculated based upon average shares outstanding |
| 2 | Total return calculations do not include any sales charges. |
| 3 | Ratios include net expenses allocated from the affiliated Master Portfolio which were as follows: |
| | | | |
Year ended May 31, 2020 | | | 0.12 | % |
Year ended May 31, 2019 | | | 0.11 | % |
Year ended May 31, 2018 | | | 0.10 | % |
Year ended May 31, 2017 | | | 0.10 | % |
Year ended May 31, 2016 | | | 0.10 | % |
| 4 | Portfolio turnover rate is calculated by multiplying the affiliated Master Portfolio’s percentage of the Fund’s total investment in securities at the end of the period by the affiliated Master Portfolio’s portfolio turnover rate. |
The accompanying notes are an integral part of these financial statements.
Wells Fargo Index Fund | 15
Financial highlights
(For a share outstanding throughout each period)
| | | | | | | | | | | | | | | | | | | | |
| | | Year ended May 31 | |
| CLASS C | | 2020 | | | 2019 | | | 2018 | | | 2017 | | | 2016 | |
Net asset value, beginning of period | | | $50.02 | | | | $63.67 | | | | $67.11 | | | | $63.12 | | | | $67.55 | |
Net investment income | | | 0.30 | | | | 0.46 | 1 | | | 0.50 | 1 | | | 0.66 | | | | 0.62 | 1 |
Net realized and unrealized gains (losses) on investments | | | 5.84 | | | | 0.52 | | | | 8.00 | | | | 9.02 | | | | (0.45 | ) |
| | | | | | | | | | | | | | | | | | | | |
Total from investment operations | | | 6.14 | | | | 0.98 | | | | 8.50 | | | | 9.68 | | | | 0.17 | |
Distributions to shareholders from | | | | | | | | | | | | | | | | | | | | |
Net investment income | | | (0.25 | ) | | | (0.30 | ) | | | (0.48 | ) | | | (0.71 | ) | | | (0.57 | ) |
Net realized gains | | | (14.01 | ) | | | (14.33 | ) | | | (11.46 | ) | | | (4.98 | ) | | | (4.03 | ) |
| | | | | | | | | | | | | | | | | | | | |
Total distributions to shareholders | | | (14.26 | ) | | | (14.63 | ) | | | (11.94 | ) | | | (5.69 | ) | | | (4.60 | ) |
Net asset value, end of period | | | $41.90 | | | | $50.02 | | | | $63.67 | | | | $67.11 | | | | $63.12 | |
Total return2 | | | 11.17 | % | | | 2.54 | % | | | 13.02 | % | | | 16.07 | % | | | 0.48 | % |
Ratios to average net assets (annualized) | | | | | | | | | | | | | | | | | | | | |
Gross expenses3 | | | 1.42 | % | | | 1.39 | % | | | 1.38 | % | | | 1.37 | % | | | 1.38 | % |
Net expenses3 | | | 1.20 | % | | | 1.20 | % | | | 1.20 | % | | | 1.20 | % | | | 1.24 | % |
Net investment income3 | | | 0.72 | % | | | 0.77 | % | | | 0.72 | % | | | 0.93 | % | | | 0.99 | % |
Supplemental data | | | | | | | | | | | | | | | | | | | | |
Portfolio turnover rate4 | | | 3 | % | | | 4 | % | | | 3 | % | | | 9 | % | | | 4 | % |
Net assets, end of period (000s omitted) | | | $16,103 | | | | $19,146 | | | | $66,117 | | | | $67,691 | | | | $79,858 | |
| 1 | Calculated based upon average shares outstanding |
| 2 | Total return calculations do not include any sales charges. |
| 3 | Ratios include net expenses allocated from the affiliated Master Portfolio which were as follows: |
| | | | |
Year ended May 31, 2020 | | | 0.12 | % |
Year ended May 31, 2019 | | | 0.11 | % |
Year ended May 31, 2018 | | | 0.10 | % |
Year ended May 31, 2017 | | | 0.10 | % |
Year ended May 31, 2016 | | | 0.10 | % |
| 4 | Portfolio turnover rate is calculated by multiplying the affiliated Master Portfolio’s percentage of the Fund’s total investment in securities at the end of the period by the affiliated Master Portfolio’s portfolio turnover rate. |
The accompanying notes are an integral part of these financial statements.
16 | Wells Fargo Index Fund
Financial highlights
(For a share outstanding throughout each period)
| | | | | | | | | | | | | | | | | | | | |
| | | Year ended May 31 | |
| ADMINISTRATOR CLASS | | 2020 | | | 2019 | | | 2018 | | | 2017 | | | 2016 | |
Net asset value, beginning of period | | | $50.24 | | | | $64.04 | | | | $67.43 | | | | $63.33 | | | | $67.80 | |
Net investment income | | | 0.81 | | | | 1.02 | 1 | | | 1.26 | | | | 1.41 | | | | 1.31 | |
Net realized and unrealized gains (losses) on investments | | | 5.85 | | | | 0.48 | | | | 7.94 | | | | 8.94 | | | | (0.51 | ) |
| | | | | | | | | | | | | | | | | | | | |
Total from investment operations | | | 6.66 | | | | 1.50 | | | | 9.20 | | | | 10.35 | | | | 0.80 | |
Distributions to shareholders from | | | | | | | | | | | | | | | | | | | | |
Net investment income | | | (0.74 | ) | | | (0.97 | ) | | | (1.13 | ) | | | (1.27 | ) | | | (1.24 | ) |
Net realized gains | | | (14.01 | ) | | | (14.33 | ) | | | (11.46 | ) | | | (4.98 | ) | | | (4.03 | ) |
| | | | | | | | | | | | | | | | | | | | |
Total distributions to shareholders | | | (14.75 | ) | | | (15.30 | ) | | | (12.59 | ) | | | (6.25 | ) | | | (5.27 | ) |
Net asset value, end of period | | | $42.15 | | | | $50.24 | | | | $64.04 | | | | $67.43 | | | | $63.33 | |
Total return | | | 12.25 | % | | | 3.52 | % | | | 14.10 | % | | | 17.18 | % | | | 1.49 | % |
Ratios to average net assets (annualized) | | | | | | | | | | | | | | | | | | | | |
Gross expenses2 | | | 0.44 | % | | | 0.41 | % | | | 0.40 | % | | | 0.39 | % | | | 0.40 | % |
Net expenses2 | | | 0.25 | % | | | 0.25 | % | | | 0.25 | % | | | 0.25 | % | | | 0.25 | % |
Net investment income2 | | | 1.67 | % | | | 1.72 | % | | | 1.70 | % | | | 1.88 | % | | | 1.97 | % |
Supplemental data | | | | | | | | | | | | | | | | | | | | |
Portfolio turnover rate3 | | | 3 | % | | | 4 | % | | | 3 | % | | | 9 | % | | | 4 | % |
Net assets, end of period (000s omitted) | | | $343,609 | | | | $460,934 | | | | $829,004 | | | | $1,151,522 | | | | $1,502,276 | |
| 1 | Calculated based upon average shares outstanding |
| 2 | Ratios include net expenses allocated from the affiliated Master Portfolio which were as follows: |
| | | | |
Year ended May 31, 2020 | | | 0.12 | % |
Year ended May 31, 2019 | | | 0.11 | % |
Year ended May 31, 2018 | | | 0.10 | % |
Year ended May 31, 2017 | | | 0.10 | % |
Year ended May 31, 2016 | | | 0.10 | % |
| 3 | Portfolio turnover rate is calculated by multiplying the affiliated Master Portfolio’s percentage of the Fund’s total investment in securities at the end of the period by the affiliated Master Portfolio’s portfolio turnover rate. |
The accompanying notes are an integral part of these financial statements.
Wells Fargo Index Fund | 17
Notes to financial statements
1. ORGANIZATION
Wells Fargo Funds Trust (the “Trust”), a Delaware statutory trust organized on March 10, 1999, is an open-end management investment company registered under the Investment Company Act of 1940, as amended (the “1940 Act”). As an investment company, the Trust follows the accounting and reporting guidance in Financial Accounting Standards Board (“FASB”) Accounting Standards Codification Topic 946, Financial Services – Investment Companies. These financial statements report on the Wells Fargo Index Fund (the “Fund”) which is a diversified series of the Trust.
The Fund is a feeder fund in a master-feeder structure that invests substantially all of its assets in a single master portfolio with a substantially identical investment objective and substantially similar investment strategies. The Fund invests in Wells Fargo Index Portfolio (the “affiliated Master Portfolio”) which is a separate diversified portfolio of Wells Fargo Master Trust, a registered open-end management investment company. As of May 31, 2020, the Fund owned 97% of Wells Fargo Index Portfolio. The affiliated Master Portfolio directly acquires portfolio securities and the Fund acquires an indirect interest in those securities. The Fund accounts for its investment in the affiliated Master Portfolio as a partnership investment and records on a daily basis its share of the affiliated Master Portfolio’s income, expense and realized and unrealized gains and losses. The financial statements of the affiliated Master Portfolio for the year ended May 31, 2020 are included in this report and should be read in conjunction with the Fund’s financial statements.
2. SIGNIFICANT ACCOUNTING POLICIES
The following significant accounting policies, which are consistently followed in the preparation of the financial statements of the Fund, are in conformity with U.S. generally accepted accounting principles which require management to make estimates and assumptions that affect the reported amounts of assets and liabilities, disclosure of contingent assets and liabilities at the date of the financial statements, and the reported amounts of revenues and expenses during the reporting period. Actual results could differ from those estimates.
Securities valuation
All investments are valued each business day as of the close of regular trading on the New York Stock Exchange (generally 4 p.m. Eastern Time), although the Fund may deviate from this calculation time under unusual or unexpected circumstances.
Investments in the affiliated Master Portfolio are valued daily based on the Fund’s proportionate share of the affiliated Master Portfolio’s net assets, which are also valued daily. Securities held in the affiliated Master Portfolio are valued as discussed in the Notes to Financial Statements of the affiliated Master Portfolio, which are included elsewhere in this report.
Investments which are not valued using the method discussed above are valued at their fair value, as determined in good faith by the Board of Trustees of the Fund. The Board of Trustees has established a Valuation Committee comprised of the Trustees and has delegated to it the authority to take any actions regarding the valuation of portfolio securities that the Valuation Committee deems necessary or appropriate, including determining the fair value of portfolio securities, unless the determination has been delegated to the Wells Fargo Asset Management Pricing Committee at Wells Fargo Funds Management, LLC (“Funds Management”). The Board of Trustees retains the authority to make or ratify any valuation decisions or approve any changes to the Valuation Procedures as it deems appropriate. On a quarterly basis, the Board of Trustees receives reports on any valuation actions taken by the Valuation Committee or the Wells Fargo Asset Management Pricing Committee which may include items for ratification.
Investment transactions, income and expenses
Investments in the affiliated Master Portfolio are recorded on a trade basis. The Fund records daily its proportionate share of the affiliated Master Portfolio’s income, expenses and realized and unrealized gains or losses. The Fund also accrues its own expenses.
Distributions to shareholders
Distributions to shareholders from net investment income and any net realized gains are recorded on the ex-dividend date and paid at least annually. Such distributions are determined in accordance with income tax regulations and may differ from U.S. generally accepted accounting principles. Dividend sources are estimated at the time of declaration. The tax character of distributions is determined as of the Fund’s fiscal year end. Therefore, a portion of the Fund’s distributions made prior to the Fund’s fiscal year end may be categorized as a tax return of capital at year end.
Federal and other taxes
The Fund intends to continue to qualify as a regulated investment company by distributing substantially all of its investment company taxable income and any net realized capital gains (after reduction for capital loss carryforwards) sufficient to relieve it from all, or substantially all, federal income taxes. Accordingly, no provision for federal income taxes was required.
The Fund’s income and federal excise tax returns and all financial records supporting those returns for the prior three fiscal years are subject to examination by the federal and Delaware revenue authorities. Management has analyzed the Fund’s tax positions taken on federal, state, and foreign tax returns for all open tax years and does not believe that there are any uncertain tax positions that require recognition of a tax liability.
18 | Wells Fargo Index Fund
Notes to financial statements
As of May 31, 2020, the aggregate cost of all investments for federal income tax purposes was $141,747,321 and the unrealized gains (losses) consisted of:
| | | | |
| |
Gross unrealized gains | | $ | 882,707,171 | |
| |
Gross unrealized losses | | | (4,712,456 | ) |
| |
Net unrealized gains | | $ | 877,994,715 | |
Class allocations
The separate classes of shares offered by the Fund differ principally in applicable sales charges, distribution, shareholder servicing, and administration fees. Class specific expenses are charged directly to that share class. Investment income, common fund-level expenses, and realized and unrealized gains (losses) on investments are allocated daily to each class of shares based on the relative proportion of net assets of each class.
3. FAIR VALUATION MEASUREMENTS
At May 31, 2020, the affiliated Master Portfolio was measured at fair value using the net asset value per share (or its equivalent) as a practical expedient. The investment objective and the value of the affiliate Master Portfolio was as follows:
| | | | | | |
| | |
| Affiliated Master Portfolio | | Investment objective | | Value of affiliated
Master Portfolio | |
| | |
Wells Fargo Index Portfolio | | Seeks to replicate the total return of the S&P 500 Index, before fees and expenses | | $ | 1,019,742,036 | |
The affiliated Master Portfolio does not have a redemption period notice, can be redeemed daily and does not have any unfunded commitments.
4. TRANSACTIONS WITH AFFILIATES
Management fee
Funds Management, an indirect wholly owned subsidiary of Wells Fargo & Company (“Wells Fargo”), is the manager of the Fund and provides advisory and fund-level administrative services under an investment management agreement. Under the investment management agreement, Funds Management is responsible for, among other services, implementing the investment objectives and strategies of the Fund and providing fund-level administrative services in connection with the Fund’s operations. As long as the Fund continues to invest substantially all of its assets in a single affiliated Master Portfolio, the Fund pays Funds Management an investment management fee only for fund-level administrative services at the following annual rate based on the Fund’s average daily net assets:
| | | | |
| |
| Average daily net assets | | Management fee | |
| |
First $5 billion | | | 0.05 | % |
| |
Next $5 billion | | | 0.04 | |
| |
Over $10 billion | | | 0.03 | |
For the year ended May 31, 2020, the management fee was equivalent to an annual rate of 0.05% of the Fund’s average daily net assets.
Funds Management also serves as the adviser to the affiliated Master Portfolio and is entitled to receive a fee from the affiliated Master Portfolio for those services.
Administration fees
Under a class-level administration agreement, Funds Management provides class-level administrative services to the Fund, which includes paying fees and expenses for services provided by the transfer agent, sub-transfer agents, omnibus account servicers and record-keepers. As compensation for its services under the class-level administration agreement, Funds Management receives an annual fee which is calculated based on the average daily net assets of each class as follows:
| | |
| |
| | | Class-level administration fee |
| |
Class A, Class C | | 0.21% |
| |
Administrator Class | | 0.13 |
Wells Fargo Index Fund | 19
Notes to financial statements
Waivers and/or expense reimbursements
Funds Management has contractually waived and/or reimbursed management and administration fees to the extent necessary to maintain certain net operating expense ratios for the Fund. When each class of the Fund has exceeded its expense cap, Funds Management has waived fees and/or reimbursed expenses from fund-level expenses on a proportionate basis and then from class specific expenses. When only certain classes exceed their expense caps, waivers and/or reimbursements are applied against class specific expenses before fund-level expenses. Net expenses from the affiliated Master Portfolio are included in the expense caps. Funds Management has committed through September 30, 2020 to waive fees and/or reimburse expenses to the extent necessary to cap the Fund’s expenses at 0.45% for Class A shares, 1.20% for Class C shares, and 0.25% for Administrator Class shares. Prior to or after the commitment expiration date, the cap may be increased or the commitment to maintain the cap may be terminated only with the approval of the Board of Trustees.
Distribution fee
The Trust has adopted a distribution plan for Class C shares of the Fund pursuant to Rule 12b-1 under the 1940 Act. A distribution fee is charged to Class C shares and paid to Wells Fargo Funds Distributor, LLC (“Funds Distributor”), the principal underwriter, at an annual rate of 0.75% of the average daily net assets of Class C shares.
In addition, Funds Distributor is entitled to receive the front-end sales charge from the purchase of Class A shares and a contingent deferred sales charge on the redemption of certain Class A shares. Funds Distributor is also entitled to receive the contingent deferred sales charges from redemptions of Class C shares. For the year ended May 31, 2020, Funds Distributor received $10,847 from the sale of Class A shares. No contingent deferred sales charges were incurred by Class A and Class C for the year ended May 31, 2020.
Shareholder servicing fees
The Trust has entered into contracts with one or more shareholder servicing agents, whereby Class A and Class C of the Fund are charged a fee at an annual rate of 0.25% of the average daily net assets of each respective class. Administrator Class is charged a fee at an annual rate of 0.10% of its average daily net assets. A portion of these total shareholder servicing fees were paid to affiliates of Wells Fargo.
5. INVESTMENT PORTFOLIO TRANSACTIONS
The Fund seeks to achieve its investment objective by investing substantially all of its assets in a single affiliated Master Portfolio. Purchases and sales have been calculated by multiplying the Fund’s ownership percentage of the affiliated Master Portfolio by the affiliated Master Portfolio’s purchases and sales. Purchases and sales of investments, excluding U.S. government obligations (if any) and short-term securities, for the year ended May 31, 2020 were $37,183,929 and $290,590,151, respectively.
6. BANK BORROWINGS
The Trust (excluding the money market funds), Wells Fargo Master Trust and Wells Fargo Variable Trust are parties to a $280,000,000 revolving credit agreement whereby the Fund is permitted to use bank borrowings for temporary or emergency purposes, such as to fund shareholder redemption requests. Interest under the credit agreement is charged to the Fund based on a borrowing rate equal to the higher of the Federal Funds rate in effect on that day plus 1.25% or the overnight LIBOR rate in effect on that day plus 1.25%. In addition, an annual commitment fee equal to 0.25% of the unused balance is allocated to each participating fund.
For the year ended May 31, 2020, there were no borrowings by the Fund under the agreement.
7. DISTRIBUTIONS TO SHAREHOLDERS
The tax character of distributions paid during the years ended May 31, 2020 and May 31, 2019 were as follows:
| | | | | | | | |
| | | Year ended May 31 | |
| | |
| | | 2020 | | | 2019 | |
| | |
Ordinary income | | $ | 19,604,325 | | | $ | 26,860,120 | |
| | |
Long-term capital gain | | | 291,185,256 | | | | 322,442,393 | |
20 | Wells Fargo Index Fund
Notes to financial statements
As of May 31, 2020, the components of distributable earnings on a tax basis were as follows:
| | | | |
Undistributed ordinary income | | Undistributed long-term gain | | Unrealized gains |
| | |
| $5,420,766 | | $101,595,169 | | $877,994,715 |
8. CONCENTRATION RISK
Concentration risks result from exposure to a limited number of sectors. Through its investment in the affiliated Master Portfolio which may invest a substantial portion of its assets in any sector, the Fund may in turn be more affected by changes in that sector than a fund whose investments are not heavily weighted in any sector. As of the end of the period, the Fund invested a concentration of its portfolio in the information technology sector.
9. INDEMNIFICATION
Under the Fund’s organizational documents, the officers and Trustees have been granted certain indemnification rights against certain liabilities that may arise out of performance of their duties to the Fund. The Fund has entered into a separate agreement with each Trustee that converts indemnification rights currently existing under the Fund’s organizational documents into contractual rights that cannot be changed in the future without the consent of the Trustee. Additionally, in the normal course of business, the Fund may enter into contracts with service providers that contain a variety of indemnification clauses. The Fund’s maximum exposure under these arrangements is dependent on future claims that may be made against the Fund and, therefore, cannot be estimated.
10. NEW ACCOUNTING PRONOUNCEMENT
In August 2018, FASB issued Accounting Standards Update (“ASU”) No. 2018-13, Fair Value Measurement (Topic 820) Disclosure Framework—Changes to the Disclosure Requirements for Fair Value Measurement. ASU 2018-13 updates the disclosure requirements for fair value measurements by modifying or removing certain disclosures and adding certain new disclosures. The amendments are effective for fiscal years, and interim periods within those fiscal years, beginning after December 15, 2019. Early adoption is permitted. Management has adopted the removal and modification of disclosures early, as permitted, and will adopt the additional new disclosures at the effective date.
11. CORONAVIRUS (COVID-19) PANDEMIC
On March 11, 2020, the World Health Organization announced that it had made the assessment that coronavirus disease 2019 (“COVID-19”) is a pandemic. The impacts of COVID-19 are adversely affecting the entire global economy, individual companies and investment products, and the market in general. There is significant uncertainty around the extent and duration of business disruptions related to COVID-19 and the impacts may be short term or may last for an extended period of time. The risk of further spreading of COVID-19 has led to significant uncertainty and volatility in the financial markets. The value of the Fund and the Master Portfolio in which the Fund invests have generally been adversely affected by impacts caused by COVID-19.
Wells Fargo Index Fund | 21
Report of independent registered public accounting firm
TO THE SHAREHOLDERS OF THE FUND AND BOARD OF TRUSTEES WELLS FARGO FUNDS TRUST:
Opinion on the Financial Statements
We have audited the accompanying statement of assets and liabilities of Wells Fargo Index Fund (the Fund), one of the funds constituting Wells Fargo Funds Trust, including the portfolio of investments, as of May 31, 2020, the related statement of operations for the year then ended, the statements of changes in net assets for each of the years in the two-year period then ended, and the related notes (collectively, the financial statements) and the financial highlights for each of the years in the five-year period then ended. In our opinion, the financial statements and financial highlights present fairly, in all material respects, the financial position of the Fund as of May 31, 2020, the results of its operations for the year then ended, the changes in its net assets for each of the years in the two-year period then ended, and the financial highlights for each of the years in the five-year period then ended, in conformity with U.S. generally accepted accounting principles.
Basis for Opinion
These financial statements and financial highlights are the responsibility of the Fund’s management. Our responsibility is to express an opinion on these financial statements and financial highlights based on our audits. We are a public accounting firm registered with the Public Company Accounting Oversight Board (United States) (PCAOB) and are required to be independent with respect to the Fund in accordance with the U.S. federal securities laws and the applicable rules and regulations of the Securities and Exchange Commission and the PCAOB.
We conducted our audits in accordance with the standards of the PCAOB. Those standards require that we plan and perform the audit to obtain reasonable assurance about whether the financial statements and financial highlights are free of material misstatement, whether due to error or fraud. Our audits included performing procedures to assess the risks of material misstatement of the financial statements and financial highlights, whether due to error or fraud, and performing procedures that respond to those risks. Such procedures included examining, on a test basis, evidence regarding the amounts and disclosures in the financial statements and financial highlights. Such procedures also included confirmation of securities owned as of May 31, 2020, by correspondence with the transfer agent. Our audits also included evaluating the accounting principles used and significant estimates made by management, as well as evaluating the overall presentation of the financial statements and financial highlights. We believe that our audits provide a reasonable basis for our opinion.

We have not been able to determine the specific year that we began serving as the auditor of one or more Wells Fargo Funds investment companies; however we are aware that we have served as the auditor of one or more Wells Fargo Funds investment companies since at least 1955.
Boston, Massachusetts
July 29, 2020
22 | Wells Fargo Index Fund
Portfolio of investments—May 31, 2020
| | | | | | | | | | | | | | | | |
| | | | | | | | | Shares | | | Value | |
| Common Stocks: 96.50% | | | | | | | | | | | | | | | | |
| | | | |
Communication Services: 10.59% | | | | | | | | | | | | | | | | |
| | | | |
| Diversified Telecommunication Services: 1.80% | | | | | | | | | | | | |
AT&T Incorporated | | | | | | | | | | | 294,017 | | | $ | 9,073,348 | |
CenturyLink Incorporated | | | | | | | | | | | 39,492 | | | | 388,206 | |
Verizon Communications Incorporated | | | | | | | | | | | 166,460 | | | | 9,551,475 | |
| |
| | | | 19,013,029 | |
| | | | | | | | | | | | | | | | |
| | | | |
| Entertainment: 1.94% | | | | | | | | | | | | |
Activision Blizzard Incorporated | | | | | | | | | | | 30,921 | | | | 2,225,694 | |
Electronic Arts Incorporated † | | | | | | | | | | | 11,752 | | | | 1,444,086 | |
Live Nation Entertainment Incorporated † | | | | | | | | | | | 5,672 | | | | 278,836 | |
Netflix Incorporated † | | | | | | | | | | | 17,639 | | | | 7,403,617 | |
Take-Two Interactive Software Incorporated † | | | | | | | | | | | 4,555 | | | | 620,254 | |
The Walt Disney Company | | | | | | | | | | | 72,544 | | | | 8,509,411 | |
| |
| | | | 20,481,898 | |
| | | | | | | | | | | | | | | | |
| | | | |
| Interactive Media & Services: 5.42% | | | | | | | | | | | | |
Alphabet Incorporated Class A † | | | | | | | | | | | 12,060 | | | | 17,288,251 | |
Alphabet Incorporated Class C † | | | | | | | | | | | 12,030 | | | | 17,189,908 | |
Facebook Incorporated Class A † | | | | | | | | | | | 96,857 | | | | 21,801,542 | |
Twitter Incorporated † | | | | | | | | | | | 31,247 | | | | 967,720 | |
| |
| | | | 57,247,421 | |
| | | | | | | | | | | | | | | | |
| | | | |
| Media: 1.28% | | | | | | | | | | | | |
Charter Communications Incorporated Class A † | | | | | | | | | | | 6,311 | | | | 3,433,184 | |
Comcast Corporation Class A | | | | | | | | | | | 182,721 | | | | 7,235,752 | |
Discovery Communications Incorporated Class A † | | | | | | | | | | | 6,365 | | | | 138,439 | |
Discovery Communications Incorporated Class C † | | | | | | | | | | | 13,500 | | | | 264,465 | |
DISH Network Corporation Class A † | | | | | | | | | | | 10,304 | | | | 326,122 | |
Fox Corporation Class A | | | | | | | | | | | 14,269 | | | | 416,227 | |
Fox Corporation Class B | | | | | | | | | | | 6,535 | | | | 188,077 | |
Interpublic Group of Companies Incorporated | | | | | | | | | | | 15,606 | | | | 267,019 | |
News Corporation Class A | | | | | | | | | | | 15,639 | | | | 191,578 | |
News Corporation Class B | | | | | | | | | | | 4,901 | | | | 60,086 | |
Omnicom Group Incorporated | | | | | | | | | | | 8,763 | | | | 480,125 | |
ViacomCBS Incorporated Class B | | | | | | | | | | | 21,750 | | | | 451,095 | |
| |
| | | | 13,452,169 | |
| | | | | | | | | | | | | | | | |
| | | | |
| Wireless Telecommunication Services: 0.15% | | | | | | | | | | | | |
T-Mobile US Incorporated † | | | | | | | | | | | 15,322 | | | | 1,532,813 | |
| | | | | | | | | | | | | | | | |
| | | | |
| Consumer Discretionary: 10.16% | | | | | | | | | | | | |
| | | | |
| Auto Components: 0.10% | | | | | | | | | | | | |
Aptiv plc | | | | | | | | | | | 10,275 | | | | 774,221 | |
BorgWarner Incorporated | | | | | | | | | | | 8,311 | | | | 267,199 | |
| |
| | | | 1,041,420 | |
| | | | | | | | | | | | | | | | |
| | | | |
| Automobiles: 0.22% | | | | | | | | | | | | |
Ford Motor Company | | | | | | | | | | | 156,730 | | | | 894,928 | |
General Motors Company | | | | | | | | | | | 50,606 | | | | 1,309,683 | |
Harley-Davidson Incorporated | | | | | | | | | | | 6,210 | | | | 132,521 | |
| |
| | | | 2,337,132 | |
| | | | | | | | | | | | | | | | |
The accompanying notes are an integral part of these financial statements.
Wells Fargo Index Portfolio | 23
Portfolio of investments—May 31, 2020
| | | | | | | | | | | | | | | | |
| | | | | | | | | Shares | | | Value | |
| Distributors: 0.08% | |
Genuine Parts Company | | | | | | | | | | | 5,848 | | | $ | 487,782 | |
LKQ Corporation † | | | | | | | | | | | 12,335 | | | | 338,719 | |
| |
| | | | 826,501 | |
| | | | | | | | | | | | | | | | |
| | | | |
| Diversified Consumer Services: 0.01% | | | | | | | | | | | | |
H&R Block Incorporated | | | | | | | | | | | 7,858 | | | | 133,586 | |
| | | | | | | | | | | | | | | | |
| | | | |
| Hotels, Restaurants & Leisure: 1.56% | | | | | | | | | | | | |
Carnival Corporation | | | | | | | | | | | 18,746 | | | | 295,062 | |
Chipotle Mexican Grill Incorporated † | | | | | | | | | | | 1,029 | | | | 1,033,023 | |
Darden Restaurants Incorporated | | | | | | | | | | | 5,250 | | | | 403,515 | |
Domino’s Pizza Incorporated | | | | | | | | | | | 1,556 | | | | 600,367 | |
Hilton Worldwide Holdings Incorporated | | | | | | | | | | | 11,357 | | | | 900,724 | |
Las Vegas Sands Corporation | | | | | | | | | | | 13,601 | | | | 652,032 | |
Marriott International Incorporated Class A | | | | | | | | | | | 10,922 | | | | 966,597 | |
McDonald’s Corporation | | | | | | | | | | | 30,311 | | | | 5,647,546 | |
MGM Resorts International | | | | | | | | | | | 20,727 | | | | 356,090 | |
Norwegian Cruise Line Holdings Limited † | | | | | | | | | | | 10,027 | | | | 157,023 | |
Royal Caribbean Cruises Limited | | | | | | | | | | | 6,919 | | | | 358,889 | |
Starbucks Corporation | | | | | | | | | | | 47,534 | | | | 3,707,177 | |
Wynn Resorts Limited | | | | | | | | | | | 3,889 | | | | 323,876 | |
Yum! Brands Incorporated | | | | | | | | | | | 12,174 | | | | 1,092,373 | |
| |
| | | | 16,494,294 | |
| | | | | | | | | | | | | | | | |
| | | | |
| Household Durables: 0.35% | | | | | | | | | | | | |
D.R. Horton Incorporated | | | | | | | | | | | 13,497 | | | | 746,384 | |
Garmin Limited | | | | | | | | | | | 5,815 | | | | 524,339 | |
Leggett & Platt Incorporated | | | | | | | | | | | 5,297 | | | | 162,035 | |
Lennar Corporation Class A | | | | | | | | | | | 11,265 | | | | 681,082 | |
Mohawk Industries Incorporated † | | | | | | | | | | | 2,393 | | | | 223,028 | |
Newell Rubbermaid Incorporated | | | | | | | | | | | 15,337 | | | | 201,682 | |
NVR Incorporated † | | | | | | | | | | | 140 | | | | 451,025 | |
Pulte Group Incorporated | | | | | | | | | | | 10,253 | | | | 348,294 | |
Whirlpool Corporation | | | | | | | | | | | 2,544 | | | | 309,910 | |
| |
| | | | 3,647,779 | |
| | | | | | | | | | | | | | | | |
| | | | |
| Internet & Direct Marketing Retail: 4.31% | | | | | | | | | | | | |
Amazon.com Incorporated † | | | | | | | | | | | 16,762 | | | | 40,939,006 | |
Booking Holdings Incorporated † | | | | | | | | | | | 1,685 | | | | 2,762,423 | |
eBay Incorporated | | | | | | | | | | | 30,779 | | | | 1,401,676 | |
Expedia Group Incorporated | | | | | | | | | | | 5,625 | | | | 447,075 | |
| |
| | | | 45,550,180 | |
| | | | | | | | | | | | | | | | |
| | | | |
| Leisure Products: 0.04% | | | | | | | | | | | | |
Hasbro Incorporated | | | | | | | | | | | 5,122 | | | | 376,518 | |
| | | | | | | | | | | | | | | | |
| | | | |
| Multiline Retail: 0.53% | | | | | | | | | | | | |
Dollar General Corporation | | | | | | | | | | | 10,247 | | | | 1,962,403 | |
Dollar Tree Incorporated † | | | | | | | | | | | 9,525 | | | | 932,212 | |
Kohl’s Corporation | | | | | | | | | | | 6,302 | | | | 121,124 | |
Nordstrom Incorporated | | | | | | | | | | | 4,312 | | | | 69,553 | |
Target Corporation | | | | | | | | | | | 20,395 | | | | 2,494,920 | |
| |
| | | | 5,580,212 | |
| | | | | | | | | | | | | | | | |
The accompanying notes are an integral part of these financial statements.
24 | Wells Fargo Index Portfolio
Portfolio of investments—May 31, 2020
| | | | | | | | | | | | | | | | |
| | | | | | | | | Shares | | | Value | |
| Specialty Retail: 2.36% | | | | | | | | | | | | |
Advance Auto Parts Incorporated | | | | | | | | | | | 2,788 | | | $ | 388,424 | |
AutoZone Incorporated † | | | | | | | | | | | 959 | | | | 1,100,798 | |
Best Buy Company Incorporated | | | | | | | | | | | 9,166 | | | | 715,773 | |
CarMax Incorporated † | | | | | | | | | | | 6,618 | | | | 582,715 | |
L Brands Incorporated | | | | | | | | | | | 9,347 | | | | 151,328 | |
Lowe’s Companies Incorporated | | | | | | | | | | | 30,850 | | | | 4,021,298 | |
O’Reilly Automotive Incorporated † | | | | | | | | | | | 3,045 | | | | 1,270,496 | |
Ross Stores Incorporated | | | | | | | | | | | 14,559 | | | | 1,411,641 | |
The Gap Incorporated | | | | | | | | | | | 8,564 | | | | 76,220 | |
The Home Depot Incorporated | | | | | | | | | | | 43,905 | | | | 10,909,514 | |
The TJX Companies Incorporated | | | | | | | | | | | 48,808 | | | | 2,575,110 | |
Tiffany & Company | | | | | | | | | | | 4,345 | | | | 556,725 | |
Tractor Supply Company | | | | | | | | | | | 4,765 | | | | 581,425 | |
Ulta Beauty Incorporated † | | | | | | | | | | | 2,301 | | | | 561,467 | |
| |
| | | | 24,902,934 | |
| | | | | | | | | | | | | | | | |
| | | | |
| Textiles, Apparel & Luxury Goods: 0.60% | | | | | | | | | | | | |
HanesBrands Incorporated | | | | | | | | | | | 14,558 | | | | 143,542 | |
Nike Incorporated Class B | | | | | | | | | | | 50,151 | | | | 4,943,886 | |
PVH Corporation | | | | | | | | | | | 2,984 | | | | 135,682 | |
Ralph Lauren Corporation | | | | | | | | | | | 2,002 | | | | 151,171 | |
Tapestry Incorporated | | | | | | | | | | | 11,106 | | | | 151,042 | |
Under Armour Incorporated Class A † | | | | | | | | | | | 7,575 | | | | 66,281 | |
Under Armour Incorporated Class C † | | | | | | | | | | | 7,831 | | | | 61,552 | |
VF Corporation | | | | | | | | | | | 13,181 | | | | 739,454 | |
| |
| | | | 6,392,610 | |
| | | | | | | | | | | | | | | | |
| | | | |
Consumer Staples: 6.88% | | | | | | | | | | | | | | | | |
| | | | |
| Beverages: 1.68% | | | | | | | | | | | | |
Brown-Forman Corporation Class B | | | | | | | | | | | 7,333 | | | | 483,465 | |
Constellation Brands Incorporated Class A | | | | | | | | | | | 6,742 | | | | 1,164,343 | |
Molson Coors Brewing Company Class B | | | | | | | | | | | 7,561 | | | | 287,016 | |
Monster Beverage Corporation † | | | | | | | | | | | 15,365 | | | | 1,104,897 | |
PepsiCo Incorporated | | | | | | | | | | | 56,124 | | | | 7,383,112 | |
The Coca-Cola Company | | | | | | | | | | | 155,201 | | | | 7,244,783 | |
| |
| | | | 17,667,616 | |
| | | | | | | | | | | | | | | | |
| | | | |
| Food & Staples Retailing: 1.52% | | | | | | | | | | | | |
Costco Wholesale Corporation | | | | | | | | | | | 17,781 | | | | 5,484,905 | |
Sysco Corporation | | | | | | | | | | | 20,536 | | | | 1,132,766 | |
The Kroger Company | | | | | | | | | | | 32,279 | | | | 1,052,941 | |
Walgreens Boots Alliance Incorporated | | | | | | | | | | | 30,176 | | | | 1,295,757 | |
Walmart Incorporated | | | | | | | | | | | 57,096 | | | | 7,083,330 | |
| |
| | | | 16,049,699 | |
| | | | | | | | | | | | | | | | |
| | | | |
| Food Products: 1.11% | | | | | | | | | | | | |
Archer Daniels Midland Company | | | | | | | | | | | 22,406 | | | | 880,780 | |
Campbell Soup Company | | | | | | | | | | | 6,799 | | | | 346,613 | |
ConAgra Foods Incorporated | | | | | | | | | | | 19,587 | | | | 681,432 | |
General Mills Incorporated | | | | | | | | | | | 24,326 | | | | 1,533,511 | |
Hormel Foods Corporation | | | | | | | | | | | 11,192 | | | | 546,505 | |
Kellogg Company | | | | | | | | | | | 10,022 | | | | 654,537 | |
Lamb Weston Holdings Incorporated | | | | | | | | | | | 5,879 | | | | 353,093 | |
McCormick & Company Incorporated | | | | | | | | | | | 4,974 | | | | 871,246 | |
The accompanying notes are an integral part of these financial statements.
Wells Fargo Index Portfolio | 25
Portfolio of investments—May 31, 2020
| | | | | | | | | | | | | | | | |
| | | | | | | | | Shares | | | Value | |
| | | | |
| Food Products (continued) | | | | | | | | | | | | |
Mondelez International Incorporated Class A | | | | | | | | | | | 57,951 | | | $ | 3,020,406 | |
The Hershey Company | | | | | | | | | | | 5,969 | | | | 809,874 | |
The J.M. Smucker Company | | | | | | | | | | | 4,591 | | | | 523,053 | |
The Kraft Heinz Company | | | | | | | | | | | 25,067 | | | | 763,791 | |
Tyson Foods Incorporated Class A | | | | | | | | | | | 11,881 | | | | 729,969 | |
| |
| | | | 11,714,810 | |
| | | | | | | | | | | | | | | | |
| | | | |
| Household Products: 1.69% | | | | | | | | | | | | |
Church & Dwight Company Incorporated | | | | | | | | | | | 9,877 | | | | 741,466 | |
Colgate-Palmolive Company | | | | | | | | | | | 34,495 | | | | 2,495,023 | |
Kimberly-Clark Corporation | | | | | | | | | | | 13,797 | | | | 1,951,448 | |
The Clorox Company | | | | | | | | | | | 5,051 | | | | 1,041,769 | |
The Procter & Gamble Company | | | | | | | | | | | 100,373 | | | | 11,635,238 | |
| |
| | | | 17,864,944 | |
| | | | | | | | | | | | | | | | |
| | | | |
| Personal Products: 0.17% | | | | | | | | | | | | |
Coty Incorporated Class A | | | | | | | | | | | 11,897 | | | | 43,186 | |
The Estee Lauder Companies Incorporated Class A | | | | | �� | | | | | | 8,957 | | | | 1,768,739 | |
| |
| | | | 1,811,925 | |
| | | | | | | | | | | | | | | | |
| | | | |
| Tobacco: 0.71% | | | | | | | | | | | | |
Altria Group Incorporated | | | | | | | | | | | 75,190 | | | | 2,936,170 | |
Philip Morris International Incorporated | | | | | | | | | | | 62,622 | | | | 4,593,950 | |
| |
| | | | 7,530,120 | |
| | | | | | | | | | | | | | | | |
| | | | |
Energy: 2.82% | | | | | | | | | | | | | | | | |
| | | | |
| Energy Equipment & Services: 0.21% | | | | | | | | | | | | |
Baker Hughes Incorporated | | | | | | | | | | | 26,156 | | | | 431,836 | |
Halliburton Company | | | | | | | | | | | 35,330 | | | | 415,128 | |
National Oilwell Varco Incorporated | | | | | | | | | | | 15,529 | | | | 193,647 | |
Schlumberger Limited | | | | | | | | | | | 55,720 | | | | 1,029,148 | |
TechnipFMC plc | | | | | | | | | | | 16,914 | | | | 125,164 | |
| |
| | | | 2,194,923 | |
| | | | | | | | | | | | | | | | |
| | | | |
| Oil, Gas & Consumable Fuels: 2.61% | | | | | | | | | | | | |
Apache Corporation | | | | | | | | | | | 15,135 | | | | 163,307 | |
Cabot Oil & Gas Corporation | | | | | | | | | | | 16,418 | | | | 325,733 | |
Chevron Corporation | | | | | | | | | | | 76,105 | | | | 6,978,829 | |
Concho Resources Incorporated | | | | | | | | | | | 8,091 | | | | 441,121 | |
ConocoPhillips | | | | | | | | | | | 44,164 | | | | 1,862,838 | |
Devon Energy Corporation | | | | | | | | | | | 15,576 | | | | 168,377 | |
Diamondback Energy Incorporated | | | | | | | | | | | 6,486 | | | | 276,174 | |
EOG Resources Incorporated | | | | | | | | | | | 23,415 | | | | 1,193,463 | |
Exxon Mobil Corporation | | | | | | | | | | | 170,296 | | | | 7,743,359 | |
Hess Corporation | | | | | | | | | | | 10,424 | | | | 494,827 | |
HollyFrontier Corporation | | | | | | | | | | | 5,976 | | | | 187,945 | |
Kinder Morgan Incorporated | | | | | | | | | | | 78,399 | | | | 1,238,704 | |
Marathon Oil Corporation | | | | | | | | | | | 32,196 | | | | 171,927 | |
Marathon Petroleum Corporation | | | | | | | | | | | 26,134 | | | | 918,349 | |
Noble Energy Incorporated | | | | | | | | | | | 19,251 | | | | 168,061 | |
Occidental Petroleum Corporation | | | | | | | | | | | 35,955 | | | | 465,617 | |
ONEOK Incorporated | | | | | | | | | | | 16,626 | | | | 610,008 | |
Phillips 66 | | | | | | | | | | | 17,885 | | | | 1,399,680 | |
Pioneer Natural Resources Company | | | | | | | | | | | 6,667 | | | | 610,697 | |
The accompanying notes are an integral part of these financial statements.
26 | Wells Fargo Index Portfolio
Portfolio of investments—May 31, 2020
| | | | | | | | | | | | | | | | |
| | | | | | | | | Shares | | | Value | |
| | | | |
| Oil, Gas & Consumable Fuels (continued) | | | | | | | | | | | | |
The Williams Companies Incorporated | | | | | | | | | | | 48,783 | | | $ | 996,637 | |
Valero Energy Corporation | | | | | | | | | | | 16,528 | | | | 1,101,426 | |
| |
| | | | 27,517,079 | |
| | | | | | | | | | | | | | | | |
|
Financials: 10.07% | |
| | | | |
| Banks: 3.71% | | | | | | | | | | | | |
Bank of America Corporation | | | | | | | | | | | 325,837 | | | | 7,859,188 | |
Citigroup Incorporated | | | | | | | | | | | 87,871 | | | | 4,209,900 | |
Citizens Financial Group Incorporated | | | | | | | | | | | 17,497 | | | | 421,678 | |
Comerica Incorporated | | | | | | | | | | | 5,802 | | | | 210,903 | |
Fifth Third Bancorp | | | | | | | | | | | 28,563 | | | | 553,837 | |
First Republic Bank | | | | | | | | | | | 6,783 | | | | 733,717 | |
Huntington Bancshares Incorporated | | | | | | | | | | | 41,567 | | | | 369,531 | |
JPMorgan Chase & Company | | | | | | | | | | | 126,239 | | | | 12,284,317 | |
KeyCorp | | | | | | | | | | | 39,643 | | | | 469,770 | |
M&T Bank Corporation | | | | | | | | | | | 5,311 | | | | 561,160 | |
People’s United Financial Incorporated | | | | | | | | | | | 17,875 | | | | 204,669 | |
PNC Financial Services Group Incorporated | | | | | | | | | | | 17,636 | | | | 2,011,209 | |
Regions Financial Corporation | | | | | | | | | | | 38,825 | | | | 439,111 | |
SVB Financial Group † | | | | | | | | | | | 2,076 | | | | 445,821 | |
Truist Financial Corporation | | | | | | | | | | | 53,976 | | | | 1,985,237 | |
US Bancorp | | | | | | | | | | | 57,205 | | | | 2,034,210 | |
Wells Fargo & Company (l) | | | | | | | | | | | 154,906 | | | | 4,100,362 | |
Zions Bancorporation | | | | | | | | | | | 6,861 | | | | 225,761 | |
| |
| | | | 39,120,381 | |
| | | | | | | | | | | | | | | | |
| | | | |
| Capital Markets: 2.65% | | | | | | | | | | | | |
Ameriprise Financial Incorporated | | | | | | | | | | | 5,099 | | | | 714,217 | |
Bank of New York Mellon Corporation | | | | | | | | | | | 33,777 | | | | 1,255,491 | |
BlackRock Incorporated | | | | | | | | | | | 6,136 | | | | 3,243,735 | |
Cboe Global Markets Incorporated | | | | | | | | | | | 4,462 | | | | 475,025 | |
CME Group Incorporated | | | | | | | | | | | 14,424 | | | | 2,633,822 | |
E*TRADE Financial Corporation | | | | | | | | | | | 9,093 | | | | 414,095 | |
Franklin Resources Incorporated | | | | | | | | | | | 11,226 | | | | 211,835 | |
Intercontinental Exchange Incorporated | | | | | | | | | | | 22,412 | | | | 2,179,567 | |
Invesco Limited | | | | | | | | | | | 14,980 | | | | 119,391 | |
MarketAxess Holdings Incorporated | | | | | | | | | | | 1,526 | | | | 776,108 | |
Moody’s Corporation | | | | | | | | | | | 6,535 | | | | 1,747,524 | |
Morgan Stanley | | | | | | | | | | | 46,875 | | | | 2,071,875 | |
MSCI Incorporated | | | | | | | | | | | 3,409 | | | | 1,121,050 | |
Northern Trust Corporation | | | | | | | | | | | 8,528 | | | | 673,797 | |
Raymond James Financial Incorporated | | | | | | | | | | | 4,969 | | | | 344,252 | |
S&P Global Incorporated | | | | | | | | | | | 9,837 | | | | 3,197,222 | |
State Street Corporation | | | | | | | | | | | 14,635 | | | | 892,150 | |
T. Rowe Price Group Incorporated | | | | | | | | | | | 9,405 | | | | 1,137,065 | |
The Charles Schwab Corporation | | | | | | | | | | | 46,015 | | | | 1,652,399 | |
The Goldman Sachs Group Incorporated | | | | | | | | | | | 12,826 | | | | 2,520,181 | |
The NASDAQ OMX Group Incorporated | | | | | | | | | | | 4,618 | | | | 547,048 | |
| |
| | | | 27,927,849 | |
| | | | | | | | | | | | | | | | |
| | | | |
| Consumer Finance: 0.46% | | | | | | | | | | | | |
American Express Company | | | | | | | | | | | 27,006 | | | | 2,567,460 | |
Capital One Financial Corporation | | | | | | | | | | | 18,745 | | | | 1,275,410 | |
Discover Financial Services | | | | | | | | | | | 12,617 | | | | 599,434 | |
Synchrony Financial | | | | | | | | | | | 22,716 | | | | 462,725 | |
| |
| | | | 4,905,029 | |
| | | | | | | | | | | | | | | | |
The accompanying notes are an integral part of these financial statements.
Wells Fargo Index Portfolio | 27
Portfolio of investments—May 31, 2020
| | | | | | | | | | | | | | | | |
| | | | | | | | | Shares | | | Value | |
| Diversified Financial Services: 1.38% | | | | | | | | | | | | |
Berkshire Hathaway Incorporated Class B † | | | | | | | | | | | 78,728 | | | $ | 14,610,342 | |
| | | | | | | | | | | | | | | | |
| | | | |
| Insurance: 1.87% | | | | | | | | | | | | |
AFLAC Incorporated | | | | | | | | | | | 29,543 | | | | 1,077,433 | |
American International Group Incorporated | | | | | | | | | | | 35,014 | | | | 1,052,521 | |
Aon plc | | | | | | | | | | | 9,424 | | | | 1,856,057 | |
Arthur J. Gallagher & Company | | | | | | | | | | | 7,507 | | | | 707,760 | |
Assurant Incorporated | | | | | | | | | | | 2,441 | | | | 250,398 | |
Chubb Limited | | | | | | | | | | | 18,241 | | | | 2,224,308 | |
Cincinnati Financial Corporation | | | | | | | | | | | 6,115 | | | | 360,479 | |
Everest Reinsurance Group Limited | | | | | | | | | | | 1,641 | | | | 325,591 | |
Globe Life Incorporated | | | | | | | | | | | 4,010 | | | | 308,850 | |
Lincoln National Corporation | | | | | | | | | | | 7,983 | | | | 302,795 | |
Loews Corporation | | | | | | | | | | | 10,296 | | | | 342,239 | |
Marsh & McLennan Companies Incorporated | | | | | | | | | | | 20,312 | | | | 2,151,447 | |
MetLife Incorporated | | | | | | | | | | | 31,462 | | | | 1,132,947 | |
Principal Financial Group Incorporated | | | | | | | | | | | 10,394 | | | | 401,416 | |
Prudential Financial Incorporated | | | | | | | | | | | 16,180 | | | | 986,333 | |
The Allstate Corporation | | | | | | | | | | | 13,039 | | | | 1,275,345 | |
The Hartford Financial Services Group Incorporated | | | | | | | | | | | 14,506 | | | | 555,435 | |
The Progressive Corporation | | | | | | | | | | | 23,531 | | | | 1,827,888 | |
The Travelers Companies Incorporated | | | | | | | | | | | 10,389 | | | | 1,111,415 | |
Unum Group | | | | | | | | | | | 8,302 | | | | 125,775 | |
W.R. Berkley Corporation | | | | | | | | | | | 5,840 | | | | 338,428 | |
Willis Towers Watson plc | | | | | | | | | | | 5,175 | | | | 1,050,008 | |
| |
| | | | 19,764,868 | |
| | | | | | | | | | | | | | | | |
| | | | |
Health Care: 14.70% | | | | | | | | | | | | | | | | |
| | | | |
| Biotechnology: 2.42% | | | | | | | | | | | | |
AbbVie Incorporated | | | | | | | | | | | 70,963 | | | | 6,576,141 | |
Alexion Pharmaceuticals Incorporated † | | | | | | | | | | | 8,907 | | | | 1,067,949 | |
Amgen Incorporated | | | | | | | | | | | 23,915 | | | | 5,493,276 | |
Biogen Idec Incorporated † | | | | | | | | | | | 7,263 | | | | 2,230,395 | |
Gilead Sciences Incorporated | | | | | | | | | | | 50,920 | | | | 3,963,104 | |
Incyte Corporation † | | | | | | | | | | | 7,196 | | | | 733,344 | |
Regeneron Pharmaceuticals Incorporated † | | | | | | | | | | | 4,060 | | | | 2,488,009 | |
Vertex Pharmaceuticals Incorporated † | | | | | | | | | | | 10,350 | | | | 2,980,386 | |
| |
| | | | 25,532,604 | |
| | | | | | | | | | | | | | | | |
| | | | |
| Health Care Equipment & Supplies: 3.77% | | | | | | | | | | | | |
Abbott Laboratories | | | | | | | | | | | 71,135 | | | | 6,752,134 | |
ABIOMED Incorporated † | | | | | | | | | | | 1,817 | | | | 406,826 | |
Align Technology Incorporated † | | | | | | | | | | | 2,887 | | | | 709,105 | |
Baxter International Incorporated | | | | | | | | | | | 20,549 | | | | 1,849,615 | |
Becton Dickinson & Company | | | | | | | | | | | 11,868 | | | | 2,930,565 | |
Boston Scientific Corporation † | | | | | | | | | | | 56,100 | | | | 2,131,239 | |
Danaher Corporation | | | | | | | | | | | 25,326 | | | | 4,219,565 | |
Dentsply Sirona Incorporated | | | | | | | | | | | 8,952 | | | | 416,447 | |
DexCom Incorporated † | | | | | | | | | | | 3,670 | | | | 1,388,398 | |
Edwards Lifesciences Corporation † | | | | | | | | | | | 8,395 | | | | 1,886,524 | |
Hologic Incorporated † | | | | | | | | | | | 10,792 | | | | 571,976 | |
IDEXX Laboratories Incorporated † | | | | | | | | | | | 3,453 | | | | 1,066,563 | |
Intuitive Surgical Incorporated † | | | | | | | | | | | 4,652 | | | | 2,698,300 | |
Medtronic plc | | | | | | | | | | | 53,948 | | | | 5,318,194 | |
ResMed Incorporated | | | | | | | | | | | 5,787 | | | | 930,665 | |
The accompanying notes are an integral part of these financial statements.
28 | Wells Fargo Index Portfolio
Portfolio of investments—May 31, 2020
| | | | | | | | | | | | | | | | |
| | | | | | | | | Shares | | | Value | |
| | | | |
| Health Care Equipment & Supplies (continued) | | | | | | | | | | | | |
STERIS plc | | | | | | | | | | | 3,412 | | | $ | 566,017 | |
Stryker Corporation | | | | | | | | | | | 12,959 | | | | 2,536,465 | |
Teleflex Incorporated | | | | | | | | | | | 1,863 | | | | 676,008 | |
The Cooper Companies Incorporated | | | | | | | | | | | 1,995 | | | | 632,375 | |
Varian Medical Systems Incorporated † | | | | | | | | | | | 3,659 | | | | 444,166 | |
West Pharmaceutical Services Incorporated | | | | | | | | | | | 2,978 | | | | 643,367 | |
Zimmer Biomet Holdings Incorporated | | | | | | | | | | | 8,279 | | | | 1,045,969 | |
| |
| | | | 39,820,483 | |
| | | | | | | | | | | | | | | | |
|
| Health Care Providers & Services: 2.89% | |
AmerisourceBergen Corporation | | | | | | | | | | | 6,050 | | | | 576,807 | |
Anthem Incorporated | | | | | | | | | | | 10,206 | | | | 3,001,687 | |
Cardinal Health Incorporated | | | | | | | | | | | 11,772 | | | | 643,811 | |
Centene Corporation † | | | | | | | | | | | 23,498 | | | | 1,556,743 | |
Cigna Corporation | | | | | | | | | | | 15,030 | | | | 2,965,720 | |
CVS Health Corporation | | | | | | | | | | | 52,362 | | | | 3,433,376 | |
DaVita HealthCare Partners Incorporated † | | | | | | | | | | | 3,609 | | | | 292,185 | |
HCA Healthcare Incorporated | | | | | | | | | | | 10,648 | | | | 1,138,271 | |
Henry Schein Incorporated † | | | | | | | | | | | 5,906 | | | | 358,612 | |
Humana Incorporated | | | | | | | | | | | 5,330 | | | | 2,188,765 | |
Laboratory Corporation of America Holdings † | | | | | | | | | | | 3,908 | | | | 685,151 | |
McKesson Corporation | | | | | | | | | | | 6,500 | | | | 1,031,355 | |
Quest Diagnostics Incorporated | | | | | | | | | | | 5,421 | | | | 641,196 | |
UnitedHealth Group Incorporated | | | | | | | | | | | 38,132 | | | | 11,624,540 | |
Universal Health Services Incorporated Class B | | | | | | | | | | | 3,233 | | | | 340,920 | |
| |
| | | | 30,479,139 | |
| | | | | | | | | | | | | | | | |
| | | | |
| Health Care Technology: 0.09% | | | | | | | | | | | | |
Cerner Corporation | | | | | | | | | | | 12,642 | | | | 921,602 | |
| | | | | | | | | | | | | | | | |
| | | | |
| Life Sciences Tools & Services: 1.11% | | | | | | | | | | | | |
Agilent Technologies Incorporated | | | | | | | | | | | 12,456 | | | | 1,097,872 | |
Illumina Incorporated † | | | | | | | | | | | 5,917 | | | | 2,148,167 | |
IQVIA Holdings Incorporated † | | | | | | | | | | | 7,263 | | | | 1,085,964 | |
Mettler-Toledo International Incorporated † | | | | | | | | | | | 980 | | | | 779,100 | |
PerkinElmer Incorporated | | | | | | | | | | | 4,472 | | | | 449,302 | |
Thermo Fisher Scientific Incorporated | | | | | | | | | | | 16,139 | | | | 5,635,577 | |
Waters Corporation † | | | | | | | | | | | 2,593 | | | | 518,211 | |
| |
| | | | 11,714,193 | |
| | | | | | | | | | | | | | | | |
| | | | |
| Pharmaceuticals: 4.42% | | | | | | | | | | | | |
Bristol-Myers Squibb Company | | | | | | | | | | | 94,350 | | | | 5,634,582 | |
Eli Lilly & Company | | | | | | | | | | | 34,007 | | | | 5,201,371 | |
Johnson & Johnson | | | | | | | | | | | 105,929 | | | | 15,756,939 | |
Merck & Company Incorporated | | | | | | | | | | | 102,472 | | | | 8,271,540 | |
Mylan NV † | | | | | | | | | | | 20,774 | | | | 354,612 | |
Perrigo Company plc | | | | | | | | | | | 5,478 | | | | 300,030 | |
Pfizer Incorporated | | | | | | | | | | | 222,741 | | | | 8,506,479 | |
Zoetis Incorporated | | | | | | | | | | | 19,170 | | | | 2,672,106 | |
| |
| | | | 46,697,659 | |
| | | | | | | | | | | | | | | | |
| | | | |
Industrials: 7.68% | | | | | | | | | | | | | | | | |
| | | | |
| Aerospace & Defense: 1.68% | | | | | | | | | | | | |
General Dynamics Corporation | | | | | | | | | | | 9,432 | | | | 1,384,901 | |
Howmet Aerospace Incorporated | | | | | | | | | | | 15,591 | | | | 203,930 | |
The accompanying notes are an integral part of these financial statements.
Wells Fargo Index Portfolio | 29
Portfolio of investments—May 31, 2020
| | | | | | | | | | | | | | | | |
| | | | | | | | | Shares | | | Value | |
| | | | |
| Aerospace & Defense (continued) | | | | | | | | | | | | |
Huntington Ingalls Industries Incorporated | | | | | | | | | | | 1,646 | | | $ | 329,019 | |
L3Harris Technologies Incorporated | | | | | | | | | | | 8,898 | | | | 1,774,706 | |
Lockheed Martin Corporation | | | | | | | | | | | 9,991 | | | | 3,880,904 | |
Northrop Grumman Corporation | | | | | | | | | | | 6,308 | | | | 2,114,442 | |
Raytheon Technologies Corporation | | | | | | | | | | | 59,081 | | | | 3,811,906 | |
Textron Incorporated | | | | | | | | | | | 9,187 | | | | 284,521 | |
The Boeing Company | | | | | | | | | | | 21,519 | | | | 3,138,546 | |
TransDigm Group Incorporated | | | | | | | | | | | 2,004 | | | | 851,339 | |
| |
| | | | 17,774,214 | |
| | | | | | | | | | | | | | | | |
| | | | |
| Air Freight & Logistics: 0.48% | | | | | | | | | | | | |
C.H. Robinson Worldwide Incorporated | | | | | | | | | | | 5,444 | | | | 441,672 | |
Expeditors International of Washington Incorporated | | | | | | | | | | | 6,854 | | | | 523,440 | |
FedEx Corporation | | | | | | | | | | | 9,661 | | | | 1,261,340 | |
United Parcel Service Incorporated Class B | | | | | | | | | | | 28,204 | | | | 2,812,221 | |
| |
| | | | 5,038,673 | |
| | | | | | | | | | | | | | | | |
| | | | |
| Airlines: 0.18% | | | | | | | | | | | | |
Alaska Air Group Incorporated | | | | | | | | | | | 4,958 | | | | 169,514 | |
American Airlines Group Incorporated | | | | | | | | | | | 15,692 | | | | 164,766 | |
Delta Air Lines Incorporated | | | | | | | | | | | 23,167 | | | | 584,040 | |
Southwest Airlines Company | | | | | | | | | | | 21,202 | | | | 680,584 | |
United Airlines Holdings Incorporated † | | | | | | | | | | | 10,032 | | | | 281,297 | |
| |
| | | | 1,880,201 | |
| | | | | | | | | | | | | | | | |
| | | | |
| Building Products: 0.38% | | | | | | | | | | | | |
A.O. Smith Corporation | | | | | | | | | | | 5,516 | | | | 262,010 | |
Allegion plc | | | | | | | | | | | 3,740 | | | | 372,878 | |
Carrier Global Corporation † | | | | | | | | | | | 32,654 | | | | 668,427 | |
Fortune Brands Home & Security Incorporated | | | | | | | | | | | 5,601 | | | | 341,437 | |
Johnson Controls International plc | | | | | | | | | | | 31,049 | | | | 975,249 | |
Masco Corporation | | | | | | | | | | | 11,435 | | | �� | 533,443 | |
Trane Technologies plc | | | | | | | | | | | 9,643 | | | | 869,895 | |
| |
| | | | 4,023,339 | |
| | | | | | | | | | | | | | | | |
| | | | |
| Commercial Services & Supplies: 0.40% | | | | | | | | | | | | |
Cintas Corporation | | | | | | | | | | | 3,374 | | | | 836,617 | |
Copart Incorporated † | | | | | | | | | | | 8,233 | | | | 735,948 | |
Republic Services Incorporated | | | | | | | | | | | 8,478 | | | | 724,530 | |
Rollins Incorporated | | | | | | | | | | | 5,667 | | | | 236,881 | |
Waste Management Incorporated | | | | | | | | | | | 15,709 | | | | 1,676,936 | |
| |
| | | | 4,210,912 | |
| | | | | | | | | | | | | | | | |
| | | | |
| Construction & Engineering: 0.06% | | | | | | | | | | | | |
Jacobs Engineering Group Incorporated | | | | | | | | | | | 5,454 | | | | 458,245 | |
Quanta Services Incorporated | | | | | | | | | | | 5,727 | | | | 211,498 | |
| |
| | | | 669,743 | |
| | | | | | | | | | | | | | | | |
| | | | |
| Electrical Equipment: 0.45% | | | | | | | | | | | | |
AMETEK Incorporated | | | | | | | | | | | 9,201 | | | | 843,824 | |
Eaton Corporation plc | | | | | | | | | | | 16,639 | | | | 1,412,651 | |
Emerson Electric Company | | | | | | | | | | | 24,518 | | | | 1,496,088 | |
Rockwell Automation Incorporated | | | | | | | | | | | 4,651 | | | | 1,005,360 | |
| |
| | | | 4,757,923 | |
| | | | | | | | | | | | | | | | |
The accompanying notes are an integral part of these financial statements.
30 | Wells Fargo Index Portfolio
Portfolio of investments—May 31, 2020
| | | | | | | | | | | | | | | | |
| | | | | | | | | Shares | | | Value | |
| Industrial Conglomerates: 1.11% | | | | | | | | | | | | |
3M Company | | | | | | | | | | | 23,145 | | | $ | 3,620,804 | |
General Electric Company | | | | | | | | | | | 351,514 | | | | 2,309,447 | |
Honeywell International Incorporated | | | | | | | | | | | 28,759 | | | | 4,194,500 | |
Roper Technologies Incorporated | | | | | | | | | | | 4,188 | | | | 1,649,234 | |
| |
| | | | 11,773,985 | |
| | | | | | | | | | | | | | | | |
| | | | |
| Machinery: 1.43% | | | | | | | | | | | | |
Caterpillar Incorporated | | | | | | | | | | | 22,244 | | | | 2,672,172 | |
Cummins Incorporated | | | | | | | | | | | 6,166 | | | | 1,045,754 | |
Deere & Company | | | | | | | | | | | 12,673 | | | | 1,927,817 | |
Dover Corporation | | | | | | | | | | | 5,847 | | | | 568,621 | |
Flowserve Corporation | | | | | | | | | | | 5,267 | | | | 137,469 | |
Fortive Corporation | | | | | | | | | | | 11,894 | | | | 725,296 | |
IDEX Corporation | | | | | | | | | | | 3,061 | | | | 487,832 | |
Illinois Tool Works Incorporated | | | | | | | | | | | 11,772 | | | | 2,030,199 | |
Ingersoll Rand Incorporated † | | | | | | | | | | | 13,928 | | | | 392,770 | |
Otis Worldwide Corporation | | | | | | | | | | | 16,327 | | | | 859,617 | |
PACCAR Incorporated | | | | | | | | | | | 13,921 | | | | 1,028,205 | |
Parker-Hannifin Corporation | | | | | | | | | | | 5,171 | | | | 930,625 | |
Pentair plc | | | | | | | | | | | 6,766 | | | | 264,821 | |
Snap-on Incorporated | | | | | | | | | | | 2,207 | | | | 286,226 | |
Stanley Black & Decker Incorporated | | | | | | | | | | | 6,118 | | | | 767,503 | |
Wabtec Corporation | | | | | | | | | | | 7,329 | | | | 447,582 | |
Xylem Incorporated | | | | | | | | | | | 7,248 | | | | 480,832 | |
| |
| | | | 15,053,341 | |
| | | | | | | | | | | | | | | | |
| | | | |
| Professional Services: 0.33% | | | | | | | | | | | | |
Equifax Incorporated | | | | | | | | | | | 4,873 | | | | 748,298 | |
IHS Markit Limited | | | | | | | | | | | 16,139 | | | | 1,121,015 | |
Nielsen Holdings plc | | | | | | | | | | | 14,321 | | | | 198,919 | |
Robert Half International Incorporated | | | | | | | | | | | 4,732 | | | | 240,102 | |
Verisk Analytics Incorporated | | | | | | | | | | | 6,596 | | | | 1,138,997 | |
| |
| | | | 3,447,331 | |
| | | | | | | | | | | | | | | | |
| | | | |
| Road & Rail: 1.00% | | | | | | | | | | | | |
CSX Corporation | | | | | | | | | | | 31,299 | | | | 2,240,382 | |
J.B. Hunt Transport Services Incorporated | | | | | | | | | | | 3,432 | | | | 410,707 | |
Kansas City Southern | | | | | | | | | | | 3,989 | | | | 600,424 | |
Norfolk Southern Corporation | | | | | | | | | | | 10,495 | | | | 1,871,154 | |
Old Dominion Freight Line Incorporated | | | | | | | | | | | 3,855 | | | | 659,552 | |
Union Pacific Corporation | | | | | | | | | | | 27,941 | | | | 4,746,058 | |
| |
| | | | 10,528,277 | |
| | | | | | | | | | | | | | | | |
| | | | |
| Trading Companies & Distributors: 0.18% | | | | | | | | | | | | |
Fastenal Company | | | | | | | | | | | 23,084 | | | | 952,446 | |
United Rentals Incorporated † | | | | | | | | | | | 3,025 | | | | 420,142 | |
W.W. Grainger Incorporated | | | | | | | | | | | 1,756 | | | | 543,693 | |
| |
| | | | 1,916,281 | |
| | | | | | | | | | | | | | | | |
| | | | |
Information Technology: 25.29% | | | | | | | | | | | | | | | | |
| | | | |
| Communications Equipment: 0.98% | | | | | | | | | | | | |
Arista Networks Incorporated † | | | | | | | | | | | 2,183 | | | | 509,643 | |
Cisco Systems Incorporated | | | | | | | | | | | 170,745 | | | | 8,165,026 | |
F5 Networks Incorporated † | | | | | | | | | | | 2,447 | | | | 354,619 | |
The accompanying notes are an integral part of these financial statements.
Wells Fargo Index Portfolio | 31
Portfolio of investments—May 31, 2020
| | | | | | | | | | | | | | | | |
| | | | | | | | | Shares | | | Value | |
| | | | |
| Communications Equipment (continued) | | | | | | | | | | | | |
Juniper Networks Incorporated | | | | | | | | | | | 13,472 | | | $ | 326,831 | |
Motorola Solutions Incorporated | | | | | | | | | | | 6,896 | | | | 933,236 | |
| |
| | | | 10,289,355 | |
| | | | | | | | | | | | | | | | |
| | | | |
| Electronic Equipment, Instruments & Components: 0.52% | | | | | | | | | | | | |
Amphenol Corporation Class A | | | | | | | | | | | 11,933 | | | | 1,152,250 | |
CDW Corporation of Delaware | | | | | | | | | | | 5,783 | | | | 641,393 | |
Corning Incorporated | | | | | | | | | | | 30,956 | | | | 705,487 | |
FLIR Systems Incorporated | | | | | | | | | | | 5,399 | | | | 249,434 | |
IPG Photonics Corporation † | | | | | | | | | | | 1,431 | | | | 222,377 | |
Keysight Technologies Incorporated † | | | | | | | | | | | 7,550 | | | | 816,382 | |
TE Connectivity Limited | | | | | | | | | | | 13,462 | | | | 1,093,788 | |
Zebra Technologies Corporation Class A † | | | | | | | | | | | 2,170 | | | | 567,064 | |
| |
| | | | 5,448,175 | |
| | | | | | | | | | | | | | | | |
| | | | |
| IT Services: 5.59% | | | | | | | | | | | | |
Accenture plc Class A | | | | | | | | | | | 25,560 | | | | 5,153,407 | |
Akamai Technologies Incorporated † | | | | | | | | | | | 6,504 | | | | 688,123 | |
Alliance Data Systems Corporation | | | | | | | | | | | 1,650 | | | | 76,445 | |
Automatic Data Processing Incorporated | | | | | | | | | | | 17,416 | | | | 2,551,270 | |
Broadridge Financial Solutions Incorporated | | | | | | | | | | | 4,614 | | | | 558,755 | |
Cognizant Technology Solutions Corporation Class A | | | | | | | | | | | 22,039 | | | | 1,168,067 | |
DXC Technology Company | | | | | | | | | | | 10,304 | | | | 146,420 | |
Fidelity National Information Services Incorporated | | | | | | | | | | | 24,737 | | | | 3,434,238 | |
Fiserv Incorporated † | | | | | | | | | | | 22,986 | | | | 2,454,215 | |
FleetCor Technologies Incorporated † | | | | | | | | | | | 3,493 | | | | 851,558 | |
Gartner Incorporated † | | | | | | | | | | | 3,600 | | | | 438,120 | |
Global Payments Incorporated | | | | | | | | | | | 12,097 | | | | 2,171,291 | |
International Business Machines Corporation | | | | | | | | | | | 35,646 | | | | 4,452,185 | |
Jack Henry & Associates Incorporated | | | | | | | | | | | 3,097 | | | | 560,123 | |
Leidos Holdings Incorporated | | | | | | | | | | | 5,356 | | | | 563,933 | |
MasterCard Incorporated Class A | | | | | | | | | | | 35,730 | | | | 10,750,800 | |
Paychex Incorporated | | | | | | | | | | | 12,822 | | | | 926,774 | |
PayPal Holdings Incorporated † | | | | | | | | | | | 47,260 | | | | 7,325,773 | |
VeriSign Incorporated † | | | | | | | | | | | 4,158 | | | | 910,644 | |
Visa Incorporated Class A | | | | | | | | | | | 68,899 | | | | 13,451,841 | |
Western Union Company | | | | | | | | | | | 16,874 | | | | 337,817 | |
| |
| | | | 58,971,799 | |
| | | | | | | | | | | | | | | | |
| | | | |
| Semiconductors & Semiconductor Equipment: 4.06% | | | | | | | | | | | | |
Advanced Micro Devices Incorporated † | | | | | | | | | | | 47,077 | | | | 2,532,743 | |
Analog Devices Incorporated | | | | | | | | | | | 14,824 | | | | 1,674,371 | |
Applied Materials Incorporated | | | | | | | | | | | 37,180 | | | | 2,088,772 | |
Intel Corporation | | | | | | | | | | | 175,082 | | | | 11,017,910 | |
KLA-Tencor Corporation | | | | | | | | | | | 6,351 | | | | 1,117,522 | |
Lam Research Corporation | | | | | | | | | | | 5,839 | | | | 1,597,959 | |
Maxim Integrated Products Incorporated | | | | | | | | | | | 10,892 | | | | 628,251 | |
Microchip Technology Incorporated | | | | | | | | | | | 9,619 | | | | 923,616 | |
Micron Technology Incorporated † | | | | | | | | | | | 44,557 | | | | 2,134,726 | |
NVIDIA Corporation | | | | | | | | | | | 24,632 | | | | 8,744,853 | |
Qorvo Incorporated † | | | | | | | | | | | 4,676 | | | | 489,764 | |
QUALCOMM Incorporated | | | | | | | | | | | 45,958 | | | | 3,717,083 | |
Skyworks Solutions Incorporated | | | | | | | | | | | 6,857 | | | | 812,829 | |
Texas Instruments Incorporated | | | | | | | | | | | 37,623 | | | | 4,467,355 | |
Xilinx Incorporated | | | | | | | | | | | 10,121 | | | | 930,626 | |
| |
| | | | 42,878,380 | |
| | | | | | | | | | | | | | | | |
The accompanying notes are an integral part of these financial statements.
32 | Wells Fargo Index Portfolio
Portfolio of investments—May 31, 2020
| | | | | | | | | | | | | | | | |
| | | | | | | | | Shares | | | Value | |
| Software: 8.80% | | | | | | | | | | | | |
Adobe Incorporated † | | | | | | | | | | | 19,484 | | | $ | 7,532,514 | |
ANSYS Incorporated † | | | | | | | | | | | 3,445 | | | | 974,935 | |
Autodesk Incorporated † | | | | | | | | | | | 8,856 | | | | 1,863,125 | |
Broadcom Incorporated | | | | | | | | | | | 15,965 | | | | 4,650,126 | |
Cadence Design Systems Incorporated † | | | | | | | | | | | 11,293 | | | | 1,030,938 | |
Citrix Systems Incorporated | | | | | | | | | | | 4,629 | | | | 685,647 | |
Fortinet Incorporated † | | | | | | | | | | | 5,714 | | | | 795,389 | |
Intuit Incorporated | | | | | | | | | | | 10,477 | | | | 3,041,683 | |
Microsoft Corporation | | | | | | | | | | | 307,049 | | | | 56,266,729 | |
NortonLifeLock Incorporated | | | | | | | | | | | 23,078 | | | | 525,717 | |
Oracle Corporation | | | | | | | | | | | 87,197 | | | | 4,688,583 | |
Paycom Software Incorporated † | | | | | | | | | | | 1,974 | | | | 586,732 | |
Salesforce.com Incorporated † | | | | | | | | | | | 35,701 | | | | 6,240,178 | |
ServiceNow Incorporated † | | | | | | | | | | | 7,591 | | | | 2,944,777 | |
Synopsys Incorporated † | | | | | | | | | | | 6,051 | | | | 1,094,686 | |
| |
| | | | 92,921,759 | |
| | | | | | | | | | | | | | | | |
| | | | |
| Technology Hardware, Storage & Peripherals: 5.34% | | | | | | | | | | | | |
Apple Incorporated | | | | | | | | | | | 168,105 | | | | 53,447,304 | |
Hewlett Packard Enterprise Company | | | | | | | | | | | 52,082 | | | | 505,716 | |
HP Incorporated | | | | | | | | | | | 59,645 | | | | 903,025 | |
NetApp Incorporated | | | | | | | | | | | 9,186 | | | | 409,144 | |
Seagate Technology plc | | | | | | | | | | | 9,305 | | | | 493,537 | |
Western Digital Corporation | | | | | | | | | | | 11,970 | | | | 531,109 | |
Xerox Holdings Corporation | | | | | | | | | | | 7,483 | | | | 118,830 | |
| |
| | | | 56,408,665 | |
| | | | | | | | | | | | | | | | |
| | | | |
Materials: 2.45% | | | | | | | | | | | | | | | | |
| | | | |
| Chemicals: 1.75% | | | | | | | | | | | | |
Air Products & Chemicals Incorporated | | | | | | | | | | | 8,872 | | | | 2,143,919 | |
Albemarle Corporation | | | | | | | | | | | 4,268 | | | | 326,587 | |
Celanese Corporation Series A | | | | | | | | | | | 4,865 | | | | 437,412 | |
CF Industries Holdings Incorporated | | | | | | | | | | | 8,751 | | | | 257,017 | |
Corteva Incorporated | | | | | | | | | | | 30,122 | | | | 822,632 | |
Dow Incorporated | | | | | | | | | | | 29,844 | | | | 1,151,978 | |
DuPont de Nemours Incorporated | | | | | | | | | | | 29,816 | | | | 1,512,566 | |
Eastman Chemical Company | | | | | | | | | | | 5,473 | | | | 372,602 | |
Ecolab Incorporated | | | | | | | | | | | 10,093 | | | | 2,145,570 | |
FMC Corporation | | | | | | | | | | | 5,217 | | | | 513,405 | |
International Flavors & Fragrances Incorporated | | | | | | | | | | | 4,298 | | | | 572,451 | |
Linde plc | | | | | | | | | | | 21,621 | | | | 4,374,793 | |
LyondellBasell Industries NV Class A | | | | | | | | | | | 10,333 | | | | 658,832 | |
PPG Industries Incorporated | | | | | | | | | | | 9,517 | | | | 967,593 | |
The Mosaic Company | | | | | | | | | | | 14,073 | | | | 170,143 | |
The Sherwin-Williams Company | | | | | | | | | | | 3,307 | | | | 1,963,862 | |
| |
| | | | 18,391,362 | |
| | | | | | | | | | | | | | | | |
| | | | |
| Construction Materials: 0.10% | | | | | | | | | | | | |
Martin Marietta Materials Incorporated | | | | | | | | | | | 2,516 | | | | 483,298 | |
Vulcan Materials Company | | | | | | | | | | | 5,327 | | | | 577,021 | |
| |
| | | | 1,060,319 | |
| | | | | | | | | | | | | | | | |
| | | | |
| Containers & Packaging: 0.32% | | | | | | | | | | | | |
Amcor plc | | | | | | | | | | | 65,209 | | | | 665,784 | |
Avery Dennison Corporation | | | | | | | | | | | 3,361 | | | | 371,962 | |
The accompanying notes are an integral part of these financial statements.
Wells Fargo Index Portfolio | 33
Portfolio of investments—May 31, 2020
| | | | | | | | | | | | | | | | |
| | | | | | | | | Shares | | | Value | |
| | | | |
| Containers & Packaging (continued) | | | | | | | | | | | | |
Ball Corporation | | | | | | | | | | | 13,167 | | | $ | 938,280 | |
International Paper Company | | | | | | | | | | | 15,782 | | | | 537,377 | |
Packaging Corporation of America | | | | | | | | | | | 3,810 | | | | 386,372 | |
Sealed Air Corporation | | | | | | | | | | | 6,219 | | | | 199,630 | |
WestRock Company | | | | | | | | | | | 10,380 | | | | 291,263 | |
| |
| | | | 3,390,668 | |
| | | | | | | | | | | | | | | | |
| | | | |
| Metals & Mining: 0.28% | | | | | | | | | | | | |
Freeport-McMoRan Incorporated | | | | | | | | | | | 58,397 | | | | 529,661 | |
Newmont Goldcorp Corporation | | | | | | | | | | | 32,997 | | | | 1,929,335 | |
Nucor Corporation | | | | | | | | | | | 12,204 | | | | 515,741 | |
| |
| | | | 2,974,737 | |
| | | | | | | | | | | | | | | | |
|
Real Estate: 2.74% | |
| | | | |
| Equity REITs: 2.68% | | | | | | | | | | | | |
Alexandria Real Estate Equities Incorporated | | | | | | | | | | | 4,934 | | | | 758,454 | |
American Tower Corporation | | | | | | | | | | | 17,828 | | | | 4,602,655 | |
Apartment Investment & Management Company Class A | | | | | | | | | | | 5,992 | | | | 220,925 | |
AvalonBay Communities Incorporated | | | | | | | | | | | 5,621 | | | | 876,932 | |
Boston Properties Incorporated | | | | | | | | | | | 5,788 | | | | 497,652 | |
Crown Castle International Corporation | | | | | | | | | | | 16,734 | | | | 2,880,925 | |
Digital Realty Trust Incorporated | | | | | | | | | | | 10,580 | | | | 1,518,865 | |
Duke Realty Corporation | | | | | | | | | | | 14,794 | | | | 510,097 | |
Equinix Incorporated | | | | | | | | | | | 3,549 | | | | 2,475,889 | |
Equity Residential Company Limited | | | | | | | | | | | 14,050 | | | | 850,868 | |
Essex Property Trust Incorporated | | | | | | | | | | | 2,660 | | | | 645,768 | |
Extra Space Storage Incorporated | | | | | | | | | | | 5,213 | | | | 504,358 | |
Federal Realty Investment Trust | | | | | | | | | | | 2,827 | | | | 225,906 | |
Healthpeak Properties Incorporated | | | | | | | | | | | 19,921 | | | | 490,853 | |
Host Hotels & Resorts Incorporated | | | | | | | | | | | 28,865 | | | | 344,648 | |
Iron Mountain Incorporated | | | | | | | | | | | 11,557 | | | | 297,708 | |
Kimco Realty Corporation | | | | | | | | | | | 16,994 | | | | 188,803 | |
Mid-America Apartment Communities Incorporated | | | | | | | | | | | 4,591 | | | | 534,209 | |
Prologis Incorporated | | | | | | | | | | | 29,713 | | | | 2,718,740 | |
Public Storage Incorporated | | | | | | | | | | | 6,046 | | | | 1,225,766 | |
Realty Income Corporation | | | | | | | | | | | 13,793 | | | | 762,891 | |
Regency Centers Corporation | | | | | | | | | | | 6,744 | | | | 288,576 | |
SBA Communications Corporation | | | | | | | | | | | 4,532 | | | | 1,423,637 | |
Simon Property Group Incorporated | | | | | | | | | | | 12,351 | | | | 712,653 | |
SL Green Realty Corporation | | | | | | | | | | | 3,281 | | | | 138,196 | |
UDR Incorporated | | | | | | | | | | | 11,795 | | | | 436,179 | |
Ventas Incorporated | | | | | | | | | | | 15,002 | | | | 524,320 | |
Vornado Realty Trust | | | | | | | | | | | 6,376 | | | | 230,875 | |
Welltower Incorporated | | | | | | | | | | | 16,331 | | | | 827,492 | |
Weyerhaeuser Company | | | | | | | | | | | 29,991 | | | | 605,518 | |
| |
| | | | 28,320,358 | |
| | | | | | | | | | | | | | | | |
| | | | |
| Real Estate Management & Development: 0.06% | | | | | | | | | | | | |
CBRE Group Incorporated Class A † | | | | | | | | | | | 13,473 | | | | 592,543 | |
| | | | | | | | | | | | | | | | |
| | | | |
Utilities: 3.12% | | | | | | | | | | | | | | | | |
| | | | |
| Electric Utilities: 1.97% | | | | | | | | | | | | |
Alliant Energy Corporation | | | | | | | | | | | 9,674 | | | | 477,509 | |
American Electric Power Company Incorporated | | | | | | | | | | | 19,881 | | | | 1,694,855 | |
Duke Energy Corporation | | | | | | | | | | | 29,343 | | | | 2,512,641 | |
Edison International | | | | | | | | | | | 14,433 | | | | 838,702 | |
The accompanying notes are an integral part of these financial statements.
34 | Wells Fargo Index Portfolio
Portfolio of investments—May 31, 2020
| | | | | | | | | | | | | | | | |
| | | | | | | | | Shares | | | Value | |
| | | | |
| Electric Utilities (continued) | | | | | | | | | | | | |
Entergy Corporation | | | | | | | | | | | 8,014 | | | $ | 815,985 | |
Evergy Incorporated | | | | | | | | | | | 9,173 | | | | 565,882 | |
Eversource Energy | | | | | | | | | | | 13,031 | | | | 1,090,695 | |
Exelon Corporation | | | | | | | | | | | 39,126 | | | | 1,498,917 | |
FirstEnergy Corporation | | | | | | | | | | | 21,747 | | | | 919,028 | |
NextEra Energy Incorporated | | | | | | | | | | | 19,673 | | | | 5,027,632 | |
NRG Energy Incorporated | | | | | | | | | | | 10,126 | | | | 365,042 | |
Pinnacle West Capital Corporation | | | | | | | | | | | 4,524 | | | | 352,420 | |
PPL Corporation | | | | | | | | | | | 30,903 | | | | 863,430 | |
The Southern Company | | | | | | | | | | | 42,210 | | | | 2,408,925 | |
Xcel Energy Incorporated | | | | | | | | | | | 21,106 | | | | 1,372,523 | |
| |
| | | | 20,804,186 | |
| | | | | | | | | | | | | | | | |
| | | | |
| Gas Utilities: 0.05% | | | | | | | | | | | | |
Atmos Energy Corporation | | | | | | | | | | | 4,803 | | | | 493,652 | |
| | | | | | | | | | | | | | | | |
| | | | |
| Independent Power & Renewable Electricity Producers: 0.03% | | | | | | | | | | | | |
AES Corporation | | | | | | | | | | | 26,721 | | | | 333,745 | |
| | | | | | | | | | | | | | | | |
|
| Multi-Utilities: 0.98% | |
Ameren Corporation | | | | | | | | | | | 9,902 | | | | 739,976 | |
CenterPoint Energy Incorporated | | | | | | | | | | | 20,215 | | | | 359,423 | |
CMS Energy Corporation | | | | | | | | | | | 11,424 | | | | 669,218 | |
Consolidated Edison Incorporated | | | | | | | | | | | 13,380 | | | | 1,004,303 | |
Dominion Energy Incorporated | | | | | | | | | | | 33,128 | | | | 2,816,211 | |
DTE Energy Company | | | | | | | | | | | 7,732 | | | | 831,731 | |
NiSource Incorporated | | | | | | | | | | | 15,035 | | | | 358,284 | |
Public Service Enterprise Group Incorporated | | | | | | | | | | | 20,355 | | | | 1,038,919 | |
Sempra Energy | | | | | | | | | | | 11,346 | | | | 1,433,113 | |
WEC Energy Group Incorporated | | | | | | | | | | | 12,696 | | | | 1,164,604 | |
| |
| | | | 10,415,782 | |
| | | | | | | | | | | | | | | | |
| | | | |
| Water Utilities: 0.09% | | | | | | | | | | | | |
American Water Works Company Incorporated | | | | | | | | | | | 7,276 | | | | 924,052 | |
| | | | | | | | | | | | | | | | |
| |
Total Common Stocks (Cost $304,391,843) | | | | 1,018,549,518 | |
| | | | | | | | | | | | | | | | |
| | | | |
| | | | | | | | | | | | | | | | |
| | | Yield | | | | | | | | | | |
| Short-Term Investments: 3.23% | |
| | | | |
| Investment Companies: 2.86% | | | | | | | | | | | | |
Wells Fargo Government Money Market Fund Select Class (l)(u) | | | 0.12 | % | | | | | | | 30,205,942 | | | | 30,205,942 | |
| | | | | | | | | | | | | | | | |
| | | | |
| | | | | | | | | | | | | | | | |
| | | | | | Maturity
date | | | Principal | | | | |
| U.S. Treasury Securities: 0.37% | |
U.S. Treasury Bill (z)# | | | 0.10 | | | | 9-10-2020 | | | $ | 2,268,000 | | | | 2,267,364 | |
U.S. Treasury Bill (z)# | | | (0.08 | ) | | | 9-17-2020 | | | | 600,000 | | | | 599,703 | |
U.S. Treasury Bill (z)# | | | 0.11 | | | | 10-1-2020 | | | | 1,000,000 | | | | 999,627 | |
| |
| | | | 3,866,694 | |
| | | | | | | | | | | | | | | | |
| |
Total Short-Term Investments (Cost $34,073,084) | | | | 34,072,636 | |
| | | | | | | | | | | | | | | | |
| | | | | | | | |
| Total investments in securities (Cost $338,464,927) | | | 99.73 | % | | | 1,052,622,154 | |
| | |
Other assets and liabilities, net | | | 0.27 | | | | 2,883,114 | |
| | | | | | | | |
| Total net assets | | | 100.00 | % | | $ | 1,055,505,268 | |
| | | | | | | | |
The accompanying notes are an integral part of these financial statements.
Wells Fargo Index Portfolio | 35
Portfolio of investments—May 31, 2020
| † | Non-income-earning security |
| (l) | The issuer of the security is an affiliated person of the Portfolio as defined in the Investment Company Act of 1940. |
| (u) | The rate represents the 7-day annualized yield at period end. |
| (z) | Zero coupon security. The rate represents the current yield to maturity. |
| # | All or a portion of this security is segregated as collateral for investments in derivative instruments. |
Abbreviations:
| REIT | Real estate investment trust |
Futures Contracts
| | | | | | | | | | | | | | | | | | | | | | | | |
| Description | | Number of
contracts | | | Expiration
date | | | Notional
cost | | | Notional
value | | | Unrealized
gains | | | Unrealized
losses | |
| | | | | | |
Long | | | | | | | | | | | | | | | | | | | | | | | | |
| | | | | | |
S&P 500 E-Mini Index | | | 243 | | | | 6-19-2020 | | | $ | 36,294,629 | | | $ | 36,960,300 | | | $ | 665,671 | | | $ | 0 | |
Investments in Affiliates
An affiliated investment is an investment in which the Portfolio owns at least 5% of the outstanding voting shares of the issuer or as a result of other relationships, such as the Portfolio and the issuer having the same adviser or investment manager. Transactions with issuers that were either affiliated persons of the Portfolio at the beginning of the period or the end of the period were as follows:
| | | | | | | | | | | | | | | | | | | | | | | | | | | | | | | | | | | | |
| | | Shares,
beginning of
period | | | Shares
purchased | | | Shares
sold | | | Shares,
end of
period | | | Net
realized
gains
(losses) | | | Net
change in
unrealized
gains
(losses) | | | Income
from
affiliated
securities | | | Value,
end of period | | | % of
net
assets | |
| | | | | | | | | |
| Common Stocks | | | | | | | | | | | | | | | | | | | | | | | | | | | |
Financials | | | | | | | | | | | | | | | | | | | | | | | | | | | | | | | | | | | | |
Banks | | | | | | | | | | | | | | | | | | | | | | | | | | | | | | | | | | | | |
Wells Fargo & Company | | | 208,199 | | | | 0 | | | | (53,293 | ) | | | 154,906 | | | $ | 1,050,317 | | | $ | (3,726,054 | ) | | $ | 362,425 | | | $ | 4,100,362 | | | | 0.39 | % |
| | | | | | | | | |
| Short-Term Investments | | | | | | | | | | | | | | | | | | | | | | | | | | | |
Investment Companies | | | | | | | | | | | | | | | | | | | | | | | | | | | | | | | | | | | | |
Securities Lending Cash Investments LLC * | | | 3,129,501 | | | | 26,661,691 | | | | (29,791,192 | ) | | | 0 | | | | 403 | | | | (149 | ) | | | 24,296 | # | | | 0 | | | | | |
Wells Fargo Government Money Market Fund Select Class | | | 24,217,403 | | | | 305,422,280 | | | | (299,433,741 | ) | | | 30,205,942 | | | | 0 | | | | 0 | | | | 339,363 | | | | 30,205,942 | | | | | |
| | | | | | | | | | | | | | | | | | | | | | | | | | | | | | | 30,205,942 | | | | 2.86 | % |
| | | | | | | | | | | | | | | | | | | | | | | | | | | | | | | | | | | | |
| | | | | | | | | | | | | | | | | | $ | 1,050,720 | | | $ | (3,726,203 | ) | | $ | 726,084 | | | $ | 34,306,304 | | | | 3.25 | % |
| | | | | | | | | | | | | | | | | | | | | | | | | | | | | | | | | | | | |
| * | No longer held at the end of the period |
| # | Amount shown represents income before fees and rebates. |
The accompanying notes are an integral part of these financial statements.
36 | Wells Fargo Index Portfolio
Statement of assets and liabilities—May 31, 2020
| | | | |
| | | | |
| |
Assets | | | | |
Investments in unaffiliated securities, at value (cost $304,763,149) | | $ | 1,018,315,850 | |
Investments in affiliated securities, at value (cost $33,701,778) | | | 34,306,304 | |
Cash | | | 1,435,347 | |
Receivable for dividends | | | 1,857,733 | |
Receivable for daily variation margin on open futures contracts | | | 40,407 | |
Prepaid expenses and other assets | | | 150,671 | |
| | | | |
Total assets | | | 1,056,106,312 | |
| | | | |
| |
Liabilities | | | | |
Payable for investments purchased | | | 488,590 | |
Advisory fee payable | | | 85,369 | |
Trustees’ fees and expenses payable | | | 874 | |
Accrued expenses and other liabilities | | | 26,211 | |
| | | | |
Total liabilities | | | 601,044 | |
| | | | |
Total net assets | | $ | 1,055,505,268 | |
| | | | |
The accompanying notes are an integral part of these financial statements.
Wells Fargo Index Portfolio | 37
Statement of operations—year ended May 31, 2020
| | | | |
| | | | |
| |
Investment income | | | | |
Dividends (net of foreign withholding taxes of $720,213) | | $ | 21,332,539 | |
Income from affiliated securities | | | 706,190 | |
Interest | | | 30,366 | |
| | | | |
Total investment income | | | 22,069,095 | |
| | | | |
| |
Expenses | | | | |
Advisory fee | | | 1,110,898 | |
Custody and accounting fees | | | 105,914 | |
Professional fees | | | 60,391 | |
Shareholder report expenses | | | 7,083 | |
Trustees’ fees and expenses | | | 20,147 | |
Other fees and expenses | | | 45,958 | |
| | | | |
Net expenses | | | 1,350,391 | |
| | | | |
Net investment income | | | 20,718,704 | |
| | | | |
| |
Realized and unrealized gains (losses) on investments | | | | |
Net realized gains (losses) on | | | | |
Unaffiliated securities | | | 187,873,929 | |
Affiliated securities | | | 1,050,720 | |
Futures contracts | | | (1,706,067 | ) |
| | | | |
Net realized gains on investments | | | 187,218,582 | |
| | | | |
| |
Net change in unrealized gains (losses) on | | | | |
Unaffiliated securities | | | (65,011,989 | ) |
Affiliated securities | | | (3,726,203 | ) |
Futures contracts | | | 2,198,926 | |
| | | | |
Net change in unrealized gains (losses) on investments | | | (66,539,266 | ) |
| | | | |
Net realized and unrealized gains (losses) on investments | | | 120,679,316 | |
| | | | |
Net increase in net assets resulting from operations | | $ | 141,398,020 | |
| | | | |
The accompanying notes are an integral part of these financial statements.
38 | Wells Fargo Index Portfolio
Statement of changes in net assets
| | | | | | | | |
| | | Year ended
May 31, 2020 | | | Year ended
May 31, 2019 | |
| | |
Operations | | | | | | | | |
Net investment income | | $ | 20,718,704 | | | $ | 27,311,387 | |
Net realized gains on investments | | | 187,218,582 | | | | 316,337,562 | |
Net change in unrealized gains (losses) on investments | | | (66,539,266 | ) | | | (292,921,380 | ) |
| | | | |
Net increase in net assets resulting from operations | | | 141,398,020 | | | | 50,727,569 | |
| | | | |
| | |
Capital transactions | | | | | | | | |
Transactions in investors’ beneficial interests | | | | | | | | |
Contributions | | | 47,457,547 | | | | 3,884,910 | |
Withdrawals | | | (328,736,831 | ) | | | (513,193,862 | ) |
| | | | |
Net decrease in net assets resulting from capital transactions | | | (281,279,284 | ) | | | (509,308,952 | ) |
| | | | |
Total decrease in net assets | | | (139,881,264 | ) | | | (458,581,383 | ) |
| | | | |
| | |
Net assets | | | | | | | | |
Beginning of period | | | 1,195,386,532 | | | | 1,653,967,915 | |
| | | | |
End of period | | $ | 1,055,505,268 | | | $ | 1,195,386,532 | |
| | | | |
The accompanying notes are an integral part of these financial statements.
Wells Fargo Index Portfolio | 39
Financial highlights
| | | | | | | | | | | | | | | | | | | | |
| | | Year ended May 31 | |
| | | 2020 | | | 2019 | | | 2018 | | | 2017 | | | 2016 | |
Total return | | | 12.74 | % | | | 3.67 | % | | | 14.27 | % | | | 17.36 | % | | | 1.62 | % |
Ratios to average net assets (annualized) | | | | | | | | | | | | | | | | | | | | |
Gross expenses | | | 0.12 | % | | | 0.11 | % | | | 0.10 | % | | | 0.10 | % | | | 0.11 | % |
Net expenses | | | 0.12 | % | | | 0.11 | % | | | 0.10 | % | | | 0.10 | % | | | 0.10 | % |
Net investment income | | | 1.80 | % | | | 1.86 | % | | | 1.84 | % | | | 2.03 | % | | | 2.12 | % |
Supplemental data | | | | | | | | | | | | | | | | | | | | |
Portfolio turnover rate | | | 3 | % | | | 4 | % | | | 3 | % | | | 9 | % | | | 4 | % |
The accompanying notes are an integral part of these financial statements.
40 | Wells Fargo Index Portfolio
Notes to financial statements
1. ORGANIZATION
Wells Fargo Master Trust (the “Trust”), a Delaware statutory trust organized on March 10, 1999, is an open-end management investment company registered under the Investment Company Act of 1940, as amended (the “1940 Act”). As an investment company, the Trust follows the accounting and reporting guidance in Financial Accounting Standards Board (“FASB”) Accounting Standards Codification Topic 946, Financial Services – Investment Companies. These financial statements report on the Wells Fargo Index Portfolio (the “Portfolio”) which is a diversified series of the Trust.
2. SIGNIFICANT ACCOUNTING POLICIES
The following significant accounting policies, which are consistently followed in the preparation of the financial statements of the Portfolio, are in conformity with U.S. generally accepted accounting principles which require management to make estimates and assumptions that affect the reported amounts of assets and liabilities, disclosure of contingent assets and liabilities at the date of the financial statements, and the reported amounts of revenues and expenses during the reporting period. Actual results could differ from those estimates.
Securities valuation
All investments are valued each business day as of the close of regular trading on the New York Stock Exchange (generally 4 p.m. Eastern Time), although the Portfolio may deviate from this calculation time under unusual or unexpected circumstances
Equity securities and futures contracts that are listed on a foreign or domestic exchange or market are valued at the official closing price or, if none, the last sales price. If no sale occurs on the principal exchange or market that day, a fair value price will be determined in accordance with the Portfolio’s Valuation Procedures.
Debt securities are valued at the evaluated bid price provided by an independent pricing service (e.g. taking into account various factors, including yields, maturities, or credit ratings) or, if a reliable price is not available, the quoted bid price from an independent broker-dealer.
Investments in registered open-end investment companies are valued at net asset value. Interests in non-registered investment companies that are redeemable at net asset value are fair valued normally at net asset value.
Investments which are not valued using any of the methods discussed above are valued at their fair value, as determined in good faith by the Board of Trustees of the Portfolio. The Board of Trustees has established a Valuation Committee comprised of the Trustees and has delegated to it the authority to take any actions regarding the valuation of portfolio securities that the Valuation Committee deems necessary or appropriate, including determining the fair value of portfolio securities, unless the determination has been delegated to the Wells Fargo Asset Management Pricing Committee at Wells Fargo Funds Management, LLC (“Funds Management”). The Board of Trustees retains the authority to make or ratify any valuation decisions or approve any changes to the Valuation Procedures as it deems appropriate. On a quarterly basis, the Board of Trustees receives reports on any valuation actions taken by the Valuation Committee or the Wells Fargo Asset Management Pricing Committee which may include items for ratification.
Securities lending
The Portfolio may lend its securities from time to time in order to earn additional income in the form of fees or interest on securities received as collateral or the investment of any cash received as collateral. When securities are on loan, the Portfolio receives interest or dividends on those securities. Cash collateral received in connection with its securities lending transactions is invested in Securities Lending Cash Investments, LLC (the “Securities Lending Fund”). Investments in Securities Lending Fund are valued at the evaluated bid price provided by an independent pricing service. Income earned from investment in the Securities Lending Fund (net of fees and rebates), if any, is included in income from affiliated securities on the Statement of Operations.
In a securities lending transaction, the net asset value of the Portfolio is affected by an increase or decrease in the value of the securities loaned and by an increase or decrease in the value of the instrument in which collateral is invested. The amount of securities lending activity undertaken by the Portfolio fluctuates from time to time. The Portfolio has the right under the lending agreement to recover the securities from the borrower on demand. In the event of default or bankruptcy by the borrower, the Portfolio may be prevented from recovering the loaned securities or gaining access to the collateral or may experience delays or costs in doing so. In such an event, the terms of the agreement allow the unaffiliated securities lending agent to use the collateral to purchase replacement securities on behalf of the Portfolio or pay the Portfolio the market value of the loaned securities. The Portfolio bears the risk of loss with respect to depreciation of its investment of the cash collateral.
Futures contracts
Futures contracts are agreements between the Portfolio and a counterparty to buy or sell a specific amount of a commodity, financial instrument or currency at a specified price and on a specified date. The Portfolio may buy and sell futures contracts in
Wells Fargo Index Portfolio | 41
Notes to financial statements
order to gain exposure to, or protect against, changes in security values and is subject to equity price risk. The primary risks associated with the use of futures contracts are the imperfect correlation between changes in market values of securities held by the Portfolio and the prices of futures contracts, and the possibility of an illiquid market. Futures contracts are generally entered into on a regulated futures exchange and cleared through a clearinghouse associated with the exchange. With futures contracts, there is minimal counterparty risk to the Portfolio since futures contracts are exchange traded and the exchange’s clearinghouse, as the counterparty to all exchange traded futures, guarantees the futures contracts against default.
Upon entering into a futures contracts, the Portfolio is required to deposit either cash or securities (initial margin) with the broker in an amount equal to a certain percentage of the contract value. Subsequent payments (variation margin) are paid to or from the broker each day equal to the daily changes in the contract value. Such payments are recorded as unrealized gains or losses and, if any, shown as variation margin receivable (payable) in the Statement of Assets and Liabilities. Should the Portfolio fail to make requested variation margin payments, the broker can gain access to the initial margin to satisfy the Portfolio’s payment obligations. When the contracts are closed, a realized gain or loss is recorded in the Statement of Operations.
Security transactions and income recognition
Securities transactions are recorded on a trade date basis. Realized gains or losses are recorded on the basis of identified cost.
Dividend income is recognized on the ex-dividend date. Dividend income is recorded net of foreign taxes withheld where recovery of such taxes is not assured.
Interest income is accrued daily and bond discounts are accreted and premiums are amortized daily. To the extent debt obligations are placed on non-accrual status, any related interest income may be reduced by writing off interest receivables when the collection of all or a portion of interest has been determined to be doubtful based on consistently applied procedures and the fair value has decreased. If the issuer subsequently resumes interest payments or when the collectability of interest is reasonably assured, the debt obligation is removed from non-accrual status.
Federal and other taxes
The Portfolio is treated as a separate entity for federal income tax purposes. The Portfolio is not required to pay federal income taxes on its net investment income and net capital gains as it is treated as a partnership for federal income tax purposes. All interest, dividends, gains and losses of the Portfolio are deemed to have been “passed through” to the interest holders in proportion to their holdings of the Portfolio regardless of whether interest, dividends and gains have been distributed by the Portfolio.
The Portfolio’s income tax returns and all financial records supporting those returns for the prior three fiscal years are subject to examination by the federal revenue authority. Management has analyzed the Portfolio’s tax positions taken on federal, state, and foreign tax returns for all open tax years and does not believe that there are any uncertain tax positions that require recognition of a tax liability.
As of May 31, 2020, the aggregate cost of all investments for federal income tax purposes was $358,423,878 and the unrealized gains (losses) consisted of:
| | | | |
| |
Gross unrealized gains | | $ | 731,102,270 | |
| |
Gross unrealized losses | | | (36,238,323 | ) |
| |
Net unrealized gains | | $ | 694,863,947 | |
3. FAIR VALUATION MEASUREMENTS
Fair value measurements of investments are determined within a framework that has established a fair value hierarchy based upon the various data inputs utilized in determining the value of the Portfolio’s investments. The three-level hierarchy gives the highest priority to unadjusted quoted prices in active markets for identical assets or liabilities (Level 1) and the lowest priority to unobservable inputs (Level 3). The Portfolio’s investments are classified within the fair value hierarchy based on the lowest level of input that is significant to the fair value measurement. The inputs are summarized into three broad levels as follows:
| ∎ | | Level 1 – quoted prices in active markets for identical securities |
| ∎ | | Level 2 – other significant observable inputs (including quoted prices for similar securities, interest rates, prepayment speeds, credit risk, etc.) |
| ∎ | | Level 3 – significant unobservable inputs (including the Portfolio’s own assumptions in determining the fair value of investments) |
42 | Wells Fargo Index Portfolio
Notes to financial statements
The inputs or methodologies used for valuing investments in securities are not necessarily an indication of the risk associated with investing in those securities.
The following is a summary of the inputs used in valuing the Portfolio’s assets and liabilities as of May 31, 2020:
| | | | | | | | | | | | | | | | |
| | | | |
| | | Quoted prices (Level 1) | | | Other significant observable inputs (Level 2) | | | Significant unobservable inputs (Level 3) | | | Total | |
| | | |
Assets | | | | | | | | | | | | |
Investments in: | | | | | | | | | | | | |
| | | |
Common stocks | | | | | | | | | | | | |
| | | | |
Communication services | | $ | 111,727,330 | | | $ | 0 | | | $ | 0 | | | $ | 111,727,330 | |
| | | | |
Consumer discretionary | | | 107,283,166 | | | | 0 | | | | 0 | | | | 107,283,166 | |
| | | | |
Consumer staples | | | 72,639,114 | | | | 0 | | | | 0 | | | | 72,639,114 | |
| | | | |
Energy | | | 29,712,002 | | | | 0 | | | | 0 | | | | 29,712,002 | |
| | | | |
Financials | | | 106,328,469 | | | | 0 | | | | 0 | | | | 106,328,469 | |
| | | | |
Health care | | | 155,165,680 | | | | 0 | | | | 0 | | | | 155,165,680 | |
| | | | |
Industrials | | | 81,074,220 | | | | 0 | | | | 0 | | | | 81,074,220 | |
| | | | |
Information technology | | | 266,918,133 | | | | 0 | | | | 0 | | | | 266,918,133 | |
| | | | |
Materials | | | 25,817,086 | | | | 0 | | | | 0 | | | | 25,817,086 | |
| | | | |
Real estate | | | 28,912,901 | | | | 0 | | | | 0 | | | | 28,912,901 | |
| | | | |
Utilities | | | 32,971,417 | | | | 0 | | | | 0 | | | | 32,971,417 | |
| | | |
Short-term investments | | | | | | | | | | | | |
| | | | |
Investment companies | | | 30,205,942 | | | | 0 | | | | 0 | | | | 30,205,942 | |
| | | | |
U.S. Treasury securities | | | 3,866,694 | | | | 0 | | | | 0 | | | | 3,866,694 | |
| | | | |
| | | 1,052,622,154 | | | | 0 | | | | 0 | | | | 1,052,622,154 | |
| | | | |
Futures contracts | | | 665,671 | | | | 0 | | | | 0 | | | | 665,671 | |
| | | | |
Total assets | | $ | 1,053,287,825 | | | $ | 0 | | | $ | 0 | | | $ | 1,053,287,825 | |
Additional sector, industry or geographic detail is included in the Portfolio of Investments.
Futures contracts reported at their cumulative unrealized gains (losses) at measurement date as reported in the table following the Portfolio of Investments. For futures contracts, the current day’s variation margin is reported on the Statement of Assets and Liabilities. All other assets and liabilities are reported at their market value at measurement date.
For the year ended May 31, 2020, the Portfolio did not have any transfers into/out of Level 3.
4. TRANSACTIONS WITH AFFILIATES
Advisory fee
The Trust has entered into an advisory contract with Funds Management, an indirect wholly owned subsidiary of Wells Fargo & Company (“Wells Fargo”). The adviser is responsible for implementing investment policies and guidelines and for supervising the subadviser, who is responsible for day-to-day portfolio management of the Portfolio. Pursuant to the contract, Funds Management is entitled to receive an annual advisory fee at the following annual rate based on the Portfolio’s average daily net assets:
| | | | |
| |
| Average daily net assets | | Advisory fee | |
| |
First $500 million | | | 0.100 | % |
| |
Next $500 million | | | 0.100 | |
| |
Next $2 billion | | | 0.075 | |
| |
Next $2 billion | | | 0.075 | |
| |
Over $5 billion | | | 0.050 | |
For the year ended May 31, 2020, the management fee was equivalent to an annual rate of 0.10% of the Portfolio’s average daily net assets.
Wells Fargo Index Portfolio | 43
Notes to financial statements
Funds Management has retained the services of a subadviser to provide daily portfolio management to the Portfolio. The fee for subadvisory services is borne by Funds Management. Wells Capital Management Incorporated (“WellsCap”), an affiliate of Funds Management and an indirect wholly owned subsidiary of Wells Fargo, is the subadviser to the Portfolio and is entitled to receive a fee from Funds Management at an annual rate starting at 0.05% and declining to 0.02% as the average daily net assets of the Portfolio increase.
Interfund transactions
The Portfolio may purchase or sell portfolio investment securities to certain other Wells Fargo affiliates pursuant to Rule 17a-7 under the 1940 Act and under procedures adopted by the Board of Trustees. The procedures have been designed to ensure that these interfund transactions, which do not incur broker commissions, are effected at current market prices.
5. INVESTMENT PORTFOLIO TRANSACTIONS
Purchases and sales of investments, excluding U.S. government obligations (if any) and short-term securities, for the year ended May 31, 2020 were $38,488,002 and $300,781,398, respectively.
6. SECURITIES LENDING TRANSACTIONS
The Portfolio lends its securities through an unaffiliated securities lending agent and receives collateral in the form of cash or securities with a value at least equal to the value of the securities on loan. The value of the loaned securities is determined at the close of each business day and any increases or decreases in the required collateral are exchanged between the Portfolio and the counterparty on the next business day. Cash collateral received is invested in the Securities Lending Fund which seeks to provide a positive return compared to the daily Fed Funds Open Rate by investing in high-quality, U.S. dollar-denominated short-term money market instruments and is exempt from registration under Section 3(c)(7) of the 1940 Act. Securities Lending Fund is managed by Funds Management and is subadvised by WellsCap. Funds Management receives an advisory fee starting at 0.05% and declining to 0.01% as the average daily net assets of the Securities Lending Fund increase. All of the fees received by Funds Management are paid to WellsCap for its services as subadviser.
In the event of counterparty default or the failure of a borrower to return a loaned security, the Portfolio has the right to use the collateral to offset any losses incurred. As of May 31, 2020, the Portfolio did not have any securities on loan.
7. DERIVATIVE TRANSACTIONS
During the year ended May 31, 2020, the Portfolio entered into futures contracts to gain market exposure. The Portfolio had an average notional amount of $26,944,619 in long futures contracts during the year ended May 31, 2020.
The fair value, realized gains or losses and change in unrealized gains or losses, if any, on derivative instruments are reflected in the corresponding financial statement captions.
8. BANK BORROWINGS
The Trust, along with Wells Fargo Variable Trust and Wells Fargo Funds Trust (excluding the money market funds), are parties to a $280,000,000 revolving credit agreement whereby the Portfolio is permitted to use bank borrowings for temporary or emergency purposes, such as to fund shareholder redemption requests. Interest under the credit agreement is charged to the Portfolio based on a borrowing rate equal to the higher of the Federal Funds rate in effect on that day plus 1.25% or the overnight LIBOR rate in effect on that day plus 1.25%. In addition, an annual commitment fee equal to 0.25% of the unused balance is allocated to each participating fund.
For the year ended May 31, 2020, there were no borrowings by the Portfolio under the agreement.
9. CONCENTRATION RISK
Concentration risks result from exposure to a limited number of sectors. As of the end of the period, the Portfolio invested a concentration of its portfolio in the information technology sector. A portfolio that invests a substantial portion of its assets in any sector may be more affected by changes in that sector than would be a portfolio whose investments are not heavily weighted in any sector.
44 | Wells Fargo Index Portfolio
Notes to financial statements
10. INDEMNIFICATION
Under the Portfolio’s organizational documents, the officers and Trustees have been granted certain indemnification rights against certain liabilities that may arise out of performance of their duties to the Portfolio. The Portfolio has entered into a separate agreement with each Trustee that converts indemnification rights currently existing under the Portfolio’s organizational documents into contractual rights that cannot be changed in the future without the consent of the Trustee. Additionally, in the normal course of business, the Portfolio may enter into contracts with service providers that contain a variety of indemnification clauses. The Portfolio’s maximum exposure under these arrangements is dependent on future claims that may be made against the Portfolio and, therefore, cannot be estimated.
11. NEW ACCOUNTING PRONOUNCEMENT
In August 2018, FASB issued Accounting Standards Update (“ASU”) No. 2018-13, Fair Value Measurement (Topic 820) Disclosure Framework—Changes to the Disclosure Requirements for Fair Value Measurement. ASU 2018-13 updates the disclosure requirements for fair value measurements by modifying or removing certain disclosures and adding certain new disclosures. The amendments are effective for fiscal years, and interim periods within those fiscal years, beginning after December 15, 2019. Early adoption is permitted. Management has adopted the removal and modification of disclosures early, as permitted, and will adopt the additional new disclosures at the effective date.
12. CORONAVIRUS (COVID-19) PANDEMIC
On March 11, 2020, the World Health Organization announced that it had made the assessment that coronavirus disease 2019 (“COVID-19”) is a pandemic. The impacts of COVID-19 are adversely affecting the entire global economy, individual companies and investment products, and the market in general. There is significant uncertainty around the extent and duration of business disruptions related to COVID-19 and the impacts may be short term or may last for an extended period of time. The risk of further spreading of COVID-19 has led to significant uncertainty and volatility in the financial markets. The value of the Portfolio and the securities in which the Portfolio invests have generally been adversely affected by impacts caused by COVID-19.
Wells Fargo Index Portfolio | 45
Report of independent registered public accounting firm
TO THE INTEREST HOLDERS OF THE PORTFOLIO AND BOARD OF TRUSTEES WELLS FARGO MASTER TRUST:
Opinion on the Financial Statements
We have audited the accompanying statement of assets and liabilities of Wells Fargo Index Portfolio (the Portfolio), one of the portfolios constituting Wells Fargo Master Trust, including the portfolio of investments, as of May 31, 2020, the related statement of operations for the year then ended, the statements of changes in net assets for each of the years in the two-year period then ended, and the related notes (collectively, the financial statements) and the financial highlights for each of the years in the five-year period then ended. In our opinion, the financial statements and financial highlights present fairly, in all material respects, the financial position of the Portfolio as of May 31, 2020, the results of its operations for the year then ended, the changes in its net assets for each of the years in the two-year period then ended, and the financial highlights for each of the years in the five-year period then ended, in conformity with U.S. generally accepted accounting principles.
Basis for Opinion
These financial statements and financial highlights are the responsibility of the Portfolio’s management. Our responsibility is to express an opinion on these financial statements and financial highlights based on our audits. We are a public accounting firm registered with the Public Company Accounting Oversight Board (United States) (PCAOB) and are required to be independent with respect to the Portfolio in accordance with the U.S. federal securities laws and the applicable rules and regulations of the Securities and Exchange Commission and the PCAOB.
We conducted our audits in accordance with the standards of the PCAOB. Those standards require that we plan and perform the audit to obtain reasonable assurance about whether the financial statements and financial highlights are free of material misstatement, whether due to error or fraud. Our audits included performing procedures to assess the risks of material misstatement of the financial statements and financial highlights, whether due to error or fraud, and performing procedures that respond to those risks. Such procedures included examining, on a test basis, evidence regarding the amounts and disclosures in the financial statements and financial highlights. Such procedures also included confirmation of securities owned as of May 31, 2020, by correspondence with the custodian, transfer agent and brokers, or by other appropriate auditing procedures. Our audits also included evaluating the accounting principles used and significant estimates made by management, as well as evaluating the overall presentation of the financial statements and financial highlights. We believe that our audits provide a reasonable basis for our opinion.
We have not been able to determine the specific year that we began serving as the auditor of one or more Wells Fargo Funds investment companies; however we are aware that we have served as the auditor of one or more Wells Fargo Funds investment companies since at least 1955.
Boston, Massachusetts
July 29, 2020
46 | Wells Fargo Index Portfolio
Other information (unaudited)
TAX INFORMATION
For corporate shareholders, pursuant to Section 854 of the Internal Revenue Code, 100% of ordinary income dividends qualify for the corporate dividends-received deduction for the fiscal year ended May 31, 2020.
Pursuant to Section 852 of the Internal Revenue Code, $291,185,256 was designated as a 20% rate gain distribution for the fiscal year ended May 31, 2020.
Pursuant to Section 854 of the Internal Revenue Code, $19,604,325 of income dividends paid during the fiscal year ended May 31, 2020 has been designated as qualified dividend income (QDI).
For the fiscal year ended May 31, 2020, $366,116 has been designated as interest-related dividends for nonresident alien shareholders pursuant to Section 871 of the Internal Revenue Code.
For the fiscal year ended May 31, 2020, $498,152 has been designated as short-term capital gain dividends for nonresident alien shareholders pursuant to Section 871 of the Internal Revenue Code.
PROXY VOTING INFORMATION
A description of the policies and procedures used to determine how to vote proxies relating to portfolio securities is available, upon request, by calling 1-800-222-8222, visiting our website at wfam.com, or visiting the SEC website at sec.gov. Information regarding how the proxies related to portfolio securities were voted during the most recent 12-month period ended June 30 is available on the website at wfam.com or by visiting the SEC website at sec.gov.
QUARTERLY PORTFOLIO HOLDINGS INFORMATION
The Fund and Portfolio file their complete schedule of portfolio holdings with the SEC for the first and third quarters of each fiscal year as an exhibit to its reports on Form N-PORT. Shareholders may view the filed Form N-PORT by visiting the SEC website at sec.gov.
Wells Fargo Index Fund | 47
Other information (unaudited)
BOARD OF TRUSTEES AND OFFICERS
Each of the Trustees and Officers1 listed in the table below acts in identical capacities for each fund in the Wells Fargo family of funds, which consists of 147 mutual funds comprising the Wells Fargo Funds Trust, Wells Fargo Variable Trust, Wells Fargo Master Trust and four closed-end funds (collectively the “Fund Complex”). This table should be read in conjunction with the Prospectus and the Statement of Additional Information2. The mailing address of each Trustee and Officer is 525 Market Street, 12th Floor, San Francisco, CA 94105. Each Trustee and Officer serves an indefinite term, however, each Trustee serves such term until reaching the mandatory retirement age established by the Trustees.
Independent Trustees
| | | | | | |
Name and year of birth | | Position held and
length of service* | | Principal occupations during past five years or longer | | Current other
public company or
investment
company
directorships |
| | | |
William R. Ebsworth (Born 1957) | | Trustee, since 2015 | | Retired. From 1984 to 2013, equities analyst, portfolio manager, research director and chief investment officer at Fidelity Management and Research Company in Boston, Tokyo, and Hong Kong, and retired in 2013 as Chief Investment Officer of Fidelity Strategic Advisers, Inc. where he led a team of investment professionals managing client assets. Prior thereto, Board member of Hong Kong Securities Clearing Co., Hong Kong Options Clearing Corp., the Thailand International Fund, Ltd., Fidelity Investments Life Insurance Company, and Empire Fidelity Investments Life Insurance Company. Audit Committee Chair and Investment Committee Chair of the Vincent Memorial Hospital Endowment (non-profit organization). Mr. Ebsworth is a CFA® charterholder. | | N/A |
| | | |
Jane A. Freeman (Born 1953) | | Trustee, since 2015; Chair Liaison, since 2018 | | Retired. From 2012 to 2014 and 1999 to 2008, Chief Financial Officer of Scientific Learning Corporation. From 2008 to 2012, Ms. Freeman provided consulting services related to strategic business projects. Prior to 1999, Portfolio Manager at Rockefeller & Co. and Scudder, Stevens & Clark. Board member of the Harding Loevner Funds from 1996 to 2014, serving as both Lead Independent Director and chair of the Audit Committee. Board member of the Russell Exchange Traded Funds Trust from 2011 to 2012 and the chair of the Audit Committee. Ms. Freeman is also an inactive Chartered Financial Analyst. | | N/A |
| | | |
Isaiah Harris, Jr. (Born 1952) | | Trustee, since 2009; Audit Committee Chairman, since 2019 | | Retired. Chairman of the Board of CIGNA Corporation since 2009, and Director since 2005. From 2003 to 2011, Director of Deluxe Corporation. Prior thereto, President and CEO of BellSouth Advertising and Publishing Corp. from 2005 to 2007, President and CEO of BellSouth Enterprises from 2004 to 2005 and President of BellSouth Consumer Services from 2000 to 2003. Emeritus member of the Iowa State University Foundation Board of Governors. Emeritus Member of the Advisory Board of Iowa State University School of Business. Advisory Board Member, Palm Harbor Academy (private school). Advisory Board Member, Child Evangelism Fellowship (non-profit). Mr. Harris is a certified public accountant (inactive status). | | CIGNA Corporation |
| | | |
Judith M. Johnson (Born 1949) | | Trustee, since 2008; Audit Committee Chairman, from 2009 to 2018 | | Retired. Prior thereto, Chief Executive Officer and Chief Investment Officer of Minneapolis Employees Retirement Fund from 1996 to 2008. Ms. Johnson is an attorney, certified public accountant and a certified managerial accountant. | | N/A |
48 | Wells Fargo Index Fund
Other information (unaudited)
| | | | | | |
Name and year of birth | | Position held and
length of service* | | Principal occupations during past five years or longer | | Current other
public company or
investment
company
directorships |
| | | |
David F. Larcker (Born 1950) | | Trustee, since 2009 | | James Irvin Miller Professor of Accounting at the Graduate School of Business, Stanford University, Director of the Corporate Governance Research Initiative and Senior Faculty of The Rock Center for Corporate Governance since 2006. From 2005 to 2008, Professor of Accounting at the Graduate School of Business, Stanford University. Prior thereto, Ernst & Young Professor of Accounting at The Wharton School, University of Pennsylvania from 1985 to 2005. | | N/A |
| | | |
Olivia S. Mitchell (Born 1953) | | Trustee, since 2006; Nominating and Governance Committee Chair, since 2018 | | International Foundation of Employee Benefit Plans Professor, Wharton School of the University of Pennsylvania since 1993. Director of Wharton’s Pension Research Council and Boettner Center on Pensions & Retirement Research, and Research Associate at the National Bureau of Economic Research. Previously, Cornell University Professor from 1978 to 1993. | | N/A |
| | | |
Timothy J. Penny (Born 1951) | | Trustee, since 1996; Chairman, since 2018 | | President and Chief Executive Officer of Southern Minnesota Initiative Foundation, a non-profit organization, since 2007. Member of the Board of Trustees of NorthStar Education Finance, Inc., a non-profit organization, since 2007. | | N/A |
| | | |
James G. Polisson (Born 1959) | | Trustee, since 2018 | | Retired. Chief Marketing Officer, Source (ETF) UK Services, Ltd, from 2015 to 2017. From 2012 to 2015, Principal of The Polisson Group, LLC, a management consulting, corporate advisory and principal investing company. Chief Executive Officer and Managing Director at Russell Investments, Global Exchange Traded Funds from 2010 to 2012. Managing Director of Barclays Global Investors from 1998 to 2010 and Global Chief Marketing Officer for iShares and Barclays Global Investors from 2000 to 2010. Trustee of the San Francisco Mechanics’ Institute, a non-profit organization, from 2013 to 2015. Board member of the Russell Exchange Traded Fund Trust from 2011 to 2012. Director of Barclays Global Investors Holdings Deutschland GmbH from 2006 to 2009. Mr. Polisson is an attorney and has a retired status with the Massachusetts and District of Columbia Bar Associations. | | N/A |
| | | |
Pamela Wheelock (Born 1959) | | Trustee, since January 2020; previously Trustee from January 2018 to July 2019 | | Board member of the Destination Medical Center Economic Development Agency, Rochester, Minnesota since 2019 and Interim President of the McKnight Foundation since 2020. Acting Commissioner, Minnesota Department of Human Services, July 2019 through September 2019. Human Services Manager (part-time), Minnesota Department of Human Services, October 2019 through December 2019. Chief Operating Officer, Twin Cities Habitat for Humanity from 2017 to 2019. Vice President of University Services, University of Minnesota from 2012 to 2016. Prior thereto, on the Board of Directors, Governance Committee and Finance Committee for the Minnesota Philanthropy Partners (Saint Paul Foundation) from 2012 to 2018, Interim Chief Executive Officer of Blue Cross Blue Shield of Minnesota from 2011 to 2012, Chairman of the Board from 2009 to 2012 and Board Director from 2003 to 2015. Vice President, Leadership and Community Engagement, Bush Foundation, Saint Paul, Minnesota (a private foundation) from 2009 to 2011. Executive Vice President and Chief Financial Officer, Minnesota Sports and Entertainment from 2004 to 2009 and Senior Vice President from 2002 to 2004. Executive Vice President of the Minnesota Wild Foundation from 2004 to 2008. Commissioner of Finance, State of Minnesota, from 1999 to 2002. Currently Board Chair of the Minnesota Wild Foundation since 2010. | | N/A |
| * | Length of service dates reflect the Trustee’s commencement of service with the Trust’s predecessor entities, where applicable. |
Wells Fargo Index Fund | 49
Other information (unaudited)
Officers
| | | | |
Name and year of birth | | Position held and
length of service | | Principal occupations during past five years or longer |
| | |
Andrew Owen (Born 1960) | | President, since 2017 | | Executive Vice President of Wells Fargo & Company and Head of Affiliated Managers, Wells Fargo Asset Management, since 2014. In addition, Mr. Owen is currently President, Chief Executive Officer and Director of Wells Fargo Funds Management, LLC since 2017. Prior thereto, Executive Vice President responsible for marketing, investments and product development for Wells Fargo Funds Management, LLC, from 2009 to 2014. |
| | |
Nancy Wiser1 (Born 1967) | | Treasurer, since 2012 | | Executive Vice President of Wells Fargo Funds Management, LLC since 2011. Chief Operating Officer and Chief Compliance Officer at LightBox Capital Management LLC, from 2008 to 2011. |
| | |
Michelle Rhee (Born 1966) | | Chief Legal Officer, since 2019 | | Secretary of Wells Fargo Funds Management, LLC, Chief Legal Counsel of Wells Fargo Asset Management and Assistant General Counsel of Wells Fargo Bank, N.A. since 2018. Associate General Counsel and Managing Director of Bank of America Corporation from 2004 to 2018. |
| | |
Catherine Kennedy (Born 1969) | | Secretary, since 2019 | | Vice President of Wells Fargo Funds Management, LLC and Senior Counsel of the Wells Fargo Legal Department since 2010. Vice President and Senior Counsel of Evergreen Investment Management Company, LLC from 1998 to 2010. |
| | |
Michael H. Whitaker (Born 1967) | | Chief Compliance Officer, since 2016 | | Chief Compliance Officer of Wells Fargo Asset Management since 2016. Senior Vice President and Chief Compliance Officer for Fidelity Investments from 2007 to 2016. |
| | |
David Berardi (Born 1975) | | Assistant Treasurer, since 2009 | | Vice President of Wells Fargo Funds Management, LLC since 2009. Vice President of Evergreen Investment Management Company, LLC from 2008 to 2010. Manager of Fund Reporting and Control for Evergreen Investment Management Company, LLC from 2004 to 2010. |
| | |
Jeremy DePalma1 (Born 1974) | | Treasurer, since 2012 | | Senior Vice President of Wells Fargo Funds Management, LLC since 2009. Senior Vice President of Evergreen Investment Management Company, LLC from 2008 to 2010 and head of the Fund Reporting and Control Team within Fund Administration from 2005 to 2010. |
| 1 | Nancy Wiser acts as Treasurer of 65 funds in the Fund Complex. Jeremy DePalma acts as the Treasurer of 82 funds in the Fund Complex. |
| 2 | The Statement of Additional Information includes additional information about the Trustees and is available, without charge, upon request, by calling 1-800-222-8222 or by visiting the website at wfam.com. |
50 | Wells Fargo Index Fund
Other information (unaudited)
BOARD CONSIDERATION OF INVESTMENT MANAGEMENT, ADVISORY AND SUB-ADVISORY AGREEMENTS:
Wells Fargo Index Fund and Wells Fargo Index Portfolio
Under the Investment Company Act of 1940 (the “1940 Act”), the Board of Trustees (each, a “Board” and collectively, the “Boards”) of each of Wells Fargo Funds Trust (“Funds Trust”) and Wells Fargo Master Trust (“Master Trust”, and collectively, the “Trusts”) must determine annually whether to approve the continuation of the Trusts’ investment management, advisory and sub-advisory agreements, as applicable. In this regard, at a Board meeting held on May 26, 2020 and May 28, 2020 (together, the “Meeting”), the Funds Trust Board, all the members of which have no direct or indirect interest in the investment management agreement and are not “interested persons” of the Trusts, as defined in the 1940 Act (the “Independent Trustees”), reviewed and approved for Wells Fargo Index Fund (the “Gateway Fund”) an investment management agreement (the “Gateway Fund Management Agreement”) with Wells Fargo Funds Management, LLC (“Funds Management”).
At the Meeting, the Master Trust Board, all the members of which have no direct or indirect interest in the investment advisory and sub-advisory agreements and are Independent Trustees, reviewed and approved: (i) an investment advisory agreement (the “Master Portfolio Advisory Agreement”) with Funds Management for Wells Fargo Index Portfolio, a portfolio of Master Trust (the “Master Portfolio”); and (ii) an investment sub-advisory agreement (the “Sub-Advisory Agreement”) with Wells Capital Management Incorporated (the “Sub-Adviser”), an affiliate of Funds Management, for the Master Portfolio.
The Gateway Fund and the Master Portfolio are collectively referred to as the “Funds.” The Gateway Fund Management Agreement, the Master Portfolio Advisory Agreement and the Sub-Advisory Agreement are collectively referred to as the “Advisory Agreements.”
The Gateway Fund is a gateway feeder fund that invest substantially all of its assets in the Master Portfolio. The Master Portfolio has a substantially similar investment objective and substantially similar investment strategies to the Gateway Fund. Information provided to the Boards regarding the Gateway Fund is also applicable to the Master Portfolio, as relevant.
At the Meeting, the Boards considered the factors and reached the conclusions described below relating to the selection of Funds Management and the Sub-Adviser and the approval of the Advisory Agreements. Prior to the Meeting, including at a Board meeting held in April 2020, the Trustees conferred extensively among themselves and with representatives of Funds Management about these matters. Also, the Boards have adopted a team-based approach, with each team consisting of a sub-set of Trustees, to assist the full Boards in the discharge of their duties in reviewing investment performance and other matters throughout the year. The Independent Trustees were assisted in their evaluation of the Advisory Agreements by independent legal counsel, from whom they received separate legal advice and with whom they met separately.
In providing information to the Boards, Funds Management and the Sub-Adviser were guided by a detailed set of requests for information submitted to them by independent legal counsel on behalf of the Independent Trustees at the start of the Boards’ annual contract renewal process earlier in 2020. In considering and approving the Advisory Agreements, the Trustees considered the information they believed relevant, including but not limited to the information discussed below. The Boards considered not only the specific information presented in connection with the Meeting, but also the knowledge gained over time through interaction with Funds Management and the Sub-Adviser about various topics. In this regard, the Boards reviewed reports of Funds Management at each of their quarterly meetings, which included, among other things, portfolio reviews and investment performance reports. In addition, the Boards and the teams mentioned above confer with portfolio managers at various times throughout the year. The Boards did not identify any particular information or consideration that was all-important or controlling, and each individual Trustee may have attributed different weights to various factors.
After its deliberations, the Funds Trust Board unanimously approved the continuation of the Gateway Fund Management Agreement for a one-year period. Additionally, after its deliberations, the Master Trust Board unanimously approved the continuation of the Master Portfolio Advisory Agreement and the Sub-Advisory Agreement, each for a one-year term. The Boards also determined that the compensation payable to Funds Management and the Sub-Adviser was reasonable. The Boards considered the approval of the Advisory Agreements for the Funds as part of their consideration of agreements for funds across the complex, but their approvals were made on a fund-by-fund basis. The following summarizes a number of important, but not necessarily all, factors considered by the Boards in support of their approvals.
Nature, extent and quality of services
The Boards received and considered various information regarding the nature, extent and quality of services provided to the Funds by Funds Management and the Sub-Adviser under the Advisory Agreements. This information included a description of the investment advisory services and Fund-level administrative services, as well as, among other things, a summary of the background and experience of senior management of Wells Fargo Asset Management (“WFAM”), of which Funds Management
Wells Fargo Index Fund | 51
Other information (unaudited)
and the Sub-Adviser are a part, and a summary of investments made in the business of WFAM. The Boards also received a description of Funds Management’s and the Sub-Adviser’s business continuity plans and of their approaches to data privacy and cybersecurity, and related testing. The Boards also received and reviewed information about Funds Management’s role as administrator of the Funds’ liquidity risk management program, Funds Management’s approach to risk management, and Funds Management’s intermediary and vendor oversight program. The Boards also considered the qualifications, background, tenure and responsibilities of each of the portfolio managers primarily responsible for the day-to-day portfolio management of the Funds.
The Boards evaluated the ability of Funds Management and the Sub-Adviser to attract and retain qualified investment professionals, including research, advisory and supervisory personnel. The Boards further considered the compliance programs and compliance records of Funds Management and the Sub-Adviser. In addition, the Boards took into account the full range of services provided to the Funds by Funds Management and its affiliates.
Fund investment performance and expenses
The Boards considered the investment performance results for each of the Funds over various time periods ended December 31, 2019. The Board also considered more current results for various time periods ended March 31, 2020. The Boards considered these results in comparison to the investment performance of funds in a universe that was determined by Broadridge Inc. (“Broadridge”) to be similar to the Gateway Fund (the “Universe”), and in comparison to the Gateway Fund’s benchmark index and to other comparative data. Broadridge is an independent provider of investment company data. The Boards received a description of the methodology used by Broadridge to select the mutual funds in the performance Universe. The Funds Trust Board noted that the investment performance of the Gateway Fund (Administrator Class) was higher than the average investment performance of its Universe for the one-, three-, five- and ten-year periods ended December 31, 2019. The Funds Trust Board also noted that the investment performance of the Gateway Fund (Administrator Class) was higher than or in range of the average investment performance of its Universe for all periods ended March 31, 2020. The Funds Trust Board also noted that the investment performance of the Gateway Fund was in range of its benchmark, the S&P 500 Index, for all periods ended December 31, 2019. The Funds Trust Board also noted that the investment performance of the Gateway Fund was in range of its benchmark, the S&P 500 Index, for all periods ended March 31, 2020.
The Master Trust Board took note of the investment performance of the Master Portfolio in the context of reviewing the investment performance of the Gateway Fund.
The Funds Trust Board also received and considered information regarding the Gateway Fund’s net operating expense ratios, which include fees and expenses of the Master Portfolio, and their various components, including actual management fees assessed at the Gateway Fund and Master Portfolio levels, custodian and other non-management fees, and Rule 12b-1 and non-Rule 12b-1 shareholder service fees. The Funds Trust Board considered these ratios in comparison to the median ratios of funds in class-specific expense groups that were determined by Broadridge to be similar to the Gateway Fund (the “Groups”). The Funds Trust Board received a description of the methodology used by Broadridge to select the mutual funds in the expense Groups and an explanation of how funds comprising expense groups and their expense ratios may vary from year-to-year. Based on the Broadridge reports, the Funds Trust Board noted that the net operating expense ratios of the Gateway Fund were lower than the median net operating expense ratios of its expense Groups for each share class.
With respect to the Master Portfolio, the Master Trust Board reviewed the fee rates that are payable to Funds Management for investment advisory services (as discussed below), which are the only fees charged at the Master Portfolio level, relative to a corresponding expense Group.
The Boards took into account the Funds’ investment performance and expense information provided to them among the factors considered in deciding to re-approve the Advisory Agreements.
Investment management, advisory and sub-advisory fee rates
The Funds Trust Board noted that Funds Management receives no advisory fees from the Gateway Fund as long as the Gateway Fund continues to invest all (or substantially all) of its assets in a single master portfolio. If the Gateway Fund were to change its investment structure so that it began investing in two or more master portfolios (a fund-of-funds), Funds Management would be entitled to receive an annual fee of 0.25% of the Gateway Fund’s average daily net assets for providing investment advisory services to the Gateway Fund, including allocating the Gateway Fund’s assets to the Master Portfolio.
The Funds Trust Board reviewed and considered the contractual fee rates that are payable by the Gateway Fund to Funds Management under the Gateway Fund Management Agreement for management services (other than investment advisory services), as well as the contractual fee rates payable by the Gateway Fund to Funds Management for class-level administrative services under a Class-Level Administration Agreement, which include, among other things, class-level transfer agency and sub-transfer agency costs (collectively, the “Management Rates”).
52 | Wells Fargo Index Fund
Other information (unaudited)
The Master Trust Board reviewed and considered the contractual investment advisory fee rate that is payable by the Master Portfolio to Funds Management for investment advisory services under the Master Portfolio Advisory Agreement (the “Advisory Agreement Rate”). The Master Trust Board also reviewed and considered the contractual investment sub-advisory fee rate that is payable by Funds Management to the Sub-Adviser for investment sub-advisory services (the “Sub-Advisory Agreement Rate”).
Among other information reviewed by the Funds Trust Board was a comparison of the Gateway Fund’s Management Rate, which, for this purpose, includes the advisory fees paid at the Master Portfolio level, with the average contractual investment management fee rates of funds in the expense Groups at a common asset level as well as transfer agency costs of the funds in the expense Groups. The Funds Trust Board noted that the Management Rates of the Gateway Fund were in range of the sum of these average rates for the Gateway Fund’s expense Groups for Administrator Class, and higher than the sum of these average rates for the Gateway Fund’s expense Groups for Class A.
The Master Trust Board reviewed a comparison of the Advisory Agreement Rate of the Master Portfolio with those of other funds in the Master Portfolio’s expense Group at a common asset level. The Master Trust Board noted that the Advisory Agreement Rate of the Master Portfolio was equal to the median rate for the Master Portfolio’s expense Group.
The Master Trust Board also received and considered information about the portions of the total management fees that were retained by Funds Management after payment of the fees to the Sub-Adviser for sub-advisory services. In assessing the reasonableness of these amounts, the Master Trust Board received and evaluated information about the nature and extent of responsibilities retained and risks assumed by Funds Management and not delegated to or assumed by the Sub-Adviser, and about Funds Management’s on-going oversight services. Given the affiliation between Funds Management and the Sub-Adviser, the Master Trust Board ascribed limited relevance to the allocation of fees between them.
The Boards also received and considered information about the nature and extent of services offered and fee rates charged by Funds Management and the Sub-Adviser to other types of clients with investment strategies similar to those of the Funds. In this regard, the Boards received information about the significantly greater scope of services, and compliance, reporting and other legal burdens and risks of managing proprietary mutual funds compared with those associated with managing assets of other types of clients, including third-party sub-advised fund clients and non-mutual fund clients such as institutional separate accounts.
Based on its consideration of the factors and information it deemed relevant, including those described here, the Funds Trust Board determined that the compensation payable to Funds Management under the Gateway Fund Management Agreement was reasonable, and the Master Trust Board determined that the compensation payable to Funds Management under the Master Portfolio Advisory Agreement and to the Sub-Adviser under the Sub-Advisory Agreement was reasonable.
Profitability
The Boards received and considered information concerning the profitability of Funds Management, as well as the profitability of both WFAM and Wells Fargo & Co. (“Wells Fargo”) from providing services to the fund family as a whole. The Boards noted that the Sub-Adviser’s profitability information with respect to providing services to the Master Portfolio and other funds in the family was subsumed in the WFAM and Wells Fargo profitability analysis.
Funds Management reported on the methodologies and estimates used in calculating profitability, including a description of the methodology used to allocate certain expenses. Among other things, the Boards noted that the levels of profitability reported on a fund-by-fund basis varied widely, depending on factors such as the size, type and age of fund. Based on its review, the Boards did not deem the profits reported by Funds Management, WFAM or Wells Fargo from services provided to the Funds to be at a level that would prevent the Boards from approving the continuation of the Advisory Agreements.
Economies of scale
The Boards received and considered information about the potential for Funds Management to experience economies of scale in the provision of management services to the Funds, the difficulties of calculating economies of scale at an individual fund level, and the extent to which potential scale benefits are shared with shareholders. The Boards noted the existence of breakpoints in the Master Portfolio’s advisory fee structure and the Gateway Fund’s management fee structure, which operate generally to reduce the Funds’ expense ratios as the Funds grow in size, and the size of the Master Portfolio and the Gateway Fund, respectively, in relation to such breakpoints. The Boards considered that, in addition to advisory fee and management fee breakpoints, Funds Management shares potential economies of scale from its management business in a variety of ways, including through fee waiver and expense reimbursement arrangements, services that benefit shareholders, competitive management fee rates set at the outset without regard to breakpoints, and investments in the business intended to enhance services available to shareholders.
Wells Fargo Index Fund | 53
Other information (unaudited)
The Boards concluded that Funds Management’s arrangements with respect to each Fund, including contractual breakpoints, constituted a reasonable approach to sharing potential economies of scale with the Funds and their shareholders.
Other benefits to Funds Management and the Sub-Adviser
The Boards received and considered information regarding potential “fall-out” or ancillary benefits received by Funds Management and its affiliates, including the Sub-Adviser, as a result of their relationships with the Funds. Ancillary benefits could include, among others, benefits directly attributable to other relationships with the Funds and benefits potentially derived from an increase in Funds Management’s and the Sub-Adviser’s business as a result of their relationships with the Funds. The Boards noted that various affiliates of Funds Management may receive distribution-related fees, shareholder servicing payments and sub-transfer agency fees in respect of shares sold or held through them and services provided.
The Boards also reviewed information about soft dollar credits earned and utilized by the Sub-Adviser, fees earned by Funds Management and the Sub-Adviser from managing a private investment vehicle for the fund family’s securities lending collateral, and commissions earned by an affiliated broker from portfolio transactions.
Based on their consideration of the factors and information they deemed relevant, including those described here, the Boards did not find that any ancillary benefits received by Funds Management and its affiliates, including the Sub-Adviser, were unreasonable.
Conclusion
At the Meeting, after considering the above-described factors and based on its deliberations and its evaluation of the information described above, the Funds Trust Board unanimously approved the continuation of the Gateway Fund Management Agreement for a one-year period. Additionally, after considering the above-described factors and based on its deliberations and its evaluation of the information described above, the Master Trust Board unanimously approved the continuation of the Master Portfolio Advisory Agreement and the Sub-Advisory Agreement, each for a one-year term. The Boards also determined that the compensation payable to Funds Management and the Sub-Adviser was reasonable.
54 | Wells Fargo Index Fund
Other information (unaudited)
LIQUIDITY RISK MANAGEMENT PROGRAM
In accordance with Rule 22e-4 under the Investment Company Act of 1940, as amended (the “Liquidity Rule”), each of Wells Fargo Funds Trust and Wells Fargo Master Trust (each a “Trust”) has adopted and implemented a liquidity risk management program (the “Program”) on behalf of each of its non-money market series, including the Fund and the Portfolio, respectively, which is reasonably designed to assess and manage the Fund’s or the Portfolio’s liquidity risk. “Liquidity risk” is defined as the risk that the Fund or Portfolio is unable to meet redemption requests without significantly diluting remaining investors’ interests. Each Trust’s Board of Trustees (each a “Board”) previously approved the designation of Wells Fargo Funds Management, LLC (“Funds Management”), the Fund’s investment manager and the Portfolio’s investment adviser, as the administrator of the Program, and Funds Management has established a Liquidity Risk Management Council composed of personnel from multiple departments within Funds Management and its affiliates to assist Funds Management in the implementation and on-going administration of the Program.
The Program is comprised of various components designed to support the assessment and/or management of liquidity risk, including: (1) the periodic assessment (no less frequently than annually) of certain factors that influence the Fund’s and the Portfolio’s liquidity risk; (2) the periodic classification (no less frequently than monthly) of the Fund’s and the Portfolio’s investments into one of four liquidity categories that reflect an estimate of their liquidity under current market conditions; (3) a 15% limit on the acquisition of “illiquid investments” (as defined under the Liquidity Rule); (4) to the extent the Fund or the Portfolio does not invest primarily in “highly liquid investments” (as defined under the Liquidity Rule), the determination of a minimum percentage of the Fund’s or the Portfolio’s assets that generally will be invested in highly liquid investments (an “HLIM”); (5) if the Fund or the Portfolio has established an HLIM, the periodic review (no less frequently than annually) of the HLIM and the adoption of policies and procedures for responding to a shortfall of the Fund’s or the Portfolio’s “highly liquid investments” below its HLIM; and (6) periodic reporting to the respective Board.
At a meeting of each Board held on May 26 and 28, 2020, the Board received a written report (the “Report”) from Funds Management that addressed the operation of the Program and assessed its adequacy and effectiveness of implementation. The Report covered the initial period from December 1, 2018 through December 31, 2019 (the “Reporting Period”). No significant liquidity events impacting the Fund or the Portfolio were noted in the Report. There were no material changes to the Program during the Reporting Period. The Report concluded that the Program is operating effectively to assess and manage the Fund’s and the Portfolio’s liquidity risk, and that the Program has been and continues to be adequately and effectively implemented to monitor and, as applicable, respond to the Fund’s and the Portfolio’s liquidity developments.
There can be no assurance that the Program will achieve its objectives under all circumstances in the future. Please refer to the Fund’s prospectus for more information regarding the Fund’s exposure to liquidity risk and other risks to which an investment in the Fund may be subject.
Wells Fargo Index Fund | 55
Appendix I (unaudited)
Effective on or about May 1, 2020, if you purchase Fund shares through a Janney Montgomery Scott LLC (“Janney”) brokerage account, you will be eligible for the following load waivers (front-end sales charge waivers and contingent deferred sales charge (“CDSC”), or back-end sales charge, waivers) and discounts, which may differ from those disclosed elsewhere in the Fund’s Prospectus or SAI.
|
| Front-end sales charge* waivers on Class A shares available at Janney |
|
| Shares purchased through reinvestment of capital gains distributions and dividend reinvestment when purchasing shares of the same fund (but not any other fund within the fund family). |
|
| Shares purchased by employees and registered representatives of Janney or its affiliates and their family members as designated by Janney. |
|
| Shares purchased from the proceeds of redemptions within the same fund family, provided (1) the repurchase occurs within ninety (90) days following the redemption, (2) the redemption and purchase occur in the same account, and (3) redeemed shares were subject to a front-end or deferred sales load (i.e., right of reinstatement). |
|
| Employer-sponsored retirement plans (e.g., 401(k) plans, 457 plans, employer-sponsored 403(b) plans, profit sharing and money purchase pension plans and defined benefit plans). For purposes of this provision, employer-sponsored retirement plans do not include SEP IRAs, Simple IRAs, SAR-SEPs or Keogh plans. |
|
| Shares acquired through a right of reinstatement. |
|
| Class C shares that are no longer subject to a contingent deferred sales charge and are converted to Class A shares of the same fund pursuant to Janney’s policies and procedures. |
| CDSC waivers on Class A and Class C shares available at Janney |
|
| Shares sold upon the death or disability of the shareholder. |
|
| Shares sold as part of a systematic withdrawal plan as described in the Fund’s Prospectus. |
|
| Shares purchased in connection with a return of excess contributions from an IRA account. |
|
| Shares sold as part of a required minimum distribution for IRA and retirement accounts if the redemption is taken in or after the year the shareholder reaches qualified age based on applicable IRS regulations. |
|
| Shares sold to pay Janney fees but only if the transaction is initiated by Janney. |
|
| Shares acquired through a right of reinstatement. |
|
| Shares exchanged into the same share class of a different fund. |
| Front-end sales charge* discounts available at Janney; breakpoints, rights of accumulation and/or letters of intent |
|
| Breakpoints as described in the Fund’s Prospectus. |
|
| Rights of accumulation (“ROA”), which entitle shareholders to breakpoint discounts, will be automatically calculated based on the aggregated holding of fund family assets held by accounts within the purchaser’s household at Janney. Eligible fund family assets not held at Janney may be included in the ROA calculation only if the shareholder notifies his or her financial advisor about such assets. |
|
| Letters of intent which allow for breakpoint discounts based on anticipated purchases within a fund family, over a 13-month time period. Eligible fund family assets not held at Janney Montgomery Scott may be included in the calculation of letters of intent only if the shareholder notifies his or her financial advisor about such assets. |
| * | Also referred to as an “initial sales charge.” |
56 | Wells Fargo Index Fund
Appendix II (unaudited)
Effective on or after May 1, 2020, clients of Edward Jones (also referred to as “shareholders”) purchasing Fund shares on the Edward Jones commission and fee-based platforms are eligible only for the following sales charge discounts (also referred to as “breakpoints”) and waivers, which can differ from breakpoints and waivers described elsewhere in the Fund’s Prospectus or SAI or through another broker-dealer. In all instances, it is the shareholder’s responsibility to inform Edward Jones at the time of purchase of any relationship, holdings of Wells Fargo Funds or other facts qualifying the purchaser for breakpoints or waivers. Edward Jones can ask for documentation of such circumstance.
|
| Breakpoints available at Edward Jones |
|
| Rights of Accumulation (ROA) |
|
The applicable sales charge on a purchase of Class A shares is determined by taking into account all share classes (except any money market funds and retirement plan share classes) of Wells Fargo Funds held by the shareholder or in an account grouped by Edward Jones with other accounts for the purpose of providing certain pricing considerations (“pricing groups”). This includes all share classes held on the Edward Jones platform and/or held on another platform. The inclusion of eligible fund family assets in the rights of accumulation calculation is dependent on the shareholder notifying his or her financial advisor of such assets at the time of calculation. |
|
ROA is determined by calculating the higher of cost or market value (current shares x NAV). |
|
| Letter of Intent (LOI) |
|
Through a LOI, shareholders can receive the sales charge and breakpoint discounts for purchases shareholders intend to makeover a 13-month period from the date Edward Jones receives the LOI. The LOI is determined by calculating the higher of cost or market value of qualifying holdings at LOI initiation in combination with the value that the shareholder intends to buy over a 13-month period to calculate the front-end sales charge and any breakpoint discounts. Each purchase the shareholder makes during that 13-month period will receive the sales charge and breakpoint discount that applies to the total amount. The inclusion of eligible fund family assets in the LOI calculation is dependent on the shareholder notifying his or her financial advisor of such assets at the time of calculation. Purchases made before the LOI is received by Edward Jones are not covered under the LOI and will not reduce the sales charge previously paid. Sales charges will be adjusted if LOI is not met. |
| Sales charges are waived for the following shareholders and in the following situations at Edward Jones: |
● Associates of Edward Jones and its affiliates and their family members who are in the same pricing group (as determined by Edward Jones under its policies and procedures) as the associate. This waiver will continue for the remainder of the associate’s life if the associate retires from Edward Jones in good-standing. |
● Shares purchased in an Edward Jones fee-based program. |
● Shares purchased through reinvestment of capital gains distributions and dividend reinvestment. |
● Shares purchased from the proceeds of redeemed shares of the same fund family so long as the following conditions are met: 1) the proceeds are from the sale of shares within 60 days of the purchase, and 2) the sale and purchase are made in the same share class and the same account or the purchase is made in an individual retirement account with proceeds from liquidations in a non-retirement account. |
● Shares exchanged into Class A shares from another share class so long as the exchange is into the same fund and was initiated at the discretion of Edward Jones. Edward Jones is responsible for any remaining CDSC due to the fund company, if applicable. Any future purchases are subject to the applicable sales charge as disclosed in the prospectus. |
● Exchanges from Class C shares to Class A shares of the same fund, generally, in the 84th month following the anniversary of the purchase date or earlier at the discretion of Edward Jones. |
If the shareholder purchases shares that are subject to a CDSC and those shares are redeemed before the CDSC is expired, the shareholder
is responsible to pay the CDSC except in the following conditions available at Edward Jones: |
● The death or disability of the shareholder. |
● Systematic withdrawals with up to 10% per year of the account value. |
● Return of excess contributions from an Individual Retirement Account (IRA). |
● Shares sold as part of a required minimum distribution for IRA and retirement accounts if the redemption is taken in or after the year the shareholder reaches qualified age based on applicable IRS regulation. |
● Shares sold to pay Edward Jones fees or costs in such cases where the transaction is initiated by Edward Jones. |
● Shares exchanged in an Edward Jones fee-based program. |
● Shares acquired through NAV reinstatement. |
Wells Fargo Index Fund | 57
Appendix II (unaudited)
|
| Other Important Information for accounts at Edward Jones: |
| Minimum Purchase Amounts |
● $250 initial purchase minimum |
● $50 subsequent purchase minimum |
|
| Minimum Balances |
| Edward Jones has the right to redeem at its discretion fund holdings with a balance of $250 or less. The following are examples of accounts that are not included in this policy: |
● A fee-based account held on an Edward Jones platform |
● A 529 account held on an Edward Jones platform |
● An account with an active systematic investment plan or letter of intent (LOI) |
|
| Changing Share Classes |
| At any time it deems necessary, Edward Jones has the authority to exchange at NAV a shareholder’s holdings in a fund to Class A shares. |
58 | Wells Fargo Index Fund
Appendix III (unaudited)
Effective June 1, 2020, shareholders purchasing Fund shares through an Oppenheimer & Co. Inc. (“Oppenheimer”) platform or account are eligible only for the following load waivers (front-end sales charge waivers and contingent deferred or back-end, sales charge waivers) and discounts, which may differ from those disclosed in the Fund’s Prospectus or SAI.
|
| Front-end Sales Load Waivers on Class A Shares available at Oppenheimer |
|
| Employer-sponsored retirement, deferred compensation and employee benefit plans (including health savings accounts) and trusts used to fund those plans, provided that the shares are not held in a commission-based brokerage account and shares are held for the benefit of the plan. |
|
| Shares purchased by or through a 529 Plan. |
|
| Shares purchased through an Oppenheimer affiliated investment advisory program. |
|
| Shares purchased through reinvestment of capital gains distributions and dividend reinvestment when purchasing shares of the same fund (but not any other fund within the fund family). |
|
| Shares purchased from the proceeds of redemptions within the same fund family, provided (1) the repurchase occurs within 90 days following the redemption, (2) the redemption and purchase occur in the same account, and (3) redeemed shares were subject to a front-end or deferred sales load (known as Rights of Restatement). |
|
| A shareholder in the Fund’s Class C shares will have their shares exchanged at net asset value to Class A shares (or the appropriate share class) of the Fund if the shares are no longer subject to a CDSC and the exchange is in line with the policies and procedures of Oppenheimer. |
|
| Employees and registered representatives of Oppenheimer or its affiliates and their family members. |
|
| Directors or Trustees of the Fund, and employees of the Fund’s investment adviser or any of its affiliates, as described in the Prospectus. |
| CDSC Waivers on A and C Shares available at Oppenheimer |
|
| Death or disability of the shareholder. |
|
| Shares sold as part of a systematic withdrawal plan as described in the Prospectus. |
|
| Return of excess contributions from an IRA Account. |
|
| Shares sold as part of a required minimum distribution for IRA and retirement accounts due to the shareholder reaching the qualified age based on applicable IRS regulations as described in the Prospectus. |
|
| Shares sold to pay Oppenheimer fees but only if the transaction is initiated by Oppenheimer. |
|
| Shares acquired through a right of reinstatement. |
| Front-end load Discounts Available at Oppenheimer: Breakpoints, Rights of Accumulation & Letters of Intent |
|
| Breakpoints as described in the Prospectus. |
|
| Rights of Accumulation (ROA), which entitle shareholders to breakpoint discounts, will be automatically calculated based on the aggregated holding of fund family assets held by accounts within the purchaser’s household at Oppenheimer. Eligible fund family assets not held at Oppenheimer may be included in the ROA calculation only if the shareholder notifies his or her financial advisor about such assets. |
Wells Fargo Index Fund | 59
Appendix IV (unaudited)
Effective June 15, 2020, shareholders purchasing fund shares through a Robert W. Baird & Co. (“Baird”) platform or account will only be eligible for the following sales charge waivers (front-end sales charge waivers and CDSC waivers) and discounts, which may differ from those disclosed elsewhere in the Fund’s Prospectus or the SAI.
|
| Front-end Sales Load Waivers on Class A Shares available at Baird |
|
| Shares purchased through reinvestment of capital gains distributions and dividend reinvestment when purchasing share of the same fund. |
|
| Share purchase by employees and registers representatives of Baird or its affiliate and their family members as designated by Baird. |
|
| Shares purchase from the proceeds of redemptions within the same fund family, provided (1) the repurchase occurs within 90 days following the redemption, (2) the redemption and purchase occur in the same accounts, and (3) redeemed shares were subject to a front-end or deferred sales charge (known as rights of reinstatement). |
|
| A shareholder in the Funds Investor C Shares will have their share exchanged at net asset value to Investor A shares of the fund if the shares are no longer subject to CDSC and the exchange is in line with the policies and procedures of Baird. |
|
| Employer-sponsored retirement plans or charitable accounts in a transactional brokerage account at Baird, including 401(k)plans, 457 plans, employer-sponsored 403(b) plans, profit sharing and money purchase pension plans and defined benefit plans. For purposes of this provision, employer-sponsored retirement plans do not include SEP IRAs, Simple IRAs or SAR-SEPs. |
| CDSC Waivers on A and C Shares available at Baird |
|
| Shares sold due to death or disability of the shareholder. |
|
| Shares sold as part of a systematic withdrawal plan as described in the Fund’s Prospectus. |
|
| Shares bought due to returns of excess contributions from an IRA Account. |
|
| Shares sold as part of a required minimum distribution for IRA and retirement accounts due to the shareholder reaching age 72 as described in the Fund’s Prospectus. |
|
| Shares sold to pay Baird fees but only if the transaction is initiated by Baird. |
|
| Shares acquired through a right of reinstatement. |
| Front-end load Discounts Available at Baird: Breakpoint and/or Rights of Accumulation |
|
| Breakpoints as described in the Prospectus. |
|
| Rights of accumulations which entitles shareholders to breakpoint discounts will be automatically calculated based on the aggregated holding of fund family assets held by accounts within the purchaser’s household at Baird. Eligible fund family assets not held at Baird may be included in the rights of accumulations calculation only if the shareholder notifies his or her financial advisor about such assets. |
|
| Letters of Intent (LOI) allow for breakpoint discounts based on anticipated purchases within a fund family through Baird, over a 13-month period of time. |
60 | Wells Fargo Index Fund

For more information
More information about Wells Fargo Funds is available free upon request. To obtain literature, please write, visit the Fund’s website, or call:
Wells Fargo Funds
P.O. Box 219967
Kansas City, MO 64121-9967
Website: wfam.com
Individual investors: 1-800-222-8222
Retail investment professionals: 1-888-877-9275
Institutional investment professionals: 1-866-765-0778

This report and the financial statements contained herein are submitted for the general information of the shareholders of the Fund. If this report is used for promotional purposes, distribution of the report must be accompanied or preceded by a current prospectus. Before investing, please consider the investment objectives, risks, charges, and expenses of the investment. For a current prospectus and, if available, a summary prospectus, containing this information, call 1-800-222-8222 or visit the Fund’s website at wfam.com. Read the prospectus carefully before you invest or send money.
Wells Fargo Asset Management (WFAM) is the trade name for certain investment advisory/management firms owned by Wells Fargo & Company. These firms include but are not limited to Wells Capital Management Incorporated and Wells Fargo Funds Management, LLC. Certain products managed by WFAM entities are distributed by Wells Fargo Funds Distributor, LLC (a broker-dealer and Member FINRA).
This material is for general informational and educational purposes only and is NOT intended to provide investment advice or a recommendation of any kind—including a recommendation for any specific investment, strategy, or plan.
INVESTMENT PRODUCTS: NOT FDIC INSURED ◾ NO BANK GUARANTEE ◾ MAY LOSE VALUE
© 2020 Wells Fargo & Company. All rights reserved.
PAR-0620-00317 07-20
A283/AR283 05-20
Annual Report
May 31, 2020
Wells Fargo
Small Company Growth Fund
Beginning on January 1, 2021, as permitted by new regulations adopted by the Securities and Exchange Commission, paper copies of the Wells Fargo Funds’ annual and semi-annual shareholder reports issued after this date will no longer be sent by mail, unless you specifically request paper copies of the reports. Instead, the reports will be made available on the Funds’ website, and you will be notified by mail each time a report is posted and provided with a website address to access the report.
If you already elected to receive shareholder reports electronically, you will not be affected by this change and you need not take any action. You may elect to receive shareholder reports and other communications from the Fund electronically at any time by contacting your financial intermediary (such as a broker-dealer or bank) or, if you are a direct investor, by calling 1-800-222-8222 or by enrolling at wellsfargo.com/advantagedelivery.
You may elect to receive all future reports in paper free of charge. If you invest through a financial intermediary, you can contact your financial intermediary to request that you continue to receive paper copies of your shareholder reports; if you invest directly with the Fund, you can call 1-800-222-8222. Your election to receive reports in paper will apply to all Wells Fargo Funds held in your account with your financial intermediary or, if you are a direct investor, to all Wells Fargo Funds that you hold.
|
|
|
Reduce clutter. Save trees. |
Sign up for electronic delivery of prospectuses and
shareholder reports at wellsfargo.com/
advantagedelivery |
The views expressed and any forward-looking statements are as of May 31, 2020, unless otherwise noted, and are those of the Fund managers and/or Wells Fargo Asset Management. Discussions of individual securities, or the markets generally, or any Wells Fargo Fund are not intended as individual recommendations. Future events or results may vary significantly from those expressed in any forward-looking statements. The views expressed are subject to change at any time in response to changing circumstances in the market. Wells Fargo Asset Management and the Fund disclaim any obligation to publicly update or revise any views expressed or forward-looking statements.
INVESTMENT PRODUCTS: NOT FDIC INSURED ◾ NO BANK GUARANTEE ◾ MAY LOSE VALUE
Wells Fargo Small Company Growth Fund | 1
Letter to shareholders (unaudited)

Andrew Owen
President
Wells Fargo Funds
Dear Shareholder:
We are pleased to offer you this annual report for the Wells Fargo Small Company Growth Fund for the 12-month period that ended May 31, 2020. Global stock markets saw earlier gains erased in February and March as governments around the world took unprecedented measures to stop the spread of the coronavirus at the expense of short-term economic output. However, markets rebounded in April and May to offset much of the losses as central banks attempted to bolster capital markets and confidence. Fixed-income markets generally performed better, achieving widespread gains.
For the 12-month period, fixed-income securities generally had positive total returns while non-U.S. equities had broad losses and U.S. stocks performed strongly despite sharp volatility since late February. For the period, U.S. stocks, based on the S&P 500 Index,1 gained 12.84%. International stocks, as measured by the MSCI ACWI ex USA Index (Net),2 returned -3.43%, while the MSCI EM Index (Net)3 trailed slightly, with a -4.39% return. For bond investors, the Bloomberg Barclays U.S. Aggregate Bond Index4 gained a robust 9.42%, the Bloomberg Barclays Global Aggregate ex-USD Index5 returned 2.67%, and the Bloomberg Barclays Municipal Bond Index6 gained a more modest 3.98%, while the ICE BofA U.S. High Yield Index7 had a slight gain of 0.35%.
The fiscal year began on a positive note.
The 12-month period began with U.S. equity market advances during June and July 2019. The gains, primarily driven by geopolitical and monetary policy events, pushed equity markets to new highs. European Central Bank (ECB) President Mario Draghi indicated the bank was ready to cut rates or buy more assets to prop up inflation if needed. President Trump backed off of earlier tariff threats against Mexico and China. In the U.S., the Federal Reserve (Fed) implemented a 0.25% federal funds rate cut in July.
Later in July, the U.S. reversed course and threatened to impose higher tariffs on China’s exports after talks failed. China responded with tariff threats of its own and devalued the renminbi, roiling global markets. Major U.S. stock market indices closed July with the worst weekly results of the year. Bond prices gained as Treasury yields fell to multiyear lows, and the yield curve inverted at multiple points along the 30-year arc, with shorter-term yields higher than longer-term.
In August, U.S.-China trade tensions continued with no signs of compromise. Evidence of a continued global economic slowdown mounted, and central banks in China, New Zealand, and Thailand cut interest rates. Industrial and manufacturing data declined in China, Canada, Japan, and Germany. Adding to global uncertainty, Italy’s prime minister resigned,
| 1 | The S&P 500 Index consists of 500 stocks chosen for market size, liquidity, and industry group representation. It is a market-value-weighted index with each stock’s weight in the index proportionate to its market value. You cannot invest directly in an index. |
| 2 | The Morgan Stanley Capital International (MSCI) All Country World Index (ACWI) ex USA Index (Net) is a free-float-adjusted market-capitalization-weighted index that is designed to measure the equity market performance of developed and emerging markets, excluding the United States. Source: MSCI. MSCI makes no express or implied warranties or representations and shall have no liability whatsoever with respect to any MSCI data contained herein. The MSCI data may not be further redistributed or used as a basis for other indices or any securities or financial products. This report is not approved, reviewed, or produced by MSCI. You cannot invest directly in an index. |
| 3 | The MSCI Emerging Markets (EM) Index (Net) is a free-float-adjusted market-capitalization-weighted index that is designed to measure equity market performance of emerging markets. You cannot invest directly in an index. |
| 4 | The Bloomberg Barclays U.S. Aggregate Bond Index is a broad-based benchmark that measures the investment-grade, U.S. dollar-denominated, fixed-rate taxable bond market, including Treasuries, government-related and corporate securities, mortgage-backed securities (agency fixed-rate and hybrid adjustable-rate mortgage pass-throughs), asset-backed securities, and commercial mortgage-backed securities. You cannot invest directly in an index. |
| 5 | The Bloomberg Barclays Global Aggregate ex-USD Index is an unmanaged index that provides a broad-based measure of the global investment-grade fixed-income markets excluding the U.S. dollar-denominated debt market. You cannot invest directly in an index. |
| 6 | The Bloomberg Barclays Municipal Bond Index is an unmanaged index composed of long-term tax-exempt bonds with a minimum credit rating of Baa. You cannot invest directly in an index. |
| 7 | The ICE BofA U.S. High Yield Index is a market-capitalization-weighted index of domestic and Yankee high-yield bonds. The index tracks the performance of high-yield securities traded in the U.S. bond market. You cannot invest directly in an index. Copyright 2020. ICE Data Indices, LLC. All rights reserved. |
2 | Wells Fargo Small Company Growth Fund
Letter to shareholders (unaudited)
many feared a crackdown in Hong Kong as protestors sustained their calls for reform, and Prime Minister Boris Johnson planned to suspend the British Parliament as Brexit’s deadline neared.
In the U.S., the Fed cut interest rates a second time in September. U.S. manufacturing data disappointed investors. The U.S. Congress announced it would pursue an impeachment investigation of President Trump. Meanwhile, the Brexit impasse showed no signs of resolution. Officials in China said that hitting the country’s economic growth goals for the year would be difficult considering the weight of tariffs and trade restrictions. Although the S&P 500 Index finished the third quarter with the best year-to-date returns in more than 20 years, concerns about future returns remained.
The fourth quarter of 2019 started on a strong note, with U.S.-China trade tensions relaxing in October along with renewed optimism for a U.K. Brexit deal and positive macroeconomic data. The initial estimate of U.S. third-quarter gross domestic product growth was a resilient 1.9% annualized rate, while the U.S. unemployment rate fell to a 50-year low of 3.5% in September. However, despite resilience among U.S. consumers, business confidence declined and manufacturing activity contracted. Concerned with a potential economic slowdown, the Fed lowered interest rates another quarter point in late October—its third rate cut in four months. This helped push the S&P 500 Index to a new all-time high while emerging market equities rallied and global bonds declined overall, reflecting a broad pickup in risk appetite.
Equity markets continued to rally in November despite ongoing geopolitical risks. Hopes for a U.S.-China trade deal buoyed investor confidence. U.S. business sentiment improved slightly, and manufacturing and services activity picked up. While consumer confidence and purchasing manager activity rose in the eurozone, China reported weakening manufacturing and consumer data. Bond yields rose marginally, leading to slightly negative returns for global government and investment-grade corporate bonds.
Financial markets ended 2019 with a boost from the U.S. and China accord on a Phase One trade deal. That, along with the landslide win by the pro-Brexit U.K. Conservative Party in a national election and ongoing central bank support, gave investors greater confidence. U.S. economic indicators were generally positive, with the exception of manufacturing activity and business confidence. Consumer confidence was resilient, fed by a robust labor market, tame inflation, and lower interest rates, which boosted housing affordability and stimulated homebuyer activity. The impeachment of U.S. President Donald Trump had little impact on markets. Meanwhile, slowing Chinese economic activity, partly attributable to the trade war, led to further government stimulus at year-end through lower reserve ratios, allowing banks to lend more money.
The year-end rally continued in early January 2020. However, capital market volatility picked up sharply in late January on concerns over the potential impact of the coronavirus on the global economy and stock markets. With sentiment somewhat souring, perceived safe havens did well in January. The U.S. dollar and Japanese yen both rose, and government bonds outperformed equities. While the S&P 500 Index held its ground, emerging market equities tumbled, including those in Asia.
In February, the coronavirus became the major market focus. Fears of the virus’s impact on global growth led to expectations of increased global central bank monetary policy support. That led the 10-year U.S. Treasury yield to fall to an all-time low of 1.1% by the end of the month. Although equity markets initially shrugged off concerns about the outbreak, focusing instead on strong fourth-quarter earnings and improving business confidence in January, market sentiment turned sharply lower toward month-end and the S&P 500 Index lost 8.2% for the month. Oil prices tumbled as Russia and the Organization of the Petroleum Exporting Countries compounded a major decline in oil demand with a brutal price war, partly aimed at dissuading further U.S. shale production. As a result, the price of West Texas Intermediate crude oil fell 13% in February.
Wells Fargo Small Company Growth Fund | 3
Letter to shareholders (unaudited)
“The global spread of the coronavirus led country after country to clamp down on social and business-related activity in order to contain the virus from causing even greater devastation and overwhelming health care systems.”
“Markets rebounded strongly in April after the earlier extreme volatility, with the S&P 500 Index gaining 12.8% for the month and the MSCI ACWI ex USA Index (Net) returning 7.6%.”
|
|
|
For further information about your Fund, contact your investment professional, visit our website at wfam.com, or call us directly at 1-800-222-8222. |
The global spread of the coronavirus led country after country to clamp down on social and business-related activity in order to contain the virus from causing even greater devastation and overwhelming health care systems. This abrupt stoppage of economic activity led to the sharp deceleration of global output, sending economies into a deep contraction. Central bank responses were swift, as they slashed interest rates and expanded quantitative easing programs to restore liquidity and confidence to the markets. In the U.S., the Fed introduced several new lending programs, funding investment-grade bonds, money market mutual funds, and commercial paper while purchasing Treasuries, mortgage-backed securities, and overnight repurchase agreements. Meanwhile, stock markets tumbled quickly into a bear market, ending the longest bull stock market in U.S. history.
Markets rebounded strongly in April after the earlier extreme volatility, with the S&P 500 Index gaining 12.8% for the month and the MSCI ACWI ex USA Index (Net) returning 7.6%. The rebound was fueled by unprecedented government and central bank stimulus measures taken to buffer the economic damage created by mass shutdowns enacted in order to contain the virus’s spread. The U.S. economy contracted by an annualized 4.8% pace in the first quarter, with 30 million new unemployment insurance claims in six weeks. In the eurozone, first-quarter real gross domestic product (GDP) shrank 3.8%, with the composite April Flash Purchasing Managers’ Index, a monthly survey of purchasing managers, falling to an all-time low of 13.5. The ECB expanded its quantitative easing to include the purchase of additional government bonds of countries with the greatest virus-related need, including Italy and Spain. China’s first-quarter GDP fell by 6.8% year over year. However, retail sales, production, and investment showed signs of recovery. Extreme oil price volatility continued as global supply far exceeded demand.
In May, the equity market rebound continued, with the S&P 500 Index climbing a further 4.8%. European and Japanese stock markets also had monthly gains. Investors regained confidence on reports of early signs of success in human trials of a coronavirus vaccine. Growth stocks continued to outperform value stocks while returns on global government bonds were generally flat. In the U.S., a gap grew between the stock market rebound and devastating economic data points, including an April unemployment rate of 14.7%, the highest level since World War II. Purchasing managers’ indices continued to reflect weakening activity in May in both the manufacturing and services sectors. U.S. corporate earnings reports indicated a 14% year-over-year contraction in earnings from the first quarter of 2019. However, high demand for technology, driven by remote activity, helped maintain robust information technology sector earnings, which helped drive powerful well-known technology stocks higher.
Don’t let short-term uncertainty derail long-term investment goals.
Periods of investment uncertainty can present challenges, but experience has taught us that maintaining long-term investment goals can be an effective way to plan for the future. To help you create a sound strategy based on your personal goals and risk tolerance, Wells Fargo Funds offers more than 100 mutual funds spanning a wide range of asset classes and investment styles. Although diversification cannot guarantee an investment profit or prevent losses, we believe it can be an effective way to manage investment risk and potentially smooth out overall portfolio performance. We encourage investors to know their investments and to understand that appropriate levels of risk-taking may unlock opportunities.
Thank you for choosing to invest with Wells Fargo Funds. We appreciate your confidence in us and remain committed to helping you meet your financial needs.
Sincerely,

Andrew Owen
President
Wells Fargo Funds
4 | Wells Fargo Small Company Growth Fund
This page is intentionally left blank.
Performance highlights (unaudited)
The Fund is currently closed to most new investors.1
Investment objective
The Fund seeks long-term capital appreciation.
Manager
Wells Fargo Funds Management, LLC
Subadviser for the affiliated master portfolio2
Peregrine Capital Management, LLC
Portfolio managers
William A. Grierson, CFA®‡
Daniel J. Hagen, CFA®‡
Paul E. von Kuster, CFA®‡
Average annual total returns (%) as of May 31, 2020
| | | | | | | | | | | | | | | | | | | | | | | | | | | | | | | | | | |
| | | | |
| | | | | Including sales charge | | | Excluding sales charge | | | Expense ratios3 (%) | |
| | | | | | | | | |
| | | Inception date | | 1 year | | | 5 year | | | 10 year | | | 1 year | | | 5 year | | | 10 year | | | Gross | | | Net4 | |
| | | | | | | | | | |
| Class A (WFSAX) | | 1-30-2004 | | | -2.26 | | | | 3.42 | | | | 11.37 | | | | 3.70 | | | | 4.66 | | | | 12.03 | | | | 1.32 | | | | 1.29 | |
| | | | | | | | | | |
| Class C (WSMCX) | | 1-30-2004 | | | 1.92 | | | | 3.87 | | | | 11.20 | | | | 2.92 | | | | 3.87 | | | | 11.20 | | | | 2.07 | | | | 2.04 | |
| | | | | | | | | | |
| Class R6 (WSCRX)5 | | 10-31-2014 | | | – | | | | – | | | | – | | | | 4.12 | | | | 5.11 | | | | 12.55 | | | | 0.89 | | | | 0.86 | |
| | | | | | | | | | |
| Administrator Class (NVSCX) | | 11-11-1994 | | | – | | | | – | | | | – | | | | 3.80 | | | | 4.79 | | | | 12.24 | | | | 1.24 | | | | 1.19 | |
| | | | | | | | | | |
| Institutional Class (WSCGX) | | 3-31-2008 | | | – | | | | – | | | | – | | | | 4.07 | | | | 5.05 | | | | 12.51 | | | | 0.99 | | | | 0.94 | |
| | | | | | | | | | |
| Russell 2000® Growth Index6 | | – | | | – | | | | – | | | | – | | | | 7.32 | | | | 6.34 | | | | 11.72 | | | | – | | | | – | |
Figures quoted represent past performance, which is no guarantee of future results, and do not reflect taxes that a shareholder may pay on an investment in a fund. Investment return and principal value of an investment will fluctuate so that an investor’s shares, when redeemed, may be worth more or less than their original cost. Performance shown without sales charges would be lower if sales charges were reflected. Current performance may be lower or higher than the performance data quoted, which assumes the reinvestment of dividends and capital gains. Current month-end performance is available on the Fund’s website, wfam.com.
Index returns do not include transaction costs associated with buying and selling securities, any mutual fund fees or expenses, or any taxes. It is not possible to invest directly in an index.
For Class A shares, the maximum front-end sales charge is 5.75%. For Class C shares, the maximum contingent deferred sales charge is 1.00%. Performance including a contingent deferred sales charge assumes the sales charge for the corresponding time period. Class R6, Administrator Class, and Institutional Class shares are sold without a front-end sales charge or contingent deferred sales charge.
Stock values fluctuate in response to the activities of individual companies and general market and economic conditions. Smaller-company stocks tend to be more volatile and less liquid than those of larger companies. Certain investment strategies tend to increase the total risk of an investment (relative to the broader market). The Fund is exposed to foreign investment risk. Consult the Fund’s prospectus for additional information on these and other risks.
Please see footnotes on page 7.
6 | Wells Fargo Small Company Growth Fund
Performance highlights (unaudited)
|
|
| Growth of $10,000 investment as of May 31, 20207 |
|
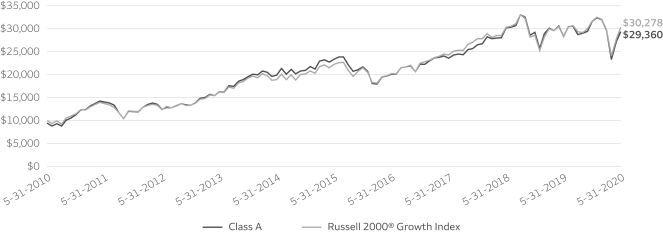
|
| ‡ | CFA® and Chartered Financial Analyst® are trademarks owned by CFA Institute. |
| 1 | Please see the Fund’s current Statement of Additional Information for further details. |
| 2 | The Fund is a feeder fund in a master-feeder structure that invests substantially all of its assets in a single affiliated master portfolio of the Wells Fargo Master Trust with a substantially identical investment objective and substantially similar investment strategies. References to the investment activities of the Fund are intended to refer to the investment activities of the affiliated master portfolio in which it invests. |
| 3 | Reflects the expense ratios as stated in the most recent prospectuses. The expense ratios shown are subject to change and may differ from the annualized expense ratios shown in the financial highlights of this report. |
| 4 | Effective June 1, 2020, the manager has contractually committed through September 30, 2021, to waive fees and/or reimburse expenses to the extent necessary to cap total annual fund operating expenses after fee waivers at 1.29% for Class A, 2.04% for Class C, 0.86% for Class R6, 1.19% for Administrator Class, and 0.94% for Institutional Class. Brokerage commissions, stamp duty fees, interest, taxes, acquired fund fees and expenses (if any) from funds in which the affiliated master portfolio invests, and extraordinary expenses are excluded from the expense caps. Net expenses from the affiliated master portfolio are included in the expense caps. Prior to or after the commitment expiration date, the caps may be increased or the commitment to maintain the caps may be terminated only with the approval of the Board of Trustees. Without these caps, the Fund’s returns would have been lower. The expense ratio paid by an investor is the net expense ratio (the total annual fund operating expenses after fee waivers) as stated in the prospectuses. |
| 5 | Historical performance shown for the Class R6 shares prior to their inception reflects the performance of the Institutional Class shares, and includes the higher expenses applicable to the Institutional Class shares. If these expenses had not been included, returns for the Class R6 shares would be higher. |
| 6 | The Russell 2000® Growth Index measures the performance shown of those Russell 2000 companies with higher price/book ratios and higher forecasted growth values. You cannot invest directly in an index. |
| 7 | The chart compares the performance of Class A shares for the most recent ten years with the Russell 2000® Growth Index. The chart assumes a hypothetical $10,000 investment in Class A shares and reflects all operating expenses and assumes the maximum initial sales charge of 5.75%. |
| 8 | The ten largest holdings, excluding cash, cash equivalents and any money market funds, are calculated based on the value of the securities of the affiliated master portfolio allocable to the Fund divided by the total net assets of the Fund. Holdings are subject to change and may have changed since the date specified. |
| 9 | Amounts represent the sector allocation of the affiliated master portfolio which are calculated based on the total long-term investments of the affiliated master portfolio. These amounts are subject to change and may have changed since the date specified. |
| * | The security is no longer held at the end of the period. |
Wells Fargo Small Company Growth Fund | 7
Performance highlights (unaudited)
MANAGER’S DISCUSSION
Fund highlights
| ∎ | | The Fund underperformed the Russell 2000® Growth Index for the 12-month period that ended May 31, 2020. |
| ∎ | | Stock selection within consumer discretionary and financials were the largest detractors to performance in the period. |
| ∎ | | Stock selection in real estate and information technology (IT) were the largest contributors to performance in the period. |
Market was dominated by volatility and uncertainty.
Heightened volatility and macroeconomic uncertainty can best describe the market environment throughout the Fund’s most recent fiscal year that ended May 31, 2020. Through the first eight months of the period, markets remained remarkably resilient, generating solid returns as multiple interest rate cuts by the U.S. Federal Reserve (Fed) and improving trade war headlines caused investor fears of a pending recession to fade. However, that narrative changed abruptly in February as the coronavirus pandemic caused unprecedented spikes in market volatility. Worldwide efforts to contain the spread of infection caused significant damage to the global economy as many businesses were forced to close indefinitely, resulting in a significant elevation in near-term unemployment rates. This widespread uncertainty led to a sharp sell-off in equity markets with the Russell 2000® Growth Index declining by 26% in February and March. Equity markets are forward looking and the impact of extensive Fed stimulus, the gradual reopening of the economy, and the relaxation of the restrictions imposed on our daily lives enabled markets to recoup much of their pandemic-related losses, leading to positive overall returns for the Fund’s fiscal year.
| | | | |
|
| Ten largest holdings (%) as of May 31, 20208 | |
| | |
Ciena Corporation | | | 1.91 | |
| | |
RealPage Incorporated | | | 1.84 | |
| | |
LiveRamp Holdings Incorporated | | | 1.69 | |
| | |
SS&C Technologies Holdings Incorporated | | | 1.67 | |
| | |
ICON plc ADR | | | 1.65 | |
| | |
Syneos Health Incorporated | | | 1.64 | |
| | |
PTC Incorporated | | | 1.58 | |
| | |
Black Knight Incorporated | | | 1.57 | |
| | |
ASGN Incorporated | | | 1.48 | |
| | |
Palomar Holdings Incorporated | | | 1.44 | |
Returns within the market at certain points throughout the year exhibited significant narrowness toward areas of perceived safety from trade war and coronavirus-related uncertainties. These preferences, focused on momentum and low volatility with little valuation regard, drove levels of market extremes, which surpassed most periods in market history. The Fund remained consistent to its long-term discipline of investing in rapidly growing companies purchased at attractive valuations throughout the fiscal year. Through many past market cycles, we have adhered to these disciplines in spite of many brief periods of strong market headwinds similar to what has been seen recently. We believe this strict adherence to our long-standing investment philosophy will ultimately drive strong future performance.
Real estate and IT contributed while consumer discretionary detracted.
Consumer discretionary was the largest detractor from performance for the fiscal year with much of the negative performance impact caused by the current coronavirus pandemic. Pervasive store closures and reduced consumer foot traffic related to the pandemic was a significant headwind to apparel retailers G-III Apparel Group and The Children’s Place, and we exited both stocks. Casino operator Eldorado Resorts was also weak in the period as the company was forced to temporarily shutter its casino properties while the longer-term uncertainty surrounding gaming trends caused by the pandemic called into question the company’s ability to complete its pending transformative acquisition of Caesars Entertainment, and we sold our position in Eldorado Resorts. The financials sector also detracted from fund performance in the period. Weakness was driven by our overweight position in the underperforming sector as well as weakness in private mortgage insurer Essent Group and commercial property and casualty insurer Argo Group International.
Please see footnotes on page 7.
8 | Wells Fargo Small Company Growth Fund
Performance highlights (unaudited)
|
|
| Sector allocation as of May 31, 20209 |
|
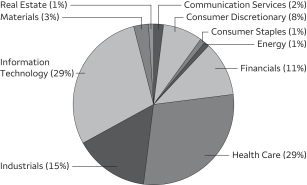 |
Real estate and IT were the top-contributing sectors for the fiscal year. Positive performance in real estate was driven by QTS Realty Trust Incorporated. QTS is a data center real estate investment trust that benefited from strong new lease activity and lower customer churn as customers increasingly looked to shift their software needs to cloud-based applications. Within IT, strength was primarily driven by stock selection in communication services and semiconductors. Optical component companies Ciena and Lumentum Holdings benefited from the continued buildout of data center and carrier networks to support the significant ongoing growth in data traffic. The contribution from semiconductors was broad based with strength in Teradyne, FormFactor, Cypress Semiconductor*, and Cabot Microelectronics.
Our team has employed the same bottom-up style for more than 40 years and we have endured similar periods of extreme market volatility, none of which have proved to be anything more than transient. Our investment philosophy centers on identifying small, rapidly growing companies with underappreciated opportunities relative to their valuations. However, during the Fund’s fiscal year, valuations mattered little as a significant increase in recessionary fears caused investors to crowd into low volatility and high-momentum stocks regardless of valuation excesses. These stocks were afforded significant valuation premiums as they were widely viewed as defensive, with secular growth opportunities able to overwhelm macro level concerns. This persistent lack of valuation sensitivity in the market, while not sustainable, created a significant headwind to our valuation sensitive style during the period. We firmly believe valuations will once again matter, providing a more conducive environment for our valuation sensitive philosophy with the potential to drive strong future outperformance for the Fund.
Please see footnotes on page 7.
Wells Fargo Small Company Growth Fund | 9
Fund expenses (unaudited)
As a shareholder of the Fund, you incur two types of costs: (1) transaction costs, including sales charges (loads) on purchase payments and contingent deferred sales charges (if any) on redemptions and (2) ongoing costs, including management fees, distribution (12b-1) and/or shareholder servicing fees, and other Fund expenses. This example is intended to help you understand your ongoing costs (in dollars) of investing in the Fund and to compare these costs with the ongoing costs of investing in other mutual funds.
The example is based on an investment of $1,000 invested at the beginning of the six-month period and held for the entire period from December 1, 2019 to May 31, 2020.
Actual expenses
The “Actual” line of the table below provides information about actual account values and actual expenses. You may use the information in this line, together with the amount you invested, to estimate the expenses that you paid over the period. Simply divide your account value by $1,000 (for example, an $8,600 account value divided by $1,000 = 8.6), then multiply the result by the number in the “Actual” line under the heading entitled “Expenses paid during period” for your applicable class of shares to estimate the expenses you paid on your account during this period.
Hypothetical example for comparison purposes
The “Hypothetical” line of the table below provides information about hypothetical account values and hypothetical expenses based on the Fund’s actual expense ratio and an assumed rate of return of 5% per year before expenses, which is not the Fund’s actual return. The hypothetical account values and expenses may not be used to estimate the actual ending account balance or expenses you paid for the period. You may use this information to compare the ongoing costs of investing in the Fund and other funds. To do so, compare this 5% hypothetical example with the 5% hypothetical examples that appear in the shareholder reports of the other funds.
Please note that the expenses shown in the table are meant to highlight your ongoing costs only and do not reflect any transactional costs, such as sales charges (loads) and contingent deferred sales charges. Therefore, the “Hypothetical” line of the table is useful in comparing ongoing costs only and will not help you determine the relative total costs of owning different funds. In addition, if these transactional costs were included, your costs would have been higher.
| | | | | | | | | | | | | | | | |
| | | Beginning
account value
12-1-2019 | | | Ending account value
5-31-2020 | | | Expenses paid during
the period1,2 | | | Annualized net expense ratio1 | |
| | | | | |
Class A | | | | | | | | | | | | | | | | |
| | | | |
Actual | | $ | 1,000.00 | | | $ | 928.22 | | | $ | 6.37 | | | | 1.32 | % |
| | | | |
Hypothetical (5% return before expenses) | | $ | 1,000.00 | | | $ | 1,018.39 | | | $ | 6.67 | | | | 1.32 | % |
| | | | | |
Class C | | | | | | | | | | | | | | | | |
| | | | |
Actual | | $ | 1,000.00 | | | $ | 924.71 | | | $ | 9.98 | | | | 2.07 | % |
| | | | |
Hypothetical (5% return before expenses) | | $ | 1,000.00 | | | $ | 1,014.63 | | | $ | 10.45 | | | | 2.07 | % |
| | | | | |
Class R6 | | | | | | | | | | | | | | | | |
| | | | |
Actual | | $ | 1,000.00 | | | $ | 929.94 | | | $ | 4.32 | | | | 0.90 | % |
| | | | |
Hypothetical (5% return before expenses) | | $ | 1,000.00 | | | $ | 1,020.52 | | | $ | 4.52 | | | | 0.90 | % |
| | | | | |
Administrator Class | | | | | | | | | | | | | | | | |
| | | | |
Actual | | $ | 1,000.00 | | | $ | 928.64 | | | $ | 5.79 | | | | 1.20 | % |
| | | | |
Hypothetical (5% return before expenses) | | $ | 1,000.00 | | | $ | 1,019.00 | | | $ | 6.06 | | | | 1.20 | % |
| | | | | |
Institutional Class | | | | | | | | | | | | | | | | |
| | | | |
Actual | | $ | 1,000.00 | | | $ | 929.88 | | | $ | 4.58 | | | | 0.95 | % |
| | | | |
Hypothetical (5% return before expenses) | | $ | 1,000.00 | | | $ | 1,020.25 | | | $ | 4.80 | | | | 0.95 | % |
| 1 | Amounts reflect net expenses allocated from the affiliated Master Portfolio in which the Fund invests. |
| 2 | Expenses paid is equal to the annualized net expense ratio of each class multiplied by the average account value over the period, multiplied by the number of days in the most recent fiscal half-year divided by the number of days in the fiscal year (to reflect the one-half-year period). |
10 | Wells Fargo Small Company Growth Fund
Portfolio of investments—May 31, 2020
| | | | | | | | | | | | | | | | |
| | | | | | | | | | | | Value | |
| Investment Companies: 100.10% | | | | | | | | | | | | | | | | |
| | | | |
| Affiliated Master Portfolio: 100.10% | | | | | | | | | | | | |
Wells Fargo Small Company Growth Portfolio | | | | | | | | | | | | | | $ | 1,358,835,185 | |
| | | | | | | | | | | | | | | | |
| | | | |
Total Investment Companies (Cost $1,071,495,346) | | | | | | | | | | | | | | | 1,358,835,185 | |
| | | | | | | | | | | | | | | | |
| | | | | | | | |
| Total investments in securities (Cost $1,071,495,346) | | | 100.10 | % | | | 1,358,835,185 | |
| | |
Other assets and liabilities, net | | | (0.10 | ) | | | (1,416,903 | ) |
| | | | | | | | |
| Total net assets | | | 100.00 | % | | $ | 1,357,418,282 | |
| | | | | | | | |
Investments in Affiliates
Transactions with the affiliated Master Portfolio were as follows:
| | | | | | | | | | | | | | | | | | | | | | | | | | | | | | | | |
| | | % of
ownership,
beginning
of period | | | % of
ownership,
end of
period | | | Net realized
gains
(losses) on
securities
transactions
allocated
from
affiliated
Master
Portfolio | | | Net change in unrealized
gains
(losses) on
securities
transactions
allocated
from
affiliated
Master
Portfolio | | | Dividends
allocated
from
affiliated
Master
Portfolio | | | Affiliated
income
allocated
from
affiliated
Master
Portfolio | | | Value,
end
of period | | | % of
net
assets | |
Wells Fargo Small Company Growth Portfolio | | | 98 | % | | | 98 | % | | $ | 107,501,645 | | | $ | (28,564,804 | ) | | $ | 9,018,933 | | | $ | 1,162,518 | | | $ | 1,358,835,185 | | | | 100.10 | % |
The accompanying notes are an integral part of these financial statements.
Wells Fargo Small Company Growth Fund | 11
Statement of assets and liabilities—May 31, 2020
| | | | |
| | | | |
| |
Assets | | | | |
Investments in affiliated Master Portfolio, at value (cost $1,071,495,346) | | $ | 1,358,835,185 | |
Receivable for Fund shares sold | | | 1,419,764 | |
Prepaid expenses and other assets | | | 23,511 | |
| | | | |
Total assets | | | 1,360,278,460 | |
| | | | |
| |
Liabilities | | | | |
Payable for Fund shares redeemed | | | 2,418,664 | |
Management fee payable | | | 7,391 | |
Administration fees payable | | | 106,962 | |
Distribution fee payable | | | 5,604 | |
Trustees’ fees and expenses payable | | | 786 | |
Accrued expenses and other liabilities | | | 320,771 | |
| | | | |
Total liabilities | | | 2,860,178 | |
| | | | |
Total net assets | | $ | 1,357,418,282 | |
| | | | |
| |
Net assets consist of | | | | |
Paid-in capital | | $ | 1,043,293,077 | |
Total distributable earnings | | | 314,125,205 | |
| | | | |
Total net assets | | $ | 1,357,418,282 | |
| | | | |
| |
Computation of net asset value and offering price per share | | | | |
Net assets – Class A | | $ | 36,533,966 | |
Shares outstanding – Class A1 | | | 783,692 | |
Net asset value per share – Class A | | | $46.62 | |
Maximum offering price per share – Class A2 | | | $49.46 | |
Net assets – Class C | | $ | 9,335,768 | |
Shares outstanding – Class C1 | | | 234,353 | |
Net asset value per share – Class C | | | $39.84 | |
Net assets – Class R6 | | $ | 462,050,192 | |
Shares outstanding – Class R61 | | | 9,123,693 | |
Net asset value per share – Class R6 | | | $50.64 | |
Net assets – Administrator Class | | $ | 55,917,121 | |
Shares outstanding – Administrator Class1 | | | 1,144,162 | |
Net asset value per share – Administrator Class | | | $48.87 | |
Net assets – Institutional Class | | $ | 793,581,235 | |
Shares outstanding – Institutional Class1 | | | 15,724,433 | |
Net asset value per share – Institutional Class | | | $50.47 | |
| 1 | The Fund has an unlimited number of authorized shares. |
| 2 | Maximum offering price is computed as 100/94.25 of net asset value. On investments of $50,000 or more, the offering price is reduced. |
The accompanying notes are an integral part of these financial statements.
12 | Wells Fargo Small Company Growth Fund
Statement of operations—year ended May 31, 2020
| | | | |
| | | | |
| |
Investment income | | | | |
Dividends allocated from affiliated Master Portfolio (net of foreign withholding taxes of $93,561) | | $ | 9,018,933 | |
Affiliated income allocated from affiliated Master Portfolio | | | 1,162,518 | |
Expenses allocated from affiliated Master Portfolio | | | (12,701,824 | ) |
| | | | |
Total investment income | | | (2,520,373 | ) |
| | | | |
| |
Expenses | | | | |
Management fee | | | 810,230 | |
Administration fees | |
Class A | | | 105,320 | |
Class C | | | 24,959 | |
Class R6 | | | 158,756 | |
Administrator Class | | | 95,924 | |
Institutional Class | | | 1,242,083 | |
Shareholder servicing fees | |
Class A | | | 125,293 | |
Class C | | | 29,712 | |
Administrator Class | | | 184,470 | |
Distribution fee | |
Class C | | | 89,088 | |
Custody and accounting fees | | | 66,019 | |
Professional fees | | | 32,906 | |
Registration fees | | | 154,343 | |
Shareholder report expenses | | | 171,222 | |
Trustees’ fees and expenses | | | 21,592 | |
Other fees and expenses | | | 62,828 | |
| | | | |
Total expenses | | | 3,374,745 | |
Less: Fee waivers and/or expense reimbursements | |
Fund-level | | | (57,072 | ) |
Class A | | | (399 | ) |
Class C | | | (9 | ) |
Administrator Class | | | (30,583 | ) |
Institutional Class | | | (397,607 | ) |
| | | | |
Net expenses | | | 2,889,075 | |
| | | | |
Net investment loss | | | (5,409,448 | ) |
| | | | |
| |
Realized and unrealized gains (losses) on investments | | | | |
Net realized gains on securities transactions allocated from affiliated Master Portfolio | | | 107,501,645 | |
Net change in unrealized gains (losses) on securities transactions allocated from affiliated Master Portfolio | | | (28,564,804 | ) |
| | | | |
Net realized and unrealized gains (losses) on investments | | | 78,936,841 | |
| | | | |
Net increase in net assets resulting from operations | | $ | 73,527,393 | |
| | | | |
The accompanying notes are an integral part of these financial statements.
Wells Fargo Small Company Growth Fund | 13
Statement of changes in net assets
| | | | | | | | | | | | | | | | |
| | | Year ended
May 31, 2020 | | | Year ended
May 31, 2019 | |
| |
Operations | | | | | |
Net investment loss | | | | | | $ | (5,409,448 | ) | | | | | | $ | (5,505,054 | ) |
Net realized gains on investments | | | | | | | 107,501,645 | | | | | | | | 211,071,257 | |
Net change in unrealized gains (losses) on investments | | | | | | | (28,564,804 | ) | | | | | | | (317,347,617 | ) |
| | | | |
Net increase (decrease) in net assets resulting from operations | | | | | | | 73,527,393 | | | | | | | | (111,781,414 | ) |
| | | | |
| | | |
Distributions to shareholders from net realized income and net realized gains | | | | | | | | | | | | |
Class A | | | | | | | (4,577,702 | ) | | | | | | | (4,812,269 | ) |
Class C | | | | | | | (1,219,067 | ) | | | | | | | (1,472,490 | ) |
Class R6 | | | | | | | (43,043,975 | ) | | | | | | | (43,353,220 | ) |
Administrator Class | | | | | | | (6,401,809 | ) | | | | | | | (7,628,191 | ) |
Institutional Class | | | | | | | (80,415,302 | ) | | | | | | | (79,166,580 | ) |
| | | | |
Total distributions to shareholders | | | | | | | (135,657,855 | ) | | | | | | | (136,432,750 | ) |
| | | | |
| | | | |
Capital share transactions | | | Shares | | | | | | | | Shares | | | | | |
Proceeds from shares sold | |
Class A | | | 188,284 | | | | 8,973,220 | | | | 438,493 | | | | 23,606,902 | |
Class C | | | 5,111 | | | | 206,315 | | | | 11,566 | | | | 528,806 | |
Class R6 | | | 1,859,972 | | | | 92,450,593 | | | | 3,125,212 | | | | 184,297,448 | |
Administrator Class | | | 170,705 | | | | 8,517,203 | | | | 504,790 | | | | 28,496,503 | |
Institutional Class | | | 4,127,985 | | | | 204,967,976 | | | | 5,840,084 | | | | 335,266,742 | |
| | | | |
| | | | | | | 315,115,307 | | | | | | | | 572,196,401 | |
| | | | |
Reinvestment of distributions | |
Class A | | | 79,105 | | | | 3,985,289 | | | | 92,633 | | | | 4,427,868 | |
Class C | | | 24,921 | | | | 1,076,603 | | | | 31,746 | | | | 1,328,867 | |
Class R6 | | | 698,418 | | | | 38,147,601 | | | | 735,766 | | | | 37,730,057 | |
Administrator Class | | | 121,124 | | | | 6,394,121 | | | | 152,980 | | | | 7,624,565 | |
Institutional Class | | | 1,085,956 | | | | 59,130,286 | | | | 1,201,482 | | | | 61,455,772 | |
| | | | |
| | | | | | | 108,733,900 | | | | | | | | 112,567,129 | |
| | | | |
Payment for shares redeemed | |
Class A | | | (793,982 | ) | | | (38,317,325 | ) | | | (563,233 | ) | | | (31,063,522 | ) |
Class C | | | (122,441 | ) | | | (5,026,553 | ) | | | (113,094 | ) | | | (5,236,576 | ) |
Class R6 | | | (4,156,884 | ) | | | (211,307,944 | ) | | | (3,393,805 | ) | | | (197,814,217 | ) |
Administrator Class | | | (866,918 | ) | | | (42,999,639 | ) | | | (882,997 | ) | | | (49,514,482 | ) |
Institutional Class | | | (9,445,990 | ) | | | (485,047,988 | ) | | | (6,511,614 | ) | | | (373,073,185 | ) |
| | | | |
| | | | | | | (782,699,449 | ) | | | | | | | (656,701,982 | ) |
| | | | |
Net increase (decrease) in net assets resulting from capital share transactions | | | | | | | (358,850,242 | ) | | | | | | | 28,061,548 | |
| | | | |
Total decrease in net assets | | | | | | | (420,980,704 | ) | | | | | | | (220,152,616 | ) |
| | | | |
| | |
Net assets | | | | | | | | |
Beginning of period | | | | | | | 1,778,398,986 | | | | | | | | 1,998,551,602 | |
| | | | |
End of period | | | | | | $ | 1,357,418,282 | | | | | | | $ | 1,778,398,986 | |
| | | | |
The accompanying notes are an integral part of these financial statements.
14 | Wells Fargo Small Company Growth Fund
Financial highlights
(For a share outstanding throughout each period)
| | | | | | | | | | | | | | | | | | | | |
| | | Year ended May 31 | |
| CLASS A | | 2020 | | | 2019 | | | 2018 | | | 2017 | | | 2016 | |
Net asset value, beginning of period | | | $48.98 | | | | $56.66 | | | | $44.26 | | | | $37.69 | | | | $44.23 | |
Net investment loss | | | (0.34 | )1 | | | (0.36 | ) | | | (0.35 | )1 | | | (0.28 | )1 | | | (0.22 | )1 |
Net realized and unrealized gains (losses) on investments | | | 2.49 | | | | (3.22 | ) | | | 12.75 | | | | 6.85 | | | | (6.05 | ) |
| | | | | | | | | | | | | | | | | | | | |
Total from investment operations | | | 2.15 | | | | (3.58 | ) | | | 12.40 | | | | 6.57 | | | | (6.27 | ) |
Distributions to shareholders from | | | | | | | | | | | | | | | | | | | | |
Net realized gains | | | (4.51 | ) | | | (4.10 | ) | | | 0.00 | | | | 0.00 | | | | (0.27 | ) |
Net asset value, end of period | | | $46.62 | | | | $48.98 | | | | $56.66 | | | | $44.26 | | | | $37.69 | |
Total return2 | | | 3.70 | % | | | (6.13 | )% | | | 28.02 | % | | | 17.43 | % | | | (14.20 | )% |
Ratios to average net assets (annualized) | | | | | | | | | | | | | | | | | | | | |
Gross expenses3 | | | 1.32 | % | | | 1.31 | % | | | 1.32 | % | | | 1.33 | % | | | 1.34 | % |
Net expenses3 | | | 1.32 | % | | | 1.31 | % | | | 1.32 | % | | | 1.33 | % | | | 1.34 | % |
Net investment loss3 | | | (0.69 | )% | | | (0.63 | )% | | | (0.71 | )% | | | (0.68 | )% | | | (0.57 | )% |
Supplemental data | | | | | | | | | | | | | | | | | | | | |
Portfolio turnover rate4 | | | 41 | % | | | 54 | % | | | 37 | % | | | 82 | % | | | 49 | % |
Net assets, end of period (000s omitted) | | | $36,534 | | | | $64,182 | | | | $76,065 | | | | $76,087 | | | | $128,675 | |
| 1 | Calculated based upon average shares outstanding |
| 2 | Total return calculations do not include any sales charges. |
| 3 | Ratios include net expenses allocated from the affiliated Master Portfolio which were as follows: |
| | | | |
Year ended May 31, 2020 | | | 0.78 | % |
Year ended May 31, 2019 | | | 0.78 | % |
Year ended May 31, 2018 | | | 0.78 | % |
Year ended May 31, 2017 | | | 0.78 | % |
Year ended May 31, 2016 | | | 0.80 | % |
| 4 | Portfolio turnover rate is calculated by multiplying the affiliated Master Portfolio’s percentage of the Fund’s total investments in securities at the end of the period by the affiliated Master Portfolio’s portfolio turnover rate. |
The accompanying notes are an integral part of these financial statements.
Wells Fargo Small Company Growth Fund | 15
Financial highlights
(For a share outstanding throughout each period)
| | | | | | | | | | | | | | | | | | | | |
| | | Year ended May 31 | |
| CLASS C | | 2020 | | | 2019 | | | 2018 | | | 2017 | | | 2016 | |
Net asset value, beginning of period | | | $42.75 | | | | $50.38 | | | | $39.65 | | | | $34.02 | | | | $40.25 | |
Net investment loss | | | (0.61 | )1 | | | (0.66 | )1 | | | (0.64 | )1 | | | (0.54 | )1 | | | (0.46 | )1 |
Net realized and unrealized gains (losses) on investments | | | 2.21 | | | | (2.87 | ) | | | 11.37 | | | | 6.17 | | | | (5.50 | ) |
| | | | | | | | | | | | | | | | | | | | |
Total from investment operations | | | 1.60 | | | | (3.53 | ) | | | 10.73 | | | | 5.63 | | | | (5.96 | ) |
Distributions to shareholders from | | | | | | | | | | | | | | | | | | | | |
Net realized gains | | | (4.51 | ) | | | (4.10 | ) | | | 0.00 | | | | 0.00 | | | | (0.27 | ) |
Net asset value, end of period | | | $39.84 | | | | $42.75 | | | | $50.38 | | | | $39.65 | | | | $34.02 | |
Total return2 | | | 2.92 | % | | | (6.82 | )% | | | 27.06 | % | | | 16.55 | % | | | (14.84 | )% |
Ratios to average net assets (annualized) | | | | | | | | | | | | | | | | | | | | |
Gross expenses3 | | | 2.07 | % | | | 2.06 | % | | | 2.07 | % | | | 2.08 | % | | | 2.09 | % |
Net expenses3 | | | 2.07 | % | | | 2.06 | % | | | 2.07 | % | | | 2.08 | % | | | 2.09 | % |
Net investment loss3 | | | (1.44 | )% | | | (1.38 | )% | | | (1.47 | )% | | | (1.43 | )% | | | (1.32 | )% |
Supplemental data | | | | | | | | | | | | | | | | | | | | |
Portfolio turnover rate4 | | | 41 | % | | | 54 | % | | | 37 | % | | | 82 | % | | | 49 | % |
Net assets, end of period (000s omitted) | | | $9,336 | | | | $13,968 | | | | $19,979 | | | | $22,410 | | | | $26,946 | |
| 1 | Calculated based upon average shares outstanding |
| 2 | Total return calculations do not include any sales charges. |
| 3 | Ratios include net expenses allocated from the affiliated Master Portfolio which were as follows: |
| | | | |
Year ended May 31, 2020 | | | 0.78 | % |
Year ended May 31, 2019 | | | 0.78 | % |
Year ended May 31, 2018 | | | 0.78 | % |
Year ended May 31, 2017 | | | 0.78 | % |
Year ended May 31, 2016 | | | 0.80 | % |
| 4 | Portfolio turnover rate is calculated by multiplying the affiliated Master Portfolio’s percentage of the Fund’s total investments in securities at the end of the period by the affiliated Master Portfolio’s portfolio turnover rate. |
The accompanying notes are an integral part of these financial statements.
16 | Wells Fargo Small Company Growth Fund
Financial highlights
(For a share outstanding throughout each period)
| | | | | | | | | | | | | | | | | | | | |
| | | Year ended May 31 | |
| CLASS R6 | | 2020 | | | 2019 | | | 2018 | | | 2017 | | | 2016 | |
Net asset value, beginning of period | | | $52.65 | | | | $60.31 | | | | $46.91 | | | | $39.77 | | | | $46.45 | |
Net investment loss | | | (0.14 | )1 | | | (0.12 | ) | | | (0.14 | ) | | | (0.11 | ) | | | (0.03 | ) |
Net realized and unrealized gains (losses) on investments | | | 2.64 | | | | (3.44 | ) | | | 13.54 | | | | 7.25 | | | | (6.38 | ) |
| | | | | | | | | | | | | | | | | | | | |
Total from investment operations | | | 2.50 | | | | (3.56 | ) | | | 13.40 | | | | 7.14 | | | | (6.41 | ) |
Distributions to shareholders from | | | | | | | | | | | | | | | | | | | | |
Net realized gains | | | (4.51 | ) | | | (4.10 | ) | | | 0.00 | | | | 0.00 | | | | (0.27 | ) |
Net asset value, end of period | | | $50.64 | | | | $52.65 | | | | $60.31 | | | | $46.91 | | | | $39.77 | |
Total return | | | 4.12 | % | | | (5.73 | )% | | | 28.59 | % | | | 17.95 | % | | | (13.83 | )% |
Ratios to average net assets (annualized) | | | | | | | | | | | | | | | | | | | | |
Gross expenses2 | | | 0.90 | % | | | 0.88 | % | | | 0.89 | % | | | 0.90 | % | | | 0.91 | % |
Net expenses2 | | | 0.89 | % | | | 0.88 | % | | | 0.89 | % | | | 0.90 | % | | | 0.90 | % |
Net investment loss2 | | | (0.27 | )% | | | (0.20 | )% | | | (0.29 | )% | | | (0.25 | )% | | | (0.09 | )% |
Supplemental data | | | | | | | | | | | | | | | | | | | | |
Portfolio turnover rate3 | | | 41 | % | | | 54 | % | | | 37 | % | | | 82 | % | | | 49 | % |
Net assets, end of period (000s omitted) | | | $462,050 | | | | $564,516 | | | | $618,523 | | | | $418,111 | | | | $229,391 | |
| 1 | Calculated based upon average shares outstanding |
| 2 | Ratios include net expenses allocated from the affiliated Master Portfolio which were as follows: |
| | | | |
Year ended May 31, 2020 | | | 0.78 | % |
Year ended May 31, 2019 | | | 0.78 | % |
Year ended May 31, 2018 | | | 0.78 | % |
Year ended May 31, 2017 | | | 0.78 | % |
Year ended May 31, 2016 | | | 0.80 | % |
| 3 | Portfolio turnover rate is calculated by multiplying the affiliated Master Portfolio’s percentage of the Fund’s total investments in securities at the end of the period by the affiliated Master Portfolio’s portfolio turnover rate. |
The accompanying notes are an integral part of these financial statements.
Wells Fargo Small Company Growth Fund | 17
Financial highlights
(For a share outstanding throughout each period)
| | | | | | | | | | | | | | | | | | | | |
| | | Year ended May 31 | |
| ADMINISTRATOR CLASS | | 2020 | | | 2019 | | | 2018 | | | 2017 | | | 2016 | |
Net asset value, beginning of period | | | $51.10 | | | | $58.85 | | | | $45.91 | | | | $39.05 | | | | $45.73 | |
Net investment loss | | | (0.29 | )1 | | | (0.29 | )1 | | | (0.30 | )1 | | | (0.24 | )1 | | | (0.19 | )1 |
Net realized and unrealized gains (losses) on investments | | | 2.57 | | | | (3.36 | ) | | | 13.24 | | | | 7.10 | | | | (6.22 | ) |
| | | | | | | | | | | | | | | | | | | | |
Total from investment operations | | | 2.28 | | | | (3.65 | ) | | | 12.94 | | | | 6.86 | | | | (6.41 | ) |
Distributions to shareholders from | | | | | | | | | | | | | | | | | | | | |
Net realized gains | | | (4.51 | ) | | | (4.10 | ) | | | 0.00 | | | | 0.00 | | | | (0.27 | ) |
Net asset value, end of period | | | $48.87 | | | | $51.10 | | | | $58.85 | | | | $45.91 | | | | $39.05 | |
Total return | | | 3.80 | % | | | (6.02 | )% | | | 28.19 | % | | | 17.57 | % | | | (14.04 | )% |
Ratios to average net assets (annualized) | | | | | | | | | | | | | | | | | | | | |
Gross expenses2 | | | 1.24 | % | | | 1.23 | % | | | 1.24 | % | | | 1.25 | % | | | 1.25 | % |
Net expenses2 | | | 1.20 | % | | | 1.20 | % | | | 1.20 | % | | | 1.20 | % | | | 1.20 | % |
Net investment loss2 | | | (0.57 | )% | | | (0.51 | )% | | | (0.60 | )% | | | (0.55 | )% | | | (0.46 | )% |
Supplemental data | | | | | | | | | | | | | | | | | | | | |
Portfolio turnover rate3 | | | 41 | % | | | 54 | % | | | 37 | % | | | 82 | % | | | 49 | % |
Net assets, end of period (000s omitted) | | | $55,917 | | | | $87,850 | | | | $114,429 | | | | $130,311 | | | | $130,104 | |
| 1 | Calculated based upon average shares outstanding |
| 2 | Ratios include net expenses allocated from the affiliated Master Portfolio which were as follows: |
| | | | |
Year ended May 31, 2020 | | | 0.78 | % |
Year ended May 31, 2019 | | | 0.78 | % |
Year ended May 31, 2018 | | | 0.78 | % |
Year ended May 31, 2017 | | | 0.78 | % |
Year ended May 31, 2016 | | | 0.80 | % |
| 3 | Portfolio turnover rate is calculated by multiplying the affiliated Master Portfolio’s percentage of the Fund’s total investments in securities at the end of the period by the affiliated Master Portfolio’s portfolio turnover rate. |
The accompanying notes are an integral part of these financial statements.
18 | Wells Fargo Small Company Growth Fund
Financial highlights
(For a share outstanding throughout each period)
| | | | | | | | | | | | | | | | | | | | |
| | | Year ended May 31 | |
| INSTITUTIONAL CLASS | | 2020 | | | 2019 | | | 2018 | | | 2017 | | | 2016 | |
Net asset value, beginning of period | | | $52.51 | | | | $60.20 | | | | $46.85 | | | | $39.75 | | | | $46.44 | |
Net investment loss | | | (0.17 | )1 | | | (0.15 | ) | | | (0.19 | ) | | | (0.15 | ) | | | (0.09 | ) |
Net realized and unrealized gains (losses) on investments | | | 2.64 | | | | (3.44 | ) | | | 13.54 | | | | 7.25 | | | | (6.33 | ) |
| | | | | | | | | | | | | | | | | | | | |
Total from investment operations | | | 2.47 | | | | (3.59 | ) | | | 13.35 | | | | 7.10 | | | | (6.42 | ) |
Distributions to shareholders from | | | | | | | | | | | | | | | | | | | | |
Net realized gains | | | (4.51 | ) | | | (4.10 | ) | | | 0.00 | | | | 0.00 | | | | (0.27 | ) |
Net asset value, end of period | | | $50.47 | | | | $52.51 | | | | $60.20 | | | | $46.85 | | | | $39.75 | |
Total return | | | 4.07 | % | | | (5.77 | )% | | | 28.50 | % | | | 17.86 | % | | | (13.85 | )% |
Ratios to average net assets (annualized) | | | | | | | | | | | | | | | | | | | | |
Gross expenses2 | | | 1.00 | % | | | 0.98 | % | | | 0.99 | % | | | 1.00 | % | | | 1.01 | % |
Net expenses2 | | | 0.95 | % | | | 0.95 | % | | | 0.95 | % | | | 0.95 | % | | | 0.95 | % |
Net investment loss2 | | | (0.32 | )% | | | (0.26 | )% | | | (0.35 | )% | | | (0.31 | )% | | | (0.18 | )% |
Supplemental data | | | | | | | | | | | | | | | | | | | | |
Portfolio turnover rate3 | | | 41 | % | | | 54 | % | | | 37 | % | | | 82 | % | | | 49 | % |
Net assets, end of period (000s omitted) | | | $793,581 | | | | $1,047,883 | | | | $1,169,555 | | | | $1,014,847 | | | | $678,699 | |
| 1 | Calculated based upon average shares outstanding |
| 2 | Ratios include net expenses allocated from the affiliated Master Portfolio which were as follows: |
| | | | |
Year ended May 31, 2020 | | | 0.78 | % |
Year ended May 31, 2019 | | | 0.78 | % |
Year ended May 31, 2018 | | | 0.78 | % |
Year ended May 31, 2017 | | | 0.78 | % |
Year ended May 31, 2016 | | | 0.80 | % |
| 3 | Portfolio turnover rate is calculated by multiplying the affiliated Master Portfolio’s percentage of the Fund’s total investments in securities at the end of the period by the affiliated Master Portfolio’s portfolio turnover rate. |
The accompanying notes are an integral part of these financial statements.
Wells Fargo Small Company Growth Fund | 19
Notes to financial statements
1. ORGANIZATION
Wells Fargo Funds Trust (the “Trust”), a Delaware statutory trust organized on March 10, 1999, is an open-end management investment company registered under the Investment Company Act of 1940, as amended (the “1940 Act”). As an investment company, the Trust follows the accounting and reporting guidance in Financial Accounting Standards Board (“FASB”) Accounting Standards Codification Topic 946, Financial Services – Investment Companies. These financial statements report on the Wells Fargo Small Company Growth Fund (the “Fund”) which is a diversified series of the Trust.
The Fund is a feeder fund in a master-feeder structure that invests substantially all of its assets in a single master portfolio with a substantially identical investment objective and substantially similar investment strategies. The Fund invests in Wells Fargo Small Company Growth Portfolio (the “affiliated Master Portfolio”) which is a separate diversified portfolio of Wells Fargo Master Trust, a registered open-end management investment company. As of May 31, 2020, the Fund owned 98% of Wells Fargo Small Company Growth Portfolio. The affiliated Master Portfolio directly acquires portfolio securities and the Fund acquires an indirect interest in those securities. The Fund accounts for its investment in the affiliated Master Portfolio as a partnership investment and records on a daily basis its share of the affiliated Master Portfolio’s income, expense and realized and unrealized gains and losses. The financial statements of the affiliated Master Portfolio for the year ended May 31, 2020 are included in this report and should be read in conjunction with the Fund’s financial statements.
2. SIGNIFICANT ACCOUNTING POLICIES
The following significant accounting policies, which are consistently followed in the preparation of the financial statements of the Fund, are in conformity with U.S. generally accepted accounting principles which require management to make estimates and assumptions that affect the reported amounts of assets and liabilities, disclosure of contingent assets and liabilities at the date of the financial statements, and the reported amounts of revenues and expenses during the reporting period. Actual results could differ from those estimates.
Securities valuation
All investments are valued each business day as of the close of regular trading on the New York Stock Exchange (generally 4 p.m. Eastern Time), although the Fund may deviate from this calculation time under unusual or unexpected circumstances.
Investments in the affiliated Master Portfolio are valued daily based on the Fund’s proportionate share of the affiliated Master Portfolio’s net assets, which are also valued daily. Securities held in the affiliated Master Portfolio are valued as discussed in the Notes to Financial Statements of the affiliated Master Portfolio, which are included elsewhere in this report.
Investments which are not valued using the method discussed above are valued at their fair value, as determined in good faith by the Board of Trustees of the Fund. The Board of Trustees has established a Valuation Committee comprised of the Trustees and has delegated to it the authority to take any actions regarding the valuation of portfolio securities that the Valuation Committee deems necessary or appropriate, including determining the fair value of portfolio securities, unless the determination has been delegated to the Wells Fargo Asset Management Pricing Committee at Wells Fargo Funds Management, LLC (“Funds Management”). The Board of Trustees retains the authority to make or ratify any valuation decisions or approve any changes to the Valuation Procedures as it deems appropriate. On a quarterly basis, the Board of Trustees receives reports on any valuation actions taken by the Valuation Committee or the Wells Fargo Asset Management Pricing Committee which may include items for ratification.
Investment transactions, income and expenses
Investments in the affiliated Master Portfolio are recorded on a trade basis. The Fund records daily its proportionate share of the affiliated Master Portfolio’s income, expenses and realized and unrealized gains or losses. The Fund also accrues its own expenses.
Distributions to shareholders
Distributions to shareholders from net investment income and any net realized gains are recorded on the ex-dividend date and paid at least annually. Such distributions are determined in accordance with income tax regulations and may differ from U.S. generally accepted accounting principles. Dividend sources are estimated at the time of declaration. The tax character of distributions is determined as of the Fund’s fiscal year end. Therefore, a portion of the Fund’s distributions made prior to the Fund’s fiscal year end may be categorized as a tax return of capital at year end.
Federal and other taxes
The Fund intends to continue to qualify as a regulated investment company by distributing substantially all of its investment company taxable income and any net realized capital gains (after reduction for capital loss carryforwards) sufficient to relieve it from all, or substantially all, federal income taxes. Accordingly, no provision for federal income taxes was required.
20 | Wells Fargo Small Company Growth Fund
Notes to financial statements
The Fund’s income and federal excise tax returns and all financial records supporting those returns for the prior three fiscal years are subject to examination by the federal and Delaware revenue authorities. Management has analyzed the Fund’s tax positions taken on federal, state, and foreign tax returns for all open tax years and does not believe that there are any uncertain tax positions that require recognition of a tax liability.
As of May 31, 2020, the aggregate cost of all investments for federal income tax purposes was $1,091,054,328 and the unrealized gains (losses) consisted of:
| | | | |
| |
Gross unrealized gains | | $ | 287,339,839 | |
| |
Gross unrealized losses | | | (19,558,982 | ) |
| |
Net unrealized gains | | $ | 267,780,857 | |
Class allocations
The separate classes of shares offered by the Fund differ principally in applicable sales charges, distribution, shareholder servicing, and administration fees. Class specific expenses are charged directly to that share class. Investment income, common fund-level expenses, and realized and unrealized gains (losses) on investments are allocated daily to each class of shares based on the relative proportion of net assets of each class.
3. FAIR VALUATION MEASUREMENTS
At May 31, 2020, the affiliated Master Portfolio was measured at fair value using the net asset value per share (or its equivalent) as a practical expedient. The investment objective and the value of the affiliate Master Portfolio was as follows:
| | | | | | |
| | |
| Affiliated Master Portfolio | | Investment objective | | Value of affiliated Master Portfolio | |
| | |
Wells Fargo Small Company Growth Portfolio | | Seeks long-term capital appreciation | | $ | 1,358,835,185 | |
The affiliated Master Portfolio does not have a redemption period notice, can be redeemed daily and does not have any unfunded commitments.
4. TRANSACTIONS WITH AFFILIATES
Management fee
Funds Management, an indirect wholly owned subsidiary of Wells Fargo & Company (“Wells Fargo”), is the manager of the Fund and provides advisory and fund-level administrative services under an investment management agreement. Under the investment management agreement, Funds Management is responsible for, among other services, implementing the investment objectives and strategies of the Fund and providing fund-level administrative services in connection with the Fund’s operations. As long as the Fund continues to invest substantially all of its assets in a single affiliated Master Portfolio, the Fund pays Funds Management an investment management fee only for fund-level administrative services at the following annual rate based on the Fund’s average daily net assets:
| | | | |
| |
| Average daily net assets | | Management fee | |
| |
First $5 billion | | | 0.05 | % |
| |
Next $5 billion | | | 0.04 | |
| |
Over $10 billion | | | 0.03 | |
For the year ended May 31, 2020, the management fee was equivalent to an annual rate of 0.05% of the Fund’s average daily net assets.
Funds Management also serves as the adviser to the affiliated Master Portfolio and is entitled to receive a fee from the affiliated Master Portfolio for those services.
Wells Fargo Small Company Growth Fund | 21
Notes to financial statements
Administration fees
Under a class-level administration agreement, Funds Management provides class-level administrative services to the Fund, which includes paying fees and expenses for services provided by the transfer agent, sub-transfer agents, omnibus account servicers and record-keepers. As compensation for its services under the class-level administration agreement, Funds Management receives an annual fee which is calculated based on the average daily net assets of each class as follows:
| | | | |
| |
| | | Class-level
administration fee | |
| |
Class A, Class C | | | 0.21 | % |
| |
Class R6 | | | 0.03 | |
| |
Administrator Class, Institutional Class | | | 0.13 | |
Waivers and/or expense reimbursements
Funds Management has contractually waived and/or reimbursed management and administration fees to the extent necessary to maintain certain net operating expense ratios for the Fund. When each class of the Fund has exceeded its expense cap, Funds Management has waived fees and/or reimbursed expenses from fund-level expenses on a proportionate basis and then from class specific expenses. When only certain classes exceed their expense caps, waivers and/or reimbursements are applied against class specific expenses before fund-level expenses. Funds Management has committed through May 31, 2020 to waive fees and/or reimburse expenses to the extent necessary to cap the Fund’s expenses at 1.33% for Class A shares, 2.08% for Class C shares, 0.90% for Class R6 shares, 1.20% for Administrator Class shares and 0.95% for Institutional Class shares. Prior to or after the commitment expiration date, the cap may be increased or the commitment to maintain the cap may be terminated only with the approval of the Board of Trustees. Prior to October 1, 2019, the Fund’s expenses were capped at 1.35% for Class A shares and 2.10% for Class C shares.
Distribution fee
The Trust has adopted a distribution plan for Class C shares of the Fund pursuant to Rule 12b-1 under the 1940 Act. A distribution fee is charged to Class C shares and paid to Wells Fargo Funds Distributor, LLC (“Funds Distributor”), the principal underwriter, at an annual rate of 0.75% of the average daily net assets of Class C shares.
In addition, Funds Distributor is entitled to receive the front-end sales charge from the purchase of Class A shares and a contingent deferred sales charge on the redemption of certain Class A shares. Funds Distributor is also entitled to receive the contingent deferred sales charges from redemptions of Class C shares. For the year ended May 31, 2020, Funds Distributor received $607 from the sale of Class A shares and $12 in contingent deferred sales charges from redemptions of Class C shares. No contingent deferred sales charges were incurred by Class A shares for the year ended May 31, 2020.
Shareholder servicing fees
The Trust has entered into contracts with one or more shareholder servicing agents, whereby Class A, Class C, and Administrator Class of the Fund are charged a fee at an annual rate of 0.25% of the average daily net assets of each respective class. A portion of these total shareholder servicing fees were paid to affiliates of Wells Fargo.
5. INVESTMENT PORTFOLIO TRANSACTIONS
The Fund seeks to achieve its investment objective by investing substantially all of its assets in a single affiliated Master Portfolio. Purchases and sales have been calculated by multiplying the Fund’s ownership percentage of the affiliated Master Portfolio by the affiliated Master Portfolio’s purchases and sales. Purchases and sales of investments, excluding short-term securities, for the year ended May 31, 2020 were $642,998,159 and $1,076,896,350, respectively.
6. BANK BORROWINGS
The Trust (excluding the money market funds), Wells Fargo Master Trust and Wells Fargo Variable Trust are parties to a $280,000,000 revolving credit agreement whereby the Fund is permitted to use bank borrowings for temporary or emergency purposes, such as to fund shareholder redemption requests. Interest under the credit agreement is charged to the Fund based on a borrowing rate equal to the higher of the Federal Funds rate in effect on that day plus 1.25% or the overnight LIBOR rate in effect on that day plus 1.25%. In addition, an annual commitment fee equal to 0.25% of the unused balance is allocated to each participating fund.
For the year ended May 31, 2020, there were no borrowings by the Fund under the agreement.
22 | Wells Fargo Small Company Growth Fund
Notes to financial statements
7. DISTRIBUTIONS TO SHAREHOLDERS
The tax character of distributions paid during the years ended May 31, 2020 and May 31, 2019 were as follows:
| | | | | | | | |
| | | Year ended May 31 | |
| | |
| | | 2020 | | | 2019 | |
| | |
Ordinary income | | $ | 12,251,811 | | | $ | 30,719,230 | |
| | |
Long-term capital gain | | | 123,406,044 | | | | 105,713,520 | |
As of May 31, 2020, the components of distributable earnings on a tax basis were as follows:
| | | | |
Undistributed ordinary income | | Undistributed long-term gain | | Unrealized gains |
| | |
| $4,117,873 | | $42,226,475 | | $267,780,857 |
8. CONCENTRATION RISKS
Concentration risks result from exposure to a limited number of sectors. Through its investment in the affiliated Master Portfolio which may invest a substantial portion of its assets in any sector, the Fund may in turn be more affected by changes in that sector than a fund whose investments are not heavily weighted in any sector. As of the end of the period, the Fund invested a concentration of its portfolio in the health care and information technology sectors.
9. INDEMNIFICATION
Under the Fund’s organizational documents, the officers and Trustees have been granted certain indemnification rights against certain liabilities that may arise out of performance of their duties to the Fund. The Fund has entered into a separate agreement with each Trustee that converts indemnification rights currently existing under the Fund’s organizational documents into contractual rights that cannot be changed in the future without the consent of the Trustee. Additionally, in the normal course of business, the Fund may enter into contracts with service providers that contain a variety of indemnification clauses. The Fund’s maximum exposure under these arrangements is dependent on future claims that may be made against the Fund and, therefore, cannot be estimated.
10. NEW ACCOUNTING PRONOUNCEMENT
In August 2018, FASB issued Accounting Standards Update (“ASU”) No. 2018-13, Fair Value Measurement (Topic 820) Disclosure Framework—Changes to the Disclosure Requirements for Fair Value Measurement. ASU 2018-13 updates the disclosure requirements for fair value measurements by modifying or removing certain disclosures and adding certain new disclosures. The amendments are effective for fiscal years, and interim periods within those fiscal years, beginning after December 15, 2019. Early adoption is permitted. Management has adopted the removal and modification of disclosures early, as permitted, and will adopt the additional new disclosures at the effective date.
11. CORONAVIRUS (COVID-19) PANDEMIC
On March 11, 2020, the World Health Organization announced that it had made the assessment that coronavirus disease 2019 (“COVID-19”) is a pandemic. The impacts of COVID-19 are adversely affecting the entire global economy, individual companies and investment products, and the market in general. There is significant uncertainty around the extent and duration of business disruptions related to COVID-19 and the impacts may be short term or may last for an extended period of time. The risk of further spreading of COVID-19 has led to significant uncertainty and volatility in the financial markets. The value of the Fund and the Master Portfolio in which the Fund invests have generally been adversely affected by impacts caused by COVID-19.
Wells Fargo Small Company Growth Fund | 23
Report of independent registered public accounting firm
TO THE SHAREHOLDERS OF THE FUND AND BOARD OF TRUSTEES WELLS FARGO FUNDS TRUST:
Opinion on the Financial Statements
We have audited the accompanying statement of assets and liabilities of Wells Fargo Small Company Growth Fund (the Fund), one of the funds constituting Wells Fargo Funds Trust, including the portfolio of investments, as of May 31, 2020, the related statement of operations for the year then ended, the statements of changes in net assets for each of the years in the two-year period then ended, and the related notes (collectively, the financial statements) and the financial highlights for each of the years in the five-year period then ended. In our opinion, the financial statements and financial highlights present fairly, in all material respects, the financial position of the Fund as of May 31, 2020, the results of its operations for the year then ended, the changes in its net assets for each of the years in the two-year period then ended, and the financial highlights for each of the years in the five-year period then ended, in conformity with U.S. generally accepted accounting principles.
Basis for Opinion
These financial statements and financial highlights are the responsibility of the Fund’s management. Our responsibility is to express an opinion on these financial statements and financial highlights based on our audits. We are a public accounting firm registered with the Public Company Accounting Oversight Board (United States) (PCAOB) and are required to be independent with respect to the Fund in accordance with the U.S. federal securities laws and the applicable rules and regulations of the Securities and Exchange Commission and the PCAOB.
We conducted our audits in accordance with the standards of the PCAOB. Those standards require that we plan and perform the audit to obtain reasonable assurance about whether the financial statements and financial highlights are free of material misstatement, whether due to error or fraud. Our audits included performing procedures to assess the risks of material misstatement of the financial statements and financial highlights, whether due to error or fraud, and performing procedures that respond to those risks. Such procedures included examining, on a test basis, evidence regarding the amounts and disclosures in the financial statements and financial highlights. Such procedures also included confirmation of securities owned as of May 31, 2020, by correspondence with the transfer agent. Our audits also included evaluating the accounting principles used and significant estimates made by management, as well as evaluating the overall presentation of the financial statements and financial highlights. We believe that our audits provide a reasonable basis for our opinion.

We have not been able to determine the specific year that we began serving as the auditor of one or more Wells Fargo Funds investment companies; however we are aware that we have served as the auditor of one or more Wells Fargo Funds investment companies since at least 1955.
Boston, Massachusetts
July 29, 2020
24 | Wells Fargo Small Company Growth Fund
Portfolio of investments—May 31, 2020
| | | | | | | | | | | | | | | | |
| | | | | | | | | Shares | | | Value | |
| Common Stocks: 97.13% | | | | | | | | | | | | | | | | |
| | | | |
Communication Services: 1.66% | | | | | | | | | | | | | | | | |
| | | | |
| Entertainment: 1.66% | | | | | | | | | | | | |
Lions Gate Entertainment Class B † | | | | | | | | | | | 719,341 | | | $ | 5,416,638 | |
Zynga Incorporated Class A † | | | | | | | | | | | 1,916,328 | | | | 17,534,401 | |
| | | | |
| | | | | | | | | | | | | | | 22,951,039 | |
| | | | | | | | | | | | | | | | |
| | | | |
Consumer Discretionary: 7.89% | | | | | | | | | | | | | | | | |
| | | | |
| Auto Components: 0.56% | | | | | | | | | | | | |
Fox Factory Holding Corporation † | | | | | | | | | | | 107,517 | | | | 7,753,051 | |
| | | | | | | | | | | | | | | | |
| | | | |
| Diversified Consumer Services: 1.29% | | | | | | | | | | | | |
Houghton Mifflin Harcourt Company † | | | | | | | | | | | 241,654 | | | | 369,731 | |
Strategic Education Incorporated | | | | | | | | | | | 102,735 | | | | 17,426,938 | |
| | | | |
| | | | | | | | | | | | | | | 17,796,669 | |
| | | | | | | | | | | | | | | | |
| | | | |
| Hotels, Restaurants & Leisure: 1.25% | | | | | | | | | | | | |
Extended Stay America Incorporated | | | | | | | | | | | 822,181 | | | | 9,455,082 | |
International Game Technology | | | | | | | | | | | 939,706 | | | | 7,921,722 | |
| | | | |
| | | | | | | | | | | | | | | 17,376,804 | |
| | | | | | | | | | | | | | | | |
| | | | |
| Household Durables: 1.03% | | | | | | | | | | | | |
Skyline Champion Corporation † | | | | | | | | | | | 573,235 | | | | 14,239,157 | |
| | | | | | | | | | | | | | | | |
| | | | |
| Leisure Products: 0.67% | | | | | | | | | | | | |
Callaway Golf Company | | | | | | | | | | | 604,836 | | | | 9,266,088 | |
| | | | | | | | | | | | | | | | |
| | | | |
| Multiline Retail: 1.17% | | | | | | | | | | | | |
Ollie’s Bargain Outlet Holdings Incorporated † | | | | | | | | | | | 177,916 | | | | 16,270,418 | |
| | | | | | | | | | | | | | | | |
| | | | |
| Specialty Retail: 1.92% | | | | | | | | | | | | |
Boot Barn Holdings Incorporated † | | | | | | | | | | | 341,437 | | | | 7,334,067 | |
Burlington Stores Incorporated † | | | | | | | | | | | 59,574 | | | | 12,490,881 | |
Monro Muffler Brake Incorporated | | | | | | | | | | | 122,195 | | | | 6,732,945 | |
| | | | |
| | | | | | | | | | | | | | | 26,557,893 | |
| | | | | | | | | | | | | | | | |
| | | | |
Consumer Staples: 1.03% | | | | | | | | | | | | | | | | |
| | | | |
| Food & Staples Retailing: 1.03% | | | | | | | | | | | | |
Performance Food Group Company † | | | | | | | | | | | 536,493 | | | | 14,297,538 | |
| | | | | | | | | | | | | | | | |
| | | | |
Energy: 0.45% | | | | | | | | | | | | | | | | |
| | | | |
| Oil, Gas & Consumable Fuels: 0.45% | | | | | | | | | | | | |
GasLog Limited | | | | | | | | | | | 694,831 | | | | 2,383,270 | |
Parsley Energy Incorporated Class A | | | | | | | | | | | 417,024 | | | | 3,811,599 | |
| | | | |
| | | | | | | | | | | | | | | 6,194,869 | |
| | | | | | | | | | | | | | | | |
| | | | |
Financials: 10.59% | | | | | | | | | | | | | | | | |
| | | | |
| Banks: 1.47% | | | | | | | | | | | | |
SVB Financial Group † | | | | | | | | | | | 59,943 | | | | 12,872,759 | |
Triumph Bancorp Incorporated † | | | | | | | | | | | 308,801 | | | | 7,581,065 | |
| | | | |
| | | | | | | | | | | | | | | 20,453,824 | |
| | | | | | | | | | | | | | | | |
The accompanying notes are an integral part of these financial statements.
Wells Fargo Small Company Growth Portfolio | 25
Portfolio of investments—May 31, 2020
| | | | | | | | | | | | | | | | |
| | | | | | | | | Shares | | | Value | |
| Capital Markets: 3.79% | | | | | | | | | | | | |
Evercore Partners Incorporated Class A | | | | | | | | | | | 218,607 | | | $ | 12,047,432 | |
Focus Financial Partners Class A † | | | | | | | | | | | 419,446 | | | | 11,677,377 | |
Stifel Financial Corporation | | | | | | | | | | | 365,020 | | | | 17,415,104 | |
VIRTU Financial Incorporated Class A | | | | | | | | | | | 475,625 | | | | 11,343,656 | |
| | | | |
| | | | | | | | | | | | | | | 52,483,569 | |
| | | | | | | | | | | | | | | | |
| | | | |
| Consumer Finance: 0.78% | | | | | | | | | | | | |
FirstCash Financial Services Incorporated | | | | | | | | | | | 154,917 | | | | 10,808,559 | |
| | | | | | | | | | | | | | | | |
| | | | |
| Insurance: 3.44% | | | | | | | | | | | | |
Argo Group International Holdings Limited | | | | | | | | | | | 238,366 | | | | 7,315,453 | |
BRP Group Incorporated Class A † | | | | | | | | | | | 365,802 | | | | 4,535,945 | |
Goosehead Insurance Incorporated Class A † | | | | | | | | | | | 264,580 | | | | 15,861,571 | |
Palomar Holdings Incorporated † | | | | | | | | | | | 268,640 | | | | 19,992,189 | |
| | | | |
| | | | | | | | | | | | | | | 47,705,158 | |
| | | | | | | | | | | | | | | | |
| | | | |
| Thrifts & Mortgage Finance: 1.11% | | | | | | | | | | | | |
Essent Group Limited | | | | | | | | | | | 463,931 | | | | 15,332,920 | |
| | | | | | | | | | | | | | | | |
| | | | |
Health Care: 28.11% | | | | | | | | | | | | | | | | |
| | | | |
| Biotechnology: 10.06% | | | | | | | | | | | | |
ACADIA Pharmaceuticals Incorporated † | | | | | | | | | | | 234,455 | | | | 11,647,724 | |
Agios Pharmaceuticals Incorporated † | | | | | | | | | | | 130,347 | | | | 6,744,154 | |
Alnylam Pharmaceuticals Incorporated † | | | | | | | | | | | 68,920 | | | | 9,322,808 | |
Amicus Therapeutics Incorporated † | | | | | | | | | | | 775,259 | | | | 9,671,356 | |
bluebird bio Incorporated † | | | | | | | | | | | 93,301 | | | | 5,936,743 | |
Blueprint Medicines Corporation † | | | | | | | | | | | 137,047 | | | | 8,927,242 | |
Emergent BioSolutions Incorporated † | | | | | | | | | | | 145,123 | | | | 12,116,319 | |
Flexion Therapeutics Incorporated † | | | | | | | | | | | 412,765 | | | | 4,717,904 | |
Galapagos NV † | | | | | | | | | | | 25,504 | | | | 5,171,701 | |
Global Blood Therapeutics Incorporated † | | | | | | | | | | | 139,724 | | | | 9,769,502 | �� |
Immunomedics Incorporated † | | | | | | | | | | | 367,638 | | | | 12,348,960 | |
Ionis Pharmaceuticals Incorporated † | | | | | | | | | | | 154,711 | | | | 8,696,305 | |
Iovance Biotherapeutics Incorporated † | | | | | | | | | | | 294,259 | | | | 9,442,771 | |
Ironwood Pharmaceuticals Incorporated † | | | | | | | | | | | 883,974 | | | | 8,601,067 | |
Momenta Pharmaceuticals Incorporated † | | | | | | | | | | | 332,097 | | | | 10,454,414 | |
Zymeworks Incorporated † | | | | | | | | | | | 151,404 | | | | 5,771,520 | |
| | | | |
| | | | | | | | | | | | | | | 139,340,490 | |
| | | | | | | | | | | | | | | | |
| | | | |
| Health Care Equipment & Supplies: 5.69% | | | | | | | | | | | | |
Atricure Incorporated † | | | | | | | | | | | 231,403 | | | | 11,063,377 | |
Axonics Modulation Technologies Incorporated † | | | | | | | | | | | 413,821 | | | | 15,174,816 | |
Cardiovascular Systems Incorporated † | | | | | | | | | | | 304,597 | | | | 11,793,996 | |
Cerus Corporation † | | | | | | | | | | | 1,159,435 | | | | 7,211,686 | |
Novocure Limited † | | | | | | | | | | | 137,312 | | | | 9,258,948 | |
Silk Road Medical Incorporated † | | | | | | | | | | | 387,046 | | | | 14,812,250 | |
Tactile Systems Technology Class I † | | | | | | | | | | | 196,160 | | | | 9,503,952 | |
| | | | |
| | | | | | | | | | | | | | | 78,819,025 | |
| | | | | | | | | | | | | | | | |
| | | | |
| Health Care Providers & Services: 2.39% | | | | | | | | | | | | |
AMN Healthcare Services Incorporated † | | | | | | | | | | | 192,345 | | | | 8,532,424 | |
HealthEquity Incorporated † | | | | | | | | | | | 152,371 | | | | 9,442,431 | |
PetIQ Incorporated † | | | | | | | | | | | 492,799 | | | | 15,119,073 | |
| | | | |
| | | | | | | | | | | | | | | 33,093,928 | |
| | | | | | | | | | | | | | | | |
The accompanying notes are an integral part of these financial statements.
26 | Wells Fargo Small Company Growth Portfolio
Portfolio of investments—May 31, 2020
| | | | | | | | | | | | | | | | |
| | | | | | | | | Shares | | | Value | |
| Health Care Technology: 4.21% | | | | | | | | | | | | |
Allscripts Healthcare Solutions Incorporated † | | | | | | | | | | | 957,906 | | | $ | 6,053,966 | |
Evolent Health Incorporated Class A † | | | | | | | | | | | 835,824 | | | | 7,422,117 | |
Omnicell Incorporated † | | | | | | | | | | | 207,322 | | | | 13,871,915 | |
Phreesia Incorporated † | | | | | | | | | | | 342,337 | | | | 10,037,321 | |
Tabula Rasa Healthcare Incorporated † | | | | | | | | | | | 172,337 | | | | 9,207,966 | |
Teladoc Incorporated † | | | | | | | | | | | 67,761 | | | | 11,794,480 | |
| | | | |
| | | | | | | | | | | | | | | 58,387,765 | |
| | | | | | | | | | | | | | | | |
| | | | |
| Life Sciences Tools & Services: 5.08% | | | | | | | | | | | | |
Adaptive Biotechnologies Corporation † | | | | | | | | | | | 270,607 | | | | 10,472,491 | |
Avantor Incorporated † | | | | | | | | | | | 757,414 | | | | 14,368,144 | |
ICON plc ADR † | | | | | | | | | | | 135,749 | | | | 22,866,919 | |
Syneos Health Incorporated † | | | | | | | | | | | 372,725 | | | | 22,732,498 | |
| | | | |
| | | | | | | | | | | | | | | 70,440,052 | |
| | | | | | | | | | | | | | | | |
| | | | |
| Pharmaceuticals: 0.68% | | | | | | | | | | | | |
Pacira Pharmaceuticals Incorporated † | | | | | | | | | | | 213,084 | | | | 9,365,042 | |
| | | | | | | | | | | | | | | | |
| | | | |
Industrials: 14.95% | | | | | | | | | | | | | | | | |
| | | | |
| Aerospace & Defense: 0.96% | | | | | | | | | | | | |
Kratos Defense & Security Solutions Incorporated † | | | | | | | | | | | 719,616 | | | | 13,348,877 | |
| | | | | | | | | | | | | | | | |
| | | | |
| Air Freight & Logistics: 0.43% | | | | | | | | | | | | |
Hub Group Incorporated Class A † | | | | | | | | | | | 128,082 | | | | 5,990,395 | |
| | | | | | | | | | | | | | | | |
| | | | |
| Building Products: 1.77% | | | | | | | | | | | | |
A.O. Smith Corporation | | | | | | | | | | | 124,626 | | | | 5,919,735 | |
Masonite International Corporation † | | | | | | | | | | | 184,026 | | | | 12,215,646 | |
PGT Incorporated † | | | | | | | | | | | 468,723 | | | | 6,379,320 | |
| | | | |
| | | | | | | | | | | | | | | 24,514,701 | |
| | | | | | | | | | | | | | | | |
| | | | |
| Commercial Services & Supplies: 1.35% | | | | | | | | | | | | |
IAA Incorporated † | | | | | | | | | | | 283,495 | | | | 11,623,295 | |
KAR Auction Services Incorporated | | | | | | | | | | | 494,047 | | | | 7,089,574 | |
| | | | |
| | | | | | | | | | | | | | | 18,712,869 | |
| | | | | | | | | | | | | | | | |
| | | | |
| Construction & Engineering: 0.57% | | | | | | | | | | | | |
Dycom Industries Incorporated † | | | | | | | | | | | 188,153 | | | | 7,921,241 | |
| | | | | | | | | | | | | | | | |
| | | | |
| Electrical Equipment: 0.83% | | | | | | | | | | | | |
Atkore International Incorporated † | | | | | | | | | | | 425,510 | | | | 11,420,688 | |
| | | | | | | | | | | | | | | | |
| | | | |
| Machinery: 3.63% | | | | | | | | | | | | |
Chart Industries Incorporated † | | | | | | | | | | | 176,426 | | | | 6,924,721 | |
Ingersoll Rand Incorporated † | | | | | | | | | | | 459,751 | | | | 12,964,978 | |
SPX Corporation † | | | | | | | | | | | 420,345 | | | | 16,805,393 | |
Wabash National Corporation | | | | | | | | | | | 687,813 | | | | 6,568,614 | |
Woodward Governor Company | | | | | | | | | | | 102,360 | | | | 7,019,849 | |
| | | | |
| | | | | | | | | | | | | | | 50,283,555 | |
| | | | | | | | | | | | | | | | |
| | | | |
| Professional Services: 3.36% | | | | | | | | | | | | |
ASGN Incorporated † | | | | | | | | | | | 331,657 | | | | 20,426,755 | |
FTI Consulting Incorporated † | | | | | | | | | | | 87,928 | | | | 10,591,807 | |
ICF International Incorporated | | | | | | | | | | | 236,773 | | | | 15,527,573 | |
| | | | |
| | | | | | | | | | | | | | | 46,546,135 | |
| | | | | | | | | | | | | | | | |
The accompanying notes are an integral part of these financial statements.
Wells Fargo Small Company Growth Portfolio | 27
Portfolio of investments—May 31, 2020
| | | | | | | | | | | | | | | | |
| | | | | | | | | Shares | | | Value | |
| Road & Rail: 2.05% | | | | | | | | | | | | |
Knight-Swift Transportation Holdings Incorporated | | | | | | | | | | | 292,434 | | | $ | 12,168,179 | |
Schneider National Incorporated Class B | | | | | | | | | | | 668,608 | | | | 16,160,255 | |
| | | | |
| | | | | | | | | | | | | | | 28,328,434 | |
| | | | | | | | | | | | | | | | |
| | | | |
Information Technology: 27.95% | | | | | | | | | | | | | | | | |
| | | | |
| Communications Equipment: 3.10% | | | | | | | | | | | | |
Ciena Corporation † | | | | | | | | | | | 478,834 | | | | 26,460,367 | |
Lumentum Holdings Incorporated † | | | | | | | | | | | 224,094 | | | | 16,430,572 | |
| | | | |
| | | | | | | | | | | | | | | 42,890,939 | |
| | | | | | | | | | | | | | | | |
| | | | |
| IT Services: 5.37% | | | | | | | | | | | | |
Black Knight Incorporated † | | | | | | | | | | | 282,605 | | | | 21,754,933 | |
KBR Incorporated | | | | | | | | | | | 518,776 | | | | 12,165,297 | |
LiveRamp Holdings Incorporated † | | | | | | | | | | | 463,675 | | | | 23,383,130 | |
Verra Mobility Corporation † | | | | | | | | | | | 593,540 | | | | 6,475,521 | |
WEX Incorporated † | | | | | | | | | | | 71,320 | | | | 10,561,066 | |
| | | | |
| | | | | | | | | | | | | | | 74,339,947 | |
| | | | | | | | | | | | | | | | |
| | | | |
| Semiconductors & Semiconductor Equipment: 4.02% | | | | | | | | | | | | |
Cabot Microelectronics Corporation | | | | | | | | | | | 87,086 | | | | 12,615,278 | |
FormFactor Incorporated † | | | | | | | | | | | 311,505 | | | | 7,840,581 | |
Onto Innovation Incorporated † | | | | | | | | | | | 317,696 | | | | 9,873,992 | |
Silicon Motion Technology Corporation ADR | | | | | | | | | | | 264,463 | | | | 11,919,347 | |
Teradyne Incorporated | | | | | | | | | | | 201,077 | | | | 13,476,181 | |
| | | | |
| | | | | | | | | | | | | | | 55,725,379 | |
| | | | | | | | | | | | | | | | |
| | | | |
| Software: 15.46% | | | | | | | | | | | | |
Benefitfocus Incorporated † | | | | | | | | | | | 282,104 | | | | 3,591,184 | |
Box Incorporated Class A † | | | | | | | | | | | 929,669 | | | | 18,574,787 | |
Cloudera Incorporated † | | | | | | | | | | | 676,092 | | | | 6,929,943 | |
Cornerstone OnDemand Incorporated † | | | | | | | | | | | 369,965 | | | | 14,299,147 | |
CyberArk Software Limited † | | | | | | | | | | | 152,108 | | | | 15,785,766 | |
Mimecast Limited † | | | | | | | | | | | 296,060 | | | | 12,369,387 | |
Nuance Communications Incorporated | | | | | | | | | | | 870,295 | | | | 19,912,350 | |
Pagerduty Incorporated † | | | | | | | | | | | 549,623 | | | | 14,592,491 | |
PTC Incorporated † | | | | | | | | | | | 286,793 | | | | 21,905,249 | |
RealPage Incorporated † | | | | | | | | | | | 376,023 | | | | 25,501,880 | |
Sprout Social Incorporated Class A † | | | | | | | | | | | 277,128 | | | | 7,634,876 | |
SS&C Technologies Holdings Incorporated | | | | | | | | | | | 399,407 | | | | 23,123,668 | |
Talend SA ADR † | | | | | | | | | | | 153,338 | | | | 4,727,411 | |
Zendesk Incorporated † | | | | | | | | | | | 156,528 | | | | 13,422,276 | |
Zuora Incorporated † | | | | | | | | | | | 985,528 | | | | 11,836,191 | |
| | | | |
| | | | | | | | | | | | | | | 214,206,606 | |
| | | | | | | | | | | | | | | | |
| | | | |
Materials: 3.43% | | | | | | | | | | | | | | | | |
| | | | |
| Chemicals: 1.62% | | | | | | | | | | | | |
Element Solutions Incorporated † | | | | | | | | | | | 1,361,267 | | | | 14,824,198 | |
Orion Engineered Carbons SA | | | | | | | | | | | 686,772 | | | | 7,595,698 | |
| | | | |
| | | | | | | | | | | | | | | 22,419,896 | |
| | | | | | | | | | | | | | | | |
| | | | |
| Metals & Mining: 0.68% | | | | | | | | | | | | |
Steel Dynamics Incorporated | | | | | | | | | | | 357,309 | | | | 9,490,127 | |
| | | | | | | | | | | | | | | | |
| | | | |
| Paper & Forest Products: 1.13% | | | | | | | | | | | | |
Boise Cascade Company | | | | | | | | | | | 461,194 | | | | 15,694,432 | |
| | | | | | | | | | | | | | | | |
The accompanying notes are an integral part of these financial statements.
28 | Wells Fargo Small Company Growth Portfolio
Portfolio of investments—May 31, 2020
| | | | | | | | | | | | | | | | |
| | | | | | | | | Shares | | | Value | |
Real Estate: 1.07% | | | | | | | | | | | | | | | | |
| | | | |
| Equity REITs: 1.07% | | | | | | | | | | | | |
QTS Realty Trust Incorporated Class A | | | | | | | | | | | 216,908 | | | $ | 14,879,889 | |
| | | | | | | | | | | | | | | | |
| | | | |
Total Common Stocks (Cost $1,004,456,877) | | | | | | | | | | | | | | | 1,345,647,968 | |
| | | | | | | | | | | | | | | | |
| | | | |
| | | | | | | | | | | | | | | | |
| | | | | | Expiration
date | | | | | | | |
| Rights: 0.00% | | | | | | | | | | | | | | | | |
| | | | |
Communication Services: 0.00% | | | | | | | | | | | | | | | | |
| | | | |
| Media: 0.00% | | | | | | | | | | | | |
Media General Incorporated †(a) | | | | | | | 12-31-2020 | | | | 347,897 | | | | 0 | |
| | | | | | | | | | | | | | | | |
| | | | |
Total Rights (Cost $0) | | | | | | | | | | | | | | | 0 | |
| | | | | | | | | | | | | | | | |
| | | | |
| | | | | | | | | | | | | | | | |
| | | Yield | | | | | | | | | | |
| Short-Term Investments: 2.85% | | | | | | | | | | | | |
| | | | |
| Investment Companies: 2.85% | | | | | | | | | | | | |
Wells Fargo Government Money Market Fund Select Class (l)(u) | | | 0.12 | % | | | | | | | 39,427,080 | | | | 39,427,080 | |
| | | | | | | | | | | | | | | | |
| | | | |
Total Short-Term Investments (Cost $39,427,080) | | | | | | | | | | | | | | | 39,427,080 | |
| | | | | | | | | | | | | | | | |
| | | | | | | | |
| Total investments in securities (Cost $1,043,883,957) | | | 99.98 | % | | | 1,385,075,048 | |
| | |
Other assets and liabilities, net | | | 0.02 | | | | 305,572 | |
| | | | | | | | |
| Total net assets | | | 100.00 | % | | $ | 1,385,380,620 | |
| | | | | | | | |
| † | Non-income-earning security |
| (a) | The security is fair valued in accordance with procedures approved by the Board of Trustees. |
| (l) | The issuer of the security is an affiliated person of the Portfolio as defined in the Investment Company Act of 1940. |
| (u) | The rate represents the 7-day annualized yield at period end. |
Abbreviations:
| ADR | American depositary receipt |
| REIT | Real estate investment trust |
Investments in Affiliates
An affiliated investment is an investment in which the Portfolio owns at least 5% of the outstanding voting shares of the issuer or as a result of other relationships, such as the Portfolio and the issuer having the same adviser or investment manager. Transactions with issuers that were either affiliated persons of the Portfolio at the beginning of the period or the end of the period were as follows:
| | | | | | | | | | | | | | | | | | | | | | | | | | | | | | | | | | | | |
| | | Shares, beginning of period | | | Shares purchased | | | Shares sold | | | Shares, end of period | | | Net realized gains (losses) | | | Net change in unrealized gains (losses) | | | Income from affiliated securities | | | Value, end of period | | | % of net assets | |
| | | | | | | | | |
| Short-Term Investments | | | | | | | | | | | | | | | | | | | | | | | | | | | |
Investment Companies | | | | | | | | | | | | | | | | | | | | | | | | | | | | | | | | | | | | |
Securities Lending Cash Investments LLC * | | | 117,789,132 | | | | 599,370,734 | | | | (717,159,866 | ) | | | 0 | | | $ | 8,127 | | | $ | (5,964 | ) | | $ | 2,062,424 | # | | $ | 0 | | | | | |
Wells Fargo Government Money Market Fund Select Class | | | 77,449,512 | | | | 645,126,796 | | | | (683,149,228 | ) | | | 39,427,080 | | | | 0 | | | | 0 | | | | 740,158 | | | | 39,427,080 | | | | | |
| | | | | | | | | | | | | | | | | | | | | | | | | | | | | | | | | | | | |
| | | | | | | | | | | | | | | | | | $ | 8,127 | | | $ | (5,964 | ) | | $ | 2,802,582 | | | $ | 39,427,080 | | | | 2.85 | % |
| | | | | | | | | | | | | | | | | | | | | | | | | | | | | | | | | | | | |
| * | No longer held at the end of the period |
| # | Amount shown represents income before fees and rebates. |
The accompanying notes are an integral part of these financial statements.
Wells Fargo Small Company Growth Portfolio | 29
Statement of assets and liabilities—May 31, 2020
| | | | |
| | | | |
| |
Assets | | | | |
Investments in unaffiliated securities, at value (cost $1,004,456,877) | | $ | 1,345,647,968 | |
Investments in affiliated securities, at value (cost $39,427,080) | | | 39,427,080 | |
Receivable for investments sold | | | 2,496,403 | |
Receivable for dividends | | | 582,433 | |
Prepaid expenses and other assets | | | 102,008 | |
| | | | |
Total assets | | | 1,388,255,892 | |
| | | | |
| |
Liabilities | | | | |
Payable for investments purchased | | | 2,006,506 | |
Advisory fee payable | | | 863,929 | |
Trustees’ fees and expenses payable | | | 758 | |
Accrued expenses and other liabilities | | | 4,079 | |
| | | | |
Total liabilities | | | 2,875,272 | |
| | | | |
Total net assets | | $ | 1,385,380,620 | |
| | | | |
The accompanying notes are an integral part of these financial statements.
30 | Wells Fargo Small Company Growth Portfolio
Statement of operations—year ended May 31, 2020
| | | | |
| | | | |
| |
Investment income | | | | |
Dividends (net of foreign withholding taxes of $95,134) | | $ | 9,175,670 | |
Income from affiliated securities | | | 1,182,183 | |
| | | | |
Total investment income | | | 10,357,853 | |
| | | | |
| |
Expenses | | | | |
Advisory fee | | | 12,739,297 | |
Custody and accounting fees | | | 89,625 | |
Professional fees | | | 48,328 | |
Shareholder report expenses | | | 1,973 | |
Trustees’ fees and expenses | | | 20,531 | |
Other fees and expenses | | | 20,893 | |
| | | | |
Total expenses | | | 12,920,647 | |
| | | | |
Net investment loss | | | (2,562,794 | ) |
| | | | |
| |
Realized and unrealized gains (losses) on investments | | | | |
Net realized gains on | | | | |
Unaffiliated securities | | | 108,626,719 | |
Affiliated securities | | | 8,127 | |
| | | | |
Net realized gains on investments | | | 108,634,846 | |
| | | | |
| |
Net change in unrealized gains (losses) on | | | | |
Unaffiliated securities | | | (27,495,735 | ) |
Affiiliated securities | | | (5,964 | ) |
| | | | |
Net change in unrealized gains (losses) on investments | | | (27,501,699 | ) |
| | | | |
Net realized and unrealized gains (losses) on investments | | | 81,133,147 | |
| | | | |
Net increase in net assets resulting from operations | | $ | 78,570,353 | |
| | | | |
The accompanying notes are an integral part of these financial statements.
Wells Fargo Small Company Growth Portfolio | 31
Statement of changes in net assets
| | | | | | | | |
| | | Year ended
May 31, 2020 | | | Year ended
May 31, 2019 | |
| | |
Operations | | | | | | | | |
Net investment loss | | $ | (2,562,794 | ) | | $ | (1,806,897 | ) |
Net realized gains on investments | | | 108,634,846 | | | | 201,431,492 | |
Net change in unrealized gains (losses) on investments | | | (27,501,699 | ) | | | (312,380,190 | ) |
| | | | |
Net increase (decrease) in net assets resulting from operations | | | 78,570,353 | | | | (112,755,595 | ) |
| | | | |
| | |
Capital transactions | | | | | | | | |
Transactions in investors’ beneficial interests | | | | | | | | |
Contributions | | | 51,028,631 | | | | 200,173,324 | |
Withdrawals | | | (551,302,982 | ) | | | (288,826,821 | ) |
| | | | |
Net decrease in net assets resulting from capital transactions | | | (500,274,351 | ) | | | (88,653,497 | ) |
| | | | |
Total decrease in net assets | | | (421,703,998 | ) | | | (201,409,092 | ) |
| | | | |
| | |
Net assets | | | | | | | | |
Beginning of period | | | 1,807,084,618 | | | | 2,008,493,710 | |
| | | | |
End of period | | $ | 1,385,380,620 | | | $ | 1,807,084,618 | |
| | | | |
The accompanying notes are an integral part of these financial statements.
32 | Wells Fargo Small Company Growth Portfolio
Financial highlights
| | | | | | | | | | | | | | | | | | | | |
| | | Year ended May 31 | |
| | | 2020 | | | 2019 | | | 2018 | | | 2017 | | | 2016 | |
Total return | | | 4.08 | % | | | (5.64 | )% | | | 28.74 | % | | | 18.15 | % | | | (13.86 | )% |
Ratios to average net assets (annualized) | | | | | | | | | | | | | | | | | | | | |
Gross expenses | | | 0.78 | % | | | 0.78 | % | | | 0.78 | % | | | 0.79 | % | | | 0.80 | % |
Net expenses | | | 0.78 | % | | | 0.78 | % | | | 0.78 | % | | | 0.79 | % | | | 0.80 | % |
Net investment loss | | | (0.16 | )% | | | (0.09 | )% | | | (0.18 | )% | | | (0.14 | )% | | | (0.03 | )% |
Supplemental data | | | | | | | | | | | | | | | | | | | | |
Portfolio turnover rate | | | 41 | % | | | 54 | % | | | 37 | % | | | 82 | % | | | 49 | % |
The accompanying notes are an integral part of these financial statements.
Wells Fargo Small Company Growth Portfolio | 33
Notes to financial statements
1. ORGANIZATION
Wells Fargo Master Trust (the “Trust”), a Delaware statutory trust organized on March 10, 1999, is an open-end management investment company registered under the Investment Company Act of 1940, as amended (the “1940 Act”). As an investment company, the Trust follows the accounting and reporting guidance in Financial Accounting Standards Board (“FASB”) Accounting Standards Codification Topic 946, Financial Services – Investment Companies. These financial statements report on the Wells Fargo Small Company Growth Portfolio (the “Portfolio”) which is a diversified series of the Trust.
2. SIGNIFICANT ACCOUNTING POLICIES
The following significant accounting policies, which are consistently followed in the preparation of the financial statements of the Portfolio, are in conformity with U.S. generally accepted accounting principles which require management to make estimates and assumptions that affect the reported amounts of assets and liabilities, disclosure of contingent assets and liabilities at the date of the financial statements, and the reported amounts of revenues and expenses during the reporting period. Actual results could differ from those estimates.
Securities valuation
All investments are valued each business day as of the close of regular trading on the New York Stock Exchange (generally 4 p.m. Eastern Time), although the Portfolio may deviate from this calculation time under unusual or unexpected circumstances.
Equity securities that are listed on a foreign or domestic exchange or market are valued at the official closing price or, if none, the last sales price. If no sale occurs on the principal exchange or market that day, a fair value price will be determined in accordance with the Portfolio’s Valuation Procedures.
Investments in registered open-end investment companies are valued at net asset value. Interests in non-registered investment companies that are redeemable at net asset value are fair valued normally at net asset value.
Investments which are not valued using any of the methods discussed above are valued at their fair value, as determined in good faith by the Board of Trustees of the Portfolio. The Board of Trustees has established a Valuation Committee comprised of the Trustees and has delegated to it the authority to take any actions regarding the valuation of portfolio securities that the Valuation Committee deems necessary or appropriate, including determining the fair value of portfolio securities, unless the determination has been delegated to the Wells Fargo Asset Management Pricing Committee at Wells Fargo Funds Management, LLC (“Funds Management”). The Board of Trustees retains the authority to make or ratify any valuation decisions or approve any changes to the Valuation Procedures as it deems appropriate. On a quarterly basis, the Board of Trustees receives reports on any valuation actions taken by the Valuation Committee or the Wells Fargo Asset Management Pricing Committee which may include items for ratification.
Securities lending
The Portfolio may lend its securities from time to time in order to earn additional income in the form of fees or interest on securities received as collateral or the investment of any cash received as collateral. When securities are on loan, the Portfolio receives interest or dividends on those securities. Cash collateral received in connection with its securities lending transactions is invested in Securities Lending Cash Investments, LLC (the “Securities Lending Fund”). Investments in Securities Lending Fund are valued at the evaluated bid price provided by an independent pricing service. Income earned from investment in the Securities Lending Fund (net of fees and rebates), if any, is included in income from affiliated securities on the Statement of Operations.
In a securities lending transaction, the net asset value of the Portfolio is affected by an increase or decrease in the value of the securities loaned and by an increase or decrease in the value of the instrument in which collateral is invested. The amount of securities lending activity undertaken by the Portfolio fluctuates from time to time. The Portfolio has the right under the lending agreement to recover the securities from the borrower on demand. In the event of default or bankruptcy by the borrower, the Portfolio may be prevented from recovering the loaned securities or gaining access to the collateral or may experience delays or costs in doing so. In such an event, the terms of the agreement allow the unaffiliated securities lending agent to use the collateral to purchase replacement securities on behalf of the Portfolio or pay the Portfolio the market value of the loaned securities. The Portfolio bears the risk of loss with respect to depreciation of its investment of the cash collateral.
Security transactions and income recognition
Securities transactions are recorded on a trade date basis. Realized gains or losses are recorded on the basis of identified cost.
Dividend income is recognized on the ex-dividend date. Dividend income is recorded net of foreign taxes withheld where recovery of such taxes is not assured.
34 | Wells Fargo Small Company Growth Portfolio
Notes to financial statements
Federal and other taxes
The Portfolio is treated as a separate entity for federal income tax purposes. The Portfolio is not required to pay federal income taxes on its net investment income and net capital gains as it is treated as a partnership for federal income tax purposes. All dividends, gains and losses of the Portfolio are deemed to have been “passed through” to the interest holders in proportion to their holdings of the Portfolio regardless of whether dividends and gains have been distributed by the Portfolio.
The Portfolio’s income tax returns and all financial records supporting those returns for the prior three fiscal years are subject to examination by the federal revenue authority. Management has analyzed the Portfolio’s tax positions taken on federal, state, and foreign tax returns for all open tax years and does not believe that there are any uncertain tax positions that require recognition of a tax liability.
As of May 31, 2020, the aggregate cost of all investments for federal income tax purposes was $1,070,986,415 and the unrealized gains (losses) consisted of:
| | | | |
| |
Gross unrealized gains | | $ | 436,926,622 | |
| |
Gross unrealized losses | | | (122,837,989 | ) |
| |
Net unrealized gains | | $ | 314,088,633 | |
3. FAIR VALUATION MEASUREMENTS
Fair value measurements of investments are determined within a framework that has established a fair value hierarchy based upon the various data inputs utilized in determining the value of the Portfolio’s investments. The three-level hierarchy gives the highest priority to unadjusted quoted prices in active markets for identical assets or liabilities (Level 1) and the lowest priority to unobservable inputs (Level 3). The Portfolio’s investments are classified within the fair value hierarchy based on the lowest level of input that is significant to the fair value measurement. The inputs are summarized into three broad levels as follows:
| ∎ | | Level 1 – quoted prices in active markets for identical securities |
| ∎ | | Level 2 – other significant observable inputs (including quoted prices for similar securities, interest rates, prepayment speeds, credit risk, etc.) |
| ∎ | | Level 3 – significant unobservable inputs (including the Portfolio’s own assumptions in determining the fair value of investments) |
The inputs or methodologies used for valuing investments in securities are not necessarily an indication of the risk associated with investing in those securities.
The following is a summary of the inputs used in valuing the Portfolio’s assets and liabilities as of May 31, 2020:
| | | | | | | | | | | | | | | | |
| | | | |
| | | Quoted prices
(Level 1) | | | Other significant
observable inputs
(Level 2) | | | Significant
unobservable inputs (Level 3) | | | Total | |
| | | |
Assets | | | | | | | | | | | | |
Investments in: | | | | | | | | | | | | |
| | | |
Common stocks | | | | | | | | | | | | |
| | | | |
Communication services | | $ | 22,951,039 | | | $ | 0 | | | $ | 0 | | | $ | 22,951,039 | |
| | | | |
Consumer discretionary | | | 109,260,080 | | | | 0 | | | | 0 | | | | 109,260,080 | |
| | | | |
Consumer staples | | | 14,297,538 | | | | 0 | | | | 0 | | | | 14,297,538 | |
| | | | |
Energy | | | 6,194,869 | | | | 0 | | | | 0 | | | | 6,194,869 | |
| | | | |
Financials | | | 146,784,030 | | | | 0 | | | | 0 | | | | 146,784,030 | |
| | | | |
Health care | | | 389,446,302 | | | | 0 | | | | 0 | | | | 389,446,302 | |
| | | | |
Industrials | | | 207,066,895 | | | | 0 | | | | 0 | | | | 207,066,895 | |
| | | | |
Information technology | | | 387,162,871 | | | | 0 | | | | 0 | | | | 387,162,871 | |
| | | | |
Materials | | | 47,604,455 | | | | 0 | | | | 0 | | | | 47,604,455 | |
| | | | |
Real estate | | | 14,879,889 | | | | 0 | | | | 0 | | | | 14,879,889 | |
| | | |
Rights | | | | | | | | | | | | |
| | | | |
Communication services | | | 0 | | | | 0 | | | | 0 | | | | 0 | |
| | | |
Short-term investments | | | | | | | | | | | | |
| | | | |
Investment companies | | | 39,427,080 | | | | 0 | | | | 0 | | | | 39,427,080 | |
| | | | |
Total assets | | $ | 1,385,075,048 | | | $ | 0 | | | $ | 0 | | | $ | 1,385,075,048 | |
Wells Fargo Small Company Growth Portfolio | 35
Notes to financial statements
Additional sector, industry or geographic detail is included in the Portfolio of Investments.
For the year ended May 31, 2020, the Portfolio did not have any transfers into/out of Level 3.
4. TRANSACTIONS WITH AFFILIATES AND OTHER EXPENSES
Advisory fee
The Trust has entered into an advisory contract with Funds Management, an indirect wholly owned subsidiary of Wells Fargo & Company (“Wells Fargo”). The adviser is responsible for implementing investment policies and guidelines and for supervising the subadviser, who is responsible for day-to-day portfolio management of the Portfolio. Pursuant to the contract, Funds Management is entitled to receive an annual advisory fee at the following annual rate based on the Portfolio’s average daily net assets:
| | | | |
| |
| Average daily net assets | | Advisory fee | |
| |
First $500 million | | | 0.800 | % |
| |
Next $500 million | | | 0.775 | |
| |
Next $1 billion | | | 0.750 | |
| |
Next $1 billion | | | 0.725 | |
| |
Next $1 billion | | | 0.700 | |
| |
Over $4 billion | | | 0.680 | |
For the year ended May 31, 2020, the advisory fee was equivalent to an annual rate of 0.77% of the Portfolio’s average daily net assets.
Funds Management has retained the services of a subadviser to provide daily portfolio management to the Portfolio. The fee for subadvisory services is borne by Funds Management. Peregrine Capital Management, LLC, which is not an affiliate of Funds Management, is the subadviser to the Portfolio and is entitled to receive a fee from Funds Management at an annual rate starting at 0.50% and declining to 0.45% as the average daily net assets of the Portfolio increase.
Interfund transactions
The Portfolio may purchase or sell portfolio investment securities to certain other Wells Fargo affiliates pursuant to Rule 17a-7 under the 1940 Act and under procedures adopted by the Board of Trustees. The procedures have been designed to ensure that these interfund transactions, which do not incur broker commissions, are effected at current market prices.
5. INVESTMENT PORTFOLIO TRANSACTIONS
Purchases and sales of investments, excluding U.S. government obligations (if any) and short-term securities, for the year ended May 31, 2020 were $655,559,407 and $1,097,933,987, respectively.
6. SECURITIES LENDING TRANSACTIONS
The Portfolio lends its securities through an unaffiliated securities lending agent and receives collateral in the form of cash or securities with a value at least equal to the value of the securities on loan. The value of the loaned securities is determined at the close of each business day and any increases or decreases in the required collateral are exchanged between the Portfolio and the counterparty on the next business day. Cash collateral received is invested in the Securities Lending Fund which seeks to provide a positive return compared to the daily Fed Funds Open Rate by investing in high-quality, U.S. dollar-denominated short-term money market instruments and is exempt from registration under Section 3(c)(7) of the 1940 Act. Securities Lending Fund is managed by Funds Management and is subadvised by Wells Capital Management Incorporated (“WellsCap”), an affiliate of Funds Management and an indirect wholly owned subsidiary of Wells Fargo. Funds Management receives an advisory fee starting at 0.05% and declining to 0.01% as the average daily net assets of the Securities Lending Fund increase. All of the fees received by Funds Management are paid to WellsCap for its services as subadviser.
In the event of counterparty default or the failure of a borrower to return a loaned security, the Fund has the right to use the collateral to offset any losses incurred. As of May 31, 2020, the Portfolio did not have any securities on loan.
7. BANK BORROWINGS
The Trust, along with Wells Fargo Variable Trust and Wells Fargo Funds Trust (excluding the money market funds), are parties to a $280,000,000 revolving credit agreement whereby the Portfolio is permitted to use bank borrowings for temporary or
36 | Wells Fargo Small Company Growth Portfolio
Notes to financial statements
emergency purposes, such as to fund shareholder redemption requests. Interest under the credit agreement is charged to the Portfolio based on a borrowing rate equal to the higher of the Federal Funds rate in effect on that day plus 1.25% or the overnight LIBOR rate in effect on that day plus 1.25%. In addition, an annual commitment fee equal to 0.25% of the unused balance is allocated to each participating fund.
For year ended May 31, 2020, there were no borrowings by the Portfolio under the agreement.
8. CONCENTRATION RISKS
Concentration risks result from exposure to a limited number of sectors. As of the end of the period, the Portfolio invested a concentration of its portfolio in the health care and information technology sectors. A Portfolio that invests a substantial portion of its assets in any sector may be more affected by changes in that sector than would be a Portfolio whose investments are not heavily weighted in any sector.
9. INDEMNIFICATION
Under the Portfolio’s organizational documents, the officers and Trustees have been granted certain indemnification rights against certain liabilities that may arise out of performance of their duties to the Portfolio. The Portfolio has entered into a separate agreement with each Trustee that converts indemnification rights currently existing under the Portfolio’s organizational documents into contractual rights that cannot be changed in the future without the consent of the Trustee. Additionally, in the normal course of business, the Portfolio may enter into contracts with service providers that contain a variety of indemnification clauses. The Portfolio’s maximum exposure under these arrangements is dependent on future claims that may be made against the Portfolio and, therefore, cannot be estimated.
10. NEW ACCOUNTING PRONOUNCEMENT
In August 2018, FASB issued Accounting Standards Update (“ASU”) No. 2018-13, Fair Value Measurement (Topic 820) Disclosure Framework—Changes to the Disclosure Requirements for Fair Value Measurement. ASU 2018-13 updates the disclosure requirements for fair value measurements by modifying or removing certain disclosures and adding certain new disclosures. The amendments are effective for fiscal years, and interim periods within those fiscal years, beginning after December 15, 2019. Early adoption is permitted. Management has adopted the removal and modification of disclosures early, as permitted, and will adopt the additional new disclosures at the effective date.
11. CORONAVIRUS (COVID-19) PANDEMIC
On March 11, 2020, the World Health Organization announced that it had made the assessment that coronavirus disease 2019 (“COVID-19”) is a pandemic. The impacts of COVID-19 are adversely affecting the entire global economy, individual companies and investment products, and the market in general. There is significant uncertainty around the extent and duration of business disruptions related to COVID-19 and the impacts may be short term or may last for an extended period of time. The risk of further spreading of COVID-19 has led to significant uncertainty and volatility in the financial markets. The value of the Portfolio and the securities in which the Portfolio invests have generally been adversely affected by impacts caused by COVID-19.
Wells Fargo Small Company Growth Portfolio | 37
Report of independent registered public accounting firm
TO THE INTEREST HOLDERS OF THE PORTFOLIO AND BOARD OF TRUSTEES WELLS FARGO MASTER TRUST:
Opinion on the Financial Statements
We have audited the accompanying statement of assets and liabilities of Wells Fargo Small Company Growth Portfolio (the Portfolio), one of the portfolios constituting Wells Fargo Master Trust, including the portfolio of investments, as of May 31, 2020, the related statement of operations for the year then ended, the statements of changes in net assets for each of the years in the two-year period then ended, and the related notes (collectively, the financial statements) and the financial highlights for each of the years in the five-year period then ended. In our opinion, the financial statements and financial highlights present fairly, in all material respects, the financial position of the Portfolio as of May 31, 2020, the results of its operations for the year then ended, the changes in its net assets for each of the years in the two-year period then ended, and the financial highlights for each of the years in the five-year period then ended, in conformity with U.S. generally accepted accounting principles.
Basis for Opinion
These financial statements and financial highlights are the responsibility of the Portfolio’s management. Our responsibility is to express an opinion on these financial statements and financial highlights based on our audits. We are a public accounting firm registered with the Public Company Accounting Oversight Board (United States) (PCAOB) and are required to be independent with respect to the Portfolio in accordance with the U.S. federal securities laws and the applicable rules and regulations of the Securities and Exchange Commission and the PCAOB.
We conducted our audits in accordance with the standards of the PCAOB. Those standards require that we plan and perform the audit to obtain reasonable assurance about whether the financial statements and financial highlights are free of material misstatement, whether due to error or fraud. Our audits included performing procedures to assess the risks of material misstatement of the financial statements and financial highlights, whether due to error or fraud, and performing procedures that respond to those risks. Such procedures included examining, on a test basis, evidence regarding the amounts and disclosures in the financial statements and financial highlights. Such procedures also included confirmation of securities owned as of May 31, 2020, by correspondence with the custodian, transfer agent and brokers, or by other appropriate auditing procedures. Our audits also included evaluating the accounting principles used and significant estimates made by management, as well as evaluating the overall presentation of the financial statements and financial highlights. We believe that our audits provide a reasonable basis for our opinion.
We have not been able to determine the specific year that we began serving as the auditor of one or more Wells Fargo Funds investment companies; however we are aware that we have served as the auditor of one or more Wells Fargo Funds investment companies since at least 1955.
Boston, Massachusetts
July 29, 2020
38 | Wells Fargo Small Company Growth Portfolio
Other information (unaudited)
TAX INFORMATION
For corporate shareholders, pursuant to Section 854 of the Internal Revenue Code, 31.34% of ordinary income dividends qualify for the corporate dividends-received deduction for the fiscal year ended May 31, 2020.
Pursuant to Section 852 of the Internal Revenue Code, $123,406,044 was designated as a 20% rate gain distribution for the fiscal year ended May 31, 2020.
Pursuant to Section 854 of the Internal Revenue Code, $5,210,849 of income dividends paid during the fiscal year ended May 31, 2020 has been designated as qualified dividend income (QDI).
For the fiscal year ended May 31, 2020, $12,251,811 has been designated as short-term capital gain dividends for nonresident alien shareholders pursuant to Section 871 of the Internal Revenue Code.
PROXY VOTING INFORMATION
A description of the policies and procedures used to determine how to vote proxies relating to portfolio securities is available, upon request, by calling 1-800-222-8222, visiting our website at wfam.com, or visiting the SEC website at sec.gov. Information regarding how the proxies related to portfolio securities were voted during the most recent 12-month period ended June 30 is available on the website at wfam.com or by visiting the SEC website at sec.gov.
QUARTERLY PORTFOLIO HOLDINGS INFORMATION
The Fund and Portfolio file their complete schedule of portfolio holdings with the SEC for the first and third quarters of each fiscal year as an exhibit to its reports on Form N-PORT. Shareholders may view the filed Form N-PORT by visiting the SEC website at sec.gov.
Wells Fargo Small Company Growth Fund | 39
Other information (unaudited)
BOARD OF TRUSTEES AND OFFICERS
Each of the Trustees and Officers1 listed in the table below acts in identical capacities for each fund in the Wells Fargo family of funds, which consists of 147 mutual funds comprising the Wells Fargo Funds Trust, Wells Fargo Variable Trust, Wells Fargo Master Trust and four closed-end funds (collectively the “Fund Complex”). This table should be read in conjunction with the Prospectus and the Statement of Additional Information2. The mailing address of each Trustee and Officer is 525 Market Street, 12th Floor, San Francisco, CA 94105. Each Trustee and Officer serves an indefinite term, however, each Trustee serves such term until reaching the mandatory retirement age established by the Trustees.
Independent Trustees
| | | | | | |
Name and year of birth | | Position held and
length of service* | | Principal occupations during past five years or longer | | Current other
public company or
investment
company
directorships |
| | | |
William R. Ebsworth (Born 1957) | | Trustee, since 2015 | | Retired. From 1984 to 2013, equities analyst, portfolio manager, research director and chief investment officer at Fidelity Management and Research Company in Boston, Tokyo, and Hong Kong, and retired in 2013 as Chief Investment Officer of Fidelity Strategic Advisers, Inc. where he led a team of investment professionals managing client assets. Prior thereto, Board member of Hong Kong Securities Clearing Co., Hong Kong Options Clearing Corp., the Thailand International Fund, Ltd., Fidelity Investments Life Insurance Company, and Empire Fidelity Investments Life Insurance Company. Audit Committee Chair and Investment Committee Chair of the Vincent Memorial Hospital Endowment (non-profit organization). Mr. Ebsworth is a CFA® charterholder. | | N/A |
| | | |
Jane A. Freeman (Born 1953) | | Trustee, since 2015; Chair Liaison, since 2018 | | Retired. From 2012 to 2014 and 1999 to 2008, Chief Financial Officer of Scientific Learning Corporation. From 2008 to 2012, Ms. Freeman provided consulting services related to strategic business projects. Prior to 1999, Portfolio Manager at Rockefeller & Co. and Scudder, Stevens & Clark. Board member of the Harding Loevner Funds from 1996 to 2014, serving as both Lead Independent Director and chair of the Audit Committee. Board member of the Russell Exchange Traded Funds Trust from 2011 to 2012 and the chair of the Audit Committee. Ms. Freeman is also an inactive Chartered Financial Analyst. | | N/A |
| | | |
Isaiah Harris, Jr. (Born 1952) | | Trustee, since 2009; Audit Committee Chairman, since 2019 | | Retired. Chairman of the Board of CIGNA Corporation since 2009, and Director since 2005. From 2003 to 2011, Director of Deluxe Corporation. Prior thereto, President and CEO of BellSouth Advertising and Publishing Corp. from 2005 to 2007, President and CEO of BellSouth Enterprises from 2004 to 2005 and President of BellSouth Consumer Services from 2000 to 2003. Emeritus member of the Iowa State University Foundation Board of Governors. Emeritus Member of the Advisory Board of Iowa State University School of Business. Advisory Board Member, Palm Harbor Academy (private school). Advisory Board Member, Child Evangelism Fellowship (non-profit). Mr. Harris is a certified public accountant (inactive status). | | CIGNA Corporation |
| | | |
Judith M. Johnson (Born 1949) | | Trustee, since 2008; Audit Committee Chairman, from 2009 to 2018 | | Retired. Prior thereto, Chief Executive Officer and Chief Investment Officer of Minneapolis Employees Retirement Fund from 1996 to 2008. Ms. Johnson is an attorney, certified public accountant and a certified managerial accountant. | | N/A |
40 | Wells Fargo Small Company Growth Fund
Other information (unaudited)
| | | | | | |
Name and year of birth | | Position held and
length of service* | | Principal occupations during past five years or longer | | Current other
public company or
investment
company
directorships |
| | | |
David F. Larcker (Born 1950) | | Trustee, since 2009 | | James Irvin Miller Professor of Accounting at the Graduate School of Business, Stanford University, Director of the Corporate Governance Research Initiative and Senior Faculty of The Rock Center for Corporate Governance since 2006. From 2005 to 2008, Professor of Accounting at the Graduate School of Business, Stanford University. Prior thereto, Ernst & Young Professor of Accounting at The Wharton School, University of Pennsylvania from 1985 to 2005. | | N/A |
| | | |
Olivia S. Mitchell (Born 1953) | | Trustee, since 2006; Nominating and Governance Committee Chair, since 2018 | | International Foundation of Employee Benefit Plans Professor, Wharton School of the University of Pennsylvania since 1993. Director of Wharton’s Pension Research Council and Boettner Center on Pensions & Retirement Research, and Research Associate at the National Bureau of Economic Research. Previously, Cornell University Professor from 1978 to 1993. | | N/A |
| | | |
Timothy J. Penny (Born 1951) | | Trustee, since 1996; Chairman, since 2018 | | President and Chief Executive Officer of Southern Minnesota Initiative Foundation, a non-profit organization, since 2007. Member of the Board of Trustees of NorthStar Education Finance, Inc., a non-profit organization, since 2007. | | N/A |
| | | |
James G. Polisson (Born 1959) | | Trustee, since 2018 | | Retired. Chief Marketing Officer, Source (ETF) UK Services, Ltd, from 2015 to 2017. From 2012 to 2015, Principal of The Polisson Group, LLC, a management consulting, corporate advisory and principal investing company. Chief Executive Officer and Managing Director at Russell Investments, Global Exchange Traded Funds from 2010 to 2012. Managing Director of Barclays Global Investors from 1998 to 2010 and Global Chief Marketing Officer for iShares and Barclays Global Investors from 2000 to 2010. Trustee of the San Francisco Mechanics’ Institute, a non-profit organization, from 2013 to 2015. Board member of the Russell Exchange Traded Fund Trust from 2011 to 2012. Director of Barclays Global Investors Holdings Deutschland GmbH from 2006 to 2009. Mr. Polisson is an attorney and has a retired status with the Massachusetts and District of Columbia Bar Associations. | | N/A |
| | | |
Pamela Wheelock (Born 1959) | | Trustee, since January 2020; previously Trustee from January 2018 to July 2019 | | Board member of the Destination Medical Center Economic Development Agency, Rochester, Minnesota since 2019 and Interim President of the McKnight Foundation since 2020. Acting Commissioner, Minnesota Department of Human Services, July 2019 through September 2019. Human Services Manager (part-time), Minnesota Department of Human Services, October 2019 through December 2019. Chief Operating Officer, Twin Cities Habitat for Humanity from 2017 to 2019. Vice President of University Services, University of Minnesota from 2012 to 2016. Prior thereto, on the Board of Directors, Governance Committee and Finance Committee for the Minnesota Philanthropy Partners (Saint Paul Foundation) from 2012 to 2018, Interim Chief Executive Officer of Blue Cross Blue Shield of Minnesota from 2011 to 2012, Chairman of the Board from 2009 to 2012 and Board Director from 2003 to 2015. Vice President, Leadership and Community Engagement, Bush Foundation, Saint Paul, Minnesota (a private foundation) from 2009 to 2011. Executive Vice President and Chief Financial Officer, Minnesota Sports and Entertainment from 2004 to 2009 and Senior Vice President from 2002 to 2004. Executive Vice President of the Minnesota Wild Foundation from 2004 to 2008. Commissioner of Finance, State of Minnesota, from 1999 to 2002. Currently Board Chair of the Minnesota Wild Foundation since 2010. | | N/A |
| * | Length of service dates reflect the Trustee’s commencement of service with the Trust’s predecessor entities, where applicable. |
Wells Fargo Small Company Growth Fund | 41
Other information (unaudited)
Officers
| | | | |
Name and year of birth | | Position held and
length of service | | Principal occupations during past five years or longer |
| | |
Andrew Owen (Born 1960) | | President, since 2017 | | Executive Vice President of Wells Fargo & Company and Head of Affiliated Managers, Wells Fargo Asset Management, since 2014. In addition, Mr. Owen is currently President, Chief Executive Officer and Director of Wells Fargo Funds Management, LLC since 2017. Prior thereto, Executive Vice President responsible for marketing, investments and product development for Wells Fargo Funds Management, LLC, from 2009 to 2014. |
| | |
Nancy Wiser1 (Born 1967) | | Treasurer, since 2012 | | Executive Vice President of Wells Fargo Funds Management, LLC since 2011. Chief Operating Officer and Chief Compliance Officer at LightBox Capital Management LLC, from 2008 to 2011. |
| | |
Michelle Rhee (Born 1966) | | Chief Legal Officer, since 2019 | | Secretary of Wells Fargo Funds Management, LLC, Chief Legal Counsel of Wells Fargo Asset Management and Assistant General Counsel of Wells Fargo Bank, N.A. since 2018. Associate General Counsel and Managing Director of Bank of America Corporation from 2004 to 2018. |
| | |
Catherine Kennedy (Born 1969) | | Secretary, since 2019 | | Vice President of Wells Fargo Funds Management, LLC and Senior Counsel of the Wells Fargo Legal Department since 2010. Vice President and Senior Counsel of Evergreen Investment Management Company, LLC from 1998 to 2010. |
| | |
Michael H. Whitaker (Born 1967) | | Chief Compliance Officer, since 2016 | | Chief Compliance Officer of Wells Fargo Asset Management since 2016. Senior Vice President and Chief Compliance Officer for Fidelity Investments from 2007 to 2016. |
| | |
David Berardi (Born 1975) | | Assistant Treasurer, since 2009 | | Vice President of Wells Fargo Funds Management, LLC since 2009. Vice President of Evergreen Investment Management Company, LLC from 2008 to 2010. Manager of Fund Reporting and Control for Evergreen Investment Management Company, LLC from 2004 to 2010. |
| | |
Jeremy DePalma1 (Born 1974) | | Treasurer, since 2012 | | Senior Vice President of Wells Fargo Funds Management, LLC since 2009. Senior Vice President of Evergreen Investment Management Company, LLC from 2008 to 2010 and head of the Fund Reporting and Control Team within Fund Administration from 2005 to 2010. |
| 1 | Nancy Wiser acts as Treasurer of 65 funds in the Fund Complex. Jeremy DePalma acts as the Treasurer of 82 funds in the Fund Complex. |
| 2 | The Statement of Additional Information includes additional information about the Trustees and is available, without charge, upon request, by calling 1-800-222-8222 or by visiting the website at wfam.com. |
42 | Wells Fargo Small Company Growth Fund
Other information (unaudited)
BOARD CONSIDERATION OF INVESTMENT MANAGEMENT, ADVISORY AND SUB-ADVISORY AGREEMENTS:
Wells Fargo Small Company Growth Fund and Wells Fargo Small Company Growth Portfolio
Under the Investment Company Act of 1940 (the “1940 Act”), the Board of Trustees (each, a “Board” and collectively, the “Boards”) of each of Wells Fargo Funds Trust (“Funds Trust”) and Wells Fargo Master Trust (“Master Trust”, and collectively, the “Trusts”) must determine annually whether to approve the continuation of the Trusts’ investment management, advisory and sub-advisory agreements, as applicable. In this regard, at a Board meeting held on May 26, 2020 and May 28, 2020 (together, the “Meeting”), the Funds Trust Board, all the members of which have no direct or indirect interest in the investment management agreement and are not “interested persons” of the Trusts, as defined in the 1940 Act (the “Independent Trustees”), reviewed and approved for Wells Fargo Small Company Growth Fund (the “Gateway Fund”) an investment management agreement (the “Gateway Fund Management Agreement”) with Wells Fargo Funds Management, LLC (“Funds Management”).
At the Meeting, the Master Trust Board, all the members of which have no direct or indirect interest in the investment advisory and sub-advisory agreements and are Independent Trustees, reviewed and approved: (i) an investment advisory agreement (the “Master Portfolio Advisory Agreement”) with Funds Management for Wells Fargo Small Company Growth Portfolio, a portfolio of Master Trust (the “Master Portfolio”); and (ii) an investment sub-advisory agreement (the “Sub-Advisory Agreement”) with Peregrine Capital Management, LLC (the “Sub-Adviser”) for the Master Portfolio.
The Gateway Fund and the Master Portfolio are collectively referred to as the “Funds.” The Gateway Fund Management Agreement, the Master Portfolio Advisory Agreement and the Sub-Advisory Agreement are collectively referred to as the “Advisory Agreements.”
The Gateway Fund is a gateway feeder fund that invest substantially all of its assets in the Master Portfolio. The Master Portfolio has a substantially similar investment objective and substantially similar investment strategies to the Gateway Fund. Information provided to the Boards regarding the Gateway Fund is also applicable to the Master Portfolio, as relevant.
At the Meeting, the Boards considered the factors and reached the conclusions described below relating to the selection of Funds Management and the Sub-Adviser and the approval of the Advisory Agreements. Prior to the Meeting, including at a Board meeting held in April 2020, the Trustees conferred extensively among themselves and with representatives of Funds Management about these matters. Also, the Boards have adopted a team-based approach, with each team consisting of a sub-set of Trustees, to assist the full Boards in the discharge of their duties in reviewing investment performance and other matters throughout the year. The Independent Trustees were assisted in their evaluation of the Advisory Agreements by independent legal counsel, from whom they received separate legal advice and with whom they met separately.
In providing information to the Boards, Funds Management and the Sub-Adviser were guided by a detailed set of requests for information submitted to them by independent legal counsel on behalf of the Independent Trustees at the start of the Boards’ annual contract renewal process earlier in 2020. In considering and approving the Advisory Agreements, the Trustees considered the information they believed relevant, including but not limited to the information discussed below. The Boards considered not only the specific information presented in connection with the Meeting, but also the knowledge gained over time through interaction with Funds Management and the Sub-Adviser about various topics. In this regard, the Boards reviewed reports of Funds Management at each of their quarterly meetings, which included, among other things, portfolio reviews and investment performance reports. In addition, the Boards and the teams mentioned above confer with portfolio managers at various times throughout the year. The Boards did not identify any particular information or consideration that was all-important or controlling, and each individual Trustee may have attributed different weights to various factors.
After its deliberations, the Funds Trust Board unanimously approved the continuation of the Gateway Fund Management Agreement for a one-year period. Additionally, after its deliberations, the Master Trust Board unanimously approved the continuation of the Master Portfolio Advisory Agreement and the Sub-Advisory Agreement, each for a one-year term. The Boards also determined that the compensation payable to Funds Management and the Sub-Adviser was reasonable. The Boards considered the approval of the Advisory Agreements for the Funds as part of their consideration of agreements for funds across the complex, but their approvals were made on a fund-by-fund basis. The following summarizes a number of important, but not necessarily all, factors considered by the Boards in support of their approvals.
Nature, Extent and Quality of Services
The Boards received and considered various information regarding the nature, extent and quality of services provided to the Funds by Funds Management and the Sub-Adviser under the Advisory Agreements. This information included a description of the investment advisory services and Fund-level administrative services, as well as, among other things, a summary of the
Wells Fargo Small Company Growth Fund | 43
Other information (unaudited)
background and experience of senior management of Wells Fargo Asset Management (“WFAM”), of which Funds Management is a part, and a summary of investments made in the business of WFAM. The Boards also received a description of Funds Management’s and the Sub-Adviser’s business continuity plans and of their approaches to data privacy and cybersecurity, and related testing. The Boards also received and reviewed information about Funds Management’s role as administrator of the Funds’ liquidity risk management program, Funds Management’s approach to risk management, and Funds Management’s intermediary and vendor oversight program. The Boards also considered the qualifications, background, tenure and responsibilities of each of the portfolio managers primarily responsible for the day-to-day portfolio management of the Funds.
The Boards evaluated the ability of Funds Management and the Sub-Adviser to attract and retain qualified investment professionals, including research, advisory and supervisory personnel. The Boards further considered the compliance programs and compliance records of Funds Management and the Sub-Adviser. In addition, the Boards took into account the full range of services provided to the Funds by Funds Management and its affiliates.
Fund Investment Performance and Expenses
The Boards considered the investment performance results for each of the Funds over various time periods ended December 31, 2019. The Board also considered more current results for various time periods ended March 31, 2020. The Boards considered these results in comparison to the investment performance of funds in a universe that was determined by Broadridge Inc. (“Broadridge”) to be similar to the Gateway Fund (the “Universe”), and in comparison to the Gateway Fund’s benchmark index and to other comparative data. Broadridge is an independent provider of investment company data. The Boards received a description of the methodology used by Broadridge to select the mutual funds in the performance Universe. The Funds Trust Board noted that the investment performance of the Gateway Fund (Administrator Class) was higher than the average investment performance of its Universe for ten-year period ended December 31, 2019, and lower than the average investment performance of its Universe for one-, three- and five- year periods ended December 31, 2019. The Funds Trust Board also noted that the investment performance of the Gateway Fund (Administrator Class) was higher than the average investment performance of its Universe for ten-year period ended March 31, 2020, and lower than the average investment performance of its Universe for one-, three- and five- year periods ended March 31, 2020. The Funds Trust Board also noted that the investment performance of the Gateway Fund was higher than its benchmark, the Russell 2000® Growth Index, for the three- and ten-year periods ended December 31, 2019, and lower than its benchmark index for the one- and five-year periods ended December 31, 2019. The Funds Trust Board also noted that the investment performance of the Gateway Fund was higher than its benchmark, the Russell 2000® Growth Index, for the ten-year period ended March 31, 2020, and lower for one-, three- and five-year periods ended March 31, 2020.
The Master Trust Board took note of the investment performance of the Master Portfolio in the context of reviewing the investment performance of the Gateway Fund.
The Funds Trust Board received information concerning, and discussed factors contributing to, the underperformance of the Gateway Fund relative to the Universe and benchmark for the periods identified above. The Funds Trust Board took note of the explanations for the relative underperformance during these periods, including with respect to investment decisions and market factors that affected the Gateway Fund’s investment performance.
The Funds Trust Board also received and considered information regarding the Gateway Fund’s net operating expense ratios, which include fees and expenses of the Master Portfolio, and their various components, including actual management fees assessed at the Gateway Fund and Master Portfolio levels, custodian and other non-management fees, and Rule 12b-1 and non-Rule 12b-1 shareholder service fees. The Funds Trust Board considered these ratios in comparison to the median ratios of funds in class-specific expense groups that were determined by Broadridge to be similar to the Gateway Fund (the “Groups”). The Funds Trust Board received a description of the methodology used by Broadridge to select the mutual funds in the expense Groups and an explanation of how funds comprising expense groups and their expense ratios may vary from year-to-year. Based on the Broadridge reports, the Funds Trust Board noted that the net operating expense ratios of the Gateway Fund were equal to or in range of the median net operating expense ratios of its expense Groups for all share classes, except Class R6.
With respect to the Master Portfolio, the Master Trust Board reviewed the fee rates that are payable to Funds Management for investment advisory services (as discussed below), which are the only fees charged at the Master Portfolio level, relative to a corresponding expense Group.
The Boards took into account the Funds’ investment performance and expense information provided to them among the factors considered in deciding to re-approve the Advisory Agreements.
Investment Management, Advisory and Sub-Advisory Fee Rates
The Funds Trust Board noted that Funds Management receives no advisory fees from the Gateway Fund as long as the Gateway Fund continues to invest all (or substantially all) of its assets in a single master portfolio. If the Gateway Fund were to change its
44 | Wells Fargo Small Company Growth Fund
Other information (unaudited)
investment structure so that it began investing in two or more master portfolios (a fund-of-funds), Funds Management would be entitled to receive an annual fee of 0.25% of the Gateway Fund’s average daily net assets for providing investment advisory services to the Gateway Fund, including allocating the Gateway Fund’s assets to the Master Portfolio.
The Funds Trust Board reviewed and considered the contractual fee rates that are payable by the Gateway Fund to Funds Management under the Gateway Fund Management Agreement for management services (other than investment advisory services), as well as the contractual fee rates payable by the Gateway Fund to Funds Management for class-level administrative services under a Class-Level Administration Agreement, which include, among other things, class-level transfer agency and sub-transfer agency costs (collectively, the “Management Rates”).
The Master Trust Board reviewed and considered the contractual investment advisory fee rate that is payable by the Master Portfolio to Funds Management for investment advisory services under the Master Portfolio Advisory Agreement (the “Advisory Agreement Rate”). The Master Trust Board also reviewed and considered the contractual investment sub-advisory fee rate that is payable by Funds Management to the Sub-Adviser for investment sub-advisory services (the “Sub-Advisory Agreement Rate”).
Among other information reviewed by the Funds Trust Board was a comparison of the Gateway Fund’s Management Rate, which, for this purpose, includes the advisory fees paid at the Master Portfolio level, with the average contractual investment management fee rates of funds in the expense Groups at a common asset level as well as transfer agency costs of the funds in the expense Groups. The Funds Trust Board noted that the Management Rates of the Gateway Fund were in range of the sum of these average rates for the Gateway Fund’s expense Groups for the Institutional Class and Class R6, and higher than the sum of these average rates for the Gateway Fund’s expense Groups for Class A and the Administrator Class. The Board noted that the Fund was benefitting from advisory fee breakpoints through the Master Portfolio in which it invests.
The Master Trust Board reviewed a comparison of the Advisory Agreement Rate of the Master Portfolio with those of other funds in the Master Portfolio’s expense Group at a common asset level. The Master Trust Board noted that the Advisory Agreement Rate of the Master Portfolio was lower than the median rate for the Master Portfolio’s expense Group.
The Master Trust Board also received and considered information about the portions of the total management fees that were retained by Funds Management after payment of the fees to the Sub-Adviser for sub-advisory services. The Master Trust Board considered these amounts in comparison to the median amount retained by advisers to funds in a sub-advised expense universe that was determined by Broadridge to be similar to the Master Portfolio. The Board noted the small size of the sub-advised expense universe. In assessing the reasonableness of these amounts, the Master Trust Board received and evaluated information about the nature and extent of responsibilities retained and risks assumed by Funds Management and not delegated to or assumed by the Sub-Adviser, and about Funds Management’s on-going oversight services. The Master Trust Board also considered that the sub-advisory fees paid to the Sub-Adviser had been negotiated by Funds Management on an arm’s length basis.
The Boards also received and considered information about the nature and extent of services offered and fee rates charged by Funds Management and the Sub-Adviser to other types of clients with investment strategies similar to those of the Funds. In this regard, the Boards received information about the significantly greater scope of services, and compliance, reporting and other legal burdens and risks of managing proprietary mutual funds compared with those associated with managing assets of other types of clients, including third-party sub-advised fund clients and non-mutual fund clients such as institutional separate accounts.
Based on its consideration of the factors and information it deemed relevant, including those described here, the Funds Trust Board determined that the compensation payable to Funds Management under the Gateway Fund Management Agreement was reasonable, and the Master Trust Board determined that the compensation payable to Funds Management under the Master Portfolio Advisory Agreement and to the Sub-Adviser under the Sub-Advisory Agreement was reasonable.
Profitability
The Boards received and considered information concerning the profitability of Funds Management, as well as the profitability of both WFAM and Wells Fargo & Co. (“Wells Fargo”) from providing services to the fund family as a whole.
Funds Management reported on the methodologies and estimates used in calculating profitability, including a description of the methodology used to allocate certain expenses. Among other things, the Boards noted that the levels of profitability reported on a fund-by-fund basis varied widely, depending on factors such as the size, type and age of fund. The Boards did not consider profitability with respect to the Sub-Adviser, as the sub-advisory fees paid to the Sub-Adviser had been negotiated by Funds Management on an arm’s-length basis.
Wells Fargo Small Company Growth Fund | 45
Other information (unaudited)
Based on its review, the Boards did not deem the profits reported by Funds Management, WFAM or Wells Fargo from services provided to the Funds to be at a level that would prevent the Boards from approving the continuation of the Advisory Agreements.
Economies of Scale
The Boards received and considered information about the potential for Funds Management to experience economies of scale in the provision of management services to the Funds, the difficulties of calculating economies of scale at an individual fund level, and the extent to which potential scale benefits are shared with shareholders. The Boards noted the existence of breakpoints in the Master Portfolio’s advisory fee structure and the Gateway Fund’s management fee structure, which operate generally to reduce the Funds’ expense ratios as the Funds grow in size, and the size of the Master Portfolio and the Gateway Fund, respectively, in relation to such breakpoints. The Boards considered that, in addition to advisory fee and management fee breakpoints, Funds Management shares potential economies of scale from its management business in a variety of ways, including through fee waiver and expense reimbursement arrangements, services that benefit shareholders, competitive management fee rates set at the outset without regard to breakpoints, and investments in the business intended to enhance services available to shareholders.
The Boards concluded that Funds Management’s arrangements with respect to each Fund, including contractual breakpoints, constituted a reasonable approach to sharing potential economies of scale with the Funds and their shareholders.
Other Benefits to Funds Management and the Sub-Adviser
The Boards received and considered information regarding potential “fall-out” or ancillary benefits received by Funds Management, the Sub-Adviser, and their affiliates as a result of their relationships with the Funds. Ancillary benefits could include, among others, benefits directly attributable to other relationships with the Funds and benefits potentially derived from an increase in Funds Management’s and the Sub-Adviser’s business as a result of their relationships with the Funds. The Boards noted that various affiliates of Funds Management may receive distribution-related fees, shareholder servicing payments and sub-transfer agency fees in respect of shares sold or held through them and services provided.
The Boards also reviewed information about soft dollar credits earned and utilized by the Sub-Adviser, fees earned by Funds Management and its affiliate from managing a private investment vehicle for the fund family’s securities lending collateral, and commissions earned by an affiliated broker from portfolio transactions.
Based on their consideration of the factors and information they deemed relevant, including those described here, the Boards did not find that any ancillary benefits received by Funds Management, the Sub-Adviser, and their affiliates were unreasonable.
Conclusion
At the Meeting, after considering the above-described factors and based on its deliberations and its evaluation of the information described above, the Funds Trust Board unanimously approved the continuation of the Gateway Fund Management Agreement for a one-year period. Additionally, after considering the above-described factors and based on its deliberations and its evaluation of the information described above, the Master Trust Board unanimously approved the continuation of the Master Portfolio Advisory Agreement and the Sub-Advisory Agreement, each for a one-year term. The Boards also determined that the compensation payable to Funds Management and the Sub-Adviser was reasonable.
46 | Wells Fargo Small Company Growth Fund
Other information (unaudited)
LIQUIDITY RISK MANAGEMENT PROGRAM
In accordance with Rule 22e-4 under the Investment Company Act of 1940, as amended (the “Liquidity Rule”), each of Wells Fargo Funds Trust and Wells Fargo Master Trust (each a “Trust”) has adopted and implemented a liquidity risk management program (the “Program”) on behalf of each of its non-money market series, including the Fund and the Portfolio, respectively, which is reasonably designed to assess and manage the Fund’s or the Portfolio’s liquidity risk. “Liquidity risk” is defined as the risk that the Fund or Portfolio is unable to meet redemption requests without significantly diluting remaining investors’ interests. Each Trust’s Board of Trustees (each a “Board”) previously approved the designation of Wells Fargo Funds Management, LLC (“Funds Management”), the Fund’s investment manager and the Portfolio’s investment adviser, as the administrator of the Program, and Funds Management has established a Liquidity Risk Management Council composed of personnel from multiple departments within Funds Management and its affiliates to assist Funds Management in the implementation and on-going administration of the Program.
The Program is comprised of various components designed to support the assessment and/or management of liquidity risk, including: (1) the periodic assessment (no less frequently than annually) of certain factors that influence the Fund’s and the Portfolio’s liquidity risk; (2) the periodic classification (no less frequently than monthly) of the Fund’s and the Portfolio’s investments into one of four liquidity categories that reflect an estimate of their liquidity under current market conditions; (3) a 15% limit on the acquisition of “illiquid investments” (as defined under the Liquidity Rule); (4) to the extent the Fund or the Portfolio does not invest primarily in “highly liquid investments” (as defined under the Liquidity Rule), the determination of a minimum percentage of the Fund’s or the Portfolio’s assets that generally will be invested in highly liquid investments (an “HLIM”); (5) if the Fund or the Portfolio has established an HLIM, the periodic review (no less frequently than annually) of the HLIM and the adoption of policies and procedures for responding to a shortfall of the Fund’s or the Portfolio’s “highly liquid investments” below its HLIM; and (6) periodic reporting to the respective Board.
At a meeting of each Board held on May 26 and 28, 2020, the Board received a written report (the “Report”) from Funds Management that addressed the operation of the Program and assessed its adequacy and effectiveness of implementation. The Report covered the initial period from December 1, 2018 through December 31, 2019 (the “Reporting Period”). No significant liquidity events impacting the Fund or the Portfolio were noted in the Report. There were no material changes to the Program during the Reporting Period. The Report concluded that the Program is operating effectively to assess and manage the Fund’s and the Portfolio’s liquidity risk, and that the Program has been and continues to be adequately and effectively implemented to monitor and, as applicable, respond to the Fund’s and the Portfolio’s liquidity developments.
There can be no assurance that the Program will achieve its objectives under all circumstances in the future. Please refer to the Fund’s prospectus for more information regarding the Fund’s exposure to liquidity risk and other risks to which an investment in the Fund may be subject.
Wells Fargo Small Company Growth Fund | 47
Appendix I (unaudited)
Effective on or about May 1, 2020, if you purchase Fund shares through a Janney Montgomery Scott LLC (“Janney”) brokerage account, you will be eligible for the following load waivers (front-end sales charge waivers and contingent deferred sales charge (“CDSC”), or back-end sales charge, waivers) and discounts, which may differ from those disclosed elsewhere in the Fund’s Prospectus or SAI.
|
| Front-end sales charge* waivers on Class A shares available at Janney |
|
| Shares purchased through reinvestment of capital gains distributions and dividend reinvestment when purchasing shares of the same fund (but not any other fund within the fund family). |
|
| Shares purchased by employees and registered representatives of Janney or its affiliates and their family members as designated by Janney. |
|
| Shares purchased from the proceeds of redemptions within the same fund family, provided (1) the repurchase occurs within ninety (90) days following the redemption, (2) the redemption and purchase occur in the same account, and (3) redeemed shares were subject to a front-end or deferred sales load (i.e., right of reinstatement). |
|
| Employer-sponsored retirement plans (e.g., 401(k) plans, 457 plans, employer-sponsored 403(b) plans, profit sharing and money purchase pension plans and defined benefit plans). For purposes of this provision, employer-sponsored retirement plans do not include SEP IRAs, Simple IRAs, SAR-SEPs or Keogh plans. |
|
| Shares acquired through a right of reinstatement. |
|
| Class C shares that are no longer subject to a contingent deferred sales charge and are converted to Class A shares of the same fund pursuant to Janney’s policies and procedures. |
| CDSC waivers on Class A and Class C shares available at Janney |
|
| Shares sold upon the death or disability of the shareholder. |
|
| Shares sold as part of a systematic withdrawal plan as described in the Fund’s Prospectus. |
|
| Shares purchased in connection with a return of excess contributions from an IRA account. |
|
| Shares sold as part of a required minimum distribution for IRA and retirement accounts if the redemption is taken in or after the year the shareholder reaches qualified age based on applicable IRS regulations. |
|
| Shares sold to pay Janney fees but only if the transaction is initiated by Janney. |
|
| Shares acquired through a right of reinstatement. |
|
| Shares exchanged into the same share class of a different fund. |
| Front-end sales charge* discounts available at Janney; breakpoints, rights of accumulation and/or letters of intent |
|
| Breakpoints as described in the Fund’s Prospectus. |
|
| Rights of accumulation (“ROA”), which entitle shareholders to breakpoint discounts, will be automatically calculated based on the aggregated holding of fund family assets held by accounts within the purchaser’s household at Janney. Eligible fund family assets not held at Janney may be included in the ROA calculation only if the shareholder notifies his or her financial advisor about such assets. |
|
| Letters of intent which allow for breakpoint discounts based on anticipated purchases within a fund family, over a 13-month time period. Eligible fund family assets not held at Janney Montgomery Scott may be included in the calculation of letters of intent only if the shareholder notifies his or her financial advisor about such assets. |
| * | Also referred to as an “initial sales charge.” |
48 | Wells Fargo Small Company Growth Fund
Appendix II (unaudited)
Effective on or after May 1, 2020, clients of Edward Jones (also referred to as “shareholders”) purchasing Fund shares on the Edward Jones commission and fee-based platforms are eligible only for the following sales charge discounts (also referred to as “breakpoints”) and waivers, which can differ from breakpoints and waivers described elsewhere in the Fund’s Prospectus or SAI or through another broker-dealer. In all instances, it is the shareholder’s responsibility to inform Edward Jones at the time of purchase of any relationship, holdings of Wells Fargo Funds or other facts qualifying the purchaser for breakpoints or waivers. Edward Jones can ask for documentation of such circumstance.
|
| Breakpoints available at Edward Jones |
|
| Rights of Accumulation (ROA) |
|
The applicable sales charge on a purchase of Class A shares is determined by taking into account all share classes (except any money market funds and retirement plan share classes) of Wells Fargo Funds held by the shareholder or in an account grouped by Edward Jones with other accounts for the purpose of providing certain pricing considerations (“pricing groups”). This includes all share classes held on the Edward Jones platform and/or held on another platform. The inclusion of eligible fund family assets in the rights of accumulation calculation is dependent on the shareholder notifying his or her financial advisor of such assets at the time of calculation. |
|
ROA is determined by calculating the higher of cost or market value (current shares x NAV). |
|
| Letter of Intent (LOI) |
|
Through a LOI, shareholders can receive the sales charge and breakpoint discounts for purchases shareholders intend to makeover a 13-month period from the date Edward Jones receives the LOI. The LOI is determined by calculating the higher of cost or market value of qualifying holdings at LOI initiation in combination with the value that the shareholder intends to buy over a 13-month period to calculate the front-end sales charge and any breakpoint discounts. Each purchase the shareholder makes during that 13-month period will receive the sales charge and breakpoint discount that applies to the total amount. The inclusion of eligible fund family assets in the LOI calculation is dependent on the shareholder notifying his or her financial advisor of such assets at the time of calculation. Purchases made before the LOI is received by Edward Jones are not covered under the LOI and will not reduce the sales charge previously paid. Sales charges will be adjusted if LOI is not met. |
| Sales charges are waived for the following shareholders and in the following situations at Edward Jones: |
● Associates of Edward Jones and its affiliates and their family members who are in the same pricing group (as determined by Edward Jones under its policies and procedures) as the associate. This waiver will continue for the remainder of the associate’s life if the associate retires from Edward Jones in good-standing. |
● Shares purchased in an Edward Jones fee-based program. |
● Shares purchased through reinvestment of capital gains distributions and dividend reinvestment. |
● Shares purchased from the proceeds of redeemed shares of the same fund family so long as the following conditions are met: 1) the proceeds are from the sale of shares within 60 days of the purchase, and 2) the sale and purchase are made in the same share class and the same account or the purchase is made in an individual retirement account with proceeds from liquidations in a non-retirement account. |
● Shares exchanged into Class A shares from another share class so long as the exchange is into the same fund and was initiated at the discretion of Edward Jones. Edward Jones is responsible for any remaining CDSC due to the fund company, if applicable. Any future purchases are subject to the applicable sales charge as disclosed in the prospectus. |
● Exchanges from Class C shares to Class A shares of the same fund, generally, in the 84th month following the anniversary of the purchase date or earlier at the discretion of Edward Jones. |
If the shareholder purchases shares that are subject to a CDSC and those shares are redeemed before the CDSC is expired, the shareholder
is responsible to pay the CDSC except in the following conditions available at Edward Jones: |
● The death or disability of the shareholder. |
● Systematic withdrawals with up to 10% per year of the account value. |
● Return of excess contributions from an Individual Retirement Account (IRA). |
● Shares sold as part of a required minimum distribution for IRA and retirement accounts if the redemption is taken in or after the year the shareholder reaches qualified age based on applicable IRS regulation. |
● Shares sold to pay Edward Jones fees or costs in such cases where the transaction is initiated by Edward Jones. |
● Shares exchanged in an Edward Jones fee-based program. |
● Shares acquired through NAV reinstatement. |
Wells Fargo Small Company Growth Fund | 49
Appendix II (unaudited)
|
| Other Important Information for accounts at Edward Jones: |
| Minimum Purchase Amounts |
● $250 initial purchase minimum |
● $50 subsequent purchase minimum |
|
| Minimum Balances |
| Edward Jones has the right to redeem at its discretion fund holdings with a balance of $250 or less. The following are examples of accounts that are not included in this policy: |
● A fee-based account held on an Edward Jones platform |
● A 529 account held on an Edward Jones platform |
● An account with an active systematic investment plan or letter of intent (LOI) |
|
| Changing Share Classes |
| At any time it deems necessary, Edward Jones has the authority to exchange at NAV a shareholder’s holdings in a fund to Class A shares. |
50 | Wells Fargo Small Company Growth Fund
Appendix III (unaudited)
Effective June 1, 2020, shareholders purchasing Fund shares through an Oppenheimer & Co. Inc. (“Oppenheimer”) platform or account are eligible only for the following load waivers (front-end sales charge waivers and contingent deferred or back-end, sales charge waivers) and discounts, which may differ from those disclosed in the Fund’s Prospectus or SAI.
|
| Front-end Sales Load Waivers on Class A Shares available at Oppenheimer |
|
| Employer-sponsored retirement, deferred compensation and employee benefit plans (including health savings accounts) and trusts used to fund those plans, provided that the shares are not held in a commission-based brokerage account and shares are held for the benefit of the plan. |
|
| Shares purchased by or through a 529 Plan. |
|
| Shares purchased through an Oppenheimer affiliated investment advisory program. |
|
| Shares purchased through reinvestment of capital gains distributions and dividend reinvestment when purchasing shares of the same fund (but not any other fund within the fund family). |
|
| Shares purchased from the proceeds of redemptions within the same fund family, provided (1) the repurchase occurs within 90 days following the redemption, (2) the redemption and purchase occur in the same account, and (3) redeemed shares were subject to a front-end or deferred sales load (known as Rights of Restatement). |
|
| A shareholder in the Fund’s Class C shares will have their shares exchanged at net asset value to Class A shares (or the appropriate share class) of the Fund if the shares are no longer subject to a CDSC and the exchange is in line with the policies and procedures of Oppenheimer. |
|
| Employees and registered representatives of Oppenheimer or its affiliates and their family members. |
|
| Directors or Trustees of the Fund, and employees of the Fund’s investment adviser or any of its affiliates, as described in the Prospectus. |
| CDSC Waivers on A and C Shares available at Oppenheimer |
|
| Death or disability of the shareholder. |
|
| Shares sold as part of a systematic withdrawal plan as described in the Prospectus. |
|
| Return of excess contributions from an IRA Account. |
|
| Shares sold as part of a required minimum distribution for IRA and retirement accounts due to the shareholder reaching the qualified age based on applicable IRS regulations as described in the Prospectus. |
|
| Shares sold to pay Oppenheimer fees but only if the transaction is initiated by Oppenheimer. |
|
| Shares acquired through a right of reinstatement. |
| Front-end load Discounts Available at Oppenheimer: Breakpoints, Rights of Accumulation & Letters of Intent |
|
| Breakpoints as described in the Prospectus. |
|
| Rights of Accumulation (ROA), which entitle shareholders to breakpoint discounts, will be automatically calculated based on the aggregated holding of fund family assets held by accounts within the purchaser’s household at Oppenheimer. Eligible fund family assets not held at Oppenheimer may be included in the ROA calculation only if the shareholder notifies his or her financial advisor about such assets. |
Wells Fargo Small Company Growth Fund | 51
Appendix IV (unaudited)
Effective June 15, 2020, shareholders purchasing fund shares through a Robert W. Baird & Co. (“Baird”) platform or account will only be eligible for the following sales charge waivers (front-end sales charge waivers and CDSC waivers) and discounts, which may differ from those disclosed elsewhere in the Fund’s Prospectus or the SAI.
|
| Front-end Sales Load Waivers on Class A Shares available at Baird |
|
| Shares purchased through reinvestment of capital gains distributions and dividend reinvestment when purchasing share of the same fund. |
|
| Share purchase by employees and registers representatives of Baird or its affiliate and their family members as designated by Baird. |
|
| Shares purchase from the proceeds of redemptions within the same fund family, provided (1) the repurchase occurs within 90 days following the redemption, (2) the redemption and purchase occur in the same accounts, and (3) redeemed shares were subject to a front-end or deferred sales charge (known as rights of reinstatement). |
|
| A shareholder in the Funds Investor C Shares will have their share exchanged at net asset value to Investor A shares of the fund if the shares are no longer subject to CDSC and the exchange is in line with the policies and procedures of Baird. |
|
| Employer-sponsored retirement plans or charitable accounts in a transactional brokerage account at Baird, including 401(k)plans, 457 plans, employer-sponsored 403(b) plans, profit sharing and money purchase pension plans and defined benefit plans. For purposes of this provision, employer-sponsored retirement plans do not include SEP IRAs, Simple IRAs or SAR-SEPs. |
| CDSC Waivers on A and C Shares available at Baird |
|
| Shares sold due to death or disability of the shareholder. |
|
| Shares sold as part of a systematic withdrawal plan as described in the Fund’s Prospectus. |
|
| Shares bought due to returns of excess contributions from an IRA Account. |
|
| Shares sold as part of a required minimum distribution for IRA and retirement accounts due to the shareholder reaching age 72 as described in the Fund’s Prospectus. |
|
| Shares sold to pay Baird fees but only if the transaction is initiated by Baird. |
|
| Shares acquired through a right of reinstatement. |
| Front-end load Discounts Available at Baird: Breakpoint and/or Rights of Accumulation |
|
| Breakpoints as described in the Prospectus. |
|
| Rights of accumulations which entitles shareholders to breakpoint discounts will be automatically calculated based on the aggregated holding of fund family assets held by accounts within the purchaser’s household at Baird. Eligible fund family assets not held at Baird may be included in the rights of accumulations calculation only if the shareholder notifies his or her financial advisor about such assets. |
|
| Letters of Intent (LOI) allow for breakpoint discounts based on anticipated purchases within a fund family through Baird, over a 13-month period of time. |
52 | Wells Fargo Small Company Growth Fund

For more information
More information about Wells Fargo Funds is available free upon request. To obtain literature, please write, visit the Fund’s website, or call:
Wells Fargo Funds
P.O. Box 219967
Kansas City, MO 64121-9967
Website: wfam.com
Individual investors: 1-800-222-8222
Retail investment professionals: 1-888-877-9275
Institutional investment professionals: 1-866-765-0778

This report and the financial statements contained herein are submitted for the general information of the shareholders of the Fund. If this report is used for promotional purposes, distribution of the report must be accompanied or preceded by a current prospectus. Before investing, please consider the investment objectives, risks, charges, and expenses of the investment. For a current prospectus and, if available, a summary prospectus, containing this information, call 1-800-222-8222 or visit the Fund’s website at wfam.com. Read the prospectus carefully before you invest or send money.
Wells Fargo Asset Management (WFAM) is the trade name for certain investment advisory/management firms owned by Wells Fargo & Company. These firms include but are not limited to Wells Capital Management Incorporated and Wells Fargo Funds Management, LLC. Certain products managed by WFAM entities are distributed by Wells Fargo Funds Distributor, LLC (a broker-dealer and Member FINRA).
This material is for general informational and educational purposes only and is NOT intended to provide investment advice or a recommendation of any kind—including a recommendation for any specific investment, strategy, or plan.
INVESTMENT PRODUCTS: NOT FDIC INSURED ◾ NO BANK GUARANTEE ◾ MAY LOSE VALUE
© 2020 Wells Fargo & Company. All rights reserved.
PAR-0620-00320 07-20
A285/AR285 05-20
Annual Report
May 31, 2020
Wells Fargo
Small Company Value Fund
Beginning on January 1, 2021, as permitted by new regulations adopted by the Securities and Exchange Commission, paper copies of the Wells Fargo Funds’ annual and semi-annual shareholder reports issued after this date will no longer be sent by mail, unless you specifically request paper copies of the reports. Instead, the reports will be made available on the Funds’ website, and you will be notified by mail each time a report is posted and provided with a website address to access the report.
If you already elected to receive shareholder reports electronically, you will not be affected by this change and you need not take any action. You may elect to receive shareholder reports and other communications from the Fund electronically at any time by contacting your financial intermediary (such as a broker-dealer or bank) or, if you are a direct investor, by calling 1-800-222-8222 or by enrolling at wellsfargo.com/advantagedelivery.
You may elect to receive all future reports in paper free of charge. If you invest through a financial intermediary, you can contact your financial intermediary to request that you continue to receive paper copies of your shareholder reports; if you invest directly with the Fund, you can call 1-800-222-8222. Your election to receive reports in paper will apply to all Wells Fargo Funds held in your account with your financial intermediary or, if you are a direct investor, to all Wells Fargo Funds that you hold.
|
|
|
Reduce clutter. Save trees. |
Sign up for electronic delivery of prospectuses and shareholder reports at wellsfargo.com/ advantagedelivery |
The views expressed and any forward-looking statements are as of May 31, 2020, unless otherwise noted, and are those of the Fund managers and/or Wells Fargo Asset Management. Discussions of individual securities, or the markets generally, or any Wells Fargo Fund are not intended as individual recommendations. Future events or results may vary significantly from those expressed in any forward-looking statements. The views expressed are subject to change at any time in response to changing circumstances in the market. Wells Fargo Asset Management and the Fund disclaim any obligation to publicly update or revise any views expressed or forward-looking statements.
INVESTMENT PRODUCTS: NOT FDIC INSURED ◾ NO BANK GUARANTEE ◾ MAY LOSE VALUE
Wells Fargo Small Company Value Fund | 1
Letter to shareholders (unaudited)

Andrew Owen
President
Wells Fargo Funds
Dear Shareholder:
We are pleased to offer you this annual report for the Wells Fargo Small Company Value Fund for the 12-month period that ended May 31, 2020. Global stock markets saw earlier gains erased in February and March as governments around the world took unprecedented measures to stop the spread of the coronavirus at the expense of short-term economic output. However, markets rebounded in April and May to offset much of the losses as central banks attempted to bolster capital markets and confidence. Fixed-income markets generally performed better, achieving widespread gains.
For the 12-month period, fixed-income securities generally had positive total returns while non-U.S. equities had broad losses and U.S. stocks performed strongly despite sharp volatility since late February. For the period, U.S. stocks, based on the S&P 500 Index,1 gained 12.84%. International stocks, as measured by the MSCI ACWI ex USA Index (Net),2 returned -3.43%, while the MSCI EM Index (Net)3 trailed slightly, with a -4.39% return. For bond investors, the Bloomberg Barclays U.S. Aggregate Bond Index4 gained a robust 9.42%, the Bloomberg Barclays Global Aggregate ex-USD Index5 returned 2.67%, and the Bloomberg Barclays Municipal Bond Index6 gained a more modest 3.98%, while the ICE BofA U.S. High Yield Index7 had a slight gain of 0.35%.
The fiscal year began on a positive note.
The 12-month period began with U.S. equity market advances during June and July 2019. The gains, primarily driven by geopolitical and monetary policy events, pushed equity markets to new highs. European Central Bank (ECB) President Mario Draghi indicated the bank was ready to cut rates or buy more assets to prop up inflation if needed. President Trump backed off of earlier tariff threats against Mexico and China. In the U.S., the Federal Reserve (Fed) implemented a 0.25% federal funds rate cut in July.
Later in July, the U.S. reversed course and threatened to impose higher tariffs on China’s exports after talks failed. China responded with tariff threats of its own and devalued the renminbi, roiling global markets. Major U.S. stock market indices closed July with the worst weekly results of the year. Bond prices gained as Treasury yields fell to multiyear lows, and the yield curve inverted at multiple points along the 30-year arc, with shorter-term yields higher than longer-term.
In August, U.S.-China trade tensions continued with no signs of compromise. Evidence of a continued global economic slowdown mounted, and central banks in China, New Zealand, and Thailand cut interest rates. Industrial and manufacturing data declined in China, Canada, Japan, and Germany. Adding to global uncertainty, Italy’s prime minister resigned,
| 1 | The S&P 500 Index consists of 500 stocks chosen for market size, liquidity, and industry group representation. It is a market-value-weighted index with each stock’s weight in the index proportionate to its market value. You cannot invest directly in an index. |
| 2 | The Morgan Stanley Capital International (MSCI) All Country World Index (ACWI) ex USA Index (Net) is a free-float-adjusted market-capitalization-weighted index that is designed to measure the equity market performance of developed and emerging markets, excluding the United States. Source: MSCI. MSCI makes no express or implied warranties or representations and shall have no liability whatsoever with respect to any MSCI data contained herein. The MSCI data may not be further redistributed or used as a basis for other indices or any securities or financial products. This report is not approved, reviewed, or produced by MSCI. You cannot invest directly in an index. |
| 3 | The MSCI Emerging Markets (EM) Index (Net) is a free-float-adjusted market-capitalization-weighted index that is designed to measure equity market performance of emerging markets. You cannot invest directly in an index. |
| 4 | The Bloomberg Barclays U.S. Aggregate Bond Index is a broad-based benchmark that measures the investment-grade, U.S. dollar-denominated, fixed-rate taxable bond market, including Treasuries, government-related and corporate securities, mortgage-backed securities (agency fixed-rate and hybrid adjustable-rate mortgage pass-throughs), asset-backed securities, and commercial mortgage-backed securities. You cannot invest directly in an index. |
| 5 | The Bloomberg Barclays Global Aggregate ex-USD Index is an unmanaged index that provides a broad-based measure of the global investment-grade fixed-income markets excluding the U.S. dollar-denominated debt market. You cannot invest directly in an index. |
| 6 | The Bloomberg Barclays Municipal Bond Index is an unmanaged index composed of long-term tax-exempt bonds with a minimum credit rating of Baa. You cannot invest directly in an index. |
| 7 | The ICE BofA U.S. High Yield Index is a market-capitalization-weighted index of domestic and Yankee high-yield bonds. The index tracks the performance of high-yield securities traded in the U.S. bond market. You cannot invest directly in an index. Copyright 2020. ICE Data Indices, LLC. All rights reserved. |
2 | Wells Fargo Small Company Value Fund
Letter to shareholders (unaudited)
many feared a crackdown in Hong Kong as protestors sustained their calls for reform, and Prime Minister Boris Johnson planned to suspend the British Parliament as Brexit’s deadline neared.
In the U.S., the Fed cut interest rates a second time in September. U.S. manufacturing data disappointed investors. The U.S. Congress announced it would pursue an impeachment investigation of President Trump. Meanwhile, the Brexit impasse showed no signs of resolution. Officials in China said that hitting the country’s economic growth goals for the year would be difficult considering the weight of tariffs and trade restrictions. Although the S&P 500 Index finished the third quarter with the best year-to-date returns in more than 20 years, concerns about future returns remained.
The fourth quarter of 2019 started on a strong note, with U.S.-China trade tensions relaxing in October along with renewed optimism for a U.K. Brexit deal and positive macroeconomic data. The initial estimate of U.S. third-quarter gross domestic product growth was a resilient 1.9% annualized rate, while the U.S. unemployment rate fell to a 50-year low of 3.5% in September. However, despite resilience among U.S. consumers, business confidence declined and manufacturing activity contracted. Concerned with a potential economic slowdown, the Fed lowered interest rates another quarter point in late October—its third rate cut in four months. This helped push the S&P 500 Index to a new all-time high while emerging market equities rallied and global bonds declined overall, reflecting a broad pickup in risk appetite.
Equity markets continued to rally in November despite ongoing geopolitical risks. Hopes for a U.S.-China trade deal buoyed investor confidence. U.S. business sentiment improved slightly, and manufacturing and services activity picked up. While consumer confidence and purchasing manager activity rose in the eurozone, China reported weakening manufacturing and consumer data. Bond yields rose marginally, leading to slightly negative returns for global government and investment-grade corporate bonds.
Financial markets ended 2019 with a boost from the U.S. and China accord on a Phase One trade deal. That, along with the landslide win by the pro-Brexit U.K. Conservative Party in a national election and ongoing central bank support, gave investors greater confidence. U.S. economic indicators were generally positive, with the exception of manufacturing activity and business confidence. Consumer confidence was resilient, fed by a robust labor market, tame inflation, and lower interest rates, which boosted housing affordability and stimulated homebuyer activity. The impeachment of U.S. President Donald Trump had little impact on markets. Meanwhile, slowing Chinese economic activity, partly attributable to the trade war, led to further government stimulus at year-end through lower reserve ratios, allowing banks to lend more money.
The year-end rally continued in early January 2020. However, capital market volatility picked up sharply in late January on concerns over the potential impact of the coronavirus on the global economy and stock markets. With sentiment somewhat souring, perceived safe havens did well in January. The U.S. dollar and Japanese yen both rose, and government bonds outperformed equities. While the S&P 500 Index held its ground, emerging market equities tumbled, including those in Asia.
In February, the coronavirus became the major market focus. Fears of the virus’s impact on global growth led to expectations of increased global central bank monetary policy support. That led the 10-year U.S. Treasury yield to fall to an all-time low of 1.1% by the end of the month. Although equity markets initially shrugged off concerns about the outbreak, focusing instead on strong fourth-quarter earnings and improving business confidence in January, market sentiment turned sharply lower toward month-end and the S&P 500 Index lost 8.2% for the month. Oil prices tumbled as Russia and the Organization of the Petroleum Exporting Countries compounded a major decline in oil demand with a brutal price war, partly aimed at dissuading further U.S. shale production. As a result, the price of West Texas Intermediate crude oil fell 13% in February.
Wells Fargo Small Company Value Fund | 3
Letter to shareholders (unaudited)
“The global spread of the coronavirus led country after country to clamp down on social and business-related activity in order to contain the virus from causing even greater devastation and overwhelming health care systems.”
“Markets rebounded strongly in April after the earlier extreme volatility, with the S&P 500 Index gaining 12.8% for the month and the MSCI ACWI ex USA Index (Net) returning 7.6%.”
|
|
|
For further information about your Fund, contact your investment professional, visit our website at wfam.com, or call us directly at 1-800-222-8222. |
The global spread of the coronavirus led country after country to clamp down on social and business-related activity in order to contain the virus from causing even greater devastation and overwhelming health care systems. This abrupt stoppage of economic activity led to the sharp deceleration of global output, sending economies into a deep contraction. Central bank responses were swift, as they slashed interest rates and expanded quantitative easing programs to restore liquidity and confidence to the markets. In the U.S., the Fed introduced several new lending programs, funding investment-grade bonds, money market mutual funds, and commercial paper while purchasing Treasuries, mortgage-backed securities, and overnight repurchase agreements. Meanwhile, stock markets tumbled quickly into a bear market, ending the longest bull stock market in U.S. history.
Markets rebounded strongly in April after the earlier extreme volatility, with the S&P 500 Index gaining 12.8% for the month and the MSCI ACWI ex USA Index (Net) returning 7.6%. The rebound was fueled by unprecedented government and central bank stimulus measures taken to buffer the economic damage created by mass shutdowns enacted in order to contain the virus’s spread. The U.S. economy contracted by an annualized 4.8% pace in the first quarter, with 30 million new unemployment insurance claims in six weeks. In the eurozone, first-quarter real gross domestic product (GDP) shrank 3.8%, with the composite April Flash Purchasing Managers’ Index, a monthly survey of purchasing managers, falling to an all-time low of 13.5. The ECB expanded its quantitative easing to include the purchase of additional government bonds of countries with the greatest virus-related need, including Italy and Spain. China’s first-quarter GDP fell by 6.8% year over year. However, retail sales, production, and investment showed signs of recovery. Extreme oil price volatility continued as global supply far exceeded demand.
In May, the equity market rebound continued, with the S&P 500 Index climbing a further 4.8%. European and Japanese stock markets also had monthly gains. Investors regained confidence on reports of early signs of success in human trials of a coronavirus vaccine. Growth stocks continued to outperform value stocks while returns on global government bonds were generally flat. In the U.S., a gap grew between the stock market rebound and devastating economic data points, including an April unemployment rate of 14.7%, the highest level since World War II. Purchasing managers’ indices continued to reflect weakening activity in May in both the manufacturing and services sectors. U.S. corporate earnings reports indicated a 14% year-over-year contraction in earnings from the first quarter of 2019. However, high demand for technology, driven by remote activity, helped maintain robust information technology sector earnings, which helped drive powerful well-known technology stocks higher.
Don’t let short-term uncertainty derail long-term investment goals.
Periods of investment uncertainty can present challenges, but experience has taught us that maintaining long-term investment goals can be an effective way to plan for the future. To help you create a sound strategy based on your personal goals and risk tolerance, Wells Fargo Funds offers more than 100 mutual funds spanning a wide range of asset classes and investment styles. Although diversification cannot guarantee an investment profit or prevent losses, we believe it can be an effective way to manage investment risk and potentially smooth out overall portfolio performance. We encourage investors to know their investments and to understand that appropriate levels of risk-taking may unlock opportunities.
Thank you for choosing to invest with Wells Fargo Funds. We appreciate your confidence in us and remain committed to helping you meet your financial needs.
Sincerely,

Andrew Owen
President
Wells Fargo Funds
4 | Wells Fargo Small Company Value Fund
This page is intentionally left blank.
Performance highlights (unaudited)
Investment objective
The Fund seeks long-term capital appreciation.
Manager
Wells Fargo Funds Management, LLC
Subadviser for the affiliated master portfolio1
Wells Capital Management Incorporated
Portfolio managers
Jeff Goverman
Garth R. Nisbet, CFA®‡
Craig Pieringer, CFA®‡
Average annual total returns (%) as of May 31, 2020
| | | | | | | | | | | | | | | | | | | | | | | | | | | | | | | | | | |
| | | | |
| | | | | Including sales charge | | | Excluding sales charge | | | Expense ratios2 (%) | |
| | | | | | | | | |
| | | Inception date | | 1 year | | | 5 year | | | 10 year | | | 1 year | | | 5 year | | | 10 year | | | Gross | | | Net3 | |
| | | | | | | | | | |
| Class A (SCVAX) | | 1-31-2002 | | | -18.04 | | | | -1.27 | | | | 6.01 | | | | -13.04 | * | | | -0.09 | | | | 6.64 | | | | 1.58 | | | | 1.15 | |
| | | | | | | | | | |
| Class C (SCVFX) | | 8-30-2002 | | | -14.70 | | | | -0.84 | | | | 5.84 | | | | -13.70 | * | | | -0.84 | | | | 5.84 | | | | 2.33 | | | | 1.90 | |
| | | | | | | | | | |
| Class R6 (SCVJX)4 | | 10-31-2016 | | | – | | | | – | | | | – | | | | -12.77 | * | | | 0.29 | | | | 6.97 | | | | 1.15 | | | | 0.75 | |
| | | | | | | | | | |
| Administrator Class (SCVIX) | | 1-31-2002 | | | – | | | | – | | | | – | | | | -12.98 | * | | | 0.03 | | | | 6.83 | | | | 1.50 | | | | 1.05 | |
| | | | | | | | | | |
| Institutional Class (SCVNX)5 | | 7-30-2010 | | | – | | | | – | | | | – | | | | -12.82 | * | | | 0.23 | | | | 7.04 | | | | 1.25 | | | | 0.85 | |
| | | | | | | | | | |
| Russell 2000® Value Index6 | | – | | | – | | | | – | | | | – | | | | -14.69 | | | | 0.71 | | | | 6.54 | | | | – | | | | – | |
| * | Total return differs from the return in the Financial Highlights in this report. The total return presented is calculated based on the NAV at which the shareholder transactions were processed. The NAV and total return presented in the Financial Highlights reflects certain adjustments made to the net assets of the Fund that are necessary under U.S. generally accepted accounting principles. |
Figures quoted represent past performance, which is no guarantee of future results, and do not reflect taxes that a shareholder may pay on an investment in a fund. Investment return and principal value of an investment will fluctuate so that an investor’s shares, when redeemed, may be worth more or less than their original cost. Performance shown without sales charges would be lower if sales charges were reflected. Current performance may be lower or higher than the performance data quoted, which assumes the reinvestment of dividends and capital gains. Current month-end performance is available on the Fund’s website, wfam.com.
Index returns do not include transaction costs associated with buying and selling securities, any mutual fund fees or expenses, or any taxes. It is not possible to invest directly in an index.
For Class A shares, the maximum front-end sales charge is 5.75%. For Class C shares, the maximum contingent deferred sales charge is 1.00%. Performance including a contingent deferred sales charge assumes the sales charge for the corresponding time period. Class R6, Administrator Class, and Institutional Class shares are sold without a front-end sales charge or contingent deferred sales charge.
Stock values fluctuate in response to the activities of individual companies and general market and economic conditions. Smaller-company stocks tend to be more volatile and less liquid than those of larger companies. Certain investment strategies tend to increase the total risk of an investment (relative to the broader market). Consult the Fund’s prospectus for additional information on these and other risks.
Please see footnotes on page 7.
6 | Wells Fargo Small Company Value Fund
Performance highlights (unaudited)
|
|
| Growth of $10,000 investment as of May 31, 20207 |
|
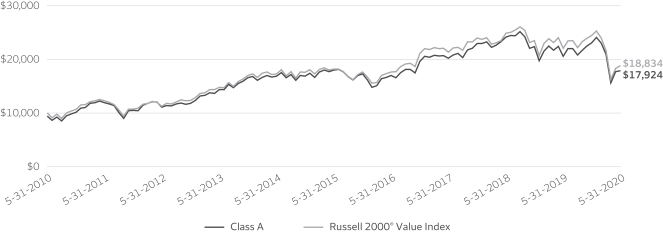
|
| ‡ | CFA® and Chartered Financial Analyst® are trademarks owned by CFA Institute. |
| 1 | The Fund is a feeder fund in a master-feeder structure that invests substantially all of its assets in a single affiliated master portfolio of the Wells Fargo Master Trust with a substantially identical investment objective and substantially similar investment strategies. References to the investment activities of the Fund are intended to refer to the investment activities of the affiliated master portfolio in which it invests. |
| 2 | Reflects the expense ratios as stated in the most recent prospectuses, which include the impact of 0.13% in acquired fund fees and expenses. The expense ratios shown are subject to change and may differ from the annualized expense ratios shown in the financial highlights of this report, which do not include acquired fund fees and expenses. |
| 3 | The manager has contractually committed through September 30, 2021, to waive fees and/or reimburse expenses to the extent necessary to cap total annual fund operating expenses after fee waivers at 1.15% for Class A, 1.90% for Class C, 0.75% for Class R6, 1.05% for Administrator Class, and 0.85% for Institutional Class. Brokerage commissions, stamp duty fees, interest, taxes, acquired fund fees and expenses (if any) from funds in which the affiliated master portfolio invests, and extraordinary expenses are excluded from the expense caps. Net expenses from the affiliated master portfolio are included in the expense caps. Prior to or after the commitment expiration date, the caps may be increased or the commitment to maintain the caps may be terminated only with the approval of the Board of Trustees. Without these caps, the Fund’s returns would have been lower. The expense ratio paid by an investor is the net expense ratio (the total annual fund operating expenses after fee waivers) as stated in the prospectuses. |
| 4 | Historical performance shown for the Class R6 shares prior to their inception reflects the performance of the Institutional Class shares and includes the higher expenses applicable to the Institutional Class shares. If these expenses had not been included, returns for the Class R6 shares would be higher. |
| 5 | Historical performance shown for the Institutional Class shares prior to their inception reflects the performance of the Administrator Class shares and includes the higher expenses applicable to the Administrator Class shares. If these expenses had not been included, returns for the Institutional Class shares would be higher. |
| 6 | The Russell 2000® Value Index measures the performance of those Russell 2000 companies with lower price/book ratios and lower forecasted growth values. You cannot invest directly in an index. |
| 7 | The chart compares the performance of Class A shares for the most recent ten years with the Russell 2000® Value Index. The chart assumes a hypothetical $10,000 investment in Class A shares and reflects all operating expenses and assumes the maximum initial sales charge of 5.75%. |
| 8 | The S&P 500 Index consists of 500 stocks chosen for market size, liquidity, and industry group representation. It is a market-value-weighted index with each stock’s weight in the index proportionate to its market value. You cannot invest directly in an index. |
| 9 | The ten largest holdings, excluding cash, cash equivalents and any money market funds, are calculated based on the value of the securities of the affiliated master portfolio allocable to the Fund divided by the total net assets of the Fund. Holdings are subject to change and may have changed since the date specified. |
| 10 | Amounts represent the sector allocation of the affiliated master portfolio which are calculated based on the total long-term investments of the affiliated master portfolio. These amounts are subject to change and may have changed since the date specified. |
| * | The security was no longer held at the end of the period. |
Wells Fargo Small Company Value Fund | 7
Performance highlights (unaudited)
MANAGER’S DISCUSSION
Fund highlights
| ∎ | | The Fund outperformed the Russell 2000® Value Index for the 12-month period that ended May 31, 2020. |
| ∎ | | Stock selection in consumer discretionary and industrials contributed to relative performance. Within consumer discretionary, investments in an internet-based shipping company and a household and personal care products company were the main contributors. Investments in a commercial vehicle manufacturer and a power generation company were the main contributors in industrials. |
| ∎ | | Stock selection within the financials sector and an underweighting in utilities detracted from relative results. Within financials, investments in mortgage real estate investment trusts (REITs) were the main detractors, while an underweight position in the outperforming utilities sector was the primary reason for the underperformance in utilities. |
During the period, investors were confronted with simultaneous global shocks.
During the 12-month period that ended May 31, 2020, the U.S. stock market endured a global trade war and then posted an all-time high in February 2020 as it celebrated the longest bull market in history—more than 10 years. Then, March 2020 marked historic volatility as communities, businesses, nations, and markets adjusted to the impact of the coronavirus pandemic. The S&P 500 Index8 of large-cap stocks sold off until it had declined by more than 35% in late March, ending the bull market. Over the 12-month period, the S&P 500 Index rose 12.84% while the Russell 2000® Value Index fell 14.69%.
As stocks climbed on Phase One trade deal optimism, we lowered portfolio market risk.
As the market approached its peak in January 2020, the portfolio management team responded to the strong market performance and full valuations by lowering the portfolio’s market risk exposure (beta). Following the March sell-off, the team increased exposure to more cyclically leveraged sectors, including consumer discretionary, materials, and banks.
| | | | |
|
| Ten largest holdings (%) as of May 31, 20209 | |
| | |
Dick’s Sporting Goods Incorporated | | | 1.12 | |
| | |
Dana Incorporated | | | 1.11 | |
| | |
Diamondback Energy Incorporated | | | 1.05 | |
| | |
Western Alliance Bancorp | | | 1.05 | |
| | |
Piper Jaffray Companies Incorporated | | | 1.03 | |
| | |
STAG Industrial Incorporated | | | 1.01 | |
| | |
Stericycle Incorporated | | | 1.00 | |
| | |
BMC Stock Holdings Incorporated | | | 0.99 | |
| | |
Hillenbrand Incorporated | | | 0.99 | |
| | |
Encore Wire Corporation | | | 0.99 | |
|
|
| Sector allocation as of May 31, 202010 |
|
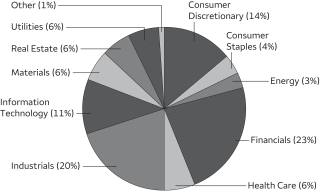 |
Strong stock selection and allocation effect within consumer discretionary led to the Fund’s outperformance.
The Fund outperformed its benchmark for the 12-month period. Stock selection in consumer discretionary and industrials contributed to relative performance, while financials and utilities investments detracted.
Stock selection in the consumer discretionary sector was the primary contributor to performance during the period. Shares of Stamps.com, Incorporated, a provider of internet-based shipping solutions, rallied over the period after reporting better-than-expected December quarter earnings and providing favorable guidance. Additionally, a significant overhang suppressing the stock was removed when the company announced that the United States Postal Service signed a new long-term agreement with resellers. The new agreement, which lasts up to six years, provides discounted pricing for large resellers such as Stamps.com. Stock selection in the industrials sector, notably Spartan Motors, Incorporated, contributed to performance. Spartan Motors (recently changed its name to Shyft Group, Incorporated), which focuses on vehicle manufacturing and assembly for the commercial and retail vehicle industries, performed well as it shed unprofitable businesses and invested in its final-mile delivery vehicle segment that is driven by strong e-commerce trends.
Please see footnotes on page 7.
8 | Wells Fargo Small Company Value Fund
Performance highlights (unaudited)
Stock selection within the financials sector detracted from performance. Due to the precipitous decline in the value of their assets, mortgage REIT stocks underperformed over the period. Shares of New York Mortgage Trust, Incorporated*, which is primarily a non-agency mortgage REIT, failed to meet margin calls after experiencing a significant decline in asset values, causing the shares to underperform the market. New York Mortgage Trust invests in residential mortgages, agency residential mortgage-backed securities, and commercial mortgage-backed securities. Shares of Redwood Trust, Incorporated*, another mortgage REIT, underperformed over the period as the company’s book value fell amid ongoing credit market deterioration. Sector allocation effect within the utilities sector detracted from performance. The portfolio’s relative underweighting and the sector’s relative outperformance led to the negative sector allocation effect.
Coincident with economic recovery, we believe there is a once-in-a-decade opportunity in value stocks.
In one of the biggest surprises in employment forecasting history, the U.S. economy added 2.5 million nonfarm payroll jobs in May—a sharp contrast to market expectations of an 8.3 million decline in jobs. Importantly, the U.S. Bureau of Labor Statistics jobs report was consistent with the better-than-expected May payrolls data reported by the ADP Research Institute. Moreover, anecdotal evidence of improved business activity included an increase in hotel occupancy, movie ticket sales, restaurant activity, airport travel, and mobility as measured by Google Maps.
The recent economic bounce and the coincident rotation away from consensus mega-cap technology stocks have gained increased investment strategist interest. We observed a number of Wall Street analysts and commentators suggesting that the pivot away from growth and large cap may have finally arrived. Christopher Harvey, head of equity strategy at Wells Fargo Securities, noted in a May 29, 2020, research piece:
“This growth-to-value, large-to-small market-cap rotation appears to be gaining steam … As we stated weeks ago, we believe there is a once-in-a-decade opportunity in value ...”
After three consecutive years of challenged small-cap value performance relative to growth and large-cap equity styles, it appears the tide may be turning.
Please see footnotes on page 7.
Wells Fargo Small Company Value Fund | 9
Fund expenses (unaudited)
As a shareholder of the Fund, you incur two types of costs: (1) transaction costs, including sales charges (loads) on purchase payments and contingent deferred sales charges (if any) on redemptions and (2) ongoing costs, including management fees, distribution (12b-1) and/or shareholder servicing fees, and other Fund expenses. This example is intended to help you understand your ongoing costs (in dollars) of investing in the Fund and to compare these costs with the ongoing costs of investing in other mutual funds.
The example is based on an investment of $1,000 invested at the beginning of the six-month period and held for the entire period from December 1, 2019 to May 31, 2020.
Actual expenses
The “Actual” line of the table below provides information about actual account values and actual expenses. You may use the information in this line, together with the amount you invested, to estimate the expenses that you paid over the period. Simply divide your account value by $1,000 (for example, an $8,600 account value divided by $1,000 = 8.6), then multiply the result by the number in the “Actual” line under the heading entitled “Expenses paid during period” for your applicable class of shares to estimate the expenses you paid on your account during this period.
Hypothetical example for comparison purposes
The “Hypothetical” line of the table below provides information about hypothetical account values and hypothetical expenses based on the Fund’s actual expense ratio and an assumed rate of return of 5% per year before expenses, which is not the Fund’s actual return. The hypothetical account values and expenses may not be used to estimate the actual ending account balance or expenses you paid for the period. You may use this information to compare the ongoing costs of investing in the Fund and other funds. To do so, compare this 5% hypothetical example with the 5% hypothetical examples that appear in the shareholder reports of the other funds.
Please note that the expenses shown in the table are meant to highlight your ongoing costs only and do not reflect any transactional costs, such as sales charges (loads) and contingent deferred sales charges. Therefore, the “Hypothetical” line of the table is useful in comparing ongoing costs only and will not help you determine the relative total costs of owning different funds. In addition, if these transactional costs were included, your costs would have been higher.
| | | | | | | | | | | | | | | | |
| | | Beginning
account value
12-1-2019 | | | Ending
account value
5-31-2020 | | | Expenses
paid during
the period1,2 | | | Annualized net
expense ratio1 | |
| | | | | |
Class A | | | | | | | | | | | | | | | | |
| | | | |
Actual | | $ | 1,000.00 | | | $ | 776.03 | | | $ | 4.97 | | | | 1.12 | % |
| | | | |
Hypothetical (5% return before expenses) | | $ | 1,000.00 | | | $ | 1,019.41 | | | $ | 5.65 | | | | 1.12 | % |
| | | | | |
Class C | | | | | | | | | | | | | | | | |
| | | | |
Actual | | $ | 1,000.00 | | | $ | 773.03 | | | $ | 8.44 | | | | 1.90 | % |
| | | | |
Hypothetical (5% return before expenses) | | $ | 1,000.00 | | | $ | 1,015.48 | | | $ | 9.59 | | | | 1.90 | % |
| | | | | |
Class R6 | | | | | | | | | | | | | | | | |
| | | | |
Actual | | $ | 1,000.00 | | | $ | 777.15 | | | $ | 3.34 | | | | 0.75 | % |
| | | | |
Hypothetical (5% return before expenses) | | $ | 1,000.00 | | | $ | 1,021.24 | | | $ | 3.80 | | | | 0.75 | % |
| | | | | |
Administrator Class | | | | | | | | | | | | | | | | |
| | | | |
Actual | | $ | 1,000.00 | | | $ | 776.32 | | | $ | 4.68 | | | | 1.05 | % |
| | | | |
Hypothetical (5% return before expenses) | | $ | 1,000.00 | | | $ | 1,019.73 | | | $ | 5.32 | | | | 1.05 | % |
| | | | | |
Institutional Class | | | | | | | | | | | | | | | | |
| | | | |
Actual | | $ | 1,000.00 | | | $ | 776.79 | | | $ | 3.79 | | | | 0.85 | % |
| | | | |
Hypothetical (5% return before expenses) | | $ | 1,000.00 | | | $ | 1,020.74 | | | $ | 4.31 | | | | 0.85 | % |
| 1 | Amounts reflect net expenses allocated from the affiliated Master Portfolio in which the Fund invests. |
| 2 | Expenses paid is equal to the annualized net expense ratio of each class multiplied by the average account value over the period, multiplied by the number of days in the most recent fiscal half-year divided by the number of days in the fiscal year (to reflect the one-half-year period). |
10 | Wells Fargo Small Company Value Fund
Portfolio of investments—May 31, 2020
| | | | | | | | | | | | | | | | | | | | |
| | | | | | | | | | | | | | | Value | |
| Investment Companies: 100.01% | | | | | | | | | | | | | | | | | | | | |
| | | | | |
| Affiliated Master Portfolios: 100.01% | | | | | | | | | | | | | | | |
Wells Fargo Small Company Value Portfolio | | | | | | | | | | | | | | | | | | $ | 322,718,004 | |
| | | | | | | | | | | | | | | | | | | | |
| | | | | |
Total Investment Companies (Cost $354,705,907) | | | | | | | | | | | | | | | | | | | 322,718,004 | |
| | | | | | | | | | | | | | | | | | | | |
| | | | | | | | |
| Total investments in securities (Cost $354,705,907) | | | 100.01 | % | | | 322,718,004 | |
| | |
Other assets and liabilities, net | | | (0.01 | ) | | | (41,903 | ) |
| | | | | | | | |
| Total net assets | | | 100.00 | % | | $ | 322,676,101 | |
| | | | | | | | |
Transactions with the affiliated Master Portfolio were as follows:
| | | | | | | | | | | | | | | | | | | | | | | | | | | | | | | | | | | | |
| | | % of
ownership,
beginning
of period | | | % of
ownership,
end of
period | | | Net realized
gains (losses) on
securities
transactions
allocated
from
affiliated
Master
Portfolio | | | Net
change in
unrealized
gains (losses)
on securities
transactions
allocated
from
affiliated
Master
Portfolio | | | Dividends
allocated
from
affiliated
Master
Portfolio | | | Securities lending income allocated from affiliated Master
Portfolio | | | Affiliated
income
allocated
from
affiliated
Master
Portfolio | | | Value,
end
of period | | | % of
net
assets | |
Wells Fargo Small Company Value Portfolio | | | 47 | % | | | 80 | % | | $ | (40,308,918 | ) | | $ | (40,806,657 | ) | | $ | 5,148,569 | | | $ | 249,531 | | | $ | 17,484 | | | $ | 322,718,004 | | | | 100.01 | % |
The accompanying notes are an integral part of these financial statements.
Wells Fargo Small Company Value Fund | 11
Statement of assets and liabilities—May 31, 2020
| | | | |
| | | | |
| |
Assets | | | | |
Investments in affiliated Master Portfolio, at value (cost $354,705,907) | | $ | 322,718,004 | |
Receivable for Fund shares sold | | | 92,789 | |
Receivable from manager | | | 33,025 | |
Prepaid expenses and other assets | | | 86,007 | |
| | | | |
Total assets | | | 322,929,825 | |
| | | | |
| |
Liabilities | | | | |
Payable for Fund shares redeemed | | | 135,765 | |
Shareholder servicing fees payable | | | 56,874 | |
Administration fees payable | | | 50,714 | |
Custody and accounting fees payable | | | 3,705 | |
Distribution fee payable | | | 2,712 | |
Trustees’ fees and expenses payable | | | 1,117 | |
Accrued expenses and other liabilities | | | 2,837 | |
| | | | |
Total liabilities | | | 253,724 | |
| | | | |
Total net assets | | | $322,676,101 | |
| | | | |
| |
Net assets consist of | | | | |
Paid-in capital | | $ | 403,554,208 | |
Total distributable loss | | | (80,878,107 | ) |
| | | | |
Total net assets | | $ | 322,676,101 | |
| | | | |
| |
Computation of net asset value and offering price per share | | | | |
Net assets – Class A | | $ | 262,574,015 | |
Shares outstanding – Class A1 | | | 12,556,537 | |
Net asset value per share – Class A | | | $20.91 | |
Maximum offering price per share – Class A2 | | | $22.19 | |
Net assets – Class C | | $ | 4,430,707 | |
Shares outstanding – Class C1 | | | 240,385 | |
Net asset value per share – Class C | | | $18.43 | |
Net assets – Class R6 | | $ | 6,490,646 | |
Shares outstanding – Class R61 | | | 301,003 | |
Net asset value per share – Class R6 | | | $21.56 | |
Net assets – Administrator Class | | $ | 15,580,742 | |
Shares outstanding – Administrator Class1 | | | 728,084 | |
Net asset value per share – Administrator Class | | | $21.40 | |
Net assets – Institutional Class | | $ | 33,599,991 | |
Shares outstanding – Institutional Class1 | | | 1,565,733 | |
Net asset value per share – Institutional Class | | | $21.46 | |
| 1 | Each Fund has an unlimited number of authorized shares. |
| 2 | Maximum offering price is computed as 100/94.25 of net asset value. On investments of $50,000 or more, the offering price is reduced. |
The accompanying notes are an integral part of these financial statements.
12 | Wells Fargo Small Company Value Fund
Statement of operations—year ended May 31, 2020
| | | | |
| | | | |
| |
Investment income | | | | |
Dividends allocated from affiliated Master Portfolio (net of foreign withholding taxes of $5,021) | | $ | 5,148,569 | |
Securities lending income allocated from affiliated Master Portfolio | | | 249,531 | |
Affiliated income allocated from affiliated Master Portfolio | | | 17,484 | |
Expenses allocated from affiliated Master Portfolio | | | (2,372,055 | ) |
Waivers allocated from affiliated Master Portfolio | | | 236,726 | |
| | | | |
Total investment income | | | 3,280,255 | |
| | | | |
| |
Expenses | | | | |
Management fee | | | 144,537 | |
Administration fees | |
Class A | | | 464,633 | |
Class C | | | 10,149 | |
Class R6 | | | 1,807 | |
Administrator Class | | | 22,372 | |
Institutional Class | | | 51,682 | |
Shareholder servicing fees | |
Class A | | | 551,801 | |
Class C | | | 12,071 | |
Administrator Class | | | 43,002 | |
Distribution fee | |
Class C | | | 36,202 | |
Custody and accounting fees | | | 6,108 | |
Professional fees | | | 32,906 | |
Registration fees | | | 130,592 | |
Shareholder report expenses | | | 47,171 | |
Trustees’ fees and expenses | | | 21,592 | |
Other fees and expenses | | | 13,424 | |
| | | | |
Total expenses | | | 1,590,049 | |
Less: Fee waivers and/or expense reimbursements | | | | |
Fund-level | | | (367,481 | ) |
Class A | | | (150,051 | ) |
Class C | | | (1,757 | ) |
Administrator Class | | | (21,870 | ) |
Institutional Class | | | (28,805 | ) |
| | | | |
Net expenses | | | 1,020,085 | |
| | | | |
Net investment income | | | 2,260,170 | |
| | | | |
| |
Realized and unrealized gains (losses) on investments | | | | |
Net realized gains (losses) on | | | | |
Unaffiliated securities | | | 4,208,424 | |
Securities transactions allocated from affiliated Master Portfolio | | | (40,308,918 | ) |
| | | | |
Net realized losses on investments | | | (36,100,494 | ) |
Net change in unrealized losses on securities transactions allocated from affiliated Master Portfolio | | | (40,806,657 | ) |
| | | | |
Net realized and unrealized gains (losses) on investments | | | (76,907,151 | ) |
| | | | |
Net decrease in net assets resulting from operations | | $ | (74,646,981 | ) |
| | | | |
The accompanying notes are an integral part of these financial statements.
Wells Fargo Small Company Value Fund | 13
Statement of changes in net assets
| | | | | | | | | | | | | | | | |
| | | Year ended
May 31, 2020 | | | Year ended
May 31, 2019 | |
| | | | |
Operations | | | | | | | | | | | | | | | | |
Net investment income | | | | | | $ | 2,260,170 | | | | | | | $ | 528,160 | |
Net realized losses on investments | | | | | | | (36,100,494 | ) | | | | | | | (4,999,289 | ) |
Net change in unrealized gains (losses) on investments | | | | | | | (40,806,657 | ) | | | | | | | (10,331,943 | ) |
| | | | |
Net decrease in net assets resulting from operations | | | | | | | (74,646,981 | ) | | | | | | | (14,803,072 | ) |
| | | | |
| | | | |
Distributions to shareholders from net investment income and net realized gains | | | | | | | | | | | | | | | | |
Class A | | | | | | | (1,775,108 | ) | | | | | | | (82,268 | ) |
Class C | | | | | | | (20,482 | ) | | | | | | | 0 | |
Class R6 | | | | | | | (57,654 | ) | | | | | | | (4,758 | ) |
Administrator Class | | | | | | | (132,559 | ) | | | | | | | (80,883 | ) |
Institutional Class | | | | | | | (389,037 | ) | | | | | | | (367,043 | ) |
| | | | |
Total distributions to shareholders | | | | | | | (2,374,840 | ) | | | | | | | (534,952 | ) |
| | | | |
| | | | |
Capital share transactions | | | Shares | | | | | | | | Shares | | | | | |
Proceeds from shares sold | | | | | | | | | | | | | | | | |
Class A | | | 660,800 | | | | 16,227,538 | | | | 100,769 | | | | 2,699,778 | |
Class C | | | 9,961 | | | | 227,898 | | | | 15,848 | | | | 366,047 | |
Class R6 | | | 64,570 | | | | 1,642,037 | | | | 25,104 | | | | 690,295 | |
Administrator Class | | | 106,132 | | | | 2,470,380 | | | | 156,576 | | | | 4,440,193 | |
Institutional Class | | | 309,975 | | | | 7,352,769 | | | | 927,734 | | | | 26,194,616 | |
| | | | |
| | | | | | | 27,920,622 | | | | | | | | 34,390,929 | |
| | | | |
Reinvestment of distributions | | | | | | | | | | | | | | | | |
Class A | | | 61,791 | | | | 1,738,175 | | | | 3,218 | | | | 75,882 | |
Class C | | | 745 | | | | 18,543 | | | | 0 | | | | 0 | |
Class R6 | | | 1,984 | | | | 57,454 | | | | 183 | | | | 4,430 | |
Administrator Class | | | 4,358 | | | | 125,424 | | | | 3,347 | | | | 80,761 | |
Institutional Class | | | 13,253 | | | | 382,205 | | | | 15,183 | | | | 366,819 | |
| | | | |
| | | | | | | 2,321,801 | | | | | | | | 527,892 | |
| | | | |
Payment for shares redeemed | | | | | | | | | | | | | | | | |
Class A | | | (1,647,283 | ) | | | (40,312,932 | ) | | | (160,314 | ) | | | (4,366,685 | ) |
Class C | | | (150,237 | ) | | | (3,268,340 | ) | | | (42,700 | ) | | | (986,195 | ) |
Class R6 | | | (949,988 | ) | | | (24,922,236 | ) | | | (6,898 | ) | | | (189,905 | ) |
Administrator Class | | | (185,643 | ) | | | (4,423,218 | ) | | | (1,664,950 | ) | | | (46,927,131 | ) |
Institutional Class | | | (876,293 | ) | | | (21,210,870 | ) | | | (1,684,689 | ) | | | (45,679,163 | ) |
| | | | |
| | | | | | | (94,137,596 | ) | | | | | | | (98,149,079 | ) |
| | | | |
Net asset value of shares issue in acquisition | | | | | | | | | | | | | | | | |
Class A | | | 12,989,900 | | | | 337,017,442 | | | | 0 | | | | 0 | |
Class C | | | 328,733 | | | | 7,545,278 | | | | 0 | | | | 0 | |
Class R6 | | | 1,155,117 | | | | 30,863,882 | | | | 0 | | | | 0 | |
Administrator Class | | | 242,559 | | | | 6,444,855 | | | | 0 | | | | 0 | |
Institutional Class | | | 786,790 | | | | 20,969,975 | | | | 0 | | | | 0 | |
| | | | |
| | | | | | | 402,841,432 | | | | | | | | 0 | |
| | | | |
Net increase (decrease) in net assets resulting from capital share transactions | | | | | | | 338,946,259 | | | | | | | | (63,230,258 | ) |
| | | | |
Total increase (decrease) in net assets | | | | | | | 261,924,438 | | | | | | | | (78,568,282 | ) |
| | | | |
| | | | |
Net assets | | | | | | | | | | | | | | | | |
Beginning of period | | | | | | | 60,751,663 | | | | | | | | 139,319,945 | |
| | | | |
End of period | | | | | | $ | 322,676,101 | | | | | | | $ | 60,751,663 | |
| | | | |
The accompanying notes are an integral part of these financial statements.
14 | Wells Fargo Small Company Value Fund
Financial highlights
(For a share outstanding throughout each period)
| | | | | | | | | | | | | | | | | | | | |
| | | Year ended May 31 | |
| CLASS A | | 2020 | | | 2019 | | | 2018 | | | 2017 | | | 2016 | |
Net asset value, beginning of period | | | $24.22 | | | | $28.60 | | | | $24.01 | | | | $20.22 | | | | $21.42 | |
Net investment income | | | 0.18 | 1 | | | 0.09 | | | | 0.09 | | | | 0.05 | | | | 0.08 | |
Net realized and unrealized gains (losses) on investments | | | (3.35 | ) | | | (4.31 | ) | | | 4.58 | | | | 3.75 | | | | (1.25 | ) |
| | | | | | | | | | | | | | | | | | | | |
Total from investment operations | | | (3.17 | ) | | | (4.22 | ) | | | 4.67 | | | | 3.80 | | | | (1.17 | ) |
Distributions to shareholders from | | | | | | | | | | | | | | | | | | | | |
Net investment income | | | (0.14 | ) | | | (0.16 | ) | | | (0.08 | ) | | | (0.01 | ) | | | (0.03 | ) |
Net asset value, end of period | | | $20.91 | | | | $24.22 | | | | $28.60 | | | | $24.01 | | | | $20.22 | |
Total return2 | | | (13.25 | )% | | | (14.72 | )% | | | 19.48 | % | | | 18.86 | % | | | (5.48 | )% |
Ratios to average net assets (annualized) | | | | | | | | | | | | | | | | | | | | |
Gross expenses3 | | | 1.32 | % | | | 1.49 | % | | | 1.47 | % | | | 1.47 | % | | | 1.48 | % |
Net expenses3 | | | 1.13 | % | | | 1.15 | % | | | 1.33 | % | | | 1.35 | % | | | 1.37 | % |
Net investment income3 | | | 0.74 | % | | | 0.38 | % | | | 0.46 | % | | | 0.20 | % | | | 0.11 | % |
Supplemental data | | | | | | | | | | | | | | | | | | | | |
Portfolio turnover rate4 | | | 78 | % | | | 168 | % | | | 144 | % | | | 110 | % | | | 72 | % |
Net assets, end of period (000s omitted) | | | $262,574 | | | | $11,902 | | | | $15,665 | | | | $16,280 | | | | $23,151 | |
| 1 | Calculated based upon average shares outstanding |
| 2 | Total return calculations do not include any sales charges. |
| 3 | Ratios include net expenses allocated from the affiliated Master Portfolio which were as follows: |
| | | | |
Year ended May 31, 2020 | | | 0.74 | % |
Year ended May 31, 2019 | | | 0.75 | % |
Year ended May 31, 2018 | | | 0.84 | % |
Year ended May 31, 2017 | | | 0.84 | % |
Year ended May 31, 2016 | | | 0.84 | % |
| 4 | Portfolio turnover rate is calculated by multiplying the affiliated Master Portfolio’s percentage of the Fund’s total investment in securities at the end of the period by the affiliated Master Portfolio’s portfolio turnover rate. |
The accompanying notes are an integral part of these financial statements.
Wells Fargo Small Company Value Fund | 15
Financial highlights
(For a share outstanding throughout each period)
| | | | | | | | | | | | | | | | | | | | |
| | | Year ended May 31 | |
| CLASS C | | 2020 | | | 2019 | | | 2018 | | | 2017 | | | 2016 | |
Net asset value, beginning of period | | | $21.48 | | | | $25.38 | | | | $21.40 | | | | $18.15 | | | | $19.34 | |
Net investment income (loss) | | | 0.01 | 1 | | | (0.08 | )1 | | | (0.07 | )1 | | | (0.11 | )1 | | | (0.11 | )1 |
Net realized and unrealized gains (losses) on investments | | | (3.00 | ) | | | (3.82 | ) | | | 4.05 | | | | 3.36 | | | | (1.08 | ) |
| | | | | | | | | | | | | | | | | | | | |
Total from investment operations | | | (2.99 | ) | | | (3.90 | ) | | | 3.98 | | | | 3.25 | | | | (1.19 | ) |
Distributions to shareholders from | | | | | | | | | | | | | | | | | | | | |
Net investment income | | | (0.06 | ) | | | 0.00 | | | | 0.00 | | | | 0.00 | | | | 0.00 | |
Net asset value, end of period | | | $18.43 | | | | $21.48 | | | | $25.38 | | | | $21.40 | | | | $18.15 | |
Total return2 | | | (13.98 | )% | | | (15.37 | )% | | | 18.60 | % | | | 17.97 | % | | | (6.20 | )% |
Ratios to average net assets (annualized) | | | | | | | | | | | | | | | | | | | | |
Gross expenses3 | | | 2.08 | % | | | 2.22 | % | | | 2.21 | % | | | 2.22 | % | | | 2.23 | % |
Net expenses3 | | | 1.90 | % | | | 1.90 | % | | | 2.08 | % | | | 2.10 | % | | | 2.12 | % |
Net investment income (loss)3 | | | 0.02 | % | | | (0.35 | )% | | | (0.29 | )% | | | (0.54 | )% | | | (0.62 | )% |
Supplemental data | | | | | | | | | | | | | | | | | | | | |
Portfolio turnover rate4 | | | 78 | % | | | 168 | % | | | 144 | % | | | 110 | % | | | 72 | % |
Net assets, end of period (000s omitted) | | | $4,431 | | | | $1,099 | | | | $1,980 | | | | $1,962 | | | | $2,004 | |
| 1 | Calculated based upon average shares outstanding |
| 2 | Total return calculations do not include any sales charges. |
| 3 | Ratios include net expenses allocated from the affiliated Master Portfolio which were as follows: |
| | | | |
Year ended May 31, 2020 | | | 0.74 | % |
Year ended May 31, 2019 | | | 0.75 | % |
Year ended May 31, 2018 | | | 0.84 | % |
Year ended May 31, 2017 | | | 0.84 | % |
Year ended May 31, 2016 | | | 0.84 | % |
| 4 | Portfolio turnover rate is calculated by multiplying the affiliated Master Portfolio’s percentage of the Fund’s total investment in securities at the end of the period by the affiliated Master Portfolio’s portfolio turnover rate. |
The accompanying notes are an integral part of these financial statements.
16 | Wells Fargo Small Company Value Fund
Financial highlights
(For a share outstanding throughout each period)
| | | | | | | | | | | | | | | | |
| | | Year ended May 31 | |
| CLASS R6 | | 2020 | | | 2019 | | | 2018 | | | 20171 | |
Net asset value, beginning of period | | | $24.92 | | | | $29.44 | | | | $24.69 | | | | $21.37 | |
Net investment income | | | 0.31 | | | | 0.21 | 2 | | | 0.29 | 2 | | | 0.08 | |
Net realized and unrealized gains (losses) on investments | | | (3.50 | ) | | | (4.45 | ) | | | 4.65 | | | | 3.33 | |
| | | | | | | | | | | | | | | | |
Total from investment operations | | | (3.19 | ) | | | (4.24 | ) | | | 4.94 | | | | 3.41 | |
Distributions to shareholders from | | | | | | | | | | | | | | | | |
Net investment income | | | (0.17 | ) | | | (0.28 | ) | | | (0.19 | ) | | | (0.09 | ) |
Net asset value, end of period | | | $21.56 | | | | $24.92 | | | | $29.44 | | | | $24.69 | |
Total return3 | | | (12.97 | )% | | | (14.38 | )% | | | 20.03 | % | | | 15.95 | % |
Ratios to average net assets (annualized) | | | | | | | | | | | | | | | | |
Gross expenses4 | | | 0.90 | % | | | 1.09 | % | | | 1.03 | % | | | 1.02 | % |
Net expenses4 | | | 0.75 | % | | | 0.75 | % | | | 0.88 | % | | | 0.90 | % |
Net investment income4 | | | 1.22 | % | | | 0.77 | % | | | 1.04 | % | | | 0.58 | % |
Supplemental data | | | | | | | | | | | | | | | | |
Portfolio turnover rate5 | | | 78 | % | | | 168 | % | | | 144 | % | | | 110 | % |
Net assets, end of period (000s omitted) | | | $6,491 | | | | $731 | | | | $322 | | | | $29 | |
| 1 | For the period from October 31, 2016 (commencement of class operations) to May 31, 2017. |
| 2 | Calculated based upon average shares outstanding |
| 3 | Returns for periods of less than one year are not annualized. |
| 4 | Ratios include net expenses allocated from the affiliated Master Portfolio which were as follows: |
| | | | |
Year ended May 31, 2020 | | | 0.74 | % |
Year ended May 31, 2019 | | | 0.75 | % |
Year ended May 31, 2018 | | | 0.84 | % |
Year ended May 31, 20171 | | | 0.83 | % |
| 5 | Portfolio turnover rate is calculated by multiplying the affiliated Master Portfolio’s percentage of the Fund’s total investment in securities at the end of the period by the affiliated Master Portfolio’s portfolio turnover rate. |
The accompanying notes are an integral part of these financial statements.
Wells Fargo Small Company Value Fund | 17
Financial highlights
(For a share outstanding throughout each period)
| | | | | | | | | | | | | | | | | | | | |
| | | Year ended May 31 | |
| ADMINISTRATOR CLASS | | 2020 | | | 2019 | | | 2018 | | | 2017 | | | 2016 | |
Net asset value, beginning of period | | | $24.80 | | | | $29.23 | | | | $24.53 | | | | $20.66 | | | | $21.90 | |
Net investment income | | | 0.21 | 1 | | | 0.14 | 1 | | | 0.20 | | | | 0.08 | 1 | | | 0.13 | |
Net realized and unrealized gains (losses) on investments | | | (3.43 | ) | | | (4.43 | ) | | | 4.63 | | | | 3.83 | | | | (1.30 | ) |
| | | | | | | | | | | | | | | | | | | | |
Total from investment operations | | | (3.22 | ) | | | (4.29 | ) | | | 4.83 | | | | 3.91 | | | | (1.17 | ) |
Distributions to shareholders from | | | | | | | | | | | | | | | | | | | | |
Net investment income | | | (0.18 | ) | | | (0.14 | ) | | | (0.13 | ) | | | (0.04 | ) | | | (0.07 | ) |
Net asset value, end of period | | | $21.40 | | | | $24.80 | | | | $29.23 | | | | $24.53 | | | | $20.66 | |
Total return | | | (13.18 | )% | | | (14.65 | )% | | | 19.71 | % | | | 19.00 | % | | | (5.36 | )% |
Ratios to average net assets (annualized) | | | | | | | | | | | | | | | | | | | | |
Gross expenses2 | | | 1.32 | % | | | 1.35 | % | | | 1.38 | % | | | 1.39 | % | | | 1.39 | % |
Net expenses2 | | | 1.05 | % | | | 1.05 | % | | | 1.19 | % | | | 1.20 | % | | | 1.20 | % |
Net investment income2 | | | 0.82 | % | | | 0.49 | % | | | 0.59 | % | | | 0.36 | % | | | 0.28 | % |
Supplemental data | | | | | | | | | | | | | | | | | | | | |
Portfolio turnover rate3 | | | 78 | % | | | 168 | % | | | 144 | % | | | 110 | % | | | 72 | % |
Net assets, end of period (000s omitted) | | | $15,581 | | | | $13,905 | | | | $60,379 | | | | $57,591 | | | | $64,023 | |
| 1 | Calculated based upon average shares outstanding |
| 2 | Ratios include net expenses allocated from the affiliated Master Portfolio which were as follows: |
| | | | |
Year ended May 31, 2020 | | | 0.74 | % |
Year ended May 31, 2019 | | | 0.75 | % |
Year ended May 31, 2018 | | | 0.84 | % |
Year ended May 31, 2017 | | | 0.84 | % |
Year ended May 31, 2016 | | | 0.84 | % |
| 3 | Portfolio turnover rate is calculated by multiplying the affiliated Master Portfolio’s percentage of the Fund’s total investment in securities at the end of the period by the affiliated Master Portfolio’s portfolio turnover rate. |
The accompanying notes are an integral part of these financial statements.
18 | Wells Fargo Small Company Value Fund
Financial highlights
(For a share outstanding throughout each period)
| | | | | | | | | | | | | | | | | | | | |
| | | Year ended May 31 | |
| INSTITUTIONAL CLASS | | 2020 | | | 2019 | | | 2018 | | | 2017 | | | 2016 | |
Net asset value, beginning of period | | | $24.86 | | | | $29.40 | | | | $24.68 | | | | $20.77 | | | | $22.02 | |
Net investment income | | | 0.25 | | | | 0.19 | 1 | | | 0.21 | | | | 0.11 | | | | 0.08 | 1 |
Net realized and unrealized gains (losses) on investments | | | (3.43 | ) | | | (4.45 | ) | | | 4.69 | | | | 3.89 | | | | (1.22 | ) |
| | | | | | | | | | | | | | | | | | | | |
Total from investment operations | | | (3.18 | ) | | | (4.26 | ) | | | 4.90 | | | | 4.00 | | | | (1.14 | ) |
Distributions to shareholders from | | | | | | | | | | | | | | | | | | | | |
Net investment income | | | (0.22 | ) | | | (0.28 | ) | | | (0.18 | ) | | | (0.09 | ) | | | (0.11 | ) |
Net asset value, end of period | | | $21.46 | | | | $24.86 | | | | $29.40 | | | | $24.68 | | | | $20.77 | |
Total return | | | (13.03 | )% | | | (14.46 | )% | | | 19.90 | % | | | 13.70 | % | | | (5.13 | )% |
Ratios to average net assets (annualized) | | | | | | | | | | | | | | | | | | | | |
Gross expenses2 | | | 1.07 | % | | | 1.14 | % | | | 1.14 | % | | | 1.14 | % | | | 1.14 | % |
Net expenses2 | | | 0.85 | % | | | 0.85 | % | | | 0.99 | % | | | 1.00 | % | | | 1.00 | % |
Net investment income2 | | | 1.04 | % | | | 0.68 | % | | | 0.78 | % | | | 0.55 | % | | | 0.40 | % |
Supplemental data | | | | | | | | | | | | | | | | | | | | |
Portfolio turnover rate3 | | | 78 | % | | | 168 | % | | | 144 | % | | | 110 | % | | | 72 | % |
Net assets, end of period (000s omitted) | | | $33,600 | | | | $33,116 | | | | $60,973 | | | | $52,072 | | | | $31,768 | |
| 1 | Calculated based upon average shares outstanding |
| 2 | Ratios include net expenses allocated from the affiliated Master Portfolio which were as follows: |
| | | | |
Year ended May 31, 2020 | | | 0.74 | % |
Year ended May 31, 2019 | | | 0.75 | % |
Year ended May 31, 2018 | | | 0.84 | % |
Year ended May 31, 2017 | | | 0.84 | % |
Year ended May 31, 2016 | | | 0.84 | % |
| 3 | Portfolio turnover rate is calculated by multiplying the affiliated Master Portfolio’s percentage of the Fund’s total investment in securities at the end of the period by the affiliated Master Portfolio’s portfolio turnover rate. |
The accompanying notes are an integral part of these financial statements.
Wells Fargo Small Company Value Fund | 19
Notes to financial statements
1. ORGANIZATION
Wells Fargo Funds Trust (the “Trust”), a Delaware statutory trust organized on March 10, 1999, is an open-end management investment company registered under the Investment Company Act of 1940, as amended (the “1940 Act”). As an investment company, the Trust follows the accounting and reporting guidance in Financial Accounting Standards Board (“FASB”) Accounting Standards Codification Topic 946, Financial Services – Investment Companies. These financial statements report on the Wells Fargo Small Company Value Fund (the “Fund”) which is a diversified series of the Trust.
The Fund is a feeder fund in a master-feeder structure that invests substantially all of its assets in a single master portfolio with a substantially identical investment objective and substantially similar investment strategies. The Fund invests in Wells Fargo Small Company Value Portfolio (the “affiliated Master Portfolio”) which is a separate diversified portfolio of Wells Fargo Master Trust, a registered open-end management investment company. As of May 31, 2020, the Fund owned 80% of Wells Fargo Small Company Value Portfolio. The affiliated Master Portfolio directly acquires portfolio securities and the Fund acquires an indirect interest in those securities. The Fund accounts for its investment in the affiliated Master Portfolio as a partnership investment and records on a daily basis its share of the affiliated Master Portfolio’s income, expense and realized and unrealized gains and losses. The financial statements of the affiliated Master Portfolio for the year ended May 31, 2020 are included in this report and should be read in conjunction with the Fund’s financial statements.
2. SIGNIFICANT ACCOUNTING POLICIES
The following significant accounting policies, which are consistently followed in the preparation of the financial statements of the Fund, are in conformity with U.S. generally accepted accounting principles which require management to make estimates and assumptions that affect the reported amounts of assets and liabilities, disclosure of contingent assets and liabilities at the date of the financial statements, and the reported amounts of revenues and expenses during the reporting period. Actual results could differ from those estimates.
Securities valuation
All investments are valued each business day as of the close of regular trading on the New York Stock Exchange (generally 4 p.m. Eastern Time), although the Fund may deviate from this calculation time under unusual or unexpected circumstances.
Investments in the affiliated Master Portfolio are valued daily based on the Fund’s proportionate share of the affiliated Master Portfolio’s net assets, which are also valued daily. Securities held in the affiliated Master Portfolio are valued as discussed in the Notes to Financial Statements of the affiliated Master Portfolio, which are included elsewhere in this report.
Investments which are not valued using the method discussed above are valued at their fair value, as determined in good faith by the Board of Trustees of the Fund. The Board of Trustees has established a Valuation Committee comprised of the Trustees and has delegated to it the authority to take any actions regarding the valuation of portfolio securities that the Valuation Committee deems necessary or appropriate, including determining the fair value of portfolio securities, unless the determination has been delegated to the Wells Fargo Asset Management Pricing Committee at Wells Fargo Funds Management, LLC (“Funds Management”). The Board of Trustees retains the authority to make or ratify any valuation decisions or approve any changes to the Valuation Procedures as it deems appropriate. On a quarterly basis, the Board of Trustees receives reports on any valuation actions taken by the Valuation Committee or the Wells Fargo Asset Management Pricing Committee which may include items for ratification.
Investment transactions, income and expenses
Investments in the affiliated Master Portfolio are recorded on a trade basis. The Fund records daily its proportionate share of the affiliated Master Portfolio’s income, expenses and realized and unrealized gains or losses. The Fund also accrues its own expenses.
Distributions to shareholders
Distributions to shareholders from net investment income and any net realized gains are recorded on the ex-dividend date and paid at least annually. Such distributions are determined in accordance with income tax regulations and may differ from U.S. generally accepted accounting principles. Dividend sources are estimated at the time of declaration. The tax character of distributions is determined as of the Fund’s fiscal year end. Therefore, a portion of the Fund’s distributions made prior to the Fund’s fiscal year end may be categorized as a tax return of capital at year end.
Federal and other taxes
The Fund intends to continue to qualify as a regulated investment company by distributing substantially all of its investment company taxable income and any net realized capital gains (after reduction for capital loss carryforwards) sufficient to relieve it from all, or substantially all, federal income taxes. Accordingly, no provision for federal income taxes was required.
20 | Wells Fargo Small Company Value Fund
Notes to financial statements
The Fund’s income and federal excise tax returns and all financial records supporting those returns for the prior three fiscal years are subject to examination by the federal and Delaware revenue authorities. Management has analyzed the Fund’s tax positions taken on federal, state, and foreign tax returns for all open tax years and does not believe that there are any uncertain tax positions that require recognition of a tax liability.
As of May 31, 2020, the aggregate cost of all investments for federal income tax purposes was $368,843,380 and the unrealized gains (losses) consisted of:
| | | | |
| |
Gross unrealized gains | | $ | 0 | |
| |
Gross unrealized losses | | | (46,125,376 | ) |
| |
Net unrealized losses | | $ | (46,125,376 | ) |
As of May 31, 2020, the Fund had capital loss carryforwards which consist of $31,483,064 in short-term capital losses and $3,107,998 in long-term capital losses. Losses may be subject to certain limitations under Sections 382-384 of the Internal Revenue Code.
As of May 31, 2020, the Fund had a qualified late-year ordinary loss of $161,669 which will be recognized on the first day of the following fiscal year.
Class allocations
The separate classes of shares offered by the Fund differ principally in applicable sales charges, distribution, shareholder servicing, and administration fees. Class specific expenses are charged directly to that share class. Investment income, common fund-level expenses, and realized and unrealized gains (losses) on investments are allocated daily to each class of shares based on the relative proportion of net assets of each class.
3. FAIR VALUATION MEASUREMENTS
At May 31, 2020, the affiliated Master Portfolio was measured at fair value using the net asset value per share (or its equivalent) as a practical expedient. The investment objective and the value of the affiliate Master Portfolio was as follows:
| | | | |
| | |
| Affiliated Master Portfolio | | Investment objective | | Value of affiliated Master
Portfolio |
| | |
Wells Fargo Small Company Value Portfolio | | Seeks long-term capital appreciation | | $322,718,004 |
The affiliated Master Portfolio does not have a redemption period notice, can be redeemed daily and does not have any unfunded commitments.
4. TRANSACTIONS WITH AFFILIATES
Management fee
Funds Management, an indirect wholly owned subsidiary of Wells Fargo & Company (“Wells Fargo”), is the manager of the Fund and provides advisory and fund-level administrative services under an investment management agreement. Under the investment management agreement, Funds Management is responsible for, among other services, implementing the investment objectives and strategies of the Fund, and providing fund-level administrative services in connection with the Fund’s operations. As long as the Fund continues to invest substantially all of its assets in a single affiliated Master Portfolio, the Fund pays Funds Management an investment management fee only for fund-level administrative services at the following annual rate based on the Fund’s average daily net assets:
| | |
| |
| Average daily net assets | | Management fee |
| |
First $5 billion | | 0.05% |
| |
Next $5 billion | | 0.04 |
| |
Over $10 billion | | 0.03 |
For the year ended May 31, 2020, the management fee was equivalent to an annual rate of 0.05% of the Fund’s average daily net assets.
Funds Management also serves as the adviser to the affiliated Master Portfolio and is entitled to receive a fee from the affiliated Master Portfolio for those services.
Wells Fargo Small Company Value Fund | 21
Notes to financial statements
Administration fees
Under a class-level administration agreement, Funds Management provides class-level administrative services to the Fund, which includes paying fees and expenses for services provided by the transfer agent, sub-transfer agents, omnibus account servicers and record-keepers. As compensation for its services under the class-level administration agreement, Funds Management receives an annual fee which is calculated based on the average daily net assets of each class as follows:
| | | | |
| |
| | | Class-level
administration fee | |
| |
Class A, Class C | | | 0.21 | % |
| |
Class R6 | | | 0.03 | |
| |
Administrator Class, Institutional Class | | | 0.13 | |
Waivers and/or expense reimbursements
Funds Management has contractually waived and/or reimbursed management and administration fees to the extent necessary to maintain certain net operating expense ratios for the Fund. When each class of the Fund has exceeded its expense cap, Funds Management has waived fees and/or reimbursed expenses from fund-level expenses on a proportionate basis and then from class specific expenses. When only certain classes exceed their expense caps, waivers and/or reimbursements are applied against class specific expenses before fund-level expenses. Net expenses from the affiliated Master Portfolio are included in the expense caps. Funds Management has committed through September 30, 2021 to waive fees and/or reimburse expenses to the extent necessary to cap the Fund’s expenses at 1.15% for Class A shares, 1.90% for Class C shares, 0.75% for Class R6 shares, 1.05% for Administrator Class shares and 0.85% for Institutional Class shares. Prior to or after the commitment expiration date, the cap may be increased or the commitment to maintain the cap may be terminated only with the approval of the Board of Trustees.
Distribution fee
The Trust has adopted a distribution plan for Class C shares of the Fund pursuant to Rule 12b-1 under the 1940 Act. A distribution fee is charged to Class C shares and paid to Wells Fargo Funds Distributor, LLC (“Funds Distributor”), the principal underwriter, at an annual rate of 0.75% of the average daily net assets of Class C shares.
In addition, Funds Distributor is entitled to receive the front-end sales charge from the purchase of Class A shares and a contingent deferred sales charge on the redemption of certain Class A shares. Funds Distributor is also entitled to receive the contingent deferred sales charges from redemptions of Class C shares. For the year ended May 31, 2020, Funds Distributor received $2,382 from the sale of Class A shares. No contingent deferred sales charges were incurred by Class A and Class C shares for the year ended May 31, 2020.
Shareholder servicing fees
The Trust has entered into contracts with one or more shareholder servicing agents, whereby Class A, Class C, and Administrator Class of the Fund are charged a fee at an annual rate of 0.25% of the average daily net assets of each respective class. A portion of these total shareholder servicing fees were paid to affiliates of Wells Fargo.
5. INVESTMENT PORTFOLIO TRANSACTIONS
The Fund seeks to achieve its investment objective by investing substantially all of its investable assets in a single affiliated Master Portfolio. Purchases and sales have been calculated by multiplying the Fund’s ownership percentage of the affiliated Master Portfolio by the affiliated Master Portfolio’s purchases and sales. Purchases and sales of investments, excluding short-term securities, for the year ended May 31, 2020 were $229,195,450 and $258,324,411, respectively.
6. ACQUISITION
After the close of business on September 20, 2019, the Fund acquired the net assets of Wells Fargo Small Cap Value Fund. The purpose of the transaction was to combine two funds with similar investment objectives and strategies. Wells Fargo Small Cap Value Fund transferred all of its portfolio securities to Wells Fargo Small Company Value Portfolio (a master portfolio in which it invested all of its assets) in exchange for interests in Wells Fargo Small Company Value Portfolio. Immediately thereafter, Wells Fargo Small Cap Value Fund transferred all of its equity interests in Wells Fargo Small Company Value Portfolio to Wells Fargo Small Cap Value Fund in exchange for shares of the Fund. Shareholders holding Class A, Class C, Class R6, Administrator Class, and Institutional Class shares of Wells Fargo Small Cap Value Fund received Class A, Class C, Class R6, Administrator Class, and Institutional Class shares, respectively, of the Fund in the reorganization. The acquisition was accomplished by a tax-free exchange of all of the shares of Wells Fargo Small Cap Value Fund for 15,503,099 shares of the Fund
22 | Wells Fargo Small Company Value Fund
Notes to financial statements
valued at $402,841,432 at an exchange ratio of 0.45, 0.28, 0.49, 0.49, and 0.49 for Class A, Class C, Class R6, Administrator Class and Institutional Class shares, respectively. The investment portfolio of Wells Fargo Small Cap Value Fund with a fair value of $399,448,746, identified cost of $378,004,130 and unrealized gains of $21,444,616 at September 20, 2019 were the principal assets acquired by the Fund. The aggregate net assets of Wells Fargo Small Cap Value Fund and the Fund immediately prior to the acquisition were $402,841,432 and $58,675,150, respectively. The aggregate net assets of the Fund immediately after the acquisition were $461,516,582. For financial reporting purposes, assets received and shares issued by the Fund were recorded at fair value; however, the cost basis of the investments received from Wells Fargo Small Cap Value Fund was carried forward to align with ongoing reporting of the Fund’s realized and unrealized gains and losses with amounts distributable to shareholders for tax purposes.
Assuming the acquisition had been completed June 1 , 2019, the beginning of the annual reporting period for the Fund, the pro forma results of operations for the year ended May 31, 2020 would have been as follows (unaudited):
| | | | |
| |
Net investment loss | | $ | (2,124,250 | ) |
| |
Net realized and unrealized gains (losses) on investments | | $ | (33,131,724 | ) |
| |
Net decrease in net assets resulting from operations | | $ | (35,255,974 | ) |
Because the combined investment portfolios have been managed as a single integrated portfolio since the acquisition was completed, it is not practicable to separate the amounts of revenue and earnings of Wells Fargo Small Cap Value Fund that have been included in the Fund’s Statement of Operations since September 23, 2019.
7. BANK BORROWINGS
The Trust (excluding the money market funds), Wells Fargo Master Trust and Wells Fargo Variable Trust are parties to a $280,000,000 revolving credit agreement whereby the Fund is permitted to use bank borrowings for temporary or emergency purposes, such as to fund shareholder redemption requests. Interest under the credit agreement is charged to the Fund based on a borrowing rate equal to the higher of the Federal Funds rate in effect on that day plus 1.25% or the overnight LIBOR rate in effect on that day plus 1.25%. In addition, an annual commitment fee equal to 0.25% of the unused balance is allocated to each participating fund.
For the year ended May 31, 2020, there were no borrowings by the Fund under the agreement.
8. DISTRIBUTIONS TO SHAREHOLDERS
The tax character of distributions paid was $2,374,840 and $534,952 of ordinary income for the years ended May 31, 2020 and May 31, 2019, respectively.
As of May 31, 2020, the components of distributable earnings on a tax basis were as follows:
| | | | |
Unrealized
losses | | Late-year ordinary losses deferred | | Capital loss
carryforward |
| | |
| $(46,125,376) | | $(161,669) | | $(34,591,062) |
9. INDEMNIFICATION
Under the Fund’s organizational documents, the officers and Trustees have been granted certain indemnification rights against certain liabilities that may arise out of performance of their duties to the Fund. The Fund has entered into a separate agreement with each Trustee that converts indemnification rights currently existing under the Fund’s organizational documents into contractual rights that cannot be changed in the future without the consent of the Trustee. Additionally, in the normal course of business, the Fund may enter into contracts with service providers that contain a variety of indemnification clauses. The Fund’s maximum exposure under these arrangements is dependent on future claims that may be made against the Fund and, therefore, cannot be estimated.
10. NEW ACCOUNTING PRONOUNCEMENT
In August 2018, FASB issued Accounting Standards Update (“ASU”) No. 2018-13, Fair Value Measurement (Topic 820) Disclosure Framework—Changes to the Disclosure Requirements for Fair Value Measurement. ASU 2018-13 updates the disclosure requirements for fair value measurements by modifying or removing certain disclosures and adding certain new disclosures. The amendments are effective for fiscal years, and interim periods within those fiscal years, beginning after December 15, 2019. Early adoption is permitted. Management has adopted the removal and modification of disclosures early, as permitted, and will adopt the additional new disclosures at the effective date.
Wells Fargo Small Company Value Fund | 23
Notes to financial statements
11. CORONAVIRUS (COVID-19) PANDEMIC
On March 11, 2020, the World Health Organization announced that it had made the assessment that coronavirus disease 2019 (“COVID-19”) is a pandemic. The impacts of COVID-19 are adversely affecting the entire global economy, individual companies and investment products, and the market in general. There is significant uncertainty around the extent and duration of business disruptions related to COVID-19 and the impacts may be short term or may last for an extended period of time. The risk of further spreading of COVID-19 has led to significant uncertainty and volatility in the financial markets. The value of the Fund and the Master Portfolio in which the Fund invests have generally been adversely affected by impacts caused by COVID-19.
24 | Wells Fargo Small Company Value Fund
Report of independent registered public accounting firm
TO THE SHAREHOLDERS OF THE FUND AND BOARD OF TRUSTEES WELLS FARGO FUNDS TRUST:
Opinion on the Financial Statements
We have audited the accompanying statement of assets and liabilities of Wells Fargo Small Company Value Fund (the Fund), one of the funds constituting Wells Fargo Funds Trust, including the portfolio of investments, as of May 31, 2020, the related statement of operations for the year then ended, the statements of changes in net assets for each of the years in the two-year period then ended, and the related notes (collectively, the financial statements) and the financial highlights for each of the years or periods in the five-year period then ended. In our opinion, the financial statements and financial highlights present fairly, in all material respects, the financial position of the Fund as of May 31, 2020, the results of its operations for the year then ended, the changes in its net assets for each of the years in the two-year period then ended, and the financial highlights for each of the years or periods in the five-year period then ended, in conformity with U.S. generally accepted accounting principles.
Basis for Opinion
These financial statements and financial highlights are the responsibility of the Fund’s management. Our responsibility is to express an opinion on these financial statements and financial highlights based on our audits. We are a public accounting firm registered with the Public Company Accounting Oversight Board (United States) (PCAOB) and are required to be independent with respect to the Fund in accordance with the U.S. federal securities laws and the applicable rules and regulations of the Securities and Exchange Commission and the PCAOB.
We conducted our audits in accordance with the standards of the PCAOB. Those standards require that we plan and perform the audit to obtain reasonable assurance about whether the financial statements and financial highlights are free of material misstatement, whether due to error or fraud. Our audits included performing procedures to assess the risks of material misstatement of the financial statements and financial highlights, whether due to error or fraud, and performing procedures that respond to those risks. Such procedures included examining, on a test basis, evidence regarding the amounts and disclosures in the financial statements and financial highlights. Such procedures also included confirmation of securities owned as of May 31, 2020, by correspondence with the transfer agent. Our audits also included evaluating the accounting principles used and significant estimates made by management, as well as evaluating the overall presentation of the financial statements and financial highlights. We believe that our audits provide a reasonable basis for our opinion.

We have not been able to determine the specific year that we began serving as the auditor of one or more Wells Fargo Funds investment companies; however we are aware that we have served as the auditor of one or more Wells Fargo Funds investment companies since at least 1955.
Boston, Massachusetts
July 29, 2020
Wells Fargo Small Company Value Fund | 25
Portfolio of investments—May 31, 2020
| | | | | | | | | | | | | | | | |
| | | | | | | | | Shares | | | Value | |
| Common Stocks: 98.50% | | | | | | | | | | | | | | | | |
| | | | |
Consumer Discretionary: 14.11% | | | | | | | | | | | | | | | | |
| | | | |
| Auto Components: 1.11% | | | | | | | | | | | | |
Dana Incorporated | | | | | | | | | | | 351,741 | | | $ | 4,446,006 | |
| | | | | | | | | | | | | | | | |
| | | | |
| Diversified Consumer Services: 0.80% | | | | | | | | | | | | |
Collectors Universe Incorporated | | | | | | | | | | | 70,654 | | | | 1,571,345 | |
WW International Incorporated † | | | | | | | | | | | 68,464 | | | | 1,636,290 | |
| | | | |
| | | | | | | | | | | | | | | 3,207,635 | |
| | | | | | | | | | | | | | | | |
| | | | |
| Hotels, Restaurants & Leisure: 3.08% | | | | | | | | | | | | |
Denny’s Corporation † | | | | | | | | | | | 181,358 | | | | 1,966,828 | |
Dine Brands Global Incorporated | | | | | | | | | | | 55,275 | | | | 2,508,932 | |
Norwegian Cruise Line Holdings Limited † | | | | | | | | | | | 88,103 | | | | 1,379,693 | |
The Wendy’s Company | | | | | | | | | | | 130,720 | | | | 2,779,107 | |
Wyndham Hotels & Resorts Incorporated | | | | | | | | | | | 81,203 | | | | 3,729,654 | |
| | | | |
| | | | | | | | | | | | | | | 12,364,214 | |
| | | | | | | | | | | | | | | | |
| | | | |
| Household Durables: 2.88% | | | | | | | | | | | | |
GoPro Incorporated Class A † | | | | | | | | | | | 363,258 | | | | 1,710,945 | |
Helen of Troy Limited † | | | | | | | | | | | 17,894 | | | | 3,255,276 | |
Hooker Furniture Corporation | | | | | | | | | | | 199,392 | | | | 3,250,090 | |
iRobot Corporation † | | | | | | | | | | | 45,381 | | | | 3,345,487 | |
| | | | |
| | | | | | | | | | | | | | | 11,561,798 | |
| | | | | | | | | | | | | | | | |
| | | | |
| Internet & Direct Marketing Retail: 0.38% | | | | | | | | | | | | |
Stamps.com Incorporated † | | | | | | | | | | | 7,714 | | | | 1,528,529 | |
| | | | | | | | | | | | | | | | |
| | | | |
| Leisure Products: 1.14% | | | | | | | | | | | | |
Johnson Outdoors Incorporated Class A | | | | | | | | | | | 29,226 | | | | 2,268,230 | |
Malibu Boats Incorporated Class A † | | | | | | | | | | | 48,833 | | | | 2,301,499 | |
| | | | |
| | | | | | | | | | | | | | | 4,569,729 | |
| | | | | | | | | | | | | | | | |
| | | | |
| Specialty Retail: 2.56% | | | | | | | | | | | | |
American Eagle Outfitters Incorporated | | | | | | | | | | | 245,581 | | | | 2,249,522 | |
Dick’s Sporting Goods Incorporated | | | | | | | | | | | 124,636 | | | | 4,494,374 | |
Shoe Carnival Incorporated | | | | | | | | | | | 136,393 | | | | 3,544,854 | |
| | | | |
| | | | | | | | | | | | | | | 10,288,750 | |
| | | | | | | | | | | | | | | | |
| | | | |
| Textiles, Apparel & Luxury Goods: 2.16% | | | | | | | | | | | | |
Carter’s Incorporated | | | | | | | | | | | 42,951 | | | | 3,689,920 | |
Lakeland Industries Incorporated † | | | | | | | | | | | 28,500 | | | | 413,250 | |
Levi Strauss & Company Class A | | | | | | | | | | | 138,484 | | | | 1,868,149 | |
Rocky Brands Incorporated | | | | | | | | | | | 131,618 | | | | 2,729,757 | |
| | | | |
| | | | | | | | | | | | | | | 8,701,076 | |
| | | | | | | | | | | | | | | | |
| | | | |
Consumer Staples: 4.14% | | | | | | | | | | | | | | | | |
| | | | |
| Food & Staples Retailing: 0.83% | | | | | | | | | | | | |
Ingles Markets Incorporated Class A | | | | | | | | | | | 78,411 | | | | 3,341,093 | |
| | | | | | | | | | | | | | | | |
| | | | |
| Food Products: 1.62% | | | | | | | | | | | | |
Hostess Brands Incorporated † | | | | | | | | | | | 212,293 | | | | 2,563,438 | |
Pilgrim’s Pride Corporation † | | | | | | | | | | | 85,943 | | | | 1,776,442 | |
TreeHouse Foods Incorporated † | | | | | | | | | | | 40,766 | | | | 2,148,776 | |
| | | | |
| | | | | | | | | | | | | | | 6,488,656 | |
| | | | | | | | | | | | | | | | |
The accompanying notes are an integral part of these financial statements.
26 | Wells Fargo Small Company Value Fund
Portfolio of investments—May 31, 2020
| | | | | | | | | | | | | | | | |
| | | | | | | | | Shares | | | Value | |
| Household Products: 0.85% | | | | | | | | | | | | |
Central Garden & Pet Company † | | | | | | | | | | | 93,199 | | | $ | 3,419,471 | |
| | | | | | | | | | | | | | | | |
| | | | |
| Personal Products: 0.84% | | | | | | | | | | | | |
Edgewell Personal Care Company † | | | | | | | | | | | 111,603 | | | | 3,394,963 | |
| | | | | | | | | | | | | | | | |
| | | | |
Energy: 2.85% | | | | | | | | | | | | | | | | |
| | | | |
| Oil, Gas & Consumable Fuels: 2.85% | | | | | | | | | | | | |
Diamondback Energy Incorporated | | | | | | | | | | | 99,358 | | | | 4,230,664 | |
Parsley Energy Incorporated Class A | | | | | | | | | | | 387,350 | | | | 3,540,379 | |
Teekay Tankers Ltd Class A † | | | | | | | | | | | 11,743 | | | | 204,093 | |
W&T Offshore Incorporated † | | | | | | | | | | | 1,333,387 | | | | 3,480,140 | |
| | | | |
| | | | | | | | | | | | | | | 11,455,276 | |
| | | | | | | | | | | | | | | | |
| | | | |
Financials: 22.22% | | | | | | | | | | | | | | | | |
| | | | |
| Banks: 13.12% | | | | | | | | | | | | |
Ameris Bancorp | | | | | | | | | | | 146,310 | | | | 3,545,091 | |
Atlantic Union Bankshares Corporation | | | | | | | | | | | 96,325 | | | | 2,229,924 | |
Banc of California Incorporated | | | | | | | | | | | 185,300 | | | | 2,029,035 | |
Banner Corporation | | | | | | | | | | | 89,610 | | | | 3,365,752 | |
Customers Bancorp Incorporated † | | | | | | | | | | | 212,457 | | | | 2,356,148 | |
FB Financial Corporation | | | | | | | | | | | 142,837 | | | | 3,372,382 | |
First Foundation Incorporated | | | | | | | | | | | 251,468 | | | | 3,746,873 | |
First Interstate BancSystem Class A | | | | | | | | | | | 124,860 | | | | 3,901,875 | |
Great Southern Bancorp Incorporated | | | | | | | | | | | 86,680 | | | | 3,515,741 | |
Heritage Financial Corporation | | | | | | | | | | | 187,776 | | | | 3,567,744 | |
Independent Bank Corporation | | | | | | | | | | | 185,025 | | | | 2,557,046 | |
Midland States Bancorp Incorporated | | | | | | | | | | | 165,986 | | | | 2,484,810 | |
OceanFirst Financial Corporation | | | | | | | | | | | 203,341 | | | | 3,395,795 | |
OFG Bancorp | | | | | | | | | | | 242,855 | | | | 2,950,688 | |
Orrstown Financial Services Incorporated | | | | | | | | | | | 73,829 | | | | 995,215 | |
Pacific Premier Bancorp Incorporated | | | | | | | | | | | 113,773 | | | | 2,459,772 | |
Umpqua Holdings Corporation | | | | | | | | | | | 202,921 | | | | 2,311,270 | |
Univest Corporation of Pennsylvania | | | | | | | | | | | 188,657 | | | | 3,101,521 | |
Western Alliance Bancorp | | | | | | | | | | | 110,551 | | | | 4,217,521 | |
| | | | |
| | | | | | | | | | | | | | | 56,104,203 | |
| | | | | | | | | | | | | | | | |
| | | | |
| Capital Markets: 1.39% | | | | | | | | | | | | |
Piper Jaffray Companies Incorporated | | | | | | | | | | | 69,576 | | | | 4,149,513 | |
Sculptor Capital Management Incorporated | | | | | | | | | | | 114,289 | | | | 1,433,184 | |
| | | | |
| | | | | | | | | | | | | | | 5,582,697 | |
| | | | | | | | | | | | | | | | |
| | | | |
| Insurance: 2.22% | | | | | | | | | | | | |
American Equity Investment Life Holding Company | | | | | | | | | | | 147,164 | | | | 3,191,987 | |
FBL Financial Group Incorporated | | | | | | | | | | | 60,505 | | | | 2,160,634 | |
National General Holdings Corporation | | | | | | | | | | | 103,973 | | | | 2,110,652 | |
State Auto Financial Corporation | | | | | | | | | | | 72,217 | | | | 1,440,007 | |
| | | | |
| | | | | | | | | | | | | | | 8,903,280 | |
| | | | | | | | | | | | | | | | |
| | | | |
| Mortgage REITs: 2.41% | | | | | | | | | | | | |
AGNC Investment Corporation | | | | | | | | | | | 292,193 | | | | 3,780,977 | |
Annaly Capital Management Incorporated | | | | | | | | | | | 566,162 | | | | 3,487,558 | |
Capstead Mortgage Corporation | | | | | | | | | | | 476,789 | | | | 2,412,552 | |
| | | | |
| | | | | | | | | | | | | | | 9,681,087 | |
| | | | | | | | | | | | | | | | |
The accompanying notes are an integral part of these financial statements.
Wells Fargo Small Company Value Fund | 27
Portfolio of investments—May 31, 2020
| | | | | | | | | | | | | | | | |
| | | | | | | | | Shares | | | Value | |
| Thrifts & Mortgage Finance: 3.08% | | | | | | | | | | | | |
Axos Financial Incorporated † | | | | | | | | | | | 109,403 | | | $ | 2,384,985 | |
Homestreet Incorporated | | | | | | | | | | | 147,390 | | | | 3,510,830 | |
Walker & Dunlop Incorporated | | | | | | | | | | | 76,365 | | | | 3,092,783 | |
| | | | |
| | | | | | | | | | | | | | | 8,988,598 | |
| | | | | | | | | | | | | | | | |
| | | | |
Health Care: 5.67% | | | | | | | | | | | | | | | | |
| | | | |
| Biotechnology: 0.26% | | | | | | | | | | | | |
Ligand Pharmaceuticals Incorporated † | | | | | | | | | | | 10,291 | | | | 1,045,257 | |
| | | | | | | | | | | | | | | | |
| | | | |
| Health Care Equipment & Supplies: 1.05% | | | | | | | | | | | | |
AngioDynamics Incorporated † | | | | | | | | | | | 77,452 | | | | 790,785 | |
ICU Medical Incorporated † | | | | | | | | | | | 5,300 | | | | 1,057,986 | |
Merit Medical Systems Incorporated † | | | | | | | | | | | 52,723 | | | | 2,372,008 | |
| | | | |
| | | | | | | | | | | | | | | 4,220,779 | |
| | | | | | | | | | | | | | | | |
| | | | |
| Health Care Providers & Services: 2.92% | | | | | | | | | | | | |
American Renal Associates Holdings † | | | | | | | | | | | 202,788 | | | | 1,255,258 | |
AMN Healthcare Services Incorporated † | | | | | | | | | | | 39,826 | | | | 1,766,681 | |
Hanger Incorporated † | | | | | | | | | | | 97,757 | | | | 1,794,819 | |
LHC Group Incorporated † | | | | | | | | | | | 7,965 | | | | 1,294,392 | |
Option Care Health Incorporated † | | | | | | | | | | | 225,647 | | | | 3,429,834 | |
The Ensign Group Incorporated | | | | | | | | | | | 49,976 | | | | 2,184,951 | |
| | | | |
| | | | | | | | | | | | | | | 11,725,935 | |
| | | | | | | | | | | | | | | | |
| | | | |
| Pharmaceuticals: 1.44% | | | | | | | | | | | | |
Lannett Company Incorporated † | | | | | | | | | | | 335,550 | | | | 2,566,958 | |
Prestige Consumer Healthcare Incorporated † | | | | | | | | | | | 76,531 | | | | 3,229,608 | |
| | | | |
| | | | | | | | | | | | | | | 5,796,566 | |
| | | | | | | | | | | | | | | | |
| | | | |
Industrials: 20.06% | | | | | | | | | | | | | | | | |
| | | | |
| Aerospace & Defense: 0.73% | | | | | | | | | | | | |
Ducommun Incorporated † | | | | | | | | | | | 90,997 | | | | 2,930,103 | |
| | | | | | | | | | | | | | | | |
| | | | |
| Air Freight & Logistics: 0.27% | | | | | | | | | | | | |
Radiant Logistics Incorporated † | | | | | | | | | | | 273,139 | | | | 1,089,825 | |
| | | | | | | | | | | | | | | | |
| | | | |
| Airlines: 0.91% | | | | | | | | | | | | |
Alaska Air Group Incorporated | | | | | | | | | | | 107,252 | | | | 3,666,946 | |
| | | | | | | | | | | | | | | | |
| | | | |
| Building Products: 1.37% | | | | | | | | | | | | |
American Woodmark Corporation † | | | | | | | | | | | 11,679 | | | | 732,974 | |
CSW Industrials Incorporated | | | | | | | | | | | 22,577 | | | | 1,615,610 | |
Patrick Industries Incorporated | | | | | | | | | | | 61,147 | | | | 3,171,695 | |
| | | | |
| | | | | | | | | | | | | | | 5,520,279 | |
| | | | | | | | | | | | | | | | |
| | | | |
| Commercial Services & Supplies: 3.50% | | | | | | | | | | | | |
ABM Industries Incorporated | | | | | | | | | | | 94,403 | | | | 2,901,004 | |
Ennis Incorporated | | | | | | | | | | | 190,798 | | | | 3,396,204 | |
Healthcare Services Group Incorporated | | | | | | | | | | | 125,269 | | | | 2,996,434 | |
Herman Miller Incorporated | | | | | | | | | | | 32,859 | | | | 756,414 | |
Stericycle Incorporated † | | | | | | | | | | | 72,925 | | | | 3,998,478 | |
| | | | |
| | | | | | | | | | | | | | | 14,048,534 | |
| | | | | | | | | | | | | | | | |
The accompanying notes are an integral part of these financial statements.
28 | Wells Fargo Small Company Value Fund
Portfolio of investments—May 31, 2020
| | | | | | | | | | | | | | | | |
| | | | | | | | | Shares | | | Value | |
| Construction & Engineering: 0.41% | | | | | | | | | | | | |
Comfort Systems Incorporated | | | | | | | | | | | 45,035 | | | $ | 1,666,295 | |
| | | | | | | | | | | | | | | | |
| | | | |
| Electrical Equipment: 1.94% | | | | | | | | | | | | |
Atkore International Incorporated † | | | | | | | | | | | 22,780 | | | | 611,415 | |
Encore Wire Corporation | | | | | | | | | | | 82,063 | | | | 3,962,822 | |
Generac Holdings Incorporated † | | | | | | | | | | | 21,749 | | | | 2,420,011 | |
Regal-Beloit Corporation | | | | | | | | | | | 10,065 | | | | 800,570 | |
| | | | |
| | | | | | | | | | | | | | | 7,794,818 | |
| | | | | | | | | | | | | | | | |
| | | | |
| Machinery: 6.02% | | | | | | | | | | | | |
Columbus McKinnon Corporation | | | | | | | | | | | 112,203 | | | | 3,412,093 | |
Federal Signal Corporation | | | | | | | | | | | 91,082 | | | | 2,654,129 | |
Hillenbrand Incorporated | | | | | | | | | | | 154,333 | | | | 3,972,531 | |
Kadant Incorporated | | | | | | | | | | | 38,974 | | | | 3,773,852 | |
Miller Industries Incorporated | | | | | | | | | | | 119,631 | | | | 3,544,667 | |
Mueller Water Products Incorporated Class A | | | | | | | | | | | 370,360 | | | | 3,459,162 | |
Rexnord Corporation | | | | | | | | | | | 25,612 | | | | 770,921 | |
The Shyft Group Incorporated | | | | | | | | | | | 150,866 | | | | 2,576,791 | |
| | | | |
| | | | | | | | | | | | | | | 24,164,146 | |
| | | | | | | | | | | | | | | | |
| | | | |
| Marine: 0.63% | | | | | | | | | | | | |
Atlas Corporation | | | | | | | | | | | 167,867 | | | | 1,190,177 | |
Costamare Incorporated | | | | | | | | | | | 292,144 | | | | 1,343,862 | |
| | | | |
| | | | | | | | | | | | | | | 2,534,039 | |
| | | | | | | | | | | | | | | | |
| | | | |
| Professional Services: 2.29% | | | | | | | | | | | | |
CBIZ Incorporated † | | | | | | | | | | | 120,094 | | | | 2,720,129 | |
Kelly Services Incorporated Class A | | | | | | | | | | | 194,829 | | | | 2,920,487 | |
Korn Ferry International | | | | | | | | | | | 116,895 | | | | 3,537,243 | |
| | | | |
| | | | | | | | | | | | | | | 9,177,859 | |
| | | | | | | | | | | | | | | | |
| | | | |
| Road & Rail: 0.47% | | | | | | | | | | | | |
Arcbest Corporation | | | | | | | | | | | 84,133 | | | | 1,883,738 | |
| | | | | | | | | | | | | | | | |
| | | | |
| Trading Companies & Distributors: 1.52% | | | | | | | | | | | | |
BMC Stock Holdings Incorporated † | | | | | | | | | | | 151,811 | | | | 3,972,894 | |
CAI International Incorporated † | | | | | | | | | | | 113,259 | | | | 2,130,402 | |
| | | | |
| | | | | | | | | | | | | | | 6,103,296 | |
| | | | | | | | | | | | | | | | |
| | | | |
Information Technology: 11.15% | | | | | | | | | | | | | | | | |
| | | | |
| Communications Equipment: 0.48% | | | | | | | | | | | | |
NETGEAR Incorporated † | | | | | | | | | | | 74,535 | | | | 1,917,786 | |
| | | | | | | | | | | | | | | | |
| | | | |
| Electronic Equipment, Instruments & Components: 3.39% | | | | | | | | | | | | |
ePlus Incorporated † | | | | | | | | | | | 35,062 | | | | 2,584,420 | |
Insight Enterprises Incorporated † | | | | | | | | | | | 75,753 | | | | 3,883,099 | |
Methode Electronics Incorporated | | | | | | | | | | | 104,762 | | | | 3,284,289 | |
PC Connection Incorporated | | | | | | | | | | | 87,980 | | | | 3,807,774 | |
Vishay Precision Group † | | | | | | | | | | | 1,572 | | | | 37,131 | |
| | | | |
| | | | | | | | | | | | | | | 13,596,713 | |
| | | | | | | | | | | | | | | | |
| | | | |
| IT Services: 1.82% | | | | | | | | | | | | |
Conduent Incorporated † | | | | | | | | | | | 606,514 | | | | 1,449,568 | |
Hackett Group Incorporated | | | | | | | | | | | 134,403 | | | | 1,853,417 | |
TTEC Holdings Incorporated | | | | | | | | | | | 53,861 | | | | 2,281,552 | |
The accompanying notes are an integral part of these financial statements.
Wells Fargo Small Company Value Fund | 29
Portfolio of investments—May 31, 2020
| | | | | | | | | | | | | | | | |
| | | | | | | | | Shares | | | Value | |
| | | | |
| IT Services (continued) | | | | | | | | | | | | |
Unisys Corporation † | | | | | | | | | | | 151,425 | | | $ | 1,720,188 | |
| | | | |
| | | | | | | | | | | | | | | 7,304,725 | |
| | | | | | | | | | | | | | | | |
| | | | |
| Semiconductors & Semiconductor Equipment: 3.33% | | | | | | | | | | | | |
Cirrus Logic Incorporated † | | | | | | | | | | | 36,320 | | | | 2,632,474 | |
Diodes Incorporated † | | | | | | | | | | | 67,754 | | | | 3,295,555 | |
FormFactor Incorporated † | | | | | | | | | | | 80,235 | | | | 2,019,515 | |
Ichor Holdings Limited † | | | | | | | | | | | 95,390 | | | | 2,170,123 | |
Onto Innovation Incorporated † | | | | | | | | | | | 105,224 | | | | 3,270,362 | |
| | | | |
| | | | | | | | | | | | | | | 13,388,029 | |
| | | | | | | | | | | | | | | | |
| | | | |
| Software: 1.62% | | | | | | | | | | | | |
American Software Incorporated Class A | | | | | | | | | | | 163,055 | | | | 3,171,420 | |
Nuance Communications Incorporated | | | | | | | | | | | 146,201 | | | | 3,345,079 | |
| | | | |
| | | | | | | | | | | | | | | 6,516,499 | |
| | | | | | | | | | | | | | | | |
| | | | |
| Technology Hardware, Storage & Peripherals: 0.51% | | | | | | | | | | | | |
NCR Corporation † | | | | | | | | | | | 113,828 | | | | 2,054,595 | |
| | | | | | | | | | | | | | | | |
| | | | |
Materials: 6.23% | | | | | | | | | | | | | | | | |
| | | | |
| Chemicals: 1.60% | | | | | | | | | | | | |
Hawkins Incorporated | | | | | | | | | | | 36,680 | | | | 1,573,572 | |
Ingevity Corporation † | | | | | | | | | | | 11,840 | | | | 623,613 | |
Minerals Technologies Incorporated | | | | | | | | | | | 12,040 | | | | 593,692 | |
Stepan Company | | | | | | | | | | | 37,529 | | | | 3,646,318 | |
| | | | |
| | | | | | | | | | | | | | | 6,437,195 | |
| | | | | | | | | | | | | | | | |
| | | | |
| Construction Materials: 0.94% | | | | | | | | | | | | |
Eagle Materials Incorporated | | | | | | | | | | | 56,390 | | | | 3,764,596 | |
| | | | | | | | | | | | | | | | |
| | | | |
| Containers & Packaging: 1.35% | | | | | | | | | | | | |
Silgan Holdings Incorporated | | | | | | | | | | | 92,688 | | | | 3,099,487 | |
UFP Technologies Incorporated † | | | | | | | | | | | 50,956 | | | | 2,303,721 | |
| | | | |
| | | | | | | | | | | | | | | 5,403,208 | |
| | | | | | | | | | | | | | | | |
| | | | |
| Metals & Mining: 1.81% | | | | | | | | | | | | |
Kaiser Aluminum Corporation | | | | | | | | | | | 48,956 | | | | 3,512,593 | |
Schnitzer Steel Industries Incorporated Class A | | | | | | | | | | | 239,841 | | | | 3,765,504 | |
| | | | |
| | | | | | | | | | | | | | | 7,278,097 | |
| | | | | | | | | | | | | | | | |
| | | | |
| Paper & Forest Products: 0.53% | | | | | | | | | | | | |
Neenah Incorporated | | | | | | | | | | | 11,687 | | | | 590,895 | |
PH Glatfelter Company | | | | | | | | | | | 68,882 | | | | 1,061,472 | |
Schweitzer-Mauduit International Incorporated | | | | | | | | | | | 15,976 | | | | 485,511 | |
| | | | |
| | | | | | | | | | | | | | | 2,137,878 | |
| | | | | | | | | | | | | | | | |
| | | | |
Real Estate: 6.11% | | | | | | | | | | | | | | | | |
| | | | |
| Equity REITs: 6.11% | | | | | | | | | | | | |
Agree Realty Corporation | | | | | | | | | | | 59,952 | | | | 3,763,187 | |
American Campus Communities Incorporated | | | | | | | | | | | 77,963 | | | | 2,518,205 | |
Armada Hoffler Properties Incorporated | | | | | | | | | | | 216,862 | | | | 1,869,350 | |
Global Medical REIT Incorporated | | | | | | | | | | | 122,538 | | | | 1,313,607 | |
Independence Realty Trust Incorporated | | | | | | | | | | | 380,474 | | | | 3,762,888 | |
The accompanying notes are an integral part of these financial statements.
30 | Wells Fargo Small Company Value Fund
Portfolio of investments—May 31, 2020
| | | | | | | | | | | | | | | | |
| | | | | | | | | Shares | | | Value | |
| | | | |
| Equity REITs (continued) | | | | | | | | | | | | |
One Liberty Properties Incorporated | | | | | | | | | | | 147,496 | | | $ | 2,337,812 | |
Outfront Media Incorporated | | | | | | | | | | | 78,440 | | | | 1,101,298 | |
PotlatchDeltic Corporation | | | | | | | | | | | 111,764 | | | | 3,798,858 | |
STAG Industrial Incorporated | | | | | | | | | | | 150,889 | | | | 4,058,914 | |
| | | | |
| | | | | | | | | | | | | | | 24,524,119 | |
| | | | | | | | | | | | | | | | |
| | | | |
Utilities: 5.96% | | | | | | | | | | | | | | | | |
| | | | |
| Electric Utilities: 3.10% | | | | | | | | | | | | |
Hawaiian Electric Industries Incorporated | | | | | | | | | | | 88,685 | | | | 3,499,510 | |
IDACORP Incorporated | | | | | | | | | | | 39,307 | | | | 3,664,592 | |
Otter Tail Corporation | | | | | | | | | | | 62,240 | | | | 2,670,718 | |
Portland General Electric Company | | | | | | | | | | | 55,985 | | | | 2,637,453 | |
| | | | |
| | | | | | | | | | | | | | | 12,472,273 | |
| | | | | | | | | | | | | | | | |
| | | | |
| Gas Utilities: 1.72% | | | | | | | | | | | | |
National Fuel Gas Company | | | | | | | | | | | 79,287 | | | | 3,327,675 | |
Northwest Natural Holding Company | | | | | | | | | | | 55,870 | | | | 3,581,826 | |
| | | | |
| | | | | | | | | | | | | | | 6,909,501 | |
| | | | | | | | | | | | | | | | |
| | | | |
| Multi-Utilities: 0.72% | | | | | | | | | | | | |
MDU Resources Group Incorporated | | | | | | | | | | | 132,941 | | | | 2,892,796 | |
| | | | | | | | | | | | | | | | |
| | | | |
| Water Utilities: 0.42% | | | | | | | | | | | | |
Artesian Resources Corporation Class A | | | | | | | | | | | 47,741 | | | | 1,676,187 | |
| | | | | | | | | | | | | | | | |
| | | | |
Total Common Stocks (Cost $418,249,578) | | | | | | | | | | | | | | | 395,669,673 | |
| | | | | | | | | | | | | | | | |
| | | | |
Exchange-Traded Funds: 0.51% | | | | | | | | | | | | | | | | |
iShares Russell 2000 Index ETF | | | | | | | | | | | 14,700 | | | | 2,041,830 | |
| | | | |
Total Exchange-Traded Funds (Cost $1,963,357) | | | | | | | | | | | | | | | 2,041,830 | |
| | | | | | | | | | | | | | | | |
| | | | |
| | | | | | | | | | | | | | | | |
| | | | | | Expiration date | | | | | | | |
| Warrants: 0.00% | | | | | | | | | | | | |
| | | | |
Energy: 0.00% | | | | | | | | | | | | | | | | |
| | | | |
| Energy Equipment & Services: 0.00% | | | | | | | | | | | | |
Parker Drilling Company †(a) | | | | | | | 9-16-2024 | | | | 8,457 | | | | 0 | |
| | | | | | | | | | | | | | | | |
| | | | |
Total Warrants (Cost $0) | | | | | | | | | | | | | | | 0 | |
| | | | | | | | | | | | | | | | |
| | | | |
| | | | | | | | | | | | | | | | |
| | | Yield | | | | | | | | | | |
| Short-Term Investments: 0.58% | | | | | | | | | | | | |
| | | | |
| Investment Companies: 0.58% | | | | | | | | | | | | |
Wells Fargo Government Money Market Fund Select Class (I)(u) | | | 0.12 | % | | | | | | | 2,323,207 | | | | 2,323,207 | |
| | | | | | | | | | | | | | | | |
| | | | |
Total Short-Term Investments (Cost $2,323,207) | | | | | | | | | | | | | | | 2,323,207 | |
| | | | | | | | | | | | | | | | |
| | | | | | | | |
| Total investments in securities (Cost $422,536,142) | | | 99.59 | % | | | 400,034,710 | |
| | |
Other assets and liabilities, net | | | 0.41 | | | | 1,634,680 | |
| | | | | | | | |
| Total net assets | | | 100.00 | % | | $ | 401,669,390 | |
| | | | | | | | |
| † | Non-income-earning security |
| (a) | The security is fair valued in accordance with procedures approved by the Board of Trustees. |
| (I) | The issuer of the security is an affiliated person of the Portfolio as defined in the investment Company Act of 1940. |
| (u) | The rate represents the 7-day annualized yield at period end. |
Abbreviations:
| REIT | Real estate investment trust |
The accompanying notes are an integral part of these financial statements.
Wells Fargo Small Company Value Fund | 31
Portfolio of investments—May 31, 2020
Investments in Affiliates
An affiliated investment is an investment in which the Portfolio owns at least 5% of the outstanding voting shares of the issuer or as a result of other relationships, such as the Portfolio and the issuer having the same adviser or investment manager. Transactions with issuers that were either affiliated persons of the Portfolio at the beginning of the period or the end of the period were as follows:
| | | | | | | | | | | | | | | | | | | | | | | | | | | | | | | | | | | | |
| | | Shares, beginning of period | | | Shares purchased | | | Shares sold | | | Shares, end of period | | | Net realized gains (losses) | | | Net change in unrealized gains (losses) | | | Income from affiliated securities | | | Value, end of period | | | % of net assets | |
| | | | | | | | | |
| Short-Term Investments | | | | | | | | | | | | | | | | | | | | | | | | | | | |
Investment Companies | | | | | | | | | | | | | | | | | | | | | | | | | | | | | | | | | | | | |
Securities Lending Cash Investments LLC* | | | 2,006,789 | | | | 103,859,848 | | | | (105,866,637 | ) | | | 0 | | | $ | 1,381 | | | $ | (180 | ) | | $ | 159,667 | # | | $ | 0 | | | | | |
Wells Fargo Government Money Market Fund Select Class | | | 718,186 | | | | 72,903,023 | | | | (71,298,002 | ) | | | 2,323,207 | | | | 0 | | | | 0 | | | | 22,614 | | | | 2,323,207 | | | | | |
| | | | | | | | | | | | | | | | | | | | | | | | | | | | | | | | | | | | |
| | | | | | | | | | | | | | | | | | $ | 1,381 | | | $ | (180 | ) | | $ | 182,281 | | | $ | 2,323,207 | | | | 0.58 | % |
| | | | | | | | | | | | | | | | | | | | | | | | | | | | | | | | | | | | |
| * | No longer held at the end of the period |
| # | Amount shown represents income before fees and rebates. |
The accompanying notes are an integral part of these financial statements.
32 | Wells Fargo Small Company Value Fund
Statement of assets and liabilities—May 31, 2020
| | | | |
| | | | |
| |
Assets | | | | |
Investments in unaffiliated securities, at value (cost $420,212,935) | | $ | 397,711,503 | |
Investments in affiliated securities, at value (cost $2,323,207) | | | 2,323,207 | |
Receivable for investments sold | | | 3,959,661 | |
Receivable for dividends | | | 295,562 | |
Prepaid expenses and other assets | | | 91,689 | |
| | | | |
Total assets | | | 404,381,622 | |
| | | | |
| |
Liabilities | | | | |
Payable for investments purchased | | | 2,476,495 | |
Advisory fee payable | | | 231,929 | |
Trustees’ fee payable | | | 781 | |
Accrued expenses and other liabilities | | | 3,027 | |
| | | | |
Total liabilities | | | 2,712,232 | |
| | | | |
Total net assets | | $ | 401,669,390 | |
| | | | |
The accompanying notes are an integral part of these financial statements.
Wells Fargo Small Company Value Fund | 33
Statement of operations—year ended May 31, 2020
| | | | |
| | | | |
| |
Investment income | | | | |
Dividends (net of foreign withholding taxes of $6,457) | | $ | 6,615,938 | |
Income from affiliated securities | | | 327,211 | |
| | | | |
Total investment income | | | 6,943,149 | |
| | | | |
| |
Expenses | | | | |
Advisory fee | | | 2,936,945 | |
Custody and accounting fees | | | 23,092 | |
Professional fees | | | 41,403 | |
Shareholder report expenses | | | 2,774 | |
Trustees’ fees and expenses | | | 20,633 | |
Other fees and expenses | | | 5,391 | |
| | | | |
Total expenses | | | 3,030,238 | |
Less: Fee waivers and/or expense reimbursements | | | (310,536 | ) |
| | | | |
Net expenses | | | 2,719,702 | |
| | | | |
Net investment income | | | 4,223,447 | |
| | | | |
| |
Realized and unrealized gains (losses) on investments | | | | |
Net realized gains (losses) on | | | | |
Unaffiliated securities | | | (50,608,697 | ) |
Affiliated securities | | | 1,381 | |
| | | | |
Net realized losses on investments | | | (50,607,316 | ) |
| | | | |
Net change in unrealized gains (losses) on | | | | |
Unaffiliated securities | | | (40,450,817 | ) |
Affiliated securities | | | (180 | ) |
| | | | |
Net change in unrealized gains (losses) on investments | | | (40,450,997 | ) |
| | | | |
Net realized and unrealized gains (losses) on investments | | | (91,058,313 | ) |
| | | | |
Net decrease in net assets resulting from operations | | $ | (86,834,866 | ) |
| | | | |
The accompanying notes are an integral part of these financial statements.
34 | Wells Fargo Small Company Value Fund
Statement of changes in net assets
| | | | | | | | |
| | | | |
| | | Year ended
May 31, 2020 | | | Year ended
May 31, 2019 | |
| | |
Operations | | | | | | | | |
Net investment income | | $ | 4,223,447 | | | $ | 1,405,371 | |
Net realized losses on investments | | | (50,607,316 | ) | | | (20,261,333 | ) |
Net change in unrealized gains (losses) on investments | | | (40,450,997 | ) | | | (10,952,752 | ) |
| | | | |
Net decrease in net assets resulting from operations | | | (86,834,866 | ) | | | (29,808,714 | ) |
| | | | |
| | |
Capital transactions | | | | | | | | |
Transactions in investors’ beneficial interests | | | | | | | | |
Contributions | | | 464,639,096 | | | | 110,246,678 | |
Withdrawals | | | (103,765,259 | ) | | | (112,205,990 | ) |
| | | | | | | | |
Net increase (decrease) in net assets resulting from capital transactions | | | 360,873,837 | | | | (1,959,312 | ) |
| | | | |
Total increase (decrease) in net assets | | | 274,038,971 | | | | (31,768,026 | ) |
| | | | |
| | |
Net assets | | | | | | | | |
Beginning of period | | | 127,630,419 | | | | 159,398,445 | |
| | | | |
End of period | | $ | 401,669,390 | | | $ | 127,630,419 | |
| | | | |
The accompanying notes are an integral part of these financial statements.
Wells Fargo Small Company Value Fund | 35
Financial highlights
| | | | | | | | | | | | | | | | | | | | |
| | | Year ended May 31 | |
| | | 2020 | | | 2019 | | | 2018 | | | 2017 | | | 2016 | |
Total return | | | (13.74 | )% | | | (14.51 | )% | | | 20.10 | % | | | 19.44 | % | | | (4.96 | )% |
Ratios to average net assets (annualized) | | | | | | | | | | | | | | | | | | | | |
Gross expenses | | | 0.82 | % | | | 0.86 | % | | | 0.85 | % | | | 0.84 | % | | | 0.85 | % |
Net expenses | | | 0.74 | % | | | 0.75 | % | | | 0.84 | % | | | 0.84 | % | | | 0.85 | % |
Net investment income | | | 1.15 | % | | | 0.80 | % | | | 0.87 | % | | | 0.72 | % | | | 0.62 | % |
Supplemental data | | | | | | | | | | | | | | | | | | | | |
Portfolio turnover rate | | | 78 | % | | | 168 | % | | | 144 | % | | | 110 | % | | | 72 | % |
The accompanying notes are an integral part of these financial statements.
36 | Wells Fargo Small Company Value Fund
Notes to financial statements
1. ORGANIZATION
Wells Fargo Master Trust (the “Trust”), a Delaware statutory trust organized on March 10, 1999, is an open-end management investment company registered under the Investment Company Act of 1940, as amended (the “1940 Act”). As an investment company, the Trust follows the accounting and reporting guidance in Financial Accounting Standards Board Accounting Standards Codification Topic 946, Financial Services – Investment Companies. These financial statements report on the Wells Fargo Small Company Value Portfolio (the “Portfolio”) which is a diversified series of the Trust.
2. SIGNIFICANT ACCOUNTING POLICIES
The following significant accounting policies, which are consistently followed in the preparation of the financial statements of the Portfolio, are in conformity with U.S. generally accepted accounting principles which require management to make estimates and assumptions that affect the reported amounts of assets and liabilities, disclosure of contingent assets and liabilities at the date of the financial statements, and the reported amounts of revenues and expenses during the reporting period. Actual results could differ from those estimates.
Securities valuation
All investments are valued each business day as of the close of regular trading on the New York Stock Exchange (generally 4 p.m. Eastern Time), although the Portfolio may deviate from this calculation time under unusual or unexpected circumstances.
Equity securities that are listed on a foreign or domestic exchange or market are valued at the official closing price or, if none, the last sales price. If no sale occurs on the principal exchange or market that day, a fair value price will be determined in accordance with the Portfolio’s Valuation Procedures.
Investments in registered open-end investment companies are valued at net asset value. Interests in non-registered investment companies that are redeemable at net asset value are fair valued normally at net asset value.
Investments which are not valued using any of the methods discussed above are valued at their fair value, as determined in good faith by the Board of Trustees of the Portfolio. The Board of Trustees has established a Valuation Committee comprised of the Trustees and has delegated to it the authority to take any actions regarding the valuation of portfolio securities that the Valuation Committee deems necessary or appropriate, including determining the fair value of portfolio securities, unless the determination has been delegated to the Wells Fargo Asset Management Pricing Committee at Wells Fargo Funds Management, LLC (“Funds Management”). The Board of Trustees retains the authority to make or ratify any valuation decisions or approve any changes to the Valuation Procedures as it deems appropriate. On a quarterly basis, the Board of Trustees receives reports on any valuation actions taken by the Valuation Committee or the Wells Fargo Asset Management Pricing Committee which may include items for ratification.
Securities lending
The Portfolio may lend its securities from time to time in order to earn additional income in the form of fees or interest on securities received as collateral or the investment of any cash received as collateral. When securities are on loan, the Portfolio receives interest or dividends on those securities. Cash collateral received in connection with its securities lending transactions is invested in Securities Lending Cash Investments, LLC (the “Securities Lending Fund”). Investments in Securities Lending Fund are valued at the evaluated bid price provided by an independent pricing service. Income earned from investment in the Securities Lending Fund (net of fees and rebates), if any, is included in income from affiliated securities on the Statements of Operations.
In a securities lending transaction, the net asset value of the Portfolio will be affected by an increase or decrease in the value of the securities loaned and by an increase or decrease in the value of the instrument in which collateral is invested. The amount of securities lending activity undertaken by the Portfolio fluctuates from time to time. The Portfolio has the right under the lending agreement to recover the securities from the borrower on demand. In the event of default or bankruptcy by the borrower, the Portfolio may be prevented from recovering the loaned securities or gaining access to the collateral or may experience delays or costs in doing so. In such an event, the terms of the agreement allow the unaffiliated securities lending agent to use the collateral to purchase replacement securities on behalf of the Portfolio or pay the Portfolio the market value of the loaned securities. The Portfolio bears the risk of loss with respect to depreciation of its investment of the cash collateral.
Security transactions and income recognition
Securities transactions are recorded on a trade date basis. Realized gains or losses are recorded on the basis of identified cost.
Dividend income is recognized on the ex-dividend date. Dividend income is recorded net of foreign taxes withheld where recovery of such taxes is not assured.
Wells Fargo Small Company Value Fund | 37
Notes to financial statements
Federal and other taxes
The Portfolio is treated as a separate entity for federal income tax purposes. The Portfolio is not required to pay federal income taxes on its net investment income and net capital gains as it is treated as a partnership for federal income tax purposes. All interest, dividends, gains and losses of the Portfolio are deemed to have been “passed through” to the interest holders in proportion to their holdings of the Portfolio regardless of whether such interest, dividends and gains have been distributed by the Portfolio.
The Portfolio’s income tax returns and all financial records supporting those returns for the prior three fiscal years are subject to examination by the federal revenue authority. Management has analyzed the Portfolio’s tax positions taken on federal, state, and foreign tax returns for all open tax years and does not believe that there are any uncertain tax positions that require recognition of a tax liability.
As of May 31, 2020, the aggregate cost of all investments for federal income tax purposes was $434,791,870 and the unrealized gains (losses) consisted of:
| | | | |
| |
Gross unrealized gains | | $ | 33,306,133 | |
| |
Gross unrealized losses | | | (68,063,293) | |
| |
Net unrealized losses | | $ | (34,757,160) | |
3. FAIR VALUATION MEASUREMENTS
Fair value measurements of investments are determined within a framework that has established a fair value hierarchy based upon the various data inputs utilized in determining the value of the Portfolio’s investments. The three-level hierarchy gives the highest priority to unadjusted quoted prices in active markets for identical assets or liabilities (Level 1) and the lowest priority to unobservable inputs (Level 3). The Portfolio’s investments are classified within the fair value hierarchy based on the lowest level of input that is significant to the fair value measurement. The inputs are summarized into three broad levels as follows:
| ∎ | | Level 1 – quoted prices in active markets for identical securities |
| ∎ | | Level 2 – other significant observable inputs (including quoted prices for similar securities, interest rates, prepayment speeds, credit risk, etc.) |
| ∎ | | Level 3 – significant unobservable inputs (including the Portfolio’s own assumptions in determining the fair value of investments) |
The inputs or methodologies used for valuing investments in securities are not necessarily an indication of the risk associated with investing in those securities.
38 | Wells Fargo Small Company Value Fund
Notes to financial statements
The following is a summary of the inputs used in valuing the Portfolio’s assets and liabilities as of May 31, 2020:
| | | | | | | | | | | | | | | | |
| | | | |
| | | Quoted prices
(Level 1) | | | Other significant
observable inputs
(Level 2) | | | Significant
unobservable inputs (Level 3) | | | Total | |
| | | | |
Assets | | | | | | | | | | | | | | | | |
Investments in: | | | | | | | | | | | | | | | | |
| | | | |
Common stocks | | | | | | | | | | | | | | | | |
| | | | |
Consumer discretionary | | $ | 56,667,737 | | | $ | 0 | | | $ | 0 | | | $ | 56,667,737 | |
| | | | |
Consumer staples | | | 16,644,183 | | | | 0 | | | | 0 | | | | 16,644,183 | |
| | | | |
Energy | | | 11,455,276 | | | | 0 | | | | 0 | | | | 11,455,276 | |
| | | | |
Financials | | | 89,259,865 | | | | 0 | | | | 0 | | | | 89,259,865 | |
| | | | |
Health care | | | 22,788,537 | | | | 0 | | | | 0 | | | | 22,788,537 | |
| | | | |
Industrials | | | 80,579,878 | | | | 0 | | | | 0 | | | | 80,579,878 | |
| | | | |
Information technology | | | 44,778,347 | | | | 0 | | | | 0 | | | | 44,778,347 | |
| | | | |
Materials | | | 25,020,974 | | | | 0 | | | | 0 | | | | 25,020,974 | |
| | | | |
Real estate | | | 24,524,119 | | | | 0 | | | | 0 | | | | 24,524,119 | |
| | | | |
Utilities | | | 23,950,757 | | | | 0 | | | | 0 | | | | 23,950,757 | |
| | | | |
Exchange-traded funds | | | 2,041,830 | | | | 0 | | | | 0 | | | | 2,041,830 | |
| | | | |
Warrants | | | | | | | | | | | | | | | | |
| | | | |
Energy | | | 0 | | | | 0 | | | | 0 | | | | 0 | |
| | | | |
Short-term investments | | | | | | | | | | | | | | | | |
| | | | |
Investment companies | | | 2,323,207 | | | | 0 | | | | 0 | | | | 2,323,207 | |
| | | | |
Total assets | | $ | 400,034,710 | | | $ | 0 | | | $ | 0 | | | $ | 400,034,710 | |
Additional sector, industry or geographic detail for the Portfolio is included in the Portfolio of investments.
For the year ended May 31, 2020, the Portfolio did not have any transfers into/out of Level 3.
4. TRANSACTIONS WITH AFFILIATES
Advisory fee
The Trust has entered into an advisory contract with Funds Management , an indirect wholly owned subsidiary of Wells Fargo & Company (“Wells Fargo”). The adviser is responsible for implementing investment policies and guidelines and for supervising the subadviser, who is responsible for day-to-day portfolio management of the Portfolio. Pursuant to the contract, Funds Management is entitled to receive an advisory fee at the following annual rate based on the Portfolio’s average daily net assets:
| | |
| |
| Average daily net assets | | Advisory fee |
| |
First $500 million | | 0.800% |
| |
Next $500 million | | 0.775 |
| |
Next $1 billion | | 0.750 |
| |
Next $1 billion | | 0.725 |
| |
Next $1 billion | | 0.700 |
| |
Over $4 billion | | 0.680 |
For the year ended May 31, 2020, the advisory fee was equivalent to an annual rate of 0.80% of the Portfolio’s average daily net assets.
Funds Management has retained the services of a subadviser to provide daily portfolio management to the Portfolio. The fee for subadvisory services is borne by Funds Management. Wells Capital Management Incorporated (“WellsCap”), an affiliate of Funds Management and an indirect wholly owned subsidiary of Wells Fargo, is the subadviser to the Portfolio and is entitled to receive a fee from Funds Management at an annual rate starting at 0.55% and declining to 0.40% as the average daily net assets of the Portfolio increase.
Wells Fargo Small Company Value Fund | 39
Notes to financial statements
Funds Management has voluntarily waived and/or reimbursed advisory fees to reduce the net operating expense ratio of the Portfolio.
Interfund transactions
The Portfolio may purchase or sell portfolio investment securities to certain other Wells Fargo affiliates pursuant to Rule 17a-7 under the 1940 Act and under procedures adopted by the Board of Trustees. The procedures have been designed to ensure that these interfund transactions, which do not incur broker commissions, are effected at current market prices.
5. INVESTMENT PORTFOLIO TRANSACTIONS
Purchases and sales of investments, excluding U.S. government obligations (if any) and short-term securities, for the year ended May 31, 2020 were $285,266,999 and $321,522,219, respectively.
6. SECURITIES LENDING TRANSACTIONS
The Portfolio lends its securities through an unaffiliated securities lending agent and receives collateral in the form of cash or securities with a value at least equal to the value of the securities on loan. The value of the loaned securities is determined at the close of each business day and any increases or decreases in the required collateral are exchanged between the Portfolio and the counterparty on the next business day. Cash collateral received is invested in the Securities Lending Fund which seeks to provide a positive return compared to the daily Federal Funds Open Rate by investing in high-quality, U.S. dollar-denominated short-term money market instruments and is exempt from registration under Section 3(c)(7) of the 1940 Act. Securities Lending Fund is managed by Funds Management and is subadvised by WellsCap. Funds Management receives an advisory fee starting at 0.05% and declining to 0.01% as the average daily net assets of the Securities Lending Fund increase. All of the fees received by Funds Management are paid to WellsCap for its services as subadviser.
In the event of counterparty default or the failure of a borrower to return a loaned security, the Portfolio has the right to use the collateral to offset any losses incurred. As of May 31, 2020, the Portfolio did not have any securities on loan.
7. BANK BORROWINGS
The Trust, along with Wells Fargo Variable Trust and Wells Fargo Funds Trust (excluding the money market funds), are parties to a $280,000,000 revolving credit agreement whereby the Portfolio is permitted to use bank borrowings for temporary or emergency purposes, such as to fund shareholder redemption requests. Interest under the credit agreement is charged to the Portfolio based on a borrowing rate equal to the higher of the Federal Funds rate in effect on that day plus 1.25% or the overnight LIBOR rate in effect on that day plus 1.25%. In addition, an annual commitment fee equal to 0.25% of the unused balance is allocated to each participating fund.
For the year ended May 31, 2020, there were no borrowings by the Portfolio under the agreement.
8. INDEMNIFICATION
Under the Portfolio’s organizational documents, the officers and Trustees have been granted certain indemnification rights against certain liabilities that may arise out of performance of their duties to the Portfolio. The Portfolio has entered into a separate agreement with each Trustee that converts indemnification rights currently existing under the Portfolio’s organizational documents into contractual rights that cannot be changed in the future without the consent of the Trustee. Additionally, in the normal course of business, the Portfolio may enter into contracts with service providers that contain a variety of indemnification clauses. The Portfolio’s maximum exposure under these arrangements is dependent on future claims that may be made against the Portfolio and, therefore, cannot be estimated.
9. NEW ACCOUNTING PRONOUNCEMENT
In August 2018, FASB issued Accounting Standards Update (“ASU”) No. 2018-13, Fair Value Measurement (Topic 820) Disclosure Framework—Changes to the Disclosure Requirements for Fair Value Measurement. ASU 2018-13 updates the disclosure requirements for fair value measurements by modifying or removing certain disclosures and adding certain new disclosures. The amendments are effective for fiscal years, and interim periods within those fiscal years, beginning after December 15, 2019. Early adoption is permitted. Management has adopted the removal and modification of disclosures early, as permitted, and will adopt the additional new disclosures at the effective date.
40 | Wells Fargo Small Company Value Fund
Notes to financial statements
10. CORONAVIRUS (COVID-19) PANDEMIC
On March 11, 2020, the World Health Organization announced that it had made the assessment that coronavirus disease 2019 (“COVID-19”) is a pandemic. The impacts of COVID-19 are adversely affecting the entire global economy, individual companies and investment products, and the market in general. There is significant uncertainty around the extent and duration of business disruptions related to COVID-19 and the impacts may be short term or may last for an extended period of time. The risk of further spreading of COVID-19 has led to significant uncertainty and volatility in the financial markets. The value of the Portfolio and the securities in which the Portfolio invests have generally been adversely affected by impacts caused by COVID-19.
Wells Fargo Small Company Value Fund | 41
Report of independent registered public accounting firm
TO THE INTEREST HOLDERS OF THE PORTFOLIO AND BOARD OF TRUSTEES WELLS FARGO MASTER TRUST:
Opinion on the Financial Statements
We have audited the accompanying statement of assets and liabilities of Wells Fargo Small Company Value Portfolio (the Portfolio), one of the portfolios constituting Wells Fargo Master Trust, including the portfolio of investments, as of May 31, 2020, the related statement of operations for the year then ended, the statements of changes in net assets for each of the years in the two-year period then ended, and the related notes (collectively, the financial statements) and the financial highlights for each of the years in the five-year period then ended. In our opinion, the financial statements and financial highlights present fairly, in all material respects, the financial position of the Portfolio as of May 31, 2020, the results of its operations for the year then ended, the changes in its net assets for each of the years in the two-year period then ended, and the financial highlights for each of the years in the five-year period then ended, in conformity with U.S. generally accepted accounting principles.
Basis for Opinion
These financial statements and financial highlights are the responsibility of the Portfolio’s management. Our responsibility is to express an opinion on these financial statements and financial highlights based on our audits. We are a public accounting firm registered with the Public Company Accounting Oversight Board (United States) (PCAOB) and are required to be independent with respect to the Portfolio in accordance with the U.S. federal securities laws and the applicable rules and regulations of the Securities and Exchange Commission and the PCAOB.
We conducted our audits in accordance with the standards of the PCAOB. Those standards require that we plan and perform the audit to obtain reasonable assurance about whether the financial statements and financial highlights are free of material misstatement, whether due to error or fraud. Our audits included performing procedures to assess the risks of material misstatement of the financial statements and financial highlights, whether due to error or fraud, and performing procedures that respond to those risks. Such procedures included examining, on a test basis, evidence regarding the amounts and disclosures in the financial statements and financial highlights. Such procedures also included confirmation of securities owned as of May 31, 2020, by correspondence with the custodian, transfer agent and brokers, or by other appropriate auditing procedures. Our audits also included evaluating the accounting principles used and significant estimates made by management, as well as evaluating the overall presentation of the financial statements and financial highlights. We believe that our audits provide a reasonable basis for our opinion.
We have not been able to determine the specific year that we began serving as the auditor of one or more Wells Fargo Funds investment companies; however we are aware that we have served as the auditor of one or more Wells Fargo Funds investment companies since at least 1955.
Boston, Massachusetts
July 29, 2020
42 | Wells Fargo Small Company Value Fund
Other information (unaudited)
TAX INFORMATION
For corporate shareholders, pursuant to Section 854 of the Internal Revenue Code, 100% of ordinary income dividends qualify for the corporate dividends-received deduction for the fiscal year ended May 31, 2020.
Pursuant to Section 854 of the Internal Revenue Code, $2,374,840 of income dividends paid during the fiscal year ended May 31, 2020 has been designated as qualified dividend income (QDI).
PROXY VOTING INFORMATION
A description of the policies and procedures used to determine how to vote proxies relating to portfolio securities is available, upon request, by calling 1-800-222-8222, visiting our website at wfam.com, or visiting the SEC website at sec.gov. Information regarding how the proxies related to portfolio securities were voted during the most recent 12-month period ended June 30 is available on the website at wfam.com or by visiting the SEC website at sec.gov.
QUARTERLY PORTFOLIO HOLDINGS INFORMATION
The Fund and Portfolio file their complete schedule of portfolio holdings with the SEC for the first and third quarters of each fiscal year as an exhibit to its reports on Form N-PORT. Shareholders may view the filed Form N-PORT by visiting the SEC website at sec.gov.
Wells Fargo Small Company Value Fund | 43
Other information (unaudited)
BOARD OF TRUSTEES AND OFFICERS
Each of the Trustees and Officers1 listed in the table below acts in identical capacities for each fund in the Wells Fargo family of funds, which consists of 147 mutual funds comprising the Wells Fargo Funds Trust, Wells Fargo Variable Trust, Wells Fargo Master Trust and four closed-end funds (collectively the “Fund Complex”). This table should be read in conjunction with the Prospectus and the Statement of Additional Information2. The mailing address of each Trustee and Officer is 525 Market Street, 12th Floor, San Francisco, CA 94105. Each Trustee and Officer serves an indefinite term, however, each Trustee serves such term until reaching the mandatory retirement age established by the Trustees.
Independent Trustees
| | | | | | |
Name and
year of birth | | Position held and
length of service* | | Principal occupations during past five years or longer | | Current other
public company or
investment
company
directorships |
| | | |
| William R. Ebsworth (Born 1957) | | Trustee,
since 2015 | | Retired. From 1984 to 2013, equities analyst, portfolio manager, research director and chief investment officer at Fidelity Management and Research Company in Boston, Tokyo, and Hong Kong, and retired in 2013 as Chief Investment Officer of Fidelity Strategic Advisers, Inc. where he led a team of investment professionals managing client assets. Prior thereto, Board member of Hong Kong Securities Clearing Co., Hong Kong Options Clearing Corp., the Thailand International Fund, Ltd., Fidelity Investments Life Insurance Company, and Empire Fidelity Investments Life Insurance Company. Audit Committee Chair and Investment Committee Chair of the Vincent Memorial Hospital Endowment (non-profit organization). Mr. Ebsworth is a CFA® charterholder. | | N/A |
| | | |
| Jane A. Freeman (Born 1953) | | Trustee,
since 2015;
Chair Liaison,
since 2018 | | Retired. From 2012 to 2014 and 1999 to 2008, Chief Financial Officer of Scientific Learning Corporation. From 2008 to 2012, Ms. Freeman provided consulting services related to strategic business projects. Prior to 1999, Portfolio Manager at Rockefeller & Co. and Scudder, Stevens & Clark. Board member of the Harding Loevner Funds from 1996 to 2014, serving as both Lead Independent Director and chair of the Audit Committee. Board member of the Russell Exchange Traded Funds Trust from 2011 to 2012 and the chair of the Audit Committee. Ms. Freeman is also an inactive Chartered Financial Analyst. | | N/A |
| | | |
| Isaiah Harris, Jr. (Born 1952) | | Trustee,
since 2009;
Audit Committee Chairman,
since 2019 | | Retired. Chairman of the Board of CIGNA Corporation since 2009, and Director since 2005. From 2003 to 2011, Director of Deluxe Corporation. Prior thereto, President and CEO of BellSouth Advertising and Publishing Corp. from 2005 to 2007, President and CEO of BellSouth Enterprises from 2004 to 2005 and President of BellSouth Consumer Services from 2000 to 2003. Emeritus member of the Iowa State University Foundation Board of Governors. Emeritus Member of the Advisory Board of Iowa State University School of Business. Advisory Board Member, Palm Harbor Academy (private school). Advisory Board Member, Child Evangelism Fellowship (non-profit). Mr. Harris is a certified public accountant (inactive status). | | CIGNA Corporation |
| | | |
| Judith M. Johnson (Born 1949) | | Trustee,
since 2008;
Audit Committee Chairman, from 2009 to 2018 | | Retired. Prior thereto, Chief Executive Officer and Chief Investment Officer of Minneapolis Employees Retirement Fund from 1996 to 2008. Ms. Johnson is an attorney, certified public accountant and a certified managerial accountant. | | N/A |
44 | Wells Fargo Small Company Value Fund
Other information (unaudited)
| | | | | | |
Name and
year of birth | | Position held and
length of service* | | Principal occupations during past five years or longer | | Current other
public company or
investment
company
directorships |
| | | |
| David F. Larcker (Born 1950) | | Trustee,
since 2009 | | James Irvin Miller Professor of Accounting at the Graduate School of Business, Stanford University, Director of the Corporate Governance Research Initiative and Senior Faculty of The Rock Center for Corporate Governance since 2006. From 2005 to 2008, Professor of Accounting at the Graduate School of Business, Stanford University. Prior thereto, Ernst & Young Professor of Accounting at The Wharton School, University of Pennsylvania from 1985 to 2005. | | N/A |
| | | |
| Olivia S. Mitchell (Born 1953) | | Trustee,
since 2006; Nominating and Governance Committee Chair,
since 2018 | | International Foundation of Employee Benefit Plans Professor, Wharton School of the University of Pennsylvania since 1993. Director of Wharton’s Pension Research Council and Boettner Center on Pensions & Retirement Research, and Research Associate at the National Bureau of Economic Research. Previously, Cornell University Professor from 1978 to 1993. | | N/A |
| | | |
| Timothy J. Penny (Born 1951) | | Trustee,
since 1996; Chairman,
since 2018 | | President and Chief Executive Officer of Southern Minnesota Initiative Foundation, a non-profit organization, since 2007. Member of the Board of Trustees of NorthStar Education Finance, Inc., a non-profit organization, since 2007. | | N/A |
| | | |
| James G. Polisson (Born 1959) | | Trustee,
since 2018 | | Retired. Chief Marketing Officer, Source (ETF) UK Services, Ltd, from 2015 to 2017. From 2012 to 2015, Principal of The Polisson Group, LLC, a management consulting, corporate advisory and principal investing company. Chief Executive Officer and Managing Director at Russell Investments, Global Exchange Traded Funds from 2010 to 2012. Managing Director of Barclays Global Investors from 1998 to 2010 and Global Chief Marketing Officer for iShares and Barclays Global Investors from 2000 to 2010. Trustee of the San Francisco Mechanics’ Institute, a non-profit organization, from 2013 to 2015. Board member of the Russell Exchange Traded Fund Trust from 2011 to 2012. Director of Barclays Global Investors Holdings Deutschland GmbH from 2006 to 2009. Mr. Polisson is an attorney and has a retired status with the Massachusetts and District of Columbia Bar Associations. | | N/A |
| | | |
| Pamela Wheelock (Born 1959) | | Trustee,
since January 2020;
previously Trustee from January 2018 to July 2019 | | Board member of the Destination Medical Center Economic Development Agency, Rochester, Minnesota since 2019 and Interim President of the McKnight Foundation since 2020. Acting Commissioner, Minnesota Department of Human Services, July 2019 through September 2019. Human Services Manager (part-time), Minnesota Department of Human Services, October 2019 through December 2019. Chief Operating Officer, Twin Cities Habitat for Humanity from 2017 to 2019. Vice President of University Services, University of Minnesota from 2012 to 2016. Prior thereto, on the Board of Directors, Governance Committee and Finance Committee for the Minnesota Philanthropy Partners (Saint Paul Foundation) from 2012 to 2018, Interim Chief Executive Officer of Blue Cross Blue Shield of Minnesota from 2011 to 2012, Chairman of the Board from 2009 to 2012 and Board Director from 2003 to 2015. Vice President, Leadership and Community Engagement, Bush Foundation, Saint Paul, Minnesota (a private foundation) from 2009 to 2011. Executive Vice President and Chief Financial Officer, Minnesota Sports and Entertainment from 2004 to 2009 and Senior Vice President from 2002 to 2004. Executive Vice President of the Minnesota Wild Foundation from 2004 to 2008. Commissioner of Finance, State of Minnesota, from 1999 to 2002. Currently Board Chair of the Minnesota Wild Foundation since 2010. | | N/A |
| * | Length of service dates reflect the Trustee’s commencement of service with the Trust’s predecessor entities, where applicable. |
Wells Fargo Small Company Value Fund | 45
Other information (unaudited)
Officers
| | | | |
Name and
year of birth | | Position held and
length of service | | Principal occupations during past five years or longer |
| | |
| Andrew Owen (Born 1960) | | President,
since 2017 | | Executive Vice President of Wells Fargo & Company and Head of Affiliated Managers, Wells Fargo Asset Management, since 2014. In addition, Mr. Owen is currently President, Chief Executive Officer and Director of Wells Fargo Funds Management, LLC since 2017. Prior thereto, Executive Vice President responsible for marketing, investments and product development for Wells Fargo Funds Management, LLC, from 2009 to 2014. |
| | |
| Nancy Wiser1 (Born 1967) | | Treasurer,
since 2012 | | Executive Vice President of Wells Fargo Funds Management, LLC since 2011. Chief Operating Officer and Chief Compliance Officer at LightBox Capital Management LLC, from 2008 to 2011. |
| | |
| Michelle Rhee (Born 1966) | | Chief Legal Officer,
since 2019 | | Secretary of Wells Fargo Funds Management, LLC, Chief Legal Counsel of Wells Fargo Asset Management and Assistant General Counsel of Wells Fargo Bank, N.A. since 2018. Associate General Counsel and Managing Director of Bank of America Corporation from 2004 to 2018. |
| | |
| Catherine Kennedy (Born 1969) | | Secretary,
since 2019 | | Vice President of Wells Fargo Funds Management, LLC and Senior Counsel of the Wells Fargo Legal Department since 2010. Vice President and Senior Counsel of Evergreen Investment Management Company, LLC from 1998 to 2010. |
| | |
| Michael H. Whitaker (Born 1967) | | Chief Compliance Officer,
since 2016 | | Chief Compliance Officer of Wells Fargo Asset Management since 2016. Senior Vice President and Chief Compliance Officer for Fidelity Investments from 2007 to 2016. |
| | |
| David Berardi (Born 1975) | | Assistant Treasurer, since 2009 | | Vice President of Wells Fargo Funds Management, LLC since 2009. Vice President of Evergreen Investment Management Company, LLC from 2008 to 2010. Manager of Fund Reporting and Control for Evergreen Investment Management Company, LLC from 2004 to 2010. |
| | |
| Jeremy DePalma1 (Born 1974) | | Treasurer,
since 2012 | | Senior Vice President of Wells Fargo Funds Management, LLC since 2009. Senior Vice President of Evergreen Investment Management Company, LLC from 2008 to 2010 and head of the Fund Reporting and Control Team within Fund Administration from 2005 to 2010. |
| 1 | Nancy Wiser acts as Treasurer of 65 funds in the Fund Complex. Jeremy DePalma acts as the Treasurer of 82 funds in the Fund Complex. |
| 2 | The Statement of Additional Information includes additional information about the Trustees and is available, without charge, upon request, by calling 1-800-222-8222 or by visiting the website at wfam.com. |
46 | Wells Fargo Small Company Value Fund
Other information (unaudited)
BOARD CONSIDERATION OF INVESTMENT MANAGEMENT, ADVISORY AND SUB-ADVISORY AGREEMENTS:
Wells Fargo Small Company Value Fund and Wells Fargo Small Company Value Portfolio
Under the Investment Company Act of 1940 (the “1940 Act”), the Board of Trustees (each, a “Board” and collectively, the “Boards”) of each of Wells Fargo Funds Trust (“Funds Trust”) and Wells Fargo Master Trust (“Master Trust”, and collectively, the “Trusts”) must determine annually whether to approve the continuation of the Trusts’ investment management, advisory and sub-advisory agreements, as applicable. In this regard, at a Board meeting held on May 26, 2020 and May 28, 2020 (together, the “Meeting”), the Funds Trust Board, all the members of which have no direct or indirect interest in the investment management agreement and are not “interested persons” of the Trusts, as defined in the 1940 Act (the “Independent Trustees”), reviewed and approved for Wells Fargo Small Company Value Fund (the “Gateway Fund”) an investment management agreement (the “Gateway Fund Management Agreement”) with Wells Fargo Funds Management, LLC (“Funds Management”).
At the Meeting, the Master Trust Board, all the members of which have no direct or indirect interest in the investment advisory and sub-advisory agreements and are Independent Trustees, reviewed and approved: (i) an investment advisory agreement (the “Master Portfolio Advisory Agreement”) with Funds Management for Wells Fargo Small Company Value Portfolio, a portfolio of Master Trust (the “Master Portfolio”); and (ii) an investment sub-advisory agreement (the “Sub-Advisory Agreement”) with Wells Capital Management Incorporated (the “Sub-Adviser”), an affiliate of Funds Management, for the Master Portfolio.
The Gateway Fund and the Master Portfolio are collectively referred to as the “Funds.” The Gateway Fund Management Agreement, the Master Portfolio Advisory Agreement and the Sub-Advisory Agreement are collectively referred to as the “Advisory Agreements.”
The Gateway Fund is a gateway feeder fund that invest substantially all of its assets in the Master Portfolio. The Master Portfolio has a substantially similar investment objective and substantially similar investment strategies to the Gateway Fund. Information provided to the Boards regarding the Gateway Fund is also applicable to the Master Portfolio, as relevant.
At the Meeting, the Boards considered the factors and reached the conclusions described below relating to the selection of Funds Management and the Sub-Adviser and the approval of the Advisory Agreements. Prior to the Meeting, including at a Board meeting held in April 2020, the Trustees conferred extensively among themselves and with representatives of Funds Management about these matters. Also, the Boards have adopted a team-based approach, with each team consisting of a sub-set of Trustees, to assist the full Boards in the discharge of their duties in reviewing investment performance and other matters throughout the year. The Independent Trustees were assisted in their evaluation of the Advisory Agreements by independent legal counsel, from whom they received separate legal advice and with whom they met separately.
In providing information to the Boards, Funds Management and the Sub-Adviser were guided by a detailed set of requests for information submitted to them by independent legal counsel on behalf of the Independent Trustees at the start of the Boards’ annual contract renewal process earlier in 2020. In considering and approving the Advisory Agreements, the Trustees considered the information they believed relevant, including but not limited to the information discussed below. The Boards considered not only the specific information presented in connection with the Meeting, but also the knowledge gained over time through interaction with Funds Management and the Sub-Adviser about various topics. In this regard, the Boards reviewed reports of Funds Management at each of their quarterly meetings, which included, among other things, portfolio reviews and investment performance reports. In addition, the Boards and the teams mentioned above confer with portfolio managers at various times throughout the year. The Boards did not identify any particular information or consideration that was all-important or controlling, and each individual Trustee may have attributed different weights to various factors.
After its deliberations, the Funds Trust Board unanimously approved the continuation of the Gateway Fund Management Agreement for a one-year period. Additionally, after its deliberations, the Master Trust Board unanimously approved the continuation of the Master Portfolio Advisory Agreement and the Sub-Advisory Agreement, each for a one-year term. The Boards also determined that the compensation payable to Funds Management and the Sub-Adviser was reasonable. The Boards considered the approval of the Advisory Agreements for the Funds as part of their consideration of agreements for funds across the complex, but their approvals were made on a fund-by-fund basis. The following summarizes a number of important, but not necessarily all, factors considered by the Boards in support of their approvals.
Nature, extent and quality of services
The Boards received and considered various information regarding the nature, extent and quality of services provided to the Funds by Funds Management and the Sub-Adviser under the Advisory Agreements. This information included a description of the investment advisory services and Fund-level administrative services, as well as, among other things, a summary of the
Wells Fargo Small Company Value Fund | 47
Other information (unaudited)
background and experience of senior management of Wells Fargo Asset Management (“WFAM”), of which Funds Management and the Sub-Adviser are a part, and a summary of investments made in the business of WFAM. The Boards also received a description of Funds Management’s and the Sub-Adviser’s business continuity plans and of their approaches to data privacy and cybersecurity, and related testing. The Boards also received and reviewed information about Funds Management’s role as administrator of the Funds’ liquidity risk management program, Funds Management’s approach to risk management, and Funds Management’s intermediary and vendor oversight program. The Boards also considered the qualifications, background, tenure and responsibilities of each of the portfolio managers primarily responsible for the day-to-day portfolio management of the Funds.
The Boards evaluated the ability of Funds Management and the Sub-Adviser to attract and retain qualified investment professionals, including research, advisory and supervisory personnel. The Boards further considered the compliance programs and compliance records of Funds Management and the Sub-Adviser. In addition, the Boards took into account the full range of services provided to the Funds by Funds Management and its affiliates.
Fund investment performance and expenses
The Boards considered the investment performance results for each of the Funds over various time periods ended December 31, 2019. The Board also considered more current results for various time periods ended March 31, 2020. The Boards considered these results in comparison to the investment performance of funds in a universe that was determined by Broadridge Inc. (“Broadridge”) to be similar to the Gateway Fund (the “Universe”), and in comparison to the Gateway Fund’s benchmark index and to other comparative data. Broadridge is an independent provider of investment company data. The Boards received a description of the methodology used by Broadridge to select the mutual funds in the performance Universe. The Funds Trust Board noted that the investment performance of the Gateway Fund (Administrator Class) was higher than or in range of the average investment performance of its Universe for the five- and ten-year periods ended December 31, 2019, and lower than the average investment performance of its Universe for the one- and three-year periods ended December 31, 2019. The Funds Trust Board also noted that the investment performance of the Gateway Fund (Administrator Class) was in range of the average investment performance of its Universe for the ten-year period ended March 31, 2020, and lower than the average investment performance of its Universe for the one-, three- and five-year periods ended March 31, 2020. The Funds Trust Board also noted that the investment performance of the Gateway Fund was higher than or in range of its benchmark, the Russell 2000® Value Index, for all periods ended December 31, 2019. The Funds Trust Board also noted that the investment performance of the Gateway Fund was higher than or in range of its benchmark, the Russell 2000® Value Index, for all periods ended March 31, 2020.
The Master Trust Board took note of the investment performance of the Master Portfolio in the context of reviewing the investment performance of the Gateway Fund.
The Funds Trust Board received information concerning, and discussed factors contributing to, the underperformance of the Gateway Fund relative to the Universe for the periods identified above. The Funds Trust Board took note of the explanations for the relative underperformance during these periods, including with respect to investment decisions and market factors that affected the Gateway Fund’s investment performance.
The Funds Trust Board also received and considered information regarding the Gateway Fund’s net operating expense ratios, which include fees and expenses of the Master Portfolio, and their various components, including actual management fees assessed at the Gateway Fund and Master Portfolio levels, custodian and other non-management fees, and Rule 12b-1 and non-Rule 12b-1 shareholder service fees. The Funds Trust Board considered these ratios in comparison to the median ratios of funds in class-specific expense groups that were determined by Broadridge to be similar to the Gateway Fund (the “Groups”). The Funds Trust Board received a description of the methodology used by Broadridge to select the mutual funds in the expense Groups and an explanation of how funds comprising expense groups and their expense ratios may vary from year-to-year. Based on the Broadridge reports, the Funds Trust Board noted that the net operating expense ratios of the Gateway Fund were lower than the median net operating expense ratios of its expense Groups for each share class.
With respect to the Master Portfolio, the Master Trust Board reviewed the fee rates that are payable to Funds Management for investment advisory services (as discussed below), which are the only fees charged at the Master Portfolio level, relative to a corresponding expense Group.
The Boards took into account the Funds’ investment performance and expense information provided to them among the factors considered in deciding to re-approve the Advisory Agreements.
48 | Wells Fargo Small Company Value Fund
Other information (unaudited)
Investment management, advisory and sub-advisory fee rates
The Funds Trust Board noted that Funds Management receives no advisory fees from the Gateway Fund as long as the Gateway Fund continues to invest all (or substantially all) of its assets in a single master portfolio. If the Gateway Fund were to change its investment structure so that it began investing in two or more master portfolios (a fund-of-funds), Funds Management would be entitled to receive an annual fee of 0.25% of the Gateway Fund’s average daily net assets for providing investment advisory services to the Gateway Fund, including allocating the Gateway Fund’s assets to the Master Portfolio.
The Funds Trust Board reviewed and considered the contractual fee rates that are payable by the Gateway Fund to Funds Management under the Gateway Fund Management Agreement for management services (other than investment advisory services), as well as the contractual fee rates payable by the Gateway Fund to Funds Management for class-level administrative services under a Class-Level Administration Agreement, which include, among other things, class-level transfer agency and sub-transfer agency costs (collectively, the “Management Rates”).
The Master Trust Board reviewed and considered the contractual investment advisory fee rate that is payable by the Master Portfolio to Funds Management for investment advisory services under the Master Portfolio Advisory Agreement (the “Advisory Agreement Rate”). The Master Trust Board also reviewed and considered the contractual investment sub-advisory fee rate that is payable by Funds Management to the Sub-Adviser for investment sub-advisory services (the “Sub-Advisory Agreement Rate”).
Among other information reviewed by the Funds Trust Board was a comparison of the Gateway Fund’s Management Rate, which, for this purpose, includes the advisory fees paid at the Master Portfolio level, with the average contractual investment management fee rates of funds in the expense Groups at a common asset level as well as transfer agency costs of the funds in the expense Groups. The Funds Trust Board noted that the Management Rates of the Gateway Fund were lower than or in range of the sum of these average rates for the Gateway Fund’s expense Groups for all share classes.
The Master Trust Board reviewed a comparison of the Advisory Agreement Rate of the Master Portfolio with those of other funds in the Master Portfolio’s expense Group at a common asset level. The Master Trust Board noted that the Advisory Agreement Rate of the Master Portfolio was lower than the median rate for the Master Portfolio’s expense Group.
The Master Trust Board also received and considered information about the portions of the total management fees that were retained by Funds Management after payment of the fees to the Sub-Adviser for sub-advisory services. In assessing the reasonableness of these amounts, the Master Trust Board received and evaluated information about the nature and extent of responsibilities retained and risks assumed by Funds Management and not delegated to or assumed by the Sub-Adviser, and about Funds Management’s on-going oversight services. Given the affiliation between Funds Management and the Sub-Adviser, the Master Trust Board ascribed limited relevance to the allocation of fees between them.
The Boards also received and considered information about the nature and extent of services offered and fee rates charged by Funds Management and the Sub-Adviser to other types of clients with investment strategies similar to those of the Funds. In this regard, the Boards received information about the significantly greater scope of services, and compliance, reporting and other legal burdens and risks of managing proprietary mutual funds compared with those associated with managing assets of other types of clients, including third-party sub-advised fund clients and non-mutual fund clients such as institutional separate accounts.
Based on its consideration of the factors and information it deemed relevant, including those described here, the Funds Trust Board determined that the compensation payable to Funds Management under the Gateway Fund Management Agreement was reasonable, and the Master Trust Board determined that the compensation payable to Funds Management under the Master Portfolio Advisory Agreement and to the Sub-Adviser under the Sub-Advisory Agreement was reasonable.
Profitability
The Boards received and considered information concerning the profitability of Funds Management, as well as the profitability of both WFAM and Wells Fargo & Co. (“Wells Fargo”) from providing services to the fund family as a whole. The Boards noted that the Sub-Adviser’s profitability information with respect to providing services to the Master Portfolio and other funds in the family was subsumed in the WFAM and Wells Fargo profitability analysis.
Funds Management reported on the methodologies and estimates used in calculating profitability, including a description of the methodology used to allocate certain expenses. Among other things, the Boards noted that the levels of profitability reported on a fund-by-fund basis varied widely, depending on factors such as the size, type and age of fund.
Based on its review, the Boards did not deem the profits reported by Funds Management, WFAM or Wells Fargo from services provided to the Funds to be at a level that would prevent the Boards from approving the continuation of the Advisory Agreements.
Wells Fargo Small Company Value Fund | 49
Other information (unaudited)
Economies of scale
The Boards received and considered information about the potential for Funds Management to experience economies of scale in the provision of management services to the Funds, the difficulties of calculating economies of scale at an individual fund level, and the extent to which potential scale benefits are shared with shareholders. The Boards noted the existence of breakpoints in the Master Portfolio’s advisory fee structure and the Gateway Fund’s management fee structure, which operate generally to reduce the Funds’ expense ratios as the Funds grow in size, and the size of the Master Portfolio and the Gateway Fund, respectively, in relation to such breakpoints. The Boards considered that, in addition to advisory fee and management fee breakpoints, Funds Management shares potential economies of scale from its management business in a variety of ways, including through fee waiver and expense reimbursement arrangements, services that benefit shareholders, competitive management fee rates set at the outset without regard to breakpoints, and investments in the business intended to enhance services available to shareholders.
The Boards concluded that Funds Management’s arrangements with respect to each Fund, including contractual breakpoints, constituted a reasonable approach to sharing potential economies of scale with the Funds and their shareholders.
Other benefits to Funds Management and the Sub-Adviser
The Boards received and considered information regarding potential “fall-out” or ancillary benefits received by Funds Management and its affiliates, including the Sub-Adviser, as a result of their relationships with the Funds. Ancillary benefits could include, among others, benefits directly attributable to other relationships with the Funds and benefits potentially derived from an increase in Funds Management’s and the Sub-Adviser’s business as a result of their relationships with the Funds. The Boards noted that various affiliates of Funds Management may receive distribution-related fees, shareholder servicing payments and sub-transfer agency fees in respect of shares sold or held through them and services provided.
The Boards also reviewed information about soft dollar credits earned and utilized by the Sub-Adviser, fees earned by Funds Management and the Sub-Adviser from managing a private investment vehicle for the fund family’s securities lending collateral, and commissions earned by an affiliated broker from portfolio transactions.
Based on their consideration of the factors and information they deemed relevant, including those described here, the Boards did not find that any ancillary benefits received by Funds Management and its affiliates, including the Sub-Adviser, were unreasonable.
Conclusion
At the Meeting, after considering the above-described factors and based on its deliberations and its evaluation of the information described above, the Funds Trust Board unanimously approved the continuation of the Gateway Fund Management Agreement for a one-year period. Additionally, after considering the above-described factors and based on its deliberations and its evaluation of the information described above, the Master Trust Board unanimously approved the continuation of the Master Portfolio Advisory Agreement and the Sub-Advisory Agreement, each for a one-year term. The Boards also determined that the compensation payable to Funds Management and the Sub-Adviser was reasonable.
50 | Wells Fargo Small Company Value Fund
Other information (unaudited)
LIQUIDITY RISK MANAGEMENT PROGRAM
In accordance with Rule 22e-4 under the Investment Company Act of 1940, as amended (the “Liquidity Rule”), each of Wells Fargo Funds Trust and Wells Fargo Master Trust (each a “Trust”) has adopted and implemented a liquidity risk management program (the “Program”) on behalf of each of its non-money market series, including the Fund and the Portfolio, respectively, which is reasonably designed to assess and manage the Fund’s or the Portfolio’s liquidity risk. “Liquidity risk” is defined as the risk that the Fund or Portfolio is unable to meet redemption requests without significantly diluting remaining investors’ interests. Each Trust’s Board of Trustees (each a “Board”) previously approved the designation of Wells Fargo Funds Management, LLC (“Funds Management”), the Fund’s investment manager and the Portfolio’s investment adviser, as the administrator of the Program, and Funds Management has established a Liquidity Risk Management Council composed of personnel from multiple departments within Funds Management and its affiliates to assist Funds Management in the implementation and on-going administration of the Program.
The Program is comprised of various components designed to support the assessment and/or management of liquidity risk, including: (1) the periodic assessment (no less frequently than annually) of certain factors that influence the Fund’s and the Portfolio’s liquidity risk; (2) the periodic classification (no less frequently than monthly) of the Fund’s and the Portfolio’s investments into one of four liquidity categories that reflect an estimate of their liquidity under current market conditions; (3) a 15% limit on the acquisition of “illiquid investments” (as defined under the Liquidity Rule); (4) to the extent the Fund or the Portfolio does not invest primarily in “highly liquid investments” (as defined under the Liquidity Rule), the determination of a minimum percentage of the Fund’s or the Portfolio’s assets that generally will be invested in highly liquid investments (an
“HLIM”); (5) if the Fund or the Portfolio has established an HLIM, the periodic review (no less frequently than annually) of the HLIM and the adoption of policies and procedures for responding to a shortfall of the Fund’s or the Portfolio’s “highly liquid investments” below its HLIM; and (6) periodic reporting to the respective Board.
At a meeting of each Board held on May 26 and 28, 2020, the Board received a written report (the “Report”) from Funds Management that addressed the operation of the Program and assessed its adequacy and effectiveness of implementation. The Report covered the initial period from December 1, 2018 through December 31, 2019 (the “Reporting Period”). No significant liquidity events impacting the Fund or the Portfolio were noted in the Report. There were no material changes to the Program during the Reporting Period. The Report concluded that the Program is operating effectively to assess and manage the Fund’s and the Portfolio’s liquidity risk, and that the Program has been and continues to be adequately and effectively implemented to monitor and, as applicable, respond to the Fund’s and the Portfolio’s liquidity developments.
There can be no assurance that the Program will achieve its objectives under all circumstances in the future. Please refer to the Fund’s prospectus for more information regarding the Fund’s exposure to liquidity risk and other risks to which an investment in the Fund may be subject.
Wells Fargo Small Company Value Fund | 51
Appendix I (unaudited)
Effective on or about May 1, 2020, if you purchase Fund shares through a Janney Montgomery Scott LLC (“Janney”) brokerage account, you will be eligible for the following load waivers (front-end sales charge waivers and contingent deferred sales charge (“CDSC”), or back-end sales charge, waivers) and discounts, which may differ from those disclosed elsewhere in the Fund’s Prospectus or SAI.
|
| Front-end sales charge* waivers on Class A shares available at Janney |
|
| Shares purchased through reinvestment of capital gains distributions and dividend reinvestment when purchasing shares of the same fund (but not any other fund within the fund family). |
|
| Shares purchased by employees and registered representatives of Janney or its affiliates and their family members as designated by Janney. |
|
| Shares purchased from the proceeds of redemptions within the same fund family, provided (1) the repurchase occurs within ninety (90) days following the redemption, (2) the redemption and purchase occur in the same account, and (3) redeemed shares were subject to a front-end or deferred sales load (i.e., right of reinstatement). |
|
| Employer-sponsored retirement plans (e.g., 401(k) plans, 457 plans, employer-sponsored 403(b) plans, profit sharing and money purchase pension plans and defined benefit plans). For purposes of this provision, employer-sponsored retirement plans do not include SEP IRAs, Simple IRAs, SAR-SEPs or Keogh plans. |
|
| Shares acquired through a right of reinstatement. |
|
| Class C shares that are no longer subject to a contingent deferred sales charge and are converted to Class A shares of the same fund pursuant to Janney’s policies and procedures. |
| CDSC waivers on Class A and Class C shares available at Janney |
|
| Shares sold upon the death or disability of the shareholder. |
|
| Shares sold as part of a systematic withdrawal plan as described in the Fund’s Prospectus. |
|
| Shares purchased in connection with a return of excess contributions from an IRA account. |
|
| Shares sold as part of a required minimum distribution for IRA and retirement accounts if the redemption is taken in or after the year the shareholder reaches qualified age based on applicable IRS regulations. |
|
| Shares sold to pay Janney fees but only if the transaction is initiated by Janney. |
|
| Shares acquired through a right of reinstatement. |
|
| Shares exchanged into the same share class of a different fund. |
| Front-end sales charge* discounts available at Janney; breakpoints, rights of accumulation and/or letters of intent |
|
| Breakpoints as described in the Fund’s Prospectus. |
|
| Rights of accumulation (“ROA”), which entitle shareholders to breakpoint discounts, will be automatically calculated based on the aggregated holding of fund family assets held by accounts within the purchaser’s household at Janney. Eligible fund family assets not held at Janney may be included in the ROA calculation only if the shareholder notifies his or her financial advisor about such assets. |
|
Letters of intent which allow for breakpoint discounts based on anticipated purchases within a fund family, over a 13-month time period. Eligible fund family assets not held at Janney Montgomery Scott may be included in the calculation of letters of intent only if the shareholder notifies his or her financial advisor about such assets. |
| * | Also referred to as an “initial sales charge.” |
52 | Wells Fargo Small Company Value Fund
Appendix II (unaudited)
Effective on or after May 1, 2020, clients of Edward Jones (also referred to as “shareholders”) purchasing Fund shares on the Edward Jones commission and fee-based platforms are eligible only for the following sales charge discounts (also referred to as “breakpoints”) and waivers, which can differ from breakpoints and waivers described elsewhere in the Fund’s Prospectus or SAI or through another broker-dealer. In all instances, it is the shareholder’s responsibility to inform Edward Jones at the time of purchase of any relationship, holdings of Wells Fargo Funds or other facts qualifying the purchaser for breakpoints or waivers. Edward Jones can ask for documentation of such circumstance.
|
| Breakpoints available at Edward Jones |
|
| Rights of Accumulation (ROA) |
|
The applicable sales charge on a purchase of Class A shares is determined by taking into account all share classes (except any money market funds and retirement plan share classes) of Wells Fargo Funds held by the shareholder or in an account grouped by Edward Jones with other accounts for the purpose of providing certain pricing considerations (“pricing groups”). This includes all share classes held on the Edward Jones platform and/or held on another platform. The inclusion of eligible fund family assets in the rights of accumulation calculation is dependent on the shareholder notifying his or her financial advisor of such assets at the time of calculation. |
|
ROA is determined by calculating the higher of cost or market value (current shares x NAV). |
|
| Letter of Intent (LOI) |
|
Through a LOI, shareholders can receive the sales charge and breakpoint discounts for purchases shareholders intend to makeover a 13-month period from the date Edward Jones receives the LOI. The LOI is determined by calculating the higher of cost or market value of qualifying holdings at LOI initiation in combination with the value that the shareholder intends to buy over a 13-month period to calculate the front-end sales charge and any breakpoint discounts. Each purchase the shareholder makes during that 13-month period will receive the sales charge and breakpoint discount that applies to the total amount. The inclusion of eligible fund family assets in the LOI calculation is dependent on the shareholder notifying his or her financial advisor of such assets at the time of calculation. Purchases made before the LOI is received by Edward Jones are not covered under the LOI and will not reduce the sales charge previously paid. Sales charges will be adjusted if LOI is not met. |
| Sales charges are waived for the following shareholders and in the following situations at Edward Jones: |
● Associates of Edward Jones and its affiliates and their family members who are in the same pricing group (as determined by Edward Jones under its policies and procedures) as the associate. This waiver will continue for the remainder of the associate’s life if the associate retires from Edward Jones in good-standing. |
● Shares purchased in an Edward Jones fee-based program. |
● Shares purchased through reinvestment of capital gains distributions and dividend reinvestment. |
● Shares purchased from the proceeds of redeemed shares of the same fund family so long as the following conditions are met: 1)the proceeds are from the sale of shares within 60 days of the purchase, and 2) the sale and purchase are made in the same share class and the same account or the purchase is made in an individual retirement account with proceeds from liquidations in anon-retirement account. |
● Shares exchanged into Class A shares from another share class so long as the exchange is into the same fund and was initiated at the discretion of Edward Jones. Edward Jones is responsible for any remaining CDSC due to the fund company, if applicable. Any future purchases are subject to the applicable sales charge as disclosed in the prospectus. |
● Exchanges from Class C shares to Class A shares of the same fund, generally, in the 84th month following the anniversary of the purchase date or earlier at the discretion of Edward Jones. |
If the shareholder purchases shares that are subject to a CDSC and those shares are redeemed before the CDSC is expired, the shareholder
is responsible to pay the CDSC except in the following conditions available at Edward Jones: |
● The death or disability of the shareholder. |
● Systematic withdrawals with up to 10% per year of the account value. |
● Return of excess contributions from an Individual Retirement Account (IRA). |
● Shares sold as part of a required minimum distribution for IRA and retirement accounts if the redemption is taken in or after the year the shareholder reaches qualified age based on applicable IRS regulation. |
● Shares sold to pay Edward Jones fees or costs in such cases where the transaction is initiated by Edward Jones. |
● Shares exchanged in an Edward Jones fee-based program. |
● Shares acquired through NAV reinstatement. |
Wells Fargo Small Company Value Fund | 53
Appendix II (unaudited)
|
| Other Important Information for accounts at Edward Jones: |
| Minimum Purchase Amounts |
● $250 initial purchase minimum |
● $50 subsequent purchase minimum |
|
| Minimum Balances |
| Edward Jones has the right to redeem at its discretion fund holdings with a balance of $250 or less. The following are examples of accounts that are not included in this policy: |
● A fee-based account held on an Edward Jones platform |
● A 529 account held on an Edward Jones platform |
● An account with an active systematic investment plan or letter of intent (LOI) |
|
| Changing Share Classes |
| At any time it deems necessary, Edward Jones has the authority to exchange at NAV a shareholder’s holdings in a fund to Class A shares. |
54 | Wells Fargo Small Company Value Fund
Appendix III
Effective June 1, 2020, shareholders purchasing Fund shares through an Oppenheimer & Co. Inc. (“Oppenheimer”) platform or account are eligible only for the following load waivers (front-end sales charge waivers and contingent deferred or back-end, sales charge waivers) and discounts, which may differ from those disclosed in the Fund’s Prospectus or SAI.
|
| Front-end Sales Load Waivers on Class A Shares available at Oppenheimer |
|
| Employer-sponsored retirement, deferred compensation and employee benefit plans (including health savings accounts) and trusts used to fund those plans, provided that the shares are not held in a commission-based brokerage account and shares are held for the benefit of the plan. |
|
| Shares purchased by or through a 529 Plan. |
|
| Shares purchased through an Oppenheimer affiliated investment advisory program. |
|
| Shares purchased through reinvestment of capital gains distributions and dividend reinvestment when purchasing shares of the same fund (but not any other fund within the fund family). |
|
| Shares purchased from the proceeds of redemptions within the same fund family, provided (1) the repurchase occurs within 90 days following the redemption, (2) the redemption and purchase occur in the same account, and (3) redeemed shares were subject to a front-end or deferred sales load (known as Rights of Restatement). |
|
| A shareholder in the Fund’s Class C shares will have their shares exchanged at net asset value to Class A shares (or the appropriate share class) of the Fund if the shares are no longer subject to a CDSC and the exchange is in line with the policies and procedures of Oppenheimer. |
|
| Employees and registered representatives of Oppenheimer or its affiliates and their family members. |
|
| Directors or Trustees of the Fund, and employees of the Fund’s investment adviser or any of its affiliates, as described in the Prospectus. |
| CDSC Waivers on A and C Shares available at Oppenheimer |
|
| Death or disability of the shareholder. |
|
| Shares sold as part of a systematic withdrawal plan as described in the Prospectus. |
|
| Return of excess contributions from an IRA Account. |
|
| Shares sold as part of a required minimum distribution for IRA and retirement accounts due to the shareholder reaching the qualified age based on applicable IRS regulations as described in the Prospectus. |
|
| Shares sold to pay Oppenheimer fees but only if the transaction is initiated by Oppenheimer. |
|
| Shares acquired through a right of reinstatement. |
| Front-end load Discounts Available at Oppenheimer: Breakpoints, Rights of Accumulation & Letters of Intent |
|
| Breakpoints as described in the Prospectus. |
|
| Rights of Accumulation (ROA), which entitle shareholders to breakpoint discounts, will be automatically calculated based on the aggregated holding of fund family assets held by accounts within the purchaser’s household at Oppenheimer. Eligible fund family assets not held at Oppenheimer may be included in the ROA calculation only if the shareholder notifies his or her financial advisor about such assets. |
Wells Fargo Small Company Value Fund | 55
Appendix IV (unaudited)
Effective June 15, 2020, shareholders purchasing fund shares through a Robert W. Baird & Co. (“Baird”) platform or account will only be eligible for the following sales charge waivers (front-end sales charge waivers and CDSC waivers) and discounts, which may differ from those disclosed elsewhere in the Fund’s Prospectus or the SAI.
|
| Front-end Sales Load Waivers on Class A Shares available at Baird |
|
| Shares purchased through reinvestment of capital gains distributions and dividend reinvestment when purchasing share of the same fund. |
|
| Share purchase by employees and registers representatives of Baird or its affiliate and their family members as designated by Baird. |
|
| Shares purchase from the proceeds of redemptions within the same fund family, provided (1) the repurchase occurs within 90 days following the redemption, (2) the redemption and purchase occur in the same accounts, and (3) redeemed shares were subject to a front-end or deferred sales charge (known as rights of reinstatement). |
|
| A shareholder in the Funds Investor C Shares will have their share exchanged at net asset value to Investor A shares of the fund if the shares are no longer subject to CDSC and the exchange is in line with the policies and procedures of Baird. |
|
| Employer-sponsored retirement plans or charitable accounts in a transactional brokerage account at Baird, including 401(k)plans, 457 plans, employer-sponsored 403(b) plans, profit sharing and money purchase pension plans and defined benefit plans. For purposes of this provision, employer-sponsored retirement plans do not include SEP IRAs, Simple IRAs or SAR-SEPs. |
| CDSC Waivers on A and C Shares available at Baird |
|
| Shares sold due to death or disability of the shareholder. |
|
| Shares sold as part of a systematic withdrawal plan as described in the Fund’s Prospectus. |
|
| Shares bought due to returns of excess contributions from an IRA Account. |
|
| Shares sold as part of a required minimum distribution for IRA and retirement accounts due to the shareholder reaching age 72as described in the Fund’s Prospectus. |
|
| Shares sold to pay Baird fees but only if the transaction is initiated by Baird. |
|
| Shares acquired through a right of reinstatement. |
| Front-end load Discounts Available at Baird: Breakpoint and/or Rights of Accumulation |
|
| Breakpoints as described in the Prospectus. |
|
| Rights of accumulations which entitles shareholders to breakpoint discounts will be automatically calculated based on the aggregated holding of fund family assets held by accounts within the purchaser’s household at Baird. Eligible fund family assets not held at Baird may be included in the rights of accumulations calculation only if the shareholder notifies his or her financial advisor about such assets. |
|
| Letters of Intent (LOI) allow for breakpoint discounts based on anticipated purchases within a fund family through Baird, over a13-month period of time. |
56 | Wells Fargo Small Company Value Fund

For more information
More information about Wells Fargo Funds is available free upon request. To obtain literature, please write, visit the Fund’s website, or call:
Wells Fargo Funds
P.O. Box 219967
Kansas City, MO 64121-9967
Website: wfam.com
Individual investors: 1-800-222-8222
Retail investment professionals: 1-888-877-9275
Institutional investment professionals: 1-866-765-0778

This report and the financial statements contained herein are submitted for the general information of the shareholders of the Fund. If this report is used for promotional purposes, distribution of the report must be accompanied or preceded by a current prospectus. Before investing, please consider the investment objectives, risks, charges, and expenses of the investment. For a current prospectus and, if available, a summary prospectus, containing this information, call 1-800-222-8222 or visit the Fund’s website at wfam.com. Read the prospectus carefully before you invest or send money.
Wells Fargo Asset Management (WFAM) is the trade name for certain investment advisory/management firms owned by Wells Fargo & Company. These firms include but are not limited to Wells Capital Management Incorporated and Wells Fargo Funds Management, LLC. Certain products managed by WFAM entities are distributed by Wells Fargo Funds Distributor, LLC (a broker-dealer and Member FINRA).
This material is for general informational and educational purposes only and is NOT intended to provide investment advice or a recommendation of any kind—including a recommendation for any specific investment, strategy, or plan.
INVESTMENT PRODUCTS: NOT FDIC INSURED ◾ NO BANK GUARANTEE ◾ MAY LOSE VALUE
© 2020 Wells Fargo & Company. All rights reserved.
PAR-0620-00323 07-20
A286/AR286 05-20
Annual Report
May 31, 2020
Wells Fargo
Large Company Value Portfolio
|
|
|
Reduce clutter. Save trees. |
Sign up for electronic delivery of prospectuses and
shareholder reports at wellsfargo.com/
advantagedelivery |
INVESTMENT PRODUCTS: NOT FDIC INSURED ◾ NO BANK GUARANTEE ◾ MAY LOSE VALUE
Wells Fargo Large Company Value Portfolio | 1
Fund information (unaudited)
Investment objective
The Portfolio seeks long-term capital appreciation.
Manager
Wells Fargo Funds Management, LLC
Subadviser
Wells Capital Management Incorporated
Portfolio managers
Dennis Bein, CFA®‡
Ryan Brown, CFA®‡
Harindra de Silva, Ph.D., CFA®‡
| | | | |
| |
| Ten largest holdings (%) as of May 31, 20201 | | | |
| | |
Berkshire Hathaway Incorporated Class B | | | 3.64 | |
| | |
JPMorgan Chase & Company | | | 3.62 | |
| | |
Merck & Company Incorporated | | | 3.01 | |
| | |
Pfizer Incorporated | | | 2.82 | |
| | |
Linde plc | | | 2.66 | |
| | |
Charter Communications Incorporated Class A | | | 2.40 | |
| | |
Verizon Communications Incorporated | | | 2.35 | |
| | |
BlackRock Incorporated | | | 2.24 | |
| | |
Intel Corporation | | | 2.24 | |
| | |
Mondelez International Incorporated Class A | | | 2.21 | |
|
|
| Sector allocation as of May 31, 20202 |
|
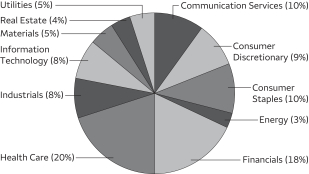
|
| ‡ | CFA® and Chartered Financial Analyst® are trademarks owned by CFA Institute. |
| 1 | The ten largest holdings, excluding cash, cash equivalents and any money market funds, are calculated based on the value of the investments divided by the total net assets of the Portfolio. Holdings are subject to change and may have changed since the date specified. |
| 2 | Amounts are calculated based on the total long-term investments of the Portfolio. These amounts are subject to change and may have changed since the date specified. |
2 | Wells Fargo Large Company Value Portfolio
Portfolio of investments—May 31, 2020
| | | | | | | | | | | | | | | | |
| | | | | | | | | Shares | | | Value | |
| Common Stocks: 97.45% | |
|
Communication Services: 9.71% | |
|
| Diversified Telecommunication Services: 2.35% | |
Verizon Communications Incorporated | | | | | | | | | | | 91,075 | | | $ | 5,225,884 | |
| | | | | | | | | | | | | | | | |
|
| Entertainment: 1.01% | |
Activision Blizzard Incorporated | | | | | | | | | | | 391 | | | | 28,144 | |
Spotify Technology SA † | | | | | | | | | | | 5,848 | | | | 1,058,079 | |
The Walt Disney Company | | | | | | | | | | | 9,981 | | | | 1,170,771 | |
| | | | |
| | | | | | | | | | | | | | | 2,256,994 | |
| | | | | | | | | | | | | | | | |
|
| Interactive Media & Services: 1.21% | |
Facebook Incorporated Class A † | | | | | | | | | | | 10,518 | | | | 2,367,497 | |
Zillow Group Incorporated Class A † | | | | | | | | | | | 5,542 | | | | 321,214 | |
| | | | |
| | | | | | | | | | | | | | | 2,688,711 | |
| | | | | | | | | | | | | | | | |
|
| Media: 3.49% | |
Charter Communications Incorporated Class A † | | | | | | | | | | | 9,828 | | | | 5,346,432 | |
Discovery Communications Incorporated Class A † | | | | | | | | | | | 16,949 | | | | 368,641 | |
News Corporation Class B | | | | | | | | | | | 40,797 | | | | 500,171 | |
ViacomCBS Incorporated Class B | | | | | | | | | | | 74,623 | | | | 1,547,681 | |
| | | | |
| | | | | | | | | | | | | | | 7,762,925 | |
| | | | | | | | | | | | | | | | |
|
| Wireless Telecommunication Services: 1.65% | |
T-Mobile US Incorporated † | | | | | | | | | | | 36,755 | | | | 3,676,970 | |
| | | | | | | | | | | | | | | | |
|
| Consumer Discretionary: 8.59% | |
|
| Auto Components: 1.04% | |
Adient plc † | | | | | | | | | | | 135,531 | | | | 2,305,382 | |
| | | | | | | | | | | | | | | | |
|
| Hotels, Restaurants & Leisure: 0.86% | |
Texas Roadhouse Incorporated | | | | | | | | | | | 36,952 | | | | 1,915,961 | |
| | | | | | | | | | | | | | | | |
|
| Household Durables: 1.46% | |
Garmin Limited | | | | | | | | | | | 19,456 | | | | 1,754,348 | |
TopBuild Corporation † | | | | | | | | | | | 12,998 | | | | 1,490,741 | |
| | | | |
| | | | | | | | | | | | | | | 3,245,089 | |
| | | | | | | | | | | | | | | | |
|
| Internet & Direct Marketing Retail: 1.47% | |
Amazon.com Incorporated † | | | | | | | | | | | 1,342 | | | | 3,277,661 | |
| | | | | | | | | | | | | | | | |
|
| Specialty Retail: 1.30% | |
Floor & Decor Holdings Incorporated Class A † | | | | | | | | | | | 49,758 | | | | 2,587,416 | |
Lowe’s Companies Incorporated | | | | | | | | | | | 2,252 | | | | 293,548 | |
| | | | |
| | | | | | | | | | | | | | | 2,880,964 | |
| | | | | | | | | | | | | | | | |
|
| Textiles, Apparel & Luxury Goods: 2.46% | |
lululemon athletica Incorporated † | | | | | | | | | | | 6,614 | | | | 1,984,828 | |
Nike Incorporated Class B | | | | | | | | | | | 35,394 | | | | 3,489,141 | |
| | | | |
| | | | | | | | | | | | | | | 5,473,969 | |
| | | | | | | | | | | | | | | | |
|
Consumer Staples: 9.41% | |
|
| Beverages: 1.97% | |
PepsiCo Incorporated | | | | | | | | | | | 33,341 | | | | 4,386,009 | |
| | | | | | | | | | | | | | | | |
The accompanying notes are an integral part of these financial statements.
Wells Fargo Large Company Value Portfolio | 3
Portfolio of investments—May 31, 2020
| | | | | | | | | | | | | | | | |
| | | | | | | | | Shares | | | Value | |
| Food & Staples Retailing: 3.09% | |
Costco Wholesale Corporation | | | | | | | | | | | 10,319 | | | $ | 3,183,102 | |
Walmart Incorporated | | | | | | | | | | | 29,706 | | | | 3,685,326 | |
| | | | |
| | | | | | | | | | | | | | | 6,868,428 | |
| | | | | | | | | | | | | | | | |
|
| Food Products: 3.52% | |
Darling Ingredients Incorporated † | | | | | | | | | | | 87,939 | | | | 2,049,858 | |
Lancaster Colony Corporation | | | | | | | | | | | 5,616 | | | | 861,831 | |
Mondelez International Incorporated Class A | | | | | | | | | | | 94,508 | | | | 4,925,757 | |
| | | | |
| | | | | | | | | | | | | | | 7,837,446 | |
| | | | | | | | | | | | | | | | |
|
| Household Products: 0.83% | |
The Procter & Gamble Company | | | | | | | | | | | 15,873 | | | | 1,839,998 | |
| | | | | | | | | | | | | | | | |
|
Energy: 3.30% | |
|
| Energy Equipment & Services: 0.11% | |
Baker Hughes Incorporated | | | | | | | | | | | 14,980 | | | | 247,320 | |
| | | | | | | | | | | | | | | | |
|
| Oil, Gas & Consumable Fuels: 3.19% | |
Cabot Oil & Gas Corporation | | | | | | | | | | | 82,404 | | | | 1,634,895 | |
Chevron Corporation | | | | | | | | | | | 25,821 | | | | 2,367,786 | |
Kinder Morgan Incorporated | | | | | | | | | | | 33,659 | | | | 531,812 | |
ONEOK Incorporated | | | | | | | | | | | 69,659 | | | | 2,555,789 | |
| | | | |
| | | | | | | | | | | | | | | 7,090,282 | |
| | | | | | | | | | | | | | | | |
|
Financials: 17.07% | |
|
| Banks: 5.58% | |
Bank of America Corporation | | | | | | | | | | | 161,567 | | | | 3,896,996 | |
First Financial Bankshares Incorporated | | | | | | | | | | | 15,081 | | | | 462,082 | |
JPMorgan Chase & Company | | | | | | | | | | | 82,822 | | | | 8,059,409 | |
| | | | |
| | | | | | | | | | | | | | | 12,418,487 | |
| | | | | | | | | | | | | | | | |
|
| Capital Markets: 3.75% | |
BlackRock Incorporated | | | | | | | | | | | 9,427 | | | | 4,983,489 | |
Morgan Stanley | | | | | | | | | | | 16,498 | | | | 729,212 | |
The Goldman Sachs Group Incorporated | | | | | | | | | | | 13,376 | | | | 2,628,250 | |
| | | | |
| | | | | | | | | | | | | | | 8,340,951 | |
| | | | | | | | | | | | | | | | |
|
| Diversified Financial Services: 3.64% | |
Berkshire Hathaway Incorporated Class B † | | | | | | | | | | | 43,600 | | | | 8,091,287 | |
| | | | | | | | | | | | | | | | |
|
| Insurance: 1.72% | |
Assured Guaranty Limited | | | | | | | | | | | 60,136 | | | | 1,559,326 | |
Globe Life Incorporated | | | | | | | | | | | 7,250 | | | | 558,395 | |
White Mountains Insurance Group Limited | | | | | | | | | | | 1,864 | | | | 1,706,604 | |
| | | | |
| | | | | | | | | | | | | | | 3,824,325 | |
| | | | | | | | | | | | | | | | |
|
| Thrifts & Mortgage Finance: 2.38% | |
Essent Group Limited | | | | | | | | | | | 111,756 | | | | 3,693,536 | |
MGIC Investment Corporation | | | | | | | | | | | 196,609 | | | | 1,614,160 | |
| | | | |
| | | | | | | | | | | | | | | 5,307,696 | |
| | | | | | | | | | | | | | | | |
The accompanying notes are an integral part of these financial statements.
4 | Wells Fargo Large Company Value Portfolio
Portfolio of investments—May 31, 2020
| | | | | | | | | | | | | | | | |
| | | | | | | | | Shares | | | Value | |
| Health Care: 19.74% | |
|
| Biotechnology: 2.39% | |
Immunomedics Incorporated † | | | | | | | | | | | 41,798 | | | $ | 1,403,995 | |
Vertex Pharmaceuticals Incorporated † | | | | | | | | | | | 13,573 | | | | 3,908,481 | |
| | | | |
| | | | | | | | | | | | | | | 5,312,476 | |
| | | | | | | | | | | | | | | | |
|
| Health Care Equipment & Supplies: 1.99% | |
Baxter International Incorporated | | | | | | | | | | | 35,676 | | | | 3,211,197 | |
Medtronic plc | | | | | | | | | | | 12,309 | | | | 1,213,421 | |
| | | | |
| | | | | | | | | | | | | | | 4,424,618 | |
| | | | | | | | | | | | | | | | |
|
| Health Care Providers & Services: 3.40% | |
Cigna Corporation | | | | | | | | | | | 14,945 | | | | 2,948,947 | |
Humana Incorporated | | | | | | | | | | | 3,694 | | | | 1,516,941 | |
The Ensign Group Incorporated | | | | | | | | | | | 70,744 | | | | 3,092,928 | |
| | | | |
| | | | | | | | | | | | | | | 7,558,816 | |
| | | | | | | | | | | | | | | | |
|
| Health Care Technology: 1.55% | |
Cerner Corporation | | | | | | | | | | | 47,216 | | | | 3,442,046 | |
| | | | | | | | | | | | | | | | |
|
| Life Sciences Tools & Services: 2.65% | |
Charles River Laboratories International Incorporated † | | | | | | | | | | | 13,097 | | | | 2,353,007 | |
IQVIA Holdings Incorporated † | | | | | | | | | | | 23,772 | | | | 3,554,389 | |
| | | | |
| | | | | | | | | | | | | | | 5,907,396 | |
| | | | | | | | | | | | | | | | |
|
| Pharmaceuticals: 7.76% | |
Johnson & Johnson | | | | | | | | | | | 28,934 | | | | 4,303,933 | |
Merck & Company Incorporated | | | | | | | | | | | 82,938 | | | | 6,694,755 | |
Pfizer Incorporated | | | | | | | | | | | 164,215 | | | | 6,271,371 | |
| | | | |
| | | | | | | | | | | | | | | 17,270,059 | |
| | | | | | | | | | | | | | | | |
|
| Industrials: 8.23% | |
|
| Building Products: 0.05% | |
Carrier Global Corporation † | | | | | | | | | | | 5,770 | | | | 118,112 | |
| | | | | | | | | | | | | | | | |
|
| Commercial Services & Supplies: 0.90% | |
Republic Services Incorporated | | | | | | | | | | | 23,408 | | | | 2,000,448 | |
| | | | | | | | | | | | | | | | |
|
| Machinery: 0.34% | |
Evoqua Water Technologies Company † | | | | | | | | | | | 32,193 | | | | 605,550 | |
Otis Worldwide Corporation | | | | | | | | | | | 2,885 | | | | 151,895 | |
| | | | |
| | | | | | | | | | | | | | | 757,445 | |
| | | | | | | | | | | | | | | | |
|
| Professional Services: 2.91% | |
IHS Markit Limited | | | | | | | | | | | 57,171 | | | | 3,971,098 | |
Robert Half International Incorporated | | | | | | | | | | | 49,365 | | | | 2,504,780 | |
| | | | |
| | | | | | | | | | | | | | | 6,475,878 | |
| | | | | | | | | | | | | | | | |
|
| Road & Rail: 3.14% | |
CSX Corporation | | | | | | | | | | | 56,063 | | | | 4,012,990 | |
Old Dominion Freight Line Incorporated | | | | | | | | | | | 17,355 | | | | 2,969,267 | |
| | | | |
| | | | | | | | | | | | | | | 6,982,257 | |
| | | | | | | | | | | | | | | | |
The accompanying notes are an integral part of these financial statements.
Wells Fargo Large Company Value Portfolio | 5
Portfolio of investments—May 31, 2020
| | | | | | | | | | | | | | | | |
| | | | | | | | | Shares | | | Value | |
| Transportation Infrastructure: 0.89% | |
Macquarie Infrastructure Company LLC | | | | | | | | | | | 69,339 | | | $ | 1,968,534 | |
| | | | | | | | | | | | | | | | |
|
Information Technology: 7.49% | |
|
| IT Services: 1.02% | |
International Business Machines Corporation | | | | | | | | | | | 18,161 | | | | 2,268,309 | |
| | | | | | | | | | | | | | | | |
|
| Semiconductors & Semiconductor Equipment: 4.17% | |
Advanced Micro Devices Incorporated † | | | | | | | | | | | 42,339 | | | | 2,277,838 | |
Intel Corporation | | | | | | | | | | | 79,168 | | | | 4,982,042 | |
NVIDIA Corporation | | | | | | | | | | | 5,665 | | | | 2,011,188 | |
| | | | |
| | | | | | | | | | | | | | | 9,271,068 | |
| | | | | | | | | | | | | | | | |
|
| Software: 1.90% | |
Intuit Incorporated | | | | | | | | | | | 14,602 | | | | 4,239,253 | |
| | | | | | | | | | | | | | | | |
|
| Technology Hardware, Storage & Peripherals: 0.40% | |
Apple Incorporated | | | | | | | | | | | 2,778 | | | | 883,237 | |
| | | | | | | | | | | | | | | | |
|
Materials: 4.69% | |
|
| Chemicals: 4.14% | |
Corteva Incorporated | | | | | | | | | | | 120,549 | | | | 3,292,193 | |
Linde plc | | | | | | | | | | | 29,267 | | | | 5,921,885 | |
| | | | |
| | | | | | | | | | | | | | | 9,214,078 | |
| | | | | | | | | | | | | | | | |
|
| Metals & Mining: 0.55% | |
Freeport-McMoRan Incorporated | | | | | | | | | | | 133,773 | | | | 1,213,321 | |
| | | | | | | | | | | | | | | | |
|
Real Estate: 3.91% | |
|
| Equity REITs: 2.16% | |
Invitation Homes Incorporated | | | | | | | | | | | 16,048 | | | | 422,062 | |
Iron Mountain Incorporated | | | | | | | | | | | 80,447 | | | | 2,072,315 | |
Prologis Incorporated | | | | | | | | | | | 1,659 | | | | 151,799 | |
PS Business Parks Incorporated | | | | | | | | | | | 4,621 | | | | 617,550 | |
The Geo Group Incorporated | | | | | | | | | | | 129,916 | | | | 1,556,394 | |
| | | | |
| | | | | | | | | | | | | | | 4,820,120 | |
| | | | | | | | | | | | | | | | |
|
| Real Estate Management & Development: 1.75% | |
CBRE Group Incorporated Class A † | | | | | | | | | | | 88,448 | | | | 3,889,943 | |
| | | | | | | | | | | | | | | | |
|
Utilities: 5.31% | |
|
| Electric Utilities: 2.14% | |
Duke Energy Corporation | | | | | | | | | | | 55,604 | | | | 4,761,371 | |
| | | | | | | | | | | | | | | | |
|
| Gas Utilities: 0.86% | |
UGI Corporation | | | | | | | | | | | 60,154 | | | | 1,915,303 | |
| | | | | | | | | | | | | | | | |
|
| Independent Power & Renewable Electricity Producers: 1.44% | |
AES Corporation | | | | | | | | | | | 255,748 | | | | 3,194,293 | |
| | | | | | | | | | | | | | | | |
|
| Multi-Utilities: 0.87% | |
MDU Resources Group Incorporated | | | | | | | | 88,981 | | | | 1,936,227 | |
| | | | | | | | | | | | | | | | |
| |
Total Common Stocks (Cost $192,189,229) | | | | 216,787,347 | |
| | | | | |
The accompanying notes are an integral part of these financial statements.
6 | Wells Fargo Large Company Value Portfolio
Portfolio of investments—May 31, 2020
| | | | | | | | | | | | | | | | |
| | | Yield | | | | | | Shares | | | Value | |
| Short-Term Investments: 1.60% | |
|
| Investment Companies: 1.60% | |
Wells Fargo Government Money Market Fund Select Class (l)(u) | | | 0.12 | % | | | | | | | 3,557,730 | | | $ | 3,557,730 | |
| | | | | | | | | | | | | | | | |
| |
Total Short-Term Investments (Cost $3,557,730) | | | | 3,557,730 | |
| | | | | |
| | | | | | | | |
| Total investments in securities (Cost $195,746,959) | | | 99.05 | % | | | 220,345,077 | |
| | |
Other assets and liabilities, net | | | 0.95 | | | | 2,103,505 | |
| | | | | | | | |
| Total net assets | | | 100.00 | % | | $ | 222,448,582 | |
| | | | | | | | |
| † | Non-income-earning security |
| (l) | The issuer of the security is an affiliated person of the Portfolio as defined in the Investment Company Act of 1940. |
| (u) | The rate represents the 7-day annualized yield at period end. |
Abbreviations:
| REIT | Real estate investment trust |
Futures Contracts
| | | | | | | | | | | | | | | | | | | | | | | | |
| Description | | Number of
contracts | | | Expiration
date | | | Notional
cost | | | Notional
value | | | Unrealized
gains | | | Unrealized
losses | |
| | | | | | |
Long | | | | | | | | | | | | | | | | | | | | | | | | |
| | | | | | |
S&P 500 E-Mini Index | | | 34 | | | | 6-19-2020 | | | $ | 4,569,880 | | | $ | 5,171,400 | | | $ | 601,520 | | | $ | 0 | |
Investments in Affiliates
An affiliated investment is an investment in which the Portfolio owns at least 5% of the outstanding voting shares of the issuer or as a result of other relationships, such as the Portfolio and the issuer having the same adviser or investment manager. Transactions with issuers that were either affiliated persons of the Portfolio at the beginning of the period or the end of the period were as follows:
| | | | | | | | | | | | | | | | | | | | | | | | | | | | | | | | | | | | |
| | | Shares,
beginning of
period | | | Shares
purchased | | | Shares
sold | | | Shares,
end of
period | | | Net
realized
gains
(losses) | | | Net
change in
unrealized
gains
(losses) | | | Income
from
affiliated
securities | | | Value,
end of
period | | | % of
net
assets | |
| | | | | | | | | |
| Short-Term Investments | | | | | | | | | | | | | | | | | | | | | | | | | | | |
Investment Companies | | | | | | | | | | | | | | | | | | | | | | | | | | | | | | | | | | | | |
Wells Fargo Government Money Market Fund Select Class | | | 4,806,420 | | | | 77,621,028 | | | | (78,869,718 | ) | | | 3,557,730 | | | $ | 0 | | | $ | 0 | | | $ | 44,218 | | | $ | 3,557,730 | | | | 1.60 | % |
The accompanying notes are an integral part of these financial statements.
Wells Fargo Large Company Value Portfolio | 7
Statement of assets and liabilities—May 31, 2020
| | | | |
| | | | |
| |
Assets | | | | |
Investments in unaffiliated securities, at value (cost $192,189,229) | | $ | 216,787,347 | |
Investments in affiliated securities, at value (cost 3,557,730) | | | 3,557,730 | |
Segregated cash for futures contracts | | | 1,800,000 | |
Receivable for dividends | | | 337,440 | |
Receivable for daily variation margin on open futures contracts | | | 6,670 | |
Prepaid expenses and other assets | | | 27,423 | |
| | | | |
Total assets | | | 222,516,610 | |
| | | | |
| |
Liabilities | | | | |
Advisory fee payable | | | 62,726 | |
Professional fees payable | | | 4,047 | |
Trustees’ fees and expenses payable | | | 748 | |
Custody fees payable | | | 507 | |
| | | | |
Total liabilities | | | 68,028 | |
| | | | |
Total net assets | | $ | 222,448,582 | |
| | | | |
The accompanying notes are an integral part of these financial statements.
8 | Wells Fargo Large Company Value Portfolio
Statement of operations—year ended May 31, 2020
| | | | |
| | | | |
| |
Investment income | | | | |
Dividends (net of foreign withholding taxes of $9,620) | | $ | 5,777,823 | |
Income from affiliated securities | | | 44,218 | |
| | | | |
Total investment income | | | 5,822,041 | |
| | | | |
| |
Expenses | | | | |
Advisory fee | | | 833,771 | |
Custody and accounting fees | | | 12,116 | |
Professional fees | | | 48,736 | |
Shareholder report expenses | | | 3,630 | |
Trustees’ fees and expenses | | | 21,020 | |
Other fees and expenses | | | 8,395 | |
| | | | |
Total expenses | | | 927,668 | |
Less: Fee waivers and/or expense reimbursements | | | (162 | ) |
| | | | |
Net expenses | | | 927,506 | |
| | | | |
Net investment income | | | 4,894,535 | |
| | | | |
| |
Realized and unrealized gains (losses) on investments | | | | |
Net realized losses on | |
Unaffiliated securities | | | (22,338,245 | ) |
Futures contracts | | | (603,129 | ) |
| | | | |
Net realized losses on investments | | | (22,941,374 | ) |
| | | | |
|
Net change in unrealized gains (losses) on | |
Unaffiliated securities | | | 22,927,403 | |
Futures contracts | | | 898,863 | |
| | | | |
Net change in unrealized gains (losses) on investments | | | 23,826,266 | |
| | | | |
Net realized and unrealized gains (losses) on investments | | | 884,892 | |
| | | | |
Net increase in net assets resulting from operations | | $ | 5,779,427 | |
| | | | |
The accompanying notes are an integral part of these financial statements.
Wells Fargo Large Company Value Portfolio | 9
Statement of changes in net assets
| | | | | | | | |
| | | Year ended
May 31, 2020 | | | Year ended
May 31, 2019 | |
|
Operations | |
Net investment income | | $ | 4,894,535 | | | $ | 5,990,384 | |
Net realized losses on investments | | | (22,941,374 | ) | | | (1,847,084 | ) |
Net change in unrealized gains (losses) on investments | | | 23,826,266 | | | | (3,272,678 | ) |
| | | | |
Net increase in net assets resulting from operations | | | 5,779,427 | | | | 870,622 | |
| | | | |
| | |
Capital transactions | | | | | | | | |
Transactions in investors’ beneficial interests | |
Contributions | | | 18,442,858 | | | | 260,981,430 | |
Withdrawals | | | (50,929,441 | ) | | | (74,532,452 | ) |
| | | | |
Net increase (decrease) in net assets resulting from capital transactions | | | (32,486,583 | ) | | | 186,448,978 | |
| | | | |
Total increase (decrease) in net assets | | | (26,707,156 | ) | | | 187,319,600 | |
| | | | |
| | |
Net assets | | | | | | | | |
Beginning of period | | | 249,155,738 | | | | 61,836,138 | |
| | | | |
End of period | | $ | 222,448,582 | | | $ | 249,155,738 | |
| | | | |
The accompanying notes are an integral part of these financial statements.
10 | Wells Fargo Large Company Value Portfolio
Financial highlights
| | | | | | | | | | | | | | | | | | | | |
| | | Year ended May 31 | |
| | | 2020 | | | 2019 | | | 2018 | | | 2017 | | | 2016 | |
Total return | | | (0.09 | )% | | | (0.94 | )% | | | 9.80 | % | | | 13.22 | % | | | (3.92 | )% |
Ratios to average net assets (annualized) | | | | | | | | | | | | | | | | | | | | |
Gross expenses | | | 0.39 | % | | | 0.39 | % | | | 0.49 | % | | | 0.68 | % | | | 0.76 | % |
Net expenses | | | 0.39 | % | | | 0.39 | % | | | 0.42 | % | | | 0.66 | % | | | 0.74 | % |
Net investment income | | | 2.05 | % | | | 2.29 | % | | | 1.56 | % | | | 1.45 | % | | | 1.54 | % |
Supplemental data | | | | | | | | | | | | | | | | | | | | |
Portfolio turnover rate | | | 335 | % | | | 246 | % | | | 244 | % | | | 203 | % | | | 50 | % |
The accompanying notes are an integral part of these financial statements.
Wells Fargo Large Company Value Portfolio | 11
Notes to financial statements
1. ORGANIZATION
Wells Fargo Master Trust (the “Trust”), a Delaware statutory trust organized on March 10, 1999, is an open-end management investment company registered under the Investment Company Act of 1940, as amended (the “1940 Act”). As an investment company, the Trust follows the accounting and reporting guidance in Financial Accounting Standards Board (“FASB”) Accounting Standards Codification Topic 946, Financial Services – Investment Companies. These financial statements report on the Wells Fargo Large Company Value Portfolio (the “Portfolio”) which is a diversified series of the Trust.
2. SIGNIFICANT ACCOUNTING POLICIES
The following significant accounting policies, which are consistently followed in the preparation of the financial statements of the Portfolio, are in conformity with U.S. generally accepted accounting principles which require management to make estimates and assumptions that affect the reported amounts of assets and liabilities, disclosure of contingent assets and liabilities at the date of the financial statements, and the reported amounts of revenues and expenses during the reporting period. Actual results could differ from those estimates.
Securities valuation
All investments are valued each business day as of the close of regular trading on the New York Stock Exchange (generally 4 p.m. Eastern Time), although the Portfolio may deviate from this calculation time under unusual or unexpected circumstances.
Equity securities and futures contracts that are listed on a foreign or domestic exchange or market are valued at the official closing price or, if none, the last sales price. If no sale occurs on the principal exchange or market that day, a fair value price will be determined in accordance with the Portfolio’s Valuation Procedures.
Investments in registered open-end investment companies are valued at net asset value.
Investments which are not valued using any of the methods discussed above are valued at their fair value, as determined in good faith by the Board of Trustees of the Portfolio. The Board of Trustees has established a Valuation Committee comprised of the Trustees and has delegated to it the authority to take any actions regarding the valuation of portfolio securities that the Valuation Committee deems necessary or appropriate, including determining the fair value of portfolio securities, unless the determination has been delegated to the Wells Fargo Asset Management Pricing Committee at Wells Fargo Funds Management, LLC (“Funds Management”). The Board of Trustees retains the authority to make or ratify any valuation decisions or approve any changes to the Valuation Procedures as it deems appropriate. On a quarterly basis, the Board of Trustees receives reports on any valuation actions taken by the Valuation Committee or the Wells Fargo Asset Management Pricing Committee which may include items for ratification.
Foreign currency translation
The accounting records of the Portfolio are maintained in U.S. dollars. The values of other assets and liabilities denominated in foreign currencies are translated into U.S. dollars at rates provided by an independent foreign currency pricing source at a time each business day specified by the Wells Fargo Asset Management Pricing Committee. Purchases and sales of securities, and income and expenses are converted at the rate of exchange on the respective dates of such transactions. Net realized foreign exchange gains or losses arise from sales of foreign currencies, currency gains or losses realized between the trade and settlement dates on securities transactions, and the difference between the amounts of dividends, interest and foreign withholding taxes recorded and the U.S. dollar equivalent of the amounts actually paid or received. Net unrealized foreign exchange gains and losses arise from changes in the fair value of assets and liabilities other than investments in securities resulting from changes in exchange rates. The changes in net assets arising from changes in exchange rates of securities and the changes in net assets resulting from changes in market prices of securities are not separately presented. Such changes are included in net realized and unrealized gains or losses from investments.
Futures contracts
Futures contracts are agreements between the Portfolio and a counterparty to buy or sell a specific amount of a commodity, financial instrument or currency at a specified price and on a specified date. The Portfolio may buy and sell futures contracts in order to gain exposure to, or protect against, changes in security values and is subject to equity price risk. The primary risks associated with the use of futures contracts are the imperfect correlation between changes in market values of securities held by the Portfolio and the prices of futures contracts, and the possibility of an illiquid market. Futures contracts are generally entered into on a regulated futures exchange and cleared through a clearinghouse associated with the exchange. With futures contracts, there is minimal counterparty risk to the Portfolio since futures contracts are exchange traded and the exchange’s clearinghouse, as the counterparty to all exchange traded futures, guarantees the futures contracts against default.
12 | Wells Fargo Large Company Value Portfolio
Notes to financial statements
Upon entering into a futures contracts, the Portfolio is required to deposit either cash or securities (initial margin) with the broker in an amount equal to a certain percentage of the contract value. Subsequent payments (variation margin) are paid to or from the broker each day equal to the daily changes in the contract value. Such payments are recorded as unrealized gains or losses and, if any, shown as variation margin receivable (payable) in the Statement of Assets and Liabilities. Should the Portfolio fail to make requested variation margin payments, the broker can gain access to the initial margin to satisfy the Portfolio’s payment obligations. When the contracts are closed, a realized gain or loss is recorded in the Statement of Operations.
Security transactions and income recognition
Securities transactions are recorded on a trade date basis. Realized gains or losses are recorded on the basis of identified cost.
Dividend income is recognized on the ex-dividend date. Dividend income is recorded net of foreign taxes withheld where recovery of such taxes is not assured.
Federal and other taxes
The Portfolio is treated as a separate entity for federal income tax purposes. The Portfolio is not required to pay federal income taxes on its net investment income and net capital gains as it is treated as a partnership for federal income tax purposes. All dividends, gains and losses of the Portfolio are deemed to have been “passed through” to the interest holders in proportion to their holdings of the Portfolio regardless of whether dividends and gains have been distributed by the Portfolio.
The Portfolio’s income tax returns and all financial records supporting those returns for the prior three fiscal years are subject to examination by the federal revenue authority. Management has analyzed the Portfolio’s tax positions taken on federal, state, and foreign tax returns for all open tax years and does not believe that there are any uncertain tax positions that require recognition of a tax liability.
As of May 31, 2020, the aggregate cost of all investments for federal income tax purposes was $203,349,279 and the unrealized gains (losses) consisted of:
| | | | |
| |
Gross unrealized gains | | $ | 25,470,227 | |
| |
Gross unrealized losses | | | (7,872,909 | ) |
| |
Net unrealized gains | | $ | 17,597,318 | |
3. FAIR VALUATION MEASUREMENTS
Fair value measurements of investments are determined within a framework that has established a fair value hierarchy based upon the various data inputs utilized in determining the value of the Portfolio’s investments. The three-level hierarchy gives the highest priority to unadjusted quoted prices in active markets for identical assets or liabilities (Level 1) and the lowest priority to unobservable inputs (Level 3). The Portfolio’s investments are classified within the fair value hierarchy based on the lowest level of input that is significant to the fair value measurement. The inputs are summarized into three broad levels as follows:
| ∎ | | Level 1 – quoted prices in active markets for identical securities |
| ∎ | | Level 2 – other significant observable inputs (including quoted prices for similar securities, interest rates, prepayment speeds, credit risk, etc.) |
| ∎ | | Level 3 – significant unobservable inputs (including the Portfolio’s own assumptions in determining the fair value of investments) |
The inputs or methodologies used for valuing investments in securities are not necessarily an indication of the risk associated with investing in those securities.
Wells Fargo Large Company Value Portfolio | 13
Notes to financial statements
The following is a summary of the inputs used in valuing the Portfolio’s assets and liabilities as of May 31, 2020:
| | | | | | | | | | | | | | | | |
| | | | |
| | | Quoted prices
(Level 1) | | | Other significant
observable inputs
(Level 2) | | | Significant
unobservable inputs (Level 3) | | | Total | |
| | | | |
Assets | | | | | | | | | | | | | | | | |
Investments in: | | | | | | | | | | | | | | | | |
| | | | |
Common stocks | | | | | | | | | | | | | | | | |
| | | | |
Communication services | | $ | 21,611,484 | | | $ | 0 | | | $ | 0 | | | $ | 21,611,484 | |
| | | | |
Consumer discretionary | | | 19,099,026 | | | | 0 | | | | 0 | | | | 19,099,026 | |
| | | | |
Consumer staples | | | 20,931,881 | | | | 0 | | | | 0 | | | | 20,931,881 | |
| | | | |
Energy | | | 7,337,602 | | | | 0 | | | | 0 | | | | 7,337,602 | |
| | | | |
Financials | | | 37,982,746 | | | | 0 | | | | 0 | | | | 37,982,746 | |
| | | | |
Health care | | | 43,915,411 | | | | 0 | | | | 0 | | | | 43,915,411 | |
| | | | |
Industrials | | | 18,302,674 | | | | 0 | | | | 0 | | | | 18,302,674 | |
| | | | |
Information technology | | | 16,661,867 | | | | 0 | | | | 0 | | | | 16,661,867 | |
| | | | |
Materials | | | 10,427,399 | | | | 0 | | | | 0 | | | | 10,427,399 | |
| | | | |
Real estate | | | 8,710,063 | | | | 0 | | | | 0 | | | | 8,710,063 | |
| | | | |
Utilities | | | 11,807,194 | | | | 0 | | | | 0 | | | | 11,807,194 | |
| | | | |
Short-term investments | | | | | | | | | | | | | | | | |
| | | | |
Investment companies | | | 3,557,730 | | | | 0 | | | | 0 | | | | 3,557,730 | |
| | | | |
| | | 220,345,077 | | | | 0 | | | | 0 | | | | 220,345,077 | |
| | | | |
Futures contracts | | | 601,520 | | | | 0 | | | | 0 | | | | 601,520 | |
| | | | |
Total assets | | $ | 220,946,597 | | | $ | 0 | | | $ | 0 | | | $ | 220,946,597 | |
Additional sector, industry or geographic detail is included in the Portfolio of Investments.
Futures contracts are reported at their cumulative unrealized gains (losses) at measurement date as reported in the table following the Portfolio of Investments. For futures contracts, the current day’s variation margin is reported on the Statement of Assets and Liabilities. All other assets and liabilities are reported at their market value at measurement date.
For the year ended May 31, 2020, the Portfolio did not have any transfers into/out of Level 3.
4. TRANSACTIONS WITH AFFILIATES
Advisory fee
The Trust has entered into an advisory contract with Funds Management, an indirect wholly owned subsidiary of Wells Fargo & Company (“Wells Fargo”). The adviser is responsible for implementing investment policies and guidelines and for supervising the subadviser, who is responsible for day-to-day portfolio management of the Portfolio. Pursuant to the contract, Funds Management is entitled to receive an annual advisory fee at the following annual rate based on the Portfolio’s average daily net assets:
| | | | |
| |
| Average daily net assets | | Advisory fee | |
| |
First $1 billion | | | 0.350 | % |
| |
Next $4 billion | | | 0.325 | |
| |
Over $5 billion | | | 0.300 | |
For the year ended May 31, 2020, the advisory fee was equivalent to an annual rate of 0.35% of the Portfolio’s average daily net assets.
Funds Management has retained the services of a subadviser to provide daily portfolio management to the Portfolio. The fee for subadvisory services is borne by Funds Management. Wells Capital Management Incorporated, an affiliate of Funds Management and an indirect wholly owned subsidiary of Wells Fargo, is the subadviser to the Portfolio and is entitled to receive a fee from Funds Management at an annual rate starting at 0.25% and declining to 0.15% as the average daily net assets of the Portfolio increase.
14 | Wells Fargo Large Company Value Portfolio
Notes to financial statements
Interfund transactions
The Portfolio may purchase or sell portfolio investment securities to certain other Wells Fargo affiliates pursuant to Rule 17a-7 under the 1940 Act and under procedures adopted by the Board of Trustees. The procedures have been designed to ensure that these interfund transactions, which do not incur broker commissions, are effected at current market prices.
5. INVESTMENT PORTFOLIO TRANSACTIONS
Purchases and sales of investments, excluding U.S. government obligations (if any) and short-term securities, for the year ended May 31, 2020 were $788,817,341 and $815,809,311, respectively.
6. DERIVATIVE TRANSACTIONS
During the year ended May 31, 2020, the Portfolio entered into futures contracts used for uninvested cash to enter into futures contracts to gain market exposure. The Portfolio had an average notional amount of $3,952,797 in long futures contracts during the year ended May 31, 2020.
The fair value, realized gains or losses and change in unrealized gains or losses, if any, on derivative instruments are reflected in the corresponding financial statement captions.
7. BANK BORROWINGS
The Trust, along with Wells Fargo Variable Trust and Wells Fargo Funds Trust (excluding the money market funds), are parties to a $280,000,000 revolving credit agreement whereby the Portfolio is permitted to use bank borrowings for temporary or emergency purposes, such as to fund shareholder redemption requests. Interest under the credit agreement is charged to the Portfolio based on a borrowing rate equal to the higher of the Federal Funds rate in effect on that day plus 1.25% or the overnight LIBOR rate in effect on that day plus 1.25%. In addition, an annual commitment fee equal to 0.25% of the unused balance is allocated to each participating fund.
For the year ended May 31, 2020, there were no borrowings by the Portfolio under the agreement.
8. INDEMNIFICATION
Under the Portfolios’ organizational documents, the officers and Trustees have been granted certain indemnification rights against certain liabilities that may arise out of performance of their duties to the Portfolio. The Portfolio has entered into a separate agreement with each Trustee that converts indemnification rights currently existing under the Portfolio’s organizational documents into contractual rights that cannot be changed in the future without the consent of the Trustee. Additionally, in the normal course of business, the Portfolio may enter into contracts with service providers that contain a variety of indemnification clauses. The Portfolio’s maximum exposure under these arrangements is dependent on future claims that may be made against the Portfolio and, therefore, cannot be estimated.
9. NEW ACCOUNTING PRONOUNCEMENT
In August 2018, FASB issued Accounting Standards Update (“ASU”) No. 2018-13, Fair Value Measurement (Topic 820) Disclosure Framework—Changes to the Disclosure Requirements for Fair Value Measurement. ASU 2018-13 updates the disclosure requirements for fair value measurements by modifying or removing certain disclosures and adding certain new disclosures. The amendments are effective for fiscal years, and interim periods within those fiscal years, beginning after December 15, 2019. Early adoption is permitted. Management has adopted the removal and modification of disclosures early, as permitted, and will adopt the additional new disclosures at the effective date.
10. CORONAVIRUS (COVID-19) PANDEMIC
On March 11, 2020, the World Health Organization announced that it had made the assessment that coronavirus disease 2019 (“COVID-19”) is a pandemic. The impacts of COVID-19 are adversely affecting the entire global economy, individual companies and investment products, and the market in general. There is significant uncertainty around the extent and duration of business disruptions related to COVID-19 and the impacts may be short term or may last for an extended period of time. The risk of further spreading of COVID-19 has led to significant uncertainty and volatility in the financial markets. The value of the Portfolio and the securities in which the Portfolio invests have generally been adversely affected by impacts caused by COVID-19.
Wells Fargo Large Company Value Portfolio | 15
Report of independent registered public accounting firm
TO THE INTEREST HOLDERS OF THE PORTFOLIO AND BOARD OF TRUSTEES WELLS FARGO FUNDS TRUST:
Opinion on the Financial Statements
We have audited the accompanying statement of assets and liabilities of Wells Fargo Large Company Value Portfolio (the Portfolio), one of the portfolios constituting Wells Fargo Master Trust, including the portfolio of investments as of May 31, 2020, the related statement of operations for the year then ended, the statements of changes in net assets for each of the years in the two-year period then ended, and the related notes (collectively, the financial statements) and the financial highlights for each of the years in the five-year period then ended. In our opinion, the financial statements and financial highlights present fairly, in all material respects, the financial position of the Fund as of May 31, 2020, the results of its operations for the year then ended, the changes in its net assets for each of the years in the two-year period then ended, and the financial highlights for each of the years in the five-year period then ended, in conformity with U.S. generally accepted accounting principles.
Basis for Opinion
These financial statements and financial highlights are the responsibility of the Fund’s management. Our responsibility is to express an opinion on these financial statements and financial highlights based on our audits. We are a public accounting firm registered with the Public Company Accounting Oversight Board (United States) (PCAOB) and are required to be independent with respect to the Fund in accordance with the U.S. federal securities laws and the applicable rules and regulations of the Securities and Exchange Commission and the PCAOB.
We conducted our audits in accordance with the standards of the PCAOB. Those standards require that we plan and perform the audit to obtain reasonable assurance about whether the financial statements and financial highlights are free of material misstatement, whether due to error or fraud. Our audits included performing procedures to assess the risks of material misstatement of the financial statements and financial highlights, whether due to error or fraud, and performing procedures that respond to those risks. Such procedures included examining, on a test basis, evidence regarding the amounts and disclosures in the financial statements and financial highlights. Such procedures also included confirmation of securities owned as May 31, 2020, by correspondence with the custodian, transfer agent, and brokers. Our audits also included evaluating the accounting principles used and significant estimates made by management, as well as evaluating the overall presentation of the financial statements and financial highlights. We believe that our audits provide a reasonable basis for our opinion.

We have not been able to determine the specific year that we began serving as the auditor of one or more Wells Fargo Funds investment companies; however we are aware that we have served as the auditor of one or more Wells Fargo Funds investment companies since at least 1955.
Boston, Massachusetts
July 29, 2020
16 | Wells Fargo Large Company Value Portfolio
Other information (unaudited)
PROXY VOTING INFORMATION
A description of the policies and procedures used to determine how to vote proxies relating to portfolio securities is available, upon request, by calling 1-800-222-8222, visiting our website at wfam.com, or visiting the SEC website at sec.gov. Information regarding how the proxies related to portfolio securities were voted during the most recent 12-month period ended June 30 is available on the website at wfam.com or by visiting the SEC website at sec.gov.
QUARTERLY PORTFOLIO HOLDINGS INFORMATION
The Portfolio files its complete schedule of portfolio holdings with the SEC for the first and third quarters of each fiscal as an exhibit to its reports on Form N-PORT. Shareholders may view the filed Form N-PORT by visiting the SEC website at sec.gov.
Wells Fargo Large Company Value Portfolio | 17
Other information (unaudited)
BOARD OF TRUSTEES AND OFFICERS
Each of the Trustees and Officers1 listed in the table below acts in identical capacities for each fund in the Wells Fargo family of funds, which consists of 147 mutual funds comprising the Wells Fargo Funds Trust, Wells Fargo Variable Trust, Wells Fargo Master Trust and four closed-end funds (collectively the “Fund Complex”). This table should be read in conjunction with the Prospectus and the Statement of Additional Information2. The mailing address of each Trustee and Officer is 525 Market Street, 12th Floor, San Francisco, CA 94105. Each Trustee and Officer serves an indefinite term, however, each Trustee serves such term until reaching the mandatory retirement age established by the Trustees.
Independent Trustees
| | | | | | |
Name and
year of birth | | Position held and
length of service* | | Principal occupations during past five years or longer | | Current other
public company or
investment
company
directorships |
| | | |
William R. Ebsworth (Born 1957) | | Trustee, since 2015 | | Retired. From 1984 to 2013, equities analyst, portfolio manager, research director and chief investment officer at Fidelity Management and Research Company in Boston, Tokyo, and Hong Kong, and retired in 2013 as Chief Investment Officer of Fidelity Strategic Advisers, Inc. where he led a team of investment professionals managing client assets. Prior thereto, Board member of Hong Kong Securities Clearing Co., Hong Kong Options Clearing Corp., the Thailand International Fund, Ltd., Fidelity Investments Life Insurance Company, and Empire Fidelity Investments Life Insurance Company. Audit Committee Chair and Investment Committee Chair of the Vincent Memorial Hospital Endowment (non-profit organization). Mr. Ebsworth is a CFA® charterholder. | | N/A |
| | | |
Jane A. Freeman (Born 1953) | | Trustee, since 2015; Chair Liaison, since 2018 | | Retired. From 2012 to 2014 and 1999 to 2008, Chief Financial Officer of Scientific Learning Corporation. From 2008 to 2012, Ms. Freeman provided consulting services related to strategic business projects. Prior to 1999, Portfolio Manager at Rockefeller & Co. and Scudder, Stevens & Clark. Board member of the Harding Loevner Funds from 1996 to 2014, serving as both Lead Independent Director and chair of the Audit Committee. Board member of the Russell Exchange Traded Funds Trust from 2011 to 2012 and the chair of the Audit Committee. Ms. Freeman is also an inactive Chartered Financial Analyst. | | N/A |
| | | |
Isaiah Harris, Jr. (Born 1952) | | Trustee, since 2009; Audit Committee Chairman, since 2019 | | Retired. Chairman of the Board of CIGNA Corporation since 2009, and Director since 2005. From 2003 to 2011, Director of Deluxe Corporation. Prior thereto, President and CEO of BellSouth Advertising and Publishing Corp. from 2005 to 2007, President and CEO of BellSouth Enterprises from 2004 to 2005 and President of BellSouth Consumer Services from 2000 to 2003. Emeritus member of the Iowa State University Foundation Board of Governors. Emeritus Member of the Advisory Board of Iowa State University School of Business. Advisory Board Member, Palm Harbor Academy (private school). Advisory Board Member, Child Evangelism Fellowship (non-profit). Mr. Harris is a certified public accountant (inactive status). | | CIGNA Corporation |
| | | |
Judith M. Johnson (Born 1949) | | Trustee, since 2008; Audit Committee Chairman, from 2009 to 2018 | | Retired. Prior thereto, Chief Executive Officer and Chief Investment Officer of Minneapolis Employees Retirement Fund from 1996 to 2008. Ms. Johnson is an attorney, certified public accountant and a certified managerial accountant. | | N/A |
18 | Wells Fargo Large Company Value Portfolio
Other information (unaudited)
| | | | | | |
Name and
year of birth | | Position held and
length of service* | | Principal occupations during past five years or longer | | Current other
public company or
investment
company
directorships |
| | | |
David F. Larcker (Born 1950) | | Trustee, since 2009 | | James Irvin Miller Professor of Accounting at the Graduate School of Business, Stanford University, Director of the Corporate Governance Research Initiative and Senior Faculty of The Rock Center for Corporate Governance since 2006. From 2005 to 2008, Professor of Accounting at the Graduate School of Business, Stanford University. Prior thereto, Ernst & Young Professor of Accounting at The Wharton School, University of Pennsylvania from 1985 to 2005. | | N/A |
| | | |
Olivia S. Mitchell (Born 1953) | | Trustee, since 2006; Nominating and Governance Committee Chair, since 2018 | | International Foundation of Employee Benefit Plans Professor, Wharton School of the University of Pennsylvania since 1993. Director of Wharton’s Pension Research Council and Boettner Center on Pensions & Retirement Research, and Research Associate at the National Bureau of Economic Research. Previously, Cornell University Professor from 1978 to 1993. | | N/A |
| | | |
Timothy J. Penny (Born 1951) | | Trustee, since 1996; Chairman, since 2018 | | President and Chief Executive Officer of Southern Minnesota Initiative Foundation, a non-profit organization, since 2007. Member of the Board of Trustees of NorthStar Education Finance, Inc., a non-profit organization, since 2007. | | N/A |
| | | |
James G. Polisson (Born 1959) | | Trustee, since 2018 | | Retired. Chief Marketing Officer, Source (ETF) UK Services, Ltd, from 2015 to 2017. From 2012 to 2015, Principal of The Polisson Group, LLC, a management consulting, corporate advisory and principal investing company. Chief Executive Officer and Managing Director at Russell Investments, Global Exchange Traded Funds from 2010 to 2012. Managing Director of Barclays Global Investors from 1998 to 2010 and Global Chief Marketing Officer for iShares and Barclays Global Investors from 2000 to 2010. Trustee of the San Francisco Mechanics’ Institute, a non-profit organization, from 2013 to 2015. Board member of the Russell Exchange Traded Fund Trust from 2011 to 2012. Director of Barclays Global Investors Holdings Deutschland GmbH from 2006 to 2009. Mr. Polisson is an attorney and has a retired status with the Massachusetts and District of Columbia Bar Associations. | | N/A |
| | | |
Pamela Wheelock (Born 1959) | | Trustee, since January 2020; previously Trustee from January 2018 to July 2019 | | Board member of the Destination Medical Center Economic Development Agency, Rochester, Minnesota since 2019 and Interim President of the McKnight Foundation since 2020. Acting Commissioner, Minnesota Department of Human Services, July 2019 through September 2019. Human Services Manager (part-time), Minnesota Department of Human Services, October 2019 through December 2019. Chief Operating Officer, Twin Cities Habitat for Humanity from 2017 to 2019. Vice President of University Services, University of Minnesota from 2012 to 2016. Prior thereto, on the Board of Directors, Governance Committee and Finance Committee for the Minnesota Philanthropy Partners (Saint Paul Foundation) from 2012 to 2018, Interim Chief Executive Officer of Blue Cross Blue Shield of Minnesota from 2011 to 2012, Chairman of the Board from 2009 to 2012 and Board Director from 2003 to 2015. Vice President, Leadership and Community Engagement, Bush Foundation, Saint Paul, Minnesota (a private foundation) from 2009 to 2011. Executive Vice President and Chief Financial Officer, Minnesota Sports and Entertainment from 2004 to 2009 and Senior Vice President from 2002 to 2004. Executive Vice President of the Minnesota Wild Foundation from 2004 to 2008. Commissioner of Finance, State of Minnesota, from 1999 to 2002. Currently Board Chair of the Minnesota Wild Foundation since 2010. | | N/A |
| * | Length of service dates reflect the Trustee’s commencement of service with the Trust’s predecessor entities, where applicable. |
Wells Fargo Large Company Value Portfolio | 19
Other information (unaudited)
Officers
| | | | |
Name and
year of birth | | Position held and
length of service | | Principal occupations during past five years or longer |
| | |
Andrew Owen (Born 1960) | | President, since 2017 | | Executive Vice President of Wells Fargo & Company and Head of Affiliated Managers, Wells Fargo Asset Management, since 2014. In addition, Mr. Owen is currently President, Chief Executive Officer and Director of Wells Fargo Funds Management, LLC since 2017. Prior thereto, Executive Vice President responsible for marketing, investments and product development for Wells Fargo Funds Management, LLC, from 2009 to 2014. |
| | |
Nancy Wiser1 (Born 1967) | | Treasurer, since 2012 | | Executive Vice President of Wells Fargo Funds Management, LLC since 2011. Chief Operating Officer and Chief Compliance Officer at LightBox Capital Management LLC, from 2008 to 2011. |
| | |
Michelle Rhee (Born 1966) | | Chief Legal Officer, since 2019 | | Secretary of Wells Fargo Funds Management, LLC, Chief Legal Counsel of Wells Fargo Asset Management and Assistant General Counsel of Wells Fargo Bank, N.A. since 2018. Associate General Counsel and Managing Director of Bank of America Corporation from 2004 to 2018. |
| | |
Catherine Kennedy (Born 1969) | | Secretary, since 2019 | | Vice President of Wells Fargo Funds Management, LLC and Senior Counsel of the Wells Fargo Legal Department since 2010. Vice President and Senior Counsel of Evergreen Investment Management Company, LLC from 1998 to 2010. |
| | |
Michael H. Whitaker (Born 1967) | | Chief Compliance Officer, since 2016 | | Chief Compliance Officer of Wells Fargo Asset Management since 2016. Senior Vice President and Chief Compliance Officer for Fidelity Investments from 2007 to 2016. |
| | |
David Berardi (Born 1975) | | Assistant Treasurer, since 2009 | | Vice President of Wells Fargo Funds Management, LLC since 2009. Vice President of Evergreen Investment Management Company, LLC from 2008 to 2010. Manager of Fund Reporting and Control for Evergreen Investment Management Company, LLC from 2004 to 2010. |
| | |
Jeremy DePalma1 (Born 1974) | | Treasurer, since 2012 | | Senior Vice President of Wells Fargo Funds Management, LLC since 2009. Senior Vice President of Evergreen Investment Management Company, LLC from 2008 to 2010 and head of the Fund Reporting and Control Team within Fund Administration from 2005 to 2010. |
| 1 | Nancy Wiser acts as Treasurer of 65 funds in the Fund Complex. Jeremy DePalma acts as the Treasurer of 82 funds in the Fund Complex. |
| 2 | The Statement of Additional Information includes additional information about the Trustees and is available, without charge, upon request, by calling 1-800-222-8222 or by visiting the website at wfam.com. |
20 | Wells Fargo Large Company Value Portfolio
Other information (unaudited)
BOARD CONSIDERATION OF INVESTMENT ADVISORY AND SUB-ADVISORY AGREEMENTS:
Wells Fargo Large Company Value Portfolio
Under the Investment Company Act of 1940 (the “1940 Act”), the Board of Trustees (the “Board”) of Wells Fargo Master Trust (the “Trust”) must determine annually whether to approve the continuation of the Trust’s investment advisory and sub-advisory agreements. In this regard, at a Board meeting held on May 26, 2020 and May 28, 2020 (together, the “Meeting”), the Board, all the members of which have no direct or indirect interest in the investment advisory and sub-advisory agreements and are not “interested persons” of the Trust, as defined in the 1940 Act (the “Independent Trustees”), reviewed and approved for the Wells Fargo Large Company Value Portfolio (the “Portfolio”): (i) an investment advisory agreement (the “Advisory Agreement”) with Wells Fargo Funds Management, LLC (“Funds Management”); and (ii) an investment sub-advisory agreement (the “Sub-Advisory Agreement”) with Wells Capital Management Incorporated (the “Sub-Adviser”), an affiliate of Funds Management. The Advisory Agreement and the Sub-Advisory Agreement are collectively referred to as the “Advisory Agreements.”
At the Meeting, the Board considered the factors and reached the conclusions described below relating to the selection of Funds Management and the Sub-Adviser and the approval of the Advisory Agreements. Prior to the Meeting, including at a Board meeting held in April 2020, the Trustees conferred extensively among themselves and with representatives of Funds Management about these matters. Also, the Board has adopted a team-based approach, with each team consisting of a sub-set of Trustees, to assist the full Board in the discharge of its duties in reviewing investment performance and other matters throughout the year. The Independent Trustees were assisted in their evaluation of the Advisory Agreements by independent legal counsel, from whom they received separate legal advice and with whom they met separately.
In providing information to the Board, Funds Management and the Sub-Adviser were guided by a detailed set of requests for information submitted to them by independent legal counsel on behalf of the Independent Trustees at the start of the Board’s annual contract renewal process earlier in 2020. In considering and approving the Advisory Agreements, the Trustees considered the information they believed relevant, including but not limited to the information discussed below. The Board considered not only the specific information presented in connection with the Meeting, but also the knowledge gained over time through interaction with Funds Management and the Sub-Adviser about various topics. In this regard, the Board reviewed reports of Funds Management at each of its quarterly meetings, which included, among other things, portfolio reviews and investment performance reports. In addition, the Board and the teams mentioned above confer with portfolio managers at various times throughout the year. The Board did not identify any particular information or consideration that was all-important or controlling, and each individual Trustee may have attributed different weights to various factors.
After its deliberations, the Board unanimously approved the continuation of the Advisory Agreements for a one-year term and determined that the compensation payable to Funds Management and the Sub-Adviser under each of the Advisory Agreements was reasonable. The Board considered the approval of the Advisory Agreements for the Portfolio as part of its consideration of agreements for funds across the complex, but its approvals were made on a portfolio-by-portfolio basis. The following summarizes a number of important, but not necessarily all, factors considered by the Board in support of its approvals.
Nature, extent and quality of services
The Board received and considered various information regarding the nature, extent and quality of services provided to the Portfolio by Funds Management and the Sub-Adviser under the Advisory Agreements. This information included a description of the investment advisory services and Portfolio-level administrative services covered by the Advisory Agreement, as well as, among other things, a summary of the background and experience of senior management of Wells Fargo Asset Management (“WFAM”), of which Funds Management and the Sub-Adviser are a part, and a summary of investments made in the business of WFAM. The Board also received a description of Funds Management’s and the Sub-Adviser’s business continuity plans and of their approaches to data privacy and cybersecurity, and related testing. The Board also received and reviewed information about Funds Management’s role as administrator of the Portfolio’s liquidity risk management program, Funds Management’s approach to risk management, and Funds Management’s intermediary and vendor oversight program.
The Board also considered the qualifications, background, tenure and responsibilities of each of the portfolio managers primarily responsible for the day-to-day portfolio management of the Portfolio. The Board evaluated the ability of Funds Management and the Sub-Adviser to attract and retain qualified investment professionals, including research, advisory and supervisory personnel. The Board further considered the compliance programs and compliance records of Funds Management and the Sub-Adviser. In addition, the Board took into account the full range of services provided to the Portfolio by Funds Management and its affiliates.
Wells Fargo Large Company Value Portfolio | 21
Other information (unaudited)
Portfolio investment performance and expenses
The Board considered the investment performance results for the Portfolio over various time periods ended December 31, 2019. The Board also considered more current results for various time periods ended March 31, 2020. The Board considered these results in comparison to the investment performance of funds in a universe that was determined by Broadridge Inc. (“Broadridge”) to be similar to the Portfolio (the “Universe”), and in comparison to the Portfolio’s benchmark index and to other comparative data. Broadridge is an independent provider of investment company data. The Board received a description of the methodology used by Broadridge to select the mutual funds in the performance Universe. The Board noted that the investment performance of the Portfolio was higher than or in range of the average investment performance of the Universe for the three-, five- and ten-year periods ended December 31, 2019, and lower than the average investment performance of the Universe for the one-year period ended December 31, 2019. The Board also noted that the investment performance of the Portfolio was higher than the average performance of the Universe for all periods ended March 31, 2020. The Board also noted that the investment performance of the Portfolio was lower than its benchmark index, the Russell 1000® Value Index, for all periods ended December 31, 2019. The Board also noted that the investment performance of the Portfolio was higher than its benchmark index, the Russell 1000® Value Index, for the one- and three-year periods ended March 31, 2020, and lower than its benchmark index, the Russell 1000® Value Index, for the five- and ten-year periods ended March 31, 2020.
The Board received information concerning, and discussed factors contributing to, the underperformance of the Portfolio relative to the Universe and benchmark for the periods identified above. The Board took note of the explanations for the relative underperformance during these periods, including with respect to investment decisions and market factors that affected the Portfolio’s investment performance.
The Board received and considered information regarding the fee rates that are payable to Funds Management for investment advisory services (as discussed below), which are the only fees charged at the Portfolio level, relative to corresponding class-specific expense groups that were determined by Broadridge to be similar to the Portfolio (the “Groups”). The Board received a description of the methodology used by Broadridge to select the mutual funds in the expense Groups and an explanation of how funds comprising expense groups and their expense ratios may vary from year-to-year.
The Board took into account the Portfolio’s investment performance and expense information provided to it among the factors considered in deciding to re-approve the Advisory Agreements.
Investment advisory and sub-advisory fee rates
The Board reviewed and considered the contractual fee rates payable by the Portfolio to Funds Management under the Advisory Agreement (the “Advisory Agreement Rate ”). The Board also reviewed and considered the contractual investment sub-advisory fee rates that are payable by Funds Management to the Sub-Adviser for investment sub-advisory services.
The Board reviewed a comparison of the Advisory Agreement Rate of the Portfolio with those of other funds in the Portfolio’s expense Group at a common asset level. The Board noted that the Portfolio’s Advisory Agreement Rate was lower than the median rate for the Portfolio’s expense Groups.
The Board also received and considered information about the portion of the total advisory fee that was retained by Funds Management after payment of the fee to the Sub-Adviser for sub-advisory services. In assessing the reasonableness of this amount, the Board received and evaluated information about the nature and extent of responsibilities retained and risks assumed by Funds Management and not delegated to or assumed by the Sub-Adviser, and about Funds Management’s on-going oversight services. Given the affiliation between Funds Management and the Sub-Adviser, the Board ascribed limited relevance to the allocation of fees between them.
The Board also received and considered information about the nature and extent of services offered and fee rates charged by Funds Management and the Sub-Adviser to other types of clients with investment strategies similar to those of the Portfolio. In this regard, the Board received information about the significantly greater scope of services, and compliance, reporting and other legal burdens and risks of managing proprietary mutual funds compared with those associated with managing assets of other types of clients, including third-party sub-advised fund clients and non-mutual fund clients such as institutional separate accounts.
Based on its consideration of the factors and information it deemed relevant, including those described here, the Board determined that the compensation payable to Funds Management under the Advisory Agreement and to the Sub-Adviser under the Sub-Advisory Agreement was reasonable.
22 | Wells Fargo Large Company Value Portfolio
Other information (unaudited)
Profitability
The Board received and considered information concerning the profitability of Funds Management, as well as the profitability of both WFAM and Wells Fargo & Co. (“Wells Fargo”) from providing services to the fund family as a whole. The Board noted that the Sub-Adviser’s profitability information with respect to providing services to the Portfolio and other funds in the family was subsumed in the WFAM and Wells Fargo profitability analysis.
Funds Management reported on the methodologies and estimates used in calculating profitability, including a description of the methodology used to allocate certain expenses. Among other things, the Board noted that the levels of profitability reported on a fund-by-fund basis varied widely, depending on factors such as the size, type and age of fund.
Based on its review, the Board did not deem the profits reported by Funds Management, WFAM or Wells Fargo from services provided to the Portfolio to be at a level that would prevent it from approving the continuation of the Advisory Agreements.
Economies of scale
The Board received and considered information about the potential for Funds Management to experience economies of scale in the provision of management services to the Portfolio, the difficulties of calculating economies of scale at an individual fund level, and the extent to which potential scale benefits are shared with shareholders. The Board noted the existence of breakpoints in the Portfolio’s advisory fee structure, which operate generally to reduce the Portfolio’s expense ratios as the Portfolio grows in size, and the size of the Portfolio in relation to such breakpoints. The Board considered that in addition to management fee breakpoints, Funds Management shares potential economies of scale from its management business in a variety of ways, including through fee waiver and expense reimbursement arrangements, services that benefit shareholders, competitive management fee rates set at the outset without regard to breakpoints, and investments in the business intended to enhance services available to shareholders.
The Board concluded that Funds Management’s arrangements with respect to the Portfolio, including contractual breakpoints, constituted a reasonable approach to sharing potential economies of scale with the Portfolio and its shareholders.
Other benefits to Funds Management and the Sub-Adviser
The Board received and considered information regarding potential “fall-out” or ancillary benefits received by Funds Management and its affiliates, including the Sub-Adviser, as a result of their relationships with the Portfolio. Ancillary benefits could include, among others, benefits directly attributable to other relationships with the Portfolio and benefits potentially derived from an increase in Funds Management’s and the Sub-Adviser’s business as a result of their relationships with the Portfolio. The Board noted that various affiliates of Funds Management may receive distribution-related fees, shareholder servicing payments and sub-transfer agency fees in respect of shares sold or held through them and services provided.
The Board also reviewed information about soft dollar credits earned and utilized by the Sub-Adviser, fees earned by Funds Management and the Sub-Adviser from managing a private investment vehicle for the fund family’s securities lending collateral, and commissions earned by an affiliated broker from portfolio transactions.
Based on its consideration of the factors and information it deemed relevant, including those described here, the Board did not find that any ancillary benefits received by Funds Management and its affiliates, including the Sub-Adviser, were unreasonable.
Conclusion
At the Meeting, after considering the above-described factors and based on its deliberations and its evaluation of the information described above, the Board unanimously approved the continuation of the Advisory Agreements for a one-year term and determined that the compensation payable to Funds Management and the Sub-Adviser under each of the Advisory Agreements was reasonable.
Wells Fargo Large Company Value Portfolio | 23
Other information (unaudited)
LIQUIDITY RISK MANAGEMENT PROGRAM
In accordance with Rule 22e-4 under the Investment Company Act of 1940, as amended (the “Liquidity Rule”), Wells Fargo Master Trust (the “Trust”) has adopted and implemented a liquidity risk management program (the “Program”) on behalf of each of its series, including the Portfolio, which is reasonably designed to assess and manage the Portfolio’s liquidity risk. “Liquidity risk” is defined as the risk that the Portfolio is unable to meet redemption requests without significantly diluting remaining investors’ interests in the Portfolio. The Trust’s Board of Trustees (the “Board”) previously approved the designation of Wells Fargo Funds Management, LLC (“Funds Management”), the Portfolio’s investment adviser, as the administrator of the Program, and Funds Management has established a Liquidity Risk Management Council composed of personnel from multiple departments within Funds Management and its affiliates to assist Funds Management in the implementation and on-going administration of the Program.
The Program is comprised of various components designed to support the assessment and/or management of liquidity risk, including: (1) the periodic assessment (no less frequently than annually) of certain factors that influence the Portfolio’s liquidity risk; (2) the periodic classification (no less frequently than monthly) of the Portfolio’s investments into one of four liquidity categories that reflect an estimate of their liquidity under current market conditions; (3) a 15% limit on the acquisition of “illiquid investments” (as defined under the Liquidity Rule); (4) to the extent the Portfolio does not invest primarily in “highly liquid investments” (as defined under the Liquidity Rule), the determination of a minimum percentage of the Portfolio’s assets that generally will be invested in highly liquid investments (an “HLIM”); (5) if the Portfolio has established an HLIM, the periodic review (no less frequently than annually) of the HLIM and the adoption of policies and procedures for responding to a shortfall of the Portfolio’s “highly liquid investments” below its HLIM; and (6) periodic reporting to the Board.
At a meeting of the Board held on May 26 and 28, 2020, the Board received a written report (the “Report”) from Funds Management that addressed the operation of the Program and assessed its adequacy and effectiveness of implementation. The Report covered the initial period from December 1, 2018 through December 31, 2019 (the “Reporting Period”). No significant liquidity events impacting the Portfolio were noted in the Report. There were no material changes to the Program during the Reporting Period. The Report concluded that the Program is operating effectively to assess and manage the Portfolio’s liquidity risk, and that the Program has been and continues to be adequately and effectively implemented to monitor and, as applicable, respond to the Portfolio’s liquidity developments.
24 | Wells Fargo Large Company Value Portfolio

For more information
More information about Wells Fargo Funds is available free upon request. To obtain literature, please write, visit the Fund’s website, or call:
Wells Fargo Funds
P.O. Box 219967
Kansas City, MO 64121-9967
Website: wfam.com
Individual investors: 1-800-222-8222
Retail investment professionals: 1-888-877-9275
Institutional investment professionals: 1-866-765-0778

This report and the financial statements contained herein are submitted for the general information of the shareholders of the Fund. If this report is used for promotional purposes, distribution of the report must be accompanied or preceded by a current prospectus. Before investing, please consider the investment objectives, risks, charges, and expenses of the investment. For a current prospectus and, if available, a summary prospectus, containing this information, call 1-800-222-8222 or visit the Fund’s website at wfam.com. Read the prospectus carefully before you invest or send money.
Wells Fargo Asset Management (WFAM) is the trade name for certain investment advisory/management firms owned by Wells Fargo & Company. These firms include but are not limited to Wells Capital Management Incorporated and Wells Fargo Funds Management, LLC. Certain products managed by WFAM entities are distributed by Wells Fargo Funds Distributor, LLC (a broker-dealer and Member FINRA).
This material is for general informational and educational purposes only and is NOT intended to provide investment advice or a recommendation of any kind—including a recommendation for any specific investment, strategy, or plan.
INVESTMENT PRODUCTS: NOT FDIC INSURED ◾ NO BANK GUARANTEE ◾ MAY LOSE VALUE
© 2020 Wells Fargo & Company. All rights reserved.
Annual Report
May 31, 2020
Wells Fargo International Value Fund
Beginning on January 1, 2021, as permitted by new regulations adopted by the Securities and Exchange Commission, paper copies of the Wells Fargo Funds’ annual and semi-annual shareholder reports issued after this date will no longer be sent by mail, unless you specifically request paper copies of the reports. Instead, the reports will be made available on the Funds’ website, and you will be notified by mail each time a report is posted and provided with a website address to access the report.
If you already elected to receive shareholder reports electronically, you will not be affected by this change and you need not take any action. You may elect to receive shareholder reports and other communications from the Fund electronically at any time by contacting your financial intermediary (such as a broker-dealer or bank) or, if you are a direct investor, by calling 1-800-222-8222 or by enrolling at wellsfargo.com/advantagedelivery.
You may elect to receive all future reports in paper free of charge. If you invest through a financial intermediary, you can contact your financial intermediary to request that you continue to receive paper copies of your shareholder reports; if you invest directly with the Fund, you can call 1-800-222-8222. Your election to receive reports in paper will apply to all Wells Fargo Funds held in your account with your financial intermediary or, if you are a direct investor, to all Wells Fargo Funds that you hold.
|
|
|
Reduce clutter. Save trees. |
Sign up for electronic delivery of prospectuses and
shareholder reports at wellsfargo.com/
advantagedelivery |
The views expressed and any forward-looking statements are as of May 31, 2020, unless otherwise noted, and are those of the Fund managers and/or Wells Fargo Asset Management. Discussions of individual securities, or the markets generally, or any Wells Fargo Fund are not intended as individual recommendations. Future events or results may vary significantly from those expressed in any forward-looking statements. The views expressed are subject to change at any time in response to changing circumstances in the market. Wells Fargo Asset Management and the Fund disclaim any obligation to publicly update or revise any views expressed or forward-looking statements.
INVESTMENT PRODUCTS: NOT FDIC INSURED ◾ NO BANK GUARANTEE ◾ MAY LOSE VALUE
Wells Fargo International Value Fund | 1
Letter to shareholders (unaudited)

Andrew Owen
President
Wells Fargo Funds
Dear Shareholder:
We are pleased to offer you this annual report for the Wells Fargo International Value Fund for the 12-month period that ended May 31, 2020. Global stock markets saw earlier gains erased in February and March as governments around the world took unprecedented measures to stop the spread of the coronavirus at the expense of short-term economic output. However, markets rebounded in April and May to offset much of the losses as central banks attempted to bolster capital markets and confidence. Fixed-income markets generally performed better, achieving widespread gains.
For the 12-month period, fixed-income securities generally had positive total returns while non-U.S. equities had broad losses and U.S. stocks performed strongly despite sharp volatility since late February. For the period, U.S. stocks, based on the S&P 500 Index,1 gained 12.84%. International stocks, as measured by the MSCI ACWI ex USA Index (Net),2 returned -3.43%, while the MSCI EM Index (Net)3 trailed slightly, with a -4.39% return. For bond investors, the Bloomberg Barclays U.S. Aggregate Bond Index4 gained a robust 9.42%, the Bloomberg Barclays Global Aggregate ex-USD Index5 returned 2.67%, and the Bloomberg Barclays Municipal Bond Index6 gained a more modest 3.98%, while the ICE BofA U.S. High Yield Index7 had a slight gain of 0.35%.
The fiscal year began on a positive note.
The 12-month period began with U.S. equity market advances during June and July 2019. The gains, primarily driven by geopolitical and monetary policy events, pushed equity markets to new highs. European Central Bank (ECB) President Mario Draghi indicated the bank was ready to cut rates or buy more assets to prop up inflation if needed. President Trump backed off of earlier tariff threats against Mexico and China. In the U.S., the Federal Reserve (Fed) implemented a 0.25% federal funds rate cut in July.
Later in July, the U.S. reversed course and threatened to impose higher tariffs on China’s exports after talks failed. China responded with tariff threats of its own and devalued the renminbi, roiling global markets. Major U.S. stock market indices closed July with the worst weekly results of the year. Bond prices gained as Treasury yields fell to multiyear lows, and the yield curve inverted at multiple points along the 30-year arc, with shorter-term yields higher than longer-term.
In August, U.S.-China trade tensions continued with no signs of compromise. Evidence of a continued global economic slowdown mounted, and central banks in China, New Zealand, and Thailand cut interest rates. Industrial and manufacturing data declined in China, Canada, Japan, and Germany. Adding to global uncertainty, Italy’s prime minister resigned,
| 1 | The S&P 500 Index consists of 500 stocks chosen for market size, liquidity, and industry group representation. It is a market-value-weighted index with each stock’s weight in the index proportionate to its market value. You cannot invest directly in an index. |
| 2 | The Morgan Stanley Capital International (MSCI) All Country World Index (ACWI) ex USA Index (Net) is a free-float-adjusted market-capitalization-weighted index that is designed to measure the equity market performance of developed and emerging markets, excluding the United States. Source: MSCI. MSCI makes no express or implied warranties or representations and shall have no liability whatsoever with respect to any MSCI data contained herein. The MSCI data may not be further redistributed or used as a basis for other indices or any securities or financial products. This report is not approved, reviewed, or produced by MSCI. You cannot invest directly in an index. |
| 3 | The MSCI Emerging Markets (EM) Index (Net) is a free-float-adjusted market-capitalization-weighted index that is designed to measure equity market performance of emerging markets. You cannot invest directly in an index. |
| 4 | The Bloomberg Barclays U.S. Aggregate Bond Index is a broad-based benchmark that measures the investment-grade, U.S. dollar-denominated, fixed-rate taxable bond market, including Treasuries, government-related and corporate securities, mortgage-backed securities (agency fixed-rate and hybrid adjustable-rate mortgage pass-throughs), asset-backed securities, and commercial mortgage-backed securities. You cannot invest directly in an index. |
| 5 | The Bloomberg Barclays Global Aggregate ex-USD Index is an unmanaged index that provides a broad-based measure of the global investment-grade fixed-income markets excluding the U.S. dollar-denominated debt market. You cannot invest directly in an index. |
| 6 | The Bloomberg Barclays Municipal Bond Index is an unmanaged index composed of long-term tax-exempt bonds with a minimum credit rating of Baa. You cannot invest directly in an index. |
| 7 | The ICE BofA U.S. High Yield Index is a market-capitalization-weighted index of domestic and Yankee high-yield bonds. The index tracks the performance of high-yield securities traded in the U.S. bond market. You cannot invest directly in an index. Copyright 2020. ICE Data Indices, LLC. All rights reserved. |
2 | Wells Fargo International Value Fund
Letter to shareholders (unaudited)
many feared a crackdown in Hong Kong as protestors sustained their calls for reform, and Prime Minister Boris Johnson planned to suspend the British Parliament as Brexit’s deadline neared.
In the U.S., the Fed cut interest rates a second time in September. U.S. manufacturing data disappointed investors. The U.S. Congress announced it would pursue an impeachment investigation of President Trump. Meanwhile, the Brexit impasse showed no signs of resolution. Officials in China said that hitting the country’s economic growth goals for the year would be difficult considering the weight of tariffs and trade restrictions. Although the S&P 500 Index finished the third quarter with the best year-to-date returns in more than 20 years, concerns about future returns remained.
The fourth quarter of 2019 started on a strong note, with U.S.-China trade tensions relaxing in October along with renewed optimism for a U.K. Brexit deal and positive macroeconomic data. The initial estimate of U.S. third-quarter gross domestic product growth was a resilient 1.9% annualized rate, while the U.S. unemployment rate fell to a 50-year low of 3.5% in September. However, despite resilience among U.S. consumers, business confidence declined and manufacturing activity contracted. Concerned with a potential economic slowdown, the Fed lowered interest rates another quarter point in late October—its third rate cut in four months. This helped push the S&P 500 Index to a new all-time high while emerging market equities rallied and global bonds declined overall, reflecting a broad pickup in risk appetite.
Equity markets continued to rally in November despite ongoing geopolitical risks. Hopes for a U.S.-China trade deal buoyed investor confidence. U.S. business sentiment improved slightly, and manufacturing and services activity picked up. While consumer confidence and purchasing manager activity rose in the eurozone, China reported weakening manufacturing and consumer data. Bond yields rose marginally, leading to slightly negative returns for global government and investment-grade corporate bonds.
Financial markets ended 2019 with a boost from the U.S. and China accord on a Phase One trade deal. That, along with the landslide win by the pro-Brexit U.K. Conservative Party in a national election and ongoing central bank support, gave investors greater confidence. U.S. economic indicators were generally positive, with the exception of manufacturing activity and business confidence. Consumer confidence was resilient, fed by a robust labor market, tame inflation, and lower interest rates, which boosted housing affordability and stimulated homebuyer activity. The impeachment of U.S. President Donald Trump had little impact on markets. Meanwhile, slowing Chinese economic activity, partly attributable to the trade war, led to further government stimulus at year-end through lower reserve ratios, allowing banks to lend more money.
The year-end rally continued in early January 2020. However, capital market volatility picked up sharply in late January on concerns over the potential impact of the coronavirus on the global economy and stock markets. With sentiment somewhat souring, perceived safe havens did well in January. The U.S. dollar and Japanese yen both rose, and government bonds outperformed equities. While the S&P 500 Index held its ground, emerging market equities tumbled, including those in Asia.
In February, the coronavirus became the major market focus. Fears of the virus’s impact on global growth led to expectations of increased global central bank monetary policy support. That led the 10-year U.S. Treasury yield to fall to an all-time low of 1.1% by the end of the month. Although equity markets initially shrugged off concerns about the outbreak, focusing instead on strong fourth-quarter earnings and improving business confidence in January, market sentiment turned sharply lower toward month-end and the S&P 500 Index lost 8.2% for the month. Oil prices tumbled as Russia and the Organization of the Petroleum Exporting Countries compounded a major decline in oil demand with a brutal price war, partly aimed at dissuading further U.S. shale production. As a result, the price of West Texas Intermediate crude oil fell 13% in February.
Wells Fargo International Value Fund | 3
Letter to shareholders (unaudited)
“The global spread of the coronavirus led country after country to clamp down on social and business-related activity in order to contain the virus from causing even greater devastation and overwhelming health care systems.”
“Markets rebounded strongly in April after the earlier extreme volatility, with the S&P 500 Index gaining 12.8% for the month and the MSCI ACWI ex USA Index (Net) returning 7.6%.”
|
|
|
For further information about your Fund, contact your investment professional, visit our website at wfam.com, or call us directly at 1-800-222-8222. |
The global spread of the coronavirus led country after country to clamp down on social and business-related activity in order to contain the virus from causing even greater devastation and overwhelming health care systems. This abrupt stoppage of economic activity led to the sharp deceleration of global output, sending economies into a deep contraction. Central bank responses were swift, as they slashed interest rates and expanded quantitative easing programs to restore liquidity and confidence to the markets. In the U.S., the Fed introduced several new lending programs, funding investment-grade bonds, money market mutual funds, and commercial paper while purchasing Treasuries, mortgage-backed securities, and overnight repurchase agreements. Meanwhile, stock markets tumbled quickly into a bear market, ending the longest bull stock market in U.S. history.
Markets rebounded strongly in April after the earlier extreme volatility, with the S&P 500 Index gaining 12.8% for the month and the MSCI ACWI ex USA Index (Net) returning 7.6%. The rebound was fueled by unprecedented government and central bank stimulus measures taken to buffer the economic damage created by mass shutdowns enacted in order to contain the virus’s spread. The U.S. economy contracted by an annualized 4.8% pace in the first quarter, with 30 million new unemployment insurance claims in six weeks. In the eurozone, first-quarter real gross domestic product (GDP) shrank 3.8%, with the composite April Flash Purchasing Managers’ Index, a monthly survey of purchasing managers, falling to an all-time low of 13.5. The ECB expanded its quantitative easing to include the purchase of additional government bonds of countries with the greatest virus-related need, including Italy and Spain. China’s first-quarter GDP fell by 6.8% year over year. However, retail sales, production, and investment showed signs of recovery. Extreme oil price volatility continued as global supply far exceeded demand.
In May, the equity market rebound continued, with the S&P 500 Index climbing a further 4.8%. European and Japanese stock markets also had monthly gains. Investors regained confidence on reports of early signs of success in human trials of a coronavirus vaccine. Growth stocks continued to outperform value stocks while returns on global government bonds were generally flat. In the U.S., a gap grew between the stock market rebound and devastating economic data points, including an April unemployment rate of 14.7%, the highest level since World War II. Purchasing managers’ indices continued to reflect weakening activity in May in both the manufacturing and services sectors. U.S. corporate earnings reports indicated a 14% year-over-year contraction in earnings from the first quarter of 2019. However, high demand for technology, driven by remote activity, helped maintain robust information technology sector earnings, which helped drive powerful well-known technology stocks higher.
Don’t let short-term uncertainty derail long-term investment goals.
Periods of investment uncertainty can present challenges, but experience has taught us that maintaining long-term investment goals can be an effective way to plan for the future. To help you create a sound strategy based on your personal goals and risk tolerance, Wells Fargo Funds offers more than 100 mutual funds spanning a wide range of asset classes and investment styles. Although diversification cannot guarantee an investment profit or prevent losses, we believe it can be an effective way to manage investment risk and potentially smooth out overall portfolio performance. We encourage investors to know their investments and to understand that appropriate levels of risk-taking may unlock opportunities.
Thank you for choosing to invest with Wells Fargo Funds. We appreciate your confidence in us and remain committed to helping you meet your financial needs.
Sincerely,

Andrew Owen
President
Wells Fargo Funds
4 | Wells Fargo International Value Fund
This page is intentionally left blank.
Performance highlights (unaudited)
Investment objective
The Fund seeks long-term capital appreciation.
Manager
Wells Fargo Funds Management, LLC
Subadviser for the affiliated master portfolio1
LSV Asset Management
Portfolio managers
Josef Lakonishok, Ph.D.
Puneet Mansharamani, CFA®‡
Menno Vermeulen, CFA®‡
Average annual total returns (%) as of May 31, 2020
| | | | | | | | | | | | | | | | | | | | | | | | | | | | | | | | | | |
| | | | |
| | | | | Including sales charge | | | Excluding sales charge | | | Expense ratios2 (%) | |
| | | | | | | | | |
| | | Inception date | | 1 year | | | 5 year | | | 10 year | | | 1 year | | | 5 year | | | 10 year | | | Gross | | | Net3 | |
| | | | | | | | | | |
| Class A (WFFAX) | | 10-31-2003 | | | -14.86 | | | | -3.41 | | | | 2.46 | | | | -9.66 | | | | -2.26 | | | | 3.07 | | | | 1.33 | | | | 1.24 | |
| | | | | | | | | | |
| Class C (WFVCX) | | 4-8-2005 | | | -11.38 | | | | -3.01 | | | | 2.28 | | | | -10.38 | | | | -3.01 | | | | 2.28 | | | | 2.08 | | | | 1.99 | |
| | | | | | | | | | |
| Class R6 (WFRVX)4 | | 7-31-2018 | | | – | | | | – | | | | – | | | | -9.27 | | | | -1.89 | | | | 3.49 | | | | 0.90 | | | | 0.84 | |
| | | | | | | | | | |
| Administrator Class (WFVDX) | | 4-8-2005 | | | – | | | | – | | | | – | | | | -9.60 | | | | -2.22 | | | | 3.21 | | | | 1.25 | | | | 1.14 | |
| | | | | | | | | | |
| Institutional Class (WFVIX) | | 8-31-2006 | | | – | | | | – | | | | – | | | | -9.32 | | | | -1.91 | | | | 3.48 | | | | 1.00 | | | | 0.89 | |
| | | | | | | | | | |
| MSCI EAFE Value Index (Net)5 | | – | | | – | | | | – | | | | – | | | | -13.03 | | | | -2.89 | | | | 2.96 | | | | – | | | | – | |
Figures quoted represent past performance, which is no guarantee of future results, and do not reflect taxes that a shareholder may pay on an investment in a fund. Investment return and principal value of an investment will fluctuate so that an investor’s shares, when redeemed, may be worth more or less than their original cost. Performance shown without sales charges would be lower if sales charges were reflected. Current performance may be lower or higher than the performance data quoted, which assumes the reinvestment of dividends and capital gains. Current month-end performance is available on the Fund’s website, wfam.com.
Index returns do not include transaction costs associated with buying and selling securities, any mutual fund fees or expenses, or any taxes. It is not possible to invest directly in an index.
For Class A shares, the maximum front-end sales charge is 5.75%. For Class C shares, the maximum contingent deferred sales charge is 1.00%. Performance including a contingent deferred sales charge assumes the sales charge for the corresponding time period. Class R6, Administrator Class, and Institutional Class shares are sold without a front-end sales charge or contingent deferred sales charge.
Stock values fluctuate in response to the activities of individual companies and general market and economic conditions. Foreign investments are especially volatile and can rise or fall dramatically due to differences in the political and economic conditions of the host country. These risks are generally intensified in emerging markets. The use of derivatives may reduce returns and/or increase volatility. Certain investment strategies tend to increase the total risk of an investment (relative to the broader market). The Fund is exposed to smaller-company securities risk. Consult the Fund’s prospectus for additional information on these and other risks.
Please see footnotes on page 7.
6 | Wells Fargo International Value Fund
Performance highlights (unaudited)
|
|
| Growth of $10,000 investment as of May 31, 20206 |
|
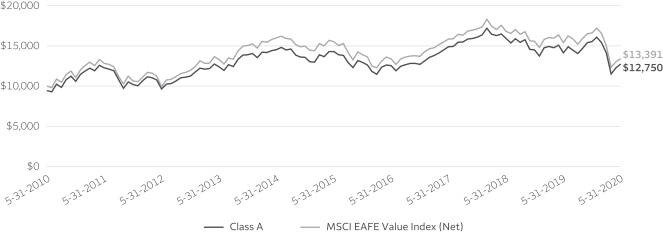
|
| ‡ | CFA® and Chartered Financial Analyst® are trademarks owned by CFA Institute. |
| 1 | The Fund is a feeder fund in a master-feeder structure that invests substantially all of its assets in a single affiliated master portfolio of the Wells Fargo Master Trust with a substantially identical investment objective and substantially similar investment strategies. References to the investment activities of the Fund are intended to refer to the investment activities of the affiliated master portfolio in which it invests. |
| 2 | Reflects the expense ratios as stated in the most recent prospectuses. The expense ratios shown are subject to change and may differ from the annualized expense ratios shown in the financial highlights of this report. |
| 3 | The manager has contractually committed through September 30, 2020, to waive fees and/or reimburse expenses to the extent necessary to cap total annual fund operating expenses after fee waivers at 1.24% for Class A, 1.99% for Class C, 0.84% for Class R6, 1.14% for Administrator Class, and 0.89% for Institutional Class. Brokerage commissions, stamp duty fees, interest, taxes, acquired fund fees and expenses (if any) from funds in which the affiliated master portfolio invests, and extraordinary expenses are excluded from the expense caps. Net expenses from the affiliated master portfolio are included in the expense caps. Prior to or after the commitment expiration date, the caps may be increased or the commitment to maintain the caps may be terminated only with the approval of the Board of Trustees. Without these caps, the Fund’s returns would have been lower. The expense ratio paid by an investor is the net expense ratio (the total annual fund operating expenses after fee waivers) as stated in the prospectuses. |
| 4 | Historical performance shown for the Class R6 shares prior to their inception reflects the performance of the Institutional Class shares, and includes the higher expenses applicable to the Institutional Class shares. If these expenses had not been included, returns for the Class R6 shares would be higher. |
| 5 | The Morgan Stanley Capital International (MSCI) Europe, Australasia, and Far East (EAFE) Value Index (Net) is a free-float-adjusted market capitalization-weighted index that is designed to measure the equity market performance of value securities within developed equity markets, excluding the United States and Canada. Source: MSCI. MSCI makes no express or implied warranties or representations and shall have no liability whatsoever with respect to any MSCI data contained herein. The MSCI data may not be further redistributed or used as a basis for other indices or any securities or financial products. This report is not approved, reviewed, or produced by MSCI. You cannot invest directly in an index. |
| 6 | The chart compares the performance of Class A shares for the most recent ten years with the MSCI EAFE Value Index (Net). The chart assumes a hypothetical $10,000 investment in Class A shares and reflects all operating expenses and assumes the maximum initial sales charge of 5.75%. |
| 7 | The MSCI EAFE Index (Net) is a free-float-adjusted market-capitalization-weighted index that is designed to measure the equity market performance of developed markets, excluding the United States and Canada. You cannot invest directly in an index. |
| 8 | The MSCI EAFE Growth Index (Net) is a free-float-adjusted market-capitalization-weighted index that is designed to measure the equity market performance of growth securities within developed equity markets, excluding the United States and Canada. You cannot invest directly in an index. |
| 9 | The ten largest holdings, excluding cash, cash equivalents and any money market funds, are calculated based on the value of the securities of the affiliated master portfolio allocable to the Fund divided by the total net assets of the Fund. Holdings are subject to change and may have changed since the date specified. |
| 10 | Amounts represent the allocation of the affiliated master portfolio which are calculated based on the total long-term investments of the affiliated master portfolio. These amounts are subject to change and may have changed since the date specified. |
| * | The security was no longer held at the end of the period. |
Wells Fargo International Value Fund | 7
Performance highlights (unaudited)
MANAGER’S DISCUSSION
Fund highlights
| ∎ | | The Fund outperformed its benchmark, the MSCI EAFE Value Index (Net), for the 12-month period that ended May 31, 2020. |
| ∎ | | While value stocks continued to underperform in the period, strong stock selection and positive sector allocation contributed to the Fund’s outperformance relative to the value benchmark. The Fund’s underweight to financials—in particular, the underweight to banks—and overweight to health care and consumer staples stocks relative to the value benchmark had a positive impact on results. While the Fund’s holdings in the industrials and consumer discretionary sectors struggled, stock selection was strong in the materials, financials, energy, and information technology (IT) sectors. |
| ∎ | | The most significant detractor in the period was the poor environment for value stocks, which lagged growth stocks by more than 20% in the developed international markets. |
International developed stock markets declined during the period.
International developed stock markets declined over the past 12 months, with the MSCI EAFE Index (Net)7 falling 2.81%. Value stocks trailed growth stocks by a significant margin in the period, as the MSCI EAFE Value Index (Net) declined 13.03% while the MSCI EAFE Growth Index (Net)8 gained 7.44%. Global equity markets finished 2019 on a strong note, rallying on strong economic data, reduced trade tensions, and continued accommodative central bank policies around the world. The market advance was abruptly interrupted in the first quarter of 2020 as the coronavirus pandemic prompted sweeping economic shutdowns across the globe. The economic impacts of containment measures and worldwide recessionary fears sent equities sharply lower, particularly value stocks, which were punished in the sell-off. There was a wide dispersion of sector returns for the trailing 12 months. Health care stocks advanced nearly 30% and IT stocks were up 15%. However, energy stocks fell more than 30% while financials and real estate stocks declined nearly 20%.
| | | | |
|
| Ten largest holdings (%) as of May 31, 20209 | |
| | |
Roche Holding AG | | | 3.38 | |
| | |
Sanofi SA | | | 2.18 | |
| | |
Novartis AG | | | 2.16 | |
| | |
KDDI Corporation | | | 1.70 | |
| | |
Nippon Telegraph & Telephone Corporation | | | 1.63 | |
| | |
GlaxoSmithKline plc | | | 1.59 | |
| | |
Koninklijke Ahold Delhaize NV | | | 1.47 | |
| | |
Enel SpA | | | 1.41 | |
| | |
Total SA | | | 1.39 | |
| | |
British American Tobacco plc | | | 1.14 | |
Strong stock selection and sector allocation contributed to the Fund’s relative performance.
The difficult environment for value stocks had a negative impact on results given the Fund’s emphasis on deeper value stocks. However, strong stock selection and positive sector allocation contributed to the Fund’s outperformance relative to the value benchmark. The Fund’s underweight to financials—in particular, the underweight to banks—and overweight to health care and consumer staples stocks relative to the value benchmark had a positive impact on results. While the Fund’s holdings in the industrials and consumer discretionary sectors struggled, stock selection was strong in the materials, financials, energy, and IT sectors.
|
|
| Sector allocation as of May 31, 202010 |
|
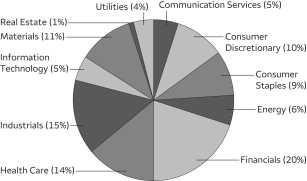
|
|
|
| Geographic allocation as of May 31, 202010 |
|
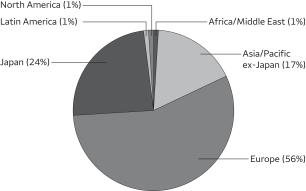 |
Please see footnotes on page 7.
8 | Wells Fargo International Value Fund
Performance highlights (unaudited)
Top-contributing stocks included pharmaceutical holdings Roche Holding Limited AG and Astellas Pharma Incorporated, which were up approximately 30%. Materials holdings Fortescue Metals, Highland Gold Mining, and China Resources Cement Holdings also contributed for the period. Underweights to integrated oil and gas companies Royal Dutch Shell and BP plc also added value. Integrated oil and gas stocks declined 35% as oil prices plummeted due to both demand and supply shocks. In addition, underweights to financials HSBC Holdings* and Banco Santander added value.
Brazilian financial holdings hurt performance.
Detractors included Brazilian financial holdings Banco do Estado do Rio Grande do Sul and Banco do Brasil* as well as Natixis in the financials sector and industrials holding Schneider Electric*. Underweights to Novartis AG, Toyota Motor Company*, Softbank Group*, and British American Tobacco all detracted, although we began buying Novartis and British American Tobacco late in the period.
The most significant changes to sector exposures during the period included an increase in IT and health care stocks and a decrease in industrials and utilities stocks. The Fund added to several pharmaceutical holdings, including Astellas Pharma, Kaken Pharmaceutical, Teva Pharmaceutical, and Bayer, and initiated a position in Swiss pharmaceutical company Novartis. The Fund initiated positions in several IT stocks, including Hon Hai Precision Technology, Tripod Technology, and Wistron Corporation in Taiwan and added to IT holdings Tech Mahindra in India and semiconductor company Siltronic.
The Fund reduced its weight to the industrials and utilities sectors relative to the value benchmark. The Fund trimmed its positions in U.K. aerospace and defense holding BAE Systems and engineering and construction company Bouygues in France. The Fund sold several Japanese industrials, including Central Glass, Fujikura, and Maeda Road Construction. Among utilities, the Fund sold Iberdrola in Spain and reduced the weight to Italian utility Enel.
The Fund is overweight the industrials, consumer staples, IT, and health care sectors relative to the value benchmark while underweight the financials, utilities, communication services, and real estate sectors.
We believe the Fund is well positioned given the recent difficult environment for value stocks.
Both in normal market periods and during large stock market downturns as we experienced in early 2020, the Fund has employed a disciplined, diversified, value-oriented approach that patiently takes advantage of investors’ tendency to overreact to information about the prospects of each company’s long-term earnings and cash flows. While value stocks have suffered over the past few years, we have weathered previous tough periods for our approach. It has been our experience that difficult periods for value stocks have historically presented investors with some of the best buying opportunities in history and this recent episode of value underperformance seems to be providing such opportunities.
Please see footnotes on page 7.
Wells Fargo International Value Fund | 9
Fund expenses (unaudited)
As a shareholder of the Fund, you incur two types of costs: (1) transaction costs, including sales charges (loads) on purchase payments and contingent deferred sales charges (if any) on redemptions and (2) ongoing costs, including management fees, distribution (12b-1) and/or shareholder servicing fees, and other Fund expenses. This example is intended to help you understand your ongoing costs (in dollars) of investing in the Fund and to compare these costs with the ongoing costs of investing in other mutual funds.
The example is based on an investment of $1,000 invested at the beginning of the six-month period and held for the entire period from December 1, 2019 to May 31, 2020.
Actual expenses
The “Actual” line of the table below provides information about actual account values and actual expenses. You may use the information in this line, together with the amount you invested, to estimate the expenses that you paid over the period. Simply divide your account value by $1,000 (for example, an $8,600 account value divided by $1,000 = 8.6), then multiply the result by the number in the “Actual” line under the heading entitled “Expenses paid during period” for your applicable class of shares to estimate the expenses you paid on your account during this period.
Hypothetical example for comparison purposes
The “Hypothetical” line of the table below provides information about hypothetical account values and hypothetical expenses based on the Fund’s actual expense ratio and an assumed rate of return of 5% per year before expenses, which is not the Fund’s actual return. The hypothetical account values and expenses may not be used to estimate the actual ending account balance or expenses you paid for the period. You may use this information to compare the ongoing costs of investing in the Fund and other funds. To do so, compare this 5% hypothetical example with the 5% hypothetical examples that appear in the shareholder reports of the other funds.
Please note that the expenses shown in the table are meant to highlight your ongoing costs only and do not reflect any transactional costs, such as sales charges (loads) and contingent deferred sales charges. Therefore, the “Hypothetical” line of the table is useful in comparing ongoing costs only and will not help you determine the relative total costs of owning different funds. In addition, if these transactional costs were included, your costs would have been higher.
| | | | | | | | | | | | | | | | |
| | | Beginning
account value
12-1-2019 | | | Ending
account value
5-31-2020 | | | Expenses
paid during
the period1,2 | | | Annualized net
expense ratio1 | |
| | | | | |
Class A | | | | | | | | | | | | | | | | |
| | | | |
Actual | | $ | 1,000.00 | | | $ | 822.65 | | | $ | 5.65 | | | | 1.24 | % |
| | | | |
Hypothetical (5% return before expenses) | | $ | 1,000.00 | | | $ | 1,018.80 | | | $ | 6.26 | | | | 1.24 | % |
| | | | | |
Class C | | | | | | | | | | | | | | | | |
| | | | |
Actual | | $ | 1,000.00 | | | $ | 818.68 | | | $ | 9.04 | | | | 1.99 | % |
| | | | |
Hypothetical (5% return before expenses) | | $ | 1,000.00 | | | $ | 1,015.06 | | | $ | 10.01 | | | | 1.99 | % |
| | | | | |
Class R6 | | | | | | | | | | | | | | | | |
| | | | |
Actual | | $ | 1,000.00 | | | $ | 823.59 | | | $ | 3.82 | | | | 0.84 | % |
| | | | |
Hypothetical (5% return before expenses) | | $ | 1,000.00 | | | $ | 1,020.81 | | | $ | 4.24 | | | | 0.84 | % |
| | | | | |
Administrator Class | | | | | | | | | | | | | | | | |
| | | | |
Actual | | $ | 1,000.00 | | | $ | 822.73 | | | $ | 5.19 | | | | 1.14 | % |
| | | | |
Hypothetical (5% return before expenses) | | $ | 1,000.00 | | | $ | 1,019.31 | | | $ | 5.75 | | | | 1.14 | % |
| | | | | |
Institutional Class | | | | | | | | | | | | | | | | |
| | | | |
Actual | | $ | 1,000.00 | | | $ | 824.34 | | | $ | 4.06 | | | | 0.89 | % |
| | | | |
Hypothetical (5% return before expenses) | | $ | 1,000.00 | | | $ | 1,020.55 | | | $ | 4.49 | | | | 0.89 | % |
| 1 | Amounts reflect net expenses allocated from the affiliated Master Portfolio in which the Fund invests. |
| 2 | Expenses paid is equal to the annualized net expense ratio of each class multiplied by the average account value over the period, multiplied by the number of days in the most recent fiscal half-year divided by the number of days in the fiscal year (to reflect the one-half-year period). |
10 | Wells Fargo International Value Fund
Portfolio of investments—May 31, 2020
| | | | | | | | | | | | | | | | |
| | | | | | | | | | | | Value | |
| Investment Companies: 101.96% | |
|
| Affiliated Master Portfolio: 101.96% | |
Wells Fargo International Value Portfolio | | | | | | | | | | | | | | $ | 591,513,965 | |
| | | | | | | | | | | | | | | | |
| | | | |
Total Investment Companies (Cost $704,237,519) | | | | | | | | | | | | | | | 591,513,965 | |
| | | | | | | | | | | | | | | | |
| | | | | | | | |
| Total investments in securities (Cost $704,237,519) | | | 101.96 | % | | | 591,513,965 | |
| | |
Other assets and liabilities, net | | | (1.96 | ) | | | (11,363,618 | ) |
| | | | | | | | |
| Total net assets | | | 100.00 | % | | $ | 580,150,347 | |
| | | | | | | | |
Transactions with the affiliated Master Portfolio were as follows:
| | | | | | | | | | | | | | | | | | | | | | | | | | | | | | | | |
| | | % of
ownership,
beginning
of period | | | % of
ownership,
end of
period | | | Net realized
gains
(losses) on
securities
transactions
allocated
from
affiliated
Master
Portfolio | | | Net change in
unrealized
gains
(losses) on
securities
transactions
allocated
from
affiliated
Master
Portfolio | | | Dividends
allocated
from
affiliated
Master
Portfolio | | | Affiliated
income
allocated
from
affiliated
Master
Portfolio | | | Value, end
of period | | | % of
net
assets | |
Wells Fargo International Value Portfolio | | | 79 | % | | | 75 | % | | $ | (11,553,693 | ) | | $ | (47,127,244 | ) | | $ | 24,568,929 | | | $ | 584,487 | | | $ | 591,513,965 | | | | 101.96 | % |
The accompanying notes are an integral part of these financial statements.
Wells Fargo International Value Fund | 11
Statement of assets and liabilities—May 31, 2020
| | | | |
| | | | |
| |
Assets | | | | |
Investments in affiliated Master Portfolio, at value (cost $704,237,519) | | $ | 591,513,965 | |
Receivable for Fund shares sold | | | 156,467 | |
Receivable from manager | | | 72,589 | |
Prepaid expenses and other assets | | | 198,310 | |
| | | | |
Total assets | | | 591,941,331 | |
| | | | |
| |
Liabilities | | | | |
Payable for Fund shares redeemed | | | 11,700,659 | |
Administration fees payable | | | 67,044 | |
Distribution fee payable | | | 247 | |
Trustees’ fees and expenses payable | | | 825 | |
Accrued expenses and other liabilities | | | 22,209 | |
| | | | |
Total liabilities | | | 11,790,984 | |
| | | | |
Total net assets | | $ | 580,150,347 | |
| | | | |
| |
Net assets consist of | | | | |
Paid-in capital | | $ | 705,098,664 | |
Total distributable loss | | | (124,948,317 | ) |
| | | | |
Total net assets | | $ | 580,150,347 | |
| | | | |
| |
Computation of net asset value and offering price per share | | | | |
Net assets – Class A | | $ | 64,413,639 | |
Shares outstanding – Class A1 | | | 5,414,640 | |
Net asset value per share – Class A | | | $11.90 | |
Maximum offering price per share – Class A2 | | | $12.63 | |
Net assets – Class C | | $ | 413,978 | |
Shares outstanding – Class C1 | | | 35,646 | |
Net asset value per share – Class C | | | $11.61 | |
Net assets – Class R6 | | $ | 2,843,048 | |
Shares outstanding – Class R61 | | | 241,890 | |
Net asset value per share – Class R6 | | | $11.75 | |
Net assets – Administrator Class | | $ | 2,270,868 | |
Shares outstanding – Administrator Class1 | | | 189,237 | |
Net asset value per share – Administrator Class | | | $12.00 | |
Net assets – Institutional Class | | $ | 510,208,814 | |
Shares outstanding – Institutional Class1 | | | 43,401,590 | |
Net asset value per share – Institutional Class | | | $11.76 | |
| 1 | The Fund has an unlimited number of authorized shares. |
| 2 | Maximum offering price is computed as 100/94.25 of net asset value. On investments of $50,000 or more, the offering price is reduced. |
The accompanying notes are an integral part of these financial statements.
12 | Wells Fargo International Value Fund
Statement of operations—year ended May 31, 2020
| | | | |
| | | | |
| |
Investment income | | | | |
Dividends allocated from affiliated Master Portfolio (net of foreign withholding taxes of $3,630,890) | | $ | 24,568,929 | |
Affiliated income allocated from affiliated Master Portfolio | | | 584,487 | |
Expenses allocated from affiliated Master Portfolio | | | (6,587,687 | ) |
Waivers allocated from affiliated Master Portfolios | | | 2,171 | |
| | | | |
Total investment income | | | 18,567,900 | |
| | | | |
| |
Expenses | | | | |
Management fee | | | 412,177 | |
Administration fees | | | | |
Class A | | | 142,265 | |
Class C | | | 1,171 | |
Class R6 | | | 377 | |
Administrator Class | | | 3,869 | |
Institutional Class | | | 977,363 | |
Shareholder servicing fees | | | | |
Class A | | | 169,354 | |
Class C | | | 1,392 | |
Administrator Class | | | 7,437 | |
Distribution fee | | | | |
Class C | | | 4,174 | |
Custody and accounting fees | | | 25,859 | |
Professional fees | | | 39,206 | |
Registration fees | | | 183,441 | |
Shareholder report expenses | | | 202,045 | |
Trustees’ fees and expenses | | | 21,592 | |
Other fees and expenses | | | 25,332 | |
| | | | |
Total expenses | | | 2,217,054 | |
Less: Fee waivers and/or expense reimbursements | | | | |
Fund-level | | | (970,738 | ) |
Class A | | | (5,218 | ) |
Class R6 | | | (98 | ) |
Class Administrator | | | (677 | ) |
Institutional Class | | | (166,871 | ) |
| | | | |
Net expenses | | | 1,073,452 | |
| | | | |
Net investment income | | | 17,494,448 | |
| | | | |
| |
Realized and unrealized gains (losses) on investments | | | | |
Net realized losses on securities transactions allocated from affiliated Master Portfolio | | | (11,553,693 | ) |
Net change in unrealized gains (losses) on securities transactions allocated from affiliated Master Portfolio | | | (47,127,244 | ) |
| | | | |
Net realized and unrealized gains (losses) on investments | | | (58,680,937 | ) |
| | | | |
Net decrease in net assets resulting from operations | | $ | (41,186,489 | ) |
| | | | |
The accompanying notes are an integral part of these financial statements.
Wells Fargo International Value Fund | 13
Statement of changes in net assets
| | | | | | | | | | | | | | | | |
| | | Year ended
May 31, 2020 | | | Year ended
May 31, 2019 | |
| | | |
Operations | | | | | | | | | | | | |
Net investment income | | | | | | $ | 17,494,448 | | | | | | | $ | 29,474,112 | |
Net realized losses on investments | | | | | | | (11,553,693 | ) | | | | | | | (1,507,425 | ) |
Net change in unrealized gains (losses) on investments | | | | | | | (47,127,244 | ) | | | | | | | (128,322,670 | ) |
| | | | |
Net decrease in net assets resulting from operations | | | | | | | (41,186,489 | ) | | | | | | | (100,355,983 | ) |
| | | | |
| | | |
Distributions to shareholders from net investment income and net realized gains | | | | | | | | | | | | |
Class A | | | | | | | (1,987,586 | ) | | | | | | | (1,313,945 | ) |
Class C | | | | | | | (10,928 | ) | | | | | | | (14,168 | ) |
Class R6 | | | | | | | (20,220 | ) | | | | | | | (596 | )1 |
Administrator Class | | | | | | | (93,039 | ) | | | | | | | (77,201 | ) |
Institutional Class | | | | | | | (29,054,083 | ) | | | | | | | (20,194,351 | ) |
| | | | |
Total distributions to shareholders | | | | | | | (31,165,856 | ) | | | | | | | (21,600,261 | ) |
| | | | |
| | | | |
Capital share transactions | | | Shares | | | | | | | | Shares | | | | | |
Proceeds from shares sold | | | | | | | | | | | | | | | | |
Class A | | | 2,695,644 | | | | 34,135,676 | | | | 3,672,486 | | | | 53,518,580 | |
Class C | | | 7,349 | | | | 103,617 | | | | 16,692 | | | | 242,225 | |
Class R6 | | | 245,451 | | | | 3,473,318 | | | | 24,567 | 1 | | | 344,146 | 1 |
Administrator Class | | | 12,438 | | | | 168,373 | | | | 32,361 | | | | 477,105 | |
Institutional Class | | | 14,319,614 | | | | 186,253,039 | | | | 18,526,386 | | | | 265,263,060 | |
| | | | |
| | | | | | | 224,134,023 | | | | | | | | 319,845,116 | |
| | | | |
Reinvestment of distributions | | | | | | | | | | | | | | | | |
Class A | | | 131,792 | | | | 1,986,109 | | | | 100,957 | | | | 1,313,445 | |
Class C | | | 741 | | | | 10,928 | | | | 1,114 | | | | 14,168 | |
Class R6 | | | 1,307 | | | | 19,422 | | | | 0 | 1 | | | 0 | 1 |
Administrator Class | | | 6,052 | | | | 91,935 | | | | 5,827 | | | | 76,387 | |
Institutional Class | | | 1,945,419 | | | | 28,908,926 | | | | 1,565,162 | | | | 20,081,032 | |
| | | | |
| | | | | | | 31,017,320 | | | | | | | | 21,485,032 | |
| | | | |
Payment for shares redeemed | | | | | | | | | | | | | | | | |
Class A | | | (1,650,931 | ) | | | (23,070,567 | ) | | | (2,002,351 | ) | | | (28,345,901 | ) |
Class C | | | (23,596 | ) | | | (307,728 | ) | | | (41,168 | ) | | | (575,161 | ) |
Class R6 | | | (29,425 | ) | | | (350,322 | ) | | | (10 | )1 | | | (134 | )1 |
Administrator Class | | | (76,336 | ) | | | (1,034,358 | ) | | | (169,343 | ) | | | (2,557,464 | ) |
Institutional Class | | | (31,599,337 | ) | | | (426,275,889 | ) | | | (14,671,752 | ) | | | (210,525,992 | ) |
| | | | |
| | | | | | | (451,038,864 | ) | | | | | | | (242,004,652 | ) |
| | | | |
Net increase (decrease) in net assets resulting from capital share transactions | | | | | | | (195,887,521 | ) | | | | | | | 99,325,496 | |
| | | | |
Total decrease in net assets | | | | | | | (268,239,866 | ) | | | | | | | (22,630,748 | ) |
| | | | |
| | |
Net assets | | | | | | | | |
Beginning of period | | | | | | | 848,390,213 | | | | | | | | 871,020,961 | |
| | | | |
End of period | | | | | | $ | 580,150,347 | | | | | | | $ | 848,390,213 | |
| | | | |
| 1 | For the period from July 31, 2018 (commencement of class operations) to May 31, 2019 |
The accompanying notes are an integral part of these financial statements.
14 | Wells Fargo International Value Fund
Financial highlights
(For a share outstanding throughout each period)
| | | | | | | | | | | | | | | | | | | | |
| | | Year ended May 31 | |
| CLASS A | | 2020 | | | 2019 | | | 2018 | | | 2017 | | | 2016 | |
Net asset value, beginning of period | | | $13.55 | | | | $15.68 | | | | $14.88 | | | | $12.83 | | | | $14.85 | |
Net investment income | | | 0.27 | 1 | | | 0.47 | 1 | | | 0.72 | 1 | | | 0.09 | 1 | | | 0.26 | |
Net realized and unrealized gains (losses) on investments | | | (1.49 | ) | | | (2.27 | ) | | | 0.35 | | | | 2.26 | | | | (2.08 | ) |
| | | | | | | | | | | | | | | | | | | | |
Total from investment operations | | | (1.22 | ) | | | (1.80 | ) | | | 1.07 | | | | 2.35 | | | | (1.82 | ) |
Distributions to shareholders from | | | | | | | | | | | | | | | | | | | | |
Net investment income | | | (0.43 | ) | | | (0.33 | ) | | | (0.27 | ) | | | (0.30 | ) | | | (0.20 | ) |
Net asset value, end of period | | | $11.90 | | | | $13.55 | | | | $15.68 | | | | $14.88 | | | | $12.83 | |
Total return2 | | | (9.66 | )% | | | (11.42 | )% | | | 7.12 | % | | | 18.65 | % | | | (12.31 | )% |
Ratios to average net assets (annualized) | | | | | | | | | | | | | | | | | | | | |
Gross expenses3 | | | 1.37 | % | | | 1.34 | % | | | 1.34 | % | | | 1.39 | % | | | 1.46 | % |
Net expenses3 | | | 1.25 | % | | | 1.33 | % | | | 1.34 | % | | | 1.35 | % | | | 1.39 | % |
Net investment income3 | | | 1.99 | % | | | 3.22 | % | | | 4.48 | % | | | 0.69 | % | | | 1.98 | % |
Supplemental data | | | | | | | | | | | | | | | | | | | | |
Portfolio turnover rate4 | | | 20 | % | | | 13 | % | | | 15 | % | | | 41 | % | | | 14 | % |
Net assets, end of period (000s omitted) | | | $64,414 | | | | $57,427 | | | | $38,677 | | | | $2,571 | | | | $4,981 | |
| 1 | Calculated based upon average shares outstanding |
| 2 | Total return calculations do not include any sales charges. |
| 3 | Ratios include net expenses allocated from the affiliated Master Portfolio which were as follows: |
| | | | |
Year ended May 31, 2020 | | | 0.80 | % |
Year ended May 31, 2019 | | | 0.80 | % |
Year ended May 31, 2018 | | | 0.81 | % |
Year ended May 31, 2017 | | | 0.85 | % |
Year ended May 31, 2016 | | | 0.91 | % |
| 4 | Portfolio turnover rate is calculated by multiplying the affiliated Master Portfolio’s percentage of the Fund’s total investment in securities at the end of the period by the affiliated Master Portfolio’s portfolio turnover rate. |
The accompanying notes are an integral part of these financial statements.
Wells Fargo International Value Fund | 15
Financial highlights
(For a share outstanding throughout each period)
| | | | | | | | | | | | | | | | | | | | |
| | | Year ended May 31 | |
| CLASS C | | 2020 | | | 2019 | | | 2018 | | | 2017 | | | 2016 | |
Net asset value, beginning of period | | | $13.20 | | | | $15.24 | | | | $14.60 | | | | $12.56 | | | | $14.54 | |
Net investment income | | | 0.15 | 1 | | | 0.36 | | | | 0.21 | | | | 0.23 | | | | 0.17 | |
Net realized and unrealized gains (losses) on investments | | | (1.46 | ) | | | (2.21 | ) | | | 0.73 | | | | 1.97 | | | | (2.05 | ) |
| | | | | | | | | | | | | | | | | | | | |
Total from investment operations | | | (1.31 | ) | | | (1.85 | ) | | | 0.94 | | | | 2.20 | | | | (1.88 | ) |
Distributions to shareholders from | | | | | | | | | | | | | | | | | | | | |
Net investment income | | | (0.28 | ) | | | (0.19 | ) | | | (0.30 | ) | | | (0.16 | ) | | | (0.10 | ) |
Net asset value, end of period | | | $11.61 | | | | $13.20 | | | | $15.24 | | | | $14.60 | | | | $12.56 | |
Total return2 | | | (10.38 | )% | | | (12.10 | )% | | | 6.36 | % | | | 17.69 | % | | | (12.95 | )% |
Ratios to average net assets (annualized) | | | | | | | | | | | | | | | | | | | | |
Gross expenses3 | | | 2.12 | % | | | 2.08 | % | | | 2.10 | % | | | 2.16 | % | | | 2.21 | % |
Net expenses3 | | | 2.00 | % | | | 2.08 | % | | | 2.10 | % | | | 2.10 | % | | | 2.14 | % |
Net investment income3 | | | 1.13 | % | | | 1.92 | % | | | 1.40 | % | | | 1.57 | % | | | 1.25 | % |
Supplemental data | | | | | | | | | | | | | | | | | | | | |
Portfolio turnover rate4 | | | 20 | % | | | 13 | % | | | 15 | % | | | 41 | % | | | 14 | % |
Net assets, end of period (000s omitted) | | | $414 | | | | $675 | | | | $1,135 | | | | $832 | | | | $783 | |
| 1 | Calculated based upon average shares outstanding |
| 2 | Total return calculations do not include any sales charges. |
| 3 | Ratios include net expenses allocated from the affiliated Master Portfolio which were as follows: |
| | | | |
Year ended May 31, 2020 | | | 0.80 | % |
Year ended May 31, 2019 | | | 0.79 | % |
Year ended May 31, 2018 | | | 0.82 | % |
Year ended May 31, 2017 | | | 0.87 | % |
Year ended May 31, 2016 | | | 0.91 | % |
| 4 | Portfolio turnover rate is calculated by multiplying the affiliated Master Portfolio’s percentage of the Fund’s total investment in securities at the end of the period by the affiliated Master Portfolio’s portfolio turnover rate. |
The accompanying notes are an integral part of these financial statements.
16 | Wells Fargo International Value Fund
Financial highlights
(For a share outstanding throughout each period)
| | | | | | | | |
| | | Year ended May 31 | |
| CLASS R6 | | 2020 | | | 20191 | |
Net asset value, beginning of period | | | $13.39 | | | | $15.44 | |
Net investment income | | | 0.37 | 1 | | | 0.51 | |
Net realized and unrealized gains (losses) on investments | | | (1.52 | ) | | | (2.19 | ) |
| | | | | | | | |
Total from investment operations | | | (1.15 | ) | | | (1.68 | ) |
Distributions to shareholders from | | | | | | | | |
Net investment income | | | (0.49 | ) | | | (0.37 | ) |
Net asset value, end of period | | | $11.75 | | | | $13.39 | |
Total return2 | | | (9.27 | )% | | | (10.85 | )% |
Ratios to average net assets (annualized) | | | | | | | | |
Gross expenses3 | | | 0.97 | % | | | 0.92 | % |
Net expenses3 | | | 0.84 | % | | | 0.89 | % |
Net investment income3 | | | 3.01 | % | | | 7.19 | % |
Supplemental data | | | | | | | | |
Portfolio turnover rate4 | | | 20 | % | | | 13 | % |
Net assets, end of period (000s omitted) | | | $2,843 | | | | $329 | |
| 1 | For the period from July 31, 2018 (commencement of class operations) to May 31, 2019 |
| 2 | Returns for periods of less than one year are not annualized. |
| 3 | Ratios include net expenses allocated from the affiliated Master Portfolio which were as follows: |
| | | | |
Year ended May 31, 2020 | | | 0.81 | % |
Year ended May 31, 20191 | | | 0.79 | % |
| 4 | Portfolio turnover rate is calculated by multiplying the affiliated Master Portfolio’s percentage of the Fund’s total investments in securities at the end of the period by the affiliated Master Portfolio’s portfolio turnover rate. |
The accompanying notes are an integral part of these financial statements.
Wells Fargo International Value Fund | 17
Financial highlights
(For a share outstanding throughout each period)
| | | | | | | | | | | | | | | | | | | | |
| | | Year ended May 31 | |
| ADMINISTRATOR CLASS | | 2020 | | | 2019 | | | 2018 | | | 2017 | | | 2016 | |
Net asset value, beginning of period | | | $13.66 | | | | $15.76 | | | | $15.04 | | | | $12.91 | | | | $14.73 | |
Net investment income | | | 0.27 | 1 | | | 0.43 | 1 | | | 0.37 | 1 | | | 0.33 | 1 | | | 0.14 | 1 |
Net realized and unrealized gains (losses) on investments | | | (1.49 | ) | | | (2.23 | ) | | | 0.73 | | | | 2.05 | | | | (1.96 | ) |
| | | | | | | | | | | | | | | | | | | | |
Total from investment operations | | | (1.22 | ) | | | (1.80 | ) | | | 1.10 | | | | 2.38 | | | | (1.82 | ) |
Distributions to shareholders from | | | | | | | | | | | | | | | | | | | | |
Net investment income | | | (0.44 | ) | | | (0.30 | ) | | | (0.38 | ) | | | (0.25 | ) | | | 0.00 | |
Net asset value, end of period | | | $12.00 | | | | $13.66 | | | | $15.76 | | | | $15.04 | | | | $12.91 | |
Total return | | | (9.60 | )% | | | (11.33 | )% | | | 7.25 | % | | | 18.66 | % | | | (12.36 | )% |
Ratios to average net assets (annualized) | | | | | | | | | | | | | | | | | | | | |
Gross expenses2 | | | 1.29 | % | | | 1.25 | % | | | 1.27 | % | | | 1.33 | % | | | 1.36 | % |
Net expenses2 | | | 1.15 | % | | | 1.24 | % | | | 1.25 | % | | | 1.25 | % | | | 1.25 | % |
Net investment income2 | | | 1.99 | % | | | 2.92 | % | | | 2.30 | % | | | 2.46 | % | | | 0.99 | % |
Supplemental data | | | | | | | | | | | | | | | | | | | | |
Portfolio turnover rate3 | | | 20 | % | | | 13 | % | | | 15 | % | | | 41 | % | | | 14 | % |
Net assets, end of period (000s omitted) | | | $2,271 | | | | $3,375 | | | | $5,961 | | | | $5,407 | | | | $11,873 | |
| 1 | Calculated based upon average shares outstanding |
| 2 | Ratios include net expenses allocated from the affiliated Master Portfolio which were as follows: |
| | | | |
Year ended May 31, 2020 | | | 0.80 | % |
Year ended May 31, 2019 | | | 0.79 | % |
Year ended May 31, 2018 | | | 0.82 | % |
Year ended May 31, 2017 | | | 0.87 | % |
Year ended May 31, 2016 | | | 0.91 | % |
| 3 | Portfolio turnover rate is calculated by multiplying the affiliated Master Portfolio’s percentage of the Fund’s total investment in securities at the end of the period by the affiliated Master Portfolio’s portfolio turnover rate. |
The accompanying notes are an integral part of these financial statements.
18 | Wells Fargo International Value Fund
Financial highlights
(For a share outstanding throughout each period)
| | | | | | | | | | | | | | | | | | | | |
| | | Year ended May 31 | |
| INSTITUTIONAL CLASS | | 2020 | | | 2019 | | | 2018 | | | 2017 | | | 2016 | |
Net asset value, beginning of period | | | $13.39 | | | | $15.48 | | | | $14.80 | | | | $12.73 | | | | $14.75 | |
Net investment income | | | 0.29 | 1 | | | 0.48 | 1 | | | 0.41 | | | | 0.39 | | | | 0.36 | |
Net realized and unrealized gains (losses) on investments | | | (1.44 | ) | | | (2.22 | ) | | | 0.71 | | | | 1.99 | | | | (2.12 | ) |
| | | | | | | | | | | | | | | | | | | | |
Total from investment operations | | | (1.15 | ) | | | (1.74 | ) | | | 1.12 | | | | 2.38 | | | | (1.76 | ) |
Distributions to shareholders from | | | | | | | | | | | | | | | | | | | | |
Net investment income | | | (0.48 | ) | | | (0.35 | ) | | | (0.44 | ) | | | (0.31 | ) | | | (0.26 | ) |
Net asset value, end of period | | | $11.76 | | | | $13.39 | | | | $15.48 | | | | $14.80 | | | | $12.73 | |
Total return | | | (9.32 | )% | | | (11.13 | )% | | | 7.51 | % | | | 19.04 | % | | | (11.98 | )% |
Ratios to average net assets (annualized) | | | | | | | | | | | | | | | | | | | | |
Gross expenses2 | | | 1.04 | % | | | 1.01 | % | | | 1.02 | % | | | 1.07 | % | | | 1.13 | % |
Net expenses2 | | | 0.90 | % | | | 0.99 | % | | | 1.00 | % | | | 1.00 | % | | | 1.00 | % |
Net investment income2 | | | 2.13 | % | | | 3.35 | % | | | 2.43 | % | | | 2.95 | % | | | 2.81 | % |
Supplemental data | | | | | | | | | | | | | | | | | | | | |
Portfolio turnover rate3 | | | 20 | % | | | 13 | % | | | 15 | % | | | 41 | % | | | 14 | % |
Net assets, end of period (000s omitted) | | | $510,209 | | | | $786,584 | | | | $825,247 | | | | $713,180 | | | | $456,239 | |
| 1 | Calculated based upon average shares outstanding |
| 2 | Ratios include net expenses allocated from the affiliated Master Portfolio which were as follows: |
| | | | |
Year ended May 31, 2020 | | | 0.80 | % |
Year ended May 31, 2019 | | | 0.79 | % |
Year ended May 31, 2018 | | | 0.82 | % |
Year ended May 31, 2017 | | | 0.86 | % |
Year ended May 31, 2016 | | | 0.91 | % |
| 3 | Portfolio turnover rate is calculated by multiplying the affiliated Master Portfolio’s percentage of the Fund’s total investment in securities at the end of the period by the affiliated Master Portfolio’s portfolio turnover rate. |
The accompanying notes are an integral part of these financial statements.
Wells Fargo International Value Fund | 19
Notes to financial statements
1. ORGANIZATION
Wells Fargo Funds Trust (the “Trust”), a Delaware statutory trust organized on March 10, 1999, is an open-end management investment company registered under the Investment Company Act of 1940, as amended (the “1940 Act”). As an investment company, the Trust follows the accounting and reporting guidance in Financial Accounting Standards Board (“FASB”) Accounting Standards Codification Topic 946, Financial Services – Investment Companies. These financial statements report on the Wells Fargo International Value Fund (the “Fund”) which is a diversified series of the Trust.
The Fund is a feeder fund in a master-feeder structure that invests substantially all of its assets in a single master portfolio with a substantially identical investment objective and substantially similar investment strategies. The Fund invests in Wells Fargo International Value Portfolio (the “affiliated Master Portfolio”) which is a separate diversified portfolio of Wells Fargo Master Trust, a registered open-end management investment company. As of May 31, 2020, the Fund owned 75% of Wells Fargo International Value Portfolio. The affiliated Master Portfolio directly acquires portfolio securities and the Fund acquires an indirect interest in those securities. The Fund accounts for its investment in the affiliated Master Portfolio as a partnership investment and records on a daily basis its share of the affiliated Master Portfolio’s income, expense and realized and unrealized gains and losses. The financial statements of the affiliated Master Portfolio for the year ended May 31, 2020 are included in this report and should be read in conjunction with the Fund’s financial statements.
2. SIGNIFICANT ACCOUNTING POLICIES
The following significant accounting policies, which are consistently followed in the preparation of the financial statements of the Fund, are in conformity with U.S. generally accepted accounting principles which require management to make estimates and assumptions that affect the reported amounts of assets and liabilities, disclosure of contingent assets and liabilities at the date of the financial statements, and the reported amounts of revenues and expenses during the reporting period. Actual results could differ from those estimates.
Securities valuation
All investments are valued each business day as of the close of regular trading on the New York Stock Exchange (generally 4 p.m. Eastern Time), although the Fund may deviate from this calculation time under unusual or unexpected circumstances.
Investments in the affiliated Master Portfolio are valued daily based on the Fund’s proportionate share of the affiliated Master Portfolio’s net assets, which are also valued daily. Securities held in the affiliated Master Portfolio are valued as discussed in the Notes to Financial Statements of the affiliated Master Portfolio, which are included elsewhere in this report.
Investments which are not valued using the method discussed above are valued at their fair value, as determined in good faith by the Board of Trustees of the Fund. The Board of Trustees has established a Valuation Committee comprised of the Trustees and has delegated to it the authority to take any actions regarding the valuation of portfolio securities that the Valuation Committee deems necessary or appropriate, including determining the fair value of portfolio securities, unless the determination has been delegated to the Wells Fargo Asset Management Pricing Committee at Wells Fargo Funds Management, LLC (“Funds Management”). The Board of Trustees retains the authority to make or ratify any valuation decisions or approve any changes to the Valuation Procedures as it deems appropriate. On a quarterly basis, the Board of Trustees receives reports on any valuation actions taken by the Valuation Committee or the Wells Fargo Asset Management Pricing Committee which may include items for ratification.
Investment transactions, income and expenses
Investments in the affiliated Master Portfolio are recorded on a trade basis. The Fund records daily its proportionate share of the affiliated Master Portfolio’s income, expenses and realized and unrealized gains or losses. The Fund also accrues its own expenses.
Distributions to shareholders
Distributions to shareholders from net investment income and any net realized gains are recorded on the ex-dividend date and paid at least annually. Such distributions are determined in accordance with income tax regulations and may differ from U.S. generally accepted accounting principles. Dividend sources are estimated at the time of declaration. The tax character of distributions is determined as of the Fund’s fiscal year end. Therefore, a portion of the Fund’s distributions made prior to the Fund’s fiscal year end may be categorized as a tax return of capital at year end.
Federal and other taxes
The Fund intends to continue to qualify as a regulated investment company by distributing substantially all of its investment company taxable income and any net realized capital gains (after reduction for capital loss carryforwards) sufficient to relieve it from all, or substantially all, federal income taxes. Accordingly, no provision for federal income taxes was required.
20 | Wells Fargo International Value Fund
Notes to financial statements
The Fund’s income and federal excise tax returns and all financial records supporting those returns for the prior three fiscal years are subject to examination by the federal and Delaware revenue authorities. Management has analyzed the Fund’s tax positions taken on federal, state, and foreign tax returns for all open tax years and does not believe that there are any uncertain tax positions that require recognition of a tax liability.
As of May 31, 2020, the aggregate cost of all investments for federal income tax purposes was $708,139,189 and the unrealized gains (losses) consisted of:
| | | | |
| |
Gross unrealized gains | | $ | 0 | |
| |
Gross unrealized losses | | | (116,625,224 | ) |
| |
Net unrealized losses | | $ | (116,625,224 | ) |
As of May 31, 2020, the Fund had capital loss carryforwards which consist of $13,306,325 in long-term capital losses.
Class allocations
The separate classes of shares offered by the Fund differ principally in applicable sales charges, distribution, shareholder servicing, and administration fees. Class specific expenses are charged directly to that share class. Investment income, common fund-level expenses, and realized and unrealized gains (losses) on investments are allocated daily to each class of shares based on the relative proportion of net assets of each class.
3. FAIR VALUATION MEASUREMENTS
At May 31, 2020, the affiliated Master Portfolio was measured at fair value using the net asset value per share (or its equivalent) as a practical expedient. The investment objective and the value of the affiliate Master Portfolio was as follows:
| | | | |
| | |
| Affiliated Master Portfolio | | Investment objective | | Fair value of affiliated Master Portfolio |
| | |
Wells Fargo International Value Portfolio | | Seek long-term capital appreciation | | $591,513,965 |
The affiliated Master Portfolio does not have a redemption period notice, can be redeemed daily and does not have any unfunded commitments.
4. TRANSACTIONS WITH AFFILIATES
Management fee
Funds Management, an indirect wholly owned subsidiary of Wells Fargo & Company (“Wells Fargo”), is the manager of the Fund and provides advisory and fund-level administrative services under an investment management agreement. Under the investment management agreement, Funds Management is responsible for, among other services, implementing the investment objectives and strategies of the Fund and providing fund-level administrative services in connection with the Fund’s operations. As long as the Fund continues to invest substantially all of its assets in a single affiliated Master Portfolio, the Fund pays Funds Management an investment management fee only for fund-level administrative services at the following annual rate based on the Fund’s average daily net assets:
| | |
| |
| Average daily net assets | | Management fee |
| |
First $5 billion | | 0.05% |
| |
Next $5 billion | | 0.04 |
| |
Over $10 billion | | 0.03 |
For the year ended May 31, 2020, the management fee was equivalent to an annual rate of 0.05% of the Fund’s average daily net assets.
Funds Management also serves as the adviser to the affiliated Master Portfolio and is entitled to receive a fee from the affiliated Master Portfolio for those services.
Administration fees
Under a class-level administration agreement, Funds Management provides class-level administrative services to the Fund, which includes paying fees and expenses for services provided by the transfer agent, sub-transfer agents, omnibus account
Wells Fargo International Value Fund | 21
Notes to financial statements
servicers and record-keepers. As compensation for its services under the class-level administration agreement, Funds Management receives an annual fee which is calculated based on the average daily net assets of each class as follows:
| | |
| |
| | | Class-level
administration fee |
| |
Class A, Class C | | 0.21% |
| |
Class R6 | | 0.03 |
| |
Administrator Class, Institutional Class | | 0.13 |
Waivers and/or expense reimbursements
Funds Management has contractually waived and/or reimbursed management and administration fees to the extent necessary to maintain certain net operating expense ratios for the Fund. When each class of the Fund has exceeded its expense cap, Funds Management has waived fees and/or reimbursed expenses from fund-level expenses on a proportionate basis and then from class specific expenses. When only certain classes exceed their expense caps, waivers and/or reimbursements are applied against class specific expenses before fund-level expenses. Net expenses from the affiliated Master Portfolio are included in the expense caps. Funds Management has committed through September 30, 2020 to waive fees and/or reimburse expenses to the extent necessary to cap the Fund’s expenses at 1.24% for Class A shares, 1.99% for Class C shares, 0.84% for Class R6 shares, 1.14% for Administrator Class shares, and 0.89% for Institutional Class shares. Prior to or after the commitment expiration date, the cap may be increased or the commitment to maintain the cap may be terminated only with the approval of the Board of Trustees. Prior to July 1, 2019, the Fund’s expenses were capped at 1.35% for Class A shares, 2.10% for Class C shares, 0.90% for Class R6 shares, 1.25% for Administrator Class shares, and 1.00% for Institutional Class shares.
Distribution fee
The Trust has adopted a distribution plan for Class C shares of the Fund pursuant to Rule 12b-1 under the 1940 Act. A distribution fee is charged to Class C shares and paid to Wells Fargo Funds Distributor, LLC (“Funds Distributor”), the principal underwriter, at an annual rate of 0.75% of the average daily net assets of Class C shares.
In addition, Funds Distributor is entitled to receive the front-end sales charge from the purchase of Class A shares and a contingent deferred sales charge on the redemption of certain Class A shares. Funds Distributor is also entitled to receive the contingent deferred sales charges from redemptions of Class C shares. For the year ended May 31, 2020, Funds Distributor received $2,262 from the sale of Class A shares. No contingent deferred sales charges were incurred by Class A and Class C shares for the year ended May 31, 2020.
Shareholder servicing fees
The Trust has entered into contracts with one or more shareholder servicing agents, whereby Class A, Class C, and Administrator Class of the Fund are charged a fee at an annual rate of 0.25% of the average daily net assets of each respective class. A portion of these total shareholder servicing fees were paid to affiliates of Wells Fargo.
5. INVESTMENT PORTFOLIO TRANSACTIONS
The Fund seeks to achieve its investment objective by investing substantially all of its assets in a single affiliated Master Portfolio. Purchases and sales have been calculated by multiplying the Fund’s ownership percentage of the affiliated Master Portfolio by the affiliated Master Portfolio’s purchases and sales. Purchases and sales of investments, excluding U.S. government obligations (if any) and short-term securities, for the year ended May 31, 2020 were $148,098,653 and $289,079,036, respectively.
6. BANK BORROWINGS
The Trust (excluding the money market funds), Wells Fargo Master Trust and Wells Fargo Variable Trust are parties to a $280,000,000 revolving credit agreement whereby the Fund is permitted to use bank borrowings for temporary or emergency purposes, such as to fund shareholder redemption requests. Interest under the credit agreement is charged to the Fund based on a borrowing rate equal to the higher of the Federal Funds rate in effect on that day plus 1.25% or the overnight LIBOR rate in effect on that day plus 1.25%. In addition, an annual commitment fee equal to 0.25% of the unused balance is allocated to each participating fund.
For the year ended May 31, 2020, there were no borrowings by the Fund under the agreement.
22 | Wells Fargo International Value Fund
Notes to financial statements
7. DISTRIBUTIONS TO SHAREHOLDERS
The tax character of distributions paid was $31,165,856 and $21,600,261 of ordinary income for the years ended May 31, 2020 and May 31, 2019, respectively.
As of May 31, 2020, the components of distributable earnings on a tax basis were as follows:
| | | | |
Undistributed ordinary income | | Unrealized losses | | Capital loss carryforward |
| | |
| $4,983,232 | | $(116,625,224) | | $(13,306,325) |
8. CONCENTRATION RISK
Concentration risks result from exposure to a limited number of geographic regions. Through its investment in the affiliated Master Portfolio which may invest a substantial portion of its assets in any geographic region, the Fund may in turn be more affected by changes in that geographic region than a fund whose investments are not heavily weighted in any geographic region. As of the end of the period, the Fund invested a concentration of its portfolio in Europe.
9. INDEMNIFICATION
Under the Fund’s organizational documents, the officers and Trustees have been granted certain indemnification rights against certain liabilities that may arise out of performance of their duties to the Fund. The Fund has entered into a separate agreement with each Trustee that converts indemnification rights currently existing under the Fund’s organizational documents into contractual rights that cannot be changed in the future without the consent of the Trustee. Additionally, in the normal course of business, the Fund may enter into contracts with service providers that contain a variety of indemnification clauses. The Fund’s maximum exposure under these arrangements is dependent on future claims that may be made against the Fund and, therefore, cannot be estimated.
10. NEW ACCOUNTING PRONOUNCEMENT
In August 2018, FASB issued Accounting Standards Update (“ASU”) No. 2018-13, Fair Value Measurement (Topic 820) Disclosure Framework—Changes to the Disclosure Requirements for Fair Value Measurement. ASU 2018-13 updates the disclosure requirements for fair value measurements by modifying or removing certain disclosures and adding certain new disclosures. The amendments are effective for fiscal years, and interim periods within those fiscal years, beginning after December 15, 2019. Early adoption is permitted. Management has adopted the removal and modification of disclosures early, as permitted, and will adopt the additional new disclosures at the effective date.
11. CORONAVIRUS (COVID-19) PANDEMIC
On March 11, 2020, the World Health Organization announced that it had made the assessment that coronavirus disease 2019 (“COVID-19”) is a pandemic. The impacts of COVID-19 are adversely affecting the entire global economy, individual companies and investment products, and the market in general. There is significant uncertainty around the extent and duration of business disruptions related to COVID-19 and the impacts may be short term or may last for an extended period of time. The risk of further spreading of COVID-19 has led to significant uncertainty and volatility in the financial markets. The value of the Fund and the Master Portfolio in which the Fund invests have generally been adversely affected by impacts caused by COVID-19.
Wells Fargo International Value Fund | 23
Report of independent registered public accounting firm
TO THE SHAREHOLDERS OF THE FUND AND BOARD OF TRUSTEES WELLS FARGO FUNDS TRUST:
Opinion on the Financial Statements
We have audited the accompanying statement of assets and liabilities of Wells Fargo International Value Fund (the Fund), one of the funds constituting Wells Fargo Funds Trust, including the portfolio of investments, as of May 31, 2020, the related statement of operations for the year then ended, the statements of changes in net assets for each of the years in the two-year period then ended, and the related notes (collectively, the financial statements) and the financial highlights for each of the years or periods in the five-year period then ended. In our opinion, the financial statements and financial highlights present fairly, in all material respects, the financial position of the Fund as of May 31, 2020, the results of its operations for the year then ended, the changes in its net assets for each of the years in the two-year period then ended, and the financial highlights for each of the years or periods in the five-year period then ended, in conformity with U.S. generally accepted accounting principles.
Basis for Opinion
These financial statements and financial highlights are the responsibility of the Fund’s management. Our responsibility is to express an opinion on these financial statements and financial highlights based on our audits. We are a public accounting firm registered with the Public Company Accounting Oversight Board (United States) (PCAOB) and are required to be independent with respect to the Fund in accordance with the U.S. federal securities laws and the applicable rules and regulations of the Securities and Exchange Commission and the PCAOB.
We conducted our audits in accordance with the standards of the PCAOB. Those standards require that we plan and perform the audit to obtain reasonable assurance about whether the financial statements and financial highlights are free of material misstatement, whether due to error or fraud. Our audits included performing procedures to assess the risks of material misstatement of the financial statements and financial highlights, whether due to error or fraud, and performing procedures that respond to those risks. Such procedures included examining, on a test basis, evidence regarding the amounts and disclosures in the financial statements and financial highlights. Such procedures also included confirmation of securities owned as of May 31, 2020, by correspondence with the transfer agent. Our audits also included evaluating the accounting principles used and significant estimates made by management, as well as evaluating the overall presentation of the financial statements and financial highlights. We believe that our audits provide a reasonable basis for our opinion.

We have not been able to determine the specific year that we began serving as the auditor of one or more Wells Fargo Funds investment companies; however we are aware that we have served as the auditor of one or more Wells Fargo Funds investment companies since at least 1955.
Boston, Massachusetts
July 29, 2020
24 | Wells Fargo International Value Fund
Portfolio of investments—May 31, 2020
| | | | | | | | | | | | | | | | |
| | | | | | | | | Shares | | | Value | |
| Common Stocks: 97.29% | |
|
| Australia: 4.76% | |
AGL Energy Limited (Utilities, Multi-Utilities) | | | | | | | | | | | 263,700 | | | $ | 2,954,376 | |
Beach Petroleum Limited (Energy, Oil, Gas & Consumable Fuels) | | | | | | | | | | | 1,639,000 | | | | 1,770,799 | |
BlueScope Steel Limited (Materials, Metals & Mining) | | | | | | | | | | | 403,600 | | | | 2,973,561 | |
Fortescue Metals Group Limited (Materials, Metals & Mining) | | | | | | | | | | | 791,200 | | | | 7,324,461 | |
Harvey Norman Holdings Limited (Consumer Discretionary, Multiline Retail) | | | | | | | | | | | 1,228,714 | | | | 2,666,327 | |
Lendlease Corporation Limited (Real Estate, Real Estate Management & Development) | | | | | | | | | | | 311,600 | | | | 2,693,685 | |
Metcash Limited (Consumer Staples, Food & Staples Retailing) | | | | | | | | | | | 1,164,200 | | | | 2,095,628 | |
Mirvac Group (Real Estate, Equity REITs) | | | | | | | | | | | 1,225,100 | | | | 1,922,036 | |
Myer Holdings Limited (Consumer Discretionary, Multiline Retail) † | | | | | | | | | | | 1,702,400 | | | | 312,679 | |
Qantas Airways Limited (Industrials, Airlines) | | | | | | | | | | | 1,241,700 | | | | 3,314,614 | |
Rio Tinto Limited (Materials, Metals & Mining) | | | | | | | | | | | 63,300 | | | | 3,953,664 | |
South32 Limited (Materials, Metals & Mining) | | | | | | | | | | | 1,057,700 | | | | 1,337,317 | |
St. Barbara Limited (Materials, Metals & Mining) | | | | | | | | | | | 932,700 | | | | 1,911,436 | |
Super Cheap Auto Group Limited (Consumer Discretionary, Specialty Retail) | | | | | | | | | | | 422,200 | | | | 2,359,778 | |
| | | | |
| | | | | | | | | | | | | | | 37,590,361 | |
| | | | | | | | | | | | | | | | |
|
| Austria: 0.71% | |
OMV AG (Energy, Oil, Gas & Consumable Fuels) | | | | | | | | | | | 80,400 | | | | 2,656,723 | |
Raiffeisen Bank International AG (Financials, Banks) | | | | | | | | | | | 161,900 | | | | 2,966,431 | |
| | | | |
| | | | | | | | | | | | | | | 5,623,154 | |
| | | | | | | | | | | | | | | | |
|
| Belgium: 0.55% | |
Bpost SA (Industrials, Air Freight & Logistics) | | | | | | | | | | | 105,700 | | | | 693,107 | |
UCB SA (Health Care, Pharmaceuticals) | | | | | | | | | | | 36,600 | | | | 3,663,117 | |
| | | | |
| | | | | | | | | | | | | | | 4,356,224 | |
| | | | | | | | | | | | | | | | |
|
| Brazil: 0.84% | |
Banco do Brasil SA (Financials, Banks) | | | | | | | | | | | 268,900 | | | | 1,554,050 | |
Companhia de Saneamento de Minas Gerais SA (Utilities, Water Utilities) | | | | | | | | | | | 212,400 | | | | 2,296,625 | |
JBS SA (Consumer Staples, Food Products) | | | | | | | | | | | 676,000 | | | | 2,783,149 | |
| | | | |
| | | | | | | | | | | | | | | 6,633,824 | |
| | | | | | | | | | | | | | | | |
|
| Canada: 0.94% | |
Loblaw Companies Limited (Consumer Staples, Food & Staples Retailing) | | | | | | | | | | | 74,000 | | | | 3,663,318 | |
Magna International Incorporated (Consumer Discretionary, Auto Components) | | | | | | | | | | | 88,500 | | | | 3,731,932 | |
| | | | |
| | | | | | | | | | | | | | | 7,395,250 | |
| | | | | | | | | | | | | | | | |
|
| China: 3.12% | |
Agile Property Holdings Limited (Real Estate, Real Estate Management & Development) | | | | | | | | | | | 1,900,000 | | | | 1,971,930 | |
China Communications Services Corporation Limited H Shares (Industrials, Construction & Engineering) | | | | | | | | | | | 2,836,000 | | | | 1,891,268 | |
China Petroleum & Chemical Corporation H Shares (Energy, Oil, Gas & Consumable Fuels) | | | | | | | | | | | 5,050,000 | | | | 2,356,180 | |
China Railway Construction Corporation Limited H Shares (Industrials, Construction & Engineering) | | | | | | | | | | | 2,455,500 | | | | 2,204,757 | |
China Resources Cement Holdings Limited (Materials, Construction Materials) | | | | | | | | | | | 4,106,000 | | | | 5,187,592 | |
China Telecom Corporation Limited H Shares (Communication Services, Diversified Telecommunication Services) | | | | | | | | | | | 6,718,000 | | | | 2,228,580 | |
PICC Property & Casualty Company Limited H Shares (Financials, Insurance) | | | | | | | | | | | 2,844,000 | | | | 2,488,288 | |
Shanghai Pharmaceuticals Holding Company Limited H Shares (Health Care, Health Care Providers & Services) | | | | | | | | | | | 922,300 | | | | 1,462,104 | |
Shenzhen International Holdings Limited H Shares (Industrials, Transportation Infrastructure) | | | | | | | | | | | 1,777,300 | | | | 2,976,639 | |
YiChang HEC ChangJiang Pharmaceutical Company Limited H Shares (Health Care, Pharmaceuticals) | | | | | | | | | | | 541,000 | | | | 1,923,188 | |
| | | | |
| | | | | | | | | | | | | | | 24,690,526 | |
| | | | | | | | | | | | | | | | |
The accompanying notes are an integral part of these financial statements.
Wells Fargo International Value Portfolio | 25
Portfolio of investments—May 31, 2020
| | | | | | | | | | | | | | | | |
| | | | | | | | | Shares | | | Value | |
| Denmark: 1.01% | |
Danske Bank AS (Financials, Banks) † | | | | | | | | | | | 150,300 | | | $ | 1,864,552 | |
DFDS AS (Industrials, Marine) † | | | | | | | | | | | 49,100 | | | | 1,440,579 | |
Pandora AS (Consumer Discretionary, Textiles, Apparel & Luxury Goods) | | | | | | | | | | | 58,500 | | | | 2,931,114 | |
Sydbank AS (Financials, Banks) † | | | | | | | | | | | 102,782 | | | | 1,779,374 | |
| | | | |
| | | | | | | | | | | | | | | 8,015,619 | |
| | | | | | | | | | | | | | | | |
|
| Finland: 0.18% | |
Nordea Bank AB (Financials, Banks) † | | | | | | | | | | | 203,700 | | | | 1,387,368 | |
| | | | | | | | | | | | | | | | |
|
| France: 7.99% | |
Air France-KLM SA (Industrials, Airlines) † | | | | | | | | | | | 288,100 | | | | 1,299,679 | |
Arkema SA (Materials, Chemicals) | | | | | | | | | | | 42,992 | | | | 3,769,981 | |
AXA SA (Financials, Insurance) † | | | | | | | | | | | 242,100 | | | | 4,442,270 | |
BNP Paribas SA (Financials, Banks) | | | | | | | | | | | 123,579 | | | | 4,447,042 | |
Bouygues SA (Industrials, Construction & Engineering) † | | | | | | | | | | | 61,700 | | | | 1,892,997 | |
Compagnie de Saint-Gobain SA (Industrials, Building Products) | | | | | | | | | | | 94,700 | | | | 3,099,106 | |
Compagnie Generale des Etablissements Michelin SCA (Consumer Discretionary, Auto Components) | | | | | | | | | | | 32,700 | | | | 3,309,592 | |
Credit Agricole SA (Financials, Banks) | | | | | | | | | | | 299,500 | | | | 2,629,362 | |
Engie SA (Utilities, Multi-Utilities) | | | | | | | | | | | 256,900 | | �� | | 3,053,075 | |
Natixis SA (Financials, Capital Markets) | | | | | | | | | | | 877,400 | | | | 1,967,499 | |
Neopost SA (Information Technology, Technology Hardware, Storage & Peripherals) | | | | | | | | | | | 66,600 | | | | 966,096 | |
Renault SA (Consumer Discretionary, Automobiles) | | | | | | | | | | | 55,900 | | | | 1,267,175 | |
Sanofi SA (Health Care, Pharmaceuticals) | | | | | | | | | | | 172,100 | | | | 16,833,922 | |
Societe Bic SA (Industrials, Commercial Services & Supplies) | | | | | | | | | | | 46,300 | | | | 2,472,099 | |
Societe Generale SA (Financials, Banks) | | | | | | | | | | | 63,400 | | | | 937,866 | |
Total SA (Energy, Oil, Gas & Consumable Fuels) | | | | | | | | | | | 283,800 | | | | 10,761,919 | |
| | | | |
| | | | | | | | | | | | | | | 63,149,680 | |
| | | | | | | | | | | | | | | | |
|
| Germany: 8.57% | |
Allianz AG (Financials, Insurance) | | | | | | | | | | | 33,400 | | | | 6,053,288 | |
Aurubis AG (Materials, Metals & Mining) | | | | | | | | | | | 43,296 | | | | 2,507,128 | |
Bayer AG (Health Care, Pharmaceuticals) | | | | | | | | | | | 90,400 | | | | 6,179,706 | |
Bayerische Motoren Werke AG (Consumer Discretionary, Automobiles) | | | | | | | | | | | 64,800 | | | | 3,797,678 | |
Covestro AG (Materials, Chemicals) 144A† | | | | | | | | | | | 102,800 | | | | 3,821,795 | |
Daimler AG (Consumer Discretionary, Automobiles) | | | | | | | | | | | 87,100 | | | | 3,245,477 | |
Deutsche Lufthansa AG (Industrials, Airlines) | | | | | | | | | | | 223,600 | | | | 2,273,032 | |
Deutsche Post AG (Industrials, Air Freight & Logistics) | | | | | | | | | | | 209,800 | | | | 6,570,561 | |
Merck KGaA (Health Care, Pharmaceuticals) | | | | | | | | | | | 33,600 | | | | 3,873,241 | |
Muenchener Rueckversicherungs Gesellschaft AG (Financials, Insurance) | | | | | | | | | | | 18,500 | | | | 4,218,723 | |
Rheinmetall AG (Industrials, Industrial Conglomerates) | | | | | | | | | | | 30,300 | | | | 2,467,796 | |
Siemens AG (Industrials, Industrial Conglomerates) | | | | | | | | | | | 67,800 | | | | 7,475,269 | |
Siltronic AG (Information Technology, Semiconductors & Semiconductor Equipment) | | | | | | | | | | | 43,000 | | | | 4,247,572 | |
United Internet AG (Communication Services, Diversified Telecommunication Services) | | | | | | | | | | | 103,800 | | | | 4,275,792 | |
Volkswagen AG (Consumer Discretionary, Automobiles) | | | | | | | | | | | 42,200 | | | | 6,714,156 | |
| | | | |
| | | | | | | | | | | | | | | 67,721,214 | |
| | | | | | | | | | | | | | | | |
|
| Hong Kong: 3.27% | |
China Water Affairs Group Limited (Utilities, Water Utilities) | | | | | | | | | | | 1,965,000 | | | | 1,313,940 | |
CK Hutchison Holdings Limited (Industrials, Industrial Conglomerates) | | | | | | | | | | | 509,000 | | | | 3,133,850 | |
Kingboard Laminates Holdings Limited (Information Technology, Electronic Equipment, Instruments & Components) | | | | | | | | | | | 3,606,500 | | | | 3,185,708 | |
Lee & Man Paper Manufacturing Limited (Materials, Paper & Forest Products) | | | | | | | | | | | 2,826,000 | | | | 1,529,423 | |
Nine Dragons Paper Holdings Limited (Materials, Paper & Forest Products) | | | | | | | | | | | 2,389,000 | | | | 2,100,637 | |
Sinotruk Hong Kong Limited (Industrials, Machinery) | | | | | | | | | | | 1,807,000 | | | | 4,404,550 | |
Skyworth Digital Holdings Limited (Consumer Discretionary, Household Durables) | | | | | | | | | | | 8,404,000 | | | | 2,191,719 | |
WH Group Limited (Consumer Staples, Food Products) 144A | | | | | | | | | | | 4,116,000 | | | | 3,580,691 | |
The accompanying notes are an integral part of these financial statements.
26 | Wells Fargo International Value Portfolio
Portfolio of investments—May 31, 2020
| | | | | | | | | | | | | | | | |
| | | | | | | | | Shares | | | Value | |
|
| Hong Kong (continued) | |
Xinyi Glass Holdings Limited (Consumer Discretionary, Auto Components) | | | | | | | | | | | 2,816,000 | | | $ | 2,991,802 | |
Yue Yuen Industrial Holdings Limited (Consumer Discretionary, Textiles, Apparel & Luxury Goods) | | | | | | | | | | | 1,005,000 | | | | 1,447,135 | |
| | | | |
| | | | | | | | | | | | | | | 25,879,455 | |
| | | | | | | | | | | | | | | | |
|
| India: 0.44% | |
REC Limited (Financials, Diversified Financial Services) | | | | | | | | | | | 1,086,900 | | | | 1,275,623 | |
Tech Mahindra Limited (Information Technology, IT Services) | | | | | | | | | | | 316,000 | | | | 2,222,319 | |
| | | | |
| | | | | | | | | | | | | | | 3,497,942 | |
| | | | | | | | | | | | | | | | |
|
| Ireland: 0.62% | |
C&C Group plc (Consumer Staples, Beverages) | | | | | | | | | | | 240,000 | | | | 571,655 | |
Grafton Group plc (Industrials, Trading Companies & Distributors) | | | | | | | | | | | 108,800 | | | | 841,405 | |
Smurfit Kappa Group plc (Materials, Containers & Packaging) | | | | | | | | | | | 106,800 | | | | 3,487,625 | |
| | | | |
| | | | | | | | | | | | | | | 4,900,685 | |
| | | | | | | | | | | | | | | | |
|
| Israel: 0.32% | |
Teva Pharmaceutical Industries Limited (Health Care, Pharmaceuticals) † | | | | | | | | | | | 206,100 | | | | 2,569,363 | |
| | | | | | | | | | | | | | | | |
|
| Italy: 2.73% | |
A2A SpA (Utilities, Multi-Utilities) | | | | | | | | | | | 2,121,107 | | | | 2,959,647 | |
Enel SpA (Utilities, Electric Utilities) | | | | | | | | | | | 1,405,800 | | | | 10,869,256 | |
Leonardo SpA (Industrials, Aerospace & Defense) | | | | | | | | | | | 325,500 | | | | 2,043,435 | |
Mediobanca SpA (Financials, Banks) | | | | | | | | | | | 371,363 | | | | 2,442,953 | |
UnipolSai Assicurazioni SpA (Financials, Insurance) | | | | | | | | | | | 1,453,100 | | | | 3,234,206 | |
| | | | |
| | | | | | | | | | | | | | | 21,549,497 | |
| | | | | | | | | | | | | | | | |
|
| Japan: 23.82% | |
Adeka Corporation (Materials, Chemicals) | | | | | | | | | | | 203,500 | | | | 2,837,177 | |
Alfresa Holdings Corporation (Health Care, Health Care Providers & Services) | | | | | | | | | | | 172,800 | | | | 3,487,991 | |
Asahi Glass Company Limited (Industrials, Building Products) | | | | | | | | | | | 121,800 | | | | 3,454,659 | |
Astellas Pharma Incorporated (Health Care, Pharmaceuticals) | | | | | | | | | | | 454,800 | | | | 8,126,336 | |
Brother Industries Limited (Information Technology, Technology Hardware, Storage & Peripherals) | | | | | | | | | | | 200,800 | | | | 3,799,914 | |
Credit Saison Company Limited (Financials, Consumer Finance) | | | | | | | | | | | 279,600 | | | | 3,342,481 | |
Daiwa House Industry Company Limited (Real Estate, Real Estate Management & Development) | | | | | | | | | | | 97,700 | | | | 2,424,191 | |
Denka Company Limited (Materials, Chemicals) | | | | | | | | | | | 99,700 | | | | 2,453,744 | |
DIC Incorporated (Materials, Chemicals) | | | | | | | | | | | 124,900 | | | | 3,264,576 | |
Fuji Machine Manufacturing Company Limited (Industrials, Machinery) | | | | | | | | | | | 139,400 | | | | 2,587,016 | |
Geo Holdings Corporation (Consumer Discretionary, Specialty Retail) | | | | | | | | | | | 133,700 | | | | 1,673,480 | |
Hitachi Capital Corporation (Financials, Consumer Finance) | | | | | | | | | | | 99,700 | | | | 2,110,837 | |
Hitachi Limited (Information Technology, Electronic Equipment, Instruments & Components) | | | | | | | | | | | 73,400 | | | | 2,370,761 | |
Honda Motor Company Limited (Consumer Discretionary, Automobiles) | | | | | | | | | | | 229,100 | | | | 5,965,441 | |
Isuzu Motors Limited (Consumer Discretionary, Automobiles) | | | | | | | | | | | 434,600 | | | | 4,082,046 | |
Itochu Corporation (Industrials, Trading Companies & Distributors) | | | | | | | | | | | 397,400 | | | | 8,545,878 | |
Japan Airlines Company Limited (Industrials, Airlines) | | | | | | | | | | | 108,600 | | | | 2,132,548 | |
JTEKT Corporation (Consumer Discretionary, Auto Components) | | | | | | | | | | | 97,500 | | | | 789,387 | |
JXTG Holdings Incorporated (Energy, Oil, Gas & Consumable Fuels) | | | | | | | | | | | 754,900 | | | | 2,917,637 | |
Kaken Pharmaceutical Company Limited (Health Care, Pharmaceuticals) | | | | | | | | | | | 37,200 | | | | 2,050,553 | |
KDDI Corporation (Communication Services, Wireless Telecommunication Services) | | | | | | | | | | | 451,200 | | | | 13,170,159 | |
Komatsu Limited (Industrials, Machinery) | | | | | | | | | | | 178,300 | | | | 3,605,478 | |
Makino Milling Machine Company Limited (Industrials, Machinery) | | | | | | | | | | | 35,500 | | | | 1,100,317 | |
Marubeni Corporation (Industrials, Trading Companies & Distributors) | | | | | | | | | | | 779,300 | | | | 3,794,190 | |
Matsumotokiyoshi Holdings Company Limited (Consumer Staples, Food & Staples Retailing) | | | | | | | | | | | 119,100 | | | | 4,461,963 | |
Mitsubishi Gas Chemical Company Incorporated (Materials, Chemicals) | | | | | | | | | | | 269,700 | | | | 4,030,965 | |
Mitsubishi UFJ Financial Group Incorporated (Financials, Banks) | | | | | | | | | | | 1,275,400 | | | | 5,294,355 | |
Mitsubishi UFJ Lease & Finance Company Limited (Financials, Diversified Financial Services) | | | | | | | | | | | 699,300 | | | | 3,429,068 | |
The accompanying notes are an integral part of these financial statements.
Wells Fargo International Value Portfolio | 27
Portfolio of investments—May 31, 2020
| | | | | | | | | | | | | | | | |
| | | | | | | | | Shares | | | Value | |
|
| Japan (continued) | |
Mitsui Chemicals Incorporated (Materials, Chemicals) | | | | | | | | | | | 177,100 | | | $ | 3,693,112 | |
Mizuho Financial Group Incorporated (Financials, Banks) | | | | | | | | | | | 3,425,200 | | | | 4,275,135 | |
Nippon Telegraph & Telephone Corporation (Communication Services, Diversified Telecommunication Services) | | | | | | | | | | | 554,100 | | | | 12,611,974 | |
Nomura Holdings Incorporated (Financials, Capital Markets) | | | | | | | | | | | 840,500 | | | | 3,622,409 | |
ORIX Corporation (Financials, Diversified Financial Services) | | | | | | | | | | | 319,600 | | | | 4,229,417 | |
Resona Holdings Incorporated (Financials, Banks) | | | | | | | | | | | 1,348,600 | | | | 4,877,162 | |
Ryobi Limited (Industrials, Machinery) | | | | | | | | | | | 117,400 | | | | 1,530,852 | |
Sawai Pharmaceutical Company Limited (Health Care, Pharmaceuticals) | | | | | | | | | | | 58,300 | | | | 3,214,872 | |
Sojitz Corporation (Industrials, Trading Companies & Distributors) | | | | | | | | | | | 1,855,500 | | | | 4,323,164 | |
Sompo Holdings Incorporated NKSJ Holdings Inc(Financials, Insurance) | | | | | | | | | | | 85,400 | | | | 3,046,360 | |
Sumitomo Corporation (Industrials, Trading Companies & Distributors) | | | | | | | | | | | 248,700 | | | | 2,996,609 | |
Sumitomo Heavy Industries Limited (Industrials, Machinery) | | | | | | | | | | | 140,900 | | | | 3,232,514 | |
Sumitomo Mitsui Financial Group Incorporated (Financials, Banks) | | | | | | | | | | | 173,200 | | | | 5,026,663 | |
T&D Holdings Incorporated (Financials, Insurance) | | | | | | | | | | | 324,400 | | | | 2,946,584 | |
Teijin Limited (Materials, Chemicals) | | | | | | | | | | | 229,500 | | | | 3,761,362 | |
The Keiyo Bank Limited (Financials, Banks) | | | | | | | | | | | 224,300 | | | | 1,082,747 | |
The Yokohama Rubber Company Limited (Consumer Discretionary, Auto Components) | | | | | | | | | | | 172,900 | | | | 2,621,458 | |
Toho Holdings Company Limited (Health Care, Health Care Providers & Services) | | | | | | | | | | | 63,000 | | | | 1,260,192 | |
Tokuyama Corporation (Materials, Chemicals) | | | | | | | | | | | 137,800 | | | | 3,307,499 | |
Toyo Ink SC Holding Company Limited (Materials, Chemicals) | | | | | | | | | | | 75,000 | | | | 1,452,045 | |
Toyota Boshoku Corporation (Consumer Discretionary, Auto Components) | | | | | | | | | | | 180,900 | | | | 2,562,598 | |
UBE Industries Limited (Materials, Chemicals) | | | | | | | | | | | 149,300 | | | | 2,671,232 | |
ULVAC Incorporated (Information Technology, Semiconductors & Semiconductor Equipment) | | | | | | | | | | | 85,100 | | | | 2,570,062 | |
| | | | |
| | | | | | | | | | | | | | | 188,219,170 | |
| | | | | | | | | | | | | | | | |
|
| Netherlands: 3.01% | |
ABN AMRO Group NV (Financials, Banks) 144A | | | | | | | | | | | 161,500 | | | | 1,285,012 | |
Aegon NV (Financials, Insurance) | | | | | | | | | | | 566,623 | | | | 1,520,646 | |
ASR Nederland NV (Financials, Insurance) | | | | | | | | | | | 83,831 | | | | 2,304,624 | |
ING Groep NV (Financials, Banks) | | | | | | | | | | | 282,500 | | | | 1,836,703 | |
Koninklijke Ahold Delhaize NV (Consumer Staples, Food & Staples Retailing) | | | | | | | | | | | 449,900 | | | | 11,406,731 | |
RHI Magnesita NV (Materials, Construction Materials) | | | | | | | | | | | 64,721 | | | | 1,943,309 | |
Signify NV (Industrials, Electrical Equipment) 144A | | | | | | | | | | | 161,000 | | | | 3,466,879 | |
| | | | |
| | | | | | | | | | | | | | | 23,763,904 | |
| | | | | | | | | | | | | | | | |
|
| Norway: 0.95% | |
DNB ASA (Financials, Banks) † | | | | | | | | | | | 207,900 | | | | 2,837,385 | |
Grieg Seafood ASA (Consumer Staples, Food Products) | | | | | | | | | | | 148,900 | | | | 1,524,824 | |
Leroy Seafood Group ASA (Consumer Staples, Food Products) | | | | | | | | | | | 558,599 | | | | 3,135,605 | |
| | | | |
| | | | | | | | | | | | | | | 7,497,814 | |
| | | | | | | | | | | | | | | | |
|
| Poland: 0.22% | |
Asseco Poland SA (Information Technology, Software) | | | | | | | | | | | 93,400 | | | | 1,703,373 | |
| | | | | | | | | | | | | | | | |
|
| Russia: 1.27% | |
Gazprom Neft ADR (Energy, Oil, Gas & Consumable Fuels) | | | | | | | | | | | 117,614 | | | | 2,793,732 | |
Gazprom Neft ADR (Energy, Oil, Gas & Consumable Fuels) | | | | | | | | | | | 886 | | | | 20,910 | |
Gazprom PAO ADR (Energy, Oil, Gas & Consumable Fuels) | | | | | | | | | | | 381,300 | | | | 2,141,293 | |
Lukoil PJSC ADR (Energy, Oil, Gas & Consumable Fuels) | | | | | | | | | | | 17,599 | | | | 1,325,029 | |
Lukoil PJSC ADR (Energy, Oil, Gas & Consumable Fuels) | | | | | | | | | | | 50,101 | | | | 3,764,326 | |
| | | | |
| | | | | | | | | | | | | | | 10,045,290 | |
| | | | | | | | | | | | | | | | |
The accompanying notes are an integral part of these financial statements.
28 | Wells Fargo International Value Portfolio
Portfolio of investments—May 31, 2020
| | | | | | | | | | | | | | | | |
| | | | | | | | | Shares | | | Value | |
| Singapore: 0.48% | |
DBS Group Holdings Limited (Financials, Banks) | | | | | | | | | | | 127,600 | | | $ | 1,765,281 | |
United Overseas Bank Limited (Financials, Banks) | | | | | | | | | | | 148,600 | | | | 2,058,181 | |
| | | | |
| | | | | | | | | | | | | | | 3,823,462 | |
| | | | | | | | | | | | | | | | |
|
| South Africa: 0.16% | |
Absa Group Limited (Financials, Banks) | | | | | | | | | | | 274,900 | | | | 1,278,313 | |
| | | | | | | | | | | | | | | | |
|
| South Korea: 2.22% | |
BNK Financial Group Incorporated (Financials, Banks) | | | | | | | | | | | 440,300 | | | | 1,812,535 | |
Industrial Bank of Korea (Financials, Banks) | | | | | | | | | | | 264,500 | | | | 1,776,531 | |
JB Financial Group Company Limited (Financials, Banks) | | | | | | | | | | | 25,418 | | | | 97,871 | |
KB Financial Group Incorporated (Financials, Banks) | | | | | | | | | | | 79,300 | | | | 2,164,184 | |
KT&G Corporation (Consumer Staples, Tobacco) | | | | | | | | | | | 52,100 | | | | 3,535,940 | |
LG Uplus Corporation (Communication Services, Diversified Telecommunication Services) | | | | | | | | | | | 343,500 | | | | 3,658,376 | |
SK Telecom Company Limited (Communication Services, Wireless Telecommunication Services) | | | | | | | | | | | 14,800 | | | | 2,584,843 | |
Woori Financial Group Incorporated (Financials, Banks) | | | | | | | | | | | 254,400 | | | | 1,877,264 | |
| | | | |
| | | | | | | | | | | | | | | 17,507,544 | |
| | | | | | | | | | | | | | | | |
|
| Spain: 1.33% | |
Banco Santander Central Hispano SA (Financials, Banks) | | | | | | | | | | | 731,000 | | | | 1,671,297 | |
Enagás SA (Utilities, Gas Utilities) | | | | | | | | | | | 121,100 | | | | 2,729,560 | |
International Consolidated Airlines Group SA (Industrials, Airlines) | | | | | | | | | | | 548,044 | | | | 1,559,852 | |
Repsol SA (Energy, Oil, Gas & Consumable Fuels) | | | | | | | | | | | 482,100 | | | | 4,539,007 | |
| | | | |
| | | | | | | | | | | | | | | 10,499,716 | |
| | | | | | | | | | | | | | | | |
|
| Sweden: 1.76% | |
Boliden AB (Materials, Metals & Mining) | | | | | | | | | | | 155,500 | | | | 3,397,889 | |
Electrolux AB Class B (Consumer Discretionary, Household Durables) | | | | | | | | | | | 122,900 | | | | 2,026,359 | |
Electrolux Professional AB Class B (Industrials, Machinery) † | | | | | | | | | | | 122,900 | | | | 444,903 | |
Volvo AB Class B (Industrials, Machinery) † | | | | | | | | | | | 563,800 | | | | 8,045,074 | |
| | | | |
| | | | | | | | | | | | | | | 13,914,225 | |
| | | | | | | | | | | | | | | | |
|
| Switzerland: 8.91% | |
Baloise Holding AG (Financials, Insurance) | | | | | | | | | | | 30,400 | | | | 4,350,100 | |
Credit Suisse Group AG (Financials, Capital Markets) | | | | | | | | | | | 452,200 | | | | 4,155,936 | |
Helvetia Holding AG (Financials, Insurance) | | | | | | | | | | | 21,500 | | | | 1,916,461 | |
Novartis AG (Health Care, Pharmaceuticals) | | | | | | | | | | | 192,040 | | | | 16,718,214 | |
Roche Holding AG (Health Care, Pharmaceuticals) | | | | | | | | | | | 75,400 | | | | 26,172,963 | |
Swiss Life Holding AG (Financials, Insurance) | | | | | | | | | | | 7,600 | | | | 2,693,886 | |
Swiss Reinsurance AG (Financials, Insurance) | | | | | | | | | | | 62,800 | | | | 4,288,706 | |
UBS Group AG (Financials, Capital Markets) | | | | | | | | | | | 424,002 | | | | 4,539,203 | |
Valiant Holding AG (Financials, Banks) | | | | | | | | | | | 17,400 | | | | 1,551,662 | |
Zurich Insurance Group AG (Financials, Insurance) | | | | | | | | | | | 12,400 | | | | 4,012,660 | |
| | | | |
| | | | | | | | | | | | | | | 70,399,791 | |
| | | | | | | | | | | | | | | | |
|
| Taiwan: 1.82% | |
Catcher Technology Company Limited (Information Technology, Technology Hardware, Storage & Peripherals) | | | | | | | | | | | 217,000 | | | | 1,581,478 | |
Hon Hai Precision Industry Company Limited (Information Technology, Electronic Equipment, Instruments & Components) | | | | | | | | | | | 1,042,000 | | | | 2,636,148 | |
Powertech Technology Incorporated (Information Technology, Semiconductors & Semiconductor Equipment) | | | | | | | | | | | 1,067,000 | | | | 3,455,636 | |
Tripod Technology Corporation (Information Technology, Electronic Equipment, Instruments & Components) | | | | | | | | | | | 823,000 | | | | 3,094,809 | |
Wistron Corporation (Information Technology, Technology Hardware, Storage & Peripherals) | | | | | | | | | | | 3,768,000 | | | | 3,592,356 | |
| | | | |
| | | | | | | | | | | | | | | 14,360,427 | |
| | | | | | | | | | | | | | | | |
The accompanying notes are an integral part of these financial statements.
Wells Fargo International Value Portfolio | 29
Portfolio of investments—May 31, 2020
| | | | | | | | | | | | | | | | |
| | | | | | | | | Shares | | | Value | |
| Thailand: 0.57% | |
Krung Thai Bank PCL ADR (Financials, Banks) | | | | | | | | | | | 3,618,100 | | | $ | 1,171,532 | |
Quality House PCL (Real Estate, Real Estate Management & Development) | | | | | | | | | | | 24,369,400 | | | | 1,654,760 | |
Thanachart Capital PCL (Financials, Banks) | | | | | | | | | | | 1,481,500 | | | | 1,699,929 | |
| | | | |
| | | | | | | | | | | | | | | 4,526,221 | |
| | | | | | | | | | | | | | | | |
|
| Turkey: 0.52% | |
Coca-Cola Icecek Uretim AS (Consumer Staples, Beverages) | | | | | | | | | | | 83,461 | | | | 495,432 | |
Koc Holding AS (Industrials, Industrial Conglomerates) | | | | | | | | | | | 857,500 | | | | 2,027,428 | |
TAV Havalimanlari Holding AS (Industrials, Transportation Infrastructure) | | | | | | | | | | | 520,000 | | | | 1,552,094 | |
| | | | |
| | | | | | | | | | | | | | | 4,074,954 | |
| | | | | | | | | | | | | | | | |
| | | | |
| United Kingdom: 14.20% | | | | | | | | | | | | |
3i Group plc (Financials, Capital Markets) | | | | | | | | | | | 265,500 | | | | 2,716,982 | |
Anglo American plc (Materials, Metals & Mining) | | | | | | | | | | | 273,400 | | | | 5,787,613 | |
Aviva plc (Financials, Insurance) | | | | | | | | | | | 704,391 | | | | 2,172,717 | |
Babcock International Group plc (Industrials, Commercial Services & Supplies) | | | | | | | | | | | 516,789 | | | | 2,451,777 | |
BAE Systems plc (Industrials, Aerospace & Defense) | | | | | | | | | | | 973,900 | | | | 6,010,736 | |
Barclays plc (Financials, Banks) | | | | | | | | | | | 1,661,400 | | | | 2,375,050 | |
Barratt Developments plc (Consumer Discretionary, Household Durables) | | | | | | | | | | | 329,100 | | | | 2,035,682 | |
Bellway plc (Consumer Discretionary, Household Durables) | | | | | | | | | | | 80,100 | | | | 2,556,933 | |
Bovis Homes Group plc (Consumer Discretionary, Household Durables) | | | | | | | | | | | 195,500 | | | | 1,857,505 | |
BP plc (Energy, Oil, Gas & Consumable Fuels) | | | | | | | | | | | 1,371,200 | | | | 5,243,384 | |
British American Tobacco plc (Consumer Staples, Tobacco) | | | | | | | | | | | 221,400 | | | | 8,780,814 | |
BT Group plc (Communication Services, Diversified Telecommunication Services) | | | | | | | | | | | 1,544,700 | | | | 2,223,938 | |
Centrica plc (Utilities, Multi-Utilities) | | | | | | | | | | | 1,821,200 | | | | 826,234 | |
Crest Nicholson Holdings plc (Consumer Discretionary, Household Durables) | | | | | | | | | | | 345,400 | | | | 1,136,285 | |
Firstgroup plc (Industrials, Road & Rail) † | | | | | | | | | | | 802,300 | | | | 552,913 | |
GlaxoSmithKline plc (Health Care, Pharmaceuticals) | | | | | | | | | | | 595,100 | | | | 12,326,131 | |
Highland Gold Mining Limited (Materials, Metals & Mining) | | | | | | | | | | | 1,280,734 | | | | 4,071,132 | |
Imperial Tobacco Group plc (Consumer Staples, Tobacco) | | | | | | | | | | | 207,800 | | | | 3,790,306 | |
Inchcape plc (Consumer Discretionary, Distributors) | | | | | | | | | | | 423,425 | | | | 2,632,506 | |
J Sainsbury plc (Consumer Staples, Food & Staples Retailing) | | | | | | | | | | | 1,688,805 | | | | 4,049,474 | |
Kingfisher plc (Consumer Discretionary, Specialty Retail) | | | | | | | | | | | 1,946,000 | | | | 4,722,910 | |
Legal & General Group plc (Financials, Insurance) | | | | | | | | | | | 1,127,800 | | | | 2,784,460 | |
Lloyds Banking Group plc (Financials, Banks) | | | | | | | | | | | 3,820,600 | | | | 1,409,048 | |
Marks & Spencer Group plc (Consumer Discretionary, Multiline Retail) | | | | | | | | | | | 705,000 | | | | 856,005 | |
Marston’s plc (Consumer Discretionary, Hotels, Restaurants & Leisure) | | | | | | | | | | | 660,700 | | | | 506,714 | |
Mitchells & Butlers plc (Consumer Discretionary, Hotels, Restaurants & Leisure) † | | | | | | | | | | | 367,200 | | | | 825,012 | |
Paragon Group of Companies plc (Financials, Thrifts & Mortgage Finance) | | | | | | | | | | | 501,100 | | | | 2,193,446 | |
Petrofac Limited (Energy, Energy Equipment & Services) | | | | | | | | | | | 522,047 | | | | 1,111,269 | |
Premier Foods plc (Consumer Staples, Food Products) † | | | | | | | | | | | 73,926 | | | | 40,189 | |
QinetiQ Group plc (Industrials, Aerospace & Defense) | | | | | | | | | | | 556,400 | | | | 2,042,269 | |
Redrow plc (Consumer Discretionary, Household Durables) | | | | | | | | | | | 420,064 | | | | 2,444,603 | |
Royal Dutch Shell plc Class B (Energy, Oil, Gas & Consumable Fuels) | | | | | | | | | | | 480,700 | | | | 7,338,777 | |
Royal Mail plc (Industrials, Air Freight & Logistics) | | | | | | | | | | | 539,626 | | | | 1,164,142 | |
Tate & Lyle plc (Consumer Staples, Food Products) | | | | | | | | | | | 497,300 | | | | 4,148,208 | |
Tesco plc (Consumer Staples, Food & Staples Retailing) | | | | | | | | | | | 2,473,800 | | | | 7,024,366 | |
| | | | |
| | | | | | | | | | | | | | | 112,209,530 | |
| | | | | | | | | | | | | | | | |
| |
Total Common Stocks (Cost $913,359,536) | | | | 768,783,896 | |
| | | | | |
| | | | |
| | | | | | | | | | | | | | | | |
The accompanying notes are an integral part of these financial statements.
30 | Wells Fargo International Value Portfolio
Portfolio of investments—May 31, 2020
| | | | | | | | | | | | | | | | |
| | | Dividend yield | | | | | | Shares | | | Value | |
| Preferred Stocks: 0.21% | |
|
| Brazil: 0.21% | |
Banco do Estado do Rio Grande do Sul SA Class B (Financials, Banks) | | | 1.22 | % | | | | | | | 711,000 | | | $ | 1,670,809 | |
| | | | | | | | | | | | | | | | |
| |
Total Preferred Stocks (Cost $2,996,311) | | | | 1,670,809 | |
| | | | | |
| | | | |
| | | | | | | | | | | | | | | | |
| | | Yield | | | | | | | | | | |
| Short-Term Investments: 0.40% | |
|
| Investment Companies: 0.40% | |
Wells Fargo Government Money Market Fund Select Class (l)(u) | | | 0.12 | | | | | | | | 3,130,999 | | | | 3,130,999 | |
| | | | | | | | | | | | | | | | |
| |
Total Short-Term Investments (Cost $3,130,999) | | | | 3,130,999 | |
| | | | | |
| | | | | | | | |
| Total investments in securities (Cost $919,486,846) | | | 97.90 | % | | | 773,585,704 | |
| | |
Other assets and liabilities, net | | | 2.10 | | | | 16,607,475 | |
| | | | | | | | |
| Total net assets | | | 100.00 | % | | $ | 790,193,179 | |
| | | | | | | | |
| † | Non-income-earning security |
| 144A | The security may be resold in transactions exempt from registration, normally to qualified institutional buyers, pursuant to Rule 144A under the Securities Act of 1933. |
| (l) | The issuer of the security is an affiliated person of the Portfolio as defined in the Investment Company Act of 1940. |
| (u) | The rate represents the 7-day annualized yield at period end. |
Abbreviations:
| ADR | American depositary receipt |
| REIT | Real estate investment trust |
Investments in Affiliates
An affiliated investment is an investment in which the Portfolio owns at least 5% of the outstanding voting shares of the issuer or as a result of other relationships, such as the Portfolio and the issuer having the same adviser or investment manager. Transactions with issuers that were either affiliated persons of the Portfolio at the beginning of the period or the end of the period were as follows:
| | | | | | | | | | | | | | | | | | | | | | | | | | | | | | | | | | | | |
| | | Shares,
beginning of
period
| | | Shares
purchased | | | Shares
sold | | | Shares,
end of
period | | | Net
realized
gains
(losses) | | | Net
change in
unrealized
gains
(losses) | | | Income
from
affiliated
securities | | | Value,
end of
period | | | % of
net
assets | |
| | | | | | | | | |
| Short-Term Investments | | | | | | | | | | | | | | | | | | | | | | | | | | | |
Investment Companies | | | | | | | | | | | | | | | | | | | | | | | | | | | | | | | | | | | | |
Securities Lending Cash Investments LLC * | | | 64,602,214 | | | | 205,570,256 | | | | (270,172,470 | ) | | | 0 | | | $ | (339 | ) | | $ | (295 | ) | | | 394,562 | # | | $ | 0 | | | | | |
Wells Fargo Government Money Market Fund Select Class | | | 6,351,554 | | | | 108,892,566 | | | | (112,113,121 | ) | | | 3,130,999 | | | | 0 | | | | 0 | | | | 99,898 | | | | 3,130,999 | | | | | |
| | | | | | | | | | | | | | | | | | | | | | | | | | | | | | | | | | | | |
| | | | | | | | | | | | | | | | | | $ | (339 | ) | | $ | (295 | ) | | $ | 494,460 | | | $ | 3,130,999 | | | | 0.40 | % |
| | | | | | | | | | | | | | | | | | | | | | | | | | | | | | | | | | | | |
| * | No longer held at the end of the period |
| # | Amount shown represents income before fees and rebates. |
The accompanying notes are an integral part of these financial statements.
Wells Fargo International Value Portfolio | 31
Statement of assets and liabilities—May 31, 2020
| | | | |
| | | | |
| |
Assets | | | | |
Investments in unaffiliated securities, at value (cost $916,355,847) | | $ | 770,454,705 | |
Investments in affiliated securities, at value (cost $3,130,999) | | | 3,130,999 | |
Foreign currency, at value (cost $10,600,118) | | | 10,073,524 | |
Receivable for dividends | | | 6,927,205 | |
Prepaid expenses and other assets | | | 181,999 | |
| | | | |
Total assets | | | 790,768,432 | |
| | | | |
| |
Liabilities | | | | |
Payable for investments purchased | | | 68,446 | |
Overdraft due to custodian bank | | | 1,002 | |
Advisory fee payable | | | 505,025 | |
Trustees’ fees and expenses payable | | | 780 | |
| | | | |
Total liabilities | | | 575,253 | |
| | | | |
Total net assets | | $ | 790,193,179 | |
| | | | |
The accompanying notes are an integral part of these financial statements.
32 | Wells Fargo International Value Portfolio
Statement of operations—year ended May 31, 2020
| | | | |
| | | | |
| |
Investment income | | | | |
Dividends (net of foreign withholding taxes of $4,618,628) | | $ | 31,220,678 | |
Income from affiliated securities | | | 735,201 | |
| | | | |
Total investment income | | | 31,955,879 | |
| | | | |
| |
Expenses | | | | |
Advisory fee | | | 7,967,121 | |
Custody and accounting fees | | | 194,813 | |
Professional fees | | | 60,500 | |
Shareholder report expenses | | | 2,632 | |
Trustees’ fees and expenses | | | 20,553 | |
Interest expense | | | 745 | |
Other fees and expenses | | | 44,643 | |
| | | | |
Total expenses | | | 8,291,007 | |
Less: Fee waivers and/or expense reimbursements | | | (2,901 | ) |
| | | | |
Net expenses | | | 8,288,106 | |
| | | | |
Net investment income | | | 23,667,773 | |
| | | | |
| |
Realized and unrealized gains (losses) on investments | | | | |
Net realized losses on | | | | |
Unaffiliated securities | | | (20,032,001 | ) |
Affiliated securities | | | (339 | ) |
| | | | |
Net realized losses on investments | | | (20,032,340 | ) |
| | | | |
| |
Net change in unrealized gains (losses) on | | | | |
Unaffiliated securities | | | (56,686,019 | ) |
Affiliated securities | | | (295 | ) |
| | | | |
Net change in unrealized gains (losses) on investments | | | (56,686,314 | ) |
| | | | |
Net realized and unrealized gains (losses) on investments | | | (76,718,654 | ) |
| | | | |
Net decrease in net assets resulting from operations | | $ | (53,050,881 | ) |
| | | | |
The accompanying notes are an integral part of these financial statements.
Wells Fargo International Value Portfolio | 33
Statement of changes in net assets
| | | | | | | | |
| | | Year ended
May 31, 2020 | | | Year ended
May 31, 2019 | |
| | |
Operations | | | | | | | | |
Net investment income | | $ | 23,667,773 | | | $ | 40,210,852 | |
Net realized losses on investments | | | (20,032,340 | ) | | | (6,397,492 | ) |
Net change in unrealized gains (losses) on investments | | | (56,686,314 | ) | | | (155,017,981 | ) |
| | | | |
Net decrease in net assets resulting from operations | | | (53,050,881 | ) | | | (121,204,621 | ) |
| | | | |
| | |
Capital transactions | | | | | | | | |
Transactions in investors’ beneficial interests | | | | | | | | |
Contributions | | | 111,076,835 | | | | 527,916,476 | |
Withdrawals | | | (336,573,528 | ) | | | (237,901,170 | ) |
| | | | |
Net increase (decrease) in net assets resulting from capital transactions | | | (225,496,693 | ) | | | 290,015,306 | |
| | | | |
Total increase (decrease) in net assets | | | (278,547,574 | ) | | | 168,810,685 | |
| | | | |
| | |
Net assets | | | | | | | | |
Beginning of period | | | 1,068,740,753 | | | | 899,930,068 | |
| | | | |
End of period | | $ | 790,193,179 | | | $ | 1,068,740,753 | |
| | | | |
The accompanying notes are an integral part of these financial statements.
34 | Wells Fargo International Value Portfolio
Financial highlights
| | | | | | | | | | | | | | | | | | | | |
| | | Year ended May 31 | |
| | | 2020 | | | 2019 | | | 2018 | | | 2017 | | | 2016 | |
Total return | | | (8.99 | )% | | | (10.98 | )% | | | 7.74 | % | | | 19.16 | % | | | (11.85 | )% |
Ratios to average net assets (annualized) | | | | | | | | | | | | | | | | | | | | |
Gross expenses | | | 0.80 | % | | | 0.80 | % | | | 0.82 | % | | | 0.87 | % | | | 0.91 | % |
Net expenses | | | 0.80 | % | | | 0.80 | % | | | 0.82 | % | | | 0.87 | % | | | 0.91 | % |
Net investment income | | | 2.28 | % | | | 3.53 | % | | | 2.65 | % | | | 3.03 | % | | | 2.50 | % |
Supplemental data | | | | | | | | | | | | | | | | | | | | |
Portfolio turnover rate | | | 20 | % | | | 13 | % | | | 15 | % | | | 41 | % | | | 14 | % |
The accompanying notes are an integral part of these financial statements.
Wells Fargo International Value Portfolio | 35
Notes to financial statements
1. ORGANIZATION
Wells Fargo Master Trust (the “Trust”), a Delaware statutory trust organized on March 10, 1999, is an open-end management investment company registered under the Investment Company Act of 1940, as amended (the “1940 Act”). As an investment company, the Trust follows the accounting and reporting guidance in Financial Accounting Standards Board (“FASB”) Accounting Standards Codification Topic 946, Financial Services – Investment Companies. These financial statements report on the Wells Fargo International Value Portfolio (the “Portfolio”) which is a diversified series of the Trust.
2. SIGNIFICANT ACCOUNTING POLICIES
The following significant accounting policies, which are consistently followed in the preparation of the financial statements of the Portfolio, are in conformity with U.S. generally accepted accounting principles which require management to make estimates and assumptions that affect the reported amounts of assets and liabilities, disclosure of contingent assets and liabilities at the date of the financial statements, and the reported amounts of revenues and expenses during the reporting period. Actual results could differ from those estimates.
Securities valuation
All investments are valued each business day as of the close of regular trading on the New York Stock Exchange (generally 4 p.m. Eastern Time), although the Portfolio may deviate from this calculation time under unusual or unexpected circumstances.
Equity securities that are listed on a foreign or domestic exchange or market are valued at the official closing price or, if none, the last sales price. If no sale occurs on the principal exchange or market that day, a fair value price will be determined in accordance with the Portfolio’s Valuation Procedures.
The values of securities denominated in foreign currencies are translated into U.S. dollars at rates provided by an independent foreign currency pricing source at a time each business day specified by the Wells Fargo Asset Management Pricing Committee at Wells Fargo Funds Management, LLC (“Funds Management”)
Many securities markets and exchanges outside the U.S. close prior to the close of the New York Stock Exchange and therefore may not fully reflect trading or events that occur after the close of the principal exchange in which the foreign securities are traded, but before the close of the New York Stock Exchange. If such trading or events are expected to materially affect the value of such securities, then fair value pricing procedures approved by the Board of Trustees of the Portfolio are applied. These procedures take into account multiple factors including movements in U.S. securities markets after foreign exchanges close. Foreign securities that are fair valued under these procedures are categorized as Level 2 and the application of these procedures may result in transfers between Level 1 and Level 2. Depending on market activity, such fair valuations may be frequent. Such fair value pricing may result in net asset values that are higher or lower than net asset values based on the last reported sales price or latest quoted bid price. On May 31, 2020, such fair value pricing was used in pricing certain foreign securities.
Investments in registered open-end investment companies are valued at net asset value. Interests in non-registered investment companies that are redeemable at net asset value are fair valued normally at net asset value.
Investments which are not valued using any of the methods discussed above are valued at their fair value, as determined in good faith by the Board of Trustees. The Board of Trustees has established a Valuation Committee comprised of the Trustees and has delegated to it the authority to take any actions regarding the valuation of portfolio securities that the Valuation Committee deems necessary or appropriate, including determining the fair value of portfolio securities, unless the determination has been delegated to the Wells Fargo Asset Management Pricing Committee. The Board of Trustees retains the authority to make or ratify any valuation decisions or approve any changes to the Valuation Procedures as it deems appropriate. On a quarterly basis, the Board of Trustees receives reports on any valuation actions taken by the Valuation Committee or the Wells Fargo Asset Management Pricing Committee which may include items for ratification.
Foreign currency translation
The accounting records of the Portfolio are maintained in U.S. dollars. The values of other assets and liabilities denominated in foreign currencies are translated into U.S. dollars at rates provided by an independent foreign currency pricing source at a time each business day specified by the Wells Fargo Asset Management Pricing Committee. Purchases and sales of securities, and income and expenses are converted at the rate of exchange on the respective dates of such transactions. Net realized foreign exchange gains or losses arise from sales of foreign currencies, currency gains or losses realized between the trade and settlement dates on securities transactions, and the difference between the amounts of dividends, interest and foreign withholding taxes recorded and the U.S. dollar equivalent of the amounts actually paid or received. Net unrealized foreign exchange gains and losses arise from changes in the fair value of assets and liabilities other than investments in securities
36 | Wells Fargo International Value Portfolio
Notes to financial statements
resulting from changes in exchange rates. The changes in net assets arising from changes in exchange rates of securities and the changes in net assets resulting from changes in market prices of securities are not separately presented. Such changes are included in net realized and unrealized gains or losses from investments.
Securities lending
The Portfolio may lend its securities from time to time in order to earn additional income in the form of fees or interest on securities received as collateral or the investment of any cash received as collateral. When securities are on loan, the Portfolio receives interest or dividends on those securities. Cash collateral received in connection with its securities lending transactions is invested in Securities Lending Cash Investments, LLC (the “Securities Lending Fund”). Investments in Securities Lending Fund are valued at the evaluated bid price provided by an independent pricing service. Income earned from investment in the Securities Lending Fund (net of fees and rebates), if any, is included in income from affiliated securities on the Statement of Operations.
In a securities lending transaction, the net asset value of the Portfolio is affected by an increase or decrease in the value of the securities loaned and by an increase or decrease in the value of the instrument in which collateral is invested. The amount of securities lending activity undertaken by the Portfolio fluctuates from time to time. The Portfolio has the right under the lending agreement to recover the securities from the borrower on demand. In the event of default or bankruptcy by the borrower, the Portfolio may be prevented from recovering the loaned securities or gaining access to the collateral or may experience delays or costs in doing so. In such an event, the terms of the agreement allow the unaffiliated securities lending agent to use the collateral to purchase replacement securities on behalf of the Portfolio or pay the Portfolio the market value of the loaned securities. The Portfolio bears the risk of loss with respect to depreciation of its investment of the cash collateral.
Security transactions and income recognition
Securities transactions are recorded on a trade date basis. Realized gains or losses are recorded on the basis of identified cost.
Dividend income is recognized on the ex-dividend date, except for certain dividends from foreign securities, which are recorded as soon as the custodian verifies the ex-dividend date. Dividend income from foreign securities is recorded net of foreign taxes withheld where recovery of such taxes is not assured.
Federal and other taxes
The Portfolio is treated as a separate entity for federal income tax purposes. The Portfolio is not required to pay federal income taxes on its net investment income and net capital gains as it is treated as a partnership for federal income tax purposes. All dividends, gains and losses of the Portfolio are deemed to have been “passed through” to the interest holders in proportion to their holdings of the Portfolio regardless of whether dividends and gains have been distributed by the Portfolio.
The Portfolio’s income tax returns and all financial records supporting those returns for the prior three fiscal years are subject to examination by the federal revenue authority. Management has analyzed the Portfolio’s tax positions taken on federal, state, and foreign tax returns for all open tax years and does not believe that there are any uncertain tax positions that require recognition of a tax liability.
As of May 31, 2020, the aggregate cost of all investments for federal income tax purposes was $923,416,316 and the unrealized gains (losses) consisted of:
| | | | |
| |
Gross unrealized gains | | $ | 70,138,564 | |
| |
Gross unrealized losses | | | (219,969,176 | ) |
| |
Net unrealized losses | | $ | (149,830,612 | ) |
3. FAIR VALUATION MEASUREMENTS
Fair value measurements of investments are determined within a framework that has established a fair value hierarchy based upon the various data inputs utilized in determining the value of the Portfolio’s investments. The three-level hierarchy gives the highest priority to unadjusted quoted prices in active markets for identical assets or liabilities (Level 1) and the lowest priority to unobservable inputs (Level 3). The Portfolio’s investments are classified within the fair value hierarchy based on the lowest level of input that is significant to the fair value measurement. The inputs are summarized into three broad levels as follows:
| ∎ | | Level 1 – quoted prices in active markets for identical securities |
| ∎ | | Level 2 – other significant observable inputs (including quoted prices for similar securities, interest rates, prepayment speeds, credit risk, etc.) |
| ∎ | | Level 3 – significant unobservable inputs (including the Portfolio’s own assumptions in determining the fair value of investments) |
Wells Fargo International Value Portfolio | 37
Notes to financial statements
The inputs or methodologies used for valuing investments in securities are not necessarily an indication of the risk associated with investing in those securities.
The following is a summary of the inputs used in valuing the Portfolio’s assets and liabilities as of May 31, 2020:
| | | | | | | | | | | | | | | | |
| | | | |
| | | Quoted prices
(Level 1) | | | Other significant observable inputs (Level 2) | | | Significant unobservable inputs (Level 3) | | | Total | |
| | | |
Assets | | | | | | | | | | | | |
Investments in: | | | | | | | | | | | | |
| | | |
Common stocks | | | | | | | | | | | | |
| | | | |
Australia | | $ | 0 | | | $ | 37,590,361 | | | $ | 0 | | | $ | 37,590,361 | |
| | | | |
Austria | | | 0 | | | | 5,623,154 | | | | 0 | | | | 5,623,154 | |
| | | | |
Belgium | | | 0 | | | | 4,356,224 | | | | 0 | | | | 4,356,224 | |
| | | | |
Brazil | | | 6,633,824 | | | | 0 | | | | 0 | | | | 6,633,824 | |
| | | | |
Canada | | | 7,395,250 | | | | 0 | | | | 0 | | | | 7,395,250 | |
| | | | |
China | | | 0 | | | | 24,690,526 | | | | 0 | | | | 24,690,526 | |
| | | | |
Denmark | | | 0 | | | | 8,015,619 | | | | 0 | | | | 8,015,619 | |
| | | | |
Finland | | | 0 | | | | 1,387,368 | | | | 0 | | | | 1,387,368 | |
| | | | |
France | | | 0 | | | | 63,149,680 | | | | 0 | | | | 63,149,680 | |
| | | | |
Germany | | | 0 | | | | 67,721,214 | | | | 0 | | | | 67,721,214 | |
| | | | |
Hong Kong | | | 0 | | | | 25,879,455 | | | | 0 | | | | 25,879,455 | |
| | | | |
India | | | 0 | | | | 3,497,942 | | | | 0 | | | | 3,497,942 | |
| | | | |
Ireland | | | 0 | | | | 4,900,685 | | | | 0 | | | | 4,900,685 | |
| | | | |
Israel | | | 0 | | | | 2,569,363 | | | | 0 | | | | 2,569,363 | |
| | | | |
Italy | | | 0 | | | | 21,549,497 | | | | 0 | | | | 21,549,497 | |
| | | | |
Japan | | | 0 | | | | 188,219,170 | | | | 0 | | | | 188,219,170 | |
| | | | |
Netherlands | | | 0 | | | | 23,763,904 | | | | 0 | | | | 23,763,904 | |
| | | | |
Norway | | | 0 | | | | 7,497,814 | | | | 0 | | | | 7,497,814 | |
| | | | |
Poland | | | 0 | | | | 1,703,373 | | | | 0 | | | | 1,703,373 | |
| | | | |
Russia | | | 1,345,939 | | | | 8,699,351 | | | | 0 | | | | 10,045,290 | |
| | | | |
Singapore | | | 0 | | | | 3,823,462 | | | | 0 | | | | 3,823,462 | |
| | | | |
South Africa | | | 0 | | | | 1,278,313 | | | | 0 | | | | 1,278,313 | |
| | | | |
South Korea | | | 0 | | | | 17,507,544 | | | | 0 | | | | 17,507,544 | |
| | | | |
Spain | | | 0 | | | | 10,499,716 | | | | 0 | | | | 10,499,716 | |
| | | | |
Sweden | | | 444,903 | | | | 13,469,322 | | | | 0 | | | | 13,914,225 | |
| | | | |
Switzerland | | | 0 | | | | 70,399,791 | | | | 0 | | | | 70,399,791 | |
| | | | |
Taiwan | | | 0 | | | | 14,360,427 | | | | 0 | | | | 14,360,427 | |
| | | | |
Thailand | | | 4,526,221 | | | | 0 | | | | 0 | | | | 4,526,221 | |
| | | | |
Turkey | | | 0 | | | | 4,074,954 | | | | 0 | | | | 4,074,954 | |
| | | | |
United Kingdom | | | 506,714 | | | | 111,702,816 | | | | 0 | | | | 112,209,530 | |
| | | |
Preferred stocks | | | | | | | | | | | | |
| | | | |
Brazil | | | 1,670,809 | | | | 0 | | | | 0 | | | | 1,670,809 | |
| | | |
Short-term investments | | | | | | | | | | | | |
| | | | |
Investment companies | | | 3,130,999 | | | | 0 | | | | 0 | | | | 3,130,999 | |
| | | | |
Total assets | | $ | 25,654,659 | | | $ | 747,931,045 | | | $ | 0 | | | $ | 773,585,704 | |
Additional sector, industry or geographic detail is included in the Portfolio of Investments.
For the year ended May 31, 2020, the Portfolio did not have any transfers into/out of Level 3.
38 | Wells Fargo International Value Portfolio
Notes to financial statements
4. TRANSACTIONS WITH AFFILIATES AND OTHER EXPENSES
Advisory fee
The Trust has entered into an advisory contract with Funds Management, an indirect wholly owned subsidiary of Wells Fargo & Company (“Wells Fargo”). The adviser is responsible for implementing investment policies and guidelines and for supervising the subadviser, who is responsible for day-to-day portfolio management of the Portfolio. Pursuant to the contract, Funds Management is entitled to receive an annual advisory fee at the following annual rate based on the Portfolio’s average daily net assets:
| | | | |
| |
| Average daily net assets | | Advisory fee | |
| |
First $500 million | | | 0.800 | % |
| |
Next $500 million | | | 0.750 | |
| |
Next $1 billion | | | 0.700 | |
| |
Next $2 billion | | | 0.675 | |
| |
Over $4 billion | | | 0.650 | |
For the year ended May 31, 2020, the advisory fee was equivalent to an annual rate of 0.77% of the Portfolio’s average daily net assets.
Funds Management has retained the services of a subadviser to provide daily portfolio management to the Portfolio. The fee for subadvisory services is borne by Funds Management. LSV Asset Management, which is not an affiliate of the Funds Management, is the subadviser to the Portfolio and is entitled to receive a fee from Funds Management at an annual rate starting at 0.35% and declining to 0.30% as the average daily net assets of the Portfolio increase.
Interfund transactions
The Fund may purchase or sell portfolio investment securities to certain other Wells Fargo affiliates pursuant to Rule 17a-7 under the 1940 Act and under procedures adopted by the Board of Trustees. The procedures have been designed to ensure that these interfund transactions, which do not incur broker commissions, are effected at current market prices.
5. INVESTMENT PORTFOLIO TRANSACTIONS
Purchases and sales of investments, excluding U.S. government obligations (if any) and short-term securities, for the year ended May 31, 2020 were $197,842,404 and $386,175,637, respectively.
6. SECURITIES LENDING TRANSACTIONS
The Fund lends its securities through an unaffiliated securities lending agent and receives collateral in the form of cash or securities with a value at least equal to the value of the securities on loan. The value of the loaned securities is determined at the close of each business day and any increases or decreases in the required collateral are exchanged between the Fund and the counterparty on the next business day. Cash collateral received is invested in the Securities Lending Fund which seeks to provide a positive return compared to the daily Federal Funds Open Rate by investing in high-quality, U.S. dollar-denominated short-term money market instruments and is exempt from registration under Section 3(c)(7) of the 1940 Act. Securities Lending Fund is managed by Funds Management and is subadvised by Wells Capital Management Incorporated (“WellsCap”). Funds Management receives an advisory fee starting at 0.05% and declining to 0.01% as the average daily net assets of the Securities Lending Fund increase. All of the fees received by Funds Management are paid to WellsCap for its services as subadviser.
In the event of counterparty default or the failure of a borrower to return a loaned security, the Fund has the right to use the collateral to offset any losses incurred. As of May 31, 2020, the Fund did not have any securities on loan.
7. BANK BORROWINGS
The Trust, along with Wells Fargo Variable Trust and Wells Fargo Funds Trust (excluding the money market funds), are parties to a $280,000,000 revolving credit agreement whereby the Portfolio is permitted to use bank borrowings for temporary or emergency purposes, such as to fund shareholder redemption requests. Interest under the credit agreement is charged to the Portfolio based on a borrowing rate equal to the higher of the Federal Funds rate in effect on that day plus 1.25% or the overnight LIBOR rate in effect on that day plus 1.25%. In addition, an annual commitment fee equal to 0.25% of the unused balance is allocated to each participating fund.
Wells Fargo International Value Portfolio | 39
Notes to financial statements
During the year ended May 31, 2020, the Portfolio had average borrowings outstanding of $23,354 at an average rate of 3.19% and paid interest in the amount of $745.
8. CONCENTRATION RISK
Concentration risks result from exposure to a limited number of geographic regions. As of the end of the period, the Portfolio invested a concentration of its portfolio in Europe. A Portfolio that invests a substantial portion of its assets in any geographic region may be more affected by changes in that geographic region than would be a Portfolio whose investments are not heavily weighted in any geographic region.
9. INDEMNIFICATION
Under the Portfolio’s organizational documents, the officers and Trustees have been granted certain indemnification rights against certain liabilities that may arise out of performance of their duties to the Portfolio. The Portfolio has entered into a separate agreement with each Trustee that converts indemnification rights currently existing under the Portfolio’s organizational documents into contractual rights that cannot be changed in the future without the consent of the Trustee. Additionally, in the normal course of business, the Portfolio may enter into contracts with service providers that contain a variety of indemnification clauses. The Portfolio’s maximum exposure under these arrangements is dependent on future claims that may be made against the Portfolio and, therefore, cannot be estimated.
10. NEW ACCOUNTING PRONOUNCEMENT
In August 2018, FASB issued Accounting Standards Update (“ASU”) No. 2018-13, Fair Value Measurement (Topic 820) Disclosure Framework—Changes to the Disclosure Requirements for Fair Value Measurement. ASU 2018-13 updates the disclosure requirements for fair value measurements by modifying or removing certain disclosures and adding certain new disclosures. The amendments are effective for fiscal years, and interim periods within those fiscal years, beginning after December 15, 2019. Early adoption is permitted. Management has adopted the removal and modification of disclosures early, as permitted, and will adopt the additional new disclosures at the effective date.
11. CORONAVIRUS (COVID-19) PANDEMIC
On March 11, 2020, the World Health Organization announced that it had made the assessment that coronavirus disease 2019 (“COVID-19”) is a pandemic. The impacts of COVID-19 are adversely affecting the entire global economy, individual companies and investment products, and the market in general. There is significant uncertainty around the extent and duration of business disruptions related to COVID-19 and the impacts may be short term or may last for an extended period of time. The risk of further spreading of COVID-19 has led to significant uncertainty and volatility in the financial markets. The value of the Portfolio and the securities in which the Portfolio invests have generally been adversely affected by impacts caused by COVID-19.
40 | Wells Fargo International Value Portfolio
Report of independent registered public accounting firm
TO THE INTEREST HOLDERS OF THE PORTFOLIO AND BOARD OF TRUSTEES WELLS FARGO MASTER TRUST:
Opinion on the Financial Statements
We have audited the accompanying statement of assets and liabilities of Wells Fargo International Value Portfolio (the Portfolio), one of the portfolios constituting Wells Fargo Master Trust, including the portfolio of investments, as of May 31, 2020, the related statement of operations for the year then ended, the statements of changes in net assets for each of the years in the two-year period then ended, and the related notes (collectively, the financial statements) and the financial highlights for each of the years in the five-year period then ended. In our opinion, the financial statements and financial highlights present fairly, in all material respects, the financial position of the Portfolio as of May 31, 2020, the results of its operations for the year then ended, the changes in its net assets for each of the years in the two-year period then ended, and the financial highlights for each of the years in the five-year period then ended, in conformity with U.S. generally accepted accounting principles.
Basis for Opinion
These financial statements and financial highlights are the responsibility of the Portfolio’s management. Our responsibility is to express an opinion on these financial statements and financial highlights based on our audits. We are a public accounting firm registered with the Public Company Accounting Oversight Board (United States) (PCAOB) and are required to be independent with respect to the Portfolio in accordance with the U.S. federal securities laws and the applicable rules and regulations of the Securities and Exchange Commission and the PCAOB.
We conducted our audits in accordance with the standards of the PCAOB. Those standards require that we plan and perform the audit to obtain reasonable assurance about whether the financial statements and financial highlights are free of material misstatement, whether due to error or fraud. Our audits included performing procedures to assess the risks of material misstatement of the financial statements and financial highlights, whether due to error or fraud, and performing procedures that respond to those risks. Such procedures included examining, on a test basis, evidence regarding the amounts and disclosures in the financial statements and financial highlights. Such procedures also included confirmation of securities owned as of May 31, 2020, by correspondence with the custodian, transfer agent and brokers, or by other appropriate auditing procedures. Our audits also included evaluating the accounting principles used and significant estimates made by management, as well as evaluating the overall presentation of the financial statements and financial highlights. We believe that our audits provide a reasonable basis for our opinion.
We have not been able to determine the specific year that we began serving as the auditor of one or more Wells Fargo Funds investment companies; however we are aware that we have served as the auditor of one or more Wells Fargo Funds investment companies since at least 1955.
Boston, Massachusetts
July 29, 2020
Wells Fargo International Value Portfolio | 41
Other information (unaudited)
TAX INFORMATION
Pursuant to Section 854 of the Internal Revenue Code, $30,790,214 of income dividends paid during the fiscal year ended May 31, 2020 has been designated as qualified dividend income (QDI).
Pursuant to Section 853 of the Internal Revenue Code, the Fund expects to designate amounts as foreign taxes paid for the fiscal year ended May 31, 2020. Additional details will be available in the semiannual report.
PROXY VOTING INFORMATION
A description of the policies and procedures used to determine how to vote proxies relating to portfolio securities is available, upon request, by calling 1-800-222-8222, visiting our website at wfam.com, or visiting the SEC website at sec.gov. Information regarding how the proxies related to portfolio securities were voted during the most recent 12-month period ended June 30 is available on the website at wfam.com or by visiting the SEC website at sec.gov.
QUARTERLY PORTFOLIO HOLDINGS INFORMATION
The Fund and Portfolio file their complete schedule of portfolio holdings with the SEC for the first and third quarters of each fiscal year as an exhibit to its reports on Form N-PORT. Shareholders may view the filed Form N-PORT by visiting the SEC website at sec.gov.
42 | Wells Fargo International Value Fund
Other information (unaudited)
BOARD OF TRUSTEES AND OFFICERS
Each of the Trustees and Officers1 listed in the table below acts in identical capacities for each fund in the Wells Fargo family of funds, which consists of 147 mutual funds comprising the Wells Fargo Funds Trust, Wells Fargo Variable Trust, Wells Fargo Master Trust and four closed-end funds (collectively the “Fund Complex”). This table should be read in conjunction with the Prospectus and the Statement of Additional Information2. The mailing address of each Trustee and Officer is 525 Market Street, 12th Floor, San Francisco, CA 94105. Each Trustee and Officer serves an indefinite term, however, each Trustee serves such term until reaching the mandatory retirement age established by the Trustees.
Independent Trustees
| | | | | | |
Name and year of birth | | Position held and
length of service* | | Principal occupations during past five years or longer | | Current other
public company or
investment
company
directorships |
| | | |
William R. Ebsworth (Born 1957) | | Trustee, since 2015 | | Retired. From 1984 to 2013, equities analyst, portfolio manager, research director and chief investment officer at Fidelity Management and Research Company in Boston, Tokyo, and Hong Kong, and retired in 2013 as Chief Investment Officer of Fidelity Strategic Advisers, Inc. where he led a team of investment professionals managing client assets. Prior thereto, Board member of Hong Kong Securities Clearing Co., Hong Kong Options Clearing Corp., the Thailand International Fund, Ltd., Fidelity Investments Life Insurance Company, and Empire Fidelity Investments Life Insurance Company. Audit Committee Chair and Investment Committee Chair of the Vincent Memorial Hospital Endowment (non-profit organization). Mr. Ebsworth is a CFA® charterholder. | | N/A |
| | | |
Jane A. Freeman (Born 1953) | | Trustee, since 2015; Chair Liaison, since 2018 | | Retired. From 2012 to 2014 and 1999 to 2008, Chief Financial Officer of Scientific Learning Corporation. From 2008 to 2012, Ms. Freeman provided consulting services related to strategic business projects. Prior to 1999, Portfolio Manager at Rockefeller & Co. and Scudder, Stevens & Clark. Board member of the Harding Loevner Funds from 1996 to 2014, serving as both Lead Independent Director and chair of the Audit Committee. Board member of the Russell Exchange Traded Funds Trust from 2011 to 2012 and the chair of the Audit Committee. Ms. Freeman is also an inactive Chartered Financial Analyst. | | N/A |
| | | |
Isaiah Harris, Jr. (Born 1952) | | Trustee, since 2009; Audit Committee Chairman, since 2019 | | Retired. Chairman of the Board of CIGNA Corporation since 2009, and Director since 2005. From 2003 to 2011, Director of Deluxe Corporation. Prior thereto, President and CEO of BellSouth Advertising and Publishing Corp. from 2005 to 2007, President and CEO of BellSouth Enterprises from 2004 to 2005 and President of BellSouth Consumer Services from 2000 to 2003. Emeritus member of the Iowa State University Foundation Board of Governors. Emeritus Member of the Advisory Board of Iowa State University School of Business. Advisory Board Member, Palm Harbor Academy (private school). Advisory Board Member, Child Evangelism Fellowship (non-profit). Mr. Harris is a certified public accountant (inactive status). | | CIGNA Corporation |
| | | |
Judith M. Johnson (Born 1949) | | Trustee, since 2008; Audit Committee Chairman, from 2009 to 2018 | | Retired. Prior thereto, Chief Executive Officer and Chief Investment Officer of Minneapolis Employees Retirement Fund from 1996 to 2008. Ms. Johnson is an attorney, certified public accountant and a certified managerial accountant. | | N/A |
Wells Fargo International Value Fund | 43
Other information (unaudited)
| | | | | | |
Name and year of birth | | Position held and
length of service* | | Principal occupations during past five years or longer | | Current other
public company or
investment
company
directorships |
| | | |
David F. Larcker (Born 1950) | | Trustee, since 2009 | | James Irvin Miller Professor of Accounting at the Graduate School of Business, Stanford University, Director of the Corporate Governance Research Initiative and Senior Faculty of The Rock Center for Corporate Governance since 2006. From 2005 to 2008, Professor of Accounting at the Graduate School of Business, Stanford University. Prior thereto, Ernst & Young Professor of Accounting at The Wharton School, University of Pennsylvania from 1985 to 2005. | | N/A |
| | | |
Olivia S. Mitchell (Born 1953) | | Trustee, since 2006; Nominating and Governance Committee Chair, since 2018 | | International Foundation of Employee Benefit Plans Professor, Wharton School of the University of Pennsylvania since 1993. Director of Wharton’s Pension Research Council and Boettner Center on Pensions & Retirement Research, and Research Associate at the National Bureau of Economic Research. Previously, Cornell University Professor from 1978 to 1993. | | N/A |
| | | |
Timothy J. Penny (Born 1951) | | Trustee, since 1996; Chairman, since 2018 | | President and Chief Executive Officer of Southern Minnesota Initiative Foundation, a non-profit organization, since 2007. Member of the Board of Trustees of NorthStar Education Finance, Inc., a non-profit organization, since 2007. | | N/A |
| | | |
James G. Polisson (Born 1959) | | Trustee, since 2018 | | Retired. Chief Marketing Officer, Source (ETF) UK Services, Ltd, from 2015 to 2017. From 2012 to 2015, Principal of The Polisson Group, LLC, a management consulting, corporate advisory and principal investing company. Chief Executive Officer and Managing Director at Russell Investments, Global Exchange Traded Funds from 2010 to 2012. Managing Director of Barclays Global Investors from 1998 to 2010 and Global Chief Marketing Officer for iShares and Barclays Global Investors from 2000 to 2010. Trustee of the San Francisco Mechanics’ Institute, a non-profit organization, from 2013 to 2015. Board member of the Russell Exchange Traded Fund Trust from 2011 to 2012. Director of Barclays Global Investors Holdings Deutschland GmbH from 2006 to 2009. Mr. Polisson is an attorney and has a retired status with the Massachusetts and District of Columbia Bar Associations. | | N/A |
| | | |
Pamela Wheelock (Born 1959) | | Trustee, since January 2020; previously Trustee from January 2018 to July 2019 | | Board member of the Destination Medical Center Economic Development Agency, Rochester, Minnesota since 2019 and Interim President of the McKnight Foundation since 2020. Acting Commissioner, Minnesota Department of Human Services, July 2019 through September 2019. Human Services Manager (part-time), Minnesota Department of Human Services, October 2019 through December 2019. Chief Operating Officer, Twin Cities Habitat for Humanity from 2017 to 2019. Vice President of University Services, University of Minnesota from 2012 to 2016. Prior thereto, on the Board of Directors, Governance Committee and Finance Committee for the Minnesota Philanthropy Partners (Saint Paul Foundation) from 2012 to 2018, Interim Chief Executive Officer of Blue Cross Blue Shield of Minnesota from 2011 to 2012, Chairman of the Board from 2009 to 2012 and Board Director from 2003 to 2015. Vice President, Leadership and Community Engagement, Bush Foundation, Saint Paul, Minnesota (a private foundation) from 2009 to 2011. Executive Vice President and Chief Financial Officer, Minnesota Sports and Entertainment from 2004 to 2009 and Senior Vice President from 2002 to 2004. Executive Vice President of the Minnesota Wild Foundation from 2004 to 2008. Commissioner of Finance, State of Minnesota, from 1999 to 2002. Currently Board Chair of the Minnesota Wild Foundation since 2010. | | N/A |
| * | Length of service dates reflect the Trustee’s commencement of service with the Trust’s predecessor entities, where applicable. |
44 | Wells Fargo International Value Fund
Other information (unaudited)
Officers
| | | | |
Name and year of birth | | Position held and
length of service | | Principal occupations during past five years or longer |
| | |
| Andrew Owen (Born 1960) | | President, since 2017 | | Executive Vice President of Wells Fargo & Company and Head of Affiliated Managers, Wells Fargo Asset Management, since 2014. In addition, Mr. Owen is currently President, Chief Executive Officer and Director of Wells Fargo Funds Management, LLC since 2017. Prior thereto, Executive Vice President responsible for marketing, investments and product development for Wells Fargo Funds Management, LLC, from 2009 to 2014. |
| | |
| Jeremy DePalma1 (Born 1974) | | Treasurer, since 2012 | | Senior Vice President of Wells Fargo Funds Management, LLC since 2009. Senior Vice President of Evergreen Investment Management Company, LLC from 2008 to 2010 and head of the Fund Reporting and Control Team within Fund Administration from 2005 to 2010. |
| | |
| Michelle Rhee (Born 1966) | | Chief Legal Officer, since 2019 | | Secretary of Wells Fargo Funds Management, LLC, Chief Legal Counsel of Wells Fargo Asset Management and Assistant General Counsel of Wells Fargo Bank, N.A. since 2018. Associate General Counsel and Managing Director of Bank of America Corporation from 2004 to 2018. |
| | |
| Catherine Kennedy (Born 1969) | | Secretary, since 2019 | | Vice President of Wells Fargo Funds Management, LLC and Senior Counsel of the Wells Fargo Legal Department since 2010. Vice President and Senior Counsel of Evergreen Investment Management Company, LLC from 1998 to 2010. |
| | |
| Michael H. Whitaker (Born 1967) | | Chief Compliance Officer, since 2016 | | Chief Compliance Officer of Wells Fargo Asset Management since 2016. Senior Vice President and Chief Compliance Officer for Fidelity Investments from 2007 to 2016. |
| | |
| David Berardi (Born 1975) | | Assistant Treasurer, since 2009 | | Vice President of Wells Fargo Funds Management, LLC since 2009. Vice President of Evergreen Investment Management Company, LLC from 2008 to 2010. Manager of Fund Reporting and Control for Evergreen Investment Management Company, LLC from 2004 to 2010. |
| 1 | Jeremy DePalma acts as Treasurer of 82 funds and Assistant Treasurer of 65 funds in the Fund Complex. |
| 2 | The Statement of Additional Information includes additional information about the Trustees and is available, without charge, upon request, by calling 1-800-222-8222 or by visiting the website at wfam.com |
Wells Fargo International Value Fund | 45
Other information (unaudited)
BOARD CONSIDERATION OF INVESTMENT MANAGEMENT, ADVISORY AND SUB-ADVISORY AGREEMENTS:
Wells Fargo International Value Fund and Wells Fargo International Value Portfolio
Under the Investment Company Act of 1940 (the “1940 Act”), the Board of Trustees (each, a “Board” and collectively, the “Boards”) of each of Wells Fargo Funds Trust (“Funds Trust”) and Wells Fargo Master Trust (“Master Trust”, and collectively, the “Trusts”) must determine annually whether to approve the continuation of the Trusts’ investment management, advisory and sub-advisory agreements, as applicable. In this regard, at a Board meeting held on May 26, 2020 and May 28, 2020 (together, the “Meeting”), the Funds Trust Board, all the members of which have no direct or indirect interest in the investment management agreement and are not “interested persons” of the Trusts, as defined in the 1940 Act (the “Independent Trustees”), reviewed and approved for Wells Fargo International Value Fund (the “Gateway Fund”) an investment management agreement (the “Gateway Fund Management Agreement”) with Wells Fargo Funds Management, LLC (“Funds Management”).
At the Meeting, the Master Trust Board, all the members of which have no direct or indirect interest in the investment advisory and sub-advisory agreements and are Independent Trustees, reviewed and approved: (i) an investment advisory agreement (the “Master Portfolio Advisory Agreement”) with Funds Management for Wells Fargo International Value Portfolio, a portfolio of Master Trust (the “Master Portfolio”); and (ii) an investment sub-advisory agreement (the “Sub-Advisory Agreement”) with LSV Asset Management (the “Sub-Adviser”) for the Master Portfolio.
The Gateway Fund and the Master Portfolio are collectively referred to as the “Funds.” The Gateway Fund Management Agreement, the Master Portfolio Advisory Agreement and the Sub-Advisory Agreement are collectively referred to as the “Advisory Agreements.”
The Gateway Fund is a gateway feeder fund that invest substantially all of its assets in the Master Portfolio. The Master Portfolio has a substantially similar investment objective and substantially similar investment strategies to the Gateway Fund. Information provided to the Boards regarding the Gateway Fund is also applicable to the Master Portfolio, as relevant.
At the Meeting, the Boards considered the factors and reached the conclusions described below relating to the selection of Funds Management and the Sub-Adviser and the approval of the Advisory Agreements. Prior to the Meeting, including at a Board meeting held in April 2020, the Trustees conferred extensively among themselves and with representatives of Funds Management about these matters. Also, the Boards have adopted a team-based approach, with each team consisting of a sub-set of Trustees, to assist the full Boards in the discharge of their duties in reviewing investment performance and other matters throughout the year. The Independent Trustees were assisted in their evaluation of the Advisory Agreements by independent legal counsel, from whom they received separate legal advice and with whom they met separately.
In providing information to the Boards, Funds Management and the Sub-Adviser were guided by a detailed set of requests for information submitted to them by independent legal counsel on behalf of the Independent Trustees at the start of the Boards’ annual contract renewal process earlier in 2020. In considering and approving the Advisory Agreements, the Trustees considered the information they believed relevant, including but not limited to the information discussed below. The Boards considered not only the specific information presented in connection with the Meeting, but also the knowledge gained over time through interaction with Funds Management and the Sub-Adviser about various topics. In this regard, the Boards reviewed reports of Funds Management at each of their quarterly meetings, which included, among other things, portfolio reviews and investment performance reports. In addition, the Boards and the teams mentioned above confer with portfolio managers at various times throughout the year. The Boards did not identify any particular information or consideration that was all-important or controlling, and each individual Trustee may have attributed different weights to various factors.
After its deliberations, the Funds Trust Board unanimously approved the continuation of the Gateway Fund Management Agreement for a one-year period. Additionally, after its deliberations, the Master Trust Board unanimously approved the continuation of the Master Portfolio Advisory Agreement and the Sub-Advisory Agreement, each for a one-year term. The Boards also determined that the compensation payable to Funds Management and the Sub-Adviser was reasonable. The Boards considered the approval of the Advisory Agreements for the Funds as part of their consideration of agreements for funds across the complex, but their approvals were made on a fund-by-fund basis. The following summarizes a number of important, but not necessarily all, factors considered by the Boards in support of their approvals.
Nature, extent and quality of services
The Boards received and considered various information regarding the nature, extent and quality of services provided to the Funds by Funds Management and the Sub-Adviser under the Advisory Agreements. This information included a description of the investment advisory services and Fund-level administrative services, as well as, among other things, a summary of the background and experience of senior management of Wells Fargo Asset Management (“WFAM”), of which Funds Management
46 | Wells Fargo International Value Fund
Other information (unaudited)
is a part, and a summary of investments made in the business of WFAM. The Boards also received a description of Funds Management’s and the Sub-Adviser’s business continuity plans and of their approaches to data privacy and cybersecurity, and related testing. The Boards also received and reviewed information about Funds Management’s role as administrator of the Funds’ liquidity risk management program, Funds Management’s approach to risk management, and Funds Management’s intermediary and vendor oversight program. The Boards also considered the qualifications, background, tenure and responsibilities of each of the portfolio managers primarily responsible for the day-to-day portfolio management of the Funds.
The Boards evaluated the ability of Funds Management and the Sub-Adviser to attract and retain qualified investment professionals, including research, advisory and supervisory personnel. The Boards further considered the compliance programs and compliance records of Funds Management and the Sub-Adviser. In addition, the Boards took into account the full range of services provided to the Funds by Funds Management and its affiliates.
Fund investment performance and expenses
The Boards considered the investment performance results for each of the Funds over various time periods ended December 31, 2019. The Board also considered more current results for various time periods ended March 31, 2020. The Boards considered these results in comparison to the investment performance of funds in a universe that was determined by Broadridge Inc. (“Broadridge”) to be similar to the Gateway Fund (the “Universe”), and in comparison to the Gateway Fund’s benchmark index and to other comparative data. Broadridge is an independent provider of investment company data. The Boards received a description of the methodology used by Broadridge to select the mutual funds in the performance Universe. The Funds Trust Board noted that the investment performance of the Gateway Fund (Administrator Class) was higher than or in range of the average investment performance of its Universe for the one-, three-, five- and ten-year periods ended December 31, 2019. The Funds Trust Board also noted that the investment performance of the Gateway Fund (Administrator Class) was higher than the average investment performance of its Universe for all periods ended March 31, 2020. The Funds Trust Board also noted that the investment performance of the Gateway Fund was higher than its benchmark, the MSCI EAFE Value Index (Net), for all periods ended December 31, 2019. The Funds Trust Board also noted that the investment performance of the Gateway Fund was higher than its benchmark, the MSCI EAFE Value Index (Net), for all periods ended March 31, 2020.
The Master Trust Board took note of the investment performance of the Master Portfolio in the context of reviewing the investment performance of the Gateway Fund.
The Funds Trust Board also received and considered information regarding the Gateway Fund’s net operating expense ratios, which include fees and expenses of the Master Portfolio, and their various components, including actual management fees assessed at the Gateway Fund and Master Portfolio levels, custodian and other non-management fees, and Rule 12b-1 and non-Rule 12b-1 shareholder service fees. The Funds Trust Board considered these ratios in comparison to the median ratios of funds in class-specific expense groups that were determined by Broadridge to be similar to the Gateway Fund (the “Groups”). The Funds Trust Board received a description of the methodology used by Broadridge to select the mutual funds in the expense Groups and an explanation of how funds comprising expense groups and their expense ratios may vary from year-to-year. Based on the Broadridge reports, the Funds Trust Board noted that the net operating expense ratios of the Gateway Fund were lower than or in range of the median net operating expense ratios of its expense Groups for all share classes.
With respect to the Master Portfolio, the Master Trust Board reviewed the fee rates that are payable to Funds Management for investment advisory services (as discussed below), which are the only fees charged at the Master Portfolio level, relative to a corresponding expense Group.
The Boards took into account the Funds’ investment performance and expense information provided to them among the factors considered in deciding to re-approve the Advisory Agreements.
Investment management, advisory and sub-advisory fee rates
The Funds Trust Board noted that Funds Management receives no advisory fees from the Gateway Fund as long as the Gateway Fund continues to invest all (or substantially all) of its assets in a single master portfolio. If the Gateway Fund were to change its investment structure so that it began investing in two or more master portfolios (a fund-of-funds), Funds Management would be entitled to receive an annual fee of 0.25% of the Gateway Fund’s average daily net assets for providing investment advisory services to the Gateway Fund, including allocating the Gateway Fund’s assets to the Master Portfolio.
The Funds Trust Board reviewed and considered the contractual fee rates that are payable by the Gateway Fund to Funds Management under the Gateway Fund Management Agreement for management services (other than investment advisory services), as well as the contractual fee rates payable by the Gateway Fund to Funds Management for class-level administrative services under a Class-Level Administration Agreement, which include, among other things, class-level transfer agency and sub-transfer agency costs (collectively, the “Management Rates”).
Wells Fargo International Value Fund | 47
Other information (unaudited)
The Master Trust Board reviewed and considered the contractual investment advisory fee rate that is payable by the Master Portfolio to Funds Management for investment advisory services under the Master Portfolio Advisory Agreement (the “Advisory Agreement Rate”). The Master Trust Board also reviewed and considered the contractual investment sub-advisory fee rate that is payable by Funds Management to the Sub-Adviser for investment sub-advisory services (the “Sub-Advisory Agreement Rate”).
Among other information reviewed by the Funds Trust Board was a comparison of the Gateway Fund’s Management Rate, which, for this purpose, includes the advisory fees paid at the Master Portfolio level, with the average contractual investment management fee rates of funds in the expense Groups at a common asset level as well as transfer agency costs of the funds in the expense Groups. The Funds Trust Board noted that the Management Rates of the Gateway Fund were lower than, equal to or in range of the sum of these average rates for the Gateway Fund’s expense Groups for all share classes, except for Class A. The Funds Trust Board also noted that the net operating expense ratio caps for all classes of the Gateway Fund were reduced in 2019, and that they would be maintained.
The Master Trust Board reviewed a comparison of the Advisory Agreement Rate of the Master Portfolio with those of other funds in the Master Portfolio’s expense Group at a common asset level. The Master Trust Board noted that the Advisory Agreement Rate of the Master Portfolio was in range of the median rate for the Master Portfolio’s expense Group.
The Master Trust Board also received and considered information about the portions of the total management fees that were retained by Funds Management after payment of the fees to the Sub-Adviser for sub-advisory services. The Master Trust Board considered these amounts in comparison to the median amount retained by advisers to funds in a sub-advised expense universe that was determined by Broadridge to be similar to the Master Portfolio. The Board noted the small size of the sub-advised expense universe. In assessing the reasonableness of these amounts, the Master Trust Board received and evaluated information about the nature and extent of responsibilities retained and risks assumed by Funds Management and not delegated to or assumed by the Sub-Adviser, and about Funds Management’s on-going oversight services. The Master Trust Board also considered that the sub-advisory fees paid to the Sub-Adviser had been negotiated by Funds Management on an arm’s length basis.
The Boards also received and considered information about the nature and extent of services offered and fee rates charged by Funds Management and the Sub-Adviser to other types of clients with investment strategies similar to those of the Funds. In this regard, the Boards received information about the significantly greater scope of services, and compliance, reporting and other legal burdens and risks of managing proprietary mutual funds compared with those associated with managing assets of other types of clients, including third-party sub-advised fund clients and non-mutual fund clients such as institutional separate accounts.
Based on its consideration of the factors and information it deemed relevant, including those described here, the Funds Trust Board determined that the compensation payable to Funds Management under the Gateway Fund Management Agreement was reasonable, and the Master Trust Board determined that the compensation payable to Funds Management under the Master Portfolio Advisory Agreement and to the Sub-Adviser under the Sub-Advisory Agreement was reasonable.
Profitability
The Boards received and considered information concerning the profitability of Funds Management, as well as the profitability of both WFAM and Wells Fargo & Co. (“Wells Fargo”) from providing services to the fund family as a whole.
Funds Management reported on the methodologies and estimates used in calculating profitability, including a description of the methodology used to allocate certain expenses. Among other things, the Boards noted that the levels of profitability reported on a fund-by-fund basis varied widely, depending on factors such as the size, type and age of fund. The Boards did not consider profitability with respect to the Sub-Adviser, as the sub-advisory fees paid to the Sub-Adviser had been negotiated by Funds Management on an arm’s-length basis.
Based on its review, the Boards did not deem the profits reported by Funds Management, WFAM or Wells Fargo from services provided to the Funds to be at a level that would prevent the Boards from approving the continuation of the Advisory Agreements.
Economies of scale
The Boards received and considered information about the potential for Funds Management to experience economies of scale in the provision of management services to the Funds, the difficulties of calculating economies of scale at an individual fund level, and the extent to which potential scale benefits are shared with shareholders. The Boards noted the existence of breakpoints in the Master Portfolio’s advisory fee structure and the Gateway Fund’s management fee structure, which operate generally to reduce the Funds’ expense ratios as the Funds grow in size, and the size of the Master Portfolio and the Gateway
48 | Wells Fargo International Value Fund
Other information (unaudited)
Fund, respectively, in relation to such breakpoints. The Boards considered that, in addition to advisory fee and management fee breakpoints, Funds Management shares potential economies of scale from its management business in a variety of ways, including through fee waiver and expense reimbursement arrangements, services that benefit shareholders, competitive management fee rates set at the outset without regard to breakpoints, and investments in the business intended to enhance services available to shareholders.
The Boards concluded that Funds Management’s arrangements with respect to each Fund, including contractual breakpoints, constituted a reasonable approach to sharing potential economies of scale with the Funds and their shareholders.
Other benefits to Funds Management and the Sub-Adviser
The Boards received and considered information regarding potential “fall-out” or ancillary benefits received by Funds Management, the Sub-Adviser, and their affiliates as a result of their relationships with the Funds. Ancillary benefits could include, among others, benefits directly attributable to other relationships with the Funds and benefits potentially derived from an increase in Funds Management’s and the Sub-Adviser’s business as a result of their relationships with the Funds. The Boards noted that various affiliates of Funds Management may receive distribution-related fees, shareholder servicing payments and sub-transfer agency fees in respect of shares sold or held through them and services provided.
The Boards also reviewed information about soft dollar credits earned and utilized by the Sub-Adviser, fees earned by Funds Management and its affiliate from managing a private investment vehicle for the fund family’s securities lending collateral, and commissions earned by an affiliated broker from portfolio transactions.
Based on their consideration of the factors and information they deemed relevant, including those described here, the Boards did not find that any ancillary benefits received by Funds Management, the Sub-Adviser, and their affiliates were unreasonable.
Conclusion
At the Meeting, after considering the above-described factors and based on its deliberations and its evaluation of the information described above, the Funds Trust Board unanimously approved the continuation of the Gateway Fund Management Agreement for a one-year period. Additionally, after considering the above-described factors and based on its deliberations and its evaluation of the information described above, the Master Trust Board unanimously approved the continuation of the Master Portfolio Advisory Agreement and the Sub-Advisory Agreement, each for a one-year term. The Boards also determined that the compensation payable to Funds Management and the Sub-Adviser was reasonable.
Wells Fargo International Value Fund | 49
Other information (unaudited)
LIQUIDITY RISK MANAGEMENT PROGRAM
In accordance with Rule 22e-4 under the Investment Company Act of 1940, as amended (the “Liquidity Rule”), each of Wells Fargo Funds Trust and Wells Fargo Master Trust (each a “Trust”) has adopted and implemented a liquidity risk management program (the “Program”) on behalf of each of its non-money market series, including the Fund and the Portfolio, respectively, which is reasonably designed to assess and manage the Fund’s or the Portfolio’s liquidity risk. “Liquidity risk” is defined as the risk that the Fund or Portfolio is unable to meet redemption requests without significantly diluting remaining investors’ interests. Each Trust’s Board of Trustees (each a “Board”) previously approved the designation of Wells Fargo Funds Management, LLC (“Funds Management”), the Fund’s investment manager and the Portfolio’s investment adviser, as the administrator of the Program, and Funds Management has established a Liquidity Risk Management Council composed of personnel from multiple departments within Funds Management and its affiliates to assist Funds Management in the implementation and on-going administration of the Program.
The Program is comprised of various components designed to support the assessment and/or management of liquidity risk, including: (1) the periodic assessment (no less frequently than annually) of certain factors that influence the Fund’s and the Portfolio’s liquidity risk; (2) the periodic classification (no less frequently than monthly) of the Fund’s and the Portfolio’s investments into one of four liquidity categories that reflect an estimate of their liquidity under current market conditions; (3) a 15% limit on the acquisition of “illiquid investments” (as defined under the Liquidity Rule); (4) to the extent the Fund or the Portfolio does not invest primarily in “highly liquid investments” (as defined under the Liquidity Rule), the determination of a minimum percentage of the Fund’s or the Portfolio’s assets that generally will be invested in highly liquid investments (an “HLIM”); (5) if the Fund or the Portfolio has established an HLIM, the periodic review (no less frequently than annually) of the HLIM and the adoption of policies and procedures for responding to a shortfall of the Fund’s or the Portfolio’s “highly liquid investments” below its HLIM; and (6) periodic reporting to the respective Board.
At a meeting of each Board held on May 26 and 28, 2020, the Board received a written report (the “Report”) from Funds Management that addressed the operation of the Program and assessed its adequacy and effectiveness of implementation. The Report covered the initial period from December 1, 2018 through December 31, 2019 (the “Reporting Period”). No significant liquidity events impacting the Fund or the Portfolio were noted in the Report, except that certain securities held by the Portfolio were subject to extended foreign market holiday closures, which caused the Portfolio to reclassify such securities as illiquid temporarily and resulted in the Portfolio temporarily breaching its 15% limit on illiquid investments. This breach was anticipated in advance and communicated to the Board prior to the closure. There were no material changes to the Program during the Reporting Period. The Report concluded that the Program is operating effectively to assess and manage the Fund’s and the Portfolio’s liquidity risk, and that the Program has been and continues to be adequately and effectively implemented to monitor and, as applicable, respond to the Fund’s and the Portfolio’s liquidity developments.
There can be no assurance that the Program will achieve its objectives under all circumstances in the future. Please refer to the Fund’s prospectus for more information regarding the Fund’s exposure to liquidity risk and other risks to which an investment in the Fund may be subject.
50 | Wells Fargo International Value Fund
Appendix I (unaudited)
Effective on or about May 1, 2020, if you purchase Fund shares through a Janney Montgomery Scott LLC (“Janney”) brokerage account, you will be eligible for the following load waivers (front-end sales charge waivers and contingent deferred sales charge (“CDSC”), or back-end sales charge, waivers) and discounts, which may differ from those disclosed elsewhere in the Fund’s Prospectus or SAI.
|
| Front-end sales charge* waivers on Class A shares available at Janney |
|
| Shares purchased through reinvestment of capital gains distributions and dividend reinvestment when purchasing shares of the same fund (but not any other fund within the fund family). |
|
| Shares purchased by employees and registered representatives of Janney or its affiliates and their family members as designated by Janney. |
|
| Shares purchased from the proceeds of redemptions within the same fund family, provided (1) the repurchase occurs within ninety (90) days following the redemption, (2) the redemption and purchase occur in the same account, and (3) redeemed shares were subject to a front-end or deferred sales load (i.e., right of reinstatement). |
|
| Employer-sponsored retirement plans (e.g., 401(k) plans, 457 plans, employer-sponsored 403(b) plans, profit sharing and money purchase pension plans and defined benefit plans). For purposes of this provision, employer-sponsored retirement plans do not include SEP IRAs, Simple IRAs, SAR-SEPs or Keogh plans. |
|
| Shares acquired through a right of reinstatement. |
|
| Class C shares that are no longer subject to a contingent deferred sales charge and are converted to Class A shares of the same fund pursuant to Janney’s policies and procedures. |
| CDSC waivers on Class A and Class C shares available at Janney |
|
| Shares sold upon the death or disability of the shareholder. |
|
| Shares sold as part of a systematic withdrawal plan as described in the Fund’s Prospectus. |
|
| Shares purchased in connection with a return of excess contributions from an IRA account. |
|
| Shares sold as part of a required minimum distribution for IRA and retirement accounts if the redemption is taken in or after the year the shareholder reaches qualified age based on applicable IRS regulations. |
|
| Shares sold to pay Janney fees but only if the transaction is initiated by Janney. |
|
| Shares acquired through a right of reinstatement. |
|
| Shares exchanged into the same share class of a different fund. |
| Front-end sales charge* discounts available at Janney; breakpoints, rights of accumulation and/or letters of intent |
|
| Breakpoints as described in the Fund’s Prospectus. |
|
| Rights of accumulation (“ROA”), which entitle shareholders to breakpoint discounts, will be automatically calculated based on the aggregated holding of fund family assets held by accounts within the purchaser’s household at Janney. Eligible fund family assets not held at Janney may be included in the ROA calculation only if the shareholder notifies his or her financial advisor about such assets. |
|
| Letters of intent which allow for breakpoint discounts based on anticipated purchases within a fund family, over a 13-month time period. Eligible fund family assets not held at Janney Montgomery Scott may be included in the calculation of letters of intent only if the shareholder notifies his or her financial advisor about such assets. |
| * | Also referred to as an “initial sales charge.” |
Wells Fargo International Value Fund | 51
Appendix II (unaudited)
Effective on or after May 1, 2020, clients of Edward Jones (also referred to as “shareholders”) purchasing Fund shares on the Edward Jones commission and fee-based platforms are eligible only for the following sales charge discounts (also referred to as “breakpoints”) and waivers, which can differ from breakpoints and waivers described elsewhere in the Fund’s Prospectus or SAI or through another broker-dealer. In all instances, it is the shareholder’s responsibility to inform Edward Jones at the time of purchase of any relationship, holdings of Wells Fargo Funds or other facts qualifying the purchaser for breakpoints or waivers. Edward Jones can ask for documentation of such circumstance.
|
| Breakpoints available at Edward Jones |
|
| Rights of Accumulation (ROA) |
|
The applicable sales charge on a purchase of Class A shares is determined by taking into account all share classes (except any money market funds and retirement plan share classes) of Wells Fargo Funds held by the shareholder or in an account grouped by Edward Jones with other accounts for the purpose of providing certain pricing considerations (“pricing groups”). This includes all share classes held on the Edward Jones platform and/or held on another platform. The inclusion of eligible fund family assets in the rights of accumulation calculation is dependent on the shareholder notifying his or her financial advisor of such assets at the time of calculation. |
|
ROA is determined by calculating the higher of cost or market value (current shares x NAV). |
|
| Letter of Intent (LOI) |
|
Through a LOI, shareholders can receive the sales charge and breakpoint discounts for purchases shareholders intend to makeover a 13-month period from the date Edward Jones receives the LOI. The LOI is determined by calculating the higher of cost or market value of qualifying holdings at LOI initiation in combination with the value that the shareholder intends to buy over a 13-month period to calculate the front-end sales charge and any breakpoint discounts. Each purchase the shareholder makes during that 13-month period will receive the sales charge and breakpoint discount that applies to the total amount. The inclusion of eligible fund family assets in the LOI calculation is dependent on the shareholder notifying his or her financial advisor of such assets at the time of calculation. Purchases made before the LOI is received by Edward Jones are not covered under the LOI and will not reduce the sales charge previously paid. Sales charges will be adjusted if LOI is not met. |
| Sales charges are waived for the following shareholders and in the following situations at Edward Jones: |
● Associates of Edward Jones and its affiliates and their family members who are in the same pricing group (as determined by Edward Jones under its policies and procedures) as the associate. This waiver will continue for the remainder of the associate’s life if the associate retires from Edward Jones in good-standing. |
● Shares purchased in an Edward Jones fee-based program. |
● Shares purchased through reinvestment of capital gains distributions and dividend reinvestment. |
● Shares purchased from the proceeds of redeemed shares of the same fund family so long as the following conditions are met: 1) the proceeds are from the sale of shares within 60 days of the purchase, and 2) the sale and purchase are made in the same share class and the same account or the purchase is made in an individual retirement account with proceeds from liquidations in a non-retirement account. |
● Shares exchanged into Class A shares from another share class so long as the exchange is into the same fund and was initiated at the discretion of Edward Jones. Edward Jones is responsible for any remaining CDSC due to the fund company, if applicable. Any future purchases are subject to the applicable sales charge as disclosed in the prospectus. |
● Exchanges from Class C shares to Class A shares of the same fund, generally, in the 84th month following the anniversary of the purchase date or earlier at the discretion of Edward Jones. |
If the shareholder purchases shares that are subject to a CDSC and those shares are redeemed before the CDSC is expired, the shareholder
is responsible to pay the CDSC except in the following conditions available at Edward Jones: |
● The death or disability of the shareholder. |
● Systematic withdrawals with up to 10% per year of the account value. |
● Return of excess contributions from an Individual Retirement Account (IRA). |
● Shares sold as part of a required minimum distribution for IRA and retirement accounts if the redemption is taken in or after the year the shareholder reaches qualified age based on applicable IRS regulation. |
● Shares sold to pay Edward Jones fees or costs in such cases where the transaction is initiated by Edward Jones. |
● Shares exchanged in an Edward Jones fee-based program. |
● Shares acquired through NAV reinstatement. |
52 | Wells Fargo International Value Fund
Appendix II (unaudited)
|
| Other Important Information for accounts at Edward Jones: |
| Minimum Purchase Amounts |
● $250 initial purchase minimum |
● $50 subsequent purchase minimum |
|
| Minimum Balances |
| Edward Jones has the right to redeem at its discretion fund holdings with a balance of $250 or less. The following are examples of accounts that are not included in this policy: |
● A fee-based account held on an Edward Jones platform |
● A 529 account held on an Edward Jones platform |
● An account with an active systematic investment plan or letter of intent (LOI) |
|
| Changing Share Classes |
| At any time it deems necessary, Edward Jones has the authority to exchange at NAV a shareholder’s holdings in a fund to Class A shares. |
Wells Fargo International Value Fund | 53
Appendix III (unaudited)
Effective June 1, 2020, shareholders purchasing Fund shares through an Oppenheimer & Co. Inc. (“Oppenheimer”) platform or account are eligible only for the following load waivers (front-end sales charge waivers and contingent deferred or back-end, sales charge waivers) and discounts, which may differ from those disclosed in the Fund’s Prospectus or SAI.
|
| Front-end Sales Load Waivers on Class A Shares available at Oppenheimer |
|
| Employer-sponsored retirement, deferred compensation and employee benefit plans (including health savings accounts) and trusts used to fund those plans, provided that the shares are not held in a commission-based brokerage account and shares are held for the benefit of the plan. |
|
| Shares purchased by or through a 529 Plan. |
|
| Shares purchased through an Oppenheimer affiliated investment advisory program. |
|
| Shares purchased through reinvestment of capital gains distributions and dividend reinvestment when purchasing shares of the same fund (but not any other fund within the fund family). |
|
| Shares purchased from the proceeds of redemptions within the same fund family, provided (1) the repurchase occurs within 90 days following the redemption, (2) the redemption and purchase occur in the same account, and (3) redeemed shares were subject to a front-end or deferred sales load (known as Rights of Restatement). |
|
| A shareholder in the Fund’s Class C shares will have their shares exchanged at net asset value to Class A shares (or the appropriate share class) of the Fund if the shares are no longer subject to a CDSC and the exchange is in line with the policies and procedures of Oppenheimer. |
|
| Employees and registered representatives of Oppenheimer or its affiliates and their family members. |
|
| Directors or Trustees of the Fund, and employees of the Fund’s investment adviser or any of its affiliates, as described in the Prospectus. |
| CDSC Waivers on A and C Shares available at Oppenheimer |
|
| Death or disability of the shareholder. |
|
| Shares sold as part of a systematic withdrawal plan as described in the Prospectus. |
|
| Return of excess contributions from an IRA Account. |
|
| Shares sold as part of a required minimum distribution for IRA and retirement accounts due to the shareholder reaching the qualified age based on applicable IRS regulations as described in the Prospectus. |
|
| Shares sold to pay Oppenheimer fees but only if the transaction is initiated by Oppenheimer. |
|
| Shares acquired through a right of reinstatement. |
| Front-end load Discounts Available at Oppenheimer: Breakpoints, Rights of Accumulation & Letters of Intent |
|
| Breakpoints as described in the Prospectus. |
|
| Rights of Accumulation (ROA), which entitle shareholders to breakpoint discounts, will be automatically calculated based on the aggregated holding of fund family assets held by accounts within the purchaser’s household at Oppenheimer. Eligible fund family assets not held at Oppenheimer may be included in the ROA calculation only if the shareholder notifies his or her financial advisor about such assets. |
54 | Wells Fargo International Value Fund
Appendix IV (unaudited)
Effective June 15, 2020, shareholders purchasing fund shares through a Robert W. Baird & Co. (“Baird”) platform or account will only be eligible for the following sales charge waivers (front-end sales charge waivers and CDSC waivers) and discounts, which may differ from those disclosed elsewhere in the Fund’s Prospectus or the SAI.
|
| Front-end Sales Load Waivers on Class A Shares available at Baird |
|
| Shares purchased through reinvestment of capital gains distributions and dividend reinvestment when purchasing share of the same fund. |
|
| Share purchase by employees and registers representatives of Baird or its affiliate and their family members as designated by Baird. |
|
| Shares purchase from the proceeds of redemptions within the same fund family, provided (1) the repurchase occurs within 90 days following the redemption, (2) the redemption and purchase occur in the same accounts, and (3) redeemed shares were subject to a front-end or deferred sales charge (known as rights of reinstatement). |
|
| A shareholder in the Funds Investor C Shares will have their share exchanged at net asset value to Investor A shares of the fund if the shares are no longer subject to CDSC and the exchange is in line with the policies and procedures of Baird. |
|
| Employer-sponsored retirement plans or charitable accounts in a transactional brokerage account at Baird, including 401(k)plans, 457 plans, employer-sponsored 403(b) plans, profit sharing and money purchase pension plans and defined benefit plans. For purposes of this provision, employer-sponsored retirement plans do not include SEP IRAs, Simple IRAs or SAR-SEPs. |
| CDSC Waivers on A and C Shares available at Baird |
|
| Shares sold due to death or disability of the shareholder. |
|
| Shares sold as part of a systematic withdrawal plan as described in the Fund’s Prospectus. |
|
| Shares bought due to returns of excess contributions from an IRA Account. |
|
| Shares sold as part of a required minimum distribution for IRA and retirement accounts due to the shareholder reaching age 72 as described in the Fund’s Prospectus. |
|
| Shares sold to pay Baird fees but only if the transaction is initiated by Baird. |
|
| Shares acquired through a right of reinstatement. |
| Front-end load Discounts Available at Baird: Breakpoint and/or Rights of Accumulation |
|
| Breakpoints as described in the Prospectus. |
|
| Rights of accumulations which entitles shareholders to breakpoint discounts will be automatically calculated based on the aggregated holding of fund family assets held by accounts within the purchaser’s household at Baird. Eligible fund family assets not held at Baird may be included in the rights of accumulations calculation only if the shareholder notifies his or her financial advisor about such assets. |
|
| Letters of Intent (LOI) allow for breakpoint discounts based on anticipated purchases within a fund family through Baird, over a 13-month period of time. |
Wells Fargo International Value Fund | 55
This page is intentionally left blank.

For more information
More information about Wells Fargo Funds is available free upon request. To obtain literature, please write, visit the Fund’s website, or call:
Wells Fargo Funds
P.O. Box 219967
Kansas City, MO 64121-9967
Website: wfam.com
Individual investors: 1-800-222-8222
Retail investment professionals: 1-888-877-9275
Institutional investment professionals: 1-866-765-0778

This report and the financial statements contained herein are submitted for the general information of the shareholders of the Fund. If this report is used for promotional purposes, distribution of the report must be accompanied or preceded by a current prospectus. Before investing, please consider the investment objectives, risks, charges, and expenses of the investment. For a current prospectus and, if available, a summary prospectus, containing this information, call 1-800-222-8222 or visit the Fund’s website at wfam.com. Read the prospectus carefully before you invest or send money.
Wells Fargo Asset Management (WFAM) is the trade name for certain investment advisory/management firms owned by Wells Fargo & Company. These firms include but are not limited to Wells Capital Management Incorporated and Wells Fargo Funds Management, LLC. Certain products managed by WFAM entities are distributed by Wells Fargo Funds Distributor, LLC (a broker-dealer and Member FINRA).
This material is for general informational and educational purposes only and is NOT intended to provide investment advice or a recommendation of any kind—including a recommendation for any specific investment, strategy, or plan.
INVESTMENT PRODUCTS: NOT FDIC INSURED ◾ NO BANK GUARANTEE ◾ MAY LOSE VALUE
© 2020 Wells Fargo & Company. All rights reserved.
PAR-0620-00319 07-20
A284/AR284 05-20
Annual Report
May 31, 2020
Wells Fargo
Disciplined International Developed Markets Portfolio
(formerly, Wells Fargo International Growth Portfolio)
|
|
|
Reduce clutter. Save trees. |
Sign up for electronic delivery of prospectuses and
shareholder reports at wellsfargo.com/
advantagedelivery |
INVESTMENT PRODUCTS: NOT FDIC INSURED ◾ NO BANK GUARANTEE ◾ MAY LOSE VALUE
Wells Fargo Disciplined International Developed Markets Portfolio | 1
Fund information (unaudited)
Investment objective
The Portfolio seeks long-term capital appreciation.
Manager
Wells Fargo Funds Management, LLC
Subadviser
Wells Capital Management Incorporated*
Portfolio manager
Mark L. Yockey, CFA®‡
| | | | |
| |
| Ten largest holdings (%) as of May 31, 20201 | | | |
| | |
Deutsche Boerse AG | | | 6.57 | |
| | |
Linde plc | | | 6.23 | |
| | |
Air Liquide SA | | | 4.27 | |
| | |
Nestle SA | | | 4.12 | |
| | |
Aon plc Class A | | | 3.83 | |
| | |
Roche Holding AG | | | 3.72 | |
| | |
Genmab AS | | | 3.50 | |
| | |
AIA Group Limited | | | 3.19 | |
| | |
Amazon.com Incorporated | | | 2.86 | |
| | |
Medtronic plc | | | 2.49 | |
|
|
| Sector allocation as of May 31, 20202 |
|
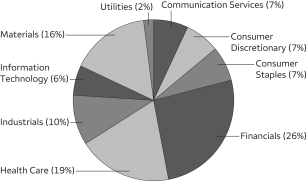
|
|
|
| Geographic allocation as of May 31, 20202 |
|
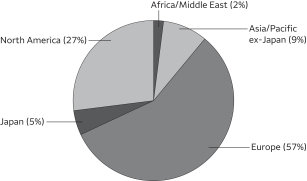 |
| * | Wells Capital Management Incorporated became the sole subadviser to the Fund effective July 7, 2020. |
| ‡ | CFA® and Chartered Financial Analyst® are trademarks owned by CFA Institute. |
| 1 | The ten largest holdings, excluding cash, cash equivalents and any money market funds, are calculated based on the value of the investments divided by the total net assets of the Portfolio. Holdings are subject to change and may have changed since the date specified. |
| 2 | Amounts are calculated based on the total long-term investments of the Portfolio. These amounts are subject to change and may have changed since the date specified. |
2 | Wells Fargo Disciplined International Developed Markets Portfolio
Portfolio of investments—May 31, 2020
| | | | | | | | | | | | | | | | |
| | | | | | | | | Shares | | | Value | |
| Common Stocks: 91.06% | |
|
| Belgium: 0.15% | |
UCB SA (Health Care, Pharmaceuticals) | | | | | | | | | | | 2,689 | | | $ | 269,129 | |
| | | | | | | | | | | | | | | | |
|
| Canada: 2.38% | |
Canadian Pacific Railway Limited (Industrials, Road & Rail) | | | | | | | | | | | 6,100 | | | | 1,528,932 | |
GFL Environmental Incorporated (Industrials, Commercial Services & Supplies) | | | | | | | | | | | 34,452 | | | | 660,445 | |
TMX Group Limited (Financials, Capital Markets) | | | | | | | | | | | 20,700 | | | | 2,074,886 | |
| | | | |
| | | | | | | | | | | | | | | 4,264,263 | |
| | | | | | | | | | | | | | | | |
|
| China: 3.70% | |
Alibaba Group Holding Limited ADR (Consumer Discretionary, Internet & Direct Marketing Retail) † | | | | | | | | | | | 16,201 | | | | 3,359,925 | |
Tencent Holdings Limited (Communication Services, Interactive Media & Services) | | | | | | | | | | | 60,300 | | | | 3,265,598 | |
| | | | |
| | | | | | | | | | | | | | | 6,625,523 | |
| | | | | | | | | | | | | | | | |
|
| Denmark: 5.04% | |
Ascendis Pharma AS ADR (Health Care, Biotechnology) † | | | | | | | | | | | 5,414 | | | | 787,683 | |
DSV Panalpina AS (Industrials, Air Freight & Logistics) | | | | | | | | | | | 4,105 | | | | 435,124 | |
Genmab AS (Health Care, Biotechnology) † | | | | | | | | | | | 20,271 | | | | 6,276,465 | |
Novo Nordisk AS Class B (Health Care, Pharmaceuticals) | | | | | | | | | | | 23,287 | | | | 1,525,407 | |
| | | | |
| | | | | | | | | | | | | | | 9,024,679 | |
| | | | | | | | | | | | | | | | |
|
| France: 8.14% | |
Air Liquide SA (Materials, Chemicals) | | | | | | | | | | | 56,203 | | | | 7,642,481 | |
Amundi SA (Financials, Capital Markets) 144A | | | | | | | | | | | 31,576 | | | | 2,358,413 | |
Eiffage SA (Industrials, Construction & Engineering) | | | | | | | | | | | 22,586 | | | | 2,061,769 | |
Vinci SA (Industrials, Construction & Engineering) | | | | | | | | | | | 27,005 | | | | 2,519,435 | |
| | | | |
| | | | | | | | | | | | | | | 14,582,098 | |
| | | | | | | | | | | | | | | | |
|
| Germany: 12.94% | |
Allianz AG (Financials, Insurance) | | | | | | | | | | | 14,640 | | | | 2,653,297 | |
Deutsche Boerse AG (Financials, Capital Markets) | | | | | | | | | | | 71,534 | | | | 11,778,198 | |
Deutsche Post AG (Industrials, Air Freight & Logistics) | | | | | | | | | | | 53,501 | | | | 1,675,556 | |
Deutsche Telekom AG (Communication Services, Diversified Telecommunication Services) † | | | | | | | | | | | 261,619 | | | | 4,105,751 | |
E.ON SE (Utilities, Multi-Utilities) | | | | | | | | | | | 127,784 | | | | 1,355,490 | |
Symrise AG (Materials, Chemicals) | | | | | | | | | | | 14,628 | | | | 1,610,507 | |
| | | | |
| | | | | | | | | | | | | | | 23,178,799 | |
| | | | | | | | | | | | | | | | |
|
| Hong Kong: 3.74% | |
AIA Group Limited (Financials, Insurance) | | | | | | | | | | | 695,800 | | | | 5,709,581 | |
Wynn Macau Limited (Consumer Discretionary, Hotels, Restaurants & Leisure) | | | | | | | | | | | 582,800 | | | | 998,210 | |
| | | | |
| | | | | | | | | | | | | | | 6,707,791 | |
| | | | | | | | | | | | | | | | |
|
| India: 0.48% | |
Reliance Industries Limited (Energy, Oil, Gas & Consumable Fuels) | | | | | | | | | | | 44,038 | | | | 855,544 | |
| | | | | | | | | | | | | | | | |
|
| Ireland: 15.54% | |
Accenture plc Class A (Information Technology, IT Services) | | | | | | | | | | | 6,952 | | | | 1,401,662 | |
Aon plc Class A (Financials, Insurance) | | | | | | | | | | | 34,807 | | | | 6,855,239 | |
Linde plc (Materials, Chemicals) | | | | | | | | | | | 55,381 | | | | 11,164,569 | |
Medtronic plc (Health Care, Health Care Equipment & Supplies) | | | | | | | | | | | 45,240 | | | | 4,459,759 | |
Willis Towers Watson plc (Financials, Insurance) | | | | | | | | | | | 19,529 | | | | 3,962,434 | |
| | | | |
| | | | | | | | | | | | | | | 27,843,663 | |
| | | | | | | | | | | | | | | | |
The accompanying notes are an integral part of these financial statements.
Wells Fargo Disciplined International Developed Markets Portfolio | 3
Portfolio of investments—May 31, 2020
| | | | | | | | | | | | | | | | |
| | | | | | | | | Shares | | | Value | |
| Israel: 1.71% | |
Nice Systems Limited ADR (Information Technology, Software) † | | | | | | | | | | | 16,472 | | | $ | 3,066,098 | |
| | | | | | | | | | | | | | | | |
|
| Italy: 1.15% | |
Assicurazioni Generali SpA (Financials, Insurance) | | | | | | | | | | | 148,224 | | | | 2,066,407 | |
| | | | | | | | | | | | | | | | |
|
| Japan: 4.86% | |
Astellas Pharma Incorporated (Health Care, Pharmaceuticals) | | | | | | | | | | | 55,000 | | | | 982,736 | |
Nippon Shinyaku Company Limited (Health Care, Pharmaceuticals) | | | | | | | | | | | 47,700 | | | | 4,121,875 | |
Sony Corporation (Consumer Discretionary, Household Durables) | | | | | | | | | | | 24,400 | | | | 1,580,286 | |
Taiyo Nippon Sanso Corporation (Materials, Chemicals) | | | | | | | | | | | 120,000 | | | | 2,017,320 | |
| | | | |
| | | | | | | | | | | | | | | 8,702,217 | |
| | | | | | | | | | | | | | | | |
|
| Netherlands: 3.31% | |
Airbus SE (Industrials, Aerospace & Defense) † | | | | | | | | | | | 38,656 | | | | 2,470,389 | |
Koninklijke DSM NV (Materials, Chemicals) | | | | | | | | | | | 26,993 | | | | 3,452,803 | |
| | | | |
| | | | | | | | | | | | | | | 5,923,192 | |
| | | | | | | | | | | | | | | | |
|
| Portugal: 0.88% | |
Energias de Portugal SA (Utilities, Electric Utilities) | | | | | | | | | | | 337,970 | | | | 1,578,855 | |
| | | | | | | | | | | | | | | | |
|
| Spain: 0.36% | |
Grifols SA ADR (Health Care, Biotechnology) | | | | | | | | | | | 34,472 | | | | 652,555 | |
| | | | | | | | | | | | | | | | |
|
| Sweden: 0.89% | |
Ericsson LM Class B (Information Technology, Communications Equipment) | | | | | | | | | | | 173,530 | | | | 1,589,074 | |
| | | | | | | | | | | | | | | | |
|
| Switzerland: 13.90% | |
Idorsia Limited (Health Care, Biotechnology) † | | | | | | | | | | | 51,549 | | | | 1,579,152 | |
Lonza Group AG (Health Care, Life Sciences Tools & Services) | | | | | | | | | | | 6,399 | | | | 3,159,957 | |
Medacta Group SA (Health Care, Health Care Equipment & Supplies) 144A† | | | | | | | | | | | 11,325 | | | | 976,557 | |
Nestle SA (Consumer Staples, Food Products) | | | | | | | | | | | 67,937 | | | | 7,376,396 | |
Roche Holding AG (Health Care, Pharmaceuticals) | | | | | | | | | | | 19,212 | | | | 6,668,898 | |
Temenos AG (Information Technology, Software) | | | | | | | | | | | 9,589 | | | | 1,473,868 | |
UBS Group AG (Financials, Capital Markets) | | | | | | | | | | | 342,939 | | | | 3,671,373 | |
| | | | |
| | | | | | | | | | | | | | | 24,906,201 | |
| | | | | | | | | | | | | | | | |
|
| United Kingdom: 5.23% | |
Amarin Corporation plc ADR (Health Care, Biotechnology) † | | | | | | | | | | | 134,968 | | | | 925,880 | |
AVEVA Group plc (Information Technology, Software) | | | | | | | | | | | 38,873 | | | | 1,975,053 | |
Coca-Cola European Partners plc (Consumer Staples, Beverages) | | | | | | | | | | | 44,049 | | | | 1,660,647 | |
Diageo plc (Consumer Staples, Beverages) | | | | | | | | | | | 97,726 | | | | 3,409,646 | |
RELX plc (Industrials, Professional Services) | | | | | | | | | | | 60,396 | | | | 1,405,746 | |
| | | | |
| | | | | | | | | | | | | | | 9,376,972 | |
| | | | | | | | | | | | | | | | |
|
| United States: 6.66% | |
Alphabet Incorporated Class A (Communication Services, Interactive Media & Services) † | | | | | | | | | | | 1,903 | | | | 2,727,989 | |
Alphabet Incorporated Class C (Communication Services, Interactive Media & Services) † | | | | | | | | | | | 774 | | | | 1,105,984 | |
Amazon.com Incorporated (Consumer Discretionary, Internet & Direct Marketing Retail) † | | | | | | | | | | | 2,096 | | | | 5,119,208 | |
Intercontinental Exchange Incorporated (Financials, Capital Markets) | | | | | | | | | | | 30,607 | | | | 2,976,531 | |
| | | | |
| | | | | | | | | | | | | | | 11,929,712 | |
| | | | | | | | | | | | | | | | |
| |
Total Common Stocks (Cost $137,290,039) | | | | 163,142,772 | |
| | | | | |
The accompanying notes are an integral part of these financial statements.
4 | Wells Fargo Disciplined International Developed Markets Portfolio
Portfolio of investments—May 31, 2020
| | | | | | | | | | | | | | | | |
| | | | | | Expiration
date | | | Shares | | | Value | |
| Participation Notes: 2.03% | | | | | | | | | | | | |
| | | | |
| Ireland: 2.03% | | | | | | | | | | | | |
HSBC Bank plc (Ryanair Holdings plc) (Industrials, Airlines) †(a) | | | | | | | 10-29-2020 | | | | 292,215 | | | $ | 3,631,578 | |
| | | | | | | | | | | | | | | | |
| | | | |
Total Participation Notes (Cost $3,777,702) | | | | | | | | | | | | | | | 3,631,578 | |
| | | | | | | | | | | | | | | | |
| | | | |
| | | | | | | | | | | | | | | | |
| | | Yield | | | | | | | | | | |
| Short-Term Investments: 6.23% | | | | | | | | | | | | |
| | | | |
| Investment Companies: 6.23% | | | | | | | | | | | | |
Wells Fargo Government Money Market Fund Select Class (l)(u) | | | 0.12 | % | | | | | | | 11,162,407 | | | | 11,162,407 | |
| | | | | | | | | | | | | | | | |
Total Short-Term Investments (Cost $11,162,407) | | | | | | | | | | | | | | | 11,162,407 | |
| | | | | | | | | | | | | | | | |
| | | | | | | | |
| Total investments in securities (Cost $152,230,148) | | | 99.32 | % | | | 177,936,757 | |
| | |
Other assets and liabilities, net | | | 0.68 | | | | 1,213,463 | |
| | | | | | | | |
| Total net assets | | | 100.00 | % | | $ | 179,150,220 | |
| | | | | | | | |
| † | Non-income-earning security |
| 144A | The security may be resold in transactions exempt from registration, normally to qualified institutional buyers, pursuant to Rule 144A under the Securities Act of 1933. |
| (a) | The security is fair valued in accordance with procedures approved by the Board of Trustees. |
| (l) | The issuer of the security is an affiliated person of the Portfolio as defined in the Investment Company Act of 1940. |
| (u) | The rate represents the 7-day annualized yield at period end. |
Abbreviations:
| ADR | American depositary receipt |
Investments in Affiliates
An affiliated investment is an investment in which the Portfolio owns at least 5% of the outstanding voting shares of the issuer or as a result of other relationships, such as the Portfolio and the issuer having the same adviser or investment manager. Transactions with issuers that were either affiliated persons of the Portfolio at the beginning of the period or the end of the period were as follows:
| | | | | | | | | | | | | | | | | | | | | | | | | | | | | | | | | | | | |
| | | Shares,
beginning of
period | | | Shares
purchased | | | Shares
sold | | | Shares,
end of
period | | | Net
realized
gains
(losses) | | | Net
change in
unrealized
gains
(losses) | | | Income
from
affiliated
securities | | | Value,
end of
period | | | % of
net
assets | |
| | | | | | | | | |
| Short-Term Investments | | | | | | | | | | | | | | | | | | | | | | | | | | | |
Investment Companies | | | | | | | | | | | | | | | | | | | | | | | | | | | | | | | | | | | | |
Securities Lending Cash Investments LLC * | | | 6,040,572 | | | | 33,506,285 | | | | (39,546,857 | ) | | | 0 | | | $ | (2,710 | ) | | $ | 0 | | | $ | 69,808 | # | | $ | 0 | | | | | |
Wells Fargo Government Money Market Fund Select Class | | | 11,990,365 | | | | 75,360,754 | | | | (76,188,712 | ) | | | 11,162,407 | | | | 0 | | | | 0 | | | | 84,339 | | | | 11,162,407 | | | | | |
| | | | | | | | | | | | | | | | | | | | | | | | | | | | | | | | | | | | |
| | | | | | | | | | | | | | | | | | $ | (2,710 | ) | | $ | 0 | | | $ | 154,147 | | | $ | 11,162,407 | | | | 6.23 | % |
| | | | | | | | | | | | | | | | | | | | | | | | | | | | | | | | | | | | |
| * | No longer held at the end of the period |
| # | Amount shown represents income before fees and rebates. |
The accompanying notes are an integral part of these financial statements.
Wells Fargo Disciplined International Developed Markets Portfolio | 5
Statement of assets and liabilities—May 31, 2020
| | | | |
| | | | |
| |
Assets | | | | |
Investments in unaffiliated securities, at value (cost $141,067,741) | | $ | 166,774,350 | |
Investments in affiliated securities, at value (cost $11,162,407) | | | 11,162,407 | |
Foreign currency, at value (cost $660,979) | | | 662,069 | |
Receivable for investments sold | | | 1,550,844 | |
Receivable for dividends | | | 559,909 | |
Prepaid expenses and other assets | | | 6,203 | |
| | | | |
Total assets | | | 180,715,782 | |
| | | | |
| |
Liabilities | | | | |
Payable for investments purchased | | | 1,390,132 | |
Advisory fee payable | | | 117,445 | |
Trustees’ fees and expenses payable | | | 937 | |
Accrued expenses and other liabilities | | | 57,048 | |
| | | | |
Total liabilities | | | 1,565,562 | |
| | | | |
Total net assets | | $ | 179,150,220 | |
| | | | |
The accompanying notes are an integral part of these financial statements.
6 | Wells Fargo Disciplined International Developed Markets Portfolio
Statement of operations—year ended May 31, 2020
| | | | |
| | | | |
| |
Investment income | | | | |
Dividends (net of foreign withholding taxes of $507,766) | | $ | 2,281,642 | |
Income from affiliated securities | | | 168,259 | |
| | | | |
Total investment income | | | 2,449,901 | |
| | | | |
| |
Expenses | | | | |
Advisory fee | | | 1,558,425 | |
Custody and accounting fees | | | 98,146 | |
Professional fees | | | 69,171 | |
Shareholder report expenses | | | 9,593 | |
Trustees’ fees and expenses | | | 20,709 | |
Other fees and expenses | | | 26,076 | |
| | | | |
Net expenses | | | 1,782,120 | |
| | | | |
Net investment income | | | 667,781 | |
| | | | |
| |
Realized and unrealized gains (losses) on investments | | | | |
Net realized gains (losses) on | |
Unaffiliated securities | | | 250,788 | |
Affiliated securities | | | (2,710 | ) |
| | | | |
Net realized gains on investments | | | 248,078 | |
Net change in unrealized gains (losses) on investments | | | 7,261,481 | |
| | | | |
Net realized and unrealized gains (losses) on investments | | | 7,509,559 | |
| | | | |
Net increase in net assets resulting from operations | | $ | 8,177,340 | |
| | | | |
The accompanying notes are an integral part of these financial statements.
Wells Fargo Disciplined International Developed Markets Portfolio | 7
Statement of changes in net assets
| | | | | | | | |
| | | Year ended
May 31, 2020 | | | Year ended
May 31, 2019 | |
|
Operations | |
Net investment income | | $ | 667,781 | | | $ | 3,074,568 | |
Net realized gains (losses) on investments | | | 248,078 | | | | (14,236,360 | ) |
Net change in unrealized gains (losses) on investments | | | 7,261,481 | | | | 11,524,725 | |
| | | | |
Net increase in net assets resulting from operations | | | 8,177,340 | | | | 362,933 | |
| | | | |
| | |
Capital transactions | | | | | | | | |
Transactions in investors’ beneficial interests | |
Contributions | | | 15,390,712 | | | | 302,716,175 | |
Withdrawals | | | (53,515,149 | ) | | | (138,556,460 | ) |
| | | | |
Net increase (decrease) in net assets resulting from capital transactions | | | (38,124,437 | ) | | | 164,159,715 | |
| | | | |
Total increase (decrease) in net assets | | | (29,947,097 | ) | | | 164,522,648 | |
| | | | |
| | |
Net assets | | | | | | | | |
Beginning of period | | | 209,097,317 | | | | 44,574,669 | |
| | | | |
End of period | | $ | 179,150,220 | | | $ | 209,097,317 | |
| | | | |
The accompanying notes are an integral part of these financial statements.
8 | Wells Fargo Disciplined International Developed Markets Portfolio
Financial highlights
| | | | | | | | | | | | | | | | | | | | |
| | | Year ended May 31 | |
| | | 2020 | | | 2019 | | | 2018 | | | 2017 | | | 2016 | |
Total return | | | 1.76 | % | | | (0.14 | )% | | | 9.46 | % | | | 10.31 | % | | | (12.40 | )% |
Ratios to average net assets (annualized) | | | | | | | | | | | | | | | | | | | | |
Gross expenses | | | 0.91 | % | | | 0.89 | % | | | 1.10 | % | | | 0.98 | % | | | 0.99 | % |
Net expenses | | | 0.91 | % | | | 0.89 | % | | | 1.06 | % | | | 0.98 | % | | | 0.99 | % |
Net investment income | | | 0.34 | % | | | 1.24 | % | | | 0.70 | % | | | 1.25 | % | | | 1.16 | % |
Supplemental data | | | | | | | | | | | | | | | | | | | | |
Portfolio turnover rate | | | 53 | % | | | 100 | % | | | 71 | % | | | 121 | % | | | 62 | % |
The accompanying notes are an integral part of these financial statements.
Wells Fargo Disciplined International Developed Markets Portfolio | 9
Notes to financial statements
1. ORGANIZATION
Wells Fargo Master Trust (the “Trust”), a Delaware statutory trust organized on March 10, 1999, is an open-end management investment company registered under the Investment Company Act of 1940, as amended (the “1940 Act”). As an investment company, the Trust follows the accounting and reporting guidance in Financial Accounting Standards Board (“FASB”) Accounting Standards Codification Topic 946, Financial Services – Investment Companies. These financial statements report on the Wells Fargo Disciplined International Developed Markets Portfolio (formerly, Wells Fargo International Growth Portfolio) (the “Portfolio”) which is a diversified series of the Trust.
2. SIGNIFICANT ACCOUNTING POLICIES
The following significant accounting policies, which are consistently followed in the preparation of the financial statements of the Portfolio, are in conformity with U.S. generally accepted accounting principles which require management to make estimates and assumptions that affect the reported amounts of assets and liabilities, disclosure of contingent assets and liabilities at the date of the financial statements, and the reported amounts of revenues and expenses during the reporting period. Actual results could differ from those estimates.
Securities valuation
All investments are valued each business day as of the close of regular trading on the New York Stock Exchange (generally 4 p.m. Eastern Time), although the Portfolio may deviate from this calculation time under unusual or unexpected circumstances.
Equity securities that are listed on a foreign or domestic exchange or market are valued at the official closing price or, if none, the last sales price. If no sale occurs on the principal exchange or market that day, a fair value price will be determined in accordance with the Portfolio’s Valuation Procedures.
The values of securities denominated in foreign currencies are translated into U.S. dollars at rates provided by an independent foreign currency pricing source at a time each business day specified by the Wells Fargo Asset Management Pricing Committee at Wells Fargo Funds Management, LLC (“Funds Management”).
Many securities markets and exchanges outside the U.S. close prior to the close of the New York Stock Exchange and therefore may not fully reflect trading or events that occur after the close of the principal exchange in which the foreign securities are traded, but before the close of the New York Stock Exchange. If such trading or events are expected to materially affect the value of such securities, then fair value pricing procedures approved by the Board of Trustees of the Portfolio are applied. These procedures take into account multiple factors including movements in U.S. securities markets after foreign exchanges close. Foreign securities that are fair valued under these procedures are categorized as Level 2 and the application of these procedures may result in transfers between Level 1 and Level 2. Depending on market activity, such fair valuations may be frequent. Such fair value pricing may result in net asset values that are higher or lower than net asset values based on the last reported sales price or latest quoted bid price. On May 31, 2020, such fair value pricing was used in pricing certain foreign securities.
Investments in registered open-end investment companies are valued at net asset value. Interests in non-registered investment companies that are redeemable at net asset value are fair valued normally at net asset value.
Investments which are not valued using any of the methods discussed above are valued at their fair value, as determined in good faith by the Board of Trustees. The Board of Trustees has established a Valuation Committee comprised of the Trustees and has delegated to it the authority to take any actions regarding the valuation of portfolio securities that the Valuation Committee deems necessary or appropriate, including determining the fair value of portfolio securities, unless the determination has been delegated to the Wells Fargo Asset Management Pricing Committee. The Board of Trustees retains the authority to make or ratify any valuation decisions or approve any changes to the Valuation Procedures as it deems appropriate. On a quarterly basis, the Board of Trustees receives reports on any valuation actions taken by the Valuation Committee or the Wells Fargo Asset Management Pricing Committee which may include items for ratification.
Foreign currency translation
The accounting records of the Portfolio are maintained in U.S. dollars. The values of other assets and liabilities denominated in foreign currencies are translated into U.S. dollars at rates provided by an independent foreign currency pricing source at a time each business day specified by the Wells Fargo Asset Management Pricing Committee. Purchases and sales of securities, and income and expenses are converted at the rate of exchange on the respective dates of such transactions. Net realized foreign exchange gains or losses arise from sales of foreign currencies, currency gains or losses realized between the trade and settlement dates on securities transactions, and the difference between the amounts of dividends, interest and foreign withholding taxes recorded and the U.S. dollar equivalent of the amounts actually paid or received. Net unrealized foreign exchange gains and losses arise from changes in the fair value of assets and liabilities other than investments in securities
10 | Wells Fargo Disciplined International Developed Markets Portfolio
Notes to financial statements
resulting from changes in exchange rates. The changes in net assets arising from changes in exchange rates of securities and the changes in net assets resulting from changes in market prices of securities are not separately presented. Such changes are included in net realized and unrealized gains or losses from investments.
Participation notes
The Portfolio may invest in participation notes to gain exposure to securities in certain foreign markets. Participation notes are issued by banks or broker-dealers and are designed to offer a return linked to a particular underlying foreign security. Participation notes involve transaction costs, which may be higher than those applicable to the underlying foreign security. The holder of the participation note is entitled to receive from the bank or broker-dealer, an amount equal to the dividend paid by the issuer of the underlying foreign security; however, the holder is not entitled to the same rights (i.e. voting rights) as an owner of the underlying foreign security. Investments in participation notes involve risks beyond those normally associated with a direct investment in an underlying security. The Portfolio has no rights against the issuer of the underlying foreign security and participation notes expose the Portfolio to counterparty risk in the event the counterparty does not perform. There is also no assurance there will be a secondary trading market for the participation note or that the trading price of the participation note will equal the underlying value of the foreign security that it seeks to replicate.
Securities lending
The Portfolio may lend its securities from time to time in order to earn additional income in the form of fees or interest on securities received as collateral or the investment of any cash received as collateral. When securities are on loan, the Portfolio receives interest or dividends on those securities. Cash collateral received in connection with its securities lending transactions is invested in Securities Lending Cash Investments, LLC (the “Securities Lending Fund”). Investments in Securities Lending Fund are valued at the evaluated bid price provided by an independent pricing service. Income earned from investment in the Securities Lending Fund (net of fees and rebates), if any, is included in income from affiliated securities on the Statement of Operations.
In a securities lending transaction, the net asset value of the Portfolio is affected by an increase or decrease in the value of the securities loaned and by an increase or decrease in the value of the instrument in which collateral is invested. The amount of securities lending activity undertaken by the Portfolio fluctuates from time to time. The Portfolio has the right under the lending agreement to recover the securities from the borrower on demand. In the event of default or bankruptcy by the borrower, the Portfolio may be prevented from recovering the loaned securities or gaining access to the collateral or may experience delays or costs in doing so. In such an event, the terms of the agreement allow the unaffiliated securities lending agent to use the collateral to purchase replacement securities on behalf of the Portfolio or pay the Portfolio the market value of the loaned securities. The Portfolio bears the risk of loss with respect to depreciation of its investment of the cash collateral.
Security transactions and income recognition
Securities transactions are recorded on a trade date basis. Realized gains or losses are recorded on the basis of identified cost.
Dividend income is recognized on the ex-dividend date, except for certain dividends from foreign securities, which are recorded as soon as the custodian verifies the ex-dividend date. Dividend income from foreign securities is recorded net of foreign taxes withheld where recovery of such taxes is not assured.
Federal and other taxes
The Portfolio is treated as a separate entity for federal income tax purposes. The Portfolio is not required to pay federal income taxes on its net investment income and net capital gains as it is treated as a partnership for federal income tax purposes. All dividends, gains and losses of the Portfolio are deemed to have been “passed through” to the interest holders in proportion to their holdings of the Portfolio regardless of whether dividends and gains have been distributed by the Portfolio.
The Portfolio’s income tax returns and all financial records supporting those returns for the prior three fiscal years are subject to examination by the federal revenue authority. Management has analyzed the Portfolio’s tax positions taken on federal, state, and foreign tax returns for all open tax years and does not believe that there are any uncertain tax positions that require recognition of a tax liability.
As of May 31, 2020, the aggregate cost of all investments for federal income tax purposes was $153,547,790 and the unrealized gains (losses) consisted of:
| | | | |
| |
Gross unrealized gains | | $ | 30,027,036 | |
| |
Gross unrealized losses | | | (5,638,069 | ) |
| |
Net unrealized gains | | $ | 24,388,967 | |
Wells Fargo Disciplined International Developed Markets Portfolio | 11
Notes to financial statements
3. FAIR VALUATION MEASUREMENTS
Fair value measurements of investments are determined within a framework that has established a fair value hierarchy based upon the various data inputs utilized in determining the value of the Portfolio’s investments. The three-level hierarchy gives the highest priority to unadjusted quoted prices in active markets for identical assets or liabilities (Level 1) and the lowest priority to unobservable inputs (Level 3). The Portfolio’s investments are classified within the fair value hierarchy based on the lowest level of input that is significant to the fair value measurement. The inputs are summarized into three broad levels as follows:
| ∎ | | Level 1 – quoted prices in active markets for identical securities |
| ∎ | | Level 2 – other significant observable inputs (including quoted prices for similar securities, interest rates, prepayment speeds, credit risk, etc.) |
| ∎ | | Level 3 – significant unobservable inputs (including the Portfolio’s own assumptions in determining the fair value of investments) |
The inputs or methodologies used for valuing investments in securities are not necessarily an indication of the risk associated with investing in those securities.
The following is a summary of the inputs used in valuing the Portfolio’s assets and liabilities as of May 31, 2020:
| | | | | | | | | | | | | | | | |
| | | | |
| | | Quoted prices
(Level 1) | | | Other significant
observable inputs
(Level 2) | | | Significant
unobservable inputs (Level 3) | | | Total | |
| | | | |
Assets | | | | | | | | | | | | | | | | |
Investments in: | | | | | | | | | | | | | | | | |
| | | | |
Common stocks | | | | | | | | | | | | | | | | |
| | | | |
Belgium | | $ | 0 | | | $ | 269,129 | | | $ | 0 | | | $ | 269,129 | |
| | | | |
Canada | | | 4,264,263 | | | | 0 | | | | 0 | | | | 4,264,263 | |
| | | | |
China | | | 3,359,925 | | | | 3,265,598 | | | | 0 | | | | 6,625,523 | |
| | | | |
Denmark | | | 787,683 | | | | 8,236,996 | | | | 0 | | | | 9,024,679 | |
| | | | |
France | | | 0 | | | | 14,582,098 | | | | 0 | | | | 14,582,098 | |
| | | | |
Germany | | | 0 | | | | 23,178,799 | | | | 0 | | | | 23,178,799 | |
| | | | |
Hong Kong | | | 0 | | | | 6,707,791 | | | | 0 | | | | 6,707,791 | |
| | | | |
India | | | 0 | | | | 855,544 | | | | 0 | | | | 855,544 | |
| | | | |
Ireland | | | 16,679,094 | | | | 11,164,569 | | | | 0 | | | | 27,843,663 | |
| | | | |
Israel | | | 3,066,098 | | | | 0 | | | | 0 | | | | 3,066,098 | |
| | | | |
Italy | | | 0 | | | | 2,066,407 | | | | 0 | | | | 2,066,407 | |
| | | | |
Japan | | | 0 | | | | 8,702,217 | | | | 0 | | | | 8,702,217 | |
| | | | |
Netherlands | | | 0 | | | | 5,923,192 | | | | 0 | | | | 5,923,192 | |
| | | | |
Portugal | | | 0 | | | | 1,578,855 | | | | 0 | | | | 1,578,855 | |
| | | | |
Spain | | | 652,555 | | | | 0 | | | | 0 | | | | 652,555 | |
| | | | |
Sweden | | | 0 | | | | 1,589,074 | | | | 0 | | | | 1,589,074 | |
| | | | |
Switzerland | | | 0 | | | | 24,906,201 | | | | 0 | | | | 24,906,201 | |
| | | | |
United Kingdom | | | 2,586,527 | | | | 6,790,445 | | | | 0 | | | | 9,376,972 | |
| | | | |
United States | | | 11,929,712 | | | | 0 | | | | 0 | | | | 11,929,712 | |
| | | | |
Participation notes | | | | | | | | | | | | | | | | |
| | | | |
Ireland | | | 0 | | | | 3,631,578 | | | | 0 | | | | 3,631,578 | |
| | | | |
Short-term investments | | | | | | | | | | | | | | | | |
| | | | |
Investment companies | | | 11,162,407 | | | | 0 | | | | 0 | | | | 11,162,407 | |
| | | | |
Total assets | | $ | 54,488,264 | | | $ | 123,448,493 | | | $ | 0 | | | $ | 177,936,757 | |
Additional sector, industry or geographic detail is included in the Portfolio of Investments.
For the year ended May 31, 2020, the Portfolio did not have any transfers into/out of Level 3.
12 | Wells Fargo Disciplined International Developed Markets Portfolio
Notes to financial statements
4. TRANSACTIONS WITH AFFILIATES AND OTHER EXPENSES
Advisory fee
The Trust has entered into an advisory contract with Funds Management, an indirect wholly owned subsidiary of Wells Fargo & Company (“Wells Fargo”). The adviser is responsible for implementing investment policies and guidelines and for supervising the subadviser, who is responsible for day-to-day portfolio management of the Portfolio. Pursuant to the contract, Funds Management is entitled to receive an annual advisory fee at the following annual rate based on the Portfolio’s average daily net assets:
| | |
| |
| Average daily net assets | | Advisory fee |
| |
First $500 million | | 0.800% |
| |
Next $500 million | | 0.750 |
| |
Next $1 billion | | 0.700 |
| |
Next $2 billion | | 0.675 |
| |
Over $4 billion | | 0.650 |
For the year ended May 31, 2020, the advisory fee was equivalent to an annual rate of 0.80% of the Portfolio’s average daily net assets.
Funds Management has retained the services of a subadviser to provide daily portfolio management to the Portfolio. The fee for subadvisory services is borne by Funds Management. Artisan Partners Limited Partnership, which is not an affiliate of Funds Management, is the subadviser to the Portfolio and is entitled to receive a fee from Funds Management at an annual rate starting at 0.80% and declining to 0.50% as the average daily net assets of the Portfolio increase.
Interfund transactions
The Portfolio may purchase or sell portfolio investment securities to certain other Wells Fargo affiliates pursuant to Rule 17a-7 under the 1940 Act and under procedures adopted by the Board of Trustees. The procedures have been designed to ensure that these interfund transactions, which do not incur broker commissions, are effected at current market prices.
5. INVESTMENT PORTFOLIO TRANSACTIONS
Purchases and sales of investments, excluding U.S. government obligations (if any) and short-term securities, for the year ended May 31, 2020 were $98,980,507 and $ 135,793,955, respectively.
6. SECURITIES LENDING TRANSACTIONS
The Portfolio lends its securities through an unaffiliated securities lending agent and receives collateral in the form of cash or securities with a value at least equal to the value of the securities on loan. The value of the loaned securities is determined at the close of each business day and any increases or decreases in the required collateral are exchanged between the Portfolio and the counterparty on the next business day. Cash collateral received is invested in the Securities Lending Fund which seeks to provide a positive return compared to the daily Fed Funds Open Rate by investing in high-quality, U.S. dollar-denominated short-term money market instruments and is exempt from registration under Section 3(c)(7) of the 1940 Act. Securities Lending Fund is managed by Funds Management and is subadvised by Wells Capital Management Incorporated (“WellsCap”), an affiliate of Funds Management and an indirect wholly owned subsidiary of Wells Fargo. Funds Management receives an advisory fee starting at 0.05% and declining to 0.01% as the average daily net assets of the Securities Lending Fund increase. All of the fees received by Funds Management are paid to WellsCap for its services as subadviser.
In the event of counterparty default or the failure of a borrower to return a loaned security, the Portfolio has the right to use the collateral to offset any losses incurred. As of May 31, 2020, the Portfolio did not have any securities on loan.
7. BANK BORROWINGS
The Trust, along with Wells Fargo Variable Trust and Wells Fargo Funds Trust (excluding the money market funds), are parties to a $280,000,000 revolving credit agreement whereby the Portfolio is permitted to use bank borrowings for temporary or emergency purposes, such as to fund shareholder redemption requests. Interest under the credit agreement is charged to the Portfolio based on a borrowing rate equal to the higher of the Federal Funds rate in effect on that day plus 1.25% or the overnight LIBOR rate in effect on that day plus 1.25%. In addition, an annual commitment fee equal to 0.25% of the unused balance is allocated to each participating fund.
Wells Fargo Disciplined International Developed Markets Portfolio | 13
Notes to financial statements
For the year ended May 31, 2020, there were no borrowings by the Portfolio under the agreement.
8. CONCENTRATION RISKS
Concentration risks result from exposure to a limited number of sectors or geographic regions. As of the end of the period, the Portfolio invested a concentration of its portfolio in the financials sector and in Europe. A portfolio that invests a substantial portion of its assets in any sector or geographic region may be more affected by changes in that sector or geographic region than would be a portfolio whose investments are not heavily weighted in any sector or geographic region.
9. INDEMNIFICATION
Under the Portfolio’s organizational documents, the officers and Trustees have been granted certain indemnification rights against certain liabilities that may arise out of performance of their duties to the Portfolio. The Portfolio has entered into a separate agreement with each Trustee that converts indemnification rights currently existing under the Portfolio’s organizational documents into contractual rights that cannot be changed in the future without the consent of the Trustee. Additionally, in the normal course of business, the Portfolio may enter into contracts with service providers that contain a variety of indemnification clauses. The Portfolio’s maximum exposure under these arrangements is dependent on future claims that may be made against the Portfolio and, therefore, cannot be estimated.
10. NEW ACCOUNTING PRONOUNCEMENT
In August 2018, FASB issued Accounting Standards Update (“ASU”) No. 2018-13, Fair Value Measurement (Topic 820) Disclosure Framework—Changes to the Disclosure Requirements for Fair Value Measurement. ASU 2018-13 updates the disclosure requirements for fair value measurements by modifying or removing certain disclosures and adding certain new disclosures. The amendments are effective for fiscal years, and interim periods within those fiscal years, beginning after December 15, 2019. Early adoption is permitted. Management has adopted the removal and modification of disclosures early, as permitted, and will adopt the additional new disclosures at the effective date.
11. CORONAVIRUS (COVID-19) PANDEMIC
On March 11, 2020, the World Health Organization announced that it had made the assessment that coronavirus disease 2019 (“COVID-19”) is a pandemic. The impacts of COVID-19 are adversely affecting the entire global economy, individual companies and investment products, and the market in general. There is significant uncertainty around the extent and duration of business disruptions related to COVID-19 and the impacts may be short term or may last for an extended period of time. The risk of further spreading of COVID-19 has led to significant uncertainty and volatility in the financial markets. The value of the Portfolio and the securities in which the Portfolio invests have generally been adversely affected by impacts caused by COVID-19.
12. SUBSEQUENT EVENT
Effective July 7, 2020, the Fund changed its name from Wells Fargo International Growth Portfolio to Wells Fargo Disciplined International Developed Markets Portfolio and WellsCap replaced Artisan Partners Limited Partnership as the subdviser to the Portfolio.
14 | Wells Fargo Disciplined International Developed Markets Portfolio
Report of independent registered public accounting firm
TO THE INTEREST HOLDERS OF THE PORTFOLIO AND BOARD OF TRUSTEES WELLS FARGO MASTER TRUST:
Opinion on the Financial Statements
We have audited the accompanying statement of assets and liabilities of Wells Fargo Disciplined International Developed Markets Portfolio (formerly, Wells Fargo International Growth Portfolio) (the Portfolio), one of the portfolios constituting Wells Fargo Master Trust, including the portfolio of investments, as of May 31, 2020, the related statement of operations for the year then ended, the statements of changes in net assets for each of the years in the two-year period then ended, and the related notes (collectively, the financial statements) and the financial highlights for each of the years in the five-year period then ended. In our opinion, the financial statements and financial highlights present fairly, in all material respects, the financial position of the Portfolio as of May 31, 2020, the results of its operations for the year then ended, the changes in its net assets for each of the years in the two-year period then ended, and the financial highlights for each of the years in the five-year period then ended, in conformity with U.S. generally accepted accounting principles.
Basis for Opinion
These financial statements and financial highlights are the responsibility of the Portfolio’s management. Our responsibility is to express an opinion on these financial statements and financial highlights based on our audits. We are a public accounting firm registered with the Public Company Accounting Oversight Board (United States) (PCAOB) and are required to be independent with respect to the Portfolio in accordance with the U.S. federal securities laws and the applicable rules and regulations of the Securities and Exchange Commission and the PCAOB.
We conducted our audits in accordance with the standards of the PCAOB. Those standards require that we plan and perform the audit to obtain reasonable assurance about whether the financial statements and financial highlights are free of material misstatement, whether due to error or fraud. Our audits included performing procedures to assess the risks of material misstatement of the financial statements and financial highlights, whether due to error or fraud, and performing procedures that respond to those risks. Such procedures included examining, on a test basis, evidence regarding the amounts and disclosures in the financial statements and financial highlights. Such procedures also included confirmation of securities owned as of May 31, 2020, by correspondence with the custodian, transfer agent and brokers, or by other appropriate auditing procedures. Our audits also included evaluating the accounting principles used and significant estimates made by management, as well as evaluating the overall presentation of the financial statements and financial highlights. We believe that our audits provide a reasonable basis for our opinion.

We have not been able to determine the specific year that we began serving as the auditor of one or more Wells Fargo Funds investment companies; however we are aware that we have served as the auditor of one or more Wells Fargo Funds investment companies since at least 1955.
Boston, Massachusetts
July 29, 2020
Wells Fargo Disciplined International Developed Markets Portfolio | 15
Other information (unaudited)
PROXY VOTING INFORMATION
A description of the policies and procedures used to determine how to vote proxies relating to portfolio securities is available, upon request, by calling 1-800-222-8222, visiting our website at wfam.com, or visiting the SEC website at sec.gov. Information regarding how the proxies related to portfolio securities were voted during the most recent 12-month period ended June 30 is available on the website at wfam.com or by visiting the SEC website at sec.gov.
QUARTERLY PORTFOLIO HOLDINGS INFORMATION
The Portfolio files its complete schedule of portfolio holdings with the SEC for the first and third quarters of each fiscal year as an exhibit to its reports on Form N-PORT. Shareholders may view the filed Form N-PORT by visiting the SEC website at sec.gov.
16 | Wells Fargo Disciplined International Developed Markets Portfolio
Other information (unaudited)
BOARD OF TRUSTEES AND OFFICERS
Each of the Trustees and Officers1 listed in the table below acts in identical capacities for each fund in the Wells Fargo family of funds, which consists of 147 mutual funds comprising the Wells Fargo Funds Trust, Wells Fargo Variable Trust, Wells Fargo Master Trust and four closed-end funds (collectively the “Fund Complex”). This table should be read in conjunction with the Prospectus and the Statement of Additional Information2. The mailing address of each Trustee and Officer is 525 Market Street, 12th Floor, San Francisco, CA 94105. Each Trustee and Officer serves an indefinite term, however, each Trustee serves such term until reaching the mandatory retirement age established by the Trustees.
Independent Trustees
| | | | | | |
Name and year of birth | | Position held and
length of service* | | Principal occupations during past five years or longer | | Current other
public company or
investment
company
directorships |
| | | |
| William R. Ebsworth (Born 1957) | | Trustee, since 2015 | | Retired. From 1984 to 2013, equities analyst, portfolio manager, research director and chief investment officer at Fidelity Management and Research Company in Boston, Tokyo, and Hong Kong, and retired in 2013 as Chief Investment Officer of Fidelity Strategic Advisers, Inc. where he led a team of investment professionals managing client assets. Prior thereto, Board member of Hong Kong Securities Clearing Co., Hong Kong Options Clearing Corp., the Thailand International Fund, Ltd., Fidelity Investments Life Insurance Company, and Empire Fidelity Investments Life Insurance Company. Audit Committee Chair and Investment Committee Chair of the Vincent Memorial Hospital Endowment (non-profit organization). Mr. Ebsworth is a CFA® charterholder. | | N/A |
| | | |
| Jane A. Freeman (Born 1953) | | Trustee, since 2015; Chair Liaison, since 2018 | | Retired. From 2012 to 2014 and 1999 to 2008, Chief Financial Officer of Scientific Learning Corporation. From 2008 to 2012, Ms. Freeman provided consulting services related to strategic business projects. Prior to 1999, Portfolio Manager at Rockefeller & Co. and Scudder, Stevens & Clark. Board member of the Harding Loevner Funds from 1996 to 2014, serving as both Lead Independent Director and chair of the Audit Committee. Board member of the Russell Exchange Traded Funds Trust from 2011 to 2012 and the chair of the Audit Committee. Ms. Freeman is also an inactive Chartered Financial Analyst. | | N/A |
| | | |
| Isaiah Harris, Jr. (Born 1952) | | Trustee, since 2009; Audit Committee Chairman, since 2019 | | Retired. Chairman of the Board of CIGNA Corporation since 2009, and Director since 2005. From 2003 to 2011, Director of Deluxe Corporation. Prior thereto, President and CEO of BellSouth Advertising and Publishing Corp. from 2005 to 2007, President and CEO of BellSouth Enterprises from 2004 to 2005 and President of BellSouth Consumer Services from 2000 to 2003. Emeritus member of the Iowa State University Foundation Board of Governors. Emeritus Member of the Advisory Board of Iowa State University School of Business. Advisory Board Member, Palm Harbor Academy (private school). Advisory Board Member, Child Evangelism Fellowship (non-profit). Mr. Harris is a certified public accountant (inactive status). | | CIGNA Corporation |
| | | |
| Judith M. Johnson (Born 1949) | | Trustee, since 2008; Audit Committee Chairman, from 2009 to 2018 | | Retired. Prior thereto, Chief Executive Officer and Chief Investment Officer of Minneapolis Employees Retirement Fund from 1996 to 2008. Ms. Johnson is an attorney, certified public accountant and a certified managerial accountant. | | N/A |
Wells Fargo Disciplined International Developed Markets Portfolio | 17
Other information (unaudited)
| | | | | | |
Name and year of birth | | Position held and
length of service* | | Principal occupations during past five years or longer | | Current other
public company or
investment
company
directorships |
| | | |
| David F. Larcker (Born 1950) | | Trustee, since 2009 | | James Irvin Miller Professor of Accounting at the Graduate School of Business, Stanford University, Director of the Corporate Governance Research Initiative and Senior Faculty of The Rock Center for Corporate Governance since 2006. From 2005 to 2008, Professor of Accounting at the Graduate School of Business, Stanford University. Prior thereto, Ernst & Young Professor of Accounting at The Wharton School, University of Pennsylvania from 1985 to 2005. | | N/A |
| | | |
| Olivia S. Mitchell (Born 1953) | | Trustee, since 2006; Nominating and Governance Committee Chair, since 2018 | | International Foundation of Employee Benefit Plans Professor, Wharton School of the University of Pennsylvania since 1993. Director of Wharton’s Pension Research Council and Boettner Center on Pensions & Retirement Research, and Research Associate at the National Bureau of Economic Research. Previously, Cornell University Professor from 1978 to 1993. | | N/A |
| | | |
| Timothy J. Penny (Born 1951) | | Trustee, since 1996; Chairman, since 2018 | | President and Chief Executive Officer of Southern Minnesota Initiative Foundation, a non-profit organization, since 2007. Member of the Board of Trustees of NorthStar Education Finance, Inc., a non-profit organization, since 2007. | | N/A |
| | | |
| James G. Polisson (Born 1959) | | Trustee, since 2018 | | Retired. Chief Marketing Officer, Source (ETF) UK Services, Ltd, from 2015 to 2017. From 2012 to 2015, Principal of The Polisson Group, LLC, a management consulting, corporate advisory and principal investing company. Chief Executive Officer and Managing Director at Russell Investments, Global Exchange Traded Funds from 2010 to 2012. Managing Director of Barclays Global Investors from 1998 to 2010 and Global Chief Marketing Officer for iShares and Barclays Global Investors from 2000 to 2010. Trustee of the San Francisco Mechanics’ Institute, a non-profit organization, from 2013 to 2015. Board member of the Russell Exchange Traded Fund Trust from 2011 to 2012. Director of Barclays Global Investors Holdings Deutschland GmbH from 2006 to 2009. Mr. Polisson is an attorney and has a retired status with the Massachusetts and District of Columbia Bar Associations. | | N/A |
| | | |
| Pamela Wheelock (Born 1959) | | Trustee, since January 2020; previously Trustee from January 2018 to July 2019 | | Board member of the Destination Medical Center Economic Development Agency, Rochester, Minnesota since 2019 and Interim President of the McKnight Foundation since 2020. Acting Commissioner, Minnesota Department of Human Services, July 2019 through September 2019. Human Services Manager (part-time), Minnesota Department of Human Services, October 2019 through December 2019. Chief Operating Officer, Twin Cities Habitat for Humanity from 2017 to 2019. Vice President of University Services, University of Minnesota from 2012 to 2016. Prior thereto, on the Board of Directors, Governance Committee and Finance Committee for the Minnesota Philanthropy Partners (Saint Paul Foundation) from 2012 to 2018, Interim Chief Executive Officer of Blue Cross Blue Shield of Minnesota from 2011 to 2012, Chairman of the Board from 2009 to 2012 and Board Director from 2003 to 2015. Vice President, Leadership and Community Engagement, Bush Foundation, Saint Paul, Minnesota (a private foundation) from 2009 to 2011. Executive Vice President and Chief Financial Officer, Minnesota Sports and Entertainment from 2004 to 2009 and Senior Vice President from 2002 to 2004. Executive Vice President of the Minnesota Wild Foundation from 2004 to 2008. Commissioner of Finance, State of Minnesota, from 1999 to 2002. Currently Board Chair of the Minnesota Wild Foundation since 2010. | | N/A |
| * | Length of service dates reflect the Trustee’s commencement of service with the Trust’s predecessor entities, where applicable. |
18 | Wells Fargo Disciplined International Developed Markets Portfolio
Other information (unaudited)
Officers
| | | | |
Name and year of birth | | Position held and
length of service | | Principal occupations during past five years or longer |
| | |
| Andrew Owen (Born 1960) | | President, since 2017 | | Executive Vice President of Wells Fargo & Company and Head of Affiliated Managers, Wells Fargo Asset Management, since 2014. In addition, Mr. Owen is currently President, Chief Executive Officer and Director of Wells Fargo Funds Management, LLC since 2017. Prior thereto, Executive Vice President responsible for marketing, investments and product development for Wells Fargo Funds Management, LLC, from 2009 to 2014. |
| | |
| Jeremy DePalma1 (Born 1974) | | Treasurer, since 2012 | | Senior Vice President of Wells Fargo Funds Management, LLC since 2009. Senior Vice President of Evergreen Investment Management Company, LLC from 2008 to 2010 and head of the Fund Reporting and Control Team within Fund Administration from 2005 to 2010. |
| | |
| Michelle Rhee (Born 1966) | | Chief Legal Officer, since 2019 | | Secretary of Wells Fargo Funds Management, LLC, Chief Legal Counsel of Wells Fargo Asset Management and Assistant General Counsel of Wells Fargo Bank, N.A. since 2018. Associate General Counsel and Managing Director of Bank of America Corporation from 2004 to 2018. |
| | |
| Catherine Kennedy (Born 1969) | | Secretary, since 2019 | | Vice President of Wells Fargo Funds Management, LLC and Senior Counsel of the Wells Fargo Legal Department since 2010. Vice President and Senior Counsel of Evergreen Investment Management Company, LLC from 1998 to 2010. |
| | |
| Michael H. Whitaker (Born 1967) | | Chief Compliance Officer, since 2016 | | Chief Compliance Officer of Wells Fargo Asset Management since 2016. Senior Vice President and Chief Compliance Officer for Fidelity Investments from 2007 to 2016. |
| | |
| David Berardi (Born 1975) | | Assistant Treasurer, since 2009 | | Vice President of Wells Fargo Funds Management, LLC since 2009. Vice President of Evergreen Investment Management Company, LLC from 2008 to 2010. Manager of Fund Reporting and Control for Evergreen Investment Management Company, LLC from 2004 to 2010. |
| 1 | Jeremy DePalma acts as Treasurer of 82 funds and Assistant Treasurer of 65 funds in the Fund Complex. |
| 2 | The Statement of Additional Information includes additional information about the Trustees and is available, without charge, upon request, by calling 1-800-222-8222 or by visiting the website at wfam.com. |
Wells Fargo Disciplined International Developed Markets Portfolio | 19
Other information (unaudited)
BOARD CONSIDERATION OF INVESTMENT ADVISORY AND SUB-ADVISORY AGREEMENTS:
Wells Fargo Disciplined International Developed Markets Portfolio (formerly, Wells Fargo International Growth Portfolio)
Under the Investment Company Act of 1940 (the “1940 Act”), the Board of Trustees (the “Board”) of Wells Fargo Master Trust (the “Trust”) must determine annually whether to approve the continuation of the Trust’s investment advisory and sub-advisory agreements. In this regard, at a Board meeting held on May 26, 2020 and May 28, 2020 (together, the “Meeting”), the Board, all the members of which have no direct or indirect interest in the investment advisory and sub-advisory agreements and are not “interested persons” of the Trust, as defined in the 1940 Act (the “Independent Trustees”), reviewed and approved for the Wells Fargo Disciplined International Developed Markets Portfolio (formerly, Wells Fargo International Growth Portfolio, the “Portfolio”): an investment advisory agreement (the “Advisory Agreement”) with Wells Fargo Funds Management, LLC (“Funds Management”) and (ii) an investment sub-advisory agreement (the “Sub-Advisory Agreement”) with Artisan Partners Limited Partnership (the “Sub-Adviser”). The Advisory Agreement and the Sub-Advisory Agreement are collectively referred to as the “Advisory Agreements”. The Board noted that it approved replacing the Sub-Adviser with Wells Capital Management Incorporated (“WellsCap”) earlier in the Meeting, and that approval of the Advisory Agreements with the Sub-Adviser shall be for the period until such replacement becomes effective, which is expected to be on or about July 30, 2020.
At the Meeting, the Board considered the factors and reached the conclusions described below relating to the selection of Funds Management and the Sub-Adviser and the approval of the Advisory Agreements. Prior to the Meeting, including at a Board meeting held in April 2020, the Trustees conferred extensively among themselves and with representatives of Funds Management about these matters. Also, the Board has adopted a team-based approach, with each team consisting of a sub-set of Trustees, to assist the full Board in the discharge of its duties in reviewing investment performance and other matters throughout the year. The Independent Trustees were assisted in their evaluation of the Advisory Agreements by independent legal counsel, from whom they received separate legal advice and with whom they met separately.
In providing information to the Board, Funds Management and the Sub-Adviser were guided by a detailed set of requests for information submitted to them by independent legal counsel on behalf of the Independent Trustees at the start of the Board’s annual contract renewal process earlier in 2020. In considering and approving the Advisory Agreements, the Trustees considered the information they believed relevant, including but not limited to the information discussed below. The Board considered not only the specific information presented in connection with the Meeting, but also the knowledge gained over time through interaction with Funds Management and the Sub-Adviser about various topics. In this regard, the Board reviewed reports of Funds Management at each of its quarterly meetings, which included, among other things, portfolio reviews and investment performance reports. In addition, the Board and the teams mentioned above confer with portfolio managers at various times throughout the year. The Board did not identify any particular information or consideration that was all-important or controlling, and each individual Trustee may have attributed different weights to various factors.
After its deliberations, the Board unanimously approved the continuation of the Advisory Agreements, although it noted that the Sub-Adviser is expected to be replaced by WellsCap on or about July 30, 2020, and determined that the compensation payable to Funds Management and the Sub-Adviser under each of the Advisory Agreements was reasonable. The Board considered the approval of the Advisory Agreements for the Portfolio as part of its consideration of agreements for funds across the complex, but its approvals were made on a portfolio-by-portfolio basis. The following summarizes a number of important, but not necessarily all, factors considered by the Board in support of its approvals.
Nature, extent and quality of services
The Board received and considered various information regarding the nature, extent and quality of services provided to the Portfolio by Funds Management and the Sub-Adviser under the Advisory Agreements. This information included a description of the investment advisory services and Portfolio-level administrative services covered by the Advisory Agreement, as well as, among other things, a summary of the background and experience of senior management of Wells Fargo Asset Management (“WFAM”), of which Funds Management is a part, and a summary of investments made in the business of WFAM. The Board also received a description of Funds Management’s and the Sub-Adviser’s business continuity plans and of their approaches to data privacy and cybersecurity, and related testing. The Board also received and reviewed information about Funds Management’s role as administrator of the Portfolio’s liquidity risk management program, Funds Management’s approach to risk management, and Funds Management’s intermediary and vendor oversight program.
The Board also considered the qualifications, background, tenure and responsibilities of each of the portfolio managers primarily responsible for the day-to-day portfolio management of the Portfolio. The Board evaluated the ability of Funds
20 | Wells Fargo Disciplined International Developed Markets Portfolio
Other information (unaudited)
Management and the Sub-Adviser to attract and retain qualified investment professionals, including research, advisory and supervisory personnel. The Board further considered the compliance programs and compliance records of Funds Management and the Sub-Adviser. In addition, the Board took into account the full range of services provided to the Portfolio by Funds Management and its affiliates.
Portfolio investment performance and expenses
The Board considered the investment performance results for the Portfolio over various time periods ended December 31, 2019. The Board also considered more current results for various time periods ended March 31, 2020. The Board considered these results in comparison to the investment performance of funds in a universe that was determined by Broadridge Inc. (“Broadridge”) to be similar to the Portfolio (the “Universe”), and in comparison to the Portfolio’s benchmark index and to other comparative data. Broadridge is an independent provider of investment company data. The Board received a description of the methodology used by Broadridge to select the mutual funds in the performance Universe. The Board noted that the investment performance of the Portfolio was higher than the average investment performance of the Universe for the one-, three- and ten-year periods ended December 31, 2019, and lower than the average investment performance of the Universe for the five-year period ended December 31, 2019. The Board noted that the investment performance of the Portfolio was higher than the average investment performance of the Universe for the one-, three- and ten-year periods ended March 31, 2020, and lower than the average investment performance of the Universe for the five-year period ended March 31, 2020. The Board also noted that the investment performance of the Portfolio was higher than or in range of its benchmark index, the MSCI EAFE Index (Net), for all periods ended December 31, 2019. The Board also noted that the investment performance of the Portfolio was higher than its benchmark index, the MSCI EAFE Index (Net), for all periods ended March 31, 2020.
The Board received and considered information regarding the fee rates that are payable to Funds Management for investment advisory services (as discussed below), which are the only fees charged at the Portfolio level, relative to corresponding class-specific expense groups that were determined by Broadridge to be similar to the Portfolio (the “Groups”). The Board received a description of the methodology used by Broadridge to select the mutual funds in the expense Groups and an explanation of how funds comprising expense groups and their expense ratios may vary from year-to-year.
The Board took into account the Portfolio’s investment performance and expense information provided to it among the factors considered in deciding to re-approve the Advisory Agreements.
Investment advisory and sub-advisory fee rates
The Board reviewed and considered the contractual fee rates payable by the Portfolio to Funds Management under the Advisory Agreement (the “Advisory Agreement Rate ”). The Board also reviewed and considered the contractual investment sub-advisory fee rates that are payable by Funds Management to the Sub-Adviser for investment sub-advisory services.
The Board reviewed a comparison of the Advisory Agreement Rate of the Portfolio with those of other funds in the Portfolio’s expense Group at a common asset level. The Board noted that the Portfolio’s Advisory Agreement Rate was equal to the median rate for the Portfolio’s expense Groups.
The Board also received and considered information about the portion of the total advisory fee that was retained by Funds Management after payment of the fee to the Sub-Adviser for sub-advisory services. The Board considered this amount in comparison to the median amount retained by advisers to funds in a sub-advised expense universe that was determined by Broadridge to be similar to the Portfolio. In assessing the reasonableness of this amount, the Board received and evaluated information about the nature and extent of responsibilities retained and risks assumed by Funds Management and not delegated to or assumed by the Sub-Adviser, and about Funds Management’s on-going oversight services. The Board also considered that the sub-advisory fees paid to the Sub-Adviser had been negotiated by Funds Management on an arm’s-length basis.
The Board also received and considered information about the nature and extent of services offered and fee rates charged by Funds Management and the Sub-Adviser to other types of clients with investment strategies similar to those of the Portfolio. In this regard, the Board received information about the significantly greater scope of services, and compliance, reporting and other legal burdens and risks of managing proprietary mutual funds compared with those associated with managing assets of other types of clients, including third-party sub-advised fund clients and non-mutual fund clients such as institutional separate accounts.
Based on its consideration of the factors and information it deemed relevant, including those described here, the Board determined that the compensation payable to Funds Management under the Advisory Agreement and to the Sub-Adviser under the Sub-Advisory Agreement was reasonable.
Wells Fargo Disciplined International Developed Markets Portfolio | 21
Other information (unaudited)
Profitability
The Board received and considered information concerning the profitability of Funds Management, as well as the profitability of both WFAM and Wells Fargo & Co. (“Wells Fargo”) from providing services to the fund family as a whole.
Funds Management reported on the methodologies and estimates used in calculating profitability, including a description of the methodology used to allocate certain expenses. Among other things, the Board noted that the levels of profitability reported on a fund-by-fund basis varied widely, depending on factors such as the size, type and age of fund. The Board did not consider profitability with respect to the Sub-Adviser, as the sub-advisory fees paid to the Sub-Adviser had been negotiated by Funds Management on an arm’s-length basis.
Based on its review, the Board did not deem the profits reported by Funds Management, WFAM or Wells Fargo from services provided to the Portfolio to be at a level that would prevent it from approving the continuation of the Advisory Agreements.
Economies of scale
The Board received and considered information about the potential for Funds Management to experience economies of scale in the provision of management services to the Portfolio, the difficulties of calculating economies of scale at an individual fund level, and the extent to which potential scale benefits are shared with shareholders. The Board noted the existence of breakpoints in the Portfolio’s advisory fee structure, which operate generally to reduce the Portfolio’s expense ratios as the Portfolio grows in size, and the size of the Portfolio in relation to such breakpoints. The Board considered that in addition to management fee breakpoints, Funds Management shares potential economies of scale from its management business in a variety of ways, including through fee waiver and expense reimbursement arrangements, services that benefit shareholders, competitive management fee rates set at the outset without regard to breakpoints, and investments in the business intended to enhance services available to shareholders.
The Board concluded that Funds Management’s arrangements with respect to the Portfolio, including contractual breakpoints, constituted a reasonable approach to sharing potential economies of scale with the Portfolio and its shareholders.
Other benefits to Funds Management and the Sub-Adviser
The Board received and considered information regarding potential “fall-out” or ancillary benefits received by Funds Management, the Sub-Adviser and their affiliates as a result of their relationships with the Portfolio. Ancillary benefits could include, among others, benefits directly attributable to other relationships with the Portfolio and benefits potentially derived from an increase in Funds Management’s and the Sub-Adviser’s business as a result of their relationships with the Portfolio. The Board noted that various affiliates of Funds Management may receive distribution-related fees, shareholder servicing payments and sub-transfer agency fees in respect of shares sold or held through them and services provided.
The Board also reviewed information about soft dollar credits earned and utilized by the Sub-Adviser, fees earned by Funds Management and its affiliate from managing a private investment vehicle for the fund family’s securities lending collateral, and commissions earned by an affiliated broker from portfolio transactions.
Based on its consideration of the factors and information it deemed relevant, including those described here, the Board did not find that any ancillary benefits received by Funds Management, the Sub-Adviser and their affiliates were unreasonable.
Conclusion
At the Meeting, after considering the above-described factors and based on its deliberations and its evaluation of the information described above, the Board unanimously approved the continuation of the Advisory Agreements and determined that the compensation payable to Funds Management and the Sub-Adviser under each of the Advisory Agreements was reasonable.
22 | Wells Fargo Disciplined International Developed Markets Portfolio
Other information (unaudited)
LIQUIDITY RISK MANAGEMENT PROGRAM
In accordance with Rule 22e-4 under the Investment Company Act of 1940, as amended (the “Liquidity Rule”), Wells Fargo Master Trust (the “Trust”) has adopted and implemented a liquidity risk management program (the “Program”) on behalf of each of its series, including the Portfolio, which is reasonably designed to assess and manage the Portfolio’s liquidity risk. “Liquidity risk” is defined as the risk that the Portfolio is unable to meet redemption requests without significantly diluting remaining investors’ interests in the Portfolio. The Trust’s Board of Trustees (the “Board”) previously approved the designation of Wells Fargo Funds Management, LLC (“Funds Management”), the Portfolio’s investment adviser, as the administrator of the Program, and Funds Management has established a Liquidity Risk Management Council composed of personnel from multiple departments within Funds Management and its affiliates to assist Funds Management in the implementation and on-going administration of the Program.
The Program is comprised of various components designed to support the assessment and/or management of liquidity risk, including: (1) the periodic assessment (no less frequently than annually) of certain factors that influence the Portfolio’s liquidity risk; (2) the periodic classification (no less frequently than monthly) of the Portfolio’s investments into one of four liquidity categories that reflect an estimate of their liquidity under current market conditions; (3) a 15% limit on the acquisition of “illiquid investments” (as defined under the Liquidity Rule); (4) to the extent the Portfolio does not invest primarily in “highly liquid investments” (as defined under the Liquidity Rule), the determination of a minimum percentage of the Portfolio’s assets that generally will be invested in highly liquid investments (an “HLIM”); (5) if the Portfolio has established an HLIM, the periodic review (no less frequently than annually) of the HLIM and the adoption of policies and procedures for responding to a shortfall of the Portfolio’s “highly liquid investments” below its HLIM; and (6) periodic reporting to the Board.
At a meeting of the Board held on May 26 and 28, 2020, the Board received a written report (the “Report”) from Funds Management that addressed the operation of the Program and assessed its adequacy and effectiveness of implementation. The Report covered the initial period from December 1, 2018 through December 31, 2019 (the “Reporting Period”). No significant liquidity events impacting the Portfolio were noted in the Report. There were no material changes to the Program during the Reporting Period. The Report concluded that the Program is operating effectively to assess and manage the Portfolio’s liquidity risk, and that the Program has been and continues to be adequately and effectively implemented to monitor and, as applicable, respond to the Portfolio’s liquidity developments.
Wells Fargo Disciplined International Developed Markets Portfolio | 23
This page is intentionally left blank.

For more information
More information about Wells Fargo Funds is available free upon request. To obtain literature, please write, visit the Fund’s website, or call:
Wells Fargo Funds
P.O. Box 219967
Kansas City, MO 64121-9967
Website: wfam.com
Individual investors: 1-800-222-8222
Retail investment professionals: 1-888-877-9275
Institutional investment professionals: 1-866-765-0778

This report and the financial statements contained herein are submitted for the general information of the shareholders of the Fund. If this report is used for promotional purposes, distribution of the report must be accompanied or preceded by a current prospectus. Before investing, please consider the investment objectives, risks, charges, and expenses of the investment. For a current prospectus and, if available, a summary prospectus, containing this information, call 1-800-222-8222 or visit the Fund’s website at wfam.com. Read the prospectus carefully before you invest or send money.
Wells Fargo Asset Management (WFAM) is the trade name for certain investment advisory/management firms owned by Wells Fargo & Company. These firms include but are not limited to Wells Capital Management Incorporated and Wells Fargo Funds Management, LLC. Certain products managed by WFAM entities are distributed by Wells Fargo Funds Distributor, LLC (a broker-dealer and Member FINRA).
This material is for general informational and educational purposes only and is NOT intended to provide investment advice or a recommendation of any kind—including a recommendation for any specific investment, strategy, or plan.
INVESTMENT PRODUCTS: NOT FDIC INSURED ◾ NO BANK GUARANTEE ◾ MAY LOSE VALUE
© 2020 Wells Fargo & Company. All rights reserved.
Annual Report
May 31, 2020
Wells Fargo C&B Large Cap Value Fund
Beginning on January 1, 2021, as permitted by new regulations adopted by the Securities and Exchange Commission, paper copies of the Wells Fargo Funds’ annual and semi-annual shareholder reports issued after this date will no longer be sent by mail, unless you specifically request paper copies of the reports. Instead, the reports will be made available on the Funds’ website, and you will be notified by mail each time a report is posted and provided with a website address to access the report.
If you already elected to receive shareholder reports electronically, you will not be affected by this change and you need not take any action. You may elect to receive shareholder reports and other communications from the Fund electronically at any time by contacting your financial intermediary (such as a broker-dealer or bank) or, if you are a direct investor, by calling 1-800-222-8222 or by enrolling at wellsfargo.com/advantagedelivery.
You may elect to receive all future reports in paper free of charge. If you invest through a financial intermediary, you can contact your financial intermediary to request that you continue to receive paper copies of your shareholder reports; if you invest directly with the Fund, you can call 1-800-222-8222. Your election to receive reports in paper will apply to all Wells Fargo Funds held in your account with your financial intermediary or, if you are a direct investor, to all Wells Fargo Funds that you hold.
|
|
|
Reduce clutter. Save trees. |
Sign up for electronic delivery of prospectuses and shareholder reports at wellsfargo.com/advantagedelivery |
The views expressed and any forward-looking statements are as of May 31, 2020, unless otherwise noted, and are those of the Fund managers and/or Wells Fargo Asset Management. Discussions of individual securities, or the markets generally, or any Wells Fargo Fund are not intended as individual recommendations. Future events or results may vary significantly from those expressed in any forward-looking statements. The views expressed are subject to change at any time in response to changing circumstances in the market. Wells Fargo Asset Management and the Fund disclaim any obligation to publicly update or revise any views expressed or forward-looking statements.
INVESTMENT PRODUCTS: NOT FDIC INSURED ◾ NO BANK GUARANTEE ◾ MAY LOSE VALUE
Wells Fargo C&B Large Cap Value Fund | 1
Letter to shareholders (unaudited)

Andrew Owen
President
Wells Fargo Funds
Dear Shareholder:
We are pleased to offer you this annual report for the Wells Fargo C&B Large Cap Value Fund for the 12-month period that ended May 31, 2020. Global stock markets saw earlier gains erased in February and March as governments around the world took unprecedented measures to stop the spread of the coronavirus at the expense of short-term economic output. However, markets rebounded in April and May to offset much of the losses as central banks attempted to bolster capital markets and confidence. Fixed-income markets generally performed better, achieving widespread gains.
For the 12-month period, fixed-income securities generally had positive total returns while non-U.S. equities had broad losses and U.S. stocks performed strongly despite sharp volatility since late February. For the period, U.S. stocks, based on the S&P 500 Index,1 gained 12.84%. International stocks, as measured by the MSCI ACWI ex USA Index (Net),2 returned -3.43%, while the MSCI EM Index (Net)3 trailed slightly, with a -4.39% return. For bond investors, the Bloomberg Barclays U.S. Aggregate Bond Index4 gained a robust 9.42%, the Bloomberg Barclays Global Aggregate ex-USD Index5 returned 2.67%, and the Bloomberg Barclays Municipal Bond Index6 gained a more modest 3.98%, while the ICE BofA U.S. High Yield Index7 had a slight gain of 0.35%.
The fiscal year began on a positive note.
The 12-month period began with U.S. equity market advances during June and July 2019. The gains, primarily driven by geopolitical and monetary policy events, pushed equity markets to new highs. European Central Bank (ECB) President Mario Draghi indicated the bank was ready to cut rates or buy more assets to prop up inflation if needed. President Trump backed off of earlier tariff threats against Mexico and China. In the U.S., the Federal Reserve (Fed) implemented a 0.25% federal funds rate cut in July.
Later in July, the U.S. reversed course and threatened to impose higher tariffs on China’s exports after talks failed. China responded with tariff threats of its own and devalued the renminbi, roiling global markets. Major U.S. stock market indices closed July with the worst weekly results of the year. Bond prices gained as Treasury yields fell to multiyear lows, and the yield curve inverted at multiple points along the 30-year arc, with shorter-term yields higher than longer-term.
In August, U.S.-China trade tensions continued with no signs of compromise. Evidence of a continued global economic slowdown mounted, and central banks in China, New Zealand, and Thailand cut interest rates. Industrial and manufacturing data declined in China, Canada, Japan, and Germany. Adding to global uncertainty, Italy’s prime minister resigned,
| 1 | The S&P 500 Index consists of 500 stocks chosen for market size, liquidity, and industry group representation. It is a market-value-weighted index with each stock’s weight in the index proportionate to its market value. You cannot invest directly in an index. |
| 2 | The Morgan Stanley Capital International (MSCI) All Country World Index (ACWI) ex USA Index (Net) is a free-float-adjusted market-capitalization-weighted index that is designed to measure the equity market performance of developed and emerging markets, excluding the United States. Source: MSCI. MSCI makes no express or implied warranties or representations and shall have no liability whatsoever with respect to any MSCI data contained herein. The MSCI data may not be further redistributed or used as a basis for other indices or any securities or financial products. This report is not approved, reviewed, or produced by MSCI. You cannot invest directly in an index. |
| 3 | The MSCI Emerging Markets (EM) Index (Net) is a free-float-adjusted market-capitalization-weighted index that is designed to measure equity market performance of emerging markets. You cannot invest directly in an index. |
| 4 | The Bloomberg Barclays U.S. Aggregate Bond Index is a broad-based benchmark that measures the investment-grade, U.S. dollar-denominated, fixed-rate taxable bond market, including Treasuries, government-related and corporate securities, mortgage-backed securities (agency fixed-rate and hybrid adjustable-rate mortgage pass-throughs), asset-backed securities, and commercial mortgage-backed securities. You cannot invest directly in an index. |
| 5 | The Bloomberg Barclays Global Aggregate ex-USD Index is an unmanaged index that provides a broad-based measure of the global investment-grade fixed-income markets excluding the U.S. dollar-denominated debt market. You cannot invest directly in an index. |
| 6 | The Bloomberg Barclays Municipal Bond Index is an unmanaged index composed of long-term tax-exempt bonds with a minimum credit rating of Baa. You cannot invest directly in an index. |
| 7 | The ICE BofA U.S. High Yield Index is a market-capitalization-weighted index of domestic and Yankee high-yield bonds. The index tracks the performance of high-yield securities traded in the U.S. bond market. You cannot invest directly in an index. Copyright 2020. ICE Data Indices, LLC. All rights reserved. |
2 | Wells Fargo C&B Large Cap Value Fund
Letter to shareholders (unaudited)
many feared a crackdown in Hong Kong as protestors sustained their calls for reform, and Prime Minister Boris Johnson planned to suspend the British Parliament as Brexit’s deadline neared.
In the U.S., the Fed cut interest rates a second time in September. U.S. manufacturing data disappointed investors. The U.S. Congress announced it would pursue an impeachment investigation of President Trump. Meanwhile, the Brexit impasse showed no signs of resolution. Officials in China said that hitting the country’s economic growth goals for the year would be difficult considering the weight of tariffs and trade restrictions. Although the S&P 500 Index finished the third quarter with the best year-to-date returns in more than 20 years, concerns about future returns remained.
The fourth quarter of 2019 started on a strong note, with U.S.-China trade tensions relaxing in October along with renewed optimism for a U.K. Brexit deal and positive macroeconomic data. The initial estimate of U.S. third-quarter gross domestic product growth was a resilient 1.9% annualized rate, while the U.S. unemployment rate fell to a 50-year low of 3.5% in September. However, despite resilience among U.S. consumers, business confidence declined and manufacturing activity contracted. Concerned with a potential economic slowdown, the Fed lowered interest rates another quarter point in late October—its third rate cut in four months. This helped push the S&P 500 Index to a new all-time high while emerging market equities rallied and global bonds declined overall, reflecting a broad pickup in risk appetite.
Equity markets continued to rally in November despite ongoing geopolitical risks. Hopes for a U.S.-China trade deal buoyed investor confidence. U.S. business sentiment improved slightly, and manufacturing and services activity picked up. While consumer confidence and purchasing manager activity rose in the eurozone, China reported weakening manufacturing and consumer data. Bond yields rose marginally, leading to slightly negative returns for global government and investment-grade corporate bonds.
Financial markets ended 2019 with a boost from the U.S. and China accord on a Phase One trade deal. That, along with the landslide win by the pro-Brexit U.K. Conservative Party in a national election and ongoing central bank support, gave investors greater confidence. U.S. economic indicators were generally positive, with the exception of manufacturing activity and business confidence. Consumer confidence was resilient, fed by a robust labor market, tame inflation, and lower interest rates, which boosted housing affordability and stimulated homebuyer activity. The impeachment of U.S. President Donald Trump had little impact on markets. Meanwhile, slowing Chinese economic activity, partly attributable to the trade war, led to further government stimulus at year-end through lower reserve ratios, allowing banks to lend more money.
The year-end rally continued in early January 2020. However, capital market volatility picked up sharply in late January on concerns over the potential impact of the coronavirus on the global economy and stock markets. With sentiment somewhat souring, perceived safe havens did well in January. The U.S. dollar and Japanese yen both rose, and government bonds outperformed equities. While the S&P 500 Index held its ground, emerging market equities tumbled, including those in Asia.
In February, the coronavirus became the major market focus. Fears of the virus’s impact on global growth led to expectations of increased global central bank monetary policy support. That led the 10-year U.S. Treasury yield to fall to an all-time low of 1.1% by the end of the month. Although equity markets initially shrugged off concerns about the outbreak, focusing instead on strong fourth-quarter earnings and improving business confidence in January, market sentiment turned sharply lower toward month-end and the S&P 500 Index lost 8.2% for the month. Oil prices tumbled as Russia and the Organization of the Petroleum Exporting Countries compounded a major decline in oil demand with a brutal price war, partly aimed at dissuading further U.S. shale production. As a result, the price of West Texas Intermediate crude oil fell 13% in February.
Wells Fargo C&B Large Cap Value Fund | 3
Letter to shareholders (unaudited)
“The global spread of the coronavirus led country after country to clamp down on social and business-related activity in order to contain the virus from causing even greater devastation and overwhelming health care systems.”
“Markets rebounded strongly in April after the earlier extreme volatility, with the S&P 500 Index gaining 12.8% for the month and the MSCI ACWI ex USA Index (Net) returning 7.6%.”
|
|
|
For further information about your Fund, contact your investment professional, visit our website at wfam.com, or call us directly at 1-800-222-8222. |
The global spread of the coronavirus led country after country to clamp down on social and business-related activity in order to contain the virus from causing even greater devastation and overwhelming health care systems. This abrupt stoppage of economic activity led to the sharp deceleration of global output, sending economies into a deep contraction. Central bank responses were swift, as they slashed interest rates and expanded quantitative easing programs to restore liquidity and confidence to the markets. In the U.S., the Fed introduced several new lending programs, funding investment-grade bonds, money market mutual funds, and commercial paper while purchasing Treasuries, mortgage-backed securities, and overnight repurchase agreements. Meanwhile, stock markets tumbled quickly into a bear market, ending the longest bull stock market in U.S. history.
Markets rebounded strongly in April after the earlier extreme volatility, with the S&P 500 Index gaining 12.8% for the month and the MSCI ACWI ex USA Index (Net) returning 7.6%. The rebound was fueled by unprecedented government and central bank stimulus measures taken to buffer the economic damage created by mass shutdowns enacted in order to contain the virus’s spread. The U.S. economy contracted by an annualized 4.8% pace in the first quarter, with 30 million new unemployment insurance claims in six weeks. In the eurozone, first-quarter real gross domestic product (GDP) shrank 3.8%, with the composite April Flash Purchasing Managers’ Index, a monthly survey of purchasing managers, falling to an all-time low of 13.5. The ECB expanded its quantitative easing to include the purchase of additional government bonds of countries with the greatest virus-related need, including Italy and Spain. China’s first-quarter GDP fell by 6.8% year over year. However, retail sales, production, and investment showed signs of recovery. Extreme oil price volatility continued as global supply far exceeded demand.
In May, the equity market rebound continued, with the S&P 500 Index climbing a further 4.8%. European and Japanese stock markets also had monthly gains. Investors regained confidence on reports of early signs of success in human trials of a coronavirus vaccine. Growth stocks continued to outperform value stocks while returns on global government bonds were generally flat. In the U.S., a gap grew between the stock market rebound and devastating economic data points, including an April unemployment rate of 14.7%, the highest level since World War II. Purchasing managers’ indices continued to reflect weakening activity in May in both the manufacturing and services sectors. U.S. corporate earnings reports indicated a 14% year-over-year contraction in earnings from the first quarter of 2019. However, high demand for technology, driven by remote activity, helped maintain robust information technology sector earnings, which helped drive powerful well-known technology stocks higher.
Don’t let short-term uncertainty derail long-term investment goals.
Periods of investment uncertainty can present challenges, but experience has taught us that maintaining long-term investment goals can be an effective way to plan for the future. To help you create a sound strategy based on your personal goals and risk tolerance, Wells Fargo Funds offers more than 100 mutual funds spanning a wide range of asset classes and investment styles. Although diversification cannot guarantee an investment profit or prevent losses, we believe it can be an effective way to manage investment risk and potentially smooth out overall portfolio performance. We encourage investors to know their investments and to understand that appropriate levels of risk-taking may unlock opportunities.
Thank you for choosing to invest with Wells Fargo Funds. We appreciate your confidence in us and remain committed to helping you meet your financial needs.
Sincerely,

Andrew Owen
President
Wells Fargo Funds
4 | Wells Fargo C&B Large Cap Value Fund
This page is intentionally left blank.
Performance highlights (unaudited)
Investment objective
The Fund seeks maximum long-term total return (current income and capital appreciation), consistent with minimizing risk to principal.
Manager
Wells Fargo Funds Management, LLC
Subadviser for the affiliated master portfolio1
Cooke & Bieler, L.P.
Portfolio managers
Andrew B. Armstrong, CFA®‡
Wesley Lim, CFA®‡ *
Steve Lyons, CFA®‡
Michael M. Meyer, CFA®‡
Edward W. O’Connor, CFA®‡
R. James O’Neil, CFA®‡
Mehul Trivedi, CFA®‡
William Weber, CFA®‡
Average annual total returns (%) as of May 31, 2020
| | | | | | | | | | | | | | | | | | | | | | | | | | | | | | | | | | |
| | | | |
| | | | | Including sales charge | | | Excluding sales charge | | | Expense ratios2 (%) | |
| | | | | | | | | |
| | | Inception date | | 1 year | | | 5 year | | | 10 year | | | 1 year | | | 5 year | | | 10 year | | | Gross | | | Net3 | |
| | | | | | | | | | |
| Class A (CBEAX) | | 7-26-2004 | | | -9.13 | | | | 3.00 | | | | 8.52 | | | | -3.61 | | | | 4.24 | | | | 9.16 | | | | 1.23 | | | | 1.08 | |
| | | | | | | | | | |
| Class C (CBECX) | | 7-26-2004 | | | -5.41 | | | | 3.44 | | | | 8.34 | | | | -4.41 | | | | 3.44 | | | | 8.34 | | | | 1.98 | | | | 1.83 | |
| | | | | | | | | | |
| Class R6 (CBEJX)4 | | 10-31-2016 | | | – | | | | – | | | | – | | | | -3.25 | | | | 4.64 | | | | 9.55 | | | | 0.80 | | | | 0.65 | |
| | | | | | | | | | |
| Administrator Class (CBLLX) | | 7-26-2004 | | | – | | | | – | | | | – | | | | -3.56 | | | | 4.36 | | | | 9.33 | | | | 1.15 | | | | 1.00 | |
| | | | | | | | | | |
| Institutional Class (CBLSX) | | 7-26-2004 | | | – | | | | – | | | | – | | | | -3.33 | | | | 4.60 | | | | 9.59 | | | | 0.90 | | | | 0.75 | |
| | | | | | | | | | |
| Russell 1000® Value Index5 | | – | | | – | | | | – | | | | – | | | | -1.64 | | | | 4.36 | | | | 9.85 | | | | – | | | | – | |
Figures quoted represent past performance, which is no guarantee of future results, and do not reflect taxes that a shareholder may pay on an investment in a fund. Investment return and principal value of an investment will fluctuate so that an investor’s shares, when redeemed, may be worth more or less than their original cost. Performance shown without sales charges would be lower if sales charges were reflected. Current performance may be lower or higher than the performance data quoted, which assumes the reinvestment of dividends and capital gains. Current month-end performance is available on the Fund’s website, wfam.com.
Index returns do not include transaction costs associated with buying and selling securities, any mutual fund fees or expenses, or any taxes. It is not possible to invest directly in an index.
For Class A shares, the maximum front-end sales charge is 5.75%. For Class C shares, the maximum contingent deferred sales charge is 1.00%. Performance including a contingent deferred sales charge assumes the sales charge for the corresponding time period. Class R6, Administrator Class, and Institutional Class shares are sold without a front-end sales charge or contingent deferred sales charge.
Stock values fluctuate in response to the activities of individual companies and general market and economic conditions. Consult the Fund’s prospectus for additional information on these and other risks.
Please see footnotes on page 7.
6 | Wells Fargo C&B Large Cap Value Fund
Performance highlights (unaudited)
|
|
| Growth of $10,000 investment as of May 31, 20206 |
|
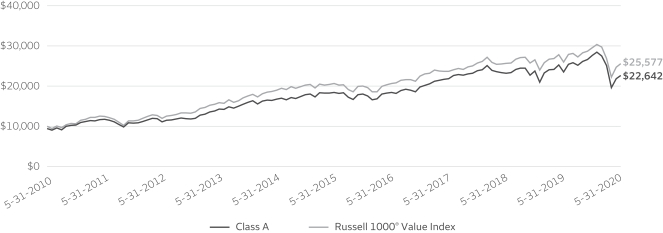
|
| ‡ | CFA® and Chartered Financial Analyst® are trademarks owned by CFA Institute. |
| * | Mr. Lim became a portfolio manager of the Fund on August 1, 2019. |
| 1 | The Fund is a feeder fund in a master-feeder structure that invests substantially all of its assets in a single affiliated master portfolio of the Wells Fargo Master Trust with a substantially identical investment objective and substantially similar investment strategies. References to the investment activities of the Fund are intended to refer to the investment activities of the affiliated master portfolio in which it invests. |
| 2 | Reflects the expense ratios as stated in the most recent prospectuses. The expense ratios shown are subject to change and may differ from the annualized expense ratios shown in the financial highlights of this report. |
| 3 | The manager has contractually committed through September 30, 2020, to waive fees and/or reimburse expenses to the extent necessary to cap total annual fund operating expenses after fee waivers at 1.08% for Class A, 1.83% for Class C, 0.65% for Class R6, 1.00% for Administrator Class, and 0.75% for Institutional Class. Brokerage commissions, stamp duty fees, interest, taxes, acquired fund fees and expenses (if any) from funds in which the affiliated master portfolio invest and from money market funds, and extraordinary expenses are excluded from the expense caps. Net expenses from the affiliated master portfolio are included in the expense caps. Prior to or after the commitment expiration date, the caps may be increased or the commitment to maintain the caps may be terminated only with the approval of the Board of Trustees. Without these caps, the Fund’s returns would have been lower. The expense ratio paid by an investor is the net expense ratio (the total annual fund operating expenses after fee waivers) as stated in the prospectuses. |
| 4 | Historical performance shown for the Class R6 shares prior to their inception reflects the performance of the Institutional Class shares adjusted to reflect the higher expenses applicable to the Class R6 shares. If these expenses had been included, returns for the Class R6 shares would be higher. |
| 5 | The Russell 1000® Value Index measures the performance of those Russell 1000 companies with lower price/book ratios and lower forecasted growth values. You cannot invest directly in an index. |
| 6 | The chart compares the performance of Class A shares for the most recent ten years with the Russell 1000® Value Index. The chart assumes a hypothetical $10,000 investment in Class A shares and reflects all operating expenses and assumes the maximum initial sales charge of 5.75%. |
| 7 | The ten largest holdings, excluding cash, cash equivalents and any money market funds, are calculated based on the value of the securities of the affiliated master portfolio allocable to the Fund divided by the total net assets of the Fund. Holdings are subject to change and may have changed since the date specified. |
| 8 | Amounts represent the sector allocation of the affiliated master portfolio which are calculated based on the total long-term investments of the affiliated master portfolio. These amounts are subject to change and may have changed since the date specified. |
Wells Fargo C&B Large Cap Value Fund | 7
Performance highlights (unaudited)
MANAGER’S DISCUSSION
Fund highlights
| ∎ | | The Fund underperformed its benchmark, the Russell 1000® Value Index, for the 12-month period that ended May 31, 2020. |
| ∎ | | Stock selection in consumer discretionary and information technology (IT) as well as an overweight in financials detracted from relative performance. |
| ∎ | | Stock selection in financials and materials and an underweight position in energy were key contributors to relative performance. |
Volatility spiked in 2020 after a respite last calendar year.
After a very strong 2019, the scale and speed of the first quarter’s equity market rout were unprecedented, marked by the fastest bear market descent in U.S. history. The wholesale sell-off was staggering and unforeseen, but with no historical analog for the unfolding coronavirus pandemic and economic landscape, it was in many respects understandable. Volatility spiked meaningfully following a respite in 2019. Treasury yields plunged, growth again outperformed value, and larger-capitalization issues beat their smaller counterparts. Against this backdrop, the Russell 1000® Value Index had its worst quarterly result since inception. Performance was broadly negative across index constituents, ranging from bad in the utilities and consumer staples sectors to atrocious in energy, where freefalling demand converged with free-flowing supply. April and May showed some rebounds in the stock market, but unemployment and uncertainty are still highly elevated, making it difficult to ascertain when the economy may truly bounce back.
| | | | |
|
| Ten largest holdings (%) as of May 31, 20207 | |
| | |
Arrow Electronics Incorporated | | | 3.46 | |
| | |
UnitedHealth Group Incorporated | | | 3.10 | |
| | |
AerCap Holdings NV | | | 3.08 | |
| | |
Chubb Limited | | | 2.97 | |
| | |
Johnson & Johnson | | | 2.88 | |
| | |
TE Connectivity Limited | | | 2.86 | |
| | |
State Street Corporation | | | 2.84 | |
| | |
The Charles Schwab Corporation | | | 2.82 | |
| | |
Colfax Corporation | | | 2.75 | |
| | |
Brookfield Asset Management Incorporated Class A | | | 2.72 | |
We found a variety of compelling opportunities.
We continue to find compelling opportunities for the Fund as market disruptions create pockets of valuation weakness despite strong fundamentals. We initiated positions across multiple industries, including three financial companies (Alleghany Corporation, Charles Schwab Corporation, and U.S. Bancorp), two industrials companies (Hexcel Corporation and Woodward, Incorporated), one health care company (HCA Healthcare), and video game developer (Activision Blizzard).
Making room for these holdings, we eliminated positions across multiple sectors, including two information
technology companies (Alliance Data Systems and Applied Materials), two health care companies (Cardinal Health and Allergan), Carnival Corporation within the consumer discretionary sector, Crown Holdings in materials, consumer staples firm Diageo, and World Fuel within energy.
Main detractors were in consumer discretionary.
The five largest detractors to the Fund were balanced across multiple sectors, though most relative underperformance came from consumer discretionary holdings. Carnival (CCL), a cruise operator, was the largest detractor. CCL severely underperformed as the cruise industry was among the hardest hit by the coronavirus pandemic, and we sold the stock during the period. Gildan (GIL), a basic apparel manufacturer, was the second-largest detractor. GIL saw an industry-wide pullback in end-user demand that has deteriorated further due to the coronavirus. Synchrony Financial (SYF), a private-label credit card provider, was the third-largest detractor due to concerns that private label cards may be under stress due to the economic environment caused by the coronavirus. Hexcel and Omnicom Group were the fourth and fifth largest detractors, respectively. From a positioning standpoint, the Fund’s overweight to financials and underweight to consumer staples and utilities were headwinds.
Please see footnotes on page 7.
8 | Wells Fargo C&B Large Cap Value Fund
Performance highlights (unaudited)
|
|
| Sector allocation as of May 31, 20208 |
|
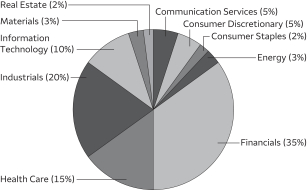 |
Top contributors were led by Colfax and Allergan.
Colfax, an acquisitive conglomerate with strong welding and orthopedic franchises, was the largest contributor for the period. A 2018 detractor, the company recovered significantly in 2019 and beyond due to strong fundamental performance and successful integration of a recent acquisition. Allergan (AGN), a manufacturer of specialty pharmaceuticals, was the second-largest contributor. AGN was eliminated prior to the market’s coronavirus-related decline, locking in gains from the company’s pending sale to AbbVie. Activision Blizzard (ATVI), a video game developer, was the third-largest contributor. With the industry having largely transitioned from physical boxed copies to digital
game downloads and in-game microtransactions, ATVI was barely scathed by the coronavirus. Intercontinental Exchange and UnitedHealth Group were the fourth and fifth largest contributors, respectively. From a positioning standpoint, the Fund benefited significantly from its underweight to energy and also from a slight overweight to IT and underweight to real estate.
Coronavirus has created uncertain expectations.
Across the globe, the coronavirus pandemic has upended expectations of all types—personal, political, social, and economic—in an astoundingly short time. Government attempts to slow the spread of the virus have resulted in an unprecedented halt to economic activity, countered in part by equally unprecedented fiscal and monetary stimulus actions. What happens next will depend heavily on how quickly the disease is contained and vaccines or other effective therapies are developed. As long as the range of possible outcomes for both the disease and its economic impact remains wide, markets are likely to remain extremely volatile. However, now is not a time to reflexively seek safety or to rush blindly to call a bottom in the market. Now is the time for careful, disciplined analysis to uncover opportunities in the turmoil.
Please see footnotes on page 7.
Wells Fargo C&B Large Cap Value Fund | 9
Fund expenses (unaudited)
As a shareholder of the Fund, you incur two types of costs: (1) transaction costs, including sales charges (loads) on purchase payments and contingent deferred sales charges (if any) on redemptions and (2) ongoing costs, including management fees, distribution (12b-1) and/or shareholder servicing fees, and other Fund expenses. This example is intended to help you understand your ongoing costs (in dollars) of investing in the Fund and to compare these costs with the ongoing costs of investing in other mutual funds.
The example is based on an investment of $1,000 invested at the beginning of the six-month period and held for the entire period from December 1, 2019 to May 31, 2020.
Actual expenses
The “Actual” line of the table below provides information about actual account values and actual expenses. You may use the information in this line, together with the amount you invested, to estimate the expenses that you paid over the period. Simply divide your account value by $1,000 (for example, an $8,600 account value divided by $1,000 = 8.6), then multiply the result by the number in the “Actual” line under the heading entitled “Expenses paid during period” for your applicable class of shares to estimate the expenses you paid on your account during this period.
Hypothetical example for comparison purposes
The “Hypothetical” line of the table below provides information about hypothetical account values and hypothetical expenses based on the Fund’s actual expense ratio and an assumed rate of return of 5% per year before expenses, which is not the Fund’s actual return. The hypothetical account values and expenses may not be used to estimate the actual ending account balance or expenses you paid for the period. You may use this information to compare the ongoing costs of investing in the Fund and other funds. To do so, compare this 5% hypothetical example with the 5% hypothetical examples that appear in the shareholder reports of the other funds.
Please note that the expenses shown in the table are meant to highlight your ongoing costs only and do not reflect any transactional costs, such as sales charges (loads) and contingent deferred sales charges. Therefore, the “Hypothetical” line of the table is useful in comparing ongoing costs only and will not help you determine the relative total costs of owning different funds. In addition, if these transactional costs were included, your costs would have been higher.
| | | | | | | | | | | | | | | | |
| | | Beginning
account value
12-1-2019 | | | Ending
account value
5-31-2020 | | | Expenses
paid during
the period1,2 | | | Annualized net
expense ratio1 | |
| | | | | |
Class A | | | | | | | | | | | | | | | | |
| | | | |
Actual | | $ | 1,000.00 | | | $ | 818.04 | | | $ | 4.83 | | | | 1.06 | % |
| | | | |
Hypothetical (5% return before expenses) | | $ | 1,000.00 | | | $ | 1,019.69 | | | $ | 5.36 | | | | 1.06 | % |
| | | | | |
Class C | | | | | | | | | | | | | | | | |
| | | | |
Actual | | $ | 1,000.00 | | | $ | 814.22 | | | $ | 8.30 | | | | 1.83 | % |
| | | | |
Hypothetical (5% return before expenses) | | $ | 1,000.00 | | | $ | 1,015.85 | | | $ | 9.22 | | | | 1.83 | % |
| | | | | |
Class R6 | | | | | | | | | | | | | | | | |
| | | | |
Actual | | $ | 1,000.00 | | | $ | 819.43 | | | $ | 2.96 | | | | 0.65 | % |
| | | | |
Hypothetical (5% return before expenses) | | $ | 1,000.00 | | | $ | 1,021.75 | | | $ | 3.29 | | | | 0.65 | % |
| | | | | |
Administrator Class | | | | | | | | | | | | | | | | |
| | | | |
Actual | | $ | 1,000.00 | | | $ | 818.09 | | | $ | 4.47 | | | | 0.98 | % |
| | | | |
Hypothetical (5% return before expenses) | | $ | 1,000.00 | | | $ | 1,020.08 | | | $ | 4.97 | | | | 0.98 | % |
| | | | | |
Institutional Class | | | | | | | | | | | | | | | | |
| | | | |
Actual | | $ | 1,000.00 | | | $ | 819.18 | | | $ | 3.41 | | | | 0.75 | % |
| | | | |
Hypothetical (5% return before expenses) | | $ | 1,000.00 | | | $ | 1,021.25 | | | $ | 3.79 | | | | 0.75 | % |
| 1 | Amounts reflect net expenses allocated from the affiliated Master Portfolio in which the Fund invests. |
| 2 | Expenses paid is equal to the annualized net expense ratio of each class multiplied by the average account value over the period, multiplied by the number of days in the most recent fiscal half-year divided by the number of days in the fiscal year (to reflect the one-half-year period). |
10 | Wells Fargo C&B Large Cap Value Fund
Portfolio of investments—May 31, 2020
| | | | | | | | | | | | | | | | |
| | | | | | | | | | | | Value | |
| Investment Companies: 100.01% | | | | | | | | | | | | | | | | |
| | | | |
| Affiliated Master Portfolio: 100.01% | | | | | | | | | | | | |
Wells Fargo C&B Large Cap Value Portfolio | | | | | | | | | | | | | | $ | 215,139,314 | |
| | | | | | | | | | | | | | | | |
| | | | |
Total Investment Companies (Cost $192,404,023) | | | | | | | | | | | | | | | 215,139,314 | |
| | | | | | | | | | | | | | | | |
| | | | | | | | |
| Total investments in securities (Cost $192,404,023) | | | 100.01 | % | | | 215,139,314 | |
| | |
Other assets and liabilities, net | | | (0.01 | ) | | | (19,953 | ) |
| | | | | | | | |
| Total net assets | | | 100.00 | % | | $ | 215,119,361 | |
| | | | | | | | |
Transactions with the affiliated Master Portfolio were as follows:
| | | | | | | | | | | | | | | | | | | | | | | | | | | | | | | | |
| | | % of
ownership,
beginning
of period | | | % of
ownership,
end of
period | | | Net realized
gains
(losses) on
securities
transactions
allocated
from
affiliated
Master
Portfolio | | | Net change in
unrealized
gains
(losses) on
securities
transactions
allocated
from
affiliated
Master
Portfolio | | | Dividends
allocated
from
affiliated
Master
Portfolio | | | Affiliated
income
allocated
from
affiliated
Master
Portfolio | | | Value,
end
of period | | | % of
net
assets | |
Wells Fargo C&B Large Cap Value Portfolio | | | 77 | % | | | 75 | % | | $ | 14,162,746 | | | $ | (23,968,868 | ) | | $ | 5,145,611 | | | $ | 175,412 | | | $ | 215,139,314 | | | | 100.01 | % |
The accompanying notes are an integral part of these financial statements.
Wells Fargo C&B Large Cap Value Fund | 11
Statement of assets and liabilities—May 31, 2020
| | | | |
| | | | |
| |
Assets | | | | |
Investments in affiliated Master Portfolio, at value (cost $192,404,023) | | $ | 215,139,314 | |
Receivable for Fund shares sold | | | 157,082 | |
Receivable from manager | | | 31,441 | |
Prepaid expenses and other assets | | | 17,127 | |
| | | | |
Total assets | | | 215,344,964 | |
| | | | |
| |
Liabilities | | | | |
Payable for Fund shares redeemed | | | 153,874 | |
Administration fees payable | | | 24,350 | |
Distribution fee payable | | | 2,173 | |
Shareholder report expenses payable | | | 16,162 | |
Shareholder servicing fees payable | | | 16,161 | |
Trustees’ fees and expenses payable | | | 783 | |
Accrued expenses and other liabilities | | | 12,100 | |
| | | | |
Total liabilities | | | 225,603 | |
| | | | |
Total net assets | | $ | 215,119,361 | |
| | | | |
| |
Net assets consist of | | | | |
Paid-in capital | | $ | 189,071,490 | |
Total distributable earnings | | | 26,047,871 | |
| | | | |
Total net assets | | $ | 215,119,361 | |
| | | | |
| |
Computation of net asset value and offering price per share | | | | |
Net assets – Class A | | $ | 70,679,717 | |
Shares outstanding – Class A1 | | | 6,153,286 | |
Net asset value per share – Class A | | | $11.49 | |
Maximum offering price per share – Class A2 | | | $12.19 | |
Net assets – Class C | | $ | 3,575,811 | |
Shares outstanding – Class C1 | | | 314,703 | |
Net asset value per share – Class C | | | $11.36 | |
Net assets – Class R6 | | $ | 37,859,319 | |
Shares outstanding – Class R61 | | | 3,282,715 | |
Net asset value per share – Class R6 | | | $11.53 | |
Net assets – Administrator Class | | $ | 6,166,572 | |
Shares outstanding – Administrator Class1 | | | 535,891 | |
Net asset value per share – Administrator Class | | | $11.51 | |
Net assets – Institutional Class | | $ | 96,837,942 | |
Shares outstanding – Institutional Class1 | | | 8,397,857 | |
Net asset value per share – Institutional Class | | | $11.53 | |
| 1 | The Fund has an unlimited number of authorized shares. |
| 2 | Maximum offering price is computed as 100/94.25 of net asset value. On investments of $50,000 or more, the offering price is reduced. |
The accompanying notes are an integral part of these financial statements.
12 | Wells Fargo C&B Large Cap Value Fund
Statement of operations—year ended May 31, 2020
| | | | |
| | | | |
| |
Investment income | | | | |
Dividends allocated from affiliated Master Portfolio (net of foreign withholding taxes of ($325,762) | | $ | 5,145,611 | |
Affiliated income allocated from affiliated Master Portfolio | | | 175,412 | |
Expenses allocated from affiliated Master Portfolio | | | (1,805,280 | ) |
Waivers allocated from affiliated Master Portfolio | | | 97,998 | |
| | | | |
Total investment income | | | 3,613,741 | |
| | | | |
| |
Expenses | | | | |
Management fee | | | 133,433 | |
Administration fees | | | | |
Class A | | | 171,399 | |
Class C | | | 9,410 | |
Class R6 | | | 16,648 | |
Administrator Class | | | 10,261 | |
Institutional Class | | | 152,591 | |
Shareholder servicing fees | | | | |
Class A | | | 204,046 | |
Class C | | | 11,203 | |
Administrator Class | | | 19,733 | |
Distribution fee | | | | |
Class C | | | 33,586 | |
Custody and accounting fees | | | 13,625 | |
Professional fees | | | 34,900 | |
Registration fees | | | 166,042 | |
Shareholder report expenses | | | 74,292 | |
Trustees’ fees and expenses | | | 21,592 | |
Other fees and expenses | | | 18,557 | |
| | | | |
Total expenses | | | 1,091,318 | |
Less: Fee waivers and/or expense reimbursements | | | | |
Fund-level | | | (502,060 | ) |
Class A | | | (16,000 | ) |
Administrator Class | | | (1,196 | ) |
| | | | |
Net expenses | | | 572,062 | |
| | | | |
Net investment income | | | 3,041,679 | |
| | | | |
| |
Realized and unrealized gains (losses) on investments | | | | |
Net realized gains on securities transactions allocated from affiliated Master Portfolio | | | 14,162,746 | |
Net change in unrealized gains (losses) on securities transactions allocated from affiliated Master Portfolio | | | (23,968,868 | ) |
| | | | |
Net realized and unrealized gains (losses) on investments | | | (9,806,122 | ) |
| | | | |
Net decrease in net assets resulting from operations | | $ | (6,764,443 | ) |
| | | | |
The accompanying notes are an integral part of these financial statements.
Wells Fargo C&B Large Cap Value Fund | 13
Statement of changes in net assets
| | | | | | | | | | | | | | | | |
| | | Year ended
May 31, 2020 | | | Year ended
May 31, 2019 | |
| | | | |
Operations | | | | | | | | | | | | | | | | |
Net investment income | | | | | | $ | 3,041,679 | | | | | | | $ | 3,494,425 | |
Net realized gains on investments | | | | | | | 14,162,746 | | | | | | | | 22,450,835 | |
Net change in unrealized gains (losses) on investments | | | | | | | (23,968,868 | ) | | | | | | | (20,286,156 | ) |
| | | | |
Net increase (decrease) in net assets resulting from operations | | | | | | | (6,764,443 | ) | | | | | | | 5,659,104 | |
| | | | |
| | | | |
Distributions to shareholders from net investment income and net realized gains | | | | | | | | | | | | | | | | |
Class A | | | | | | | (7,751,447 | ) | | | | | | | (5,854,644 | ) |
Class C | | | | | | | (388,806 | ) | | | | | | | (663,292 | ) |
Class R6 | | | | | | | (5,218,989 | ) | | | | | | | (8,273,383 | ) |
Administrator Class | | | | | | | (711,108 | ) | | | | | | | (729,387 | ) |
Institutional Class | | | | | | | (11,583,308 | ) | | | | | | | (9,537,075 | ) |
| | | | |
Total distributions to shareholders | | | | | | | (25,653,658 | ) | | | | | | | (25,057,781 | ) |
| | | | |
| | | | |
Capital share transactions | | | Shares | | | | | | | | Shares | | | | | |
Proceeds from shares sold | | | | | | | | | | | | | | | | |
Class A | | | 738,336 | | | | 9,862,221 | | | | 598,330 | | | | 7,944,833 | |
Class C | | | 84,359 | | | | 1,159,805 | | | | 153,872 | | | | 1,981,780 | |
Class R6 | | | 862,015 | | | | 10,181,197 | | | | 709,584 | | | | 9,759,366 | |
Administrator Class | | | 86,612 | | | | 1,194,613 | | | | 63,073 | | | | 881,388 | |
Institutional Class | | | 3,591,723 | | | | 48,556,144 | | | | 2,556,786 | | | | 34,874,000 | |
| | | | |
| | | | | | | 70,953,980 | | | | | | | | 55,441,367 | |
| | | | |
Reinvestment of distributions | | | | | | | | | | | | | | | | |
Class A | | | 529,924 | | | | 7,655,000 | | | | 463,313 | | | | 5,752,084 | |
Class C | | | 26,971 | | | | 383,791 | | | | 53,533 | | | | 657,661 | |
Class R6 | | | 47,617 | | | | 691,796 | | | | 40,613 | | | | 506,108 | |
Administrator Class | | | 34,562 | | | | 500,228 | | | | 45,134 | | | | 561,040 | |
Institutional Class | | | 792,083 | | | | 11,497,247 | | | | 755,134 | | | | 9,401,667 | |
| | | | |
| | | | | | | 20,728,062 | | | | | | | | 16,878,560 | |
| | | | |
Payment for shares redeemed | | | | | | | | | | | | | | | | |
Class A | | | (1,199,143 | ) | | | (15,487,514 | ) | | | (1,139,570 | ) | | | (15,660,154 | ) |
Class C | | | (192,765 | ) | | | (2,559,135 | ) | | | (613,403 | ) | | | (8,120,776 | ) |
Class R6 | | | (2,860,401 | ) | | | (39,194,686 | ) | | | (3,440,746 | ) | | | (46,779,401 | ) |
Administrator Class | | | (297,032 | ) | | | (3,913,331 | ) | | | (311,921 | ) | | | (4,389,568 | ) |
Institutional Class | | | (4,306,577 | ) | | | (53,511,682 | ) | | | (4,670,529 | ) | | | (62,677,183 | ) |
| | | | |
| | | | | | | (114,666,348 | ) | | | | | | | (137,627,082 | ) |
| | | | |
Net decrease in net assets resulting from capital share transactions | | | | | | | (22,984,306 | ) | | | | | | | (65,307,155 | ) |
| | | | |
Total decrease in net assets | | | | | | | (55,402,407 | ) | | | | | | | (84,705,832 | ) |
| | | | |
| | | | |
Net assets | | | | | | | | | | | | | | | | |
Beginning of period | | | | | | | 270,521,768 | | | | | | | | 355,227,600 | |
| | | | |
End of period | | | | | | $ | 215,119,361 | | | | | | | $ | 270,521,768 | |
| | | | |
The accompanying notes are an integral part of these financial statements.
14 | Wells Fargo C&B Large Cap Value Fund
Financial highlights
(For a share outstanding throughout each period)
| | | | | | | | | | | | | | | | | | | | |
| | | Year ended May 31 | |
| CLASS A | | 2020 | | | 2019 | | | 2018 | | | 2017 | | | 2016 | |
Net asset value, beginning of period | | | $13.01 | | | | $13.91 | | | | $14.54 | | | | $12.55 | | | | $13.07 | |
Net investment income | | | 0.12 | | | | 0.11 | | | | 0.09 | 1 | | | 0.08 | | | | 0.11 | 1 |
Net realized and unrealized gains (losses) on investments | | | (0.33 | ) | | | 0.02 | | | | 0.87 | | | | 2.23 | | | | (0.14 | ) |
| | | | | | | | | | | | | | | | | | | | |
Total from investment operations | | | (0.21 | ) | | | 0.13 | | | | 0.96 | | | | 2.31 | | | | (0.03 | ) |
Distributions to shareholders from | | | | | | | | | | | | | | | | | | | | |
Net investment income | | | (0.13 | ) | | | (0.12 | ) | | | (0.06 | ) | | | (0.08 | ) | | | (0.10 | ) |
Net realized gains | | | (1.18 | ) | | | (0.91 | ) | | | (1.53 | ) | | | (0.24 | ) | | | (0.39 | ) |
| | | | | | | | | | | | | | | | | | | | |
Total distributions to shareholders | | | (1.31 | ) | | | (1.03 | ) | | | (1.59 | ) | | | (0.32 | ) | | | (0.49 | ) |
Net asset value, end of period | | | $11.49 | | | | $13.01 | | | | $13.91 | | | | $14.54 | | | | $12.55 | |
Total return2 | | | (3.61 | )% | | | 1.33 | % | | | 6.29 | % | | | 18.62 | % | | | (0.08 | )% |
Ratios to average net assets (annualized) | | | | | | | | | | | | | | | | | | | | |
Gross expenses3 | | | 1.27 | % | | | 1.23 | % | | | 1.21 | % | | | 1.24 | % | | | 1.25 | % |
Net expenses3 | | | 1.07 | % | | | 1.08 | % | | | 1.10 | % | | | 1.15 | % | | | 1.15 | % |
Net investment income3 | | | 0.92 | % | | | 0.83 | % | | | 0.58 | % | | | 0.62 | % | | | 0.89 | % |
Supplemental data | | | | | | | | | | | | | | | | | | | | |
Portfolio turnover rate4 | | | 33 | % | | | 47 | % | | | 42 | % | | | 89 | % | | | 29 | % |
Net assets, end of period (000s omitted) | | | $70,680 | | | | $79,172 | | | | $85,707 | | | | $83,016 | | | | $88,387 | |
| 1 | Calculated based upon average shares outstanding |
| 2 | Total return calculations do not include any sales charges. |
| 3 | Ratios include net expenses allocated from the affiliated Master Portfolio which were as follows: |
| | | | |
Year ended May 31, 2020 | | | 0.64 | % |
Year ended May 31, 2019 | | | 0.65 | % |
Year ended May 31, 2018 | | | 0.66 | % |
Year ended May 31, 2017 | | | 0.68 | % |
Year ended May 31, 2016 | | | 0.68 | % |
| 4 | Portfolio turnover rate is calculated by multiplying the affiliated Master Portfolio’s percentage of the Fund’s total investments in securities at the end of the period by the affiliated Master Portfolio’s portfolio turnover rate. |
The accompanying notes are an integral part of these financial statements.
Wells Fargo C&B Large Cap Value Fund | 15
Financial highlights
(For a share outstanding throughout each period)
| | | | | | | | | | | | | | | | | | | | |
| | | Year ended May 31 | |
| CLASS C | | 2020 | | | 2019 | | | 2018 | | | 2017 | | | 2016 | |
Net asset value, beginning of period | | | $12.87 | | | | $13.75 | | | | $14.44 | | | | $12.48 | | | | $13.01 | |
Net investment income (loss) | | | 0.02 | 1 | | | 0.01 | 1 | | | (0.02 | )1 | | | (0.02 | ) | | | 0.01 | |
Net realized and unrealized gains (losses) on investments | | | (0.35 | ) | | | 0.03 | | | | 0.86 | | | | 2.22 | | | | (0.14 | ) |
| | | | | | | | | | | | | | | | | | | | |
Total from investment operations | | | (0.33 | ) | | | 0.04 | | | | 0.84 | | | | 2.20 | | | | (0.13 | ) |
Distributions to shareholders from | | | | | | | | | | | | | | | | | | | | |
Net investment income | | | 0.00 | | | | (0.01 | ) | | | 0.00 | | | | 0.00 | | | | (0.01 | ) |
Net realized gains | | | (1.18 | ) | | | (0.91 | ) | | | (1.53 | ) | | | (0.24 | ) | | | (0.39 | ) |
| | | | | | | | | | | | | | | | | | | | |
Total distributions to shareholders | | | (1.18 | ) | | | (0.92 | ) | | | (1.53 | ) | | | (0.24 | ) | | | (0.40 | ) |
Net asset value, end of period | | | $11.36 | | | | $12.87 | | | | $13.75 | | | | $14.44 | | | | $12.48 | |
Total return2 | | | (4.41 | )% | | | 0.61 | % | | | 5.46 | % | | | 17.73 | % | | | (0.82 | )% |
Ratios to average net assets (annualized) | | | | | | | | | | | | | | | | | | | | |
Gross expenses3 | | | 2.02 | % | | | 1.97 | % | | | 1.96 | % | | | 1.99 | % | | | 2.00 | % |
Net expenses3 | | | 1.83 | % | | | 1.83 | % | | | 1.85 | % | | | 1.90 | % | | | 1.90 | % |
Net investment income (loss) 3 | | | 0.16 | % | | | 0.07 | % | | | (0.16 | )% | | | (0.13 | )% | | | 0.11 | % |
Supplemental data | | | | | | | | | | | | | | | | | | | | |
Portfolio turnover rate4 | | | 33 | % | | | 47 | % | | | 42 | % | | | 89 | % | | | 29 | % |
Net assets, end of period (000s omitted) | | | $3,576 | | | | $5,098 | | | | $11,031 | | | | $8,043 | | | | $7,282 | |
| 1 | Calculated based upon average shares outstanding |
| 2 | Total return calculations do not include any sales charges. |
| 3 | Ratios include net expenses allocated from the affiliated Master Portfolio which were as follows: |
| | | | |
Year ended May 31, 2020 | | | 0.64 | % |
Year ended May 31, 2019 | | | 0.65 | % |
Year ended May 31, 2018 | | | 0.66 | % |
Year ended May 31, 2017 | | | 0.68 | % |
Year ended May 31, 2016 | | | 0.68 | % |
| 4 | Portfolio turnover rate is calculated by multiplying the affiliated Master Portfolio’s percentage of the Fund’s total investments in securities at the end of the period by the affiliated Master Portfolio’s portfolio turnover rate. |
The accompanying notes are an integral part of these financial statements.
16 | Wells Fargo C&B Large Cap Value Fund
Financial highlights
(For a share outstanding throughout each period)
| | | | | | | | | | | | | | | | |
| | | Year ended May 31 | |
| CLASS R6 | | 2020 | | | 2019 | | | 2018 | | | 20171 | |
Net asset value, beginning of period | | | $13.06 | | | | $13.97 | | | | $14.59 | | | | $12.73 | |
Net investment income | | | 0.18 | 2 | | | 0.18 | 2 | | | 0.18 | 2 | | | 0.16 | |
Net realized and unrealized gains (losses) on investments | | | (0.33 | ) | | | 0.00 | 3 | | | 0.85 | | | | 2.06 | |
| | | | | | | | | | | | | | | | |
Total from investment operations | | | (0.15 | ) | | | 0.18 | | | | 1.03 | | | | 2.22 | |
Distributions to shareholders from | | | | | | | | | | | | | | | | |
Net investment income | | | (0.20 | ) | | | (0.18 | ) | | | (0.12 | ) | | | (0.12 | ) |
Net realized gains | | | (1.18 | ) | | | (0.91 | ) | | | (1.53 | ) | | | (0.24 | ) |
| | | | | | | | | | | | | | | | |
Total distributions to shareholders | | | (1.38 | ) | | | (1.09 | ) | | | (1.65 | ) | | | (0.36 | ) |
Net asset value, end of period | | | $11.53 | | | | $13.06 | | | | $13.97 | | | | $14.59 | |
Total return4 | | | (3.25 | )% | | | 1.74 | % | | | 6.76 | % | | | 17.65 | % |
Ratios to average net assets (annualized) | | | | | | | | | | | | | | | | |
Gross expenses5 | | | 0.84 | % | | | 0.79 | % | | | 0.77 | % | | | 0.81 | % |
Net expenses5 | | | 0.65 | % | | | 0.65 | % | | | 0.65 | % | | | 0.70 | % |
Net investment income5 | | | 1.33 | % | | | 1.27 | % | | | 1.28 | % | | | 1.04 | % |
Supplemental data | | | | | | | | | | | | | | | | |
Portfolio turnover rate6 | | | 33 | % | | | 47 | % | | | 42 | % | | | 89 | % |
Net assets, end of period (000s omitted) | | | $37,859 | | | | $68,366 | | | | $110,665 | | | | $3,532 | |
| 1 | For the period from October 31, 2016 (commencement of class operations) to March 31, 2017 |
| 2 | Calculated based upon average shares outstanding |
| 3 | Amount is less than $0.005. |
| 4 | Returns for periods of less than one year are not annualized. |
| 5 | Ratios include net expenses allocated from the affiliated Master Portfolio which were as follows: |
| | | | |
Year ended May 31, 2020 | | | 0.64 | % |
Year ended May 31, 2019 | | | 0.65 | % |
Year ended May 31, 2018 | | | 0.65 | % |
Year ended May 31, 20171 | | | 0.68 | % |
| 6 | Portfolio turnover rate is calculated by multiplying the affiliated Master Portfolio’s percentage of the Fund’s total investment in securities at the end of the period by the affiliated Master Portfolio’s portfolio turnover rate. |
The accompanying notes are an integral part of these financial statements.
Wells Fargo C&B Large Cap Value Fund | 17
Financial highlights
(For a share outstanding throughout each period)
| | | | | | | | | | | | | | | | | | | | |
| | | Year ended May 31 | |
| ADMINISTRATOR CLASS | | 2020 | | | 2019 | | | 2018 | | | 2017 | | | 2016 | |
Net asset value, beginning of period | | | $13.03 | | | | $13.92 | | | | $14.56 | | | | $12.54 | | | | $13.07 | |
Net investment income | | | 0.13 | 1 | | | 0.12 | 1 | | | 0.10 | 1 | | | 0.10 | 1 | | | 0.13 | 1 |
Net realized and unrealized gains (losses) on investments | | | (0.33 | ) | | | 0.02 | | | | 0.87 | | | | 2.24 | | | | (0.15 | ) |
| | | | | | | | | | | | | | | | | | | | |
Total from investment operations | | | (0.20 | ) | | | 0.14 | | | | 0.97 | | | | 2.34 | | | | (0.02 | ) |
Distributions to shareholders from | | | | | | | | | | | | | | | | | | | | |
Net investment income | | | (0.14 | ) | | | (0.12 | ) | | | (0.08 | ) | | | (0.08 | ) | | | (0.12 | ) |
Net realized gains | | | (1.18 | ) | | | (0.91 | ) | | | (1.53 | ) | | | (0.24 | ) | | | (0.39 | ) |
| | | | | | | | | | | | | | | | | | | | |
Total distributions to shareholders | | | (1.32 | ) | | | (1.03 | ) | | | (1.61 | ) | | | (0.32 | ) | | | (0.51 | ) |
Net asset value, end of period | | | $11.51 | | | | $13.03 | | | | $13.92 | | | | $14.56 | | | | $12.54 | |
Total return | | | (3.56 | )% | | | 1.44 | % | | | 6.36 | % | | | 18.82 | % | | | 0.11 | % |
Ratios to average net assets (annualized) | | | | | | | | | | | | | | | | | | | | |
Gross expenses2 | | | 1.19 | % | | | 1.15 | % | | | 1.13 | % | | | 1.16 | % | | | 1.16 | % |
Net expenses2 | | | 0.99 | % | | | 1.00 | % | | | 1.00 | % | | | 1.00 | % | | | 0.98 | % |
Net investment income2 | | | 1.00 | % | | | 0.90 | % | | | 0.69 | % | | | 0.77 | % | | | 1.03 | % |
Supplemental data | | | | | | | | | | | | | | | | | | | | |
Portfolio turnover rate3 | | | 33 | % | | | 47 | % | | | 42 | % | | | 89 | % | | | 29 | % |
Net assets, end of period (000s omitted) | | | $6,167 | | | | $9,274 | | | | $12,742 | | | | $11,467 | | | | $23,210 | |
| 1 | Calculated based upon average shares outstanding |
| 2 | Ratios include net expenses allocated from the affiliated Master Portfolio which were as follows: |
| | | | |
Year ended May 31, 2020 | | | 0.64 | % |
Year ended May 31, 2019 | | | 0.65 | % |
Year ended May 31, 2018 | | | 0.66 | % |
Year ended May 31, 2017 | | | 0.68 | % |
Year ended May 31, 2016 | | | 0.68 | % |
| 3 | Portfolio turnover rate is calculated by multiplying the affiliated Master Portfolio’s percentage of the Fund’s total investments in securities at the end of the period by the affiliated Master Portfolio’s portfolio turnover rate. |
The accompanying notes are an integral part of these financial statements.
18 | Wells Fargo C&B Large Cap Value Fund
Financial highlights
(For a share outstanding throughout each period)
| | | | | | | | | | | | | | | | | | | | |
| | | Year ended May 31 | |
| INSTITUTIONAL CLASS | | 2020 | | | 2019 | | | 2018 | | | 2017 | | | 2016 | |
Net asset value, beginning of period | | | $13.05 | | | | $13.96 | | | | $14.58 | | | | $12.58 | | | | $13.11 | |
Net investment income | | | 0.16 | | | | 0.14 | | | | 0.13 | 1 | | | 0.14 | | | | 0.16 | |
Net realized and unrealized gains (losses) on investments | | | (0.33 | ) | | | 0.02 | | | | 0.89 | | | | 2.22 | | | | (0.14 | ) |
| | | | | | | | | | | | | | | | | | | | |
Total from investment operations | | | (0.17 | ) | | | 0.16 | | | | 1.02 | | | | 2.36 | | | | 0.02 | |
Distributions to shareholders from | | | | | | | | | | | | | | | | | | | | |
Net investment income | | | (0.17 | ) | | | (0.16 | ) | | | (0.11 | ) | | | (0.12 | ) | | | (0.16 | ) |
Net realized gains | | | (1.18 | ) | | | (0.91 | ) | | | (1.53 | ) | | | (0.24 | ) | | | (0.39 | ) |
| | | | | | | | | | | | | | | | | | | | |
Total distributions to shareholders | | | (1.35 | ) | | | (1.07 | ) | | | (1.64 | ) | | | (0.36 | ) | | | (0.55 | ) |
Net asset value, end of period | | | $11.53 | | | | $13.05 | | | | $13.96 | | | | $14.58 | | | | $12.58 | |
Total return | | | (3.33 | )% | | | 1.64 | % | | | 6.68 | % | | | 19.05 | % | | | 0.33 | % |
Ratios to average net assets (annualized) | | | | | | | | | | | | | | | | | | | | |
Gross expenses2 | | | 0.94 | % | | | 0.90 | % | | | 0.88 | % | | | 0.91 | % | | | 0.92 | % |
Net expenses2 | | | 0.75 | % | | | 0.75 | % | | | 0.77 | % | | | 0.80 | % | | | 0.77 | % |
Net investment income2 | | | 1.25 | % | | | 1.17 | % | | | 0.87 | % | | | 0.96 | % | | | 1.25 | % |
Supplemental data | | | | | | | | | | | | | | | | | | | | |
Portfolio turnover rate3 | | | 33 | % | | | 47 | % | | | 42 | % | | | 89 | % | | | 29 | % |
Net assets, end of period (000s omitted) | | | $96,838 | | | | $108,613 | | | | $135,082 | | | | $220,257 | | | | $133,632 | |
| 1 | Calculated based upon average shares outstanding |
| 2 | Ratios include net expenses allocated from the affiliated Master Portfolio which were as follows: |
| | | | |
Year ended May 31, 2020 | | | 0.64 | % |
Year ended May 31, 2019 | | | 0.65 | % |
Year ended May 31, 2018 | | | 0.66 | % |
Year ended May 31, 2017 | | | 0.68 | % |
Year ended May 31, 2016 | | | 0.68 | % |
| 4 | Portfolio turnover rate is calculated by multiplying the affiliated Master Portfolio’s percentage of the Fund’s total investment in securities at the end of the period by the affiliated Master Portfolio’s portfolio turnover rate. |
The accompanying notes are an integral part of these financial statements.
Wells Fargo C&B Large Cap Value Fund | 19
Notes to financial statements
1. ORGANIZATION
Wells Fargo Funds Trust (the “Trust”), a Delaware statutory trust organized on March 10, 1999, is an open-end management investment company registered under the Investment Company Act of 1940, as amended (the “1940 Act”). As an investment company, the Trust follows the accounting and reporting guidance in Financial Accounting Standards Board (“FASB”) Accounting Standards Codification Topic 946, Financial Services – Investment Companies. These financial statements report on the Wells Fargo C&B Large Cap Value Fund (the “Fund”) which is a diversified series of the Trust.
The Fund is a feeder fund in a master-feeder structure that invests substantially all of its assets in a single master portfolio with a substantially identical investment objective and substantially similar investment strategies. The Fund invests in Wells Fargo C&B Large Cap Value Portfolio (the “affiliated Master Portfolio”) which is a separate diversified portfolio of Wells Fargo Master Trust, a registered open-end management investment company. As of May 31, 2020, the Fund owned 75% of Wells Fargo C&B Large Cap Value Portfolio. The affiliated Master Portfolio directly acquires portfolio securities and the Fund acquires an indirect interest in those securities. The Fund accounts for its investment in the affiliated Master Portfolio as a partnership investment and records on a daily basis its share of the affiliated Master Portfolio’s income, expense and realized and unrealized gains and losses. The financial statements of the affiliated Master Portfolio for the year ended May 31, 2020 are included in this report and should be read in conjunction with the Fund’s financial statements.
2. SIGNIFICANT ACCOUNTING POLICIES
The following significant accounting policies, which are consistently followed in the preparation of the financial statements of the Fund, are in conformity with U.S. generally accepted accounting principles which require management to make estimates and assumptions that affect the reported amounts of assets and liabilities, disclosure of contingent assets and liabilities at the date of the financial statements, and the reported amounts of revenues and expenses during the reporting period. Actual results could differ from those estimates.
Securities valuation
All investments are valued each business day as of the close of regular trading on the New York Stock Exchange (generally 4 p.m. Eastern Time), although the Fund may deviate from this calculation time under unusual or unexpected circumstances.
Investments in the affiliated Master Portfolio are valued daily based on the Fund’s proportionate share of the affiliated Master Portfolio’s net assets, which are also valued daily. Securities held in the affiliated Master Portfolio are valued as discussed in the Notes to Financial Statements of the affiliated Master Portfolio, which are included elsewhere in this report.
Investments which are not valued using the method discussed above are valued at their fair value, as determined in good faith by the Board of Trustees of the Fund. The Board of Trustees has established a Valuation Committee comprised of the Trustees and has delegated to it the authority to take any actions regarding the valuation of portfolio securities that the Valuation Committee deems necessary or appropriate, including determining the fair value of portfolio securities, unless the determination has been delegated to the Wells Fargo Asset Management Pricing Committee at Wells Fargo Funds Management, LLC (“Funds Management”). The Board of Trustees retains the authority to make or ratify any valuation decisions or approve any changes to the Valuation Procedures as it deems appropriate. On a quarterly basis, the Board of Trustees receives reports on any valuation actions taken by the Valuation Committee or the Wells Fargo Asset Management Pricing Committee which may include items for ratification.
Investment transactions, income and expenses
Investments in the affiliated Master Portfolio are recorded on a trade basis. The Fund records daily its proportionate share of the affiliated Master Portfolio’s income, expenses and realized and unrealized gains or losses. The Fund also accrues its own expenses.
Distributions to shareholders
Distributions to shareholders from net investment income and any net realized gains are recorded on the ex-dividend date and paid at least annually. Such distributions are determined in accordance with income tax regulations and may differ from U.S. generally accepted accounting principles. Dividend sources are estimated at the time of declaration. The tax character of distributions is determined as of the Fund’s fiscal year end. Therefore, a portion of the Fund’s distributions made prior to the Fund’s fiscal year end may be categorized as a tax return of capital at year end.
Federal and other taxes
The Fund intends to continue to qualify as a regulated investment company by distributing substantially all of its investment company taxable income and any net realized capital gains (after reduction for capital loss carryforwards) sufficient to relieve it from all, or substantially all, federal income taxes. Accordingly, no provision for federal income taxes was required.
20 | Wells Fargo C&B Large Cap Value Fund
Notes to financial statements
The Fund’s income and federal excise tax returns and all financial records supporting those returns for the prior three fiscal years are subject to examination by the federal and Delaware revenue authorities. Management has analyzed the Fund’s tax positions taken on federal, state, and foreign tax returns for all open tax years and does not believe that there are any uncertain tax positions that require recognition of a tax liability.
As of May 31, 2020, the aggregate cost of all investments for federal income tax purposes was $194,477,073 and the unrealized gains (losses) consisted of:
| | | | |
| |
Gross unrealized gains | | $ | 22,735,291 | |
| |
Gross unrealized losses | | | (2,073,,050 | ) |
| |
Net unrealized gains | | $ | 20,662,241 | |
Class allocations
The separate classes of shares offered by the Fund differ principally in applicable sales charges, distribution, shareholder servicing, and administration fees. Class specific expenses are charged directly to that share class. Investment income, common fund-level expenses, and realized and unrealized gains (losses) on investments are allocated daily to each class of shares based on the relative proportion of net assets of each class.
3. FAIR VALUATION MEASUREMENTS
At May 31, 2020, the affiliated Master Portfolio was measured at fair value using the net asset value per share (or its equivalent) as a practical expedient. The investment objective and the value of the affiliate Master Portfolio was as follows:
| | | | | | |
| | |
| Affiliated Master Portfolio | | Investment objective | | Value of
affiliated Master
Portfolio | |
| | |
Wells Fargo C&B Large Cap Value Portfolio | | Seeks maximum long-term total return (current income and capital
appreciation), consistent with minimizing risk to principal | | $ | 215,139,314 | |
The affiliated Master Portfolio does not have a redemption period notice, can be redeemed daily and does not have any unfunded commitments.
4. TRANSACTIONS WITH AFFILIATES
Management fee
Funds Management, an indirect wholly owned subsidiary of Wells Fargo & Company (“Wells Fargo”), is the manager of the Fund and provides advisory and fund-level administrative services under an investment management agreement. Under the investment management agreement, Funds Management is responsible for, among other services, implementing the investment objectives and strategies of the Fund and providing fund-level administrative services in connection with the Fund’s operations. As long as the Fund continues to invest substantially all of its assets in a single affiliated Master Portfolio, the Fund pays Funds Management an investment management fee only for fund-level administrative services at the following annual rate based on the Fund’s average daily net assets:
| | | | |
| |
| Average daily net assets | | Management fee | |
| |
First $5 billion | | | 0.05 | % |
| |
Next $5 billion | | | 0.04 | |
| |
Over $10 billion | | | 0.03 | |
For the year ended May 31, 2020, the management fee was equivalent to an annual rate of 0.05% of the Fund’s average daily net assets.
Funds Management also serves as the adviser to the affiliated Master Portfolio and is entitled to receive a fee from the affiliated Master Portfolio for those services.
Wells Fargo C&B Large Cap Value Fund | 21
Notes to financial statements
Administration fees
Under a class-level administration agreement, Funds Management provides class-level administrative services to the Fund, which includes paying fees and expenses for services provided by the transfer agent, sub-transfer agents, omnibus account servicers and record-keepers. As compensation for its services under the class-level administration agreement, Funds Management receives an annual fee which is calculated based on the average daily net assets of each class as follows:
| | | | |
| |
| | | Class-level
administration fee | |
| |
Class A, Class C | | | 0.21 | % |
| |
Class R6 | | | 0.03 | |
| |
Administrator Class, Institutional Class | | | 0.13 | |
Waivers and/or expense reimbursements
Funds Management has contractually waived and/or reimbursed management and administration fees to the extent necessary to maintain certain net operating expense ratios for the Fund. When each class of the Fund has exceeded its expense cap, Funds Management has waived fees and/or reimbursed expenses from fund-level expenses on a proportionate basis and then from class specific expenses. When only certain classes exceed their expense caps, waivers and/or reimbursements are applied against class specific expenses before fund-level expenses. Net expenses from the affiliated Master Portfolio are included in the expense caps. Funds Management has committed through September 30, 2020 to waive fees and/or reimburse expenses to the extent necessary to cap the Fund’s expenses at 1.08% for Class A shares, 1.83% for Class C shares, 0.65% for Class R6 shares, 1.00% for Administrator Class shares, and 0.75% for Institutional Class shares. Prior to or after the commitment expiration date, the cap may be increased or the commitment to maintain the cap may be terminated only with the approval of the Board of Trustees.
Distribution fee
The Trust has adopted a distribution plan for Class C shares of the Fund pursuant to Rule 12b-1 under the 1940 Act. A distribution fee is charged to Class C shares and paid to Wells Fargo Funds Distributor, LLC (“Funds Distributor”), the principal underwriter, at an annual rate of 0.75% of the average daily net assets of Class C shares.
In addition, Funds Distributor is entitled to receive the front-end sales charge from the purchase of Class A shares and a contingent deferred sales charge on the redemption of certain Class A shares. Funds Distributor is also entitled to receive the contingent deferred sales charges from redemptions of Class C shares. For the year ended May 31, 2020, Funds Distributor received $6,786 from the sale of Class A shares. No contingent deferred sales charges were incurred by Class A and Class C shares for the year ended May 31, 2020.
Shareholder servicing fees
The Trust has entered into contracts with one or more shareholder servicing agents, whereby Class A, Class C, and Administrator Class of the Fund are charged a fee at an annual rate of 0.25% of the average daily net assets of each respective class. A portion of these total shareholder servicing fees were paid to affiliates of Wells Fargo.
5. INVESTMENT PORTFOLIO TRANSACTIONS
The Fund seeks to achieve its investment objective by investing substantially all of its assets in a single affiliated Master Portfolio. Purchases and sales have been calculated by multiplying the Fund’s ownership percentage of the affiliated Master Portfolio by the affiliated Master Portfolio’s purchases and sales. Purchases and sales of investments, excluding U.S. government obligations (if any) and short-term securities, for the year ended May 31, 2020 were $81,327,908 and $116,772,566, respectively.
6. BANK BORROWINGS
The Trust (excluding the money market funds), Wells Fargo Master Trust and Wells Fargo Variable Trust are parties to a $280,000,000 revolving credit agreement whereby the Fund is permitted to use bank borrowings for temporary or emergency purposes, such as to fund shareholder redemption requests. Interest under the credit agreement is charged to the Fund based on a borrowing rate equal to the higher of the Federal Funds rate in effect on that day plus 1.25% or the overnight LIBOR rate in effect on that day plus 1.25%. In addition, an annual commitment fee equal to 0.25% of the unused balance is allocated to each participating fund.
For the year ended May 31, 2020, there were no borrowings by the Fund under the agreement.
22 | Wells Fargo C&B Large Cap Value Fund
Notes to financial statements
7. DISTRIBUTIONS TO SHAREHOLDERS
The tax character of distributions paid during the years ended May 31, 2020 and May 31, 2019 were as follows:
| | | | | | | | |
| | | Year ended May 31 | |
| | |
| | | 2020 | | | 2019 | |
| | |
Ordinary income | | $ | 6,869,198 | | | $ | 8,378,114 | |
| | |
Long-term capital gain | | | 18,784,460 | | | | 16,679,667 | |
As of May 31, 2020, the components of distributable earnings on a tax basis were as follows:
| | | | |
Undistributed ordinary income | | Undistributed long-term gain | | Unrealized gains |
| | |
| $2,222,295 | | $3,163,335 | | $20,662,241 |
8. CONCENTRATION RISK
Concentration risks result from exposure to a limited number of sectors. Through its investment in the affiliated Master Portfolio which may invest a substantial portion of its assets in any sector, the Fund may in turn be more affected by changes in that sector than a fund whose investments are not heavily weighted in any sector. As of the end of the period, the Fund invested a concentration of its portfolio in the financials sector.
9. INDEMNIFICATION
Under the Fund’s organizational documents, the officers and Trustees have been granted certain indemnification rights against certain liabilities that may arise out of performance of their duties to the Fund. The Fund has entered into a separate agreement with each Trustee that converts indemnification rights currently existing under the Fund’s organizational documents into contractual rights that cannot be changed in the future without the consent of the Trustee. Additionally, in the normal course of business, the Fund may enter into contracts with service providers that contain a variety of indemnification clauses. The Fund’s maximum exposure under these arrangements is dependent on future claims that may be made against the Fund and, therefore, cannot be estimated.
10. NEW ACCOUNTING PRONOUNCEMENT
In August 2018, FASB issued Accounting Standards Update (“ASU”) No. 2018-13, Fair Value Measurement (Topic 820) Disclosure Framework—Changes to the Disclosure Requirements for Fair Value Measurement. ASU 2018-13 updates the disclosure requirements for fair value measurements by modifying or removing certain disclosures and adding certain new disclosures. The amendments are effective for fiscal years, and interim periods within those fiscal years, beginning after December 15, 2019. Early adoption is permitted. Management has adopted the removal and modification of disclosures early, as permitted, and will adopt the additional new disclosures at the effective date.
11. CORONAVIRUS (COVID-19) PANDEMIC
On March 11, 2020, the World Health Organization announced that it had made the assessment that coronavirus disease 2019 (“COVID-19”) is a pandemic. The impacts of COVID-19 are adversely affecting the entire global economy, individual companies and investment products, and the market in general. There is significant uncertainty around the extent and duration of business disruptions related to COVID-19 and the impacts may be short term or may last for an extended period of time. The risk of further spreading of COVID-19 has led to significant uncertainty and volatility in the financial markets. The value of the Fund and the Master Portfolio in which the Fund invests have generally been adversely affected by impacts caused by COVID-19.
Wells Fargo C&B Large Cap Value Fund | 23
Report of independent registered public accounting firm
TO THE SHAREHOLDERS OF THE FUND AND BOARD OF TRUSTEES WELLS FARGO FUNDS TRUST:
Opinion on the Financial Statements
We have audited the accompanying statement of assets and liabilities of Wells Fargo C&B Large Cap Value Fund (the Fund), one of the funds constituting Wells Fargo Funds Trust, including the portfolio of investments as of May 31, 2020, the related statement of operations for the year then ended, the statements of changes in net assets for each of the years in the two-year period then ended, and the related notes (collectively, the financial statements) and the financial highlights for each of the years or periods in the five-year period then ended. In our opinion, the financial statements and financial highlights present fairly, in all material respects, the financial position of the Fund as of May 31, 2020, the results of its operations for the year then ended, the changes in its net assets for each of the years in the two-year period then ended, and the financial highlights for each of the years or periods in the five-year period then ended, in conformity with U.S. generally accepted accounting principles.
Basis for Opinion
These financial statements and financial highlights are the responsibility of the Fund’s management. Our responsibility is to express an opinion on these financial statements and financial highlights based on our audits. We are a public accounting firm registered with the Public Company Accounting Oversight Board (United States) (PCAOB) and are required to be independent with respect to the Fund in accordance with the U.S. federal securities laws and the applicable rules and regulations of the Securities and Exchange Commission and the PCAOB.
We conducted our audits in accordance with the standards of the PCAOB. Those standards require that we plan and perform the audit to obtain reasonable assurance about whether the financial statements and financial highlights are free of material misstatement, whether due to error or fraud. Our audits included performing procedures to assess the risks of material misstatement of the financial statements and financial highlights, whether due to error or fraud, and performing procedures that respond to those risks. Such procedures included examining, on a test basis, evidence regarding the amounts and disclosures in the financial statements and financial highlights. Such procedures also included confirmation of securities owned as of May 31,2020, by correspondence with the transfer agent. Our audits also included evaluating the accounting principles used and significant estimates made by management, as well as evaluating the overall presentation of the financial statements and financial highlights. We believe that our audits provide a reasonable basis for our opinion.

We have not been able to determine the specific year that we began serving as the auditor of one or more Wells Fargo Funds investment companies; however we are aware that we have served as the auditor of one or more Wells Fargo Funds investment companies since at least 1955.
Boston, Massachusetts
July 29, 2020
24 | Wells Fargo C&B Large Cap Value Fund
Portfolio of investments—May 31, 2020
| | | | | | | | | | | | | | | | |
| | | | | | | | | Shares | | | Value | |
| Common Stocks: 96.97% | |
|
Communication Services: 5.37% | |
|
| Diversified Telecommunication Services: 1.95% | |
Verizon Communications Incorporated | | | | | | | | | | | 97,700 | | | $ | 5,606,026 | |
| | | | | | | | | | | | | | | | |
|
| Entertainment: 1.34% | |
Activision Blizzard Incorporated | | | | | | | | | | | 53,400 | | | | 3,843,732 | |
| | | | | | | | | | | | | | | | |
|
| Media: 2.08% | |
Omnicom Group Incorporated | | | | | | | | | | | 108,800 | | | | 5,961,152 | |
| | | | | | | | | | | | | | | | |
|
| Consumer Discretionary: 4.65% | |
|
| Household Durables: 1.84% | |
Whirlpool Corporation | | | | | | | | | | | 43,200 | | | | 5,262,624 | |
| | | | | | | | | | | | | | | | |
|
| Textiles, Apparel & Luxury Goods: 2.81% | |
Gildan Activewear Incorporated | | | | | | | | | | | 300,000 | | | | 4,173,000 | |
HanesBrands Incorporated | | | | | | | | | | | 395,197 | | | | 3,896,642 | |
| | | | |
| | | | | | | | | | | | | | | 8,069,642 | |
| | | | | | | | | | | | | | | | |
|
Consumer Staples: 1.77% | |
|
| Tobacco: 1.77% | |
Philip Morris International Incorporated | | | | | | | | | | | 69,400 | | | | 5,091,184 | |
| | | | | | | | | | | | | | | | |
|
Energy: 2.54% | |
|
| Energy Equipment & Services: 0.95% | |
Schlumberger Limited | | | | | | | | | | | 148,000 | | | | 2,733,560 | |
| | | | | | | | | | | | | | | | |
|
| Oil, Gas & Consumable Fuels: 1.59% | |
Exxon Mobil Corporation | | | | | | | | | | | 100,100 | | | | 4,551,547 | |
| | | | | | | | | | | | | | | | |
|
| Financials: 33.62% | |
|
| Banks: 7.74% | |
JPMorgan Chase & Company | | | | | | | | | | | 75,000 | | | | 7,298,250 | |
PNC Financial Services Group Incorporated | | | | | | | | | | | 65,400 | | | | 7,458,216 | |
US Bancorp | | | | | | | | | | | 209,700 | | | | 7,456,932 | |
| | | | |
| | | | | | | | | | | | | | | 22,213,398 | |
| | | | | | | | | | | | | | | | |
|
| Capital Markets: 10.76% | |
Brookfield Asset Management Incorporated Class A | | | | | | | | | | | 248,900 | | | | 7,805,504 | |
Intercontinental Exchange Incorporated | | | | | | | | | | | 70,200 | | | | 6,826,950 | |
State Street Corporation | | | | | | | | | | | 133,600 | | | | 8,144,256 | |
The Charles Schwab Corporation | | | | | | | | | | | 225,300 | | | | 8,090,523 | |
| | | | |
| | | | | | | | | | | | | | | 30,867,233 | |
| | | | | | | | | | | | | | | | |
|
| Consumer Finance: 2.50% | |
Synchrony Financial | | | | | | | | | | | 352,000 | | | | 7,170,240 | |
| | | | | | | | | | | | | | | | |
|
| Diversified Financial Services: 2.70% | |
Berkshire Hathaway Incorporated Class B † | | | | | | | | | | | 41,800 | | | | 7,757,244 | |
| | | | | | | | | | | | | | | | |
|
| Insurance: 9.92% | |
Alleghany Corporation | | | | | | | | | | | 7,700 | | | | 3,950,870 | |
Arch Capital Group Limited † | | | | | | | | | | | 226,150 | | | | 6,381,953 | |
Chubb Limited | | | | | | | | | | | 69,800 | | | | 8,511,412 | |
The accompanying notes are an integral part of these financial statements.
Wells Fargo C&B Large Cap Value Portfolio | 25
Portfolio of investments—May 31, 2020
| | | | | | | | | | | | | | | | |
| | | | | | | | | Shares | | | Value | |
|
| Insurance (continued) | |
Fidelity National Financial Incorporated | | | | | | | | | | | 72,700 | | | $ | 2,319,130 | |
The Progressive Corporation | | | | | | | | | | | 93,800 | | | | 7,286,384 | |
| | | | |
| | | | | | | | | | | | | | | 28,449,749 | |
| | | | | | | | | | | | | | | | |
|
Health Care: 14.76% | |
|
| Health Care Equipment & Supplies: 4.36% | |
Becton Dickinson & Company | | | | | | | | | | | 25,000 | | | | 6,173,250 | |
Medtronic plc | | | | | | | | | | | 64,400 | | | | 6,348,552 | |
| | | | |
| | | | | | | | | | | | | | | 12,521,802 | |
| | | | | | | | | | | | | | | | |
|
| Health Care Providers & Services: 7.52% | |
HCA Healthcare Incorporated | | | | | | | | | | | 54,800 | | | | 5,858,120 | |
Laboratory Corporation of America Holdings † | | | | | | | | | | | 38,910 | | | | 6,821,701 | |
UnitedHealth Group Incorporated | | | | | | | | | | | 29,200 | | | | 8,901,620 | |
| | | | |
| | | | | | | | | | | | | | | 21,581,441 | |
| | | | | | | | | | | | | | | | |
|
| Pharmaceuticals: 2.88% | |
Johnson & Johnson | | | | | | | | | | | 55,500 | | | | 8,255,625 | |
| | | | | | | | | | | | | | | | |
|
Industrials: 19.74% | |
|
| Aerospace & Defense: 0.82% | |
Hexcel Corporation | | | | | | | | | | | 65,300 | | | | 2,363,207 | |
| | | | | | | | | | | | | | | | |
|
| Air Freight & Logistics: 2.17% | |
United Parcel Service Incorporated Class B | | | | | | | | | | | 62,400 | | | | 6,221,904 | |
| | | | | | | | | | | | | | | | |
|
| Building Products: 1.58% | |
Johnson Controls International plc | | | | | | | | | | | 144,700 | | | | 4,545,027 | |
| | | | | | | | | | | | | | | | |
|
| Electrical Equipment: 4.06% | |
AMETEK Incorporated | | | | | | | | | | | 53,400 | | | | 4,897,314 | |
Eaton Corporation plc | | | | | | | | | | | 79,400 | | | | 6,741,060 | |
| | | | |
| | | | | | | | | | | | | | | 11,638,374 | |
| | | | | | | | | | | | | | | | |
| | | | |
| Industrial Conglomerates: 2.19% | | | | | | | | | | | | |
3M Company | | | | | | | | | | | 40,100 | | | | 6,273,244 | |
| | | | | | | | | | | | | | | | |
|
| Machinery: 5.84% | |
Colfax Corporation † | | | | | | | | | | | 281,100 | | | | 7,887,666 | |
Snap-on Incorporated | | | | | | | | | | | 45,900 | | | | 5,952,771 | |
Woodward Incorporated | | | | | | | | | | | 42,400 | | | | 2,907,792 | |
| | | | |
| | | | | | | | | | | | | | | 16,748,229 | |
| | | | | | | | | | | | | | | | |
|
| Trading Companies & Distributors: 3.08% | |
AerCap Holdings NV † | | | | | | | | | | | 274,300 | | | | 8,843,432 | |
| | | | | | | | | | | | | | | | |
|
| Information Technology: 9.57% | |
|
| Electronic Equipment, Instruments & Components: 6.32% | |
Arrow Electronics Incorporated † | | | | | | | | | | | 143,600 | | | | 9,919,888 | |
TE Connectivity Limited | | | | | | | | | | | 100,900 | | | | 8,198,125 | |
| | | | |
| | | | | | | | | | | | | | | 18,118,013 | |
| | | | | | | | | | | | | | | | |
The accompanying notes are an integral part of these financial statements.
26 | Wells Fargo C&B Large Cap Value Portfolio
Portfolio of investments—May 31, 2020
| | | | | | | | | | | | | | | | |
| | | | | | | | | Shares | | | Value | |
| IT Services: 3.25% | |
Amdocs Limited | | | | | | | | 105,000 | | | $ | 6,537,300 | |
Leidos Holdings Incorporated | | | | | | | | 26,500 | | | | 2,790,185 | |
| | | | |
| | | | | | | | | | | | | | | 9,327,485 | |
| | | | | | | | | | | | | | | | |
|
| Materials: 3.15% | |
|
| Chemicals: 1.65% | |
Axalta Coating Systems Limited † | | | | | | | | 205,100 | | | | 4,739,861 | |
| | | | | | | | | | | | | | | | |
|
| Metals & Mining: 1.50% | |
Reliance Steel & Aluminum Company | | | | | | | | 44,300 | | | | 4,297,100 | |
| | | | | | | | | | | | | | | | |
|
| Real Estate: 1.80% | |
|
| Real Estate Management & Development: 1.80% | |
CBRE Group Incorporated Class A † | | | | | | | | 117,400 | | | | 5,163,252 | |
| | | | | | | | | | | | | | | | |
| |
Total Common Stocks (Cost $247,068,975) | | | | 278,215,327 | |
| | | | | | | | | | | | | | | | |
| | | | |
| | | | | | | | | | | | | | | | |
| | | Yield | | | | | | | | | | |
| Short-Term Investments: 2.22% | |
|
| Investment Companies: 2.22% | |
Wells Fargo Government Money Market Fund Select Class (l)(u) | | | 0.12 | % | | | | | | | 6,370,055 | | | | 6,370,055 | |
| | | | | | | | | | | | | | | | |
| |
Total Short-Term Investments (Cost $6,370,055) | | | | 6,370,055 | |
| | | | | | | | | | | | | | | | |
| | | | | | | | |
| Total investments in securities (Cost $253,439,030) | | | 99.19 | % | | | 284,585,382 | |
| | |
Other assets and liabilities, net | | | 0.81 | | | | 2,326,972 | |
| | | | | | | | |
| Total net assets | | | 100.00 | % | | $ | 286,912,354 | |
| | | | | | | | |
| † | Non-income-earning security |
| (l) | The issuer of the security is an affiliated person of the Portfolio as defined in the Investment Company Act of 1940. |
| (u) | The rate represents the 7-day annualized yield at period end. |
Investments in Affiliates
An affiliated investment is an investment in which the Portfolio owns at least 5% of the outstanding voting shares of the issuer or as a result of other relationships, such as the Portfolio and the issuer having the same adviser or investment manager. Transactions with issuers that were either affiliated persons of the Portfolio at the beginning of the period or the end of the period were as follows:
| | | | | | | | | | | | | | | | | | | | | | | | | | | | | | | | | | | | |
| | | Shares,
beginning of
period | | | Shares
purchased | | | Shares
sold | | | Shares,
end of
period | | | Net
realized
gains
(losses) | | | Net
change in
unrealized
gains
(losses) | | | Income
from
affiliated
securities | | | Value,
end of
period | | | % of
net
assets | |
| | | | | | | | | |
| Short-Term Investments | | | | | | | | | | | | | | | | | | | | | | | | | | | |
Investment Companies | | | | | | | | | | | | | | | | | | | | | | | | | | | | | | | | | | | | |
Securities Lending Cash Investments LLC * | | | 0 | | | | 44,301,104 | | | | (44,301,104 | ) | | | 0 | | | $ | 2 | | | $ | 0 | | | $ | 20,349 | # | | $ | 0 | | | | | |
Wells Fargo Government Money Market Fund Select Class | | | 11,857,445 | | | | 131,459,327 | | | | (136,946,717 | ) | | | 6,370,055 | | | | 0 | | | | 0 | | | | 222,709 | | | | 6,370,055 | | | | | |
| | | | | | | | | | | | | | | | | | | | | | | | | | | | | | | | | | | | |
| | | | | | | | | | | | | | | | | | $ | 2 | | | | 0 | | | $ | 243,058 | | | $ | 6,370,055 | | | | 2.22 | % |
| | | | | | | | | | | | | | | | | | | | | | | | | | | | | | | | | | | | |
| # | Amount shown represents income before fees and rebates. |
| * | No longer held at the end of the period |
The accompanying notes are an integral part of these financial statements.
Wells Fargo C&B Large Cap Value Portfolio | 27
Statement of assets and liabilities—May 31, 2020
| | | | |
| | | | |
| |
Assets | | | | |
Investments in unaffiliated securities, at value (cost $247,068,975) | | $ | 278,215,327 | |
Investments in affiliated securities, at value (cost $6,370,055) | | | 6,370,055 | |
Cash | | | 43,471 | |
Receivable for investments sold | | | 1,857,493 | |
Receivable for dividends | | | 532,955 | |
Prepaid expenses and other assets | | | 34,255 | |
| | | | |
Total assets | | | 287,053,556 | |
| | | | |
| |
Liabilities | | | | |
Advisory fee payable | | | 140,389 | |
Trustees’ fees and expenses payable | | | 813 | |
| | | | |
Total liabilities | | | 141,202 | |
| | | | |
Total net assets | | $ | 286,912,354 | |
| | | | |
The accompanying notes are an integral part of these financial statements.
28 | Wells Fargo C&B Large Cap Value Portfolio
Statement of operations—year ended May 31, 2020
| | | | |
| | | | |
| |
Investment income | | | | |
Dividends (net of foreign withholding taxes of $429,660) | | $ | 6,647,149 | |
Income from affiliated securities | | | 225,696 | |
| | | | |
Total investment income | | | 6,872,845 | |
| | | | |
| |
Expenses | | | | |
Advisory fee | | | 2,238,948 | |
Custody and accounting fees | | | 17,542 | |
Professional fees | | | 40,019 | |
Shareholder report expenses | | | 5,056 | |
Trustees’ fees and expenses | | | 20,186 | |
Other fees and expenses | | | 9,053 | |
| | | | |
Total expenses | | | 2,330,804 | |
Less: Fee waivers and/or expense reimbursements | | | (126,647 | ) |
| | | | |
Net expenses | | | 2,204,157 | |
| | | | |
Net investment income | | | 4,668,688 | |
| | | | |
| |
Realized and unrealized gains (losses) on investments | | | | |
Net realized gains on: | |
Unaffiliated securities | | | 14,608,305 | |
Affiliated securities | | | 2 | |
| | | | |
Net realized gains on investments | | | 14,608,307 | |
Net change in unrealized gains (losses) on investments | | | (25,082,549 | ) |
| | | | |
Net realized and unrealized gains (losses) on investments | | | (10,474,242 | ) |
| | | | |
Net decrease in net assets resulting from operations | | $ | (5,805,554 | ) |
| | | | |
The accompanying notes are an integral part of these financial statements.
Wells Fargo C&B Large Cap Value Portfolio | 29
Statement of changes in net assets
| | | | | | | | |
| | | Year ended
May 31, 2020 | | | Year ended
May 31, 2019 | |
|
Operations | |
Net investment income | | $ | 4,668,688 | | | $ | 5,213,964 | |
Net realized gains on investments | | | 14,608,307 | | | | 23,339,628 | |
Net change in unrealized gains (losses) on investments | | | (25,082,549 | ) | | | (19,832,017 | ) |
| | | | |
Net increase (decrease) in net assets resulting from operations | | | (5,805,554 | ) | | | 8,721,575 | |
| | | | |
| | |
Capital transactions | | | | | | | | |
Transactions in investors’ beneficial interests | |
Contributions | | | 41,745,884 | | | | 105,704,905 | |
Withdrawals | | | (99,923,052 | ) | | | (145,734,521 | ) |
| | | | |
Net decrease in net assets resulting from capital transactions | | | (58,177,168 | ) | | | (40,029,616 | ) |
| | | | |
Total decrease in net assets | | | (63,982,722 | ) | | | (31,308,041 | ) |
| | | | |
| | |
Net assets | | | | | | | | |
Beginning of period | | | 350,895,076 | | | | 382,203,117 | |
| | | | |
End of period | | $ | 286,912,354 | | | $ | 350,895,076 | |
| | | | |
The accompanying notes are an integral part of these financial statements.
30 | Wells Fargo C&B Large Cap Value Portfolio
Financial highlights
| | | | | | | | | | | | | | | | | | | | |
| | | Year ended May 31 | |
| | | 2020 | | | 2019 | | | 2018 | | | 2017 | | | 2016 | |
Total return | | | (3.40 | )% | | | 1.80 | % | | | 6.65 | % | | | 19.17 | % | | | 0.35 | % |
Ratios to average net assets (annualized) | | | | | | | | | | | | | | | | | | | | |
Gross expenses | | | 0.68 | % | | | 0.67 | % | | | 0.67 | % | | | 0.68 | % | | | 0.68 | % |
Net expenses | | | 0.64 | % | | | 0.65 | % | | | 0.66 | % | | | 0.68 | % | | | 0.68 | % |
Net investment income | | | 1.36 | % | | | 1.27 | % | | | 1.02 | % | | | 1.09 | % | | | 1.33 | % |
Supplemental data | | | | | | | | | | | | | | | | | | | | |
Portfolio turnover rate | | | 33 | % | | | 47 | % | | | 42 | % | | | 89 | % | | | 29 | % |
The accompanying notes are an integral part of these financial statements.
Wells Fargo C&B Large Cap Value Portfolio | 31
Notes to financial statements
1. ORGANIZATION
Wells Fargo Master Trust (the “Trust”), a Delaware statutory trust organized on March 10, 1999, is an open-end management investment company registered under the Investment Company Act of 1940, as amended (the “1940 Act”). As an investment company, the Trust follows the accounting and reporting guidance in Financial Accounting Standards Board (“FASB”) Accounting Standards Codification Topic 946, Financial Services – Investment Companies. These financial statements report on the Wells Fargo C&B Large Cap Value Portfolio (the “Portfolio”) which is a diversified series of the Trust.
2. SIGNIFICANT ACCOUNTING POLICIES
The following significant accounting policies, which are consistently followed in the preparation of the financial statements of the Portfolio, are in conformity with U.S. generally accepted accounting principles which require management to make estimates and assumptions that affect the reported amounts of assets and liabilities, disclosure of contingent assets and liabilities at the date of the financial statements, and the reported amounts of revenues and expenses during the reporting period. Actual results could differ from those estimates.
Securities valuation
All investments are valued each business day as of the close of regular trading on the New York Stock Exchange (generally 4 p.m. Eastern Time), although the Portfolio may deviate from this calculation time under unusual or unexpected circumstances.
Equity securities that are listed on a foreign or domestic exchange or market are valued at the official closing price or, if none, the last sales price. If no sale occurs on the principal exchange or market that day, a fair value price will be determined in accordance with the Portfolio’s Valuation Procedures.
Investments in registered open-end investment companies are valued at net asset value. Interests in non-registered investment companies that are redeemable at net asset value are fair valued normally at net asset value.
Investments which are not valued using any of the methods discussed above are valued at their fair value, as determined in good faith by the Board of Trustees of the Portfolio. The Board of Trustees has established a Valuation Committee comprised of the Trustees and has delegated to it the authority to take any actions regarding the valuation of portfolio securities that the Valuation Committee deems necessary or appropriate, including determining the fair value of portfolio securities, unless the determination has been delegated to the Wells Fargo Asset Management Pricing Committee at Wells Fargo Funds Management, LLC (“Funds Management”). The Board of Trustees retains the authority to make or ratify any valuation decisions or approve any changes to the Valuation Procedures as it deems appropriate. On a quarterly basis, the Board of Trustees receives reports on any valuation actions taken by the Valuation Committee or the Wells Fargo Asset Management Pricing Committee which may include items for ratification.
Securities lending
The Portfolio may lend its securities from time to time in order to earn additional income in the form of fees or interest on securities received as collateral or the investment of any cash received as collateral. When securities are on loan, the Portfolio receives interest or dividends on those securities. Cash collateral received in connection with its securities lending transactions is invested in Securities Lending Cash Investments, LLC (the “Securities Lending Fund”). Investments in Securities Lending Fund are valued at the evaluated bid price provided by an independent pricing service. Income earned from investment in the Securities Lending Fund (net of fees and rebates), if any, is included in income from affiliated securities on the Statement of Operations.
In a securities lending transaction, the net asset value of the Portfolio is affected by an increase or decrease in the value of the securities loaned and by an increase or decrease in the value of the instrument in which collateral is invested. The amount of securities lending activity undertaken by the Portfolio fluctuates from time to time. The Portfolio has the right under the lending agreement to recover the securities from the borrower on demand. In the event of default or bankruptcy by the borrower, the Portfolio may be prevented from recovering the loaned securities or gaining access to the collateral or may experience delays or costs in doing so. In such an event, the terms of the agreement allow the unaffiliated securities lending agent to use the collateral to purchase replacement securities on behalf of the Portfolio or pay the Portfolio the market value of the loaned securities. The Portfolio bears the risk of loss with respect to depreciation of its investment of the cash collateral.
Security transactions and income recognition
Securities transactions are recorded on a trade date basis. Realized gains or losses are recorded on the basis of identified cost.
Dividend income is recognized on the ex-dividend date. Dividend income is recorded net of foreign taxes withheld where recovery of such taxes is not assured.
32 | Wells Fargo C&B Large Cap Value Portfolio
Notes to financial statements
Federal and other taxes
The Portfolio is treated as a separate entity for federal income tax purposes. The Portfolio is not required to pay federal income taxes on its net investment income and net capital gains as it is treated as a partnership for federal income tax purposes. All dividends, gains and losses of the Portfolio are deemed to have been “passed through” to the interest holders in proportion to their holdings of the Portfolio regardless of whether dividends and gains have been distributed by the Portfolio.
The Portfolio’s income tax returns and all financial records supporting those returns for the prior three fiscal years are subject to examination by the federal revenue authority. Management has analyzed the Portfolio’s tax positions taken on federal, state, and foreign tax returns for all open tax years and does not believe that there are any uncertain tax positions that require recognition of a tax liability.
As of May 31, 2020, the aggregate cost of all investments for federal income tax purposes was $258,023,122 and the unrealized gains (losses) consisted of:
| | | | |
| |
Gross unrealized gains | | $ | 58,132,907 | |
| |
Gross unrealized losses | | | (31,570,647 | ) |
| |
Net unrealized gains | | $ | 26,562,260 | |
3. FAIR VALUATION MEASUREMENTS
Fair value measurements of investments are determined within a framework that has established a fair value hierarchy based upon the various data inputs utilized in determining the value of the Portfolio’s investments. The three-level hierarchy gives the highest priority to unadjusted quoted prices in active markets for identical assets or liabilities (Level 1) and the lowest priority to unobservable inputs (Level 3). The Portfolio’s investments are classified within the fair value hierarchy based on the lowest level of input that is significant to the fair value measurement. The inputs are summarized into three broad levels as follows:
| ∎ | | Level 1 – quoted prices in active markets for identical securities |
| ∎ | | Level 2 – other significant observable inputs (including quoted prices for similar securities, interest rates, prepayment speeds, credit risk, etc.) |
| ∎ | | Level 3 – significant unobservable inputs (including the Portfolio’s own assumptions in determining the fair value of investments) |
The inputs or methodologies used for valuing investments in securities are not necessarily an indication of the risk associated with investing in those securities.
The following is a summary of the inputs used in valuing the Portfolio’s assets and liabilities as of May 31, 2020:
| | | | | | | | | | | | | | | | |
| | | | |
| | | Quoted prices
(Level 1) | | | Other significant
observable inputs
(Level 2) | | | Significant
unobservable inputs (Level 3) | | | Total | |
Assets | | | | | | | | | | | | | | | | |
Investments in: | | | | | | | | | | | | | | | | |
| | | | |
Common stocks | | | | | | | | | | | | | | | | |
| | | | |
Communication services | | $ | 15,410,910 | | | $ | 0 | | | $ | 0 | | | $ | 15,410,910 | |
| | | | |
Consumer discretionary | | | 13,332,266 | | | | 0 | | | | 0 | | | | 13,332,266 | |
| | | | |
Consumer staples | | | 5,091,184 | | | | 0 | | | | 0 | | | | 5,091,184 | |
| | | | |
Energy | | | 7,285,107 | | | | 0 | | | | 0 | | | | 7,285,107 | |
| | | | |
Financials | | | 96,457,864 | | | | 0 | | | | 0 | | | | 96,457,864 | |
| | | | |
Health care | | | 42,358,868 | | | | 0 | | | | 0 | | | | 42,358,868 | |
| | | | |
Industrials | | | 56,633,417 | | | | 0 | | | | 0 | | | | 56,633,417 | |
| | | | |
Information technology | | | 27,445,498 | | | | 0 | | | | 0 | | | | 27,445,498 | |
| | | | |
Materials | | | 9,036,961 | | | | 0 | | | | 0 | | | | 9,036,961 | |
| | | | |
Real estate | | | 5,163,252 | | | | 0 | | | | 0 | | | | 5,163,252 | |
| | | | |
Short-term investments | | | | | | | | | | | | | | | | |
| | | | |
Investment companies | | | 6,370,055 | | | | 0 | | | | 0 | | | | 6,370,055 | |
| | | | |
Total assets | | $ | 284,585,382 | | | $ | 0 | | | $ | 0 | | | $ | 284,585,382 | |
Wells Fargo C&B Large Cap Value Portfolio | 33
Notes to financial statements
Additional sector, industry or geographic detail is included in the Portfolio of Investments.
For the year ended May 31, 2020, the Portfolio did not have any transfers into/out of Level 3.
4. TRANSACTIONS WITH AFFILIATES AND OTHER EXPENSES
Advisory fee
The Trust has entered into an advisory contract with Funds Management, an indirect wholly owned subsidiary of Wells Fargo & Company (“Wells Fargo”). The adviser is responsible for implementing investment policies and guidelines and for supervising the subadviser, who is responsible for day-to-day portfolio management of the Portfolio. Pursuant to the contract, Funds Management is entitled to receive an annual advisory fee at the following annual rate based on the Portfolio’s average daily net assets:
| | | | |
| |
| Average daily net assets | | Advisory fee | |
| |
First $500 million | | | 0.650 | % |
| |
Next $500 million | | | 0.625 | |
| |
Next $1 billion | | | 0.600 | |
| |
Next $2 billion | | | 0.575 | |
| |
Next $4 billion | | | 0.550 | |
| |
Next $4 billion | | | 0.525 | |
| |
Next $4 billion | | | 0.500 | |
| |
Over $16 billion | | | 0.475 | |
For the year ended May 31, 2020, the advisory fee was equivalent to an annual rate of 0.65% of the Portfolio’s average daily net assets.
Funds Management has retained the services of a subadviser to provide daily portfolio management to the Portfolio. The fee for subadvisory services is borne by Funds Management. Cooke & Bieler, L.P., which is not an affiliate of Funds Management, is the subadviser to the Portfolio and is entitled to receive a fee from Funds Management at an annual rate starting at 0.38% and declining to 0.30% as the average daily net assets of the Portfolio increase.
Funds Management has voluntarily waived and/or reimbursed advisory fees to reduce the net operating expense ratio of the Portfolio.
5. INVESTMENT PORTFOLIO TRANSACTIONS
Purchases and sales of investments, excluding U.S. government obligations (if any) and short-term securities, for the year ended May 31, 2020 were $108,459,867 and $155,729,286, respectively.
6. SECURITIES LENDING TRANSACTIONS
The Portfolio lends its securities through an unaffiliated securities lending agent and receives collateral in the form of cash or securities with a value at least equal to the value of the securities on loan. The value of the loaned securities is determined at the close of each business day and any increases or decreases in the required collateral are exchanged between the Portfolio and the counterparty on the next business day. Cash collateral received is invested in the Securities Lending Fund which seeks to provide a positive return compared to the daily Fed Funds Open Rate by investing in high-quality, U.S. dollar-denominated short-term money market instruments and is exempt from registration under Section 3(c)(7) of the 1940 Act. Securities Lending Fund is managed by Funds Management and is subadvised by Wells Capital Management Incorporated (“WellsCap”), an affiliate of Funds Management and an indirect wholly owned subsidiary of Wells Fargo. Funds Management receives an advisory fee starting at 0.05% and declining to 0.01% as the average daily net assets of the Securities Lending Fund increase. All of the fees received by Funds Management are paid to WellsCap for its services as subadviser.
In the event of counterparty default or the failure of a borrower to return a loaned security, the Fund has the right to use the collateral to offset any losses incurred. As of May 31, 2020, the Portfolio did not have any securities on loan.
34 | Wells Fargo C&B Large Cap Value Portfolio
Notes to financial statements
7. BANK BORROWINGS
The Trust, along with Wells Fargo Variable Trust and Wells Fargo Funds Trust (excluding the money market funds), are parties to a $280,000,000 revolving credit agreement whereby the Portfolio is permitted to use bank borrowings for temporary or emergency purposes, such as to fund shareholder redemption requests. Interest under the credit agreement is charged to the Portfolio based on a borrowing rate equal to the higher of the Federal Funds rate in effect on that day plus 1.25% or the overnight LIBOR rate in effect on that day plus 1.25%. In addition, an annual commitment fee equal to 0.25% of the unused balance is allocated to each participating fund.
For the year ended May 31, 2020, there were no borrowings by the Portfolio under the agreement.
8. CONCENTRATION RISK
Concentration risks result from exposure to a limited number of sectors. As of the end of the period, the Portfolio invested a concentration of its portfolio in the financials sector. A Portfolio that invests a substantial portion of its assets in any sector may be more affected by changes in that sector than would be a portfolio whose investments are not heavily weighted in any sector.
9. INDEMNIFICATION
Under the Portfolio’s organizational documents, the officers and Trustees have been granted certain indemnification rights against certain liabilities that may arise out of performance of their duties to the Portfolio. The Portfolio has entered into a separate agreement with each Trustee that converts indemnification rights currently existing under the Portfolio’s organizational documents into contractual rights that cannot be changed in the future without the consent of the Trustee. Additionally, in the normal course of business, the Portfolio may enter into contracts with service providers that contain a variety of indemnification clauses. The Portfolio’s maximum exposure under these arrangements is dependent on future claims that may be made against the Portfolio and, therefore, cannot be estimated.
10. NEW ACCOUNTING PRONOUNCEMENT
In August 2018, FASB issued Accounting Standards Update (“ASU”) No. 2018-13, Fair Value Measurement (Topic 820) Disclosure Framework—Changes to the Disclosure Requirements for Fair Value Measurement. ASU 2018-13 updates the disclosure requirements for fair value measurements by modifying or removing certain disclosures and adding certain new disclosures. The amendments are effective for fiscal years, and interim periods within those fiscal years, beginning after December 15, 2019. Early adoption is permitted. Management has adopted the removal and modification of disclosures early, as permitted, and will adopt the additional new disclosures at the effective date.
11. CORONAVIRUS (COVID-19) PANDEMIC
On March 11, 2020, the World Health Organization announced that it had made the assessment that coronavirus disease 2019 (“COVID-19”) is a pandemic. The impacts of COVID-19 are adversely affecting the entire global economy, individual companies and investment products, and the market in general. There is significant uncertainty around the extent and duration of business disruptions related to COVID-19 and the impacts may be short term or may last for an extended period of time. The risk of further spreading of COVID-19 has led to significant uncertainty and volatility in the financial markets. The value of the Portfolio and the securities in which the Portfolio invests have generally been adversely affected by impacts caused by COVID-19.
Wells Fargo C&B Large Cap Value Portfolio | 35
Report of independent registered public accounting firm
TO THE INTEREST HOLDERS OF THE PORTFOLIO AND BOARD OF TRUSTEES WELLS FARGO MASTER TRUST:
Opinion on the Financial Statements
We have audited the accompanying statement of assets and liabilities of Wells Fargo C&B Large Cap Value Portfolio (the Portfolio), one of the portfolios constituting Wells Fargo Master Trust, including the portfolio of investments as of May 31, 2020, the related statement of operations for the year then ended, the statements of changes in net assets for each of the years in the two-year period then ended, and the related notes (collectively, the financial statements) and the financial highlights for each of the years in the five-year period then ended. In our opinion, the financial statements and financial highlights present fairly, in all material respects, the financial position of the Portfolio as of May 31, 2020, the results of its operations for the year then ended, the changes in its net assets for each of the years in the two-year period then ended, and the financial highlights for each of the years in the five-year period then ended, in conformity with U.S. generally accepted accounting principles.
Basis for Opinion
These financial statements and financial highlights are the responsibility of the Portfolio’s management. Our responsibility is to express an opinion on these financial statements and financial highlights based on our audits. We are a public accounting firm registered with the Public Company Accounting Oversight Board (United States) (PCAOB) and are required to be independent with respect to the Portfolio in accordance with the U.S. federal securities laws and the applicable rules and regulations of the Securities and Exchange Commission and the PCAOB.
We conducted our audits in accordance with the standards of the PCAOB. Those standards require that we plan and perform the audit to obtain reasonable assurance about whether the financial statements and financial highlights are free of material misstatement, whether due to error or fraud. Our audits included performing procedures to assess the risks of material misstatement of the financial statements and financial highlights, whether due to error or fraud, and performing procedures that respond to those risks. Such procedures included examining, on a test basis, evidence regarding the amounts and disclosures in the financial statements and financial highlights. Such procedures also included confirmation of securities owned as of May 31, 2020, by correspondence with the custodian, transfer agent and brokers, or by other appropriate auditing procedures. Our audits also included evaluating the accounting principles used and significant estimates made by management, as well as evaluating the overall presentation of the financial statements and financial highlights. We believe that our audits provide a reasonable basis for our opinion.
We have not been able to determine the specific year that we began serving as the auditor of one or more Wells Fargo Funds investment companies; however we are aware that we have served as the auditor of one or more Wells Fargo Funds investment companies since at least 1955.
Boston, Massachusetts
July 29, 2020
36 | Wells Fargo C&B Large Cap Value Portfolio
Other information (unaudited)
TAX INFORMATION
For corporate shareholders, pursuant to Section 854 of the Internal Revenue Code, 62.59% of ordinary income dividends qualify for the corporate dividends-received deduction for the fiscal year ended May 31, 2020.
Pursuant to Section 852 of the Internal Revenue Code, $18,784,460 was designated as a 20% rate gain distribution for the fiscal year ended May 31, 2020.
Pursuant to Section 854 of the Internal Revenue Code, $5,657,756 of income dividends paid during the fiscal year ended May 31, 2020 has been designated as qualified dividend income (QDI).
For the fiscal year ended May 31, 2020, $123,486 has been designated as interest-related dividends for nonresident alien shareholders pursuant to Section 871 of the Internal Revenue Code.
For the fiscal year ended May 31, 2020, $3,658,429 has been designated as short-term capital gain dividends for nonresident alien shareholders pursuant to Section 871 of the Internal Revenue Code.
PROXY VOTING INFORMATION
A description of the policies and procedures used to determine how to vote proxies relating to portfolio securities is available, upon request, by calling 1-800-222-8222, visiting our website at wfam.com, or visiting the SEC website at sec.gov. Information regarding how the proxies related to portfolio securities were voted during the most recent 12-month period ended June 30 is available on the website at wfam.com or by visiting the SEC website at sec.gov.
QUARTERLY PORTFOLIO HOLDINGS INFORMATION
The Fund and Portfolio file their complete schedule of portfolio holdings with the SEC for the first and third quarters of each fiscal year as an exhibit to its reports on Form N-PORT. Shareholders may view the filed Form N-PORT by visiting the SEC website at sec.gov.
Wells Fargo C&B Large Cap Value Fund | 37
Other information (unaudited)
BOARD OF TRUSTEES AND OFFICERS
Each of the Trustees and Officers1 listed in the table below acts in identical capacities for each fund in the Wells Fargo family of funds, which consists of 147 mutual funds comprising the Wells Fargo Funds Trust, Wells Fargo Variable Trust, Wells Fargo Master Trust and four closed-end funds (collectively the “Fund Complex”). This table should be read in conjunction with the Prospectus and the Statement of Additional Information2. The mailing address of each Trustee and Officer is 525 Market Street, 12th Floor, San Francisco, CA 94105. Each Trustee and Officer serves an indefinite term, however, each Trustee serves such term until reaching the mandatory retirement age established by the Trustees.
Independent Trustees
| | | | | | |
Name and year of birth | | Position held and length of service* | | Principal occupations during past five years or longer | | Current other public company or investment
company
directorships |
| | | |
William R. Ebsworth (Born 1957) | | Trustee, since 2015 | | Retired. From 1984 to 2013, equities analyst, portfolio manager, research director and chief investment officer at Fidelity Management and Research Company in Boston, Tokyo, and Hong Kong, and retired in 2013 as Chief Investment Officer of Fidelity Strategic Advisers, Inc. where he led a team of investment professionals managing client assets. Prior thereto, Board member of Hong Kong Securities Clearing Co., Hong Kong Options Clearing Corp., the Thailand International Fund, Ltd., Fidelity Investments Life Insurance Company, and Empire Fidelity Investments Life Insurance Company. Audit Committee Chair and Investment Committee Chair of the Vincent Memorial Hospital Endowment (non-profit organization). Mr. Ebsworth is a CFA® charterholder. | | N/A |
| | | |
Jane A. Freeman (Born 1953) | | Trustee, since 2015; Chair Liaison, since 2018 | | Retired. From 2012 to 2014 and 1999 to 2008, Chief Financial Officer of Scientific Learning Corporation. From 2008 to 2012, Ms. Freeman provided consulting services related to strategic business projects. Prior to 1999, Portfolio Manager at Rockefeller & Co. and Scudder, Stevens & Clark. Board member of the Harding Loevner Funds from 1996 to 2014, serving as both Lead Independent Director and chair of the Audit Committee. Board member of the Russell Exchange Traded Funds Trust from 2011 to 2012 and the chair of the Audit Committee. Ms. Freeman is also an inactive Chartered Financial Analyst. | | N/A |
| | | |
Isaiah Harris, Jr. (Born 1952) | | Trustee, since 2009; Audit Committee Chairman, since 2019 | | Retired. Chairman of the Board of CIGNA Corporation since 2009, and Director since 2005. From 2003 to 2011, Director of Deluxe Corporation. Prior thereto, President and CEO of BellSouth Advertising and Publishing Corp. from 2005 to 2007, President and CEO of BellSouth Enterprises from 2004 to 2005 and President of BellSouth Consumer Services from 2000 to 2003. Emeritus member of the Iowa State University Foundation Board of Governors. Emeritus Member of the Advisory Board of Iowa State University School of Business. Advisory Board Member, Palm Harbor Academy (private school). Advisory Board Member, Child Evangelism Fellowship (non-profit). Mr. Harris is a certified public accountant (inactive status). | | CIGNA Corporation |
| | | |
Judith M. Johnson (Born 1949) | | Trustee, since 2008; Audit Committee Chairman, from 2009 to 2018 | | Retired. Prior thereto, Chief Executive Officer and Chief Investment Officer of Minneapolis Employees Retirement Fund from 1996 to 2008. Ms. Johnson is an attorney, certified public accountant and a certified managerial accountant. | | N/A |
38 | Wells Fargo C&B Large Cap Value Fund
Other information (unaudited)
| | | | | | |
Name and year of birth | | Position held and length of service* | | Principal occupations during past five years or longer | | Current other public company or investment
company
directorships |
| | | |
David F. Larcker (Born 1950) | | Trustee, since 2009 | | James Irvin Miller Professor of Accounting at the Graduate School of Business, Stanford University, Director of the Corporate Governance Research Initiative and Senior Faculty of The Rock Center for Corporate Governance since 2006. From 2005 to 2008, Professor of Accounting at the Graduate School of Business, Stanford University. Prior thereto, Ernst & Young Professor of Accounting at The Wharton School, University of Pennsylvania from 1985 to 2005. | | N/A |
| | | |
Olivia S. Mitchell (Born 1953) | | Trustee, since 2006; Nominating and Governance Committee Chair, since 2018 | | International Foundation of Employee Benefit Plans Professor, Wharton School of the University of Pennsylvania since 1993. Director of Wharton’s Pension Research Council and Boettner Center on Pensions & Retirement Research, and Research Associate at the National Bureau of Economic Research. Previously, Cornell University Professor from 1978 to 1993. | | N/A |
| | | |
Timothy J. Penny (Born 1951) | | Trustee, since 1996; Chairman, since 2018 | | President and Chief Executive Officer of Southern Minnesota Initiative Foundation, a non-profit organization, since 2007. Member of the Board of Trustees of NorthStar Education Finance, Inc., a non-profit organization, since 2007. | | N/A |
| | | |
James G. Polisson (Born 1959) | | Trustee, since 2018 | | Retired. Chief Marketing Officer, Source (ETF) UK Services, Ltd, from 2015 to 2017. From 2012 to 2015, Principal of The Polisson Group, LLC, a management consulting, corporate advisory and principal investing company. Chief Executive Officer and Managing Director at Russell Investments, Global Exchange Traded Funds from 2010 to 2012. Managing Director of Barclays Global Investors from 1998 to 2010 and Global Chief Marketing Officer for iShares and Barclays Global Investors from 2000 to 2010. Trustee of the San Francisco Mechanics’ Institute, a non-profit organization, from 2013 to 2015. Board member of the Russell Exchange Traded Fund Trust from 2011 to 2012. Director of Barclays Global Investors Holdings Deutschland GmbH from 2006 to 2009. Mr. Polisson is an attorney and has a retired status with the Massachusetts and District of Columbia Bar Associations. | | N/A |
| | | |
Pamela Wheelock (Born 1959) | | Trustee, since January 2020; previously Trustee from January 2018 to July 2019 | | Board member of the Destination Medical Center Economic Development Agency, Rochester, Minnesota since 2019 and Interim President of the McKnight Foundation since 2020. Acting Commissioner, Minnesota Department of Human Services, July 2019 through September 2019. Human Services Manager (part-time), Minnesota Department of Human Services, October 2019 through December 2019. Chief Operating Officer, Twin Cities Habitat for Humanity from 2017 to 2019. Vice President of University Services, University of Minnesota from 2012 to 2016. Prior thereto, on the Board of Directors, Governance Committee and Finance Committee for the Minnesota Philanthropy Partners (Saint Paul Foundation) from 2012 to 2018, Interim Chief Executive Officer of Blue Cross Blue Shield of Minnesota from 2011 to 2012, Chairman of the Board from 2009 to 2012 and Board Director from 2003 to 2015. Vice President, Leadership and Community Engagement, Bush Foundation, Saint Paul, Minnesota (a private foundation) from 2009 to 2011. Executive Vice President and Chief Financial Officer, Minnesota Sports and Entertainment from 2004 to 2009 and Senior Vice President from 2002 to 2004. Executive Vice President of the Minnesota Wild Foundation from 2004 to 2008. Commissioner of Finance, State of Minnesota, from 1999 to 2002. Currently Board Chair of the Minnesota Wild Foundation since 2010. | | N/A |
| * | Length of service dates reflect the Trustee’s commencement of service with the Trust’s predecessor entities, where applicable. |
Wells Fargo C&B Large Cap Value Fund | 39
Other information (unaudited)
Officers
| | | | |
Name and year of birth | | Position held and length of service | | Principal occupations during past five years or longer |
| | |
Andrew Owen (Born 1960) | | President, since 2017 | | Executive Vice President of Wells Fargo & Company and Head of Affiliated Managers, Wells Fargo Asset Management, since 2014. In addition, Mr. Owen is currently President, Chief Executive Officer and Director of Wells Fargo Funds Management, LLC since 2017. Prior thereto, Executive Vice President responsible for marketing, investments and product development for Wells Fargo Funds Management, LLC, from 2009 to 2014. |
| | |
Nancy Wiser1 (Born 1967) | | Treasurer, since 2012 | | Executive Vice President of Wells Fargo Funds Management, LLC since 2011. Chief Operating Officer and Chief Compliance Officer at LightBox Capital Management LLC, from 2008 to 2011. |
| | |
Michelle Rhee (Born 1966) | | Chief Legal Officer, since 2019 | | Secretary of Wells Fargo Funds Management, LLC, Chief Legal Counsel of Wells Fargo Asset Management and Assistant General Counsel of Wells Fargo Bank, N.A. since 2018. Associate General Counsel and Managing Director of Bank of America Corporation from 2004 to 2018. |
| | |
Catherine Kennedy (Born 1969) | | Secretary, since 2019 | | Vice President of Wells Fargo Funds Management, LLC and Senior Counsel of the Wells Fargo Legal Department since 2010. Vice President and Senior Counsel of Evergreen Investment Management Company, LLC from 1998 to 2010. |
| | |
Michael H. Whitaker (Born 1967) | | Chief Compliance Officer, since 2016 | | Chief Compliance Officer of Wells Fargo Asset Management since 2016. Senior Vice President and Chief Compliance Officer for Fidelity Investments from 2007 to 2016. |
| | |
David Berardi (Born 1975) | | Assistant Treasurer, since 2009 | | Vice President of Wells Fargo Funds Management, LLC since 2009. Vice President of Evergreen Investment Management Company, LLC from 2008 to 2010. Manager of Fund Reporting and Control for Evergreen Investment Management Company, LLC from 2004 to 2010. |
| | |
Jeremy DePalma1 (Born 1974) | | Treasurer, since 2012 | | Senior Vice President of Wells Fargo Funds Management, LLC since 2009. Senior Vice President of Evergreen Investment Management Company, LLC from 2008 to 2010 and head of the Fund Reporting and Control Team within Fund Administration from 2005 to 2010. |
| 1 | Nancy Wiser acts as Treasurer of 65 funds in the Fund Complex. Jeremy DePalma acts as the Treasurer of 82 funds in the Fund Complex. |
| 2 | The Statement of Additional Information includes additional information about the Trustees and is available, without charge, upon request, by calling 1-800-222-8222 or by visiting the website at wfam.com. |
40 | Wells Fargo C&B Large Cap Value Fund
Other information (unaudited)
BOARD CONSIDERATION OF INVESTMENT MANAGEMENT, ADVISORY AND SUB-ADVISORY AGREEMENTS:
Wells Fargo C&B Large Cap Value Fund and Wells Fargo C&B Large Cap Value Portfolio
Under the Investment Company Act of 1940 (the “1940 Act”), the Board of Trustees (each, a “Board” and collectively, the “Boards”) of each of Wells Fargo Funds Trust (“Funds Trust”) and Wells Fargo Master Trust (“Master Trust”, and collectively, the “Trusts”) must determine annually whether to approve the continuation of the Trusts’ investment management, advisory and sub-advisory agreements, as applicable. In this regard, at a Board meeting held on May 26, 2020 and May 28, 2020 (together, the “Meeting”), the Funds Trust Board, all the members of which have no direct or indirect interest in the investment management agreement and are not “interested persons” of the Trusts, as defined in the 1940 Act (the “Independent Trustees”), reviewed and approved for Wells Fargo C&B Large Cap Value Fund (the “Gateway Fund”) an investment management agreement (the “Gateway Fund Management Agreement”) with Wells Fargo Funds Management, LLC (“Funds Management”).
At the Meeting, the Master Trust Board, all the members of which have no direct or indirect interest in the investment advisory and sub-advisory agreements and are Independent Trustees, reviewed and approved: (i) an investment advisory agreement (the “Master Portfolio Advisory Agreement”) with Funds Management for Wells Fargo C&B Large Cap Value Portfolio, a portfolio of Master Trust (the “Master Portfolio”); and (ii) an investment sub-advisory agreement (the “Sub-Advisory Agreement”) with Cooke & Bieler L.P. (the “Sub-Adviser”) for the Master Portfolio.
The Gateway Fund and the Master Portfolio are collectively referred to as the “Funds.” The Gateway Fund Management Agreement, the Master Portfolio Advisory Agreement and the Sub-Advisory Agreement are collectively referred to as the “Advisory Agreements.”
The Gateway Fund is a gateway feeder fund that invest substantially all of its assets in the Master Portfolio. The Master Portfolio has a substantially similar investment objective and substantially similar investment strategies to the Gateway Fund. Information provided to the Boards regarding the Gateway Fund is also applicable to the Master Portfolio, as relevant.
At the Meeting, the Boards considered the factors and reached the conclusions described below relating to the selection of Funds Management and the Sub-Adviser and the approval of the Advisory Agreements. Prior to the Meeting, including at a Board meeting held in April 2020, the Trustees conferred extensively among themselves and with representatives of Funds Management about these matters. Also, the Boards have adopted a team-based approach, with each team consisting of a sub-set of Trustees, to assist the full Boards in the discharge of their duties in reviewing investment performance and other matters throughout the year. The Independent Trustees were assisted in their evaluation of the Advisory Agreements by independent legal counsel, from whom they received separate legal advice and with whom they met separately.
In providing information to the Boards, Funds Management and the Sub-Adviser were guided by a detailed set of requests for information submitted to them by independent legal counsel on behalf of the Independent Trustees at the start of the Boards’ annual contract renewal process earlier in 2020. In considering and approving the Advisory Agreements, the Trustees considered the information they believed relevant, including but not limited to the information discussed below. The Boards considered not only the specific information presented in connection with the Meeting, but also the knowledge gained over time through interaction with Funds Management and the Sub-Adviser about various topics. In this regard, the Boards reviewed reports of Funds Management at each of their quarterly meetings, which included, among other things, portfolio reviews and investment performance reports. In addition, the Boards and the teams mentioned above confer with portfolio managers at various times throughout the year. The Boards did not identify any particular information or consideration that was all-important or controlling, and each individual Trustee may have attributed different weights to various factors.
After its deliberations, the Funds Trust Board unanimously approved the continuation of the Gateway Fund Management Agreement for a one-year period. Additionally, after its deliberations, the Master Trust Board unanimously approved the continuation of the Master Portfolio Advisory Agreement and the Sub-Advisory Agreement, each for a one-year term. The Boards also determined that the compensation payable to Funds Management and the Sub-Adviser was reasonable. The Boards considered the approval of the Advisory Agreements for the Funds as part of their consideration of agreements for funds across the complex, but their approvals were made on a fund-by-fund basis. The following summarizes a number of important, but not necessarily all, factors considered by the Boards in support of their approvals.
Nature, Extent and Quality of Services
The Boards received and considered various information regarding the nature, extent and quality of services provided to the Funds by Funds Management and the Sub-Adviser under the Advisory Agreements. This information included a description of
Wells Fargo C&B Large Cap Value Fund | 41
Other information (unaudited)
the investment advisory services and Fund-level administrative services, as well as, among other things, a summary of the background and experience of senior management of Wells Fargo Asset Management (“WFAM”), of which Funds Management is a part, and a summary of investments made in the business of WFAM. The Boards also received a description of Funds Management’s and the Sub-Adviser’s business continuity plans and of their approaches to data privacy and cybersecurity, and related testing. The Boards also received and reviewed information about Funds Management’s role as administrator of the Funds’ liquidity risk management program, Funds Management’s approach to risk management, and Funds Management’s intermediary and vendor oversight program. The Boards also considered the qualifications, background, tenure and responsibilities of each of the portfolio managers primarily responsible for the day-to-day portfolio management of the Funds.
The Boards evaluated the ability of Funds Management and the Sub-Adviser to attract and retain qualified investment professionals, including research, advisory and supervisory personnel. The Boards further considered the compliance programs and compliance records of Funds Management and the Sub-Adviser. In addition, the Boards took into account the full range of services provided to the Funds by Funds Management and its affiliates.
Fund Investment Performance and Expenses
The Boards considered the investment performance results for each of the Funds over various time periods ended December 31, 2019. The Boards also considered more current results for various time periods ended March 31, 2020. The Boards considered these results in comparison to the investment performance of funds in a universe that was determined by Broadridge Inc. (“Broadridge”) to be similar to the Gateway Fund (the “Universe”), and in comparison to the Gateway Fund’s benchmark index and to other comparative data. Broadridge is an independent provider of investment company data. The Boards received a description of the methodology used by Broadridge to select the mutual funds in the performance Universe. The Funds Trust Board noted that the investment performance of the Gateway Fund (Administrator Class) was higher than the average investment performance of its Universe for the one-, three-, five- and ten-year periods ended December 31, 2019. The Funds Trust Board also noted that the investment performance of the Gateway Fund (Administrator Class) was higher than the average investment performance of its Universe for all periods ended March 31, 2020. The Funds Trust Board also noted that the investment performance of the Gateway Fund was higher than or in range of its benchmark index, the Russell 1000® Value Index, for all periods ended December 31, 2019. The Funds Trust Board also noted that the investment performance of the Gateway Fund was in range of its benchmark index, the Russell 1000® Value Index, for the five-year period ended March 31, 2020, and lower than its benchmark index for the one-, three- and ten-year periods ended March 31, 2020.
The Master Trust Board took note of the investment performance of the Master Portfolio in the context of reviewing the investment performance of the Gateway Fund.
The Funds Trust Board received information concerning, and discussed factors contributing to, the underperformance of the Gateway Fund relative to its benchmark index for the periods identified above. The Funds Trust Board took note of the explanations for the relative underperformance during these periods, including with respect to investment decisions and market factors that affected the Gateway Fund’s investment performance. The Board also took note of the Gateway Fund’s outperformance relative to the Universe.
The Funds Trust Board also received and considered information regarding the Gateway Fund’s net operating expense ratios, which include fees and expenses of the Master Portfolio, and their various components, including actual management fees assessed at the Gateway Fund and Master Portfolio levels, custodian and other non-management fees, and Rule 12b-1 and non-Rule 12b-1 shareholder service fees. The Funds Trust Board considered these ratios in comparison to the median ratios of funds in class-specific expense groups that were determined by Broadridge to be similar to the Gateway Fund (the “Groups”). The Funds Trust Board received a description of the methodology used by Broadridge to select the mutual funds in the expense Groups and an explanation of how funds comprising expense groups and their expense ratios may vary from year-to-year. Based on the Broadridge reports, the Funds Trust Board noted that the net operating expense ratios of the Gateway Fund were lower than or equal to the median net operating expense ratios of its expense Groups for each share class.
With respect to the Master Portfolio, the Master Trust Board reviewed the fee rates that are payable to Funds Management for investment advisory services (as discussed below), which are the only fees charged at the Master Portfolio level, relative to a corresponding expense Group.
The Boards took into account the Funds’ investment performance and expense information provided to them among the factors considered in deciding to re-approve the Advisory Agreements.
Investment Management, Advisory and Sub-Advisory Fee Rates
The Funds Trust Board noted that Funds Management receives no advisory fees from the Gateway Fund as long as the Gateway Fund continues to invest all (or substantially all) of its assets in a single master portfolio. If the Gateway Fund were to change its
42 | Wells Fargo C&B Large Cap Value Fund
Other information (unaudited)
investment structure so that it began investing in two or more master portfolios (a fund-of-funds), Funds Management would be entitled to receive an annual fee of 0.25% of the Gateway Fund’s average daily net assets for providing investment advisory services to the Gateway Fund, including allocating the Gateway Fund’s assets to the Master Portfolio.
The Funds Trust Board reviewed and considered the contractual fee rates that are payable by the Gateway Fund to Funds Management under the Gateway Fund Management Agreement for management services (other than investment advisory services), as well as the contractual fee rates payable by the Gateway Fund to Funds Management for class-level administrative services under a Class-Level Administration Agreement, which include, among other things, class-level transfer agency and sub-transfer agency costs (collectively, the “Management Rates”).
The Master Trust Board reviewed and considered the contractual investment advisory fee rate that is payable by the Master Portfolio to Funds Management for investment advisory services under the Master Portfolio Advisory Agreement (the “Advisory Agreement Rate”). The Master Trust Board also reviewed and considered the contractual investment sub-advisory fee rate that is payable by Funds Management to the Sub-Adviser for investment sub-advisory services (the “Sub-Advisory Agreement Rate”).
Among other information reviewed by the Funds Trust Board was a comparison of the Gateway Fund’s Management Rate, which, for this purpose, includes the advisory fees paid at the Master Portfolio level, with the average contractual investment management fee rates of funds in the expense Groups at a common asset level as well as transfer agency costs of the funds in the expense Groups. The Funds Trust Board noted that the Management Rates of the Gateway Fund were in range of the sum of these average rates for the Gateway Fund’s expense Groups for each share class.
The Master Trust Board reviewed a comparison of the Advisory Agreement Rate of the Master Portfolio with those of other funds in the Master Portfolio’s expense Group at a common asset level. The Master Trust Board noted that the Advisory Agreement Rate of the Master Portfolio was in range of the median rate for the Master Portfolio’s expense Group.
The Master Trust Board also received and considered information about the portions of the total management fees that were retained by Funds Management after payment of the fees to the Sub-Adviser for sub-advisory services. The Master Trust Board considered these amounts in comparison to the median amount retained by advisers to funds in a sub-advised expense universe that was determined by Broadridge to be similar to the Master Portfolio. In assessing the reasonableness of these amounts, the Master Trust Board received and evaluated information about the nature and extent of responsibilities retained and risks assumed by Funds Management and not delegated to or assumed by the Sub-Adviser, and about Funds Management’s on-going oversight services. The Master Trust Board also considered that the sub-advisory fees paid to the Sub-Adviser had been negotiated by Funds Management on an arm’s length basis.
The Boards also received and considered information about the nature and extent of services offered and fee rates charged by Funds Management and the Sub-Adviser to other types of clients with investment strategies similar to those of the Funds. In this regard, the Boards received information about the significantly greater scope of services, and compliance, reporting and other legal burdens and risks of managing proprietary mutual funds compared with those associated with managing assets of other types of clients, including third-party sub-advised fund clients and non-mutual fund clients such as institutional separate accounts.
Based on its consideration of the factors and information it deemed relevant, including those described here, the Funds Trust Board determined that the compensation payable to Funds Management under the Gateway Fund Management Agreement was reasonable, and the Master Trust Board determined that the compensation payable to Funds Management under the Master Portfolio Advisory Agreement and to the Sub-Adviser under the Sub-Advisory Agreement was reasonable.
Profitability
The Boards received and considered information concerning the profitability of Funds Management, as well as the profitability of both WFAM and Wells Fargo & Co. (“Wells Fargo”) from providing services to the fund family as a whole. Funds Management reported on the methodologies and estimates used in calculating profitability, including a description of the methodology used to allocate certain expenses. Among other things, the Boards noted that the levels of profitability reported on a fund-by-fund basis varied widely, depending on factors such as the size, type and age of fund. The Boards did not consider profitability with respect to the Sub-Adviser, as the sub-advisory fees paid to the Sub-Adviser had been negotiated by Funds Management on an arm’s-length basis.
Based on its review, the Boards did not deem the profits reported by Funds Management, WFAM or Wells Fargo from services provided to the Funds to be at a level that would prevent the Boards from approving the continuation of the Advisory Agreements.
Wells Fargo C&B Large Cap Value Fund | 43
Other information (unaudited)
Economies of Scale
The Boards received and considered information about the potential for Funds Management to experience economies of scale in the provision of management services to the Funds, the difficulties of calculating economies of scale at an individual fund level, and the extent to which potential scale benefits are shared with shareholders. The Boards noted the existence of breakpoints in the Master Portfolio’s advisory fee structure and the Gateway Fund’s management fee structure, which operate generally to reduce the Funds’ expense ratios as the Funds grow in size, and the size of the Master Portfolio and the Gateway Fund, respectively, in relation to such breakpoints. The Boards considered that, in addition to advisory fee and management fee breakpoints, Funds Management shares potential economies of scale from its management business in a variety of ways, including through fee waiver and expense reimbursement arrangements, services that benefit shareholders, competitive management fee rates set at the outset without regard to breakpoints, and investments in the business intended to enhance services available to shareholders.
The Boards concluded that Funds Management’s arrangements with respect to each Fund, including contractual breakpoints, constituted a reasonable approach to sharing potential economies of scale with the Funds and their shareholders.
Other Benefits to Funds Management and the Sub-Adviser
The Boards received and considered information regarding potential “fall-out” or ancillary benefits received by Funds Management, the Sub-Adviser, and their affiliates as a result of their relationships with the Funds. Ancillary benefits could include, among others, benefits directly attributable to other relationships with the Funds and benefits potentially derived from an increase in Funds Management’s and the Sub-Adviser’s business as a result of their relationships with the Funds. The Boards noted that various affiliates of Funds Management may receive distribution-related fees, shareholder servicing payments and sub-transfer agency fees in respect of shares sold or held through them and services provided.
The Boards also reviewed information about soft dollar credits earned and utilized by the Sub-Adviser, fees earned by Funds Management and its affiliate from managing a private investment vehicle for the fund family’s securities lending collateral, and commissions earned by an affiliated broker from portfolio transactions.
Based on their consideration of the factors and information they deemed relevant, including those described here, the Boards did not find that any ancillary benefits received by Funds Management, the Sub-Adviser, and their affiliates were unreasonable.
Conclusion
At the Meeting, after considering the above-described factors and based on its deliberations and its evaluation of the information described above, the Funds Trust Board unanimously approved the continuation of the Gateway Fund Management Agreement for a one-year period. Additionally, after considering the above-described factors and based on its deliberations and its evaluation of the information described above, the Master Trust Board unanimously approved the continuation of the Master Portfolio Advisory Agreement and the Sub-Advisory Agreement, each for a one-year term. The Boards also determined that the compensation payable to Funds Management and the Sub-Adviser was reasonable.
44 | Wells Fargo C&B Large Cap Value Fund
Other information (unaudited)
LIQUIDITY RISK MANAGEMENT PROGRAM
In accordance with Rule 22e-4 under the Investment Company Act of 1940, as amended (the “Liquidity Rule”), each of Wells Fargo Funds Trust and Wells Fargo Master Trust (each a “Trust”) has adopted and implemented a liquidity risk management program (the “Program”) on behalf of each of its non-money market series, including the Fund and the Portfolio, respectively, which is reasonably designed to assess and manage the Fund’s or the Portfolio’s liquidity risk. “Liquidity risk” is defined as the risk that the Fund or Portfolio is unable to meet redemption requests without significantly diluting remaining investors’ interests. Each Trust’s Board of Trustees (each a “Board”) previously approved the designation of Wells Fargo Funds Management, LLC (“Funds Management”), the Fund’s investment manager and the Portfolio’s investment adviser, as the administrator of the Program, and Funds Management has established a Liquidity Risk Management Council composed of personnel from multiple departments within Funds Management and its affiliates to assist Funds Management in the implementation and on-going administration of the Program.
The Program is comprised of various components designed to support the assessment and/or management of liquidity risk, including: (1) the periodic assessment (no less frequently than annually) of certain factors that influence the Fund’s and the Portfolio’s liquidity risk; (2) the periodic classification (no less frequently than monthly) of the Fund’s and the Portfolio’s investments into one of four liquidity categories that reflect an estimate of their liquidity under current market conditions; (3) a 15% limit on the acquisition of “illiquid investments” (as defined under the Liquidity Rule); (4) to the extent the Fund or the Portfolio does not invest primarily in “highly liquid investments” (as defined under the Liquidity Rule), the determination of a minimum percentage of the Fund’s or the Portfolio’s assets that generally will be invested in highly liquid investments (an “HLIM”); (5) if the Fund or the Portfolio has established an HLIM, the periodic review (no less frequently than annually) of the HLIM and the adoption of policies and procedures for responding to a shortfall of the Fund’s or the Portfolio’s “highly liquid investments” below its HLIM; and (6) periodic reporting to the respective Board.
At a meeting of each Board held on May 26 and 28, 2020, the Board received a written report (the “Report”) from Funds Management that addressed the operation of the Program and assessed its adequacy and effectiveness of implementation. The Report covered the initial period from December 1, 2018 through December 31, 2019 (the “Reporting Period”). No significant liquidity events impacting the Fund or the Portfolio were noted in the Report. There were no material changes to the Program during the Reporting Period. The Report concluded that the Program is operating effectively to assess and manage the Fund’s and the Portfolio’s liquidity risk, and that the Program has been and continues to be adequately and effectively implemented to monitor and, as applicable, respond to the Fund’s and the Portfolio’s liquidity developments.
There can be no assurance that the Program will achieve its objectives under all circumstances in the future. Please refer to the Fund’s prospectus for more information regarding the Fund’s exposure to liquidity risk and other risks to which an investment in the Fund may be subject.
Wells Fargo C&B Large Cap Value Fund | 45
Appendix I (unaudited)
Effective on or about May 1, 2020, if you purchase Fund shares through a Janney Montgomery Scott LLC (“Janney”) brokerage account, you will be eligible for the following load waivers (front-end sales charge waivers and contingent deferred sales charge (“CDSC”), or back-end sales charge, waivers) and discounts, which may differ from those disclosed elsewhere in the Fund’s Prospectus or SAI.
|
| Front-end sales charge* waivers on Class A shares available at Janney |
|
| Shares purchased through reinvestment of capital gains distributions and dividend reinvestment when purchasing shares of the same fund (but not any other fund within the fund family). |
|
| Shares purchased by employees and registered representatives of Janney or its affiliates and their family members as designated by Janney. |
|
| Shares purchased from the proceeds of redemptions within the same fund family, provided (1) the repurchase occurs within ninety (90) days following the redemption, (2) the redemption and purchase occur in the same account, and (3) redeemed shares were subject to a front-end or deferred sales load (i.e., right of reinstatement). |
|
| Employer-sponsored retirement plans (e.g., 401(k) plans, 457 plans, employer-sponsored 403(b) plans, profit sharing and money purchase pension plans and defined benefit plans). For purposes of this provision, employer-sponsored retirement plans do not include SEP IRAs, Simple IRAs, SAR-SEPs or Keogh plans. |
|
| Shares acquired through a right of reinstatement. |
|
| Class C shares that are no longer subject to a contingent deferred sales charge and are converted to Class A shares of the same fund pursuant to Janney’s policies and procedures. |
| CDSC waivers on Class A and Class C shares available at Janney |
|
| Shares sold upon the death or disability of the shareholder. |
|
| Shares sold as part of a systematic withdrawal plan as described in the Fund’s Prospectus. |
|
| Shares purchased in connection with a return of excess contributions from an IRA account. |
|
| Shares sold as part of a required minimum distribution for IRA and retirement accounts if the redemption is taken in or after the year the shareholder reaches qualified age based on applicable IRS regulations. |
|
| Shares sold to pay Janney fees but only if the transaction is initiated by Janney. |
|
| Shares acquired through a right of reinstatement. |
|
| Shares exchanged into the same share class of a different fund. |
| Front-end sales charge* discounts available at Janney; breakpoints, rights of accumulation and/or letters of intent |
|
| Breakpoints as described in the Fund’s Prospectus. |
|
| Rights of accumulation (“ROA”), which entitle shareholders to breakpoint discounts, will be automatically calculated based on the aggregated holding of fund family assets held by accounts within the purchaser’s household at Janney. Eligible fund family assets not held at Janney may be included in the ROA calculation only if the shareholder notifies his or her financial advisor about such assets. |
|
| Letters of intent which allow for breakpoint discounts based on anticipated purchases within a fund family, over a 13-month time period. Eligible fund family assets not held at Janney Montgomery Scott may be included in the calculation of letters of intent only if the shareholder notifies his or her financial advisor about such assets. |
| * | Also referred to as an “initial sales charge.” |
46 | Wells Fargo C&B Large Cap Value Fund
Appendix II (unaudited)
Effective on or after May 1, 2020, clients of Edward Jones (also referred to as “shareholders”) purchasing Fund shares on the Edward Jones commission and fee-based platforms are eligible only for the following sales charge discounts (also referred to as “breakpoints”) and waivers, which can differ from breakpoints and waivers described elsewhere in the Fund’s Prospectus or SAI or through another broker-dealer. In all instances, it is the shareholder’s responsibility to inform Edward Jones at the time of purchase of any relationship, holdings of Wells Fargo Funds or other facts qualifying the purchaser for breakpoints or waivers. Edward Jones can ask for documentation of such circumstance.
|
| Breakpoints available at Edward Jones |
|
| Rights of Accumulation (ROA) |
|
The applicable sales charge on a purchase of Class A shares is determined by taking into account all share classes (except any money market funds and retirement plan share classes) of Wells Fargo Funds held by the shareholder or in an account grouped by Edward Jones with other accounts for the purpose of providing certain pricing considerations (“pricing groups”). This includes all share classes held on the Edward Jones platform and/or held on another platform. The inclusion of eligible fund family assets in the rights of accumulation calculation is dependent on the shareholder notifying his or her financial advisor of such assets at the time of calculation. |
|
ROA is determined by calculating the higher of cost or market value (current shares x NAV). |
|
| Letter of Intent (LOI) |
|
Through a LOI, shareholders can receive the sales charge and breakpoint discounts for purchases shareholders intend to makeover a 13-month period from the date Edward Jones receives the LOI. The LOI is determined by calculating the higher of cost or market value of qualifying holdings at LOI initiation in combination with the value that the shareholder intends to buy over a 13-month period to calculate the front-end sales charge and any breakpoint discounts. Each purchase the shareholder makes during that 13-month period will receive the sales charge and breakpoint discount that applies to the total amount. The inclusion of eligible fund family assets in the LOI calculation is dependent on the shareholder notifying his or her financial advisor of such assets at the time of calculation. Purchases made before the LOI is received by Edward Jones are not covered under the LOI and will not reduce the sales charge previously paid. Sales charges will be adjusted if LOI is not met. |
| Sales charges are waived for the following shareholders and in the following situations at Edward Jones: |
● Associates of Edward Jones and its affiliates and their family members who are in the same pricing group (as determined by Edward Jones under its policies and procedures) as the associate. This waiver will continue for the remainder of the associate’s life if the associate retires from Edward Jones in good-standing. |
● Shares purchased in an Edward Jones fee-based program. |
● Shares purchased through reinvestment of capital gains distributions and dividend reinvestment. |
● Shares purchased from the proceeds of redeemed shares of the same fund family so long as the following conditions are met: 1) the proceeds are from the sale of shares within 60 days of the purchase, and 2) the sale and purchase are made in the same share class and the same account or the purchase is made in an individual retirement account with proceeds from liquidations in a non-retirement account. |
● Shares exchanged into Class A shares from another share class so long as the exchange is into the same fund and was initiated at the discretion of Edward Jones. Edward Jones is responsible for any remaining CDSC due to the fund company, if applicable. Any future purchases are subject to the applicable sales charge as disclosed in the prospectus. |
● Exchanges from Class C shares to Class A shares of the same fund, generally, in the 84th month following the anniversary of the purchase date or earlier at the discretion of Edward Jones. |
If the shareholder purchases shares that are subject to a CDSC and those shares are redeemed before the CDSC is expired, the shareholder
is responsible to pay the CDSC except in the following conditions available at Edward Jones: |
● The death or disability of the shareholder. |
● Systematic withdrawals with up to 10% per year of the account value. |
● Return of excess contributions from an Individual Retirement Account (IRA). |
● Shares sold as part of a required minimum distribution for IRA and retirement accounts if the redemption is taken in or after the year the shareholder reaches qualified age based on applicable IRS regulation. |
● Shares sold to pay Edward Jones fees or costs in such cases where the transaction is initiated by Edward Jones. |
● Shares exchanged in an Edward Jones fee-based program. |
● Shares acquired through NAV reinstatement. |
Wells Fargo C&B Large Cap Value Fund | 47
Appendix II (unaudited)
|
| Other Important Information for accounts at Edward Jones: |
| Minimum Purchase Amounts |
● $250 initial purchase minimum |
● $50 subsequent purchase minimum |
|
| Minimum Balances |
| Edward Jones has the right to redeem at its discretion fund holdings with a balance of $250 or less. The following are examples of accounts that are not included in this policy: |
● A fee-based account held on an Edward Jones platform |
● A 529 account held on an Edward Jones platform |
● An account with an active systematic investment plan or letter of intent (LOI) |
|
| Changing Share Classes |
| At any time it deems necessary, Edward Jones has the authority to exchange at NAV a shareholder’s holdings in a fund to Class A shares. |
48 | Wells Fargo C&B Large Cap Value Fund
Appendix III (unaudited)
Effective June 1, 2020, shareholders purchasing Fund shares through an Oppenheimer & Co. Inc. (“Oppenheimer”) platform or account are eligible only for the following load waivers (front-end sales charge waivers and contingent deferred or back-end, sales charge waivers) and discounts, which may differ from those disclosed in the Fund’s Prospectus or SAI.
|
| Front-end Sales Load Waivers on Class A Shares available at Oppenheimer |
|
| Employer-sponsored retirement, deferred compensation and employee benefit plans (including health savings accounts) and trusts used to fund those plans, provided that the shares are not held in a commission-based brokerage account and shares are held for the benefit of the plan. |
|
| Shares purchased by or through a 529 Plan. |
|
| Shares purchased through an Oppenheimer affiliated investment advisory program. |
|
| Shares purchased through reinvestment of capital gains distributions and dividend reinvestment when purchasing shares of the same fund (but not any other fund within the fund family). |
|
| Shares purchased from the proceeds of redemptions within the same fund family, provided (1) the repurchase occurs within 90 days following the redemption, (2) the redemption and purchase occur in the same account, and (3) redeemed shares were subject to a front-end or deferred sales load (known as Rights of Restatement). |
|
| A shareholder in the Fund’s Class C shares will have their shares exchanged at net asset value to Class A shares (or the appropriate share class) of the Fund if the shares are no longer subject to a CDSC and the exchange is in line with the policies and procedures of Oppenheimer. |
|
| Employees and registered representatives of Oppenheimer or its affiliates and their family members. |
|
| Directors or Trustees of the Fund, and employees of the Fund’s investment adviser or any of its affiliates, as described in the Prospectus. |
| CDSC Waivers on A and C Shares available at Oppenheimer |
|
| Death or disability of the shareholder. |
|
| Shares sold as part of a systematic withdrawal plan as described in the Prospectus. |
|
| Return of excess contributions from an IRA Account. |
|
| Shares sold as part of a required minimum distribution for IRA and retirement accounts due to the shareholder reaching the qualified age based on applicable IRS regulations as described in the Prospectus. |
|
| Shares sold to pay Oppenheimer fees but only if the transaction is initiated by Oppenheimer. |
|
| Shares acquired through a right of reinstatement. |
| Front-end load Discounts Available at Oppenheimer: Breakpoints, Rights of Accumulation & Letters of Intent |
|
| Breakpoints as described in the Prospectus. |
|
| Rights of Accumulation (ROA), which entitle shareholders to breakpoint discounts, will be automatically calculated based on the aggregated holding of fund family assets held by accounts within the purchaser’s household at Oppenheimer. Eligible fund family assets not held at Oppenheimer may be included in the ROA calculation only if the shareholder notifies his or her financial advisor about such assets. |
Wells Fargo C&B Large Cap Value Fund | 49
Appendix IV (unaudited)
Effective June 15, 2020, shareholders purchasing fund shares through a Robert W. Baird & Co. (“Baird”) platform or account will only be eligible for the following sales charge waivers (front-end sales charge waivers and CDSC waivers) and discounts, which may differ from those disclosed elsewhere in the Fund’s Prospectus or the SAI.
|
| Front-end Sales Load Waivers on Class A Shares available at Baird |
|
| Shares purchased through reinvestment of capital gains distributions and dividend reinvestment when purchasing share of the same fund. |
|
| Share purchase by employees and registers representatives of Baird or its affiliate and their family members as designated by Baird. |
|
| Shares purchase from the proceeds of redemptions within the same fund family, provided (1) the repurchase occurs within 90 days following the redemption, (2) the redemption and purchase occur in the same accounts, and (3) redeemed shares were subject to a front-end or deferred sales charge (known as rights of reinstatement). |
|
| A shareholder in the Funds Investor C Shares will have their share exchanged at net asset value to Investor A shares of the fund if the shares are no longer subject to CDSC and the exchange is in line with the policies and procedures of Baird. |
|
| Employer-sponsored retirement plans or charitable accounts in a transactional brokerage account at Baird, including 401(k)plans, 457 plans, employer-sponsored 403(b) plans, profit sharing and money purchase pension plans and defined benefit plans. For purposes of this provision, employer-sponsored retirement plans do not include SEP IRAs, Simple IRAs or SAR-SEPs. |
| CDSC Waivers on A and C Shares available at Baird |
|
| Shares sold due to death or disability of the shareholder. |
|
| Shares sold as part of a systematic withdrawal plan as described in the Fund’s Prospectus. |
|
| Shares bought due to returns of excess contributions from an IRA Account. |
|
| Shares sold as part of a required minimum distribution for IRA and retirement accounts due to the shareholder reaching age 72 as described in the Fund’s Prospectus. |
|
| Shares sold to pay Baird fees but only if the transaction is initiated by Baird. |
|
| Shares acquired through a right of reinstatement. |
| Front-end load Discounts Available at Baird: Breakpoint and/or Rights of Accumulation |
|
| Breakpoints as described in the Prospectus. |
|
| Rights of accumulations which entitles shareholders to breakpoint discounts will be automatically calculated based on the aggregated holding of fund family assets held by accounts within the purchaser’s household at Baird. Eligible fund family assets not held at Baird may be included in the rights of accumulations calculation only if the shareholder notifies his or her financial advisor about such assets. |
|
| Letters of Intent (LOI) allow for breakpoint discounts based on anticipated purchases within a fund family through Baird, over a 13-month period of time. |
50 | Wells Fargo C&B Large Cap Value Fund
This page is intentionally left blank.
This page is intentionally left blank.

For more information
More information about Wells Fargo Funds is available free upon request. To obtain literature, please write, visit the Fund’s website, or call:
Wells Fargo Funds
P.O. Box 219967
Kansas City, MO 64121-9967
Website: wfam.com
Individual investors: 1-800-222-8222
Retail investment professionals: 1-888-877-9275
Institutional investment professionals: 1-866-765-0778

This report and the financial statements contained herein are submitted for the general information of the shareholders of the Fund. If this report is used for promotional purposes, distribution of the report must be accompanied or preceded by a current prospectus. Before investing, please consider the investment objectives, risks, charges, and expenses of the investment. For a current prospectus and, if available, a summary prospectus, containing this information, call 1-800-222-8222 or visit the Fund’s website at wfam.com. Read the prospectus carefully before you invest or send money.
Wells Fargo Asset Management (WFAM) is the trade name for certain investment advisory/management firms owned by Wells Fargo & Company. These firms include but are not limited to Wells Capital Management Incorporated and Wells Fargo Funds Management, LLC. Certain products managed by WFAM entities are distributed by Wells Fargo Funds Distributor, LLC (a broker-dealer and Member FINRA).
This material is for general informational and educational purposes only and is NOT intended to provide investment advice or a recommendation of any kind—including a recommendation for any specific investment, strategy, or plan.
INVESTMENT PRODUCTS: NOT FDIC INSURED ◾ NO BANK GUARANTEE ◾ MAY LOSE VALUE
© 2020 Wells Fargo & Company. All rights reserved.
PAR-0620-00250 07-20
A280/AR280 05-20
Annual Report
May 31, 2020
Wells Fargo Real Return Fund
Beginning on January 1, 2021, as permitted by new regulations adopted by the Securities and Exchange Commission, paper copies of the Wells Fargo Funds’ annual and semi-annual shareholder reports issued after this date will no longer be sent by mail, unless you specifically request paper copies of the reports. Instead, the reports will be made available on the Funds’ website, and you will be notified by mail each time a report is posted and provided with a website address to access the report.
If you already elected to receive shareholder reports electronically, you will not be affected by this change and you need not take any action. You may elect to receive shareholder reports and other communications from the Fund electronically at any time by contacting your financial intermediary (such as a broker-dealer or bank) or, if you are a direct investor, by calling 1-800-222-8222 or by enrolling at wellsfargo.com/advantagedelivery.
You may elect to receive all future reports in paper free of charge. If you invest through a financial intermediary, you can contact your financial intermediary to request that you continue to receive paper copies of your shareholder reports; if you invest directly with the Fund, you can call 1-800-222-8222. Your election to receive reports in paper will apply to all Wells Fargo Funds held in your account with your financial intermediary or, if you are a direct investor, to all Wells Fargo Funds that you hold.
|
|
|
Reduce clutter. Save trees. |
Sign up for electronic delivery of prospectuses and shareholder reports at wellsfargo.com/advantagedelivery |
The views expressed and any forward-looking statements are as of May 31, 2020, unless otherwise noted, and are those of the Fund managers and/or Wells Fargo Asset Management. Discussions of individual securities, or the markets generally, or any Wells Fargo Fund are not intended as individual recommendations. Future events or results may vary significantly from those expressed in any forward-looking statements. The views expressed are subject to change at any time in response to changing circumstances in the market. Wells Fargo Asset Management and the Fund disclaim any obligation to publicly update or revise any views expressed or forward-looking statements.
INVESTMENT PRODUCTS: NOT FDIC INSURED ◾ NO BANK GUARANTEE ◾ MAY LOSE VALUE
Wells Fargo Real Return Fund | 1
Letter to shareholders (unaudited)

Andrew Owen
President
Wells Fargo Funds
Dear Shareholder:
We are pleased to offer you this annual report for the Wells Fargo Real Return Fund for the 12-month period that ended May 31, 2020. Global stock markets saw earlier gains erased in February and March as governments around the world took unprecedented measures to stop the spread of the coronavirus at the expense of short-term economic output. However, markets rebounded in April and May to offset much of the losses as central banks attempted to bolster capital markets and confidence. Fixed-income markets generally performed better, achieving widespread gains.
For the 12-month period, fixed-income securities generally had positive total returns while non-U.S. equities had broad losses and U.S. stocks performed strongly despite sharp volatility since late February. For the period, U.S. stocks, based on the S&P 500 Index,1 gained 12.84%. International stocks, as measured by the MSCI ACWI ex USA Index (Net),2 returned -3.43%, while the MSCI EM Index (Net)3 trailed slightly, with a -4.39% return. For bond investors, the Bloomberg Barclays U.S. Aggregate Bond Index4 gained a robust 9.42%, the Bloomberg Barclays Global Aggregate ex-USD Index5 returned 2.67%, and the Bloomberg Barclays Municipal Bond Index6 gained a more modest 3.98%, while the ICE BofA U.S. High Yield Index7 had a slight gain of 0.35%.
The fiscal year began on a positive note.
The 12-month period began with U.S. equity market advances during June and July 2019. The gains, primarily driven by geopolitical and monetary policy events, pushed equity markets to new highs. European Central Bank (ECB) President Mario Draghi indicated the bank was ready to cut rates or buy more assets to prop up inflation if needed. President Trump backed off of earlier tariff threats against Mexico and China. In the U.S., the Federal Reserve (Fed) implemented a 0.25% federal funds rate cut in July.
Later in July, the U.S. reversed course and threatened to impose higher tariffs on China’s exports after talks failed. China responded with tariff threats of its own and devalued the renminbi, roiling global markets. Major U.S. stock market indices closed July with the worst weekly results of the year. Bond prices gained as Treasury yields fell to multiyear lows, and the yield curve inverted at multiple points along the 30-year arc, with shorter-term yields higher than longer-term.
In August, U.S.-China trade tensions continued with no signs of compromise. Evidence of a continued global economic slowdown mounted, and central banks in China, New Zealand, and Thailand cut interest rates. Industrial and manufacturing data declined in China, Canada, Japan, and Germany. Adding to global uncertainty, Italy’s prime minister resigned,
| 1 | The S&P 500 Index consists of 500 stocks chosen for market size, liquidity, and industry group representation. It is a market-value-weighted index with each stock’s weight in the index proportionate to its market value. You cannot invest directly in an index. |
| 2 | The Morgan Stanley Capital International (MSCI) All Country World Index (ACWI) ex USA Index (Net) is a free-float-adjusted market-capitalization-weighted index that is designed to measure the equity market performance of developed and emerging markets, excluding the United States. Source: MSCI. MSCI makes no express or implied warranties or representations and shall have no liability whatsoever with respect to any MSCI data contained herein. The MSCI data may not be further redistributed or used as a basis for other indices or any securities or financial products. This report is not approved, reviewed, or produced by MSCI. You cannot invest directly in an index. |
| 3 | The MSCI Emerging Markets (EM) Index (Net) is a free-float-adjusted market-capitalization-weighted index that is designed to measure equity market performance of emerging markets. You cannot invest directly in an index. |
| 4 | The Bloomberg Barclays U.S. Aggregate Bond Index is a broad-based benchmark that measures the investment-grade, U.S. dollar-denominated, fixed-rate taxable bond market, including Treasuries, government-related and corporate securities, mortgage-backed securities (agency fixed-rate and hybrid adjustable-rate mortgage pass-throughs), asset-backed securities, and commercial mortgage-backed securities. You cannot invest directly in an index. |
| 5 | The Bloomberg Barclays Global Aggregate ex-USD Index is an unmanaged index that provides a broad-based measure of the global investment-grade fixed-income markets excluding the U.S. dollar-denominated debt market. You cannot invest directly in an index. |
| 6 | The Bloomberg Barclays Municipal Bond Index is an unmanaged index composed of long-term tax-exempt bonds with a minimum credit rating of Baa. You cannot invest directly in an index. |
| 7 | The ICE BofA U.S. High Yield Index is a market-capitalization-weighted index of domestic and Yankee high-yield bonds. The index tracks the performance of high-yield securities traded in the U.S. bond market. You cannot invest directly in an index. Copyright 2020. ICE Data Indices, LLC. All rights reserved. |
2 | Wells Fargo Real Return Fund
Letter to shareholders (unaudited)
many feared a crackdown in Hong Kong as protestors sustained their calls for reform, and Prime Minister Boris Johnson planned to suspend the British Parliament as Brexit’s deadline neared.
In the U.S., the Fed cut interest rates a second time in September. U.S. manufacturing data disappointed investors. The U.S. Congress announced it would pursue an impeachment investigation of President Trump. Meanwhile, the Brexit impasse showed no signs of resolution. Officials in China said that hitting the country’s economic growth goals for the year would be difficult considering the weight of tariffs and trade restrictions. Although the S&P 500 Index finished the third quarter with the best year-to-date returns in more than 20 years, concerns about future returns remained.
The fourth quarter of 2019 started on a strong note, with U.S.-China trade tensions relaxing in October along with renewed optimism for a U.K. Brexit deal and positive macroeconomic data. The initial estimate of U.S. third-quarter gross domestic product growth was a resilient 1.9% annualized rate, while the U.S. unemployment rate fell to a 50-year low of 3.5% in September. However, despite resilience among U.S. consumers, business confidence declined and manufacturing activity contracted. Concerned with a potential economic slowdown, the Fed lowered interest rates another quarter point in late October—its third rate cut in four months. This helped push the S&P 500 Index to a new all-time high while emerging market equities rallied and global bonds declined overall, reflecting a broad pickup in risk appetite.
Equity markets continued to rally in November despite ongoing geopolitical risks. Hopes for a U.S.-China trade deal buoyed investor confidence. U.S. business sentiment improved slightly, and manufacturing and services activity picked up. While consumer confidence and purchasing manager activity rose in the eurozone, China reported weakening manufacturing and consumer data. Bond yields rose marginally, leading to slightly negative returns for global government and investment-grade corporate bonds.
Financial markets ended 2019 with a boost from the U.S. and China accord on a Phase One trade deal. That, along with the landslide win by the pro-Brexit U.K. Conservative Party in a national election and ongoing central bank support, gave investors greater confidence. U.S. economic indicators were generally positive, with the exception of manufacturing activity and business confidence. Consumer confidence was resilient, fed by a robust labor market, tame inflation, and lower interest rates, which boosted housing affordability and stimulated homebuyer activity. The impeachment of U.S. President Donald Trump had little impact on markets. Meanwhile, slowing Chinese economic activity, partly attributable to the trade war, led to further government stimulus at year-end through lower reserve ratios, allowing banks to lend more money.
The year-end rally continued in early January 2020. However, capital market volatility picked up sharply in late January on concerns over the potential impact of the coronavirus on the global economy and stock markets. With sentiment somewhat souring, perceived safe havens did well in January. The U.S. dollar and Japanese yen both rose, and government bonds outperformed equities. While the S&P 500 Index held its ground, emerging market equities tumbled, including those in Asia.
In February, the coronavirus became the major market focus. Fears of the virus’s impact on global growth led to expectations of increased global central bank monetary policy support. That led the 10-year U.S. Treasury yield to fall to an all-time low of 1.1% by the end of the month. Although equity markets initially shrugged off concerns about the outbreak, focusing instead on strong fourth-quarter earnings and improving business confidence in January, market sentiment turned sharply lower toward month-end and the S&P 500 Index lost 8.2% for the month. Oil prices tumbled as Russia and the Organization of the Petroleum Exporting Countries compounded a major decline in oil demand with a brutal price war, partly aimed at dissuading further U.S. shale production. As a result, the price of West Texas Intermediate crude oil fell 13% in February.
Wells Fargo Real Return Fund | 3
Letter to shareholders (unaudited)
“The global spread of the coronavirus led country after country to clamp down on social and business-related activity in order to contain the virus from causing even greater devastation and overwhelming health care systems.”
“Markets rebounded strongly in April after the earlier extreme volatility, with the S&P 500 Index gaining 12.8% for the month and the MSCI ACWI ex USA Index (Net) returning 7.6%.”
|
|
|
For further information about your Fund, contact your investment professional, visit our website at wfam.com, or call us directly at 1-800-222-8222. |
The global spread of the coronavirus led country after country to clamp down on social and business-related activity in order to contain the virus from causing even greater devastation and overwhelming health care systems. This abrupt stoppage of economic activity led to the sharp deceleration of global output, sending economies into a deep contraction. Central bank responses were swift, as they slashed interest rates and expanded quantitative easing programs to restore liquidity and confidence to the markets. In the U.S., the Fed introduced several new lending programs, funding investment-grade bonds, money market mutual funds, and commercial paper while purchasing Treasuries, mortgage-backed securities, and overnight repurchase agreements. Meanwhile, stock markets tumbled quickly into a bear market, ending the longest bull stock market in U.S. history.
Markets rebounded strongly in April after the earlier extreme volatility, with the S&P 500 Index gaining 12.8% for the month and the MSCI ACWI ex USA Index (Net) returning 7.6%. The rebound was fueled by unprecedented government and central bank stimulus measures taken to buffer the economic damage created by mass shutdowns enacted in order to contain the virus’s spread. The U.S. economy contracted by an annualized 4.8% pace in the first quarter, with 30 million new unemployment insurance claims in six weeks. In the eurozone, first-quarter real gross domestic product (GDP) shrank 3.8%, with the composite April Flash Purchasing Managers’ Index , a monthly survey of purchasing managers, falling to an all-time low of 13.5. The ECB expanded its quantitative easing to include the purchase of additional government bonds of countries with the greatest virus-related need, including Italy and Spain. China’s first-quarter GDP fell by 6.8% year over year. However, retail sales, production, and investment showed signs of recovery. Extreme oil price volatility continued as global supply far exceeded demand.
In May, the equity market rebound continued, with the S&P 500 Index climbing a further 4.8%. European and Japanese stock markets also had monthly gains. Investors regained confidence on reports of early signs of success in human trials of a coronavirus vaccine. Growth stocks continued to outperform value stocks while returns on global government bonds were generally flat. In the U.S., a gap grew between the stock market rebound and devastating economic data points, including an April unemployment rate of 14.7%, the highest level since World War II. Purchasing managers’ indices continued to reflect weakening activity in May in both the manufacturing and services sectors. U.S. corporate earnings reports indicated a 14% year-over-year contraction in earnings from the first quarter of 2019. However, high demand for technology, driven by remote activity, helped maintain robust information technology sector earnings, which helped drive powerful well-known technology stocks higher.
Don’t let short-term uncertainty derail long-term investment goals.
Periods of investment uncertainty can present challenges, but experience has taught us that maintaining long-term investment goals can be an effective way to plan for the future. To help you create a sound strategy based on your personal goals and risk tolerance, Wells Fargo Funds offers more than 100 mutual funds spanning a wide range of asset classes and investment styles. Although diversification cannot guarantee an investment profit or prevent losses, we believe it can be an effective way to manage investment risk and potentially smooth out overall portfolio performance. We encourage investors to know their investments and to understand that appropriate levels of risk-taking may unlock opportunities.
Thank you for choosing to invest with Wells Fargo Funds. We appreciate your confidence in us and remain committed to helping you meet your financial needs.
Sincerely,

Andrew Owen
President
Wells Fargo Funds
4 | Wells Fargo Real Return Fund
This page is intentionally left blank.
Performance highlights (unaudited)
Investment objective
The Fund seeks returns that exceed the rate of inflation over the long-term.
Manager
Wells Fargo Funds Management, LLC
Subadviser for the affiliated master portfolio1
Wells Capital Management Incorporated
Portfolio managers
Kandarp R. Acharya, CFA®‡, FRM
Petros N. Bocray, CFA®‡, FRM
Michael Bradshaw, CFA®‡
Christian L. Chan, CFA®‡
Jay N. Mueller, CFA®‡
Garth B. Newport, CFA®‡
Michael Schueller, CFA®‡*
Average annual total returns (%) as of May 31, 2020
| | | | | | | | | | | | | | | | | | | | | | | | | | | | | | | | | | |
| | | | |
| | | | | Including sales charge | | | Excluding sales charge | | | Expense ratios2 (%) | |
| | | | | | | | | |
| | | Inception date | | 1 year | | | 5 year | | | 10 year | | | 1 year | | | 5 year | | | 10 year | | | Gross | | | Net3 | |
| | | | | | | | | | |
| Class A (IPBAX) | | 2-28-2003 | | | 0.74 | | | | 1.55 | | | | 2.49 | | | | 5.48 | | | | 2.49 | | | | 2.96 | | | | 1.17 | | | | 0.78 | |
| | | | | | | | | | |
| Class C (IPBCX) | | 2-28-2003 | | | 3.67 | | | | 1.73 | | | | 2.23 | | | | 4.67 | ** | | | 1.73 | | | | 2.23 | | | | 1.92 | | | | 1.53 | |
| | | | | | | | | | |
| Class R6 (IPBJX)4 | | 10-31-2016 | | | – | | | | – | | | | – | | | | 5.94 | | | | 2.85 | | | | 3.30 | | | | 0.79 | | | | 0.40 | |
| | | | | | | | | | |
| Administrator Class (IPBIX) | | 2-28-2003 | | | – | | | | – | | | | – | | | | 5.67 | | | | 2.71 | | | | 3.23 | | | | 1.11 | | | | 0.60 | |
| | | | | | | | | | |
| Institutional Class (IPBNX)5 | | 10-31-2016 | | | – | | | | – | | | | – | | | | 5.78 | ** | | | 2.81 | | | | 3.28 | | | | 0.84 | | | | 0.45 | |
| | | | | | | | | | |
| Bloomberg Barclays U.S. TIPS Index6 | | – | | | – | | | | – | | | | – | | | | 8.00 | | | | 3.32 | | | | 3.55 | | | | – | | | | – | |
| | | | | | | | | | |
| CPI7 | | – | | | – | | | | – | | | | – | | | | 0.12 | | | | 1.52 | | | | 1.63 | | | | – | | | | – | |
| ** | | Total return differs from the return in the Financial Highlights in this report. The total return presented is calculated based on the NAV at which the shareholder transactions were processed. The NAV and total return presented in the Financial Highlights reflects certain adjustments made to the net assets of the Fund that are necessary under U.S. generally accepted accounting principles. |
Figures quoted represent past performance, which is no guarantee of future results, and do not reflect taxes that a shareholder may pay on an investment in a fund. Investment return and principal value of an investment will fluctuate so that an investor’s shares, when redeemed, may be worth more or less than their original cost. Performance shown without sales charges would be lower if sales charges were reflected. Current performance may be lower or higher than the performance data quoted, which assumes the reinvestment of dividends and capital gains. Current month-end performance is available on the Fund’s website, wfam.com.
Index returns do not include transaction costs associated with buying and selling securities, any mutual fund fees or expenses, or any taxes. It is not possible to invest directly in an index.
For Class A shares, the maximum front-end sales charge is 4.50%. For Class C shares, the maximum contingent deferred sales charge is 1.00%. Performance including a contingent deferred sales charge assumes the sales charge for the corresponding time period. Class R6, Administrator Class, and Institutional shares are sold without a front-end sales charge or contingent deferred sales charge.
Bond values fluctuate in response to the financial condition of individual issuers, general market and economic conditions, and changes in interest rates. Changes in market conditions and government policies may lead to periods of heightened volatility in the bond market and reduced liquidity for certain bonds held by the Fund. In general, when interest rates rise, bond values fall and investors may lose principal value. Interest rate changes and their impact on the Fund and its share price can be sudden and unpredictable. Stock values fluctuate in response to the activities of individual companies and general market and economic conditions. High-yield securities have a greater risk of default and tend to be more volatile than higher-rated debt securities. Loans are subject to risks similar to those associated with other below investment-grade bond investments, such as credit risk (for example, risk of issuer default), below-investment-grade bond risk (for example, risk of greater volatility in value), and risk that the loan may become illiquid or difficult to price. The use of derivatives may reduce returns and/or increase volatility. Foreign investments are especially volatile and can rise or fall dramatically due to differences in the political and economic conditions of the host country. These risks are generally intensified in emerging markets. Securities issued by U.S. government agencies or government-sponsored entities may not be guaranteed by the U.S. Treasury. The Fund is exposed to mortgage- and asset-backed securities risk and small-company securities risk. Consult the Fund’s prospectus for additional information on these and other risks.
Please see footnotes on page 7.
6 | Wells Fargo Real Return Fund
Performance highlights (unaudited)
|
|
| Growth of $10,000 investment as of May 31, 20208 |
|

|
| ‡ | CFA® and Chartered Financial Analyst® are trademarks owned by CFA Institute. |
| * | Mr. Schueller became a portfolio manager of the Fund on January 15, 2020. |
| 1 | The Fund is a feeder fund in a master-feeder structure that invests substantially all of its assets in a single affiliated master portfolio of the Wells Fargo Master Trust with a substantially identical investment objective and substantially similar investment strategies. References to the investment activities of the Fund are intended to refer to the investment activities of the affiliated master portfolio in which it invests. |
| 2 | Reflects the expense ratios as stated in the most recent prospectuses. The expense ratios shown are subject to change and may differ from the annualized expense ratios shown in the financial highlights of this report. |
| 3 | The manager has contractually committed through September 30, 2020, to waive fees and/or reimburse expenses to the extent necessary to cap total annual fund operating expenses after fee waivers at 0.78% for Class A, 1.53% for Class C, 0.40% for Class R6, 0.60% for Administrator Class, and 0.45% for Institutional Class. Brokerage commissions, stamp duty fees, interest, taxes, acquired fund fees and expenses (if any) from funds in which the affiliated master portfolio invests, and extraordinary expenses are excluded from the expense caps. Net expenses from the affiliated master portfolio are included in the expense caps. Prior to or after the commitment expiration date, the caps may be increased or the commitment to maintain the caps may be terminated only with the approval of the Board of Trustees. Without these caps, the Fund’s returns would have been lower. The expense ratio paid by an investor is the net expense ratio (the total annual fund operating expenses after fee waivers) as stated in the prospectuses. |
| 4 | Historical performance shown for the Class R6 shares prior to their inception reflects the performance of the Administrator Class shares, and is not adjusted to reflect the Class R6 expenses. If these expenses had been included, returns for the Class R6 shares would be higher. |
| 5 | Historical performance shown for the Institutional Class shares prior to their inception reflects the performance of the Administrator Class shares, and is not adjusted to reflect the Institutional Class expenses. If these expenses had been included, returns for the Institutional Class shares would be higher. |
| 6 | The Bloomberg Barclays U.S. Treasury Inflation-Protected Securities (TIPS) Index is an index of inflation-indexed-linked U.S. Treasury securities. You cannot invest directly in an index. |
| 7 | The Consumer Price Index (CPI) for All Urban Consumers in U.S. All Items is published monthly by the U.S. government as an indicator of changes in price levels (or inflation) paid by urban consumers for a representative basket of goods and services. You cannot invest directly in an index. |
| 8 | The chart compares the performance of Class A shares for the most recent ten years with the Bloomberg Barclays U.S. TIPS Index and CPI. The chart assumes a hypothetical $10,000 investment in Class A shares and reflects all operating expenses and assumes the maximum initial sales charge of 4.50%. |
| 9The | S&P 500 Index consists of 500 stocks chosen for market size, liquidity, and industry group representation. It is a market-value-weighted index with each stock’s weight in the index proportionate to its market value. You cannot invest directly in an index. |
| 10 | The Bloomberg Barclays U.S. Aggregate Bond Index is a broad-based benchmark that measures the investment-grade, U.S. dollar-denominated, fixed-rate taxable bond market, including Treasuries, government-related and corporate securities, mortgage-backed securities (agency fixed-rate and hybrid adjustable-rate mortgage pass-throughs), asset-backed securities, and commercial mortgage-backed securities. You cannot invest directly in an index. |
| 11 | The ten largest holdings, excluding cash, cash equivalents and any money market funds, are calculated based on the value of the securities of the affiliated master portfolio allocable to the Fund divided by the total net assets of the Fund. Holdings are subject to change and may have changed since the date specified. |
| 12 | Amounts represent the portfolio composition of the affiliated master portfolio which are calculated based on the total long-term investments of the affiliated master portfolio. These amounts are subject to change and may have changed since the date specified. |
Wells Fargo Real Return Fund | 7
Performance highlights (unaudited)
MANAGER’S DISCUSSION
Fund highlights
| ∎ | | The Fund underperformed its benchmark, the Bloomberg Barclays U.S. Treasury Inflation-Protected Securities (TIPS) Index, for the 12-month period that ended May 31, 2020. |
| ∎ | | As investments in high-quality fixed-income investments outperformed most equity and high-yield bond investments in the portfolio over the period, the Fund’s holdings in more market-sensitive investments detracted from performance. |
| ∎ | | Gold and gold-mining stocks performed very well over the 12-month period. Our exposure to precious metals mining stocks added to relative performance. |
Market returns were positive despite the economic ravages of the coronavirus pandemic.
The 12-month period that ended May 31, 2020, saw the broad U.S. equity markets, as measured by the S&P 500 Index9, post a +12.84% return and the broad U.S. fixed-income markets, as measured by the Bloomberg Barclays U.S. Aggregate Bond Index10, post a +9.42% return. Those returns would be considered pretty good during most any historical 12-month period. Given that they materialized as the world is opening up from the global coronavirus pandemic lockdown is truly remarkable.
From June 1, 2019, to mid-February 2020, the market climbed a wall of worry, fretting over slower growth, Brexit, and trade tensions with China. Credit spreads compressed and pundits debated the impacts of negative interest rates. On February 19, the S&P 500 Index reached a high of 3,386. Soon after, fears of the coronavirus pandemic took hold. The world sheltered in place and economic activity ground to a halt. By March 23, the S&P 500 Index shed over one-third of its value and stood at 2,237. The U.S. Federal Reserve slashed interest rates. Unprecedented levels of monetary and fiscal policy flooded the markets. Despite all of the massively negative economic news, the market recovered. As of May 31, 2020, the S&P 500 Index climbed back to 3,044, roughly 10% off its February 19, 2020, peak.
| | | | |
| |
| Ten largest holdings (%) as of May 31, 202011 | | | |
| | |
TIPS, 0.38%, 7-15-2025 | | | 11.21 | |
| | |
TIPS, 0.63%, 1-15-2026 | | | 9.98 | |
| | |
TIPS, 0.13%, 1-15-2023 | | | 9.50 | |
| | |
TIPS, 0.38%, 7-15-2023 | | | 8.31 | |
| | |
TIPS, 0.25%, 1-15-2025 | | | 8.17 | |
| | |
TIPS, 2.38%, 1-15-2025 | | | 7.96 | |
| | |
TIPS, 0.63%, 4-15-2023 | | | 7.36 | |
| | |
TIPS, 0.13%, 7-15-2026 | | | 6.66 | |
| | |
TIPS, 0.63%, 1-15-2024 | | | 6.49 | |
| | |
TIPS, 0.50%, 1-15-2028 | | | 6.30 | |
The Fund uses a multi-asset-class strategy to target inflation protection.
During the 12-month period, we maintained allocations to Treasury Inflation-Protected Securities (TIPS) as well as other inflation-sensitive sectors, such as real estate investment trusts (REITs), short-term high-yield bonds, and inflation-sensitive equities. We used this multi-asset-class strategy to target greater inflation protection and real returns than a traditional inflation-hedged strategy might while seeking to achieve similar levels of volatility.
The return on our investments in TIPS matched the benchmark return of 8% over the period. While our investments in short-term high-yield bonds and in REITs
produced positive results, they underperformed the return on TIPS, thus detracting from performance. The energy stocks in our STEM (consumer staples, energy, and materials) portfolio dominated performance and this portfolio produced a negative return. Buoyed by strong advances in gold, our precious metals mining stocks produced a remarkable return in excess of 60%. Unfortunately, this sleeve only represents about 2% of the portfolio. So, it was not large enough to make up for the relative underperformance of the other sleeves.
Please see footnotes on page 7.
8 | Wells Fargo Real Return Fund
Performance highlights (unaudited)
|
|
| Portfolio composition as of May 31, 202012 |
|
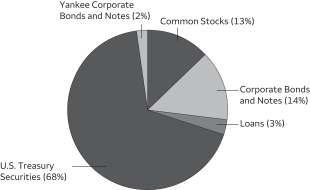 |
With respect to changes in the underlying portfolio, in June 2019, we sold all our foreign STEM stocks.
Looking ahead, we remain cautiously optimistic.
Our macroeconomic outlook is best defined as cautious optimism. We place the emphasis on cautious. There is a massive amount of uncertainty surrounding the virus, U.S. civil unrest, domestic politics, and geopolitical tensions that could cause this view to change quickly. On the positive side of the ledger, coordinated global policy action has released trillions of dollars into the market. We believe it is unlikely that we will hit the March 2020 market lows again. From an investor psychology aspect, we suspect that even if a
significant second wave of the coronavirus strikes, the economy now has a path to follow forward and that markets should not behave as negatively as they did in March. However, the easy money off the low has been realized; upside from here will be limited. We have moved from a market-wide beta-driven market recovery to more of a sector and issuer-driven market. Investors went from fear of recession to the reality of recession faster than at any other time in history. We find it reasonable to conclude that the recovery should be in proportion to the decline.
We will continue to monitor the situation very carefully.
Please see footnotes on page 7.
Wells Fargo Real Return Fund | 9
Fund expenses (unaudited)
As a shareholder of the Fund, you incur two types of costs: (1) transaction costs, including sales charges (loads) on purchase payments and contingent deferred sales charges (if any) on redemptions and (2) ongoing costs, including management fees, distribution (12b-1) and/or shareholder servicing fees, and other Fund expenses. This example is intended to help you understand your ongoing costs (in dollars) of investing in the Fund and to compare these costs with the ongoing costs of investing in other mutual funds.
The example is based on an investment of $1,000 invested at the beginning of the six-month period and held for the entire period from December 1, 2019 to May 31, 2020.
Actual expenses
The “Actual” line of the table below provides information about actual account values and actual expenses. You may use the information in this line, together with the amount you invested, to estimate the expenses that you paid over the period. Simply divide your account value by $1,000 (for example, an $8,600 account value divided by $1,000 = 8.6), then multiply the result by the number in the “Actual” line under the heading entitled “Expenses paid during period” for your applicable class of shares to estimate the expenses you paid on your account during this period.
Hypothetical example for comparison purposes
The “Hypothetical” line of the table below provides information about hypothetical account values and hypothetical expenses based on the Fund’s actual expense ratio and an assumed rate of return of 5% per year before expenses, which is not the Fund’s actual return. The hypothetical account values and expenses may not be used to estimate the actual ending account balance or expenses you paid for the period. You may use this information to compare the ongoing costs of investing in the Fund and other funds. To do so, compare this 5% hypothetical example with the 5% hypothetical examples that appear in the shareholder reports of the other funds.
Please note that the expenses shown in the table are meant to highlight your ongoing costs only and do not reflect any transactional costs, such as sales charges (loads) and contingent deferred sales charges. Therefore, the “Hypothetical” line of the table is useful in comparing ongoing costs only and will not help you determine the relative total costs of owning different funds. In addition, if these transactional costs were included, your costs would have been higher.
| | | | | | | | | | | | | | | | |
| | | Beginning
account value
12-1-2019 | | | Ending
account value
5-31-2020 | | | Expenses
paid during
the period1,2 | | | Annualized net
expense ratio1 | |
| | | | | |
Class A | | | | | | | | | | | | | | | | |
| | | | |
Actual | | $ | 1,000.00 | | | $ | 1,022.33 | | | $ | 3.92 | | | | 0.78 | % |
| | | | |
Hypothetical (5% return before expenses) | | $ | 1,000.00 | | | $ | 1,021.13 | | | $ | 3.92 | | | | 0.78 | % |
| | | | | |
Class C | | | | | | | | | | | | | | | | |
| | | | |
Actual | | $ | 1,000.00 | | | $ | 1,018.05 | | | $ | 7.71 | | | | 1.53 | % |
| | | | |
Hypothetical (5% return before expenses) | | $ | 1,000.00 | | | $ | 1,017.36 | | | $ | 7.71 | | | | 1.53 | % |
| | | | | |
Class R6 | | | | | | | | | | | | | | | | |
| | | | |
Actual | | $ | 1,000.00 | | | $ | 1,024.10 | | | $ | 2.02 | | | | 0.40 | % |
| | | | |
Hypothetical (5% return before expenses) | | $ | 1,000.00 | | | $ | 1,023.00 | | | $ | 2.02 | | | | 0.40 | % |
| | | | | |
Administrator Class | | | | | | | | | | | | | | | | |
| | | | |
Actual | | $ | 1,000.00 | | | $ | 1,023.36 | | | $ | 3.03 | | | | 0.60 | % |
| | | | |
Hypothetical (5% return before expenses) | | $ | 1,000.00 | | | $ | 1,022.00 | | | $ | 3.03 | | | | 0.60 | % |
| | | | | |
Institutional Class | | | | | | | | | | | | | | | | |
| | | | |
Actual | | $ | 1,000.00 | | | $ | 1,023.83 | | | $ | 2.28 | | | | 0.45 | % |
| | | | |
Hypothetical (5% return before expenses) | | $ | 1,000.00 | | | $ | 1,022.75 | | | $ | 2.28 | | | | 0.45 | % |
| 1 | Amounts reflect net expenses allocated from the affiliated Master Portfolio in which the Fund invests. |
| 2 | Expenses paid is equal to the annualized net expense ratio of each class multiplied by the average account value over the period, multiplied by the number of days in the most recent fiscal half-year divided by the number of days in the fiscal year (to reflect the one-half-year period). |
10 | Wells Fargo Real Return Fund
Portfolio of investments—May 31, 2020
| | | | | | | | | | | | | | | | |
| | | | | | | | | | | | Value | |
| Investment Companies: 99.85% | |
|
| Affiliated Master Portfolio: 99.85% | |
Wells Fargo Real Return Portfolio | | | | | | | | | | | | | | $ | 57,182,776 | |
| | | | | | | | | | | | | | | | |
| | | |
Total Investment Companies (Cost $53,089,799) | | | | | | | | | | | | 57,182,776 | |
| | | | | | | | | | | | | | | | |
| | | | | | | | |
| Total investments in securities (Cost $53,089,799) | | | 99.85 | % | | | 57,182,776 | |
| | |
Other assets and liabilities, net | | | 0.15 | | | | 83,216 | |
| | | | | | | | |
| Total net assets | | | 100.00 | % | | $ | 57,265,992 | |
| | | | | | | | |
Transactions with the affiliated Master Portfolio were as follows:
| | | | | | | | | | | | | | | | | | | | | | | | | | | | | | | | | | | | |
| | | % of
ownership,
beginning
of period | | | % of
ownership,
end of
period | | | Net realized
gains
(losses) on
securities
transactions
allocated
from
affiliated
Master
Portfolio | | | Net change in
unrealized gains (losses) on
securities
transactions
allocated
from
affiliated
Master
Portfolio | | | Interest
allocated
from
affiliated
Master
Portfolio | | | Dividends
allocated
from
affiliated
Master
Portfolio | | | Affiliated
income
allocated
from
affiliated
Master
Portfolio | | | Value,
end
of period | | | % of
net
assets | |
| | | | | | | | | |
| Affiliated Master Portfolio | | | | | | | | | | | | | | | | | | | | | | | | | | | |
Wells Fargo Real Return Portfolio | | | 32 | % | | | 35 | % | | $ | (1,121,387 | ) | | $ | 3,059,682 | | | $ | 1,288,760 | | | $ | 202,018 | | | $ | 9,637 | | | $ | 57,182,776 | | | | 99.85 | % |
The accompanying notes are an integral part of these financial statements.
Wells Fargo Real Return Fund | 11
Statement of assets and liabilities—May 31, 2020
| | | | |
| | | | |
| |
Assets | | | | |
Investments in affiliated Master Portfolio, at value (cost $53,089,799) | | $ | 57,182,776 | |
Receivable for Fund shares sold | | | 61,207 | |
Receivable from manager | | | 36,379 | |
Prepaid expenses and other assets | | | 56,947 | |
| | | | |
Total assets | | | 57,337,309 | |
| | | | |
| |
Liabilities | | | | |
Payable for Fund shares redeemed | | | 55,278 | |
Administration fees payable | | | 4,337 | |
Distribution fee payable | | | 1,100 | |
Shareholder servicing fees payable | | | 5,783 | |
Trustees’ fees and expenses payable | | | 794 | |
Accrued expenses and other liabilities | | | 4,025 | |
| | | | |
Total liabilities | | | 71,317 | |
| | | | |
Total net assets | | $ | 57,265,992 | |
| | | | |
| |
Net assets consist of | | | | |
Paid-in capital | | $ | 55,216,751 | |
Total distributable earnings | | | 2,049,241 | |
| | | | |
Total net assets | | $ | 57,265,992 | |
| | | | |
| |
Computation of net asset value and offering price per share | | | | |
Net assets – Class A | | $ | 13,196,266 | |
Shares outstanding – Class A1 | | | 1,291,090 | |
Net asset value per share – Class A | | | $10.22 | |
Maximum offering price per share – Class A2 | | | $10.70 | |
Net assets – Class C | | $ | 1,714,319 | |
Shares outstanding – Class C1 | | | 170,472 | |
Net asset value per share – Class C | | | $10.06 | |
Net assets – Class R6 | | $ | 18,224,227 | |
Shares outstanding – Class R61 | | | 1,764,904 | |
Net asset value per share – Class R6 | | | $10.33 | |
Net assets – Administrator Class | | $ | 13,543,763 | |
Shares outstanding – Administrator Class1 | | | 1,304,867 | |
Net asset value per share – Administrator Class | | | $10.38 | |
Net assets – Institutional Class | | $ | 10,587,417 | |
Shares outstanding – Institutional Class1 | | | 1,024,920 | |
Net asset value per share – Institutional Class | | | $10.33 | |
| 1 | The Fund has an unlimited number of authorized shares. |
| 2 | Maximum offering price is computed as 100/95.50 of net asset value. On investments of $50,000 or more, the offering price is reduced. |
The accompanying notes are an integral part of these financial statements.
12 | Wells Fargo Real Return Fund
Statement of operations—year ended May 31, 2020
| | | | |
| | | | |
| |
Investment income | | | | |
Interest allocated from affiliated Master Portfolio | | $ | 1,288,760 | |
Dividends allocated from affiliated Master Portfolio (net of foreign withholding taxes of $4,191) | | | 202,018 | |
Affiliated income allocated from affiliated Master Portfolio | | | 9,637 | |
Expenses allocated from affiliated Master Portfolio | | | (268,526 | ) |
Waivers allocated from affiliated Master Portfolio | | | 38,038 | |
| | | | |
Total investment income | | | 1,269,927 | |
| | | | |
| |
Expenses | | | | |
Management fee | | | 29,658 | |
Administration fees | | | | |
Class A | | | 25,476 | |
Class C | | | 3,256 | |
Class R6 | | | 5,101 | |
Administrator Class | | | 12,799 | |
Institutional Class | | | 9,244 | |
Shareholder servicing fees | | | | |
Class A | | | 39,768 | |
Class C | | | 5,083 | |
Administrator Class | | | 31,942 | |
Distribution fee | | | | |
Class C | | | 15,247 | |
Custody and accounting fees | | | 4,019 | |
Professional fees | | | 35,898 | |
Registration fees | | | 199,450 | |
Shareholder report expenses | | | 69,138 | |
Trustees’ fees and expenses | | | 21,592 | |
Other fees and expenses | | | 15,357 | |
| | | | |
Total expenses | | | 523,028 | |
Less: Fee waivers and/or expense reimbursements | | | | |
Fund-level | | | (386,544 | ) |
Class A | | | (388 | ) |
Class C | | | (1 | ) |
Administrator Class | | | (15,361 | ) |
| | | | |
Net expenses | | | 120,734 | |
| | | | |
Net investment income | | | 1,149,193 | |
| | | | |
| |
Realized and unrealized gains (losses) on investments | | | | |
Net realized losses on securities transactions allocated from affiliated Master Portfolio | | | (1,121,387 | ) |
Net change in unrealized gains (losses) on securities transactions allocated from affiliated Master Portfolio | | | 3,059,682 | |
| | | | |
Net realized and unrealized gains (losses) on investments | | | 1,938,295 | |
| | | | |
Net increase in net assets resulting from operations | | $ | 3,087,488 | |
| | | | |
The accompanying notes are an integral part of these financial statements.
Wells Fargo Real Return Fund | 13
Statement of changes in net assets
| | | | | | | | | | | | | | | | |
| | | Year ended
May 31, 2020 | | | Year ended
May 31, 2019 | |
| | | | |
Operations | | | | | | | | | | | | | | | | |
Net investment income | | | | | | $ | 1,149,193 | | | | | | | $ | 1,389,934 | |
Net realized losses on investments | | | | | | | (1,121,387 | ) | | | | | | | (830,409 | ) |
Net change in unrealized gains (losses) on investments | | | | | | | 3,059,682 | | | | | | | | 806,875 | |
| | | | |
Net increase in net assets resulting from operations | | | | | | | 3,087,488 | | | | | | | | 1,366,400 | |
| | | | |
| | | | |
Distributions to shareholders from net investment income and net realized gains | | | | | | | | | | | | | | | | |
Class A | | | | | | | (333,051 | ) | | | | | | | (509,589 | ) |
Class C | | | | | | | (28,644 | ) | | | | | | | (59,497 | ) |
Class R6 | | | | | | | (410,590 | ) | | | | | | | (321,376 | ) |
Administrator Class | | | | | | | (268,283 | ) | | | | | | | (396,758 | ) |
Institutional Class | | | | | | | (274,619 | ) | | | | | | | (349,231 | ) |
| | | | |
Total distributions to shareholders | | | | | | | (1,315,187 | ) | | | | | | | (1,636,451 | ) |
| | | | |
| | | | |
Capital share transactions | | | Shares | | | | | | | | Shares | | | | | |
Proceeds from shares sold | | | | | | | | | | | | | | | | |
Class A | | | 341,385 | | | | 3,446,122 | | | | 536,260 | | | | 5,211,071 | |
Class C | | | 58,887 | | | | 586,232 | | | | 115,162 | | | | 1,107,921 | |
Class R6 | | | 700,870 | | | | 7,155,041 | | | | 315,330 | | | | 3,110,483 | |
Administrator Class | | | 754,263 | | | | 7,722,657 | | | | 418,320 | | | | 4,128,845 | |
Institutional Class | | | 587,649 | | | | 6,004,061 | | | | 733,768 | | | | 7,248,113 | |
| | | | |
| | | | | | | 24,914,113 | | | | | | | | 20,806,433 | |
| | | | |
Reinvestment of distributions | | | | | | | | | | | | | | | | |
Class A | | | 23,714 | | | | 238,785 | | | | 36,976 | | | | 359,276 | |
Class C | | | 2,484 | | | | 24,671 | | | | 5,600 | | | | 53,596 | |
Class R6 | | | 22,788 | | | | 231,443 | | | | 13,831 | | | | 135,701 | |
Administrator Class | | | 25,943 | | | | 265,162 | | | | 40,010 | | | | 394,108 | |
Institutional Class | | | 26,962 | | | | 274,014 | | | | 35,503 | | | | 348,182 | |
| | | | |
| | | | | | | 1,034,075 | | | | | | | | 1,290,863 | |
| | | | |
Payment for shares redeemed | | | | | | | | | | | | | | | | |
Class A | | | (865,507 | ) | | | (8,666,594 | ) | | | (1,429,739 | ) | | | (13,815,687 | ) |
Class C | | | (153,174 | ) | | | (1,519,143 | ) | | | (219,827 | ) | | | (2,105,292 | ) |
Class R6 | | | (395,994 | ) | | | (4,031,485 | ) | | | (71,175 | ) | | | (700,914 | ) |
Administrator Class | | | (827,804 | ) | | | (8,434,604 | ) | | | (1,441,193 | ) | | | (14,228,082 | ) |
Institutional Class | | | (699,776 | ) | | | (7,084,487 | ) | | | (874,093 | ) | | | (8,536,165 | ) |
| | | | |
| | | | | | | (29,736,313 | ) | | | | | | | (39,386,140 | ) |
| | | | |
Net decrease in net assets resulting from capital share transactions | | | | | | | (3,788,125 | ) | | | | | | | (17,288,844 | ) |
| | | | |
Total decrease in net assets | | | | | | | (2,015,824 | ) | | | | | | | (17,558,895 | ) |
| | | | |
| | | | |
Net assets | | | | | | | | | | | | | | | | |
Beginning of period | | | | | | | 59,281,816 | | | | | | | | 76,840,711 | |
| | | | |
End of period | | | | | | $ | 57,265,992 | | | | | | | $ | 59,281,816 | |
| | | | |
The accompanying notes are an integral part of these financial statements.
14 | Wells Fargo Real Return Fund
Financial highlights
(For a share outstanding throughout each period)
| | | | | | | | | | | | | | | | | | | | |
| | | Year ended May 31 | |
| CLASS A | | 2020 | | | 2019 | | | 2018 | | | 2017 | | | 2016 | |
Net asset value, beginning of period | | | $9.89 | | | | $9.87 | | | | $9.96 | | | | $9.95 | | | | $10.07 | |
Net investment income | | | 0.12 | | | | 0.15 | | | | 0.21 | | | | 0.19 | 1 | | | 0.10 | 1 |
Net realized and unrealized gains (losses) on investments | | | 0.42 | | | | 0.09 | | | | (0.09 | ) | | | 0.03 | | | | (0.01 | ) |
| | | | | | | | | | | | | | | | | | | | |
Total from investment operations | | | 0.54 | | | | 0.24 | | | | 0.12 | | | | 0.22 | | | | 0.09 | |
Distributions to shareholders from | | | | | | | | | | | | | | | | | | | | |
Net investment income | | | (0.21 | ) | | | (0.19 | ) | | | (0.21 | ) | | | (0.20 | ) | | | (0.07 | ) |
Net realized gains | | | 0.00 | | | | (0.03 | ) | | | 0.00 | | | | (0.01 | ) | | | (0.14 | ) |
| | | | | | | | | | | | | | | | | | | | |
Total distributions to shareholders | | | (0.21 | ) | | | (0.22 | ) | | | (0.21 | ) | | | (0.21 | ) | | | (0.21 | ) |
Net asset value, end of period | | | $10.22 | | | | $9.89 | | | | $9.87 | | | | $9.96 | | | | $9.95 | |
Total return2 | �� | | 5.48 | % | | | 2.56 | % | | | 1.25 | % | | | 2.23 | % | | | 1.01 | % |
Ratios to average net assets (annualized) | | | | | | | | | | | | | | | | | | | | |
Gross expenses3 | | | 1.43 | % | | | 1.16 | % | | | 1.04 | % | | | 1.11 | % | | | 1.20 | % |
Net expenses3 | | | 0.78 | % | | | 0.77 | % | | | 0.80 | % | | | 0.85 | % | | | 0.85 | % |
Net investment income3 | | | 1.79 | % | | | 1.95 | % | | | 2.15 | % | | | 1.92 | % | | | 0.98 | % |
Supplemental data | | | | | | | | | | | | | | | | | | | | |
Portfolio turnover rate4 | | | 24 | % | | | 39 | % | | | 29 | % | | | 25 | % | | | 29 | % |
Net assets, end of period (000s omitted) | | | $13,196 | | | | $17,716 | | | | $26,133 | | | | $29,678 | | | | $18,938 | |
| 1 | Calculated based upon average shares outstanding |
| 2 | Total return calculations do not include any sales charges. |
| 3 | Ratios include net expenses allocated from the affiliated Master Portfolio which were as follows: |
| | | | |
Year ended May 31, 2020 | | | 0.39 | % |
Year ended May 31, 2019 | | | 0.39 | % |
Year ended May 31, 2018 | | | 0.41 | % |
Year ended May 31, 2017 | | | 0.44 | % |
Year ended May 31, 2016 | | | 0.44 | % |
| 4 | Portfolio turnover rate is calculated by multiplying the affiliated Master Portfolio’s percentage of the Fund’s total investment in securities at the end of the period by the affiliated Master Portfolio’s portfolio turnover rate. |
The accompanying notes are an integral part of these financial statements.
Wells Fargo Real Return Fund | 15
Financial highlights
(For a share outstanding throughout each period)
| | | | | | | | | | | | | | | | | | | | |
| | | Year ended May 31 | |
| CLASS C | | 2020 | | | 2019 | | | 2018 | | | 2017 | | | 2016 | |
Net asset value, beginning of period | | | $9.73 | | | | $9.73 | | | | $9.82 | | | | $9.77 | | | | $9.92 | |
Net investment income | | | 0.11 | 1 | | | 0.10 | 1 | | | 0.03 | | | | 0.04 | | | | 0.03 | 1 |
Net realized and unrealized gains (losses) on investments | | | 0.35 | | | | 0.07 | | | | 0.02 | | | | 0.10 | | | | (0.02 | ) |
| | | | | | | | | | | | | | | | | | | | |
Total from investment operations | | | 0.46 | | | | 0.17 | | | | 0.05 | | | | 0.14 | | | | 0.01 | |
Distributions to shareholders from | | | | | | | | | | | | | | | | | | | | |
Net investment income | | | (0.13 | ) | | | (0.14 | ) | | | (0.14 | ) | | | (0.08 | ) | | | (0.02 | ) |
Net realized gains | | | 0.00 | | | | (0.03 | ) | | | 0.00 | | | | (0.01 | ) | | | (0.14 | ) |
| | | | | | | | | | | | | | | | | | | | |
Total distributions to shareholders | | | (0.13 | ) | | | (0.17 | ) | | | (0.14 | ) | | | (0.09 | ) | | | (0.16 | ) |
Net asset value, end of period | | | $10.06 | | | | $9.73 | | | | $9.73 | | | | $9.82 | | | | $9.77 | |
Total return2 | | | 4.77 | % | | | 1.79 | % | | | 0.53 | % | | | 1.44 | % | | | 0.21 | % |
Ratios to average net assets (annualized) | | | | | | | | | | | | | | | | | | | | |
Gross expenses3 | | | 2.18 | % | | | 1.91 | % | | | 1.79 | % | | | 1.86 | % | | | 1.95 | % |
Net expenses3 | | | 1.53 | % | | | 1.52 | % | | | 1.56 | % | | | 1.60 | % | | | 1.60 | % |
Net investment income3 | | | 1.09 | % | | | 1.08 | % | | | 1.39 | % | | | 1.23 | % | | | 0.30 | % |
Supplemental data | | | | | | | | | | | | | | | | | | | | |
Portfolio turnover rate4 | | | 24 | % | | | 39 | % | | | 29 | % | | | 25 | % | | | 29 | % |
Net assets, end of period (000s omitted) | | | $1,714 | | | | $2,553 | | | | $3,517 | | | | $4,580 | | | | $5,654 | |
| 1 | Calculated based upon average shares outstanding |
| 2 | Total return calculations do not include any sales charges. |
| 3 | Ratios include net expenses allocated from the affiliated Master Portfolio which were as follows: |
| | | | |
Year ended May 31, 2020 | | | 0.39 | % |
Year ended May 31, 2019 | | | 0.39 | % |
Year ended May 31, 2018 | | | 0.44 | % |
Year ended May 31, 2017 | | | 0.44 | % |
Year ended May 31, 2016 | | | 0.44 | % |
| 4 | Portfolio turnover rate is calculated by multiplying the affiliated Master Portfolio’s percentage of the Fund’s total investment in securities at the end of the period by the affiliated Master Portfolio’s portfolio turnover rate. |
The accompanying notes are an integral part of these financial statements.
16 | Wells Fargo Real Return Fund
Financial highlights
(For a share outstanding throughout each period)
| | | | | | | | | | | | | | | | |
| | | Year ended May 31 | |
| CLASS R6 | | 2020 | | | 2019 | | | 2018 | | | 20171 | |
Net asset value, beginning of period | | | $9.99 | | | | $9.96 | | | | $10.05 | | | | $10.17 | |
Net investment income | | | 0.22 | | | | 0.23 | 2 | | | 0.22 | | | | 0.10 | |
Net realized and unrealized gains (losses) on investments | | | 0.37 | | | | 0.06 | | | | (0.06 | ) | | | (0.07 | ) |
| | | | | | | | | | | | | | | | |
Total from investment operations | | | 0.59 | | | | 0.29 | | | | 0.16 | | | | 0.03 | |
Distributions to shareholders from | | | | | | | | | | | | | | | | |
Net investment income | | | (0.25 | ) | | | (0.23 | ) | | | (0.25 | ) | | | (0.14 | ) |
Net realized gains | | | 0.00 | | | | (0.03 | ) | | | 0.00 | | | | (0.01 | ) |
| | | | | | | | | | | | | | | | |
Total distributions to shareholders | | | (0.25 | ) | | | (0.26 | ) | | | (0.25 | ) | | | (0.15 | ) |
Net asset value, end of period | | | $10.33 | | | | $9.99 | | | | $9.96 | | | | $10.05 | |
Total return3 | | | 5.94 | % | | | 2.99 | % | | | 1.63 | % | | | 0.36 | % |
Ratios to average net assets (annualized) | | | | | | | | | | | | | | | | |
Gross expenses4 | | | 1.05 | % | | | 0.82 | % | | | 0.66 | % | | | 0.69 | % |
Net expenses4 | | | 0.40 | % | | | 0.39 | % | | | 0.42 | % | | | 0.47 | % |
Net investment income4 | | | 2.08 | % | | | 2.34 | % | | | 2.52 | % | | | 1.32 | % |
Supplemental data | | | | | | | | | | | | | | | | |
Portfolio turnover rate5 | | | 24 | % | | | 39 | % | | | 29 | % | | | 25 | % |
Net assets, end of period (000s omitted) | | | $18,224 | | | | $14,358 | | | | $11,750 | | | | $7,438 | |
| 1 | For the period from October 31, 2016 (commencement of operations) to May 31, 2017 |
| 2 | Calculated based upon average shares outstanding |
| 3 | Returns for periods of less than one year are not annualized. |
| 4 | Ratios include net expenses allocated from the affiliated Master Portfolio which were as follows: |
| | | | |
Year ended May 31, 2020 | | | 0.39 | % |
Year ended May 31, 2019 | | | 0.39 | % |
Year ended May 31, 2018 | | | 0.41 | % |
Year ended May 31, 20171 | | | 0.44 | % |
| 5 | Portfolio turnover rate is calculated by multiplying the affiliated Master Portfolio’s percentage of the Fund’s total investment in securities at the end of the period by the affiliated Master Portfolio’s portfolio turnover rate. |
The accompanying notes are an integral part of these financial statements.
Wells Fargo Real Return Fund | 17
Financial highlights
(For a share outstanding throughout each period)
| | | | | | | | | | | | | | | | | | | | |
| | | Year ended May 31 | |
| ADMINISTRATOR CLASS | | 2020 | | | 2019 | | | 2018 | | | 2017 | | | 2016 | |
Net asset value, beginning of period | | | $10.03 | | | | $9.99 | | | | $10.06 | | | | $10.03 | | | | $10.15 | |
Net investment income | | | 0.20 | 1 | | | 0.21 | 1 | | | 0.24 | 1 | | | 0.22 | 1 | | | 0.13 | 1 |
Net realized and unrealized gains (losses) on investments | | | 0.36 | | | | 0.06 | | | | (0.09 | ) | | | 0.02 | | | | (0.02 | ) |
| | | | | | | | | | | | | | | | | | | | |
Total from investment operations | | | 0.56 | | | | 0.27 | | | | 0.15 | | | | 0.24 | | | | 0.11 | |
Distributions to shareholders from | | | | | | | | | | | | | | | | | | | | |
Net investment income | | | (0.21 | ) | | | (0.20 | ) | | | (0.22 | ) | | | (0.20 | ) | | | (0.09 | ) |
Net realized gains | | | 0.00 | | | | (0.03 | ) | | | 0.00 | | | | (0.01 | ) | | | (0.14 | ) |
| | | | | | | | | | | | | | | | | | | | |
Total distributions to shareholders | | | (0.21 | ) | | | (0.23 | ) | | | (0.22 | ) | | | (0.21 | ) | | | (0.23 | ) |
Net asset value, end of period | | | $10.38 | | | | $10.03 | | | | $9.99 | | | | $10.06 | | | | $10.03 | |
Total return | | | 5.67 | % | | | 2.78 | % | | | 1.50 | % | | | 2.46 | % | | | 1.21 | % |
Ratios to average net assets (annualized) | | | | | | | | | | | | | | | | | | | | |
Gross expenses2 | | | 1.37 | % | | | 1.10 | % | | | 0.97 | % | | | 1.04 | % | | | 1.13 | % |
Net expenses2 | | | 0.60 | % | | | 0.59 | % | | | 0.60 | % | | | 0.60 | % | | | 0.60 | % |
Net investment income2 | | | 1.92 | % | | | 2.15 | % | | | 2.39 | % | | | 2.20 | % | | | 1.30 | % |
Supplemental data | | | | | | | | | | | | | | | | | | | | |
Portfolio turnover rate3 | | | 24 | % | | | 39 | % | | | 29 | % | | | 25 | % | | | 29 | % |
Net assets, end of period (000s omitted) | | | $13,544 | | | | $13,562 | | | | $23,331 | | | | $26,100 | | | | $20,607 | |
| 1 | Calculated based upon average shares outstanding |
| 2 | Ratios include net expenses allocated from the affiliated Master Portfolio which were as follows: |
| | | | |
Year ended May 31, 2020 | | | 0.39 | % |
Year ended May 31, 2019 | | | 0.39 | % |
Year ended May 31, 2018 | | | 0.41 | % |
Year ended May 31, 2017 | | | 0.44 | % |
Year ended May 31, 2016 | | | 0.44 | % |
| 3 | Portfolio turnover rate is calculated by multiplying the affiliated Master Portfolio’s percentage of the Fund’s total investment in securities at the end of the period by the affiliated Master Portfolio’s portfolio turnover rate. |
The accompanying notes are an integral part of these financial statements.
18 | Wells Fargo Real Return Fund
Financial highlights
(For a share outstanding throughout each period)
| | | | | | | | | | | | | | | | |
| | | Year ended May 31 | |
| INSTITUTIONAL CLASS | | 2020 | | | 2019 | | | 2018 | | | 20171 | |
Net asset value, beginning of period | | | $9.99 | | | | $9.97 | | | | $10.06 | | | | $10.17 | |
Net investment income | | | 0.21 | | | | 0.22 | | | | 0.24 | | | | 0.14 | |
Net realized and unrealized gains (losses) on investments | | | 0.37 | | | | 0.05 | | | | (0.08 | ) | | | (0.10 | ) |
| | | | | | | | | | | | | | | | |
Total from investment operations | | | 0.58 | | | | 0.27 | | | | 0.16 | | | | 0.04 | |
Distributions to shareholders from | | | | | | | | | | | | | | | | |
Net investment income | | | (0.24 | ) | | | (0.22 | ) | | | (0.25 | ) | | | (0.14 | ) |
Net realized gains | | | 0.00 | | | | (0.03 | ) | | | 0.00 | | | | (0.01 | ) |
| | | | | | | | | | | | | | | | |
Total distributions to shareholders | | | (0.24 | ) | | | (0.25 | ) | | | (0.25 | ) | | | (0.15 | ) |
Net asset value, end of period | | | $10.33 | | | | $9.99 | | | | $9.97 | | | | $10.06 | |
Total return2 | | | 5.88 | % | | | 2.84 | % | | | 1.57 | % | | | 0.41 | % |
Ratios to average net assets (annualized) | | | | | | | | | | | | | | | | |
Gross expenses3 | | | 1.10 | % | | | 0.84 | % | | | 0.71 | % | | | 0.76 | % |
Net expenses3 | | | 0.45 | % | | | 0.44 | % | | | 0.47 | % | | | 0.52 | % |
Net investment income3 | | | 2.09 | % | | | 2.20 | % | | | 2.62 | % | | | 2.24 | % |
Supplemental data | | | | | | | | | | | | | | | | |
Portfolio turnover rate4 | | | 24 | % | | | 39 | % | | | 29 | % | | | 25 | % |
Net assets, end of period (000s omitted) | | | $10,587 | | | | $11,094 | | | | $12,110 | | | | $5,229 | |
| 1 | For the period from October 31, 2016 (commencement of class operations) to May 31, 2017 |
| 2 | Returns for periods of less than one year are not annualized. |
| 3 | Ratios include net expenses allocated from the affiliated Master Portfolio which were as follows: |
| | | | |
Year ended May 31, 2020 | | | 0.39 | % |
Year ended May 31, 2019 | | | 0.39 | % |
Year ended May 31, 2018 | | | 0.41 | % |
Year ended May 31, 20171 | | | 0.44 | % |
| 4 | Portfolio turnover rate is calculated by multiplying the affiliated Master Portfolio’s percentage of the Fund’s total investments in securities at the end of the period by the affiliated Master Portfolio’s portfolio turnover rate. |
The accompanying notes are an integral part of these financial statements.
Wells Fargo Real Return Fund | 19
Notes to financial statements
1. ORGANIZATION
Wells Fargo Funds Trust (the “Trust”), a Delaware statutory trust organized on March 10, 1999, is an open-end management investment company registered under the Investment Company Act of 1940, as amended (the “1940 Act”). As an investment company, the Trust follows the accounting and reporting guidance in Financial Accounting Standards Board (“FASB”) Accounting Standards Codification Topic 946, Financial Services – Investment Companies. These financial statements report on the Wells Fargo Real Return Fund (the “Fund”) which is a diversified series of the Trust.
The Fund is a feeder fund in a master-feeder structure that invests substantially all of its assets in a single master portfolio with a substantially identical investment objective and substantially similar investment strategies. The Fund invests in Wells Fargo Real Return Portfolio (the “affiliated Master Portfolio”) which is a separate diversified portfolio of Wells Fargo Master Trust, a registered open-end management investment company. As of May 31, 2020, the Fund owned 35% of Wells Fargo Real Return Portfolio. The affiliated Master Portfolio directly acquires portfolio securities and the Fund acquires an indirect interest in those securities. The Fund accounts for its investment in the affiliated Master Portfolio as a partnership investment and records on a daily basis its share of the affiliated Master Portfolio’s income, expense and realized and unrealized gains and losses. The financial statements of the affiliated Master Portfolio for the year ended May 31, 2020 are included in this report and should be read in conjunction with the Fund’s financial statements.
2. SIGNIFICANT ACCOUNTING POLICIES
The following significant accounting policies, which are consistently followed in the preparation of the financial statements of the Fund, are in conformity with U.S. generally accepted accounting principles which require management to make estimates and assumptions that affect the reported amounts of assets and liabilities, disclosure of contingent assets and liabilities at the date of the financial statements, and the reported amounts of revenues and expenses during the reporting period. Actual results could differ from those estimates.
Securities valuation
All investments are valued each business day as of the close of regular trading on the New York Stock Exchange (generally 4 p.m. Eastern Time), although the Fund may deviate from this calculation time under unusual or unexpected circumstances.
Investments in the affiliated Master Portfolio are valued daily based on the Fund’s proportionate share of the affiliated Master Portfolio’s net assets, which are also valued daily. Securities held in the affiliated Master Portfolio are valued as discussed in the Notes to Financial Statements of the affiliated Master Portfolio, which are included elsewhere in this report.
Investments which are not valued using the method discussed above are valued at their fair value, as determined in good faith by the Board of Trustees of the Fund. The Board of Trustees has established a Valuation Committee comprised of the Trustees and has delegated to it the authority to take any actions regarding the valuation of portfolio securities that the Valuation Committee deems necessary or appropriate, including determining the fair value of portfolio securities, unless the determination has been delegated to the Wells Fargo Asset Management Pricing Committee at Wells Fargo Funds Management, LLC (“Funds Management”). The Board of Trustees retains the authority to make or ratify any valuation decisions or approve any changes to the Valuation Procedures as it deems appropriate. On a quarterly basis, the Board of Trustees receives reports on any valuation actions taken by the Valuation Committee or the Wells Fargo Asset Management Pricing Committee which may include items for ratification.
Investment transactions, income and expenses
Investments in the affiliated Master Portfolio are recorded on a trade basis. The Fund records daily its proportionate share of the affiliated Master Portfolio’s income, expenses and realized and unrealized gains or losses. The Fund also accrues its own expenses.
Distributions to shareholders
Distributions to shareholders are recorded on the ex-dividend date and paid from net investment income monthly and any net realized gains are paid at least annually. Such distributions are determined in accordance with income tax regulations and may differ from U.S. generally accepted accounting principles. Dividend sources are estimated at the time of declaration. The tax character of distributions is determined as of the Fund’s fiscal year end. Therefore, a portion of the Fund’s distributions made prior to the Fund’s fiscal year end may be categorized as a tax return of capital at year end.
Federal and other taxes
The Fund intends to continue to qualify as a regulated investment company by distributing substantially all of its investment company taxable income and any net realized capital gains (after reduction for capital loss carryforwards) sufficient to relieve it from all, or substantially all, federal income taxes. Accordingly, no provision for federal income taxes was required.
20 | Wells Fargo Real Return Fund
Notes to financial statements
The Fund’s income and federal excise tax returns and all financial records supporting those returns for the prior three fiscal years are subject to examination by the federal and Delaware revenue authorities. Management has analyzed the Fund’s tax positions taken on federal, state, and foreign tax returns for all open tax years and does not believe that there are any uncertain tax positions that require recognition of a tax liability.
As of May 31, 2020, the aggregate cost of all investments for federal income tax purposes was $53,216,678 and the unrealized gains (losses) consisted of:
| | | | |
| |
Gross unrealized gains | | $ | 3,966,098 | |
| |
Gross unrealized losses | | | 0 | |
| |
Net unrealized gains | | $ | 3,966,098 | |
As of May 31, 2020, the Fund had capital loss carryforwards which consist of $1,082,708 in short-term capital losses and $906,231 in long-term capital losses.
Class allocations
The separate classes of shares offered by the Fund differ principally in applicable sales charges, distribution, shareholder servicing, and administration fees. Class specific expenses are charged directly to that share class. Investment income, common fund-level expenses, and realized and unrealized gains (losses) on investments are allocated daily to each class of shares based on the relative proportion of net assets of each class.
3. FAIR VALUATION MEASUREMENTS
At May 31, 2020, the affiliated Master Portfolio was measured at fair value using the net asset value per share (or its equivalent) as a practical expedient. The investment objective and the value of the affiliate Master Portfolio was as follows:
| | | | | | |
| | |
| Affiliated Master Portfolio | | Investment objective | | Value of
affiliated Master
Portfolio | |
| | |
Wells Fargo Real Return Portfolio | | Seeks returns that exceed the rate of inflation over the long-term | | $ | 57,182,776 | |
The affiliated Master Portfolio does not have a redemption period notice, can be redeemed daily and does not have any unfunded commitments.
4. TRANSACTIONS WITH AFFILIATES
Management fee
Funds Management, an indirect wholly owned subsidiary of Wells Fargo & Company (“Wells Fargo”), is the manager of the Fund and provides advisory and fund-level administrative services under an investment management agreement. Under the investment management agreement, Funds Management is responsible for, among other services, implementing the investment objectives and strategies of the Fund and providing fund-level administrative services in connection with the Fund’s operations. As long as the Fund continues to invest substantially all of its assets in a single affiliated Master Portfolio, the Fund pays Funds Management an investment management fee only for fund-level administrative services at the following annual rate based on the Fund’s average daily net assets:
| | | | |
| |
| Average daily net assets | | Management fee | |
| |
First $5 billion | | | 0.05 | % |
| |
Next $5 billion | | | 0.04 | |
| |
Over $10 billion | | | 0.03 | |
For the year ended May 31, 2020, the management fee was equivalent to an annual rate of 0.05% of the Fund’s average daily net assets.
Funds Management also serves as the adviser to the affiliated Master Portfolio and is entitled to receive a fee from the affiliated Master Portfolio for those services.
Wells Fargo Real Return Fund | 21
Notes to financial statements
Administration fees
Under a class-level administration agreement, Funds Management provides class-level administrative services to the Fund, which includes paying fees and expenses for services provided by the transfer agent, sub-transfer agents, omnibus account servicers and record-keepers. As compensation for its services under the class-level administration agreement, Funds Management receives an annual fee which is calculated based on the average daily net assets of each class as follows:
| | | | |
| |
| | | Class-level
administration fee | |
| |
Class A, Class C | | | 0.16 | % |
| |
Class R6 | | | 0.03 | |
| |
Administrator Class | | | 0.10 | |
| |
Institutional Class | | | 0.08 | |
Waivers and/or expense reimbursements
Funds Management has contractually waived and/or reimbursed management and administration fees to the extent necessary to maintain certain net operating expense ratios for the Fund. When each class of the Fund has exceeded its expense cap, Funds Management has waived fees and/or reimbursed expenses from fund-level expenses on a proportionate basis and then from class specific expenses. When only certain classes exceed their expense caps, waivers and/or reimbursements are applied against class specific expenses before fund-level expenses. Net expenses from the affiliated Master Portfolio are included in the expense caps. Funds Management has committed through September 30, 2020 to waive fees and/or reimburse expenses to the extent necessary to cap the Fund’s expenses at 0.78% for Class A shares, 1.53% for Class C shares, 0.40% for Class R6 shares, 0.60% for Administrator Class shares, and 0.45% for Institutional Class shares. Prior to or after the commitment expiration date, the cap may be increased or the commitment to maintain the cap may be terminated only with the approval of the Board of Trustees.
Distribution fee
The Trust has adopted a distribution plan for Class C shares of the Fund pursuant to Rule 12b-1 under the 1940 Act. A distribution fee is charged to Class C shares and paid to Wells Fargo Funds Distributor, LLC (“Funds Distributor”), the principal underwriter, at an annual rate of 0.75% of the average daily net assets of Class C shares.
In addition, Funds Distributor is entitled to receive the front-end sales charge from the purchase of Class A shares and a contingent deferred sales charge on the redemption of certain Class A shares. Funds Distributor is also entitled to receive the contingent deferred sales charges from redemptions of Class C shares. For the year ended May 31, 2020, Funds Distributor received $65 from the sale of Class A shares. No contingent deferred sales charges were incurred by Class A and Class C shares for the year ended May 31, 2020.
Shareholder servicing fees
The Trust has entered into contracts with one or more shareholder servicing agents, whereby Class A, Class C, and Administrator Class of the Fund are charged a fee at an annual rate of 0.25% of the average daily net assets of each respective class. A portion of these total shareholder servicing fees were paid to affiliates of Wells Fargo.
5. INVESTMENT PORTFOLIO TRANSACTIONS
The Fund seeks to achieve its investment objective by investing substantially all of its assets in a single affiliated Master Portfolio. Purchases and sales have been calculated by multiplying the Fund’s ownership percentage of the affiliated Master Portfolio by the affiliated Master Portfolio’s purchases and sales. Purchases and sales of investments, excluding short-term securities, for the year ended May 31, 2020 were as follows:
| | | | | | |
Purchases at cost | | Sales proceeds |
U.S.
government | | Non-U.S. government | | U.S. government | | Non-U.S. government |
| $3,621,157 | | $11,256,534 | | $11,770,359 | | $11,516,037 |
6. BANK BORROWINGS
The Trust, along with Wells Fargo Variable Trust and Wells Fargo Funds Trust (excluding the money market funds), are parties to a $280,000,000 revolving credit agreement whereby the Portfolio is permitted to use bank borrowings for temporary or
22 | Wells Fargo Real Return Fund
Notes to financial statements
emergency purposes, such as to fund shareholder redemption requests. Interest under the credit agreement is charged to the Portfolio based on a borrowing rate equal to the higher of the Federal Funds rate in effect on that day plus 1.25% or the overnight LIBOR rate in effect on that day plus 1.25%. In addition, an annual commitment fee equal to 0.25% of the unused balance is allocated to each participating fund.
For the year ended May 31, 2020, there were no borrowings by the Portfolio under the agreement.
7. DISTRIBUTIONS TO SHAREHOLDERS
The tax character of distributions paid during the years ended May 31, 2020 and May 31, 2019 were as follows:
| | | | | | | | |
| | | Year ended May 31 | |
| | |
| | | 2020 | | | 2019 | |
| | |
Ordinary income | | $ | 1,315,187 | | | $ | 1,409,996 | |
| | |
Long-term capital gain | | | 0 | | | | 226,455 | |
As of May 31, 2020, the components of distributable earnings on a tax basis were as follows:
| | | | |
Undistributed ordinary income | | Unrealized gains | | Capital loss carryforward |
| | |
| $72,082 | | $3,966,098 | | $(1,988,939) |
8. INDEMNIFICATION
Under the Fund’s organizational documents, the officers and Trustees have been granted certain indemnification rights against certain liabilities that may arise out of performance of their duties to the Fund. The Fund has entered into a separate agreement with each Trustee that converts indemnification rights currently existing under the Fund’s organizational documents into contractual rights that cannot be changed in the future without the consent of the Trustee. Additionally, in the normal course of business, the Fund may enter into contracts with service providers that contain a variety of indemnification clauses. The Fund’s maximum exposure under these arrangements is dependent on future claims that may be made against the Fund and, therefore, cannot be estimated.
9. NEW ACCOUNTING PRONOUNCEMENT
In August 2018, FASB issued Accounting Standards Update (“ASU”) No. 2018-13, Fair Value Measurement (Topic 820) Disclosure Framework—Changes to the Disclosure Requirements for Fair Value Measurement. ASU 2018-13 updates the disclosure requirements for fair value measurements by modifying or removing certain disclosures and adding certain new disclosures. The amendments are effective for fiscal years, and interim periods within those fiscal years, beginning after December 15, 2019. Early adoption is permitted. Management has adopted the removal and modification of disclosures early, as permitted, and will adopt the additional new disclosures at the effective date.
10. CORONAVIRUS (COVID-19) PANDEMIC
On March 11, 2020, the World Health Organization announced that it had made the assessment that coronavirus disease 2019 (“COVID-19”) is a pandemic. The impacts of COVID-19 are adversely affecting the entire global economy, individual companies and investment products, and the market in general. There is significant uncertainty around the extent and duration of business disruptions related to COVID-19 and the impacts may be short term or may last for an extended period of time. The risk of further spreading of COVID-19 has led to significant uncertainty and volatility in the financial markets. The value of the Fund and the Master Portfolio in which the Fund invests have generally been adversely affected by impacts caused by COVID-19.
Wells Fargo Real Return Fund | 23
Report of independent registered public accounting firm
TO THE SHAREHOLDERS OF THE FUND AND BOARD OF TRUSTEES WELLS FARGO FUNDS TRUST:
Opinion on the Financial Statements
We have audited the accompanying statement of assets and liabilities of Wells Fargo Real Return Fund (the Fund), one of the funds constituting Wells Fargo Funds Trust, including the portfolio of investments, as of May 31, 2020, the related statement of operations for the year then ended, the statements of changes in net assets for each of the years in the two-year period then ended, and the related notes (collectively, the financial statements) and the financial highlights for each of the years or periods in the five-year period then ended. In our opinion, the financial statements and financial highlights present fairly, in all material respects, the financial position of the Fund as of May 31, 2020, the results of its operations for the year then ended, the changes in its net assets for each of the years in the two-year period then ended, and the financial highlights for each of the years or periods in the five-year period then ended, in conformity with U.S. generally accepted accounting principles.
Basis for Opinion
These financial statements and financial highlights are the responsibility of the Fund’s management. Our responsibility is to express an opinion on these financial statements and financial highlights based on our audits. We are a public accounting firm registered with the Public Company Accounting Oversight Board (United States) (PCAOB) and are required to be independent with respect to the Fund in accordance with the U.S. federal securities laws and the applicable rules and regulations of the Securities and Exchange Commission and the PCAOB.
We conducted our audits in accordance with the standards of the PCAOB. Those standards require that we plan and perform the audit to obtain reasonable assurance about whether the financial statements and financial highlights are free of material misstatement, whether due to error or fraud. Our audits included performing procedures to assess the risks of material misstatement of the financial statements and financial highlights, whether due to error or fraud, and performing procedures that respond to those risks. Such procedures included examining, on a test basis, evidence regarding the amounts and disclosures in the financial statements and financial highlights. Such procedures also included confirmation of securities owned as of May 31, 2020, by correspondence with the transfer agent. Our audits also included evaluating the accounting principles used and significant estimates made by management, as well as evaluating the overall presentation of the financial statements and financial highlights. We believe that our audits provide a reasonable basis for our opinion.

We have not been able to determine the specific year that we began serving as the auditor of one or more Wells Fargo Funds investment companies; however we are aware that we have served as the auditor of one or more Wells Fargo Funds investment companies since at least 1955.
Boston, Massachusetts
July 29, 2020
24 | Wells Fargo Real Return Fund
Portfolio of investments—May 31, 2020
| | | | | | | | | | | | | | | | |
| | | | | | | | | Shares | | | Value | |
| Common Stocks: 12.66% | |
|
Consumer Staples: 3.73% | |
|
| Beverages: 0.62% | |
PepsiCo Incorporated | | | | | | | | | | | 7,618 | | | $ | 1,002,148 | |
| | | | | | | | | | | | | | | | |
|
| Food & Staples Retailing: 0.92% | |
Costco Wholesale Corporation | | | | | | | | | | | 1,672 | | | | 515,762 | |
Walmart Incorporated | | | | | | | | | | | 7,908 | | | | 981,066 | |
| | | | |
| | | | | | | | | | | | | | | 1,496,828 | |
| | | | | | | | | | | | | | | | |
|
| Food Products: 0.61% | |
Mondelez International Incorporated Class A | | | | | | | | | | | 9,802 | | | | 510,880 | |
Nomad Foods Limited † | | | | | | | | | | | 12,990 | | | | 275,128 | |
Tyson Foods Incorporated Class A | | | | | | | | | | | 3,169 | | | | 194,703 | |
| | | | |
| | | | | | | | | | | | | | | 980,711 | |
| | | | | | | | | | | | | | | | |
|
| Household Products: 1.36% | |
Church & Dwight Company Incorporated | | | | | | | | | | | 6,577 | | | | 493,735 | |
The Clorox Company | | | | | | | | | | | 1,640 | | | | 338,250 | |
The Procter & Gamble Company | | | | | | | | | | | 11,849 | | | | 1,373,536 | |
| | | | |
| | | | | | | | | | | | | | | 2,205,521 | |
| | | | | | | | | | | | | | | | |
|
| Tobacco: 0.22% | |
Philip Morris International Incorporated | | | | | | | | | | | 4,953 | | | | 363,352 | |
| | | | | | | | | | | | | | | | |
|
Energy: 1.15% | |
|
| Oil, Gas & Consumable Fuels: 1.15% | |
BP plc | | | | | | | | | | | 23,180 | | | | 536,385 | |
Chevron Corporation | | | | | | | | | | | 7,961 | | | | 730,024 | |
Phillips 66 | | | | | | | | | | | 7,623 | | | | 596,576 | |
| | | | |
| | | | | | | | | | | | | | | 1,862,985 | |
| | | | | | | | | | | | | | | | |
|
Financials: 0.08% | |
|
| Mortgage REITs: 0.08% | |
AGNC Investment Corporation | | | | | | | | | | | 10,171 | | | | 131,613 | |
| | | | | | | | | | | | | | | | |
|
Materials: 3.23% | |
|
| Chemicals: 1.05% | |
Ecolab Incorporated | | | | | | | | | | | 1,407 | | | | 299,100 | |
Linde plc | | | | | | | | | | | 3,334 | | | | 674,602 | |
The Sherwin-Williams Company | | | | | | | | | | | 771 | | | | 457,858 | |
Westlake Chemical Corporation | | | | | | | | | | | 5,632 | | | | 268,635 | |
| | | | |
| | | | | | | | | | | | | | | 1,700,195 | |
| | | | | | | | | | | | | | | | |
|
| Construction Materials: 0.15% | |
Martin Marietta Materials Incorporated | | | | | | | | | | | 1,253 | | | | 240,689 | |
| | | | | | | | | | | | | | | | |
|
| Containers & Packaging: 0.12% | |
Crown Holdings Incorporated † | | | | | | | | | | | 3,023 | | | | 197,795 | |
| | | | | | | | | | | | | | | | |
|
| Metals & Mining: 1.91% | |
Agnico-Eagle Mines Limited | | | | | | | | | | | 2,300 | | | | 147,200 | |
Alacer Gold Corporation † | | | | | | | | | | | 7,000 | | | | 43,621 | |
Alamos Gold Incorporated Class A | | | | | | | | | | | 10,500 | | | | 85,031 | |
The accompanying notes are an integral part of these financial statements.
Wells Fargo Real Return Portfolio | 25
Portfolio of investments—May 31, 2020
| | | | | | | | | | | | | | | | |
| | | | | | | | | Shares | | | Value | |
|
| Metals & Mining (continued) | |
AngloGold Ashanti Limited ADR | | | | | | | | | | | 3,500 | | | $ | 85,960 | |
B2Gold Corporation | | | | | | | | | | | 27,000 | | | | 148,840 | |
Barrick Gold Corporation | | | | | | | | | | | 12,056 | | | | 289,344 | |
Endeavour Mining Corporation † | | | | | | | | | | | 2,700 | | | | 65,066 | |
Evolution Mining Limited | | | | | | | | | | | 21,000 | | | | 84,174 | |
Franco-Nevada Corporation | | | | | | | | | | | 1,000 | | | | 140,364 | |
Gold Fields Limited ADR | | | | | | | | | | | 11,500 | | | | 88,780 | |
Kinross Gold Corporation † | | | | | | | | | | | 21,500 | | | | 139,757 | |
Kirkland Lake Gold Limited | | | | | | | | | | | 3,437 | | | | 132,428 | |
MAG Silver Corporation † | | | | | | | | | | | 6,000 | | | | 74,562 | |
Newcrest Mining Limited | | | | | | | | | | | 6,200 | | | | 125,630 | |
Newmont Goldcorp Corporation | | | | | | | | | | | 5,940 | | | | 347,312 | |
Northern Star Resources Limited | | | | | | | | | | | 15,000 | | | | 145,236 | |
Pan American Silver Corporation | | | | | | | | | | | 3,300 | | | | 96,690 | |
Royal Gold Incorporated | | | | | | | | | | | 2,342 | | | | 311,954 | |
SSR Mining Incorporated † | | | | | | | | | | | 3,100 | | | | 59,613 | |
Steel Dynamics Incorporated | | | | | | | | | | | 7,368 | | | | 195,694 | |
Torex Gold Resources Incorporated † | | | | | | | | | | | 5,000 | | | | 68,998 | |
Wheaton Precious Metals Corporation | | | | | | | | | | | 4,100 | | | | 176,644 | |
Yamana Gold Incorporated | | | | | | | | | | | 9,000 | | | | 48,698 | |
| | | | |
| | | | | | | | | | | | | | | 3,101,596 | |
| | | | | | | | | | | | | | | | |
| | | | |
Real Estate: 4.47% | | | | | | | | | | | | | | | | |
| | | | |
| Equity REITs: 4.47% | | | | | | | | | | | | |
Alexandria Real Estate Equities Incorporated | | | | | | | | | | | 2,314 | | | | 355,708 | |
American Homes 4 Rent Class A | | | | | | | | | | | 8,535 | | | | 215,423 | |
American Tower Corporation | | | | | | | | | | | 3,252 | | | | 839,569 | |
Camden Property Trust | | | | | | | | | | | 2,593 | | | | 237,441 | |
CoreSite Realty Corporation | | | | | | | | | | | 2,352 | | | | 293,577 | |
Equinix Incorporated | | | | | | | | | | | 1,175 | | | | 819,715 | |
Equity Residential | | | | | | | | | | | 3,508 | | | | 212,444 | |
Four Corners Property Trust Incorporated | | | | | | | | | | | 14,457 | | | | 312,560 | |
Healthcare Realty Trust Incorporated | | | | | | | | | | | 9,571 | | | | 293,830 | |
Host Hotels & Resorts Incorporated | | | | | | | | | | | 10,882 | | | | 129,931 | |
Hudson Pacific Properties Incorporated | | | | | | | | | | | 6,749 | | | | 163,123 | |
Invitation Homes Incorporated | | | | | | | | | | | 12,539 | | | | 329,776 | |
Mid-America Apartment Communities Incorporated | | | | | | | | | | | 2,072 | | | | 241,098 | |
Prologis Incorporated | | | | | | | | | | | 7,688 | | | | 703,452 | |
Public Storage Incorporated | | | | | | | | | | | 1,077 | | | | 218,351 | |
Retail Opportunity Investment Corporation | | | | | | | | | | | 16,380 | | | | 153,808 | |
SBA Communications Corporation | | | | | | | | | | | 1,707 | | | | 536,220 | |
Simon Property Group Incorporated | | | | | | | | | | | 1,970 | | | | 113,669 | |
STAG Industrial Incorporated | | | | | | | | | | | 7,719 | | | | 207,641 | |
Sun Communities Incorporated | | | | | | | | | | | 3,287 | | | | 450,944 | |
VICI Properties Incorporated | | | | | | | | | | | 20,686 | | | | 405,859 | |
| | | | |
| | | | | | | | | | | | | | | 7,234,139 | |
| | | | | | | | | | | | | | | | |
| |
Total Common Stocks (Cost $16,454,740) | | | | 20,517,572 | |
| | | | | |
| | | | |
| | | | | | | | | | | | | | | | |
The accompanying notes are an integral part of these financial statements.
26 | Wells Fargo Real Return Portfolio
Portfolio of investments—May 31, 2020
| | | | | | | | | | | | | | | | |
| | | Interest rate | | | Maturity date | | | Principal | | | Value | |
| Corporate Bonds and Notes: 13.53% | |
|
Communication Services: 1.75% | |
|
| Diversified Telecommunication Services: 0.45% | |
CenturyLink Incorporated | | | 6.75 | % | | | 12-1-2023 | | | $ | 260,000 | | | $ | 282,264 | |
CenturyLink Incorporated | | | 6.45 | | | | 6-15-2021 | | | | 155,000 | | | | 159,263 | |
Commscope Holding Company Incorporated 144A | | | 5.50 | | | | 3-1-2024 | | | | 75,000 | | | | 77,134 | |
Level 3 Financing Incorporated | | | 5.38 | | | | 1-15-2024 | | | | 125,000 | | | | 126,563 | |
Level 3 Financing Incorporated | | | 5.38 | | | | 5-1-2025 | | | | 85,000 | | | | 87,321 | |
| | | | |
| | | | | | | | | | | | | | | 732,545 | |
| | | | | | | | | | | | | | | | |
|
| Entertainment: 0.38% | |
Netflix Incorporated | | | 5.38 | | | | 2-1-2021 | | | | 600,000 | | | | 612,750 | |
| | | | | | | | | | | | | | | | |
|
| Media: 0.66% | |
CSC Holdings LLC | | | 6.75 | | | | 11-15-2021 | | | | 105,000 | | | | 110,621 | |
DISH DBS Corporation | | | 5.88 | | | | 7-15-2022 | | | | 190,000 | | | | 195,267 | |
DISH DBS Corporation | | | 6.75 | | | | 6-1-2021 | | | | 155,000 | | | | 158,100 | |
Sirius XM Radio Incorporated 144A | | | 3.88 | | | | 8-1-2022 | | | | 600,000 | | | | 601,500 | |
| | | | |
| | | | | | | | | | | | | | | 1,065,488 | |
| | | | | | | | | | | | | | | | |
|
| Wireless Telecommunication Services: 0.26% | |
Sprint Corporation | | | 7.88 | | | | 9-15-2023 | | | | 155,000 | | | | 175,925 | |
Sprint Spectrum Company LLC 144A | | | 3.36 | | | | 3-20-2023 | | | | 65,625 | | | | 65,912 | |
T-Mobile USA Incorporated | | | 4.00 | | | | 4-15-2022 | | | | 175,000 | | | | 179,813 | |
| | | | |
| | | | | | | | | | | | | | | 421,650 | |
| | | | | | | | | | | | | | | | |
|
Consumer Discretionary: 2.53% | |
|
| Auto Components: 0.12% | |
Allison Transmission Incorporated 144A | | | 5.00 | | | | 10-1-2024 | | | | 200,000 | | | | 201,500 | |
| | | | | | | | | | | | | | | | |
|
| Hotels, Restaurants & Leisure: 0.14% | |
MGM Resorts International | | | 7.75 | | | | 3-15-2022 | | | | 130,000 | | | | 135,311 | |
Royal Caribbean Cruises Limited 144A | | | 11.50 | | | | 6-1-2025 | | | | 85,000 | | | | 90,130 | |
| | | | |
| | | | | | | | | | | | | | | 225,441 | |
| | | | | | | | | | | | | | | | |
|
| Household Durables: 0.94% | |
KB Home | | | 7.50 | | | | 9-15-2022 | | | | 315,000 | | | | 344,925 | |
Lennar Corporation | | | 6.25 | | | | 12-15-2021 | | | | 250,000 | | | | 257,344 | |
Newell Brands Incorporated | | | 4.35 | | | | 4-1-2023 | | | | 267,000 | | | | 274,343 | |
Pulte Group Incorporated | | | 4.25 | | | | 3-1-2021 | | | | 400,000 | | | | 406,040 | |
Toll Brothers Finance Corporation | | | 5.88 | | | | 2-15-2022 | | | | 225,000 | | | | 234,281 | |
| | | | |
| | | | | | | | | | | | | | | 1,516,933 | |
| | | | | | | | | | | | | | | | |
|
| Internet & Direct Marketing Retail: 0.26% | |
QVC Incorporated | | | 4.38 | | | | 3-15-2023 | | | | 140,000 | | | | 136,500 | |
QVC Incorporated | | | 5.13 | | | | 7-2-2022 | | | | 290,000 | | | | 289,638 | |
| | | | |
| | | | | | | | | | | | | | | 426,138 | |
| | | | | | | | | | | | | | | | |
|
| Multiline Retail: 0.21% | |
Macy’s Incorporated 144A%% | | | 8.38 | | | | 6-15-2025 | | | | 235,000 | | | | 238,231 | |
Macy’s Retail Holdings Incorporated | | | 3.45 | | | | 1-15-2021 | | | | 100,000 | | | | 97,000 | |
| | | | |
| | | | | | | | | | | | | | | 335,231 | |
| | | | | | | | | | | | | | | | |
The accompanying notes are an integral part of these financial statements.
Wells Fargo Real Return Portfolio | 27
Portfolio of investments—May 31, 2020
| | | | | | | | | | | | | | | | |
| | | Interest rate | | | Maturity date | | | Principal | | | Value | |
| Specialty Retail: 0.75% | |
Group 1 Automotive Incorporated | | | 5.00 | % | | | 6-1-2022 | | | $ | 395,000 | | | $ | 387,100 | |
L Brands Incorporated | | | 6.63 | | | | 4-1-2021 | | | | 365,000 | | | | 363,175 | |
Penske Auto Group Incorporated | | | 3.75 | | | | 8-15-2020 | | | | 360,000 | | | | 356,432 | |
Penske Auto Group Incorporated | | | 5.75 | | | | 10-1-2022 | | | | 110,000 | | | | 110,275 | |
| | | | |
| | | | | | | | | | | | | | | 1,216,982 | |
| | | | | | | | | | | | | | | | |
|
| Textiles, Apparel & Luxury Goods: 0.11% | |
Levi Strauss & Company | | | 5.00 | | | | 5-1-2025 | | | | 180,000 | | | | 183,600 | |
| | | | | | | | | | | | | | | | |
|
Consumer Staples: 0.49% | |
|
| Food Products: 0.21% | |
Albertsons Company | | | 6.63 | | | | 6-15-2024 | | | | 330,000 | | | | 341,220 | |
| | | | | | | | | | | | | | | | |
|
| Personal Products: 0.28% | |
Edgewell Personal Care Company | | | 4.70 | | | | 5-19-2021 | | | | 380,000 | | | | 394,782 | |
Edgewell Personal Care Company | | | 4.70 | | | | 5-24-2022 | | | | 60,000 | | | | 61,800 | |
| | | | |
| | | | | | | | | | | | | | | 456,582 | |
| | | | | | | | | | | | | | | | |
|
Energy: 1.59% | |
|
| Oil, Gas & Consumable Fuels: 1.59% | |
Apache Corporation | | | 3.25 | | | | 4-15-2022 | | | | 115,000 | | | | 110,488 | |
Buckeye Partners LP 144A | | | 4.13 | | | | 3-1-2025 | | | | 50,000 | | | | 49,063 | |
Crestwood Midstream Partners LP | | | 6.25 | | | | 4-1-2023 | | | | 210,000 | | | | 200,025 | |
DCP Midstream Operating LP 144A | | | 4.75 | | | | 9-30-2021 | | | | 300,000 | | | | 294,000 | |
NuStar Logistics LP | | | 4.80 | | | | 9-1-2020 | | | | 210,000 | | | | 211,706 | |
Sabine Pass Liquefaction LLC | | | 6.25 | | | | 3-15-2022 | | | | 250,000 | | | | 265,941 | |
Southern Star Central Corporation 144A | | | 5.13 | | | | 7-15-2022 | | | | 405,000 | | | | 405,122 | |
Suburban Propane Partners LP | | | 5.50 | | | | 6-1-2024 | | | | 345,000 | | | | 348,450 | |
Tallgrass Energy Partners LP 144A | | | 4.75 | | | | 10-1-2023 | | | | 360,000 | | | | 351,900 | |
Targa Resources Partners LP | | | 4.25 | | | | 11-15-2023 | | | | 345,000 | | | | 337,303 | |
| | | | |
| | | | | | | | | | | | | | | 2,573,998 | |
| | | | | | | | | | | | | | | | |
|
Financials: 2.04% | |
|
| Banks: 0.19% | |
CIT Group Incorporated | | | 5.00 | | | | 8-15-2022 | | | | 305,000 | | | | 305,763 | |
| | | | | | | | | | | | | | | | |
|
| Capital Markets: 0.25% | |
Blue Cube Spinco Incorporated | | | 10.00 | | | | 10-15-2025 | | | | 390,000 | | | | 410,998 | |
| | | | | | | | | | | | | | | | |
|
| Consumer Finance: 0.99% | |
Ford Motor Credit Company LLC | | | 3.34 | | | | 3-18-2021 | | | | 170,000 | | | | 167,144 | |
Ford Motor Credit Company LLC | | | 5.60 | | | | 1-7-2022 | | | | 160,000 | | | | 159,600 | |
General Motors Financial Company | | | 4.20 | | | | 3-1-2021 | | | | 380,000 | | | | 383,811 | |
Navient Corporation | | | 5.00 | | | | 10-26-2020 | | | | 400,000 | | | | 394,000 | |
Springleaf Finance Corporation | | | 6.13 | | | | 3-15-2024 | | | | 95,000 | | | | 92,179 | |
Springleaf Finance Corporation | | | 7.75 | | | | 10-1-2021 | | | | 390,000 | | | | 399,750 | |
| | | | |
| | | | | | | | | | | | | | | 1,596,484 | |
| | | | | | | | | | | | | | | | |
|
| Diversified Financial Services: 0.19% | |
LPL Holdings Incorporated 144A | | | 5.75 | | | | 9-15-2025 | | | | 295,000 | | | | 306,694 | |
| | | | | | | | | | | | | | | | |
|
| Insurance: 0.11% | |
Genworth Holdings Incorporated | | | 7.63 | | | | 9-24-2021 | | | | 195,000 | | | | 180,178 | |
| | | | | | | | | | | | | | | | |
The accompanying notes are an integral part of these financial statements.
28 | Wells Fargo Real Return Portfolio
Portfolio of investments—May 31, 2020
| | | | | | | | | | | | | | | | |
| | | Interest rate | | | Maturity date | | | Principal | | | Value | |
| Mortgage REITs: 0.12% | |
Starwood Property Trust Incorporated | | | 5.00 | % | | | 12-15-2021 | | | $ | 200,000 | | | $ | 196,000 | |
| | | | | | | | | | | | | | | | |
|
| Thrifts & Mortgage Finance: 0.19% | |
Ladder Capital Finance Holdings LP 144A | | | 5.25 | | | | 3-15-2022 | | | | 330,000 | | | | 308,550 | |
| | | | | | | | | | | | | | | | |
|
Health Care: 1.48% | |
|
| Health Care Equipment & Supplies: 0.05% | |
Hologic Incorporated 144A | | | 4.38 | | | | 10-15-2025 | | | | 75,000 | | | | 76,672 | |
| | | | | | | | | | | | | | | | |
|
| Health Care Providers & Services: 1.43% | |
Centene Corporation | | | 4.75 | | | | 5-15-2022 | | | | 435,000 | | | | 440,459 | |
Centene Corporation | | | 4.75 | | | | 1-15-2025 | | | | 130,000 | | | | 134,225 | |
HealthSouth Corporation | | | 5.13 | | | | 3-15-2023 | | | | 290,000 | | | | 291,450 | |
Magellan Health Incorporated | | | 4.90 | | | | 9-22-2024 | | | | 180,000 | | | | 183,600 | |
MEDNAX Incorporated 144A | | | 5.25 | | | | 12-1-2023 | | | | 335,000 | | | | 328,300 | |
Molina Healthcare Incorporated | | | 5.38 | | | | 11-15-2022 | | | | 400,000 | | | | 414,220 | |
Tenet Healthcare Corporation | | | 4.63 | | | | 7-15-2024 | | | | 240,000 | | | | 243,000 | |
Universal Health Services Incorporated 144A | | | 4.75 | | | | 8-1-2022 | | | | 282,000 | | | | 282,000 | |
| | | | |
| | | | | | | | | | | | | | | 2,317,254 | |
| | | | | | | | | | | | | | | | |
|
Industrials: 1.43% | |
|
| Airlines: 0.33% | |
American Airlines Group Company 144A | | | 5.00 | | | | 6-1-2022 | | | | 430,000 | | | | 249,400 | |
United Continental Holdings Incorporated | | | 4.25 | | | | 10-1-2022 | | | | 360,000 | | | | 288,900 | |
| | | | |
| | | | | | | | | | | | | | | 538,300 | |
| | | | | | | | | | | | | | | | |
|
| Commercial Services & Supplies: 0.34% | |
ADT Corporation | | | 6.25 | | | | 10-15-2021 | | | | 350,000 | | | | 361,946 | |
Mobile Mini Incorporated | | | 5.88 | | | | 7-1-2024 | | | | 190,000 | | | | 194,750 | |
| | | | |
| | | | | | | | | | | | | | | 556,696 | |
| | | | | | | | | | | | | | | | |
|
| Construction & Engineering: 0.32% | |
Great Lakes Dredge & Dock Corporation | | | 8.00 | | | | 5-15-2022 | | | | 395,000 | | | | 402,900 | |
Taylor Morrison Communities Incorporated 144A | | | 5.88 | | | | 4-15-2023 | | | | 110,000 | | | | 109,725 | |
| | | | |
| | | | | | | | | | | | | | | 512,625 | |
| | | | | | | | | | | | | | | | |
|
| Electronic Equipment, Instruments & Components: 0.04% | |
Wesco Distribution Incorporated Company 144A%% | | | 7.13 | | | | 6-15-2025 | | | | 55,000 | | | | 55,000 | |
| | | | | | | | | | | | | | | | |
|
| Trading Companies & Distributors: 0.40% | |
Aircastle Limited | | | 5.13 | | | | 3-15-2021 | | | | 275,000 | | | | 269,615 | |
Fortress Transportation & Infrastructure Investors LLC 144A | | | 6.75 | | | | 3-15-2022 | | | | 415,000 | | | | 384,116 | |
| | | | |
| | | | | | | | | | | | | | | 653,731 | |
| | | | | | | | | | | | | | | | |
|
Information Technology: 0.99% | |
|
| Electronic Equipment, Instruments & Components: 0.22% | |
Anixter International Incorporated | | | 5.13 | | | | 10-1-2021 | | | | 350,000 | | | | 357,875 | |
| | | | | | | | | | | | | | | | |
|
| IT Services: 0.20% | |
Cardtronics Incorporated 144A | | | 5.50 | | | | 5-1-2025 | | | | 345,000 | | | | 324,300 | |
| | | | | | | | | | | | | | | | |
The accompanying notes are an integral part of these financial statements.
Wells Fargo Real Return Portfolio | 29
Portfolio of investments—May 31, 2020
| | | | | | | | | | | | | | | | |
| | | Interest rate | | | Maturity date | | | Principal | | | Value | |
| Software: 0.32% | |
NortonLifeLock Incorporated 144A | | | 5.00 | % | | | 4-15-2025 | | | $ | 120,000 | | | $ | 122,400 | |
Symantec Corporation | | | 4.20 | | | | 9-15-2020 | | | | 395,000 | | | | 396,481 | |
| | | | |
| | | | | | | | | | | | | | | 518,881 | |
| | | | | | | | | | | | | | | | |
|
| Technology Hardware, Storage & Peripherals: 0.25% | |
Dell International LLC 144A | | | 7.13 | | | | 6-15-2024 | | | | 245,000 | | | | 254,339 | |
EMC Corporation | | | 2.65 | | | | 6-1-2020 | | | | 158,000 | | | | 158,000 | |
| | | | |
| | | | | | | | | | | | | | | 412,339 | |
| | | | | | | | | | | | | | | | |
|
Materials: 0.29% | |
|
| Chemicals: 0.04% | |
Chemours Company | | | 6.63 | | | | 5-15-2023 | | | | 65,000 | | | | 65,163 | |
| | | | | | | | | | | | | | | | |
|
| Containers & Packaging: 0.21% | |
Berry Global Incorporated | | | 5.50 | | | | 5-15-2022 | | | | 22,000 | | | | 21,946 | |
Owens-Brockway Glass Container Incorporated 144A | | | 5.00 | | | | 1-15-2022 | | | | 57,000 | | | | 57,428 | |
Sealed Air Corporation 144A | | | 5.13 | | | | 12-1-2024 | | | | 50,000 | | | | 54,111 | |
Sealed Air Corporation 144A | | | 5.25 | | | | 4-1-2023 | | | | 190,000 | | | | 199,975 | |
| | | | |
| | | | | | | | | | | | | | | 333,460 | |
| | | | | | | | | | | | | | | | |
|
| Metals & Mining: 0.04% | |
Freeport-McMoRan Incorporated | | | 3.55 | | | | 3-1-2022 | | | | 69,000 | | | | 69,690 | |
| | | | | | | | | | | | | | | | |
|
Real Estate: 0.35% | |
|
| Equity REITs: 0.20% | |
CoreCivic Incorporated | | | 4.63 | | | | 5-1-2023 | | | | 245,000 | | | | 237,650 | |
CoreCivic Incorporated | | | 5.00 | | | | 10-15-2022 | | | | 35,000 | | | | 34,300 | |
SBA Communications Corporation | | | 4.00 | | | | 10-1-2022 | | | | 60,000 | | | | 60,838 | |
| | | | |
| | | | | | | | | | | | | | | 332,788 | |
| | | | | | | | | | | | | | | | |
|
| Real Estate Management & Development: 0.15% | |
Realogy Group LLC 144A | | | 5.25 | | | | 12-1-2021 | | | | 250,000 | | | | 238,750 | |
| | | | | | | | | | | | | | | | |
|
Utilities: 0.59% | |
|
| Electric Utilities: 0.16% | |
DPL Incorporated | | | 7.25 | | | | 10-15-2021 | | | | 145,000 | | | | 148,988 | |
NextEra Energy Operating Partners LP 144A | | | 4.25 | | | | 7-15-2024 | | | | 100,000 | | | | 103,250 | |
| | | | |
| | | | | | | | | | | | | | | 252,238 | |
| | | | | | | | | | | | | | | | |
|
| Independent Power & Renewable Electricity Producers: 0.43% | |
TerraForm Power Operating LLC 144A | | | 4.25 | | | | 1-31-2023 | | | | 500,000 | | | | 508,750 | |
The AES Corporation | | | 4.50 | | | | 3-15-2023 | | | | 185,000 | | | | 188,478 | |
| | | | |
| | | | | | | | | | | | | | | 697,228 | |
| | | | | | | | | | | | | | | | |
| |
Total Corporate Bonds and Notes (Cost $22,317,090) | | | | 21,927,715 | |
| | | | | |
|
Loans: 3.42% | |
|
Communication Services: 0.85% | |
|
| Entertainment: 0.08% | |
Live Nation Entertainment Inc Term Loan B4 (1 Month LIBOR +1.75%) ± | | | 1.94 | | | | 10-17-2026 | | | | 136,158 | | | | 127,376 | |
| | | | | | | | | | | | | | | | |
The accompanying notes are an integral part of these financial statements.
30 | Wells Fargo Real Return Portfolio
Portfolio of investments—May 31, 2020
| | | | | | | | | | | | | | | | |
| | | Interest rate | | | Maturity date | | | Principal | | | Value | |
| Media: 0.51% | |
CSC Holdings LLC (1 Month LIBOR +2.50%) ± | | | 2.68 | % | | | 4-15-2027 | | | $ | 370,689 | | | $ | 357,021 | |
Diamond Sports Group LLC (1 Month LIBOR +3.25%) ± | | | 3.42 | | | | 8-24-2026 | | | | 348,250 | | | | 298,189 | |
Virgin Media Bristol LLC (1 Month LIBOR +2.50%) ± | | | 2.68 | | | | 1-31-2028 | | | | 175,000 | | | | 169,458 | |
| | | | |
| | | | | | | | | | | | | | | 824,668 | |
| | | | | | | | | | | | | | | | |
|
| Wireless Telecommunication Services: 0.26% | |
SBA Senior Finance II LLC (1 Month LIBOR +1.75%) ± | | | 1.93 | | | | 4-11-2025 | | | | 430,788 | | | | 418,451 | |
| | | | | | | | | | | | | | | | |
|
Consumer Discretionary: 0.26% | |
|
| Auto Components: 0.09% | |
Belron Finance US LLC Term Loan B ‡ | | | 2.97 | | | | 11-7-2024 | | | | 156,400 | | | | 152,490 | |
| | | | | | | | | | | | | | | | |
|
| Hotels, Restaurants & Leisure: 0.13% | |
Wyndham Hotels & Resorts Incorporated (1 Month LIBOR +1.75%) ± | | | 1.92 | | | | 5-30-2025 | | | | 216,700 | | | | 205,943 | |
| | | | | | | | | | | | | | | | |
|
| Specialty Retail: 0.04% | |
Sally Beauty Holdings Incorporated (1 Month LIBOR +2.25%) ±‡ | | | 2.43 | | | | 7-5-2024 | | | | 64,064 | | | | 60,220 | |
| | | | | | | | | | | | | | | | |
|
Consumer Staples: 0.08% | |
|
| Food Products: 0.08% | |
Prestige Brands Incorporated (1 Month LIBOR +2.00%) ± | | | 2.17 | | | | 1-26-2024 | | | | 131,416 | | | | 128,733 | |
| | | | | | | | | | | | | | | | |
|
| Energy: 0.16% | |
|
| Oil, Gas & Consumable Fuels: 0.16% | |
Apergy Corporation 2020 Term Loan < | | | 5.00 | | | | 5-29-2027 | | | | 40,000 | | | | 38,000 | |
Buckeye Partners LP (1 Month LIBOR +2.75%) ± | | | 3.12 | | | | 11-1-2026 | | | | 230,000 | | | | 223,100 | |
| | | | |
| | | | | | | | | | | | | | | 261,100 | |
| | | | | | | | | | | | | | | | |
|
Financials: 0.30% | |
|
| Consumer Finance: 0.22% | |
TransUnion LLC (1 Month LIBOR +1.75%) ± | | | 1.92 | | | | 11-16-2026 | | | | 363,487 | | | | 351,598 | |
| | | | | | | | | | | | | | | | |
|
| Diversified Financial Services: 0.08% | |
Delos Finance SARL (3 Month LIBOR +1.75%) ± | | | 3.20 | | | | 10-6-2023 | | | | 140,000 | | | | 133,613 | |
| | | | | | | | | | | | | | | | |
|
Health Care: 0.10% | |
|
| Health Care Providers & Services: 0.10% | |
HCA Incorporated (1 Month LIBOR +1.75%) ± | | | 1.92 | | | | 3-18-2026 | | | | 112,103 | | | | 109,800 | |
Select Medical Corporation (1 Month LIBOR +2.50%) ± | | | 2.67 | | | | 3-6-2025 | | | | 49,214 | | | | 47,369 | |
| | | | |
| | | | | | | | | | | | | | | 157,169 | |
| | | | | | | | | | | | | | | | |
|
Industrials: 1.00% | |
|
| Aerospace & Defense: 0.09% | |
Rexnord LLC (1 Month LIBOR +1.75%) ± | | | 1.92 | | | | 8-21-2024 | | | | 156,250 | | | | 153,955 | |
| | | | | | | | | | | | | | | | |
|
| Building Products: 0.37% | |
Advanced Drainage Systems Incorporated (1 Month LIBOR +2.25%) ±‡ | | | 2.63 | | | | 7-31-2026 | | | | 323,250 | | | | 315,573 | |
Flex Acquisition Company (3 Month LIBOR +3.00%) ±‡< | | | 3.00 | | | | 12-29-2023 | | | | 300,000 | | | | 282,750 | |
| | | | |
| | | | | | | | | | | | | | | 598,323 | |
| | | | | | | | | | | | | | | | |
The accompanying notes are an integral part of these financial statements.
Wells Fargo Real Return Portfolio | 31
Portfolio of investments—May 31, 2020
| | | | | | | | | | | | | | | | |
| | | Interest rate | | | Maturity date | | | Principal | | | Value | |
| Commercial Services & Supplies: 0.41% | |
Advanced Disposal Services Incorporated (1 Month LIBOR +2.25%) ± | | | 3.00 | % | | | 11-10-2023 | | | $ | 175,722 | | | $ | 174,096 | |
Aramark Services Incorporated (1 Month LIBOR +1.75%) ± | | | 1.92 | | | | 3-28-2024 | | | | 106,844 | | | | 101,903 | |
Aramark Services Incorporated (1 Month LIBOR +1.75%) ± | | | 1.92 | | | | 3-11-2025 | | | | 364,323 | | | | 346,380 | |
KAR Auction Services Incorporated (1 Month LIBOR +2.25%) ±‡ | | | 2.44 | | | | 9-19-2026 | | | | 38,969 | | | | 37,216 | |
| | | | |
| | | | | | | | | | | | | | | 659,595 | |
| | | | | | | | | | | | | | | | |
|
| Machinery: 0.02% | |
Columbus McKinnon Corporation (3 Month LIBOR +2.50%) ±‡ | | | 3.95 | | | | 1-31-2024 | | | | 37,883 | | | | 36,178 | |
| | | | | | | | | | | | | | | | |
|
| Road & Rail: 0.11% | |
Genesee & Wyoming Incorporated (3 Month LIBOR +2.00%) ± | | | 3.45 | | | | 12-30-2026 | | | | 180,000 | | | | 175,918 | |
| | | | | | | | | | | | | | | | |
|
Information Technology: 0.41% | |
|
| Electronic Equipment, Instruments & Components: 0.12% | |
CDW LLC (1 Month LIBOR +1.75%) ± | | | 1.93 | | | | 10-13-2026 | | | | 195,929 | | | | 192,684 | |
| | | | | | | | | | | | | | | | |
|
| Semiconductors & Semiconductor Equipment: 0.19% | |
ON Semiconductor Corporation (1 Month LIBOR +2.00%) ± | | | 2.17 | | | | 9-19-2026 | | | | 313,425 | | | | 304,480 | |
| | | | | | | | | | | | | | | | |
|
| Software: 0.10% | |
SS&C Technologies Incorporated (1 Month LIBOR +1.75%) ± | | | 1.92 | | | | 4-16-2025 | | | | 102,767 | | | | 99,363 | |
SS&C Technologies Incorporated (1 Month LIBOR +1.75%) ± | | | 1.92 | | | | 4-16-2025 | | | | 70,636 | | | | 68,296 | |
| | | | |
| | | | | | | | | | | | | | | 167,659 | |
| | | | | | | | | | | | | | | | |
|
Materials: 0.26% | |
|
| Chemicals: 0.16% | |
Ineos US Finance LLC (1 Month LIBOR +2.00%) ± | | | 2.17 | | | | 4-1-2024 | | | | 264,787 | | | | 253,753 | |
| | | | | | | | | | | | | | | | |
|
| Containers & Packaging: 0.10% | |
Berry Global Incorporated (1 Month LIBOR +2.00%) ± | | | 2.22 | | | | 10-1-2022 | | | | 175,000 | | | | 172,239 | |
| | | | | | | | | | | | | | | | |
| |
Total Loans (Cost $5,770,787) | | | | 5,536,145 | |
| | | | | |
|
| U.S. Treasury Securities: 67.12% | |
TIPS | | | 0.13 | | | | 7-15-2022 | | | | 2,301,125 | | | | 2,327,810 | |
TIPS | | | 0.13 | | | | 1-15-2023 | | | | 5,379,119 | | | | 5,438,599 | |
TIPS | | | 0.13 | | | | 7-15-2024 | | | | 2,647,137 | | | | 2,722,826 | |
TIPS | | | 0.13 | | | | 10-15-2024 | | | | 2,998,208 | | | | 3,090,681 | |
TIPS | | | 0.13 | | | | 7-15-2026 | | | | 3,656,076 | | | | 3,814,406 | |
TIPS | | | 0.13 | | | | 1-15-2030 | | | | 2,944,686 | | | | 3,125,248 | |
TIPS | | | 0.25 | | | | 1-15-2025 | | | | 4,522,836 | | | | 4,676,466 | |
TIPS | | | 0.25 | | | | 7-15-2029 | | | | 1,745,830 | | | | 1,873,953 | |
TIPS | | | 0.25 | | | | 2-15-2050 | | | | 436,757 | | | | 478,608 | |
TIPS | | | 0.38 | | | | 7-15-2023 | | | | 4,630,952 | | | | 4,758,990 | |
TIPS | | | 0.38 | | | | 7-15-2025 | | | | 6,117,426 | | | | 6,419,179 | |
TIPS | | | 0.38 | | | | 1-15-2027 | | | | 3,179,115 | | | | 3,368,900 | |
TIPS | | | 0.38 | | | | 7-15-2027 | | | | 1,540,665 | | | | 1,646,971 | |
TIPS | | | 0.50 | | | | 1-15-2028 | | | | 3,343,536 | | | | 3,605,908 | |
TIPS | | | 0.63 | | | | 4-15-2023 | | | | 4,104,919 | | | | 4,212,387 | |
TIPS | | | 0.63 | | | | 1-15-2024 | | | | 3,578,881 | | | | 3,713,939 | |
TIPS | | | 0.63 | | | | 1-15-2026 | | | | 5,372,100 | | | | 5,716,652 | |
TIPS | | | 0.63 | | | | 2-15-2043 | | | | 2,060,246 | | | | 2,380,722 | |
TIPS | | | 0.75 | | | | 7-15-2028 | | | | 2,277,795 | | | | 2,523,765 | |
TIPS | | | 0.75 | | | | 2-15-2042 | | | | 2,781,695 | | | | 3,271,431 | |
TIPS | | | 0.75 | | | | 2-15-2045 | | | | 1,989,585 | | | | 2,388,478 | |
TIPS | | | 0.88 | | | | 1-15-2029 | | | | 884,290 | | | | 990,020 | |
The accompanying notes are an integral part of these financial statements.
32 | Wells Fargo Real Return Portfolio
Portfolio of investments—May 31, 2020
| | | | | | | | | | | | | | | | |
| | | Interest rate | | | Maturity date | | | Principal | | | Value | |
|
| U.S. Treasury Securities (continued) | |
TIPS | | | 0.88 | % | | | 2-15-2047 | | | $ | 1,074,697 | | | $ | 1,345,353 | |
TIPS | | | 1.00 | | | | 2-15-2046 | | | | 1,557,871 | | | | 1,984,208 | |
TIPS | | | 1.00 | | | | 2-15-2048 | | | | 1,198,563 | | | | 1,554,138 | |
TIPS | | | 1.00 | | | | 2-15-2049 | | | | 712,945 | | | | 934,940 | |
TIPS | | | 1.38 | | | | 2-15-2044 | | | | 2,248,408 | | | | 3,016,026 | |
TIPS | | | 1.75 | | | | 1-15-2028 | | | | 2,359,586 | | | | 2,775,411 | |
TIPS | | | 2.00 | | | | 1-15-2026 | | | | 2,926,283 | | | | 3,342,141 | |
TIPS | | | 2.13 | | | | 2-15-2040 | | | | 1,242,062 | | | | 1,796,157 | |
TIPS | | | 2.13 | | | | 2-15-2041 | | | | 1,585,405 | | | | 2,324,605 | |
TIPS | | | 2.38 | | | | 1-15-2025 | | | | 4,019,277 | | | | 4,555,798 | |
TIPS | | | 2.38 | | | | 1-15-2027 | | | | 2,169,617 | | | | 2,593,980 | |
TIPS | | | 2.50 | | | | 1-15-2029 | | | | 2,272,347 | | | | 2,867,941 | |
TIPS | | | 3.38 | | | | 4-15-2032 | | | | 916,190 | | | | 1,339,073 | |
TIPS | | | 3.63 | | | | 4-15-2028 | | | | 1,843,357 | | | | 2,442,649 | |
TIPS | | | 3.88 | | | | 4-15-2029 | | | | 2,418,139 | | | | 3,354,917 | |
| |
Total U.S. Treasury Securities (Cost $99,294,373) | | | | 108,773,276 | |
| | | | | |
|
Yankee Corporate Bonds and Notes: 2.07% | |
|
| Communication Services: 0.42% | |
|
| Media: 0.42% | |
Nielsen Holding and Finance BV 144A | | | 5.50 | | | | 10-1-2021 | | | | 289,000 | | | | 289,361 | |
Videotron Limited | | | 5.00 | | | | 7-15-2022 | | | | 375,000 | | | | 388,125 | |
| | | | |
| | | | | | | | | | | | | | | 677,486 | |
| | | | | | | | | | | | | | | | |
|
| Consumer Discretionary: 0.16% | |
|
| Hotels, Restaurants & Leisure: 0.16% | |
International Game Technology plc 144A | | | 6.25 | | | | 2-15-2022 | | | | 250,000 | | | | 255,138 | |
| | | | | | | | | | | | | | | | |
|
Energy: 0.22% | |
|
| Energy Equipment & Services: 0.22% | |
Alcoa Nederland Holding Company BV 144A | | | 6.75 | | | | 9-30-2024 | | | | 355,000 | | | | 360,325 | |
| | | | | | | | | | | | | | | | |
|
Health Care: 0.73% | |
|
| Pharmaceuticals: 0.73% | |
Bausch Health Companies Incorporated 144A | | | 6.50 | | | | 3-15-2022 | | | | 535,000 | | | | 544,256 | |
Teva Pharmaceutical Finance BV | | | 2.20 | | | | 7-21-2021 | | | | 275,000 | | | | 269,624 | |
Teva Pharmaceutical Finance BV | | | 2.80 | | | | 7-21-2023 | | | | 310,000 | | | | 292,950 | |
Teva Pharmaceutical Finance BV | | | 3.65 | | | | 11-10-2021 | | | | 70,000 | | | | 68,950 | |
| | | | |
| | | | | | | | | | | | | | | 1,175,780 | |
| | | | | | | | | | | | | | | | |
|
Information Technology: 0.11% | |
|
| Communications Equipment: 0.11% | |
Nokia OYJ | | | 3.38 | | | | 6-12-2022 | | | | 180,000 | | | | 183,600 | |
| | | | | | | | | | | | | | | | |
|
Materials: 0.43% | |
|
| Chemicals: 0.22% | |
Park Aerospace Holdings Company 144A | | | 5.25 | | | | 8-15-2022 | | | | 400,000 | | | | 353,014 | |
| | | | | | | | | | | | | | | | |
|
Metals & Mining: 0.21% | |
FMG Resources Proprietary Limited 144A | | | 4.75 | | | | 5-15-2022 | | | | 345,000 | | | | 350,365 | |
| | | | | | | | | | | | | | | | |
| |
Total Yankee Corporate Bonds and Notes (Cost $3,371,811) | | | | 3,355,708 | |
| | | | | |
The accompanying notes are an integral part of these financial statements.
Wells Fargo Real Return Portfolio | 33
Portfolio of investments—May 31, 2020
| | | | | | | | | | | | | | | | |
| | | Yield | | | | | | Shares | | | Value | |
| Short-Term Investments: 0.57% | |
|
| Investment Companies: 0.57% | |
Wells Fargo Government Money Market Fund Select Class (l)(u)## | | | 0.12 | % | | | | | | | 923,723 | | | $ | 923,723 | |
| | | | | | | | | | | | | |
| |
Total Short-Term Investments (Cost $923,723) | | | | 923,723 | |
| | | | | |
| | | | | | | | |
| Total investments in securities (Cost $148,132,524) | | | 99.37 | % | | | 161,034,139 | |
| | |
Other assets and liabilities, net | | | 0.63 | | | | 1,020,733 | |
| | | | | | | | |
| Total net assets | | | 100.00 | % | | $ | 162,054,872 | |
| | | | | | | | |
| † | Non-income-earning security |
| 144A | The security may be resold in transactions exempt from registration, normally to qualified institutional buyers, pursuant to Rule 144A under the Securities Act of 1933. |
| %% | The security is purchased on a when-issued basis. |
| ± | Variable rate investment. The rate shown is the rate in effect at period end. |
| ‡ | Security is valued using significant unobservable inputs. |
| < | All or a portion of the position represents an unfunded loan commitment. The rate represents current interest rate if the loan is partially funded. |
| (l) | The issuer of the security is an affiliated person of the Portfolio as defined in the Investment Company Act of 1940. |
| (u) | The rate represents the 7-day annualized yield at period end. |
| ## | All or a portion of this security is segregated for when-issued securities and/or unfunded loans. |
Abbreviations:
| ADR | American depositary receipt |
| LIBOR | London Interbank Offered Rate |
| TIPS | Treasury inflation-protected securities |
| REIT | Real estate investment trust |
Futures Contracts
| | | | | | | | | | | | | | | | | | | | | | | | |
| Description | | Number of
contracts | | | Expiration
date | | | Notional
cost | | | Notional
value | | | Unrealized
gains | | | Unrealized
losses | |
| | | | | | |
Long | | | | | | | | | | | | | | | | | | | | | | | | |
| | | | | | |
2-Year U.S. Treasury Notes | | | 14 | | | | 9-30-2020 | | | $ | 3,090,851 | | | $ | 3,091,813 | | | $ | 962 | | | $ | 0 | |
| | | | | | |
Short | | | | | | | | | | | | | | | | | | | | | | | | |
| | | | | | |
10-Year U.S. Treasury Notes | | | (25) | | | | 9-21-2020 | | | | (3,466,181 | ) | | | (3,476,563 | ) | | | 0 | | | | (10,382 | ) |
| | | | | | |
10-Year Ultra Futures | | | (3) | | | | 9-21-2020 | | | | (469,635 | ) | | | (471,984 | ) | | | 0 | | | | (2,349 | ) |
| | | | | | |
U.S. Ultra Bond | | | (8) | | | | 9-21-2020 | | | | (1,739,187 | ) | | | (1,744,250 | ) | | | 0 | | | | (5,063 | ) |
| | | | | | |
5-Year U.S. Treasury Notes | | | (64) | | | | 9-30-2020 | | | | (8,023,940 | ) | | | (8,040,000 | ) | | | 0 | | | | (16,060 | ) |
| | | | | | | | | | | | | | | | | | | | | | | | |
| | | | | | |
| | | | | | | | | | | | | | | | | | $ | 962 | | | $ | (33,854 | ) |
| | | | | | | | | | | | | | | | | | | | | | | | |
The accompanying notes are an integral part of these financial statements.
34 | Wells Fargo Real Return Portfolio
Portfolio of investments—May 31, 2020
Investments in Affiliates
An affiliated investment is an investment in which the Portfolio owns at least 5% of the outstanding voting shares of the issuer or as a result of other relationships, such as the Portfolio and the issuer having the same adviser or investment manager. Transactions with issuers that were either affiliated persons of the Portfolio at the beginning of the period or the end of the period were as follows:
| | | | | | | | | | | | | | | | | | | | | | | | | | | | | | | | | | | | |
| | | Shares,
beginning of period | | | Shares
purchased | | | Shares sold | | | Shares,
end of period | | | Net realized gains (losses) | | | Net change in unrealized gains (losses) | | | Income from affiliated securities | | | Value, end of period | | | % of net assets | |
| | | | | | | | | |
| Short-Term Investments | | | | | | | | | | | | | | | | | | | | | | | | | | | |
Investment companies | | | | | | | | | | | | | | | | | | | | | | | | | | | | | | | | | | | | |
Securities Lending Cash Investments LLC * | | | 0 | | | | 3,588,528 | | | | (3,588,528 | ) | | | 0 | | | $ | (13 | ) | | $ | 0 | | | $ | 1,443 | # | | $ | 0 | | | | | |
Wells Fargo Government Money Market Fund Select Class | | | 2,121,643 | | | | 44,536,645 | | | | (45,734,565 | ) | | | 923,723 | | | | 0 | | | | 0 | | | | 28,557 | | | | 923,723 | | | | | |
| | | | | | | | | | | | | | | | | | | | | | | | | | | | | | | | | | | | |
| | | | | | | | | | | | | | | | | | $ | (13 | ) | | $ | 0 | | | $ | 30,000 | | | $ | 923,723 | | | | 0.57 | % |
| | | | | | | | | | | | | | | | | | | | | | | | | | | | | | | | | | | | |
| * | No longer held at the end of the period |
| # | Amount shown represents income before fees and rebates. |
The accompanying notes are an integral part of these financial statements.
Wells Fargo Real Return Portfolio | 35
Statement of assets and liabilities—May 31, 2020
| | | | |
| | | | |
| |
Assets | | | | |
Investments in unaffiliated securities, at value (cost $147,208,801) | | $ | 160,110,416 | |
Investments in affiliated securities, at value (cost $923,723) | | | 923,723 | |
Foreign currency, at value (cost $1,402) | | | 1,510 | |
Cash | | | 291,006 | |
Segregated cash for futures contracts | | | 226,321 | |
Receivable for investments sold | | | 819,606 | |
Receivable for dividends and interest | | | 663,685 | |
Prepaid expenses and other assets | | | 56,261 | |
| | | | |
Total assets | | | 163,092,528 | |
| | | | |
| |
Liabilities | | | | |
Payable for investments purchased | | | 945,755 | |
Payable for daily variation margin on open futures contracts | | | 46,141 | |
Advisory fee payable | | | 44,957 | |
Trustees’ fees and expenses payable | | | 803 | |
| | | | |
Total liabilities | | | 1,037,656 | |
| | | | |
Total net assets | | $ | 162,054,872 | |
| | | | |
The accompanying notes are an integral part of these financial statements.
36 | Wells Fargo Real Return Portfolio
Statement of operations—year ended May 31, 2020
| | | | |
| | | | |
| |
Investment income | | | | |
Interest | | $ | 3,836,384 | |
Dividends (net of foreign withholding taxes of $12,363) | | | 596,946 | |
Income from affiliated securities | | | 28,949 | |
| | | | |
Total investment income | | | 4,462,279 | |
| | | | |
| |
Expenses | | | | |
Advisory fee | | | 699,629 | |
Custody and accounting fees | | | 17,287 | |
Professional fees | | | 46,570 | |
Shareholder report expenses | | | 1,427 | |
Trustees’ fees and expenses | | | 20,776 | |
Other fees and expenses | | | 8,530 | |
| | | | |
Total expenses | | | 794,219 | |
Less: Fee waivers and/or expense reimbursements | | | (112,426 | ) |
| | | | |
Net expenses | | | 681,793 | |
| | | | |
Net investment income | | | 3,780,486 | |
| | | | |
| |
Realized and unrealized gains (losses) on investments | | | | |
Net realized losses on | |
Unaffiliated securities | | | (2,298,470 | ) |
Affiliated securities | | | (13 | ) |
Futures contracts | | | (636,028 | ) |
| | | | |
Net realized losses on investments | | | (2,934,511 | ) |
| | | | |
|
Net change in unrealized gains (losses) on | |
Unaffiliated securities | | | 8,793,994 | |
Futures contracts | | | 5,286 | |
| | | | |
Net change in unrealized gains (losses) on investments | | | 8,799,280 | |
| | | | |
Net realized and unrealized gains (losses) on investments | | | 5,864,769 | |
| | | | |
Net increase in net assets resulting from operations | | $ | 9,645,255 | |
| | | | |
The accompanying notes are an integral part of these financial statements.
Wells Fargo Real Return Portfolio | 37
Statement of changes in net assets
| | | | | | | | |
| | | Year ended
May 31, 2020 | | | Year ended
May 31, 2019 | |
|
Operations | |
Net investment income | | $ | 3,780,486 | | | $ | 4,635,632 | |
Net realized losses on investments | | | (2,934,511 | ) | | | (2,945,442 | ) |
Net change in unrealized gains (losses) on investments | | | 8,799,280 | | | | 3,096,994 | |
| | | | | | | | |
Net increase in net assets resulting from operations | | | 9,645,255 | | | | 4,787,184 | |
| | | | | | | | |
| | |
Capital transactions | | | | | | | | |
Transactions in investors’ beneficial interests | |
Contributions | | | 25,838,830 | | | | 110,886,812 | |
Withdrawals | | | (56,167,504 | ) | | | (78,081,410 | ) |
| | | | | | | | |
Net increase (decrease) in net assets resulting from capital transactions | | | (30,328,674 | ) | | | 32,805,402 | |
| | | | | | | | |
Total increase (decrease) in net assets | | | (20,683,419 | ) | | | 37,592,586 | |
| | | | | | | | |
| | |
Net assets | | | | | | | | |
Beginning of period | | | 182,738,291 | | | | 145,145,705 | |
| | | | | | | | |
End of period | | $ | 162,054,872 | | | $ | 182,738,291 | |
| | | | | | | | |
The accompanying notes are an integral part of these financial statements.
38 | Wells Fargo Real Return Portfolio
Financial highlights
| | | | | | | | | | | | | | | | | | | | |
| | | Year ended May 31 | |
| | | 2020 | | | 2019 | | | 2018 | | | 2017 | | | 2016 | |
Total return | | | 5.92 | % | | | 2.99 | % | | | 1.67 | % | | | 2.65 | % | | | 1.29 | % |
Ratios to average net assets (annualized) | | | | | | | | | | | | | | | | | | | | |
Gross expenses | | | 0.45 | % | | | 0.45 | % | | | 0.48 | % | | | 0.52 | % | | | 0.56 | % |
Net expenses | | | 0.39 | % | | | 0.40 | % | | | 0.41 | % | | | 0.44 | % | | | 0.44 | % |
Net investment income | | | 2.16 | % | | | 2.29 | % | | | 2.40 | % | | | 2.36 | % | | | 1.45 | % |
Supplemental data | | | | | | | | | | | | | | | | | | | | |
Portfolio turnover rate | | | 24 | % | | | 39 | % | | | 29 | % | | | 25 | % | | | 29 | % |
The accompanying notes are an integral part of these financial statements.
Wells Fargo Real Return Portfolio | 39
Notes to financial statements
1. ORGANIZATION
Wells Fargo Master Trust (the “Trust”), a Delaware statutory trust organized on March 10, 1999, is an open-end management investment company registered under the Investment Company Act of 1940, as amended (the “1940 Act”). As an investment company, the Trust follows the accounting and reporting guidance in Financial Accounting Standards Board (“FASB”) Accounting Standards Codification Topic 946, Financial Services – Investment Companies. These financial statements report on the Wells Fargo Real Return Portfolio (the “Portfolio”) which is a diversified series of the Trust.
2. SIGNIFICANT ACCOUNTING POLICIES
The following significant accounting policies, which are consistently followed in the preparation of the financial statements of the Portfolio, are in conformity with U.S. generally accepted accounting principles which require management to make estimates and assumptions that affect the reported amounts of assets and liabilities, disclosure of contingent assets and liabilities at the date of the financial statements, and the reported amounts of revenues and expenses during the reporting period. Actual results could differ from those estimates.
Securities valuation
All investments are valued each business day as of the close of regular trading on the New York Stock Exchange (generally 4 p.m. Eastern Time), although the Portfolio may deviate from this calculation time under unusual or unexpected circumstances.
Debt securities are valued at the evaluated bid price provided by an independent pricing service (e.g. taking into account various factors, including yields, maturities, or credit ratings) or, if a reliable price is not available, the quoted bid price from an independent broker-dealer.
Equity securities and futures contracts that are listed on a foreign or domestic exchange or market are valued at the official closing price or, if none, the last sales price. If no sale occurs on the principal exchange or market that day, a fair value price will be determined in accordance with the Portfolio’s Valuation Procedures.
Many securities markets and exchanges outside the U.S. close prior to the close of the New York Stock Exchange and therefore may not fully reflect trading or events that occur after the close of the principal exchange in which the foreign securities are traded, but before the close of the New York Stock Exchange. If such trading or events are expected to materially affect the value of such securities, then fair value pricing procedures approved by the Board of Trustees of the Portfolio are applied. These procedures take into account multiple factors including movements in U.S. securities markets after foreign exchanges close. Foreign securities that are fair valued under these procedures are categorized as Level 2 and the application of these procedures may result in transfers between Level 1 and Level 2. Depending on market activity, such fair valuations may be frequent. Such fair value pricing may result in net asset values that are higher or lower than net asset values based on the last reported sales price or latest quoted bid price. On May 31, 2020, such fair value pricing was used in pricing certain foreign securities.
Investments in registered open-end investment companies are valued at net asset value. Interests in non-registered investment companies that are redeemable at net asset value are fair valued normally at net asset value.
Investments which are not valued using any of the methods discussed above are valued at their fair value, as determined in good faith by the Board of Trustees. The Board of Trustees has established a Valuation Committee comprised of the Trustees and has delegated to it the authority to take any actions regarding the valuation of portfolio securities that the Valuation Committee deems necessary or appropriate, including determining the fair value of portfolio securities, unless the determination has been delegated to the Wells Fargo Asset Management Pricing Committee at Wells Fargo Funds Management, LLC (“Funds Management”). The Board of Trustees retains the authority to make or ratify any valuation decisions or approve any changes to the Valuation Procedures as it deems appropriate. On a quarterly basis, the Board of Trustees receives reports on any valuation actions taken by the Valuation Committee or the Wells Fargo Asset Management Pricing Committee which may include items for ratification.
Foreign currency translation
The accounting records of the Portfolio are maintained in U.S. dollars. The values of other assets and liabilities denominated in foreign currencies are translated into U.S. dollars at rates provided by an independent foreign currency pricing source at a time each business day specified by the Wells Fargo Asset Management Pricing Committee. Purchases and sales of securities, and income and expenses are converted at the rate of exchange on the respective dates of such transactions. Net realized foreign exchange gains or losses arise from sales of foreign currencies, currency gains or losses realized between the trade and settlement dates on securities transactions, and the difference between the amounts of dividends, interest and foreign withholding taxes recorded and the U.S. dollar equivalent of the amounts actually paid or received. Net unrealized foreign exchange gains and losses arise from changes in the fair value of assets and liabilities other than investments in securities
40 | Wells Fargo Real Return Portfolio
Notes to financial statements
resulting from changes in exchange rates. The changes in net assets arising from changes in exchange rates of securities and the changes in net assets resulting from changes in market prices of securities are not separately presented. Such changes are included in net realized and unrealized gains or losses from investments.
Participation notes
The Portfolio may invest in participation notes to gain exposure to securities in certain foreign markets. Participation notes are issued by banks or broker-dealers and are designed to offer a return linked to a particular underlying foreign security. Participation notes involve transaction costs, which may be higher than those applicable to the underlying foreign security. The holder of the participation note is entitled to receive from the bank or broker-dealer, an amount equal to the dividend paid by the issuer of the underlying foreign security; however, the holder is not entitled to the same rights (i.e. voting rights) as an owner of the underlying foreign security. Investments in participation notes involve risks beyond those normally associated with a direct investment in an underlying security. The Portfolio has no rights against the issuer of the underlying foreign security and participation notes expose the Portfolio to counterparty risk in the event the counterparty does not perform. There is also no assurance there will be a secondary trading market for the participation note or that the trading price of the participation note will equal the underlying value of the foreign security that it seeks to replicate.
Securities lending
The Portfolio may lend its securities from time to time in order to earn additional income in the form of fees or interest on securities received as collateral or the investment of any cash received as collateral. When securities are on loan, the Portfolio receives interest or dividends on those securities. Cash collateral received in connection with its securities lending transactions is invested in Securities Lending Cash Investments, LLC (the “Securities Lending Fund”). Investments in Securities Lending Fund are valued at the evaluated bid price provided by an independent pricing service. Income earned from investment in the Securities Lending Fund (net of fees and rebates), if any, is included in income from affiliated securities on the Statement of Operations.
In a securities lending transaction, the net asset value of the Portfolio is affected by an increase or decrease in the value of the securities loaned and by an increase or decrease in the value of the instrument in which collateral is invested. The amount of securities lending activity undertaken by the Portfolio fluctuates from time to time. The Portfolio has the right under the lending agreement to recover the securities from the borrower on demand. In the event of default or bankruptcy by the borrower, the Portfolio may be prevented from recovering the loaned securities or gaining access to the collateral or may experience delays or costs in doing so. In such an event, the terms of the agreement allow the unaffiliated securities lending agent to use the collateral to purchase replacement securities on behalf of the Portfolio or pay the Portfolio the market value of the loaned securities. The Portfolio bears the risk of loss with respect to depreciation of its investment of the cash collateral.
When-issued transactions
The Portfolio may purchase securities on a forward commitment or when-issued basis. The Portfolio records a when-issued transaction on the trade date and will segregate assets in an amount at least equal in value to the Portfolio’s commitment to purchase when-issued securities. Securities purchased on a when-issued basis are marked-to-market daily and the Portfolio begins earning interest on the settlement date. Losses may arise due to changes in the market value of the underlying securities or if the counterparty does not perform under the contract.
Loans
The Portfolio may invest in direct debt instruments which are interests in amounts owed to lenders by corporate or other borrowers. The loans pay interest at rates which are periodically reset by reference to a base lending rate plus a spread. Investments in loans may be in the form of participations in loans or assignments of all or a portion of loans from third parties. When the Portfolio purchases participations, it generally has no rights to enforce compliance with the terms of the loan agreement with the borrower. As a result, the Portfolio assumes the credit risk of both the borrower and the lender that is selling the participation. When the Portfolio purchases assignments from lenders, it acquires direct rights against the borrower on the loan and may enforce compliance by the borrower with the terms of the loan agreement. Loans may include fully funded term loans or unfunded loan commitments, which are contractual obligations for future funding.
Futures contracts
Futures contracts are agreements between the Portfolio and a counterparty to buy or sell a specific amount of a commodity, financial instrument or currency at a specified price and on a specified date. The Portfolio may buy and sell futures contracts in order to gain exposure to, or protect against, changes in interest rates and is subject to interest rate risk. The primary risks associated with the use of futures contracts are the imperfect correlation between changes in market values of securities held by the Portfolio and the prices of futures contracts, and the possibility of an illiquid market. Futures contracts are generally entered into on a regulated futures exchange and cleared through a clearinghouse associated with the exchange. With futures
Wells Fargo Real Return Portfolio | 41
Notes to financial statements
contracts, there is minimal counterparty risk to the Portfolio since futures contracts are exchange traded and the exchange’s clearinghouse, as the counterparty to all exchange traded futures, guarantees the futures contracts against default.
Upon entering into a futures contracts, the Portfolio is required to deposit either cash or securities (initial margin) with the broker in an amount equal to a certain percentage of the contract value. Subsequent payments (variation margin) are paid to or from the broker each day equal to the daily changes in the contract value. Such payments are recorded as unrealized gains or losses and, if any, shown as variation margin receivable (payable) in the Statement of Assets and Liabilities. Should the Portfolio fail to make requested variation margin payments, the broker can gain access to the initial margin to satisfy the Portfolio’s payment obligations. When the contracts are closed, a realized gain or loss is recorded in the Statement of Operations.
Inflation-indexed bonds and TIPS
The Portfolio may invest in inflation-indexed bonds, including Treasury inflation-protected securities (TIPS). Inflation-indexed bonds are fixed income securities whose principal value is periodically adjusted according to the rate of inflation. If the index measuring inflation falls, the principal value of inflation-indexed bonds (other than municipal inflation-indexed bonds and certain corporate inflation-indexed bonds) will be adjusted downward, and consequently the interest payable on these securities (calculated with respect to a smaller principal amount) will be reduced. Repayment of the original bond principal upon maturity (as adjusted for inflation) is guaranteed in the case of U.S. Treasury inflation-indexed bonds. For bonds that do not provide a similar guarantee, the adjusted principal value of the bond repaid at maturity may be less than the original principal. The value of inflation-indexed bonds is expected to change in response to changes in real interest rates. Real interest rates are tied to the relationship between nominal interest rates and the rate of inflation. If nominal interest rates increase at a faster rate than inflation, real interest rates may rise, leading to a decrease in value of inflation-indexed bonds. Inflation-indexed bonds, including TIPS, decline in value when real interest rates rise. In certain interest rate environments, such as when real interest rates are rising faster than nominal interest rates, inflation-indexed bonds may experience greater losses than other fixed income securities with similar durations.
Security transactions and income recognition
Securities transactions are recorded on a trade date basis. Realized gains or losses are recorded on the basis of identified cost.
Interest income is accrued daily and bond discounts are accreted and premiums are amortized daily. To the extent debt obligations are placed on non-accrual status, any related interest income may be reduced by writing off interest receivables when the collection of all or a portion of interest has been determined to be doubtful based on consistently applied procedures and the fair value has decreased. If the issuer subsequently resumes interest payments or when the collectability of interest is reasonably assured, the debt obligation is removed from non-accrual status.
Dividend income is recognized on the ex-dividend date, except for certain dividends from foreign securities, which are recorded as soon as the custodian verifies the ex-dividend date. Dividend income from foreign securities is recorded net of foreign taxes withheld where recovery of such taxes is not assured.
Federal and other taxes
The Portfolio is treated as a separate entity for federal income tax purposes. The Portfolio is not required to pay federal income taxes on its net investment income and net capital gains as it is treated as a partnership for federal income tax purposes. All interest, dividends, gains and losses of the Portfolio are deemed to have been “passed through” to the interest holders in proportion to their holdings of the Portfolio regardless of whether interest, dividends and gains have been distributed by the Portfolio.
The Portfolio’s income tax returns and all financial records supporting those returns for the prior three fiscal years are subject to examination by the federal revenue authority. Management has analyzed the Portfolio’s tax positions taken on federal, state, and foreign tax returns for all open tax years and does not believe that there are any uncertain tax positions that require recognition of a tax liability.
As of May 31, 2020, the aggregate cost of all investments for federal income tax purposes was $148,538,694 and the unrealized gains (losses) consisted of:
| | | | |
| |
Gross unrealized gains | | $ | 14,912,826 | |
| |
Gross unrealized losses | | | (2,450,273 | ) |
| |
Net unrealized gains | | $ | 12,462,553 | |
42 | Wells Fargo Real Return Portfolio
Notes to financial statements
3. FAIR VALUATION MEASUREMENTS
Fair value measurements of investments are determined within a framework that has established a fair value hierarchy based upon the various data inputs utilized in determining the value of the Portfolio’s investments. The three-level hierarchy gives the highest priority to unadjusted quoted prices in active markets for identical assets or liabilities (Level 1) and the lowest priority to unobservable inputs (Level 3). The Portfolio’s investments are classified within the fair value hierarchy based on the lowest level of input that is significant to the fair value measurement. The inputs are summarized into three broad levels as follows:
| ∎ | | Level 1 – quoted prices in active markets for identical securities |
| ∎ | | Level 2 – other significant observable inputs (including quoted prices for similar securities, interest rates, prepayment speeds, credit risk, etc.) |
| ∎ | | Level 3 – significant unobservable inputs (including the Portfolio’s own assumptions in determining the fair value of investments) |
The inputs or methodologies used for valuing investments in securities are not necessarily an indication of the risk associated with investing in those securities.
The following is a summary of the inputs used in valuing the Portfolio’s assets and liabilities as of May 31, 2020:
| | | | | | | | | | | | | | | | |
| | | | |
| | | Quoted prices
(Level 1) | | | Other significant
observable inputs
(Level 2) | | | Significant
unobservable inputs (Level 3) | | | Total | |
| | | | |
Assets | | | | | | | | | | | | | | | | |
Investments in: | | | | | | | | | | | | | | | | |
| | | | |
Common stocks | | | | | | | | | | | | | | | | |
| | | | |
Consumer staples | | $ | 6,048,560 | | | $ | 0 | | | $ | 0 | | | $ | 6,048,560 | |
| | | | |
Energy | | | 1,862,985 | | | | 0 | | | | 0 | | | | 1,862,985 | |
| | | | |
Financials | | | 131,613 | | | | 0 | | | | 0 | | | | 131,613 | |
| | | | |
Materials | | | 4,885,235 | | | | 355,040 | | | | 0 | | | | 5,240,275 | |
| | | | |
Real estate | | | 7,234,139 | | | | 0 | | | | 0 | | | | 7,234,139 | |
| | | | |
Corporate bonds and notes | | | 0 | | | | 21,927,715 | | | | 0 | | | | 21,927,715 | |
| | | | |
Loans | | | 0 | | | | 4,651,718 | | | | 884,427 | | | | 5,536,145 | |
| | | | |
U.S. Treasury securities | | | 108,773,276 | | | | 0 | | | | 0 | | | | 108,773,276 | |
| | | | |
Yankee corporate bonds and notes | | | 0 | | | | 3,355,708 | | | | 0 | | | | 3,355,708 | |
| | | | |
Short-term investments | | | | | | | | | | | | | | | | |
| | | | |
Investment companies | | | 923,723 | | | | 0 | | | | 0 | | | | 923,723 | |
| | | | |
| | | 129,859,531 | | | | 30,290,181 | | | | 884,427 | | | | 161,034,139 | |
| | | | |
Futures contracts | | | 962 | | | | 0 | | | | 0 | | | | 962 | |
| | | | |
Total assets | | $ | 129,860,493 | | | $ | 30,290,181 | | | $ | 884,427 | | | $ | 161,035,101 | |
| | | | |
Liabilities | | | | | | | | | | | | | | | | |
| | | | |
Futures contracts | | $ | 33,854 | | | $ | 0 | | | $ | 0 | | | $ | 33,854 | |
| | | | |
Total liabilities | | $ | 33,854 | | | $ | 0 | | | $ | 0 | | | $ | 33,854 | |
Additional sector, industry or geographic detail is included in the Portfolio of Investments.
Futures contracts are reported at their cumulative unrealized gains (losses) at measurement date as reported in the table following the Portfolio of Investments. For futures contracts, the current day’s variation margin is reported on the Statement of Assets and Liabilities. All other assets and liabilities are reported at their market value at measurement date.
For the year ended May 31, 2020, the Portfolio did not have any transfers into/out of Level 3.
Wells Fargo Real Return Portfolio | 43
Notes to financial statements
4. TRANSACTIONS WITH AFFILIATES
Advisory fee
The Trust has entered into an advisory contract with Funds Management, an indirect wholly owned subsidiary of Wells Fargo & Company (“Wells Fargo”). The adviser is responsible for implementing investment policies and guidelines and for supervising the subadviser, who is responsible for day-to-day portfolio management of the Portfolio. Pursuant to the contract, Funds Management is entitled to receive an annual advisory fee at the following annual rate based on the Portfolio’s average daily net assets:
| | | | |
| |
| Average daily net assets | | Advisory fee | |
| |
First $500 million | | | 0.400 | % |
| |
Next $500 million | | | 0.375 | |
| |
Next $2 billion | | | 0.350 | |
| |
Next $2 billion | | | 0.325 | |
| |
Next $5 billion | | | 0.300 | |
| |
Over $10 billion | | | 0.290 | |
For the year ended May 31, 2020, the advisory fee was equivalent to an annual rate of 0.40% of the Portfolio’s average daily net assets.
Funds Management has retained the services of a subadviser to provide daily portfolio management to the Portfolio. The fee for subadvisory services is borne by Funds Management. Wells Capital Management Incorporated (“WellsCap”), an affiliate of Funds Management and an indirect wholly owned subsidiary of Wells Fargo, is the subadviser to the Portfolio and is entitled to receive a fee from Funds Management at an annual rate starting at 0.28% and declining to 0.18% as the average daily net assets of the Portfolio increase.
Funds Management has voluntarily waived and/or reimbursed advisory fees to reduce the net operating expense ratio of the Portfolio.
Interfund transactions
The Portfolio may purchase or sell portfolio investment securities to certain other Wells Fargo affiliates pursuant to Rule 17a-7 under the 1940 Act and under procedures adopted by the Board of Trustees. The procedures have been designed to ensure that these interfund transactions, which do not incur broker commissions, are effected at current market prices.
5. INVESTMENT PORTFOLIO TRANSACTIONS
Purchases and sales of investments, excluding short-term securities, for the year ended May 31, 2020 were as follows:
| | | | | | |
Purchases at cost | | Sales proceeds |
U.S.
government | | Non-U.S.
government | | U.S.
government | | Non-U.S.
government |
| $10,262,289 | | $31,900,797 | | $33,356,968 | | $32,636,224 |
6. SECURITIES LENDING TRANSACTIONS
The Portfolio lends its securities through an unaffiliated securities lending agent and receives collateral in the form of cash or securities with a value at least equal to the value of the securities on loan. The value of the loaned securities is determined at the close of each business day and any increases or decreases in the required collateral are exchanged between the Portfolio and the counterparty on the next business day. Cash collateral received is invested in the Securities Lending Fund which seeks to provide a positive return compared to the daily Fed Funds Open Rate by investing in high-quality, U.S. dollar-denominated short-term money market instruments and is exempt from registration under Section 3(c)(7) of the 1940 Act. Securities Lending Fund is managed by Funds Management and is subadvised by WellsCap. Funds Management receives an advisory fee starting at 0.05% and declining to 0.01% as the average daily net assets of the Securities Lending Fund increase. All of the fees received by Funds Management are paid to WellsCap for its services as subadviser.
In the event of counterparty default or the failure of a borrower to return a loaned security, the Portfolio has the right to use the collateral to offset any losses incurred. As of May 31, 2020, the Portfolio did not have any securities on loan.
44 | Wells Fargo Real Return Portfolio
Notes to financial statements
7. DERIVATIVE TRANSACTIONS
During the year ended May 31, 2020, the Portfolio entered into futures contracts to speculate on interest rates and to help manage the duration of the portfolio. The Portfolio had an average notional amount of $3,328,875 in long futures contracts and $7,168,090 in short futures contracts during the year ended May 31, 2020.
The fair value, realized gains or losses and change in unrealized gains or losses, if any, on derivative instruments are reflected in the corresponding financial statement captions.
8. BORROWINGS
The Trust, along with Wells Fargo Variable Trust and Wells Fargo Funds Trust (excluding the money market funds), are parties to a $280,000,000 revolving credit agreement whereby the Portfolio is permitted to use bank borrowings for temporary or emergency purposes, such as to fund shareholder redemption requests. Interest under the credit agreement is charged to the Portfolio based on a borrowing rate equal to the higher of the Federal Funds rate in effect on that day plus 1.25% or the overnight LIBOR rate in effect on that day plus 1.25%. In addition, an annual commitment fee equal to 0.25% of the unused balance is allocated to each participating fund.
For the year ended May 31, 2020, there were no borrowings by the Portfolio under the agreement.
9. INDEMNIFICATION
Under the Fund’s organizational documents, the officers and Trustees have been granted certain indemnification rights against certain liabilities that may arise out of performance of their duties to the Fund. The Fund has entered into a separate agreement with each Trustee that converts indemnification rights currently existing under the Fund’s organizational documents into contractual rights that cannot be changed in the future without the consent of the Trustee. Additionally, in the normal course of business, the Fund may enter into contracts with service providers that contain a variety of indemnification clauses. The Fund’s maximum exposure under these arrangements dependent on future claims that may be made against the Fund and, therefore, cannot be estimated.
10. NEW ACCOUNTING PRONOUNCEMENTS
In August 2018, FASB issued Accounting Standards Update (“ASU”) No. 2018-13, Fair Value Measurement (Topic 820) Disclosure Framework—Changes to the Disclosure Requirements for Fair Value Measurement. ASU 2018-13 updates the disclosure requirements for fair value measurements by modifying or removing certain disclosures and adding certain new disclosures. The amendments are effective for fiscal years, and interim periods within those fiscal years, beginning after December 15, 2019. Early adoption is permitted. Management has adopted the removal and modification of disclosures early, as permitted, and will adopt the additional new disclosures at the effective date.
In March 2017, FASB issued ASU No. 2017-08, Premium Amortization on Purchased Callable Debt Securities. ASU 2017-08 shortens the amortization period for certain callable debt securities held at a premium and requires the premium to be amortized to the earliest call date. The amendments do not require an accounting change for securities held at a discount and discounts will continue to be accreted to the maturity date of the security. ASU 2017-08 is effective for fiscal years beginning after December 15, 2018 and for interim periods within those fiscal years. During the current reporting period, management of the Portfolio adopted the change in accounting policy which did not have a material impact to the Portfolio’s financial statements.
11. CORONAVIRUS (COVID-19) PANDEMIC
On March 11, 2020, the World Health Organization announced that it had made the assessment that coronavirus disease 2019 (“COVID-19”) is a pandemic. The impacts of COVID-19 are adversely affecting the entire global economy, individual companies and investment products, and the market in general. There is significant uncertainty around the extent and duration of business disruptions related to COVID-19 and the impacts may be short term or may last for an extended period of time. The risk of further spreading of COVID-19 has led to significant uncertainty and volatility in the financial markets. The value of the Portfolio and the securities in which the Portfolio invests have generally been adversely affected by impacts caused by COVID-19.
Wells Fargo Real Return Portfolio | 45
Report of independent registered public accounting firm
TO THE INTEREST HOLDERS OF THE PORTFOLIO AND BOARD OF TRUSTEES WELLS FARGO MASTER TRUST:
Opinion on the Financial Statements
We have audited the accompanying statement of assets and liabilities of Wells Fargo Real Return Portfolio (the Portfolio), one of the portfolios constituting Wells Fargo Master Trust, including the portfolio of investments, as of May 31, 2020, the related statement of operations for the year then ended, the statements of changes in net assets for each of the years in the two-year period then ended, and the related notes (collectively, the financial statements) and the financial highlights for each of the years in the five-year period then ended. In our opinion, the financial statements and financial highlights present fairly, in all material respects, the financial position of the Portfolio as of May 31, 2020, the results of its operations for the year then ended, the changes in its net assets for each of the years in the two-year period then ended, and the financial highlights for each of the years in the five-year period then ended, in conformity with U.S. generally accepted accounting principles.
Basis for Opinion
These financial statements and financial highlights are the responsibility of the Portfolio’s management. Our responsibility is to express an opinion on these financial statements and financial highlights based on our audits. We are a public accounting firm registered with the Public Company Accounting Oversight Board (United States) (PCAOB) and are required to be independent with respect to the Portfolio in accordance with the U.S. federal securities laws and the applicable rules and regulations of the Securities and Exchange Commission and the PCAOB.
We conducted our audits in accordance with the standards of the PCAOB. Those standards require that we plan and perform the audit to obtain reasonable assurance about whether the financial statements and financial highlights are free of material misstatement, whether due to error or fraud. Our audits included performing procedures to assess the risks of material misstatement of the financial statements and financial highlights, whether due to error or fraud, and performing procedures that respond to those risks. Such procedures included examining, on a test basis, evidence regarding the amounts and disclosures in the financial statements and financial highlights. Such procedures also included confirmation of securities owned as of May 31, 2020, by correspondence with the custodian, transfer agent and brokers, or by other appropriate auditing procedures. Our audits also included evaluating the accounting principles used and significant estimates made by management, as well as evaluating the overall presentation of the financial statements and financial highlights. We believe that our audits provide a reasonable basis for our opinion.
We have not been able to determine the specific year that we began serving as the auditor of one or more Wells Fargo Funds investment companies; however we are aware that we have served as the auditor of one or more Wells Fargo Funds investment companies since at least 1955.
Boston, Massachusetts
July 29, 2020
46 | Wells Fargo Real Return Portfolio
Other information (unaudited)
TAX INFORMATION
For corporate shareholders, pursuant to Section 854 of the Internal Revenue Code, 8.61% of ordinary income dividends qualify for the corporate dividends-received deduction for the fiscal year ended May 31, 2020.
Pursuant to Section 854 of the Internal Revenue Code, $153,127 of income dividends paid during the fiscal year ended May 31, 2020 has been designated as qualified dividend income (QDI).
For the fiscal year ended May 31, 2020, $1,071,834 has been designated as interest-related dividends for nonresident alien shareholders pursuant to Section 871 of the Internal Revenue Code.
For the fiscal year ended May 31, 2020, 16.67% of the ordinary income distributed was derived from interest on U.S. government securities.
PROXY VOTING INFORMATION
A description of the policies and procedures used to determine how to vote proxies relating to portfolio securities is available, upon request, by calling 1-800-222-8222, visiting our website at wfam.com, or visiting the SEC website at sec.gov. Information regarding how the proxies related to portfolio securities were voted during the most recent 12-month period ended June 30 is available on the website at wfam.com or by visiting the SEC website at sec.gov.
QUARTERLY PORTFOLIO HOLDINGS INFORMATION
The Fund and Portfolio file their complete schedule of portfolio holdings with the SEC for the first and third quarters of each fiscal year as an exhibit to its reports on Form N-PORT. Shareholders may view the filed Form N-PORT by visiting the SEC website at sec.gov.
Wells Fargo Real Return Fund | 47
Other information (unaudited)
BOARD OF TRUSTEES AND OFFICERS
Each of the Trustees and Officers1 listed in the table below acts in identical capacities for each fund in the Wells Fargo family of funds, which consists of 147 mutual funds comprising the Wells Fargo Funds Trust, Wells Fargo Variable Trust, Wells Fargo Master Trust and four closed-end funds (collectively the “Fund Complex”). This table should be read in conjunction with the Prospectus and the Statement of Additional Information2. The mailing address of each Trustee and Officer is 525 Market Street, 12th Floor, San Francisco, CA 94105. Each Trustee and Officer serves an indefinite term, however, each Trustee serves such term until reaching the mandatory retirement age established by the Trustees.
Independent Trustees
| | | | | | |
Name and year of birth | | Position held and length of service* | | Principal occupations during past five years or longer | | Current other public company or investment company directorships |
| | | |
William R. Ebsworth (Born 1957) | | Trustee, since 2015 | | Retired. From 1984 to 2013, equities analyst, portfolio manager, research director and chief investment officer at Fidelity Management and Research Company in Boston, Tokyo, and Hong Kong, and retired in 2013 as Chief Investment Officer of Fidelity Strategic Advisers, Inc. where he led a team of investment professionals managing client assets. Prior thereto, Board member of Hong Kong Securities Clearing Co., Hong Kong Options Clearing Corp., the Thailand International Fund, Ltd., Fidelity Investments Life Insurance Company, and Empire Fidelity Investments Life Insurance Company. Audit Committee Chair and Investment Committee Chair of the Vincent Memorial Hospital Endowment (non-profit organization). Mr. Ebsworth is a CFA® charterholder. | | N/A |
| | | |
Jane A. Freeman (Born 1953) | | Trustee, since 2015; Chair Liaison, since 2018 | | Retired. From 2012 to 2014 and 1999 to 2008, Chief Financial Officer of Scientific Learning Corporation. From 2008 to 2012, Ms. Freeman provided consulting services related to strategic business projects. Prior to 1999, Portfolio Manager at Rockefeller & Co. and Scudder, Stevens & Clark. Board member of the Harding Loevner Funds from 1996 to 2014, serving as both Lead Independent Director and chair of the Audit Committee. Board member of the Russell Exchange Traded Funds Trust from 2011 to 2012 and the chair of the Audit Committee. Ms. Freeman is also an inactive Chartered Financial Analyst. | | N/A |
| | | |
Isaiah Harris, Jr. (Born 1952) | | Trustee, since 2009; Audit Committee Chairman, since 2019 | | Retired. Chairman of the Board of CIGNA Corporation since 2009, and Director since 2005. From 2003 to 2011, Director of Deluxe Corporation. Prior thereto, President and CEO of BellSouth Advertising and Publishing Corp. from 2005 to 2007, President and CEO of BellSouth Enterprises from 2004 to 2005 and President of BellSouth Consumer Services from 2000 to 2003. Emeritus member of the Iowa State University Foundation Board of Governors. Emeritus Member of the Advisory Board of Iowa State University School of Business. Advisory Board Member, Palm Harbor Academy (private school). Advisory Board Member, Child Evangelism Fellowship (non-profit). Mr. Harris is a certified public accountant (inactive status). | | CIGNA Corporation |
| | | |
Judith M. Johnson (Born 1949) | | Trustee, since 2008; Audit Committee Chairman, from 2009 to 2018 | | Retired. Prior thereto, Chief Executive Officer and Chief Investment Officer of Minneapolis Employees Retirement Fund from 1996 to 2008. Ms. Johnson is an attorney, certified public accountant and a certified managerial accountant. | | N/A |
48 | Wells Fargo Real Return Fund
Other information (unaudited)
| | | | | | |
Name and year of birth | | Position held and length of service* | | Principal occupations during past five years or longer | | Current other public company or investment company directorships |
| | | |
David F. Larcker (Born 1950) | | Trustee, since 2009 | | James Irvin Miller Professor of Accounting at the Graduate School of Business, Stanford University, Director of the Corporate Governance Research Initiative and Senior Faculty of The Rock Center for Corporate Governance since 2006. From 2005 to 2008, Professor of Accounting at the Graduate School of Business, Stanford University. Prior thereto, Ernst & Young Professor of Accounting at The Wharton School, University of Pennsylvania from 1985 to 2005. | | N/A |
| | | |
Olivia S. Mitchell (Born 1953) | | Trustee, since 2006; Nominating and Governance Committee Chair, since 2018 | | International Foundation of Employee Benefit Plans Professor, Wharton School of the University of Pennsylvania since 1993. Director of Wharton’s Pension Research Council and Boettner Center on Pensions & Retirement Research, and Research Associate at the National Bureau of Economic Research. Previously, Cornell University Professor from 1978 to 1993. | | N/A |
| | | |
Timothy J. Penny (Born 1951) | | Trustee, since 1996; Chairman, since 2018 | | President and Chief Executive Officer of Southern Minnesota Initiative Foundation, a non-profit organization, since 2007. Member of the Board of Trustees of NorthStar Education Finance, Inc., a non-profit organization, since 2007. | | N/A |
| | | |
James G. Polisson (Born 1959) | | Trustee, since 2018 | | Retired. Chief Marketing Officer, Source (ETF) UK Services, Ltd, from 2015 to 2017. From 2012 to 2015, Principal of The Polisson Group, LLC, a management consulting, corporate advisory and principal investing company. Chief Executive Officer and Managing Director at Russell Investments, Global Exchange Traded Funds from 2010 to 2012. Managing Director of Barclays Global Investors from 1998 to 2010 and Global Chief Marketing Officer for iShares and Barclays Global Investors from 2000 to 2010. Trustee of the San Francisco Mechanics’ Institute, a non-profit organization, from 2013 to 2015. Board member of the Russell Exchange Traded Fund Trust from 2011 to 2012. Director of Barclays Global Investors Holdings Deutschland GmbH from 2006 to 2009. Mr. Polisson is an attorney and has a retired status with the Massachusetts and District of Columbia Bar Associations. | | N/A |
| | | |
Pamela Wheelock (Born 1959) | | Trustee, since January 2020; previously Trustee from January 2018 to July 2019 | | Board member of the Destination Medical Center Economic Development Agency, Rochester, Minnesota since 2019 and Interim President of the McKnight Foundation since 2020. Acting Commissioner, Minnesota Department of Human Services, July 2019 through September 2019. Human Services Manager (part-time), Minnesota Department of Human Services, October 2019 through December 2019. Chief Operating Officer, Twin Cities Habitat for Humanity from 2017 to 2019. Vice President of University Services, University of Minnesota from 2012 to 2016. Prior thereto, on the Board of Directors, Governance Committee and Finance Committee for the Minnesota Philanthropy Partners (Saint Paul Foundation) from 2012 to 2018, Interim Chief Executive Officer of Blue Cross Blue Shield of Minnesota from 2011 to 2012, Chairman of the Board from 2009 to 2012 and Board Director from 2003 to 2015. Vice President, Leadership and Community Engagement, Bush Foundation, Saint Paul, Minnesota (a private foundation) from 2009 to 2011. Executive Vice President and Chief Financial Officer, Minnesota Sports and Entertainment from 2004 to 2009 and Senior Vice President from 2002 to 2004. Executive Vice President of the Minnesota Wild Foundation from 2004 to 2008. Commissioner of Finance, State of Minnesota, from 1999 to 2002. Currently Board Chair of the Minnesota Wild Foundation since 2010. | | N/A |
| * | Length of service dates reflect the Trustee’s commencement of service with the Trust’s predecessor entities, where applicable. |
Wells Fargo Real Return Fund | 49
Other information (unaudited)
Officers
| | | | |
Name and year of birth | | Position held and length of service | | Principal occupations during past five years or longer |
| | |
Andrew Owen (Born 1960) | | President, since 2017 | | Executive Vice President of Wells Fargo & Company and Head of Affiliated Managers, Wells Fargo Asset Management, since 2014. In addition, Mr. Owen is currently President, Chief Executive Officer and Director of Wells Fargo Funds Management, LLC since 2017. Prior thereto, Executive Vice President responsible for marketing, investments and product development for Wells Fargo Funds Management, LLC, from 2009 to 2014. |
| | |
Nancy Wiser1 (Born 1967) | | Treasurer, since 2012 | | Executive Vice President of Wells Fargo Funds Management, LLC since 2011. Chief Operating Officer and Chief Compliance Officer at LightBox Capital Management LLC, from 2008 to 2011. |
| | |
Michelle Rhee (Born 1966) | | Chief Legal Officer, since 2019 | | Secretary of Wells Fargo Funds Management, LLC, Chief Legal Counsel of Wells Fargo Asset Management and Assistant General Counsel of Wells Fargo Bank, N.A. since 2018. Associate General Counsel and Managing Director of Bank of America Corporation from 2004 to 2018. |
| | |
Catherine Kennedy (Born 1969) | | Secretary, since 2019 | | Vice President of Wells Fargo Funds Management, LLC and Senior Counsel of the Wells Fargo Legal Department since 2010. Vice President and Senior Counsel of Evergreen Investment Management Company, LLC from 1998 to 2010. |
| | |
Michael H. Whitaker (Born 1967) | | Chief Compliance Officer, since 2016 | | Chief Compliance Officer of Wells Fargo Asset Management since 2016. Senior Vice President and Chief Compliance Officer for Fidelity Investments from 2007 to 2016. |
| | |
David Berardi (Born 1975) | | Assistant Treasurer, since 2009 | | Vice President of Wells Fargo Funds Management, LLC since 2009. Vice President of Evergreen Investment Management Company, LLC from 2008 to 2010. Manager of Fund Reporting and Control for Evergreen Investment Management Company, LLC from 2004 to 2010. |
| | |
Jeremy DePalma1 (Born 1974) | | Treasurer, since 2012 | | Senior Vice President of Wells Fargo Funds Management, LLC since 2009. Senior Vice President of Evergreen Investment Management Company, LLC from 2008 to 2010 and head of the Fund Reporting and Control Team within Fund Administration from 2005 to 2010. |
| 1 | Nancy Wiser acts as Treasurer of 65 funds in the Fund Complex. Jeremy DePalma acts as the Treasurer of 82 funds in the Fund Complex. |
| 2 | The Statement of Additional Information includes additional information about the Trustees and is available, without charge, upon request, by calling 1-800-222-8222 or by visiting the website at wfam.com. |
50 | Wells Fargo Real Return Fund
Other information (unaudited)
BOARD CONSIDERATION OF INVESTMENT MANAGEMENT, ADVISORY AND SUB-ADVISORY AGREEMENTS:
Wells Fargo Real Return Fund and Wells Fargo Real Return Portfolio
Under the Investment Company Act of 1940 (the “1940 Act”), the Board of Trustees (each, a “Board” and collectively, the “Boards”) of each of Wells Fargo Funds Trust (“Funds Trust”) and Wells Fargo Master Trust (“Master Trust”, and collectively, the “Trusts”) must determine annually whether to approve the continuation of the Trusts’ investment management, advisory and sub-advisory agreements, as applicable. In this regard, at a Board meeting held on May 26, 2020 and May 28, 2020 (together, the “Meeting”), the Funds Trust Board, all the members of which have no direct or indirect interest in the investment management agreement and are not “interested persons” of the Trusts, as defined in the 1940 Act (the “Independent Trustees”), reviewed and approved for Wells Fargo Real Return Fund (the “Gateway Fund”) an investment management agreement (the “Gateway Fund Management Agreement”) with Wells Fargo Funds Management, LLC (“Funds Management”).
At the Meeting, the Master Trust Board, all the members of which have no direct or indirect interest in the investment advisory and sub-advisory agreements and are Independent Trustees, reviewed and approved: (i) an investment advisory agreement (the “Master Portfolio Advisory Agreement”) with Funds Management for Wells Fargo Real Return Portfolio, a portfolio of Master Trust (the “Master Portfolio”); and (ii) an investment sub-advisory agreement (the “Sub-Advisory Agreement”) with Wells Capital Management Incorporated (the “Sub-Adviser”), an affiliate of Funds Management, for the Master Portfolio.
The Gateway Fund and the Master Portfolio are collectively referred to as the “Funds.” The Gateway Fund Management Agreement, the Master Portfolio Advisory Agreement and the Sub-Advisory Agreement are collectively referred to as the “Advisory Agreements.”
The Gateway Fund is a gateway feeder fund that invest substantially all of its assets in the Master Portfolio. The Master Portfolio has a substantially similar investment objective and substantially similar investment strategies to the Gateway Fund. Information provided to the Boards regarding the Gateway Fund is also applicable to the Master Portfolio, as relevant.
At the Meeting, the Boards considered the factors and reached the conclusions described below relating to the selection of Funds Management and the Sub-Adviser and the approval of the Advisory Agreements. Prior to the Meeting, including at a Board meeting held in April 2020, the Trustees conferred extensively among themselves and with representatives of Funds Management about these matters. Also, the Boards have adopted a team-based approach, with each team consisting of a sub-set of Trustees, to assist the full Boards in the discharge of their duties in reviewing investment performance and other matters throughout the year. The Independent Trustees were assisted in their evaluation of the Advisory Agreements by independent legal counsel, from whom they received separate legal advice and with whom they met separately.
In providing information to the Boards, Funds Management and the Sub-Adviser were guided by a detailed set of requests for information submitted to them by independent legal counsel on behalf of the Independent Trustees at the start of the Boards’ annual contract renewal process earlier in 2020. In considering and approving the Advisory Agreements, the Trustees considered the information they believed relevant, including but not limited to the information discussed below. The Boards considered not only the specific information presented in connection with the Meeting, but also the knowledge gained over time through interaction with Funds Management and the Sub-Adviser about various topics. In this regard, the Boards reviewed reports of Funds Management at each of their quarterly meetings, which included, among other things, portfolio reviews and investment performance reports. In addition, the Boards and the teams mentioned above confer with portfolio managers at various times throughout the year. The Boards did not identify any particular information or consideration that was all-important or controlling, and each individual Trustee may have attributed different weights to various factors.
After its deliberations, the Funds Trust Board unanimously approved the continuation of the Gateway Fund Management Agreement for a one-year period. Additionally, after its deliberations, the Master Trust Board unanimously approved the continuation of the Master Portfolio Advisory Agreement and the Sub-Advisory Agreement, each for a one-year term. The Boards also determined that the compensation payable to Funds Management and the Sub-Adviser was reasonable. The Boards considered the approval of the Advisory Agreements for the Funds as part of their consideration of agreements for funds across the complex, but their approvals were made on a fund-by-fund basis. The following summarizes a number of important, but not necessarily all, factors considered by the Boards in support of their approvals.
Nature, extent and quality of services
The Boards received and considered various information regarding the nature, extent and quality of services provided to the Funds by Funds Management and the Sub-Adviser under the Advisory Agreements. This information included a description of the investment advisory services and Fund-level administrative services, as well as, among other things, a summary of the background and experience of senior management of Wells Fargo Asset Management (“WFAM”), of which Funds Management
Wells Fargo Real Return Fund | 51
Other information (unaudited)
and the Sub-Adviser are a part, and a summary of investments made in the business of WFAM. The Boards also received a description of Funds Management’s and the Sub-Adviser’s business continuity plans and of their approaches to data privacy and cybersecurity, and related testing. The Boards also received and reviewed information about Funds Management’s role as administrator of the Funds’ liquidity risk management program, Funds Management’s approach to risk management, and Funds Management’s intermediary and vendor oversight program. The Boards also considered the qualifications, background, tenure and responsibilities of each of the portfolio managers primarily responsible for the day-to-day portfolio management of the Funds.
The Boards evaluated the ability of Funds Management and the Sub-Adviser to attract and retain qualified investment professionals, including research, advisory and supervisory personnel. The Boards further considered the compliance programs and compliance records of Funds Management and the Sub-Adviser. In addition, the Boards took into account the full range of services provided to the Funds by Funds Management and its affiliates.
Fund investment performance and expenses
The Boards considered the investment performance results for each of the Funds over various time periods ended December 31, 2019. The Board also considered more current results for various time periods ended March 31, 2020. The Boards considered these results in comparison to the investment performance of funds in a universe that was determined by Broadridge Inc. (“Broadridge”) to be similar to the Gateway Fund (the “Universe”), and in comparison to the Gateway Fund’s benchmark index and to other comparative data. Broadridge is an independent provider of investment company data. The Boards received a description of the methodology used by Broadridge to select the mutual funds in the performance Universe. The Funds Trust Board noted that the investment performance of the Gateway Fund (Administrator Class) was higher than the average investment performance of its Universe for the one-, three-, five- and ten-year periods ended December 31, 2019. The Funds Trust Board also noted that the investment performance of the Gateway Fund (Administrator Class) was higher than the average investment performance of its Universe for the five- and ten-year periods ended March 31, 2020, and lower than the average investment performance of its Universe for one- and three-year periods ended March 31, 2020. The Funds Trust Board also noted that the investment performance of the Gateway Fund was higher than its benchmark, the Bloomberg Barclays U.S. TIPS Index, for all periods ended December 31, 2019, and lower than its benchmark index for all periods ended March 31, 2020.
The Master Trust Board took note of the investment performance of the Master Portfolio in the context of reviewing the investment performance of the Gateway Fund.
The Funds Trust Board also received and considered information regarding the Gateway Fund’s net operating expense ratios, which include fees and expenses of the Master Portfolio, and their various components, including actual management fees assessed at the Gateway Fund and Master Portfolio levels, custodian and other non-management fees, and Rule 12b-1 and non-Rule 12b-1 shareholder service fees. The Funds Trust Board considered these ratios in comparison to the median ratios of funds in class-specific expense groups that were determined by Broadridge to be similar to the Gateway Fund (the “Groups”). The Funds Trust Board received a description of the methodology used by Broadridge to select the mutual funds in the expense Groups and an explanation of how funds comprising expense groups and their expense ratios may vary from year-to-year. Based on the Broadridge reports, the Funds Trust Board noted that the net operating expense ratios of the Gateway Fund were lower than or equal to the median net operating expense ratios of its expense Groups for all share classes.
With respect to the Master Portfolio, the Master Trust Board reviewed the fee rates that are payable to Funds Management for investment advisory services (as discussed below), which are the only fees charged at the Master Portfolio level, relative to a corresponding expense Group.
The Boards took into account the Funds’ investment performance and expense information provided to them among the factors considered in deciding to re-approve the Advisory Agreements.
Investment management, advisory and sub-advisory fee rates
The Funds Trust Board noted that Funds Management receives no advisory fees from the Gateway Fund as long as the Gateway Fund continues to invest all (or substantially all) of its assets in a single master portfolio. If the Gateway Fund were to change its investment structure so that it began investing in two or more master portfolios (a fund-of-funds), Funds Management would be entitled to receive an annual fee of 0.25% of the Gateway Fund’s average daily net assets for providing investment advisory services to the Gateway Fund, including allocating the Gateway Fund’s assets to the Master Portfolio.
The Funds Trust Board reviewed and considered the contractual fee rates that are payable by the Gateway Fund to Funds Management under the Gateway Fund Management Agreement for management services (other than investment advisory services), as well as the contractual fee rates payable by the Gateway Fund to Funds Management for class-level administrative services under a Class-Level Administration Agreement, which include, among other things, class-level transfer agency and sub-transfer agency costs (collectively, the “Management Rates”).
52 | Wells Fargo Real Return Fund
Other information (unaudited)
The Master Trust Board reviewed and considered the contractual investment advisory fee rate that is payable by the Master Portfolio to Funds Management for investment advisory services under the Master Portfolio Advisory Agreement (the “Advisory Agreement Rate”). The Master Trust Board also reviewed and considered the contractual investment sub-advisory fee rate that is payable by Funds Management to the Sub-Adviser for investment sub-advisory services (the “Sub-Advisory Agreement Rate”).
Among other information reviewed by the Funds Trust Board was a comparison of the Gateway Fund’s Management Rate, which, for this purpose, includes the advisory fees paid at the Master Portfolio level, with the average contractual investment management fee rates of funds in the expense Groups at a common asset level as well as transfer agency costs of the funds in the expense Groups. The Funds Trust Board noted that the Management Rates of the Gateway Fund were in range of the sum of these average rates for the Gateway Fund’s expense Groups for each share class.
The Master Trust Board reviewed a comparison of the Advisory Agreement Rate of the Master Portfolio with those of other funds in the Master Portfolio’s expense Group at a common asset level. The Master Trust Board noted that the Advisory Agreement Rate of the Master Portfolio was in range of the median rate for the Master Portfolio’s expense Group.
The Master Trust Board also received and considered information about the portions of the total management fees that were retained by Funds Management after payment of the fees to the Sub-Adviser for sub-advisory services. In assessing the reasonableness of these amounts, the Master Trust Board received and evaluated information about the nature and extent of responsibilities retained and risks assumed by Funds Management and not delegated to or assumed by the Sub-Adviser, and about Funds Management’s on-going oversight services. Given the affiliation between Funds Management and the Sub-Adviser, the Master Trust Board ascribed limited relevance to the allocation of fees between them.
The Boards also received and considered information about the nature and extent of services offered and fee rates charged by Funds Management and the Sub-Adviser to other types of clients with investment strategies similar to those of the Funds. In this regard, the Boards received information about the significantly greater scope of services, and compliance, reporting and other legal burdens and risks of managing proprietary mutual funds compared with those associated with managing assets of other types of clients, including third-party sub-advised fund clients and non-mutual fund clients such as institutional separate accounts.
Based on its consideration of the factors and information it deemed relevant, including those described here, the Funds Trust Board determined that the compensation payable to Funds Management under the Gateway Fund Management Agreement was reasonable, and the Master Trust Board determined that the compensation payable to Funds Management under the Master Portfolio Advisory Agreement and to the Sub-Adviser under the Sub-Advisory Agreement was reasonable.
Profitability
The Boards received and considered information concerning the profitability of Funds Management, as well as the profitability of both WFAM and Wells Fargo & Co. (“Wells Fargo”) from providing services to the fund family as a whole. The Boards noted that the Sub-Adviser’s profitability information with respect to providing services to the Master Portfolio and other funds in the family was subsumed in the WFAM and Wells Fargo profitability analysis.
Funds Management reported on the methodologies and estimates used in calculating profitability, including a description of the methodology used to allocate certain expenses. Among other things, the Boards noted that the levels of profitability reported on a fund-by-fund basis varied widely, depending on factors such as the size, type and age of fund. Based on its review, the Boards did not deem the profits reported by Funds Management, WFAM or Wells Fargo from services provided to the Funds to be at a level that would prevent the Boards from approving the continuation of the Advisory Agreements.
Economies of scale
The Boards received and considered information about the potential for Funds Management to experience economies of scale in the provision of management services to the Funds, the difficulties of calculating economies of scale at an individual fund level, and the extent to which potential scale benefits are shared with shareholders. The Boards noted the existence of breakpoints in the Master Portfolio’s advisory fee structure and the Gateway Fund’s management fee structure, which operate generally to reduce the Funds’ expense ratios as the Funds grow in size, and the size of the Master Portfolio and the Gateway Fund, respectively, in relation to such breakpoints. The Boards considered that, in addition to advisory fee and management fee breakpoints, Funds Management shares potential economies of scale from its management business in a variety of ways, including through fee waiver and expense reimbursement arrangements, services that benefit shareholders, competitive management fee rates set at the outset without regard to breakpoints, and investments in the business intended to enhance services available to shareholders.
The Boards concluded that Funds Management’s arrangements with respect to each Fund, including contractual breakpoints, constituted a reasonable approach to sharing potential economies of scale with the Funds and their shareholders.
Wells Fargo Real Return Fund | 53
Other information (unaudited)
Other benefits to Funds Management and the Sub-Adviser
The Boards received and considered information regarding potential “fall-out” or ancillary benefits received by Funds Management and its affiliates, including the Sub-Adviser, as a result of their relationships with the Funds. Ancillary benefits could include, among others, benefits directly attributable to other relationships with the Funds and benefits potentially derived from an increase in Funds Management’s and the Sub-Adviser’s business as a result of their relationships with the Funds. The Boards noted that various affiliates of Funds Management may receive distribution-related fees, shareholder servicing payments and sub-transfer agency fees in respect of shares sold or held through them and services provided.
The Boards also reviewed information about soft dollar credits earned and utilized by the Sub-Adviser, fees earned by Funds Management and the Sub-Adviser from managing a private investment vehicle for the fund family’s securities lending collateral, and commissions earned by an affiliated broker from portfolio transactions.
Based on their consideration of the factors and information they deemed relevant, including those described here, the Boards did not find that any ancillary benefits received by Funds Management and its affiliates, including the Sub-Adviser, were unreasonable.
Conclusion
At the Meeting, after considering the above-described factors and based on its deliberations and its evaluation of the information described above, the Funds Trust Board unanimously approved the continuation of the Gateway Fund Management Agreement for a one-year period. Additionally, after its deliberations, the Master Trust Board unanimously approved the continuation of the Master Portfolio Advisory Agreement and the Sub-Advisory Agreement for a one-year term. The Boards also determined that the compensation payable to Funds Management and the Sub-Adviser was reasonable.
54 | Wells Fargo Real Return Fund
Other information (unaudited)
LIQUIDITY RISK MANAGEMENT PROGRAM
In accordance with Rule 22e-4 under the Investment Company Act of 1940, as amended (the “Liquidity Rule”), each of Wells Fargo Funds Trust and Wells Fargo Master Trust (each a “Trust”) has adopted and implemented a liquidity risk management program (the “Program”) on behalf of each of its non-money market series, including the Fund and the Portfolio, respectively, which is reasonably designed to assess and manage the Fund’s or the Portfolio’s liquidity risk. “Liquidity risk” is defined as the risk that the Fund or Portfolio is unable to meet redemption requests without significantly diluting remaining investors’ interests. Each Trust’s Board of Trustees (each a “Board”) previously approved the designation of Wells Fargo Funds Management, LLC (“Funds Management”), the Fund’s investment manager and the Portfolio’s investment adviser, as the administrator of the Program, and Funds Management has established a Liquidity Risk Management Council composed of personnel from multiple departments within Funds Management and its affiliates to assist Funds Management in the implementation and on-going administration of the Program.
The Program is comprised of various components designed to support the assessment and/or management of liquidity risk, including: (1) the periodic assessment (no less frequently than annually) of certain factors that influence the Fund’s and the Portfolio’s liquidity risk; (2) the periodic classification (no less frequently than monthly) of the Fund’s and the Portfolio’s investments into one of four liquidity categories that reflect an estimate of their liquidity under current market conditions; (3) a 15% limit on the acquisition of “illiquid investments” (as defined under the Liquidity Rule); (4) to the extent the Fund or the Portfolio does not invest primarily in “highly liquid investments” (as defined under the Liquidity Rule), the determination of a minimum percentage of the Fund’s or the Portfolio’s assets that generally will be invested in highly liquid investments (an “HLIM”); (5) if the Fund or the Portfolio has established an HLIM, the periodic review (no less frequently than annually) of the HLIM and the adoption of policies and procedures for responding to a shortfall of the Fund’s or the Portfolio’s “highly liquid investments” below its HLIM; and (6) periodic reporting to the respective Board.
At a meeting of each Board held on May 26 and 28, 2020, the Board received a written report (the “Report”) from Funds Management that addressed the operation of the Program and assessed its adequacy and effectiveness of implementation. The Report covered the initial period from December 1, 2018 through December 31, 2019 (the “Reporting Period”). No significant liquidity events impacting the Fund or the Portfolio were noted in the Report. There were no material changes to the Program during the Reporting Period. The Report concluded that the Program is operating effectively to assess and manage the Fund’s and the Portfolio’s liquidity risk, and that the Program has been and continues to be adequately and effectively implemented to monitor and, as applicable, respond to the Fund’s and the Portfolio’s liquidity developments.
There can be no assurance that the Program will achieve its objectives under all circumstances in the future. Please refer to the Fund’s prospectus for more information regarding the Fund’s exposure to liquidity risk and other risks to which an investment in the Fund may be subject.
Wells Fargo Real Return Fund | 55
Appendix I (unaudited)
Effective on or about May 1, 2020, if you purchase Fund shares through a Janney Montgomery Scott LLC (“Janney”) brokerage account, you will be eligible for the following load waivers (front-end sales charge waivers and contingent deferred sales charge (“CDSC”), or back-end sales charge, waivers) and discounts, which may differ from those disclosed elsewhere in the Fund’s Prospectus or SAI.
|
| Front-end sales charge* waivers on Class A shares available at Janney |
|
| Shares purchased through reinvestment of capital gains distributions and dividend reinvestment when purchasing shares of the same fund (but not any other fund within the fund family). |
|
| Shares purchased by employees and registered representatives of Janney or its affiliates and their family members as designated by Janney. |
|
| Shares purchased from the proceeds of redemptions within the same fund family, provided (1) the repurchase occurs within ninety (90) days following the redemption, (2) the redemption and purchase occur in the same account, and (3) redeemed shares were subject to a front-end or deferred sales load (i.e., right of reinstatement). |
|
| Employer-sponsored retirement plans (e.g., 401(k) plans, 457 plans, employer-sponsored 403(b) plans, profit sharing and money purchase pension plans and defined benefit plans). For purposes of this provision, employer-sponsored retirement plans do not include SEP IRAs, Simple IRAs, SAR-SEPs or Keogh plans. |
|
| Shares acquired through a right of reinstatement. |
|
| Class C shares that are no longer subject to a contingent deferred sales charge and are converted to Class A shares of the same fund pursuant to Janney’s policies and procedures. |
| CDSC waivers on Class A and Class C shares available at Janney |
|
| Shares sold upon the death or disability of the shareholder. |
|
| Shares sold as part of a systematic withdrawal plan as described in the Fund’s Prospectus. |
|
| Shares purchased in connection with a return of excess contributions from an IRA account. |
|
| Shares sold as part of a required minimum distribution for IRA and retirement accounts if the redemption is taken in or after the year the shareholder reaches qualified age based on applicable IRS regulations. |
|
| Shares sold to pay Janney fees but only if the transaction is initiated by Janney. |
|
| Shares acquired through a right of reinstatement. |
|
| Shares exchanged into the same share class of a different fund. |
| Front-end sales charge* discounts available at Janney; breakpoints, rights of accumulation and/or letters of intent |
|
| Breakpoints as described in the Fund’s Prospectus. |
|
| Rights of accumulation (“ROA”), which entitle shareholders to breakpoint discounts, will be automatically calculated based on the aggregated holding of fund family assets held by accounts within the purchaser’s household at Janney. Eligible fund family assets not held at Janney may be included in the ROA calculation only if the shareholder notifies his or her financial advisor about such assets. |
|
| Letters of intent which allow for breakpoint discounts based on anticipated purchases within a fund family, over a 13-month time period. Eligible fund family assets not held at Janney Montgomery Scott may be included in the calculation of letters of intent only if the shareholder notifies his or her financial advisor about such assets. |
| * | Also referred to as an “initial sales charge.” |
56 | Wells Fargo Real Return Fund
Appendix II (unaudited)
Effective on or after May 1, 2020, clients of Edward Jones (also referred to as “shareholders”) purchasing Fund shares on the Edward Jones commission and fee-based platforms are eligible only for the following sales charge discounts (also referred to as “breakpoints”) and waivers, which can differ from breakpoints and waivers described elsewhere in the Fund’s Prospectus or SAI or through another broker-dealer. In all instances, it is the shareholder’s responsibility to inform Edward Jones at the time of purchase of any relationship, holdings of Wells Fargo Funds or other facts qualifying the purchaser for breakpoints or waivers. Edward Jones can ask for documentation of such circumstance.
|
| Breakpoints available at Edward Jones |
|
| Rights of Accumulation (ROA) |
|
The applicable sales charge on a purchase of Class A shares is determined by taking into account all share classes (except any money market funds and retirement plan share classes) of Wells Fargo Funds held by the shareholder or in an account grouped by Edward Jones with other accounts for the purpose of providing certain pricing considerations (“pricing groups”). This includes all share classes held on the Edward Jones platform and/or held on another platform. The inclusion of eligible fund family assets in the rights of accumulation calculation is dependent on the shareholder notifying his or her financial advisor of such assets at the time of calculation. |
|
ROA is determined by calculating the higher of cost or market value (current shares x NAV). |
|
| Letter of Intent (LOI) |
|
Through a LOI, shareholders can receive the sales charge and breakpoint discounts for purchases shareholders intend to makeover a 13-month period from the date Edward Jones receives the LOI. The LOI is determined by calculating the higher of cost or market value of qualifying holdings at LOI initiation in combination with the value that the shareholder intends to buy over a 13-month period to calculate the front-end sales charge and any breakpoint discounts. Each purchase the shareholder makes during that 13-month period will receive the sales charge and breakpoint discount that applies to the total amount. The inclusion of eligible fund family assets in the LOI calculation is dependent on the shareholder notifying his or her financial advisor of such assets at the time of calculation. Purchases made before the LOI is received by Edward Jones are not covered under the LOI and will not reduce the sales charge previously paid. Sales charges will be adjusted if LOI is not met. |
| Sales charges are waived for the following shareholders and in the following situations at Edward Jones: |
● Associates of Edward Jones and its affiliates and their family members who are in the same pricing group (as determined by Edward Jones under its policies and procedures) as the associate. This waiver will continue for the remainder of the associate’s life if the associate retires from Edward Jones in good-standing. |
● Shares purchased in an Edward Jones fee-based program. |
● Shares purchased through reinvestment of capital gains distributions and dividend reinvestment. |
● Shares purchased from the proceeds of redeemed shares of the same fund family so long as the following conditions are met: 1) the proceeds are from the sale of shares within 60 days of the purchase, and 2) the sale and purchase are made in the same share class and the same account or the purchase is made in an individual retirement account with proceeds from liquidations in a non-retirement account. |
● Shares exchanged into Class A shares from another share class so long as the exchange is into the same fund and was initiated at the discretion of Edward Jones. Edward Jones is responsible for any remaining CDSC due to the fund company, if applicable. Any future purchases are subject to the applicable sales charge as disclosed in the prospectus. |
● Exchanges from Class C shares to Class A shares of the same fund, generally, in the 84th month following the anniversary of the purchase date or earlier at the discretion of Edward Jones. |
If the shareholder purchases shares that are subject to a CDSC and those shares are redeemed before the CDSC is expired, the shareholder
is responsible to pay the CDSC except in the following conditions available at Edward Jones: |
● The death or disability of the shareholder. |
● Systematic withdrawals with up to 10% per year of the account value. |
● Return of excess contributions from an Individual Retirement Account (IRA). |
● Shares sold as part of a required minimum distribution for IRA and retirement accounts if the redemption is taken in or after the year the shareholder reaches qualified age based on applicable IRS regulation. |
● Shares sold to pay Edward Jones fees or costs in such cases where the transaction is initiated by Edward Jones. |
● Shares exchanged in an Edward Jones fee-based program. |
● Shares acquired through NAV reinstatement. |
Wells Fargo Real Return Fund | 57
Appendix II (unaudited)
|
| Other Important Information for accounts at Edward Jones: |
| Minimum Purchase Amounts |
● $250 initial purchase minimum |
● $50 subsequent purchase minimum |
|
| Minimum Balances |
| Edward Jones has the right to redeem at its discretion fund holdings with a balance of $250 or less. The following are examples of accounts that are not included in this policy: |
● A fee-based account held on an Edward Jones platform |
● A 529 account held on an Edward Jones platform |
● An account with an active systematic investment plan or letter of intent (LOI) |
|
| Changing Share Classes |
| At any time it deems necessary, Edward Jones has the authority to exchange at NAV a shareholder’s holdings in a fund to Class A shares. |
58 | Wells Fargo Real Return Fund
Appendix III (unaudited)
Effective June 1, 2020, shareholders purchasing Fund shares through an Oppenheimer & Co. Inc. (“Oppenheimer”) platform or account are eligible only for the following load waivers (front-end sales charge waivers and contingent deferred or back-end, sales charge waivers) and discounts, which may differ from those disclosed in the Fund’s Prospectus or SAI.
|
| Front-end Sales Load Waivers on Class A Shares available at Oppenheimer |
|
| Employer-sponsored retirement, deferred compensation and employee benefit plans (including health savings accounts) and trusts used to fund those plans, provided that the shares are not held in a commission-based brokerage account and shares are held for the benefit of the plan. |
|
| Shares purchased by or through a 529 Plan. |
|
| Shares purchased through an Oppenheimer affiliated investment advisory program. |
|
| Shares purchased through reinvestment of capital gains distributions and dividend reinvestment when purchasing shares of the same fund (but not any other fund within the fund family). |
|
| Shares purchased from the proceeds of redemptions within the same fund family, provided (1) the repurchase occurs within 90 days following the redemption, (2) the redemption and purchase occur in the same account, and (3) redeemed shares were subject to a front-end or deferred sales load (known as Rights of Restatement). |
|
| A shareholder in the Fund’s Class C shares will have their shares exchanged at net asset value to Class A shares (or the appropriate share class) of the Fund if the shares are no longer subject to a CDSC and the exchange is in line with the policies and procedures of Oppenheimer. |
|
| Employees and registered representatives of Oppenheimer or its affiliates and their family members. |
|
| Directors or Trustees of the Fund, and employees of the Fund’s investment adviser or any of its affiliates, as described in the Prospectus. |
| CDSC Waivers on A and C Shares available at Oppenheimer |
|
| Death or disability of the shareholder. |
|
| Shares sold as part of a systematic withdrawal plan as described in the Prospectus. |
|
| Return of excess contributions from an IRA Account. |
|
| Shares sold as part of a required minimum distribution for IRA and retirement accounts due to the shareholder reaching the qualified age based on applicable IRS regulations as described in the Prospectus. |
|
| Shares sold to pay Oppenheimer fees but only if the transaction is initiated by Oppenheimer. |
|
| Shares acquired through a right of reinstatement. |
| Front-end load Discounts Available at Oppenheimer: Breakpoints, Rights of Accumulation & Letters of Intent |
|
| Breakpoints as described in the Prospectus. |
|
| Rights of Accumulation (ROA), which entitle shareholders to breakpoint discounts, will be automatically calculated based on the aggregated holding of fund family assets held by accounts within the purchaser’s household at Oppenheimer. Eligible fund family assets not held at Oppenheimer may be included in the ROA calculation only if the shareholder notifies his or her financial advisor about such assets. |
Wells Fargo Real Return Fund | 59
Appendix IV (unaudited)
Effective June 15, 2020, shareholders purchasing fund shares through a Robert W. Baird & Co. (“Baird”) platform or account will only be eligible for the following sales charge waivers (front-end sales charge waivers and CDSC waivers) and discounts, which may differ from those disclosed elsewhere in the Fund’s Prospectus or the SAI.
|
| Front-end Sales Load Waivers on Class A Shares available at Baird |
|
| Shares purchased through reinvestment of capital gains distributions and dividend reinvestment when purchasing share of the same fund. |
|
| Share purchase by employees and registers representatives of Baird or its affiliate and their family members as designated by Baird. |
|
| Shares purchase from the proceeds of redemptions within the same fund family, provided (1) the repurchase occurs within 90 days following the redemption, (2) the redemption and purchase occur in the same accounts, and (3) redeemed shares were subject to a front-end or deferred sales charge (known as rights of reinstatement). |
|
| A shareholder in the Funds Investor C Shares will have their share exchanged at net asset value to Investor A shares of the fund if the shares are no longer subject to CDSC and the exchange is in line with the policies and procedures of Baird. |
|
| Employer-sponsored retirement plans or charitable accounts in a transactional brokerage account at Baird, including 401(k)plans, 457 plans, employer-sponsored 403(b) plans, profit sharing and money purchase pension plans and defined benefit plans. For purposes of this provision, employer-sponsored retirement plans do not include SEP IRAs, Simple IRAs or SAR-SEPs. |
| CDSC Waivers on A and C Shares available at Baird |
|
| Shares sold due to death or disability of the shareholder. |
|
| Shares sold as part of a systematic withdrawal plan as described in the Fund’s Prospectus. |
|
| Shares bought due to returns of excess contributions from an IRA Account. |
|
| Shares sold as part of a required minimum distribution for IRA and retirement accounts due to the shareholder reaching age 72 as described in the Fund’s Prospectus. |
|
| Shares sold to pay Baird fees but only if the transaction is initiated by Baird. |
|
| Shares acquired through a right of reinstatement. |
| Front-end load Discounts Available at Baird: Breakpoint and/or Rights of Accumulation |
|
| Breakpoints as described in the Prospectus. |
|
| Rights of accumulations which entitles shareholders to breakpoint discounts will be automatically calculated based on the aggregated holding of fund family assets held by accounts within the purchaser’s household at Baird. Eligible fund family assets not held at Baird may be included in the rights of accumulations calculation only if the shareholder notifies his or her financial advisor about such assets. |
|
| Letters of Intent (LOI) allow for breakpoint discounts based on anticipated purchases within a fund family through Baird, over a 13-month period of time. |
60 | Wells Fargo Real Return Fund

For more information
More information about Wells Fargo Funds is available free upon request. To obtain literature, please write, visit the Fund’s website, or call:
Wells Fargo Funds
P.O. Box 219967
Kansas City, MO 64121-9967
Website: wfam.com
Individual investors: 1-800-222-8222
Retail investment professionals: 1-888-877-9275
Institutional investment professionals: 1-866-765-0778

This report and the financial statements contained herein are submitted for the general information of the shareholders of the Fund. If this report is used for promotional purposes, distribution of the report must be accompanied or preceded by a current prospectus. Before investing, please consider the investment objectives, risks, charges, and expenses of the investment. For a current prospectus and, if available, a summary prospectus, containing this information, call 1-800-222-8222 or visit the Fund’s website at wfam.com. Read the prospectus carefully before you invest or send money.
Wells Fargo Asset Management (WFAM) is the trade name for certain investment advisory/management firms owned by Wells Fargo & Company. These firms include but are not limited to Wells Capital Management Incorporated and Wells Fargo Funds Management, LLC. Certain products managed by WFAM entities are distributed by Wells Fargo Funds Distributor, LLC (a broker-dealer and Member FINRA).
This material is for general informational and educational purposes only and is NOT intended to provide investment advice or a recommendation of any kind—including a recommendation for any specific investment, strategy, or plan.
INVESTMENT PRODUCTS: NOT FDIC INSURED ◾ NO BANK GUARANTEE ◾ MAY LOSE VALUE
© 2020 Wells Fargo & Company. All rights reserved.
PAR-0620-00337 07-20
A288/AR288 05-20
Annual Report
May 31, 2020
Wells Fargo Core Bond Fund
Beginning on January 1, 2021, as permitted by new regulations adopted by the Securities and Exchange Commission, paper copies of the Wells Fargo Funds’ annual and semi-annual shareholder reports issued after this date will no longer be sent by mail, unless you specifically request paper copies of the reports. Instead, the reports will be made available on the Funds’ website, and you will be notified by mail each time a report is posted and provided with a website address to access the report.
If you already elected to receive shareholder reports electronically, you will not be affected by this change and you need not take any action. You may elect to receive shareholder reports and other communications from the Fund electronically at any time by contacting your financial intermediary (such as a broker-dealer or bank) or, if you are a direct investor, by calling 1-800-222-8222 or by enrolling at wellsfargo.com/advantagedelivery.
You may elect to receive all future reports in paper free of charge. If you invest through a financial intermediary, you can contact your financial intermediary to request that you continue to receive paper copies of your shareholder reports; if you invest directly with the Fund, you can call 1-800-222-8222. Your election to receive reports in paper will apply to all Wells Fargo Funds held in your account with your financial intermediary or, if you are a direct investor, to all Wells Fargo Funds that you hold.
|
|
|
Reduce clutter. Save trees. |
Sign up for electronic delivery of prospectuses and shareholder reports at wellsfargo.com/
advantagedelivery |
The views expressed and any forward-looking statements are as of May 31, 2020, unless otherwise noted, and are those of the Fund managers and/or Wells Fargo Asset Management. Discussions of individual securities, or the markets generally, or any Wells Fargo Fund are not intended as individual recommendations. Future events or results may vary significantly from those expressed in any forward-looking statements. The views expressed are subject to change at any time in response to changing circumstances in the market. Wells Fargo Asset Management and the Fund disclaim any obligation to publicly update or revise any views expressed or forward-looking statements.
INVESTMENT PRODUCTS: NOT FDIC INSURED ◾ NO BANK GUARANTEE ◾ MAY LOSE VALUE
Wells Fargo Core Bond Fund | 1
Letter to shareholders (unaudited)

Andrew Owen
President
Wells Fargo Funds
Dear Shareholder:
We are pleased to offer you this annual report for the Wells Fargo Core Bond Fund for the 12-month period that ended May 31, 2020. Global stock markets saw earlier gains erased in February and March as governments around the world took unprecedented measures to stop the spread of the coronavirus at the expense of short-term economic output. However, markets rebounded in April and May to offset much of the losses as central banks attempted to bolster capital markets and confidence. Fixed-income markets generally performed better, achieving widespread gains.
For the 12-month period, fixed-income securities generally had positive total returns while non-U.S. equities had broad losses and U.S. stocks performed strongly despite sharp volatility since late February. For the period, U.S. stocks, based on the S&P 500 Index,1 gained 12.84%. International stocks, as measured by the MSCI ACWI ex USA Index (Net),2 returned -3.43%, while the MSCI EM Index (Net)3 trailed slightly, with a -4.39% return. For bond investors, the Bloomberg Barclays U.S. Aggregate Bond Index4 gained a robust 9.42%, the Bloomberg Barclays Global Aggregate ex-USD Index5 returned 2.67%, and the Bloomberg Barclays Municipal Bond Index6 gained a more modest 3.98%, while the ICE BofA U.S. High Yield Index7 had a slight gain of 0.35%.
The fiscal year began on a positive note.
The 12-month period began with U.S. equity market advances during June and July 2019. The gains, primarily driven by geopolitical and monetary policy events, pushed equity markets to new highs. European Central Bank (ECB) President Mario Draghi indicated the bank was ready to cut rates or buy more assets to prop up inflation if needed. President Trump backed off of earlier tariff threats against Mexico and China. In the U.S., the Federal Reserve (Fed) implemented a 0.25% federal funds rate cut in July.
Later in July, the U.S. reversed course and threatened to impose higher tariffs on China’s exports after talks failed. China responded with tariff threats of its own and devalued the renminbi, roiling global markets. Major U.S. stock market indices closed July with the worst weekly results of the year. Bond prices gained as Treasury yields fell to multiyear lows, and the yield curve inverted at multiple points along the 30-year arc, with shorter-term yields higher than longer-term.
In August, U.S.-China trade tensions continued with no signs of compromise. Evidence of a continued global economic slowdown mounted, and central banks in China, New Zealand, and Thailand cut interest rates. Industrial and manufacturing data declined in China, Canada, Japan, and Germany. Adding to global uncertainty, Italy’s prime minister resigned,
| 1 | The S&P 500 Index consists of 500 stocks chosen for market size, liquidity, and industry group representation. It is a market-value-weighted index with each stock’s weight in the index proportionate to its market value. You cannot invest directly in an index. |
| 2 | The Morgan Stanley Capital International (MSCI) All Country World Index (ACWI) ex USA Index (Net) is a free-float-adjusted market-capitalization-weighted index that is designed to measure the equity market performance of developed and emerging markets, excluding the United States. Source: MSCI. MSCI makes no express or implied warranties or representations and shall have no liability whatsoever with respect to any MSCI data contained herein. The MSCI data may not be further redistributed or used as a basis for other indices or any securities or financial products. This report is not approved, reviewed, or produced by MSCI. You cannot invest directly in an index. |
| 3 | The MSCI Emerging Markets (EM) Index (Net) is a free-float-adjusted market-capitalization-weighted index that is designed to measure equity market performance of emerging markets. You cannot invest directly in an index. |
| 4 | The Bloomberg Barclays U.S. Aggregate Bond Index is a broad-based benchmark that measures the investment-grade, U.S. dollar-denominated, fixed-rate taxable bond market, including Treasuries, government-related and corporate securities, mortgage-backed securities (agency fixed-rate and hybrid adjustable-rate mortgage pass-throughs), asset-backed securities, and commercial mortgage-backed securities. You cannot invest directly in an index. |
| 5 | The Bloomberg Barclays Global Aggregate ex-USD Index is an unmanaged index that provides a broad-based measure of the global investment-grade fixed-income markets excluding the U.S. dollar-denominated debt market. You cannot invest directly in an index. |
| 6 | The Bloomberg Barclays Municipal Bond Index is an unmanaged index composed of long-term tax-exempt bonds with a minimum credit rating of Baa. You cannot invest directly in an index. |
| 7 | The ICE BofA U.S. High Yield Index is a market-capitalization-weighted index of domestic and Yankee high-yield bonds. The index tracks the performance of high-yield securities traded in the U.S. bond market. You cannot invest directly in an index. Copyright 2020. ICE Data Indices, LLC. All rights reserved. |
2 | Wells Fargo Core Bond Fund
Letter to shareholders (unaudited)
many feared a crackdown in Hong Kong as protestors sustained their calls for reform, and Prime Minister Boris Johnson planned to suspend the British Parliament as Brexit’s deadline neared.
In the U.S., the Fed cut interest rates a second time in September. U.S. manufacturing data disappointed investors. The U.S. Congress announced it would pursue an impeachment investigation of President Trump. Meanwhile, the Brexit impasse showed no signs of resolution. Officials in China said that hitting the country’s economic growth goals for the year would be difficult considering the weight of tariffs and trade restrictions. Although the S&P 500 Index finished the third quarter with the best year-to-date returns in more than 20 years, concerns about future returns remained.
The fourth quarter of 2019 started on a strong note, with U.S.-China trade tensions relaxing in October along with renewed optimism for a U.K. Brexit deal and positive macroeconomic data. The initial estimate of U.S. third-quarter gross domestic product growth was a resilient 1.9% annualized rate, while the U.S. unemployment rate fell to a 50-year low of 3.5% in September. However, despite resilience among U.S. consumers, business confidence declined and manufacturing activity contracted. Concerned with a potential economic slowdown, the Fed lowered interest rates another quarter point in late October—its third rate cut in four months. This helped push the S&P 500 Index to a new all-time high while emerging market equities rallied and global bonds declined overall, reflecting a broad pickup in risk appetite.
Equity markets continued to rally in November despite ongoing geopolitical risks. Hopes for a U.S.-China trade deal buoyed investor confidence. U.S. business sentiment improved slightly, and manufacturing and services activity picked up. While consumer confidence and purchasing manager activity rose in the eurozone, China reported weakening manufacturing and consumer data. Bond yields rose marginally, leading to slightly negative returns for global government and investment-grade corporate bonds.
Financial markets ended 2019 with a boost from the U.S. and China accord on a Phase One trade deal. That, along with the landslide win by the pro-Brexit U.K. Conservative Party in a national election and ongoing central bank support, gave investors greater confidence. U.S. economic indicators were generally positive, with the exception of manufacturing activity and business confidence. Consumer confidence was resilient, fed by a robust labor market, tame inflation, and lower interest rates, which boosted housing affordability and stimulated homebuyer activity. The impeachment of U.S. President Donald Trump had little impact on markets. Meanwhile, slowing Chinese economic activity, partly attributable to the trade war, led to further government stimulus at year-end through lower reserve ratios, allowing banks to lend more money.
The year-end rally continued in early January 2020. However, capital market volatility picked up sharply in late January on concerns over the potential impact of the coronavirus on the global economy and stock markets. With sentiment somewhat souring, perceived safe havens did well in January. The U.S. dollar and Japanese yen both rose, and government bonds outperformed equities. While the S&P 500 Index held its ground, emerging market equities tumbled, including those in Asia.
In February, the coronavirus became the major market focus. Fears of the virus’s impact on global growth led to expectations of increased global central bank monetary policy support. That led the 10-year U.S. Treasury yield to fall to an all-time low of 1.1% by the end of the month. Although equity markets initially shrugged off concerns about the outbreak, focusing instead on strong fourth-quarter earnings and improving business confidence in January, market sentiment turned sharply lower toward month-end and the S&P 500 Index lost 8.2% for the month. Oil prices tumbled as Russia and the Organization of the Petroleum Exporting Countries compounded a major decline in oil demand with a brutal price war, partly aimed at dissuading further U.S. shale production. As a result, the price of West Texas Intermediate crude oil fell 13% in February.
Wells Fargo Core Bond Fund | 3
Letter to shareholders (unaudited)
“The global spread of the coronavirus led country after country to clamp down on social and business-related activity in order to contain the virus from causing even greater devastation and overwhelming health care systems.”
“Markets rebounded strongly in April after the earlier extreme volatility, with the S&P 500 Index gaining 12.8% for the month and the MSCI ACWI ex USA Index (Net) returning 7.6%.”
|
|
|
For further information about your Fund, contact your investment professional, visit our website at wfam.com, or call us directly at 1-800-222-8222. |
The global spread of the coronavirus led country after country to clamp down on social and business-related activity in order to contain the virus from causing even greater devastation and overwhelming health care systems. This abrupt stoppage of economic activity led to the sharp deceleration of global output, sending economies into a deep contraction. Central bank responses were swift, as they slashed interest rates and expanded quantitative easing programs to restore liquidity and confidence to the markets. In the U.S., the Fed introduced several new lending programs, funding investment-grade bonds, money market mutual funds, and commercial paper while purchasing Treasuries, mortgage-backed securities, and overnight repurchase agreements. Meanwhile, stock markets tumbled quickly into a bear market, ending the longest bull stock market in U.S. history.
Markets rebounded strongly in April after the earlier extreme volatility, with the S&P 500 Index gaining 12.8% for the month and the MSCI ACWI ex USA Index (Net) returning 7.6%. The rebound was fueled by unprecedented government and central bank stimulus measures taken to buffer the economic damage created by mass shutdowns enacted in order to contain the virus’s spread. The U.S. economy contracted by an annualized 4.8% pace in the first quarter, with 30 million new unemployment insurance claims in six weeks. In the eurozone, first-quarter real gross domestic product (GDP) shrank 3.8%, with the composite April Flash Purchasing Managers’ Index, a monthly survey of purchasing managers, falling to an all-time low of 13.5. The ECB expanded its quantitative easing to include the purchase of additional government bonds of countries with the greatest virus-related need, including Italy and Spain. China’s first-quarter GDP fell by 6.8% year over year. However, retail sales, production, and investment showed signs of recovery. Extreme oil price volatility continued as global supply far exceeded demand.
In May, the equity market rebound continued, with the S&P 500 Index climbing a further 4.8%. European and Japanese stock markets also had monthly gains. Investors regained confidence on reports of early signs of success in human trials of a coronavirus vaccine. Growth stocks continued to outperform value stocks while returns on global government bonds were generally flat. In the U.S., a gap grew between the stock market rebound and devastating economic data points, including an April unemployment rate of 14.7%, the highest level since World War II. Purchasing managers’ indices continued to reflect weakening activity in May in both the manufacturing and services sectors. U.S. corporate earnings reports indicated a 14% year-over-year contraction in earnings from the first quarter of 2019. However, high demand for technology, driven by remote activity, helped maintain robust information technology sector earnings, which helped drive powerful well-known technology stocks higher.
Don’t let short-term uncertainty derail long-term investment goals.
Periods of investment uncertainty can present challenges, but experience has taught us that maintaining long-term investment goals can be an effective way to plan for the future. To help you create a sound strategy based on your personal goals and risk tolerance, Wells Fargo Funds offers more than 100 mutual funds spanning a wide range of asset classes and investment styles. Although diversification cannot guarantee an investment profit or prevent losses, we believe it can be an effective way to manage investment risk and potentially smooth out overall portfolio performance. We encourage investors to know their investments and to understand that appropriate levels of risk-taking may unlock opportunities.
Thank you for choosing to invest with Wells Fargo Funds. We appreciate your confidence in us and remain committed to helping you meet your financial needs.
Sincerely,

Andrew Owen
President
Wells Fargo Funds
4 | Wells Fargo Core Bond Fund
This page is intentionally left blank.
Performance highlights (unaudited)
Investment objective
The Fund seeks total return, consisting of income and capital appreciation.
Manager
Wells Fargo Funds Management, LLC
Subadviser for the affiliated master portfolio1
Wells Capital Management Incorporated
Portfolio managers
Maulik Bhansali, CFA®‡
Thomas O’Connor, CFA®‡*
Jarad Vasquez
Average annual total returns (%) as of May 31, 2020
| | | | | | | | | | | | | | | | | | | | | | | | | | | | | | | | | | |
| | | | |
| | | | | Including sales charge | | | Excluding sales charge | | | Expense ratios2 (%) | |
| | | | | | | | | |
| | | Inception date | | 1 year | | | 5 year | | | 10 year | | | 1 year | | | 5 year | | | 10 year | | | Gross | | | Net3 | |
| | | | | | | | | | |
| Class A (MBFAX) | | 10-31-2001 | | | 4.10 | | | | 2.55 | | | | 3.43 | | | | 9.03 | | | | 3.50 | | | | 3.90 | | | | 0.83 | | | | 0.78 | |
| | | | | | | | | | |
| Class C (MBFCX) | | 10-31-2001 | | | 7.22 | | | | 2.73 | | | | 3.12 | | | | 8.22 | | | | 2.73 | | | | 3.12 | | | | 1.58 | | | | 1.53 | |
| | | | | | | | | | |
| Class R (WTRRX)4 | | 7-9-2010 | | | – | | | | – | | | | – | | | | 8.80 | | | | 3.24 | | | | 3.64 | | | | 1.08 | | | | 1.03 | |
| | | | | | | | | | |
| Class R4 (MBFRX)5 | | 11-30-2012 | | | – | | | | – | | | | – | | | | 9.34 | | | | 3.78 | | | | 4.19 | | | | 0.60 | | | | 0.52 | |
| | | | | | | | | | |
| Class R6 (WTRIX)6 | | 11-30-2012 | | | – | | | | – | | | | – | | | | 9.42 | | | | 3.92 | | | | 4.32 | | | | 0.45 | | | | 0.37 | |
| | | | | | | | | | |
| Administrator Class (MNTRX) | | 6-30-1997 | | | – | | | | – | | | | – | | | | 9.14 | | | | 3.58 | | | | 3.99 | | | | 0.77 | | | | 0.70 | |
| | | | | | | | | | |
| Institutional Class (MBFIX) | | 10-31-2001 | | | – | | | | – | | | | – | | | | 9.45 | | | | 3.87 | | | | 4.29 | | | | 0.50 | | | | 0.42 | |
| | | | | | | | | | |
| Bloomberg Barclays U.S. Aggregate Bond Index7 | | – | | | – | | | | – | | | | – | | | | 9.42 | | | | 3.94 | | | | 3.92 | | | | – | | | | – | |
Figures quoted represent past performance, which is no guarantee of future results, and do not reflect taxes that a shareholder may pay on an investment in a fund. Investment return and principal value of an investment will fluctuate so that an investor’s shares, when redeemed, may be worth more or less than their original cost. Performance shown without sales charges would be lower if sales charges were reflected. Current performance may be lower or higher than the performance data quoted, which assumes the reinvestment of dividends and capital gains. Current month-end performance is available on the Fund’s website, wfam.com.
Index returns do not include transaction costs associated with buying and selling securities, any mutual fund fees or expenses, or any taxes. It is not possible to invest directly in an index.
For Class A shares, the maximum front-end sales charge is 4.50%. For Class C shares, the maximum contingent deferred sales charge is 1.00%. Performance including a contingent deferred sales charge assumes the sales charge for the corresponding time period. Class R, Class R4, Class R6, Administrator Class, and Institutional Class shares are sold without a front-end sales charge or contingent deferred sales charge.
Bond values fluctuate in response to the financial condition of individual issuers, general market and economic conditions, and changes in interest rates. Changes in market conditions and government policies may lead to periods of heightened volatility in the bond market and reduced liquidity for certain bonds held by the Fund. In general, when interest rates rise, bond values fall and investors may lose principal value. Interest rate changes and their impact on the Fund and its share price can be sudden and unpredictable. The use of derivatives may reduce returns and/or increase volatility. Certain investment strategies tend to increase the total risk of an investment (relative to the broader market). Securities issued by U.S. government agencies or government-sponsored entities may not be guaranteed by the U.S. Treasury. The Fund is exposed to foreign investment risk and mortgage- and asset-backed securities risk. Consult the Fund’s prospectus for additional information on these and other risks.
Please see footnotes on page 7.
6 | Wells Fargo Core Bond Fund
Performance highlights (unaudited)
|
|
| Growth of $10,000 investment as of May 31, 20208 |
|
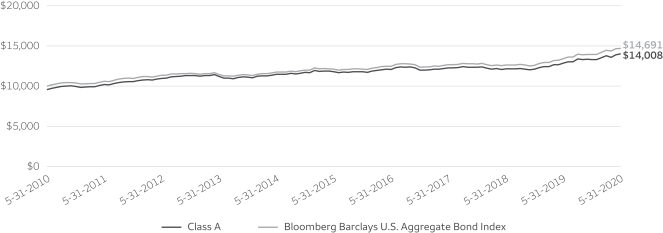
|
| ‡ | CFA® and Chartered Financial Analyst® are trademarks owned by CFA Institute. |
| * | Thomas O’Connor, CFA has announced his intention to retire from Wells Capital Management Incorporated on December 31, 2020. He will continue to serve as a portfolio manager of the Fund through that date. |
| 1 | The Fund is a feeder fund in a master-feeder structure that invests substantially all of its assets in a single affiliated master portfolio of the Wells Fargo Master Trust with a substantially identical investment objective and substantially similar investment strategies. References to the investment activities of the Fund are intended to refer to the investment activities of the affiliated master portfolio in which it invests. |
| 2 | Reflects the expense ratios as stated in the most recent prospectuses. The expense ratios shown are subject to change and may differ from the annualized expense ratios shown in the financial highlights of this report. |
| 3 | The manager has contractually committed through September 30, 2020, to waive fees and/or reimburse expenses to the extent necessary to cap total annual fund operating expenses after fee waivers at 0.78% for Class A, 1.53% for Class C, 1.03% for Class R, 0.52% for Class R4, 0.37% for Class R6, 0.70% for Administrator Class, and 0.42% for Institutional Class. Brokerage commissions, stamp duty fees, interest, taxes, acquired fund fees and expenses (if any) from funds in which the affiliated master portfolio invests, and extraordinary expenses are excluded from the expense caps. Net expenses from the affiliated master portfolio are included in the expense caps. Prior to or after the commitment expiration date, the caps may be increased or the commitment to maintain the caps may be terminated only with the approval of the Board of Trustees. Without these caps, the Fund’s returns would have been lower. The expense ratio paid by an investor is the net expense ratio (the total annual fund operating expenses after fee waivers) as stated in the prospectuses. |
| 4 | Historical performance shown for the Class R shares prior to their inception reflects the performance of the Administrator Class shares, adjusted to reflect the higher expenses applicable to the Class R shares. |
| 5 | Historical performance shown for the Class R4 shares prior to their inception reflects the performance of the Institutional Class shares, adjusted to reflect the higher expenses applicable to the Class R4 shares. |
| 6 | Historical performance shown for the Class R6 shares prior to their inception reflects the performance of the Institutional Class shares and includes the higher expenses applicable to the Institutional Class shares. If these expenses had not been included, returns for the Class R6 shares would be higher. |
| 7 | The Bloomberg Barclays U.S. Aggregate Bond Index is a broad-based benchmark that measures the investment-grade, U.S. dollar–denominated, fixed-rate taxable bond market, including Treasuries, government-related and corporate securities, mortgage-backed securities (agency fixed-rate and hybrid adjustable-rate mortgage pass-throughs), asset-backed securities, and commercial mortgage-backed securities. You cannot invest directly in an index. |
| 8 | The chart compares the performance of Class A shares for the most recent ten years with the Bloomberg Barclays U.S. Aggregate Bond Index. The chart assumes a hypothetical $10,000 investment in Class A shares and reflects all operating expenses and assumes the maximum initial sales charge of 4.50%. |
| 9 | The ten largest holdings, excluding cash, cash equivalents and any money market funds, are calculated based on the value of the securities of the affiliated master portfolio allocable to the Fund divided by the total net assets of the Fund. Holdings are subject to change and may have changed since the date specified. |
| 10 | Amounts represent the portfolio composition of the affiliated master portfolio which are calculated based on the total long-term investments of the affiliated master portfolio. These amounts are subject to change and may have changed since the date specified. |
| 11 | The S&P 500 Index consists of 500 stocks chosen for market size, liquidity, and industry group representation. It is a market-value-weighted index with each stock’s weight in the index proportionate to its market value. You cannot invest directly in an index. |
Wells Fargo Core Bond Fund | 7
Performance highlights (unaudited)
MANAGER’S DISCUSSION
Fund highlights
| ∎ | | The Fund (Class A, excluding sales charges) underperformed its benchmark, the Bloomberg Barclays U.S. Aggregate Bond Index, for the 12-month period that ended May 31, 2020. |
| ∎ | | A sector overweight to asset-backed securities (ABS) and poor security selection within ABS and commercial mortgage-backed securities (CMBS) detracted from performance, particularly during March 2020. |
| ∎ | | Security selection in the credit sector and in agency mortgage-backed securities (MBS) contributed to performance and was an offset to the negative performance comparisons versus benchmark. |
The global economy and markets faced a range of issues.
Despite trade tensions presenting a clear overhang along with political uneasiness with China, such as its own tensions with Hong Kong, the U.S. economy coasted into year-end with sub-trend growth, while stocks and credit were performing well. Slowing manufacturing surveys amid ongoing uncertainties on trade, weak export performance, and the impact of the General Motors strike and Boeing’s production halt all loomed large.
As we moved into the new year, concerns around the broadening scope of the coronavirus outbreak began to simmer, adding to a high degree of uncertainty in the U.S. and global economies. The outbreak of the coronavirus intensified and spread from mainland China into several other countries during February, first erupting in Italy and Iran before moving to the United States and elsewhere throughout the globe, sending shockwaves through financial markets.
While signs of economic strength were emerging early in the year, moves toward shutdowns of all but essential activity to contain the spread of the virus had profound effects on world economies. Early indicators suggest unprecedented declines in economic activity coupled with a rapid rise of unemployment as companies furloughed workers to mitigate the impact of lost revenue and to conserve liquidity. Consensus forecasts for second-quarter U.S. gross domestic product suggests a decline of 30% to 50% with unemployment moving toward 15%.
The pandemic contributed to extreme volatility.
Quite understandably, the outset of the pandemic contributed to periods of extreme volatility in financial markets. U.S. fixed-income markets seized up in a dramatic rush for cash, on behalf of both corporate and investor participants, prices plunged across the spectrum of our opportunity set amid violent technical moves. Policymakers responded swiftly, using the playbook from the 2008 financial crisis, but with far more firepower and all in a period of a few weeks. The U.S. Federal Reserve lowered rates to near zero and announced a broad array of liquidity support measures, such as buying sufficient Treasuries and agency mortgages to support smooth market functioning after high volatility and coordinating with the U.S. Department of the Treasury to provide lending power for purchases of ABS, commercial paper, money markets, small business loans, and investment-grade corporate issuance. Further, Congress provided $2 trillion of fiscal stimulus on a broad bipartisan basis to support workers and affected sectors, with additional packages likely forthcoming. Foreign countries are following with fiscal and monetary stimulus of their own, and there are early signs of stepped-up international coordination from the International Monetary Fund and G-20.
While hope is for the stimulus measures to provide a bridge to eventual reopenings, shocking U.S. economic data released during April and May reflected an idle U.S. economy amid coronavirus closures that are just now beginning to ease. We expect a continuing trend of eye-popping economic and corporate results for the next many quarters but for now, the financial markets are looking beyond the current fundamentals.
| | | | |
|
| Ten largest holdings (%) as of May 31, 20209 | |
| | |
FNMA, 2.50%, 6-11-2050 | | | 2.85 | |
| | |
FNMA, 2.50%, 8-13-2050 | | | 2.71 | |
| | |
U.S. Treasury Bond, 2.75%, 11-15-2042 | | | 2.29 | |
| | |
FNMA, 2.50%, 7-14-2050 | | | 1.88 | |
| | |
U.S. Treasury Bond, 2.88%, 5-15-2043 | | | 1.66 | |
| | |
U.S. Treasury Bond, 3.13%, 8-15-2044 | | | 1.62 | |
| | |
U.S. Treasury Bond, 1.13%, 5-15-2040 | | | 1.38 | |
| | |
U.S. Treasury Note, 0.13%, 5-31-2022 | | | 1.36 | |
| | |
FHLMC, 4.00%, 7-1-2049 | | | 1.14 | |
| | |
GNMA, 4.00%, 6-20-2047 | | | 1.13 | |
|
|
| Portfolio composition as of May 31, 202010 |
|
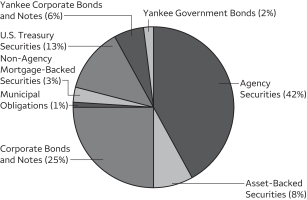 |
Please see footnotes on page 7.
8 | Wells Fargo Core Bond Fund
Performance highlights (unaudited)
Stocks and credit markets soared in April and May on the heels of the extraordinary stimulus measures driving record inflows into riskier assets, including credit strategies. At period-end, the S&P 500 Index11 was up more than 36% from its 52-week low on March 23 and credit funds were reporting an accelerating pace of inflows, fueling the incredibly strong technical conditions.
Heading into 2020, the core strategy was positioned with modest underweights to the credit and CMBS sectors and overweight positions in MBS and ABS. Taking advantage of the dramatic sell-off in credit, which has presented a robust opportunity for security selection, we have increased our exposure to the highly liquid agency MBS sector, with some modest reductions to ABS as an offset. We continue to maintain an underweight to commercial MBS, with significant questions about commercial real estate fundamentals.
We believe fixed-income markets are providing superior security selection opportunities in 2020 and potentially for a number of quarters and years as we observe attractive valuations and an extended period of heightened volatility. We will seek to add value through our bottom-up, active, relative-value investment management while maintaining disciplined risk management and a duration-neutral approach. As always, we continue to focus on bottom-up security selection in what are unusually disorderly markets. As always, we remain nimble and agile and stand ready to take advantage of opportunities across our opportunity set, the most liquid components of the U.S. fixed-income universe.
Please see footnotes on page 7.
Wells Fargo Core Bond Fund | 9
Fund Expenses (unaudited)
As a shareholder of the Fund, you incur two types of costs: (1) transaction costs, including sales charges (loads) on purchase payments and contingent deferred sales charges (if any) on redemptions and (2) ongoing costs, including management fees, distribution (12b-1) and/or shareholder servicing fees, and other Fund expenses. This example is intended to help you understand your ongoing costs (in dollars) of investing in the Fund and to compare these costs with the ongoing costs of investing in other mutual funds.
The example is based on an investment of $1,000 invested at the beginning of the six-month period and held for the entire period from December 1, 2019 to May 31, 2020.
Actual expenses
The “Actual” line of the table below provides information about actual account values and actual expenses. You may use the information in this line, together with the amount you invested, to estimate the expenses that you paid over the period. Simply divide your account value by $1,000 (for example, an $8,600 account value divided by $1,000 = 8.6), then multiply the result by the number in the “Actual” line under the heading entitled “Expenses paid during period” for your applicable class of shares to estimate the expenses you paid on your account during this period.
Hypothetical example for comparison purposes
The “Hypothetical” line of the table below provides information about hypothetical account values and hypothetical expenses based on the Fund’s actual expense ratio and an assumed rate of return of 5% per year before expenses, which is not the Fund’s actual return. The hypothetical account values and expenses may not be used to estimate the actual ending account balance or expenses you paid for the period. You may use this information to compare the ongoing costs of investing in the Fund and other funds. To do so, compare this 5% hypothetical example with the 5% hypothetical examples that appear in the shareholder reports of the other funds.
Please note that the expenses shown in the table are meant to highlight your ongoing costs only and do not reflect any transactional costs, such as sales charges (loads) and contingent deferred sales charges. Therefore, the “Hypothetical” line of the table is useful in comparing ongoing costs only and will not help you determine the relative total costs of owning different funds. In addition, if these transactional costs were included, your costs would have been higher.
| | | | | | | | | | | | | | | | |
| | | Beginning
account value
12-1-2019 | | | Ending
account value
5-31-2020 | | | Expenses
paid during
the period1,2 | | | Annualized net
expense ratio1 | |
| | | | | |
Class A | | | | | | | | | | | | | | | | |
| | | | |
Actual | | $ | 1,000.00 | | | $ | 1,053.12 | | | $ | 4.00 | | | | 0.78 | % |
| | | | |
Hypothetical (5% return before expenses) | | $ | 1,000.00 | | | $ | 1,021.10 | | | $ | 3.94 | | | | 0.78 | % |
| | | | | |
Class C | | | | | | | | | | | | | | | | |
| | | | |
Actual | | $ | 1,000.00 | | | $ | 1,048.90 | | | $ | 7.82 | | | | 1.53 | % |
| | | | |
Hypothetical (5% return before expenses) | | $ | 1,000.00 | | | $ | 1,017.37 | | | $ | 7.70 | | | | 1.53 | % |
| | | | | |
Class R | | | | | | | | | | | | | | | | |
| | | | |
Actual | | $ | 1,000.00 | | | $ | 1,052.36 | | | $ | 5.09 | | | | 0.99 | % |
| | | | |
Hypothetical (5% return before expenses) | | $ | 1,000.00 | | | $ | 1,020.04 | | | $ | 5.01 | | | | 0.99 | % |
| | | | | |
Class R4 | | | | | | | | | | | | | | | | |
| | | | |
Actual | | $ | 1,000.00 | | | $ | 1,054.05 | | | $ | 2.67 | | | | 0.52 | % |
| | | | |
Hypothetical (5% return before expenses) | | $ | 1,000.00 | | | $ | 1,022.40 | | | $ | 2.63 | | | | 0.52 | % |
| | | | | |
Class R6 | | | | | | | | | | | | | | | | |
| | | | |
Actual | | $ | 1,000.00 | | | $ | 1,054.87 | | | $ | 1.90 | | | | 0.37 | % |
| | | | |
Hypothetical (5% return before expenses) | | $ | 1,000.00 | | | $ | 1,023.15 | | | $ | 1.87 | | | | 0.37 | % |
| | | | | |
Administrator Class | | | | | | | | | | | | | | | | |
| | | | |
Actual | | $ | 1,000.00 | | | $ | 1,053.89 | | | $ | 3.58 | | | | 0.70 | % |
| | | | |
Hypothetical (5% return before expenses) | | $ | 1,000.00 | | | $ | 1,021.52 | | | $ | 3.52 | | | | 0.70 | % |
| | | | | |
Institutional Class | | | | | | | | | | | | | | | | |
| | | | |
Actual | | $ | 1,000.00 | | | $ | 1,054.61 | | | $ | 2.16 | | | | 0.42 | % |
| | | | |
Hypothetical (5% return before expenses) | | $ | 1,000.00 | | | $ | 1,022.90 | | | $ | 2.12 | | | | 0.42 | % |
| 1 | Amounts reflect net expenses allocated from the affiliated Master Portfolio in which the Fund invests. |
| 2 | Expenses paid is equal to the annualized net expense ratio of each class multiplied by the average account value over the period, multiplied by the number of days in the most recent fiscal half-year divided by the number of days in the fiscal year (to reflect the one-half-year period). |
10 | Wells Fargo Core Bond Fund
Portfolio of investments—May 31, 2020
| | | | | | | | | | | | | | | | |
| | | | | | | | | | | | Value | |
| Investment Companies: 100.00% | | | | | | | | | | | | |
| | | | |
| Affiliated Master Portfolio: 100.00% | | | | | | | | | | | | |
Wells Fargo Core Bond Portfolio | | | | | | | | | | | | | | $ | 5,464,570,176 | |
| | | | | | | | | | | | | | | | |
| | | | |
Total Investment Companies (Cost $5,290,657,085) | | | | | | | | | | | | | | | 5,464,570,176 | |
| | | | | | | | | | | | | | | | |
| | | | | | | | |
| Total investments in securities (Cost $5,290,657,085) | | | 100.00 | % | | | 5,464,570,176 | |
| | |
Other assets and liabilities, net | | | 0.00 | | | | 107,646 | |
| | | | | | | | |
| Total net assets | | | 100.00 | % | | $ | 5,464,677,822 | |
| | | | | | | | |
Transactions with the affiliated Master Portfolio were as follows:
| | | | | | | | | | | | | | | | | | | | | | | | | | | | | | | | |
| | | % of
ownership,
beginning
of period | | | % of
ownership,
end of
period | | | Net realized
gains (losses)
on securities
transactions
allocated
from
affiliated
Master
Portfolio | | | Net
change in
unrealized
gains
(losses) on
securities
transactions
allocated
from
affiliated
Master
Portfolio | | | Interest
allocated
from
affiliated
Master
Portfolio | | | Affiliated
income
allocated
from
affiliated
Master
Portfolio | | | Value,
end of period | | | % of
net
assets | |
Wells Fargo Core Bond Portfolio | | | 93 | % | | | 95 | % | | $ | 306,742,964 | | | $ | 56,934,677 | | | $ | 142,065,598 | | | $ | 1,837,951 | | | $ | 5,464,570,176 | | | | 100.00 | % |
The accompanying notes are an integral part of these financial statements.
Wells Fargo Core Bond Fund | 11
Statement of assets and liabilities—May 31, 2020
| | | | |
| | | | |
| |
Assets | | | | |
Investments in affiliated Master Portfolio, at value (cost $5,290,657,085) | | $ | 5,464,570,176 | |
Receivable for Fund shares sold | | | 8,750,159 | |
Prepaid expenses and other assets | | | 15,027 | |
| | | | |
Total assets | | | 5,473,335,362 | |
| | | | |
| |
Liabilities | | | | |
Payable for Fund shares redeemed | | | 6,061,601 | |
Dividends payable | | | 1,751,113 | |
Management fee payable | | | 131,910 | |
Administration fees payable | | | 286,485 | |
Distribution fees payable | | | 18,278 | |
Trustees’ fees and expenses payable | | | 843 | |
Accrued expenses and other liabilities | | | 407,310 | |
| | | | |
Total liabilities | | | 8,657,540 | |
| | | | |
Total net assets | | $ | 5,464,677,822 | |
| | | | |
| |
Net assets consist of | | | | |
Paid-in capital | | $ | 5,132,209,537 | |
Total distributable earnings | | | 332,468,285 | |
| | | | |
Total net assets | | $ | 5,464,677,822 | |
| | | | |
| |
Computation of net asset value and offering price per share | | | | |
Net assets – Class A | | $ | 299,642,121 | |
Shares outstanding – Class A1 | | | 21,143,131 | |
Net asset value per share – Class A | | | $14.17 | |
Maximum offering price per share – Class A2 | | | $14.84 | |
Net assets – Class C | | $ | 27,971,348 | |
Shares outstanding – Class C1 | | | 1,993,026 | |
Net asset value per share – Class C | | | $14.03 | |
Net assets – Class R | | $ | 3,240,527 | |
Shares outstanding – Class R1 | | | 234,284 | |
Net asset value per share – Class R | | | $13.83 | |
Net assets – Class R4 | | $ | 4,548,628 | |
Share outstanding – Class R41 | | | 328,978 | |
Net asset value per share – Class R4 | | | $13.83 | |
Net assets – Class R6 | | $ | 2,545,332,095 | |
Shares outstanding – Class R61 | | | 184,184,376 | |
Net asset value per share – Class R6 | | | $13.82 | |
Net assets – Administrator Class | | $ | 218,522,163 | |
Shares outstanding – Administrator Class1 | | | 15,797,219 | |
Net asset value per share – Administrator Class | | | $13.83 | |
Net assets – Institutional Class | | $ | 2,365,420,940 | |
Shares outstanding – Institutional Class1 | | | 171,219,253 | |
Net asset value per share – Institutional Class | | | $13.82 | |
| 1 | The Fund has an unlimited number of authorized shares. |
| 2 | Maximum offering price is computed as 100/95.50 of net asset value. On investments of $50,000 or more, the offering price is reduced. |
The accompanying notes are an integral part of these financial statements.
12 | Wells Fargo Core Bond Fund
Statement of operations—year ended May 31, 2020
| | | | |
| | | | |
| |
Investment income | | | | |
Interest allocated from affiliated Master Portfolio | | $ | 142,065,598 | |
Affiliated income allocated from affiliated Master Portfolio | | | 1,837,951 | |
Expenses allocated from affiliated Master Portfolio | | | (19,028,985 | ) |
| | | | |
Total investment income | | | 124,874,564 | |
| | | | |
| |
Expenses | | | | |
Management fee | | | 2,688,785 | |
Administration fees | | | | |
Class A | | | 478,850 | |
Class C | | | 49,215 | |
Class R | | | 8,323 | |
Class R4 | | | 5,406 | |
Class R6 | | | 756,695 | |
Administrator Class | | | 206,329 | |
Institutional Class | | | 1,926,516 | |
Shareholder servicing fees | | | | |
Class A | | | 747,869 | |
Class C | | | 76,808 | |
Class R | | | 12,359 | |
Class R4 | | | 6,756 | |
Administrator Class | | | 512,120 | |
Distribution fees | | | | |
Class C | | | 230,090 | |
Class R | | | 12,584 | |
Custody and accounting fees | | | 184,137 | |
Professional fees | | | 35,323 | |
Registration fees | | | 237,262 | |
Shareholder report expenses | | | 325,558 | |
Trustees’ fees and expenses | | | 21,592 | |
Other fees and expenses | | | 102,230 | |
| | | | |
Total expenses | | | 8,624,807 | |
Less: Fee waivers and/or expense reimbursements | | | | |
Fund-level | | | (2,108,224 | ) |
Class A | | | (23,650 | ) |
Class C | | | (2,037 | ) |
Class R4 | | | (2,528 | ) |
Class R6 | | | (756,695 | ) |
Administrator Class | | | (57,433 | ) |
Institutional Class | | | (913,629 | ) |
| | | | |
Net expenses | | | 4,760,611 | |
| | | | |
Net investment income | | | 120,113,953 | |
| | | | |
| |
Realized and unrealized gains (losses) on investments | | | | |
Net realized gains on securities transactions allocated from affiliated Master Portfolio | | | 306,742,964 | |
Net change in unrealized gains (losses) on securities transactions allocated from affiliated Master Portfolio | | | 56,934,677 | |
| | | | |
Net realized and unrealized gains (losses) on investments | | | 363,677,641 | |
| | | | |
Net increase in net assets resulting from operations | | $ | 483,791,594 | |
| | | | |
The accompanying notes are an integral part of these financial statements.
Wells Fargo Core Bond Fund | 13
Statement of changes in net assets
| | | | | | | | | | | | | | | | |
| | | Year ended
May 31, 2020 | | | Year ended
May 31, 2019 | |
| | | | |
Operations | | | | | | | | | | | | | | | | |
Net investment income | | | | | | $ | 120,113,953 | | | | | | | $ | 149,517,912 | |
Net realized gains (losses) on investments | | | | | | | 306,742,964 | | | | | | | | (17,410,516 | ) |
Net change in unrealized gains (losses) on investments | | | | | | | 56,934,677 | | | | | | | | 182,530,737 | |
| | | | |
Net increase in net assets resulting from operations | | | | | | | 483,791,594 | | | | | | | | 314,638,133 | |
| | | | |
| | | | |
Distributions to shareholders from net investment income and net realized gains | | | | | | | | | | | | | | | | |
Class A | | | | | | | (6,294,414 | ) | | | | | | | (7,707,522 | ) |
Class C | | | | | | | (417,858 | ) | | | | | | | (731,013 | ) |
Class R | | | | | | | (97,982 | ) | | | | | | | (258,514 | ) |
Class R4 | | | | | | | (161,109 | ) | | | | | | | (310,999 | ) |
Class R6 | | | | | | | (63,508,068 | ) | | | | | | | (65,026,382 | ) |
Administrator Class | | | | | | | (4,506,235 | ) | | | | | | | (6,822,022 | ) |
Institutional Class | | | | | | | (59,496,339 | ) | | | | | | | (68,704,939 | ) |
| | | | |
Total distributions to shareholders | | | | | | | (134,482,005 | ) | | | | | | | (149,561,391 | ) |
| | | | |
| | | | |
Capital share transactions | | | Shares | | | | | | | | Shares | | | | | |
Proceeds from shares sold | | | | | | | | | | | | | | | | |
Class A | | | 5,035,376 | | | | 68,831,957 | | | | 5,814,230 | | | | 74,731,899 | |
Class C | | | 737,031 | | | | 9,984,279 | | | | 504,131 | | | | 6,445,467 | |
Class R | | | 91,423 | | | | 1,215,599 | | | | 192,684 | | | | 2,418,555 | |
Class R4 | | | 183,129 | | | | 2,446,252 | | | | 232,839 | | | | 2,916,548 | |
Class R6 | | | 46,956,601 | | | | 627,133,874 | | | | 134,743,486 | | | | 1,690,762,705 | |
Administrator Class | | | 5,387,937 | | | | 72,239,222 | | | | 7,054,319 | | | | 87,991,112 | |
Institutional Class | | | 67,880,909 | | | | 903,670,274 | | | | 62,642,714 | | | | 786,483,803 | |
| | | | |
| | | | | | | 1,685,521,457 | | | | | | | | 2,651,750,089 | |
| | | | |
Reinvestment of distributions | | | | | | | | | | | | | | | | |
Class A | | | 399,765 | | | | 5,475,932 | | | | 517,112 | | | | 6,661,968 | |
Class C | | | 14,131 | | | | 191,525 | | | | 27,587 | | | | 351,123 | |
Class R | | | 1,589 | | | | 21,221 | | | | 2,650 | | | | 33,322 | |
Class R4 | | | 12,039 | | | | 160,382 | | | | 24,725 | | | | 310,703 | |
Class R6 | | | 3,578,858 | | | | 47,809,034 | | | | 4,654,160 | | | | 58,457,025 | |
Administrator Class | | | 324,731 | | | | 4,342,589 | | | | 528,027 | | | | 6,640,587 | |
Institutional Class | | | 3,940,416 | | | | 52,636,436 | | | | 4,468,964 | | | | 56,130,059 | |
| | | | |
| | | | | | | 110,637,119 | | | | | | | | 128,584,787 | |
| | | | |
Payment for shares redeemed | | | | | | | | | | | | | | | | |
Class A | | | (7,058,184 | ) | | | (96,112,855 | ) | | | (8,462,820 | ) | | | (108,862,680 | ) |
Class C | | | (1,381,669 | ) | | | (18,673,889 | ) | | | (1,664,172 | ) | | | (21,223,278 | ) |
Class R | | | (519,677 | ) | | | (6,891,248 | ) | | | (508,524 | ) | | | (6,425,841 | ) |
Class R4 | | | (700,264 | ) | | | (9,317,864 | ) | | | (354,232 | ) | | | (4,433,486 | ) |
Class R6 | | | (60,509,001 | ) | | | (803,022,923 | ) | | | (53,758,496 | ) | | | (673,745,873 | ) |
Administrator Class | | | (5,797,513 | ) | | | (77,110,768 | ) | | | (13,129,627 | ) | | | (165,688,347 | ) |
Institutional Class | | | (81,653,483 | ) | | | (1,088,476,808 | ) | | | (150,751,229 | ) | | | (1,886,370,187 | ) |
| | | | |
| | | | | | | (2,099,606,355 | ) | | | | | | | (2,866,749,692 | ) |
| | | | |
Net decrease in net assets resulting from capital share transactions | | | | | | | (303,447,779 | ) | | | | | | | (86,414,816 | ) |
| | | | |
Total increase in net assets | | | | | | | 45,861,810 | | | | | | | | 78,661,926 | |
| | | | |
| | | | |
Net assets | | | | | | | | | | | | | | | | |
Beginning of period | | | | | | | 5,418,816,012 | | | | | | | | 5,340,154,086 | |
| | | | |
End of period | | | | | | $ | 5,464,677,822 | | | | | | | $ | 5,418,816,012 | |
| | | | |
The accompanying notes are an integral part of these financial statements.
14 | Wells Fargo Core Bond Fund
Financial highlights
(For a share outstanding throughout each period)
| | | | | | | | | | | | | | | | | | | | |
| | | Year ended May 31 | |
| CLASS A | | 2020 | | | 2019 | | | 2018 | | | 2017 | | | 2016 | |
Net asset value, beginning of period | | | $13.28 | | | | $12.86 | | | | $13.22 | | | | $13.28 | | | | $13.16 | |
Net investment income | | | 0.25 | | | | 0.32 | | | | 0.24 | | | | 0.19 | 1 | | | 0.19 | 1 |
Net realized and unrealized gains (losses) on investments | | | 0.93 | | | | 0.42 | | | | (0.36 | ) | | | 0.00 | | | | 0.12 | |
| | | | | | | | | | | | | | | | | | | | |
Total from investment operations | | | 1.18 | | | | 0.74 | | | | (0.12 | ) | | | 0.19 | | | | 0.31 | |
Distributions to shareholders from | | | | | | | | | | | | | | | | | | | | |
Net investment income | | | (0.26 | ) | | | (0.32 | ) | | | (0.24 | ) | | | (0.19 | ) | | | (0.19 | ) |
Net realized gains | | | (0.03 | ) | | | 0.00 | | | | 0.00 | | | | (0.06 | ) | | | 0.00 | |
| | | | | | | | | | | | | | | | | | | | |
Total distributions to shareholders | | | (0.29 | ) | | | (0.32 | ) | | | (0.24 | ) | | | (0.25 | ) | | | (0.19 | ) |
Net asset value, end of period | | | $14.17 | | | | $13.28 | | | | $12.86 | | | | $13.22 | | | | $13.28 | |
Total return2 | | | 9.03 | % | | | 5.87 | % | | | (0.96 | )% | | | 1.48 | % | | | 2.36 | % |
Ratios to average net assets (annualized) | | | | | | | | | | | | | | | | | | | | |
Gross expenses3 | | | 0.82 | % | | | 0.83 | % | | | 0.83 | % | | | 0.83 | % | | | 0.83 | % |
Net expenses3 | | | 0.78 | % | | | 0.78 | % | | | 0.78 | % | | | 0.78 | % | | | 0.78 | % |
Net investment income3 | | | 1.85 | % | | | 2.50 | % | | | 1.79 | % | | | 1.40 | % | | | 1.43 | % |
Supplemental data | | | | | | | | | | | | | | | | | | | | |
Portfolio turnover rate4 | | | 603 | % | | | 577 | % | | | 542 | % | | | 614 | % | | | 667 | % |
Net assets, end of period (000s omitted) | | | $299,642 | | | | $302,246 | | | | $320,208 | | | | $360,276 | | | | $699,273 | |
| 1 | Calculated based upon average shares outstanding |
| 2 | Total return calculations do not include any sales charges. |
| 3 | Ratios include net expenses allocated from the affiliated Master Portfolio which were as follows: |
| | | | |
Year ended May 31, 2020 | | | 0.35 | % |
Year ended May 31, 2019 | | | 0.35 | % |
Year ended May 31, 2018 | | | 0.35 | % |
Year ended May 31, 2017 | | | 0.35 | % |
Year ended May 31, 2016 | | | 0.35 | % |
| 4 | Portfolio turnover rate is calculated by multiplying the affiliated Master Portfolio’s percentage of the Fund’s total investment in securities at the end of the period by the affiliated Master Portfolio’s portfolio turnover rate. |
The accompanying notes are an integral part of these financial statements.
Wells Fargo Core Bond Fund | 15
Financial highlights
(For a share outstanding throughout each period)
| | | | | | | | | | | | | | | | | | | | |
| | | Year ended May 31 | |
| CLASS C | | 2020 | | | 2019 | | | 2018 | | | 2017 | | | 2016 | |
Net asset value, beginning of period | | | $13.15 | | | | $12.74 | | | | $13.09 | | | | $13.15 | | | | $13.03 | |
Net investment income | | | 0.15 | | | | 0.23 | | | | 0.14 | | | | 0.09 | | | | 0.09 | |
Net realized and unrealized gains (losses) on investments | | | 0.92 | | | | 0.40 | | | | (0.35 | ) | | | 0.00 | | | | 0.12 | |
| | | | | | | | | | | | | | | | | | | | |
Total from investment operations | | | 1.07 | | | | 0.63 | | | | (0.21 | ) | | | 0.09 | | | | 0.21 | |
Distributions to shareholders from | | | | | | | | | | | | | | | | | | | | |
Net investment income | | | (0.16 | ) | | | (0.22 | ) | | | (0.14 | ) | | | (0.09 | ) | | | (0.09 | ) |
Net realized gains | | | (0.03 | ) | | | 0.00 | | | | 0.00 | | | | (0.06 | ) | | | 0.00 | |
| | | | | | | | | | | | | | | | | | | | |
Total distributions to shareholders | | | (0.19 | ) | | | (0.22 | ) | | | (0.14 | ) | | | (0.15 | ) | | | (0.09 | ) |
Net asset value, end of period | | | $14.03 | | | | $13.15 | | | | $12.74 | | | | $13.09 | | | | $13.15 | |
Total return1 | | | 8.22 | % | | | 5.04 | % | | | (1.65 | )% | | | 0.72 | % | | | 1.61 | % |
Ratios to average net assets (annualized) | | | | | | | | | | | | | | | | | | | | |
Gross expenses2 | | | 1.57 | % | | | 1.58 | % | | | 1.58 | % | | | 1.58 | % | | | 1.58 | % |
Net expenses2 | | | 1.53 | % | | | 1.53 | % | | | 1.53 | % | | | 1.53 | % | | | 1.53 | % |
Net investment income2 | | | 1.11 | % | | | 1.75 | % | | | 1.04 | % | | | 0.68 | % | | | 0.68 | % |
Supplemental data | | | | | | | | | | | | | | | | | | | | |
Portfolio turnover rate3 | | | 603 | % | | | 577 | % | | | 542 | % | | | 614 | % | | | 667 | % |
Net assets, end of period (000s omitted) | | | $27,971 | | | | $34,494 | | | | $47,843 | | | | $59,049 | | | | $66,612 | |
| 1 | Total return calculations do not include any sales charges. |
| 2 | Ratios include net expenses allocated from the affiliated Master Portfolio which were as follows: |
| | | | |
Year ended May 31, 2020 | | | 0.35 | % |
Year ended May 31, 2019 | | | 0.35 | % |
Year ended May 31, 2018 | | | 0.35 | % |
Year ended May 31, 2017 | | | 0.35 | % |
Year ended May 31, 2016 | | | 0.35 | % |
| 3 | Portfolio turnover rate is calculated by multiplying the affiliated Master Portfolio’s percentage of the Fund’s total investment in securities at the end of the period by the affiliated Master Portfolio’s portfolio turnover rate. |
The accompanying notes are an integral part of these financial statements.
16 | Wells Fargo Core Bond Fund
Financial highlights
(For a share outstanding throughout each period)
| | | | | | | | | | | | | | | | | | | | |
| | | Year ended May 31 | |
| CLASS R | | 2020 | | | 2019 | | | 2018 | | | 2017 | | | 2016 | |
Net asset value, beginning of period | | | $12.96 | | | | $12.55 | | | | $12.90 | | | | $12.97 | | | | $12.85 | |
Net investment income | | | 0.22 | 1 | | | 0.28 | 1 | | | 0.20 | 1 | | | 0.15 | 1 | | | 0.15 | 1 |
Net realized and unrealized gains (losses) on investments | | | 0.90 | | | | 0.41 | | | | (0.35 | ) | | | (0.01 | ) | | | 0.12 | |
| | | | | | | | | | | | | | | | | | | | |
Total from investment operations | | | 1.12 | | | | 0.69 | | | | (0.15 | ) | | | 0.14 | | | | 0.27 | |
Distributions to shareholders from | | | | | | | | | | | | | | | | | | | | |
Net investment income | | | (0.22 | ) | | | (0.28 | ) | | | (0.20 | ) | | | (0.15 | ) | | | (0.15 | ) |
Net realized gains | | | (0.03 | ) | | | 0.00 | | | | 0.00 | | | | (0.06 | ) | | | 0.00 | |
| | | | | | | | | | | | | | | | | | | | |
Total distributions to shareholders | | | (0.25 | ) | | | (0.28 | ) | | | (0.20 | ) | | | (0.21 | ) | | | (0.15 | ) |
Net asset value, end of period | | | $13.83 | | | | $12.96 | | | | $12.55 | | | | $12.90 | | | | $12.97 | |
Total return | | | 8.80 | % | | | 5.61 | % | | | (1.19 | )% | | | 1.15 | % | | | 2.13 | % |
Ratios to average net assets (annualized) | | | | | | | | | | | | | | | | | | | | |
Gross expenses2 | | | 1.05 | % | | | 1.07 | % | | | 1.08 | % | | | 1.08 | % | | | 1.08 | % |
Net expenses2 | | | 1.02 | % | | | 1.03 | % | | | 1.03 | % | | | 1.03 | % | | | 1.03 | % |
Net investment income2 | | | 1.66 | % | | | 2.25 | % | | | 1.54 | % | | | 1.18 | % | | | 1.18 | % |
Supplemental data | | | | | | | | | | | | | | | | | | | | |
Portfolio turnover rate3 | | | 603 | % | | | 577 | % | | | 542 | % | | | 614 | % | | | 667 | % |
Net assets, end of period (000s omitted) | | | $3,241 | | | | $8,565 | | | | $12,230 | | | | $13,826 | | | | $17,985 | |
| 1 | Calculated based upon average shares outstanding |
| 2 | Ratios include net expenses allocated from the affiliated Master Portfolio which were as follows: |
| | | | |
Year ended May 31, 2020 | | | 0.35 | % |
Year ended May 31, 2019 | | | 0.35 | % |
Year ended May 31, 2018 | | | 0.35 | % |
Year ended May 31, 2017 | | | 0.35 | % |
Year ended May 31, 2016 | | | 0.35 | % |
| 3 | Portfolio turnover rate is calculated by multiplying the affiliated Master Portfolio’s percentage of the Fund’s total investment in securities at the end of the period by the affiliated Master Portfolio’s portfolio turnover rate. |
The accompanying notes are an integral part of these financial statements.
Wells Fargo Core Bond Fund | 17
Financial highlights
(For a share outstanding throughout each period)
| | | | | | | | | | | | | | | | | | | | |
| | | Year ended May 31 | |
| CLASS R4 | | 2020 | | | 2019 | | | 2018 | | | 2017 | | | 2016 | |
Net asset value, beginning of period | | | $12.95 | | | | $12.55 | | | | $12.89 | | | | $12.95 | | | | $12.83 | |
Net investment income | | | 0.29 | 1 | | | 0.35 | | | | 0.26 | 1 | | | 0.22 | | | | 0.22 | |
Net realized and unrealized gains (losses) on investments | | | 0.91 | | | | 0.40 | | | | (0.34 | ) | | | 0.00 | | | | 0.12 | |
| | | | | | | | | | | | | | | | | | | | |
Total from investment operations | | | 1.20 | | | | 0.75 | | | | (0.08 | ) | | | 0.22 | | | | 0.34 | |
Distributions to shareholders from | | | | | | | | | | | | | | | | | | | | |
Net investment income | | | (0.29 | ) | | | (0.35 | ) | | | (0.26 | ) | | | (0.22 | ) | | | (0.22 | ) |
Net realized gains | | | (0.03 | ) | | | 0.00 | | | | 0.00 | | | | (0.06 | ) | | | 0.00 | |
| | | | | | | | | | | | | | | | | | | | |
Total distributions to shareholders | | | (0.32 | ) | | | (0.35 | ) | | | (0.26 | ) | | | (0.28 | ) | | | (0.22 | ) |
Net asset value, end of period | | | $13.83 | | | | $12.95 | | | | $12.55 | | | | $12.89 | | | | $12.95 | |
Total return | | | 9.34 | % | | | 6.07 | % | | | (0.61 | )% | | | 1.74 | % | | | 2.65 | % |
Ratios to average net assets (annualized) | | | | | | | | | | | | | | | | | | | | |
Gross expenses2 | | | 0.59 | % | | | 0.60 | % | | | 0.60 | % | | | 0.60 | % | | | 0.60 | % |
Net expenses2 | | | 0.52 | % | | | 0.52 | % | | | 0.52 | % | | | 0.52 | % | | | 0.52 | % |
Net investment income2 | | | 2.19 | % | | | 2.76 | % | | | 2.01 | % | | | 1.70 | % | | | 1.69 | % |
Supplemental data | | | | | | | | | | | | | | | | | | | | |
Portfolio turnover rate3 | | | 603 | % | | | 577 | % | | | 542 | % | | | 614 | % | | | 667 | % |
Net assets, end of period (000s omitted) | | | $4,549 | | | | $10,805 | | | | $11,680 | | | | $43,205 | | | | $41,272 | |
| 1 | Calculated based upon average shared outstanding |
| 2 | Ratios include net expenses allocated from the affiliated Master Portfolio which were as follows: |
| | | | |
Year ended May 31, 2020 | | | 0.35 | % |
Year ended May 31, 2019 | | | 0.35 | % |
Year ended May 31, 2018 | | | 0.35 | % |
Year ended May 31, 2017 | | | 0.35 | % |
Year ended May 31, 2016 | | | 0.35 | % |
| 3 | Portfolio turnover rate is calculated by multiplying the affiliated Master Portfolio’s percentage of the Fund’s total investments in securities at the end of the period by the affiliated Master Portfolio’s portfolio turnover rate. |
The accompanying notes are an integral part of these financial statements.
18 | Wells Fargo Core Bond Fund
Financial highlights
(For a share outstanding throughout each period)
| | | | | | | | | | | | | | | | | | | | |
| | | Year ended May 31 | |
| CLASS R6 | | 2020 | | | 2019 | | | 2018 | | | 2017 | | | 2016 | |
Net asset value, beginning of period | | | $12.95 | | | | $12.54 | | | | $12.89 | | | | $12.95 | | | | $12.83 | |
Net investment income | | | 0.30 | | | | 0.37 | | | | 0.28 | | | | 0.24 | | | | 0.24 | |
Net realized and unrealized gains (losses) on investments | | | 0.91 | | | | 0.41 | | | | (0.35 | ) | | | 0.00 | | | | 0.12 | |
| | | | | | | | | | | | | | | | | | | | |
Total from investment operations | | | 1.21 | | | | 0.78 | | | | (0.07 | ) | | | 0.24 | | | | 0.36 | |
Distributions to shareholders from | | | | | | | | | | | | | | | | | | | | |
Net investment income | | | (0.31 | ) | | | (0.37 | ) | | | (0.28 | ) | | | (0.24 | ) | | | (0.24 | ) |
Net realized gains | | | (0.03 | ) | | | 0.00 | | | | 0.00 | | | | (0.06 | ) | | | 0.00 | |
| | | | | | | | | | | | | | | | | | | | |
Total distributions to shareholders | | | (0.34 | ) | | | (0.37 | ) | | | (0.28 | ) | | | (0.30 | ) | | | (0.24 | ) |
Net asset value, end of period | | | $13.82 | | | | $12.95 | | | | $12.54 | | | | $12.89 | | | | $12.95 | |
Total return | | | 9.42 | % | | | 6.31 | % | | | (0.54 | )% | | | 1.90 | % | | | 2.81 | % |
Ratios to average net assets (annualized) | | | | | | | | | | | | | | | | | | | | |
Gross expenses1 | | | 0.44 | % | | | 0.45 | % | | | 0.45 | % | | | 0.45 | % | | | 0.45 | % |
Net expenses1 | | | 0.37 | % | | | 0.37 | % | | | 0.37 | % | | | 0.37 | % | | | 0.37 | % |
Net investment income1 | | | 2.26 | % | | | 2.92 | % | | | 2.24 | % | | | 1.87 | % | | | 1.84 | % |
Supplemental data | | | | | | | | | | | | | | | | | | | | |
Portfolio turnover rate2 | | | 603 | % | | | 577 | % | | | 542 | % | | | 614 | % | | | 667 | % |
Net assets, end of period (000s omitted) | | | $2,545,332 | | | | $2,513,644 | | | | $1,360,847 | | | | $797,896 | | | | $450,791 | |
| 1 | Ratios include net expenses allocated from the affiliated Master Portfolio which were as follows: |
| | | | |
Year ended May 31, 2020 | | | 0.35 | % |
Year ended May 31, 2019 | | | 0.35 | % |
Year ended May 31, 2018 | | | 0.35 | % |
Year ended May 31, 2017 | | | 0.35 | % |
Year ended May 31, 2016 | | | 0.35 | % |
| 2 | Portfolio turnover rate is calculated by multiplying the affiliated Master Portfolio’s percentage of the Fund’s total investments in securities at the end of the period by the affiliated Master Portfolio’s portfolio turnover rate. |
The accompanying notes are an integral part of these financial statements.
Wells Fargo Core Bond Fund | 19
Financial highlights
(For a share outstanding throughout each period)
| | | | | | | | | | | | | | | | | | | | |
| | | Year ended May 31 | |
| ADMINISTRATOR CLASS | | 2020 | | | 2019 | | | 2018 | | | 2017 | | | 2016 | |
Net asset value, beginning of period | | | $12.96 | | | | $12.56 | | | | $12.90 | | | | $12.97 | | | | $12.85 | |
Net investment income | | | 0.26 | | | | 0.33 | 1 | | | 0.24 | 1 | | | 0.21 | | | | 0.19 | |
Net realized and unrealized gains (losses) on investments | | | 0.90 | | | | 0.40 | | | | (0.34 | ) | | | (0.02 | ) | | | 0.12 | |
| | | | | | | | | | | | | | | | | | | | |
Total from investment operations | | | 1.16 | | | | 0.73 | | | | (0.10 | ) | | | 0.19 | | | | 0.31 | |
Distributions to shareholders from | | | | | | | | | | | | | | | | | | | | |
Net investment income | | | (0.26 | ) | | | (0.33 | ) | | | (0.24 | ) | | | (0.20 | ) | | | (0.19 | ) |
Net realized gains | | | (0.03 | ) | | | 0.00 | | | | 0.00 | | | | (0.06 | ) | | | 0.00 | |
| | | | | | | | | | | | | | | | | | | | |
Total distributions to shareholders | | | (0.29 | ) | | | (0.33 | ) | | | (0.24 | ) | | | (0.26 | ) | | | (0.19 | ) |
Net asset value, end of period | | | $13.83 | | | | $12.96 | | | | $12.56 | | | | $12.90 | | | | $12.97 | |
Total return | | | 9.14 | % | | | 5.87 | % | | | (0.79 | )% | | | 1.48 | % | | | 2.47 | % |
Ratios to average net assets (annualized) | | | | | | | | | | | | | | | | | | | | |
Gross expenses2 | | | 0.76 | % | | | 0.76 | % | | | 0.77 | % | | | 0.77 | % | | | 0.77 | % |
Net expenses2 | | | 0.70 | % | | | 0.70 | % | | | 0.70 | % | | | 0.70 | % | | | 0.70 | % |
Net investment income2 | | | 1.92 | % | | | 2.58 | % | | | 1.86 | % | | | 1.50 | % | | | 1.51 | % |
Supplemental data | | | | | | | | | | | | | | | | | | | | |
Portfolio turnover rate3 | | | 603 | % | | | 577 | % | | | 542 | % | | | 614 | % | | | 667 | % |
Net assets, end of period (000s omitted) | | | $218,522 | | | | $205,825 | | | | $269,057 | | | | $373,042 | | | | $529,530 | |
| 1 | Calculated based upon average shared outstanding |
| 2 | Ratios include net expenses allocated from the affiliated Master Portfolio which were as follows: |
| | | | |
Year ended May 31, 2020 | | | 0.35 | % |
Year ended May 31, 2019 | | | 0.35 | % |
Year ended May 31, 2018 | | | 0.35 | % |
Year ended May 31, 2017 | | | 0.35 | % |
Year ended May 31, 2016 | | | 0.35 | % |
| 3 | Portfolio turnover rate is calculated by multiplying the affiliated Master Portfolio’s percentage of the Fund’s total investments in securities at the end of the period by the affiliated Master Portfolio’s portfolio turnover rate. |
The accompanying notes are an integral part of these financial statements.
20 | Wells Fargo Core Bond Fund
Financial highlights
(For a share outstanding throughout each period)
| | | | | | | | | | | | | | | | | | | | |
| | | Year ended May 31 | |
| INSTITUTIONAL CLASS | | 2020 | | | 2019 | | | 2018 | | | 2017 | | | 2016 | |
Net asset value, beginning of period | | | $12.94 | | | | $12.54 | | | | $12.88 | | | | $12.95 | | | | $12.83 | |
Net investment income | | | 0.29 | | | | 0.36 | | | | 0.28 | | | | 0.23 | | | | 0.23 | |
Net realized and unrealized gains (losses) on investments | | | 0.92 | | | | 0.40 | | | | (0.34 | ) | | | (0.01 | ) | | | 0.12 | |
| | | | | | | | | | | | | | | | | | | | |
Total from investment operations | | | 1.21 | | | | 0.76 | | | | (0.06 | ) | | | 0.22 | | | | 0.35 | |
Distributions to shareholders from | | | | | | | | | | | | | | | | | | | | |
Net investment income | | | (0.30 | ) | | | (0.36 | ) | | | (0.28 | ) | | | (0.23 | ) | | | (0.23 | ) |
Net realized gains | | | (0.03 | ) | | | 0.00 | | | | 0.00 | | | | (0.06 | ) | | | 0.00 | |
| | | | | | | | | | | | | | | | | | | | |
Total distributions to shareholders | | | (0.33 | ) | | | (0.36 | ) | | | (0.28 | ) | | | (0.29 | ) | | | (0.23 | ) |
Net asset value, end of period | | | $13.82 | | | | $12.94 | | | | $12.54 | | | | $12.88 | | | | $12.95 | |
Total return | | | 9.45 | % | | | 6.18 | % | | | (0.51 | )% | | | 1.77 | % | | | 2.76 | % |
Ratios to average net assets (annualized) | | | | | | | | | | | | | | | | | | | | |
Gross expenses1 | | | 0.49 | % | | | 0.50 | % | | | 0.50 | % | | | 0.50 | % | | | 0.50 | % |
Net expenses1 | | | 0.42 | % | | | 0.42 | % | | | 0.42 | % | | | 0.42 | % | | | 0.42 | % |
Net investment income1 | | | 2.21 | % | | | 2.86 | % | | | 2.16 | % | | | 1.82 | % | | | 1.79 | % |
Supplemental data | | | | | | | | | | | | | | | | | | | | |
Portfolio turnover rate2 | | | 603 | % | | | 577 | % | | | 542 | % | | | 614 | % | | | 667 | % |
Net assets, end of period (000s omitted) | | | $2,365,421 | | | | $2,343,238 | | | | $3,318,290 | | | | $3,166,348 | | | | $2,102,073 | |
| 1 | Ratios include net expenses allocated from the affiliated Master Portfolio which were as follows: |
| | | | |
Year ended May 31, 2020 | | | 0.35 | % |
Year ended May 31, 2019 | | | 0.35 | % |
Year ended May 31, 2018 | | | 0.35 | % |
Year ended May 31, 2017 | | | 0.35 | % |
Year ended May 31, 2016 | | | 0.35 | % |
| 2 | Portfolio turnover rate is calculated by multiplying the affiliated Master Portfolio’s percentage of the Fund’s total investments in securities at the end of the period by the affiliated Master Portfolio’s portfolio turnover rate. |
The accompanying notes are an integral part of these financial statements.
Wells Fargo Core Bond Fund | 21
Notes to financial statements
1. ORGANIZATION
Wells Fargo Funds Trust (the “Trust”), a Delaware statutory trust organized on March 10, 1999, is an open-end management investment company registered under the Investment Company Act of 1940, as amended (the “1940 Act”). As an investment company, the Trust follows the accounting and reporting guidance in Financial Accounting Standards Board (“FASB”) Accounting Standards Codification Topic 946, Financial Services – Investment Companies. These financial statements report on the Wells Fargo Core Bond Fund (the “Fund”) which is a diversified series of the Trust.
The Fund is a feeder fund in a master-feeder structure that invests substantially all of its assets in a single master portfolio with a substantially identical investment objective and substantially similar investment strategies. The Fund invests in Wells Fargo Core Bond Portfolio (the “affiliated Master Portfolio”) which is a separate diversified portfolio of Wells Fargo Master Trust, a registered open-end management investment company. As of May 31, 2020, the Fund owned 95% of Wells Fargo Core Bond Portfolio. The affiliated Master Portfolio directly acquires portfolio securities and the Fund acquires an indirect interest in those securities. The Fund accounts for its investment in the affiliated Master Portfolio as a partnership investment and records on a daily basis its share of the affiliated Master Portfolio’s income, expense and realized and unrealized gains and losses. The financial statements of the affiliated Master Portfolio for the year ended May 31, 2020 are included in this report and should be read in conjunction with the Fund’s financial statements.
2. SIGNIFICANT ACCOUNTING POLICIES
The following significant accounting policies, which are consistently followed in the preparation of the financial statements of the Fund, are in conformity with U.S. generally accepted accounting principles which require management to make estimates and assumptions that affect the reported amounts of assets and liabilities, disclosure of contingent assets and liabilities at the date of the financial statements, and the reported amounts of revenues and expenses during the reporting period. Actual results could differ from those estimates.
Securities valuation
All investments are valued each business day as of the close of regular trading on the New York Stock Exchange (generally 4 p.m. Eastern Time), although the Fund may deviate from this calculation time under unusual or unexpected circumstances.
Investments in the affiliated Master Portfolio are valued daily based on the Fund’s proportionate share of the affiliated Master Portfolio’s net assets, which are also valued daily. Securities held in the affiliated Master Portfolio are valued as discussed in the Notes to Financial Statements of the affiliated Master Portfolio, which are included elsewhere in this report.
Investments which are not valued using the method discussed above are valued at their fair value, as determined in good faith by the Board of Trustees of the Fund. The Board of Trustees has established a Valuation Committee comprised of the Trustees and has delegated to it the authority to take any actions regarding the valuation of portfolio securities that the Valuation Committee deems necessary or appropriate, including determining the fair value of portfolio securities, unless the determination has been delegated to the Wells Fargo Asset Management Pricing Committee at Wells Fargo Funds Management, LLC (“Funds Management”). The Board of Trustees retains the authority to make or ratify any valuation decisions or approve any changes to the Valuation Procedures as it deems appropriate. On a quarterly basis, the Board of Trustees receives reports on any valuation actions taken by the Valuation Committee or the Wells Fargo Asset Management Pricing Committee which may include items for ratification.
Investment transactions, income and expenses
Investments in the affiliated Master Portfolio are recorded on a trade basis. The Fund records daily its proportionate share of the affiliated Master Portfolio’s income, expenses and realized and unrealized gains or losses. The Fund also accrues its own expenses.
Distributions to shareholders
Distributions to shareholders from net investment income are declared daily and paid monthly. Distributions from net realized gains, if any, are recorded on the ex-dividend date and paid at least annually. Such distributions are determined in accordance with income tax regulations and may differ from U.S. generally accepted accounting principles. Dividend sources are estimated at the time of declaration. The tax character of distributions is determined as of the Fund’s fiscal year end. Therefore, a portion of the Fund’s distributions made prior to the Fund’s fiscal year end may be categorized as a tax return of capital at year end.
Federal and other taxes
The Fund intends to continue to qualify as a regulated investment company by distributing substantially all of its investment company taxable income and any net realized capital gains (after reduction for capital loss carryforwards) sufficient to relieve it from all, or substantially all, federal income taxes. Accordingly, no provision for federal income taxes was required.
The Fund’s income and federal excise tax returns and all financial records supporting those returns for the prior three fiscal years are subject to examination by the federal and Delaware revenue authorities. Management has analyzed the Fund’s tax positions taken on federal, state, and foreign tax returns for all open tax years and does not believe that there are any uncertain tax positions that require recognition of a tax liability.
22 | Wells Fargo Core Bond Fund
Notes to financial statements
As of May 31, 2020, the aggregate cost of all investments for federal income tax purposes was $5,292,759,425 and the unrealized gains (losses) consisted of:
| | | | |
| |
Gross unrealized gains | | $ | 173,913,308 | |
| |
Gross unrealized losses | | | (2,102,557 | ) |
| |
Net unrealized gains | | $ | 171,810,751 | |
Class allocations
The separate classes of shares offered by the Fund differ principally in applicable sales charges, distribution, shareholder servicing, and administration fees. Class specific expenses are charged directly to that share class. Investment income, common fund-level expenses, and realized and unrealized gains (losses) on investments are allocated daily to each class of shares based on the relative proportion of net assets of each class.
3. FAIR VALUATION MEASUREMENTS
At May 31, 2020, the affiliated Master Portfolio was measured at fair value using the net asset value per share (or its equivalent) as a practical expedient. The investment objective and the value of the affiliate Master Portfolio was as follows:
| | | | |
| | |
| Affiliated Master Portfolio | | Investment objective | | Value of affiliated
Master Portfolio |
| | |
Wells Fargo Core Bond Portfolio | | Seeks total return, consisting of income and capital appreciation | | $5,464,570,176 |
The affiliated Master Portfolio does not have a redemption period notice, can be redeemed daily and does not have any unfunded commitments.
4. TRANSACTIONS WITH AFFILIATES
Management fee
Funds Management, an indirect wholly owned subsidiary of Wells Fargo & Company (“Wells Fargo”), is the manager of the Fund and provides advisory and fund-level administrative services under an investment management agreement. Under the investment management agreement, Funds Management is responsible for, among other services, implementing the investment objectives and strategies of the Fund and providing fund-level administrative services in connection with the Fund’s operations. As long as the Fund continues to invest substantially all of its assets in a single affiliated Master Portfolio, the Fund pays Funds Management an investment management fee only for fund-level administrative services at the following annual rate based on the Fund’s average daily net assets:
| | |
| |
| Average daily net assets | | Management fee |
| |
First $5 billion | | 0.05% |
| |
Next $5 billion | | 0.04 |
| |
Over $10 billion | | 0.03 |
For the year ended May 31, 2020, the management fee was equivalent to an annual rate of 0.05% of the Fund’s average daily net assets.
Funds Management also serves as the adviser to the affiliated Master Portfolio and is entitled to receive a fee from the affiliated Master Portfolio for those services.
Administration fees
Under a class-level administration agreement, Funds Management provides class-level administrative services to the Fund, which includes paying fees and expenses for services provided by the transfer agent, sub-transfer agents, omnibus account servicers and record-keepers. As compensation for its services under the class-level administration agreement, Funds Management receives an annual fee which is calculated based on the average daily net assets of each class as follows:
| | | | |
| |
| | | Class-level
administration fee | |
| |
Class A, Class C, Class R | | | 0.16 | % |
| |
Class R4, Institutional Class | | | 0.08 | |
| |
Class R6 | | | 0.03 | |
| |
Administrator Class | | | 0.10 | |
Wells Fargo Core Bond Fund | 23
Notes to financial statements
Waivers and/or expense reimbursements
Funds Management has contractually waived and/or reimbursed management and administration fees to the extent necessary to maintain certain net operating expense ratios for the Fund. When each class of the Fund has exceeded its expense cap, Funds Management has waived fees and/or reimbursed expenses from fund-level expenses on a proportionate basis and then from class specific expenses. When only certain classes exceed their expense caps, waivers and/or reimbursements are applied against class specific expenses before fund-level expenses. Net expenses from the affiliated Master Portfolio are included in the expense caps. Funds Management has committed through September 30, 2020 to waive fees and/or reimburse expenses to the extent necessary to cap the Fund’s expenses at 0.78% for Class A shares, 1.53% for Class C shares, 1.03% for Class R shares, 0.52% for Class R4 shares, 0.37% for Class R6 shares, 0.70% for Administrator shares, and 0.42% for Institutional Class shares. Prior to or after the commitment expiration date, the cap may be increased or the commitment to maintain the cap may be terminated only with the approval of the Board of Trustees.
Distribution fees
The Trust has adopted a distribution plan for Class C and Class R shares of the Fund pursuant to Rule 12b-1 under the 1940 Act. Distribution fees are charged to Class C and Class R shares and paid to Wells Fargo Funds Distributor, LLC (“Funds Distributor”), the principal underwriter, at an annual rate of 0.75% of the average daily net assets of Class C shares and 0.25% of the average daily net assets of Class R shares.
In addition, Funds Distributor is entitled to receive the front-end sales charge from the purchase of Class A shares and a contingent deferred sales charge on the redemption of certain Class A shares. Funds Distributor is also entitled to receive the contingent deferred sales charges from redemptions of Class C shares. For the year ended May 31, 2020, Funds Distributor received $6,639 from the sale of Class A shares. Funds Distributor did not receive any front-end or contingent deferred sales charges from Class A or Class C shares for the year ended May 31, 2020.
Shareholder servicing fees
The Trust has entered into contracts with one or more shareholder servicing agents, whereby Class A, Class C, Class R, and Administrator Class of the Fund are charged a fee at an annual rate of 0.25% of the average daily net assets of each respective class. Class R4 is charged a fee at an annual rate of 0.10% of its average daily net assets. A portion of these total shareholder servicing fees were paid to affiliates of Wells Fargo.
5. INVESTMENT PORTFOLIO TRANSACTIONS
The Fund seeks to achieve its investment objective by investing substantially all of its assets in a single affiliated Master Portfolio. Purchases and sales have been calculated by multiplying the Fund’s ownership percentage of the affiliated Master Portfolio by the affiliated Master Portfolio’s purchases and sales. Purchases and sales of investments, excluding short-term securities, for the year ended May 31, 2020 were as follows:
| | | | | | |
Purchases at cost | | Sales proceeds |
U.S. government | | Non-U.S.
government | | U.S.
government | | Non-U.S.
government |
| $30,266,635,350 | | $4,721,160,764 | | $30,561,071,517 | | $4,372,505,023 |
6. BANK BORROWINGS
The Trust (excluding the money market funds), Wells Fargo Master Trust and Wells Fargo Variable Trust are parties to a $280,000,000 revolving credit agreement whereby the Fund is permitted to use bank borrowings for temporary or emergency purposes, such as to fund shareholder redemption requests. Interest under the credit agreement is charged to the Fund based on a borrowing rate equal to the higher of the Federal Funds rate in effect on that day plus 1.25% or the overnight LIBOR rate in effect on that day plus 1.25%. In addition, an annual commitment fee equal to 0.25% of the unused balance is allocated to each participating fund.
For the year ended May 31, 2020, there were no borrowings by the Fund under the agreement.
7. DISTRIBUTIONS TO SHAREHOLDERS
The tax character of distributions paid was $134,482,005 and $149,561,391 of ordinary income for the years ended May 31, 2020 and May 31, 2019, respectively.
24 | Wells Fargo Core Bond Fund
Notes to financial statements
As of May 31, 2020, the components of distributable earnings on a tax basis were as follows:
| | |
Undistributed ordinary income | | Unrealized gains |
| |
| $162,497,605 | | $171,810,751 |
8. INDEMNIFICATION
Under the Fund’s organizational documents, the officers and Trustees have been granted certain indemnification rights against certain liabilities that may arise out of performance of their duties to the Fund. The Fund has entered into a separate agreement with each Trustee that converts indemnification rights currently existing under the Fund’s organizational documents into contractual rights that cannot be changed in the future without the consent of the Trustee. Additionally, in the normal course of business, the Fund may enter into contracts with service providers that contain a variety of indemnification clauses. The Fund’s maximum exposure under these arrangements is dependent on future claims that may be made against the Fund and, therefore, cannot be estimated.
9. NEW ACCOUNTING PRONOUNCEMENT
In August 2018, FASB issued Accounting Standards Update (“ASU”) No. 2018-13, Fair Value Measurement (Topic 820) Disclosure Framework—Changes to the Disclosure Requirements for Fair Value Measurement. ASU 2018-13 updates the disclosure requirements for fair value measurements by modifying or removing certain disclosures and adding certain new disclosures. The amendments are effective for fiscal years, and interim periods within those fiscal years, beginning after December 15, 2019. Early adoption is permitted. Management has adopted the removal and modification of disclosures early, as permitted, and will adopt the additional new disclosures at the effective date.
10. CORONAVIRUS (COVID-19) PANDEMIC
On March 11, 2020, the World Health Organization announced that it had made the assessment that coronavirus disease 2019 (“COVID-19”) is a pandemic. The impacts of COVID-19 are adversely affecting the entire global economy, individual companies and investment products, and the market in general. There is significant uncertainty around the extent and duration of business disruptions related to COVID-19 and the impacts may be short term or may last for an extended period of time. The risk of further spreading of COVID-19 has led to significant uncertainty and volatility in the financial markets. The value of the Fund and the Master Portfolio in which the Fund invests have generally been adversely affected by impacts caused by COVID-19.
Wells Fargo Core Bond Fund | 25
Report of independent registered public accounting firm
TO THE SHAREHOLDERS OF THE FUND AND BOARD OF TRUSTEES WELLS FARGO FUNDS TRUST:
Opinion on the Financial Statements
We have audited the accompanying statement of assets and liabilities of Wells Fargo Core Bond Fund (the Fund), one of the funds constituting Wells Fargo Funds Trust, including the portfolio of investments, as of May 31, 2020, the related statement of operations for the year then ended, the statements of changes in net assets for each of the years in the two-year period then ended, and the related notes (collectively, the financial statements) and the financial highlights for each of the years in the five-year period then ended. In our opinion, the financial statements and financial highlights present fairly, in all material respects, the financial position of the Fund as of May 31, 2020, the results of its operations for the year then ended, the changes in its net assets for each of the years in the two-year period then ended, and the financial highlights for each of the years in the five-year period then ended, in conformity with U.S. generally accepted accounting principles.
Basis for Opinion
These financial statements and financial highlights are the responsibility of the Fund’s management. Our responsibility is to express an opinion on these financial statements and financial highlights based on our audits. We are a public accounting firm registered with the Public Company Accounting Oversight Board (United States) (PCAOB) and are required to be independent with respect to the Fund in accordance with the U.S. federal securities laws and the applicable rules and regulations of the Securities and Exchange Commission and the PCAOB.
We conducted our audits in accordance with the standards of the PCAOB. Those standards require that we plan and perform the audit to obtain reasonable assurance about whether the financial statements and financial highlights are free of material misstatement, whether due to error or fraud. Our audits included performing procedures to assess the risks of material misstatement of the financial statements and financial highlights, whether due to error or fraud, and performing procedures that respond to those risks. Such procedures included examining, on a test basis, evidence regarding the amounts and disclosures in the financial statements and financial highlights. Such procedures also included confirmation of securities owned as of May 31, 2020, by correspondence with the transfer agent. Our audits also included evaluating the accounting principles used and significant estimates made by management, as well as evaluating the overall presentation of the financial statements and financial highlights. We believe that our audits provide a reasonable basis for our opinion.

We have not been able to determine the specific year that we began serving as the auditor of one or more Wells Fargo Funds investment companies; however we are aware that we have served as the auditor of one or more Wells Fargo Funds investment companies since at least 1955.
Boston, Massachusetts
July 29, 2020
26 | Wells Fargo Core Bond Fund
Portfolio of investments—May 31, 2020
| | | | | | | | | | | | | | | | |
| | | Interest
rate | | | Maturity
date | | | Principal | | | Value | |
| Agency Securities: 44.32% | |
FHLMC (1 Month LIBOR +0.35%) ± | | | 0.53 | % | | | 12-15-2048 | | | $ | 1,725,364 | | | $ | 1,722,933 | |
FHLMC | | | 1.75 | | | | 5-15-2043 | | | | 3,736,211 | | | | 3,840,690 | |
FHLMC | | | 2.50 | | | | 5-1-2031 | | | | 476,664 | | | | 502,883 | |
FHLMC | | | 2.50 | | | | 3-1-2050 | | | | 2,681,133 | | | | 2,828,779 | |
FHLMC (1 Month LIBOR +0.35%) ± | | | 2.85 | | | | 10-15-2037 | | | | 5,385,399 | | | | 5,359,619 | |
FHLMC | | | 3.00 | | | | 10-15-2047 | | | | 16,608,664 | | | | 17,585,984 | |
FHLMC | | | 3.00 | | | | 12-1-2049 | | | | 1,149,663 | | | | 1,237,732 | |
FHLMC | | | 3.00 | | | | 12-1-2049 | | | | 990,149 | | | | 1,065,996 | |
FHLMC | | | 3.00 | | | | 2-1-2050 | | | | 1,008,354 | | | | 1,079,165 | |
FHLMC | | | 3.00 | | | | 2-1-2050 | | | | 7,552,351 | | | | 8,105,587 | |
FHLMC | | | 3.00 | | | | 5-15-2050 | | | | 7,174,261 | | | | 7,674,031 | |
FHLMC | | | 3.50 | | | | 2-1-2048 | | | | 3,004,111 | | | | 3,282,419 | |
FHLMC | | | 3.50 | | | | 3-1-2048 | | | | 5,528 | | | | 6,014 | |
FHLMC | | | 3.50 | | | | 4-1-2049 | | | | 6,128,491 | | | | 6,694,056 | |
FHLMC | | | 3.50 | | | | 8-1-2049 | | | | 5,580,317 | | | | 6,095,339 | |
FHLMC | | | 3.50 | | | | 11-1-2049 | | | | 18,994,574 | | | | 20,093,692 | |
FHLMC | | | 3.50 | | | | 1-1-2050 | | | | 426,809 | | | | 464,476 | |
FHLMC | | | 4.00 | | | | 1-1-2035 | | | | 198,395 | | | | 218,860 | |
FHLMC | | | 4.00 | | | | 1-1-2036 | | | | 276,930 | | | | 299,752 | |
FHLMC | | | 4.00 | | | | 10-1-2036 | | | | 1,984,819 | | | | 2,145,947 | |
FHLMC | | | 4.00 | | | | 3-1-2037 | | | | 238,556 | | | | 260,748 | |
FHLMC | | | 4.00 | | | | 3-1-2037 | | | | 274,719 | | | | 302,942 | |
FHLMC | | | 4.00 | | | | 3-1-2037 | | | | 450,969 | | | | 488,006 | |
FHLMC | | | 4.00 | | | | 4-1-2037 | | | | 2,026,680 | | | | 2,193,124 | |
FHLMC | | | 4.00 | | | | 4-1-2037 | | | | 2,442,367 | | | | 2,669,438 | |
FHLMC | | | 4.00 | | | | 8-1-2038 | | | | 17,835,474 | | | | 19,159,931 | |
FHLMC | | | 4.00 | | | | 4-1-2047 | | | | 19,925,493 | | | | 21,879,687 | |
FHLMC | | | 4.00 | | | | 1-1-2048 | | | | 1,687,783 | | | | 1,886,631 | |
FHLMC | | | 4.00 | | | | 6-1-2048 | | | | 3,115,758 | | | | 3,379,252 | |
FHLMC | | | 4.00 | | | | 7-1-2048 | | | | 17,831,604 | | | | 19,583,598 | |
FHLMC | | | 4.00 | | | | 9-1-2048 | | | | 1,892,718 | | | | 2,076,929 | |
FHLMC | | | 4.00 | | | | 11-1-2048 | | | | 14,784,404 | | | | 16,227,620 | |
FHLMC | | | 4.00 | | | | 1-1-2049 | | | | 8,274,826 | | | | 9,032,493 | |
FHLMC | | | 4.00 | | | | 2-1-2049 | | | | 7,867,435 | | | | 8,595,596 | |
FHLMC | | | 4.00 | | | | 2-1-2049 | | | | 3,833,754 | | | | 4,207,484 | |
FHLMC | | | 4.00 | | | | 3-1-2049 | | | | 4,270,360 | | | | 4,733,748 | |
FHLMC | | | 4.00 | | | | 7-1-2049 | | | | 17,266,599 | | | | 19,206,457 | |
FHLMC | | | 4.00 | | | | 7-1-2049 | | | | 59,868,788 | | | | 65,694,215 | |
FHLMC | | | 4.00 | | | | 9-1-2049 | | | | 751,400 | | | | 824,507 | |
FHLMC | | | 4.00 | | | | 11-1-2049 | | | | 9,519,063 | | | | 10,644,217 | |
FHLMC | | | 4.50 | | | | 6-1-2039 | | | | 223,328 | | | | 257,082 | |
FHLMC | | | 4.50 | | | | 7-1-2039 | | | | 270,074 | | | | 314,901 | |
FHLMC | | | 4.50 | | | | 11-1-2048 | | | | 8,267,862 | | | | 9,315,742 | |
FHLMC | | | 4.50 | | | | 3-1-2049 | | | | 3,159,894 | | | | 3,556,108 | |
FHLMC | | | 4.50 | | | | 4-1-2049 | | | | 32,457,272 | | | | 35,704,957 | |
FHLMC | | | 4.50 | | | | 8-1-2049 | | | | 28,479,485 | | | | 31,681,425 | |
FHLMC | | | 5.00 | | | | 5-1-2048 | | | | 9,807,911 | | | | 11,216,908 | |
FHLMC | | | 5.00 | | | | 9-1-2048 | | | | 6,719,709 | | | | 7,387,630 | |
FHLMC | | | 5.00 | | | | 3-1-2049 | | | | 19,405,516 | | | | 21,879,080 | |
FHLMC | | | 6.50 | | | | 4-1-2021 | | | | 98 | | | | 99 | |
FHLMC Series 1897 Class K | | | 7.00 | | | | 9-15-2026 | | | | 342 | | | | 381 | |
FHLMC Series 264 Class 30 | | | 3.00 | | | | 7-15-2042 | | | | 14,538,028 | | | | 15,708,242 | |
FHLMC Series 4426 Class QC | | | 1.75 | | | | 7-15-2037 | | | | 6,124,342 | | | | 6,313,300 | |
FHLMC Series 4705 Class A | | | 4.50 | | | | 9-15-2042 | | | | 4,481,331 | | | | 4,649,925 | |
FHLMC Series 4763 Class CA | | | 3.00 | | | | 9-15-2038 | | | | 1,571,759 | | | | 1,690,216 | |
The accompanying notes are an integral part of these financial statements.
Wells Fargo Core Bond Portfolio | 27
Portfolio of investments—May 31, 2020
| | | | | | | | | | | | | | | | |
| | | Interest
rate | | | Maturity
date | | | Principal | | | Value | |
| Agency Securities (continued) | |
FHLMC Series 4767 Class KA | | | 3.00 | % | | | 3-15-2048 | | | $ | 4,033,350 | | | $ | 4,357,037 | |
FHLMC Series 4786 Class DP | | | 4.50 | | | | 7-15-2042 | | | | 2,459,348 | | | | 2,492,142 | |
FNMA | | | 1.50 | | | | 1-25-2043 | | | | 11,650,017 | | | | 11,867,964 | |
FNMA | | | 1.50 | | | | 1-25-2043 | | | | 4,812,442 | | | | 4,952,864 | |
FNMA | | | 1.50 | | | | 4-25-2043 | | | | 1,478,884 | | | | 1,506,069 | |
FNMA | | | 1.70 | | | | 8-25-2033 | | | | 14,984,477 | | | | 15,497,731 | |
FNMA | | | 1.75 | | | | 5-25-2043 | | | | 5,233,731 | | | | 5,424,422 | |
FNMA | | | 1.75 | | | | 6-25-2046 | | | | 27,802,970 | | | | 28,648,972 | |
FNMA %% | | | 2.00 | | | | 6-17-2035 | | | | 21,600,000 | | | | 22,285,125 | |
FNMA %% | | | 2.00 | | | | 7-16-2035 | | | | 37,800,000 | | | | 38,936,901 | |
FNMA | | | 2.00 | | | | 6-25-2038 | | | | 19,780,464 | | | | 20,434,986 | |
FNMA | | | 2.50 | | | | 11-1-2028 | | | | 1,791,637 | | | | 1,879,537 | |
FNMA | | | 2.50 | | | | 1-1-2030 | | | | 1,358,293 | | | | 1,424,994 | |
FNMA | | | 2.50 | | | | 4-1-2030 | | | | 839,452 | | | | 880,691 | |
FNMA | | | 2.50 | | | | 8-1-2031 | | | | 4,289,066 | | | | 4,495,782 | |
FNMA %% | | | 2.50 | | | | 7-16-2035 | | | | 2,900,000 | | | | 3,030,043 | |
FNMA | | | 2.50 | | | | 11-25-2044 | | | | 3,438,333 | | | | 3,654,135 | |
FNMA | | | 2.50 | | | | 5-1-2050 | | | | 39,408,087 | | | | 40,870,906 | |
FNMA %% | | | 2.50 | | | | 6-11-2050 | | | | 158,300,000 | | | | 164,211,516 | |
FNMA %% | | | 2.50 | | | | 7-14-2050 | | | | 104,700,000 | | | | 108,363,720 | |
FNMA %% | | | 2.50 | | | | 8-13-2050 | | | | 150,900,000 | | | | 155,901,410 | |
FNMA (12 Month LIBOR +1.59%) ± | | | 2.66 | | | | 1-1-2046 | | | | 16,448,923 | | | | 17,002,407 | |
FNMA (12 Month LIBOR +1.58%) ± | | | 2.75 | | | | 6-1-2045 | | | | 4,553,751 | | | | 4,718,513 | |
FNMA | | | 3.00 | | | | 12-1-2034 | | | | 6,006,988 | | | | 6,374,188 | |
FNMA | | | 3.00 | | | | 3-1-2035 | | | | 27,751 | | | | 29,694 | |
FNMA | | | 3.00 | | | | 1-1-2043 | | | | 7,468,723 | | | | 7,961,961 | |
FNMA | | | 3.00 | | | | 11-25-2043 | | | | 3,820,757 | | | | 3,950,307 | |
FNMA | | | 3.00 | | | | 5-25-2048 | | | | 9,287,506 | | | | 9,914,738 | |
FNMA | | | 3.00 | | | | 7-25-2049 | | | | 6,900,175 | | | | 7,386,221 | |
FNMA | | | 3.00 | | | | 7-25-2049 | | | | 4,937,760 | | | | 5,188,888 | |
FNMA | | | 3.00 | | | | 2-1-2050 | | | | 854,404 | | | | 914,284 | |
FNMA %% | | | 3.00 | | | | 7-14-2050 | | | | 42,300,000 | | | | 44,397,948 | |
FNMA | | | 3.50 | | | | 6-1-2049 | | | | 2,287,296 | | | | 2,432,638 | |
FNMA | | | 3.50 | | | | 11-1-2049 | | | | 21,007,088 | | | | 22,222,660 | |
FNMA | | | 3.50 | | | | 3-1-2050 | | | | 230,149 | | | | 253,641 | |
FNMA | | | 4.00 | | | | 7-1-2033 | | | | 2,573,181 | | | | 2,738,840 | |
FNMA | | | 4.00 | | | | 9-1-2033 | | | | 4,351,370 | | | | 4,622,494 | |
FNMA | | | 4.00 | | | | 12-1-2036 | | | | 322,278 | | | | 348,520 | |
FNMA | | | 4.00 | | | | 10-1-2037 | | | | 2,371,949 | | | | 2,561,666 | |
FNMA | | | 4.00 | | | | 5-1-2038 | | | | 792,981 | | | | 849,699 | |
FNMA | | | 4.00 | | | | 2-1-2042 | | | | 3,310,091 | | | | 3,658,510 | |
FNMA | | | 4.00 | | | | 9-1-2045 | | | | 1,200,018 | | | | 1,361,848 | |
FNMA | | | 4.00 | | | | 1-1-2046 | | | | 7,991,365 | | | | 9,067,702 | |
FNMA | | | 4.00 | | | | 10-1-2046 | | | | 623,359 | | | | 676,184 | |
FNMA | | | 4.00 | | | | 12-1-2046 | | | | 843,596 | | | | 915,212 | |
FNMA | | | 4.00 | | | | 1-1-2047 | | | | 5,803,959 | | | | 6,261,009 | |
FNMA | | | 4.00 | | | | 2-1-2047 | | | | 6,047,323 | | | | 6,765,356 | |
FNMA | | | 4.00 | | | | 4-1-2047 | | | | 720,520 | | | | 817,233 | |
FNMA | | | 4.00 | | | | 4-1-2047 | | | | 779,865 | | | | 836,365 | |
FNMA | | | 4.00 | | | | 4-1-2047 | | | | 939,201 | | | | 1,028,767 | |
FNMA | | | 4.00 | | | | 9-1-2047 | | | | 3,135,899 | | | | 3,389,291 | |
FNMA | | | 4.00 | | | | 10-1-2047 | | | | 719,365 | | | | 815,933 | |
FNMA | | | 4.00 | | | | 10-1-2047 | | | | 729,254 | | | | 820,505 | |
FNMA | | | 4.00 | | | | 10-1-2047 | | | | 2,450,875 | | | | 2,649,289 | |
FNMA | | | 4.00 | | | | 11-1-2047 | | | | 23,649,342 | | | | 25,265,226 | |
FNMA | | | 4.00 | | | | 11-1-2047 | | | | 381,894 | | | | 412,472 | |
The accompanying notes are an integral part of these financial statements.
28 | Wells Fargo Core Bond Portfolio
Portfolio of investments—May 31, 2020
| | | | | | | | | | | | | | | | |
| | | Interest
rate | | | Maturity
date | | | Principal | | | Value | |
| Agency Securities (continued) | |
FNMA | | | 4.00 | % | | | 11-1-2047 | | | $ | 785,291 | | | $ | 849,102 | |
FNMA | | | 4.00 | | | | 2-1-2048 | | | | 4,110,149 | | | | 4,594,396 | |
FNMA | | | 4.00 | | | | 3-1-2048 | | | | 19,206,111 | | | | 21,763,846 | |
FNMA | | | 4.00 | | | | 4-1-2048 | | | | 15,307,331 | | | | 17,032,384 | |
FNMA | | | 4.00 | | | | 6-1-2048 | | | | 9,526,476 | | | | 10,712,574 | |
FNMA | | | 4.00 | | | | 7-1-2048 | | | | 28,039,944 | | | | 30,598,402 | |
FNMA | | | 4.00 | | | | 9-1-2048 | | | | 7,755,203 | | | | 8,594,251 | |
FNMA | | | 4.00 | | | | 10-1-2048 | | | | 6,671,352 | | | | 7,306,925 | |
FNMA | | | 4.00 | | | | 11-1-2048 | | | | 6,721,738 | | | | 7,448,953 | |
FNMA | | | 4.00 | | | | 12-1-2048 | | | | 4,108,952 | | | | 4,656,217 | |
FNMA | | | 4.00 | | | | 1-1-2049 | | | | 7,959,453 | | | | 8,823,265 | |
FNMA | | | 4.00 | | | | 2-1-2049 | | | | 7,611,101 | | | | 8,524,032 | |
FNMA | | | 4.00 | | | | 3-1-2049 | | | | 3,081,920 | | | | 3,346,692 | |
FNMA | | | 4.00 | | | | 4-1-2049 | | | | 4,182,963 | | | | 4,546,549 | |
FNMA | | | 4.00 | | | | 4-1-2049 | | | | 340,755 | | | | 381,514 | |
FNMA | | | 4.00 | | | | 5-1-2049 | | | | 479,766 | | | | 521,044 | |
FNMA | | | 4.00 | | | | 5-1-2049 | | | | 421,833 | | | | 460,410 | |
FNMA | | | 4.00 | | | | 5-1-2049 | | | | 3,943,748 | | | | 4,274,634 | |
FNMA | | | 4.00 | | | | 5-1-2049 | | | | 4,343,637 | | | | 4,884,591 | |
FNMA | | | 4.00 | | | | 5-1-2049 | | | | 13,669,868 | | | | 15,447,272 | |
FNMA | | | 4.00 | | | | 6-1-2049 | | | | 4,208,082 | | | | 4,577,266 | |
FNMA | | | 4.00 | | | | 6-1-2049 | | | | 2,157,702 | | | | 2,332,479 | |
FNMA | | | 4.00 | | | | 7-1-2049 | | | | 614,948 | | | | 682,558 | |
FNMA | | | 4.00 | | | | 7-1-2049 | | | | 219,034 | | | | 240,412 | |
FNMA | | | 4.00 | | | | 11-1-2049 | | | | 5,417,379 | | | | 6,057,706 | |
FNMA | | | 4.00 | | | | 12-1-2049 | | | | 1,320,419 | | | | 1,463,735 | |
FNMA | | | 4.00 | | | | 12-1-2049 | | | | 7,642,605 | | | | 8,663,726 | |
FNMA | | | 4.00 | | | | 12-1-2049 | | | | 5,750,788 | | | | 6,466,997 | |
FNMA | | | 4.00 | | | | 12-1-2049 | | | | 4,859,774 | | | | 5,434,108 | |
FNMA | | | 4.00 | | | | 1-1-2050 | | | | 10,738,852 | | | | 11,904,349 | |
FNMA | | | 4.00 | | | | 1-1-2050 | | | | 56,685,150 | | | | 61,638,703 | |
FNMA | | | 4.00 | | | | 3-1-2050 | | | | 22,018,244 | | | | 24,507,491 | |
FNMA | | | 4.00 | | | | 4-1-2050 | | | | 7,110,879 | | | | 8,060,980 | |
FNMA | | | 4.00 | | | | 1-1-2059 | | | | 22,828,814 | | | | 25,386,200 | |
FNMA | | | 4.50 | | | | 5-1-2034 | | | | 1,446,477 | | | | 1,600,004 | |
FNMA | | | 4.50 | | | | 6-1-2041 | | | | 299,206 | | | | 336,355 | |
FNMA | | | 4.50 | | | | 3-1-2043 | | | | 3,284,555 | | | | 3,691,005 | |
FNMA | | | 4.50 | | | | 3-1-2044 | | | | 1,049,129 | | | | 1,179,115 | |
FNMA | | | 4.50 | | | | 10-1-2045 | | | | 5,131,691 | | | | 5,767,534 | |
FNMA | | | 4.50 | | | | 2-1-2046 | | | | 134,255 | | | | 150,469 | |
FNMA | | | 4.50 | | | | 2-1-2048 | | | | 6,215,655 | | | | 6,895,911 | |
FNMA | | | 4.50 | | | | 3-1-2048 | | | | 1,989,602 | | | | 2,203,115 | |
FNMA | | | 4.50 | | | | 4-1-2048 | | | | 3,882,460 | | | | 4,296,352 | |
FNMA | | | 4.50 | | | | 5-1-2048 | | | | 2,541,936 | | | | 2,814,738 | |
FNMA | | | 4.50 | | | | 6-1-2048 | | | | 2,137,348 | | | | 2,469,740 | |
FNMA | | | 4.50 | | | | 7-1-2048 | | | | 6,293,885 | | | | 7,010,605 | |
FNMA | | | 4.50 | | | | 8-1-2048 | | | | 11,930,354 | | | | 13,507,277 | |
FNMA | | | 4.50 | | | | 10-1-2048 | | | | 2,678,147 | | | | 2,964,817 | |
FNMA | | | 4.50 | | | | 10-1-2048 | | | | 10,662,978 | | | | 11,994,872 | |
FNMA | | | 4.50 | | | | 10-1-2048 | | | | 16,346,719 | | | | 18,334,049 | |
FNMA | | | 4.50 | | | | 11-1-2048 | | | | 3,123,995 | | | | 3,602,237 | |
FNMA | | | 4.50 | | | | 1-1-2049 | | | | 19,035,523 | | | | 21,501,376 | |
FNMA | | | 4.50 | | | | 2-1-2049 | | | | 10,929,725 | | | | 12,370,377 | |
FNMA | | | 4.50 | | | | 3-1-2049 | | | | 3,999,250 | | | | 4,435,762 | |
FNMA | | | 4.50 | | | | 4-1-2049 | | | | 3,498,216 | | | | 3,871,606 | |
FNMA | | | 4.50 | | | | 5-1-2049 | | | | 1,609,356 | | | | 1,781,131 | |
The accompanying notes are an integral part of these financial statements.
Wells Fargo Core Bond Portfolio | 29
Portfolio of investments—May 31, 2020
| | | | | | | | | | | | | | | | |
| | | Interest
rate | | | Maturity
date | | | Principal | | | Value | |
| Agency Securities (continued) | |
FNMA | | | 4.50 | % | | | 6-1-2049 | | | $ | 8,164,880 | | | $ | 9,241,140 | |
FNMA | | | 4.50 | | | | 7-1-2049 | | | | 7,878,683 | | | | 8,917,244 | |
FNMA | | | 4.50 | | | | 7-1-2049 | | | | 12,396,984 | | | | 13,959,976 | |
FNMA | | | 4.50 | | | | 8-1-2049 | | | | 7,448,380 | | | | 8,430,192 | |
FNMA | | | 4.50 | | | | 3-1-2050 | | | | 7,944,797 | | | | 8,992,056 | |
FNMA | | | 4.50 | | | | 3-1-2050 | | | | 14,208,160 | | | | 15,999,435 | |
FNMA | | | 4.50 | | | | 4-1-2050 | | | | 2,603,994 | | | | 2,970,093 | |
FNMA | | | 4.50 | | | | 4-1-2050 | | | | 4,161,754 | | | | 4,807,214 | |
FNMA | | | 4.50 | | | | 1-1-2059 | | | | 12,351,315 | | | | 13,946,505 | |
FNMA | | | 5.00 | | | | 7-1-2044 | | | | 574,131 | | | | 638,936 | |
FNMA | | | 5.00 | | | | 6-1-2048 | | | | 13,806,630 | | | | 15,917,491 | |
FNMA | | | 5.00 | | | | 9-1-2048 | | | | 2,789,792 | | | | 3,109,495 | |
FNMA | | | 5.00 | | | | 9-1-2048 | | | | 921,225 | | | | 1,022,970 | |
FNMA | | | 5.00 | | | | 10-1-2048 | | | | 144,977 | | | | 165,379 | |
FNMA | | | 5.00 | | | | 10-1-2048 | | | | 7,194,318 | | | | 8,294,299 | |
FNMA | | | 5.00 | | | | 11-1-2048 | | | | 4,766,013 | | | | 5,237,947 | |
FNMA | | | 5.00 | | | | 12-1-2048 | | | | 6,771,884 | | | | 7,526,468 | |
FNMA | | | 5.00 | | | | 1-1-2049 | | | | 10,249,062 | | | | 11,423,661 | |
FNMA | | | 5.00 | | | | 2-1-2049 | | | | 26,547,280 | | | | 30,606,245 | |
FNMA | | | 5.00 | | | | 6-1-2049 | | | | 41,280,244 | | | | 46,892,540 | |
FNMA | | | 5.00 | | | | 8-1-2049 | | | | 48,944,310 | | | | 56,428,179 | |
FNMA | | | 5.00 | | | | 8-1-2049 | | | | 26,698,217 | | | | 30,521,978 | |
FNMA | | | 5.00 | | | | 11-1-2049 | | | | 8,944,618 | | | | 9,970,714 | |
FNMA | | | 5.50 | | | | 12-1-2048 | | | | 6,609,737 | | | | 7,530,737 | |
FNMA | | | 5.50 | | | | 6-1-2049 | | | | 16,730,598 | | | | 19,443,677 | |
FNMA | | | 6.00 | | | | 4-1-2022 | | | | 2,406 | | | | 2,672 | |
FNMA | | | 6.00 | | | | 2-1-2029 | | | | 3,548 | | | | 3,971 | |
FNMA | | | 6.00 | | | | 3-1-2033 | | | | 31,407 | | | | 36,136 | |
FNMA | | | 6.00 | | | | 11-1-2033 | | | | 11,136 | | | | 12,835 | |
FNMA Series 2005-31 Class PB | | | 5.50 | | | | 4-25-2035 | | | | 250,000 | | | | 286,755 | |
FNMA Series 2017-13 Class PA | | | 3.00 | | | | 8-25-2046 | | | | 4,920,046 | | | | 5,264,498 | |
FNMA Series 2017-M7 Class A2 ±± | | | 2.96 | | | | 2-25-2027 | | | | 2,108,000 | | | | 2,324,139 | |
FNMA Series 2018-14 Class KC | | | 3.00 | | | | 3-25-2048 | | | | 4,966,263 | | | | 5,302,947 | |
FNMA Series 2018-15 Class AB | | | 3.00 | | | | 3-25-2048 | | | | 1,745,508 | | | | 1,874,942 | |
FNMA Series 2018-8 Class KL | | | 2.50 | | | | 3-25-2047 | | | | 6,661,987 | | | | 6,960,981 | |
FNMA Series 414 Class A35 | | | 3.50 | | | | 10-25-2042 | | | | 12,487,364 | | | | 14,019,711 | |
GNMA %% | | | 2.00 | | | | 7-21-2050 | | | | 10,400,000 | | | | 10,734,750 | |
GNMA %% | | | 2.50 | | | | 6-22-2050 | | | | 19,400,000 | | | | 20,409,406 | |
GNMA | | | 3.00 | | | | 2-20-2050 | | | | 6,724,606 | | | | 7,164,996 | |
GNMA | | | 3.00 | | | | 2-20-2050 | | | | 15,257,331 | | | | 16,180,643 | |
GNMA | | | 3.00 | | | | 3-20-2050 | | | | 4,616,952 | | | | 4,929,065 | |
GNMA %% | | | 3.00 | | | | 6-22-2050 | | | | 9,000,000 | | | | 9,525,938 | |
GNMA | | | 3.50 | | | | 1-20-2048 | | | | 5,778,471 | | | | 6,244,719 | |
GNMA | | | 3.50 | | | | 3-20-2049 | | | | 5,611,580 | | | | 5,923,699 | |
GNMA | | | 3.50 | | | | 8-20-2049 | | | | 8,685,833 | | | | 9,400,441 | |
GNMA | | | 4.00 | | | | 4-20-2047 | | | | 24,644,221 | | | | 26,565,735 | |
GNMA | | | 4.00 | | | | 6-20-2047 | | | | 60,400,955 | | | | 65,057,360 | |
GNMA | | | 4.00 | | | | 10-20-2047 | | | | 1,670,172 | | | | 1,818,375 | |
GNMA | | | 4.00 | | | | 1-20-2048 | | | | 2,982,260 | | | | 3,208,476 | |
GNMA | | | 4.00 | | | | 3-20-2048 | | | | 1,704,904 | | | | 1,848,937 | |
GNMA | | | 4.00 | | | | 4-20-2048 | | | | 2,831,280 | | | | 3,070,608 | |
GNMA | | | 4.00 | | | | 4-20-2048 | | | | 2,479,588 | | | | 2,716,560 | |
GNMA | | | 4.00 | | | | 4-20-2048 | | | | 1,742,729 | | | | 1,917,300 | |
GNMA | | | 4.00 | | | | 4-20-2048 | | | | 6,772,022 | | | | 7,252,143 | |
GNMA | | | 4.00 | | | | 5-20-2048 | | | | 19,334,176 | | | | 20,720,807 | |
GNMA | | | 4.00 | | | | 5-20-2049 | | | | 3,095,166 | | | | 3,374,710 | |
The accompanying notes are an integral part of these financial statements.
30 | Wells Fargo Core Bond Portfolio
Portfolio of investments—May 31, 2020
| | | | | | | | | | | | | | | | |
| | | Interest
rate | | | Maturity
date | | | Principal | | | Value | |
| Agency Securities (continued) | |
GNMA | | | 4.00 | % | | | 6-20-2049 | | | $ | 10,522,012 | | | $ | 11,473,973 | |
GNMA | | | 4.00 | | | | 7-20-2049 | | | | 7,637,270 | | | | 8,331,616 | |
GNMA | | | 4.50 | | | | 8-15-2047 | | | | 1,532,075 | | | | 1,694,179 | |
GNMA | | | 4.50 | | | | 6-20-2048 | | | | 8,861,630 | | | | 9,613,674 | |
GNMA | | | 4.50 | | | | 2-20-2049 | | | | 9,857,778 | | | | 11,031,691 | |
GNMA | | | 4.50 | | | | 3-20-2049 | | | | 5,712,482 | | | | 6,298,304 | |
GNMA | | | 4.50 | | | | 3-20-2049 | | | | 1,405,321 | | | | 1,548,956 | |
GNMA | | | 4.50 | | | | 4-20-2049 | | | | 2,762,915 | | | | 3,043,665 | |
GNMA | | | 4.50 | | | | 5-20-2049 | | | | 2,711,787 | | | | 2,989,294 | |
GNMA | | | 4.50 | | | | 5-20-2049 | | | | 2,507,186 | | | | 2,765,100 | |
GNMA | | | 4.50 | | | | 5-20-2049 | | | | 1,846,988 | | | | 2,036,668 | |
GNMA | | | 5.00 | | | | 12-20-2039 | | | | 189,430 | | | | 217,701 | |
GNMA | | | 5.00 | | | | 11-20-2045 | | | | 347,030 | | | | 392,776 | |
GNMA | | | 5.00 | | | | 3-20-2048 | | | | 17,664,182 | | | | 19,347,659 | |
GNMA | | | 5.00 | | | | 5-20-2048 | | | | 8,932,576 | | | | 9,770,855 | |
GNMA | | | 5.00 | | | | 6-20-2048 | | | | 29,213,785 | | | | 31,935,246 | |
GNMA | | | 5.00 | | | | 8-20-2048 | | | | 10,093,508 | | | | 11,022,797 | |
GNMA | | | 5.00 | | | | 12-20-2048 | | | | 10,933,491 | | | | 11,897,275 | |
GNMA | | | 5.00 | | | | 1-20-2049 | | | | 2,186,892 | | | | 2,377,648 | |
GNMA | | | 5.00 | | | | 1-20-2049 | | | | 7,106,357 | | | | 8,079,990 | |
GNMA | | | 5.00 | | | | 2-20-2049 | | | | 2,102,158 | | | | 2,335,858 | |
GNMA | | | 5.00 | | | | 3-20-2049 | | | | 2,512,962 | | | | 2,792,320 | |
GNMA Series 2012-141 Class WA ±± | | | 4.53 | | | | 11-16-2041 | | | | 1,456,869 | | | | 1,682,920 | |
GNMA Series 2017-167 Class BQ | | | 2.50 | | | | 8-20-2044 | | | | 7,102,200 | | | | 7,347,822 | |
GNMA Series 2019-132 Class NA | | | 3.50 | | | | 9-20-2049 | | | | 9,443,664 | | | | 10,020,607 | |
| |
Total Agency Securities (Cost $2,484,022,240) | | | | 2,553,913,359 | |
| | | | | | | | | | | | | | | | |
|
| Asset-Backed Securities: 8.34% | |
Avis Budget Rental Car Funding LLC Series 2017-1A Class A 144A | | | 3.07 | | | | 9-20-2023 | | | | 1,620,000 | | | | 1,602,072 | |
Avis Budget Rental Car Funding LLC Serries 2019-3A Class A1 144A | | | 2.36 | | | | 3-20-2026 | | | | 3,825,000 | | | | 3,656,648 | |
CNH Equipment Trust Series 2020-A Class A3 | | | 1.16 | | | | 6-16-2025 | | | | 4,629,000 | | | | 4,637,256 | |
CNH Equipment Trust Series 2020-A Class A4 | | | 1.51 | | | | 4-15-2027 | | | | 1,297,000 | | | | 1,299,874 | |
College Avenue Student Loan Trust Series 2017-A Class A1 (1 Month LIBOR +1.65%) 144A± | | | 1.82 | | | | 11-26-2046 | | | | 3,224,695 | | | | 3,182,523 | |
College Avenue Student Loan Trust Series 2018-A Class A2 144A | | | 4.13 | | | | 12-26-2047 | | | | 2,310,492 | | | | 2,492,962 | |
College Avenue Student Loan Trust Series 2019- A Class A2 144A | | | 3.28 | | | | 12-28-2048 | | | | 2,284,128 | | | | 2,372,897 | |
Ford Credit Auto Owner Trust Series 2017-1 Class A 144A | | | 2.62 | | | | 8-15-2028 | | | | 3,865,000 | | | | 3,920,840 | |
Ford Credit Auto Owner Trust Series 2017-2 Class A 144A | | | 2.36 | | | | 3-15-2029 | | | | 9,960,000 | | | | 10,056,167 | |
Ford Credit Auto Owner Trust Series 2018-1 Class A 144A | | | 3.19 | | | | 7-15-2031 | | | | 17,004,000 | | | | 17,804,441 | |
Ford Credit Auto Owner Trust Series 2018-2 Class A 144A | | | 3.47 | | | | 1-15-2030 | | | | 6,806,000 | | | | 7,067,292 | |
Ford Credit Auto Owner Trust Series 2019-1 Class A 144A | | | 3.52 | | | | 7-15-2030 | | | | 11,868,000 | | | | 12,468,611 | |
Ford Credit Auto Owner Trust Series 2020-1 Class A 144A | | | 2.04 | | | | 8-15-2031 | | | | 14,567,000 | | | | 14,627,723 | |
Ford Credit Auto Owner Trust Series 2020-A Class A3 | | | 1.04 | | | | 8-15-2024 | | | | 6,791,000 | | | | 6,861,049 | |
Ford Credit Auto Owner Trust Series 2020-A Class A4 | | | 1.35 | | | | 7-15-2025 | | | | 2,232,000 | | | | 2,268,766 | |
GM Financial Consumer Automobile Receivables Trust Series 2020-2 Class A3 | | | 1.49 | | | | 12-16-2024 | | | | 3,485,000 | | | | 3,555,348 | |
GM Financial Consumer Automobile Receivables Trust Series 2020-2 Class A4 | | | 1.74 | | | | 8-18-2025 | | | | 1,745,000 | | | | 1,772,522 | |
Honda Auto Receivables Owner Trust Series 2020-2 Class A3 | | | 0.82 | | | | 7-15-2024 | | | | 8,077,000 | | | | 8,113,230 | |
Honda Auto Receivables Owner Trust Series 2020-2 Class A4 | | | 1.09 | | | | 10-15-2026 | | | | 2,758,000 | | | | 2,785,095 | |
Navient Student Loan Trust Series 2014-1 Class A3 (1 Month LIBOR +0.51%) ± | | | 0.68 | | | | 6-25-2031 | | | | 4,089,210 | | | | 3,913,274 | |
Navient Student Loan Trust Series 2015-1 Class A2 (1 Month LIBOR +0.60%) ± | | | 0.77 | | | | 4-25-2040 | | | | 2,665,221 | | | | 2,532,941 | |
Navient Student Loan Trust Series 2016-1A Class A (1 Month LIBOR +0.70%) 144A± | | | 0.87 | | | | 2-25-2070 | | | | 1,671,969 | | | | 1,568,676 | |
The accompanying notes are an integral part of these financial statements.
Wells Fargo Core Bond Portfolio | 31
Portfolio of investments—May 31, 2020
| | | | | | | | | | | | | | | | |
| | | Interest
rate | | | Maturity
date | | | Principal | | | Value | |
|
| Asset-Backed Securities (continued) | |
Navient Student Loan Trust Series 2016-3A Class A2 (1 Month LIBOR +0.85%) 144A± | | | 1.02 | % | | | 6-25-2065 | | | $ | 604,856 | | | $ | 604,821 | |
Navient Student Loan Trust Series 2016-AA Class A2B (1 Month LIBOR +2.15%) 144A± | | | 2.33 | | | | 12-15-2045 | | | | 2,145,328 | | | | 2,161,614 | |
Navient Student Loan Trust Series 2018-A Class A2 144A | | | 3.19 | | | | 2-18-2042 | | | | 2,233,000 | | | | 2,253,887 | |
Navient Student Loan Trust Series 2018-BA Class A2A 144A | | | 3.61 | | | | 12-15-2059 | | | | 4,454,000 | | | | 4,534,426 | |
Navient Student Loan Trust Series 2018-CA Class A2 144A | | | 3.52 | | | | 6-16-2042 | | | | 2,507,000 | | | | 2,548,658 | |
Navient Student Loan Trust Series 2018-DA Class A2A 144A | | | 4.00 | | | | 12-15-2059 | | | | 10,280,000 | | | | 10,751,384 | |
Navient Student Loan Trust Series 2018-EA Class A2 144A | | | 4.00 | | | | 12-15-2059 | | | | 6,822,000 | | | | 7,007,738 | |
Navient Student Loan Trust Series 2019 -D Class A2A 144A | | | 3.01 | | | | 12-15-2059 | | | | 10,199,000 | | | | 10,349,480 | |
Navient Student Loan Trust Series 2019-A Class A2A 144A | | | 3.42 | | | | 1-15-2043 | | | | 11,743,000 | | | | 12,061,676 | |
Navient Student Loan Trust Series 2019-BA Class A2A 144A | | | 3.39 | | | | 12-15-2059 | | | | 8,228,000 | | | | 8,468,760 | |
Navient Student Loan Trust Series 2019-CA Class A2 144A | | | 3.13 | | | | 2-15-2068 | | | | 6,899,000 | | | | 7,078,438 | |
Navient Student Loan Trust Series 2019-FA Class A2 144A | | | 2.60 | | | | 8-15-2068 | | | | 12,057,000 | | | | 12,328,181 | |
Navient Student Loan Trust Series 2019-GA Class A 144A | | | 2.40 | | | | 10-15-2068 | | | | 10,732,284 | | | | 10,878,151 | |
Navient Student Loan Trust Series 2020-A Class A2A 144A | | | 2.46 | | | | 11-15-2068 | | | | 5,505,000 | | | | 5,477,014 | |
Navient Student Loan Trust Series 2020-A ClassA2B (1 Month LIBOR +0.90%) 144A± | | | 1.08 | | | | 11-15-2068 | | | | 4,776,000 | | | | 4,473,939 | |
Navient Student Loan Trust Series 2020-BA ClassA2 144A | | | 2.12 | | | | 1-15-2069 | | | | 4,271,000 | | | | 4,222,808 | |
Navient Student Loan Trust Series 2020-CA Class A2 144A | | | 2.15 | | | | 11-15-2068 | | | | 4,211,000 | | | | 4,218,777 | |
Nelnet Student Loan Trust Series 2004-4 Class A5 (3 Month LIBOR +0.16%) ± | | | 1.15 | | | | 1-25-2037 | | | | 6,719,071 | | | | 6,436,557 | |
Nelnet Student Loan Trust Series 2004-5 Class A5 (3 Month LIBOR +0.18%) ± | | | 1.17 | | | | 10-27-2036 | | | | 2,443,591 | | | | 2,381,883 | |
Nelnet Student Loan Trust Series 2005-1 Class A5 (3 Month LIBOR +0.11%) ± | | | 1.10 | | | | 10-25-2033 | | | | 20,420,157 | | | | 19,074,464 | |
Nelnet Student Loan Trust Series 2005-2 Class A5 (3 Month LIBOR +0.10%) ± | | | 1.30 | | | | 3-23-2037 | | | | 19,940,985 | | | | 18,831,389 | |
Nelnet Student Loan Trust Series 2005-3 Class A5 (3 Month LIBOR +0.12%) ± | | | 1.32 | | | | 12-24-2035 | | | | 15,058,712 | | | | 14,369,938 | |
Nelnet Student Loan Trust Series 2005-4 Class A4 (3 Month LIBOR +0.18%) ± | | | 1.38 | | | | 3-22-2032 | | | | 3,554,456 | | | | 3,283,685 | |
Nelnet Student Loan Trust Series 2012-2A Class A (1 Month LIBOR +0.80%) 144A± | | | 0.97 | | | | 12-26-2033 | | | | 2,495,572 | | | | 2,447,411 | |
Nelnet Student Loan Trust Series 2013-1A Class A (1 Month LIBOR +0.60%) 144A± | | | 0.77 | | | | 6-25-2041 | | | | 3,659,989 | | | | 3,392,916 | |
Nelnet Student Loan Trust Series 2014-1A Class A (1 Month LIBOR +0.57%) 144A± | | | 0.74 | | | | 9-25-2041 | | | | 1,891,212 | | | | 1,803,526 | |
Santander Drive Auto Receivables Trust Series 2020-1 Class A3 | | | 2.03 | | | | 2-15-2024 | | | | 2,240,000 | | | | 2,265,403 | |
Santander Revolving Auto Loan Trust Series 2019-A Class A 144A | | | 2.51 | | | | 1-26-2032 | | | | 12,015,000 | | | | 11,899,877 | |
SLM Student Loan Trust Series 2003-1 Class A5C (3 Month LIBOR +0.75%) 144A± | | | 1.49 | | | | 12-15-2032 | | | | 3,318,848 | | | | 3,022,314 | |
SLM Student Loan Trust Series 2007-2 Class A4 (3 Month LIBOR +0.06%) ± | | | 1.05 | | | | 7-25-2022 | | | | 9,535,833 | | | | 8,913,332 | |
SLM Student Loan Trust Series 2008-1 Class A4A (3 Month LIBOR +1.60%) ± | | | 2.34 | | | | 12-15-2032 | | | | 3,420,643 | | | | 3,365,571 | |
SLM Student Loan Trust Series 2010-1 Class A (1 Month LIBOR +0.40%) ± | | | 0.57 | | | | 3-25-2025 | | | | 1,575,684 | | | | 1,447,557 | |
SLM Student Loan Trust Series 2012-1 Class A3 (1 Month LIBOR +0.95%) ± | | | 1.12 | | | | 9-25-2028 | | | | 11,379,743 | | | | 10,741,329 | |
SLM Student Loan Trust Series 2012-2 Class A (1 Month LIBOR +0.70%) ± | | | 0.87 | | | | 1-25-2029 | | | | 9,864,040 | | | | 9,085,759 | |
SLM Student Loan Trust Series 2012-6 Class A3 (1 Month LIBOR +0.75%) ± | | | 0.92 | | | | 5-26-2026 | | | | 2,560,344 | | | | 2,349,267 | |
SMB Private Education Loan Trust Series 2015-A Class A2B (1 Month LIBOR +1.00%) 144A± | | | 1.18 | | | | 6-15-2027 | | | | 2,207,376 | | | | 2,190,742 | |
SMB Private Education Loan Trust Series 2015-B Class A2A 144A | | | 2.98 | | | | 7-15-2027 | | | | 404,638 | | | | 409,233 | |
SMB Private Education Loan Trust Series 2015-C Class A2B (1 Month LIBOR +1.40%) 144A± | | | 1.58 | | | | 7-15-2027 | | | | 1,197,410 | | | | 1,199,127 | |
SMB Private Education Loan Trust Series 2016-A Class A2A 144A | | | 2.70 | | | | 5-15-2031 | | | | 6,736,081 | | | | 6,766,481 | |
The accompanying notes are an integral part of these financial statements.
32 | Wells Fargo Core Bond Portfolio
Portfolio of investments—May 31, 2020
| | | | | | | | | | | | | | | | |
| | | Interest
rate | | | Maturity
date | | | Principal | | | Value | |
|
| Asset-Backed Securities (continued) | |
SMB Private Education Loan Trust Series 2016-A Class A2B (1 Month LIBOR +1.50%) 144A± | | | 1.68 | % | | | 5-15-2031 | | | $ | 8,857,480 | | | $ | 8,742,481 | |
SMB Private Education Loan Trust Series 2016-B Class A2A 144A | | | 2.43 | | | | 2-17-2032 | | | | 3,250,750 | | | | 3,296,064 | |
SMB Private Education Loan Trust Series 2016-B Class A2B (1 Month LIBOR +1.45%) 144A± | | | 1.63 | | | | 2-17-2032 | | | | 8,951,894 | | | | 8,899,811 | |
SMB Private Education Loan Trust Series 2016-C Class A2B (1 Month LIBOR +1.10%) 144A± | | | 1.28 | | | | 9-15-2034 | | | | 3,486,864 | | | | 3,434,231 | |
SMB Private Education Loan Trust Series 2017-A Class A2B (1 Month LIBOR +0.90%) 144A± | | | 1.08 | | | | 9-15-2034 | | | | 2,634,682 | | | | 2,574,125 | |
SMB Private Education Loan Trust Series 2017-B Class A2A 144A | | | 2.82 | | | | 10-15-2035 | | | | 3,055,513 | | | | 3,128,450 | |
SMB Private Education Loan Trust Series 2018-C Class A2A 144A | | | 3.63 | | | | 11-15-2035 | | | | 4,055,000 | | | | 4,215,572 | |
SMB Private Education Loan Trust Series 2019-A Class A2A 144A | | | 3.44 | | | | 7-15-2036 | | | | 16,387,000 | | | | 16,983,751 | |
SoFi Professional Loan Program LLC Series 2016-A Class A2 144A | | | 2.76 | | | | 12-26-2036 | | | | 1,952,871 | | | | 1,954,666 | |
SoFi Professional Loan Program LLC Series 2016-D Class A1 (1 Month LIBOR +0.95%) 144A± | | | 1.12 | | | | 1-25-2039 | | | | 336,166 | | | | 335,304 | |
SoFi Professional Loan Program LLC Series 2016-E Class A1 (1 Month LIBOR +0.85%) 144A± | | | 1.02 | | | | 7-25-2039 | | | | 589,654 | | | | 585,275 | |
SoFi Professional Loan Program LLC Series 2017-A Class A1 (1 Month LIBOR +0.70%) 144A± | | | 0.87 | | | | 3-26-2040 | | | | 685,703 | | | | 679,666 | |
SoFi Professional Loan Program LLC Series 2017-D Class A2 144A | | | 2.65 | | | | 9-25-2040 | | | | 500,310 | | | | 511,156 | |
SoFi Professional Loan Program LLC Series 2017-E Class A1 (1 Month LIBOR +0.50%) 144A± | | | 0.67 | | | | 11-26-2040 | | | | 447,451 | | | | 444,275 | |
SoFi Professional Loan Program LLC Series 2017-E Class A2B 144A | | | 2.72 | | | | 11-26-2040 | | | | 2,473,000 | | | | 2,503,290 | |
SoFi Professional Loan Program LLC Series 2018-A Class A2B 144A | | | 2.95 | | | | 2-25-2042 | | | | 3,098,000 | | | | 3,130,643 | |
SoFi Professional Loan Program LLC Series 2018-B Class A2FX 144A | | | 3.34 | | | | 8-25-2047 | | | | 6,978,000 | | | | 7,174,846 | |
SoFi Professional Loan Program LLC Series 2020-A Class A2 144A | | | 2.54 | | | | 5-15-2046 | | | | 10,245,000 | | | | 10,513,638 | |
SoFi Professional Loan Program LLC Series 2020-C Class AFX 144A | | | 1.95 | | | | 2-15-2046 | | | | 9,693,000 | | | | 9,693,000 | |
Structured Asset Securities Corporation Series 1998-2 Class A (1 Month LIBOR +0.52%) ± | | | 0.69 | | | | 2-25-2028 | | | | 611 | | | | 609 | |
Toyota Auto Receivables Owner Trust Series 2020-B Class A3 | | | 1.36 | | | | 8-15-2024 | | | | 5,355,000 | | | | 5,431,453 | |
Verizon Owner Trust Seires 2019-C Class A1A | | | 1.94 | | | | 4-22-2024 | | | | 4,429,000 | | | | 4,537,159 | |
Verizon Owner Trust Series 2020-A Class A1A | | | 1.85 | | | | 7-22-2024 | | | | 9,683,000 | | | | 9,937,344 | |
Volkswagen Auto Loan Enhanced Trust Series 2020-1 Class A3 | | | 0.98 | | | | 11-20-2024 | | | | 5,831,000 | | | | 5,854,101 | |
Volkswagen Auto Loan Enhanced Trust Series 2020-1 Class A4 | | | 1.26 | | | | 8-20-2026 | | | | 2,187,000 | | | | 2,201,082 | |
| |
Total Asset-Backed Securities (Cost 481,198,756) | | | | 480,419,712 | |
| | | | | | | | | | | | | | | | |
|
Corporate Bonds and Notes: 26.63% | |
|
Communication Services: 3.01% | |
|
| Diversified Telecommunication Services: 1.69% | |
AT&T Incorporated | | | 2.30 | | | | 6-1-2027 | | | | 5,982,000 | | | | 6,050,688 | |
AT&T Incorporated | | | 2.75 | | | | 6-1-2031 | | | | 5,983,000 | | | | 6,024,269 | |
AT&T Incorporated | | | 3.00 | | | | 2-15-2022 | | | | 2,852,000 | | | | 2,956,623 | |
AT&T Incorporated | | | 3.00 | | | | 6-30-2022 | | | | 4,570,000 | | | | 4,741,363 | |
AT&T Incorporated | | | 3.40 | | | | 5-15-2025 | | | | 7,182,000 | | | | 7,743,852 | |
AT&T Incorporated | | | 3.50 | | | | 6-1-2041 | | | | 1,995,000 | | | | 2,008,480 | |
AT&T Incorporated | | | 3.60 | | | | 2-17-2023 | | | | 3,436,000 | | | | 3,651,406 | |
AT&T Incorporated | | | 3.65 | | | | 6-1-2051 | | | | 1,893,000 | | | | 1,907,442 | |
AT&T Incorporated | | | 3.85 | | | | 6-1-2060 | | | | 1,995,000 | | | | 2,028,556 | |
AT&T Incorporated | | | 3.88 | | | | 8-15-2021 | | | | 2,749,000 | | | | 2,851,897 | |
AT&T Incorporated | | | 3.90 | | | | 3-11-2024 | | | | 2,045,000 | | | | 2,215,027 | |
AT&T Incorporated | | | 4.30 | | | | 2-15-2030 | | | | 4,298,000 | | | | 4,883,649 | |
AT&T Incorporated | | | 4.50 | | | | 3-9-2048 | | | | 1,592,000 | | | | 1,812,105 | |
AT&T Incorporated | | | 4.85 | | | | 3-1-2039 | | | | 1,812,000 | | | | 2,122,787 | |
AT&T Incorporated | | | 5.15 | | | | 2-15-2050 | | | | 3,659,000 | | | | 4,572,975 | |
AT&T Incorporated | | | 5.25 | | | | 3-1-2037 | | | | 1,072,000 | | | | 1,309,608 | |
The accompanying notes are an integral part of these financial statements.
Wells Fargo Core Bond Portfolio | 33
Portfolio of investments—May 31, 2020
| | | | | | | | | | | | | | | | |
| | | Interest
rate | | | Maturity
date | | | Principal | | | Value | |
|
| Diversified Telecommunication Services (continued) | |
AT&T Incorporated | | | 5.35 | % | | | 12-15-2043 | | | $ | 897,000 | | | $ | 1,087,334 | |
AT&T Incorporated | | | 5.38 | | | | 10-15-2041 | | | | 1,435,000 | | | | 1,752,464 | |
T-Mobile USA Incorporated 144A | | | 3.50 | | | | 4-15-2025 | | | | 8,067,000 | | | | 8,638,708 | |
T-Mobile USA Incorporated 144A | | | 3.75 | | | | 4-15-2027 | | | | 6,134,000 | | | | 6,632,019 | |
T-Mobile USA Incorporated 144A | | | 3.88 | | | | 4-15-2030 | | | | 4,000,000 | | | | 4,336,320 | |
Verizon Communications Incorporated | | | 3.00 | | | | 3-22-2027 | | | | 1,863,000 | | | | 2,029,029 | |
Verizon Communications Incorporated | | | 3.50 | | | | 11-1-2024 | | | | 4,330,000 | | | | 4,765,907 | |
Verizon Communications Incorporated | | | 4.02 | | | | 12-3-2029 | | | | 2,238,000 | | | | 2,636,917 | |
Verizon Communications Incorporated | | | 4.27 | | | | 1-15-2036 | | | | 798,000 | | | | 961,485 | |
Verizon Communications Incorporated | | | 4.40 | | | | 11-1-2034 | | | | 3,892,000 | | | | 4,775,437 | |
Verizon Communications Incorporated | | | 4.52 | | | | 9-15-2048 | | | | 2,425,000 | | | | 3,159,080 | |
| | | | |
| | | | | | | | | | | | | | | 97,655,427 | |
| | | | | | | | | | | | | | | | |
|
| Entertainment: 0.39% | |
The Walt Disney Company | | | 3.50 | | | | 5-13-2040 | | | | 2,269,000 | | | | 2,482,556 | |
The Walt Disney Company | | | 3.60 | | | | 1-13-2051 | | | | 3,949,000 | | | | 4,414,969 | |
The Walt Disney Company | | | 3.80 | | | | 5-13-2060 | | | | 1,418,000 | | | | 1,611,712 | |
ViacomCBS Incorporated | | | 4.20 | | | | 5-19-2032 | | | | 5,858,000 | | | | 6,048,132 | |
ViacomCBS Incorporated | | | 4.38 | | | | 3-15-2043 | | | | 543,000 | | | | 517,754 | |
ViacomCBS Incorporated | | | 4.60 | | | | 1-15-2045 | | | | 350,000 | | | | 338,659 | |
ViacomCBS Incorporated | | | 4.75 | | | | 5-15-2025 | | | | 3,076,000 | | | | 3,384,196 | |
ViacomCBS Incorporated | | | 4.95 | | | | 1-15-2031 | | | | 1,873,000 | | | | 2,072,535 | |
ViacomCBS Incorporated | | | 5.85 | | | | 9-1-2043 | | | | 1,297,000 | | | | 1,404,309 | |
| | | | |
| | | | | | | | | | | | | | | 22,274,822 | |
| | | | | | | | | | | | | | | | |
|
| Media: 0.93% | |
Charter Communications Operating LLC | | | 4.46 | | | | 7-23-2022 | | | | 1,776,000 | | | | 1,891,364 | |
Charter Communications Operating LLC | | | 4.80 | | | | 3-1-2050 | | | | 1,502,000 | | | | 1,672,523 | |
Comcast Corporation | | | 1.95 | | | | 1-15-2031 | | | | 6,977,000 | | | | 6,986,152 | |
Comcast Corporation | | | 2.65 | | | | 2-1-2030 | | | | 2,698,000 | | | | 2,875,928 | |
Comcast Corporation | | | 2.80 | | | | 1-15-2051 | | | | 3,039,000 | | | | 2,990,235 | |
Comcast Corporation | | | 3.10 | | | | 4-1-2025 | | | | 3,797,000 | | | | 4,149,790 | |
Comcast Corporation | | | 3.70 | | | | 4-15-2024 | | | | 3,591,000 | | | | 3,970,950 | |
Comcast Corporation | | | 3.75 | | | | 4-1-2040 | | | | 4,545,000 | | | | 5,208,702 | |
Comcast Corporation | | | 3.95 | | | | 10-15-2025 | | | | 3,247,000 | | | | 3,719,725 | |
Comcast Corporation | | | 4.15 | | | | 10-15-2028 | | | | 4,655,000 | | | | 5,506,734 | |
Comcast Corporation | | | 4.60 | | | | 10-15-2038 | | | | 4,545,000 | | | | 5,641,758 | |
Discovery Communications LLC | | | 3.63 | | | | 5-15-2030 | | | | 4,159,000 | | | | 4,393,945 | |
Discovery Communications LLC | | | 4.65 | | | | 5-15-2050 | | | | 2,770,000 | | | | 2,944,651 | |
Time Warner Cable Incorporated | | | 6.55 | | | | 5-1-2037 | | | | 1,283,000 | | | | 1,636,689 | |
| | | | |
| | | | | | | | | | | | | | | 53,589,146 | |
| | | | | | | | | | | | | | | | |
|
Consumer Discretionary: 1.07% | |
|
| Automobiles: 0.01% | |
General Motors Company | | | 5.95 | | | | 4-1-2049 | | | | 513,000 | | | | 526,953 | |
| | | | | | | | | | | | | | | | |
|
| Diversified Consumer Services: 0.01% | |
Stanford University %% | | | 1.29 | | | | 6-1-2027 | | | | 761,000 | | | | 764,843 | |
| | | | | | | | | | | | | | | | |
|
| Hotels, Restaurants & Leisure: 0.35% | |
GLP Capital LP / GLP Financing II Incorporated | | | 4.00 | | | | 1-15-2030 | | | | 1,531,000 | | | | 1,335,798 | |
GLP Capital LP / GLP Financing II Incorporated | | | 5.30 | | | | 1-15-2029 | | | | 1,881,000 | | | | 1,805,760 | |
Marriott International Incorporated %% | | | 4.63 | | | | 6-15-2030 | | | | 4,659,000 | | | | 4,767,760 | |
McDonald’s Corporation | | | 1.45 | | | | 9-1-2025 | | | | 3,711,000 | | | | 3,783,316 | |
McDonald’s Corporation | | | 2.13 | | | | 3-1-2030 | | | | 529,000 | | | | 535,179 | |
McDonald’s Corporation | | | 2.63 | | | | 9-1-2029 | | | | 1,100,000 | | | | 1,147,040 | |
The accompanying notes are an integral part of these financial statements.
34 | Wells Fargo Core Bond Portfolio
Portfolio of investments—May 31, 2020
| | | | | | | | | | | | | | | | |
| | | Interest
rate | | | Maturity
date | | | Principal | | | Value | |
|
| Hotels, Restaurants & Leisure (continued) | |
Starbucks Corporation | | | 1.30 | % | | | 5-7-2022 | | | $ | 2,355,000 | | | $ | 2,386,008 | |
Starbucks Corporation | | | 2.55 | | | | 11-15-2030 | | | | 2,025,000 | | | | 2,068,404 | |
Starbucks Corporation | | | 3.35 | | | | 3-12-2050 | | | | 923,000 | | | | 914,788 | |
Starbucks Corporation | | | 3.50 | | | | 11-15-2050 | | | | 1,425,000 | | | | 1,453,801 | |
| | | | |
| | | | | | | | | | | | | | | 20,197,854 | |
| | | | | | | | | | | | | | | | |
|
| Multiline Retail: 0.05% | |
Dollar General Corporation | | | 3.50 | | | | 4-3-2030 | | | | 2,240,000 | | | | 2,504,996 | |
Dollar General Corporation | | | 4.13 | | | | 4-3-2050 | | | | 426,000 | | | | 506,559 | |
| | | | |
| | | | | | | | | | | | | | | 3,011,555 | |
| | | | | | | | | | | | | | | | |
|
| Specialty Retail: 0.48% | |
Advance Auto Parts Company 144A | | | 3.90 | | | | 4-15-2030 | | | | 5,088,000 | | | | 5,196,608 | |
Autonation Incorporated | | | 4.75 | | | | 6-1-2030 | | | | 2,982,000 | | | | 3,104,602 | |
Home Depot Incorporated | | | 2.50 | | | | 4-15-2027 | | | | 2,294,000 | | | | 2,498,190 | |
Home Depot Incorporated | | | 2.70 | | | | 4-15-2030 | | | | 1,026,000 | | | | 1,119,839 | |
Home Depot Incorporated | | | 2.95 | | | | 6-15-2029 | | | | 301,000 | | | | 334,256 | |
Home Depot Incorporated | | | 3.13 | | | | 12-15-2049 | | | | 4,342,000 | | | | 4,739,219 | |
Lowe’s Companies Incorporated | | | 4.00 | | | | 4-15-2025 | | | | 2,010,000 | | | | 2,272,202 | |
Lowe’s Companies Incorporated | | | 5.00 | | | | 4-15-2040 | | | | 2,268,000 | | | | 2,895,044 | |
Lowe’s Companies Incorporated | | | 5.13 | | | | 4-15-2050 | | | | 644,000 | | | | 866,916 | |
O’Reilly Automotive Incorporated | | | 4.20 | | | | 4-1-2030 | | | | 3,814,000 | | | | 4,303,989 | |
| | | | |
| | | | | | | | | | | | | | | 27,330,865 | |
| | | | | | | | | | | | | | | | |
|
| Textiles, Apparel & Luxury Goods: 0.17% | |
Nike Incorporated | | | 2.40 | | | | 3-27-2025 | | | | 2,741,000 | | | | 2,940,338 | |
Nike Incorporated | | | 2.75 | | | | 3-27-2027 | | | | 1,830,000 | | | | 2,000,922 | |
Nike Incorporated | | | 2.85 | | | | 3-27-2030 | | | | 1,804,000 | | | | 2,004,535 | |
Nike Incorporated | | | 3.38 | | | | 3-27-2050 | | | | 2,241,000 | | | | 2,590,936 | |
| | | | |
| | | | | | | | | | | | | | | 9,536,731 | |
| | | | | | | | | | | | | | | | |
|
Consumer Staples: 1.79% | |
|
| Beverages: 0.50% | |
Anheuser-Busch InBev Company | | | 4.90 | | | | 2-1-2046 | | | | 543,000 | | | | 629,656 | |
Anheuser-Busch InBev Worldwide Incorporated | | | 4.60 | | | | 4-15-2048 | | | | 2,483,000 | | | | 2,760,573 | |
Anheuser-Busch InBev Worldwide Incorporated | | | 4.70 | | | | 2-1-2036 | | | | 3,368,000 | | | | 3,840,150 | |
Anheuser-Busch InBev Worldwide Incorporated | | | 4.15 | | | | 1-23-2025 | | | | 3,909,000 | | | | 4,393,055 | |
Constellation Brands Incorporated | | | 3.20 | | | | 2-15-2023 | | | | 911,000 | | | | 967,946 | |
Constellation Brands Incorporated | | | 3.70 | | | | 12-6-2026 | | | | 1,521,000 | | | | 1,679,928 | |
Constellation Brands Incorporated | | | 3.75 | | | | 5-1-2050 | | | | 2,990,000 | | | | 3,078,272 | |
Constellation Brands Incorporated | | | 4.40 | | | | 11-15-2025 | | | | 274,000 | | | | 312,287 | |
Keurig Dr Pepper Incorporated | | | 3.80 | | | | 5-1-2050 | | | | 1,939,000 | | | | 2,110,743 | |
PepsiCo Incorporated | | | 2.25 | | | | 3-19-2025 | | | | 2,578,000 | | | | 2,754,061 | |
PepsiCo Incorporated | | | 2.63 | | | | 3-19-2027 | | | | 1,624,000 | | | | 1,776,082 | |
The Coca Cola Company | | | 2.60 | | | | 6-1-2050 | | | | 4,622,000 | | | | 4,549,863 | |
| | | | |
| | | | | | | | | | | | | | | 28,852,616 | |
| | | | | | | | | | | | | | | | |
|
| Food & Staples Retailing: 0.48% | |
Costco Wholesale Corporation | | | 1.60 | | | | 4-20-2030 | | | | 11,193,000 | | | | 11,279,862 | |
Costco Wholesale Corporation | | | 1.75 | | | | 4-20-2032 | | | | 2,888,000 | | | | 2,905,222 | |
Sysco Corporation | | | 6.60 | | | | 4-1-2050 | | | | 982,000 | | | | 1,268,001 | |
Walmart Incorporated | | | 3.05 | | | | 7-8-2026 | | | | 1,744,000 | | | | 1,956,117 | |
Walmart Incorporated | | | 3.55 | | | | 6-26-2025 | | | | 3,857,000 | | | | 4,355,569 | |
The accompanying notes are an integral part of these financial statements.
Wells Fargo Core Bond Portfolio | 35
Portfolio of investments—May 31, 2020
| | | | | | | | | | | | | | | | |
| | | Interest
rate | | | Maturity
date | | | Principal | | | Value | |
|
| Food & Staples Retailing (continued) | |
Walmart Incorporated | | | 3.70 | % | | | 6-26-2028 | | | $ | 4,862,000 | | | $ | 5,750,607 | |
Walmart Incorporated | | | 4.05 | | | | 6-29-2048 | | | | 43,000 | | | | 55,217 | |
| | | | |
| | | | | | | | | | | | | | | 27,570,595 | |
| | | | | | | | | | | | | | | | |
|
| Food Products: 0.32% | |
General Mills Incorporated | | | 2.88 | | | | 4-15-2030 | | | | 6,077,000 | | | | 6,532,689 | |
Ingredion Incorporated | | | 2.90 | | | | 6-1-2030 | | | | 5,796,000 | | | | 6,055,955 | |
Ingredion Incorporated | | | 3.90 | | | | 6-1-2050 | | | | 1,792,000 | | | | 2,006,816 | |
Mondelez International Incorporated | | | 1.50 | | | | 5-4-2025 | | | | 3,923,000 | | | | 4,000,334 | |
| | | | |
| | | | | | | | | | | | | | | 18,595,794 | |
| | | | | | | | | | | | | | | | |
|
| Household Products: 0.08% | |
The Procter & Gamble Company | | | 2.80 | | | | 3-25-2027 | | | | 943,000 | | | | 1,046,089 | |
The Procter & Gamble Company | | | 3.00 | | | | 3-25-2030 | | | | 1,212,000 | | | | 1,388,806 | |
The Procter & Gamble Company | | | 3.55 | | | | 3-25-2040 | | | | 574,000 | | | | 692,540 | |
The Procter & Gamble Company | | | 3.60 | | | | 3-25-2050 | | | | 962,000 | | | | 1,207,812 | |
| | | | |
| | | | | | | | | | | | | | | 4,335,247 | |
| | | | | | | | | | | | | | | | |
|
| Tobacco: 0.41% | |
Altria Group Incorporated | | | 2.35 | | | | 5-6-2025 | | | | 3,028,000 | | | | 3,136,641 | |
Altria Group Incorporated | | | 3.40 | | | | 5-6-2030 | | | | 2,436,000 | | | | 2,569,742 | |
Altria Group Incorporated | | | 4.45 | | | | 5-6-2050 | | | | 2,481,000 | | | | 2,678,227 | |
BAT Capital Corporation | | | 3.22 | | | | 9-6-2026 | | | | 1,965,000 | | | | 2,046,141 | |
BAT Capital Corporation | | | 3.56 | | | | 8-15-2027 | | | | 5,739,000 | | | | 6,029,951 | |
BAT Capital Corporation | | | 4.39 | | | | 8-15-2037 | | | | 278,000 | | | | 291,783 | |
BAT Capital Corporation | | | 4.70 | | | | 4-2-2027 | | | | 3,969,000 | | | | 4,439,020 | |
Reynolds American Incorporated | | | 5.85 | | | | 8-15-2045 | | | | 2,028,000 | | | | 2,432,360 | |
| | | | |
| | | | | | | | | | | | | | | 23,623,865 | |
| | | | | | | | | | | | | | | | |
|
Energy: 2.05% | |
|
| Oil, Gas & Consumable Fuels: 2.05% | |
BP Capital Markets America Incorporated | | | 3.19 | | | | 4-6-2025 | | | | 4,613,000 | | | | 5,004,841 | |
BP Capital Markets America Incorporated | | | 3.54 | | | | 4-6-2027 | | | | 4,634,000 | | | | 5,049,147 | |
Chevron Corporation | | | 1.14 | | | | 5-11-2023 | | | | 7,086,000 | | | | 7,218,095 | |
Chevron Corporation | | | 1.55 | | | | 5-11-2025 | | | | 9,875,000 | | | | 10,178,832 | |
Chevron Corporation | | | 2.00 | | | | 5-11-2027 | | | | 2,459,000 | | | | 2,567,178 | |
Chevron Corporation | | | 2.24 | | | | 5-11-2030 | | | | 6,299,000 | | | | 6,638,431 | |
Chevron Corporation | | | 3.08 | | | | 5-11-2050 | | | | 4,146,000 | | | | 4,452,288 | |
Devon Energy Corporation | | | 5.00 | | | | 6-15-2045 | | | | 976,000 | | | | 865,888 | |
Devon Energy Corporation | | | 5.60 | | | | 7-15-2041 | | | | 1,502,000 | | | | 1,391,992 | |
Diamondback Energy Incorporated | | | 3.25 | | | | 12-1-2026 | | | | 4,728,000 | | | | 4,591,315 | |
Energy Transfer Operating Partners LP | | | 6.05 | | | | 6-1-2041 | | | | 870,000 | | | | 916,481 | |
Energy Transfer Operating Partners LP | | | 6.13 | | | | 12-15-2045 | | | | 730,000 | | | | 762,146 | |
Enterprise Products Operating LLC | | | 3.70 | | | | 1-31-2051 | | | | 1,735,000 | | | | 1,745,344 | |
Enterprise Products Operating LLC | | | 3.95 | | | | 1-31-2060 | | | | 1,916,000 | | | | 1,916,056 | |
Enterprise Products Operating LLC | | | 4.20 | | | | 1-31-2050 | | | | 704,000 | | | | 755,877 | |
EOG Resources Incorporated | | | 4.38 | | | | 4-15-2030 | | | | 3,425,000 | | | | 4,041,122 | |
Exxon Mobil Corporation | | | 1.57 | | | | 4-15-2023 | | | | 9,032,000 | | | | 9,274,479 | |
Exxon Mobil Corporation | | | 2.99 | | | | 3-19-2025 | | | | 1,891,000 | | | | 2,070,118 | |
Exxon Mobil Corporation | | | 3.45 | | | | 4-15-2051 | | | | 1,633,000 | | | | 1,785,629 | |
Magellan Midstream Partners LP | | | 3.25 | | | | 6-1-2030 | | | | 3,805,000 | | | | 3,949,138 | |
Marathon Petroleum Corporation | | | 3.63 | | | | 9-15-2024 | | | | 4,888,000 | | | | 5,081,712 | |
Marathon Petroleum Corporation | | | 4.40 | | | | 7-15-2027 | | | | 3,654,000 | | | | 3,342,800 | |
Marathon Petroleum Corporation | | | 4.50 | | | | 5-1-2023 | | | | 1,904,000 | | | | 2,023,908 | |
The accompanying notes are an integral part of these financial statements.
36 | Wells Fargo Core Bond Portfolio
Portfolio of investments—May 31, 2020
| | | | | | | | | | | | | | | | |
| | | Interest
rate | | | Maturity
date | | | Principal | | | Value | |
|
| Oil, Gas & Consumable Fuels (continued) | |
Marathon Petroleum Corporation | | | 4.50 | % | | | 4-1-2048 | | | $ | 475,000 | | | $ | 451,219 | |
Marathon Petroleum Corporation | | | 4.70 | | | | 5-1-2025 | | | | 3,468,000 | | | | 3,820,632 | |
Marathon Petroleum Corporation | | | 4.75 | | | | 12-15-2023 | | | | 1,489,000 | | | | 1,606,890 | |
Noble Energy Incorporated | | | 3.85 | | | | 1-15-2028 | | | | 940,000 | | | | 854,904 | |
Noble Energy Incorporated | | | 3.90 | | | | 11-15-2024 | | | | 2,173,000 | | | | 2,147,927 | |
Noble Energy Incorporated | | | 4.20 | | | | 10-15-2049 | | | | 2,612,000 | | | | 2,117,168 | |
Noble Energy Incorporated | | | 4.95 | | | | 8-15-2047 | | | | 2,332,000 | | | | 1,992,536 | |
ONEOK Incorporated | | | 3.40 | | | | 9-1-2029 | | | | 380,000 | | | | 351,252 | |
Plains All American Pipeline LP | | | 3.55 | | | | 12-15-2029 | | | | 3,760,000 | | | | 3,551,257 | |
Plains All American Pipeline LP | | | 4.90 | | | | 2-15-2045 | | | | 807,000 | | | | 736,169 | |
Sunoco Logistics Partner LP | | | 5.30 | | | | 4-1-2044 | | | | 1,251,000 | | | | 1,234,331 | |
Sunoco Logistics Partner LP | | | 5.35 | | | | 5-15-2045 | | | | 238,000 | | | | 232,404 | |
Tennessee Gas Pipeline Company 144A | | | 2.90 | | | | 3-1-2030 | | | | 4,682,000 | | | | 4,741,907 | |
Transcontinental Gas Pipe Line Company 144A | | | 3.25 | | | | 5-15-2030 | | | | 1,967,000 | | | | 2,093,184 | |
Transcontinental Gas Pipe Line Company 144A | | | 3.95 | | | | 5-15-2050 | | | | 3,153,000 | | | | 3,346,274 | |
Williams Companies Incorporated | | | 3.90 | | | | 1-15-2025 | | | | 1,319,000 | | | | 1,410,851 | |
Williams Companies Incorporated | | | 5.40 | | | | 3-4-2044 | | | | 1,849,000 | | | | 2,033,437 | |
| | | | |
| | | | | | | | | | | | | | | 118,345,159 | |
| | | | | | | | | | | | | | | | |
|
Financials: 6.48% | |
|
| Banks: 3.02% | |
Bank of America Corporation (3 Month LIBOR +0.87%) ± | | | 2.46 | | | | 10-22-2025 | | | | 11,297,000 | | | | 11,755,800 | |
Bank of America Corporation (U.S. SOFR +2.15%) ± | | | 2.59 | | | | 4-29-2031 | | | | 1,935,000 | | | | 1,988,875 | |
Bank of America Corporation (3 Month LIBOR +0.79%) ± | | | 3.00 | | | | 12-20-2023 | | | | 9,845,000 | | | | 10,287,144 | |
Bank of America Corporation (3 Month LIBOR +1.09%) ± | | | 3.09 | | | | 10-1-2025 | | | | 7,035,000 | | | | 7,495,867 | |
Bank of America Corporation (3 Month LIBOR +1.04%) ± | | | 3.42 | | | | 12-20-2028 | | | | 12,681,000 | | | | 13,797,327 | |
Bank of America Corporation | | | 4.13 | | | | 1-22-2024 | | | | 623,000 | | | | 686,234 | |
Bank of America Corporation | | | 4.18 | | | | 11-25-2027 | | | | 5,258,000 | | | | 5,898,222 | |
Bank of America Corporation (3 Month LIBOR +1.31%) ± | | | 4.27 | | | | 7-23-2029 | | | | 9,347,000 | | | | 10,756,288 | |
Citigroup Incorporated (U.S. SOFR +2.11%) ±%% | | | 2.57 | | | | 6-3-2031 | | | | 7,607,000 | | | | 7,599,366 | |
Citigroup Incorporated (U.S. SOFR +1.42%) ± | | | 2.98 | | | | 11-5-2030 | | | | 5,292,000 | | | | 5,501,784 | |
Citigroup Incorporated (U.S. SOFR +2.75%) ± | | | 3.11 | | | | 4-8-2026 | | | | 21,310,000 | | | | 22,435,420 | |
Citigroup Incorporated | | | 3.20 | | | | 10-21-2026 | | | | 3,692,000 | | | | 3,950,495 | |
Citigroup Incorporated (U.S. SOFR +3.91%) ± | | | 4.41 | | | | 3-31-2031 | | | | 11,882,000 | | | | 13,684,922 | |
Inter-American Development Bank | | | 0.88 | | | | 4-3-2025 | | | | 7,328,000 | | | | 7,450,861 | |
JPMorgan Chase & Company (U.S. SOFR +1.46%) ± | | | 1.51 | | | | 6-1-2024 | | | | 19,010,000 | | | | 19,143,588 | |
JPMorgan Chase & Company (U.S. SOFR +1.89%) ± | | | 2.18 | | | | 6-1-2028 | | | | 5,700,000 | | | | 5,735,569 | |
JPMorgan Chase & Company | | | 2.95 | | | | 10-1-2026 | | | | 552,000 | | | | 595,101 | |
JPMorgan Chase & Company (U.S. SOFR +2.52%) ± | | | 2.96 | | | | 5-13-2031 | | | | 7,888,000 | | | | 8,120,665 | |
JPMorgan Chase & Company (3 Month LIBOR +0.70%) ± | | | 3.21 | | | | 4-1-2023 | | | | 6,057,000 | | | | 6,292,355 | |
JPMorgan Chase & Company (U.S. SOFR +3.79%) ± | | | 4.49 | | | | 3-24-2031 | | | | 2,251,000 | | | | 2,673,484 | |
Santander Holdings USA %% | | | 3.45 | | | | 6-2-2025 | | | | 5,709,000 | | | | 5,764,572 | |
Truist Bank | | | 2.25 | | | | 3-11-2030 | | | | 2,525,000 | | | | 2,494,851 | |
| | | | |
| | | | | | | | | | | | | | | 174,108,790 | |
| | | | | | | | | | | | | | | | |
|
| Capital Markets: 1.42% | |
Ameriprise Financial Services Incorporated | | | 3.00 | | | | 4-2-2025 | | | | 3,119,000 | | | | 3,349,206 | |
Goldman Sachs Group Incorporated (3 Month LIBOR +1.20%) ± | | | 3.27 | | | | 9-29-2025 | | | | 911,000 | | | | 964,204 | |
Goldman Sachs Group Incorporated | | | 3.50 | | | | 4-1-2025 | | | | 23,326,000 | | | | 25,035,019 | |
Goldman Sachs Group Incorporated | | | 3.50 | | | | 11-16-2026 | | | | 7,531,000 | | | | 8,119,564 | |
Goldman Sachs Group Incorporated | | | 3.85 | | | | 1-26-2027 | | | | 3,075,000 | | | | 3,387,851 | |
Goldman Sachs Group Incorporated | | | 4.00 | | | | 3-3-2024 | | | | 803,000 | | | | 879,564 | |
Goldman Sachs Group Incorporated | | | 6.75 | | | | 10-1-2037 | | | | 3,153,000 | | | | 4,360,310 | |
Morgan Stanley | | | 2.75 | | | | 5-19-2022 | | | | 6,916,000 | | | | 7,180,776 | |
The accompanying notes are an integral part of these financial statements.
Wells Fargo Core Bond Portfolio | 37
Portfolio of investments—May 31, 2020
| | | | | | | | | | | | | | | | |
| | | Interest
rate | | | Maturity
date | | | Principal | | | Value | |
|
| Capital Markets (continued) | |
PPL Capital Funding Incorporated | | | 3.10 | % | | | 5-15-2026 | | | $ | 4,519,000 | | | $ | 4,816,358 | |
PPL Capital Funding Incorporated | | | 3.40 | | | | 6-1-2023 | | | | 538,000 | | | | 562,885 | |
PPL Capital Funding Incorporated | | | 4.13 | | | | 4-15-2030 | | | | 4,835,000 | | | | 5,458,717 | |
PPL Capital Funding Incorporated | | | 5.00 | | | | 3-15-2044 | | | | 2,491,000 | | | | 2,960,175 | |
State Street Corporation (U.S. SOFR +2.69%) 144A± | | | 2.83 | | | | 3-30-2023 | | | | 4,768,000 | | | | 4,930,370 | |
The Charles Schwab Corporation | | | 3.25 | | | | 5-22-2029 | | | | 5,163,000 | | | | 5,703,951 | |
The Charles Schwab Corporation | | | 4.63 | | | | 3-22-2030 | | | | 3,423,000 | | | | 4,201,840 | |
| | | | |
| | | | | | | | | | | | | | | 81,910,790 | |
| | | | | | | | | | | | | | | | |
|
| Consumer Finance: 0.90% | |
Capital One Financial Company | | | 2.60 | | | | 5-11-2023 | | | | 13,251,000 | | | | 13,606,740 | |
Capital One Financial Company | | | 3.65 | | | | 5-11-2027 | | | | 3,762,000 | | | | 3,925,414 | |
Daimler Finance North America LLC 144A | | | 2.13 | | | | 3-10-2025 | | | | 5,271,000 | | | | 5,088,838 | |
General Motors Financial Company Incorporated | | | 2.90 | | | | 2-26-2025 | | | | 4,708,000 | | | | 4,572,586 | |
General Motors Financial Company Incorporated | | | 3.95 | | | | 4-13-2024 | | | | 471,000 | | | | 472,700 | |
General Motors Financial Company Incorporated | | | 4.35 | | | | 4-9-2025 | | | | 1,081,000 | | | | 1,098,265 | |
General Motors Financial Company Incorporated | | | 5.20 | | | | 3-20-2023 | | | | 6,170,000 | | | | 6,423,138 | |
General Motors Financial Company Incorporated | | | 5.40 | | | | 4-1-2048 | | | | 2,766,000 | | | | 2,664,231 | |
John Deere Capital Corporation | | | 1.20 | | | | 4-6-2023 | | | | 4,373,000 | | | | 4,429,343 | |
John Deere Capital Corporation | | | 1.75 | | | | 3-9-2027 | | | | 2,620,000 | | | | 2,683,407 | |
Toyota Motor Credit Corporation | | | 1.35 | | | | 8-25-2023 | | | | 5,711,000 | | | | 5,761,116 | |
Toyota Motor Credit Corporation | | | 2.15 | | | | 2-13-2030 | | | | 1,266,000 | | | | 1,283,028 | |
| | | | |
| | | | | | | | | | | | | | | 52,008,806 | |
| | | | | | | | | | | | | | | | |
|
| Diversified Financial Services: 0.17% | |
General Electric Capital International Funding Company 144A | | | 3.45 | | | | 5-15-2025 | | | | 7,961,000 | | | | 8,090,327 | |
International Lease Finance Corporation | | | 5.88 | | | | 8-15-2022 | | | | 1,414,000 | | | | 1,435,098 | |
| | | | |
| | | | | | | | | | | | | | | 9,525,425 | |
| | | | | | | | | | | | | | | | |
|
| Insurance: 0.97% | |
American International Group Incorporated | | | 2.50 | | | | 6-30-2025 | | | | 11,255,000 | | | | 11,642,000 | |
American International Group Incorporated | | | 3.40 | | | | 6-30-2030 | | | | 4,196,000 | | | | 4,403,050 | |
American International Group Incorporated | | | 4.20 | | | | 4-1-2028 | | | | 2,784,000 | | | | 3,093,634 | |
American International Group Incorporated | | | 4.50 | | | | 7-16-2044 | | | | 2,483,000 | | | | 2,787,587 | |
American International Group Incorporated | | | 4.75 | | | | 4-1-2048 | | | | 3,849,000 | | | | 4,461,803 | |
American International Group Incorporated | | | 5.25 | | | | 4-2-2030 | | | | 4,777,000 | | | | 5,319,269 | |
Brighthouse Financial Incorporated | | | 4.70 | | | | 6-22-2047 | | | | 2,079,000 | | | | 1,831,239 | |
Lincoln National Corporation | | | 3.05 | | | | 1-15-2030 | | | | 6,057,000 | | | | 6,055,531 | |
Nationwide Financial Services Incorporated 144A | | | 3.90 | | | | 11-30-2049 | | | | 4,459,000 | | | | 4,362,372 | |
Nationwide Mutual Insurance Company 144A | | | 4.35 | | | | 4-30-2050 | | | | 2,498,000 | | | | 2,538,557 | |
Prudential Financial Incorporated | | | 1.50 | | | | 3-10-2026 | | | | 7,070,000 | | | | 7,128,722 | |
Prudential Financial Incorporated | | | 4.35 | | | | 2-25-2050 | | | | 1,920,000 | | | | 2,192,128 | |
| | | | |
| | | | | | | | | | | | | | | 55,815,892 | |
| | | | | | | | | | | | | | | | |
|
Health Care: 4.03% | |
|
| Biotechnology: 1.13% | |
AbbVie Incorporated 144A | | | 2.30 | | | | 11-21-2022 | | | | 14,700,000 | | | | 15,173,850 | |
AbbVie Incorporated 144A | | | 2.60 | | | | 11-21-2024 | | | | 6,503,000 | | | | 6,830,356 | |
AbbVie Incorporated | | | 2.90 | | | | 11-6-2022 | | | | 5,026,000 | | | | 5,263,791 | |
AbbVie Incorporated 144A | | | 2.95 | | | | 11-21-2026 | | | | 1,850,000 | | | | 1,983,533 | |
AbbVie Incorporated 144A | | | 3.20 | | | | 11-21-2029 | | | | 5,616,000 | | | | 6,017,306 | |
AbbVie Incorporated | | | 3.75 | | | | 11-14-2023 | | | | 502,000 | | | | 545,828 | |
AbbVie Incorporated 144A | | | 3.80 | | | | 3-15-2025 | | | | 8,675,000 | | | | 9,555,014 | |
AbbVie Incorporated 144A | | | 4.05 | | | | 11-21-2039 | | | | 2,156,000 | | | | 2,419,278 | |
The accompanying notes are an integral part of these financial statements.
38 | Wells Fargo Core Bond Portfolio
Portfolio of investments—May 31, 2020
| | | | | | | | | | | | | | | | |
| | | Interest
rate | | | Maturity
date | | | Principal | | | Value | |
|
| Biotechnology (continued) | |
AbbVie Incorporated 144A | | | 4.25 | % | | | 11-21-2049 | | | $ | 3,562,000 | | | $ | 4,080,854 | |
Amgen Incorporated | | | 2.20 | | | | 2-21-2027 | | | | 2,944,000 | | | | 3,068,708 | |
Amgen Incorporated | | | 2.30 | | | | 2-25-2031 | | | | 3,939,000 | | | | 4,069,743 | |
Amgen Incorporated | | | 3.15 | | | | 2-21-2040 | | | | 2,037,000 | | | | 2,126,474 | |
Amgen Incorporated | | | 3.38 | | | | 2-21-2050 | | | | 1,848,000 | | | | 1,956,476 | |
Biogen Incorporated | | | 3.15 | | | | 5-1-2050 | | | | 2,418,000 | | | | 2,341,265 | |
| | | | |
| | | | | | | | | | | | | �� | | 65,432,476 | |
| | | | | | | | | | | | | | | | |
|
| Health Care Equipment & Supplies: 0.42% | |
Abbott Laboratories | | | 3.75 | | | | 11-30-2026 | | | | 2,340,000 | | | | 2,741,146 | |
Becton Dickinson & Company | | | 2.40 | | | | 6-5-2020 | | | | 6,048,000 | | | | 6,047,407 | |
Danaher Corporation | | | 3.35 | | | | 9-15-2025 | | | | 1,860,000 | | | | 2,046,852 | |
Dentsply Sirona Incorporated | | | 3.25 | | | | 6-1-2030 | | | | 3,022,000 | | | | 3,093,438 | |
Stryker Corporation %% | | | 1.15 | | | | 6-15-2025 | | | | 3,977,000 | | | | 3,973,025 | |
Stryker Corporation %% | | | 1.95 | | | | 6-15-2030 | | | | 3,616,000 | | | | 3,597,816 | |
Stryker Corporation %% | | | 2.90 | | | | 6-15-2050 | | | | 2,786,000 | | | | 2,796,876 | |
| | | | |
| | | | | | | | | | | | | | | 24,296,560 | |
| | | | | | | | | | | | | | | | |
|
| Health Care Providers & Services: 1.07% | |
Aetna Incorporated | | | 3.88 | | | | 8-15-2047 | | | | 1,475,000 | | | | 1,617,619 | |
Anthem Incorporated | | | 2.25 | | | | 5-15-2030 | | | | 4,902,000 | | | | 5,032,635 | |
Anthem Incorporated | | | 3.13 | | | | 5-15-2050 | | | | 1,971,000 | | | | 2,025,508 | |
Anthem Incorporated | | | 3.65 | | | | 12-1-2027 | | | | 2,542,000 | | | | 2,876,179 | |
Cigna Corporation | | | 3.75 | | | | 7-15-2023 | | | | 3,385,000 | | | | 3,682,978 | |
Cigna Corporation | | | 3.40 | | | | 9-17-2021 | | | | 4,089,000 | | | | 4,231,027 | |
Cigna Corporation 144A | | | 3.40 | | | | 3-1-2027 | | | | 4,519,000 | | | | 4,959,891 | |
Cigna Corporation | | | 3.40 | | | | 3-15-2050 | | | | 915,000 | | | | 981,411 | |
Cigna Corporation 144A | | | 3.88 | | | | 10-15-2047 | | | | 3,943,000 | | | | 4,464,385 | |
Cigna Corporation | | | 4.38 | | | | 10-15-2028 | | | | 935,000 | | | | 1,097,308 | |
CVS Health Corporation | | | 3.00 | | | | 8-15-2026 | | | | 2,002,000 | | | | 2,186,686 | |
CVS Health Corporation | | | 3.63 | | | | 4-1-2027 | | | | 2,869,000 | | | | 3,148,936 | |
CVS Health Corporation | | | 3.70 | | | | 3-9-2023 | | | | 4,957,000 | | | | 5,310,171 | |
CVS Health Corporation | | | 4.00 | | | | 12-5-2023 | | | | 2,706,000 | | | | 2,949,466 | |
CVS Health Corporation | | | 4.78 | | | | 3-25-2038 | | | | 1,428,000 | | | | 1,738,736 | |
UnitedHealth Group Incorporated | | | 2.00 | | | | 5-15-2030 | | | | 2,979,000 | | | | 3,067,535 | |
UnitedHealth Group Incorporated | | | 2.38 | | | | 8-15-2024 | | | | 1,067,000 | | | | 1,134,629 | |
UnitedHealth Group Incorporated | | | 2.75 | | | | 5-15-2040 | | | | 2,372,000 | | | | 2,465,052 | |
UnitedHealth Group Incorporated | | | 2.90 | | | | 5-15-2050 | | | | 1,588,000 | | | | 1,649,456 | |
UnitedHealth Group Incorporated | | | 3.13 | | | | 5-15-2060 | | | | 988,000 | | | | 1,039,906 | |
UnitedHealth Group Incorporated | | | 3.50 | | | | 8-15-2039 | | | | 636,000 | | | | 732,041 | |
UnitedHealth Group Incorporated | | | 3.70 | | | | 12-15-2025 | | | | 2,002,000 | | | | 2,279,395 | |
UnitedHealth Group Incorporated | | | 3.75 | | | | 10-15-2047 | | | | 1,601,000 | | | | 1,893,624 | |
UnitedHealth Group Incorporated | | | 3.88 | | | | 8-15-2059 | | | | 1,016,000 | | | | 1,221,729 | |
| | | | |
| | | | | | | | | | | | | | | 61,786,303 | |
| | | | | | | | | | | | | | | | |
|
| Life Sciences Tools & Services: 0.15% | |
Thermo Fisher Scientific Incorporated | | | 4.50 | | | | 3-25-2030 | | | | 6,908,000 | | | | 8,440,543 | |
| | | | | | | | | | | | | | | | |
|
| Pharmaceuticals: 1.26% | |
Bristol-Myers Squibb Company 144A | | | 2.60 | | | | 5-16-2022 | | | | 4,147,000 | | | | 4,319,246 | |
Bristol-Myers Squibb Company 144A | | | 2.75 | | | | 2-15-2023 | | | | 6,469,000 | | | | 6,795,231 | |
Bristol-Myers Squibb Company 144A | | | 2.88 | | | | 2-19-2021 | | | | 1,796,000 | | | | 1,828,657 | |
Bristol-Myers Squibb Company 144A | | | 2.90 | | | | 7-26-2024 | | | | 6,246,000 | | | | 6,742,884 | |
Bristol-Myers Squibb Company 144A | | | 3.20 | | | | 6-15-2026 | | | | 3,754,000 | | | | 4,210,565 | |
Bristol-Myers Squibb Company 144A | | | 3.40 | | | | 7-26-2029 | | | | 1,480,000 | | | | 1,692,378 | |
The accompanying notes are an integral part of these financial statements.
Wells Fargo Core Bond Portfolio | 39
Portfolio of investments—May 31, 2020
| | | | | | | | | | | | | | | | |
| | | Interest
rate | | | Maturity
date | | | Principal | | | Value | |
|
| Pharmaceuticals (continued) | |
Bristol-Myers Squibb Company 144A | | | 3.45 | % | | | 11-15-2027 | | | $ | 2,680,000 | | | $ | 3,065,972 | |
Bristol-Myers Squibb Company 144A | | | 3.88 | | | | 8-15-2025 | | | | 2,062,000 | | | | 2,343,040 | |
Bristol-Myers Squibb Company 144A | | | 3.90 | | | | 2-20-2028 | | | | 2,868,000 | | | | 3,327,825 | |
Bristol-Myers Squibb Company 144A | | | 4.13 | | | | 6-15-2039 | | | | 462,000 | | | | 584,866 | |
Bristol-Myers Squibb Company 144A | | | 4.25 | | | | 10-26-2049 | | | | 1,513,000 | | | | 1,989,317 | |
Bristol-Myers Squibb Company 144A | | | 4.35 | | | | 11-15-2047 | | | | 893,000 | | | | 1,154,282 | |
Eli Lilly and Company | | | 2.25 | | | | 5-15-2050 | | | | 2,813,000 | | | | 2,647,003 | |
Merck & Company Incorporated | | | 3.70 | | | | 2-10-2045 | | | | 1,296,000 | | | | 1,563,040 | |
Novartis Capital Corporation | | | 2.00 | | | | 2-14-2027 | | | | 3,462,000 | | | | 3,658,024 | |
Novartis Capital Corporation | | | 2.20 | | | | 8-14-2030 | | | | 9,771,000 | | | | 10,314,287 | |
Pfizer Incorporated | | | 1.70 | | | | 5-28-2030 | | | | 6,647,000 | | | | 6,669,876 | |
Pfizer Incorporated | | | 2.55 | | | | 5-28-2040 | | | | 3,796,000 | | | | 3,837,237 | |
Pfizer Incorporated | | | 2.70 | | | | 5-28-2050 | | | | 3,796,000 | | | | 3,825,313 | |
Pfizer Incorporated | | | 2.80 | | | | 3-11-2022 | | | | 1,787,000 | | | | 1,863,101 | |
| | | | |
| | | | | | | | | | | | | | | 72,432,144 | |
| | | | | | | | | | | | | | | | |
|
Industrials: 1.45% | |
|
| Aerospace & Defense: 0.70% | |
General Dynamics Corporation | | | 3.25 | | | | 4-1-2025 | | | | 2,320,000 | | | | 2,569,149 | |
General Dynamics Corporation | | | 4.25 | | | | 4-1-2040 | | | | 776,000 | | | | 962,552 | |
Northrop Grumman Corporation | | | 2.55 | | | | 10-15-2022 | | | | 5,868,000 | | | | 6,142,933 | |
Northrop Grumman Corporation | | | 2.93 | | | | 1-15-2025 | | | | 265,000 | | | | 287,192 | |
Northrop Grumman Corporation | | | 3.25 | | | | 8-1-2023 | | | | 5,412,000 | | | | 5,858,764 | |
Northrop Grumman Corporation | | | 3.25 | | | | 1-15-2028 | | | | 3,351,000 | | | | 3,713,654 | |
Northrop Grumman Corporation | | | 4.03 | | | | 10-15-2047 | | | | 1,933,000 | | | | 2,342,103 | |
Northrop Grumman Corporation | | | 5.15 | | | | 5-1-2040 | | | | 2,895,000 | | | | 3,892,081 | |
The Boeing Company | | | 2.70 | | | | 2-1-2027 | | | | 2,852,000 | | | | 2,655,209 | |
The Boeing Company | | | 2.95 | | | | 2-1-2030 | | | | 3,031,000 | | | | 2,886,942 | |
The Boeing Company | | | 5.81 | | | | 5-1-2050 | | | | 2,125,000 | | | | 2,405,329 | |
United Technologies Corporation | | | 3.65 | | | | 8-16-2023 | | | | 373,000 | | | | 404,878 | |
United Technologies Corporation | | | 3.95 | | | | 8-16-2025 | | | | 2,673,000 | | | | 3,040,895 | |
United Technologies Corporation | | | 4.45 | | | | 11-16-2038 | | | | 2,486,000 | | | | 2,994,692 | |
| | | | |
| | | | | | | | | | | | | | | 40,156,373 | |
| | | | | | | | | | | | | | | | |
|
| Electrical Equipment: 0.04% | |
Otis Worldwide Corporation 144A | | | 2.57 | | | | 2-15-2030 | | | | 1,951,000 | | | | 1,970,939 | |
| | | | | | | | | | | | | | | | |
|
| Industrial Conglomerates: 0.16% | |
General Electric Company | | | 3.10 | | | | 1-9-2023 | | | | 650,000 | | | | 669,464 | |
General Electric Company | | | 3.45 | | | | 5-1-2027 | | | | 5,518,000 | | | | 5,463,248 | |
General Electric Company | | | 3.63 | | | | 5-1-2030 | | | | 2,827,000 | | | | 2,795,817 | |
General Electric Company | | | 5.88 | | | | 1-14-2038 | | | | 309,000 | | | | 345,112 | |
| | | | |
| | | | | | | | | | | | | | | 9,273,641 | |
| | | | | | | | | | | | | | | | |
|
| Machinery: 0.11% | |
Deere & Company | | | 2.75 | | | | 4-15-2025 | | | | 3,875,000 | | | | 4,201,580 | |
Deere & Company | | | 3.75 | | | | 4-15-2050 | | | | 1,701,000 | | | | 2,052,221 | |
| | | | |
| | | | | | | | | | | | | | | 6,253,801 | |
| | | | | | | | | | | | | | | | |
|
| Road & Rail: 0.38% | |
Burlington Northern Santa Fe LLC | | | 3.05 | | | | 2-15-2051 | | | | 1,329,000 | | | | 1,378,212 | |
CSX Corporation | | | 4.30 | | | | 3-1-2048 | | | | 238,000 | | | | 289,570 | |
CSX Corporation | | | 2.40 | | | | 2-15-2030 | | | | 561,000 | | | | 586,603 | |
CSX Corporation | | | 4.75 | | | | 11-15-2048 | | | | 1,292,000 | | | | 1,658,036 | |
The accompanying notes are an integral part of these financial statements.
40 | Wells Fargo Core Bond Portfolio
Portfolio of investments—May 31, 2020
| | | | | | | | | | | | | | | | |
| | | Interest
rate | | | Maturity
date | | | Principal | | | Value | |
|
| Road & Rail (continued) | |
Union Pacific Corporation | | | 2.15 | % | | | 2-5-2027 | | | $ | 2,938,000 | | | $ | 3,082,984 | |
Union Pacific Corporation | | | 2.40 | | | | 2-5-2030 | | | | 3,634,000 | | | | 3,795,158 | |
Union Pacific Corporation | | | 2.95 | | | | 3-1-2022 | | | | 3,290,000 | | | | 3,425,518 | |
Union Pacific Corporation | | | 3.15 | | | | 3-1-2024 | | | | 1,579,000 | | | | 1,706,702 | |
Union Pacific Corporation | | | 3.25 | | | | 2-5-2050 | | | | 4,665,000 | | | | 4,934,775 | |
Union Pacific Corporation | | | 3.75 | | | | 2-5-2070 | | | | 592,000 | | | | 645,715 | |
Union Pacific Corporation | | | 4.30 | | | | 3-1-2049 | | | | 489,000 | | | | 614,758 | |
| | | | |
| | | | | | | | | | | | | | | 22,118,031 | |
| | | | | | | | | | | | | | | | |
|
| Transportation Infrastructure: 0.06% | |
Crowley Conro LLC | | | 4.18 | | | | 8-15-2043 | | | | 2,789,920 | | | | 3,510,825 | |
| | | | | | | | | | | | | | | | |
|
Information Technology: 2.41% | |
|
| IT Services: 0.44% | |
Fiserv Incorporated | | | 3.20 | | | | 7-1-2026 | | | | 3,187,000 | | | | 3,467,505 | |
Fiserv Incorporated | | | 3.50 | | | | 7-1-2029 | | | | 3,418,000 | | | | 3,772,067 | |
Fiserv Incorporated | | | 4.20 | | | | 10-1-2028 | | | | 318,000 | | | | 368,536 | |
IBM Corporation | | | 3.30 | | | | 5-15-2026 | | | | 1,095,000 | | | | 1,226,394 | |
IBM Corporation | | | 4.15 | | | | 5-15-2039 | | | | 1,364,000 | | | | 1,622,190 | |
Mastercard Incorporated | | | 3.30 | | | | 3-26-2027 | | | | 1,899,000 | | | | 2,153,370 | |
Mastercard Incorporated | | | 3.85 | | | | 3-26-2050 | | | | 330,000 | | | | 418,346 | |
Paypal Holdings Incorporated | | | 1.35 | | | | 6-1-2023 | | | | 5,137,000 | | | | 5,218,425 | |
Paypal Holdings Incorporated | | | 1.65 | | | | 6-1-2025 | | | | 7,193,000 | | | | 7,367,224 | |
| | | | |
| | | | | | | | | | | | | | | 25,614,057 | |
| | | | | | | | | | | | | | | | |
|
| Semiconductors & Semiconductor Equipment: 1.17% | |
Broadcom Incorporated 144A | | | 3.15 | | | | 11-15-2025 | | | | 10,424,000 | | | | 10,803,250 | |
Broadcom Incorporated | | | 3.88 | | | | 1-15-2027 | | | | 4,502,000 | | | | 4,736,805 | |
Broadcom Incorporated 144A | | | 4.15 | | | | 11-15-2030 | | | | 8,867,000 | | | | 9,216,886 | |
Broadcom Incorporated 144A | | | 4.25 | | | | 4-15-2026 | | | | 3,187,000 | | | | 3,412,357 | |
Broadcom Incorporated 144A | | | 4.70 | | | | 4-15-2025 | | | | 4,663,000 | | | | 5,110,210 | |
Broadcom Incorporated 144A | | | 5.00 | | | | 4-15-2030 | | | | 2,476,000 | | | | 2,733,350 | |
Intel Corporation | | | 2.45 | | | | 11-15-2029 | | | | 2,184,000 | | | | 2,340,406 | |
Intel Corporation | | | 4.60 | | | | 3-25-2040 | | | | 1,890,000 | | | | 2,455,312 | |
KLA Corporation | | | 3.30 | | | | 3-1-2050 | | | | 2,522,000 | | | | 2,534,880 | |
Lam Research Corporation | | | 1.90 | | | | 6-15-2030 | | | | 3,385,000 | | | | 3,404,367 | |
Lam Research Corporation | | | 2.88 | | | | 6-15-2050 | | | | 3,334,000 | | | | 3,376,067 | |
Lam Research Corporation | | | 3.13 | | | | 6-15-2060 | | | | 1,375,000 | | | | 1,426,282 | |
Micron Technology Incorporated | | | 2.50 | | | | 4-24-2023 | | | | 5,867,000 | | | | 6,006,800 | |
NVIDIA Corporation | | | 3.50 | | | | 4-1-2040 | | | | 1,916,000 | | | | 2,194,115 | |
NVIDIA Corporation | | | 3.50 | | | | 4-1-2050 | | | | 4,777,000 | | | | 5,423,749 | |
Texas Instruments Incorporated | | | 1.38 | | | | 3-12-2025 | | | | 2,353,000 | | | | 2,419,113 | |
| | | | |
| | | | | | | | | | | | | | | 67,593,949 | |
| | | | | | | | | | | | | | | | |
|
| Software: 0.57% | |
Adobe Incorporated | | | 2.30 | | | | 2-1-2030 | | | | 6,598,000 | | | | 7,042,818 | |
Microsoft Corporation | | | 2.53 | | | | 6-1-2050 | | | | 1,109,000 | | | | 1,106,892 | |
Microsoft Corporation | | | 2.68 | | | | 6-1-2060 | | | | 2,388,000 | | | | 2,310,853 | |
Microsoft Corporation | | | 2.88 | | | | 2-6-2024 | | | | 1,134,000 | | | | 1,228,637 | |
Microsoft Corporation | | | 4.10 | | | | 2-6-2037 | | | | 1,872,000 | | | | 2,379,532 | |
Oracle Corporation | | | 2.63 | | | | 2-15-2023 | | | | 2,457,000 | | | | 2,590,241 | |
Oracle Corporation | | | 2.80 | | | | 4-1-2027 | | | | 5,670,000 | | | | 6,148,054 | |
Oracle Corporation | | | 2.95 | | | | 11-15-2024 | | | | 1,319,000 | | | | 1,435,872 | |
Oracle Corporation | | | 3.80 | | | | 11-15-2037 | | | | 1,346,000 | | | | 1,531,093 | |
The accompanying notes are an integral part of these financial statements.
Wells Fargo Core Bond Portfolio | 41
Portfolio of investments—May 31, 2020
| | | | | | | | | | | | | | | | |
| | | Interest
rate | | | Maturity
date | | | Principal | | | Value | |
|
| Software (continued) | |
Oracle Corporation | | | 3.85 | % | | | 4-1-2060 | | | $ | 3,136,000 | | | $ | 3,582,490 | |
Oracle Corporation | | | 4.00 | | | | 11-15-2047 | | | | 2,861,000 | | | | 3,360,586 | |
| | | | |
| | | | | | | | | | | | | | | 32,717,068 | |
| | | | | | | | | | | | | | | | |
|
| Technology Hardware, Storage & Peripherals: 0.23% | |
Apple Incorporated | | | 2.05 | | | | 9-11-2026 | | | | 5,954,000 | | | | 6,358,793 | |
Apple Incorporated | | | 2.65 | | | | 5-11-2050 | | | | 2,632,000 | | | | 2,699,746 | |
Apple Incorporated | | | 2.95 | | | | 9-11-2049 | | | | 381,000 | | | | 411,574 | |
Apple Incorporated | | | 3.20 | | | | 5-13-2025 | | | | 1,357,000 | | | | 1,524,725 | |
Apple Incorporated | | | 4.25 | | | | 2-9-2047 | | | | 1,624,000 | | | | 2,114,625 | |
| | | | |
| | | | | | | | | | | | | | | 13,109,463 | |
| | | | | | | | | | | | | | | | |
|
Materials: 0.76% | |
|
| Chemicals: 0.21% | |
Air Products and Chemicals Incorporated | | | 2.70 | | | | 5-15-2040 | | | | 951,000 | | | | 985,854 | |
DuPont de Nemours Incorporated | | | 4.21 | | | | 11-15-2023 | | | | 4,914,000 | | | | 5,343,632 | |
DuPont de Nemours Incorporated | | | 4.49 | | | | 11-15-2025 | | | | 3,497,000 | | | | 3,967,383 | |
Mosaic Company | | | 5.45 | | | | 11-15-2033 | | | | 275,000 | | | | 279,487 | |
Mosaic Company | | | 5.63 | | | | 11-15-2043 | | | | 1,332,000 | | | | 1,360,779 | |
| | | | |
| | | | | | | | | | | | | | | 11,937,135 | |
| | | | | | | | | | | | | | | | |
|
| Containers & Packaging: 0.11% | |
International Paper Company | | | 4.40 | | | | 8-15-2047 | | | | 1,863,000 | | | | 2,078,697 | |
Packaging Corporation of America | | | 3.00 | | | | 12-15-2029 | | | | 1,615,000 | | | | 1,696,511 | |
Westrock Company | | | 4.90 | | | | 3-15-2029 | | | | 2,113,000 | | | | 2,431,506 | |
| | | | |
| | | | | | | | | | | | | | | 6,206,714 | |
| | | | | | | | | | | | | | | | |
|
| Metals & Mining: 0.19% | |
Barrick Gold Finance Company LLC | | | 5.70 | | | | 5-30-2041 | | | | 2,268,000 | | | | 3,012,154 | |
Barrick North America Finance LLC | | | 5.75 | | | | 5-1-2043 | | | | 866,000 | | | | 1,190,216 | |
Newmont MIning Corporation | | | 2.25 | | | | 10-1-2030 | | | | 2,973,000 | | | | 2,941,601 | |
Nucor Corporation | | | 2.00 | | | | 6-1-2025 | | | | 1,987,000 | | | | 2,022,629 | |
Nucor Corporation | | | 2.70 | | | | 6-1-2030 | | | | 1,987,000 | | | | 2,020,404 | |
| | | | |
| | | | | | | | | | | | | | | 11,187,004 | |
| | | | | | | | | | | | | | | | |
|
| Paper & Forest Products: 0.25% | |
Georgia Pacific LLC 144A | | | 1.75 | | | | 9-30-2025 | | | | 6,269,000 | | | | 6,403,028 | |
Georgia Pacific LLC 144A | | | 2.10 | | | | 4-30-2027 | | | | 3,025,000 | | | | 3,077,950 | |
Georgia Pacific LLC 144A | | | 2.30 | | | | 4-30-2030 | | | | 4,968,000 | | | | 5,074,911 | |
| | | | |
| | | | | | | | | | | | | | | 14,555,889 | |
| | | | | | | | | | | | | | | | |
|
Real Estate: 0.99% | |
|
| Equity REITs: 0.81% | |
Alexandria Real Estate Equities Incorporated | | | 4.90 | | | | 12-15-2030 | | | | 1,899,000 | | | | 2,304,719 | |
Crown Castle International Corporation | | | 3.30 | | | | 7-1-2030 | | | | 5,340,000 | | | | 5,776,297 | |
Crown Castle International Corporation | | | 4.00 | | | | 3-1-2027 | | | | 924,000 | | | | 1,033,254 | |
Equinix Incorporated | | | 2.63 | | | | 11-18-2024 | | | | 2,506,000 | | | | 2,644,331 | |
Equinix Incorporated | | | 2.90 | | | | 11-18-2026 | | | | 5,223,000 | | | | 5,514,809 | |
Mid-America Apartments LP | | | 3.60 | | | | 6-1-2027 | | | | 279,000 | | | | 297,952 | |
Mid-America Apartments LP | | | 3.75 | | | | 6-15-2024 | | | | 4,347,000 | | | | 4,476,554 | |
Mid-America Apartments LP | | | 3.95 | | | | 3-15-2029 | | | | 1,873,000 | | | | 2,070,509 | |
Mid-America Apartments LP | | | 4.00 | | | | 11-15-2025 | | | | 2,277,000 | | | | 2,366,456 | |
The accompanying notes are an integral part of these financial statements.
42 | Wells Fargo Core Bond Portfolio
Portfolio of investments—May 31, 2020
| | | | | | | | | | | | | | | | |
| | | Interest
rate | | | Maturity
date | | | Principal | | | Value | |
|
| Equity REITs (continued) | |
Mid-America Apartments LP | | | 4.30 | % | | | 10-15-2023 | | | $ | 1,907,000 | | | $ | 1,991,903 | |
Realty Income Corporation | | | 3.25 | | | | 1-15-2031 | | | | 4,248,000 | | | | 4,341,695 | |
Regency Centers LP | | | 2.95 | | | | 9-15-2029 | | | | 4,046,000 | | | | 3,885,160 | |
Regency Centers LP | | | 3.70 | | | | 6-15-2030 | | | | 1,390,000 | | | | 1,430,074 | |
Store Capital Corporation | | | 4.50 | | | | 3-15-2028 | | | | 7,002,000 | | | | 6,588,032 | |
Store Capital Corporation | | | 4.63 | | | | 3-15-2029 | | | | 2,381,000 | | | | 2,214,531 | |
| | | | |
| | | | | | | | | | | | | | | 46,936,276 | |
| | | | | | | | | | | | | | | | |
|
| Real Estate Management & Development: 0.18% | |
Federal Realty Investment Trust | | | 3.95 | | | | 1-15-2024 | | | | 2,954,000 | | | | 3,068,503 | |
Spirit Realty LP | | | 3.40 | | | | 1-15-2030 | | | | 2,242,000 | | | | 1,925,961 | |
Spirit Realty LP | | | 4.00 | | | | 7-15-2029 | | | | 1,079,000 | | | | 978,233 | |
Spirit Realty LP | | | 4.45 | | | | 9-15-2026 | | | | 229,000 | | | | 219,235 | |
Ventas Realty LP | | | 4.75 | | | | 11-15-2030 | | | | 3,840,000 | | | | 3,995,904 | |
| | | | |
| | | | | | | | | | | | | | | 10,187,836 | |
| | | | | | | | | | | | | | | | |
|
Utilities: 2.59% | |
|
| Electric Utilities: 1.65% | |
Alabama Power Company | | | 3.45 | | | | 10-1-2049 | | | | 3,720,000 | | | | 4,045,616 | |
Arizona Public Service Company | | | 3.15 | | | | 5-15-2025 | | | | 4,707,000 | | | | 5,139,058 | |
Duke Energy Corporation | | | 1.80 | | | | 9-1-2021 | | | | 3,918,000 | | | | 3,964,489 | |
Duke Energy Corporation | | | 2.45 | | | | 6-1-2030 | | | | 3,068,000 | | | | 3,159,109 | |
Duke Energy Corporation | | | 2.65 | | | | 9-1-2026 | | | | 2,431,000 | | | | 2,601,942 | |
Duke Energy Ohio Incorporated | | | 2.13 | | | | 6-1-2030 | | | | 2,846,000 | | | | 2,924,312 | |
Edison International | | | 4.13 | | | | 3-15-2028 | | | | 13,000 | | | | 13,505 | |
Evergy Incorporated | | | 2.45 | | | | 9-15-2024 | | | | 3,471,000 | | | | 3,630,701 | |
Evergy Incorporated | | | 2.90 | | | | 9-15-2029 | | | | 3,445,000 | | | | 3,591,935 | |
Evergy Kansas Central Incorporated | | | 3.45 | | | | 4-15-2050 | | | | 5,015,000 | | | | 5,441,867 | |
Evergy Metro Incorporated | | | 2.25 | | | | 6-1-2030 | | | | 3,798,000 | | | | 3,900,395 | |
Exelon Corporation | | | 4.70 | | | | 4-15-2050 | | | | 4,215,000 | | | | 5,256,809 | |
Exelon Generation Company LLC | | | 3.25 | | | | 6-1-2025 | | | | 5,253,000 | | | | 5,437,942 | |
FirstEnergy Corporation | | | 3.90 | | | | 7-15-2027 | | | | 3,471,000 | | | | 3,893,457 | |
FirstEnergy Corporation | | | 2.85 | | | | 7-15-2022 | | | | 816,000 | | | | 841,916 | |
FirstEnergy Corporation | | | 4.25 | | | | 3-15-2023 | | | | 4,725,000 | | | | 5,102,332 | |
Interstate Power & Light Company | | | 3.50 | | | | 9-30-2049 | | | | 1,426,000 | | | | 1,517,013 | |
ITC Holdings Corporation | | | 2.70 | | | | 11-15-2022 | | | | 3,746,000 | | | | 3,890,167 | |
Metropolitan Edison Company 144A | | | 4.30 | | | | 1-15-2029 | | | | 2,938,000 | | | | 3,423,282 | |
Mississippi Power Company | | | 3.95 | | | | 3-30-2028 | | | | 4,562,000 | | | | 5,076,214 | |
Mississippi Power Company | | | 4.25 | | | | 3-15-2042 | | | | 2,741,000 | | | | 2,999,917 | |
National Fuel Gas Company %% | | | 5.50 | | | | 1-15-2026 | | | | 993,000 | | | | 1,012,944 | |
Pennsylvania Electric Compnay 144A | | | 3.25 | | | | 3-15-2028 | | | | 1,572,000 | | | | 1,685,068 | |
Public Service Electric and Gas Company | | | 2.70 | | | | 5-1-2050 | | | | 4,126,000 | | | | 4,122,359 | |
South Carolina Edison Company | | | 4.13 | | | | 3-1-2048 | | | | 3,033,000 | | | | 3,423,733 | |
Southern California Edison Company | | | 2.85 | | | | 8-1-2029 | | | | 1,890,000 | | | | 1,969,574 | |
Southern California Edison Company | | | 4.65 | | | | 10-1-2043 | | | | 893,000 | | | | 1,039,348 | |
Southern California Gas Company | | | 2.55 | | | | 2-1-2030 | | | | 2,903,000 | | | | 3,088,448 | |
Southern California Gas Company | | | 2.60 | | | | 6-15-2026 | | | | 1,065,000 | | | | 1,142,229 | |
Trans-Allegheny Interstate Line Company 144A | | | 3.85 | | | | 6-1-2025 | | | | 1,306,000 | | | | 1,449,183 | |
| | | | |
| | | | | | | | | | | | | | | 94,784,864 | |
| | | | | | | | | | | | | | | | |
|
| Multi-Utilities: 0.94% | |
Ameren Corporation | | | 3.50 | | | | 1-15-2031 | | | | 890,000 | | | | 988,822 | |
Black Hills Corporation | | | 3.05 | | | | 10-15-2029 | | | | 6,014,000 | | | | 6,135,562 | |
Black Hills Corporation | | | 3.88 | | | | 10-15-2049 | | | | 1,675,000 | | | | 1,680,749 | |
The accompanying notes are an integral part of these financial statements.
Wells Fargo Core Bond Portfolio | 43
Portfolio of investments—May 31, 2020
| | | | | | | | | | | | | | | | |
| | | Interest
rate | | | Maturity
date | | | Principal | | | Value | |
|
| Multi-Utilities (continued) | |
CenterPoint Energy Incorporated | | | 2.50 | % | | | 9-1-2022 | | | $ | 377,000 | | | $ | 388,685 | |
CenterPoint Energy Incorporated | | | 2.50 | | | | 9-1-2024 | | | | 4,055,000 | | | | 4,207,504 | |
CenterPoint Energy Incorporated | | | 2.95 | | | | 3-1-2030 | | | | 1,761,000 | | | | 1,854,291 | |
CenterPoint Energy Incorporated | | | 4.10 | | | | 9-1-2047 | | | | 1,813,000 | | | | 1,923,657 | |
Consumers Energy Company | | | 2.50 | | | | 5-1-2060 | | | | 1,570,000 | | | | 1,473,383 | |
Dominion Resources Incorporated | | | 2.00 | | | | 8-15-2021 | | | | 2,612,000 | | | | 2,646,077 | |
Dominion Resources Incorporated | | | 2.85 | | | | 8-15-2026 | | | | 2,413,000 | | | | 2,543,974 | |
DTE Energy Company | | | 2.53 | | | | 10-1-2024 | | | | 3,309,000 | | | | 3,419,821 | |
DTE Energy Company | | | 2.95 | | | | 3-1-2030 | | | | 2,493,000 | | | | 2,554,814 | |
DTE Energy Company | | | 2.95 | | | | 3-1-2050 | | | | 4,115,000 | | | | 4,252,159 | |
DTE Energy Company | | | 3.80 | | | | 3-15-2027 | | | | 3,747,000 | | | | 4,032,667 | |
Midamerican Energy Company | | | 3.65 | | | | 8-1-2048 | | | | 1,976,000 | | | | 2,287,403 | |
NextEra Energy Capital Company | | | 2.25 | | | | 6-1-2030 | | | | 5,941,000 | | | | 6,052,230 | |
NextEra Energy Capital Company | | | 2.75 | | | | 5-1-2025 | | | | 6,104,000 | | | | 6,527,503 | |
NiSource Incorporated | | | 3.60 | | | | 5-1-2030 | | | | 1,094,000 | | | | 1,236,314 | |
| | | | |
| | | | | | | | | | | | | | | 54,205,615 | |
| | | | | | | | | | | | | | | | |
| |
Total Corporate Bonds and Notes (Cost $1,456,340,605) | | | | 1,534,288,681 | |
| | | | | | | | | | | | | | | | |
|
Foreign Corporate Bonds and Notes: 0.01% | |
|
Energy: 0.01% | |
|
| Oil, Gas & Consumable Fuels: 0.01% | |
EnCana Corporation | | | 6.63 | | | | 8-15-2037 | | | CAD | 979,000 | | | | 728,445 | |
| | | | | | | | | | | | | | | | |
| |
Total Foreign Corporate Bonds and Notes (Cost $1,165,761) | | | | 728,445 | |
| | | | | | | | | | | | | | | | |
|
Municipal Obligations: 0.55% | |
|
California: 0.17% | |
| | | | |
| GO Revenue: 0.17% | | | | | | | | | | | | |
California Build America Bonds | | | 7.60 | | | | 11-1-2040 | | | $ | 830,000 | | | | 1,475,964 | |
Los Angeles CA Community College District Build America Bonds | | | 6.75 | | | | 8-1-2049 | | | | 4,690,000 | | | | 7,966,387 | |
| | | | |
| | | | | | | | | | | | | | | 9,442,351 | |
| | | | | | | | | | | | | | | | |
| | | | |
Nevada: 0.08% | | | | | | | | | | | | | | | | |
| | | | |
| Airport Revenue: 0.08% | | | | | | | | | | | | |
Clark County NV Airport Authority Build America Bonds Series C | | | 6.82 | | | | 7-1-2045 | | | | 3,365,000 | | | | 4,770,931 | |
| | | | | | | | | | | | | | | | |
| | | | |
New York: 0.12% | | | | | | | | | | | | | | | | |
| | | | |
| Airport Revenue: 0.12% | | | | | | | | | | | | |
Port Authority of New York & New Jersey Consolidated Bonds Series 174 | | | 4.46 | | | | 10-1-2062 | | | | 5,505,000 | | | | 6,948,081 | |
| | | | | | | | | | | | | | | | |
| | | | |
Ohio: 0.05% | | | | | | | | | | | | | | | | |
| | | | |
| Education Revenue: 0.05% | | | | | | | | | | | | |
Ohio State University General Receipts Taxable Bonds Series A | | | 4.80 | | | | 6-1-2111 | | | | 1,957,000 | | | | 2,817,747 | |
| | | | | | | | | | | | | | | | |
| | | | |
Texas: 0.13% | | | | | | | | | | | | | | | | |
| | | | |
| Education Revenue: 0.03% | | | | | | | | | | | | |
University of Texas Financing System Bond Series B | | | 2.44 | | | | 8-15-2049 | | | | 1,695,000 | | | | 1,697,305 | |
| | | | | | | | | | | | | | | | |
| | | | |
| Transportation Revenue: 0.10% | | | | | | | | | | | | |
North Texas Tollway Authority | | | 6.72 | | | | 1-1-2049 | | | | 3,609,000 | | | | 6,014,435 | |
| | | | | | | | | | | | | | | | |
| | | | |
| | | | | | | | | | | | | | | 7,711,740 | |
| | | | | | | | | | | | | | | | |
| |
Total Municipal Obligations (Cost $23,744,438) | | | | 31,690,850 | |
| | | | | | | | | | | | | | | | |
The accompanying notes are an integral part of these financial statements.
44 | Wells Fargo Core Bond Portfolio
Portfolio of investments—May 31, 2020
| | | | | | | | | | | | | | | | |
| | | Interest
rate | | | Maturity
date | | | Principal | | | Value | |
| Non-Agency Mortgage-Backed Securities: 3.63% | |
Angel Oak Mortgage Trust Series 2019-2 Class A1 144A±± | | | 3.63 | % | | | 3-25-2049 | | | $ | 2,431,305 | | | $ | 2,460,026 | |
Angel Oak Mortgage Trust Series 2020-2 Class A1 144A±± | | | 2.53 | | | | 1-26-2065 | | | | 7,967,000 | | | | 7,965,607 | |
Benchmark Mortgage Trust Series 2018-B1 Class ASB ±± | | | 3.60 | | | | 1-15-2051 | | | | 1,620,000 | | | | 1,760,198 | |
Bunker Hill Loan Depositary Trust Series 2019-1 Class A1 144A | | | 3.61 | | | | 10-26-2048 | | | | 3,021,369 | | | | 3,066,894 | |
Bunker Hill Loan Depositary Trust Series 2019-2 Class A1 144A | | | 2.88 | | | | 7-25-2049 | | | | 5,289,032 | | | | 5,272,206 | |
Bunker Hill Loan Depositary Trust Series 2019-3 Class A1 144A | | | 2.72 | | | | 11-25-2059 | | | | 6,243,659 | | | | 6,285,324 | |
CD Commercial Mortgage Trust Series 2016-CD1 Class A1 | | | 1.44 | | | | 8-10-2049 | | | | 612,071 | | | | 611,502 | |
CD Commercial Mortgage Trust Series 2017-CD4 Class A4 ±± | | | 3.51 | | | | 5-10-2050 | | | | 2,986,000 | | | | 3,265,925 | |
CD Commercial Mortgage Trust Series 2017-CD4 Class ASB | | | 3.32 | | | | 5-10-2050 | | | | 2,105,000 | | | | 2,244,851 | |
CD Commercial Mortgage Trust Series 2017-CD6 Class ASB | | | 3.33 | | | | 11-13-2050 | | | | 5,323,000 | | | | 5,690,651 | |
CFCRE Commercial Mortgage Trust Series 2016-C3 Class A1 | | | 1.79 | | | | 1-10-2048 | | | | 517,720 | | | | 517,922 | |
CFCRE Commercial Mortgage Trust Series 2017-C8 Class A1 | | | 1.96 | | | | 6-15-2050 | | | | 359,129 | | | | 359,554 | |
CFCRE Commercial Mortgage Trust Series 2017-C8 Class ASB | | | 3.37 | | | | 6-15-2050 | | | | 2,014,000 | | | | 2,143,823 | |
Citigroup Commercial Mortgage Trust Series 2016- P5 Class A1 | | | 1.41 | | | | 10-10-2049 | | | | 523,192 | | | | 522,755 | |
Colt Funding LLC Series 2019-1 Class A1 144A±± | | | 3.71 | | | | 3-25-2049 | | | | 1,978,636 | | | | 1,988,773 | |
Colt Funding LLC Series 2019-2 Class A1 144A±± | | | 3.34 | | | | 5-25-2049 | | | | 3,752,733 | | | | 3,775,345 | |
Colt Funding LLC Series 2019-4 Class A1 144A±± | | | 2.58 | | | | 11-25-2049 | | | | 4,641,768 | | | | 4,635,531 | |
Commercial Mortgage Pass-Through Certificate Series 2015-LC21 Class A4 | | | 3.71 | | | | 7-10-2048 | | | | 1,777,000 | | | | 1,932,949 | |
Commercial Mortgage Pass-Through Certificate Series 2015-LC23 Class A4 | | | 3.77 | | | | 10-10-2048 | | | | 3,551,000 | | | | 3,881,149 | |
Commercial Mortgage Pass-Through Certificate Series 2016-C1 Class ASB | | | 2.97 | | | | 10-10-2049 | | | | 2,071,000 | | | | 2,166,315 | |
CSAIL Commercial Mortgage Trust Series 2015-C2 Class A4 | | | 3.50 | | | | 6-15-2057 | | | | 2,953,000 | | | | 3,149,646 | |
CSAIL Commercial Mortgage Trust Series 2015-C4 Class A4 | | | 3.81 | | | | 11-15-2048 | | | | 4,102,200 | | | | 4,382,729 | |
CSAIL Commercial Mortgage Trust Series 2016-C5 Class ASB | | | 3.53 | | | | 11-15-2048 | | | | 865,000 | | | | 908,473 | |
Deutsche Bank Commercial Mortgage Trust Series 2017-C6 Class ASB | | | 3.12 | | | | 6-10-2050 | | | | 1,249,000 | | | | 1,319,453 | |
GCAT Series 2019-NQM1 Class A1 144A | | | 2.99 | | | | 2-25-2059 | | | | 1,960,207 | | | | 2,004,886 | |
Goldman Sachs Mortgage Securities Trust Series 2012-GCJ7 Class AAB | | | 2.94 | | | | 5-10-2045 | | | | 86,012 | | | | 86,247 | |
Goldman Sachs Mortgage Securities Trust Series 2014-GCJ18 Class A3 | | | 3.80 | | | | 1-10-2047 | | | | 1,727,233 | | | | 1,784,756 | |
Goldman Sachs Mortgage Securities Trust Series 2015-GC28 Class A5 | | | 3.40 | | | | 2-10-2048 | | | | 1,355,000 | | | | 1,429,151 | |
Goldman Sachs Mortgage Securities Trust Series 2015-GC34 Class A4 | | | 3.51 | | | | 10-10-2048 | | | | 3,317,000 | | | | 3,586,161 | |
Goldman Sachs Mortgage Securities Trust Series 2020-GC47 Class A5 | | | 2.38 | | | | 5-12-2053 | | | | 4,162,000 | | | | 4,290,695 | |
Impact Funding LLC Series 2010-1 Class A1 144A | | | 5.31 | | | | 1-25-2051 | | | | 6,345,963 | | | | 6,779,428 | |
JPMDB Commercial Mortgage Securities Series 2014-C23 Class A4 | | | 3.67 | | | | 9-15-2047 | | | | 2,419,000 | | | | 2,581,971 | |
JPMDB Commercial Mortgage Securities Series 2015-C33 Class A4 | | | 3.77 | | | | 12-15-2048 | | | | 1,554,714 | | | | 1,702,954 | |
JPMDB Commercial Mortgage Securities Series 2017-C5 Class ASB | | | 3.49 | | | | 3-15-2050 | | | | 861,000 | | | | 920,090 | |
JPMDB Commercial Mortgage Securities Series 2018-C8 Class ASB | | | 4.15 | | | | 6-15-2051 | | | | 2,714,000 | | | | 3,022,876 | |
JPMorgan Chase Commercial Mortgage Securities Trust Series 2014-GC26 Class A4 | | | 3.49 | | | | 1-15-2048 | | | | 3,433,202 | | | | 3,668,458 | |
JPMorgan Chase Commercial Mortgage Securities Trust Series 2015-C28 Class A3 | | | 2.91 | | | | 10-15-2048 | | | | 10,025,969 | | | | 10,472,973 | |
JPMorgan Chase Commercial Mortgage Securities Trust Series 2015-C29 Class A4 | | | 3.61 | | | | 5-15-2048 | | | | 2,663,000 | | | | 2,877,049 | |
JPMorgan Chase Commercial Mortgage Securities Trust Series 2017-JP6 Class ASB | | | 3.28 | | | | 7-15-2050 | | | | 2,343,000 | | | | 2,498,829 | |
Morgan Stanley Bank of America Merrill Lynch Trust Series 2013 -C10 Class A4 ±± | | | 4.08 | | | | 7-15-2046 | | | | 532,000 | | | | 563,860 | |
Morgan Stanley Bank of America Merrill Lynch Trust Series 2015-C125 Class ASB | | | 3.38 | | | | 10-15-2048 | | | | 1,689,000 | | | | 1,767,674 | |
Morgan Stanley Bank of America Merrill Lynch Trust Series 2015-C20 Class A4 | | | 3.25 | | | | 2-15-2048 | | | | 800,041 | | | | 844,428 | |
Morgan Stanley Bank of America Merrill Lynch Trust Series 2015-C27 Class A4 | | | 3.75 | | | | 12-15-2047 | | | | 754,000 | | | | 808,853 | |
Morgan Stanley Capital I Trust Series 2016-UB11 Class A1 | | | 1.45 | | | | 8-15-2049 | | | | 1,049,928 | | | | 1,048,730 | |
Morgan Stanley Capital I Trust Series 2016-UB11 Class ASB | | | 2.61 | | | | 8-15-2049 | | | | 2,119,000 | | | | 2,183,278 | |
New Residential Mortgage Loan Trust Series 2019-NQM2 Class A1 144A±± | | | 3.60 | | | | 4-25-2049 | | | | 2,528,871 | | | | 2,556,320 | |
The accompanying notes are an integral part of these financial statements.
Wells Fargo Core Bond Portfolio | 45
Portfolio of investments—May 31, 2020
| | | | | | | | | | | | | | | | |
| | | Interest
rate | | | Maturity
date | | | Principal | | | Value | |
| Non-Agency Mortgage-Backed Securities (continued) | |
New Residential Mortgage Loan Trust Series 2019-NQM4 Class A1 144A±± | | | 2.49 | % | | | 9-25-2059 | | | $ | 4,242,720 | | | $ | 4,136,895 | |
SG Capital Partners Series 2019-3 Class A1 144A±± | | | 2.70 | | | | 9-25-2059 | | | | 4,515,720 | | | | 4,507,785 | |
Starwood Mortgage Residential Trust Series 2019-INV1 Class A1 144A±± | | | 2.61 | | | | 9-27-2049 | | | | 4,735,707 | | | | 4,679,627 | |
Starwood Mortgage Residential Trust Series 2020-1 Class A1 144A±± | | | 2.28 | | | | 2-25-2050 | | | | 8,062,265 | | | | 8,052,371 | |
Verus Securitization Trust Series 2019-1 Class A1 144A±± | | | 3.40 | | | | 12-25-2059 | | | | 3,864,356 | | | | 3,920,275 | |
Verus Securitization Trust Series 2019-1 Class A1 144A±± | | | 3.84 | | | | 2-25-2059 | | | | 1,977,832 | | | | 1,996,915 | |
Verus Securitization Trust Series 2019-2 Class A1 144A±± | | | 2.91 | | | | 7-25-2059 | | | | 4,651,644 | | | | 4,688,731 | |
Verus Securitization Trust Series 2019-2 Class A1 144A±± | | | 3.21 | | | | 5-25-2059 | | | | 9,092,150 | | | | 9,153,617 | |
Verus Securitization Trust Series 2019-3 Class A1 144A±± | | | 2.69 | | | | 11-25-2059 | | | | 2,935,180 | | | | 2,885,785 | |
Verus Securitization Trust Series 2019-3 Class A1 144A | | | 2.78 | | | | 7-25-2059 | | | | 8,989,567 | | | | 9,097,940 | |
Verus Securitization Trust Series 2019-4 Class A1 144A | | | 2.64 | | | | 11-25-2059 | | | | 12,926,857 | | | | 13,020,995 | |
Verus Securitization Trust Series 2020-1 Class A1 144A±± | | | 2.42 | | | | 1-25-2060 | | | | 2,828,505 | | | | 2,839,969 | |
Verus Securitization Trust Series 2020-2 Class A1 144A±± | | | 2.23 | | | | 5-25-2060 | | | | 10,053,000 | | | | 10,043,637 | |
Visio Trust Series 2019-1 Class A1 144A±± | | | 3.57 | | | | 6-25-2054 | | | | 2,371,944 | | | | 2,398,537 | |
| |
Total Non-Agency Mortgage-Backed Securities (Cost $206,132,890) | | | | 209,210,347 | |
| | | | | | | | | | | | | | | | |
|
| U.S. Treasury Securities: 13.54% | |
U.S. Treasury Bond %% | | | 1.13 | | | | 5-15-2040 | | | | 80,287,000 | | | | 79,459,040 | |
U.S. Treasury Bond | | | 1.25 | | | | 5-15-2050 | | | | 34,970,000 | | | | 33,516,559 | |
U.S. Treasury Bond | | | 2.00 | | | | 2-15-2050 | | | | 16,443,000 | | | | 18,797,047 | |
U.S. Treasury Bond | | | 2.38 | | | | 11-15-2049 | | | | 5,813,000 | | | | 7,163,614 | |
U.S. Treasury Bond ## | | | 2.75 | | | | 11-15-2042 | | | | 103,405,000 | | | | 131,926,199 | |
U.S. Treasury Bond | | | 2.88 | | | | 5-15-2043 | | | | 73,539,000 | | | | 95,813,273 | |
U.S. Treasury Bond | | | 3.13 | | | | 8-15-2044 | | | | 68,578,000 | | | | 93,349,124 | |
U.S. Treasury Note | | | 0.13 | | | | 4-30-2022 | | | | 3,691,000 | | | | 3,688,981 | |
U.S. Treasury Note ## | | | 0.13 | | | | 5-31-2022 | | | | 78,247,000 | | | | 78,188,862 | |
U.S. Treasury Note | | | 0.13 | | | | 5-15-2023 | | | | 1,359,000 | | | | 1,356,186 | |
U.S. Treasury Note ## | | | 0.25 | | | | 5-31-2025 | | | | 58,075,000 | | | | 57,876,267 | |
U.S. Treasury Note | | | 0.38 | | | | 3-31-2022 | | | | 8,291,000 | | | | 8,322,091 | |
U.S. Treasury Note | | | 0.38 | | | | 4-30-2025 | | | | 18,495,000 | | | | 18,557,854 | |
U.S. Treasury Note | | | 0.50 | | | | 4-30-2027 | | | | 23,045,000 | | | | 23,056,702 | |
U.S. Treasury Note ## | | | 0.63 | | | | 5-15-2030 | | | | 56,326,000 | | | | 56,167,583 | |
U.S. Treasury Note ## | | | 2.50 | | | | 2-28-2026 | | | | 38,154,000 | | | | 42,705,653 | |
U.S. Treasury Note ## | | | 2.63 | | | | 3-31-2025 | | | | 19,330,000 | | | | 21,479,707 | |
U.S. Treasury Note | | | 2.88 | | | | 11-30-2025 | | | | 7,491,000 | | | | 8,509,893 | |
| |
Total U.S. Treasury Securities (Cost $764,175,637) | | | | 779,934,635 | |
| | | | | | | | | | | | | | | | |
|
Yankee Corporate Bonds and Notes: 6.05% | |
|
Communication Services: 0.17% | |
|
| Wireless Telecommunication Services: 0.17% | |
America Movil SAV de CV | | | 2.88 | | | | 5-7-2030 | | | | 5,650,000 | | | | 5,881,763 | |
Vodafone Group plc | | | 4.25 | | | | 9-17-2050 | | | | 3,512,000 | | | | 4,032,290 | |
| | | | |
| | | | | | | | | | | | | | | 9,914,053 | |
| | | | | | | | | | | | | | | | |
|
Consumer Staples: 0.21% | |
|
| Beverages: 0.01% | |
Bacardi Limited 144A | | | 5.30 | | | | 5-15-2048 | | | | 492,000 | | | | 589,927 | |
| | | | | | | | | | | | | | | | |
|
| Food Products: 0.20% | |
Danone SA 144A | | | 2.95 | | | | 11-2-2026 | | | | 10,762,000 | | | | 11,734,068 | |
| | | | | | | | | | | | | | | | |
The accompanying notes are an integral part of these financial statements.
46 | Wells Fargo Core Bond Portfolio
Portfolio of investments—May 31, 2020
| | | | | | | | | | | | | | | | |
| | | Interest
rate | | | Maturity
date | | | Principal | | | Value | |
| Energy: 0.98% | |
|
| Energy Equipment & Services: 0.03% | |
Schlumberger Limited 144A | | | 2.65 | % | | | 11-20-2022 | | | $ | 1,873,000 | | | $ | 1,901,911 | |
| | | | | | | | | | | | | | | | |
|
| Oil, Gas & Consumable Fuels: 0.95% | |
Ecopetrol SA | | | 5.88 | | | | 5-28-2045 | | | | 1,971,000 | | | | 2,049,840 | |
Ecopetrol SA | | | 6.88 | | | | 4-29-2030 | | | | 5,235,000 | | | | 5,975,753 | |
Enbridge Incorporated | | | 2.50 | | | | 1-15-2025 | | | | 8,774,000 | | | | 9,031,932 | |
Enbridge Incorporated | | | 3.13 | | | | 11-15-2029 | | | | 4,015,000 | | | | 4,159,558 | |
EnCana Corporation | | | 6.50 | | | | 2-1-2038 | | | | 1,000,000 | | | | 763,541 | |
Equinor ASA | | | 1.75 | | | | 1-22-2026 | | | | 2,849,000 | | | | 2,909,861 | |
Equinor ASA | | | 2.38 | | | | 5-22-2030 | | | | 1,898,000 | | | | 1,956,830 | |
Equinor ASA | | | 3.25 | | | | 11-18-2049 | | | | 1,365,000 | | | | 1,436,895 | |
Petroleos Mexicanos Company | | | 2.38 | | | | 4-15-2025 | | | | 1,814,500 | | | | 1,883,300 | |
Petroleos Mexicanos Company | | | 2.46 | | | | 12-15-2025 | | | | 4,839,000 | | | | 5,031,835 | |
Suncor Energy Incorporated | | | 2.80 | | | | 5-15-2023 | | | | 4,907,000 | | | | 5,027,241 | |
Suncor Energy Incorporated | | | 3.10 | | | | 5-15-2025 | | | | 3,945,000 | | | | 4,128,988 | |
Total Capital International SA | | | 3.13 | | | | 5-29-2050 | | | | 2,903,000 | | | | 2,933,078 | |
TransCanada PipeLines Limited | | | 3.75 | | | | 10-16-2023 | | | | 4,723,000 | | | | 5,079,191 | |
TransCanada PipeLines Limited | | | 4.63 | | | | 3-1-2034 | | | | 1,297,000 | | | | 1,486,208 | |
TransCanada PipeLines Limited | | | 4.88 | | | | 1-15-2026 | | | | 579,000 | | | | 671,043 | |
| | | | |
| | | | | | | | | | | | | | | 54,525,094 | |
| | | | | | | | | | | | | | | | |
|
Financials: 3.87% | |
|
| Banks: 2.28% | |
Asian Development Bank | | | 0.63 | | | | 4-7-2022 | | | | 16,572,000 | | | | 16,663,716 | |
Banco Santander SA | | | 2.75 | | | | 5-28-2025 | | | | 3,600,000 | | | | 3,674,367 | |
Banco Santander SA | | | 3.49 | | | | 5-28-2030 | | | | 1,800,000 | | | | 1,843,047 | |
Banco Santander SA 144A | | | 5.38 | | | | 4-17-2025 | | | | 2,512,000 | | | | 2,690,980 | |
Barclays plc (3 Month LIBOR +3.05%) ± | | | 5.09 | | | | 6-20-2030 | | | | 6,484,000 | | | | 7,225,841 | |
BNP Paribas SA (3 Month LIBOR +1.11%) 144A± | | | 2.82 | | | | 11-19-2025 | | | | 10,801,000 | | | | 11,092,591 | |
BNP Paribas SA (U.S. SOFR +1.51%) 144A± | | | 3.05 | | | | 1-13-2031 | | | | 4,798,000 | | | | 4,914,116 | |
Credit Agricole SA (London) 144A | | | 2.38 | | | | 1-22-2025 | | | | 6,989,000 | | | | 7,260,316 | |
Danske Bank A/S (3 Month LIBOR +1.25%) 144A± | | | 3.00 | | | | 9-20-2022 | | | | 9,078,000 | | | | 9,170,086 | |
Danske Bank A/S (3 Month LIBOR +1.59%) 144A± | | | 3.24 | | | | 12-20-2025 | | | | 8,694,000 | | | | 8,878,977 | |
Danske Bank A/S 144A | | | 5.00 | | | | 1-12-2022 | | | | 4,619,000 | | | | 4,839,452 | |
Landwirtschaftliche Rentenbank | | | 0.50 | | | | 5-27-2025 | | | | 11,397,000 | | | | 11,384,928 | |
Lloyds Banking Group plc (1 Year Treasury Constant Maturity +3.50%) ± | | | 3.87 | | | | 7-9-2025 | | | | 10,041,000 | | | | 10,663,499 | |
Royal Bank Scotland Group plc (1 Year Treasury Constant Maturity +2.15%) ± | | | 2.36 | | | | 5-22-2024 | | | | 1,639,000 | | | | 1,655,230 | |
Royal Bank Scotland Group plc (1 Year Treasury Constant Maturity +2.55%) ± | | | 3.07 | | | | 5-22-2028 | | | | 2,969,000 | | | | 3,038,902 | |
Royal Bank Scotland Group plc (5 Year Treasury Constant Maturity +2.10%) ± | | | 3.75 | | | | 11-1-2029 | | | | 2,937,000 | | | | 2,971,051 | |
Royal Bank Scotland Group plc (3 Month LIBOR +1.87%) ± | | | 4.45 | | | | 5-8-2030 | | | | 2,768,000 | | | | 3,125,388 | |
Societe Generale 144A | | | 2.63 | | | | 10-16-2024 | | | | 2,188,000 | | | | 2,197,738 | |
Societe Generale 144A | | | 2.63 | | | | 1-22-2025 | | | | 7,257,000 | | | | 7,286,022 | |
Standard Chartered plc (5 Year Treasury Constant Maturity +3.85%) 144A± | | | 4.64 | | | | 4-1-2031 | | | | 740,000 | | | | 825,253 | |
Swedish Export Credit Corporation | | | 0.75 | | | | 4-6-2023 | | | | 9,751,000 | | | | 9,820,463 | |
| | | | |
| | | | | | | | | | | | | | | 131,221,963 | |
| | | | | | | | | | | | | | | | |
|
| Capital Markets: 0.58% | |
Credit Suisse Group Funding Limited (3 Month LIBOR +1.20%) 144A± | | | 3.00 | | | | 12-14-2023 | | | | 3,476,000 | | | | 3,585,132 | |
Credit Suisse Group Funding Limited 144A | | | 3.57 | | | | 1-9-2023 | | | | 9,687,000 | | | | 9,987,367 | |
Credit Suisse Group Funding Limited | | | 3.80 | | | | 6-9-2023 | | | | 3,131,000 | | | | 3,323,801 | |
MDGH GMTN BV 144A | | | 2.88 | | | | 11-7-2029 | | | | 3,449,000 | | | | 3,574,026 | |
The accompanying notes are an integral part of these financial statements.
Wells Fargo Core Bond Portfolio | 47
Portfolio of investments—May 31, 2020
| | | | | | | | | | | | | | | | |
| | | Interest
rate | | | Maturity
date | | | Principal | | | Value | |
|
| Capital Markets (continued) | |
Nomura Holdings Incorporated | | | 2.65 | % | | | 1-16-2025 | | | $ | 3,419,000 | | | $ | 3,530,610 | |
Nomura Holdings Incorporated | | | 3.10 | | | | 1-16-2030 | | | | 9,355,000 | | | | 9,428,662 | |
| | | | |
| | | | | | | | | | | | | | | 33,429,598 | |
| | | | | | | | | | | | | | | | |
|
| Diversified Financial Services: 0.84% | |
AerCap Ireland Capital DAC | | | 3.50 | | | | 5-26-2022 | | | | 1,794,000 | | | | 1,663,328 | |
AerCap Ireland Capital DAC | | | 3.95 | | | | 2-1-2022 | | | | 992,000 | | | | 934,801 | |
AerCap Ireland Capital DAC | | | 4.45 | | | | 4-3-2026 | | | | 1,162,000 | | | | 1,007,817 | |
AerCap Ireland Capital DAC | | | 4.63 | | | | 7-1-2022 | | | | 838,000 | | | | 789,735 | |
AerCap Ireland Capital DAC | | | 4.88 | | | | 1-16-2024 | | | | 1,868,000 | | | | 1,670,209 | |
Brookfield Finance Incorporated | | | 4.35 | | | | 4-15-2030 | | | | 3,943,000 | | | | 4,315,020 | |
DH Europe Finance II | | | 2.05 | | | | 11-15-2022 | | | | 2,964,000 | | | | 3,053,701 | |
DH Europe Finance II | | | 2.20 | | | | 11-15-2024 | | | | 5,077,000 | | | | 5,305,728 | |
DH Europe Finance II | | | 2.60 | | | | 11-15-2029 | | | | 6,383,000 | | | | 6,709,893 | |
DH Europe Finance II | | | 3.40 | | | | 11-15-2049 | | | | 1,552,000 | | | | 1,723,669 | |
Element Fleet Management Corporation 144A%% | | | 3.85 | | | | 6-15-2025 | | | | 3,803,000 | | | | 3,817,674 | |
General Electric Capital International Funding Company | | | 4.42 | | | | 11-15-2035 | | | | 7,786,000 | | | | 7,773,801 | |
UBS Group Funding Switzerland AG (3 Month LIBOR +0.95%) 144A± | | | 2.86 | | | | 8-15-2023 | | | | 9,184,000 | | | | 9,466,395 | |
| | | | |
| | | | | | | | | | | | | | | 48,231,771 | |
| | | | | | | | | | | | | | | | |
|
| Insurance: 0.11% | |
Athene Holding Limited | | | 6.15 | | | | 4-3-2030 | | | | 5,825,000 | | | | 6,362,344 | |
| | | | | | | | | | | | | | | | |
|
| Thrifts & Mortgage Finance: 0.06% | |
Nationwide Building Society (3 Month LIBOR +1.39%) 144A± | | | 4.36 | | | | 8-1-2024 | | | | 3,382,000 | | | | 3,620,199 | |
| | | | | | | | | | | | | | | | |
|
Health Care: 0.23% | |
|
| Pharmaceuticals: 0.23% | |
Shire plc | | | 2.88 | | | | 9-23-2023 | | | | 3,857,000 | | | | 4,067,465 | |
Shire plc | | | 3.20 | | | | 9-23-2026 | | | | 4,630,000 | | | | 5,111,335 | |
Takeda Pharmaceutical | | | 4.40 | | | | 11-26-2023 | | | | 3,391,000 | | | | 3,766,952 | |
| | | | |
| | | | | | | | | | | | | | | 12,945,752 | |
| | | | | | | | | | | | | | | | |
|
Industrials: 0.04% | |
|
| Construction & Engineering: 0.04% | |
Hutama Karya Persero PT 144A | | | 3.75 | | | | 5-11-2030 | | | | 2,193,000 | | | | 2,276,641 | |
| | | | | | | | | | | | | | | | |
|
Information Technology: 0.33% | |
|
| Semiconductors & Semiconductor Equipment: 0.33% | |
NXP BV 144A | | | 2.70 | | | | 5-1-2025 | | | | 1,881,000 | | | | 1,939,885 | |
NXP BV 144A | | | 3.15 | | | | 5-1-2027 | | | | 3,193,000 | | | | 3,265,465 | |
NXP BV 144A | | | 3.40 | | | | 5-1-2030 | | | | 4,040,000 | | | | 4,197,631 | |
NXP BV 144A | | | 3.88 | | | | 6-18-2026 | | | | 6,561,000 | | | | 7,086,352 | |
NXP BV 144A | | | 4.30 | | | | 6-18-2029 | | | | 2,491,000 | | | | 2,729,462 | |
| | | | |
| | | | | | | | | | | | | | | 19,218,795 | |
| | | | | | | | | | | | | | | | |
|
Materials: 0.14% | |
|
| Chemicals: 0.11% | |
Nutrien Limited | | | 2.95 | | | | 5-13-2030 | | | | 2,552,000 | | | | 2,663,345 | |
Nutrien Limited | | | 5.00 | | | | 4-1-2049 | | | | 2,878,000 | | | | 3,540,692 | |
| | | | |
| | | | | | | | | | | | | | | 6,204,037 | |
| | | | | | | | | | | | | | | | |
The accompanying notes are an integral part of these financial statements.
48 | Wells Fargo Core Bond Portfolio
Portfolio of investments—May 31, 2020
| | | | | | | | | | | | | | | | |
| | | Interest
rate | | | Maturity
date | | | Principal | | | Value | |
| Metals & Mining: 0.03% | |
Teck Resources Limited | | | 6.25 | % | | | 7-15-2041 | | | $ | 1,595,000 | | | $ | 1,607,072 | |
| | | | | | | | | | | | | | | | |
|
Real Estate: 0.08% | |
|
| Equity REITs: 0.08% | |
Scentre Group Trust 144A | | | 3.63 | | | | 1-28-2026 | | | | 2,946,000 | | | | 2,990,379 | |
Trust F/1401 144A | | | 6.39 | | | | 1-15-2050 | | | | 1,754,000 | | | | 1,609,137 | |
| | | | |
| | | | | | | | | | | | | | | 4,599,516 | |
| | | | | | | | | | | | | | | | |
| |
Total Yankee Corporate Bonds and Notes (Cost $337,419,944) | | | | 348,382,741 | |
| | | | | | | | | | | | | | | | |
|
| Yankee Government Bonds: 1.42% | |
Abu Dhabi Government International 144A | | | 2.50 | | | | 4-16-2025 | | | | 10,643,000 | | | | 11,050,095 | |
Abu Dhabi Government International 144A | | | 3.88 | | | | 4-16-2050 | | | | 960,000 | | | | 1,093,200 | |
Japan Bank for International Cooperation | | | 1.75 | | | | 10-17-2024 | | | | 5,082,000 | | | | 5,292,715 | |
Republic of Indonesia | | | 4.45 | | | | 4-15-2070 | | | | 3,021,000 | | | | 3,351,662 | |
Republic of Paraguay 144A | | | 4.95 | | | | 4-28-2031 | | | | 3,341,000 | | | | 3,591,575 | |
Republic of Paraguay 144A | | | 5.40 | | | | 3-30-2050 | | | | 5,109,000 | | | | 5,637,833 | |
Republic of Peru | | | 2.39 | | | | 1-23-2026 | | | | 2,239,000 | | | | 2,315,126 | |
Republic of Peru | | | 2.78 | | | | 1-23-2031 | | | | 1,307,000 | | | | 1,377,578 | |
State of Israel | | | 3.38 | | | | 1-15-2050 | | | | 1,926,000 | | | | 2,033,972 | |
State of Israel | | | 4.50 | | | | 4-3-2120 | | | | 1,948,000 | | | | 2,368,534 | |
State of Qatar 144A | | | 3.40 | | | | 4-16-2025 | | | | 7,445,000 | | | | 7,949,324 | |
State of Qatar 144A | | | 3.75 | | | | 4-16-2030 | | | | 5,095,000 | | | | 5,668,188 | |
United Mexican States | | | 3.25 | | | | 4-16-2030 | | | | 6,701,000 | | | | 6,610,604 | |
United Mexican States | | | 3.90 | | | | 4-27-2025 | | | | 4,768,000 | | | | 5,023,088 | |
United Mexican States | | | 4.50 | | | | 4-22-2029 | | | | 10,455,000 | | | | 11,291,400 | |
United Mexican States | | | 4.60 | | | | 2-10-2048 | | | | 1,756,000 | | | | 1,817,460 | |
United Mexican States | | | 4.75 | | | | 3-8-2044 | | | | 2,482,000 | | | | 2,589,967 | |
United Mexican States | | | 5.00 | | | | 4-27-2051 | | | | 2,564,000 | | | | 2,753,736 | |
| |
Total Yankee Government Bonds (Cost $76,730,367) | | | | 81,816,057 | |
| | | | | | | | | | | | | | | | |
| | | | |
| | | | | | | | | | | | | | | | |
| | | Yield | | | | | | Shares | | | | |
| Short-Term Investments: 5.48% | |
|
| Investment Companies: 5.48% | |
Wells Fargo Government Money Market Fund Select Class (l)(u)## | | | 0.12 | | | | | | | | 315,907,475 | | | | 315,907,475 | |
| | | | | | | | | | | | | | | | |
| |
Total Short-Term Investments (Cost $315,907,475) | | | | 315,907,475 | |
| | | | | | | | | | | | | | | | |
| | | | | | | | |
| Total investments in securities (Cost $6,146,838,113) | | | 109.97 | % | | | 6,336,292,302 | |
| | |
Other assets and liabilities, net | | | (9.97 | ) | | | (574,436,458 | ) |
| | | | | | | | |
| Total net assets | | | 100.00 | % | | $ | 5,761,855,844 | |
| | | | | | | | |
| ± | Variable rate investment. The rate shown is the rate in effect at period end. |
| %% | The security is purchased on a when-issued basis. |
| ±± | The coupon of the security is adjusted based on the principal and interest payments received from the underlying pool of mortgages as well as the credit quality and the actual prepayment speed of the underlying mortgages. |
| 144A | The security may be resold in transactions exempt from registration, normally to qualified institutional buyers, pursuant to Rule 144A under the Securities Act of 1933. |
| ## | All or a portion of this security is segregated for when-issued securities. |
| (l) | The issuer of the security is an affiliated person of the Portfolio as defined in the Investment Company Act of 1940. |
| (u) | The rate represents the 7-day annualized yield at period end. |
The accompanying notes are an integral part of these financial statements.
Wells Fargo Core Bond Portfolio | 49
Portfolio of investments—May 31, 2020
Abbreviations:
| FHLMC | Federal Home Loan Mortgage Corporation |
| FNMA | Federal National Mortgage Association |
| GNMA | Government National Mortgage Association |
| LIBOR | London Interbank Offered Rate |
| REIT | Real estate investment trust |
| SOFR | Secured Overnight Financing Rate |
Investments in Affiliates
An affiliated investment is an investment in which the Portfolio owns at least 5% of the outstanding voting shares of the issuer or as a result of other relationships, such as the Portfolio and the issuer having the same adviser or investment manager. Transactions with issuers that were either affiliated persons of the Portfolio at the beginning of the period or the end of the period were as follows:
| | | | | | | | | | | | | | | | | | | | | | | | | | | | | | | | | | | | |
| | | Shares, beginning of period | | | Shares
purchased | | | Shares
sold | | | Shares,
end of
period | | | Net
realized
gains | | | Net
change in
unrealized
gains
(losses) | | | Income
from
affiliated
securities | | | Value,
end of period | | | % of
net
assets | |
| | | | | | | | | |
| Short-Term Investments | | | | | | | | | | | | | | | | | | | | | | | | | | | |
Investment Companies | | | | | | | | | | | | | | | | | | | | | | | | | | | | | | | | | | | | |
Securities Lending Cash Investments LLC* | | | 2,778,863 | | | | 448,833,680 | | | | (451,612,543 | ) | | | 0 | | | $ | 162,733 | | | $ | 0 | | | $ | 167,952 | # | | $ | 0 | | | | | |
Wells Fargo Government Money Market Fund Select Class | | | 117,422,859 | | | | 4,506,785,163 | | | | (4,308,300,547 | ) | | | 315,907,475 | | | | 0 | | | | 0 | | | | 1,907,124 | | | | 315,907,475 | | | | | |
| | | | | | | | | | | | | | | | | | | | | | | | | | | | | | | | | | | | |
| | | | | | | | | | | | | | | | | | $ | 162,733 | | | $ | 0 | | | $ | 2,075,076 | | | $ | 315,907,475 | | | | 5.48 | % |
| | | | | | | | | | | | | | | | | | | | | | | | | | | | | | | | | | | | |
| * | No longer held at the end of the period |
| # | Amount shown represents income before fees and rebates. |
The accompanying notes are an integral part of these financial statements.
50 | Wells Fargo Core Bond Portfolio
Statement of assets and liabilities—May 31, 2020
| | | | |
| | | | |
| |
Assets | | | | |
Investments in unaffiliated securities, at value (cost $5,830,930,638) | | $ | 6,020,384,827 | |
Investments in affiliated securities, at value (cost $315,907,475) | | | 315,907,475 | |
Cash | | | 380,563 | |
Receivable for investments sold | | | 741,344,952 | |
Receivable for interest | | | 20,894,460 | |
Prepaid expenses and other assets | | | 482,739 | |
| | | | |
Total assets | | | 7,099,395,016 | |
| | | | |
| |
Liabilities | | | | |
Payable for investments purchased | | | 644,079,378 | |
Payable for when-issued transactions | | | 691,350,673 | |
Cash collateral due to broker | | | 451,000 | |
Advisory fee payable | | | 1,657,358 | |
Trustees’ fees and expenses payable | | | 763 | |
| | | | |
Total liabilities | | | 1,337,539,172 | |
| | | | |
Total net assets | | $ | 5,761,855,844 | |
| | | | |
The accompanying notes are an integral part of these financial statements.
Wells Fargo Core Bond Portfolio | 51
Statement of operations—year ended May 31, 2020
| | | | |
| | | | |
| |
Investment income | | | | |
Interest | | $ | 151,181,732 | |
Income from affiliated securities | | | 1,959,822 | |
| | | | |
Total investment income | | | 153,141,554 | |
| | | | |
| |
Expenses | | | | |
Advisory fee | | | 19,865,265 | |
Custody and accounting fees | | | 250,457 | |
Professional fees | | | 77,976 | |
Shareholder report expenses | | | 4,044 | |
Trustees’ fees and expenses | | | 21,036 | |
Other fees and expenses | | | 22,924 | |
| | | | |
Net expenses | | | 20,241,702 | |
| | | | |
Net investment income | | | 132,899,852 | |
| | | | |
| |
Realized and unrealized gains (losses) on investments | | | | |
Net realized gains on | |
Unaffiliated securities | | | 327,741,682 | |
Affiliated securities | | | 162,733 | |
| | | | |
Net realized gains on investments | | | 327,904,415 | |
Net change in unrealized gains (losses) on investments | | | 58,392,982 | |
| | | | |
Net realized and unrealized gains (losses) on investments | | | 386,297,397 | |
| | | | |
Net increase in net assets resulting from operations | | $ | 519,197,249 | |
| | | | |
The accompanying notes are an integral part of these financial statements.
52 | Wells Fargo Core Bond Portfolio
Statement of changes in net assets
| | | | | | | | |
| | | Year ended
May 31, 2020 | | | Year ended
May 31, 2019 | |
|
Operations | |
Net investment income | | $ | 132,899,852 | | | $ | 166,921,454 | |
Net realized gains (losses) on investments | | | 327,904,415 | | | | (17,686,402 | ) |
Net change in unrealized gains (losses) on investments | | | 58,392,982 | | | | 194,869,104 | |
| | | | |
Net increase in net assets resulting from operations | | | 519,197,249 | | | | 344,104,156 | |
| | | | |
| | |
Capital transactions | | | | | | | | |
Transactions in investors’ beneficial interests | |
Contributions | | | 2,488,553,741 | | | | 697,097,878 | |
Withdrawals | | | (3,071,640,078 | ) | | | (888,699,376 | ) |
| | | | |
Net decrease in net assets resulting from capital transactions | | | (583,086,337 | ) | | | (191,601,498 | ) |
| | | | |
Total increase (decrease) in net assets | | | (63,889,088 | ) | | | 152,502,658 | |
| | | | |
| | |
Net assets | | | | | | | | |
Beginning of period | | | 5,825,744,932 | | | | 5,673,242,274 | |
| | | | |
End of period | | $ | 5,761,855,844 | | | $ | 5,825,744,932 | |
| | | | |
The accompanying notes are an integral part of these financial statements.
Wells Fargo Core Bond Portfolio | 53
Financial highlights
| | | | | | | | | | | | | | | | | | | | |
| | | Year ended May 31 | |
| | | 2020 | | | 2019 | | | 2018 | | | 2017 | | | 2016 | |
Total return | | | 9.49 | % | | | 6.30 | % | | | (0.53 | )% | | | 1.89 | % | | | 2.78 | % |
Ratios to average net assets (annualized) | | | | | | | | | | | | | | | | | | | | |
Gross expenses | | | 0.35 | % | | | 0.35 | % | | | 0.35 | % | | | 0.35 | % | | | 0.36 | % |
Net expenses | | | 0.35 | % | | | 0.35 | % | | | 0.35 | % | | | 0.35 | % | | | 0.35 | % |
Net investment income | | | 2.28 | % | | | 2.93 | % | | | 2.23 | % | | | 1.87 | % | | | 1.86 | % |
Supplemental data | | | | | | | | | | | | | | | | | | | | |
Portfolio turnover rate | | | 603 | % | | | 577 | % | | | 542 | % | | | 614 | % | | | 667 | % |
The accompanying notes are an integral part of these financial statements.
54 | Wells Fargo Core Bond Portfolio
Notes to financial statements
1. ORGANIZATION
Wells Fargo Master Trust (the “Trust”), a Delaware statutory trust organized on March 10, 1999, is an open-end management investment company registered under the Investment Company Act of 1940, as amended (the “1940 Act”). As an investment company, the Trust follows the accounting and reporting guidance in Financial Accounting Standards Board (“FASB”) Accounting Standards Codification Topic 946, Financial Services – Investment Companies. These financial statements report on the Wells Fargo Core Bond Portfolio (the “Portfolio”) which is a diversified series of the Trust.
2. SIGNIFICANT ACCOUNTING POLICIES
The following significant accounting policies, which are consistently followed in the preparation of the financial statements of the Portfolio, are in conformity with U.S. generally accepted accounting principles which require management to make estimates and assumptions that affect the reported amounts of assets and liabilities, disclosure of contingent assets and liabilities at the date of the financial statements, and the reported amounts of revenues and expenses during the reporting period. Actual results could differ from those estimates.
Securities valuation
All investments are valued each business day as of the close of regular trading on the New York Stock Exchange (generally 4 p.m. Eastern Time), although the Portfolio may deviate from this calculation time under unusual or unexpected circumstances.
Debt securities are valued at the evaluated bid price provided by an independent pricing service (e.g. taking into account various factors, including yields, maturities, or credit ratings) or, if a reliable price is not available, the quoted bid price from an independent broker-dealer.
The values of securities denominated in foreign currencies are translated into U.S. dollars at rates provided by an independent foreign currency pricing source at a time each business day specified by the Wells Fargo Asset Management Pricing Committee at Wells Fargo Funds Management, LLC (“Funds Management”).
Investments in registered open-end investment companies are valued at net asset value. Interests in non-registered investment companies that are redeemable at net asset value are fair valued normally at net asset value.
Investments which are not valued using any of the methods discussed above are valued at their fair value, as determined in good faith by the Board of Trustees of the Portfolio. The Board of Trustees has established a Valuation Committee comprised of the Trustees and has delegated to it the authority to take any actions regarding the valuation of portfolio securities that the Valuation Committee deems necessary or appropriate, including determining the fair value of portfolio securities, unless the determination has been delegated to the Wells Fargo Asset Management Pricing Committee. The Board of Trustees retains the authority to make or ratify any valuation decisions or approve any changes to the Valuation Procedures as it deems appropriate. On a quarterly basis, the Board of Trustees receives reports on any valuation actions taken by the Valuation Committee or the Wells Fargo Asset Management Pricing Committee which may include items for ratification.
Foreign currency translation
The accounting records of the Portfolio are maintained in U.S. dollars. The values of other assets and liabilities denominated in foreign currencies are translated into U.S. dollars at rates provided by an independent foreign currency pricing source at a time each business day specified by the Wells Fargo Asset Management Pricing Committee. Purchases and sales of securities, and income and expenses are converted at the rate of exchange on the respective dates of such transactions. Net realized foreign exchange gains or losses arise from sales of foreign currencies, currency gains or losses realized between the trade and settlement dates on securities transactions, and the difference between the amounts of dividends, interest and foreign withholding taxes recorded and the U.S. dollar equivalent of the amounts actually paid or received. Net unrealized foreign exchange gains and losses arise from changes in the fair value of assets and liabilities other than investments in securities resulting from changes in exchange rates. The changes in net assets arising from changes in exchange rates of securities and the changes in net assets resulting from changes in market prices of securities are not separately presented. Such changes are included in net realized and unrealized gains or losses from investments.
Securities lending
The Portfolio may lend its securities from time to time in order to earn additional income in the form of fees or interest on securities received as collateral or the investment of any cash received as collateral. When securities are on loan, the Portfolio receives interest or dividends on those securities. Cash collateral received in connection with its securities lending transactions is invested in Securities Lending Cash Investments, LLC (the “Securities Lending Fund”). Investments in Securities Lending Fund are valued at the evaluated bid price provided by an independent pricing service. Income earned from investment in the Securities Lending Fund (net of fees and rebates), if any, is included in income from affiliated securities on the Statement of Operations.
Wells Fargo Core Bond Portfolio | 55
Notes to financial statements
In a securities lending transaction, the net asset value of the Portfolio is affected by an increase or decrease in the value of the securities loaned and by an increase or decrease in the value of the instrument in which collateral is invested. The amount of securities lending activity undertaken by the Portfolio fluctuates from time to time. The Portfolio has the right under the lending agreement to recover the securities from the borrower on demand. In the event of default or bankruptcy by the borrower, the Portfolio may be prevented from recovering the loaned securities or gaining access to the collateral or may experience delays or costs in doing so. In such an event, the terms of the agreement allow the unaffiliated securities lending agent to use the collateral to purchase replacement securities on behalf of the Portfolio or pay the Portfolio the market value of the loaned securities. The Portfolio bears the risk of loss with respect to depreciation of its investment of the cash collateral.
When-issued transactions
The Portfolio may purchase securities on a forward commitment or when-issued basis. The Portfolio records a when-issued transaction on the trade date and will segregate assets in an amount at least equal in value to the Portfolio’s commitment to purchase when-issued securities. Securities purchased on a when-issued basis are marked-to-market daily and the Portfolio begins earning interest on the settlement date. Losses may arise due to changes in the market value of the underlying securities or if the counterparty does not perform under the contract.
Security transactions and income recognition
Securities transactions are recorded on a trade date basis. Realized gains or losses are recorded on the basis of identified cost.
Interest income is accrued daily and bond discounts are accreted and premiums are amortized daily. To the extent debt obligations are placed on non-accrual status, any related interest income may be reduced by writing off interest receivables when the collection of all or a portion of interest has been determined to be doubtful based on consistently applied procedures and the fair value has decreased. If the issuer subsequently resumes interest payments or when the collectability of interest is reasonably assured, the debt obligation is removed from non-accrual status.
Federal and other taxes
The Portfolio is treated as a separate entity for federal income tax purposes. The Portfolio is not required to pay federal income taxes on its net investment income and net capital gains as it is treated as a partnership for federal income tax purposes. All interest, gains and losses of the Portfolio are deemed to have been “passed through” to the interest holders in proportion to their holdings of the Portfolio regardless of whether interest and gains have been distributed by the Portfolio.
The Portfolio’s income tax returns and all financial records supporting those returns for the prior three fiscal years are subject to examination by the federal revenue authority. Management has analyzed the Portfolio’s tax positions taken on federal, state, and foreign tax returns for all open tax years and does not believe that there are any uncertain tax positions that require recognition of a tax liability.
As of May 31, 2020, the aggregate cost of all investments for federal income tax purposes was $6,151,455,687 and the unrealized gains (losses) consisted of:
| | | | |
| |
Gross unrealized gains | | $ | 208,361,047 | |
| |
Gross unrealized losses | | | (23,524,432 | ) |
| |
Net unrealized gains | | $ | 184,836,615 | |
3. FAIR VALUATION MEASUREMENTS
Fair value measurements of investments are determined within a framework that has established a fair value hierarchy based upon the various data inputs utilized in determining the value of the Portfolio’s investments. The three-level hierarchy gives the highest priority to unadjusted quoted prices in active markets for identical assets or liabilities (Level 1) and the lowest priority to unobservable inputs (Level 3). The Portfolio’s investments are classified within the fair value hierarchy based on the lowest level of input that is significant to the fair value measurement. The inputs are summarized into three broad levels as follows:
| ∎ | | Level 1 – quoted prices in active markets for identical securities |
| ∎ | | Level 2 – other significant observable inputs (including quoted prices for similar securities, interest rates, prepayment speeds, credit risk, etc.) |
| ∎ | | Level 3 – significant unobservable inputs (including the Portfolio’s own assumptions in determining the fair value of investments) |
56 | Wells Fargo Core Bond Portfolio
Notes to financial statements
The inputs or methodologies used for valuing investments in securities are not necessarily an indication of the risk associated with investing in those securities.
The following is a summary of the inputs used in valuing the Portfolio’s assets and liabilities as of May 31, 2020:
| | | | | | | | | | | | | | | | |
| | | | |
| | | Quoted prices
(Level 1) | | | Other significant
observable inputs
(Level 2) | | | Significant
unobservable inputs (Level 3) | | | Total | |
Assets | | | | | | | | | | | | | | | | |
Investments in: | | | | | | | | | | | | | | | | |
| | | | |
Agency securities | | $ | 0 | | | $ | 2,553,913,359 | | | $ | 0 | | | $ | 2,553,913,359 | |
| | | | |
Asset-backed securities | | | 0 | | | | 480,419,712 | | | | 0 | | | | 480,419,712 | |
| | | | |
Corporate bonds and notes | | | 0 | | | | 1,534,288,681 | | | | 0 | | | | 1,534,288,681 | |
| | | | |
Foreign corporate bonds and notes | | | 0 | | | | 728,445 | | | | 0 | | | | 728,445 | |
| | | | |
Municipal obligations | | | 0 | | | | 31,690,850 | | | | 0 | | | | 31,690,850 | |
| | | | |
Non-agency mortgage-back securities | | | 0 | | | | 209,210,347 | | | | 0 | | | | 209,210,347 | |
| | | | |
U.S. Treasury securities | | | 779,934,635 | | | | 0 | | | | 0 | | | | 779,934,635 | |
| | | | |
Yankee corporate bonds and notes | | | 0 | | | | 348,382,741 | | | | 0 | | | | 348,382,741 | |
| | | | |
Yankee government bonds | | | 0 | | | | 81,816,057 | | | | 0 | | | | 81,816,057 | |
| | | | |
Short-term investments | | | | | | | | | | | | | | | | |
| | | | |
Investment companies | | | 315,907,475 | | | | 0 | | | | 0 | | | | 315,907,475 | |
| | | | |
Total assets | | $ | 1,095,842,110 | | | $ | 5,240,450,192 | | | $ | 0 | | | $ | 6,336,292,302 | |
Additional sector, industry or geographic detail is included in the Portfolio of Investments.
For the year ended May 31, 2020, the Portfolio did not have any transfers into/out of Level 3.
4. TRANSACTIONS WITH AFFILIATES
Advisory fee
The Trust has entered into an advisory contract with Funds Management, an indirect wholly owned subsidiary of Wells Fargo & Company (“Wells Fargo”). The adviser is responsible for implementing investment policies and guidelines and for supervising the subadviser, who is responsible for day-to-day portfolio management of the Portfolio. Pursuant to the contract, Funds Management is entitled to receive an annual advisory fee at the following annual rate based on the Portfolio’s average daily net assets:
| | |
| |
| Average daily net assets | | Advisory fee |
| |
First $500 million | | 0.400% |
| |
Next $500 million | | 0.375 |
| |
Next $2 billion | | 0.350 |
| |
Next $2 billion | | 0.325 |
| |
Next $5 billion | | 0.300 |
| |
Over $10 billion | | 0.290 |
For the year ended May 31, 2020, the advisory fee was equivalent to an annual rate of 0.34% of the Portfolio’s average daily net assets.
Funds Management has retained the services of a subadviser to provide daily portfolio management to the Portfolio. The fee for subadvisory services is borne by Funds Management. Wells Capital Management Incorporated (“WellsCap”), an affiliate of Funds Management and an indirect wholly owned subsidiary of Wells Fargo, is the subadviser to the Portfolio and is entitled to receive a fee from Funds Management at an annual rate starting at 0.20% and declining to 0.10% as the average daily net assets of the Portfolio increase.
Wells Fargo Core Bond Portfolio | 57
Notes to financial statements
Interfund transactions
The Portfolio may purchase or sell portfolio investment securities to certain other Wells Fargo affiliates pursuant to Rule 17a-7 under the 1940 Act and under procedures adopted by the Board of Trustees. The procedures have been designed to ensure that these interfund transactions, which do not incur broker commissions, are effected at current market prices.
5. INVESTMENT PORTFOLIO TRANSACTIONS
Purchases and sales of investments, excluding short-term securities, for the year ended May 31, 2020 were as follows:
| | | | | | |
Purchases at cost | | Sales proceeds |
U.S.
government | | Non-U.S.
government | | U.S.
government | | Non-U.S.
government |
| $31,913,212,645 | | $4,978,003,193 | | $32,223,666,843 | | $4,610,379,746 |
6. SECURITIES LENDING TRANSACTIONS
The Portfolio lends its securities through an unaffiliated securities lending agent and receives collateral in the form of cash or securities with a value at least equal to the value of the securities on loan. The value of the loaned securities is determined at the close of each business day and any increases or decreases in the required collateral are exchanged between the Portfolio and the counterparty on the next business day. Cash collateral received is invested in the Securities Lending Fund which seeks to provide a positive return compared to the daily Fed Funds Open Rate by investing in high-quality, U.S. dollar-denominated short-term money market instruments and is exempt from registration under Section 3(c)(7) of the 1940 Act. Securities Lending Fund is managed by Funds Management and is subadvised by WellsCap. Funds Management receives an advisory fee starting at 0.05% and declining to 0.01% as the average daily net assets of the Securities Lending Fund increase. All of the fees received by Funds Management are paid to WellsCap for its services as subadviser.
In the event of counterparty default or the failure of a borrower to return a loaned security, the Portfolio has the right to use the collateral to offset any losses incurred. As of May 31, 2020, the Portfolio did not have any securities on loan.
7. BANK BORROWINGS
The Trust, along with Wells Fargo Variable Trust and Wells Fargo Funds Trust (excluding the money market funds), are parties to a $280,000,000 revolving credit agreement whereby the Portfolio is permitted to use bank borrowings for temporary or emergency purposes, such as to fund shareholder redemption requests. Interest under the credit agreement is charged to the Portfolio based on a borrowing rate equal to the higher of the Federal Funds rate in effect on that day plus 1.25% or the overnight LIBOR rate in effect on that day plus 1.25%. In addition, an annual commitment fee equal to 0.25% of the unused balance is allocated to each participating fund.
For the year ended May 31, 2020, there were no borrowings by the Portfolio under the agreement.
8. INDEMNIFICATION
Under the Portfolio’s organizational documents, the officers and Trustees have been granted certain indemnification rights against certain liabilities that may arise out of performance of their duties to the Portfolio. The Portfolio has entered into a separate agreement with each Trustee that converts indemnification rights currently existing under the Portfolio’s organizational documents into contractual rights that cannot be changed in the future without the consent of the Trustee. Additionally, in the normal course of business, the Portfolio may enter into contracts with service providers that contain a variety of indemnification clauses. The Portfolio’s maximum exposure under these arrangements is dependent on future claims that may be made against the Portfolio and, therefore, cannot be estimated.
9. NEW ACCOUNTING PRONOUNCEMENTS
In August 2018, FASB issued Accounting Standards Update (“ASU”) No. 2018-13, Fair Value Measurement (Topic 820) Disclosure Framework—Changes to the Disclosure Requirements for Fair Value Measurement. ASU 2018-13 updates the disclosure requirements for fair value measurements by modifying or removing certain disclosures and adding certain new disclosures. The amendments are effective for fiscal years, and interim periods within those fiscal years, beginning after December 15, 2019. Early adoption is permitted. Management has adopted the removal and modification of disclosures early, as permitted, and will adopt the additional new disclosures at the effective date.
In March 2017, FASB issued ASU No. 2017-08, Premium Amortization on Purchased Callable Debt Securities. ASU 2017-08 shortens the amortization period for certain callable debt securities held at a premium and requires the premium to be amortized to the
58 | Wells Fargo Core Bond Portfolio
Notes to financial statements
earliest call date. The amendments do not require an accounting change for securities held at a discount and discounts will continue to be accreted to the maturity date of the security. ASU 2017-08 is effective for fiscal years beginning after December 15, 2018 and for interim periods within those fiscal years. During the current reporting period, management of the Portfolio adopted the change in accounting policy which did not have a material impact to the Portfolio’s financial statements.
10. CORONAVIRUS (COVID-19) PANDEMIC
On March 11, 2020, the World Health Organization announced that it had made the assessment that coronavirus disease 2019 (“COVID-19”) is a pandemic. The impacts of COVID-19 are adversely affecting the entire global economy, individual companies and investment products, and the market in general. There is significant uncertainty around the extent and duration of business disruptions related to COVID-19 and the impacts may be short term or may last for an extended period of time. The risk of further spreading of COVID-19 has led to significant uncertainty and volatility in the financial markets. The value of the Portfolio and the securities in which the Portfolio invests have generally been adversely affected by impacts caused by COVID-19.
Wells Fargo Core Bond Portfolio | 59
Report of independent registered public accounting firm
TO THE INTEREST HOLDERS OF THE PORTFOLIO AND BOARD OF TRUSTEES WELLS FARGO MASTER TRUST:
Opinion on the Financial Statements
We have audited the accompanying statement of assets and liabilities of Wells Fargo Core Bond Portfolio (the Portfolio), one of the portfolios constituting Wells Fargo Master Trust, including the portfolio of investments, as of May 31, 2020, the related statement of operations for the year then ended, the statements of changes in net assets for each of the years in the two-year period then ended, and the related notes (collectively, the financial statements) and the financial highlights for each of the years in the five-year period then ended. In our opinion, the financial statements and financial highlights present fairly, in all material respects, the financial position of the Portfolio as of May 31, 2020, the results of its operations for the year then ended, the changes in its net assets for each of the years in the two-year period then ended, and the financial highlights for each of the years in the five-year period then ended, in conformity with U.S. generally accepted accounting principles.
Basis for Opinion
These financial statements and financial highlights are the responsibility of the Portfolio’s management. Our responsibility is to express an opinion on these financial statements and financial highlights based on our audits. We are a public accounting firm registered with the Public Company Accounting Oversight Board (United States) (PCAOB) and are required to be independent with respect to the Portfolio in accordance with the U.S. federal securities laws and the applicable rules and regulations of the Securities and Exchange Commission and the PCAOB.
We conducted our audits in accordance with the standards of the PCAOB. Those standards require that we plan and perform the audit to obtain reasonable assurance about whether the financial statements and financial highlights are free of material misstatement, whether due to error or fraud. Our audits included performing procedures to assess the risks of material misstatement of the financial statements and financial highlights, whether due to error or fraud, and performing procedures that respond to those risks. Such procedures included examining, on a test basis, evidence regarding the amounts and disclosures in the financial statements and financial highlights. Such procedures also included confirmation of securities owned as of May 31, 2020, by correspondence with the custodian, transfer agent and brokers, or by other appropriate auditing procedures. Our audits also included evaluating the accounting principles used and significant estimates made by management, as well as evaluating the overall presentation of the financial statements and financial highlights. We believe that our audits provide a reasonable basis for our opinion.
We have not been able to determine the specific year that we began serving as the auditor of one or more Wells Fargo Funds investment companies; however we are aware that we have served as the auditor of one or more Wells Fargo Funds investment companies since at least 1955.
Boston, Massachusetts
July 29, 2020
60 | Wells Fargo Core Bond Portfolio
Other information (unaudited)
TAX INFORMATION
For the fiscal year ended May 31, 2020, $122,041,975 has been designated as interest-related dividends for nonresident alien shareholders pursuant to Section 871 of the Internal Revenue Code.
For the fiscal year ended May 31, 2020, $12,673,109 has been designated as short-term capital gain dividends for nonresident alien shareholders pursuant to Section 871 of the Internal Revenue Code.
For the fiscal year ended May 31, 2020, 15.12% of the ordinary income distributed was derived from interest on U.S. government securities.
PROXY VOTING INFORMATION
A description of the policies and procedures used to determine how to vote proxies relating to portfolio securities is available, upon request, by calling 1-800-222-8222, visiting our website at wfam.com, or visiting the SEC website at sec.gov. Information regarding how the proxies related to portfolio securities were voted during the most recent 12-month period ended June 30 is available on the website at wfam.com or by visiting the SEC website at sec.gov.
QUARTERLY PORTFOLIO HOLDINGS INFORMATION
The Fund and Portfolio file their complete schedule of portfolio holdings with the SEC for the first and third quarters of each fiscal year as an exhibit to its reports on Form N-PORT. Shareholders may view the filed Form N-PORT by visiting the SEC website at sec.gov.
Wells Fargo Core Bond Fund | 61
Other information (unaudited)
BOARD OF TRUSTEES AND OFFICERS
Each of the Trustees and Officers1 listed in the table below acts in identical capacities for each fund in the Wells Fargo family of funds, which consists of 147 mutual funds comprising the Wells Fargo Funds Trust, Wells Fargo Variable Trust, Wells Fargo Master Trust and four closed-end funds (collectively the “Fund Complex”). This table should be read in conjunction with the Prospectus and the Statement of Additional Information2. The mailing address of each Trustee and Officer is 525 Market Street, 12th Floor, San Francisco, CA 94105. Each Trustee and Officer serves an indefinite term, however, each Trustee serves such term until reaching the mandatory retirement age established by the Trustees.
Independent Trustees
| | | | | | |
Name and
year of birth | | Position held and
length of service* | | Principal occupations during past five years or longer | | Current other
public company or
investment
company
directorships |
| | | |
| William R. Ebsworth (Born 1957) | | Trustee, since 2015 | | Retired. From 1984 to 2013, equities analyst, portfolio manager, research director and chief investment officer at Fidelity Management and Research Company in Boston, Tokyo, and Hong Kong, and retired in 2013 as Chief Investment Officer of Fidelity Strategic Advisers, Inc. where he led a team of investment professionals managing client assets. Prior thereto, Board member of Hong Kong Securities Clearing Co., Hong Kong Options Clearing Corp., the Thailand International Fund, Ltd., Fidelity Investments Life Insurance Company, and Empire Fidelity Investments Life Insurance Company. Audit Committee Chair and Investment Committee Chair of the Vincent Memorial Hospital Endowment (non-profit organization). Mr. Ebsworth is a CFA® charterholder. | | N/A |
| | | |
| Jane A. Freeman (Born 1953) | | Trustee, since 2015; Chair Liaison, since 2018 | | Retired. From 2012 to 2014 and 1999 to 2008, Chief Financial Officer of Scientific Learning Corporation. From 2008 to 2012, Ms. Freeman provided consulting services related to strategic business projects. Prior to 1999, Portfolio Manager at Rockefeller & Co. and Scudder, Stevens & Clark. Board member of the Harding Loevner Funds from 1996 to 2014, serving as both Lead Independent Director and chair of the Audit Committee. Board member of the Russell Exchange Traded Funds Trust from 2011 to 2012 and the chair of the Audit Committee. Ms. Freeman is also an inactive Chartered Financial Analyst. | | N/A |
| | | |
| Isaiah Harris, Jr. (Born 1952) | | Trustee, since 2009; Audit Committee Chairman, since 2019 | | Retired. Chairman of the Board of CIGNA Corporation since 2009, and Director since 2005. From 2003 to 2011, Director of Deluxe Corporation. Prior thereto, President and CEO of BellSouth Advertising and Publishing Corp. from 2005 to 2007, President and CEO of BellSouth Enterprises from 2004 to 2005 and President of BellSouth Consumer Services from 2000 to 2003. Emeritus member of the Iowa State University Foundation Board of Governors. Emeritus Member of the Advisory Board of Iowa State University School of Business. Advisory Board Member, Palm Harbor Academy (private school). Advisory Board Member, Child Evangelism Fellowship (non-profit). Mr. Harris is a certified public accountant (inactive status). | | CIGNA Corporation |
| | | |
| Judith M. Johnson (Born 1949) | | Trustee, since 2008; Audit Committee Chairman, from 2009 to 2018 | | Retired. Prior thereto, Chief Executive Officer and Chief Investment Officer of Minneapolis Employees Retirement Fund from 1996 to 2008. Ms. Johnson is an attorney, certified public accountant and a certified managerial accountant. | | N/A |
| | | |
| David F. Larcker (Born 1950) | | Trustee, since 2009 | | James Irvin Miller Professor of Accounting at the Graduate School of Business, Stanford University, Director of the Corporate Governance Research Initiative and Senior Faculty of The Rock Center for Corporate Governance since 2006. From 2005 to 2008, Professor of Accounting at the Graduate School of Business, Stanford University. Prior thereto, Ernst & Young Professor of Accounting at The Wharton School, University of Pennsylvania from 1985 to 2005. | | N/A |
62 | Wells Fargo Core Bond Fund
Other information (unaudited)
| | | | | | |
Name and
year of birth | | Position held and
length of service* | | Principal occupations during past five years or longer | | Current other
public company or
investment
company
directorships |
| | | |
| Olivia S. Mitchell (Born 1953) | | Trustee, since 2006; Nominating and Governance Committee Chair, since 2018 | | International Foundation of Employee Benefit Plans Professor, Wharton School of the University of Pennsylvania since 1993. Director of Wharton’s Pension Research Council and Boettner Center on Pensions & Retirement Research, and Research Associate at the National Bureau of Economic Research. Previously, Cornell University Professor from 1978 to 1993. | | N/A |
| | | |
| Timothy J. Penny (Born 1951) | | Trustee, since 1996; Chairman, since 2018 | | President and Chief Executive Officer of Southern Minnesota Initiative Foundation, a non-profit organization, since 2007. Member of the Board of Trustees of NorthStar Education Finance, Inc., a non-profit organization, since 2007. | | N/A |
| | | |
| James G. Polisson (Born 1959) | | Trustee, since 2018 | | Retired. Chief Marketing Officer, Source (ETF) UK Services, Ltd, from 2015 to 2017. From 2012 to 2015, Principal of The Polisson Group, LLC, a management consulting, corporate advisory and principal investing company. Chief Executive Officer and Managing Director at Russell Investments, Global Exchange Traded Funds from 2010 to 2012. Managing Director of Barclays Global Investors from 1998 to 2010 and Global Chief Marketing Officer for iShares and Barclays Global Investors from 2000 to 2010. Trustee of the San Francisco Mechanics’ Institute, a non-profit organization, from 2013 to 2015. Board member of the Russell Exchange Traded Fund Trust from 2011 to 2012. Director of Barclays Global Investors Holdings Deutschland GmbH from 2006 to 2009. Mr. Polisson is an attorney and has a retired status with the Massachusetts and District of Columbia Bar Associations. | | N/A |
| | | |
| Pamela Wheelock (Born 1959) | | Trustee, since January 2020; previously Trustee from January 2018 to July 2019 | | Board member of the Destination Medical Center Economic Development Agency, Rochester, Minnesota since 2019 and Interim President of the McKnight Foundation since 2020. Acting Commissioner, Minnesota Department of Human Services, July 2019 through September 2019. Human Services Manager (part-time), Minnesota Department of Human Services, October 2019 through December 2019. Chief Operating Officer, Twin Cities Habitat for Humanity from 2017 to 2019. Vice President of University Services, University of Minnesota from 2012 to 2016. Prior thereto, on the Board of Directors, Governance Committee and Finance Committee for the Minnesota Philanthropy Partners (Saint Paul Foundation) from 2012 to 2018, Interim Chief Executive Officer of Blue Cross Blue Shield of Minnesota from 2011 to 2012, Chairman of the Board from 2009 to 2012 and Board Director from 2003 to 2015. Vice President, Leadership and Community Engagement, Bush Foundation, Saint Paul, Minnesota (a private foundation) from 2009 to 2011. Executive Vice President and Chief Financial Officer, Minnesota Sports and Entertainment from 2004 to 2009 and Senior Vice President from 2002 to 2004. Executive Vice President of the Minnesota Wild Foundation from 2004 to 2008. Commissioner of Finance, State of Minnesota, from 1999 to 2002. Currently Board Chair of the Minnesota Wild Foundation since 2010. | | N/A |
| * | Length of service dates reflect the Trustee’s commencement of service with the Trust’s predecessor entities, where applicable. |
Wells Fargo Core Bond Fund | 63
Other information (unaudited)
Officers
| | | | |
Name and
year of birth | | Position held and
length of service | | Principal occupations during past five years or longer |
| | |
| Andrew Owen (Born 1960) | | President, since 2017 | | Executive Vice President of Wells Fargo & Company and Head of Affiliated Managers, Wells Fargo Asset Management, since 2014. In addition, Mr. Owen is currently President, Chief Executive Officer and Director of Wells Fargo Funds Management, LLC since 2017. Prior thereto, Executive Vice President responsible for marketing, investments and product development for Wells Fargo Funds Management, LLC, from 2009 to 2014. |
| | |
| Nancy Wiser1 (Born 1967) | | Treasurer, since 2012 | | Executive Vice President of Wells Fargo Funds Management, LLC since 2011. Chief Operating Officer and Chief Compliance Officer at LightBox Capital Management LLC, from 2008 to 2011. |
| | |
| Michelle Rhee (Born 1966) | | Chief Legal Officer, since 2019 | | Secretary of Wells Fargo Funds Management, LLC, Chief Legal Counsel of Wells Fargo Asset Management and Assistant General Counsel of Wells Fargo Bank, N.A. since 2018. Associate General Counsel and Managing Director of Bank of America Corporation from 2004 to 2018. |
| | |
| Catherine Kennedy (Born 1969) | | Secretary, since 2019 | | Vice President of Wells Fargo Funds Management, LLC and Senior Counsel of the Wells Fargo Legal Department since 2010. Vice President and Senior Counsel of Evergreen Investment Management Company, LLC from 1998 to 2010. |
| | |
| Michael H. Whitaker (Born 1967) | | Chief Compliance Officer, since 2016 | | Chief Compliance Officer of Wells Fargo Asset Management since 2016. Senior Vice President and Chief Compliance Officer for Fidelity Investments from 2007 to 2016. |
| | |
| David Berardi (Born 1975) | | Assistant Treasurer, since 2009 | | Vice President of Wells Fargo Funds Management, LLC since 2009. Vice President of Evergreen Investment Management Company, LLC from 2008 to 2010. Manager of Fund Reporting and Control for Evergreen Investment Management Company, LLC from 2004 to 2010. |
| | |
| Jeremy DePalma1 (Born 1974) | | Treasurer, since 2012 | | Senior Vice President of Wells Fargo Funds Management, LLC since 2009. Senior Vice President of Evergreen Investment Management Company, LLC from 2008 to 2010 and head of the Fund Reporting and Control Team within Fund Administration from 2005 to 2010. |
| 1 | Nancy Wiser acts as Treasurer of 65 funds in the Fund Complex. Jeremy DePalma acts as the Treasurer of 82 funds in the Fund Complex. |
| 2 | The Statement of Additional Information includes additional information about the Trustees and is available, without charge, upon request, by calling 1-800-222-8222 or by visiting the website at wfam.com. |
64 | Wells Fargo Core Bond Fund
Other information (unaudited)
BOARD CONSIDERATION OF INVESTMENT MANAGEMENT, ADVISORY AND SUB-ADVISORY AGREEMENTS:
Wells Fargo Core Bond Fund and Wells Fargo Core Bond Portfolio
Under the Investment Company Act of 1940 (the “1940 Act”), the Board of Trustees (each, a “Board” and collectively, the “Boards”) of each of Wells Fargo Funds Trust (“Funds Trust”) and Wells Fargo Master Trust (“Master Trust”, and collectively, the “Trusts”) must determine annually whether to approve the continuation of the Trusts’ investment management, advisory and sub-advisory agreements, as applicable. In this regard, at a Board meeting held on May 26, 2020 and May 28, 2020 (together, the “Meeting”), the Funds Trust Board, all the members of which have no direct or indirect interest in the investment management agreement and are not “interested persons” of the Trusts, as defined in the 1940 Act (the “Independent Trustees”), reviewed and approved for Wells Fargo Core Bond Fund (the “Gateway Fund”) an investment management agreement (the “Gateway Fund Management Agreement”) with Wells Fargo Funds Management, LLC (“Funds Management”).
At the Meeting, the Master Trust Board, all the members of which have no direct or indirect interest in the investment advisory and sub-advisory agreements and are Independent Trustees, reviewed and approved: (i) an investment advisory agreement (the “Master Portfolio Advisory Agreement”) with Funds Management for Wells Fargo Core Bond Portfolio, a portfolio of Master Trust (the “Master Portfolio”); and (ii) an investment sub-advisory agreement (the “Sub-Advisory Agreement”) with Wells Capital Management Incorporated (the “Sub-Adviser”), an affiliate of Funds Management, for the Master Portfolio.
The Gateway Fund and the Master Portfolio are collectively referred to as the “Funds.” The Gateway Fund Management Agreement, the Master Portfolio Advisory Agreement and the Sub-Advisory Agreement are collectively referred to as the “Advisory Agreements.”
The Gateway Fund is a gateway feeder fund that invest substantially all of its assets in the Master Portfolio. The Master Portfolio has a substantially similar investment objective and substantially similar investment strategies to the Gateway Fund. Information provided to the Boards regarding the Gateway Fund is also applicable to the Master Portfolio, as relevant.
At the Meeting, the Boards considered the factors and reached the conclusions described below relating to the selection of Funds Management and the Sub-Adviser and the approval of the Advisory Agreements. Prior to the Meeting, including at a Board meeting held in April 2020, the Trustees conferred extensively among themselves and with representatives of Funds Management about these matters. Also, the Boards have adopted a team-based approach, with each team consisting of a sub-set of Trustees, to assist the full Boards in the discharge of their duties in reviewing investment performance and other matters throughout the year. The Independent Trustees were assisted in their evaluation of the Advisory Agreements by independent legal counsel, from whom they received separate legal advice and with whom they met separately.
In providing information to the Boards, Funds Management and the Sub-Adviser were guided by a detailed set of requests for information submitted to them by independent legal counsel on behalf of the Independent Trustees at the start of the Boards’ annual contract renewal process earlier in 2020. In considering and approving the Advisory Agreements, the Trustees considered the information they believed relevant, including but not limited to the information discussed below. The Boards considered not only the specific information presented in connection with the Meeting, but also the knowledge gained over time through interaction with Funds Management and the Sub-Adviser about various topics. In this regard, the Boards reviewed reports of Funds Management at each of their quarterly meetings, which included, among other things, portfolio reviews and investment performance reports. In addition, the Boards and the teams mentioned above confer with portfolio managers at various times throughout the year. The Boards did not identify any particular information or consideration that was all-important or controlling, and each individual Trustee may have attributed different weights to various factors.
After its deliberations, the Funds Trust Board unanimously approved the continuation of the Gateway Fund Management Agreement for a one-year period. Additionally, after its deliberations, the Master Trust Board unanimously approved the continuation of the Master Portfolio Advisory Agreement and the Sub-Advisory Agreement, each for a one-year term. The Boards also determined that the compensation payable to Funds Management and the Sub-Adviser was reasonable. The Boards considered the approval of the Advisory Agreements for the Funds as part of their consideration of agreements for funds across the complex, but their approvals were made on a fund-by-fund basis. The following summarizes a number of important, but not necessarily all, factors considered by the Boards in support of their approvals.
Nature, extent and quality of services
The Boards received and considered various information regarding the nature, extent and quality of services provided to the Funds by Funds Management and the Sub-Adviser under the Advisory Agreements. This information included a description of the investment advisory services and Fund-level administrative services, as well as, among other things, a summary of the background and experience of senior management of Wells Fargo Asset Management (“WFAM”), of which Funds Management
Wells Fargo Core Bond Fund | 65
Other information (unaudited)
and the Sub-Adviser are a part, and a summary of investments made in the business of WFAM. The Boards also received a description of Funds Management’s and the Sub-Adviser’s business continuity plans and of their approaches to data privacy and cybersecurity, and related testing. The Boards also received and reviewed information about Funds Management’s role as administrator of the Funds’ liquidity risk management program, Funds Management’s approach to risk management, and Funds Management’s intermediary and vendor oversight program. The Boards also considered the qualifications, background, tenure and responsibilities of each of the portfolio managers primarily responsible for the day-to-day portfolio management of the Funds.
The Boards evaluated the ability of Funds Management and the Sub-Adviser to attract and retain qualified investment professionals, including research, advisory and supervisory personnel. The Boards further considered the compliance programs and compliance records of Funds Management and the Sub-Adviser. In addition, the Boards took into account the full range of services provided to the Funds by Funds Management and its affiliates.
Fund investment performance and expenses
The Boards considered the investment performance results for each of the Funds over various time periods ended December 31, 2019. The Board also considered more current results for various time periods ended March 31, 2020. The Boards considered these results in comparison to the investment performance of funds in a universe that was determined by Broadridge Inc. (“Broadridge”) to be similar to the Gateway Fund (the “Universe”), and in comparison to the Gateway Fund’s benchmark index and to other comparative data. Broadridge is an independent provider of investment company data. The Boards received a description of the methodology used by Broadridge to select the mutual funds in the performance Universe. The Funds Trust Board noted that the investment performance of the Gateway Fund (Administrator Class) was higher than or in range of the average investment performance of its Universe for the five- and ten-year periods ended December 31, 2019, and lower than the average investment performance of its Universe for the one- and three-year periods ended December 31, 2019. The Funds Trust Board also noted that the investment performance of the Gateway Fund (Administrator Class) was higher than the average investment performance of its Universe for all periods ended March 31, 2020. The Funds Trust Board also noted that the investment performance of the Gateway Fund was higher than its benchmark, the Bloomberg Barclays U.S. Aggregate Bond Index, for the ten-year period ended December 31, 2019, and lower than its benchmark for the one-, three- and five-year period ended December 31, 2019. The Funds Trust Board also noted that the investment performance of the Gateway Fund was in range of its benchmark, the Bloomberg Barclays U.S. Aggregate Bond Index, for the ten-year period ended March 31, 2020, and lower than its benchmark for the one-, three- and five-year periods ended March 31, 2020.
The Master Trust Board took note of the investment performance of the Master Portfolio in the context of reviewing the investment performance of the Gateway Fund.
The Funds Trust Board received information concerning, and discussed factors contributing to, the underperformance of the Gateway Fund relative to the Universe and benchmark for the periods identified above. The Funds Trust Board took note of the explanations for the relative underperformance during these periods, including with respect to investment decisions and market factors that affected the Gateway Fund’s investment performance.
The Funds Trust Board also received and considered information regarding the Gateway Fund’s net operating expense ratios, which include fees and expenses of the Master Portfolio, and their various components, including actual management fees assessed at the Gateway Fund and Master Portfolio levels, custodian and other non-management fees, and Rule 12b-1 and non-Rule 12b-1 shareholder service fees. The Funds Trust Board considered these ratios in comparison to the median ratios of funds in class-specific expense groups that were determined by Broadridge to be similar to the Gateway Fund (the “Groups”). The Funds Trust Board received a description of the methodology used by Broadridge to select the mutual funds in the expense Groups and an explanation of how funds comprising expense groups and their expense ratios may vary from year-to-year. Based on the Broadridge reports, the Funds Trust Board noted that the net operating expense ratios of the Gateway Fund were lower than or equal to the median net operating expense ratios of its expense Groups for all share classes.
With respect to the Master Portfolio, the Master Trust Board reviewed the fee rates that are payable to Funds Management for investment advisory services (as discussed below), which are the only fees charged at the Master Portfolio level, relative to a corresponding expense Group.
The Boards took into account the Funds’ investment performance and expense information provided to them among the factors considered in deciding to re-approve the Advisory Agreements.
Investment management, advisory and sub-advisory fee rates
The Funds Trust Board noted that Funds Management receives no advisory fees from the Gateway Fund as long as the Gateway Fund continues to invest all (or substantially all) of its assets in a single master portfolio. If the Gateway Fund were to change its investment structure so that it began investing in two or more master portfolios (a fund-of-funds), Funds Management would
66 | Wells Fargo Core Bond Fund
Other information (unaudited)
be entitled to receive an annual fee of 0.25% of the Gateway Fund’s average daily net assets for providing investment advisory services to the Gateway Fund, including allocating the Gateway Fund’s assets to the Master Portfolio.
The Funds Trust Board reviewed and considered the contractual fee rates that are payable by the Gateway Fund to Funds Management under the Gateway Fund Management Agreement for management services (other than investment advisory services), as well as the contractual fee rates payable by the Gateway Fund to Funds Management for class-level administrative services under a Class-Level Administration Agreement, which include, among other things, class-level transfer agency and sub-transfer agency costs (collectively, the “Management Rates”).
The Master Trust Board reviewed and considered the contractual investment advisory fee rate that is payable by the Master Portfolio to Funds Management for investment advisory services under the Master Portfolio Advisory Agreement (the “Advisory Agreement Rate”). The Master Trust Board also reviewed and considered the contractual investment sub-advisory fee rate that is payable by Funds Management to the Sub-Adviser for investment sub-advisory services (the “Sub-Advisory Agreement Rate”).
Among other information reviewed by the Funds Trust Board was a comparison of the Gateway Fund’s Management Rate, which, for this purpose, includes the advisory fees paid at the Master Portfolio level, with the average contractual investment management fee rates of funds in the expense Groups at a common asset level as well as transfer agency costs of the funds in the expense Groups. The Funds Trust Board noted that the Management Rates of the Gateway Fund were lower than or equal to the sum of these average rates for the Gateway Fund’s expense Groups for all share classes.
The Master Trust Board reviewed a comparison of the Advisory Agreement Rate of the Master Portfolio with those of other funds in the Master Portfolio’s expense Group at a common asset level. The Master Trust Board noted that the Advisory Agreement Rate of the Master Portfolio was in range of the median rate for the Master Portfolio’s expense Group.
The Master Trust Board also received and considered information about the portions of the total management fees that were retained by Funds Management after payment of the fees to the Sub-Adviser for sub-advisory services. In assessing the reasonableness of these amounts, the Master Trust Board received and evaluated information about the nature and extent of responsibilities retained and risks assumed by Funds Management and not delegated to or assumed by the Sub-Adviser, and about Funds Management’s on-going oversight services. Given the affiliation between Funds Management and the Sub-Adviser, the Master Trust Board ascribed limited relevance to the allocation of fees between them.
The Boards also received and considered information about the nature and extent of services offered and fee rates charged by Funds Management and the Sub-Adviser to other types of clients with investment strategies similar to those of the Funds. In this regard, the Boards received information about the significantly greater scope of services, and compliance, reporting and other legal burdens and risks of managing proprietary mutual funds compared with those associated with managing assets of other types of clients, including third-party sub-advised fund clients and non-mutual fund clients such as institutional separate accounts.
Based on its consideration of the factors and information it deemed relevant, including those described here, the Funds Trust Board determined that the compensation payable to Funds Management under the Gateway Fund Management Agreement was reasonable, and the Master Trust Board determined that the compensation payable to Funds Management under the Master Portfolio Advisory Agreement and to the Sub-Adviser under the Sub-Advisory Agreement was reasonable.
Profitability
The Boards received and considered information concerning the profitability of Funds Management, as well as the profitability of both WFAM and Wells Fargo & Co. (“Wells Fargo”) from providing services to the fund family as a whole. The Boards noted that the Sub-Adviser’s profitability information with respect to providing services to the Master Portfolio and other funds in the family was subsumed in the WFAM and Wells Fargo profitability analysis.
Funds Management reported on the methodologies and estimates used in calculating profitability, including a description of the methodology used to allocate certain expenses. Among other things, the Boards noted that the levels of profitability reported on a fund-by-fund basis varied widely, depending on factors such as the size, type and age of fund. Based on its review, the Boards did not deem the profits reported by Funds Management, WFAM or Wells Fargo from services provided to the Funds to be at a level that would prevent the Boards from approving the continuation of the Advisory Agreements.
Economies of scale
The Boards received and considered information about the potential for Funds Management to experience economies of scale in the provision of management services to the Funds, the difficulties of calculating economies of scale at an individual fund level, and the extent to which potential scale benefits are shared with shareholders. The Boards noted the existence of breakpoints in
Wells Fargo Core Bond Fund | 67
Other information (unaudited)
the Master Portfolio’s advisory fee structure and the Gateway Fund’s management fee structure, which operate generally to reduce the Funds’ expense ratios as the Funds grow in size, and the size of the Master Portfolio and the Gateway Fund, respectively, in relation to such breakpoints. The Boards considered that, in addition to advisory fee and management fee breakpoints, Funds Management shares potential economies of scale from its management business in a variety of ways, including through fee waiver and expense reimbursement arrangements, services that benefit shareholders, competitive management fee rates set at the outset without regard to breakpoints, and investments in the business intended to enhance services available to shareholders.
The Boards concluded that Funds Management’s arrangements with respect to each Fund, including contractual breakpoints, constituted a reasonable approach to sharing potential economies of scale with the Funds and their shareholders.
Other benefits to Funds Management and the Sub-Adviser
The Boards received and considered information regarding potential “fall-out” or ancillary benefits received by Funds Management and its affiliates, including the Sub-Adviser, as a result of their relationships with the Funds. Ancillary benefits could include, among others, benefits directly attributable to other relationships with the Funds and benefits potentially derived from an increase in Funds Management’s and the Sub-Adviser’s business as a result of their relationships with the Funds. The Boards noted that various affiliates of Funds Management may receive distribution-related fees, shareholder servicing payments and sub-transfer agency fees in respect of shares sold or held through them and services provided.
The Boards also reviewed information about soft dollar credits earned and utilized by the Sub-Adviser, fees earned by Funds Management and the Sub-Adviser from managing a private investment vehicle for the fund family’s securities lending collateral, and commissions earned by an affiliated broker from portfolio transactions.
Based on their consideration of the factors and information they deemed relevant, including those described here, the Boards did not find that any ancillary benefits received by Funds Management and its affiliates, including the Sub-Adviser, were unreasonable.
Conclusion
At the Meeting, after considering the above-described factors and based on its deliberations and its evaluation of the information described above, the Funds Trust Board unanimously approved the continuation of the Gateway Fund Management Agreement for a one-year period. Additionally, after its deliberations, the Master Trust Board unanimously approved the continuation of the Master Portfolio Advisory Agreement and the Sub-Advisory Agreement for a one-year term. The Boards also determined that the compensation payable to Funds Management and the Sub-Adviser was reasonable.
68 | Wells Fargo Core Bond Fund
Other information (unaudited)
LIQUIDITY RISK MANAGEMENT PROGRAM
In accordance with Rule 22e-4 under the Investment Company Act of 1940, as amended (the “Liquidity Rule”), each of Wells Fargo Funds Trust and Wells Fargo Master Trust (each a “Trust”) has adopted and implemented a liquidity risk management program (the “Program”) on behalf of each of its non-money market series, including the Fund and the Portfolio, respectively, which is reasonably designed to assess and manage the Fund’s or the Portfolio’s liquidity risk. “Liquidity risk” is defined as the risk that the Fund or Portfolio is unable to meet redemption requests without significantly diluting remaining investors’ interests. Each Trust’s Board of Trustees (each a “Board”) previously approved the designation of Wells Fargo Funds Management, LLC (“Funds Management”), the Fund’s investment manager and the Portfolio’s investment adviser, as the administrator of the Program, and Funds Management has established a Liquidity Risk Management Council composed of personnel from multiple departments within Funds Management and its affiliates to assist Funds Management in the implementation and on-going administration of the Program.
The Program is comprised of various components designed to support the assessment and/or management of liquidity risk, including: (1) the periodic assessment (no less frequently than annually) of certain factors that influence the Fund’s and the Portfolio’s liquidity risk; (2) the periodic classification (no less frequently than monthly) of the Fund’s and the Portfolio’s investments into one of four liquidity categories that reflect an estimate of their liquidity under current market conditions; (3) a 15% limit on the acquisition of “illiquid investments” (as defined under the Liquidity Rule); (4) to the extent the Fund or the Portfolio does not invest primarily in “highly liquid investments” (as defined under the Liquidity Rule), the determination of a minimum percentage of the Fund’s or the Portfolio’s assets that generally will be invested in highly liquid investments (an “HLIM”); (5) if the Fund or the Portfolio has established an HLIM, the periodic review (no less frequently than annually) of the HLIM and the adoption of policies and procedures for responding to a shortfall of the Fund’s or the Portfolio’s “highly liquid investments” below its HLIM; and (6) periodic reporting to the respective Board.
At a meeting of each Board held on May 26 and 28, 2020, the Board received a written report (the “Report”) from Funds Management that addressed the operation of the Program and assessed its adequacy and effectiveness of implementation. The Report covered the initial period from December 1, 2018 through December 31, 2019 (the “Reporting Period”). No significant liquidity events impacting the Fund or the Portfolio were noted in the Report. There were no material changes to the Program during the Reporting Period. The Report concluded that the Program is operating effectively to assess and manage the Fund’s and the Portfolio’s liquidity risk, and that the Program has been and continues to be adequately and effectively implemented to monitor and, as applicable, respond to the Fund’s and the Portfolio’s liquidity developments.
There can be no assurance that the Program will achieve its objectives under all circumstances in the future. Please refer to the Fund’s prospectus for more information regarding the Fund’s exposure to liquidity risk and other risks to which an investment in the Fund may be subject.
Wells Fargo Core Bond Fund | 69
Appendix I (unaudited)
Effective on or about May 1, 2020, if you purchase Fund shares through a Janney Montgomery Scott LLC (“Janney”) brokerage account, you will be eligible for the following load waivers (front-end sales charge waivers and contingent deferred sales charge (“CDSC”), or back-end sales charge, waivers) and discounts, which may differ from those disclosed elsewhere in the Fund’s Prospectus or SAI.
|
| Front-end sales charge* waivers on Class A shares available at Janney |
|
| Shares purchased through reinvestment of capital gains distributions and dividend reinvestment when purchasing shares of the same fund (but not any other fund within the fund family). |
|
| Shares purchased by employees and registered representatives of Janney or its affiliates and their family members as designated by Janney. |
|
| Shares purchased from the proceeds of redemptions within the same fund family, provided (1) the repurchase occurs within ninety (90) days following the redemption, (2) the redemption and purchase occur in the same account, and (3) redeemed shares were subject to a front-end or deferred sales load (i.e., right of reinstatement). |
|
| Employer-sponsored retirement plans (e.g., 401(k) plans, 457 plans, employer-sponsored 403(b) plans, profit sharing and money purchase pension plans and defined benefit plans). For purposes of this provision, employer-sponsored retirement plans do not include SEP IRAs, Simple IRAs, SAR-SEPs or Keogh plans. |
|
| Shares acquired through a right of reinstatement. |
|
| Class C shares that are no longer subject to a contingent deferred sales charge and are converted to Class A shares of the same fund pursuant to Janney’s policies and procedures. |
| CDSC waivers on Class A and Class C shares available at Janney |
|
| Shares sold upon the death or disability of the shareholder. |
|
| Shares sold as part of a systematic withdrawal plan as described in the Fund’s Prospectus. |
|
| Shares purchased in connection with a return of excess contributions from an IRA account. |
|
| Shares sold as part of a required minimum distribution for IRA and retirement accounts if the redemption is taken in or after the year the shareholder reaches qualified age based on applicable IRS regulations. |
|
| Shares sold to pay Janney fees but only if the transaction is initiated by Janney. |
|
| Shares acquired through a right of reinstatement. |
|
| Shares exchanged into the same share class of a different fund. |
| Front-end sales charge* discounts available at Janney; breakpoints, rights of accumulation and/or letters of intent |
|
| Breakpoints as described in the Fund’s Prospectus. |
|
| Rights of accumulation (“ROA”), which entitle shareholders to breakpoint discounts, will be automatically calculated based on the aggregated holding of fund family assets held by accounts within the purchaser’s household at Janney. Eligible fund family assets not held at Janney may be included in the ROA calculation only if the shareholder notifies his or her financial advisor about such assets. |
|
| Letters of intent which allow for breakpoint discounts based on anticipated purchases within a fund family, over a 13-month time period. Eligible fund family assets not held at Janney Montgomery Scott may be included in the calculation of letters of intent only if the shareholder notifies his or her financial advisor about such assets. |
| * | Also referred to as an “initial sales charge.” |
70 | Wells Fargo Core Bond Fund
Appendix II (unaudited)
Effective on or after May 1, 2020, clients of Edward Jones (also referred to as “shareholders”) purchasing Fund shares on the Edward Jones commission and fee-based platforms are eligible only for the following sales charge discounts (also referred to as “breakpoints”) and waivers, which can differ from breakpoints and waivers described elsewhere in the Fund’s Prospectus or SAI or through another broker-dealer. In all instances, it is the shareholder’s responsibility to inform Edward Jones at the time of purchase of any relationship, holdings of Wells Fargo Funds or other facts qualifying the purchaser for breakpoints or waivers. Edward Jones can ask for documentation of such circumstance.
|
| Breakpoints available at Edward Jones |
|
| Rights of Accumulation (ROA) |
|
The applicable sales charge on a purchase of Class A shares is determined by taking into account all share classes (except any money market funds and retirement plan share classes) of Wells Fargo Funds held by the shareholder or in an account grouped by Edward Jones with other accounts for the purpose of providing certain pricing considerations (“pricing groups”). This includes all share classes held on the Edward Jones platform and/or held on another platform. The inclusion of eligible fund family assets in the rights of accumulation calculation is dependent on the shareholder notifying his or her financial advisor of such assets at the time of calculation. |
|
ROA is determined by calculating the higher of cost or market value (current shares x NAV). |
|
| Letter of Intent (LOI) |
|
Through a LOI, shareholders can receive the sales charge and breakpoint discounts for purchases shareholders intend to makeover a 13-month period from the date Edward Jones receives the LOI. The LOI is determined by calculating the higher of cost or market value of qualifying holdings at LOI initiation in combination with the value that the shareholder intends to buy over a 13-month period to calculate the front-end sales charge and any breakpoint discounts. Each purchase the shareholder makes during that 13-month period will receive the sales charge and breakpoint discount that applies to the total amount. The inclusion of eligible fund family assets in the LOI calculation is dependent on the shareholder notifying his or her financial advisor of such assets at the time of calculation. Purchases made before the LOI is received by Edward Jones are not covered under the LOI and will not reduce the sales charge previously paid. Sales charges will be adjusted if LOI is not met. |
| Sales charges are waived for the following shareholders and in the following situations at Edward Jones: |
● Associates of Edward Jones and its affiliates and their family members who are in the same pricing group (as determined by Edward Jones under its policies and procedures) as the associate. This waiver will continue for the remainder of the associate’s life if the associate retires from Edward Jones in good-standing. |
● Shares purchased in an Edward Jones fee-based program. |
● Shares purchased through reinvestment of capital gains distributions and dividend reinvestment. |
● Shares purchased from the proceeds of redeemed shares of the same fund family so long as the following conditions are met: 1)the proceeds are from the sale of shares within 60 days of the purchase, and 2) the sale and purchase are made in the same share class and the same account or the purchase is made in an individual retirement account with proceeds from liquidations in anon-retirement account. |
● Shares exchanged into Class A shares from another share class so long as the exchange is into the same fund and was initiated at the discretion of Edward Jones. Edward Jones is responsible for any remaining CDSC due to the fund company, if applicable. Any future purchases are subject to the applicable sales charge as disclosed in the prospectus. |
● Exchanges from Class C shares to Class A shares of the same fund, generally, in the 84th month following the anniversary of the purchase date or earlier at the discretion of Edward Jones. |
|
If the shareholder purchases shares that are subject to a CDSC and those shares are redeemed before the CDSC is expired, the shareholder
is responsible to pay the CDSC except in the following conditions available at Edward Jones: |
● The death or disability of the shareholder. |
● Systematic withdrawals with up to 10% per year of the account value. |
● Return of excess contributions from an Individual Retirement Account (IRA). |
● Shares sold as part of a required minimum distribution for IRA and retirement accounts if the redemption is taken in or after the year the shareholder reaches qualified age based on applicable IRS regulation. |
● Shares sold to pay Edward Jones fees or costs in such cases where the transaction is initiated by Edward Jones. |
● Shares exchanged in an Edward Jones fee-based program. |
● Shares acquired through NAV reinstatement. |
Wells Fargo Core Bond Fund | 71
Appendix II (unaudited)
|
| Other Important Information for accounts at Edward Jones: |
| Minimum Purchase Amounts |
● $250 initial purchase minimum |
● $50 subsequent purchase minimum |
|
| Minimum Balances |
| Edward Jones has the right to redeem at its discretion fund holdings with a balance of $250 or less. The following are examples of accounts that are not included in this policy: |
● A fee-based account held on an Edward Jones platform |
● A 529 account held on an Edward Jones platform |
● An account with an active systematic investment plan or letter of intent (LOI) |
|
| Changing Share Classes |
| At any time it deems necessary, Edward Jones has the authority to exchange at NAV a shareholder’s holdings in a fund to Class A shares. |
72 | Wells Fargo Core Bond Fund
Appendix III (unaudited)
Effective June 1, 2020, shareholders purchasing Fund shares through an Oppenheimer & Co. Inc. (“Oppenheimer”) platform or account are eligible only for the following load waivers (front-end sales charge waivers and contingent deferred or back-end, sales charge waivers) and discounts, which may differ from those disclosed in the Fund’s Prospectus or SAI.
|
| Front-end Sales Load Waivers on Class A Shares available at Oppenheimer |
|
| Employer-sponsored retirement, deferred compensation and employee benefit plans (including health savings accounts) and trusts used to fund those plans, provided that the shares are not held in a commission-based brokerage account and shares are held for the benefit of the plan. |
|
| Shares purchased by or through a 529 Plan. |
|
| Shares purchased through an Oppenheimer affiliated investment advisory program. |
|
| Shares purchased through reinvestment of capital gains distributions and dividend reinvestment when purchasing shares of the same fund (but not any other fund within the fund family). |
|
| Shares purchased from the proceeds of redemptions within the same fund family, provided (1) the repurchase occurs within 90 days following the redemption, (2) the redemption and purchase occur in the same account, and (3) redeemed shares were subject to a front-end or deferred sales load (known as Rights of Restatement). |
|
| A shareholder in the Fund’s Class C shares will have their shares exchanged at net asset value to Class A shares (or the appropriate share class) of the Fund if the shares are no longer subject to a CDSC and the exchange is in line with the policies and procedures of Oppenheimer. |
|
| Employees and registered representatives of Oppenheimer or its affiliates and their family members. |
|
| Directors or Trustees of the Fund, and employees of the Fund’s investment adviser or any of its affiliates, as described in the Prospectus. |
| CDSC Waivers on A and C Shares available at Oppenheimer |
|
| Death or disability of the shareholder. |
|
| Shares sold as part of a systematic withdrawal plan as described in the Prospectus. |
|
| Return of excess contributions from an IRA Account. |
|
| Shares sold as part of a required minimum distribution for IRA and retirement accounts due to the shareholder reaching the qualified age based on applicable IRS regulations as described in the Prospectus. |
|
| Shares sold to pay Oppenheimer fees but only if the transaction is initiated by Oppenheimer. |
|
| Shares acquired through a right of reinstatement. |
| Front-end load Discounts Available at Oppenheimer: Breakpoints, Rights of Accumulation & Letters of Intent |
|
| Breakpoints as described in the Prospectus. |
|
| Rights of Accumulation (ROA), which entitle shareholders to breakpoint discounts, will be automatically calculated based on the aggregated holding of fund family assets held by accounts within the purchaser’s household at Oppenheimer. Eligible fund family assets not held at Oppenheimer may be included in the ROA calculation only if the shareholder notifies his or her financial advisor about such assets. |
Wells Fargo Core Bond Fund | 73
Appendix IV (unaudited)
Effective June 15, 2020, shareholders purchasing fund shares through a Robert W. Baird & Co. (“Baird”) platform or account will only be eligible for the following sales charge waivers (front-end sales charge waivers and CDSC waivers) and discounts, which may differ from those disclosed elsewhere in the Fund’s Prospectus or the SAI.
|
| Front-end Sales Load Waivers on Class A Shares available at Baird |
|
| Shares purchased through reinvestment of capital gains distributions and dividend reinvestment when purchasing share of the same fund. |
|
| Share purchase by employees and registers representatives of Baird or its affiliate and their family members as designated by Baird. |
|
| Shares purchase from the proceeds of redemptions within the same fund family, provided (1) the repurchase occurs within 90 days following the redemption, (2) the redemption and purchase occur in the same accounts, and (3) redeemed shares were subject to a front-end or deferred sales charge (known as rights of reinstatement). |
|
| A shareholder in the Funds Investor C Shares will have their share exchanged at net asset value to Investor A shares of the fund if the shares are no longer subject to CDSC and the exchange is in line with the policies and procedures of Baird. |
|
| Employer-sponsored retirement plans or charitable accounts in a transactional brokerage account at Baird, including 401(k)plans, 457 plans, employer-sponsored 403(b) plans, profit sharing and money purchase pension plans and defined benefit plans. For purposes of this provision, employer-sponsored retirement plans do not include SEP IRAs, Simple IRAs or SAR-SEPs. |
| CDSC Waivers on A and C Shares available at Baird |
|
| Shares sold due to death or disability of the shareholder. |
|
| Shares sold as part of a systematic withdrawal plan as described in the Fund’s Prospectus. |
|
| Shares bought due to returns of excess contributions from an IRA Account. |
|
| Shares sold as part of a required minimum distribution for IRA and retirement accounts due to the shareholder reaching age 72as described in the Fund’s Prospectus. |
|
| Shares sold to pay Baird fees but only if the transaction is initiated by Baird. |
|
| Shares acquired through a right of reinstatement. |
| Front-end load Discounts Available at Baird: Breakpoint and/or Rights of Accumulation |
|
| Breakpoints as described in the Prospectus. |
|
| Rights of accumulations which entitles shareholders to breakpoint discounts will be automatically calculated based on the aggregated holding of fund family assets held by accounts within the purchaser’s household at Baird. Eligible fund family assets not held at Baird may be included in the rights of accumulations calculation only if the shareholder notifies his or her financial advisor about such assets. |
|
| Letters of Intent (LOI) allow for breakpoint discounts based on anticipated purchases within a fund family through Baird, over a13-month period of time. |
74 | Wells Fargo Core Bond Fund
This page is intentionally left blank.
This page is intentionally left blank.

For more information
More information about Wells Fargo Funds is available free upon request. To obtain literature, please write, visit the Fund’s website, or call:
Wells Fargo Funds
P.O. Box 219967
Kansas City, MO 64121-9967
Website: wfam.com
Individual investors: 1-800-222-8222
Retail investment professionals: 1-888-877-9275
Institutional investment professionals: 1-866-765-0778

This report and the financial statements contained herein are submitted for the general information of the shareholders of the Fund. If this report is used for promotional purposes, distribution of the report must be accompanied or preceded by a current prospectus. Before investing, please consider the investment objectives, risks, charges, and expenses of the investment. For a current prospectus and, if available, a summary prospectus, containing this information, call 1-800-222-8222 or visit the Fund’s website at wfam.com. Read the prospectus carefully before you invest or send money.
Wells Fargo Asset Management (WFAM) is the trade name for certain investment advisory/management firms owned by Wells Fargo & Company. These firms include but are not limited to Wells Capital Management Incorporated and Wells Fargo Funds Management, LLC. Certain products managed by WFAM entities are distributed by Wells Fargo Funds Distributor, LLC (a broker-dealer and Member FINRA).
This material is for general informational and educational purposes only and is NOT intended to provide investment advice or a recommendation of any kind—including a recommendation for any specific investment, strategy, or plan.
INVESTMENT PRODUCTS: NOT FDIC INSURED ◾ NO BANK GUARANTEE ◾ MAY LOSE VALUE
© 2020 Wells Fargo & Company. All rights reserved.
PAR-0620-00336 07-20
A287/AR287 05-20
Annual Report
May 31, 2020
Wells Fargo Emerging Growth Fund
Beginning on January 1, 2021, as permitted by new regulations adopted by the Securities and Exchange Commission, paper copies of the Wells Fargo Funds’ annual and semi-annual shareholder reports issued after this date will no longer be sent by mail, unless you specifically request paper copies of the reports. Instead, the reports will be made available on the Funds’ website, and you will be notified by mail each time a report is posted and provided with a website address to access the report.
If you already elected to receive shareholder reports electronically, you will not be affected by this change and you need not take any action. You may elect to receive shareholder reports and other communications from the Fund electronically at any time by contacting your financial intermediary (such as a broker-dealer or bank) or, if you are a direct investor, by calling 1-800-222-8222 or by enrolling at wellsfargo.com/advantagedelivery.
You may elect to receive all future reports in paper free of charge. If you invest through a financial intermediary, you can contact your financial intermediary to request that you continue to receive paper copies of your shareholder reports; if you invest directly with the Fund, you can call 1-800-222-8222. Your election to receive reports in paper will apply to all Wells Fargo Funds held in your account with your financial intermediary or, if you are a direct investor, to all Wells Fargo Funds that you hold.
|
|
|
Reduce clutter. Save trees. |
Sign up for electronic delivery of prospectuses and shareholder reports at wellsfargo.com/ advantagedelivery |
The views expressed and any forward-looking statements are as of May 31, 2020, unless otherwise noted, and are those of the Fund managers and/or Wells Fargo Asset Management. Discussions of individual securities, or the markets generally, or any Wells Fargo Fund are not intended as individual recommendations. Future events or results may vary significantly from those expressed in any forward-looking statements. The views expressed are subject to change at any time in response to changing circumstances in the market. Wells Fargo Asset Management and the Fund disclaim any obligation to publicly update or revise any views expressed or forward-looking statements.
INVESTMENT PRODUCTS: NOT FDIC INSURED ◾ NO BANK GUARANTEE ◾ MAY LOSE VALUE
Wells Fargo Emerging Growth Fund | 1
Letter to shareholders (unaudited)

Andrew Owen
President
Wells Fargo Funds
Dear Shareholder:
We are pleased to offer you this annual report for the Wells Fargo Emerging Growth Fund for the 12-month period that ended May 31, 2020. Global stock markets saw earlier gains erased in February and March as governments around the world took unprecedented measures to stop the spread of the coronavirus at the expense of short-term economic output. However, markets rebounded in April and May to offset much of the losses as central banks attempted to bolster capital markets and confidence. Fixed-income markets generally performed better, achieving widespread gains.
For the 12-month period, fixed-income securities generally had positive total returns while non-U.S. equities had broad losses and U.S. stocks performed strongly despite sharp volatility since late February. For the period, U.S. stocks, based on the S&P 500 Index,1 gained 12.84%. International stocks, as measured by the MSCI ACWI ex USA Index (Net),2 returned -3.43%, while the MSCI EM Index (Net)3 trailed slightly, with a -4.39% return. For bond investors, the Bloomberg Barclays U.S. Aggregate Bond Index4 gained a robust 9.42%, the Bloomberg Barclays Global Aggregate ex-USD Index5 returned 2.67%, and the Bloomberg Barclays Municipal Bond Index6 gained a more modest 3.98%, while the ICE BofA U.S. High Yield Index7 had a slight gain of 0.35%.
The fiscal year began on a positive note.
The 12-month period began with U.S. equity market advances during June and July 2019. The gains, primarily driven by geopolitical and monetary policy events, pushed equity markets to new highs. European Central Bank (ECB) President Mario Draghi indicated the bank was ready to cut rates or buy more assets to prop up inflation if needed. President Trump backed off of earlier tariff threats against Mexico and China. In the U.S., the Federal Reserve (Fed) implemented a 0.25% federal funds rate cut in July.
Later in July, the U.S. reversed course and threatened to impose higher tariffs on China’s exports after talks failed. China responded with tariff threats of its own and devalued the renminbi, roiling global markets. Major U.S. stock market indices closed July with the worst weekly results of the year. Bond prices gained as Treasury yields fell to multiyear lows, and the yield curve inverted at multiple points along the 30-year arc, with shorter-term yields higher than longer-term.
In August, U.S.-China trade tensions continued with no signs of compromise. Evidence of a continued global economic slowdown mounted, and central banks in China, New Zealand, and Thailand cut interest rates. Industrial and manufacturing data declined in China, Canada, Japan, and Germany. Adding to global uncertainty, Italy’s prime minister resigned,
| 1 | The S&P 500 Index consists of 500 stocks chosen for market size, liquidity, and industry group representation. It is a market-value-weighted index with each stock’s weight in the index proportionate to its market value. You cannot invest directly in an index. |
| 2 | The Morgan Stanley Capital International (MSCI) All Country World Index (ACWI) ex USA Index (Net) is a free-float-adjusted market-capitalization-weighted index that is designed to measure the equity market performance of developed and emerging markets, excluding the United States. Source: MSCI. MSCI makes no express or implied warranties or representations and shall have no liability whatsoever with respect to any MSCI data contained herein. The MSCI data may not be further redistributed or used as a basis for other indices or any securities or financial products. This report is not approved, reviewed, or produced by MSCI. You cannot invest directly in an index. |
| 3 | The MSCI Emerging Markets (EM) Index (Net) is a free-float-adjusted market-capitalization-weighted index that is designed to measure equity market performance of emerging markets. You cannot invest directly in an index. |
| 4 | The Bloomberg Barclays U.S. Aggregate Bond Index is a broad-based benchmark that measures the investment-grade, U.S. dollar-denominated, fixed-rate taxable bond market, including Treasuries, government-related and corporate securities, mortgage-backed securities (agency fixed-rate and hybrid adjustable-rate mortgage pass-throughs), asset-backed securities, and commercial mortgage-backed securities. You cannot invest directly in an index. |
| 5 | The Bloomberg Barclays Global Aggregate ex-USD Index is an unmanaged index that provides a broad-based measure of the global investment-grade fixed-income markets excluding the U.S. dollar-denominated debt market. You cannot invest directly in an index. |
| 6 | The Bloomberg Barclays Municipal Bond Index is an unmanaged index composed of long-term tax-exempt bonds with a minimum credit rating of Baa. You cannot invest directly in an index. |
| 7 | The ICE BofA U.S. High Yield Index is a market-capitalization-weighted index of domestic and Yankee high-yield bonds. The index tracks the performance of high-yield securities traded in the U.S. bond market. You cannot invest directly in an index. Copyright 2020. ICE Data Indices, LLC. All rights reserved. |
2 | Wells Fargo Emerging Growth Fund
Letter to shareholders (unaudited)
many feared a crackdown in Hong Kong as protestors sustained their calls for reform, and Prime Minister Boris Johnson planned to suspend the British Parliament as Brexit’s deadline neared.
In the U.S., the Fed cut interest rates a second time in September. U.S. manufacturing data disappointed investors. The U.S. Congress announced it would pursue an impeachment investigation of President Trump. Meanwhile, the Brexit impasse showed no signs of resolution. Officials in China said that hitting the country’s economic growth goals for the year would be difficult considering the weight of tariffs and trade restrictions. Although the S&P 500 Index finished the third quarter with the best year-to-date returns in more than 20 years, concerns about future returns remained.
The fourth quarter of 2019 started on a strong note, with U.S.-China trade tensions relaxing in October along with renewed optimism for a U.K. Brexit deal and positive macroeconomic data. The initial estimate of U.S. third-quarter gross domestic product growth was a resilient 1.9% annualized rate, while the U.S. unemployment rate fell to a 50-year low of 3.5% in September. However, despite resilience among U.S. consumers, business confidence declined and manufacturing activity contracted. Concerned with a potential economic slowdown, the Fed lowered interest rates another quarter point in late October—its third rate cut in four months. This helped push the S&P 500 Index to a new all-time high while emerging market equities rallied and global bonds declined overall, reflecting a broad pickup in risk appetite.
Equity markets continued to rally in November despite ongoing geopolitical risks. Hopes for a U.S.-China trade deal buoyed investor confidence. U.S. business sentiment improved slightly, and manufacturing and services activity picked up. While consumer confidence and purchasing manager activity rose in the eurozone, China reported weakening manufacturing and consumer data. Bond yields rose marginally, leading to slightly negative returns for global government and investment-grade corporate bonds.
Financial markets ended 2019 with a boost from the U.S. and China accord on a Phase One trade deal. That, along with the landslide win by the pro-Brexit U.K. Conservative Party in a national election and ongoing central bank support, gave investors greater confidence. U.S. economic indicators were generally positive, with the exception of manufacturing activity and business confidence. Consumer confidence was resilient, fed by a robust labor market, tame inflation, and lower interest rates, which boosted housing affordability and stimulated homebuyer activity. The impeachment of U.S. President Donald Trump had little impact on markets. Meanwhile, slowing Chinese economic activity, partly attributable to the trade war, led to further government stimulus at year-end through lower reserve ratios, allowing banks to lend more money.
The year-end rally continued in early January 2020. However, capital market volatility picked up sharply in late January on concerns over the potential impact of the coronavirus on the global economy and stock markets. With sentiment somewhat souring, perceived safe havens did well in January. The U.S. dollar and Japanese yen both rose, and government bonds outperformed equities. While the S&P 500 Index held its ground, emerging market equities tumbled, including those in Asia.
In February, the coronavirus became the major market focus. Fears of the virus’s impact on global growth led to expectations of increased global central bank monetary policy support. That led the 10-year U.S. Treasury yield to fall to an all-time low of 1.1% by the end of the month. Although equity markets initially shrugged off concerns about the outbreak, focusing instead on strong fourth-quarter earnings and improving business confidence in January, market sentiment turned sharply lower toward month-end and the S&P 500 Index lost 8.2% for the month. Oil prices tumbled as Russia and the Organization of the Petroleum Exporting Countries compounded a major decline in oil demand with a brutal price war, partly aimed at dissuading further U.S. shale production. As a result, the price of West Texas Intermediate crude oil fell 13% in February.
Wells Fargo Emerging Growth Fund | 3
Letter to shareholders (unaudited)
“The global spread of the coronavirus led country after country to clamp down on social and business-related activity in order to contain the virus from causing even greater devastation and overwhelming health care systems.”
“Markets rebounded strongly in April after the earlier extreme volatility, with the S&P 500 Index gaining 12.8% for the month and the MSCI ACWI ex USA Index (Net) returning 7.6%.”
|
|
|
For further information about your Fund, contact your investment professional, visit our website at wfam.com, or call us directly at 1-800-222-8222. |
The global spread of the coronavirus led country after country to clamp down on social and business-related activity in order to contain the virus from causing even greater devastation and overwhelming health care systems. This abrupt stoppage of economic activity led to the sharp deceleration of global output, sending economies into a deep contraction. Central bank responses were swift, as they slashed interest rates and expanded quantitative easing programs to restore liquidity and confidence to the markets. In the U.S., the Fed introduced several new lending programs, funding investment-grade bonds, money market mutual funds, and commercial paper while purchasing Treasuries, mortgage-backed securities, and overnight repurchase agreements. Meanwhile, stock markets tumbled quickly into a bear market, ending the longest bull stock market in U.S. history.
Markets rebounded strongly in April after the earlier extreme volatility, with the S&P 500 Index gaining 12.8% for the month and the MSCI ACWI ex USA Index (Net) returning 7.6%. The rebound was fueled by unprecedented government and central bank stimulus measures taken to buffer the economic damage created by mass shutdowns enacted in order to contain the virus’s spread. The U.S. economy contracted by an annualized 4.8% pace in the first quarter, with 30 million new unemployment insurance claims in six weeks. In the eurozone, first-quarter real gross domestic product (GDP) shrank 3.8%, with the composite April Flash Purchasing Managers’ Index , a monthly survey of purchasing managers, falling to an all-time low of 13.5. The ECB expanded its quantitative easing to include the purchase of additional government bonds of countries with the greatest virus-related need, including Italy and Spain. China’s first-quarter GDP fell by 6.8% year over year. However, retail sales, production, and investment showed signs of recovery. Extreme oil price volatility continued as global supply far exceeded demand.
In May, the equity market rebound continued, with the S&P 500 Index climbing a further 4.8%. European and Japanese stock markets also had monthly gains. Investors regained confidence on reports of early signs of success in human trials of a coronavirus vaccine. Growth stocks continued to outperform value stocks while returns on global government bonds were generally flat. In the U.S., a gap grew between the stock market rebound and devastating economic data points, including an April unemployment rate of 14.7%, the highest level since World War II. Purchasing managers’ indices continued to reflect weakening activity in May in both the manufacturing and services sectors. U.S. corporate earnings reports indicated a 14% year-over-year contraction in earnings from the first quarter of 2019. However, high demand for technology, driven by remote activity, helped maintain robust information technology sector earnings, which helped drive powerful well-known technology stocks higher.
Don’t let short-term uncertainty derail long-term investment goals.
Periods of investment uncertainty can present challenges, but experience has taught us that maintaining long-term investment goals can be an effective way to plan for the future. To help you create a sound strategy based on your personal goals and risk tolerance, Wells Fargo Funds offers more than 100 mutual funds spanning a wide range of asset classes and investment styles. Although diversification cannot guarantee an investment profit or prevent losses, we believe it can be an effective way to manage investment risk and potentially smooth out overall portfolio performance. We encourage investors to know their investments and to understand that appropriate levels of risk-taking may unlock opportunities.
Thank you for choosing to invest with Wells Fargo Funds. We appreciate your confidence in us and remain committed to helping you meet your financial needs.
Sincerely,

Andrew Owen
President
Wells Fargo Funds
4 | Wells Fargo Emerging Growth Fund
This page is intentionally left blank.
Performance highlights (unaudited)
Investment objective
The Fund seeks long-term capital appreciation.
Manager
Wells Fargo Funds Management, LLC
Subadviser for the affiliated master portfolio1
Wells Capital Management Incorporated
Portfolio managers
Joseph M. Eberhardy, CFA®‡ , CPA
Thomas C. Ognar, CFA®‡
Average annual total returns (%) as of May 31, 2020
| | | | | | | | | | | | | | | | | | | | | | | | | | | | | | | | | | |
| | | | |
| | | | | Including sales charge | | | Excluding sales charge | | | Expense ratios2 (%) | |
| | | | | | | | | |
| | | Inception date | | 1 year | | | 5 year | | | 10 year | | | 1 year | | | 5 year | | | 10 year | | | Gross | | | Net3 | |
| | | | | | | | | | |
| Class A (WEMAX) | | 3-31-2008 | | | 8.36 | | | | 8.43 | | | | 13.24 | | | | 14.97 | | | | 9.72 | | | | 13.91 | | | | 1.55 | | | | 1.28 | |
| | | | | | | | | | |
| Class C (WEMCX) | | 3-31-2008 | | | 13.16 | | | | 8.91 | | | | 13.06 | | | | 14.16 | | | | 8.91 | | | | 13.06 | | | | 2.30 | | | | 2.03 | |
| | | | | | | | | | |
| Class R6 (WEGRX)4 | | 7-31-2018 | | | – | | | | – | | | | – | | | | 15.51 | | | | 10.25 | | | | 14.47 | | | | 1.12 | | | | 0.85 | |
| | | | | | | | | | |
| Administrator Class (WFGDX) | | 1-31-2007 | | | – | | | | – | | | | – | | | | 15.07 | | | | 9.86 | | | | 14.08 | | | | 1.47 | | | | 1.20 | |
| | | | | | | | | | |
| Institutional Class (WEMIX) | | 3-31-2008 | | | – | | | | – | | | | – | | | | 15.40 | | | | 10.19 | | | | 14.44 | | | | 1.22 | | | | 0.90 | |
| | | | | | | | | | |
| Russell 2000® Growth Index5 | | – | | | – | | | | – | | | | – | | | | 7.32 | | | | 6.34 | | | | 11.72 | | | | – | | | | – | |
Figures quoted represent past performance, which is no guarantee of future results, and do not reflect taxes that a shareholder may pay on an investment in a fund. Investment return and principal value of an investment will fluctuate so that an investor’s shares, when redeemed, may be worth more or less than their original cost. Performance shown without sales charges would be lower if sales charges were reflected. Current performance may be lower or higher than the performance data quoted, which assumes the reinvestment of dividends and capital gains. Current month-end performance is available on the Fund’s website, wfam.com.
Index returns do not include transaction costs associated with buying and selling securities, any mutual fund fees or expenses, or any taxes. It is not possible to invest directly in an index.
For Class A shares, the maximum front-end sales charge is 5.75%. For Class C shares, the maximum contingent deferred sales charge is 1.00%. Performance including a contingent deferred sales charge assumes the sales charge for the corresponding time period. Class R6, Administrator Class, and Institutional Class shares are sold without a front-end sales charge or contingent deferred sales charge.
Stock values fluctuate in response to the activities of individual companies and general market and economic conditions. Smaller-company stocks tend to be more volatile and less liquid than those of larger companies. Certain investment strategies tend to increase the total risk of an investment (relative to the broader market). The Fund is exposed to foreign investment risk. Consult the Fund’s prospectus for additional information on these and other risks.
Please see footnotes on page 7.
6 | Wells Fargo Emerging Growth Fund
Performance highlights (unaudited)
|
|
| Growth of $10,000 investment as of May 31, 20206 |
|
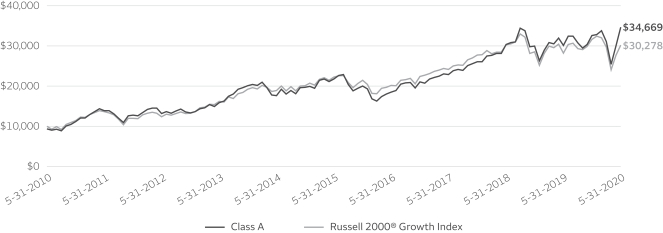
|
| ‡ | CFA® and Chartered Financial Analyst® are trademarks owned by CFA Institute. |
| 1 | The Fund is a feeder fund in a master-feeder structure that invests substantially all of its assets in a single affiliated master portfolio of the Wells Fargo Master Trust with a substantially identical investment objective and substantially similar investment strategies. References to the investment activities of the Fund are intended to refer to the investment activities of the affiliated master portfolio in which it invests. |
| 2 | Reflects the expense ratios as stated in the most recent prospectuses, which include the impact of 0.20% in acquired fund fees and expenses. The expense ratios shown are subject to change and may differ from the annualized expense ratios shown in the financial highlights of this report, which do not include acquired fund fees and expenses. |
| 3 | The manager has contractually committed through September 30, 2020, to waive fees and/or reimburse expenses to the extent necessary to cap total annual fund operating expenses after fee waivers at 1.28% for Class A, 2.03% for Class C, 0.85% for Class R6, 1.20% for Administrator Class, and 0.90% for Institutional Class. Brokerage commissions, stamp duty fees, interest, taxes, acquired fund fees and expenses (if any) from funds in which the affiliated master portfolio invests, and extraordinary expenses are excluded from the expense caps. Net expenses from the affiliated master portfolio are included in the expense caps. Prior to or after the commitment expiration date, the caps may be increased or the commitment to maintain the caps may be terminated only with the approval of the Board of Trustees. Without these caps, the Fund’s returns would have been lower. The expense ratio paid by an investor is the net expense ratio (the total annual fund operating expenses after fee waivers) as stated in the prospectuses. |
| 4 | Historical performance shown for the Class R6 shares prior to their inception reflects the performance of the Institutional Class shares, and includes the higher expenses applicable to the Institutional Class shares. If these expenses had not been included, returns for the Class R6 shares would be higher. |
| 5 | The Russell 2000® Growth Index measures the performance of those Russell 2000 companies with higher price/book ratios and higher forecasted growth values. You cannot invest directly in an index. |
| 6 | The chart compares the performance of Class A shares for the most recent ten years with the Russell 2000® Growth Index. The chart assumes a hypothetical $10,000 investment in Class A shares and reflects all operating expenses and assumes the maximum initial sales charge of 5.75%. |
| 7 | The Russell 2000® Index measures the performance of the 2,000 smallest companies in the Russell 3000® Index, which represents approximately 8% of the total market capitalization of the Russell 3000® Index. You cannot invest directly in an index. |
| 8 | The ten largest holdings, excluding cash, cash equivalents and any money market funds, are calculated based on the value of the securities of the affiliated master portfolio allocable to the Fund divided by the total net assets of the Fund. Holdings are subject to change and may have changed since the date specified. |
| 9 | Amounts represent the sector allocation of the affiliated master portfolio which are calculated based on the total long-term investments of the affiliated master portfolio. These amounts are subject to change and may have changed since the date specified. |
| * | This security was no longer held at the end of the period. |
Wells Fargo Emerging Growth Fund | 7
Performance highlights (unaudited)
MANAGER’S DISCUSSION
Fund highlights
| ∎ | | The Fund outperformed the Russell 2000® Growth Index for the 12-month period that ended May 31, 2020. |
| ∎ | | Relative performance contributions came from software stocks within information technology (IT), industrials, and specialty insurance stocks within financials. |
| ∎ | | Detractors in the Fund mainly stemmed from stocks within the health care sector. |
Equity markets demonstrated strong consistency and low volatility during the period.
For much of the 12-month period, stocks were largely impervious to tariffs on Chinese goods and other geopolitical events. However, in the first quarter of 2020, the spread of the coronavirus pandemic crippled the global economy, sending U.S. equities into a laconic bear market. The unprecedented spread of the coronavirus prompted global central banks to quickly inject massive liquidity into the markets. On the fiscal side, the U.S. government passed the Coronavirus Aid, Relief, and Economic Security Act and other stimulative measures to support the economy. The Russell 2000® Index7 set a record for the quickest descent into bear market territory while most commodities were decimated as expectations for global demand waned. A key advantage of our diversified approach is that it allows us to take advantage of dislocations in the market as the underappreciated gap widens. We have been through these periods before and we will rely on our experience as a guide for the current market.
| | | | |
|
| Ten largest holdings (%) as of May 31, 20208 | |
| | |
Casella Waste Systems Incorporated Class A | | | 3.30 | |
| | |
Q2 Holdings Incorporated | | | 3.03 | |
| | |
Envestnet Incorporated | | | 2.96 | |
| | |
Kinsale Capital Group Incorporated | | | 2.93 | |
| | |
ASGN Incorporated | | | 2.92 | |
| | |
Rexnord Corporation | | | 2.61 | |
| | |
Rapid7 Incorporated | | | 2.53 | |
| | |
Mercury Computer Systems Incorporated | | | 2.53 | |
| | |
Novanta Incorporated | | | 2.37 | |
| | |
SPS Commerce Incorporated | | | 2.17 | |
IT contributed while health care detracted.
Notable strength from the IT sector, particularly within the software-as-a-service area, aided relative performance as companies such as Five9, Incorporated, witnessed an increase demand for their unique offering, a mobility infrastructure that makes it easier for agents to work remotely through the disruptions presented by the coronavirus. Select stocks within the financials sector contributed, such as Kinsale Capital Group, provider of excess and supply insurance. Kinsale rallied sharply after reporting a strong increase in submissions and net premium earned metrics throughout the period. Elsewhere within the portfolio, iRhythm Technologies, Incorporated, was rewarded for its innovative Zio patch system, which detects symptomatic arrhythmia.
|
|
| Sector allocation as of May 31, 20209 |
|
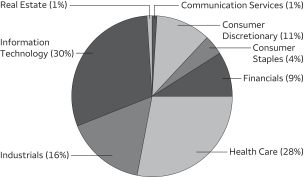 |
Weakness in the portfolio came mainly from stocks within the health care sector. Medical devices holding Merit Medical Systems, Incorporated*, maker of more than 200 devices, fell sharply after it delivered disappointing results that fell short of expectations on revenue and earnings per share, citing slowness from its higher-margin products. Other weakness came from LendingTree, Incorporated, which fell sharply in the first quarter of 2020 as credit card, personal loan, and small business lenders spent less on their platform amid the economic slowdown. Other detractors included Talend SA, one of the few publicly listed pure-play data integration companies, which reported a deceleration in
operating margins coupled with weaker fiscal year guidance. Further share pressure prevailed after its cloud solutions partner, Cloudera, delivered poor earnings metrics, sending Talend shares down in sympathy with the group.
Although our companies are certainly susceptible to changes in the economic cycle, many of the stocks we own are exhibiting strong relevance in the current environment. Some of their secular attributes can be personified in our SCODIi acronym, which stands for SaaS, cloud services, online retail, digital payments, the internet of things, and innovation. For instance, within SaaS
Please see footnotes on page 7.
8 | Wells Fargo Emerging Growth Fund
Performance highlights (unaudited)
(software as a service), companies that offer critical event management capabilities are helping people function through multiple verticals within the work environment. In cloud computing, workload usage has spiked both at the enterprise and individual levels as more people are vying for storage and bandwidth. While overall consumer spending has decelerated, online purchases through e-commerce sites have risen sharply, enabling payment processors to benefit from increased digital transactions. The internet of things within the semiconductor industry has played an essential role as cloud service usage from areas like gaming has been supported by more powerful underlying chip hardware. Lastly, within innovation, diagnostics companies have changed their testing methods by setting up mobile stations for patients who would otherwise be unable to receive their services.
The market volatility in early 2020 enabled us to opportunistically add to positions in stocks with strong secular drivers whose absolute and relative valuations were trading at attractive levels. Volatility tends to add fear and uncertainty to the investor psyche, which may prompt investors to capitulate into cash. We caution that market timing has proven to be a very costly proposition for growth investors, as those who miss the best days in the market have significantly underperformed those who remain fully invested. We remain comfortable with our positioning and maintain a diversified portfolio that we believe will be successful in a panoply of outcomes. We have a history of navigating through turbulent markets and subsequently emerging with strong performance in ensuing years. We do not believe that now is the time to panic and we are allowing our investment process to guide our decisions in an effort to position our portfolios to thrive over the long term.
Wells Fargo Emerging Growth Fund | 9
Fund expenses (unaudited)
As a shareholder of the Fund, you incur two types of costs: (1) transaction costs, including sales charges (loads) on purchase payments and contingent deferred sales charges (if any) on redemptions and (2) ongoing costs, including management fees, distribution (12b-1) and/or shareholder servicing fees, and other Fund expenses. This example is intended to help you understand your ongoing costs (in dollars) of investing in the Fund and to compare these costs with the ongoing costs of investing in other mutual funds.
The example is based on an investment of $1,000 invested at the beginning of the six-month period and held for the entire period from December 1, 2019 to May 31, 2020.
Actual expenses
The “Actual” line of the table below provides information about actual account values and actual expenses. You may use the information in this line, together with the amount you invested, to estimate the expenses that you paid over the period. Simply divide your account value by $1,000 (for example, an $8,600 account value divided by $1,000 = 8.6), then multiply the result by the number in the “Actual” line under the heading entitled “Expenses paid during period” for your applicable class of shares to estimate the expenses you paid on your account during this period.
Hypothetical example for comparison purposes
The “Hypothetical” line of the table below provides information about hypothetical account values and hypothetical expenses based on the Fund’s actual expense ratio and an assumed rate of return of 5% per year before expenses, which is not the Fund’s actual return. The hypothetical account values and expenses may not be used to estimate the actual ending account balance or expenses you paid for the period. You may use this information to compare the ongoing costs of investing in the Fund and other funds. To do so, compare this 5% hypothetical example with the 5% hypothetical examples that appear in the shareholder reports of the other funds.
Please note that the expenses shown in the table are meant to highlight your ongoing costs only and do not reflect any transactional costs, such as sales charges (loads) and contingent deferred sales charges. Therefore, the “Hypothetical” line of the table is useful in comparing ongoing costs only and will not help you determine the relative total costs of owning different funds. In addition, if these transactional costs were included, your costs would have been higher.
| | | | | | | | | | | | | | | | |
| | | Beginning
account value
12-1-2019 | | | Ending
account value
5-31-2020 | | | Expenses
paid during
the period1,2 | | | Annualized net
expense ratio1 | |
| | | | | |
Class A | | | | | | | | | | | | | | | | |
| | | | |
Actual | | $ | 1,000.00 | | | $ | 1,063.12 | | | $ | 6.45 | | | | 1.25 | % |
| | | | |
Hypothetical (5% return before expenses) | | $ | 1,000.00 | | | $ | 1,018.75 | | | $ | 6.31 | | | | 1.25 | % |
| | | | | |
Class C | | | | | | | | | | | | | | | | |
| | | | |
Actual | | $ | 1,000.00 | | | $ | 1,059.26 | | | $ | 10.45 | | | | 2.03 | % |
| | | | |
Hypothetical (5% return before expenses) | | $ | 1,000.00 | | | $ | 1,014.85 | | | $ | 10.22 | | | | 2.03 | % |
| | | | | |
Class R6 | | | | | | | | | | | | | | | | |
| | | | |
Actual | | $ | 1,000.00 | | | $ | 1,065.43 | | | $ | 4.39 | | | | 0.85 | % |
| | | | |
Hypothetical (5% return before expenses) | | $ | 1,000.00 | | | $ | 1,020.75 | | | $ | 4.29 | | | | 0.85 | % |
| | | | | |
Administrator Class | | | | | | | | | | | | | | | | |
| | | | |
Actual | | $ | 1,000.00 | | | $ | 1,063.46 | | | $ | 6.19 | | | | 1.20 | % |
| | | | |
Hypothetical (5% return before expenses) | | $ | 1,000.00 | | | $ | 1,019.00 | | | $ | 6.06 | | | | 1.20 | % |
| | | | | |
Institutional Class | | | | | | | | | | | | | | | | |
| | | | |
Actual | | $ | 1,000.00 | | | $ | 1,065.61 | | | $ | 4.65 | | | | 0.90 | % |
| | | | |
Hypothetical (5% return before expenses) | | $ | 1,000.00 | | | $ | 1,020.50 | | | $ | 4.55 | | | | 0.90 | % |
| 1 | Amounts reflect net expenses allocated from the affiliated Master Portfolio in which the Fund invests. |
| 2 | Expenses paid is equal to the annualized net expense ratio of each class multiplied by the average account value over the period, multiplied by the number of days in the most recent fiscal half-year divided by the number of days in the fiscal year (to reflect the one-half-year period). |
10 | Wells Fargo Emerging Growth Fund
Portfolio of investments—May 31, 2020
| | | | | | | | | | | | | | | | |
| | | | | | | | | | | | Value | |
| Investment Companies: 99.98% | | | | | | | | | | | | | | | | |
| | | | |
| Affiliated Master Portfolio: 99.98% | | | | | | | | | | | | |
Wells Fargo Emerging Growth Portfolio | | | | | | | | | | | | | | $ | 662,550,823 | |
| | | | | | | | | | | | | | | | |
| | | | |
Total Investment Companies (Cost $440,135,785) | | | | | | | | | | | | | | | 662,550,823 | |
| | | | | | | | | | | | | | | | |
| | | | | | | | |
| Total investments in securities (Cost $440,135,785) | | | 99.98 | % | | | 662,550,823 | |
| | |
Other assets and liabilities, net | | | 0.02 | | | | 133,838 | |
| | | | | | | | |
| Total net assets | | | 100.00 | % | | $ | 662,684,661 | |
| | | | | | | | |
Transactions with the affiliated Master Portfolio were as follows:
| | | | | | | | | | | | | | | | | | | | | | | | | | | | | | | | | | | | |
| | | % of
ownership,
beginning
of period | | | % of
ownership,
end of
period | | | Net realized
gains
(losses) on
securities
transactions
allocated
from
affiliated
Master
Portfolio | | | Net
change in
unrealized
gains
(losses) on
securities
transactions
allocated
from
affiliated
Master
Portfolio | | | Dividends
allocated
from
affiliated
Master
Portfolio | | | Securities
lending
income
allocated
from
affiliated
Master
Portfolio | | | Affiliated
income
allocated
from
affiliated
Master
Portfolio | | | Value,
end
of period | | | % of
net
assets | |
Wells Fargo Emerging Growth Portfolio | | | 91 | % | | | 92 | % | | $ | 87,082,930 | | | $ | 4,916,772 | | | $ | 702,756 | | | $ | 514,387 | | | $ | 134,927 | | | $ | 662,550,823 | | | | 99.98 | % |
The accompanying notes are an integral part of these financial statements.
Wells Fargo Emerging Growth Fund | 11
Statement of assets and liabilities—May 31, 2020
| | | | |
| | | | |
| |
Assets | | | | |
Investments in affiliated Master Portfolio, at value (cost $440,135,785) | | $ | 662,550,823 | |
Receivable for Fund shares sold | | | 1,081,905 | |
Receivable from manager | | | 38,230 | |
Prepaid expenses and other assets | | | 27,304 | |
| | | | |
Total assets | | | 663,698,262 | |
| | | | |
| |
Liabilities | | | | |
Payable for Fund shares redeemed | | | 804,461 | |
Administration fees payable | | | 78,333 | |
Distribution fee payable | | | 939 | |
Shareholder report expenses payable | | | 66,042 | |
Trustees’ fees and expenses payable | | | 759 | |
Accrued expenses and other liabilities | | | 63,067 | |
| | | | |
Total liabilities | | | 1,013,601 | |
| | | | |
Total net assets | | $ | 662,684,661 | |
| | | | |
| |
Net assets consist of | | | | |
Paid-in capital | | $ | 378,619,222 | |
Total distributable earnings | | | 284,065,439 | |
| | | | |
Total net assets | | $ | 662,684,661 | |
| | | | |
| |
Computation of net asset value and offering price per share | | | | |
Net assets – Class A | | $ | 148,866,069 | |
Shares outstanding – Class A1 | | | 10,118,794 | |
Net asset value per share – Class A | | | $14.71 | |
Maximum offering price per share – Class A2 | | | $15.61 | |
Net assets – Class C | | $ | 1,598,660 | |
Shares outstanding – Class C1 | | | 128,961 | |
Net asset value per share – Class C | | | $12.40 | |
Net assets – Class R6 | | $ | 19,457,920 | |
Shares outstanding – Class R61 | | | 1,191,113 | |
Net asset value per share – Class R6 | | | $16.34 | |
Net assets – Administrator Class | | $ | 21,250,433 | |
Shares outstanding – Administrator Class1 | | | 1,388,171 | |
Net asset value per share – Administrator Class | | | $15.31 | |
Net assets – Institutional Class | | $ | 471,511,579 | |
Shares outstanding – Institutional Class1 | | | 28,949,518 | |
Net asset value per share – Institutional Class | | | $16.29 | |
| 1 | The Fund has an unlimited number of authorized shares. |
| 2 | Maximum offering price is computed as 100/94.25 of net asset value. On investments of $50,000 or more, the offering price is reduced. |
The accompanying notes are an integral part of these financial statements.
12 | Wells Fargo Emerging Growth Fund
Statement of operations—year ended May 31, 2020
| | | | |
| | | | |
| |
Investment income | | | | |
Dividends allocated from affiliated Master Portfolio | | $ | 702,756 | |
Securities lending income allocated from affiliated Master Portfolio | | | 514,387 | |
Affiliated income allocated from affiliated Master Portfolio | | | 134,927 | |
Expenses allocated from affiliated Master Portfolio | | | (5,806,254 | ) |
| | | | |
Total investment income | | | (4,454,184 | ) |
| | | | |
| |
Expenses | | | | |
Management fee | | | 358,481 | |
Administration fees | |
Class A | | | 297,569 | |
Class C | | | 3,294 | |
Class R6 | | | 2,810 | |
Administrator Class | | | 28,175 | |
Institutional Class | | | 705,448 | |
Shareholder servicing fees | |
Class A | | | 354,249 | |
Class C | | | 3,921 | |
Administrator Class | | | 54,171 | |
Distribution fee | |
Class C | | | 11,760 | |
Custody and accounting fees | | | 27,952 | |
Professional fees | | | 31,490 | |
Registration fees | | | 73,735 | |
Shareholder report expenses | | | 86,621 | |
Trustees’ fees and expenses | | | 21,592 | |
Other fees and expenses | | | 15,828 | |
| | | | |
Total expenses | | | 2,077,096 | |
Less: Fee waivers and/or expense reimbursements | |
Fund-level | | | (525,443 | ) |
Class A | | | (40,554 | ) |
Administrator Class | | | (12 | ) |
Institutional Class | | | (269,023 | ) |
| | | | |
Net expenses | | | 1,242,064 | |
| | | | |
Net investment loss | | | (5,696,248 | ) |
| | | | |
|
Realized and unrealized gains (losses) on investments | |
Net realized gains on securities transactions allocated from affiliated Master Portfolio | | | 87,082,930 | |
Net change in unrealized gains (losses) on securities transactions allocated from affiliated Master Portfolio | | | 4,916,772 | |
| | | | |
Net realized and unrealized gains (losses) on investments | | | 91,999,702 | |
| | | | |
Net increase in net assets resulting from operations | | $ | 86,303,454 | |
| | | | |
The accompanying notes are an integral part of these financial statements.
Wells Fargo Emerging Growth Fund | 13
Statement of changes in net assets
| | | | | | | | | | | | | | | | |
| | | Year ended
May 31, 2020 | | | Year ended
May 31, 2019 | |
| | | | |
Operations | | | | | | | | | | | | | | | | |
Net investment loss | | | | | | $ | (5,696,248 | ) | | | | | | $ | (6,103,434 | ) |
Net realized gains on investments | | | | | | | 87,082,930 | | | | | | | | 97,676,529 | |
Net change in unrealized gains (losses) on investments | | | | | | | 4,916,772 | | | | | | | | (97,747,120 | ) |
| | | | |
Net increase (decrease) in net assets resulting from operations | | | | | | | 86,303,454 | | | | | | | | (6,174,025 | ) |
| | | | |
| | | | |
Distributions to shareholders from net investment income and net realized gains | | | | | | | | | | | | | | | | |
Class A | | | | | | | (7,796,239 | ) | | | | | | | (28,101,143 | ) |
Class C | | | | | | | (97,557 | ) | | | | | | | (901,234 | ) |
Class R6 | | | | | | | (245,756 | ) | | | | | | | (42,849 | )1 |
Administrator Class | | | | | | | (1,143,908 | ) | | | | | | | (8,840,125 | ) |
Institutional Class | | | | | | | (28,466,003 | ) | | | | | | | (102,793,991 | ) |
| | | | |
Total distributions to shareholders | | | | | | | (37,749,463 | ) | | | | | | | (140,679,342 | ) |
| | | | |
| | | | |
Capital share transactions | | | Shares | | | | | | | | Shares | | | | | |
Proceeds from shares sold | | | | | | | | | | | | | | | | |
Class A | | | 270,025 | | | | 3,503,910 | | | | 862,093 | | | | 13,135,712 | |
Class C | | | 14,056 | | | | 158,468 | | | | 77,032 | | | | 1,001,064 | |
Class R6 | | | 1,351,041 | | | | 21,252,448 | | | | 14,756 | 1 | | | 297,716 | 1 |
Administrator Class | | | 185,559 | | | | 2,546,018 | | | | 429,821 | | | | 7,044,106 | |
Institutional Class | | | 7,701,460 | | | | 113,827,845 | | | | 9,474,160 | | | | 157,333,266 | |
| | | | |
| | | | | | | 141,288,689 | | | | | | | | 178,811,864 | |
| | | | |
Reinvestment of distributions | | | | | | | | | | | | | | | | |
Class A | | | 556,631 | | | | 7,609,147 | | | | 2,156,211 | | | | 27,319,193 | |
Class C | | | 8,439 | | | | 97,557 | | | | 82,682 | | | | 901,234 | |
Class R6 | | | 16,154 | | | | 244,735 | | | | 2,781 | 1 | | | 38,603 | 1 |
Administrator Class | | | 80,016 | | | | 1,137,821 | | | | 670,663 | | | | 8,812,510 | |
Institutional Class | | | 1,832,144 | | | | 27,683,692 | | | | 7,302,150 | | | | 101,353,848 | |
| | | | |
| | | | | | | 36,772,952 | | | | | | | | 138,425,388 | |
| | | | |
Payment for shares redeemed | | | | | | | | | | | | | | | | |
Class A | | | (1,506,830 | ) | | | (19,951,780 | ) | | | (1,230,646 | ) | | | (18,738,814 | ) |
Class C | | | (45,564 | ) | | | (513,234 | ) | | | (283,432 | ) | | | (3,327,781 | ) |
Class R6 | | | (177,590 | ) | | | (2,654,701 | ) | | | (16,029 | )1 | | | (224,477 | )1 |
Administrator Class | | | (557,050 | ) | | | (7,634,612 | ) | | | (2,404,440 | ) | | | (34,455,016 | ) |
Institutional Class | | | (19,569,429 | ) | | | (282,480,504 | ) | | | (10,946,323 | ) | | | (181,113,056 | ) |
| | | | |
| | | | | | | (313,234,831 | ) | | | | | | | (237,859,144 | ) |
| | | | |
Net increase (decrease) in net assets resulting from capital share transactions | | | | | | | (135,173,190 | ) | | | | | | | 79,378,108 | |
| | | | |
Total decrease in net assets | | | | | | | (86,619,199 | ) | | | | | | | (67,475,259 | ) |
| | | | |
| | | | |
Net assets | | | | | | | | | | | | | | | | |
Beginning of period | | | | | | | 749,303,860 | | | | | | | | 816,779,119 | |
| | | | |
End of period | | | | | | $ | 662,684,661 | | | | | | | $ | 749,303,860 | |
| | | | |
| 1 | For the period from July 31, 2018 (commencement of class operations) to May 31, 2019 |
The accompanying notes are an integral part of these financial statements.
14 | Wells Fargo Emerging Growth Fund
Financial highlights
(For a share outstanding throughout each period)
| | | | | | | | | | | | | | | | | | | | |
| | | Year ended May 31 | |
| CLASS A | | 2020 | | | 2019 | | | 2018 | | | 2017 | | | 2016 | |
Net asset value, beginning of period | | | $13.51 | | | | $17.04 | | | | $14.57 | | | | $12.55 | | | | $16.70 | |
Net investment loss | | | (0.17 | ) | | | (0.16 | )1 | | | (0.15 | ) | | | (0.10 | )1 | | | (0.13 | )1 |
Net realized and unrealized gains (losses) on investments | | | 2.13 | | | | (0.19 | ) | | | 4.57 | | | | 2.96 | | | | (2.28 | ) |
| | | | | | | | | | | | | | | | | | | | |
Total from investment operations | | | 1.96 | | | | (0.35 | ) | | | 4.42 | | | | 2.86 | | | | (2.41 | ) |
Distributions to shareholders from | |
Net realized gains | | | (0.76 | ) | | | (3.18 | ) | | | (1.95 | ) | | | (0.84 | ) | | | (1.74 | ) |
Net asset value, end of period | | | $14.71 | | | | $13.51 | | | | $17.04 | | | | $14.57 | | | | $12.55 | |
Total return2 | | | 14.97 | % | | | (0.84 | )% | | | 32.91 | % | | | 23.39 | % | | | (14.94 | )% |
Ratios to average net assets (annualized) | |
Gross expenses3 | | | 1.36 | % | | | 1.35 | % | | | 1.36 | % | | | 1.36 | % | | | 1.35 | % |
Net expenses3 | | | 1.27 | % | | | 1.29 | % | | | 1.35 | % | | | 1.35 | % | | | 1.35 | % |
Net investment loss3 | | | (1.08 | )% | | | (1.06 | )% | | | (1.01 | )% | | | (0.72 | )% | | | (0.92 | )% |
Supplemental data | |
Portfolio turnover rate4 | | | 55 | % | | | 71 | % | | | 47 | % | | | 115 | % | | | 68 | % |
Net assets, end of period (000s omitted) | | | $148,866 | | | | $145,898 | | | | $153,526 | | | | $129,724 | | | | $127,154 | |
| 1 | Calculated based upon average shares outstanding |
| 2 | Total return calculations do not include any sales charges. |
| 3 | Ratios include net expenses allocated from the affiliated Master Portfolio which were as follows: |
| | | | |
Year ended May 31, 2020 | | | 0.81 | % |
Year ended May 31, 2019 | | | 0.81 | % |
Year ended May 31, 2018 | | | 0.81 | % |
Year ended May 31, 2017 | | | 0.81 | % |
Year ended May 31, 2016 | | | 0.80 | % |
| 4 | Portfolio turnover rate is calculated by multiplying the affiliated Master Portfolio’s percentage of the Fund’s total investments in securities at the end of the period by the affiliated Master Portfolio’s portfolio turnover rate. |
The accompanying notes are an integral part of these financial statements.
Wells Fargo Emerging Growth Fund | 15
Financial highlights
(For a share outstanding throughout each period)
| | | | | | | | | | | | | | | | | | | | |
| | | Year ended May 31 | |
| CLASS C | | 2020 | | | 2019 | | | 2018 | | | 2017 | | | 2016 | |
Net asset value, beginning of period | | | $11.58 | | | | $15.19 | | | | $13.28 | | | | $11.58 | | | | $15.67 | |
Net investment loss | | | (0.21 | )1 | | | (0.25 | )1 | | | (0.25 | )1 | | | (0.19 | )1 | | | (0.21 | ) |
Net realized and unrealized gains (losses) on investments | | | 1.79 | | | | (0.18 | ) | | | 4.11 | | | | 2.73 | | | | (2.14 | ) |
| | | | | | | | | | | | | | | | | | | | |
Total from investment operations | | | 1.58 | | | | (0.43 | ) | | | 3.86 | | | | 2.54 | | | | (2.35 | ) |
Distributions to shareholders from | |
Net realized gains | | | (0.76 | ) | | | (3.18 | ) | | | (1.95 | ) | | | (0.84 | ) | | | (1.74 | ) |
Net asset value, end of period | | | $12.40 | | | | $11.58 | | | | $15.19 | | | | $13.28 | | | | $11.58 | |
Total return2 | | | 14.16 | % | | | (1.55 | )% | | | 31.82 | % | | | 22.56 | % | | | (15.59 | )% |
Ratios to average net assets (annualized) | |
Gross expenses3 | | | 2.11 | % | | | 2.10 | % | | | 2.11 | % | | | 2.11 | % | | | 2.10 | % |
Net expenses3 | | | 2.03 | % | | | 2.04 | % | | | 2.10 | % | | | 2.10 | % | | | 2.10 | % |
Net investment loss3 | | | (1.84 | )% | | | (1.78 | )% | | | (1.76 | )% | | | (1.46 | )% | | | (1.70 | )% |
Supplemental data | |
Portfolio turnover rate4 | | | 55 | % | | | 71 | % | | | 47 | % | | | 115 | % | | | 68 | % |
Net assets, end of period (000s omitted) | | | $1,599 | | | | $1,761 | | | | $4,190 | | | | $3,328 | | | | $3,815 | |
| 1 | Calculated based upon average shares outstanding |
| 2 | Total return calculations do not include any sales charges. |
| 3 | Ratios include net expenses allocated from the affiliated Master Portfolio which were as follows: |
| | | | |
Year ended May 31, 2020 | | | 0.81 | % |
Year ended May 31, 2019 | | | 0.81 | % |
Year ended May 31, 2018 | | | 0.81 | % |
Year ended May 31, 2017 | | | 0.81 | % |
Year ended May 31, 2016 | | | 0.80 | % |
| 4 | Portfolio turnover rate is calculated by multiplying the affiliated Master Portfolio’s percentage of the Fund’s total investments in securities at the end of the period by the affiliated Master Portfolio’s portfolio turnover rate. |
The accompanying notes are an integral part of these financial statements.
16 | Wells Fargo Emerging Growth Fund
Financial highlights
(For a share outstanding throughout each period)
| | | | | | | | |
| | | Year ended May 31 | |
| CLASS R6 | | 2020 | | | 20191 | |
Net asset value, beginning of period | | | $14.86 | | | | $18.70 | |
Net investment loss | | | (0.10 | )2 | | | (0.07 | )2 |
Net realized and unrealized gains (losses) on investments | | | 2.34 | | | | (0.59 | ) |
| | | | | | | | |
Total from investment operations | | | 2.24 | | | | (0.66 | ) |
Distributions to shareholders from | |
Net realized gains | | | (0.76 | ) | | | (3.18 | ) |
Net asset value, end of period | | | $16.34 | | | | $14.86 | |
Total return3 | | | 15.51 | % | | | (2.35 | )% |
Ratios to average net assets (annualized) | |
Gross expenses4 | | | 0.93 | % | | | 0.92 | % |
Net expenses4 | | | 0.85 | % | | | 0.85 | % |
Net investment loss4 | | | (0.67 | )% | | | (0.51 | )% |
Supplemental data | |
Portfolio turnover rate5 | | | 55 | % | | | 71 | % |
Net assets, end of period (000s omitted) | | | $19,458 | | | | $22 | |
| 1 | For the period from July 31, 2018 (commencement of class operations) to May 31, 2019 |
| 2 | Calculated based upon average shares outstanding |
| 3 | Returns for periods of less than one year are not annualized. |
| 4 | Ratios include net expenses allocated from the affiliated Master Portfolio which were as follows: |
| | | | |
Year ended May 31, 2020 | | | 0.81 | % |
Year ended May 31, 20191 | | | 0.81 | % |
| 5 | Portfolio turnover rate is calculated by multiplying the affiliated Master Portfolio’s percentage of the Fund’s total investments in securities at the end of the period by the affiliated Master Portfolio’s portfolio turnover rate. |
The accompanying notes are an integral part of these financial statements.
Wells Fargo Emerging Growth Fund | 17
Financial highlights
(For a share outstanding throughout each period)
| | | | | | | | | | | | | | | | | | | | |
| | | Year ended May 31 | |
| ADMINISTRATOR CLASS | | 2020 | | | 2019 | | | 2018 | | | 2017 | | | 2016 | |
Net asset value, beginning of period | | | $14.02 | | | | $17.54 | | | | $14.93 | | | | $12.82 | | | | $17.00 | |
Net investment loss | | | (0.14 | )1 | | | (0.15 | )1 | | | (0.14 | )1 | | | (0.07 | )1 | | | (0.12 | )1 |
Net realized and unrealized gains (losses) on investments | | | 2.19 | | | | (0.19 | ) | | | 4.70 | | | | 3.02 | | | | (2.32 | ) |
| | | | | | | | | | | | | | | | | | | | |
Total from investment operations | | | 2.05 | | | | (0.34 | ) | | | 4.56 | | | | 2.95 | | | | (2.44 | ) |
Distributions to shareholders from | |
Net realized gains | | | (0.76 | ) | | | (3.18 | ) | | | (1.95 | ) | | | (0.84 | ) | | | (1.74 | ) |
Net asset value, end of period | | | $15.31 | | | | $14.02 | | | | $17.54 | | | | $14.93 | | | | $12.82 | |
Total return | | | 15.07 | % | | | (0.75 | )% | | | 33.06 | % | | | 23.60 | % | | | (14.80 | )% |
Ratios to average net assets (annualized) | |
Gross expenses2 | | | 1.28 | % | | | 1.27 | % | | | 1.28 | % | | | 1.26 | % | | | 1.23 | % |
Net expenses2 | | | 1.20 | % | | | 1.20 | % | | | 1.20 | % | | | 1.20 | % | | | 1.20 | % |
Net investment loss2 | | | (1.01 | )% | | | (0.94 | )% | | | (0.86 | )% | | | (0.48 | )% | | | (0.80 | )% |
Supplemental data | |
Portfolio turnover rate3 | | | 55 | % | | | 71 | % | | | 47 | % | | | 115 | % | | | 68 | % |
Net assets, end of period (000s omitted) | | | $21,250 | | | | $23,549 | | | | $52,335 | | | | $50,865 | | | | $99,792 | |
| 1 | Calculated based upon average shares outstanding |
| 2 | Ratios include net expenses allocated from the affiliated Master Portfolio which were as follows: |
| | | | |
Year ended May 31, 2020 | | | 0.81 | % |
Year ended May 31, 2019 | | | 0.81 | % |
Year ended May 31, 2018 | | | 0.81 | % |
Year ended May 31, 2017 | | | 0.81 | % |
Year ended May 31, 2016 | | | 0.80 | % |
| 3 | Portfolio turnover rate is calculated by multiplying the affiliated Master Portfolio’s percentage of the Fund’s total investments in securities at the end of the period by the affiliated Master Portfolio’s portfolio turnover rate. |
The accompanying notes are an integral part of these financial statements.
18 | Wells Fargo Emerging Growth Fund
Financial highlights
(For a share outstanding throughout each period)
| | | | | | | | | | | | | | | | | | | | |
| | | Year ended May 31 | |
| INSTITUTIONAL CLASS | | 2020 | | | 2019 | | | 2018 | | | 2017 | | | 2016 | |
Net asset value, beginning of period | | | $14.83 | | | | $18.30 | | | | $15.46 | | | | $13.20 | | | | $17.40 | |
Net investment loss | | | (0.11 | )1 | | | (0.13 | ) | | | (0.09 | ) | | | (0.04 | )1 | | | (0.07 | ) |
Net realized and unrealized gains (losses) on investments | | | 2.33 | | | | (0.16 | ) | | | 4.88 | | | | 3.14 | | | | (2.39 | ) |
| | | | | | | | | | | | | | | | | | | | |
Total from investment operations | | | 2.22 | | | | (0.29 | ) | | | 4.79 | | | | 3.10 | | | | (2.46 | ) |
Distributions to shareholders from | |
Net realized gains | | | (0.76 | ) | | | (3.18 | ) | | | (1.95 | ) | | | (0.84 | ) | | | (1.74 | ) |
Net asset value, end of period | | | $16.29 | | | | $14.83 | | | | $18.30 | | | | $15.46 | | | | $13.20 | |
Total return | | | 15.40 | % | | | (0.42 | )% | | | 33.44 | % | | | 24.08 | % | | | (14.62 | )% |
Ratios to average net assets (annualized) | |
Gross expenses2 | | | 1.03 | % | | | 1.02 | % | | | 1.03 | % | | | 1.03 | % | | | 1.01 | % |
Net expenses2 | | | 0.90 | % | | | 0.90 | % | | | 0.90 | % | | | 0.90 | % | | | 0.90 | % |
Net investment loss2 | | | (0.71 | )% | | | (0.67 | )% | | | (0.56 | )% | | | (0.24 | )% | | | (0.50 | )% |
Supplemental data | |
Portfolio turnover rate3 | | | 55 | % | | | 71 | % | | | 47 | % | | | 115 | % | | | 68 | % |
Net assets, end of period (000s omitted) | | | $471,512 | | | | $578,073 | | | | $606,729 | | | | $534,846 | | | | $583,843 | |
| 1 | Calculated based upon average shares outstanding |
| 2 | Ratios include net expenses allocated from the affiliated Master Portfolio which were as follows: |
| | | | |
Year ended May 31, 2020 | | | 0.81 | % |
Year ended May 31, 2019 | | | 0.81 | % |
Year ended May 31, 2018 | | | 0.81 | % |
Year ended May 31, 2017 | | | 0.81 | % |
Year ended May 31, 2016 | | | 0.80 | % |
| 3 | Portfolio turnover rate is calculated by multiplying the affiliated Master Portfolio’s percentage of the Fund’s total investments in securities at the end of the period by the affiliated Master Portfolio’s portfolio turnover rate. |
The accompanying notes are an integral part of these financial statements.
Wells Fargo Emerging Growth Fund | 19
Notes to financial statements
1. ORGANIZATION
Wells Fargo Funds Trust (the “Trust”), a Delaware statutory trust organized on March 10, 1999, is an open-end management investment company registered under the Investment Company Act of 1940, as amended (the “1940 Act”). As an investment company, the Trust follows the accounting and reporting guidance in Financial Accounting Standards Board (“FASB”) Accounting Standards Codification Topic 946, Financial Services – Investment Companies. These financial statements report on the Wells Fargo Emerging Growth Fund (the “Fund”) which is a diversified series of the Trust.
The Fund is a feeder fund in a master-feeder structure that invests substantially all of its assets in a single master portfolio with a substantially identical investment objective and substantially similar investment strategies. The Fund invests in Wells Fargo Emerging Growth Portfolio which is a separate diversified portfolio of Wells Fargo Master Trust, a registered open-end management investment company. As of May 31, 2020, the Fund owned 92% of Wells Fargo Emerging Growth Portfolio. The affiliated Master Portfolio directly acquires portfolio securities and the Fund acquires an indirect interest in those securities. The Fund accounts for its investment in the affiliated Master Portfolio as a partnership investment and records on a daily basis its share of the affiliated Master Portfolio’s income, expense and realized and unrealized gains and losses. The financial statements of the affiliated Master Portfolio for the year ended May 31, 2020 are included in this report and should be read in conjunction with the Fund’s financial statements.
2. SIGNIFICANT ACCOUNTING POLICIES
The following significant accounting policies, which are consistently followed in the preparation of the financial statements of the Fund, are in conformity with U.S. generally accepted accounting principles which require management to make estimates and assumptions that affect the reported amounts of assets and liabilities, disclosure of contingent assets and liabilities at the date of the financial statements, and the reported amounts of revenues and expenses during the reporting period. Actual results could differ from those estimates.
Securities valuation
All investments are valued each business day as of the close of regular trading on the New York Stock Exchange (generally 4 p.m. Eastern Time), although the Fund may deviate from this calculation time under unusual or unexpected circumstances.
Investments in the affiliated Master Portfolio are valued daily based on the Fund’s proportionate share of the affiliated Master Portfolio’s net assets, which are also valued daily. Securities held in the affiliated Master Portfolio are valued as discussed in the Notes to Financial Statements of the affiliated Master Portfolio, which are included elsewhere in this report.
Investments which are not valued using the method discussed above are valued at their fair value, as determined in good faith by the Board of Trustees of the Fund. The Board of Trustees has established a Valuation Committee comprised of the Trustees and has delegated to it the authority to take any actions regarding the valuation of portfolio securities that the Valuation Committee deems necessary or appropriate, including determining the fair value of portfolio securities, unless the determination has been delegated to the Wells Fargo Asset Management Pricing Committee at Wells Fargo Funds Management, LLC (“Funds Management”). The Board of Trustees retains the authority to make or ratify any valuation decisions or approve any changes to the Valuation Procedures as it deems appropriate. On a quarterly basis, the Board of Trustees receives reports on any valuation actions taken by the Valuation Committee or the Wells Fargo Asset Management Pricing Committee which may include items for ratification.
Investment transactions, income and expenses
Investments in the affiliated Master Portfolio are recorded on a trade basis. The Fund records daily its proportionate share of the affiliated Master Portfolio’s income, expenses and realized and unrealized gains or losses. The Fund also accrues its own expenses.
Distributions to shareholders
Distributions to shareholders from net investment income and any net realized gains are recorded on the ex-dividend date and paid at least annually. Such distributions are determined in accordance with income tax regulations and may differ from U.S. generally accepted accounting principles. Dividend sources are estimated at the time of declaration. The tax character of distributions is determined as of the Fund’s fiscal year end. Therefore, a portion of the Fund’s distributions made prior to the Fund’s fiscal year end may be categorized as a tax return of capital at year end.
Federal and other taxes
The Fund intends to continue to qualify as a regulated investment company by distributing substantially all of its investment company taxable income and any net realized capital gains (after reduction for capital loss carryforwards) sufficient to relieve it from all, or substantially all, federal income taxes. Accordingly, no provision for federal income taxes was required.
The Fund’s income and federal excise tax returns and all financial records supporting those returns for the prior three fiscal years are subject to examination by the federal and Delaware revenue authorities. Management has analyzed the Fund’s tax positions taken on federal, state, and foreign tax returns for all open tax years and does not believe that there are any uncertain tax positions that require recognition of a tax liability.
20 | Wells Fargo Emerging Growth Fund
Notes to financial statements
As of May 31, 2020, the aggregate cost of all investments for federal income tax purposes was $442,845,434 and the unrealized gains (losses) consisted of:
| | | | |
| |
Gross unrealized gains | | $ | 222,415,038 | |
| |
Gross unrealized losses | | | (2,709,649 | ) |
| |
Net unrealized gains | | $ | 219,705,389 | |
Reclassifications are made to the Fund’s capital accounts for permanent tax differences to reflect income and gains available for distribution (or available capital loss carryforwards) under federal income tax regulations. U.S. generally accepted accounting principles require that certain components of net assets be adjusted to reflect permanent differences between financial and tax reporting. These reclassifications have no effect on net assets or net asset values per share. The primary permanent difference causing such reclassification is due to net operating losses. At May 31, 2020, as a result of permanent book-to-tax differences, the following reclassification adjustments were made on the Statement of Assets and Liabilities:
| | |
| Paid-in-capital | | Total distributable earnings |
| |
| $(5,706,524) | | $5,706,524 |
As of May 31, 2020, the Fund had a qualified late-year ordinary loss of $2,330,946 which will be recognized on the first day of the following fiscal year.
Class allocations
The separate classes of shares offered by the Fund differ principally in applicable sales charges, distribution, shareholder servicing, and administration fees. Class specific expenses are charged directly to that share class. Investment income, common fund-level expenses, and realized and unrealized gains (losses) on investments are allocated daily to each class of shares based on the relative proportion of net assets of each class.
3. FAIR VALUATION MEASUREMENTS
At May 31, 2020, the affiliated Master Portfolio was measured at fair value using the net asset value per share (or its equivalent) as a practical expedient. The investment objective and the value of the affiliate Master Portfolio was as follows:
| | | | | | |
| | |
| Affiliated Master Portfolio | | Investment objective | | Value of affiliated
Master Portfolio | |
| | |
Wells Fargo Emerging Growth Portfolio | | Seeks long-term capital appreciation | | $ | 662,550,823 | |
The affiliated Master Portfolio does not have a redemption period notice, can be redeemed daily and does not have any unfunded commitments.
4. TRANSACTIONS WITH AFFILIATES
Management fee
Funds Management, an indirect wholly owned subsidiary of Wells Fargo & Company (“Wells Fargo”), is the manager of the Fund and provides advisory and fund-level administrative services under an investment management agreement. Under the investment management agreement, Funds Management is responsible for, among other services, implementing the investment objectives and strategies of the Fund and providing fund-level administrative services in connection with the Fund’s operations. As long as the Fund continues to invest substantially all of its assets in a single affiliated Master Portfolio, the Fund pays Funds Management an investment management fee only for fund-level administrative services at the following annual rate based on the Fund’s average daily net assets:
| | | | |
| |
| Average daily net assets | | Management fee | |
| |
First $5 billion | | | 0.05 | % |
| |
Next $5 billion | | | 0.04 | |
| |
Over $10 billion | | | 0.03 | |
For the year ended May 31, 2020, the management fee was equivalent to an annual rate of 0.05% of the Fund’s average daily net assets.
Wells Fargo Emerging Growth Fund | 21
Notes to financial statements
Funds Management also serves as the adviser to the affiliated Master Portfolio and is entitled to receive a fee from the affiliated Master Portfolio for those services.
Administration fees
Under a class-level administration agreement, Funds Management provides class-level administrative services to the Fund, which includes paying fees and expenses for services provided by the transfer agent, sub-transfer agents, omnibus account servicers and record-keepers. As compensation for its services under the class-level administration agreement, Funds Management receives an annual fee which is calculated based on the average daily net assets of each class as follows:
| | | | |
| |
| | | Class-level
administration fee | |
| |
Class A, Class C | | | 0.21 | % |
| |
Class R6 | | | 0.03 | |
| |
Administrator Class, Institutional Class | | | 0.13 | |
Waivers and/or expense reimbursements
Funds Management has contractually waived and/or reimbursed management and administration fees to the extent necessary to maintain certain net operating expense ratios for the Fund. When each class of the Fund has exceeded its expense cap, Funds Management has waived fees and/or reimbursed expenses from fund-level expenses on a proportionate basis and then from class specific expenses. When only certain classes exceed their expense caps, waivers and/or reimbursements are applied against class specific expenses before fund-level expenses. Net expenses from the affiliated Master Portfolio are included in the expense cap. Funds Management has committed through September 30, 2020 to waive fees and/or reimburse expenses to the extent necessary to cap each Fund’s expenses at 1.28% for Class A shares, 2.03% for Class C shares, 0.85% for Class R6 shares, 1.20% for Administrator Class shares, and 0.90% for Institutional Class shares. Prior to or after the commitment expiration date, the cap may be increased or the commitment to maintain the cap may be terminated only with the approval of the Board of Trustees.
Distribution fee
The Trust has adopted a distribution plan for Class C shares of the Fund pursuant to Rule 12b-1 under the 1940 Act. A distribution fee is charged to Class C shares and paid to Wells Fargo Funds Distributor, LLC (“Funds Distributor”), the principal underwriter, at an annual rate of 0.75% of the average daily net assets of Class C shares.
In addition, Funds Distributor is entitled to receive the front-end sales charge from the purchase of Class A shares and a contingent deferred sales charge on the redemption of certain Class A shares. Funds Distributor is also entitled to receive the contingent deferred sales charges from redemptions of Class C shares. For the year ended May 31, 2020, Funds Distributor received $369 from the sale of Class A shares and $7 in contingent deferred sales charges from redemptions of Class C shares. No contingent deferred sales charges were incurred by Class A for the year ended May 31, 2020.
Shareholder servicing fees
The Trust has entered into contracts with one or more shareholder servicing agents, whereby Class A, Class C, and Administrator Class of the Fund are charged a fee at an annual rate of 0.25% of the average daily net assets of each respective class. A portion of these total shareholder servicing fees were paid to affiliates of Wells Fargo.
5. INVESTMENT PORTFOLIO TRANSACTIONS
The Fund seeks to achieve its investment objective by investing substantially all of its assets in a single affiliated Master Portfolio. Purchases and sales have been calculated by multiplying the Fund’s ownership percentage of the affiliated Master Portfolio by the affiliated Master Portfolio’s purchases and sales. Purchases and sales of investments, excluding short-term securities, for the year ended May 31, 2020 were $392,467,019 and $551,777,325, respectively.
6. BANK BORROWINGS
The Trust (excluding the money market funds), Wells Fargo Master Trust and Wells Fargo Variable Trust are parties to a $280,000,000 revolving credit agreement whereby the Fund is permitted to use bank borrowings for temporary or emergency purposes, such as to fund shareholder redemption requests. Interest under the credit agreement is charged to the Fund based on a borrowing rate equal to the higher of the Federal Funds rate in effect on that day plus 1.25% or the overnight LIBOR rate in effect on that day plus 1.25%. In addition, an annual commitment fee equal to 0.25% of the unused balance is allocated to each participating fund.
For the year ended May 31, 2020, there were no borrowings by the Fund under the agreement.
22 | Wells Fargo Emerging Growth Fund
Notes to financial statements
7. DISTRIBUTIONS TO SHAREHOLDERS
The tax character of distributions paid during the years ended May 31, 2020 and May 31, 2019 were as follows:
| | | | | | | | |
| | | Year ended May 31 | |
| | |
| | | 2020 | | | 2019 | |
| | |
Ordinary income | | $ | 0 | | | $ | 14,567,564 | |
| | |
Long-term capital gain | | | 37,749,463 | | | | 126,111,778 | |
As of May 31, 2020, the components of distributable earnings on a tax basis were as follows:
| | | | |
Undistributed
long-term
gain | | Unrealized
gains | | Late-year
ordinary losses
deferred |
| | |
| $66,690,996 | | $219,705,389 | | $(2,330,946) |
8. CONCENTRATION RISKS
Concentration risks result from exposure to a limited number of sectors. Through its investment in the affiliated Master Portfolio which may invest a substantial portion of its assets in any sector, the Fund may in turn be more affected by changes in that sector than a fund whose investments are not heavily weighted in any sector. As of the end of the period, the Fund invested a concentration of its portfolio in the health care and information technology sectors.
9. INDEMNIFICATION
Under the Fund’s organizational documents, the officers and Trustees have been granted certain indemnification rights against certain liabilities that may arise out of performance of their duties to the Fund. The Fund has entered into a separate agreement with each Trustee that converts indemnification rights currently existing under the Fund’s organizational documents into contractual rights that cannot be changed in the future without the consent of the Trustee. Additionally, in the normal course of business, the Fund may enter into contracts with service providers that contain a variety of indemnification clauses. The Fund’s maximum exposure under these arrangements is dependent on future claims that may be made against the Fund and, therefore, cannot be estimated.
10. REDEMPTION IN-KIND
After the close of business on March 31, 2020, the Fund redeemed assets through an in-kind redemption. In the redemption transaction, the Fund transferred securities with a value of $32,967,178 and cash in the amount of $95,186. The Fund recognized losses in the amount of $7,498,217 which is reflected on the Statement of Operations. The redemption in-kind by a shareholder of the Institutional Class represented 5.89% of the Fund and is reflected on the Statement of Changes in Net Assets.
11. NEW ACCOUNTING PRONOUNCEMENT
In August 2018, FASB issued Accounting Standards Update (“ASU”) No. 2018-13, Fair Value Measurement (Topic 820) Disclosure Framework—Changes to the Disclosure Requirements for Fair Value Measurement. ASU 2018-13 updates the disclosure requirements for fair value measurements by modifying or removing certain disclosures and adding certain new disclosures. The amendments are effective for fiscal years, and interim periods within those fiscal years, beginning after December 15, 2019. Early adoption is permitted. Management has adopted the removal and modification of disclosures early, as permitted, and will adopt the additional new disclosures at the effective date.
12. CORONAVIRUS (COVID-19) PANDEMIC
On March 11, 2020, the World Health Organization announced that it had made the assessment that coronavirus disease 2019 (“COVID-19”) is a pandemic. The impacts of COVID-19 are adversely affecting the entire global economy, individual companies and investment products, and the market in general. There is significant uncertainty around the extent and duration of business disruptions related to COVID-19 and the impacts may be short term or may last for an extended period of time. The risk of further spreading of COVID-19 has led to significant uncertainty and volatility in the financial markets. The value of the Fund and the Master Portfolio in which the Fund invests have generally been adversely affected by impacts caused by COVID-19.
Wells Fargo Emerging Growth Fund | 23
Report of independent registered public accounting firm
TO THE SHAREHOLDERS OF THE FUND AND BOARD OF TRUSTEES WELLS FARGO FUNDS TRUST:
Opinion on the Financial Statements
We have audited the accompanying statement of assets and liabilities of Wells Fargo Emerging Growth Fund (the Fund), one of the funds constituting Wells Fargo Funds Trust, including the portfolio of investments, as of May 31, 2020, the related statement of operations for the year then ended, the statements of changes in net assets for each of the years in the two-year period then ended, and the related notes (collectively, the financial statements) and the financial highlights for each of the years or periods in the five-year period then ended. In our opinion, the financial statements and financial highlights present fairly, in all material respects, the financial position of the Fund as of May 31, 2020, the results of its operations for the year then ended, the changes in its net assets for each of the years in the two-year period then ended, and the financial highlights for each of the years or periods in the five-year period then ended, in conformity with U.S. generally accepted accounting principles.
Basis for Opinion
These financial statements and financial highlights are the responsibility of the Fund’s management. Our responsibility is to express an opinion on these financial statements and financial highlights based on our audits. We are a public accounting firm registered with the Public Company Accounting Oversight Board (United States) (PCAOB) and are required to be independent with respect to the Fund in accordance with the U.S. federal securities laws and the applicable rules and regulations of the Securities and Exchange Commission and the PCAOB.
We conducted our audits in accordance with the standards of the PCAOB. Those standards require that we plan and perform the audit to obtain reasonable assurance about whether the financial statements and financial highlights are free of material misstatement, whether due to error or fraud. Our audits included performing procedures to assess the risks of material misstatement of the financial statements and financial highlights, whether due to error or fraud, and performing procedures that respond to those risks. Such procedures included examining, on a test basis, evidence regarding the amounts and disclosures in the financial statements and financial highlights. Such procedures also included confirmation of securities owned as of May 31, 2020, by correspondence with the transfer agent. Our audits also included evaluating the accounting principles used and significant estimates made by management, as well as evaluating the overall presentation of the financial statements and financial highlights. We believe that our audits provide a reasonable basis for our opinion.

We have not been able to determine the specific year that we began serving as the auditor of one or more Wells Fargo Funds investment companies; however we are aware that we have served as the auditor of one or more Wells Fargo Funds investment companies since at least 1955.
Boston, Massachusetts
July 29, 2020
24 | Wells Fargo Emerging Growth Fund
Portfolio of investments—May 31, 2020
| | | | | | | | | | | | | | | | |
| | | | | | | | | Shares | | | Value | |
| Common Stocks: 98.26% | |
|
Communication Services: 0.49% | |
|
| Media: 0.49% | |
Cardlytics Incorporated † | | | | | | | | | | | 52,220 | | | $ | 3,555,660 | |
| | | | | | | | | | | | | | | | |
|
Consumer Discretionary: 10.35% | |
|
| Auto Components: 0.38% | |
Fox Factory Holding Corporation † | | | | | | | | | | | 38,110 | | | | 2,748,112 | |
| | | | | | | | | | | | | | | | |
|
| Diversified Consumer Services: 1.11% | |
Chegg Incorporated † | | | | | | | | | | | 131,024 | | | | 8,002,946 | |
| | | | | | | | | | | | | | | | |
|
| Hotels, Restaurants & Leisure: 2.49% | |
GAN Limited † | | | | | | | | | | | 203,571 | | | | 4,456,169 | |
Wingstop Incorporated | | | | | | | | | | | 111,138 | | | | 13,553,279 | |
| | | | |
| | | | | | | | | | | | | | | 18,009,448 | |
| | | | | | | | | | | | | | | | |
|
| Household Durables: 0.41% | |
Purple Innovation Incorporated † | | | | | | | | | | | 206,553 | | | | 2,961,970 | |
| | | | | | | | | | | | | | | | |
|
| Internet & Direct Marketing Retail: 0.85% | |
Fiverr International Limited † | | | | | | | | | | | 94,720 | | | | 6,168,166 | |
| | | | | | | | | | | | | | | | |
|
| Leisure Products: 1.01% | |
YETI Holdings Incorporated † | | | | | | | | | | | 227,967 | | | | 7,317,741 | |
| | | | | | | | | | | | | | | | |
|
| Multiline Retail: 0.35% | |
Ollie’s Bargain Outlet Holdings Incorporated † | | | | | | | | | | | 28,100 | | | | 2,569,745 | |
| | | | | | | | | | | | | | | | |
|
| Specialty Retail: 2.20% | |
Boot Barn Holdings Incorporated † | | | | | | | | | | | 358,030 | | | | 7,690,484 | |
Five Below Incorporated † | | | | | | | | | | | 13,147 | | | | 1,375,834 | |
Lithia Motors Incorporated Class A | | | | | | | | | | | 56,590 | | | | 6,824,188 | |
| | | | |
| | | | | | | | | | | | | | | 15,890,506 | |
| | | | | | | | | | | | | | | | |
|
| Textiles, Apparel & Luxury Goods: 1.55% | |
Crocs Incorporated † | | | | | | | | | | | 202,980 | | | | 5,815,377 | |
Deckers Outdoor Corporation † | | | | | | | | | | | 29,610 | | | | 5,404,713 | |
| | | | |
| | | | | | | | | | | | | | | 11,220,090 | |
| | | | | | | | | | | | | | | | |
|
Consumer Staples: 3.95% | |
|
| Beverages: 0.73% | |
Boston Beer Company Incorporated Class A † | | | | | | | | | | | 9,430 | | | | 5,325,404 | |
| | | | | | | | | | | | | | | | |
|
| Food & Staples Retailing: 1.19% | |
Grocery Outlet Holding Corporation † | | | | | | | | | | | 130,777 | | | | 4,813,901 | |
The Chef’s Warehouse Incorporated † | | | | | | | | | | | 255,200 | | | | 3,776,960 | |
| | | | |
| | | | | | | | | | | | | | | 8,590,861 | |
| | | | | | | | | | | | | | | | |
|
| Food Products: 1.52% | |
Freshpet Incorporated † | | | | | | | | | | | 142,780 | | | | 11,019,760 | |
| | | | | | | | | | | | | | | | |
|
| Personal Products: 0.51% | |
Inter Parfums Incorporated | | | | | | | | | | | 79,280 | | | | 3,679,385 | |
| | | | | | | | | | | | | | | | |
The accompanying notes are an integral part of these financial statements.
Wells Fargo Emerging Growth Portfolio | 25
Portfolio of investments—May 31, 2020
| | | | | | | | | | | | | | | | |
| | | | | | | | | Shares | | | Value | |
| Financials: 8.64% | |
|
| Capital Markets: 1.79% | |
Assetmark Financial Holdings † | | | | | | | | | | | 182,059 | | | $ | 4,860,975 | |
Stifel Financial Corporation | | | | | | | | | | | 169,150 | | | | 8,070,147 | |
| | | | |
| | | | | | | | | | | | | | | 12,931,122 | |
| | | | | | | | | | | | | | | | |
|
| Consumer Finance: 1.70% | |
LendingTree Incorporated † | | | | | | | | | | | 47,302 | | | | 12,299,466 | |
| | | | | | | | | | | | | | | | |
|
| Insurance: 5.15% | |
eHealth Incorporated † | | | | | | | | | | | 84,730 | | | | 11,050,487 | |
Goosehead Insurance Incorporated Class A † | | | | | | | | | | | 73,153 | | | | 4,385,522 | |
Kinsale Capital Group Incorporated | | | | | | | | | | | 141,987 | | | | 21,201,499 | |
SelectQuote Incorporated † | | | | | | | | | | | 23,738 | | | | 653,270 | |
| | | | |
| | | | | | | | | | | | | | | 37,290,778 | |
| | | | | | | | | | | | | | | | |
|
Health Care: 27.57% | |
|
| Biotechnology: 9.88% | |
Arcutis Biotherapeutics Incorporated † | | | | | | | | | | | 245,103 | | | | 8,223,206 | |
Arena Pharmaceuticals Incorporated † | | | | | | | | | | | 100,920 | | | | 6,031,988 | |
Biohaven Pharmaceutical Holding Company † | | | | | | | | | | | 82,520 | | | | 5,155,024 | |
CareDx Incorporated † | | | | | | | | | | | 104,566 | | | | 3,358,660 | |
Castle Biosciences Incorporated † | | | | | | | | | | | 211,800 | | | | 8,139,474 | |
Emergent BioSolutions Incorporated † | | | | | | | | | | | 45,260 | | | | 3,778,757 | |
Fate Therapeutics Incorporated † | | | | | | | | | | | 138,080 | | | | 4,477,934 | |
Halozyme Therapeutics Incorporated † | | | | | | | | | | | 226,040 | | | | 5,485,991 | |
Invitae Corporation † | | | | | | | | | | | 243,480 | | | | 4,095,334 | |
Krystal Biotech Incorporated † | | | | | | | | | | | 64,398 | | | | 3,310,701 | |
Natera Incorporated † | | | | | | | | | | | 205,387 | | | | 9,006,220 | |
ORIC Pharmaceuticals Incorporated † | | | | | | | | | | | 37,792 | | | | 1,096,724 | |
PTC Therapeutics Incorporated † | | | | | | | | | | | 40,690 | | | | 2,063,390 | |
Vericel Corporation † | | | | | | | | | | | 505,640 | | | | 7,271,103 | |
| | | | |
| | | | | | | | | | | | | | | 71,494,506 | |
| | | | | | | | | | | | | | | | |
|
| Health Care Equipment & Supplies: 8.29% | |
Glaukos Corporation † | | | | | | | | | | | 56,739 | | | | 2,211,686 | |
iRhythm Technologies Incorporated † | | | | | | | | | | | 112,682 | | | | 14,007,499 | |
Orthopediatrics Corporation † | | | | | | | | | | | 148,281 | | | | 6,840,203 | |
Shockwave Medical Incorporated † | | | | | | | | | | | 191,358 | | | | 8,421,666 | |
SI-BONE Incorporated † | | | | | | | | | | | 336,197 | | | | 5,880,086 | |
Silk Road Medical Incorporated † | | | | | | | | | | | 71,023 | | | | 2,718,050 | |
Tactile Systems Technology Class I † | | | | | | | | | | | 135,293 | | | | 6,554,946 | |
Tandem Diabetes Care Incorporated † | | | | | | | | | | | 75,270 | | | | 6,258,701 | |
Vapotherm Incorporated † | | | | | | | | | | | 265,609 | | | | 7,073,168 | |
| | | | |
| | | | | | | | | | | | | | | 59,966,005 | |
| | | | | | | | | | | | | | | | |
|
| Health Care Providers & Services: 2.21% | |
Addus Homecare Corporation † | | | | | | | | | | | 112,160 | | | | 11,099,354 | |
Amedisys Incorporated † | | | | | | | | | | | 25,540 | | | | 4,904,957 | |
| | | | |
| | | | | | | | | | | | | | | 16,004,311 | |
| | | | | | | | | | | | | | | | |
|
| Health Care Technology: 2.68% | |
Health Catalyst Incorporated † | | | | | | | | | | | 166,870 | | | | 4,528,852 | |
Inspire Medical Systems Incorporated † | | | | | | | | | | | 59,500 | | | | 4,851,630 | |
The accompanying notes are an integral part of these financial statements.
26 | Wells Fargo Emerging Growth Portfolio
Portfolio of investments—May 31, 2020
| | | | | | | | | | | | | | | | |
| | | | | | | | | Shares | | | Value | |
|
| Health Care Technology (continued) | |
Phreesia Incorporated † | | | | | | | | | | | 222,718 | | | $ | 6,530,092 | |
Teladoc Incorporated † | | | | | | | | | | | 19,979 | | | | 3,477,545 | |
| | | | |
| | | | | | | | | | | | | | | 19,388,119 | |
| | | | | | | | | | | | | | | | |
|
| Life Sciences Tools & Services: 3.69% | |
Adaptive Biotechnologies Corporation † | | | | | | | | | | | 80,465 | | | | 3,113,996 | |
Codexis Incorporated † | | | | | | | | | | | 926,729 | | | | 11,509,974 | |
Neogenomics Incorporated † | | | | | | | | | | | 346,364 | | | | 9,244,455 | |
Repligen Corporation † | | | | | | | | | | | 21,400 | | | | 2,802,758 | |
| | | | |
| | | | | | | | | | | | | | | 26,671,183 | |
| | | | | | | | | | | | | | | | |
|
| Pharmaceuticals: 0.82% | |
MyoKardia Incorporated † | | | | | | | | | | | 30,500 | | | | 3,119,845 | |
Pacira Pharmaceuticals Incorporated † | | | | | | | | | | | 63,650 | | | | 2,797,418 | |
| | | | |
| | | | | | | | | | | | | | | 5,917,263 | |
| | | | | | | | | | | | | | | | |
|
Industrials: 15.51% | |
|
| Aerospace & Defense: 3.53% | |
Kratos Defense & Security Solutions Incorporated † | | | | | | | | | | | 392,240 | | | | 7,276,052 | |
Mercury Computer Systems Incorporated † | | | | | | | | | | | 204,795 | | | | 18,298,433 | |
| | | | |
| | | | | | | | | | | | | | | 25,574,485 | |
| | | | | | | | | | | | | | | | |
|
| Commercial Services & Supplies: 3.30% | |
Casella Waste Systems Incorporated Class A † | | | | | | | | | | | 469,200 | | | | 23,905,740 | |
| | | | | | | | | | | | | | | | |
|
| Construction & Engineering: 0.87% | |
MasTec Incorporated † | | | | | | | | | | | 160,570 | | | | 6,286,316 | |
| | | | | | | | | | | | | | | | |
|
| Machinery: 2.61% | |
Rexnord Corporation | | | | | | | | | | | 626,190 | | | | 18,848,319 | |
| | | | | | | | | | | | | | | | |
|
| Professional Services: 2.92% | |
ASGN Incorporated † | | | | | | | | | | | 342,733 | | | | 21,108,925 | |
| | | | | | | | | | | | | | | | |
|
| Road & Rail: 1.24% | |
Marten Transport Limited | | | | | | | | | | | 146,250 | | | | 3,742,538 | |
Saia Incorporated † | | | | | | | | | | | 48,130 | | | | 5,219,217 | |
| | | | |
| | | | | | | | | | | | | | | 8,961,755 | |
| | | | | | | | | | | | | | | | |
|
| Trading Companies & Distributors: 1.04% | |
SiteOne Landscape Supply Incorporated † | | | | | | | | | | | 70,530 | | | | 7,498,044 | |
| | | | | | | | | | | | | | | | |
|
Information Technology: 30.36% | |
|
| Electronic Equipment, Instruments & Components: 2.37% | |
Novanta Incorporated † | | | | | | | | | | | 167,270 | | | | 17,180,302 | |
| | | | | | | | | | | | | | | | |
|
| IT Services: 3.86% | |
Endava plc Sponsored ADR † | | | | | | | | | | | 183,982 | | | | 8,845,855 | |
EVO Payments Incorporated Class A † | | | | | | | | | | | 376,197 | | | | 8,329,002 | |
Fastly Incorporated † | | | | | | | | | | | 149,900 | | | | 6,466,686 | |
LiveRamp Holdings Incorporated † | | | | | | | | | | | 84,910 | | | | 4,282,011 | |
| | | | |
| | | | | | | | | | | | | | | 27,923,554 | |
| | | | | | | | | | | | | | | | |
The accompanying notes are an integral part of these financial statements.
Wells Fargo Emerging Growth Portfolio | 27
Portfolio of investments—May 31, 2020
| | | | | | | | | | | | | | | | |
| | | | | | | | | Shares | | | Value | |
| Semiconductors & Semiconductor Equipment: 3.22% | | | | | | | | | | | | |
Diodes Incorporated † | | | | | | | | | | | 169,651 | | | $ | 8,251,825 | |
Semtech Corporation † | | | | | | | | | | | 225,090 | | | | 11,970,286 | |
Silicon Laboratories Incorporated † | | | | | | | | | | | 32,410 | | | | 3,035,521 | |
| | | | |
| | | | | | | | | | | | | | | 23,257,632 | |
| | | | | | | | | | | | | | | | |
| | | | |
| Software: 20.91% | | | | | | | | | | | | |
Bill.com Holdings Incorporated † | | | | | | | | | | | 12,398 | | | | 863,397 | |
BlackLine Incorporated † | | | | | | | | | | | 90,943 | | | | 6,757,065 | |
Envestnet Incorporated † | | | | | | | | | | | 294,842 | | | | 21,408,478 | |
Everbridge Incorporated † | | | | | | | | | | | 73,200 | | | | 10,706,232 | |
Five9 Incorporated † | | | | | | | | | | | 120,013 | | | | 12,505,355 | |
Globant SA † | | | | | | | | | | | 63,860 | | | | 8,953,811 | |
Mimecast Limited † | | | | | | | | | | | 180,300 | | | | 7,532,934 | |
New Relic Incorporated † | | | | | | | | | | | 86,530 | | | | 5,723,960 | |
PROS Holdings Incorporated † | | | | | | | | | | | 106,920 | | | | 4,164,534 | |
Q2 Holdings Incorporated † | | | | | | | | | | | 265,063 | | | | 21,899,505 | |
Rapid7 Incorporated † | | | | | | | | | | | 374,836 | | | | 18,325,732 | |
Sprout Social Incorporated Class A † | | | | | | | | | | | 201,696 | | | | 5,556,725 | |
SPS Commerce Incorporated † | | | | | | | | | | | 230,136 | | | | 15,686,070 | |
Talend SA ADR † | | | | | | | | | | | 362,038 | | | | 11,161,632 | |
| | | | |
| | | | | | | | | | | | | | | 151,245,430 | |
| | | | | | | | | | | | | | | | |
| | | | |
Materials: 0.25% | | | | | | | | | | | | | | | | |
| | | | |
| Chemicals: 0.25% | | | | | | | | | | | | |
PQ Group Holdings Incorporated † | | | | | | | | | | | 141,820 | | | | 1,779,841 | |
| | | | | | | | | | | | | | | | |
| | | | |
Real Estate: 1.14% | | | | | | | | | | | | | | | | |
| | | | |
| Equity REITs: 1.14% | | | | | | | | | | | | |
QTS Realty Trust Incorporated Class A | | | | | | | | | | | 120,450 | | | | 8,262,864 | |
| | | | | | | | | | | | | | | | |
| | | | |
Total Common Stocks (Cost $452,257,386) | | | | | | | | | | | | | | | 710,855,754 | |
| | | | | | | | | | | | | | | | |
| | | | |
| | | | | | | | | | | | | | | | |
| | | Yield | | | | | | | | | | |
| Short-Term Investments: 1.39% | | | | | | | | | | | | |
| | | | |
| Investment Companies: 1.39% | | | | | | | | | | | | |
Wells Fargo Government Money Market Fund Select Class (l)(u) | | | 0.12 | % | | | | | | | 10,065,569 | | | | 10,065,569 | |
| | | | | | | | | | | | | | | | |
| | | | |
Total Short-Term Investments (Cost $10,065,569) | | | | | | | | | | | | | | | 10,065,569 | |
| | | | | | | | | | | | | | | | |
| | | | | | | | |
| Total investments in securities (Cost $462,322,955) | | | 99.65 | % | | | 720,921,323 | |
| | |
Other assets and liabilities, net | | | 0.35 | | | | 2,499,372 | |
| | | | | | | | |
| Total net assets | | | 100.00 | % | | $ | 723,420,695 | |
| | | | | | | | |
| † | Non-income-earning security |
| (l) | The issuer of the security is an affiliated person of the Portfolio as defined in the Investment Company Act of 1940. |
| (u) | The rate represents the 7-day annualized yield at period end. |
Abbreviations:
| ADR | American depositary receipt |
The accompanying notes are an integral part of these financial statements.
28 | Wells Fargo Emerging Growth Portfolio
Portfolio of investments—May 31, 2020
Investments in Affiliates
An affiliated investment is an investment in which the Portfolio owns at least 5% of the outstanding voting shares of the issuer or as a result of other relationships, such as the Portfolio and the issuer having the same adviser or investment manager. Transactions with issuers that were either affiliated persons of the Portfolio at the beginning of the period or the end of the period were as follows:
| | | | | | | | | | | | | | | | | | | | | | | | | | | | | | | | | | | | |
| | | Shares, beginning of period | | | Shares purchased | | | Shares sold | | | Shares, end of period | | | Net realized gains (losses) | | | Net change in unrealized gains (losses) | | | Income from affiliated securities | | | Value, end of period | | | % of net assets | |
| | | | | | | | | |
| Short-Term Investments | | | | | | | | | | | | | | | | | | | | | | | | | | | |
Investment Companies | | | | | | | | | | | | | | | | | | | | | | | | | | | | | | | | | | | | |
Securities Lending Cash Investments LLC * | | | 41,141,098 | | | | 243,715,267 | | | | (284,856,365 | ) | | | 0 | | | $ | 3,169 | | | $ | (1,066 | ) | | $ | 646,454 | # | | $ | 0 | | | | | |
Wells Fargo Government Money Market Fund Select Class | | | 10,281,602 | | | | 266,283,361 | | | | (266,499,394 | ) | | | 10,065,569 | | | | 0 | | | | 0 | | | | 147,167 | | | | 10,065,569 | | | | | |
| | | | | | | | | | | | | | | | | | | | | | | | | | | | | | | | | | | | |
| | | | | | | | | | | | | | | | | | $ | 3,169 | | | $ | (1,066 | ) | | $ | 793,621 | | | $ | 10,065,569 | | | | 1.39 | % |
| | | | | | | | | | | | | | | | | | | | | | | | | | | | | | | | | | | | |
| * | No longer held at the end of the period |
| # | Amount shown represents income before fees and rebates. |
The accompanying notes are an integral part of these financial statements.
Wells Fargo Emerging Growth Portfolio | 29
Statement of assets and liabilities—May 31, 2020
| | | | |
| | | | |
| |
Assets | | | | |
Investments in unaffiliated securities, at value (cost $452,257,386) | | $ | 710,855,754 | |
Investments in affiliated securities, at value (cost $10,065,569) | | | 10,065,569 | |
Receivable for investments sold | | | 6,521,533 | |
Receivable for dividends | | | 77,703 | |
Prepaid expenses and other assets | | | 11,097 | |
| | | | |
Total assets | | | 727,531,656 | |
| | | | |
| |
Liabilities | | | | |
Payable for investments purchased | | | 3,637,757 | |
Advisory fee payable | | | 469,296 | |
Trustees’ fees and expenses payable | | | 864 | |
Accrued expenses and other liabilities | | | 3,044 | |
| | | | |
Total liabilities | | | 4,110,961 | |
| | | | |
Total net assets | | $ | 723,420,695 | |
| | | | |
The accompanying notes are an integral part of these financial statements.
30 | Wells Fargo Emerging Growth Portfolio
Statement of operations—year ended May 31, 2020
| | | | |
| | | | |
| |
Investment income | | | | |
Dividends | | $ | 766,422 | |
Securities lending income from affiliates, net | | | 561,380 | |
Income from affiliated securities | | | 147,167 | |
| | | | |
Total investment income | | | 1,474,969 | |
| | | | |
| |
Expenses | | | | |
Advisory fee | | | 6,187,843 | |
Custody and accounting fees | | | 51,586 | |
Professional fees | | | 46,730 | |
Shareholder report expenses | | | 9,499 | |
Trustees’ fees and expenses | | | 20,837 | |
Other fees and expenses | | | 19,849 | |
| | | | |
Net expenses | | | 6,336,344 | |
| �� | | | |
Net investment loss | | | (4,861,375 | ) |
| | | | |
| |
Realized and unrealized gains (losses) on investments | | | | |
Net realized gains on | | | | |
Unaffiliated securities | | | 95,683,983 | |
Affiliated securities | | | 3,169 | |
| | | | |
Net realized gains on investments | | | 95,687,152 | |
| | | | |
|
Net change in unrealized gains (losses) on | |
Unaffiliated securities | | | 7,684,283 | |
Affiliated securities | | | (1,066 | ) |
| | | | |
Net change in unrealized gains (losses) on investments | | | 7,683,217 | |
| | | | |
Net realized and unrealized gains (losses) on investments | | | 103,370,369 | |
| | | | |
Net increase in net assets resulting from operations | | $ | 98,508,994 | |
| | | | |
The accompanying notes are an integral part of these financial statements.
Wells Fargo Emerging Growth Portfolio | 31
Statement of changes in net assets
| | | | | | | | |
| | | Year ended
May 31, 2020 | | | Year ended
May 31, 2019 | |
|
Operations | |
Net investment loss | | $ | (4,861,375 | ) | | $ | (5,059,099 | ) |
Net realized gains on investments | | | 95,687,152 | | | | 101,592,660 | |
Net change in unrealized gains (losses) on investments | | | 7,683,217 | | | | (103,571,551 | ) |
| | | | |
Net increase (decrease) in net assets resulting from operations | | | 98,508,994 | | | | (7,037,990 | ) |
| | | | |
| | |
Capital transactions | | | | | | | | |
Transactions in investors’ beneficial interests | |
Contributions | | | 65,548,053 | | | | 113,603,214 | |
Withdrawals | | | (260,126,766 | ) | | | (166,578,053 | ) |
| | | | |
Net decrease in net assets resulting from capital transactions | | | (194,578,713 | ) | | | (52,974,839 | ) |
| | | | |
Total decrease in net assets | | | (96,069,719 | ) | | | (60,012,829 | ) |
| | | | |
| | |
Net assets | | | | | | | | |
Beginning of period | | | 819,490,414 | | | | 879,503,243 | |
| | | | |
End of period | | $ | 723,420,695 | | | $ | 819,490,414 | |
| | | | |
The accompanying notes are an integral part of these financial statements.
32 | Wells Fargo Emerging Growth Portfolio
Financial highlights
| | | | | | | | | | | | | | | | | | | | |
| | | Year ended May 31 | |
| | | 2020 | | | 2019 | | | 2018 | | | 2017 | | | 2016 | |
Total return | | | 15.49 | % | | | (0.28 | )% | | | 33.60 | % | | | 23.97 | % | | | (14.47 | )% |
Ratios to average net assets (annualized) | |
Gross expenses | | | 0.81 | % | | | 0.81 | % | | | 0.81 | % | | | 0.81 | % | | | 0.80 | % |
Net expenses | | | 0.81 | % | | | 0.81 | % | | | 0.81 | % | | | 0.81 | % | | | 0.80 | % |
Net investment loss | | | (0.62 | )% | | | (0.57 | )% | | | (0.47 | )% | | | (0.15 | )% | | | (0.40 | )% |
Supplemental data | |
Portfolio turnover rate | | | 55 | % | | | 71 | % | | | 47 | % | | | 115 | % | | | 66 | % |
The accompanying notes are an integral part of these financial statements.
Wells Fargo Emerging Growth Portfolio | 33
Notes to financial statements
1. ORGANIZATION
Wells Fargo Master Trust (the “Trust”), a Delaware statutory trust organized on March 10, 1999, is an open-end management investment company registered under the Investment Company Act of 1940, as amended (the “1940 Act”). As an investment company, the Trust follows the accounting and reporting guidance in Financial Accounting Standards Board (“FASB”) Accounting Standards Codification Topic 946, Financial Services – Investment Companies. These financial statements report on the Wells Fargo Emerging Growth Portfolio (the “Portfolio”) which is a diversified series of the Trust.
2. SIGNIFICANT ACCOUNTING POLICIES
The following significant accounting policies, which are consistently followed in the preparation of the financial statements of the Portfolio, are in conformity with U.S. generally accepted accounting principles which require management to make estimates and assumptions that affect the reported amounts of assets and liabilities, disclosure of contingent assets and liabilities at the date of the financial statements, and the reported amounts of revenues and expenses during the reporting period. Actual results could differ from those estimates.
Securities valuation
All investments are valued each business day as of the close of regular trading on the New York Stock Exchange (generally 4 p.m. Eastern Time), although the Portfolio may deviate from this calculation time under unusual or unexpected circumstances.
Equity securities that are listed on a foreign or domestic exchange or market are valued at the official closing price or, if none, the last sales price. If no sale occurs on the principal exchange or market that day, a fair value price will be determined in accordance with the Portfolio’s Valuation Procedures.
Investments in registered open-end investment companies are valued at net asset value. Interests in non-registered investment companies that are redeemable at net asset value are fair valued normally at net asset value.
Investments which are not valued using any of the methods discussed above are valued at their fair value, as determined in good faith by the Board of Trustees of the Portfolio. The Board of Trustees has established a Valuation Committee comprised of the Trustees and has delegated to it the authority to take any actions regarding the valuation of portfolio securities that the Valuation Committee deems necessary or appropriate, including determining the fair value of portfolio securities, unless the determination has been delegated to the Wells Fargo Asset Management Pricing Committee at Wells Fargo Funds Management, LLC (“Funds Management”). The Board of Trustees retains the authority to make or ratify any valuation decisions or approve any changes to the Valuation Procedures as it deems appropriate. On a quarterly basis, the Board of Trustees receives reports on any valuation actions taken by the Valuation Committee or the Wells Fargo Asset Management Pricing Committee which may include items for ratification.
Securities lending
The Portfolio may lend its securities from time to time in order to earn additional income in the form of fees or interest on securities received as collateral or the investment of any cash received as collateral. When securities are on loan, the Portfolio receives interest or dividends on those securities. Cash collateral received in connection with its securities lending transactions is invested in Securities Lending Cash Investments, LLC (the “Securities Lending Fund”). Investments in Securities Lending Fund are valued at the evaluated bid price provided by an independent pricing service. Income earned from investment in the Securities Lending Fund, if any, is included in securities lending income from affiliates (net of fees and rebates) on the Statement of Operations.
In a securities lending transaction, the net asset value of the Portfolio is affected by an increase or decrease in the value of the securities loaned and by an increase or decrease in the value of the instrument in which collateral is invested. The amount of securities lending activity undertaken by the Portfolio fluctuates from time to time. The Portfolio has the right under the lending agreement to recover the securities from the borrower on demand. In the event of default or bankruptcy by the borrower, the Portfolio may be prevented from recovering the loaned securities or gaining access to the collateral or may experience delays or costs in doing so. In such an event, the terms of the agreement allow the unaffiliated securities lending agent to use the collateral to purchase replacement securities on behalf of the Portfolio or pay the Portfolio the market value of the loaned securities. The Portfolio bears the risk of loss with respect to depreciation of its investment of the cash collateral.
Security transactions and income recognition
Securities transactions are recorded on a trade date basis. Realized gains or losses are recorded on the basis of identified cost.
Dividend income is recognized on the ex-dividend date.
34 | Wells Fargo Emerging Growth Portfolio
Notes to financial statements
Federal and other taxes
The Portfolio is treated as a separate entity for federal income tax purposes. The Portfolio is not required to pay federal income taxes on its net investment income and net capital gains as it is treated as a partnership for federal income tax purposes. All dividends, gains and losses of the Portfolio are deemed to have been “passed through” to the interest holders in proportion to their holdings of the Portfolio regardless of whether dividends and gains have been distributed by the Portfolio.
The Portfolio’s income tax returns and all financial records supporting those returns for the prior three fiscal years are subject to examination by the federal revenue authority. Management has analyzed the Portfolio’s tax positions taken on federal, state, and foreign tax returns for all open tax years and does not believe that there are any uncertain tax positions that require recognition of a tax liability.
As of May 31, 2020, the aggregate cost of all investments for federal income tax purposes was $468,063,249 and the unrealized gains (losses) consisted of:
| | | | |
| |
Gross unrealized gains | | $ | 274,630,318 | |
| |
Gross unrealized losses | | | (21,772,244 | ) |
| |
Net unrealized gains | | $ | 252,858,074 | |
3. FAIR VALUATION MEASUREMENTS
Fair value measurements of investments are determined within a framework that has established a fair value hierarchy based upon the various data inputs utilized in determining the value of the Portfolio’s investments. The three-level hierarchy gives the highest priority to unadjusted quoted prices in active markets for identical assets or liabilities (Level 1) and the lowest priority to unobservable inputs (Level 3). The Portfolio’s investments are classified within the fair value hierarchy based on the lowest level of input that is significant to the fair value measurement. The inputs are summarized into three broad levels as follows:
| ∎ | | Level 1 – quoted prices in active markets for identical securities |
| ∎ | | Level 2 – other significant observable inputs (including quoted prices for similar securities, interest rates, prepayment speeds, credit risk, etc.) |
| ∎ | | Level 3 – significant unobservable inputs (including the Portfolio’s own assumptions in determining the fair value of investments) |
The inputs or methodologies used for valuing investments in securities are not necessarily an indication of the risk associated with investing in those securities.
The following is a summary of the inputs used in valuing the Portfolio’s assets and liabilities as of May 31, 2020:
| | | | | | | | | | | | | | | | |
| | | | |
| | | Quoted prices
(Level 1) | | | Other significant
observable inputs
(Level 2) | | | Significant
unobservable inputs (Level 3) | | | Total | |
| | | | |
Assets | | | | | | | | | | | | | | | | |
Investments in: | | | | | | | | | | | | | | | | |
| | | | |
Common stocks | | | | | | | | | | | | | | | | |
| | | | |
Communication services | | $ | 3,555,660 | | | $ | 0 | | | $ | 0 | | | $ | 3,555,660 | |
| | | | |
Consumer discretionary | | | 74,888,724 | | | | 0 | | | | 0 | | | | 74,888,724 | |
| | | | |
Consumer staples | | | 28,615,410 | | | | 0 | | | | 0 | | | | 28,615,410 | |
| | | | |
Financials | | | 62,521,366 | | | | 0 | | | | 0 | | | | 62,521,366 | |
| | | | |
Health care | | | 199,441,387 | | | | 0 | | | | 0 | | | | 199,441,387 | |
| | | | |
Industrials | | | 112,183,584 | | | | 0 | | | | 0 | | | | 112,183,584 | |
| | | | |
Information technology | | | 219,606,918 | | | | 0 | | | | 0 | | �� | | 219,606,918 | |
| | | | |
Materials | | | 1,779,841 | | | | 0 | | | | 0 | | | | 1,779,841 | |
| | | | |
Real estate | | | 8,262,864 | | | | 0 | | | | 0 | | | | 8,262,864 | |
| | | | |
Short-term investments | | | | | | | | | | | | | | | | |
| | | | |
Investment companies | | | 10,065,569 | | | | 0 | | | | 0 | | | | 10,065,569 | |
| | | | |
Total assets | | $ | 720,921,323 | | | $ | 0 | | | $ | 0 | | | $ | 720,921,323 | |
Wells Fargo Emerging Growth Portfolio | 35
Notes to financial statements
Additional sector, industry or geographic detail is included in the Portfolio of Investments.
For the year ended May 31, 2020, the Portfolio did not have any transfers into/out of Level 3.
4. TRANSACTIONS WITH AFFILIATES
Advisory fee
The Trust has entered into an advisory contract with Funds Management, an indirect wholly owned subsidiary of Wells Fargo & Company (“Wells Fargo”). The adviser is responsible for implementing investment policies and guidelines and for supervising the subadviser, who is responsible for day-to-day portfolio management of the Portfolio. Pursuant to the contract, Funds Management is entitled to receive an annual advisory fee at the following annual rate based on the Portfolio’s average daily net assets:
| | | | |
| |
| Average daily net assets | | Advisory fee | |
| |
First $500 million | | | 0.800 | % |
| |
Next $500 million | | | 0.775 | |
| |
Next $1 billion | | | 0.750 | |
| |
Next $1 billion | | | 0.725 | |
| |
Next $1 billion | | | 0.700 | |
| |
Over $4 billion | | | 0.680 | |
For the year ended May 31, 2020, the advisory fee was equivalent to an annual rate of 0.79% of the Portfolio’s average daily net assets.
Funds Management has retained the services of a subadviser to provide daily portfolio management to the Portfolio. The fee for subadvisory services is borne by Funds Management. Wells Capital Management Incorporated (“WellsCap”), an affiliate of Funds Management and an indirect wholly owned subsidiary of Wells Fargo is the subadviser to the Portfolio and is entitled to receive a fee from Funds Management at an annual rate starting at 0.55% and declining to 0.40% as the average daily net assets of the Portfolio increase.
Interfund transactions
The Portfolio may purchase or sell portfolio investment securities to certain other Wells Fargo affiliates pursuant to Rule 17a-7 under the 1940 Act and under procedures adopted by the Board of Trustees. The procedures have been designed to ensure that these interfund transactions, which do not incur broker commissions, are effected at current market prices.
5. INVESTMENT PORTFOLIO TRANSACTIONS
Purchases and sales of investments, excluding U.S. government obligations (if any) and short-term securities, for the year ended May 31, 2020 were $428,523,750 and $602,470,213, respectively.
6. SECURITIES LENDING TRANSACTIONS
The Portfolio lends its securities through an unaffiliated securities lending agent and receives collateral in the form of cash or securities with a value at least equal to the value of the securities on loan. The value of the loaned securities is determined at the close of each business day and any increases or decreases in the required collateral are exchanged between the Portfolio and the counterparty on the next business day. Cash collateral received is invested in the Securities Lending Fund which seeks to provide a positive return compared to the daily Fed Funds Open Rate by investing in high-quality, U.S. dollar-denominated short-term money market instruments and is exempt from registration under Section 3(c)(7) of the 1940 Act. Securities Lending Fund is managed by Funds Management and is subadvised by WellsCap. Funds Management receives an advisory fee starting at 0.05% and declining to 0.01% as the average daily net assets of the Securities Lending Fund increase. All of the fees received by Funds Management are paid to WellsCap for its services as subadviser.
In the event of counterparty default or the failure of a borrower to return a loaned security, the Portfolio has the right to use the collateral to offset any losses incurred. As of May 31, 2020, the Portfolio did not have any securities on loan.
7. BANK BORROWINGS
The Trust, along with Wells Fargo Variable Trust and Wells Fargo Funds Trust (excluding the money market funds), are parties to a $280,000,000 revolving credit agreement whereby the Portfolio is permitted to use bank borrowings for temporary or
36 | Wells Fargo Emerging Growth Portfolio
Notes to financial statements
emergency purposes, such as to fund shareholder redemption requests. Interest under the credit agreement is charged to the Portfolio based on a borrowing rate equal to the higher of the Federal Funds rate in effect on that day plus 1.25% or the overnight LIBOR rate in effect on that day plus 1.25%. In addition, an annual commitment fee equal to 0.25% of the unused balance is allocated to each participating fund.
For the year ended May 31, 2020, there were no borrowings by the Portfolio under the agreement.
8. CONCENTRATION RISKS
Concentration risks result from exposure to a limited number of sectors. As of the end of the period, the Portfolio invested a concentration of its portfolio in the health care and information technology sectors. A Portfolio that invests a substantial portion of its assets in any sector may be more affected by changes in that sector than would be a Portfolio whose investments are not heavily weighted in any sector.
9. INDEMNIFICATION
Under the Portfolio’s organizational documents, the officers and Trustees have been granted certain indemnification rights against certain liabilities that may arise out of performance of their duties to the Portfolio. The Portfolio has entered into a separate agreement with each Trustee that converts indemnification rights currently existing under the Portfolio’s organizational documents into contractual rights that cannot be changed in the future without the consent of the Trustee. Additionally, in the normal course of business, the Portfolio may enter into contracts with service providers that contain a variety of indemnification clauses. The Portfolio’s maximum exposure under these arrangements is dependent on future claims that may be made against the Portfolio and, therefore, cannot be estimated.
10. NEW ACCOUNTING PRONOUNCEMENT
In August 2018, FASB issued Accounting Standards Update (“ASU”) No. 2018-13, Fair Value Measurement (Topic 820) Disclosure Framework—Changes to the Disclosure Requirements for Fair Value Measurement. ASU 2018-13 updates the disclosure requirements for fair value measurements by modifying or removing certain disclosures and adding certain new disclosures. The amendments are effective for fiscal years, and interim periods within those fiscal years, beginning after December 15, 2019. Early adoption is permitted. Management has adopted the removal and modification of disclosures early, as permitted, and will adopt the additional new disclosures at the effective date.
11. CORONAVIRUS (COVID-19) PANDEMIC
On March 11, 2020, the World Health Organization announced that it had made the assessment that coronavirus disease 2019 (“COVID-19”) is a pandemic. The impacts of COVID-19 are adversely affecting the entire global economy, individual companies and investment products, and the market in general. There is significant uncertainty around the extent and duration of business disruptions related to COVID-19 and the impacts may be short term or may last for an extended period of time. The risk of further spreading of COVID-19 has led to significant uncertainty and volatility in the financial markets. The value of the Portfolio and the securities in which the Portfolio invests have generally been adversely affected by impacts caused by COVID-19.
Wells Fargo Emerging Growth Portfolio | 37
Report of Independent Registered Public Accounting Firm
TO THE INTEREST HOLDERS OF THE PORTFOLIO AND BOARD OF TRUSTEES WELLS FARGO MASTER TRUST:
Opinion on the Financial Statements
We have audited the accompanying statement of assets and liabilities of Wells Fargo Emerging Growth Portfolio (the Portfolio), one of the portfolios constituting Wells Fargo Master Trust, including the portfolio of investments, as of May 31, 2020, the related statement of operations for the year then ended, the statements of changes in net assets for each of the years in the two-year period then ended, and the related notes (collectively, the financial statements) and the financial highlights for each of the years in the five-year period then ended. In our opinion, the financial statements and financial highlights present fairly, in all material respects, the financial position of the Portfolio as of May 31, 2020, the results of its operations for the year then ended, the changes in its net assets for each of the years in the two-year period then ended, and the financial highlights for each of the years in the five-year period then ended, in conformity with U.S. generally accepted accounting principles.
Basis for Opinion
These financial statements and financial highlights are the responsibility of the Portfolio’s management. Our responsibility is to express an opinion on these financial statements and financial highlights based on our audits. We are a public accounting firm registered with the Public Company Accounting Oversight Board (United States) (PCAOB) and are required to be independent with respect to the Portfolio in accordance with the U.S. federal securities laws and the applicable rules and regulations of the Securities and Exchange Commission and the PCAOB.
We conducted our audits in accordance with the standards of the PCAOB. Those standards require that we plan and perform the audit to obtain reasonable assurance about whether the financial statements and financial highlights are free of material misstatement, whether due to error or fraud. Our audits included performing procedures to assess the risks of material misstatement of the financial statements and financial highlights, whether due to error or fraud, and performing procedures that respond to those risks. Such procedures included examining, on a test basis, evidence regarding the amounts and disclosures in the financial statements and financial highlights. Such procedures also included confirmation of securities owned as of May 31, 2020, by correspondence with the custodian, transfer agent and brokers, or by other appropriate auditing procedures. Our audits also included evaluating the accounting principles used and significant estimates made by management, as well as evaluating the overall presentation of the financial statements and financial highlights. We believe that our audits provide a reasonable basis for our opinion.
We have not been able to determine the specific year that we began serving as the auditor of one or more Wells Fargo Funds investment companies; however we are aware that we have served as the auditor of one or more Wells Fargo Funds investment companies since at least 1955.
Boston, Massachusetts
July 29, 2020
38 | Wells Fargo Emerging Growth Portfolio
Other information (unaudited)
TAX INFORMATION
Pursuant to Section 852 of the Internal Revenue Code, $37,749,463 was designated as a 20% rate gain distribution for the fiscal year ended May 31, 2020.
PROXY VOTING INFORMATION
A description of the policies and procedures used to determine how to vote proxies relating to portfolio securities is available, upon request, by calling 1-800-222-8222, visiting our website at wfam.com, or visiting the SEC website at sec.gov. Information regarding how the proxies related to portfolio securities were voted during the most recent 12-month period ended June 30 is available on the website at wfam.com or by visiting the SEC website at sec.gov.
QUARTERLY PORTFOLIO HOLDINGS INFORMATION
The Fund and Portfolio file their complete schedule of portfolio holdings with the SEC for the first and third quarters of each fiscal year as an exhibit to its reports on Form N-PORT. Shareholders may view the filed Form N-PORT by visiting the SEC website at sec.gov.
Wells Fargo Emerging Growth Fund | 39
Other information (unaudited)
BOARD OF TRUSTEES AND OFFICERS
Each of the Trustees and Officers1 listed in the table below acts in identical capacities for each fund in the Wells Fargo family of funds, which consists of 147 mutual funds comprising the Wells Fargo Funds Trust, Wells Fargo Variable Trust, Wells Fargo Master Trust and four closed-end funds (collectively the “Fund Complex”). This table should be read in conjunction with the Prospectus and the Statement of Additional Information2. The mailing address of each Trustee and Officer is 525 Market Street, 12th Floor, San Francisco, CA 94105. Each Trustee and Officer serves an indefinite term, however, each Trustee serves such term until reaching the mandatory retirement age established by the Trustees.
Independent Trustees
| | | | | | |
Name and
year of birth | | Position held and
length of service* | | Principal occupations during past five years or longer | | Current other
public company or
investment
company
directorships |
| | | |
| William R. Ebsworth (Born 1957) | | Trustee, since 2015 | | Retired. From 1984 to 2013, equities analyst, portfolio manager, research director and chief investment officer at Fidelity Management and Research Company in Boston, Tokyo, and Hong Kong, and retired in 2013 as Chief Investment Officer of Fidelity Strategic Advisers, Inc. where he led a team of investment professionals managing client assets. Prior thereto, Board member of Hong Kong Securities Clearing Co., Hong Kong Options Clearing Corp., the Thailand International Fund, Ltd., Fidelity Investments Life Insurance Company, and Empire Fidelity Investments Life Insurance Company. Audit Committee Chair and Investment Committee Chair of the Vincent Memorial Hospital Endowment (non-profit organization). Mr. Ebsworth is a CFA® charterholder. | | N/A |
| | | |
| Jane A. Freeman (Born 1953) | | Trustee, since 2015; Chair Liaison, since 2018 | | Retired. From 2012 to 2014 and 1999 to 2008, Chief Financial Officer of Scientific Learning Corporation. From 2008 to 2012, Ms. Freeman provided consulting services related to strategic business projects. Prior to 1999, Portfolio Manager at Rockefeller & Co. and Scudder, Stevens & Clark. Board member of the Harding Loevner Funds from 1996 to 2014, serving as both Lead Independent Director and chair of the Audit Committee. Board member of the Russell Exchange Traded Funds Trust from 2011 to 2012 and the chair of the Audit Committee. Ms. Freeman is also an inactive Chartered Financial Analyst. | | N/A |
| | | |
| Isaiah Harris, Jr. (Born 1952) | | Trustee, since 2009; Audit Committee Chairman, since 2019 | | Retired. Chairman of the Board of CIGNA Corporation since 2009, and Director since 2005. From 2003 to 2011, Director of Deluxe Corporation. Prior thereto, President and CEO of BellSouth Advertising and Publishing Corp. from 2005 to 2007, President and CEO of BellSouth Enterprises from 2004 to 2005 and President of BellSouth Consumer Services from 2000 to 2003. Emeritus member of the Iowa State University Foundation Board of Governors. Emeritus Member of the Advisory Board of Iowa State University School of Business. Advisory Board Member, Palm Harbor Academy (private school). Advisory Board Member, Child Evangelism Fellowship (non-profit). Mr. Harris is a certified public accountant (inactive status). | | CIGNA Corporation |
| | | |
| Judith M. Johnson (Born 1949) | | Trustee, since 2008; Audit Committee Chairman, from 2009 to 2018 | | Retired. Prior thereto, Chief Executive Officer and Chief Investment Officer of Minneapolis Employees Retirement Fund from 1996 to 2008. Ms. Johnson is an attorney, certified public accountant and a certified managerial accountant. | | N/A |
| | | |
| David F. Larcker (Born 1950) | | Trustee, since 2009 | | James Irvin Miller Professor of Accounting at the Graduate School of Business, Stanford University, Director of the Corporate Governance Research Initiative and Senior Faculty of The Rock Center for Corporate Governance since 2006. From 2005 to 2008, Professor of Accounting at the Graduate School of Business, Stanford University. Prior thereto, Ernst & Young Professor of Accounting at The Wharton School, University of Pennsylvania from 1985 to 2005. | | N/A |
40 | Wells Fargo Emerging Growth Fund
Other information (unaudited)
| | | | | | |
Name and
year of birth | | Position held and
length of service* | | Principal occupations during past five years or longer | | Current other
public company or
investment
company
directorships |
| | | |
| Olivia S. Mitchell (Born 1953) | | Trustee, since 2006; Nominating and Governance Committee Chair, since 2018 | | International Foundation of Employee Benefit Plans Professor, Wharton School of the University of Pennsylvania since 1993. Director of Wharton’s Pension Research Council and Boettner Center on Pensions & Retirement Research, and Research Associate at the National Bureau of Economic Research. Previously, Cornell University Professor from 1978 to 1993. | | N/A |
| | | |
| Timothy J. Penny (Born 1951) | | Trustee, since 1996; Chairman, since 2018 | | President and Chief Executive Officer of Southern Minnesota Initiative Foundation, a non-profit organization, since 2007. Member of the Board of Trustees of NorthStar Education Finance, Inc., a non-profit organization, since 2007. | | N/A |
| | | |
| James G. Polisson (Born 1959) | | Trustee, since 2018 | | Retired. Chief Marketing Officer, Source (ETF) UK Services, Ltd, from 2015 to 2017. From 2012 to 2015, Principal of The Polisson Group, LLC, a management consulting, corporate advisory and principal investing company. Chief Executive Officer and Managing Director at Russell Investments, Global Exchange Traded Funds from 2010 to 2012. Managing Director of Barclays Global Investors from 1998 to 2010 and Global Chief Marketing Officer for iShares and Barclays Global Investors from 2000 to 2010. Trustee of the San Francisco Mechanics’ Institute, a non-profit organization, from 2013 to 2015. Board member of the Russell Exchange Traded Fund Trust from 2011 to 2012. Director of Barclays Global Investors Holdings Deutschland GmbH from 2006 to 2009. Mr. Polisson is an attorney and has a retired status with the Massachusetts and District of Columbia Bar Associations. | | N/A |
| | | |
| Pamela Wheelock (Born 1959) | | Trustee, since January 2020; previously Trustee from January 2018 to July 2019 | | Board member of the Destination Medical Center Economic Development Agency, Rochester, Minnesota since 2019 and Interim President of the McKnight Foundation since 2020. Acting Commissioner, Minnesota Department of Human Services, July 2019 through September 2019. Human Services Manager (part-time), Minnesota Department of Human Services, October 2019 through December 2019. Chief Operating Officer, Twin Cities Habitat for Humanity from 2017 to 2019. Vice President of University Services, University of Minnesota from 2012 to 2016. Prior thereto, on the Board of Directors, Governance Committee and Finance Committee for the Minnesota Philanthropy Partners (Saint Paul Foundation) from 2012 to 2018, Interim Chief Executive Officer of Blue Cross Blue Shield of Minnesota from 2011 to 2012, Chairman of the Board from 2009 to 2012 and Board Director from 2003 to 2015. Vice President, Leadership and Community Engagement, Bush Foundation, Saint Paul, Minnesota (a private foundation) from 2009 to 2011. Executive Vice President and Chief Financial Officer, Minnesota Sports and Entertainment from 2004 to 2009 and Senior Vice President from 2002 to 2004. Executive Vice President of the Minnesota Wild Foundation from 2004 to 2008. Commissioner of Finance, State of Minnesota, from 1999 to 2002. Currently Board Chair of the Minnesota Wild Foundation since 2010. | | N/A |
| * | Length of service dates reflect the Trustee’s commencement of service with the Trust’s predecessor entities, where applicable. |
Wells Fargo Emerging Growth Fund | 41
Other information (unaudited)
Officers
| | | | |
Name and
year of birth | | Position held and
length of service | | Principal occupations during past five years or longer |
| | |
| Andrew Owen (Born 1960) | | President, since 2017 | | Executive Vice President of Wells Fargo & Company and Head of Affiliated Managers, Wells Fargo Asset Management, since 2014. In addition, Mr. Owen is currently President, Chief Executive Officer and Director of Wells Fargo Funds Management, LLC since 2017. Prior thereto, Executive Vice President responsible for marketing, investments and product development for Wells Fargo Funds Management, LLC, from 2009 to 2014. |
| | |
| Nancy Wiser1 (Born 1967) | | Treasurer, since 2012 | | Executive Vice President of Wells Fargo Funds Management, LLC since 2011. Chief Operating Officer and Chief Compliance Officer at LightBox Capital Management LLC, from 2008 to 2011. |
| | |
| Michelle Rhee (Born 1966) | | Chief Legal Officer, since 2019 | | Secretary of Wells Fargo Funds Management, LLC, Chief Legal Counsel of Wells Fargo Asset Management and Assistant General Counsel of Wells Fargo Bank, N.A. since 2018. Associate General Counsel and Managing Director of Bank of America Corporation from 2004 to 2018. |
| | |
| Catherine Kennedy (Born 1969) | | Secretary, since 2019 | | Vice President of Wells Fargo Funds Management, LLC and Senior Counsel of the Wells Fargo Legal Department since 2010. Vice President and Senior Counsel of Evergreen Investment Management Company, LLC from 1998 to 2010. |
| | |
| Michael H. Whitaker (Born 1967) | | Chief Compliance Officer, since 2016 | | Chief Compliance Officer of Wells Fargo Asset Management since 2016. Senior Vice President and Chief Compliance Officer for Fidelity Investments from 2007 to 2016. |
| | |
| David Berardi (Born 1975) | | Assistant Treasurer, since 2009 | | Vice President of Wells Fargo Funds Management, LLC since 2009. Vice President of Evergreen Investment Management Company, LLC from 2008 to 2010. Manager of Fund Reporting and Control for Evergreen Investment Management Company, LLC from 2004 to 2010. |
| | |
| Jeremy DePalma1 (Born 1974) | | Treasurer, since 2012 | | Senior Vice President of Wells Fargo Funds Management, LLC since 2009. Senior Vice President of Evergreen Investment Management Company, LLC from 2008 to 2010 and head of the Fund Reporting and Control Team within Fund Administration from 2005 to 2010. |
| 1 | Nancy Wiser acts as Treasurer of 65 funds in the Fund Complex. Jeremy DePalma acts as the Treasurer of 82 funds in the Fund Complex. |
| 2 | The Statement of Additional Information includes additional information about the Trustees and is available, without charge, upon request, by calling 1-800-222-8222 or by visiting the website at wfam.com. |
42 | Wells Fargo Emerging Growth Fund
Other information (unaudited)
BOARD CONSIDERATION OF INVESTMENT MANAGEMENT, ADVISORY AND SUB-ADVISORY AGREEMENTS:
Wells Fargo Emerging Growth Fund and Wells Fargo Emerging Growth Portfolio
Under the Investment Company Act of 1940 (the “1940 Act”), the Board of Trustees (each, a “Board” and collectively, the “Boards”) of each of Wells Fargo Funds Trust (“Funds Trust”) and Wells Fargo Master Trust (“Master Trust”, and collectively, the “Trusts”) must determine annually whether to approve the continuation of the Trusts’ investment management, advisory and sub-advisory agreements, as applicable. In this regard, at a Board meeting held on May 26, 2020 and May 28, 2020 (together, the “Meeting”), the Funds Trust Board, all the members of which have no direct or indirect interest in the investment management agreement and are not “interested persons” of the Trusts, as defined in the 1940 Act (the “Independent Trustees”), reviewed and approved for Wells Fargo Emerging Growth Fund (the “Gateway Fund”) an investment management agreement (the “Gateway Fund Management Agreement”) with Wells Fargo Funds Management, LLC (“Funds Management”).
At the Meeting, the Master Trust Board, all the members of which have no direct or indirect interest in the investment advisory and sub-advisory agreements and are Independent Trustees, reviewed and approved: (i) an investment advisory agreement (the “Master Portfolio Advisory Agreement”) with Funds Management for Wells Fargo Emerging Growth Portfolio, a portfolio of Master Trust (the “Master Portfolio”); and (ii) an investment sub-advisory agreement (the “Sub-Advisory Agreement”) with Wells Capital Management Incorporated (the “Sub-Adviser”), an affiliate of Funds Management, for the Master Portfolio.
The Gateway Fund and the Master Portfolio are collectively referred to as the “Funds.” The Gateway Fund Management Agreement, the Master Portfolio Advisory Agreement and the Sub-Advisory Agreement are collectively referred to as the “Advisory Agreements.”
The Gateway Fund is a gateway feeder fund that invest substantially all of its assets in the Master Portfolio. The Master Portfolio has a substantially similar investment objective and substantially similar investment strategies to the Gateway Fund. Information provided to the Boards regarding the Gateway Fund is also applicable to the Master Portfolio, as relevant.
At the Meeting, the Boards considered the factors and reached the conclusions described below relating to the selection of Funds Management and the Sub-Adviser and the approval of the Advisory Agreements. Prior to the Meeting, including at a Board meeting held in April 2020, the Trustees conferred extensively among themselves and with representatives of Funds Management about these matters. Also, the Boards have adopted a team-based approach, with each team consisting of a sub-set of Trustees, to assist the full Boards in the discharge of their duties in reviewing investment performance and other matters throughout the year. The Independent Trustees were assisted in their evaluation of the Advisory Agreements by independent legal counsel, from whom they received separate legal advice and with whom they met separately.
In providing information to the Boards, Funds Management and the Sub-Adviser were guided by a detailed set of requests for information submitted to them by independent legal counsel on behalf of the Independent Trustees at the start of the Boards’ annual contract renewal process earlier in 2020. In considering and approving the Advisory Agreements, the Trustees considered the information they believed relevant, including but not limited to the information discussed below. The Boards considered not only the specific information presented in connection with the Meeting, but also the knowledge gained over time through interaction with Funds Management and the Sub-Adviser about various topics. In this regard, the Boards reviewed reports of Funds Management at each of their quarterly meetings, which included, among other things, portfolio reviews and investment performance reports. In addition, the Boards and the teams mentioned above confer with portfolio managers at various times throughout the year. The Boards did not identify any particular information or consideration that was all-important or controlling, and each individual Trustee may have attributed different weights to various factors.
After its deliberations, the Funds Trust Board unanimously approved the continuation of the Gateway Fund Management Agreement for a one-year period. Additionally, after its deliberations, the Master Trust Board unanimously approved the continuation of the Master Portfolio Advisory Agreement and the Sub-Advisory Agreement, each for a one-year term. The Boards also determined that the compensation payable to Funds Management and the Sub-Adviser was reasonable. The Boards considered the approval of the Advisory Agreements for the Funds as part of their consideration of agreements for funds across the complex, but their approvals were made on a fund-by-fund basis. The following summarizes a number of important, but not necessarily all, factors considered by the Boards in support of their approvals.
Nature, extent and quality of services
The Boards received and considered various information regarding the nature, extent and quality of services provided to the Funds by Funds Management and the Sub-Adviser under the Advisory Agreements. This information included a description of the investment advisory services and Fund-level administrative services, as well as, among other things, a summary of the background and experience of senior management of Wells Fargo Asset Management (“WFAM”), of which Funds Management and the
Wells Fargo Emerging Growth Fund | 43
Other information (unaudited)
Sub-Adviser are a part, and a summary of investments made in the business of WFAM. The Boards also received a description of Funds Management’s and the Sub-Adviser’s business continuity plans and of their approaches to data privacy and cybersecurity, and related testing. The Boards also received and reviewed information about Funds Management’s role as administrator of the Funds’ liquidity risk management program, Funds Management’s approach to risk management, and Funds Management’s intermediary and vendor oversight program. The Boards also considered the qualifications, background, tenure and responsibilities of each of the portfolio managers primarily responsible for the day-to-day portfolio management of the Funds.
The Boards evaluated the ability of Funds Management and the Sub-Adviser to attract and retain qualified investment professionals, including research, advisory and supervisory personnel. The Boards further considered the compliance programs and compliance records of Funds Management and the Sub-Adviser. In addition, the Boards took into account the full range of services provided to the Funds by Funds Management and its affiliates.
Fund investment performance and expenses
The Boards considered the investment performance results for each of the Funds over various time periods ended December 31, 2019. The Boards also considered more current results for various time periods ended March 31, 2020. The Boards considered these results in comparison to the investment performance of funds in a universe that was determined by Broadridge Inc. (“Broadridge”) to be similar to the Gateway Fund (the “Universe”), and in comparison to the Gateway Fund’s benchmark index and to other comparative data. Broadridge is an independent provider of investment company data. The Boards received a description of the methodology used by Broadridge to select the mutual funds in the performance Universe. The Funds Trust Board noted that the investment performance of the Gateway Fund (Administrator Class) was higher than the average investment performance of its Universe for the three-, five- and ten-year periods ended December 31, 2019, and lower than the average investment performance of the Universe for the one-year period ended December 31, 2019. The Funds Trust Board also noted that the investment performance of the Gateway Fund (Administrator Class) was higher than the average investment performance of its Universe for all periods ended March 31, 2020. The Funds Trust Board also noted that the investment performance of the Gateway Fund was higher than its benchmark, the Russell 2000® Growth Index, for the three-, five- and ten-year periods ended December 31, 2019, and lower for the one-year period ended December 31, 2019. The Funds Trust Board also noted that the investment performance of the Gateway Fund was higher than its benchmark, the Russell 2000® Growth Index, for all periods ended March 31, 2020.
The Master Trust Board took note of the investment performance of the Master Portfolio in the context of reviewing the investment performance of the Gateway Fund.
The Funds Trust Board also received and considered information regarding the Gateway Fund’s net operating expense ratios, which include fees and expenses of the Master Portfolio, and their various components, including actual management fees assessed at the Gateway Fund and Master Portfolio levels, custodian and other non-management fees, and Rule 12b-1 and non-Rule 12b-1 shareholder service fees. The Funds Trust Board considered these ratios in comparison to the median ratios of funds in class-specific expense groups that were determined by Broadridge to be similar to the Gateway Fund (the “Groups”). The Funds Trust Board received a description of the methodology used by Broadridge to select the mutual funds in the expense Groups and an explanation of how funds comprising expense groups and their expense ratios may vary from year-to-year. Based on the Broadridge reports, the Funds Trust Board noted that the net operating expense ratios of the Gateway Fund were lower than, equal to or in range of the median net operating expense ratios of its expense Groups for each share class.
With respect to the Master Portfolio, the Master Trust Board reviewed the fee rates that are payable to Funds Management for investment advisory services (as discussed below), which are the only fees charged at the Master Portfolio level, relative to a corresponding expense Group.
The Boards took into account the Funds’ investment performance and expense information provided to them among the factors considered in deciding to re-approve the Advisory Agreements.
Investment management, advisory and sub-advisory fee rates
The Funds Trust Board noted that Funds Management receives no advisory fees from the Gateway Fund as long as the Gateway Fund continues to invest all (or substantially all) of its assets in a single master portfolio. If the Gateway Fund were to change its investment structure so that it began investing in two or more master portfolios (a fund-of-funds), Funds Management would be entitled to receive an annual fee of 0.25% of the Gateway Fund’s average daily net assets for providing investment advisory services to the Gateway Fund, including allocating the Gateway Fund’s assets to the Master Portfolio.
The Funds Trust Board reviewed and considered the contractual fee rates that are payable by the Gateway Fund to Funds Management under the Gateway Fund Management Agreement for management services (other than investment advisory services), as well as the contractual fee rates payable by the Gateway Fund to Funds Management for class-level administrative services under a Class-Level Administration Agreement, which include, among other things, class-level transfer agency and sub-transfer agency costs (collectively, the “Management Rates”).
44 | Wells Fargo Emerging Growth Fund
Other information (unaudited)
The Master Trust Board reviewed and considered the contractual investment advisory fee rate that is payable by the Master Portfolio to Funds Management for investment advisory services under the Master Portfolio Advisory Agreement (the “Advisory Agreement Rate”). The Master Trust Board also reviewed and considered the contractual investment sub-advisory fee rate that is payable by Funds Management to the Sub-Adviser for investment sub-advisory services (the “Sub-Advisory Agreement Rate”).
Among other information reviewed by the Funds Trust Board was a comparison of the Gateway Fund’s Management Rate, which, for this purpose, includes the advisory fees paid at the Master Portfolio level, with the average contractual investment management fee rates of funds in the expense Groups at a common asset level as well as transfer agency costs of the funds in the expense Groups. The Funds Trust Board noted that the Management Rates of the Gateway Fund were in range of the sum of these average rates for the Gateway Fund’s expense Groups for each share class.
The Master Trust Board reviewed a comparison of the Advisory Agreement Rate of the Master Portfolio with those of other funds in the Master Portfolio’s expense Group at a common asset level. The Master Trust Board noted that the Advisory Agreement Rate of the Master Portfolio was lower than the median rate for the Master Portfolio’s expense Group.
The Master Trust Board also received and considered information about the portions of the total management fees that were retained by Funds Management after payment of the fees to the Sub-Adviser for sub-advisory services. The Master Trust Board noted the small size of the sub-advised expense universe. In assessing the reasonableness of these amounts, the Master Trust Board received and evaluated information about the nature and extent of responsibilities retained and risks assumed by Funds Management and not delegated to or assumed by the Sub-Adviser, and about Funds Management’s on-going oversight services. Given the affiliation between Funds Management and the Sub-Adviser, the Master Trust Board ascribed limited relevance to the allocation of fees between them.
The Boards also received and considered information about the nature and extent of services offered and fee rates charged by Funds Management and the Sub-Adviser to other types of clients with investment strategies similar to those of the Funds. In this regard, the Boards received information about the significantly greater scope of services, and compliance, reporting and other legal burdens and risks of managing proprietary mutual funds compared with those associated with managing assets of other types of clients, including third-party sub-advised fund clients and non-mutual fund clients such as institutional separate accounts.
Based on its consideration of the factors and information it deemed relevant, including those described here, the Funds Trust Board determined that the compensation payable to Funds Management under the Gateway Fund Management Agreement was reasonable, and the Master Trust Board determined that the compensation payable to Funds Management under the Master Portfolio Advisory Agreement and to the Sub-Adviser under the Sub-Advisory Agreement was reasonable.
Profitability
The Boards received and considered information concerning the profitability of Funds Management, as well as the profitability of both WFAM and Wells Fargo & Co. (“Wells Fargo”) from providing services to the fund family as a whole. The Boards noted that the Sub-Adviser’s profitability with respect to providing services to the Master Portfolio and other funds in the family was subsumed in the WFAM and Wells Fargo profitability analysis.
Funds Management reported on the methodologies and estimates used in calculating profitability, including a description of the methodology used to allocate certain expenses. Among other things, the Boards noted that the levels of profitability reported on a fund-by-fund basis varied widely, depending on factors such as the size, type and age of fund. Based on its review, the Boards did not deem the profits reported by Funds Management, WFAM or Wells Fargo from services provided to the Funds to be at a level that would prevent the Boards from approving the continuation of the Advisory Agreements.
Economies of scale
The Boards received and considered information about the potential for Funds Management to experience economies of scale in the provision of management services to the Funds, the difficulties of calculating economies of scale at an individual fund level, and the extent to which potential scale benefits are shared with shareholders. The Boards noted the existence of breakpoints in the Master Portfolio’s advisory fee structure and the Gateway Fund’s management fee structure, which operate generally to reduce the Funds’ expense ratios as the Funds grow in size, and the size of the Master Portfolio and the Gateway Fund, respectively, in relation to such breakpoints. The Boards considered that, in addition to advisory fee and management fee breakpoints, Funds Management shares potential economies of scale from its management business in a variety of ways, including through fee waiver and expense reimbursement arrangements, services that benefit shareholders, competitive management fee rates set at the outset without regard to breakpoints, and investments in the business intended to enhance services available to shareholders.
Wells Fargo Emerging Growth Fund | 45
Other information (unaudited)
The Boards concluded that Funds Management’s arrangements with respect to each Fund, including contractual breakpoints, constituted a reasonable approach to sharing potential economies of scale with the Funds and their shareholders.
Other benefits to Funds Management and the Sub-Adviser
The Boards received and considered information regarding potential “fall-out” or ancillary benefits received by Funds Management and its affiliates, including the Sub-Adviser, as a result of their relationships with the Funds. Ancillary benefits could include, among others, benefits directly attributable to other relationships with the Funds and benefits potentially derived from an increase in Funds Management’s and the Sub-Adviser’s business as a result of their relationships with the Funds. The Boards noted that various affiliates of Funds Management may receive distribution-related fees, shareholder servicing payments and sub-transfer agency fees in respect of shares sold or held through them and services provided.
The Boards also reviewed information about soft dollar credits earned and utilized by the Sub-Adviser, fees earned by Funds Management and the Sub-Adviser from managing a private investment vehicle for the fund family’s securities lending collateral, and commissions earned by an affiliated broker from portfolio transactions.
Based on their consideration of the factors and information they deemed relevant, including those described here, the Boards did not find that any ancillary benefits received by Funds Management and its affiliates, including the Sub-Adviser, were unreasonable.
Conclusion
At the Meeting, after considering the above-described factors and based on its deliberations and its evaluation of the information described above, the Funds Trust Board unanimously approved the continuation of the Gateway Fund Management Agreement for a one-year period. Additionally, after considering the above-described factors and based on its deliberations and its evaluation of the information described above, the Master Trust Board unanimously approved the continuation of the Master Portfolio Advisory Agreement and the Sub-Advisory Agreement, each for a one-year term. The Boards also determined that the compensation payable to Funds Management and the Sub-Adviser was reasonable.
46 | Wells Fargo Emerging Growth Fund
Other information (unaudited)
LIQUIDITY RISK MANAGEMENT PROGRAM
In accordance with Rule 22e-4 under the Investment Company Act of 1940, as amended (the “Liquidity Rule”), each of Wells Fargo Funds Trust and Wells Fargo Master Trust (each a “Trust”) has adopted and implemented a liquidity risk management program (the “Program”) on behalf of each of its non-money market series, including the Fund and the Portfolio, respectively, which is reasonably designed to assess and manage the Fund’s or the Portfolio’s liquidity risk. “Liquidity risk” is defined as the risk that the Fund or Portfolio is unable to meet redemption requests without significantly diluting remaining investors’ interests. Each Trust’s Board of Trustees (each a “Board”) previously approved the designation of Wells Fargo Funds Management, LLC (“Funds Management”), the Fund’s investment manager and the Portfolio’s investment adviser, as the administrator of the Program, and Funds Management has established a Liquidity Risk Management Council composed of personnel from multiple departments within Funds Management and its affiliates to assist Funds Management in the implementation and on-going administration of the Program.
The Program is comprised of various components designed to support the assessment and/or management of liquidity risk, including: (1) the periodic assessment (no less frequently than annually) of certain factors that influence the Fund’s and the Portfolio’s liquidity risk; (2) the periodic classification (no less frequently than monthly) of the Fund’s and the Portfolio’s investments into one of four liquidity categories that reflect an estimate of their liquidity under current market conditions; (3) a 15% limit on the acquisition of “illiquid investments” (as defined under the Liquidity Rule); (4) to the extent the Fund or the Portfolio does not invest primarily in “highly liquid investments” (as defined under the Liquidity Rule), the determination of a minimum percentage of the Fund’s or the Portfolio’s assets that generally will be invested in highly liquid investments (an “HLIM”); (5) if the Fund or the Portfolio has established an HLIM, the periodic review (no less frequently than annually) of the HLIM and the adoption of policies and procedures for responding to a shortfall of the Fund’s or the Portfolio’s “highly liquid investments” below its HLIM; and (6) periodic reporting to the respective Board.
At a meeting of each Board held on May 26 and 28, 2020, the Board received a written report (the “Report”) from Funds Management that addressed the operation of the Program and assessed its adequacy and effectiveness of implementation. The Report covered the initial period from December 1, 2018 through December 31, 2019 (the “Reporting Period”). No significant liquidity events impacting the Fund or the Portfolio were noted in the Report. There were no material changes to the Program during the Reporting Period. The Report concluded that the Program is operating effectively to assess and manage the Fund’s and the Portfolio’s liquidity risk, and that the Program has been and continues to be adequately and effectively implemented to monitor and, as applicable, respond to the Fund’s and the Portfolio’s liquidity developments.
There can be no assurance that the Program will achieve its objectives under all circumstances in the future. Please refer to the Fund’s prospectus for more information regarding the Fund’s exposure to liquidity risk and other risks to which an investment in the Fund may be subject.
Wells Fargo Emerging Growth Fund | 47
Appendix I (unaudited)
Effective on or about May 1, 2020, if you purchase Fund shares through a Janney Montgomery Scott LLC (“Janney”) brokerage account, you will be eligible for the following load waivers (front-end sales charge waivers and contingent deferred sales charge (“CDSC”), or back-end sales charge, waivers) and discounts, which may differ from those disclosed elsewhere in the Fund’s Prospectus or SAI.
|
| Front-end sales charge* waivers on Class A shares available at Janney |
|
| Shares purchased through reinvestment of capital gains distributions and dividend reinvestment when purchasing shares of the same fund (but not any other fund within the fund family). |
|
| Shares purchased by employees and registered representatives of Janney or its affiliates and their family members as designated by Janney. |
|
| Shares purchased from the proceeds of redemptions within the same fund family, provided (1) the repurchase occurs within ninety (90) days following the redemption, (2) the redemption and purchase occur in the same account, and (3) redeemed shares were subject to a front-end or deferred sales load (i.e., right of reinstatement). |
|
| Employer-sponsored retirement plans (e.g., 401(k) plans, 457 plans, employer-sponsored 403(b) plans, profit sharing and money purchase pension plans and defined benefit plans). For purposes of this provision, employer-sponsored retirement plans do not include SEP IRAs, Simple IRAs, SAR-SEPs or Keogh plans. |
|
| Shares acquired through a right of reinstatement. |
|
| Class C shares that are no longer subject to a contingent deferred sales charge and are converted to Class A shares of the same fund pursuant to Janney’s policies and procedures. |
| CDSC waivers on Class A and Class C shares available at Janney |
|
| Shares sold upon the death or disability of the shareholder. |
|
| Shares sold as part of a systematic withdrawal plan as described in the Fund’s Prospectus. |
|
| Shares purchased in connection with a return of excess contributions from an IRA account. |
|
| Shares sold as part of a required minimum distribution for IRA and retirement accounts if the redemption is taken in or after the year the shareholder reaches qualified age based on applicable IRS regulations. |
|
| Shares sold to pay Janney fees but only if the transaction is initiated by Janney. |
|
| Shares acquired through a right of reinstatement. |
|
| Shares exchanged into the same share class of a different fund. |
| Front-end sales charge* discounts available at Janney; breakpoints, rights of accumulation and/or letters of intent |
|
| Breakpoints as described in the Fund’s Prospectus. |
|
| Rights of accumulation (“ROA”), which entitle shareholders to breakpoint discounts, will be automatically calculated based on the aggregated holding of fund family assets held by accounts within the purchaser’s household at Janney. Eligible fund family assets not held at Janney may be included in the ROA calculation only if the shareholder notifies his or her financial advisor about such assets. |
|
Letters of intent which allow for breakpoint discounts based on anticipated purchases within a fund family, over a 13-month time period. Eligible fund family assets not held at Janney Montgomery Scott may be included in the calculation of letters of intent only if the shareholder notifies his or her financial advisor about such assets. |
| * | Also referred to as an “initial sales charge.” |
48 | Wells Fargo Emerging Growth Fund
Appendix II (unaudited)
Effective on or after May 1, 2020, clients of Edward Jones (also referred to as “shareholders”) purchasing Fund shares on the Edward Jones commission and fee-based platforms are eligible only for the following sales charge discounts (also referred to as “breakpoints”) and waivers, which can differ from breakpoints and waivers described elsewhere in the Fund’s Prospectus or SAI or through another broker-dealer. In all instances, it is the shareholder’s responsibility to inform Edward Jones at the time of purchase of any relationship, holdings of Wells Fargo Funds or other facts qualifying the purchaser for breakpoints or waivers. Edward Jones can ask for documentation of such circumstance.
|
| Breakpoints available at Edward Jones |
|
| Rights of Accumulation (ROA) |
|
The applicable sales charge on a purchase of Class A shares is determined by taking into account all share classes (except any money market funds and retirement plan share classes) of Wells Fargo Funds held by the shareholder or in an account grouped by Edward Jones with other accounts for the purpose of providing certain pricing considerations (“pricing groups”). This includes all share classes held on the Edward Jones platform and/or held on another platform. The inclusion of eligible fund family assets in the rights of accumulation calculation is dependent on the shareholder notifying his or her financial advisor of such assets at the time of calculation. |
|
ROA is determined by calculating the higher of cost or market value (current shares x NAV). |
|
| Letter of Intent (LOI) |
|
Through a LOI, shareholders can receive the sales charge and breakpoint discounts for purchases shareholders intend to makeover a 13-month period from the date Edward Jones receives the LOI. The LOI is determined by calculating the higher of cost or market value of qualifying holdings at LOI initiation in combination with the value that the shareholder intends to buy over a 13-month period to calculate the front-end sales charge and any breakpoint discounts. Each purchase the shareholder makes during that 13-month period will receive the sales charge and breakpoint discount that applies to the total amount. The inclusion of eligible fund family assets in the LOI calculation is dependent on the shareholder notifying his or her financial advisor of such assets at the time of calculation. Purchases made before the LOI is received by Edward Jones are not covered under the LOI and will not reduce the sales charge previously paid. Sales charges will be adjusted if LOI is not met. |
| Sales charges are waived for the following shareholders and in the following situations at Edward Jones: |
● Associates of Edward Jones and its affiliates and their family members who are in the same pricing group (as determined by Edward Jones under its policies and procedures) as the associate. This waiver will continue for the remainder of the associate’s life if the associate retires from Edward Jones in good-standing. |
● Shares purchased in an Edward Jones fee-based program. |
● Shares purchased through reinvestment of capital gains distributions and dividend reinvestment. |
● Shares purchased from the proceeds of redeemed shares of the same fund family so long as the following conditions are met: 1)the proceeds are from the sale of shares within 60 days of the purchase, and 2) the sale and purchase are made in the same share class and the same account or the purchase is made in an individual retirement account with proceeds from liquidations in anon-retirement account. |
● Shares exchanged into Class A shares from another share class so long as the exchange is into the same fund and was initiated at the discretion of Edward Jones. Edward Jones is responsible for any remaining CDSC due to the fund company, if applicable. Any future purchases are subject to the applicable sales charge as disclosed in the prospectus. |
● Exchanges from Class C shares to Class A shares of the same fund, generally, in the 84th month following the anniversary of the purchase date or earlier at the discretion of Edward Jones. |
|
If the shareholder purchases shares that are subject to a CDSC and those shares are redeemed before the CDSC is expired, the shareholder
is responsible to pay the CDSC except in the following conditions available at Edward Jones: |
● The death or disability of the shareholder. |
● Systematic withdrawals with up to 10% per year of the account value. |
● Return of excess contributions from an Individual Retirement Account (IRA). |
● Shares sold as part of a required minimum distribution for IRA and retirement accounts if the redemption is taken in or after the year the shareholder reaches qualified age based on applicable IRS regulation. |
● Shares sold to pay Edward Jones fees or costs in such cases where the transaction is initiated by Edward Jones. |
● Shares exchanged in an Edward Jones fee-based program. |
● Shares acquired through NAV reinstatement. |
Wells Fargo Emerging Growth Fund | 49
Appendix II (unaudited)
|
| Other Important Information for accounts at Edward Jones: |
| Minimum Purchase Amounts |
● $250 initial purchase minimum |
● $50 subsequent purchase minimum |
|
| Minimum Balances |
| Edward Jones has the right to redeem at its discretion fund holdings with a balance of $250 or less. The following are examples of accounts that are not included in this policy: |
● A fee-based account held on an Edward Jones platform |
● A 529 account held on an Edward Jones platform |
● An account with an active systematic investment plan or letter of intent (LOI) |
|
| Changing Share Classes |
| At any time it deems necessary, Edward Jones has the authority to exchange at NAV a shareholder’s holdings in a fund to Class A shares. |
50 | Wells Fargo Emerging Growth Fund
Appendix III (unaudited)
Effective June 1, 2020, shareholders purchasing Fund shares through an Oppenheimer & Co. Inc. (“Oppenheimer”) platform or account are eligible only for the following load waivers (front-end sales charge waivers and contingent deferred or back-end, sales charge waivers) and discounts, which may differ from those disclosed in the Fund’s Prospectus or SAI.
|
| Front-end Sales Load Waivers on Class A Shares available at Oppenheimer |
|
| Employer-sponsored retirement, deferred compensation and employee benefit plans (including health savings accounts) and trusts used to fund those plans, provided that the shares are not held in a commission-based brokerage account and shares are held for the benefit of the plan. |
|
| Shares purchased by or through a 529 Plan. |
|
| Shares purchased through an Oppenheimer affiliated investment advisory program. |
|
| Shares purchased through reinvestment of capital gains distributions and dividend reinvestment when purchasing shares of the same fund (but not any other fund within the fund family). |
|
| Shares purchased from the proceeds of redemptions within the same fund family, provided (1) the repurchase occurs within 90 days following the redemption, (2) the redemption and purchase occur in the same account, and (3) redeemed shares were subject to a front-end or deferred sales load (known as Rights of Restatement). |
|
| A shareholder in the Fund’s Class C shares will have their shares exchanged at net asset value to Class A shares (or the appropriate share class) of the Fund if the shares are no longer subject to a CDSC and the exchange is in line with the policies and procedures of Oppenheimer. |
|
| Employees and registered representatives of Oppenheimer or its affiliates and their family members. |
|
| Directors or Trustees of the Fund, and employees of the Fund’s investment adviser or any of its affiliates, as described in the Prospectus. |
| CDSC Waivers on A and C Shares available at Oppenheimer |
|
| Death or disability of the shareholder. |
|
| Shares sold as part of a systematic withdrawal plan as described in the Prospectus. |
|
| Return of excess contributions from an IRA Account. |
|
| Shares sold as part of a required minimum distribution for IRA and retirement accounts due to the shareholder reaching the qualified age based on applicable IRS regulations as described in the Prospectus. |
|
| Shares sold to pay Oppenheimer fees but only if the transaction is initiated by Oppenheimer. |
|
| Shares acquired through a right of reinstatement. |
| Front-end load Discounts Available at Oppenheimer: Breakpoints, Rights of Accumulation & Letters of Intent |
|
| Breakpoints as described in the Prospectus. |
|
| Rights of Accumulation (ROA), which entitle shareholders to breakpoint discounts, will be automatically calculated based on the aggregated holding of fund family assets held by accounts within the purchaser’s household at Oppenheimer. Eligible fund family assets not held at Oppenheimer may be included in the ROA calculation only if the shareholder notifies his or her financial advisor about such assets. |
Wells Fargo Emerging Growth Fund | 51
Appendix IV (unaudited)
Effective June 15, 2020, shareholders purchasing fund shares through a Robert W. Baird & Co. (“Baird”) platform or account will only be eligible for the following sales charge waivers (front-end sales charge waivers and CDSC waivers) and discounts, which may differ from those disclosed elsewhere in the Fund’s Prospectus or the SAI.
|
| Front-end Sales Load Waivers on Class A Shares available at Baird |
|
| Shares purchased through reinvestment of capital gains distributions and dividend reinvestment when purchasing share of the same fund. |
|
| Share purchase by employees and registers representatives of Baird or its affiliate and their family members as designated by Baird. |
|
| Shares purchase from the proceeds of redemptions within the same fund family, provided (1) the repurchase occurs within 90 days following the redemption, (2) the redemption and purchase occur in the same accounts, and (3) redeemed shares were subject to a front-end or deferred sales charge (known as rights of reinstatement). |
|
| A shareholder in the Funds Investor C Shares will have their share exchanged at net asset value to Investor A shares of the fund if the shares are no longer subject to CDSC and the exchange is in line with the policies and procedures of Baird. |
|
| Employer-sponsored retirement plans or charitable accounts in a transactional brokerage account at Baird, including 401(k)plans, 457 plans, employer-sponsored 403(b) plans, profit sharing and money purchase pension plans and defined benefit plans. For purposes of this provision, employer-sponsored retirement plans do not include SEP IRAs, Simple IRAs or SAR-SEPs. |
| CDSC Waivers on A and C Shares available at Baird |
|
| Shares sold due to death or disability of the shareholder. |
|
| Shares sold as part of a systematic withdrawal plan as described in the Fund’s Prospectus. |
|
| Shares bought due to returns of excess contributions from an IRA Account. |
|
| Shares sold as part of a required minimum distribution for IRA and retirement accounts due to the shareholder reaching age 72as described in the Fund’s Prospectus. |
|
| Shares sold to pay Baird fees but only if the transaction is initiated by Baird. |
|
| Shares acquired through a right of reinstatement. |
| Front-end load Discounts Available at Baird: Breakpoint and/or Rights of Accumulation |
|
| Breakpoints as described in the Prospectus. |
|
| Rights of accumulations which entitles shareholders to breakpoint discounts will be automatically calculated based on the aggregated holding of fund family assets held by accounts within the purchaser’s household at Baird. Eligible fund family assets not held at Baird may be included in the rights of accumulations calculation only if the shareholder notifies his or her financial advisor about such assets. |
|
| Letters of Intent (LOI) allow for breakpoint discounts based on anticipated purchases within a fund family through Baird, over a13-month period of time. |
52 | Wells Fargo Emerging Growth Fund

For more information
More information about Wells Fargo Funds is available free upon request. To obtain literature, please write, visit the Fund’s website, or call:
Wells Fargo Funds
P.O. Box 219967
Kansas City, MO 64121-9967
Website: wfam.com
Individual investors: 1-800-222-8222
Retail investment professionals: 1-888-877-9275
Institutional investment professionals: 1-866-765-0778

This report and the financial statements contained herein are submitted for the general information of the shareholders of the Fund. If this report is used for promotional purposes, distribution of the report must be accompanied or preceded by a current prospectus. Before investing, please consider the investment objectives, risks, charges, and expenses of the investment. For a current prospectus and, if available, a summary prospectus, containing this information, call 1-800-222-8222 or visit the Fund’s website at wfam.com. Read the prospectus carefully before you invest or send money.
Wells Fargo Asset Management (WFAM) is the trade name for certain investment advisory/management firms owned by Wells Fargo & Company. These firms include but are not limited to Wells Capital Management Incorporated and Wells Fargo Funds Management, LLC. Certain products managed by WFAM entities are distributed by Wells Fargo Funds Distributor, LLC (a broker-dealer and Member FINRA).
This material is for general informational and educational purposes only and is NOT intended to provide investment advice or a recommendation of any kind—including a recommendation for any specific investment, strategy, or plan.
INVESTMENT PRODUCTS: NOT FDIC INSURED ◾ NO BANK GUARANTEE ◾ MAY LOSE VALUE
© 2020 Wells Fargo & Company. All rights reserved.
PAR-0620-00270 07-20
A282/AR282 05-20
Annual Report
May 31, 2020
Wells Fargo
Diversified Large Cap Growth Portfolio
|
|
|
Reduce clutter. Save trees. |
Sign up for electronic delivery of prospectuses and
shareholder reports at wellsfargo.com/
advantagedelivery |
INVESTMENT PRODUCTS: NOT FDIC INSURED ◾ NO BANK GUARANTEE ◾ MAY LOSE VALUE
Wells Fargo Diversified Large Cap Growth Portfolio | 1
Fund information (unaudited)
Investment objective
The Portfolio seeks long-term capital appreciation.
Manager
Wells Fargo Funds Management, LLC
Subadviser
Wells Capital Management Incorporated
Portfolio managers
John R. Campbell, CFA®‡
Joseph M. Eberhardy, CFA®‡, CPA
Vince Fioramonti, CFA®‡*
Thomas C. Ognar, CFA®‡
| | | | |
|
| Ten largest holdings (%) as of May 31, 20201 | |
| | |
Microsoft Corporation | | | 7.24 | |
| | |
Amazon.com Incorporated | | | 6.42 | |
| | |
MasterCard Incorporated Class A | | | 3.36 | |
| | |
Alphabet Incorporated Class A | | | 3.26 | |
| | |
Facebook Incorporated Class A | | | 2.78 | |
| | |
Visa Incorporated Class A | | | 2.54 | |
| | |
Apple Incorporated | | | 2.38 | |
| | |
PayPal Holdings Incorporated | | | 2.12 | |
| | |
Alphabet Incorporated Class C | | | 2.04 | |
| | |
Microchip Technology Incorporated | | | 1.93 | |
|
|
| Sector allocation as of May 31, 20202 |
|
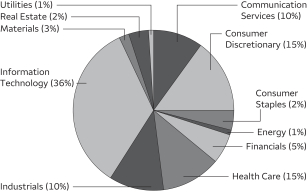 |
| ‡ | CFA® and Chartered Financial Analyst® are trademarks owned by CFA Institute. |
| * | Mr. Fioramonti became a portfolio manager of the Fund on October 21, 2019. |
| 1 | The ten largest holdings, excluding cash, cash equivalents and any money market funds, are calculated based on the value of the investments divided by the total net assets of the Portfolio. Holdings are subject to change and may have changed since the date specified. |
| 2 | Amounts are calculated based on the total long-term investments of the Portfolio. These amounts are subject to change and may have changed since the date specified. |
2 | Wells Fargo Diversified Large Cap Growth Portfolio
Portfolio of investments—May 31, 2020
| | | | | | | | | | | | | | | | |
| | | | | | | | | Shares | | | Value | |
| Common Stocks: 99.29% | | | | | | | | | | | | | | | | |
| | | | |
Communication Services: 10.36% | | | | | | | | | | | | | | | | |
| | | | |
| Diversified Telecommunication Services: 0.43% | | | | | | | | | | | | |
AT&T Incorporated | | | | | | | | | | | 31,535 | | | $ | 973,170 | |
| | | | | | | | | | | | | | | | |
| | | | |
| Entertainment: 1.16% | | | | | | | | | | | | |
Activision Blizzard Incorporated | | | | | | | | | | | 25,380 | | | | 1,826,852 | |
Netflix Incorporated † | | | | | | | | | | | 295 | | | | 123,820 | |
Roku Incorporated † | | | | | | | | | | | 1,705 | | | | 186,715 | |
The Walt Disney Company | | | | | | | | | | | 4,145 | | | | 486,209 | |
| |
| | | | 2,623,596 | |
| | | | | | | | | | | | | | | | |
| | | | |
| Interactive Media & Services: 8.38% | | | | | | | | | | | | |
Alphabet Incorporated Class A † | | | | | | | | | | | 5,155 | | | | 7,389,796 | |
Alphabet Incorporated Class C † | | | | | | | | | | | 3,229 | | | | 4,613,983 | |
Facebook Incorporated Class A † | | | | | | | | | | | 27,931 | | | | 6,286,989 | |
Pinterest Incorporated Class A † | | | | | | | | | | | 33,288 | | | | 675,414 | |
| |
| | | | 18,966,182 | |
| | | | | | | | | | | | | | | | |
| | | | |
| Media: 0.39% | | | | | | | | | | | | |
Discovery Communications Incorporated Class A † | | | | | | | | | | | 41,155 | | | | 895,121 | |
| | | | | | | | | | | | | | | | |
| | | | |
Consumer Discretionary: 15.32% | | | | | | | | | | | | | | | | |
| | | | |
| Auto Components: 0.37% | | | | | | | | | | | | |
Lear Corporation | | | | | | | | | | | 7,842 | | | | 831,644 | |
| | | | | | | | | | | | | | | | |
| | | | |
| Hotels, Restaurants & Leisure: 0.86% | | | | | | | | | | | | |
Chipotle Mexican Grill Incorporated † | | | | | | | | | | | 855 | | | | 858,343 | |
Domino’s Pizza Incorporated | | | | | | | | | | | 1,305 | | | | 503,521 | |
Planet Fitness Incorporated Class A † | | | | | | | | | | | 4,050 | | | | 261,752 | |
Starbucks Corporation | | | | | | | | | | | 4,060 | | | | 316,639 | |
| |
| | | | 1,940,255 | |
| | | | | | | | | | | | | | | | |
| | | | |
| Household Durables: 0.41% | | | | | | | | | | | | |
Pulte Group Incorporated | | | | | | | | | | | 27,629 | | | | 938,557 | |
| | | | | | | | | | | | | | | | |
| | | | |
| Internet & Direct Marketing Retail: 6.42% | | | | | | | | | | | | |
Amazon.com Incorporated † | | | | | | | | | | | 5,946 | | | | 14,522,327 | |
| | | | | | | | | | | | | | | | |
| | | | |
| Multiline Retail: 0.79% | | | | | | | | | | | | |
Dollar General Corporation | | | | | | | | | | | 2,110 | | | | 404,086 | |
Target Corporation | | | | | | | | | | | 11,301 | | | | 1,382,451 | |
| |
| | | | 1,786,537 | |
| | | | | | | | | | | | | | | | |
| | | | |
| Specialty Retail: 5.11% | | | | | | | | | | | | |
Burlington Stores Incorporated † | | | | | | | | | | | 12,905 | | | | 2,705,791 | |
CarMax Incorporated † | | | | | | | | | | | 8,895 | | | | 783,205 | |
Five Below Incorporated † | | | | | | | | | | | 6,455 | | | | 675,516 | |
Floor & Decor Holdings Incorporated † | | | | | | | | | | | 12,155 | | | | 632,060 | |
O’Reilly Automotive Incorporated † | | | | | | | | | | | 960 | | | | 400,550 | |
The Home Depot Incorporated | | | | | | | | | | | 10,745 | | | | 2,669,918 | |
The TJX Companies Incorporated | | | | | | | | | | | 37,954 | | | | 2,002,453 | |
Ulta Beauty Incorporated † | | | | | | | | | | | 6,979 | | | | 1,702,946 | |
| |
| | | | 11,572,439 | |
| | | | | | | | | | | | | | | | |
The accompanying notes are an integral part of these financial statements.
Wells Fargo Diversified Large Cap Growth Portfolio | 3
Portfolio of investments—May 31, 2020
| | | | | | | | | | | | | | | | |
| | | | | | | | | Shares | | | Value | |
| Textiles, Apparel & Luxury Goods: 1.36% | | | | | | | | | | | | |
Deckers Outdoor Corporation † | | | | | | | | | | | 2,530 | | | $ | 461,801 | |
Levi Strauss & Company Class A | | | | | | | | | | | 12,369 | | | | 166,858 | |
lululemon athletica Incorporated † | | | | | | | | | | | 4,955 | | | | 1,486,971 | |
Nike Incorporated Class B | | | | | | | | | | | 9,875 | | | | 973,478 | |
| |
| | | | 3,089,108 | |
| | | | | | | | | | | | | | | | |
| | | | |
Consumer Staples: 2.32% | | | | | | | | | | | | | | | | |
| | | | |
| Beverages: 0.77% | | | | | | | | | | | | |
Boston Beer Company Incorporated Class A † | | | | | | | | | | | 970 | | | | 547,788 | |
The Coca-Cola Company | | | | | | | | | | | 25,792 | | | | 1,203,971 | |
| |
| | | | 1,751,759 | |
| | | | | | | | | | | | | | | | |
| | | | |
| Food & Staples Retailing: 1.32% | | | | | | | | | | | | |
Costco Wholesale Corporation | | | | | | | | | | | 5,207 | | | | 1,606,203 | |
Walmart Incorporated | | | | | | | | | | | 11,157 | | | | 1,384,137 | |
| |
| | | | 2,990,340 | |
| | | | | | | | | | | | | | | | |
| | | | |
| Personal Products: 0.23% | | | | | | | | | | | | |
The Estee Lauder Companies Incorporated Class A | | | | | | | | | | | 2,617 | | | | 516,779 | |
| | | | | | | | | | | | | | | | |
| | | | |
Energy: 0.96% | | | | | | | | | | | | | | | | |
| | | | |
| Oil, Gas & Consumable Fuels: 0.96% | | | | | | | | | | | | |
Chevron Corporation | | | | | | | | | | | 7,344 | | | | 673,445 | |
ConocoPhillips | | | | | | | | | | | 18,416 | | | | 776,787 | |
Marathon Petroleum Corporation | | | | | | | | | | | 20,550 | | | | 722,127 | |
| |
| | | | 2,172,359 | |
| | | | | | | | | | | | | | | | |
| | | | |
Financials: 4.99% | | | | | | | | | | | | | | | | |
| | | | |
| Banks: 1.12% | | | | | | | | | | | | |
Citizens Financial Group Incorporated | | | | | | | | | | | 23,571 | | | | 568,061 | |
Fifth Third Bancorp | | | | | | | | | | | 41,096 | | | | 796,851 | |
JPMorgan Chase & Company | | | | | | | | | | | 12,087 | | | | 1,176,186 | |
| |
| | | | 2,541,098 | |
| | | | | | | | | | | | | | | | |
| | | | |
| Capital Markets: 3.28% | | | | | | | | | | | | |
BlackRock Incorporated | | | | | | | | | | | 2,399 | | | | 1,268,207 | |
CME Group Incorporated | | | | | | | | | | | 4,914 | | | | 897,296 | |
Evercore Partners Incorporated Class A | | | | | | | | | | | 13,932 | | | | 767,793 | |
MarketAxess Holdings Incorporated | | | | | | | | | | | 7,042 | | | | 3,581,491 | |
Tradeweb Markets Incorporated Class A | | | | | | | | | | | 13,775 | | | | 908,599 | |
| |
| | | | 7,423,386 | |
| | | | | | | | | | | | | | | | |
| | | | |
| Consumer Finance: 0.31% | | | | | | | | | | | | |
LendingTree Incorporated † | | | | | | | | | | | 2,670 | | | | 694,253 | |
| | | | | | | | | | | | | | | | |
| | | | |
| Insurance: 0.28% | | | | | | | | | | | | |
Prudential Financial Incorporated | | | | | | | | | | | 10,426 | | | | 635,569 | |
| | | | | | | | | | | | | | | | |
| | | | |
Health Care: 14.80% | | | | | | | | | | | | | | | | |
| | | | |
| Biotechnology: 3.42% | | | | | | | | | | | | |
AbbVie Incorporated | | | | | | | | | | | 9,345 | | | | 866,001 | |
Alnylam Pharmaceuticals Incorporated † | | | | | | | | | | | 3,925 | | | | 530,935 | |
Amgen Incorporated | | | | | | | | | | | 4,694 | | | | 1,078,212 | |
The accompanying notes are an integral part of these financial statements.
4 | Wells Fargo Diversified Large Cap Growth Portfolio
Portfolio of investments—May 31, 2020
| | | | | | | | | | | | | | | | |
| | | | | | | | | Shares | | | Value | |
| Biotechnology (continued) | | | | | | | | | | | | |
BioMarin Pharmaceutical Incorporated † | | | | | | | | | | | 6,775 | | | $ | 721,876 | |
Exact Sciences Corporation † | | | | | | | | | | | 6,700 | | | | 575,396 | |
Gilead Sciences Incorporated | | | | | | | | | | | 13,966 | | | | 1,086,974 | |
Regeneron Pharmaceuticals Incorporated † | | | | | | | | | | | 863 | | | | 528,855 | |
United Therapeutics Corporation † | | | | | | | | | | | 10,486 | | | | 1,236,824 | |
Vertex Pharmaceuticals Incorporated † | | | | | | | | | | | 3,833 | | | | 1,103,751 | |
| |
| | | | 7,728,824 | |
| | | | | | | | | | | | | | | | |
| | | | |
| Health Care Equipment & Supplies: 5.96% | | | | | | | | | | | | |
Abbott Laboratories | | | | | | | | | | | 24,065 | | | | 2,284,250 | |
Baxter International Incorporated | | | | | | | | | | | 23,286 | | | | 2,095,973 | |
Boston Scientific Corporation † | | | | | | | | | | | 89,802 | | | | 3,411,578 | |
DexCom Incorporated † | | | | | | | | | | | 1,255 | | | | 474,779 | |
Edwards Lifesciences Corporation † | | | | | | | | | | | 8,555 | | | | 1,922,480 | |
Insulet Corporation † | | | | | | | | | | | 3,745 | | | | 706,195 | |
Intuitive Surgical Incorporated † | | | | | | | | | | | 2,035 | | | | 1,180,361 | |
Novocure Limited † | | | | | | | | | | | 6,715 | | | | 452,792 | |
Stryker Corporation | | | | | | | | | | | 4,923 | | | | 963,579 | |
| |
| | | | 13,491,987 | |
| | | | | | | | | | | | | | | | |
| | | | |
| Health Care Providers & Services: 1.98% | | | | | | | | | | | | |
Amedisys Incorporated † | | | | | | | | | | | 3,905 | | | | 749,955 | |
Anthem Incorporated | | | | | | | | | | | 4,138 | | | | 1,217,027 | |
CVS Health Corporation | | | | | | | | | | | 16,868 | | | | 1,106,035 | |
UnitedHealth Group Incorporated | | | | | | | | | | | 4,649 | | | | 1,417,248 | |
| |
| | | | 4,490,265 | |
| | | | | | | | | | | | | | | | |
| | | | |
| Health Care Technology: 0.83% | | | | | | | | | | | | |
Veeva Systems Incorporated Class A † | | | | | | | | | | | 8,617 | | | | 1,886,003 | |
| | | | | | | | | | | | | | | | |
| | | | |
| Life Sciences Tools & Services: 0.56% | | | | | | | | | | | | |
Agilent Technologies Incorporated | | | | | | | | | | | 5,953 | | | | 524,697 | |
Repligen Corporation † | | | | | | | | | | | 5,595 | | | | 732,777 | |
| |
| | | | 1,257,474 | |
| | | | | | | | | | | | | | | | |
| | | | |
| Pharmaceuticals: 2.05% | | | | | | | | | | | | |
Bristol-Myers Squibb Company | | | | | | | | | | | 17,529 | | | | 1,046,832 | |
Johnson & Johnson | | | | | | | | | | | 7,114 | | | | 1,058,208 | |
Zoetis Incorporated | | | | | | | | | | | 18,189 | | | | 2,535,365 | |
| |
| | | | 4,640,405 | |
| | | | | | | | | | | | | | | | |
| | | | |
Industrials: 9.84% | | | | | | | | | | | | | | | | |
| | | | |
| Aerospace & Defense: 0.58% | | | | | | | | | | | | |
Lockheed Martin Corporation | | | | | | | | | | | 3,393 | | | | 1,317,977 | |
| | | | | | | | | | | | | | | | |
| | | | |
| Commercial Services & Supplies: 1.94% | | | | | | | | | | | | |
Copart Incorporated † | | | | | | | | | | | 18,420 | | | | 1,646,564 | |
Waste Connections Incorporated | | | | | | | | | | | 29,075 | | | | 2,734,213 | |
| |
| | | | 4,380,777 | |
| | | | | | | | | | | | | | | | |
| | | | |
| Construction & Engineering: 0.40% | | | | | | | | | | | | |
EMCOR Group Incorporated | | | | | | | | | | | 14,134 | | | | 898,216 | |
| | | | | | | | | | | | | | | | |
| | | | |
| Electrical Equipment: 0.26% | | | | | | | | | | | | |
Generac Holdings Incorporated † | | | | | | | | | | | 5,315 | | | | 591,400 | |
| | | | | | | | | | | | | | | | |
The accompanying notes are an integral part of these financial statements.
Wells Fargo Diversified Large Cap Growth Portfolio | 5
Portfolio of investments—May 31, 2020
| | | | | | | | | | | | | | | | |
| | | | | | | | | Shares | | | Value | |
| Industrial Conglomerates: 1.06% | | | | | | | | | | | | | | | | |
Roper Technologies Incorporated | | | | | | | | | | | 6,112 | | | $ | 2,406,906 | |
| | | | | | | | | | | | | | | | |
| | | | |
| Machinery: 0.81% | | | | | | | | | | | | |
Allison Transmission Holdings Incorporated | | | | | | | | | | | 22,360 | | | | 843,419 | |
Cummins Incorporated | | | | | | | | | | | 5,857 | | | | 993,347 | |
| |
| | | | 1,836,766 | |
| | | | | | | | | | | | | | | | |
| | | | |
| Professional Services: 1.57% | | | | | | | | | | | | |
CoStar Group Incorporated † | | | | | | | | | | | 3,488 | | | | 2,290,918 | |
TransUnion | | | | | | | | | | | 14,529 | | | | 1,253,707 | |
| |
| | | | 3,544,625 | |
| | | | | | | | | | | | | | | | |
| | | | |
| Road & Rail: 3.22% | | | | | | | | | | | | |
CSX Corporation | | | | | | | | | | | 33,413 | | | | 2,391,703 | |
Norfolk Southern Corporation | | | | | | | | | | | 12,136 | | | | 2,163,727 | |
Union Pacific Corporation | | | | | | | | | | | 16,128 | | | | 2,739,502 | |
| |
| | | | 7,294,932 | |
| | | | | | | | | | | | | | | | |
| | | | |
Information Technology: 36.21% | | | | | | | | | | | | | | | | |
| | | | |
| Communications Equipment: 0.50% | | | | | | | | | | | | |
Cisco Systems Incorporated | | | | | | | | | | | 23,617 | | | | 1,129,365 | |
| | | | | | | | | | | | | | | | |
| | | | |
| Electronic Equipment, Instruments & Components: 1.13% | | | | | | | | | | | | |
CDW Corporation of Delaware | | | | | | | | | | | 10,321 | | | | 1,144,702 | |
Zebra Technologies Corporation Class A † | | | | | | | | | | | 5,382 | | | | 1,406,424 | |
| |
| | | | 2,551,126 | |
| | | | | | | | | | | | | | | | |
| | | | |
| IT Services: 11.41% | | | | | | | | | | | | |
Fidelity National Information Services Incorporated | | | | | | | | | | | 23,980 | | | | 3,329,143 | |
Global Payments Incorporated | | | | | | | | | | | 12,052 | | | | 2,163,213 | |
Leidos Holdings Incorporated | | | | | | | | | | | 11,019 | | | | 1,160,191 | |
MasterCard Incorporated Class A | | | | | | | | | | | 25,306 | | | | 7,614,322 | |
PayPal Holdings Incorporated † | | | | | | | | | | | 30,988 | | | | 4,803,450 | |
Square Incorporated Class A † | | | | | | | | | | | 10,793 | | | | 875,096 | |
Twilio Incorporated Class A † | | | | | | | | | | | 690 | | | | 136,344 | |
Visa Incorporated Class A | | | | | | | | | | | 29,447 | | | | 5,749,232 | |
| |
| | | | 25,830,991 | |
| | | | | | | | | | | | | | | | |
| | | | |
| Semiconductors & Semiconductor Equipment: 4.97% | | | | | | | | | | | | |
Intel Corporation | | | | | | | | | | | 20,317 | | | | 1,278,549 | |
Maxim Integrated Products Incorporated | | | | | | | | | | | 8,060 | | | | 464,901 | |
Microchip Technology Incorporated | | | | | | | | | | | 45,502 | | | | 4,369,102 | |
Monolithic Power Systems Incorporated | | | | | | | | | | | 2,825 | | | | 592,544 | |
NVIDIA Corporation | | | | | | | | | | | 3,220 | | | | 1,143,164 | |
NXP Semiconductors NV | | | | | | | | | | | 7,435 | | | | 714,504 | |
Texas Instruments Incorporated | | | | | | | | | | | 22,690 | | | | 2,694,211 | |
| |
| | | | 11,256,975 | |
| | | | | | | | | | | | | | | | |
| | | | |
| Software: 15.83% | | | | | | | | | | | | |
Adobe Incorporated † | | | | | | | | | | | 4,555 | | | | 1,760,963 | |
Anaplan Incorporated † | | | | | | | | | | | 13,875 | | | | 637,140 | |
Cloudflare Incorporated Class A † | | | | | | | | | | | 17,407 | | | | 506,021 | |
Dynatrace Incorporated † | | | | | | | | | | | 25,004 | | | | 961,904 | |
Fortinet Incorporated † | | | | | | | | | | | 12,598 | | | | 1,753,642 | |
HubSpot Incorporated † | | | | | | | | | | | 3,849 | | | | 769,569 | |
Intuit Incorporated | | | | | | | | | | | 4,065 | | | | 1,180,151 | |
The accompanying notes are an integral part of these financial statements.
6 | Wells Fargo Diversified Large Cap Growth Portfolio
Portfolio of investments—May 31, 2020
| | | | | | | | | | | | | | | | |
| | | | | | | | | Shares | | | Value | |
| | | | |
| Software (continued) | | | | | | | | | | | | |
Microsoft Corporation | | | | | | | | | | | 89,405 | | | $ | 16,383,466 | |
Oracle Corporation | | | | | | | | | | | 22,467 | | | | 1,208,051 | |
Proofpoint Incorporated † | | | | | | | | | | | 6,522 | | | | 758,313 | |
RingCentral Incorporated Class A † | | | | | | | | | | | 3,230 | | | | 885,828 | |
Salesforce.com Incorporated † | | | | | | | | | | | 11,340 | | | | 1,982,119 | |
ServiceNow Incorporated † | | | | | | | | | | | 6,470 | | | | 2,509,907 | |
Splunk Incorporated † | | | | | | | | | | | 15,399 | | | | 2,861,750 | |
VMware Incorporated Class A † | | | | | | | | | | | 5,903 | | | | 922,462 | |
Zendesk Incorporated † | | | | | | | | | | | 8,690 | | | | 745,168 | |
| |
| | | | 35,826,454 | |
| | | | | | | | | | | | | | | | |
| | | | |
| Technology Hardware, Storage & Peripherals: 2.37% | | | | | | | | | | | | |
Apple Incorporated | | | | | | | | | | | 16,913 | | | | 5,377,319 | |
| | | | | | | | | | | | | | | | |
| | | | |
Materials: 2.51% | | | | | | | | | | | | | | | | |
| | | | |
| Chemicals: 1.98% | | | | | | | | | | | | |
Air Products & Chemicals Incorporated | | | | | | | | | | | 4,713 | | | | 1,138,896 | |
Ecolab Incorporated | | | | | | | | | | | 1,315 | | | | 279,543 | |
Huntsman Corporation | | | | | | | | | | | 41,070 | | | | 745,421 | |
Linde plc | | | | | | | | | | | 11,482 | | | | 2,323,268 | |
| |
| | | | 4,487,128 | |
| | | | | | | | | | | | | | | | |
| | | | |
| Metals & Mining: 0.53% | | | | | | | | | | | | |
Reliance Steel & Aluminum Company | | | | | | | | | | | 12,367 | | | | 1,199,599 | |
| | | | | | | | | | | | | | | | |
| | | | |
Real Estate: 1.56% | | | | | | | | | | | | | | | | |
| | | | |
| Equity REITs: 1.56% | | | | | | | | | | | | |
American Tower Corporation | | | | | | | | | | | 5,476 | | | | 1,413,739 | |
Prologis Incorporated | | | | | | | | | | | 14,503 | | | | 1,327,025 | |
SBA Communications Corporation | | | | | | | | | | | 2,495 | | | | 783,754 | |
| |
| | | | 3,524,518 | |
| | | | | | | | | | | | | | | | |
| | | | |
Utilities: 0.42% | | | | | | | | | | | | | | | | |
| | | | |
| Independent Power & Renewable Electricity Producers: 0.42% | | | | | | | | | | | | |
Vistra Energy Corporation | | | | | | | | | | | 46,683 | | | | 954,201 | |
| | | | | | | | | | | | | | | | |
| |
Total Common Stocks (Cost $145,817,523) | | | | 224,768,712 | |
| | | | | | | | | | | | | | | | |
| | | | |
| | | | | | | | | | | | | | | | |
| | | Yield | | | | | | | | | | |
| Short-Term Investments: 0.45% | | | | | | | | | | | | |
| | | | |
Investment Companies: 0.45% | | | | | | | | | | | | | | | | |
Wells Fargo Government Money Market Fund Select Class (l)(u) | | | 0.12 | % | | | | | | | 1,015,923 | | | | 1,015,923 | |
| | | | | | | | | | | | | | | | |
| |
Total Short-Term Investments (Cost $1,015,923) | | | | 1,015,923 | |
| | | | | | | | | | | | | | | | |
| | | | | | | | |
| Total investments in securities (Cost $146,833,446) | | | 99.74 | % | | | 225,784,635 | |
| | |
Other assets and liabilities, net | | | 0.26 | | | | 581,244 | |
| | | | | | | | |
| Total net assets | | | 100.00 | % | | $ | 226,365,879 | |
| | | | | | | | |
| † | Non-income-earning security |
| (l) | The issuer of the security is an affiliated person of the Portfolio as defined in the Investment Company Act of 1940. |
| (u) | The rate represents the 7-day annualized yield at period end. |
Abbreviations:
| REIT | Real estate investment trust |
The accompanying notes are an integral part of these financial statements.
Wells Fargo Diversified Large Cap Growth Portfolio | 7
Portfolio of investments—May 31, 2020
Investments in Affiliates
An affiliated investment is an investment in which the Portfolio owns at least 5% of the outstanding voting shares of the issuer or as a result of other relationships, such as the Portfolio and the issuer having the same adviser or investment manager. Transactions with issuers that were either affiliated persons of the Portfolio at the beginning of the period or the end of the period were as follows:
| | | | | | | | | | | | | | | | | | | | | | | | | | | | | | | | | | | | |
| | | Shares,
beginning of
period | | | Shares
purchased | | | Shares
sold | | | Shares,
end of
period | | | Net
realized
gains
(losses) | | | Net
change in
unrealized
gains
(losses) | | | Income
from
affiliated
securities | | | Value,
end of
period | | | % of
net
assets | |
| | | | | | | | | |
| Short-Term Investments | | | | | | | | | | | | | | | | | | | | | | | | | | | |
Investment Companies | | | | | | | | | | | | | | | | | | | | | | | | | | | | | | | | | | | | |
Securities Lending Cash Investments LLC * | | | 7,813,999 | | | | 69,724,800 | | | | (77,538,799 | ) | | | 0 | | | $ | 1,156 | | | $ | 0 | | | $ | 69,808 | # | | $ | 0 | | | | | |
Wells Fargo Government Money Market Fund Select Class | | | 2,887,213 | | | | 67,526,912 | | | | (69,398,202 | ) | | | 1,015,923 | | | | 0 | | | | 0 | | | | 32,376 | | | | 1,015,923 | | | | | |
| | | | | | | | | | | | | | | | | | | | | | | | | | | | | | | | | | | | |
| | | | | | | | | | | | | | | | | | $ | 1,156 | | | $ | 0 | | | $ | 102,184 | | | $ | 1,015,923 | | | | 0.45 | % |
| | | | | | | | | | | | | | | | | | | | | | | | | | | | | | | | | | | | |
| * | No longer held at the end of the period |
| # | Amount shown represents income before fees and rebates. |
The accompanying notes are an integral part of these financial statements.
8 | Wells Fargo Diversified Large Cap Growth Portfolio
Statement of assets and liabilities—May 31, 2020
| | | | |
| | | | |
| |
Assets | | | | |
Investments in unaffiliated securities, at value (cost $145,817,523) | | $ | 224,768,712 | |
Investments in affiliated securities, at value (cost $1,015,923) | | | 1,015,923 | |
Receivable for investments sold | | | 1,240,961 | |
Receivable for dividends | | | 242,571 | |
| | | | |
Total assets | | | 227,268,167 | |
| | | | |
| |
Liabilities | | | | |
Payable for investments purchased | | | 712,606 | |
Advisory fee payable | | | 127,217 | |
Trustees’ fees and expenses payable | | | 832 | |
Accrued expenses and other liabilities | | | 61,633 | |
| | | | |
Total liabilities | | | 902,288 | |
| | | | |
Total net assets | | $ | 226,365,879 | |
| | | | |
The accompanying notes are an integral part of these financial statements.
Wells Fargo Diversified Large Cap Growth Portfolio | 9
Statement of operations—year ended May 31, 2020
| | | | |
| | | | |
| |
Investment income | | | | |
Dividends (net of foreign withholding taxes of $5,451) | | $ | 2,548,085 | |
Income from affiliated securities | | | 55,006 | |
| | | | |
Total investment income | | | 2,603,091 | |
| | | | |
| |
Expenses | | | | |
Advisory fee | | | 1,572,847 | |
Custody and accounting fees | | | 42,859 | |
Professional fees | | | 47,913 | |
Shareholder report expenses | | | 9,038 | |
Trustees’ fees and expenses | | | 20,805 | |
Other fees and expenses | | | 18,329 | |
| | | | |
Total expenses | | | 1,711,791 | |
Less: Fee waivers and/or expense reimbursements | | | (215,731 | ) |
| | | | |
Net expenses | | | 1,496,060 | |
| | | | |
Net investment income | | | 1,107,031 | |
| | | | |
| |
Realized and unrealized gains (losses) on investments | | | | |
Net realized gains on | | | | |
Unaffiliated securities | | | 8,812,620 | |
Affiliated securities | | | 1,156 | |
| | | | |
Net realized gains on investments | | | 8,813,776 | |
Net change in unrealized gains (losses) on investments | | | 29,761,001 | |
| | | | |
Net realized and unrealized gains (losses) on investments | | | 38,574,777 | |
| | | | |
Net increase in net assets resulting from operations | | $ | 39,681,808 | |
| | | | |
The accompanying notes are an integral part of these financial statements.
10 | Wells Fargo Diversified Large Cap Growth Portfolio
Statement of changes in net assets
| | | | | | | | |
| | | Year ended
May 31, 2020 | | | Year ended
May 31, 2019 | |
| | |
Operations | | | | | | | | |
Net investment income | | $ | 1,107,031 | | | $ | 2,091,090 | |
Net realized gains (losses) on investments | | | 8,813,776 | | | | (11,838,627 | ) |
Net change in unrealized gains (losses) on investments | | | 29,761,001 | | | | 13,800,380 | |
| | | | |
Net increase in net assets resulting from operations | | | 39,681,808 | | | | 4,052,843 | |
| | | | |
| |
Capital transactions | | | | |
Transactions in investors’ beneficial interests | | | | | | | | |
Contributions | | | 24,249,945 | | | | 373,370,690 | |
Withdrawals | | | (88,296,877 | ) | | | (212,811,363 | ) |
| | | | |
Net increase (decrease) in net assets resulting from capital transactions | | | (64,046,932 | ) | | | 160,559,327 | |
| | | | |
Total increase (decrease) in net assets | | | (24,365,124 | ) | | | 164,612,170 | |
| | | | |
| |
Net assets | | | | |
Beginning of period | | | 250,731,003 | | | | 86,118,833 | |
| | | | |
End of period | | $ | 226,365,879 | | | $ | 250,731,003 | |
| | | | | | | | |
The accompanying notes are an integral part of these financial statements.
Wells Fargo Diversified Large Cap Growth Portfolio | 11
Financial highlights
| | | | | | | | | | | | | | | | | | | | |
| | | Year ended May 31 | |
| | | 2020 | | | 2019 | | | 2018 | | | 2017 | | | 2016 | |
Total return | | | 16.10 | % | | | 3.79 | % | | | 24.12 | % | | | 15.36 | % | | | (2.28 | )% |
Ratios to average net assets (annualized) | | | | | | | | |
Gross expenses | | | 0.71 | % | | | 0.70 | % | | | 0.80 | % | | | 0.78 | % | | | 0.74 | % |
Net expenses | | | 0.62 | % | | | 0.62 | % | | | 0.62 | % | | | 0.62 | % | | | 0.62 | % |
Net investment income | | | 0.46 | % | | | 0.68 | % | | | 0.53 | % | | | 0.51 | % | | | 0.29 | % |
Supplemental data | | | | | | | | | | | | | | | | | | | | |
Portfolio turnover rate | | | 43 | % | | | 100 | % | | | 37 | % | | | 98 | % | | | 59 | % |
The accompanying notes are an integral part of these financial statements.
12 | Wells Fargo Diversified Large Cap Growth Portfolio
Notes to financial statements
1. ORGANIZATION
Wells Fargo Master Trust (the “Trust”), a Delaware statutory trust organized on March 10, 1999, is an open-end management investment company registered under the Investment Company Act of 1940, as amended (the “1940 Act”). As an investment company, the Trust follows the accounting and reporting guidance in Financial Accounting Standards Board (“FASB”) Accounting Standards Codification Topic 946, Financial Services – Investment Companies. These financial statements report on the Wells Fargo Diversified Large Cap Growth Portfolio (the “Portfolio”) which is a diversified series of the Trust.
2. SIGNIFICANT ACCOUNTING POLICIES
The following significant accounting policies, which are consistently followed in the preparation of the financial statements of the Portfolio, are in conformity with U.S. generally accepted accounting principles which require management to make estimates and assumptions that affect the reported amounts of assets and liabilities, disclosure of contingent assets and liabilities at the date of the financial statements, and the reported amounts of revenues and expenses during the reporting period. Actual results could differ from those estimates.
Securities valuation
All investments are valued each business day as of the close of regular trading on the New York Stock Exchange (generally 4 p.m. Eastern Time), although the Portfolio may deviate from this calculation time under unusual or unexpected circumstances.
Equity securities that are listed on a foreign or domestic exchange or market are valued at the official closing price or, if none, the last sales price. If no sale occurs on the principal exchange or market that day, a fair value price will be determined in accordance with the Portfolio’s Valuation Procedures.
Investments in registered open-end investment companies are valued at net asset value. Interests in non-registered investment companies that are redeemable at net asset value are fair valued normally at net asset value.
Investments which are not valued using any of the methods discussed above are valued at their fair value, as determined in good faith by the Board of Trustees of the Portfolio. The Board of Trustees has established a Valuation Committee comprised of the Trustees and has delegated to it the authority to take any actions regarding the valuation of portfolio securities that the Valuation Committee deems necessary or appropriate, including determining the fair value of portfolio securities, unless the determination has been delegated to the Wells Fargo Asset Management Pricing Committee at Wells Fargo Funds Management, LLC (“Funds Management”). The Board of Trustees retains the authority to make or ratify any valuation decisions or approve any changes to the Valuation Procedures as it deems appropriate. On a quarterly basis, the Board of Trustees receives reports on any valuation actions taken by the Valuation Committee or the Wells Fargo Asset Management Pricing Committee which may include items for ratification.
Foreign currency translation
The accounting records of the Portfolio are maintained in U.S. dollars. The values of other assets and liabilities denominated in foreign currencies are translated into U.S. dollars at rates provided by an independent foreign currency pricing source at a time each business day specified by the Wells Fargo Asset Management Pricing Committee. Purchases and sales of securities, and income and expenses are converted at the rate of exchange on the respective dates of such transactions. Net realized foreign exchange gains or losses arise from sales of foreign currencies, currency gains or losses realized between the trade and settlement dates on securities transactions, and the difference between the amounts of dividends, interest and foreign withholding taxes recorded and the U.S. dollar equivalent of the amounts actually paid or received. Net unrealized foreign exchange gains and losses arise from changes in the fair value of assets and liabilities other than investments in securities resulting from changes in exchange rates. The changes in net assets arising from changes in exchange rates of securities and the changes in net assets resulting from changes in market prices of securities are not separately presented. Such changes are included in net realized and unrealized gains or losses from investments.
Securities lending
The Portfolio may lend its securities from time to time in order to earn additional income in the form of fees or interest on securities received as collateral or the investment of any cash received as collateral. When securities are on loan, the Portfolio receives interest or dividends on those securities. Cash collateral received in connection with its securities lending transactions is invested in Securities Lending Cash Investments, LLC (the “Securities Lending Fund”). Investments in Securities Lending Fund are valued at the evaluated bid price provided by an independent pricing service. Income earned from investment in the Securities Lending Fund (net of fees and rebates), if any, is included in income from affiliated securities on the Statement of Operations.
In a securities lending transaction, the net asset value of the Portfolio is affected by an increase or decrease in the value of the securities loaned and by an increase or decrease in the value of the instrument in which collateral is invested. The amount of
Wells Fargo Diversified Large Cap Growth Portfolio | 13
Notes to financial statements
securities lending activity undertaken by the Portfolio fluctuates from time to time. The Portfolio has the right under the lending agreement to recover the securities from the borrower on demand. In the event of default or bankruptcy by the borrower, the Portfolio may be prevented from recovering the loaned securities or gaining access to the collateral or may experience delays or costs in doing so. In such an event, the terms of the agreement allow the unaffiliated securities lending agent to use the collateral to purchase replacement securities on behalf of the Portfolio or pay the Portfolio the market value of the loaned securities. The Portfolio bears the risk of loss with respect to depreciation of its investment of the cash collateral.
Security transactions and income recognition
Securities transactions are recorded on a trade date basis. Realized gains or losses are recorded on the basis of identified cost.
Dividend income is recognized on the ex-dividend date. Dividend income is recorded net of foreign taxes withheld where recovery of such taxes is not assured.
Federal and other taxes
The Portfolio is treated as a separate entity for federal income tax purposes. The Portfolio is not required to pay federal income taxes on its net investment income and net capital gains as it is treated as a partnership for federal income tax purposes. All dividends, gains and losses of the Portfolio are deemed to have been “passed through” to the interest holders in proportion to their holdings of the Portfolio regardless of whether dividends and gains have been distributed by the Portfolio.
The Portfolio’s income tax returns and all financial records supporting those returns for the prior three fiscal years are subject to examination by the federal revenue authority. Management has analyzed the Portfolio’s tax positions taken on federal, state, and foreign tax returns for all open tax years and does not believe that there are any uncertain tax positions that require recognition of a tax liability.
As of May 31, 2020, the aggregate cost of all investments for federal income tax purposes was $148,881,599 and the unrealized gains (losses) consisted of:
| | | | |
| |
Gross unrealized gains | | $ | 83,698,519 | |
| |
Gross unrealized losses | | | (6,795,483 | ) |
| |
Net unrealized gains | | $ | 76,903,036 | |
3. FAIR VALUATION MEASUREMENTS
Fair value measurements of investments are determined within a framework that has established a fair value hierarchy based upon the various data inputs utilized in determining the value of the Portfolio’s investments. The three-level hierarchy gives the highest priority to unadjusted quoted prices in active markets for identical assets or liabilities (Level 1) and the lowest priority to unobservable inputs (Level 3). The Portfolio’s investments are classified within the fair value hierarchy based on the lowest level of input that is significant to the fair value measurement. The inputs are summarized into three broad levels as follows:
| ∎ | | Level 1 – quoted prices in active markets for identical securities |
| ∎ | | Level 2 – other significant observable inputs (including quoted prices for similar securities, interest rates, prepayment speeds, credit risk, etc.) |
| ∎ | | Level 3 – significant unobservable inputs (including the Portfolio’s own assumptions in determining the fair value of investments) |
The inputs or methodologies used for valuing investments in securities are not necessarily an indication of the risk associated with investing in those securities.
14 | Wells Fargo Diversified Large Cap Growth Portfolio
Notes to financial statements
The following is a summary of the inputs used in valuing the Portfolio’s assets and liabilities as of May 31, 2020:
| | | | | | | | | | | | | | | | |
| | | | |
| | | Quoted prices (Level 1) | | | Other significant
observable inputs (Level 2) | | | Significant
unobservable inputs (Level 3) | | | Total | |
| | | | |
Assets | | | | | | | | | | | | | | | | |
Investments in: | | | | | | | | | | | | | | | | |
| | | | |
Common stocks | | | | | | | | | | | | | | | | |
| | | | |
Communication services | | $ | 23,458,069 | | | $ | 0 | | | $ | 0 | | | $ | 23,458,069 | |
| | | | |
Consumer discretionary | | | 34,680,867 | | | | 0 | | | | 0 | | | | 34,680,867 | |
| | | | |
Consumer staples | | | 5,258,878 | | | | 0 | | | | 0 | | | | 5,258,878 | |
| | | | |
Energy | | | 2,172,359 | | | | 0 | | | | 0 | | | | 2,172,359 | |
| | | | |
Financials | | | 11,294,306 | | | | 0 | | | | 0 | | | | 11,294,306 | |
| | | | |
Health care | | | 33,494,958 | | | | 0 | | | | 0 | | | | 33,494,958 | |
| | | | |
Industrials | | | 22,271,599 | | | | 0 | | | | 0 | | | | 22,271,599 | |
| | | | |
Information technology | | | 81,972,230 | | | | 0 | | | | 0 | | | | 81,972,230 | |
| | | | |
Materials | | | 5,686,727 | | | | 0 | | | | 0 | | | | 5,686,727 | |
| | | | |
Real estate | | | 3,524,518 | | | | 0 | | | | 0 | | | | 3,524,518 | |
| | | | |
Utilities | | | 954,201 | | | | 0 | | | | 0 | | | | 954,201 | |
| | | | |
Short-term investments | | | | | | | | | | | | | | | | |
| | | | |
Investment companies | | | 1,015,923 | | | | 0 | | | | 0 | | | | 1,015,923 | |
| | | | |
Total assets | | $ | 225,784,635 | | | $ | 0 | | | $ | 0 | | | $ | 225,784,635 | |
Additional sector, industry or geographic detail is included in the Portfolio of Investments.
For the year ended May 31, 2020, the Portfolio did not have any transfers into/out of Level 3.
4. TRANSACTIONS WITH AFFILIATES
Advisory fee
The Trust has entered into an advisory contract with Funds Management, an indirect wholly owned subsidiary of Wells Fargo & Company (“Wells Fargo”). The adviser is responsible for implementing investment policies and guidelines and for supervising the subadviser, who is responsible for day-to-day portfolio management of the Portfolio. Pursuant to the contract, Funds Management is entitled to receive an annual advisory fee at the following annual rate based on the Portfolio’s average daily net assets:
| | | | |
| |
| Average daily net assets | | Advisory fee | |
| |
First $500 million | | | 0.650 | % |
| |
Next $500 million | | | 0.625 | |
| |
Next $1 billion | | | 0.600 | |
| |
Next $2 billion | | | 0.575 | |
| |
Next $4 billion | | | 0.550 | |
| |
Next $4 billion | | | 0.525 | |
| |
Next $4 billion | | | 0.500 | |
| |
Over $16 billion | | | 0.475 | |
For the year ended May 31, 2020, the advisory fee was equivalent to an annual rate of 0.65% of the Portfolio’s average daily net assets.
Funds Management has retained the services of a subadviser to provide daily portfolio management to the Portfolio. The fee for subadvisory services is borne by Funds Management. Wells Capital Management Incorporated (“WellsCap”), an affiliate of Funds Management and an indirect wholly owned subsidiary of Wells Fargo, is the subadviser to the Portfolio and is entitled to receive a fee from Funds Management at an annual rate starting at 0.35% and declining to 0.30% as the average daily net assets of the Portfolio increase. Prior to February 20, 2020, WellsCap received a fee at an annual rate which started at 0.30% and declined to 0.20% as the average daily net assets of the Portfolio increased.
Wells Fargo Diversified Large Cap Growth Portfolio | 15
Notes to financial statements
Funds Management has voluntarily waived and/or reimbursed advisory fees to reduce the net operating expense ratio of the Portfolio.
Interfund transactions
The Portfolio may purchase or sell portfolio investment securities to certain other Wells Fargo affiliates pursuant to Rule 17a-7 under the 1940 Act and under procedures adopted by the Board of Trustees. The procedures have been designed to ensure that these interfund transactions, which do not incur broker commissions, are effected at current market prices.
5. INVESTMENT PORTFOLIO TRANSACTIONS
Purchases and sales of investments, excluding U.S. government obligations (if any) and short-term securities, for the year ended May 31, 2020 were $103,155,146 and $164,830,674, respectively.
6. SECURITIES LENDING TRANSACTIONS
The Portfolio lends its securities through an unaffiliated securities lending agent and receives collateral in the form of cash or securities with a value at least equal to the value of the securities on loan. The value of the loaned securities is determined at the close of each business day and any increases or decreases in the required collateral are exchanged between the Portfolio and the counterparty on the next business day. Cash collateral received is invested in the Securities Lending Fund which seeks to provide a positive return compared to the daily Fed Funds Open Rate by investing in high-quality, U.S. dollar-denominated short-term money market instruments and is exempt from registration under Section 3(c)(7) of the 1940 Act. Securities Lending Fund is managed by Funds Management and is subadvised by WellsCap. Funds Management receives an advisory fee starting at 0.05% and declining to 0.01% as the average daily net assets of the Securities Lending Fund increase. All of the fees received by Funds Management are paid to WellsCap for its services as subadviser.
In the event of counterparty default or the failure of a borrower to return a loaned security, the Portfolio has the right to use the collateral to offset any losses incurred. As of May 31, 2020, the Portfolio did not have any securities on loan.
7. BANK BORROWINGS
The Trust, along with Wells Fargo Variable Trust and Wells Fargo Funds Trust (excluding the money market funds), are parties to a $280,000,000 revolving credit agreement whereby the Portfolio is permitted to use bank borrowings for temporary or emergency purposes, such as to fund shareholder redemption requests. Interest under the credit agreement is charged to the Portfolio based on a borrowing rate equal to the higher of the Federal Funds rate in effect on that day plus 1.25% or the overnight LIBOR rate in effect on that day plus 1.25%. In addition, an annual commitment fee equal to 0.25% of the unused balance is allocated to each participating fund.
For the year ended May 31, 2020, there were no borrowings by the Portfolio under the agreement.
8. CONCENTRATION RISK
Concentration risk results from exposure to a limited number of sectors. As of the end of the period, the Portfolio invested a concentration of its portfolio in the information technology sector. A portfolio that invests a substantial portion of its assets in any sector may be more affected by changes in that sector than would be a portfolio whose investments are not heavily weighted in any sector.
9. INDEMNIFICATION
Under the Portfolio’s organizational documents, the officers and Trustees have been granted certain indemnification rights against certain liabilities that may arise out of performance of their duties to the Portfolio. The Portfolio has entered into a separate agreement with each Trustee that converts indemnification rights currently existing under the Portfolio’s organizational documents into contractual rights that cannot be changed in the future without the consent of the Trustee. Additionally, in the normal course of business, the Portfolio may enter into contracts with service providers that contain a variety of indemnification clauses. The Portfolio’s maximum exposure under these arrangements is dependent on future claims that may be made against the Portfolio and, therefore, cannot be estimated.
10. NEW ACCOUNTING PRONOUNCEMENT
In August 2018, FASB issued Accounting Standards Update (“ASU”) No. 2018-13, Fair Value Measurement (Topic 820) Disclosure Framework—Changes to the Disclosure Requirements for Fair Value Measurement. ASU 2018-13 updates the disclosure requirements for fair value measurements by modifying or removing certain disclosures and adding certain new disclosures. The amendments are effective for fiscal years, and interim periods within those fiscal years, beginning after December 15, 2019. Early adoption is permitted. Management has adopted the removal and modification of disclosures early, as permitted, and will adopt the additional new disclosures at the effective date.
16 | Wells Fargo Diversified Large Cap Growth Portfolio
Notes to financial statements
11. CORONAVIRUS (COVID-19) PANDEMIC
On March 11, 2020, the World Health Organization announced that it had made the assessment that coronavirus disease 2019 (“COVID-19”) is a pandemic. The impacts of COVID-19 are adversely affecting the entire global economy, individual companies and investment products, and the market in general. There is significant uncertainty around the extent and duration of business disruptions related to COVID-19 and the impacts may be short term or may last for an extended period of time. The risk of further spreading of COVID-19 has led to significant uncertainty and volatility in the financial markets. The value of the Portfolio and the securities in which the Portfolio invests have generally been adversely affected by impacts caused by COVID-19.
Wells Fargo Diversified Large Cap Growth Portfolio | 17
Report of independent registered public accounting firm
TO THE INTEREST HOLDERS OF THE PORTFOLIO AND BOARD OF TRUSTEES
WELLS FARGO MASTER TRUST:
Opinion on the Financial Statements
We have audited the accompanying statement of assets and liabilities of Wells Fargo Diversified Large Cap Growth Portfolio (the Portfolio), one of the portfolios constituting Wells Fargo Master Trust, including the portfolio of investments, as of May 31, 2020, the related statement of operations for the year then ended, the statements of changes in net assets for each of the years in the two-year period then ended, and the related notes (collectively, the financial statements) and the financial highlights for each of the years in the five-year period then ended. In our opinion, the financial statements and financial highlights present fairly, in all material respects, the financial position of the Portfolio as of May 31, 2020, the results of its operations for the year then ended, the changes in its net assets for each of the years in the two-year period then ended, and the financial highlights for each of the years in the five-year period then ended, in conformity with U.S. generally accepted accounting principles.
Basis for Opinion
These financial statements and financial highlights are the responsibility of the Portfolio’s management. Our responsibility is to express an opinion on these financial statements and financial highlights based on our audits. We are a public accounting firm registered with the Public Company Accounting Oversight Board (United States) (PCAOB) and are required to be independent with respect to the Portfolio in accordance with the U.S. federal securities laws and the applicable rules and regulations of the Securities and Exchange Commission and the PCAOB.
We conducted our audits in accordance with the standards of the PCAOB. Those standards require that we plan and perform the audit to obtain reasonable assurance about whether the financial statements and financial highlights are free of material misstatement, whether due to error or fraud. Our audits included performing procedures to assess the risks of material misstatement of the financial statements and financial highlights, whether due to error or fraud, and performing procedures that respond to those risks. Such procedures included examining, on a test basis, evidence regarding the amounts and disclosures in the financial statements and financial highlights. Such procedures also included confirmation of securities owned as of May 31, 2020, by correspondence with the custodian, transfer agent and brokers, or by other appropriate auditing procedures. Our audits also included evaluating the accounting principles used and significant estimates made by management, as well as evaluating the overall presentation of the financial statements and financial highlights. We believe that our audits provide a reasonable basis for our opinion.

We have not been able to determine the specific year that we began serving as the auditor of one or more Wells Fargo Funds investment companies; however we are aware that we have served as the auditor of one or more Wells Fargo Funds investment companies since at least 1955.
Boston, Massachusetts
July 29, 2020
18 | Wells Fargo Diversified Large Cap Growth Portfolio
Other information (unaudited)
PROXY VOTING INFORMATION
A description of the policies and procedures used to determine how to vote proxies relating to portfolio securities is available, upon request, by calling 1-800-222-8222, visiting our website at wfam.com, or visiting the SEC website at sec.gov. Information regarding how the proxies related to portfolio securities were voted during the most recent 12-month period ended June 30 is available on the website at wfam.com or by visiting the SEC website at sec.gov.
QUARTERLY PORTFOLIO HOLDINGS INFORMATION
The Portfolio files its complete schedule of portfolio holdings with the SEC for the first and third quarters of each fiscal year as an exhibit to its reports on Form N-PORT. Shareholders may view the filed Form N-PORT by visiting the SEC website at sec.gov.
Wells Fargo Diversified Large Cap Growth Portfolio | 19
Other information (unaudited)
BOARD OF TRUSTEES AND OFFICERS
Each of the Trustees and Officers1 listed in the table below acts in identical capacities for each fund in the Wells Fargo family of funds, which consists of 147 mutual funds comprising the Wells Fargo Funds Trust, Wells Fargo Variable Trust, Wells Fargo Master Trust and four closed-end funds (collectively the “Fund Complex”). This table should be read in conjunction with the Prospectus and the Statement of Additional Information2. The mailing address of each Trustee and Officer is 525 Market Street, 12th Floor, San Francisco, CA 94105. Each Trustee and Officer serves an indefinite term, however, each Trustee serves such term until reaching the mandatory retirement age established by the Trustees.
Independent Trustees
| | | | | | |
Name and year of birth | | Position held and length of service* | | Principal occupations during past five years or longer | | Current other public company or investment company directorships |
| | | |
William R. Ebsworth (Born 1957) | | Trustee, since 2015 | | Retired. From 1984 to 2013, equities analyst, portfolio manager, research director and chief investment officer at Fidelity Management and Research Company in Boston, Tokyo, and Hong Kong, and retired in 2013 as Chief Investment Officer of Fidelity Strategic Advisers, Inc. where he led a team of investment professionals managing client assets. Prior thereto, Board member of Hong Kong Securities Clearing Co., Hong Kong Options Clearing Corp., the Thailand International Fund, Ltd., Fidelity Investments Life Insurance Company, and Empire Fidelity Investments Life Insurance Company. Audit Committee Chair and Investment Committee Chair of the Vincent Memorial Hospital Endowment (non-profit organization). Mr. Ebsworth is a CFA® charterholder. | | N/A |
| | | |
Jane A. Freeman (Born 1953) | | Trustee, since 2015; Chair Liaison, since 2018 | | Retired. From 2012 to 2014 and 1999 to 2008, Chief Financial Officer of Scientific Learning Corporation. From 2008 to 2012, Ms. Freeman provided consulting services related to strategic business projects. Prior to 1999, Portfolio Manager at Rockefeller & Co. and Scudder, Stevens & Clark. Board member of the Harding Loevner Funds from 1996 to 2014, serving as both Lead Independent Director and chair of the Audit Committee. Board member of the Russell Exchange Traded Funds Trust from 2011 to 2012 and the chair of the Audit Committee. Ms. Freeman is also an inactive Chartered Financial Analyst. | | N/A |
| | | |
Isaiah Harris, Jr. (Born 1952) | | Trustee, since 2009; Audit Committee Chairman, since 2019 | | Retired. Chairman of the Board of CIGNA Corporation since 2009, and Director since 2005. From 2003 to 2011, Director of Deluxe Corporation. Prior thereto, President and CEO of BellSouth Advertising and Publishing Corp. from 2005 to 2007, President and CEO of BellSouth Enterprises from 2004 to 2005 and President of BellSouth Consumer Services from 2000 to 2003. Emeritus member of the Iowa State University Foundation Board of Governors. Emeritus Member of the Advisory Board of Iowa State University School of Business. Advisory Board Member, Palm Harbor Academy (private school). Advisory Board Member, Child Evangelism Fellowship (non-profit). Mr. Harris is a certified public accountant (inactive status). | | CIGNA Corporation |
| | | |
Judith M. Johnson (Born 1949) | | Trustee, since 2008; Audit Committee Chairman, from 2009 to 2018 | | Retired. Prior thereto, Chief Executive Officer and Chief Investment Officer of Minneapolis Employees Retirement Fund from 1996 to 2008. Ms. Johnson is an attorney, certified public accountant and a certified managerial accountant. | | N/A |
20 | Wells Fargo Diversified Large Cap Growth Portfolio
Other information (unaudited)
| | | | | | |
Name and year of birth | | Position held and length of service* | | Principal occupations during past five years or longer | | Current other public company or investment company directorships |
| | | |
David F. Larcker (Born 1950) | | Trustee, since 2009 | | James Irvin Miller Professor of Accounting at the Graduate School of Business, Stanford University, Director of the Corporate Governance Research Initiative and Senior Faculty of The Rock Center for Corporate Governance since 2006. From 2005 to 2008, Professor of Accounting at the Graduate School of Business, Stanford University. Prior thereto, Ernst & Young Professor of Accounting at The Wharton School, University of Pennsylvania from 1985 to 2005. | | N/A |
| | | |
Olivia S. Mitchell (Born 1953) | | Trustee, since 2006; Nominating and Governance Committee Chair, since 2018 | | International Foundation of Employee Benefit Plans Professor, Wharton School of the University of Pennsylvania since 1993. Director of Wharton’s Pension Research Council and Boettner Center on Pensions & Retirement Research, and Research Associate at the National Bureau of Economic Research. Previously, Cornell University Professor from 1978 to 1993. | | N/A |
| | | |
Timothy J. Penny (Born 1951) | | Trustee, since 1996; Chairman, since 2018 | | President and Chief Executive Officer of Southern Minnesota Initiative Foundation, a non-profit organization, since 2007. Member of the Board of Trustees of NorthStar Education Finance, Inc., a non-profit organization, since 2007. | | N/A |
| | | |
James G. Polisson (Born 1959) | | Trustee, since 2018 | | Retired. Chief Marketing Officer, Source (ETF) UK Services, Ltd, from 2015 to 2017. From 2012 to 2015, Principal of The Polisson Group, LLC, a management consulting, corporate advisory and principal investing company. Chief Executive Officer and Managing Director at Russell Investments, Global Exchange Traded Funds from 2010 to 2012. Managing Director of Barclays Global Investors from 1998 to 2010 and Global Chief Marketing Officer for iShares and Barclays Global Investors from 2000 to 2010. Trustee of the San Francisco Mechanics’ Institute, a non-profit organization, from 2013 to 2015. Board member of the Russell Exchange Traded Fund Trust from 2011 to 2012. Director of Barclays Global Investors Holdings Deutschland GmbH from 2006 to 2009. Mr. Polisson is an attorney and has a retired status with the Massachusetts and District of Columbia Bar Associations. | | N/A |
| | | |
Pamela Wheelock (Born 1959) | | Trustee, since January 2020; previously Trustee from January 2018 to July 2019 | | Board member of the Destination Medical Center Economic Development Agency, Rochester, Minnesota since 2019 and Interim President of the McKnight Foundation since 2020. Acting Commissioner, Minnesota Department of Human Services, July 2019 through September 2019. Human Services Manager (part-time), Minnesota Department of Human Services, October 2019 through December 2019. Chief Operating Officer, Twin Cities Habitat for Humanity from 2017 to 2019. Vice President of University Services, University of Minnesota from 2012 to 2016. Prior thereto, on the Board of Directors, Governance Committee and Finance Committee for the Minnesota Philanthropy Partners (Saint Paul Foundation) from 2012 to 2018, Interim Chief Executive Officer of Blue Cross Blue Shield of Minnesota from 2011 to 2012, Chairman of the Board from 2009 to 2012 and Board Director from 2003 to 2015. Vice President, Leadership and Community Engagement, Bush Foundation, Saint Paul, Minnesota (a private foundation) from 2009 to 2011. Executive Vice President and Chief Financial Officer, Minnesota Sports and Entertainment from 2004 to 2009 and Senior Vice President from 2002 to 2004. Executive Vice President of the Minnesota Wild Foundation from 2004 to 2008. Commissioner of Finance, State of Minnesota, from 1999 to 2002. Currently Board Chair of the Minnesota Wild Foundation since 2010. | | N/A |
| * | Length of service dates reflect the Trustee’s commencement of service with the Trust’s predecessor entities, where applicable. |
Wells Fargo Diversified Large Cap Growth Portfolio | 21
Other information (unaudited)
Officers
| | | | |
Name and year of birth | | Position held and length of service | | Principal occupations during past five years or longer |
| | |
Andrew Owen (Born 1960) | | President, since 2017 | | Executive Vice President of Wells Fargo & Company and Head of Affiliated Managers, Wells Fargo Asset Management, since 2014. In addition, Mr. Owen is currently President, Chief Executive Officer and Director of Wells Fargo Funds Management, LLC since 2017. Prior thereto, Executive Vice President responsible for marketing, investments and product development for Wells Fargo Funds Management, LLC, from 2009 to 2014. |
| | |
Nancy Wiser1 (Born 1967) | | Treasurer, since 2012 | | Executive Vice President of Wells Fargo Funds Management, LLC since 2011. Chief Operating Officer and Chief Compliance Officer at LightBox Capital Management LLC, from 2008 to 2011. |
| | |
Michelle Rhee (Born 1966) | | Chief Legal Officer, since 2019 | | Secretary of Wells Fargo Funds Management, LLC, Chief Legal Counsel of Wells Fargo Asset Management and Assistant General Counsel of Wells Fargo Bank, N.A. since 2018. Associate General Counsel and Managing Director of Bank of America Corporation from 2004 to 2018. |
| | |
Catherine Kennedy (Born 1969) | | Secretary, since 2019 | | Vice President of Wells Fargo Funds Management, LLC and Senior Counsel of the Wells Fargo Legal Department since 2010. Vice President and Senior Counsel of Evergreen Investment Management Company, LLC from 1998 to 2010. |
| | |
Michael H. Whitaker (Born 1967) | | Chief Compliance Officer, since 2016 | | Chief Compliance Officer of Wells Fargo Asset Management since 2016. Senior Vice President and Chief Compliance Officer for Fidelity Investments from 2007 to 2016. |
| | |
David Berardi (Born 1975) | | Assistant Treasurer, since 2009 | | Vice President of Wells Fargo Funds Management, LLC since 2009. Vice President of Evergreen Investment Management Company, LLC from 2008 to 2010. Manager of Fund Reporting and Control for Evergreen Investment Management Company, LLC from 2004 to 2010. |
| | |
Jeremy DePalma1 (Born 1974) | | Treasurer, since 2012 | | Senior Vice President of Wells Fargo Funds Management, LLC since 2009. Senior Vice President of Evergreen Investment Management Company, LLC from 2008 to 2010 and head of the Fund Reporting and Control Team within Fund Administration from 2005 to 2010. |
| 1 | Nancy Wiser acts as Treasurer of 65 funds in the Fund Complex. Jeremy DePalma acts as the Treasurer of 82 funds in the Fund Complex. |
| 2 | The Statement of Additional Information includes additional information about the Trustees and is available, without charge, upon request, by calling 1-800-222-8222 or by visiting the website at wfam.com. |
22 | Wells Fargo Diversified Large Cap Growth Portfolio
Other information (unaudited)
BOARD CONSIDERATION OF INVESTMENT ADVISORY AND SUB-ADVISORY AGREEMENTS:
Wells Fargo Diversified Large Cap Growth Portfolio
Under the Investment Company Act of 1940 (the “1940 Act”), the Board of Trustees (the “Board”) of Wells Fargo Master Trust (the “Trust”) must determine annually whether to approve the continuation of the Trust’s investment advisory and sub-advisory agreements. In this regard, at a Board meeting held on May 26, 2020 and May 28, 2020 (together, the “Meeting”), the Board, all the members of which have no direct or indirect interest in the investment advisory and sub-advisory agreements and are not “interested persons” of the Trust, as defined in the 1940 Act (the “Independent Trustees”), reviewed and approved for the Wells Fargo Diversified Large Cap Growth Portfolio (the “Portfolio”): (i) an investment advisory agreement (the “Advisory Agreement”) with Wells Fargo Funds Management, LLC (“Funds Management”); and (ii) an investment sub-advisory agreement (the “Sub-Advisory Agreement”) with Wells Capital Management Incorporated (the “Sub-Adviser”), an affiliate of Funds Management. The Advisory Agreement and the Sub-Advisory Agreement are collectively referred to as the “Advisory Agreements.”
At the Meeting, the Board considered the factors and reached the conclusions described below relating to the selection of Funds Management and the Sub-Adviser and the approval of the Advisory Agreements. Prior to the Meeting, including at a Board meeting held in April 2020, the Trustees conferred extensively among themselves and with representatives of Funds Management about these matters. Also, the Board has adopted a team-based approach, with each team consisting of a sub-set of Trustees, to assist the full Board in the discharge of its duties in reviewing investment performance and other matters throughout the year. The Independent Trustees were assisted in their evaluation of the Advisory Agreements by independent legal counsel, from whom they received separate legal advice and with whom they met separately.
In providing information to the Board, Funds Management and the Sub-Adviser were guided by a detailed set of requests for information submitted to them by independent legal counsel on behalf of the Independent Trustees at the start of the Board’s annual contract renewal process earlier in 2020. In considering and approving the Advisory Agreements, the Trustees considered the information they believed relevant, including but not limited to the information discussed below. The Board considered not only the specific information presented in connection with the Meeting, but also the knowledge gained over time through interaction with Funds Management and the Sub-Adviser about various topics. In this regard, the Board reviewed reports of Funds Management at each of its quarterly meetings, which included, among other things, portfolio reviews and investment performance reports. In addition, the Board and the teams mentioned above confer with portfolio managers at various times throughout the year. The Board did not identify any particular information or consideration that was all-important or controlling, and each individual Trustee may have attributed different weights to various factors.
After its deliberations, the Board unanimously approved the continuation of the Advisory Agreements for a one-year term and determined that the compensation payable to Funds Management and the Sub-Adviser under each of the Advisory Agreements was reasonable. The Board considered the approval of the Advisory Agreements for the Portfolio as part of its consideration of agreements for funds across the complex, but its approvals were made on a portfolio-by-portfolio basis. The following summarizes a number of important, but not necessarily all, factors considered by the Board in support of its approvals.
Nature, extent and quality of services
The Board received and considered various information regarding the nature, extent and quality of services provided to the Portfolio by Funds Management and the Sub-Adviser under the Advisory Agreements. This information included a description of the investment advisory services and Portfolio-level administrative services covered by the Advisory Agreement, as well as, among other things, a summary of the background and experience of senior management of Wells Fargo Asset Management (“WFAM”), of which Funds Management and the Sub-Adviser are a part, and a summary of investments made in the business of WFAM. The Board also received a description of Funds Management’s and the Sub-Adviser’s business continuity plans and of their approaches to data privacy and cybersecurity, and related testing. The Board also received and reviewed information about Funds Management’s role as administrator of the Portfolio’s liquidity risk management program, Funds Management’s approach to risk management, and Funds Management’s intermediary and vendor oversight program.
The Board also considered the qualifications, background, tenure and responsibilities of each of the portfolio managers primarily responsible for the day-to-day portfolio management of the Portfolio. The Board evaluated the ability of Funds Management and the Sub-Adviser to attract and retain qualified investment professionals, including research, advisory and supervisory personnel. The Board further considered the compliance programs and compliance records of Funds Management and the Sub-Adviser. In addition, the Board took into account the full range of services provided to the Portfolio by Funds Management and its affiliates.
Wells Fargo Diversified Large Cap Growth Portfolio | 23
Other information (unaudited)
Portfolio investment performance and expenses
The Board considered the investment performance results for the Portfolio over various time periods ended December 31, 2019. The Board also considered more current results for various time periods ended March 31, 2020. The Board considered these results in comparison to the investment performance of funds in a universe that was determined by Broadridge Inc. (“Broadridge”) to be similar to the Portfolio (the “Universe”), and in comparison to the Portfolio’s benchmark index and to other comparative data. Broadridge is an independent provider of investment company data. The Board received a description of the methodology used by Broadridge to select the mutual funds in the performance Universe. The Board noted that the investment performance of the Portfolio was in range of the average investment performance of the Universe for the three-year period ended December 31, 2019, and lower than the average investment performance of the Universe for the one-, five- and ten-year periods ended December 31, 2019. The Board also noted that the investment performance of the Portfolio was lower than the average performance of the Universe for the all periods ended March 31, 2020. The Board also noted that the investment performance of the Portfolio was lower than its benchmark index, the Russell 1000® Growth Index, for all periods ended December 31, 2019. The Board also noted that the investment performance of the Portfolio was lower than its benchmark index, the Russell 1000® Growth Index, for all periods ended March 31, 2020.
The Board received information concerning, and discussed factors contributing to, the underperformance of the Portfolio relative to the Universe and benchmark for the periods identified above. The Board took note of the explanations for the relative underperformance during these periods, including with respect to investment decisions and market factors that affected the Portfolio’s investment performance.
The Board received and considered information regarding the fee rates that are payable to Funds Management for investment advisory services (as discussed below), which are the only fees charged at the Portfolio level, relative to corresponding class-specific expense groups that were determined by Broadridge to be similar to the Portfolio (the “Groups”). The Board received a description of the methodology used by Broadridge to select the mutual funds in the expense Groups and an explanation of how funds comprising expense groups and their expense ratios may vary from year-to-year.
The Board took into account the Portfolio’s investment performance and expense information provided to it among the factors considered in deciding to re-approve the Advisory Agreements.
Investment advisory and sub-advisory fee Rates
The Board reviewed and considered the contractual fee rates payable by the Portfolio to Funds Management under the Advisory Agreement (the “Advisory Agreement Rate ”). The Board also reviewed and considered the contractual investment sub-advisory fee rates that are payable by Funds Management to the Sub-Adviser for investment sub-advisory services.
The Board reviewed a comparison of the Advisory Agreement Rate of the Portfolio with those of other funds in the Portfolio’s expense Group at a common asset level. The Board noted that the Portfolio’s Advisory Agreement Rate was in range of the median rate for the Portfolio’s expense Groups.
The Board also received and considered information about the portion of the total advisory fee that was retained by Funds Management after payment of the fee to the Sub-Adviser for sub-advisory services. In assessing the reasonableness of this amount, the Board received and evaluated information about the nature and extent of responsibilities retained and risks assumed by Funds Management and not delegated to or assumed by the Sub-Adviser, and about Funds Management’s on-going oversight services. Given the affiliation between Funds Management and the Sub-Adviser, the Board ascribed limited relevance to the allocation of fees between them.
Based on its consideration of the factors and information it deemed relevant, including those described here, the Board determined that the compensation payable to Funds Management under the Advisory Agreement and to the Sub-Adviser under the Sub-Advisory Agreement was reasonable.
Profitability
The Board received and considered information concerning the profitability of Funds Management, as well as the profitability of both WFAM and Wells Fargo & Co. (“Wells Fargo”) from providing services to the fund family as a whole. The Board noted that the Sub-Adviser’s profitability information with respect to providing services to the Portfolio and other funds in the family was subsumed in the WFAM and Wells Fargo profitability analysis.
Funds Management reported on the methodologies and estimates used in calculating profitability, including a description of the methodology used to allocate certain expenses. Among other things, the Board noted that the levels of profitability reported on a fund-by-fund basis varied widely, depending on factors such as the size, type and age of fund.
24 | Wells Fargo Diversified Large Cap Growth Portfolio
Other information (unaudited)
Based on its review, the Board did not deem the profits reported by Funds Management, WFAM or Wells Fargo from services provided to the Portfolio to be at a level that would prevent it from approving the continuation of the Advisory Agreements.
Economies of scale
The Board received and considered information about the potential for Funds Management to experience economies of scale in the provision of management services to the Portfolio, the difficulties of calculating economies of scale at an individual fund level, and the extent to which potential scale benefits are shared with shareholders. The Board noted the existence of breakpoints in the Portfolio���s advisory fee structure, which operate generally to reduce the Portfolio’s expense ratios as the Portfolio grows in size, and the size of the Portfolio in relation to such breakpoints. The Board considered that in addition to management fee breakpoints, Funds Management shares potential economies of scale from its management business in a variety of ways, including through fee waiver and expense reimbursement arrangements, services that benefit shareholders, competitive management fee rates set at the outset without regard to breakpoints, and investments in the business intended to enhance services available to shareholders.
The Board concluded that Funds Management’s arrangements with respect to the Portfolio, including contractual breakpoints, constituted a reasonable approach to sharing potential economies of scale with the Portfolio and its shareholders.
Other benefits to Funds Management and the Sub-Adviser
The Board received and considered information regarding potential “fall-out” or ancillary benefits received by Funds Management and its affiliates, including the Sub-Adviser, as a result of their relationships with the Portfolio. Ancillary benefits could include, among others, benefits directly attributable to other relationships with the Portfolio and benefits potentially derived from an increase in Funds Management’s and the Sub-Adviser’s business as a result of their relationships with the Portfolio. The Board noted that various affiliates of Funds Management may receive distribution-related fees, shareholder servicing payments and sub-transfer agency fees in respect of shares sold or held through them and services provided.
The Board also reviewed information about soft dollar credits earned and utilized by the Sub-Adviser, fees earned by Funds Management and the Sub-Adviser from managing a private investment vehicle for the fund family’s securities lending collateral, and commissions earned by an affiliated broker from portfolio transactions.
Based on its consideration of the factors and information it deemed relevant, including those described here, the Board did not find that any ancillary benefits received by Funds Management and its affiliates, including the Sub-Adviser, were unreasonable.
Conclusion
At the Meeting, after considering the above-described factors and based on its deliberations and its evaluation of the information described above, the Board unanimously approved the continuation of the Advisory Agreements for a one-year term and determined that the compensation payable to Funds Management and the Sub-Adviser under each of the Advisory Agreements was reasonable.
Wells Fargo Diversified Large Cap Growth Portfolio | 25
Other information (unaudited)
LIQUIDITY RISK MANAGEMENT PROGRAM
In accordance with Rule 22e-4 under the Investment Company Act of 1940, as amended (the “Liquidity Rule”), Wells Fargo Master Trust (the “Trust”) has adopted and implemented a liquidity risk management program (the “Program”) on behalf of each of its series, including the Portfolio, which is reasonably designed to assess and manage the Portfolio’s liquidity risk. “Liquidity risk” is defined as the risk that the Portfolio is unable to meet redemption requests without significantly diluting remaining investors’ interests in the Portfolio. The Trust’s Board of Trustees (the “Board”) previously approved the designation of Wells Fargo Funds Management, LLC (“Funds Management”), the Portfolio’s investment adviser, as the administrator of the Program, and Funds Management has established a Liquidity Risk Management Council composed of personnel from multiple departments within Funds Management and its affiliates to assist Funds Management in the implementation and on-going administration of the Program.
The Program is comprised of various components designed to support the assessment and/or management of liquidity risk, including: (1) the periodic assessment (no less frequently than annually) of certain factors that influence the Portfolio’s liquidity risk; (2) the periodic classification (no less frequently than monthly) of the Portfolio’s investments into one of four liquidity categories that reflect an estimate of their liquidity under current market conditions; (3) a 15% limit on the acquisition of “illiquid investments” (as defined under the Liquidity Rule); (4) to the extent the Portfolio does not invest primarily in “highly liquid investments” (as defined under the Liquidity Rule), the determination of a minimum percentage of the Portfolio’s assets that generally will be invested in highly liquid investments (an “HLIM”); (5) if the Portfolio has established an HLIM, the periodic review (no less frequently than annually) of the HLIM and the adoption of policies and procedures for responding to a shortfall of the Portfolio’s “highly liquid investments” below its HLIM; and (6) periodic reporting to the Board.
At a meeting of the Board held on May 26 and 28, 2020, the Board received a written report (the “Report”) from Funds Management that addressed the operation of the Program and assessed its adequacy and effectiveness of implementation. The Report covered the initial period from December 1, 2018 through December 31, 2019 (the “Reporting Period”). No significant liquidity events impacting the Portfolio were noted in the Report. There were no material changes to the Program during the Reporting Period. The Report concluded that the Program is operating effectively to assess and manage the Portfolio’s liquidity risk, and that the Program has been and continues to be adequately and effectively implemented to monitor and, as applicable, respond to the Portfolio’s liquidity developments.
26 | Wells Fargo Diversified Large Cap Growth Portfolio
This page is intentionally left blank.
This page is intentionally left blank.

For more information
More information about Wells Fargo Funds is available free upon request. To obtain literature, please write, visit the Fund’s website, or call:
Wells Fargo Funds
P.O. Box 219967
Kansas City, MO 64121-9967
Website: wfam.com
Individual investors: 1-800-222-8222
Retail investment professionals: 1-888-877-9275
Institutional investment professionals: 1-866-765-0778

This report and the financial statements contained herein are submitted for the general information of the shareholders of the Fund. If this report is used for promotional purposes, distribution of the report must be accompanied or preceded by a current prospectus. Before investing, please consider the investment objectives, risks, charges, and expenses of the investment. For a current prospectus and, if available, a summary prospectus, containing this information, call 1-800-222-8222 or visit the Fund’s website at wfam.com. Read the prospectus carefully before you invest or send money.
Wells Fargo Asset Management (WFAM) is the trade name for certain investment advisory/management firms owned by Wells Fargo & Company. These firms include but are not limited to Wells Capital Management Incorporated and Wells Fargo Funds Management, LLC. Certain products managed by WFAM entities are distributed by Wells Fargo Funds Distributor, LLC (a broker-dealer and Member FINRA).
This material is for general informational and educational purposes only and is NOT intended to provide investment advice or a recommendation of any kind—including a recommendation for any specific investment, strategy, or plan.
INVESTMENT PRODUCTS: NOT FDIC INSURED ◾ NO BANK GUARANTEE ◾ MAY LOSE VALUE
© 2020 Wells Fargo & Company. All rights reserved.
Annual Report
May 31, 2020
Wells Fargo
Disciplined Large Cap Portfolio
|
|
|
Reduce clutter. Save trees. |
Sign up for electronic delivery of prospectuses and
shareholder reports at wellsfargo.com/
advantagedelivery |
INVESTMENT PRODUCTS: NOT FDIC INSURED ◾ NO BANK GUARANTEE ◾ MAY LOSE VALUE
Wells Fargo Disciplined Large Cap Portfolio | 1
Fund information (unaudited)
Investment objective
The Portfolio seeks long-term capital appreciation.
Manager
Wells Fargo Funds Management, LLC
Subadviser
Wells Capital Management Incorporated
Portfolio managers
Justin P. Carr, CFA®‡
Robert M. Wicentowski, CFA®‡*
| | | | |
|
| Ten largest holdings (%) as of May 31, 20201 | |
| | |
Microsoft Corporation | | | 5.34 | |
| | |
Apple Incorporation | | | 5.08 | |
| | |
Amazon.com Incorporated | | | 3.51 | |
| | |
Johnson & Johnson | | | 1.72 | |
| | |
Alphabet Incorporated Class C | | | 1.71 | |
| | |
Alphabet Incorporated Class A | | | 1.68 | |
| | |
VISA Incorporated | | | 1.63 | |
| | |
Facebook Incorporated Class A | | | 1.57 | |
| | |
Berkshire Hathaway Incorporated Class B | | | 1.46 | |
| | |
Intel Corporation | | | 1.41 | |
|
|
| Sector allocation as of May 31, 20202 |
|
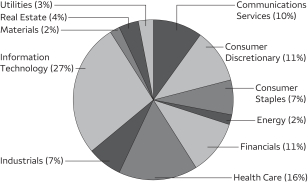 |
| ‡ | CFA® and Chartered Financial Analyst® are trademarks owned by CFA Institute. |
| * | Mr. Wicentowski became a portfolio manager on July 1, 2019. |
| 1 | The ten largest holdings, excluding cash, cash equivalents and any money market funds, are calculated based on the value of the investments divided by the total net assets of the Portfolio. Holdings are subject to change and may have changed since the date specified. |
| 2 | Amounts are calculated based on the total long-term investments of the Portfolio. These amounts are subject to change and may have changed since the date specified. |
2 | Wells Fargo Disciplined Large Cap Portfolio
Portfolio of investments—May 31, 2020
| | | | | | | | | | | | | | | | |
| | | | | | | | | Shares | | | Value | |
| Common Stocks: 96.43% | |
|
Communication Services: 9.96% | |
|
| Diversified Telecommunication Services: 2.12% | |
AT&T Incorporated | | | | | | | | | | | 82,958 | | | $ | 2,560,084 | |
Verizon Communications Incorporated | | | | | | | | | | | 49,212 | | | | 2,823,785 | |
| |
| | | | 5,383,869 | |
| | | | | |
|
| Entertainment: 1.71% | |
Activision Blizzard Incorporated | | | | | | | | | | | 8,345 | | | | 600,673 | |
Lions Gate Entertainment Class B † | | | | | | | | | | | 49,042 | | | | 369,286 | |
Netflix Incorporated † | | | | | | | | | | | 3,203 | | | | 1,344,395 | |
Take-Two Interactive Software Incorporated † | | | | | | | | | | | 4,742 | | | | 645,718 | |
The Walt Disney Company | | | | | | | | | | | 11,777 | | | | 1,381,442 | |
| |
| | | | 4,341,514 | |
| | | | | |
|
| Interactive Media & Services: 4.96% | |
Alphabet Incorporated Class A † | | | | | | | | | | | 2,977 | | | | 4,267,589 | |
Alphabet Incorporated Class C † | | | | | | | | | | | 3,035 | | | | 4,336,772 | |
Facebook Incorporated Class A † | | | | | | | | | | | 17,686 | | | | 3,980,942 | |
| |
| | | | 12,585,303 | |
| | | | | |
|
| Media: 1.05% | |
Cable One Incorporated | | | | | | | | | | | 146 | | | | 275,486 | |
Comcast Corporation Class A | | | | | | | | | | | 37,679 | | | | 1,492,088 | |
Discovery Communications Incorporated Class A † | | | | | | | | | | | 41,262 | | | | 897,449 | |
| |
| | | | 2,665,023 | |
| | | | | |
|
| Wireless Telecommunication Services: 0.12% | |
Telephone & Data Systems Incorporated | | | | | | | | | | | 13,977 | | | | 286,389 | |
| | | | | | | | | | | | | | | | |
|
Consumer Discretionary: 10.62% | |
|
| Automobiles: 0.63% | |
Ford Motor Company | | | | | | | | | | | 52,754 | | | | 301,225 | |
General Motors Company | | | | | | | | | | | 16,668 | | | | 431,368 | |
Tesla Motors Incorporated † | | | | | | | | | | | 1,043 | | | | 870,905 | |
| |
| | | | 1,603,498 | |
| | | | | |
|
| Hotels, Restaurants & Leisure: 1.33% | |
Chipotle Mexican Grill Incorporated † | | | | | | | | | | | 313 | | | | 314,224 | |
Domino’s Pizza Incorporated | | | | | | | | | | | 667 | | | | 257,355 | |
McDonald’s Corporation | | | | | | | | | | | 5,983 | | | | 1,114,753 | |
Starbucks Corporation | | | | | | | | | | | 21,603 | | | | 1,684,818 | |
| |
| | | | 3,371,150 | |
| | | | | |
|
| Household Durables: 1.37% | |
D.R. Horton Incorporated | | | | | | | | | | | 12,617 | | | | 697,720 | |
Garmin Limited | | | | | | | | | | | 4,306 | | | | 388,272 | |
Lennar Corporation Class A | | | | | | | | | | | 6,985 | | | | 422,313 | |
Lennar Corporation Class B | | | | | | | | | | | 10,138 | | | | 454,993 | |
NVR Incorporated † | | | | | | | | | | | 366 | | | | 1,179,109 | |
Pulte Group Incorporated | | | | | | | | | | | 10,101 | | | | 343,131 | |
| |
| | | | 3,485,538 | |
| | | | | |
The accompanying notes are an integral part of these financial statements.
Wells Fargo Disciplined Large Cap Portfolio | 3
Portfolio of investments—May 31, 2020
| | | | | | | | | | | | | | | | |
| | | | | | | | | Shares | | | Value | |
| Internet & Direct Marketing Retail: 3.51% | |
Amazon.com Incorporated † | | | | | | | | | | | 3,649 | | | $ | 8,912,208 | |
| | | | | | | | | | | | | | | | |
|
| Multiline Retail: 0.55% | |
Target Corporation | | | | | | | | | | | 11,463 | | | | 1,402,269 | |
| | | | | | | | | | | | | | | | |
|
| Specialty Retail: 2.29% | |
AutoZone Incorporated † | | | | | | | | | | | 967 | | | | 1,109,981 | |
Best Buy Company Incorporated | | | | | | | | | | | 13,890 | | | | 1,084,670 | |
The Home Depot Incorporated | | | | | | | | | | | 13,192 | | | | 3,277,948 | |
The TJX Companies Incorporated | | | | | | | | | | | 6,454 | | | | 340,513 | |
| |
| | | | 5,813,112 | |
| | | | | |
|
| Textiles, Apparel & Luxury Goods: 0.94% | |
lululemon athletica Incorporated † | | | | | | | | | | | 1,051 | | | | 315,400 | |
Nike Incorporated Class B | | | | | | | | | | | 20,842 | | | | 2,054,604 | |
| |
| | | | 2,370,004 | |
| | | | | |
|
Consumer Staples: 6.57% | |
|
| Beverages: 1.00% | |
Monster Beverage Corporation † | | | | | | | | | | | 3,969 | | | | 285,411 | |
PepsiCo Incorporated | | | | | | | | | | | 7,087 | | | | 932,295 | |
The Coca-Cola Company | | | | | | | | | | | 28,313 | | | | 1,321,651 | |
| |
| | | | 2,539,357 | |
| | | | | |
|
| Food & Staples Retailing: 2.18% | |
Costco Wholesale Corporation | | | | | | | | | | | 6,799 | | | | 2,097,288 | |
Sysco Corporation | | | | | | | | | | | 7,121 | | | | 392,794 | |
The Kroger Company | | | | | | | | | | | 30,682 | | | | 1,000,847 | |
Walgreens Boots Alliance Incorporated | | | | | | | | | | | 16,526 | | | | 709,626 | |
Walmart Incorporated | | | | | | | | | | | 10,714 | | | | 1,329,179 | |
| |
| | | | 5,529,734 | |
| | | | | |
|
| Food Products: 0.81% | |
General Mills Incorporated | | | | | | | | | | | 5,925 | | | | 373,512 | |
Pilgrim’s Pride Corporation † | | | | | | | | | | | 33,637 | | | | 695,277 | |
The Hershey Company | | | | | | | | | | | 2,088 | | | | 283,300 | |
Tyson Foods Incorporated Class A | | | | | | | | | | | 11,197 | | | | 687,944 | |
| |
| | | | 2,040,033 | |
| | | | | |
|
| Household Products: 1.53% | |
Kimberly-Clark Corporation | | | | | | | | | | | 3,192 | | | | 451,476 | |
The Procter & Gamble Company | | | | | | | | | | | 29,579 | | | | 3,428,798 | |
| |
| | | | 3,880,274 | |
| | | | | |
|
| Personal Products: 0.26% | |
The Estee Lauder Companies Incorporated Class A | | | | | | | | | | | 3,355 | | | | 662,512 | |
| | | | | | | | | | | | | | | | |
|
| Tobacco: 0.79% | |
Altria Group Incorporated | | | | | | | | | | | 20,094 | | | | 784,671 | |
Philip Morris International Incorporated | | | | | | | | | | | 16,752 | | | | 1,228,927 | |
| |
| | | | 2,013,598 | |
| | | | | |
The accompanying notes are an integral part of these financial statements.
4 | Wells Fargo Disciplined Large Cap Portfolio
Portfolio of investments—May 31, 2020
| | | | | | | | | | | | | | | | |
| | | | | | | | | Shares | | | Value | |
| Energy: 2.41% | |
|
| Oil, Gas & Consumable Fuels: 2.41% | |
Chevron Corporation | | | | | | | | | | | 21,259 | | | $ | 1,949,450 | |
ConocoPhillips | | | | | | | | | | | 11,233 | | | | 473,808 | |
Exxon Mobil Corporation | | | | | | | | | | | 45,067 | | | | 2,049,196 | |
Kinder Morgan Incorporated | | | | | | | | | | | 15,704 | | | | 248,123 | |
Marathon Petroleum Corporation | | | | | | | | | | | 18,737 | | | | 658,418 | |
Phillips 66 | | | | | | | | | | | 5,180 | | | | 405,387 | |
Valero Energy Corporation | | | | | | | | | | | 5,125 | | | | 341,530 | |
| |
| | | | 6,125,912 | |
| | | | | |
|
Financials: 10.39% | |
|
| Banks: 3.21% | |
Bank of America Corporation | | | | | | | | | | | 47,745 | | | | 1,151,609 | |
Citigroup Incorporated | | | | | | | | | | | 28,801 | | | | 1,379,856 | |
Citizens Financial Group Incorporated | | | | | | | | | | | 18,349 | | | | 442,211 | |
Fifth Third Bancorp | | | | | | | | | | | 22,233 | | | | 431,098 | |
JPMorgan Chase & Company | | | | | | | | | | | 32,003 | | | | 3,114,212 | |
Popular Incorporated | | | | | | | | | | | 10,365 | | | | 409,314 | |
Regions Financial Corporation | | | | | | | | | | | 25,658 | | | | 290,192 | |
US Bancorp | | | | | | | | | | | 25,832 | | | | 918,586 | |
| |
| | | | 8,137,078 | |
| | | | | |
|
| Capital Markets: 2.42% | |
Ameriprise Financial Incorporated | | | | | | | | | | | 4,795 | | | | 671,636 | |
Bank of New York Mellon Corporation | | | | | | | | | | | 25,242 | | | | 938,245 | |
CME Group Incorporated | | | | | | | | | | | 2,945 | | | | 537,757 | |
Morgan Stanley | | | | | | | | | | | 19,326 | | | | 854,209 | |
Northern Trust Corporation | | | | | | | | | | | 9,932 | | | | 784,727 | |
S&P Global Incorporated | | | | | | | | | | | 916 | | | | 297,718 | |
SEI Investments Company | | | | | | | | | | | 6,871 | | | | 372,546 | |
T. Rowe Price Group Incorporated | | | | | | | | | | | 3,277 | | | | 396,189 | |
The Charles Schwab Corporation | | | | | | | | | | | 35,807 | | | | 1,285,829 | |
| |
| | | | 6,138,856 | |
| | | | | |
|
| Consumer Finance: 0.40% | |
OneMain Holdings Incorporated | | | | | | | | | | | 11,164 | | | | 260,456 | |
Synchrony Financial | | | | | | | | | | | 36,737 | | | | 748,333 | |
| |
| | | | 1,008,789 | |
| | | | | |
|
| Diversified Financial Services: 1.81% | |
Berkshire Hathaway Incorporated Class B † | | | | | | | | | | | 19,963 | | | | 3,704,734 | |
Equitable Holdings Incorporated | | | | | | | | | | | 46,832 | | | | 894,960 | |
| |
| | | | 4,599,694 | |
| | | | | |
|
| Insurance: 2.55% | |
AFLAC Incorporated | | | | | | | | | | | 22,508 | | | | 820,867 | |
Arch Capital Group Limited † | | | | | | | | | | | 10,267 | | | | 289,735 | |
Brighthouse Financial Incorporated † | | | | | | | | | | | 18,869 | | | | 560,598 | |
Everest Reinsurance Group Limited | | | | | | | | | | | 1,511 | | | | 299,798 | |
Mercury General Corporation | | | | | | | | | | | 6,720 | | | | 270,346 | |
MetLife Incorporated | | | | | | | | | | | 24,748 | | | | 891,175 | |
Prudential Financial Incorporated | | | | | | | | | | | 10,719 | | | | 653,430 | |
Reinsurance Group of America Incorporated | | | | | | | | | | | 5,361 | | | | 486,511 | |
The Allstate Corporation | | | | | | | | | | | 10,561 | | | | 1,032,971 | |
The accompanying notes are an integral part of these financial statements.
Wells Fargo Disciplined Large Cap Portfolio | 5
Portfolio of investments—May 31, 2020
| | | | | | | | | | | | | | | | |
| | | | | | | | | Shares | | | Value | |
|
| Insurance (continued) | |
The Hartford Financial Services Group Incorporated | | | | | | | | | | | 21,084 | | | $ | 807,306 | |
The Progressive Corporation | | | | | | | | | | | 4,762 | | | | 369,912 | |
| |
| | | | 6,482,649 | |
| | | | | |
|
Health Care: 15.27% | |
|
| Biotechnology: 3.37% | |
AbbVie Incorporated | | | | | | | | | | | 26,594 | | | | 2,464,470 | |
Amgen Incorporated | | | | | | | | | | | 7,915 | | | | 1,818,076 | |
Gilead Sciences Incorporated | | | | | | | | | | | 23,278 | | | | 1,811,727 | |
Regeneron Pharmaceuticals Incorporated † | | | | | | | | | | | 2,493 | | | | 1,527,735 | |
United Therapeutics Corporation † | | | | | | | | | | | 4,488 | | | | 529,360 | |
Vertex Pharmaceuticals Incorporated † | | | | | | | | | | | 1,371 | | | | 394,793 | |
| |
| | | | 8,546,161 | |
| | | | | |
|
| Health Care Equipment & Supplies: 3.29% | |
Abbott Laboratories | | | | | | | | | | | 19,808 | | | | 1,880,175 | |
Baxter International Incorporated | | | | | | | | | | | 8,967 | | | | 807,120 | |
Danaher Corporation | | | | | | | | | | | 1,888 | | | | 314,560 | |
Dentsply Sirona Incorporated | | | | | | | | | | | 6,548 | | | | 304,613 | |
Edwards Lifesciences Corporation † | | | | | | | | | | | 5,170 | | | | 1,161,802 | |
Intuitive Surgical Incorporated † | | | | | | | | | | | 1,726 | | | | 1,001,132 | |
Masimo Corporation † | | | | | | | | | | | 985 | | | | 236,587 | |
Medtronic plc | | | | | | | | | | | 23,614 | | | | 2,327,868 | |
ResMed Incorporated | | | | | | | | | | | 2,037 | | | | 327,590 | |
| |
| | | | 8,361,447 | |
| | | | | |
|
| Health Care Providers & Services: 3.45% | |
AmerisourceBergen Corporation | | | | | | | | | | | 9,166 | | | | 873,886 | |
Cardinal Health Incorporated | | | | | | | | | | | 14,176 | | | | 775,285 | |
Centene Corporation † | | | | | | | | | | | 8,739 | | | | 578,959 | |
Cigna Corporation | | | | | | | | | | | 3,143 | | | | 620,177 | |
CVS Health Corporation | | | | | | | | | | | 13,867 | | | | 909,259 | |
Humana Incorporated | | | | | | | | | | | 4,154 | | | | 1,705,840 | |
McKesson Corporation | | | | | | | | | | | 8,041 | | | | 1,275,865 | |
UnitedHealth Group Incorporated | | | | | | | | | | | 6,593 | | | | 2,009,876 | |
| |
| | | | 8,749,147 | |
| | | | | |
|
| Health Care Technology: 0.43% | |
Veeva Systems Incorporated Class A † | | | | | | | | | | | 4,991 | | | | 1,092,380 | |
| | | | | | | | | | | | | | | | |
|
| Life Sciences Tools & Services: 0.32% | |
Adaptive Biotechnologies Corporation † | | | | | | | | | | | 5,571 | | | | 215,598 | |
Thermo Fisher Scientific Incorporated | | | | | | | | | | | 1,676 | | | | 585,242 | |
| |
| | | | 800,840 | |
| | | | | |
|
| Pharmaceuticals: 4.41% | |
Bristol-Myers Squibb Company | | | | | | | | | | | 36,838 | | | | 2,199,965 | |
Eli Lilly & Company | | | | | | | | | | | 5,082 | | | | 777,292 | |
Johnson & Johnson | | | | | | | | | | | 29,265 | | | | 4,353,169 | |
Merck & Company Incorporated | | | | | | | | | | | 28,949 | | | | 2,336,763 | |
Pfizer Incorporated | | | | | | | | | | | 40,255 | | | | 1,537,338 | |
| |
| | | | 11,204,527 | |
| | | | | |
The accompanying notes are an integral part of these financial statements.
6 | Wells Fargo Disciplined Large Cap Portfolio
Portfolio of investments—May 31, 2020
| | | | | | | | | | | | | | | | |
| | | | | | | | | Shares | | | Value | |
| Industrials: 7.26% | |
|
| Aerospace & Defense: 1.37% | |
Howmet Aerospace Incorporated | | | | | | | | | | | 16,648 | | | $ | 217,756 | |
Lockheed Martin Corporation | | | | | | | | | | | 5,235 | | | | 2,033,483 | |
Raytheon Technologies Corporation | | | | | | | | | | | 18,906 | | | | 1,219,815 | |
| |
| | | | 3,471,054 | |
| | | | | |
|
| Air Freight & Logistics: 0.61% | |
Expeditors International of Washington Incorporated | | | | | | | | | | | 8,896 | | | | 679,388 | |
United Parcel Service Incorporated Class B | | | | | | | | | | | 8,812 | | | | 878,645 | |
| |
| | | | 1,558,033 | |
| | | | | |
|
| Airlines: 0.25% | |
Delta Air Lines Incorporated | | | | | | | | | | | 25,500 | | | | 642,855 | |
| | | | | | | | | | | | | | | | |
|
| Commercial Services & Supplies: 0.60% | |
Copart Incorporated † | | | | | | | | | | | 7,341 | | | | 656,212 | |
Waste Management Incorporated | | | | | | | | | | | 8,056 | | | | 859,978 | |
| |
| | | | 1,516,190 | |
| | | | | |
|
| Construction & Engineering: 0.51% | |
AECOM Technology Corporation † | | | | | | | | | | | 7,100 | | | | 275,267 | |
Quanta Services Incorporated | | | | | | | | | | | 27,684 | | | | 1,022,370 | |
| |
| | | | 1,297,637 | |
| | | | | |
|
| Electrical Equipment: 0.77% | |
AMETEK Incorporated | | | | | | | | | | | 3,783 | | | | 346,939 | |
Eaton Corporation plc | | | | | | | | | | | 11,499 | | | | 976,265 | |
Rockwell Automation Incorporated | | | | | | | | | | | 2,964 | | | | 640,698 | |
| |
| | | | 1,963,902 | |
| | | | | |
|
| Industrial Conglomerates: 0.49% | |
Carlisle Companies Incorporated | | | | | | | | | | | 2,553 | | | | 306,003 | |
Honeywell International Incorporated | | | | | | | | | | | 6,348 | | | | 925,856 | |
| |
| | | | 1,231,859 | |
| | | | | |
|
| Machinery: 1.28% | |
Allison Transmission Holdings Incorporated | | | | | | | | | | | 11,712 | | | | 441,777 | |
Cummins Incorporated | | | | | | | | | | | 7,355 | | | | 1,247,408 | |
Illinois Tool Works Incorporated | | | | | | | | | | | 1,591 | | | | 274,384 | |
ITT Incorporated | | | | | | | | | | | 4,293 | | | | 247,706 | |
Oshkosh Corporation | | | | | | | | | | | 14,504 | | | | 1,041,677 | |
| |
| | | | 3,252,952 | |
| | | | | |
|
| Professional Services: 0.22% | |
Manpower Incorporated | | | | | | | | | | | 8,213 | | | | 567,847 | |
| | | | | | | | | | | | | | | | |
|
| Road & Rail: 0.47% | |
Kansas City Southern | | | | | | | | | | | 1,613 | | | | 242,789 | |
Schneider National Incorporated Class B | | | | | | | | | | | 38,866 | | | | 939,391 | |
| |
| | | | 1,182,180 | |
| | | | | |
The accompanying notes are an integral part of these financial statements.
Wells Fargo Disciplined Large Cap Portfolio | 7
Portfolio of investments—May 31, 2020
| | | | | | | | | | | | | | | | |
| | | | | | | | | Shares | | | Value | |
| Trading Companies & Distributors: 0.69% | |
W.W. Grainger Incorporated | | | | | | | | | | | 3,345 | | | $ | 1,035,679 | |
WESCO International Incorporated † | | | | | | | | | | | 21,040 | | | | 700,632 | |
| |
| | | | 1,736,311 | |
| | | | | |
|
Information Technology: 25.74% | |
|
| Communications Equipment: 1.03% | |
Cisco Systems Incorporated | | | | | | | | | | | 54,528 | | | | 2,607,529 | |
| | | | | | | | | | | | | | | | |
|
| IT Services: 5.33% | |
Accenture plc Class A | | | | | | | | | | | 7,882 | | | | 1,589,169 | |
Amdocs Limited | | | | | | | | | | | 9,751 | | | | 607,097 | |
Cognizant Technology Solutions Corporation Class A | | | | | | | | | | | 13,691 | | | | 725,623 | |
FleetCor Technologies Incorporated † | | | | | | | | | | | 1,319 | | | | 321,559 | |
International Business Machines Corporation | | | | | | | | | | | 8,798 | | | | 1,098,870 | |
Jack Henry & Associates Incorporated | | | | | | | | | | | 2,803 | | | | 506,951 | |
Leidos Holdings Incorporated | | | | | | | | | | | 2,975 | | | | 313,238 | |
MasterCard Incorporated Class A | | | | | | | | | | | 10,211 | | | | 3,072,388 | |
Paychex Incorporated | | | | | | | | | | | 4,258 | | | | 307,768 | |
PayPal Holdings Incorporated † | | | | | | | | | | | 3,647 | | | | 565,321 | |
VeriSign Incorporated † | | | | | | | | | | | 1,216 | | | | 266,316 | |
Visa Incorporated Class A | | | | | | | | | | | 21,228 | | | | 4,144,555 | |
| |
| | | | 13,518,855 | |
| | | | | |
|
| Semiconductors & Semiconductor Equipment: 4.70% | |
Applied Materials Incorporated | | | | | | | | | | | 20,433 | | | | 1,147,926 | |
Broadcom Incorporated | | | | | | | | | | | 1,867 | | | | 543,801 | |
Intel Corporation | | | | | | | | | | | 56,726 | | | | 3,569,767 | |
KLA-Tencor Corporation | | | | | | | | | | | 2,364 | | | | 415,969 | |
Lam Research Corporation | | | | | | | | | | | 4,917 | | | | 1,345,635 | |
Micron Technology Incorporated † | | | | | | | | | | | 28,988 | | | | 1,388,815 | |
NVIDIA Corporation | | | | | | | | | | | 5,490 | | | | 1,949,060 | |
QUALCOMM Incorporated | | | | | | | | | | | 16,736 | | | | 1,353,608 | |
Texas Instruments Incorporated | | | | | | | | | | | 1,913 | | | | 227,150 | |
| |
| | | | 11,941,731 | |
| | | | | |
|
| Software: 8.88% | |
Adobe Incorporated † | | | | | | | | | | | 4,309 | | | | 1,665,859 | |
Cadence Design Systems Incorporated † | | | | | | | | | | | 13,714 | | | | 1,251,951 | |
Fortinet Incorporated † | | | | | | | | | | | 6,053 | | | | 842,578 | |
Intuit Incorporated | | | | | | | | | | | 6,116 | | | | 1,775,597 | |
Microsoft Corporation | | | | | | | | | | | 73,933 | | | | 13,548,222 | |
Oracle Corporation | | | | | | | | | | | 36,050 | | | | 1,938,409 | |
Pagerduty Incorporated † | | | | | | | | | | | 13,277 | | | | 352,504 | |
Paycom Software Incorporated † | | | | | | | | | | | 1,261 | | | | 374,807 | |
Salesforce.com Incorporated † | | | | | | | | | | | 2,961 | | | | 517,553 | |
Synopsys Incorporated † | | | | | | | | | | | 1,522 | | | | 275,345 | |
| |
| | | | 22,542,825 | |
| | | | | |
|
| Technology Hardware, Storage & Peripherals: 5.80% | |
Apple Incorporated | | | | | | | | | | | 40,535 | | | | 12,887,698 | |
Dell Technologies Incorporated † | | | | | | | | | | | 17,882 | | | | 887,662 | |
HP Incorporated | | | | | | | | | | | 61,747 | | | | 934,850 | |
| |
| | | | 14,710,210 | |
| | | | | |
The accompanying notes are an integral part of these financial statements.
8 | Wells Fargo Disciplined Large Cap Portfolio
Portfolio of investments—May 31, 2020
| | | | | | | | | | | | | | | | |
| | | | | | | | | Shares | | | Value | |
| Materials: 1.88% | |
|
| Chemicals: 0.62% | |
LyondellBasell Industries NV Class A | | | | | | | | | | | 11,696 | | | $ | 745,737 | |
NewMarket Corporation | | | | | | | | | | | 1,262 | | | | 550,396 | |
Valvoline Incorporated | | | | | | | | | | | 14,655 | | | | 268,919 | |
| |
| | | | 1,565,052 | |
| | | | | |
|
| Containers & Packaging: 0.25% | |
Avery Dennison Corporation | | | | | | | | | | | 3,323 | | | | 367,756 | |
Packaging Corporation of America | | | | | | | | | | | 2,544 | | | | 257,987 | |
| |
| | | | 625,743 | |
| | | | | |
|
| Metals & Mining: 0.87% | |
Nucor Corporation | | | | | | | | | | | 17,577 | | | | 742,804 | |
Reliance Steel & Aluminum Company | | | | | | | | | | | 8,120 | | | | 787,640 | |
Steel Dynamics Incorporated | | | | | | | | | | | 25,259 | | | | 670,879 | |
| |
| | | | 2,201,323 | |
| | | | | |
|
| Paper & Forest Products: 0.14% | |
Domtar Corporation | | | | | | | | | | | 17,913 | | | | 365,425 | |
| | | | | | | | | | | | | | | | |
|
Real Estate: 3.49% | |
|
| Equity REITs: 3.49% | |
American Tower Corporation | | | | | | | | | | | 7,237 | | | | 1,868,376 | |
AvalonBay Communities Incorporated | | | | | | | | | | | 7,214 | | | | 1,125,456 | |
Boston Properties Incorporated | | | | | | | | | | | 3,676 | | | | 316,062 | |
Colony Capital Incorporated | | | | | | | | | | | 105,429 | | | | 211,912 | |
Crown Castle International Corporation | | | | | | | | | | | 1,593 | | | | 274,251 | |
Equinix Incorporated | | | | | | | | | | | 587 | | | | 409,509 | |
Gaming and Leisure Properties Incorporated | | | | | | | | | | | 17,341 | | | | 598,958 | |
Invitation Homes Incorporated | | | | | | | | | | | 34,169 | | | | 898,645 | |
Prologis Incorporated | | | | | | | | | | | 19,377 | | | | 1,772,996 | |
SBA Communications Corporation | | | | | | | | | | | 3,008 | | | | 944,903 | |
Vornado Realty Trust | | | | | | | | | | | 11,983 | | | | 433,904 | |
| |
| | | | 8,854,972 | |
| | | | | |
|
Utilities: 2.84% | |
|
| Electric Utilities: 1.48% | |
Exelon Corporation | | | | | | | | | | | 27,743 | | | | 1,062,834 | |
NRG Energy Incorporated | | | | | | | | | | | 30,809 | | | | 1,110,664 | |
PPL Corporation | | | | | | | | | | | 8,251 | | | | 230,533 | |
The Southern Company | | | | | | | | | | | 23,817 | | | | 1,359,236 | |
| |
| | | | 3,763,267 | |
| | | | | |
|
| Independent Power & Renewable Electricity Producers: 0.63% | |
AES Corporation | | | | | | | | | | | 31,714 | | | | 396,108 | |
Vistra Energy Corporation | | | | | | | | | | | 58,164 | | | | 1,188,872 | |
| |
| | | | 1,584,980 | |
| | | | | |
|
| Multi-Utilities: 0.73% | |
Dominion Energy Incorporated | | | | | | | | | | | 6,093 | | | | 517,966 | |
MDU Resources Group Incorporated | | | | | | | | | | | 40,814 | | | | 888,113 | |
Sempra Energy | | | | | | | | | | | 3,564 | | | | 450,169 | |
| |
| | | | 1,856,248 | |
| | | | | |
| | | | |
Total Common Stocks (Cost $211,574,917) | | | | | | | | | | | | | | | 244,691,845 | |
| | | | | | | | | | | | | | | | |
The accompanying notes are an integral part of these financial statements.
Wells Fargo Disciplined Large Cap Portfolio | 9
Portfolio of investments—May 31, 2020
| | | | | | | | | | | | | | | | |
| | | Yield | | | | | | Shares | | | Value | |
| Short-Term Investments: 3.55% | |
|
| Investment Companies: 3.27% | |
Wells Fargo Government Money Market Fund Select Class (l)(u) | | | 0.12 | % | | | | | | | 8,289,328 | | | $ | 8,289,328 | |
| | | | | | | | | | | | | |
| | | | |
| | | | | | | | | | | | | | | | |
| | | | | | Maturity date | | | Principal | | | | |
| U.S. Treasury Securities: 0.28% | |
U.S. Treasury Bill (z)# | | | 0.11 | | | | 10-1-2020 | | | $ | 200,000 | | | | 199,886 | |
U.S. Treasury Bill (z)# | | | 0.12 | | | | 10-22-2020 | | | | 100,000 | | | | 99,935 | |
U.S. Treasury Bill (z)# | | | 0.89 | | | | 9-10-2020 | | | | 100,000 | | | | 99,955 | |
U.S. Treasury Bill (z)# | | | 1.47 | | | | 7-30-2020 | | | | 325,000 | | | | 324,924 | |
| | | | |
| | | | | | | | | | | | | | | 724,700 | |
| | | | | | | | | | | | | | | | |
| |
Total Short-Term Investments (Cost $9,013,157) | | | | 9,014,028 | |
| | | | | |
| | | | | | | | |
| Total investments in securities (Cost $220,588,074) | | | 99.98 | % | | | 253,705,873 | |
| | |
Other assets and liabilities, net | | | 0.02 | | | | 50,291 | |
| | | | | | | | |
| Total net assets | | | 100.00 | % | | $ | 253,756,164 | |
| | | | | | | | |
| † | Non-income-earning security |
| (l) | The issuer of the security is an affiliated person of the Portfolio as defined in the Investment Company Act of 1940. |
| (u) | The rate represents the 7-day annualized yield at period end. |
| (z) | Zero coupon security. The rate represents the current yield to maturity. |
| # | All or a prtion of this security is segregated as collateral for investments in derivative instruments. |
Futures Contracts
| | | | | | | | | | | | | | | | | | | | | | | | |
| Description | | Number of
contracts | | | Expiration
date | | | Notional
cost | | | Notional
value | | | Unrealized
gains | | | Unrealized
losses | |
| | | | | | |
Long | | | | | | | | | | | | | | | | | | | | | | | | |
| | | | | | |
S&P 500 E-Mini Index | | | 51 | | | | 6-19-2020 | | | $ | 7,445,738 | | | $ | 7,757,100 | | | $ | 311,362 | | | $ | 0 | |
Investments in Affiliates
An affiliated investment is an investment in which the Portfolio owns at least 5% of the outstanding voting shares of the issuer or as a result of other relationships, such as the Portfolio and the issuer having the same adviser or investment manager. Transactions with issuers that were either affiliated persons of the Portfolio at the beginning of the period or the end of the period were as follows:
| | | | | | | | | | | | | | | | | | | | | | | | | | | | | | | | | | | | |
| | | Shares,
beginning of
period | | | Shares
purchased | | | Shares
sold | | | Shares,
end of
period | | | Net
realized
gains
(losses) | | | Net
change in
unrealized
gains
(losses) | | | Income
from
affiliated
securities | | | Value,
end
of period | | | % of
net
assets | |
| | | | | | | | | |
| Short-Term Investments | | | | | | | | | | | | | | | | | | | | | | | | | | | |
Investment Companies | | | | | | | | | | | | | | | | | | | | | | | | | | | | | | | | | | | | |
Wells Fargo Government Money Market Fund Select Class | | | 1,455,727 | | | | 138,982,684 | | | | (132,149,083 | ) | | | 8,289,328 | | | $ | 0 | | | $ | 0 | | | $ | 38,003 | | | $ | 8,289,328 | | | | 3.27 | % |
The accompanying notes are an integral part of these financial statements.
10 | Wells Fargo Disciplined Large Cap Portfolio
Statement of assets and liabilities—May 31, 2020
| | | | |
| | | | |
| |
Assets | | | | |
Investments in unaffiliated securities, at value (cost $212,298,746) | | $ | 245,416,545 | |
Investments in affiliated securities, at value (cost 8,289,328) | | | 8,289,328 | |
Due from broker | | | 19,957 | |
Receivable for dividends | | | 475,869 | |
Prepaid expenses and other assets | | | 20,832 | |
| | | | |
Total assets | | | 254,222,531 | |
| | | | |
| |
Liabilities | | | | |
Payable for daily variation margin on open futures contracts | | | 9,945 | |
Due to custodian bank | | | 402,808 | |
Advisory fee payable | | | 52,802 | |
Trustees’ fees and expenses payable | | | 812 | |
| | | | |
Total liabilities | | | 466,367 | |
| | | | |
Total net assets | | $ | 253,756,164 | |
| | | | |
The accompanying notes are an integral part of these financial statements.
Wells Fargo Disciplined Large Cap Portfolio | 11
Statement of operations—year ended May 31, 2020
| | | | |
| | | | |
| |
Investment income | | | | |
Dividends (net of foreign withholding taxes of $29,955) | | $ | 5,975,919 | |
Income from affiliated securities | | | 38,003 | |
Interest | | | 1,894 | |
| | | | |
Total investment income | | | 6,015,816 | |
| | | | |
| |
Expenses | | | | |
Advisory fee | | | 711,835 | |
Custody and accounting fees | | | 21,674 | |
Professional fees | | | 48,867 | |
Shareholder report expenses | | | 5,598 | |
Trustees’ fees and expenses | | | 20,332 | |
Interest expense | | | 437 | |
Other fees and expenses | | | 15,978 | |
| | | | |
Net expenses | | | 824,721 | |
| | | | |
Net investment income | | | 5,191,095 | |
| | | | |
| |
Realized and unrealized gains (losses) on investments | | | | |
Net realized losses on | | | | |
Unaffiliated securities | | | (3,564,299 | ) |
Futures contracts | | | (1,010,903 | ) |
| | | | |
Net realized losses on investments | | | (4,575,202 | ) |
| | | | |
|
Net change in unrealized gains (losses) on | |
Unaffiliated securities | | | 36,999,245 | |
Futures contracts | | | 311,420 | |
| | | | |
Net change in unrealized gains (losses) on investments | | | 37,310,665 | |
| | | | |
Net realized and unrealized gains (losses) on investments | | | 32,735,463 | |
| | | | |
Net increase in net assets resulting from operations | | $ | 37,926,558 | |
| | | | |
The accompanying notes are an integral part of these financial statements.
12 | Wells Fargo Disciplined Large Cap Portfolio
Statement of changes in net assets
| | | | | | | | |
| | | Year ended
May 31, 2020 | | | Year ended
May 31, 20191 | |
| | |
Operations | | | | | | | | |
Net investment income | | $ | 5,191,095 | | | $ | 6,837,610 | |
Net realized losses on investments | | | (4,575,202 | ) | | | (14,167,894 | ) |
Net change in unrealized gains (losses) on investments | | | 37,310,665 | | | | (3,882,332 | ) |
| | | | |
Net increase (decrease) in net assets resulting from operations | | | 37,926,558 | | | | (11,212,616 | ) |
| | | | |
| | |
Capital transactions | | | | | | | | |
Transactions in investors’ beneficial interests | | | | | | | | |
Contributions | | | 83,932,662 | | | | 456,478,424 | |
Withdrawals | | | (180,669,198 | ) | | | (132,699,666 | ) |
| | | | |
Net increase (decrease) in net assets resulting from capital transactions | | | (96,736,536 | ) | | | 323,778,758 | |
| | | | |
Total increase (decrease) in net assets | | | (58,809,978 | ) | | | 312,566,142 | |
| | | | |
| | |
Net assets | | | | | | | | |
Beginning of period | | | 312,566,142 | | | | 0 | |
| | | | |
End of period | | $ | 253,756,164 | | | $ | 312,566,142 | |
| | | | |
| 1 | For the period from June 12, 2018 (commencement of operations) to May 31, 2019. |
The accompanying notes are an integral part of these financial statements.
Wells Fargo Disciplined Large Cap Portfolio | 13
Financial highlights
| | | | | | | | |
| | | Year ended May 31, | |
| | | 2020 | | | 20191 | |
Total return2 | | | 11.56 | % | | | (2.40 | )% |
Ratios to average net assets (annualized) | | | | | | | | |
Gross expenses | | | 0.29 | % | | | 0.28 | % |
Net expenses | | | 0.29 | % | | | 0.28 | % |
Net investment income | | | 1.82 | % | | | 1.84 | % |
Supplemental data | | | | | | | | |
Portfolio turnover rate | | | 81 | % | | | 92 | % |
| 1 | For the period from June 12, 2018 (commencement of operations) to May 31, 2019. |
| 2 | Returns for periods of less than one year are not annualized. |
The accompanying notes are an integral part of these financial statements.
14 | Wells Fargo Disciplined Large Cap Portfolio
Notes to financial statements
1. ORGANIZATION
Wells Fargo Master Trust (the “Trust”), a Delaware statutory trust organized on March 10, 1999, is an open-end management investment company registered under the Investment Company Act of 1940, as amended (the “1940 Act”). As an investment company, the Trust follows the accounting and reporting guidance in Financial Accounting Standards Board (“FASB”) Accounting Standards Codification Topic 946, Financial Services – Investment Companies. These financial statements report on the Wells Fargo Disciplined Large Cap Portfolio (the “Portfolio”) which is a diversified series of the Trust.
2. SIGNIFICANT ACCOUNTING POLICIES
The following significant accounting policies, which are consistently followed in the preparation of the financial statements of the Portfolio, are in conformity with U.S. generally accepted accounting principles which require management to make estimates and assumptions that affect the reported amounts of assets and liabilities, disclosure of contingent assets and liabilities at the date of the financial statements, and the reported amounts of revenues and expenses during the reporting period. Actual results could differ from those estimates.
Securities valuation
All investments are valued each business day as of the close of regular trading on the New York Stock Exchange (generally 4 p.m. Eastern Time), although the Portfolio may deviate from this calculation time under unusual or unexpected circumstances.
Equity securities and futures contracts that are listed on a foreign or domestic exchange or market are valued at the official closing price or, if none, the last sales price. If no sale occurs on the principal exchange or market that day, a fair value price will be determined in accordance with the Portfolio’s Valuation Procedures.
Investments in registered open-end investment companies are valued at net asset value.
Investments which are not valued using any of the methods discussed above are valued at their fair value, as determined in good faith by the Board of Trustees of the Portfolio. The Board of Trustees has established a Valuation Committee comprised of the Trustees and has delegated to it the authority to take any actions regarding the valuation of portfolio securities that the Valuation Committee deems necessary or appropriate, including determining the fair value of portfolio securities, unless the determination has been delegated to the Wells Fargo Asset Management Pricing Committee at Wells Fargo Funds Management, LLC (“Funds Management”). The Board of Trustees retains the authority to make or ratify any valuation decisions or approve any changes to the Valuation Procedures as it deems appropriate. On a quarterly basis, the Board of Trustees receives reports on any valuation actions taken by the Valuation Committee or the Wells Fargo Asset Management Pricing Committee which may include items for ratification.
Futures contracts
Futures contracts are agreements between the Portfolio and a counterparty to buy or sell a specific amount of a commodity, financial instrument or currency at a specified price and on a specified date. The Portfolio may buy and sell futures contracts in order to gain exposure to, or protect against, changes in security values and is subject to equity price risk. The primary risks associated with the use of futures contracts are the imperfect correlation between changes in market values of securities held by the Portfolio and the prices of futures contracts, and the possibility of an illiquid market. Futures contracts are generally entered into on a regulated futures exchange and cleared through a clearinghouse associated with the exchange. With futures contracts, there is minimal counterparty risk to the Portfolio since futures contracts are exchange traded and the exchange’s clearinghouse, as the counterparty to all exchange traded futures, guarantees the futures contracts against default.
Upon entering into a futures contracts, the Portfolio is required to deposit either cash or securities (initial margin) with the broker in an amount equal to a certain percentage of the contract value. Subsequent payments (variation margin) are paid to or from the broker each day equal to the daily changes in the contract value. Such payments are recorded as unrealized gains or losses and, if any, shown as variation margin receivable (payable) in the Statement of Assets and Liabilities. Should the Portfolio fail to make requested variation margin payments, the broker can gain access to the initial margin to satisfy the Portfolio’s payment obligations. When the contracts are closed, a realized gain or loss is recorded in the Statement of Operations.
Security transactions and income recognition
Securities transactions are recorded on a trade date basis. Realized gains or losses are recorded on the basis of identified cost.
Dividend income is recognized on the ex-dividend date. Dividend income is recorded net of foreign taxes withheld where recovery of such taxes is not assured.
Wells Fargo Disciplined Large Cap Portfolio | 15
Notes to financial statements
Federal and other taxes
The Portfolio is treated as a separate entity for federal income tax purposes. The Portfolio is not required to pay federal income taxes on its net investment income and net capital gains as it is treated as a partnership for federal income tax purposes. All interest, dividends, gains and losses of the Portfolio are deemed to have been “passed through” to the interest holders in proportion to their holdings of the Portfolio regardless of whether interest, dividends and gains have been distributed by the Portfolio.
The Portfolio’s income tax returns and all financial records supporting those returns the fiscal years since commencement of operations are subject to examination by the federal revenue authority. Management has analyzed the Portfolio’s tax positions taken on federal, state, and foreign tax returns for all open tax years and does not believe that there are any uncertain tax positions that require recognition of a tax liability.
As of May 31, 2020, the aggregate cost of all investments for federal income tax purposes was $230,162,900 and the unrealized gains (losses) consisted of:
| | | | |
| |
Gross unrealized gains | | $ | 42,002,442 | |
| |
Gross unrealized losses | | | (18,148,107 | ) |
| |
Net unrealized gains | | $ | 23,854,335 | |
3. FAIR VALUATION MEASUREMENTS
Fair value measurements of investments are determined within a framework that has established a fair value hierarchy based upon the various data inputs utilized in determining the value of the Portfolio’s investments. The three-level hierarchy gives the highest priority to unadjusted quoted prices in active markets for identical assets or liabilities (Level 1) and the lowest priority to unobservable inputs (Level 3). The Portfolio’s investments are classified within the fair value hierarchy based on the lowest level of input that is significant to the fair value measurement. The inputs are summarized into three broad levels as follows:
| ∎ | | Level 1 – quoted prices in active markets for identical securities |
| ∎ | | Level 2 – other significant observable inputs (including quoted prices for similar securities, interest rates, prepayment speeds, credit risk, etc.) |
| ∎ | | Level 3 – significant unobservable inputs (including the Portfolio’s own assumptions in determining the fair value of investments) |
The inputs or methodologies used for valuing investments in securities are not necessarily an indication of the risk associated with investing in those securities.
16 | Wells Fargo Disciplined Large Cap Portfolio
Notes to financial statements
The following is a summary of the inputs used in valuing the Portfolio’s assets and liabilities as of May 31, 2020:
| | | | | | | | | | | | | | | | |
| | | | |
| | | Quoted prices (Level 1) | | | Other significant observable inputs (Level 2) | | | Significant unobservable inputs (Level 3) | | | Total | |
| | | | |
Assets | | | | | | | | | | | | | | | | |
Investments in: | | | | | | | | | | | | | | | | |
| | | | |
Common stocks | | | | | | | | | | | | | | | | |
| | | | |
Communication services | | $ | 25,262,098 | | | $ | 0 | | | $ | 0 | | | $ | 25,262,098 | |
| | | | |
Consumer discretionary | | | 26,957,779 | | | | 0 | | | | 0 | | | | 26,957,779 | |
| | | | |
Consumer staples | | | 16,665,508 | | | | 0 | | | | 0 | | | | 16,665,508 | |
| | | | |
Energy | | | 6,125,912 | | | | 0 | | | | 0 | | | | 6,125,912 | |
| | | | |
Financials | | | 26,367,066 | | | | 0 | | | | 0 | | | | 26,367,066 | |
| | | | |
Health care | | | 38,754,502 | | | | 0 | | | | 0 | | | | 38,754,502 | |
| | | | |
Industrials | | | 18,420,820 | | | | 0 | | | | 0 | | | | 18,420,820 | |
| | | | |
Information technology | | | 65,321,150 | | | | 0 | | | | 0 | | | | 65,321,150 | |
| | | | |
Materials | | | 4,757,543 | | | | 0 | | | | 0 | | | | 4,757,543 | |
| | | | |
Real estate | | | 8,854,972 | | | | 0 | | | | 0 | | | | 8,854,972 | |
| | | | |
Utilities | | | 7,204,495 | | | | 0 | | | | 0 | | | | 7,204,495 | |
| | | | |
Short-term investments | | | | | | | | | | | | | | | | |
| | | | |
Investment companies | | | 8,289,328 | | | | 0 | | | | 0 | | | | 8,289,328 | |
| | | | |
U.S. Treasury securities | | | 724,700 | | | | 0 | | | | 0 | | | | 724,700 | |
| | | | |
| | | 253,705,873 | | | | 0 | | | | 0 | | | | 253,705,873 | |
| | | | |
Futures contracts | | | 311,362 | | | | 0 | | | | 0 | | | | 311,362 | |
| | | | |
Total assets | | $ | 254,017,235 | | | $ | 0 | | | $ | 0 | | | $ | 254,017,235 | |
Additional sector, industry or geographic detail is included in the Portfolio of Investments.
Futures contracts are reported at their cumulative unrealized gains (losses) at measurement date as reported in the table following the Portfolio of Investments. For futures contracts the current day’s variation margin is reported on the Statement of Assets and Liabilities. All other assets and liabilities are reported at their market value at measurement date.
For the year ended May 31, 2020, the Portfolio did not have any transfers into/out of Level 3.
4. TRANSACTIONS WITH AFFILIATES
Advisory fee
The Trust has entered into an advisory contract with Funds Management, an indirect wholly owned subsidiary of Wells Fargo & Company (“Wells Fargo”). The adviser is responsible for implementing investment policies and guidelines and for supervising the subadviser, who is responsible for day-to-day portfolio management of the Portfolio. Pursuant to the contract, Funds Management is entitled to receive an annual advisory fee at the following annual rate based on the Portfolio’s average daily net assets:
| | | | |
| |
| Average daily net assets | | Advisory fee | |
| |
First $1 billion | | | 0.250 | % |
| |
Next $4 billion | | | 0.225 | |
| |
Over $5 billion | | | 0.200 | |
For the year ended May 31, 2020, the advisory fee was equivalent to an annual rate of 0.25% of the Portfolio’s average daily net assets.
Funds Management has retained the services of a subadviser to provide daily portfolio management to the Portfolio. The fee for subadvisory services is borne by Funds Management. Wells Capital Management Incorporated, an affiliate of Funds Management and an indirect wholly owned subsidiary of Wells Fargo, is the subadviser to the Portfolio and is entitled to receive a fee from Funds Management at an annual rate starting at 0.20% and declining to 0.15% as the average daily net assets of the Portfolio increase.
Wells Fargo Disciplined Large Cap Portfolio | 17
Notes to financial statements
Interfund transactions
The Portfolio may purchase or sell portfolio investment securities to certain other Wells Fargo affiliates pursuant to Rule 17a-7 under the 1940 Act and under procedures adopted by the Board of Trustees. The procedures have been designed to ensure that these interfund transactions, which do not incur broker commissions, are effected at current market prices.
5. INVESTMENT PORTFOLIO TRANSACTIONS
Purchases and sales of investments, excluding U.S. government obligations (if any) and short-term securities, for the year ended May 31, 2020 were $228,658,714 and $326,737,131, respectively.
6. DERIVATIVE TRANSACTIONS
During the year ended May 31, 2020, the Portfolio entered into futures contracts to gain market exposure. The Portfolio had an average notional amount of $1,908,316 in long futures contracts during the year ended May 31, 2020.
The fair value, realized gains or losses and change in unrealized gains or losses, if any, on derivative instruments are reflected in the corresponding financial statement captions.
7. BANK BORROWINGS
The Trust, along with Wells Fargo Variable Trust and Wells Fargo Funds Trust (excluding the money market funds), are parties to a $280,000,000 revolving credit agreement whereby the Portfolio is permitted to use bank borrowings for temporary or emergency purposes, such as to fund shareholder redemption requests. Interest under the credit agreement is charged to the Portfolio based on a borrowing rate equal to the higher of the Federal Funds rate in effect on that day plus 1.25% or the overnight LIBOR rate in effect on that day plus 1.25%. In addition, an annual commitment fee equal to 0.25% of the unused balance is allocated to each participating fund.
During the year ended May 31, 2020, the Fund had average borrowings outstanding of $32,612 at an average rate of 1.34% and paid interest in the amount of $437.
8. CONCENTRATION RISK
Concentration risk results from exposure to a limited number of sectors. As of the end of the period, the Portfolio invested a concentration of its portfolio in the information technology sector. A portfolio that invests a substantial portion of its assets in any sector may be more affected by changes in that sector than would be a portfolio whose investments are not heavily weighted in any sector.
9. INDEMNIFICATION
Under the Portfolio’s organizational documents, the officers and Trustees have been granted certain indemnification rights against certain liabilities that may arise out of performance of their duties to the Portfolio. The Portfolio has entered into a separate agreement with each Trustee that converts indemnification rights currently existing under the Portfolio’s organizational documents into contractual rights that cannot be changed in the future without the consent of the Trustee. Additionally, in the normal course of business, the Portfolio may enter into contracts with service providers that contain a variety of indemnification clauses. The Portfolio’s maximum exposure under these arrangements is dependent on future claims that may be made against the Portfolio and, therefore, cannot be estimated.
10. NEW ACCOUNTING PRONOUNCEMENT
In August 2018, FASB issued Accounting Standards Update (“ASU”) No. 2018-13, Fair Value Measurement (Topic 820) Disclosure Framework—Changes to the Disclosure Requirements for Fair Value Measurement. ASU 2018-13 updates the disclosure requirements for fair value measurements by modifying or removing certain disclosures and adding certain new disclosures. The amendments are effective for fiscal years, and interim periods within those fiscal years, beginning after December 15, 2019. Early adoption is permitted. Management has adopted the removal and modification of disclosures early, as permitted, and will adopt the additional new disclosures at the effective date.
11. CORONAVIRUS (COVID-19) PANDEMIC
On March 11, 2020, the World Health Organization announced that it had made the assessment that coronavirus disease 2019 (“COVID-19”) is a pandemic. The impacts of COVID-19 are adversely affecting the entire global economy, individual companies and investment products, and the market in general. There is significant uncertainty around the extent and duration of business disruptions related to COVID-19 and the impacts may be short term or may last for an extended period of time. The risk of further spreading of COVID-19 has led to significant uncertainty and volatility in the financial markets. The value of the Portfolio and the securities in which the Portfolio invests have generally been adversely affected by impacts caused by COVID-19.
18 | Wells Fargo Disciplined Large Cap Portfolio
Report of independent registered public accounting firm
TO THE INTEREST HOLDERS OF THE PORTFOLIO AND BOARD OF TRUSTEES WELLS FARGO MASTER TRUST:
Opinion on the Financial Statements
We have audited the accompanying statement of assets and liabilities of Wells Fargo Disciplined Large Cap Portfolio (the Portfolio), one of the portfolios constituting Wells Fargo Master Trust, including the portfolio of investments, as of May 31, 2020, the related statement of operations for the year then ended, the statements of changes in net assets for the year ended May 31, 2020 and for the period from June 12, 2018 (commencement of operations) to May 31, 2019, and the related notes (collectively, the financial statements) and the financial highlights for the year ended May 31, 2020 and for the period from the commencement of operations to May 31, 2019. In our opinion, the financial statements and financial highlights present fairly, in all material respects, the financial position of the Portfolio as of May 31, 2020, the results of its operations for the year then ended, and the changes in its net assets and the financial highlights for the year ended May 31, 2020 and for the period from the commencement of operations to May 31, 2019, in conformity with U.S. generally accepted accounting principles.
Basis for Opinion
These financial statements and financial highlights are the responsibility of the Portfolio’s management. Our responsibility is to express an opinion on these financial statements and financial highlights based on our audits. We are a public accounting firm registered with the Public Company Accounting Oversight Board (United States) (PCAOB) and are required to be independent with respect to the Portfolio in accordance with the U.S. federal securities laws and the applicable rules and regulations of the Securities and Exchange Commission and the PCAOB.
We conducted our audits in accordance with the standards of the PCAOB. Those standards require that we plan and perform the audit to obtain reasonable assurance about whether the financial statements and financial highlights are free of material misstatement, whether due to error or fraud. Our audits included performing procedures to assess the risks of material misstatement of the financial statements and financial highlights, whether due to error or fraud, and performing procedures that respond to those risks. Such procedures included examining, on a test basis, evidence regarding the amounts and disclosures in the financial statements and financial highlights. Such procedures also included confirmation of securities owned as of May 31, 2020, by correspondence with the custodian, transfer agent and broker. Our audits also included evaluating the accounting principles used and significant estimates made by management, as well as evaluating the overall presentation of the financial statements and financial highlights. We believe that our audits provide a reasonable basis for our opinion.

We have not been able to determine the specific year that we began serving as the auditor of one or more Wells Fargo Funds investment companies; however we are aware that we have served as the auditor of one or more Wells Fargo Funds investment companies since at least 1955.
Boston, Massachusetts
July 29, 2020
Wells Fargo Disciplined Large Cap Portfolio | 19
Other information (unaudited)
PROXY VOTING INFORMATION
A description of the policies and procedures used to determine how to vote proxies relating to portfolio securities is available, upon request, by calling 1-800-222-8222, visiting our website at wfam.com, or visiting the SEC website at sec.gov. Information regarding how the proxies related to portfolio securities were voted during the most recent 12-month period ended June 30 is available on the website at wfam.com or by visiting the SEC website at sec.gov.
QUARTERLY PORTFOLIO HOLDINGS INFORMATION
The Portfolio files its complete schedule of portfolio holdings with the SEC for the first and third quarters of each fiscal year as an exhibit to its reports on Form N-PORT. Shareholders may view the filed Form N-PORT by visiting the SEC website at sec.gov.
20 | Wells Fargo Disciplined Large Cap Portfolio
Other information (unaudited)
BOARD OF TRUSTEES AND OFFICERS
Each of the Trustees and Officers1 listed in the table below acts in identical capacities for each fund in the Wells Fargo family of funds, which consists of 147 mutual funds comprising the Wells Fargo Funds Trust, Wells Fargo Variable Trust, Wells Fargo Master Trust and four closed-end funds (collectively the “Fund Complex”). This table should be read in conjunction with the Prospectus and the Statement of Additional Information2. The mailing address of each Trustee and Officer is 525 Market Street, 12th Floor, San Francisco, CA 94105. Each Trustee and Officer serves an indefinite term, however, each Trustee serves such term until reaching the mandatory retirement age established by the Trustees.
Independent Trustees
| | | | | | |
Name and year of birth | | Position held and length of service* | | Principal occupations during past five years or longer | | Current other public company or investment company directorships |
| | | |
William R. Ebsworth (Born 1957) | | Trustee, since 2015 | | Retired. From 1984 to 2013, equities analyst, portfolio manager, research director and chief investment officer at Fidelity Management and Research Company in Boston, Tokyo, and Hong Kong, and retired in 2013 as Chief Investment Officer of Fidelity Strategic Advisers, Inc. where he led a team of investment professionals managing client assets. Prior thereto, Board member of Hong Kong Securities Clearing Co., Hong Kong Options Clearing Corp., the Thailand International Fund, Ltd., Fidelity Investments Life Insurance Company, and Empire Fidelity Investments Life Insurance Company. Audit Committee Chair and Investment Committee Chair of the Vincent Memorial Hospital Endowment (non-profit organization). Mr. Ebsworth is a CFA® charterholder. | | N/A |
| | | |
Jane A. Freeman (Born 1953) | | Trustee, since 2015; Chair Liaison, since 2018 | | Retired. From 2012 to 2014 and 1999 to 2008, Chief Financial Officer of Scientific Learning Corporation. From 2008 to 2012, Ms. Freeman provided consulting services related to strategic business projects. Prior to 1999, Portfolio Manager at Rockefeller & Co. and Scudder, Stevens & Clark. Board member of the Harding Loevner Funds from 1996 to 2014, serving as both Lead Independent Director and chair of the Audit Committee. Board member of the Russell Exchange Traded Funds Trust from 2011 to 2012 and the chair of the Audit Committee. Ms. Freeman is also an inactive Chartered Financial Analyst. | | N/A |
| | | |
Isaiah Harris, Jr. (Born 1952) | | Trustee, since 2009; Audit Committee Chairman, since 2019 | | Retired. Chairman of the Board of CIGNA Corporation since 2009, and Director since 2005. From 2003 to 2011, Director of Deluxe Corporation. Prior thereto, President and CEO of BellSouth Advertising and Publishing Corp. from 2005 to 2007, President and CEO of BellSouth Enterprises from 2004 to 2005 and President of BellSouth Consumer Services from 2000 to 2003. Emeritus member of the Iowa State University Foundation Board of Governors. Emeritus Member of the Advisory Board of Iowa State University School of Business. Advisory Board Member, Palm Harbor Academy (private school). Advisory Board Member, Child Evangelism Fellowship (non-profit). Mr. Harris is a certified public accountant (inactive status). | | CIGNA Corporation |
| | | |
Judith M. Johnson (Born 1949) | | Trustee, since 2008; Audit Committee Chairman, from 2009 to 2018 | | Retired. Prior thereto, Chief Executive Officer and Chief Investment Officer of Minneapolis Employees Retirement Fund from 1996 to 2008. Ms. Johnson is an attorney, certified public accountant and a certified managerial accountant. | | N/A |
Wells Fargo Disciplined Large Cap Portfolio | 21
Other information (unaudited)
| | | | | | |
Name and year of birth | | Position held and length of service* | | Principal occupations during past five years or longer | | Current other public company or investment company directorships |
| | | |
David F. Larcker (Born 1950) | | Trustee, since 2009 | | James Irvin Miller Professor of Accounting at the Graduate School of Business, Stanford University, Director of the Corporate Governance Research Initiative and Senior Faculty of The Rock Center for Corporate Governance since 2006. From 2005 to 2008, Professor of Accounting at the Graduate School of Business, Stanford University. Prior thereto, Ernst & Young Professor of Accounting at The Wharton School, University of Pennsylvania from 1985 to 2005. | | N/A |
| | | |
Olivia S. Mitchell (Born 1953) | | Trustee, since 2006; Nominating and Governance Committee Chair, since 2018 | | International Foundation of Employee Benefit Plans Professor, Wharton School of the University of Pennsylvania since 1993. Director of Wharton’s Pension Research Council and Boettner Center on Pensions & Retirement Research, and Research Associate at the National Bureau of Economic Research. Previously, Cornell University Professor from 1978 to 1993. | | N/A |
| | | |
Timothy J. Penny (Born 1951) | | Trustee, since 1996; Chairman, since 2018 | | President and Chief Executive Officer of Southern Minnesota Initiative Foundation, a non-profit organization, since 2007. Member of the Board of Trustees of NorthStar Education Finance, Inc., a non-profit organization, since 2007. | | N/A |
| | | |
James G. Polisson (Born 1959) | | Trustee, since 2018 | | Retired. Chief Marketing Officer, Source (ETF) UK Services, Ltd, from 2015 to 2017. From 2012 to 2015, Principal of The Polisson Group, LLC, a management consulting, corporate advisory and principal investing company. Chief Executive Officer and Managing Director at Russell Investments, Global Exchange Traded Funds from 2010 to 2012. Managing Director of Barclays Global Investors from 1998 to 2010 and Global Chief Marketing Officer for iShares and Barclays Global Investors from 2000 to 2010. Trustee of the San Francisco Mechanics’ Institute, a non-profit organization, from 2013 to 2015. Board member of the Russell Exchange Traded Fund Trust from 2011 to 2012. Director of Barclays Global Investors Holdings Deutschland GmbH from 2006 to 2009. Mr. Polisson is an attorney and has a retired status with the Massachusetts and District of Columbia Bar Associations. | | N/A |
| | | |
Pamela Wheelock (Born 1959) | | Trustee, since January 2020; previously Trustee from January 2018 to July 2019 | | Board member of the Destination Medical Center Economic Development Agency, Rochester, Minnesota since 2019 and Interim President of the McKnight Foundation since 2020. Acting Commissioner, Minnesota Department of Human Services, July 2019 through September 2019. Human Services Manager (part-time), Minnesota Department of Human Services, October 2019 through December 2019. Chief Operating Officer, Twin Cities Habitat for Humanity from 2017 to 2019. Vice President of University Services, University of Minnesota from 2012 to 2016. Prior thereto, on the Board of Directors, Governance Committee and Finance Committee for the Minnesota Philanthropy Partners (Saint Paul Foundation) from 2012 to 2018, Interim Chief Executive Officer of Blue Cross Blue Shield of Minnesota from 2011 to 2012, Chairman of the Board from 2009 to 2012 and Board Director from 2003 to 2015. Vice President, Leadership and Community Engagement, Bush Foundation, Saint Paul, Minnesota (a private foundation) from 2009 to 2011. Executive Vice President and Chief Financial Officer, Minnesota Sports and Entertainment from 2004 to 2009 and Senior Vice President from 2002 to 2004. Executive Vice President of the Minnesota Wild Foundation from 2004 to 2008. Commissioner of Finance, State of Minnesota, from 1999 to 2002. Currently Board Chair of the Minnesota Wild Foundation since 2010. | | N/A |
| * | Length of service dates reflect the Trustee’s commencement of service with the Trust’s predecessor entities, where applicable. |
22 | Wells Fargo Disciplined Large Cap Portfolio
Other information (unaudited)
Officers
| | | | |
Name and year of birth | | Position held and length of service | | Principal occupations during past five years or longer |
| | |
Andrew Owen (Born 1960) | | President, since 2017 | | Executive Vice President of Wells Fargo & Company and Head of Affiliated Managers, Wells Fargo Asset Management, since 2014. In addition, Mr. Owen is currently President, Chief Executive Officer and Director of Wells Fargo Funds Management, LLC since 2017. Prior thereto, Executive Vice President responsible for marketing, investments and product development for Wells Fargo Funds Management, LLC, from 2009 to 2014. |
| | |
Jeremy DePalma1 (Born 1974) | | Treasurer, since 2012 | | Senior Vice President of Wells Fargo Funds Management, LLC since 2009. Senior Vice President of Evergreen Investment Management Company, LLC from 2008 to 2010 and head of the Fund Reporting and Control Team within Fund Administration from 2005 to 2010. |
| | |
Michelle Rhee (Born 1966) | | Chief Legal Officer, since 2019 | | Secretary of Wells Fargo Funds Management, LLC, Chief Legal Counsel of Wells Fargo Asset Management and Assistant General Counsel of Wells Fargo Bank, N.A. since 2018. Associate General Counsel and Managing Director of Bank of America Corporation from 2004 to 2018. |
| | |
Catherine Kennedy (Born 1969) | | Secretary, since 2019 | | Vice President of Wells Fargo Funds Management, LLC and Senior Counsel of the Wells Fargo Legal Department since 2010. Vice President and Senior Counsel of Evergreen Investment Management Company, LLC from 1998 to 2010. |
| | |
Michael H. Whitaker (Born 1967) | | Chief Compliance Officer, since 2016 | | Chief Compliance Officer of Wells Fargo Asset Management since 2016. Senior Vice President and Chief Compliance Officer for Fidelity Investments from 2007 to 2016. |
| | |
David Berardi (Born 1975) | | Assistant Treasurer, since 2009 | | Vice President of Wells Fargo Funds Management, LLC since 2009. Vice President of Evergreen Investment Management Company, LLC from 2008 to 2010. Manager of Fund Reporting and Control for Evergreen Investment Management Company, LLC from 2004 to 2010. |
| 1 | Jeremy DePalma acts as Treasurer of 82 funds and Assistant Treasurer of 65 funds in the Fund Complex. |
| 2 | The Statement of Additional Information includes additional information about the Trustees and is available, without charge, upon request, by calling 1-800-222-8222 or by visiting the website at wfam.com. |
Wells Fargo Disciplined Large Cap Portfolio | 23
Other information (unaudited)
BOARD CONSIDERATION OF INVESTMENT ADVISORY AND SUB-ADVISORY AGREEMENTS:
Wells Fargo Disciplined Large Cap Portfolio
Under the Investment Company Act of 1940 (the “1940 Act”), the Board of Trustees (the “Board”) of Wells Fargo Master Trust (the “Trust”) must determine annually whether to approve the continuation of the Trust’s investment advisory and sub-advisory agreements. In this regard, at a Board meeting held on May 26, 2020 and May 28, 2020 (together, the “Meeting”), the Board, all the members of which have no direct or indirect interest in the investment advisory and sub-advisory agreements and are not “interested persons” of the Trust, as defined in the 1940 Act (the “Independent Trustees”), reviewed and approved for the Wells Fargo Disciplined Large Cap Portfolio (the “Portfolio”): (i) an investment advisory agreement (the “Advisory Agreement”) with Wells Fargo Funds Management, LLC (“Funds Management”); and (ii) an investment sub-advisory agreement (the “Sub-Advisory Agreement”) with Wells Capital Management Incorporated (the “Sub-Adviser”), an affiliate of Funds Management. The Advisory Agreement and the Sub-Advisory Agreement are collectively referred to as the “Advisory Agreements.”
At the Meeting, the Board considered the factors and reached the conclusions described below relating to the selection of Funds Management and the Sub-Adviser and the approval of the Advisory Agreements. Prior to the Meeting, including at a Board meeting held in April 2020, the Trustees conferred extensively among themselves and with representatives of Funds Management about these matters. Also, the Board has adopted a team-based approach, with each team consisting of a sub-set of Trustees, to assist the full Board in the discharge of its duties in reviewing investment performance and other matters throughout the year. The Independent Trustees were assisted in their evaluation of the Advisory Agreements by independent legal counsel, from whom they received separate legal advice and with whom they met separately.
In providing information to the Board, Funds Management and the Sub-Adviser were guided by a detailed set of requests for information submitted to them by independent legal counsel on behalf of the Independent Trustees at the start of the Board’s annual contract renewal process earlier in 2020. In considering and approving the Advisory Agreements, the Trustees considered the information they believed relevant, including but not limited to the information discussed below. The Board considered not only the specific information presented in connection with the Meeting, but also the knowledge gained over time through interaction with Funds Management and the Sub-Adviser about various topics. In this regard, the Board reviewed reports of Funds Management at each of its quarterly meetings, which included, among other things, portfolio reviews and investment performance reports. In addition, the Board and the teams mentioned above confer with portfolio managers at various times throughout the year. The Board did not identify any particular information or consideration that was all-important or controlling, and each individual Trustee may have attributed different weights to various factors.
After its deliberations, the Board unanimously approved the continuation of the Advisory Agreements for a one-year term and determined that the compensation payable to Funds Management and the Sub-Adviser under each of the Advisory Agreements was reasonable. The Board considered the approval of the Advisory Agreements for the Portfolio as part of its consideration of agreements for funds across the complex, but its approvals were made on a portfolio-by-portfolio basis. The following summarizes a number of important, but not necessarily all, factors considered by the Board in support of its approvals.
Nature, extent and quality of services
The Board received and considered various information regarding the nature, extent and quality of services provided to the Portfolio by Funds Management and the Sub-Adviser under the Advisory Agreements. This information included a description of the investment advisory services and Fund-level administrative services covered by the Advisory Agreement, as well as, among other things, a summary of the background and experience of senior management of Wells Fargo Asset Management (“WFAM”), of which Funds Management and the Sub-Adviser are a part, and a summary of investments made in the business of WFAM. The Board also received a description of Funds Management’s and the Sub-Adviser’s business continuity plans and of their approaches to data privacy and cybersecurity, and related testing. The Board also received and reviewed information about Funds Management’s role as administrator of the Portfolio’s liquidity risk management program, Funds Management’s approach to risk management, and Funds Management’s intermediary and vendor oversight program.
The Board also considered the qualifications, background, tenure and responsibilities of each of the portfolio managers primarily responsible for the day-to-day portfolio management of the Portfolio. The Board evaluated the ability of Funds Management and the Sub-Adviser to attract and retain qualified investment professionals, including research, advisory and supervisory personnel. The Board further considered the compliance programs and compliance records of Funds Management and the Sub-Adviser. In addition, the Board took into account the full range of services provided to the Portfolio by Funds Management and its affiliates.
24 | Wells Fargo Disciplined Large Cap Portfolio
Other information (unaudited)
Portfolio investment performance and expenses
The Boards noted that the Portfolio had recently commenced operations and only had a one-year period of performance history to review. The Board considered the investment performance results for the Portfolio for the one-year period ended December 31, 2019. The Board also considered more current results for the one-year period ended March 31, 2020. The Board considered these results in comparison to the investment performance of funds in a universe that was determined by Broadridge Inc. (“Broadridge”) to be similar to the Portfolio (the “Universe”), and in comparison to the Portfolio’s benchmark index and to other comparative data. Broadridge is an independent provider of investment company data. The Board received a description of the methodology used by Broadridge to select the mutual funds in the performance Universe. The Board noted that the investment performance of the Portfolio was in range of the average investment performance of the Universe for the one-year period ended December 31, 2019, and lower than the average investment performance of the Universe for the one-year period ended March 31, 2020. The Board also noted that the investment performance of the Portfolio was higher than its benchmark index, the Wells Fargo Factor Enhanced Large Cap Index, for the one-year period ended December 31, 2019, and higher than its benchmark index for the one-year period ended March 31, 2020.
The Board also received and considered information regarding the fee rates that are payable to Funds Management for investment advisory services (as discussed below), which are the only fees charged at the Portfolio level, relative to corresponding class-specific expense groups that were determined by Broadridge to be similar to the Portfolio (the “Group”). The Board received a description of the methodology used by Broadridge to select the mutual funds in the expense Group and an explanation of how funds comprising expense groups and their expense ratios may vary from year-to-year.
The Board took into account the Portfolio’s investment performance and expense information provided to it among the factors considered in deciding to re-approve the Advisory Agreements.
Investment advisory and sub-advisory fee rates
The Board reviewed and considered the contractual investment advisory fee rate that is payable by the Portfolio to Funds Management for investment advisory services under the Advisory Agreement (the “Advisory Agreement Rate”). The Board also reviewed and considered the contractual investment sub-advisory fee rate that is payable by Funds Management to the Sub-Adviser for investment sub-advisory services (the “Sub-Advisory Agreement Rate”).
Among other information reviewed by the Board was a comparison of the Portfolio’s Advisory Agreement Rate with the average contractual investment management fee rates of funds in the expense Groups at a common asset level. The Board noted that the Portfolio’s Advisory Agreement Rate was lower than the median rate for the Portfolio’s expense Group.
The Board also received and considered information about the portion of the total advisory fee that was retained by Funds Management after payment of the fee to the Sub-Adviser for sub-advisory services. In assessing the reasonableness of this amount, the Board received and evaluated information about the nature and extent of responsibilities retained and risks assumed by Funds Management and not delegated to or assumed by the Sub-Adviser, and about Funds Management’s on-going oversight services. Given the affiliation between Funds Management and the Sub-Adviser, the Board ascribed limited relevance to the allocation of fees between them.
Based on its consideration of the factors and information it deemed relevant, including those described here, the Board determined that the compensation payable to Funds Management under the Advisory Agreement and to the Sub-Adviser under the Sub-Advisory Agreement was reasonable.
Profitability
The Board received and considered information concerning the profitability of Funds Management, as well as the profitability of both WFAM and Wells Fargo & Co. (“Wells Fargo”) from providing services to the fund family as a whole. The Board noted that the Sub-Adviser’s profitability information with respect to providing services to the Portfolio and other funds in the family was subsumed in the WFAM and Wells Fargo profitability analysis.
Funds Management reported on the methodologies and estimates used in calculating profitability, including a description of the methodology used to allocate certain expenses. Among other things, the Board noted that the levels of profitability reported on a fund-by-fund basis varied widely, depending on factors such as the size, type and age of fund.
Based on its review, the Board did not deem the profits reported by Funds Management, WFAM or Wells Fargo from services provided to the Portfolio to be at a level that would prevent it from approving the continuation of the Advisory Agreements.
Economies of scale
The Board received and considered information about the potential for Funds Management to experience economies of scale in the provision of management services to the Portfolio, the difficulties of calculating economies of scale at an individual fund
Wells Fargo Disciplined Large Cap Portfolio | 25
Other information (unaudited)
level, and the extent to which potential scale benefits are shared with shareholders. The Board noted the existence of breakpoints in the Portfolio’s advisory fee structure, which operate generally to reduce the Portfolio’s expense ratios as the Portfolio grows in size, and the size of the Portfolio in relation to such breakpoints. The Board considered that in addition to management fee breakpoints, Funds Management shares potential economies of scale from its management business in a variety of ways, including through fee waiver and expense reimbursement arrangements, services that benefit shareholders, competitive management fee rates set at the outset without regard to breakpoints, and investments in the business intended to enhance services available to shareholders.
The Board concluded that Funds Management’s arrangements with respect to the Portfolio, including contractual breakpoints, constituted a reasonable approach to sharing potential economies of scale with the Portfolio and its shareholders.
Other benefits to Funds Management and the Sub-Adviser
The Board received and considered information regarding potential “fall-out” or ancillary benefits received by Funds Management and its affiliates, including the Sub-Adviser, as a result of their relationships with the Portfolio. Ancillary benefits could include, among others, benefits directly attributable to other relationships with the Portfolio and benefits potentially derived from an increase in Funds Management’s and the Sub-Adviser’s business as a result of their relationships with the Portfolio. The Board noted that various affiliates of Funds Management may receive distribution-related fees, shareholder servicing payments and sub-transfer agency fees in respect of shares sold or held through them and services provided.
The Board also reviewed information about soft dollar credits earned and utilized by the Sub-Adviser, fees earned by Funds Management and the Sub-Adviser from managing a private investment vehicle for the fund family’s securities lending collateral, and commissions earned by an affiliated broker from portfolio transactions.
Based on its consideration of the factors and information it deemed relevant, including those described here, the Board did not find that any ancillary benefits received by Funds Management and its affiliates, including the Sub-Adviser, were unreasonable.
Conclusion
At the Meeting, after considering the above-described factors and based on its deliberations and its evaluation of the information described above, the Board unanimously approved the continuation of the Advisory Agreements for a one-year term and determined that the compensation payable to Funds Management and the Sub-Adviser under each of the Advisory Agreements was reasonable.
26 | Wells Fargo Disciplined Large Cap Portfolio
Other information (unaudited)
LIQUIDITY RISK MANAGEMENT PROGRAM
In accordance with Rule 22e-4 under the Investment Company Act of 1940, as amended (the “Liquidity Rule”), Wells Fargo Master Trust (the “Trust”) has adopted and implemented a liquidity risk management program (the “Program”) on behalf of each of its series, including the Portfolio, which is reasonably designed to assess and manage the Portfolio’s liquidity risk. “Liquidity risk” is defined as the risk that the Portfolio is unable to meet redemption requests without significantly diluting remaining investors’ interests in the Portfolio. The Trust’s Board of Trustees (the “Board”) previously approved the designation of Wells Fargo Funds Management, LLC (“Funds Management”), the Portfolio’s investment adviser, as the administrator of the Program, and Funds Management has established a Liquidity Risk Management Council composed of personnel from multiple departments within Funds Management and its affiliates to assist Funds Management in the implementation and on-going administration of the Program.
The Program is comprised of various components designed to support the assessment and/or management of liquidity risk, including: (1) the periodic assessment (no less frequently than annually) of certain factors that influence the Portfolio’s liquidity risk; (2) the periodic classification (no less frequently than monthly) of the Portfolio’s investments into one of four liquidity categories that reflect an estimate of their liquidity under current market conditions; (3) a 15% limit on the acquisition of “illiquid investments” (as defined under the Liquidity Rule); (4) to the extent the Portfolio does not invest primarily in “highly liquid investments” (as defined under the Liquidity Rule), the determination of a minimum percentage of the Portfolio’s assets that generally will be invested in highly liquid investments (an “HLIM”); (5) if the Portfolio has established an HLIM, the periodic review (no less frequently than annually) of the HLIM and the adoption of policies and procedures for responding to a shortfall of the Portfolio’s “highly liquid investments” below its HLIM; and (6) periodic reporting to the Board.
At a meeting of the Board held on May 26 and 28, 2020, the Board received a written report (the “Report”) from Funds Management that addressed the operation of the Program and assessed its adequacy and effectiveness of implementation. The Report covered the initial period from December 1, 2018 through December 31, 2019 (the “Reporting Period”). No significant liquidity events impacting the Portfolio were noted in the Report. There were no material changes to the Program during the Reporting Period. The Report concluded that the Program is operating effectively to assess and manage the Portfolio’s liquidity risk, and that the Program has been and continues to be adequately and effectively implemented to monitor and, as applicable, respond to the Portfolio’s liquidity developments.
Wells Fargo Disciplined Large Cap Portfolio | 27
This page is intentionally left blank.

For more information
More information about Wells Fargo Funds is available free upon request. To obtain literature, please write, visit the Fund’s website, or call:
Wells Fargo Funds
P.O. Box 219967
Kansas City, MO 64121-9967
Website: wfam.com
Individual investors: 1-800-222-8222
Retail investment professionals: 1-888-877-9275
Institutional investment professionals: 1-866-765-0778

This report and the financial statements contained herein are submitted for the general information of the shareholders of the Fund. If this report is used for promotional purposes, distribution of the report must be accompanied or preceded by a current prospectus. Before investing, please consider the investment objectives, risks, charges, and expenses of the investment. For a current prospectus and, if available, a summary prospectus, containing this information, call 1-800-222-8222 or visit the Fund’s website at wfam.com. Read the prospectus carefully before you invest or send money.
Wells Fargo Asset Management (WFAM) is the trade name for certain investment advisory/management firms owned by Wells Fargo & Company. These firms include but are not limited to Wells Capital Management Incorporated and Wells Fargo Funds Management, LLC. Certain products managed by WFAM entities are distributed by Wells Fargo Funds Distributor, LLC (a broker-dealer and Member FINRA).
This material is for general informational and educational purposes only and is NOT intended to provide investment advice or a recommendation of any kind—including a recommendation for any specific investment, strategy, or plan.
INVESTMENT PRODUCTS: NOT FDIC INSURED ◾ NO BANK GUARANTEE ◾ MAY LOSE VALUE
© 2020 Wells Fargo & Company. All rights reserved.
ITEM 2. CODE OF ETHICS
(a) As of the end of the period covered by the report, Wells Fargo Master Trust has adopted a code of ethics that applies to its President and Treasurer. A copy of the code of ethics is filed as an exhibit to this Form N-CSR.
(c) During the period covered by this report, there were no amendments to the provisions of the code of ethics adopted in Item 2(a) above.
(d) During the period covered by this report, there were no implicit or explicit waivers to the provisions of the code of ethics adopted in Item 2(a) above.
ITEM 3. AUDIT COMMITTEE FINANCIAL EXPERT
The Board of Trustees of Wells Fargo Master Trust has determined that Judith Johnson is an audit committee financial expert, as defined in Item 3 of Form N-CSR. Mrs. Johnson is independent for purposes of Item 3 of Form N-CSR.
ITEM 4. PRINCIPAL ACCOUNTANT FEES AND SERVICES
(a), (b), (c), (d) The following table presents aggregate fees billed in each of the last two fiscal years for services rendered to the Registrant by the Registrant’s principal accountant. These fees were billed to the registrant and were approved by the Registrant’s audit committee.
| | | | | | | | |
| | | Fiscal
year ended
May 31, 2020 | | | Fiscal
year ended
May 31, 2019 | |
Audit fees | | $ | 477,950 | | | $ | 454,060 | |
Audit-related fees | | | — | | | | — | |
Tax fees (1) | | | 95,740 | | | | 88,700 | |
All other fees | | | — | | | | — | |
| | | | | | | | |
| | $ | 573,690 | | | $ | 542,760 | |
| | | | | | | | |
| (1) | Tax fees consist of fees for tax compliance, tax advice, tax planning and excise tax. |
(e) The Chairman of the Audit Committees is authorized to pre-approve: (1) audit services for the mutual funds of Wells Fargo Master Trust; (2) non-audit tax or compliance consulting or training services provided to the Funds by the independent auditors (“Auditors”) if the fees for any particular engagement are not anticipated to exceed $50,000; and (3) non-audit tax or compliance consulting or training services provided by the Auditors to a Fund’s investment adviser and its controlling entities (where pre-approval is required because the engagement relates directly to the operations and financial reporting of the Fund) if the fee to the Auditors for any particular engagement is not anticipated to exceed $50,000. For any such pre-approval sought from the Chairman, Management shall prepare a brief description of the proposed services. If the Chairman approves of such service, he or she shall sign the statement prepared by Management. Such written statement shall be presented to the full Committees at their next regularly scheduled meetings.
(f) Not applicable
(g) Not applicable
(h) Not applicable
ITEM 5. AUDIT COMMITTEE OF LISTED REGISTRANTS
Not applicable.
ITEM 6. INVESTMENTS
A Portfolio of Investments for each series of Wells Fargo Master Trust is included as part of the report to shareholders filed under Item 1 of this Form.
ITEM 7. DISCLOSURE OF PROXY VOTING POLICIES AND PROCEDURES FOR CLOSED-END MANAGEMENT INVESTMENT COMPANIES
Not applicable.
ITEM 8. PORTFOLIO MANAGERS OF CLOSED-END MANAGEMENT INVESTMENT COMPANIES
Not applicable.
ITEM 9. PURCHASES OF EQUITY SECURITIES BY CLOSED-END MANAGEMENT INVESTMENT COMPANY AND AFFILIATED PURCHASERS
Not applicable.
ITEM 10. SUBMISSION OF MATTERS TO A VOTE OF SECURITY HOLDERS
There have been no material changes to the procedures by which shareholders may recommend nominees to the registrant’s Board of Trustees that have been implemented since the registrant’s last provided disclosure in response to the requirements of this Item.
ITEM 11. CONTROLS AND PROCEDURES
(a) The President and Treasurer have concluded that the Wells Fargo Master Trust disclosure controls and procedures (as defined in Rule 30a-3(c) under the Investment Company Act of 1940) provide reasonable assurances that material information relating to the registrant is made known to them by the appropriate persons based on their evaluation of these controls and procedures as of a date within 90 days of the filing of this report.
(b) There were no significant changes in the registrant’s internal controls over financial reporting (as defined in Rule 30a-3(d) under the Investment Company Act of 1940) that occurred during the most recent fiscal half-year of the period covered by this report that materially affected, or is reasonably likely to materially affect, the registrant’s internal control over financial reporting.
ITEM 12. DISCLOSURES OF SECURITIES LENDING ACTIVITES FOR CLOSED-END MANAGEMENT INVESTMENT COMPANIES
Not applicable.
ITEM 13. EXHIBITS
(a)(1) Code of Ethics.
(a)(2) Certifications pursuant to Section 302 of the Sarbanes-Oxley Act of 2002.
(b) Certifications pursuant to Section 906 of the Sarbanes-Oxley Act of 2002.
SIGNATURES
Pursuant to the requirements of the Securities Exchange Act of 1934 and the Investment Company Act of 1940, the registrant has duly caused this report to be signed on its behalf by the undersigned, thereunto duly authorized.
| | |
Wells Fargo Master Trust |
| |
| By: | | |
| | /s/ Andrew Owen |
| |
| | Andrew Owen |
| | President |
| |
| Date: | | July 29, 2020 |
Pursuant to the requirements of the Securities Exchange Act of 1934 and the Investment Company Act of 1940, this report has been signed below by the following persons on behalf of the registrant and in the capacities and on the date indicated.
| | |
Wells Fargo Master Trust |
| |
By: | | |
| | /s/ Andrew Owen |
| |
| | Andrew Owen |
| | President |
| |
Date: | | July 29, 2020 |
| |
| By: | | |
| | /s/ Nancy Wiser |
| |
| | Nancy Wiser |
| | Treasurer |
| |
| Date: | | July 29, 2020 |
| |
| By: | | |
| | /s/ Jeremy DePalma |
| |
| | Jeremy DePalma |
| | Treasurer |
| |
| Date: | | July 29, 2020 |