
UNITED STATES
SECURITIES AND EXCHANGE COMMISSION
Washington, D.C. 20549
FORM N-CSR
CERTIFIED SHAREHOLDER REPORT OF REGISTERED
MANAGEMENT INVESTMENT COMPANIES
Investment Company Act file number: 811-09689
Allspring Master Trust
(Exact name of registrant as specified in charter)
525 Market St., San Francisco, CA 94105
(Address of principal executive offices) (Zip code)
Matthew Prasse
Allspring Funds Management, LLC
525 Market St., San Francisco, CA 94105
(Name and address of agent for service)
Registrant’s telephone number, including area code: 800-222-8222
Date of fiscal year end: February 28
Registrant is making a filing for 11 of its series:
Allspring Bloomberg US Aggregate ex-Corporate Portfolio, Allspring Emerging Markets Bond Portfolio, Allspring Factor Enhanced Emerging Markets Equity Portfolio, Allspring Factor Enhanced International Equity Portfolio, Allspring Factor Enhanced U.S. Large Cap Equity Portfolio, Allspring Factor Enhanced U.S. Small Cap Equity Portfolio, Allspring Factor Enhanced U.S. Low Volatility Equity Portfolio, Allspring High Yield Corporate Bond Portfolio, Allspring Investment Grade Corporate Bond Portfolio, Allspring Strategic Retirement Bond Portfolio and Allspring U.S. REIT Portfolio.
Date of reporting period: February 28, 2022
ITEM 1. REPORT TO STOCKHOLDERS

Aggregate ex-Corporate Portfolio
| Investment objective | The Portfolio seeks to replicate the total return of the Bloomberg U.S. Aggregate ex-Corporate Index†, before fees and expenses. |
| Adviser | Allspring Funds Management, LLC |
| Subadviser | Allspring Global Investments, LLC |
| Portfolio managers | Manjunath Boraiah, Christopher Y. Kauffman, CFA®‡, Janet S. Rilling, CFA®‡, CPA, Michal Stanczyk |
| Ten largest holdings (%) as of February 28, 20221 | |
| FNMA, 2.00%, 3-14-2052 | 7.93 |
| FNMA, 2.50%, 11-25-2051 | 3.77 |
| U.S. Treasury Note, 2.25%, 11-15-2025 | 1.97 |
| GNMA, 2.00%, 3-21-2052 | 1.80 |
| U.S. Treasury Bond, 3.00%, 5-15-2047 | 1.69 |
| GNMA, 2.50%, 3-21-2052 | 1.57 |
| FHLMC, 3.00%, 2-1-2047 | 1.31 |
| FNMA, 2.00%, 3-17-2037 | 1.28 |
| U.S. Treasury Bond, 5.50%, 8-15-2028 | 1.19 |
| U.S. Treasury Note, 1.63%, 2-15-2026 | 1.16 |
| 1 | Figures represent the percentage of the Portfolio's net assets. Holdings are subject to change and may have changed since the date specified. |
| Portfolio composition as of February 28, 20221 |
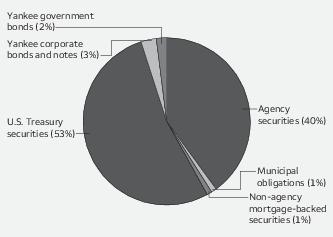
| 1 | Figures represent the percentage of the Portfolio's long-term investments. These amounts are subject to change and may have changed since the date specified. |
| ‡ | CFA® and Chartered Financial Analyst® are trademarks owned by CFA Institute. |
| † | The Bloomberg U.S. Aggregate ex-Corporate Index is a broad-based benchmark that includes Treasuries, government-related securities, mortgage-backed securities (agency fixed-rate and hybrid adjustable-rate mortgage pass-throughs), asset-backed securities and commercial mortgage-backed securities (agency and non-agency). You cannot invest directly in an index. |
| Interest rate | Maturity date | Principal | Value | |||
| Agency securities: 39.65% | ||||||
| FFCB | 0.13% | 4-13-2023 | $ | 510,000 | $ 503,781 | |
| FFCB | 0.30 | 3-28-2024 | 100,000 | 97,697 | ||
| FFCB | 0.48 | 9-3-2024 | 70,000 | 68,006 | ||
| FFCB | 0.57 | 7-2-2024 | 180,000 | 175,473 | ||
| FFCB | 1.55 | 7-26-2030 | 700,000 | 649,743 | ||
| FHLB | 1.50 | 8-15-2024 | 10,000 | 9,986 | ||
| FHLB | 2.13 | 3-10-2023 | 980,000 | 990,079 | ||
| FHLB | 2.13 | 6-9-2023 | 70,000 | 70,730 | ||
| FHLB | 2.75 | 12-13-2024 | 10,000 | 10,297 | ||
| FHLB | 2.88 | 6-14-2024 | 430,000 | 442,339 | ||
| FHLB | 2.88 | 9-13-2024 | 60,000 | 61,932 | ||
| FHLB | 3.00 | 3-10-2028 | 10,000 | 10,588 | ||
| FHLB | 3.38 | 9-8-2023 | 30,000 | 30,912 | ||
| FHLB | 5.63 | 3-14-2036 | 10,000 | 13,827 | ||
| FHLMC | 0.25 | 11-6-2023 | 650,000 | 637,549 | ||
| FHLMC | 0.32 | 11-24-2023 | 50,000 | 49,101 | ||
| FHLMC | 0.62 | 12-1-2025 | 900,000 | 867,083 | ||
| FHLMC | 1.50 | 11-1-2035 | 895,022 | 872,095 | ||
| FHLMC ## | 2.50 | 3-1-2032 | 1,793,508 | 1,820,604 | ||
| FHLMC | 2.50 | 2-1-2035 | 648,106 | 656,743 | ||
| FHLMC | 2.75 | 6-19-2023 | 220,000 | 224,217 | ||
| FHLMC | 3.00 | 2-1-2047 | 6,837,498 | 7,002,216 | ||
| FHLMC | 3.00 | 3-1-2048 | 49,628 | 50,543 | ||
| FHLMC | 3.00 | 6-1-2050 | 981,032 | 995,581 | ||
| FHLMC | 3.00 | 7-1-2050 | 2,286,159 | 2,329,724 | ||
| FHLMC | 3.00 | 8-1-2050 | 1,122,844 | 1,144,688 | ||
| FHLMC | 3.50 | 2-1-2044 | 5,732,273 | 6,033,805 | ||
| FHLMC | 3.50 | 4-1-2045 | 241,873 | 253,972 | ||
| FHLMC ## | 3.50 | 8-1-2047 | 2,018,397 | 2,099,358 | ||
| FHLMC | 5.50 | 7-15-2036 | 180,000 | 248,720 | ||
| FHLMC | 6.00 | 7-1-2040 | 1,360,048 | 1,555,037 | ||
| FHLMC | 6.75 | 3-15-2031 | 330,000 | 454,906 | ||
| FHLMC Series K029 Class A2 ±± | 3.32 | 2-25-2023 | 527,012 | 535,502 | ||
| FHLMC Series K030 Class A2 ±± | 3.25 | 4-25-2023 | 302,288 | 307,256 | ||
| FHLMC Series K032 Class A2 ±± | 3.31 | 5-25-2023 | 50,000 | 50,990 | ||
| FHLMC Series K034 Class A2 ±± | 3.53 | 7-25-2023 | 60,000 | 61,415 | ||
| FHLMC Series K035 Class A2 ±± | 3.46 | 8-25-2023 | 55,000 | 56,337 | ||
| FHLMC Series K048 Class A2 ±± | 3.28 | 6-25-2025 | 215,000 | 223,418 | ||
| FHLMC Series K062 Class A2 | 3.41 | 12-25-2026 | 750,000 | 793,750 | ||
| FHLMC Series K063 Class A2 ±± | 3.43 | 1-25-2027 | 45,000 | 47,596 | ||
| FHLMC Series K070 Class A2 ±± | 3.30 | 11-25-2027 | 425,000 | 449,194 | ||
| FHLMC Series K152 Class A1 | 2.83 | 5-25-2030 | 288,488 | 298,674 | ||
| FHLMC Series K152 Class A2 | 3.08 | 1-25-2031 | 125,000 | 131,456 | ||
| FHLMC Series K153 Class A3 ±± | 3.12 | 10-25-2031 | 70,000 | 74,851 | ||
| FHLMC Series K155 Class A3 | 3.75 | 4-25-2033 | 40,000 | 44,380 | ||
| FNMA | 0.25 | 5-22-2023 | 330,000 | 326,222 | ||
| FNMA | 0.25 | 7-10-2023 | 390,000 | 384,598 | ||
| FNMA | 0.35 | 8-18-2023 | 210,000 | 207,207 | ||
| FNMA | 0.38 | 7-21-2025 | 400,000 | 382,344 | ||
| FNMA | 0.50 | 11-7-2025 | 280,000 | 267,143 | ||
| FNMA | 0.63 | 4-22-2025 | 650,000 | 628,855 | ||
| FNMA %% | 1.50 | 3-17-2037 | 4,155,000 | 4,043,010 | ||
| FNMA %% | 1.50 | 3-14-2052 | 5,650,000 | 5,240,154 | ||
| FNMA %% | 2.00 | 3-17-2037 | 6,910,000 | 6,858,715 | ||
| Interest rate | Maturity date | Principal | Value | |||
| Agency securities (continued) | ||||||
| FNMA | 2.00% | 1-1-2041 | $ | 843,929 | $ 822,344 | |
| FNMA | 2.00 | 2-1-2042 | 2,008,800 | 1,956,182 | ||
| FNMA %% | 2.00 | 3-14-2052 | 44,210,000 | 42,407,061 | ||
| FNMA | 2.13 | 4-24-2026 | 180,000 | 182,399 | ||
| FNMA | 2.50 | 12-1-2027 | 336,542 | 341,320 | ||
| FNMA | 2.50 | 9-1-2031 | 1,188,010 | 1,206,024 | ||
| FNMA | 2.50 | 2-1-2035 | 849,272 | 860,595 | ||
| FNMA | 2.50 | 11-1-2050 | 3,424,758 | 3,391,480 | ||
| FNMA %% | 2.50 | 11-25-2051 | 20,435,000 | 20,161,203 | ||
| FNMA | 3.00 | 12-1-2026 | 1,276,258 | 1,311,037 | ||
| FNMA | 3.00 | 12-1-2030 | 276,606 | 285,501 | ||
| FNMA | 3.00 | 7-1-2032 | 1,364,672 | 1,408,430 | ||
| FNMA | 3.00 | 1-1-2034 | 200,675 | 206,951 | ||
| FNMA | 3.00 | 8-1-2036 | 103,860 | 106,306 | ||
| FNMA | 3.00 | 2-1-2037 | 1,737,561 | 1,782,297 | ||
| FNMA | 3.00 | 8-1-2043 | 1,235,599 | 1,272,257 | ||
| FNMA | 3.00 | 11-1-2046 | 1,399,218 | 1,440,871 | ||
| FNMA | 3.00 | 12-1-2047 | 704,937 | 717,512 | ||
| FNMA | 3.00 | 9-1-2050 | 4,669,799 | 4,753,812 | ||
| FNMA | 3.50 | 4-1-2034 | 1,712,414 | 1,776,205 | ||
| FNMA | 3.50 | 1-1-2035 | 94,036 | 98,067 | ||
| FNMA | 3.50 | 3-1-2036 | 987,479 | 1,029,646 | ||
| FNMA | 3.50 | 4-1-2037 | 437,223 | 450,481 | ||
| FNMA | 3.50 | 6-1-2042 | 273,775 | 287,904 | ||
| FNMA | 3.50 | 7-1-2042 | 404,227 | 425,104 | ||
| FNMA | 3.50 | 9-1-2043 | 890,616 | 936,723 | ||
| FNMA | 3.50 | 3-1-2048 | 267,794 | 277,420 | ||
| FNMA %% | 3.50 | 3-14-2052 | 1,750,000 | 1,802,227 | ||
| FNMA | 4.00 | 6-1-2042 | 4,553,306 | 4,880,062 | ||
| FNMA | 4.00 | 6-1-2042 | 335,446 | 358,006 | ||
| FNMA | 4.00 | 8-1-2043 | 2,000,659 | 2,138,862 | ||
| FNMA | 4.00 | 12-1-2047 | 1,274,235 | 1,339,552 | ||
| FNMA | 4.00 | 2-1-2048 | 1,570,830 | 1,693,323 | ||
| FNMA | 4.00 | 6-1-2048 | 294,099 | 308,317 | ||
| FNMA | 4.00 | 8-1-2048 | 199,921 | 209,020 | ||
| FNMA | 4.00 | 2-1-2050 | 519,238 | 543,092 | ||
| FNMA | 4.50 | 5-1-2040 | 189,778 | 206,087 | ||
| FNMA | 4.50 | 9-1-2040 | 4,304,367 | 4,673,237 | ||
| FNMA | 4.50 | 2-1-2047 | 1,392,158 | 1,488,977 | ||
| FNMA | 4.50 | 4-1-2048 | 401,419 | 427,635 | ||
| FNMA | 4.50 | 8-1-2048 | 23,206 | 24,527 | ||
| FNMA | 5.00 | 1-1-2042 | 157,697 | 175,304 | ||
| FNMA | 5.00 | 6-1-2045 | 723,310 | 804,966 | ||
| FNMA | 5.00 | 7-1-2045 | 959,435 | 1,061,596 | ||
| FNMA | 5.50 | 9-1-2040 | 1,385,192 | 1,560,159 | ||
| FNMA | 6.00 | 5-1-2041 | 82,472 | 94,280 | ||
| FNMA | 6.21 | 8-6-2038 | 60,000 | 91,220 | ||
| FNMA | 6.25 | 5-15-2029 | 100,000 | 128,567 | ||
| FNMA | 7.13 | 1-15-2030 | 250,000 | 343,153 | ||
| FNMA | 7.25 | 5-15-2030 | 380,000 | 532,936 | ||
| FNMA Series 2016-M5 Class A2 | 2.47 | 4-25-2026 | 220,000 | 221,507 | ||
| FNMA Series 2016-M7 Class A2 | 2.50 | 9-25-2026 | 109,940 | 109,173 | ||
| FNMA Series 2017-M1 Class A2 ±± | 2.42 | 10-25-2026 | 231,677 | 234,267 | ||
| FNMA Series 2017-M11 Class A2 | 2.98 | 8-25-2029 | 1,370,000 | 1,434,189 | ||
| FNMA Series 2017-M5 Class A2 ±± | 3.12 | 4-25-2029 | 65,356 | 69,036 | ||
| Interest rate | Maturity date | Principal | Value | |||
| Agency securities (continued) | ||||||
| FNMA Series 2018-M1 Class A2 ±± | 2.99% | 12-25-2027 | $ | 687,342 | $ 712,639 | |
| FNMA Series 2018-M13 Class A2 ±± | 3.71 | 9-25-2030 | 87,887 | 96,975 | ||
| FNMA Series 2019-M4 Class A2 | 3.61 | 2-25-2031 | 1,770,000 | 1,933,687 | ||
| FNMA Series 2019-M7 Class A2 | 3.14 | 4-25-2029 | 225,000 | 238,100 | ||
| FNMA Series 2020 M1 Class A2 | 2.44 | 10-25-2029 | 1,100,000 | 1,116,272 | ||
| GNMA %% | 2.00 | 3-21-2052 | 9,855,000 | 9,634,802 | ||
| GNMA %% | 2.50 | 3-21-2052 | 8,390,000 | 8,383,118 | ||
| GNMA | 3.00 | 4-20-2045 | 2,503,062 | 2,569,874 | ||
| GNMA | 3.00 | 11-20-2045 | 202,490 | 207,889 | ||
| GNMA | 3.00 | 3-20-2046 | 429,809 | 441,261 | ||
| GNMA | 3.00 | 12-20-2049 | 832,029 | 847,294 | ||
| GNMA | 3.00 | 10-20-2050 | 4,584,982 | 4,674,057 | ||
| GNMA | 3.50 | 2-20-2045 | 5,229,608 | 5,497,160 | ||
| GNMA | 3.50 | 6-20-2045 | 835,492 | 876,994 | ||
| GNMA | 3.50 | 11-20-2045 | 959,133 | 1,008,012 | ||
| GNMA | 3.50 | 7-20-2047 | 214,076 | 223,017 | ||
| GNMA | 3.50 | 5-20-2048 | 59,811 | 62,310 | ||
| GNMA | 4.00 | 7-20-2044 | 1,094,077 | 1,170,677 | ||
| GNMA | 4.00 | 8-20-2044 | 545,936 | 584,155 | ||
| GNMA | 4.00 | 9-20-2044 | 1,115,915 | 1,194,030 | ||
| GNMA | 4.00 | 12-20-2047 | 1,319,265 | 1,391,445 | ||
| TVA | 2.88 | 2-1-2027 | 35,000 | 36,705 | ||
| TVA | 4.63 | 9-15-2060 | 55,000 | 77,323 | ||
| TVA | 4.65 | 6-15-2035 | 9,000 | 11,110 | ||
| TVA | 5.38 | 4-1-2056 | 140,000 | 219,340 | ||
| TVA | 5.50 | 6-15-2038 | 30,000 | 41,983 | ||
| TVA | 5.88 | 4-1-2036 | 80,000 | 112,826 | ||
| TVA | 6.75 | 11-1-2025 | 120,000 | 141,261 | ||
| Total Agency securities (Cost $212,842,623) | 212,197,124 | |||||
| Asset-backed securities: 0.27% | ||||||
| Capital One Multi-Asset Execution Trust Series 2017-A3 Class A3 | 2.43 | 1-15-2025 | 110,000 | 110,093 | ||
| CarMax Auto Owner Trust Series 2018-3 Class D | 3.91 | 1-15-2025 | 80,000 | 80,995 | ||
| CenterPoint Energy Transition Restoration Bond Company LLC | 4.24 | 8-15-2023 | 14,559 | 14,670 | ||
| Chase Issuance Trust Series 2012-A7 Class A7 | 2.16 | 9-15-2024 | 205,000 | 206,368 | ||
| Citibank Credit Card Issuance Trust Series 2018-A3 Class A3 | 3.29 | 5-23-2025 | 180,000 | 184,079 | ||
| Citibank Credit Card Issuance Trust Series 2018-A7 Class A7 | 3.96 | 10-13-2030 | 130,000 | 144,089 | ||
| Ford Credit Floorplan Master Owner Trust Series 2017-3 Class A | 2.48 | 9-15-2024 | 50,000 | 50,340 | ||
| Ford Credit Floorplan Master Owner Trust Series 2018-2 Class A | 3.17 | 3-15-2025 | 100,000 | 100,685 | ||
| Ford Credit Floorplan Master Owner Trust Series 2019-2 Class A | 3.06 | 4-15-2026 | 65,000 | 66,572 | ||
| Nissan Auto Receivables Owner Trust Series 2018-B Class A4 | 3.16 | 12-16-2024 | 195,000 | 196,488 | ||
| Nissan Auto Receivables Owner Trust Series 2018-C Class A4 | 3.27 | 6-16-2025 | 155,000 | 157,055 | ||
| Interest rate | Maturity date | Principal | Value | |||
| Asset-backed securities (continued) | ||||||
| Synchrony Credit Card Master Note Trust Series 2018-2 Class A | 3.47% | 5-15-2026 | $ | 105,000 | $ 107,418 | |
| World Omni Auto Receivables Trust Series 2018-D Class A4 | 3.44 | 12-16-2024 | 28,000 | 28,427 | ||
| Total Asset-backed securities (Cost $1,434,832) | 1,447,279 | |||||
| Municipal obligations: 0.85% | ||||||
| California: 0.27% | ||||||
| Education revenue: 0.02% | ||||||
| California Series B | 3.90 | 11-1-2047 | 15,000 | 16,877 | ||
| University of California Series AD | 4.86 | 5-15-2112 | 70,000 | 92,891 | ||
| 109,768 | ||||||
| GO revenue: 0.16% | ||||||
| California Build America Bonds Taxable Various Purpose | 1.75 | 11-1-2030 | 110,000 | 103,222 | ||
| California Build America Bonds Taxable Various Purpose | 7.35 | 11-1-2039 | 70,000 | 104,247 | ||
| California Build America Bonds Taxable Various Purpose | 7.50 | 4-1-2034 | 100,000 | 146,020 | ||
| California Build America Bonds Taxable Various Purpose | 7.55 | 4-1-2039 | 170,000 | 267,385 | ||
| California Build America Bonds Taxable Various Purpose | 7.60 | 11-1-2040 | 15,000 | 24,006 | ||
| Los Angeles CA Community College District Build America Bonds | 6.75 | 8-1-2049 | 5,000 | 7,944 | ||
| Los Angeles CA Unified School District Build America Bonds | 5.75 | 7-1-2034 | 15,000 | 18,861 | ||
| Los Angeles CA Unified School District Build America Bonds | 5.76 | 7-1-2029 | 60,000 | 70,739 | ||
| Los Angeles CA Unified School District Build America Bonds | 6.76 | 7-1-2034 | 80,000 | 107,625 | ||
| 850,049 | ||||||
| Transportation revenue: 0.05% | ||||||
| Bay Area CA Toll Authority Series 1 | 6.26 | 4-1-2049 | 100,000 | 152,057 | ||
| Bay Area CA Toll Authority Series 1 | 6.92 | 4-1-2040 | 15,000 | 21,593 | ||
| Bay Area CA Toll Authority Series 1 | 7.04 | 4-1-2050 | 60,000 | 97,898 | ||
| 271,548 | ||||||
| Utilities revenue: 0.04% | ||||||
| Los Angeles CA Department of Water & Power Build America Bonds Series A | 5.72 | 7-1-2039 | 100,000 | 136,031 | ||
| Los Angeles CA Department of Water & Power Build America Bonds Series D | 6.57 | 7-1-2045 | 55,000 | 84,812 | ||
| 220,843 | ||||||
| Florida: 0.04% | ||||||
| Miscellaneous revenue: 0.04% | ||||||
| Florida Board of Administrative Finance | 2.15 | 7-1-2030 | 200,000 | 194,118 | ||
| Georgia: 0.00% | ||||||
| Utilities revenue: 0.00% | ||||||
| Municipal Electric Authority of Georgia Build America Bonds | 7.06 | 4-1-2057 | 10,000 | 14,050 | ||
| Interest rate | Maturity date | Principal | Value | |||
| Illinois: 0.07% | ||||||
| GO revenue: 0.01% | ||||||
| Illinois Taxable Pension | 5.10% | 6-1-2033 | $ | 50,000 | $ 55,161 | |
| Miscellaneous revenue: 0.01% | ||||||
| Illinois Build America Bonds Series 3 | 6.73 | 4-1-2035 | 45,000 | 53,216 | ||
| Tax revenue: 0.05% | ||||||
| Chicago IL Transit Authority Series B | 6.90 | 12-1-2040 | 210,000 | 281,665 | ||
| Kansas: 0.00% | ||||||
| Miscellaneous revenue: 0.00% | ||||||
| Kansas Development Finance Authority Series H | 4.93 | 4-15-2045 | 5,000 | 6,237 | ||
| Massachusetts: 0.03% | ||||||
| GO revenue: 0.03% | ||||||
| Massachusetts Build America Bonds Series A | 4.91 | 5-1-2029 | 130,000 | 150,588 | ||
| Massachusetts Build America Bonds Series D | 4.50 | 8-1-2031 | 5,000 | 5,733 | ||
| 156,321 | ||||||
| New Jersey: 0.06% | ||||||
| Miscellaneous revenue: 0.02% | ||||||
| New Jersey EDA Series A (NPFGC Insured) | 7.43 | 2-15-2029 | 95,000 | 116,050 | ||
| Transportation revenue: 0.04% | ||||||
| New Jersey Transportation Trust | 6.56 | 12-15-2040 | 60,000 | 82,195 | ||
| New Jersey Turnpike Authority Build America Bonds Series A | 7.10 | 1-1-2041 | 70,000 | 105,499 | ||
| 187,694 | ||||||
| New York: 0.17% | ||||||
| Airport revenue: 0.08% | ||||||
| Port Authority of New York & New Jersey Consolidated Bonds Series 174 | 4.46 | 10-1-2062 | 190,000 | 227,824 | ||
| Port Authority of New York & New Jersey Consolidated Bonds Series 201 | 4.23 | 10-15-2057 | 100,000 | 114,371 | ||
| Port Authority of New York & New Jersey Consolidated Bonds Series 210 | 4.03 | 9-1-2048 | 50,000 | 54,580 | ||
| 396,775 | ||||||
| Tax revenue: 0.09% | ||||||
| New York Metropolitan Transportation Authority Dedicated Tax Fund Build America Bonds | 7.34 | 11-15-2039 | 140,000 | 214,227 | ||
| New York NY Transitional Finance Authority Build America Bonds Subseries B-1 | 5.57 | 11-1-2038 | 130,000 | 161,369 | ||
| New York NY Transitional Finance Authority Build America Bonds Subseries C-2 | 5.77 | 8-1-2036 | 100,000 | 120,707 | ||
| 496,303 | ||||||
| Water & sewer revenue: 0.00% | ||||||
| New York NY Municipal Water Finance Authority Series AA | 5.44 | 6-15-2043 | 10,000 | 13,541 | ||
| Interest rate | Maturity date | Principal | Value | |||
| Ohio: 0.04% | ||||||
| Education revenue: 0.00% | ||||||
| Ohio State University Build America Bonds | 4.91% | 6-1-2040 | $ | 5,000 | $ 6,362 | |
| Utilities revenue: 0.04% | ||||||
| American Municipal Power Ohio Incorporated Build America Bonds | 5.94 | 2-15-2047 | 150,000 | 209,781 | ||
| Oregon: 0.03% | ||||||
| Tax revenue: 0.03% | ||||||
| Oregon Department of Transportation Build America Bonds Series A | 5.83 | 11-15-2034 | 50,000 | 66,151 | ||
| Oregon Taxable Pension | 5.76 | 6-1-2023 | 75,549 | 78,096 | ||
| 144,247 | ||||||
| Pennsylvania: 0.00% | ||||||
| Transportation revenue: 0.00% | ||||||
| Pennsylvania Turnpike Commission Series B | 5.51 | 12-1-2045 | 5,000 | 6,740 | ||
| Texas: 0.13% | ||||||
| Airport revenue: 0.03% | ||||||
| Dallas Fort Worth TX International Airport Refunding Bonds Series 2021C | 2.84 | 11-1-2046 | 170,000 | 161,454 | ||
| GO revenue: 0.02% | ||||||
| Texas Transportation Commission | 2.56 | 4-1-2042 | 90,000 | 81,867 | ||
| Transportation revenue: 0.06% | ||||||
| Grand Parkway Transportation Corporation Series 2013E | 5.18 | 10-1-2042 | 50,000 | 63,131 | ||
| Northern Texas Tollway Authority | 3.01 | 1-1-2043 | 200,000 | 192,593 | ||
| Texas Private Activity Bond North Tarrant Express Managed Lanes Project Series B | 3.92 | 12-31-2049 | 50,000 | 50,174 | ||
| 305,898 | ||||||
| Utilities revenue: 0.02% | ||||||
| San Antonio TX Electric and Gas Revenue | 4.43 | 2-1-2042 | 110,000 | 128,313 | ||
| Wisconsin: 0.01% | ||||||
| Tax revenue: 0.01% | ||||||
| Wisconsin General Fund Annual Appropriations Series C | 3.15 | 5-1-2027 | 80,000 | 84,538 | ||
| Total Municipal obligations (Cost $4,434,555) | 4,552,539 | |||||
| Non-agency mortgage-backed securities: 1.10% | ||||||
| Benchmark Mortgage Trust Series 2018-B1 Class A4 | 3.40 | 1-15-2051 | 25,000 | 25,531 | ||
| Benchmark Mortgage Trust Series 2018-B6 Class A4 | 4.26 | 10-10-2051 | 135,000 | 146,430 | ||
| CFCRE Commercial Mortgage Trust Series 2016-C7 Class A3 | 3.84 | 12-10-2054 | 20,000 | 20,867 | ||
| Citigroup Commercial Mortgage Trust Series 2015-GC27 Class A5 | 3.14 | 2-10-2048 | 55,000 | 55,717 | ||
| Citigroup Commercial Mortgage Trust Series 2016 GC37 Class B | 4.23 | 4-10-2049 | 110,000 | 110,578 | ||
| Citigroup Commercial Mortgage Trust Series 2016-GC36 Class B ±± | 4.75 | 2-10-2049 | 40,000 | 41,254 | ||
| Citigroup Commercial Mortgage Trust Series 2016-GC36 Class C ±± | 4.75 | 2-10-2049 | 95,000 | 94,287 | ||
| Interest rate | Maturity date | Principal | Value | |||
| Non-agency mortgage-backed securities (continued) | ||||||
| Citigroup Commercial Mortgage Trust Series 2016-P4 Class A4 | 2.90% | 7-10-2049 | $ | 135,000 | $ 136,172 | |
| Citigroup Commercial Mortgage Trust Series 2017-P8 Class AS ±± | 3.79 | 9-15-2050 | 300,000 | 312,034 | ||
| Citigroup Commercial Mortgage Trust Series 2018-C6 Class A4 | 4.41 | 11-10-2051 | 520,000 | 567,478 | ||
| Commercial Mortgage Trust Series 2013-CR6 Class A4 | 3.10 | 3-10-2046 | 60,000 | 60,249 | ||
| Commercial Mortgage Trust Series 2014 UBS5 Class C ±± | 4.61 | 9-10-2047 | 195,000 | 194,142 | ||
| Commercial Mortgage Trust Series 2014-UBS6 Class C ±± | 4.44 | 12-10-2047 | 60,000 | 59,605 | ||
| Commercial Mortgage Trust Series 2015-CR23 Class A3 | 3.23 | 5-10-2048 | 60,000 | 60,260 | ||
| Commercial Mortgage Trust Series 2016-COR1 Class C ±± | 4.33 | 10-10-2049 | 65,000 | 65,667 | ||
| Commercial Mortgage Trust Series 2016-CR28 Class A4 | 3.76 | 2-10-2049 | 215,000 | 222,880 | ||
| Goldman Sachs Mortgage Securities Trust Series 2012-GCJ9 Class AS | 3.12 | 11-10-2045 | 40,000 | 40,231 | ||
| Goldman Sachs Mortgage Securities Trust Series 2013-GC14 Class A5 | 4.24 | 8-10-2046 | 265,000 | 271,508 | ||
| Goldman Sachs Mortgage Securities Trust Series 2014-GC18 Class B ±± | 4.89 | 1-10-2047 | 80,000 | 78,441 | ||
| Goldman Sachs Mortgage Securities Trust Series 2014-GC26 Class A5 | 3.63 | 11-10-2047 | 340,000 | 349,043 | ||
| Goldman Sachs Mortgage Securities Trust Series 2018-GS10 Class AAB ±± | 4.11 | 7-10-2051 | 180,000 | 189,936 | ||
| Goldman Sachs Mortgage Securities Trust Series 2018-GS9 Class A4 ±± | 3.99 | 3-10-2051 | 140,000 | 148,033 | ||
| JPMorgan Chase Commercial Mortgage Securities Trust Series 2013-C15 Class A4 | 4.10 | 11-15-2045 | 10,673 | 10,883 | ||
| JPMorgan Chase Commercial Mortgage Securities Trust Series 2015-C29 Class A4 | 3.61 | 5-15-2048 | 200,000 | 205,328 | ||
| JPMorgan Chase Commercial Mortgage Securities Trust Series 2015-C31 Class A3 | 3.80 | 8-15-2048 | 190,577 | 196,833 | ||
| Morgan Stanley Bank of America Merrill Lynch Trust Series 2013-C11 Class AS ±± | 4.35 | 8-15-2046 | 360,000 | 355,169 | ||
| Morgan Stanley Bank of America Merrill Lynch Trust Series 2013-C8 Class A4 | 3.13 | 12-15-2048 | 50,000 | 50,321 | ||
| Morgan Stanley Bank of America Merrill Lynch Trust Series 2015-C22 Class A4 | 3.31 | 4-15-2048 | 60,000 | 60,985 | ||
| Morgan Stanley Bank of America Merrill Lynch Trust Series 2015-C22 Class ASB | 3.04 | 4-15-2048 | 622,986 | 629,389 | ||
| Morgan Stanley Bank of America Merrill Lynch Trust Series 2015-C22 Class B ±± | 3.88 | 4-15-2048 | 285,000 | 283,312 | ||
| Morgan Stanley Bank of America Merrill Lynch Trust Series 2015-C24 Class A4 | 3.73 | 5-15-2048 | 400,000 | 413,802 | ||
| Morgan Stanley Bank of America Merrill Lynch Trust Series 2016-C30 Class B ±± | 3.31 | 9-15-2049 | 425,000 | 410,102 | ||
| Total Non-agency mortgage-backed securities (Cost $5,909,175) | 5,866,467 | |||||
| U.S. Treasury securities: 52.76% | ||||||
| U.S. Treasury Bond | 1.13 | 5-15-2040 | 840,000 | 698,578 | ||
| U.S. Treasury Bond | 1.13 | 8-15-2040 | 1,885,000 | 1,561,752 | ||
| U.S. Treasury Bond | 1.25 | 5-15-2050 | 2,355,000 | 1,878,664 | ||
| U.S. Treasury Bond | 1.38 | 11-15-2040 | 1,350,000 | 1,167,328 | ||
| U.S. Treasury Bond | 1.38 | 8-15-2050 | 2,030,000 | 1,671,182 | ||
| U.S. Treasury Bond | 1.63 | 11-15-2050 | 2,975,000 | 2,606,611 | ||
| Interest rate | Maturity date | Principal | Value | |||
| U.S. Treasury securities (continued) | ||||||
| U.S. Treasury Bond | 1.75% | 8-15-2041 | $ | 3,105,000 | $ 2,845,927 | |
| U.S. Treasury Bond | 1.88 | 2-15-2041 | 315,000 | 296,125 | ||
| U.S. Treasury Bond | 1.88 | 2-15-2051 | 2,065,000 | 1,922,386 | ||
| U.S. Treasury Bond | 2.00 | 2-15-2050 | 2,515,000 | 2,408,407 | ||
| U.S. Treasury Bond | 2.25 | 8-15-2046 | 390,000 | 385,902 | ||
| U.S. Treasury Bond | 2.25 | 8-15-2049 | 1,725,000 | 1,739,353 | ||
| U.S. Treasury Bond | 2.38 | 11-15-2049 | 1,660,000 | 1,721,213 | ||
| U.S. Treasury Bond | 2.50 | 2-15-2045 | 555,000 | 572,972 | ||
| U.S. Treasury Bond | 2.50 | 2-15-2046 | 100,000 | 103,559 | ||
| U.S. Treasury Bond | 2.50 | 5-15-2046 | 200,000 | 207,125 | ||
| U.S. Treasury Bond | 2.75 | 8-15-2042 | 3,085,000 | 3,322,039 | ||
| U.S. Treasury Bond | 2.75 | 11-15-2042 | 1,770,000 | 1,904,824 | ||
| U.S. Treasury Bond | 2.75 | 8-15-2047 | 270,000 | 295,545 | ||
| U.S. Treasury Bond | 2.75 | 11-15-2047 | 270,000 | 296,009 | ||
| U.S. Treasury Bond | 2.88 | 5-15-2043 | 605,000 | 663,279 | ||
| U.S. Treasury Bond | 2.88 | 8-15-2045 | 265,000 | 292,328 | ||
| U.S. Treasury Bond | 2.88 | 11-15-2046 | 265,000 | 294,088 | ||
| U.S. Treasury Bond | 3.00 | 5-15-2042 | 145,000 | 162,411 | ||
| U.S. Treasury Bond | 3.00 | 11-15-2044 | 265,000 | 297,390 | ||
| U.S. Treasury Bond | 3.00 | 5-15-2045 | 105,000 | 118,027 | ||
| U.S. Treasury Bond | 3.00 | 11-15-2045 | 35,000 | 39,475 | ||
| U.S. Treasury Bond | 3.00 | 2-15-2047 | 310,000 | 352,092 | ||
| U.S. Treasury Bond | 3.00 | 5-15-2047 | 7,931,000 | 9,031,736 | ||
| U.S. Treasury Bond | 3.00 | 2-15-2048 | 435,000 | 500,437 | ||
| U.S. Treasury Bond | 3.00 | 2-15-2049 | 320,000 | 371,363 | ||
| U.S. Treasury Bond | 3.13 | 11-15-2041 | 1,090,000 | 1,241,450 | ||
| U.S. Treasury Bond | 3.13 | 2-15-2042 | 2,055,000 | 2,344,867 | ||
| U.S. Treasury Bond | 3.13 | 2-15-2043 | 475,000 | 540,813 | ||
| U.S. Treasury Bond | 3.13 | 8-15-2044 | 110,000 | 125,787 | ||
| U.S. Treasury Bond | 3.13 | 5-15-2048 | 250,000 | 294,658 | ||
| U.S. Treasury Bond | 3.38 | 5-15-2044 | 20,000 | 23,742 | ||
| U.S. Treasury Bond | 3.50 | 2-15-2039 | 15,000 | 18,046 | ||
| U.S. Treasury Bond | 3.63 | 8-15-2043 | 110,000 | 134,853 | ||
| U.S. Treasury Bond | 3.63 | 2-15-2044 | 35,000 | 42,998 | ||
| U.S. Treasury Bond | 3.75 | 8-15-2041 | 35,000 | 43,373 | ||
| U.S. Treasury Bond | 3.75 | 11-15-2043 | 350,000 | 437,295 | ||
| U.S. Treasury Bond | 3.88 | 8-15-2040 | 1,040,000 | 1,306,013 | ||
| U.S. Treasury Bond | 4.25 | 11-15-2040 | 480,000 | 630,619 | ||
| U.S. Treasury Bond | 4.38 | 5-15-2040 | 800,000 | 1,069,156 | ||
| U.S. Treasury Bond | 4.38 | 5-15-2041 | 1,905,000 | 2,549,128 | ||
| U.S. Treasury Bond | 4.50 | 8-15-2039 | 550,000 | 745,186 | ||
| U.S. Treasury Bond | 4.75 | 2-15-2041 | 120,000 | 167,517 | ||
| U.S. Treasury Bond | 5.38 | 2-15-2031 | 447,000 | 579,441 | ||
| U.S. Treasury Bond | 5.50 | 8-15-2028 | 5,200,000 | 6,364,719 | ||
| U.S. Treasury Bond | 6.13 | 11-15-2027 | 245,000 | 302,862 | ||
| U.S. Treasury Bond | 6.38 | 8-15-2027 | 50,000 | 61,994 | ||
| U.S. Treasury Bond | 6.88 | 8-15-2025 | 335,000 | 393,834 | ||
| U.S. Treasury Note | 0.13 | 5-15-2023 | 2,815,000 | 2,779,263 | ||
| U.S. Treasury Note | 0.13 | 7-15-2023 | 545,000 | 536,612 | ||
| U.S. Treasury Note | 0.13 | 8-15-2023 | 3,190,000 | 3,135,296 | ||
| U.S. Treasury Note | 0.13 | 9-15-2023 | 2,855,000 | 2,802,249 | ||
| U.S. Treasury Note | 0.25 | 4-15-2023 | 1,475,000 | 1,459,731 | ||
| U.S. Treasury Note | 0.25 | 6-15-2023 | 2,925,000 | 2,888,438 | ||
| U.S. Treasury Note | 0.25 | 11-15-2023 | 3,105,000 | 3,044,719 | ||
| U.S. Treasury Note | 0.25 | 6-15-2024 | 2,360,000 | 2,291,044 | ||
| Interest rate | Maturity date | Principal | Value | |||
| U.S. Treasury securities (continued) | ||||||
| U.S. Treasury Note | 0.25% | 5-31-2025 | $ | 1,790,000 | $ 1,709,170 | |
| U.S. Treasury Note | 0.25 | 6-30-2025 | 1,295,000 | 1,234,550 | ||
| U.S. Treasury Note | 0.25 | 7-31-2025 | 3,000,000 | 2,856,797 | ||
| U.S. Treasury Note | 0.25 | 8-31-2025 | 3,980,000 | 3,782,710 | ||
| U.S. Treasury Note | 0.25 | 9-30-2025 | 1,370,000 | 1,300,323 | ||
| U.S. Treasury Note | 0.25 | 10-31-2025 | 1,905,000 | 1,805,657 | ||
| U.S. Treasury Note | 0.38 | 9-15-2024 | 2,750,000 | 2,666,748 | ||
| U.S. Treasury Note | 0.38 | 12-31-2025 | 2,315,000 | 2,199,973 | ||
| U.S. Treasury Note | 0.38 | 7-31-2027 | 1,860,000 | 1,726,821 | ||
| U.S. Treasury Note | 0.38 | 9-30-2027 | 2,000,000 | 1,850,938 | ||
| U.S. Treasury Note | 0.50 | 3-15-2023 | 2,915,000 | 2,896,440 | ||
| U.S. Treasury Note | 0.50 | 3-31-2025 | 1,675,000 | 1,617,095 | ||
| U.S. Treasury Note | 0.50 | 2-28-2026 | 460,000 | 438,060 | ||
| U.S. Treasury Note | 0.50 | 5-31-2027 | 1,645,000 | 1,541,031 | ||
| U.S. Treasury Note | 0.50 | 6-30-2027 | 2,225,000 | 2,082,113 | ||
| U.S. Treasury Note | 0.50 | 8-31-2027 | 815,000 | 760,433 | ||
| U.S. Treasury Note | 0.63 | 7-31-2026 | 3,145,000 | 2,994,875 | ||
| U.S. Treasury Note | 0.63 | 11-30-2027 | 2,840,000 | 2,658,395 | ||
| U.S. Treasury Note | 0.63 | 12-31-2027 | 2,145,000 | 2,006,329 | ||
| U.S. Treasury Note | 0.63 | 5-15-2030 | 2,675,000 | 2,430,906 | ||
| U.S. Treasury Note | 0.63 | 8-15-2030 | 3,160,000 | 2,863,627 | ||
| U.S. Treasury Note | 0.75 | 11-15-2024 | 3,010,000 | 2,940,629 | ||
| U.S. Treasury Note | 0.75 | 3-31-2026 | 2,535,000 | 2,436,472 | ||
| U.S. Treasury Note | 0.75 | 4-30-2026 | 2,060,000 | 1,977,761 | ||
| U.S. Treasury Note | 0.75 | 5-31-2026 | 2,860,000 | 2,743,366 | ||
| U.S. Treasury Note | 0.75 | 8-31-2026 | 3,085,000 | 2,952,200 | ||
| U.S. Treasury Note | 0.75 | 1-31-2028 | 1,615,000 | 1,519,677 | ||
| U.S. Treasury Note | 0.88 | 6-30-2026 | 1,925,000 | 1,855,144 | ||
| U.S. Treasury Note | 0.88 | 11-15-2030 | 3,240,000 | 2,993,077 | ||
| U.S. Treasury Note | 1.00 | 7-31-2028 | 2,885,000 | 2,741,313 | ||
| U.S. Treasury Note | 1.13 | 2-28-2025 | 1,855,000 | 1,827,175 | ||
| U.S. Treasury Note | 1.13 | 8-31-2028 | 3,010,000 | 2,880,664 | ||
| U.S. Treasury Note | 1.13 | 2-15-2031 | 3,135,000 | 2,953,635 | ||
| U.S. Treasury Note | 1.25 | 7-31-2023 | 630,000 | 629,705 | ||
| U.S. Treasury Note | 1.25 | 8-31-2024 | 1,610,000 | 1,597,045 | ||
| U.S. Treasury Note | 1.25 | 3-31-2028 | 3,080,000 | 2,981,584 | ||
| U.S. Treasury Note | 1.25 | 6-30-2028 | 3,025,000 | 2,921,725 | ||
| U.S. Treasury Note | 1.25 | 8-15-2031 | 3,115,000 | 2,957,790 | ||
| U.S. Treasury Note | 1.38 | 6-30-2023 | 4,245,000 | 4,251,633 | ||
| U.S. Treasury Note | 1.38 | 8-31-2023 | 725,000 | 725,368 | ||
| U.S. Treasury Note | 1.38 | 9-30-2023 | 6,135,000 | 6,137,157 | ||
| U.S. Treasury Note | 1.38 | 8-31-2026 | 2,175,000 | 2,139,826 | ||
| U.S. Treasury Note | 1.38 | 10-31-2028 | 1,720,000 | 1,670,617 | ||
| U.S. Treasury Note | 1.38 | 11-15-2031 | 1,290,000 | 1,236,586 | ||
| U.S. Treasury Note | 1.50 | 2-28-2023 | 395,000 | 396,512 | ||
| U.S. Treasury Note | 1.50 | 3-31-2023 | 1,755,000 | 1,761,650 | ||
| U.S. Treasury Note | 1.50 | 9-30-2024 | 3,215,000 | 3,206,963 | ||
| U.S. Treasury Note | 1.50 | 10-31-2024 | 225,000 | 224,376 | ||
| U.S. Treasury Note | 1.50 | 8-15-2026 | 545,000 | 539,209 | ||
| U.S. Treasury Note | 1.50 | 1-31-2027 | 755,000 | 746,093 | ||
| U.S. Treasury Note | 1.50 | 11-30-2028 | 4,935,000 | 4,831,673 | ||
| U.S. Treasury Note | 1.50 | 2-15-2030 | 2,090,000 | 2,041,505 | ||
| U.S. Treasury Note | 1.63 | 4-30-2023 | 280,000 | 281,378 | ||
| U.S. Treasury Note | 1.63 | 5-31-2023 | 3,090,000 | 3,105,450 | ||
| U.S. Treasury Note | 1.63 | 10-31-2023 | 2,540,000 | 2,549,624 | ||
| Interest rate | Maturity date | Principal | Value | |||
| U.S. Treasury securities (continued) | ||||||
| U.S. Treasury Note | 1.63% | 2-15-2026 | $ | 6,240,000 | $ 6,212,700 | |
| U.S. Treasury Note | 1.63 | 5-15-2026 | 2,720,000 | 2,706,294 | ||
| U.S. Treasury Note | 1.63 | 9-30-2026 | 1,395,000 | 1,387,262 | ||
| U.S. Treasury Note | 1.63 | 10-31-2026 | 915,000 | 909,960 | ||
| U.S. Treasury Note | 1.63 | 8-15-2029 | 1,945,000 | 1,920,536 | ||
| U.S. Treasury Note | 1.63 | 5-15-2031 | 3,040,000 | 2,987,156 | ||
| U.S. Treasury Note | 1.75 | 5-15-2023 | 410,000 | 412,675 | ||
| U.S. Treasury Note | 1.75 | 6-30-2024 | 3,510,000 | 3,526,453 | ||
| U.S. Treasury Note | 1.75 | 11-15-2029 | 830,000 | 827,309 | ||
| U.S. Treasury Note | 1.88 | 8-31-2024 | 3,290,000 | 3,314,289 | ||
| U.S. Treasury Note | 2.00 | 6-30-2024 | 1,986,000 | 2,006,869 | ||
| U.S. Treasury Note | 2.00 | 2-15-2025 | 340,000 | 343,533 | ||
| U.S. Treasury Note | 2.00 | 8-15-2025 | 2,495,000 | 2,519,463 | ||
| U.S. Treasury Note | 2.00 | 8-15-2051 | 2,940,000 | 2,820,103 | ||
| U.S. Treasury Note | 2.13 | 11-30-2023 | 750,000 | 759,082 | ||
| U.S. Treasury Note | 2.13 | 9-30-2024 | 3,270,000 | 3,313,941 | ||
| U.S. Treasury Note | 2.13 | 11-30-2024 | 995,000 | 1,008,409 | ||
| U.S. Treasury Note | 2.13 | 5-15-2025 | 880,000 | 892,238 | ||
| U.S. Treasury Note | 2.25 | 12-31-2023 | 15,000 | 15,219 | ||
| U.S. Treasury Note | 2.25 | 4-30-2024 | 605,000 | 614,406 | ||
| U.S. Treasury Note | 2.25 | 10-31-2024 | 2,035,000 | 2,069,341 | ||
| U.S. Treasury Note | 2.25 | 11-15-2024 | 640,000 | 650,900 | ||
| U.S. Treasury Note | 2.25 | 12-31-2024 | 1,485,000 | 1,511,046 | ||
| U.S. Treasury Note | 2.25 | 11-15-2025 | 10,340,000 | 10,536,693 | ||
| U.S. Treasury Note | 2.25 | 2-15-2027 | 1,065,000 | 1,090,127 | ||
| U.S. Treasury Note | 2.25 | 11-15-2027 | 20,000 | 20,492 | ||
| U.S. Treasury Note | 2.25 | 5-15-2041 | 300,000 | 299,051 | ||
| U.S. Treasury Note | 2.38 | 8-15-2024 | 490,000 | 499,379 | ||
| U.S. Treasury Note | 2.38 | 5-15-2027 | 2,493,000 | 2,568,472 | ||
| U.S. Treasury Note | 2.38 | 5-15-2029 | 100,000 | 103,738 | ||
| U.S. Treasury Note | 2.38 | 5-15-2051 | 1,920,000 | 2,001,975 | ||
| U.S. Treasury Note | 2.50 | 8-15-2023 | 270,000 | 274,672 | ||
| U.S. Treasury Note | 2.50 | 5-15-2024 | 1,150,000 | 1,174,123 | ||
| U.S. Treasury Note | 2.50 | 1-31-2025 | 1,670,000 | 1,711,163 | ||
| U.S. Treasury Note | 2.50 | 2-28-2026 | 800,000 | 823,375 | ||
| U.S. Treasury Note | 2.63 | 12-31-2025 | 95,000 | 98,184 | ||
| U.S. Treasury Note | 2.63 | 2-15-2029 | 3,060,000 | 3,220,411 | ||
| U.S. Treasury Note | 2.75 | 11-15-2023 | 2,040,000 | 2,086,298 | ||
| U.S. Treasury Note | 2.75 | 2-28-2025 | 90,000 | 92,883 | ||
| U.S. Treasury Note | 2.75 | 6-30-2025 | 1,270,000 | 1,313,656 | ||
| U.S. Treasury Note | 2.75 | 2-15-2028 | 2,685,000 | 2,829,633 | ||
| U.S. Treasury Note | 2.88 | 11-30-2025 | 1,145,000 | 1,192,813 | ||
| U.S. Treasury Note | 2.88 | 5-15-2028 | 2,295,000 | 2,437,362 | ||
| U.S. Treasury Note | 2.88 | 8-15-2028 | 2,510,000 | 2,670,699 | ||
| U.S. Treasury Note | 3.13 | 11-15-2028 | 1,910,000 | 2,065,859 | ||
| U.S. Treasury Note | 6.00 | 2-15-2026 | 450,000 | 524,707 | ||
| U.S. Treasury Note | 6.50 | 11-15-2026 | 745,000 | 904,884 | ||
| U.S. Treasury Note | 7.50 | 11-15-2024 | 695,000 | 805,033 | ||
| Total U.S. Treasury securities (Cost $287,134,974) | 282,336,269 | |||||
| Interest rate | Maturity date | Principal | Value | |||
| Yankee corporate bonds and notes: 2.72% | ||||||
| Energy: 0.12% | ||||||
| Oil, gas & consumable fuels: 0.12% | ||||||
| Equinor ASA | 1.75% | 1-22-2026 | $ | 330,000 | $ 323,611 | |
| Equinor ASA | 3.00 | 4-6-2027 | 150,000 | 153,839 | ||
| Equinor ASA | 3.63 | 4-6-2040 | 40,000 | 41,143 | ||
| Equinor ASA | 4.25 | 11-23-2041 | 130,000 | 143,737 | ||
| 662,330 | ||||||
| Financials: 2.60% | ||||||
| Banks: 2.60% | ||||||
| African Development Bank | 0.75 | 4-3-2023 | 410,000 | 407,890 | ||
| Asian Development Bank | 0.25 | 7-14-2023 | 160,000 | 157,693 | ||
| Asian Development Bank | 0.25 | 10-6-2023 | 580,000 | 569,500 | ||
| Asian Development Bank | 0.38 | 9-3-2025 | 200,000 | 190,326 | ||
| Asian Development Bank | 1.50 | 10-18-2024 | 360,000 | 358,699 | ||
| Asian Development Bank | 1.75 | 9-19-2029 | 160,000 | 157,863 | ||
| Asian Development Bank | 1.88 | 1-24-2030 | 110,000 | 109,301 | ||
| Asian Development Bank | 2.00 | 4-24-2026 | 60,000 | 60,335 | ||
| Asian Development Bank | 2.13 | 3-19-2025 | 60,000 | 60,719 | ||
| Asian Development Bank | 2.63 | 1-12-2027 | 180,000 | 186,474 | ||
| Asian Development Bank | 5.82 | 6-16-2028 | 10,000 | 12,261 | ||
| Asian Development Bank | 6.22 | 8-15-2027 | 80,000 | 96,255 | ||
| Asian Infrastructure Investment Bank | 0.50 | 5-28-2025 | 350,000 | 335,699 | ||
| European Bank for Reconstruction & Development | 0.50 | 5-19-2025 | 430,000 | 412,571 | ||
| European Investment Bank | 0.25 | 9-15-2023 | 470,000 | 461,987 | ||
| European Investment Bank | 0.63 | 7-25-2025 | 160,000 | 153,968 | ||
| European Investment Bank | 0.88 | 5-17-2030 | 50,000 | 46,049 | ||
| European Investment Bank | 1.25 | 2-14-2031 | 440,000 | 416,143 | ||
| European Investment Bank | 1.88 | 2-10-2025 | 110,000 | 110,665 | ||
| European Investment Bank | 2.00 | 12-15-2022 | 100,000 | 100,742 | ||
| European Investment Bank | 2.25 | 6-24-2024 | 640,000 | 648,340 | ||
| European Investment Bank | 2.50 | 3-15-2023 | 200,000 | 202,632 | ||
| European Investment Bank | 3.25 | 1-29-2024 | 20,000 | 20,663 | ||
| Inter-American Development Bank | 0.88 | 4-20-2026 | 470,000 | 451,216 | ||
| Inter-American Development Bank | 1.13 | 7-20-2028 | 280,000 | 266,683 | ||
| Inter-American Development Bank | 1.75 | 3-14-2025 | 170,000 | 170,184 | ||
| Inter-American Development Bank | 2.00 | 6-2-2026 | 260,000 | 261,487 | ||
| Inter-American Development Bank | 2.13 | 1-15-2025 | 150,000 | 151,918 | ||
| Inter-American Development Bank | 2.38 | 7-7-2027 | 30,000 | 30,738 | ||
| Inter-American Development Bank | 3.13 | 9-18-2028 | 250,000 | 268,131 | ||
| Inter-American Development Bank | 4.38 | 1-24-2044 | 60,000 | 79,114 | ||
| Inter-American Development Bank | 7.00 | 6-15-2025 | 50,000 | 58,148 | ||
| International Bank for Reconstruction & Development | 0.38 | 7-28-2025 | 220,000 | 209,830 | ||
| International Bank for Reconstruction & Development | 0.50 | 10-28-2025 | 410,000 | 391,012 | ||
| International Bank for Reconstruction & Development | 0.75 | 8-26-2030 | 130,000 | 118,117 | ||
| International Bank for Reconstruction & Development | 1.50 | 8-28-2024 | 30,000 | 29,922 | ||
| International Bank for Reconstruction & Development | 1.63 | 11-3-2031 | 190,000 | 184,684 | ||
| International Bank for Reconstruction & Development | 1.88 | 6-19-2023 | 470,000 | 473,519 | ||
| International Bank for Reconstruction & Development | 2.50 | 3-19-2024 | 260,000 | 265,010 | ||
| International Bank for Reconstruction & Development | 2.50 | 7-29-2025 | 570,000 | 583,704 | ||
| International Bank for Reconstruction & Development | 2.50 | 11-22-2027 | 370,000 | 381,455 | ||
| International Finance Corporation | 1.38 | 10-16-2024 | 100,000 | 99,034 | ||
| International Finance Corporation | 2.13 | 4-7-2026 | 100,000 | 101,626 | ||
| Interest rate | Maturity date | Principal | Value | |||
| Banks (continued) | ||||||
| KfW ¤ | 0.00% | 4-18-2036 | $ | 80,000 | $ 59,096 | |
| KfW ¤ | 0.00 | 6-29-2037 | 50,000 | 35,873 | ||
| KfW | 0.50 | 9-20-2024 | 540,000 | 524,507 | ||
| KfW | 0.63 | 1-22-2026 | 640,000 | 610,956 | ||
| KfW | 0.75 | 9-30-2030 | 260,000 | 235,582 | ||
| KfW | 2.00 | 5-2-2025 | 40,000 | 40,330 | ||
| KfW | 2.88 | 4-3-2028 | 410,000 | 432,295 | ||
| Korea Development Bank | 3.38 | 9-16-2025 | 410,000 | 427,450 | ||
| Landwirtschaftliche Rentenbank | 1.75 | 7-27-2026 | 10,000 | 9,970 | ||
| Landwirtschaftliche Rentenbank | 2.00 | 1-13-2025 | 150,000 | 151,368 | ||
| Landwirtschaftliche Rentenbank | 3.13 | 11-14-2023 | 350,000 | 359,788 | ||
| Nordic Investment Bank | 0.38 | 9-11-2025 | 370,000 | 350,772 | ||
| Oesterreichische Kontrollbank AG | 2.88 | 3-13-2023 | 260,000 | 264,301 | ||
| Swedish Export Credit ¤ | 0.00 | 5-11-2037 | 65,000 | 41,690 | ||
| Swedish Export Credit | 0.50 | 8-26-2025 | 510,000 | 487,292 | ||
| 13,883,577 | ||||||
| Total Yankee corporate bonds and notes (Cost $14,913,357) | 14,545,907 | |||||
| Yankee government bonds: 2.00% | ||||||
| Canada Government | 1.63 | 1-22-2025 | 235,000 | 234,540 | ||
| Export Development Canada | 2.63 | 2-21-2024 | 320,000 | 326,614 | ||
| Export-Import Bank of Korea | 2.88 | 1-21-2025 | 400,000 | 408,786 | ||
| Japan Bank for International Cooperation | 0.38 | 9-15-2023 | 360,000 | 353,895 | ||
| Japan Bank for International Cooperation | 2.38 | 4-20-2026 | 320,000 | 324,557 | ||
| Japan Bank for International Cooperation | 2.75 | 11-16-2027 | 360,000 | 372,794 | ||
| Japan Bank for International Cooperation | 3.38 | 10-31-2023 | 270,000 | 278,115 | ||
| Oriental Republic of Uruguay | 4.38 | 1-23-2031 | 75,000 | 82,445 | ||
| Oriental Republic of Uruguay | 4.50 | 8-14-2024 | 15,000 | 15,559 | ||
| Oriental Republic of Uruguay | 4.98 | 4-20-2055 | 200,000 | 236,920 | ||
| Oriental Republic of Uruguay | 5.10 | 6-18-2050 | 35,000 | 41,754 | ||
| Province of Alberta | 1.30 | 7-22-2030 | 210,000 | 194,267 | ||
| Province of Alberta | 1.88 | 11-13-2024 | 210,000 | 210,584 | ||
| Province of British Columbia | 7.25 | 9-1-2036 | 100,000 | 152,839 | ||
| Province of Manitoba | 3.05 | 5-14-2024 | 150,000 | 154,292 | ||
| Province of Ontario | 1.05 | 5-21-2027 | 150,000 | 142,592 | ||
| Province of Ontario | 2.00 | 10-2-2029 | 90,000 | 88,844 | ||
| Province of Ontario | 2.30 | 6-15-2026 | 70,000 | 70,706 | ||
| Province of Ontario | 2.50 | 4-27-2026 | 70,000 | 71,334 | ||
| Province of Ontario | 3.20 | 5-16-2024 | 5,000 | 5,162 | ||
| Province of Ontario | 3.40 | 10-17-2023 | 110,000 | 113,369 | ||
| Province of Quebec | 1.35 | 5-28-2030 | 100,000 | 94,206 | ||
| Province of Quebec | 2.50 | 4-9-2024 | 70,000 | 71,412 | ||
| Province of Quebec | 2.50 | 4-20-2026 | 75,000 | 76,544 | ||
| Province of Quebec | 2.63 | 2-13-2023 | 260,000 | 263,437 | ||
| Province of Quebec | 7.13 | 2-9-2024 | 110,000 | 121,176 | ||
| Province of Quebec | 7.50 | 7-15-2023 | 80,000 | 86,484 | ||
| Republic of Chile | 3.24 | 2-6-2028 | 210,000 | 212,982 | ||
| Republic of Chile | 3.63 | 10-30-2042 | 365,000 | 347,586 | ||
| Republic of Hungary | 5.38 | 3-25-2024 | 19,000 | 20,124 | ||
| Republic of Hungary | 7.63 | 3-29-2041 | 84,000 | 122,406 | ||
| Republic of Indonesia | 4.10 | 4-24-2028 | 225,000 | 240,201 | ||
| Republic of Indonesia | 4.35 | 1-11-2048 | 205,000 | 208,934 | ||
| Republic of Italy | 2.88 | 10-17-2029 | 415,000 | 407,661 | ||
| Republic of Italy | 5.38 | 6-15-2033 | 60,000 | 71,008 | ||
| Interest rate | Maturity date | Principal | Value | |||
| Yankee government bonds (continued) | ||||||
| Republic of Korea | 3.88% | 9-11-2023 | $ | 210,000 | $ 217,056 | |
| Republic of Panama | 2.25 | 9-29-2032 | 200,000 | 176,668 | ||
| Republic of Panama | 3.87 | 7-23-2060 | 200,000 | 172,192 | ||
| Republic of Panama | 8.88 | 9-30-2027 | 50,000 | 64,673 | ||
| Republic of Panama | 9.38 | 4-1-2029 | 185,000 | 252,297 | ||
| Republic of Peru | 2.78 | 1-23-2031 | 200,000 | 188,974 | ||
| Republic of Peru | 2.84 | 6-20-2030 | 180,000 | 172,737 | ||
| Republic of Peru | 3.23 | 7-28-2121 | 75,000 | 55,283 | ||
| Republic of Peru | 5.63 | 11-18-2050 | 200,000 | 249,486 | ||
| Republic of Philippines | 1.65 | 6-10-2031 | 200,000 | 176,764 | ||
| Republic of Philippines | 2.65 | 12-10-2045 | 200,000 | 162,850 | ||
| Republic of Philippines | 3.70 | 2-2-2042 | 215,000 | 205,028 | ||
| Republic of Philippines | 5.50 | 3-30-2026 | 210,000 | 233,291 | ||
| Republic of Philippines | 9.50 | 2-2-2030 | 55,000 | 78,969 | ||
| Republic of Poland | 3.00 | 3-17-2023 | 140,000 | 141,422 | ||
| Republic of Poland | 3.25 | 4-6-2026 | 10,000 | 10,320 | ||
| State of Israel | 3.38 | 1-15-2050 | 350,000 | 341,674 | ||
| State of Israel | 5.50 | 12-4-2023 | 120,000 | 128,314 | ||
| State of Israel | 5.50 | 9-18-2033 | 6,000 | 7,991 | ||
| United Mexican States | 3.60 | 1-30-2025 | 200,000 | 207,768 | ||
| United Mexican States | 4.15 | 3-28-2027 | 205,000 | 217,974 | ||
| United Mexican States | 4.35 | 1-15-2047 | 225,000 | 209,095 | ||
| United Mexican States | 4.50 | 1-31-2050 | 260,000 | 245,885 | ||
| United Mexican States | 4.75 | 3-8-2044 | 54,000 | 53,388 | ||
| United Mexican States | 5.55 | 1-21-2045 | 80,000 | 87,296 | ||
| United Mexican States | 5.75 | 10-12-2110 | 163,000 | 167,729 | ||
| United Mexican States | 6.05 | 1-11-2040 | 40,000 | 45,756 | ||
| United Mexican States | 7.50 | 4-8-2033 | 110,000 | 145,064 | ||
| United Mexican States | 8.30 | 8-15-2031 | 60,000 | 82,650 | ||
| Total Yankee government bonds (Cost $11,169,032) | 10,722,723 | |||||
| Yield | Shares | |||||
| Short-term investments: 18.85% | ||||||
| Investment companies: 18.85% | ||||||
| Allspring Government Money Market Fund Select Class ♠∞## | 0.03 | 100,859,173 | 100,859,173 | |||
| Total Short-term investments (Cost $100,859,173) | 100,859,173 | |||||
| Total investments in securities (Cost $638,697,721) | 118.20% | 632,527,481 | ||||
| Other assets and liabilities, net | (18.20) | (97,403,621) | ||||
| Total net assets | 100.00% | $535,123,860 | ||||
| ## | All or a portion of this security is segregated for when-issued securities. |
| ±± | The coupon of the security is adjusted based on the principal and/or interest payments received from the underlying pool of mortgages as well as the credit quality and the actual prepayment speed of the underlying mortgages. The rate shown is the rate in effect at period end. |
| ¤ | The security is issued in zero coupon form with no periodic interest payments. |
| ♠ | The issuer of the security is an affiliated person of the Portfolio as defined in the Investment Company Act of 1940. |
| ∞ | The rate represents the 7-day annualized yield at period end. |
| %% | The security is purchased on a when-issued basis. |
| Abbreviations: | |
| EDA | Economic Development Authority |
| FFCB | Federal Farm Credit Banks |
| FHLB | Federal Home Loan Bank |
| FHLMC | Federal Home Loan Mortgage Corporation |
| FNMA | Federal National Mortgage Association |
| GNMA | Government National Mortgage Association |
| GO | General obligation |
| NPFGC | National Public Finance Guarantee Corporation |
| TVA | Tennessee Valley Authority |
| Value, beginning of period | Purchases | Sales proceeds | Net realized gains (losses) | Net change in unrealized gains (losses) | Value, end of period | Shares, end of period | Income from affiliated securities | |
| Short-term investments | ||||||||
| Allspring Government Money Market Fund Select Class | $57,676,698 | $162,185,641 | $(119,003,166) | $0 | $0 | $100,859,173 | 100,859,173 | $23,328 |
| Assets | |
Investments in unaffiliated securities, at value (cost $537,838,548) | $ 531,668,308 |
Investments in affiliated securities, at value (cost $100,859,173) | 100,859,173 |
Cash held at broker | 400,000 |
Receivable for investments sold | 2,060,965 |
Receivable for interest | 1,527,332 |
Prepaid expenses and other assets | 3,146 |
Total assets | 636,518,924 |
| Liabilities | |
Payable for when-issued transactions | 101,313,562 |
Advisory fee payable | 9,481 |
Accrued expenses and other liabilities | 72,021 |
Total liabilities | 101,395,064 |
Total net assets | $535,123,860 |
| Investment income | |
Interest | $ 7,080,773 |
Income from affiliated securities | 23,328 |
Total investment income | 7,104,101 |
| Expenses | |
Advisory fee | 287,494 |
Custody and accounting fees | 31,065 |
Professional fees | 60,219 |
Interest holder report expenses | 14,563 |
Trustees’ fees and expenses | 20,121 |
Other fees and expenses | 13,012 |
Total expenses | 426,474 |
Less: Fee waivers and/or expense reimbursements | (127,480) |
Net expenses | 298,994 |
Net investment income | 6,805,107 |
| Realized and unrealized gains (losses) on investments | |
Net realized losses on investments | (430,367) |
Net change in unrealized gains (losses) on investments | (20,174,634) |
Net realized and unrealized gains (losses) on investments | (20,605,001) |
Net decrease in net assets resulting from operations | $(13,799,894) |
| Year ended February 28, 2022 | Year ended February 28, 2021 | |
| Operations | ||
Net investment income | $ 6,805,107 | $ 8,895,120 |
Net realized gains (losses) on investments | (430,367) | 13,824,150 |
Net change in unrealized gains (losses) on investments | (20,174,634) | (20,010,769) |
Net increase (decrease) in net assets resulting from operations | (13,799,894) | 2,708,501 |
| Capital transactions | ||
| Transactions in investors’ beneficial interests | ||
Contributions | 98,689,236 | 200,389,400 |
Withdrawals | (136,927,823) | (281,370,896) |
Net decrease in net assets resulting from capital transactions | (38,238,587) | (80,981,496) |
Total decrease in net assets | (52,038,481) | (78,272,995) |
| Net assets | ||
Beginning of period | 587,162,341 | 665,435,336 |
End of period | $ 535,123,860 | $ 587,162,341 |
| Year ended February 28 | |||||
| 2022 | 2021 | 2020 1 | 2019 | 2018 2 | |
Total return3 | (2.47)% | 0.52% | 10.34% | 3.23% | (1.39)% |
| Ratios to average net assets (annualized) | |||||
Gross expenses | 0.07% | 0.07% | 0.07% | 0.08% | 0.08% |
Net expenses | 0.05% * | 0.05% * | 0.06% | 0.07% | 0.07% |
Net investment income | 1.18% | 1.57% | 2.32% | 2.38% | 2.03% |
| Supplemental data | |||||
Portfolio turnover rate | 209% | 114% | 46% | 72% | 221% |
| * | Ratio includes expenses which were voluntarily waived by the adviser. Without these voluntary waivers, the net expense ratios would be increased by the following amounts: |
| Year ended February 28, 2022 | 0.02% |
| Year ended February 28, 2021 | 0.02% |
| 1 | Year ended February 29 |
| 2 | For the period from May 23, 2017 (commencement of operations) to February 28, 2018 |
| 3 | Returns for periods of less than one year are not annualized. |
| Gross unrealized gains | $ 5,059,786 |
| Gross unrealized losses | (11,146,507) |
| Net unrealized losses | $ (6,086,721) |
| ■ | Level 1 – quoted prices in active markets for identical securities |
| ■ | Level 2 – other significant observable inputs (including quoted prices for similar securities, interest rates, prepayment speeds, credit risk, etc.) |
| ■ | Level 3 – significant unobservable inputs (including the Portfolio’s own assumptions in determining the fair value of investments) |
| Quoted prices (Level 1) | Other significant observable inputs (Level 2) | Significant unobservable inputs (Level 3) | Total | |
| Assets | ||||
| Investments in: | ||||
| Agency securities | $ 0 | $ 212,197,124 | $0 | $ 212,197,124 |
| Asset-backed securities | 0 | 1,447,279 | 0 | 1,447,279 |
| Municipal obligations | 0 | 4,552,539 | 0 | 4,552,539 |
| Non-agency mortgage-backed securities | 0 | 5,866,467 | 0 | 5,866,467 |
| U.S. Treasury securities | 282,336,269 | 0 | 0 | 282,336,269 |
| Yankee corporate bonds and notes | 0 | 14,545,907 | 0 | 14,545,907 |
| Yankee government bonds | 0 | 10,722,723 | 0 | 10,722,723 |
| Short-term investments | ||||
| Investment companies | 100,859,173 | 0 | 0 | 100,859,173 |
| Total assets | $383,195,442 | $249,332,039 | $0 | $632,527,481 |
| Average daily net assets | Advisory fee |
| First $5 billion | 0.050% |
| Next $5 billion | 0.040 |
| Over $10 billion | 0.030 |
| Purchases at cost | Sales proceeds | |||
| U.S. government | Non-U.S. government | U.S. government | Non-U.S. government | |
| $1,194,238,158 | $19,738,065 | $1,160,797,781 | $27,292,806 | |
Allspring Master Trust:

| Name and year of birth | Position held and length of service* | Principal occupations during past five years or longer | Current other public company or investment company directorships |
| William R. Ebsworth (Born 1957) | Trustee, since 2015 | Retired. From 1984 to 2013, equities analyst, portfolio manager, research director and chief investment officer at Fidelity Management and Research Company in Boston, Tokyo, and Hong Kong, and retired in 2013 as Chief Investment Officer of Fidelity Strategic Advisers, Inc. where he led a team of investment professionals managing client assets. Prior thereto, Board member of Hong Kong Securities Clearing Co., Hong Kong Options Clearing Corp., the Thailand International Fund, Ltd., Fidelity Investments Life Insurance Company, and Empire Fidelity Investments Life Insurance Company. Audit Committee Chair and Investment Committee Chair of the Vincent Memorial Hospital Endowment (non-profit organization). Mr. Ebsworth is a CFA® charterholder. | N/A |
| Jane A. Freeman (Born 1953) | Trustee, since 2015; Chair Liaison, since 2018 | Retired. From 2012 to 2014 and 1999 to 2008, Chief Financial Officer of Scientific Learning Corporation. From 2008 to 2012, Ms. Freeman provided consulting services related to strategic business projects. Prior to 1999, Portfolio Manager at Rockefeller & Co. and Scudder, Stevens & Clark. Board member of the Harding Loevner Funds from 1996 to 2014, serving as both Lead Independent Director and chair of the Audit Committee. Board member of the Russell Exchange Traded Funds Trust from 2011 to 2012 and the chair of the Audit Committee. Ms. Freeman is also an inactive Chartered Financial Analyst. | N/A |
| Isaiah Harris, Jr. (Born 1952) | Trustee, since 2009; Audit Committee Chair, since 2019 | Retired. Chairman of the Board of CIGNA Corporation from 2009 to 2021, and Director from 2005 to 2008. From 2003 to 2011, Director of Deluxe Corporation. Prior thereto, President and CEO of BellSouth Advertising and Publishing Corp. from 2005 to 2007, President and CEO of BellSouth Enterprises from 2004 to 2005 and President of BellSouth Consumer Services from 2000 to 2003. Emeritus member of the Iowa State University Foundation Board of Governors. Emeritus Member of the Advisory Board of Iowa State University School of Business. Advisory Board Member, Palm Harbor Academy (private school). Advisory Board Member, Fellowship of Christian Athletes. Mr. Harris is a certified public accountant (inactive status). | N/A |
| David F. Larcker (Born 1950) | Trustee, since 2009 | James Irvin Miller Professor of Accounting at the Graduate School of Business (Emeritus), Stanford University, Director of the Corporate Governance Research Initiative and Senior Faculty of The Rock Center for Corporate Governance since 2006. From 2005 to 2008, Professor of Accounting at the Graduate School of Business, Stanford University. Prior thereto, Ernst & Young Professor of Accounting at The Wharton School, University of Pennsylvania from 1985 to 2005. | N/A |
| Name and year of birth | Position held and length of service* | Principal occupations during past five years or longer | Current other public company or investment company directorships |
| Olivia S. Mitchell (Born 1953) | Trustee, since 2006; Nominating and Governance Committee Chair, since 2018 | International Foundation of Employee Benefit Plans Professor since 1993, Wharton School of the University of Pennsylvania. Director of Wharton’s Pension Research Council and Boettner Center on Pensions & Retirement Research, and Research Associate at the National Bureau of Economic Research. Previously taught at Cornell University from 1978 to 1993. | N/A |
| Timothy J. Penny (Born 1951) | Trustee, since 1996; Chair, since 2018 | President and Chief Executive Officer of Southern Minnesota Initiative Foundation, a non-profit organization, since 2007. Member of the Board of Trustees of NorthStar Education Finance, Inc., a non-profit organization, since 2007. | N/A |
| James G. Polisson (Born 1959) | Trustee, since 2018 | Retired. Chief Marketing Officer, Source (ETF) UK Services, Ltd, from 2015 to 2017. From 2012 to 2015, Principal of The Polisson Group, LLC, a management consulting, corporate advisory and principal investing company. Chief Executive Officer and Managing Director at Russell Investments, Global Exchange Traded Funds from 2010 to 2012. Managing Director of Barclays Global Investors from 1998 to 2010 and Global Chief Marketing Officer for iShares and Barclays Global Investors from 2000 to 2010. Trustee of the San Francisco Mechanics’ Institute, a non-profit organization, from 2013 to 2015. Board member of the Russell Exchange Traded Fund Trust from 2011 to 2012. Director of Barclays Global Investors Holdings Deutschland GmbH from 2006 to 2009. Mr. Polisson is an attorney and has a retired status with the Massachusetts and District of Columbia Bar Associations. | N/A |
| Pamela Wheelock (Born 1959) | Trustee, since January 2020; previously Trustee from January 2018 to July 2019 | Board member of the Destination Medical Center Economic Development Agency, Rochester, Minnesota since 2019. Interim President of the McKnight Foundation from January to September 2020. McKnight Foundation Consultant, November 2020 to February 2021. Acting Commissioner, Minnesota Department of Human Services, July 2019 through September 2019. Consultant (part-time), Minnesota Department of Human Services, October 2019 through December 2019. Chief Operating Officer, Twin Cities Habitat for Humanity from 2017 to 2019. Vice President of University Services, University of Minnesota from 2012 to 2016. Prior thereto, on the Board of Directors, Governance Committee and Finance Committee for the Minnesota Philanthropy Partners (Saint Paul Foundation) from 2012 to 2018, Interim Chief Executive Officer of Blue Cross Blue Shield of Minnesota from 2011 to 2012, Chairman of the Board from 2009 to 2012 and Board Director from 2003 to 2015. Vice President, Leadership and Community Engagement, Bush Foundation, Saint Paul, Minnesota (a private foundation) from 2009 to 2011. Executive Vice President and Chief Financial Officer, Minnesota Sports and Entertainment from 2004 to 2009 and Senior Vice President from 2002 to 2004. Executive Vice President of the Minnesota Wild Foundation from 2004 to 2008. Commissioner of Finance, State of Minnesota, from 1999 to 2002. Currently Board Chair of the Minnesota Wild Foundation since 2010. | N/A |
| Name and year of birth | Position held and length of service | Principal occupations during past five years or longer |
| Andrew Owen (Born 1960) | President, since 2017 | President, Chief Executive Officer and Director of Allspring Funds Management, LLC since 2017 and co-president of Galliard Capital Management, LLC, an affiliate of Allspring Funds Management, LLC, since 2019. Prior thereto, Head of Affiliated Managers, Allspring Global Investments, from 2014 to 2019 and Executive Vice President responsible for marketing, investments and product development for Allspring Funds Management, LLC, from 2009 to 2014. In addition, Mr. Owen was an Executive Vice President of Wells Fargo & Company from 2014 to 2021. |
| Jeremy DePalma (Born 1974) | Treasurer, since 2012 (for certain funds in the Fund Complex); since 2021 (for the remaining funds in the Fund Complex) | Senior Vice President of Allspring Funds Management, LLC since 2009. Senior Vice President of Evergreen Investment Management Company, LLC from 2008 to 2010 and head of the Fund Reporting and Control Team within Fund Administration from 2005 to 2010. |
| Kate McKinley (Born 1977) | Chief Legal Officer, since 2021 | Chief Legal Officer of Allspring Global Investments since 2021. Prior thereto, held various roles at State Street Global Advisors beginning in 2010, including serving as Senior Vice President and General Counsel from 2019 to 2021, and Chief Operating Officer of the Institutional Client Group from 2016 - 2019. Prior to working at State Street Global Advisors served as Assistant General Counsel for Bank of America Corporation from 2005 to 2010 and as an Associate at WilmerHale from 2002 to 2005. |
| Christopher Baker (Born 1976) | Chief Compliance Officer, since 2022 | Global Chief Compliance Officer for Allspring Global Investments since 2022. Prior thereto, Chief Compliance Officer for State Street Global Advisors from 2018 to 2021. Senior Compliance Officer for the State Street divisions of Alternative Investment Solutions, Sector Solutions, and Global Marketing from 2015 to 2018. From 2010 to 2015 Vice President, Global Head of Investment and Marketing Compliance for State Street Global Advisors. |
| Matthew Prasse (Born 1983) | Secretary, since 2021 | Senior Counsel of the Allspring Legal Department since 2021. Senior Counsel of the Wells Fargo Legal Department from 2018 to 2021. Previously, Counsel for Barings LLC from 2015 to 2018. Prior to joining Barings, Associate at Morgan, Lewis & Bockius LLP from 2008 to 2015. |
P.O. Box 219967
Kansas City, MO 64121-9967
1-800-222-8222. Read the prospectus carefully before you invest or send money.

Emerging Markets Bond Portfolio
| Investment objective | The Portfolio seeks to replicate the total return of the JP Morgan EMBI Global Diversified Index,† before fees and expenses. |
| Adviser | Allspring Funds Management, LLC |
| Subadvisers | Allspring Global Investments (UK) Limited |
| Allspring Global Investments, LLC | |
| Portfolio managers | Richard Bishop, CFA®‡#, Manjunath Boraiah, Michael Lee, Limin Xiao, CFA®‡, Ph.D.¤ |
| Ten largest holdings (%) as of February 28, 20221 | |
| Qatar Government, 4.63%, 6-2-2046 | 1.60 |
| Republic of Philippines, 5.50%, 3-30-2026 | 1.34 |
| Kingdom of Bahrain, 7.00%, 10-12-2028 | 1.28 |
| State Grid Overseas Investment (2014) Limited, 4.13%, 5-7-2024 | 1.26 |
| Federation of Malaysia, 3.18%, 4-27-2026 | 1.26 |
| Federative Republic of Brazil, 4.63%, 1-13-2028 | 1.23 |
| Republic of South Africa, 4.85%, 9-30-2029 | 1.18 |
| Republic of Peru, 6.55%, 3-14-2037 | 1.15 |
| Oman Government, 6.50%, 3-8-2047 | 1.13 |
| Dominican Republic, 5.95%, 1-25-2027 | 1.10 |
| 1 | Figures represent the percentage of the Portfolio's net assets. Holdings are subject to change and may have changed since the date specified. |
| Portfolio composition as of February 28, 20221 |

| 1 | Figures represent the percentage of the Portfolio's long-term investments. These amounts are subject to change and may have changed since the date specified. |
| ‡ | CFA® and Chartered Financial Analyst® are trademarks owned by CFA Institute. |
| † | The JP Morgan Emerging Markets Bond Index (“EMBI”) Global Diversified Index is a composite index representing an unleveraged investment in emerging market bonds that is broadly based across the spectrum of emerging market bonds and includes reinvestment of income (to represent real assets). You cannot invest directly in an index. |
| # | Mr. Bishop became portfolio manager of the Portfolio on August 1, 2021. |
| ¤ | Ms. Xiao became portfolio manager of the Fund on July 1, 2021. |
| Interest rate | Maturity date | Principal | Value | |||
| Yankee corporate bonds and notes: 16.18% | ||||||
| Azerbaijan: 0.61% | ||||||
| State Oil Company of the Azerbaijan Republic (Energy, Oil, gas & consumable fuels) | 4.75% | 3-13-2023 | $ | 200,000 | $ 202,594 | |
| Bahrain: 0.63% | ||||||
| Oil & Gas Holding Company (Energy, Oil, gas & consumable fuels) | 7.63 | 11-7-2024 | 200,000 | 209,000 | ||
| Chile: 1.54% | ||||||
| Codelco Incorporated (Materials, Metals & mining) | 4.25 | 7-17-2042 | 250,000 | 244,443 | ||
| Codelco Incorporated (Materials, Metals & mining) | 4.88 | 11-4-2044 | 250,000 | 264,175 | ||
| 508,618 | ||||||
| China: 3.07% | ||||||
| Sinopec Group Overseas Development (2015) Limited (Energy, Oil, gas & consumable fuels) | 3.25 | 4-28-2025 | 200,000 | 205,181 | ||
| Sinopec Group Overseas Development (2018) Limited (Energy, Oil, gas & consumable fuels) | 2.30 | 1-8-2031 | 200,000 | 187,603 | ||
| State Grid Overseas Investment (2014) Limited (Utilities, Electric utilities) | 4.13 | 5-7-2024 | 400,000 | 417,943 | ||
| State Grid Overseas Investment (2016) Limited (Utilities, Electric utilities) | 2.88 | 5-18-2026 | 200,000 | 206,360 | ||
| 1,017,087 | ||||||
| Hong Kong: 0.58% | ||||||
| CNAC Finbridge Company Limited (Industrials, Chemicals) | 3.00 | 9-22-2030 | 200,000 | 190,271 | ||
| Indonesia: 1.80% | ||||||
| PT Indonesia Asahan Aluminium Persero Tbk (Materials, Metals & mining) | 5.71 | 11-15-2023 | 200,000 | 208,466 | ||
| PT Pertamina Persero Tbk (Energy, Oil, gas & consumable fuels) | 5.63 | 5-20-2043 | 200,000 | 212,720 | ||
| PT Perusahaan Listrik Negara Tbk (Utilities, Electric utilities) | 4.00 | 6-30-2050 | 200,000 | 174,978 | ||
| 596,164 | ||||||
| Kazakhstan: 0.63% | ||||||
| KazMunayGas National Company JSC (Energy, Oil, gas & consumable fuels) | 5.75 | 4-19-2047 | 200,000 | 208,440 | ||
| Malaysia: 1.63% | ||||||
| Petronas Capital Limited Bhd (Energy, Oil, gas & consumable fuels) | 3.50 | 4-21-2030 | 200,000 | 204,794 | ||
| Petronas Capital Limited Bhd (Energy, Oil, gas & consumable fuels) | 4.50 | 3-18-2045 | 300,000 | 332,817 | ||
| 537,611 | ||||||
| Mexico: 1.80% | ||||||
| Petroleos Mexicanos Company (Energy, Oil, gas & consumable fuels) | 5.95 | 1-28-2031 | 170,000 | 159,188 | ||
| Petroleos Mexicanos Company (Energy, Oil, gas & consumable fuels) | 6.35 | 2-12-2048 | 30,000 | 24,000 | ||
| Petroleos Mexicanos Company (Energy, Oil, gas & consumable fuels) | 6.38 | 1-23-2045 | 30,000 | 24,382 | ||
| Petroleos Mexicanos Company (Energy, Oil, gas & consumable fuels) | 6.50 | 6-2-2041 | 30,000 | 25,324 |
| Interest rate | Maturity date | Principal | Value | |||
| Mexico: 1.80% (continued) | ||||||
| Petroleos Mexicanos Company (Energy, Oil, gas & consumable fuels) | 6.63% | 6-15-2035 | $ | 30,000 | $ 27,167 | |
| Petroleos Mexicanos Company (Energy, Oil, gas & consumable fuels) | 6.63 | 9-29-2049 | 60,000 | 47,026 | ||
| Petroleos Mexicanos Company (Energy, Oil, gas & consumable fuels) | 6.75 | 9-21-2047 | 140,000 | 116,298 | ||
| Petroleos Mexicanos Company (Energy, Oil, gas & consumable fuels) | 6.95 | 1-28-2060 | 110,000 | 91,300 | ||
| Petroleos Mexicanos Company (Energy, Oil, gas & consumable fuels) | 7.69 | 1-23-2050 | 90,000 | 80,847 | ||
| 595,532 | ||||||
| Peru: 0.58% | ||||||
| Petroleos del Peru - Petroperu SA (Energy, Oil, gas & consumable fuels) | 4.75 | 6-19-2032 | 200,000 | 192,972 | ||
| Saudi Arabia: 0.61% | ||||||
| KSA Sukuk Limited (Financials, Diversified financial services) | 2.97 | 10-29-2029 | 200,000 | 203,000 | ||
| South Africa: 0.62% | ||||||
| Eskom Holdings SOC Limited (Utilities, Electric utilities) | 6.35 | 8-10-2028 | 200,000 | 203,717 | ||
| United Arab Emirates: 2.08% | ||||||
| Abu Dhabi Crude Oil Pipeline LLC (Energy, Oil, gas & consumable fuels) | 4.60 | 11-2-2047 | 200,000 | 218,918 | ||
| Mamoura Diversified Global Holding GMTN BV (Financials, Diversified financial services) | 3.00 | 4-19-2024 | 200,000 | 203,083 | ||
| Mamoura Diversified Global Holding GMTN BV (Financials, Diversified financial services) | 3.75 | 4-19-2029 | 250,000 | 265,191 | ||
| 687,192 | ||||||
| Total Yankee corporate bonds and notes (Cost $5,414,417) | 5,352,198 | |||||
| Yankee government bonds: 80.14% | ||||||
| Abu Dhabi Government | 2.13 | 9-30-2024 | 200,000 | 200,512 | ||
| Abu Dhabi Government | 3.13 | 9-30-2049 | 200,000 | 188,438 | ||
| Abu Dhabi Government | 3.88 | 4-16-2050 | 200,000 | 214,272 | ||
| Arab Republic of Egypt | 5.88 | 6-11-2025 | 200,000 | 195,572 | ||
| Arab Republic of Egypt | 6.88 | 4-30-2040 | 100,000 | 77,226 | ||
| Arab Republic of Egypt | 7.50 | 1-31-2027 | 200,000 | 190,627 | ||
| Arab Republic of Egypt | 8.50 | 1-31-2047 | 250,000 | 193,223 | ||
| Arab Republic of Egypt | 8.70 | 3-1-2049 | 200,000 | 156,125 | ||
| China Development Bank | 1.63 | 10-27-2030 | 200,000 | 187,673 | ||
| Dominican Republic | 5.88 | 1-30-2060 | 200,000 | 168,502 | ||
| Dominican Republic | 5.95 | 1-25-2027 | 350,000 | 362,779 | ||
| Dominican Republic | 6.00 | 7-19-2028 | 200,000 | 206,302 | ||
| Dominican Republic | 6.40 | 6-5-2049 | 150,000 | 138,377 | ||
| Export-Import Bank of China | 4.00 | 11-28-2047 | 200,000 | 222,464 | ||
| Export-Import Bank of India | 4.00 | 1-14-2023 | 250,000 | 253,968 | ||
| Federation of Malaysia | 3.18 | 4-27-2026 | 400,000 | 417,408 | ||
| Federative Republic of Brazil | 4.50 | 5-30-2029 | 200,000 | 197,868 | ||
| Federative Republic of Brazil | 4.63 | 1-13-2028 | 400,000 | 406,000 | ||
| Federative Republic of Brazil | 5.63 | 1-7-2041 | 250,000 | 242,830 | ||
| Federative Republic of Brazil | 7.13 | 1-20-2037 | 50,000 | 57,907 | ||
| Federative Republic of Brazil | 8.25 | 1-20-2034 | 20,000 | 25,105 | ||
| Islamic Republic of Pakistan | 6.88 | 12-5-2027 | 200,000 | 186,000 |
| Interest rate | Maturity date | Principal | Value | |||
| Yankee government bonds: 80.14% (continued) | ||||||
| Islamic Republic of Pakistan | 8.25% | 9-30-2025 | $ | 200,000 | $ 201,564 | |
| Kingdom of Bahrain | 6.75 | 9-20-2029 | 200,000 | 205,384 | ||
| Kingdom of Bahrain | 7.00 | 10-12-2028 | 400,000 | 423,018 | ||
| Kingdom of Jordan | 5.85 | 7-7-2030 | 200,000 | 187,532 | ||
| Kingdom of Morocco | 4.25 | 12-11-2022 | 200,000 | 203,000 | ||
| Kuwait Government | 3.50 | 3-20-2027 | 200,000 | 211,532 | ||
| Lebanese Republic † | 6.25 | 11-4-2024 | 200,000 | 23,024 | ||
| Lebanese Republic † | 6.60 | 11-27-2026 | 250,000 | 28,853 | ||
| Lebanese Republic † | 6.65 | 2-26-2030 | 50,000 | 5,771 | ||
| Lebanese Republic † | 7.05 | 11-2-2035 | 200,000 | 23,008 | ||
| Mongolia Government | 4.45 | 7-7-2031 | 200,000 | 181,500 | ||
| Oman Government | 4.75 | 6-15-2026 | 200,000 | 200,067 | ||
| Oman Government | 4.88 | 6-15-2030 | 200,000 | 209,500 | ||
| Oman Government | 5.93 | 10-31-2025 | 200,000 | 215,750 | ||
| Oman Government | 6.50 | 3-8-2047 | 400,000 | 374,096 | ||
| Oriental Republic of Uruguay | 4.38 | 10-27-2027 | 200,000 | 216,156 | ||
| Oriental Republic of Uruguay | 4.98 | 4-20-2055 | 100,000 | 118,460 | ||
| Oriental Republic of Uruguay | 5.10 | 6-18-2050 | 250,000 | 298,245 | ||
| Oriental Republic of Uruguay | 7.88 | 1-15-2033 | 125,000 | 173,814 | ||
| Perusahaan Penerbit SBSN Indonesia III | 4.45 | 2-20-2029 | 200,000 | 218,250 | ||
| Qatar Government | 3.24 | 1-18-2023 | 200,000 | 203,246 | ||
| Qatar Government | 3.25 | 6-2-2026 | 200,000 | 207,080 | ||
| Qatar Government | 3.75 | 4-16-2030 | 200,000 | 215,900 | ||
| Qatar Government | 4.00 | 3-14-2029 | 200,000 | 217,665 | ||
| Qatar Government | 4.63 | 6-2-2046 | 450,000 | 527,795 | ||
| Republic of Angola | 8.25 | 5-9-2028 | 200,000 | 199,000 | ||
| Republic of Angola | 9.50 | 11-12-2025 | 200,000 | 213,392 | ||
| Republic of Argentina øø | 0.50 | 7-9-2030 | 200,000 | 63,800 | ||
| Republic of Argentina | 1.00 | 7-9-2029 | 93,355 | 30,801 | ||
| Republic of Argentina øø | 1.13 | 7-9-2035 | 425,000 | 125,800 | ||
| Republic of Argentina øø | 1.13 | 7-9-2046 | 28,500 | 8,522 | ||
| Republic of Argentina øø | 2.00 | 1-9-2038 | 215,000 | 79,550 | ||
| Republic of Argentina øø | 2.50 | 7-9-2041 | 235,000 | 79,900 | ||
| Republic of Armenia | 3.60 | 2-2-2031 | 200,000 | 170,000 | ||
| Republic of Azerbaijan | 3.50 | 9-1-2032 | 200,000 | 187,800 | ||
| Republic of Belarus | 7.63 | 6-29-2027 | 200,000 | 54,000 | ||
| Republic of Chile | 3.13 | 1-21-2026 | 200,000 | 204,768 | ||
| Republic of Chile | 3.86 | 6-21-2047 | 200,000 | 195,202 | ||
| Republic of Colombia | 3.13 | 4-15-2031 | 200,000 | 169,498 | ||
| Republic of Colombia | 4.13 | 5-15-2051 | 200,000 | 150,114 | ||
| Republic of Colombia | 4.50 | 1-28-2026 | 200,000 | 202,408 | ||
| Republic of Colombia | 5.00 | 6-15-2045 | 286,000 | 238,310 | ||
| Republic of Colombia | 7.38 | 9-18-2037 | 150,000 | 166,500 | ||
| Republic of Costa Rica | 7.00 | 4-4-2044 | 350,000 | 335,125 | ||
| Republic of Cote d'Ivoire | 6.13 | 6-15-2033 | 200,000 | 191,947 | ||
| Republic of Croatia | 6.00 | 1-26-2024 | 200,000 | 212,988 | ||
| Republic of Ecuador ¤ | 0.00 | 7-31-2030 | 90,000 | 52,876 | ||
| Republic of Ecuador øø | 1.00 | 7-31-2035 | 500,000 | 351,255 | ||
| Republic of Ecuador øø | 5.00 | 7-31-2030 | 250,000 | 218,750 | ||
| Republic of El Salvador | 5.88 | 1-30-2025 | 135,000 | 81,338 | ||
| Republic of El Salvador | 6.38 | 1-18-2027 | 60,000 | 32,850 | ||
| Republic of El Salvador | 7.65 | 6-15-2035 | 290,000 | 150,800 | ||
| Republic of El Salvador | 8.63 | 2-28-2029 | 85,000 | 46,325 | ||
| Republic of Ghana | 6.38 | 2-11-2027 | 400,000 | 277,472 | ||
| Republic of Ghana | 7.63 | 5-16-2029 | 300,000 | 202,860 |
| Interest rate | Maturity date | Principal | Value | |||
| Yankee government bonds: 80.14% (continued) | ||||||
| Republic of Ghana | 8.63% | 6-16-2049 | $ | 200,000 | $ 128,222 | |
| Republic of Guatemala | 4.38 | 6-5-2027 | 200,000 | 201,000 | ||
| Republic of Hungary | 5.38 | 2-21-2023 | 40,000 | 41,262 | ||
| Republic of Hungary | 5.38 | 3-25-2024 | 200,000 | 211,828 | ||
| Republic of Hungary | 5.75 | 11-22-2023 | 30,000 | 31,715 | ||
| Republic of Hungary | 7.63 | 3-29-2041 | 120,000 | 174,866 | ||
| Republic of Indonesia | 4.10 | 4-24-2028 | 300,000 | 320,268 | ||
| Republic of Indonesia | 5.13 | 1-15-2045 | 200,000 | 223,124 | ||
| Republic of Indonesia | 7.75 | 1-17-2038 | 125,000 | 173,216 | ||
| Republic of Iraq | 5.80 | 1-15-2028 | 187,500 | 179,766 | ||
| Republic of Jamaica | 8.00 | 3-15-2039 | 200,000 | 265,000 | ||
| Republic of Kazakhstan | 5.13 | 7-21-2025 | 200,000 | 214,246 | ||
| Republic of Kazakhstan | 6.50 | 7-21-2045 | 200,000 | 232,800 | ||
| Republic of Kenya | 6.88 | 6-24-2024 | 200,000 | 206,592 | ||
| Republic of Kenya | 8.25 | 2-28-2048 | 200,000 | 172,700 | ||
| Republic of Nigeria | 7.63 | 11-21-2025 | 200,000 | 211,700 | ||
| Republic of Nigeria | 7.63 | 11-28-2047 | 200,000 | 160,864 | ||
| Republic of Nigeria | 7.88 | 2-16-2032 | 300,000 | 275,562 | ||
| Republic of Panama | 3.16 | 1-23-2030 | 200,000 | 196,118 | ||
| Republic of Panama | 3.87 | 7-23-2060 | 200,000 | 172,192 | ||
| Republic of Panama | 4.00 | 9-22-2024 | 200,000 | 206,072 | ||
| Republic of Panama | 4.50 | 5-15-2047 | 350,000 | 344,624 | ||
| Republic of Paraguay | 5.00 | 4-15-2026 | 250,000 | 260,878 | ||
| Republic of Peru | 2.78 | 12-1-2060 | 60,000 | 45,434 | ||
| Republic of Peru | 3.23 | 7-28-2121 | 60,000 | 44,226 | ||
| Republic of Peru | 3.55 | 3-10-2051 | 40,000 | 36,204 | ||
| Republic of Peru | 4.13 | 8-25-2027 | 100,000 | 105,061 | ||
| Republic of Peru | 5.63 | 11-18-2050 | 100,000 | 124,743 | ||
| Republic of Peru | 6.55 | 3-14-2037 | 300,000 | 380,478 | ||
| Republic of Philippines | 1.65 | 6-10-2031 | 200,000 | 176,764 | ||
| Republic of Philippines | 2.65 | 12-10-2045 | 200,000 | 162,850 | ||
| Republic of Philippines | 3.70 | 2-2-2042 | 200,000 | 190,724 | ||
| Republic of Philippines | 5.50 | 3-30-2026 | 400,000 | 444,365 | ||
| Republic of Poland | 3.25 | 4-6-2026 | 300,000 | 309,612 | ||
| Republic of Senegal | 6.25 | 5-23-2033 | 200,000 | 185,504 | ||
| Republic of South Africa | 4.85 | 9-30-2029 | 400,000 | 389,960 | ||
| Republic of South Africa | 6.25 | 3-8-2041 | 200,000 | 196,500 | ||
| Republic of Sri Lanka | 5.75 | 4-18-2023 | 400,000 | 198,968 | ||
| Republic of Sri Lanka | 6.75 | 4-18-2028 | 300,000 | 132,000 | ||
| Republic of Turkey | 4.88 | 10-9-2026 | 200,000 | 177,500 | ||
| Republic of Turkey | 5.60 | 11-14-2024 | 200,000 | 194,020 | ||
| Republic of Turkey | 6.63 | 2-17-2045 | 400,000 | 319,280 | ||
| Republic of Turkey | 7.25 | 3-5-2038 | 20,000 | 18,009 | ||
| Republic of Turkey | 7.38 | 2-5-2025 | 200,000 | 201,940 | ||
| Republic of Turkey | 7.63 | 4-26-2029 | 200,000 | 195,420 | ||
| Republic of Venezuela † | 6.00 | 12-9-2020 | 225,000 | 12,375 | ||
| Republic of Venezuela † | 7.00 | 3-31-2038 | 200,000 | 11,000 | ||
| Romania Government | 4.00 | 2-14-2051 | 140,000 | 118,300 | ||
| Romania Government | 4.38 | 8-22-2023 | 110,000 | 113,149 | ||
| Romania Government | 4.88 | 1-22-2024 | 150,000 | 155,646 | ||
| Romania Government | 5.13 | 6-15-2048 | 160,000 | 162,000 | ||
| Russian Federation | 5.10 | 3-28-2035 | 200,000 | 70,000 | ||
| Russian Federation | 5.25 | 6-23-2047 | 200,000 | 70,000 | ||
| Russian Federation | 5.63 | 4-4-2042 | 200,000 | 70,000 | ||
| Saudi Government | 2.88 | 3-4-2023 | 200,000 | 202,566 |
| Interest rate | Maturity date | Principal | Value | |||
| Yankee government bonds: 80.14% (continued) | ||||||
| Saudi Government | 3.63% | 3-4-2028 | $ | 200,000 | $ 210,965 | |
| Saudi Government | 4.50 | 4-17-2030 | 200,000 | 224,162 | ||
| Saudi Government | 4.50 | 10-26-2046 | 200,000 | 216,272 | ||
| Saudi Government | 4.63 | 10-4-2047 | 200,000 | 219,879 | ||
| Trinidad & Tobago Government | 4.50 | 8-4-2026 | 200,000 | 201,002 | ||
| Ukraine Government | 7.38 | 9-25-2032 | 200,000 | 64,050 | ||
| Ukraine Government | 7.75 | 9-1-2023 | 200,000 | 84,968 | ||
| Ukraine Government | 7.75 | 9-1-2025 | 400,000 | 134,800 | ||
| United Mexican States | 2.66 | 5-24-2031 | 200,000 | 183,696 | ||
| United Mexican States | 3.25 | 4-16-2030 | 200,000 | 194,388 | ||
| United Mexican States | 4.13 | 1-21-2026 | 200,000 | 212,456 | ||
| United Mexican States | 4.50 | 1-31-2050 | 200,000 | 189,142 | ||
| United Mexican States | 4.75 | 3-8-2044 | 40,000 | 39,547 | ||
| United Mexican States | 5.55 | 1-21-2045 | 20,000 | 21,824 | ||
| United Mexican States | 5.75 | 10-12-2110 | 20,000 | 20,580 | ||
| United Mexican States | 6.05 | 1-11-2040 | 20,000 | 22,878 | ||
| United Mexican States | 6.75 | 9-27-2034 | 150,000 | 184,877 | ||
| Total Yankee government bonds (Cost $30,144,162) | 26,518,038 |
| Yield | Shares | |||||
| Short-term investments: 2.37% | ||||||
| Investment companies: 2.37% | ||||||
| Allspring Government Money Market Fund Select Class ♠∞ | 0.03 | 783,628 | 783,628 | |||
| Total Short-term investments (Cost $783,628) | 783,628 | |||||
| Total investments in securities (Cost $36,342,207) | 98.69% | 32,653,864 | ||||
| Other assets and liabilities, net | 1.31 | 433,405 | ||||
| Total net assets | 100.00% | $33,087,269 |
| † | Non-income-earning security |
| øø | The interest rate is determined and reset by the issuer periodically depending upon the terms of the security. The rate shown is the rate in effect at period end. |
| ¤ | The security is issued in zero coupon form with no periodic interest payments. |
| ♠ | The issuer of the security is an affiliated person of the Portfolio as defined in the Investment Company Act of 1940. |
| ∞ | The rate represents the 7-day annualized yield at period end. |
| Value, beginning of period | Purchases | Sales proceeds | Net realized gains (losses) | Net change in unrealized gains (losses) | Value, end of period | Shares, end of period | Income from affiliated securities | |
| Short-term investments | ||||||||
| Allspring Government Money Market Fund Select Class | $654,821 | $9,519,912 | $(9,391,105) | $0 | $0 | $783,628 | 783,628 | $123 |
| Assets | |
Investments in unaffiliated securities, at value (cost $35,558,579) | $ 31,870,236 |
Investments in affiliated securities, at value (cost $783,628) | 783,628 |
Cash | 8,250 |
Receivable for interest | 468,839 |
Receivable for investments sold | 371,740 |
Receivable from adviser | 4,386 |
Prepaid expenses and other assets | 786 |
Total assets | 33,507,865 |
| Liabilities | |
Payable for investments purchased | 357,749 |
Professional fees payable | 46,561 |
Trustees’ fees and expenses payable | 2,150 |
Accrued expenses and other liabilities | 14,136 |
Total liabilities | 420,596 |
Total net assets | $33,087,269 |
| Investment income | |
Interest | $ 1,714,236 |
Income from affiliated securities | 123 |
Total investment income | 1,714,359 |
| Expenses | |
Advisory fee | 91,514 |
Custody and accounting fees | 18,179 |
Professional fees | 68,108 |
Interest holder report expenses | 23,659 |
Trustees’ fees and expenses | 20,121 |
Other fees and expenses | 4,551 |
Total expenses | 226,132 |
Less: Fee waivers and/or expense reimbursements | (124,369) |
Net expenses | 101,763 |
Net investment income | 1,612,596 |
| Realized and unrealized gains (losses) on investments | |
Net realized losses on investments | (819,137) |
Net change in unrealized gains (losses) on investments | (3,305,043) |
Net realized and unrealized gains (losses) on investments | (4,124,180) |
Net decrease in net assets resulting from operations | $(2,511,584) |
| Year ended February 28, 2022 | Year ended February 28, 2021 | |
| Operations | ||
Net investment income | $ 1,612,596 | $ 1,573,994 |
Net realized losses on investments | (819,137) | (1,594,466) |
Net change in unrealized gains (losses) on investments | (3,305,043) | (149,379) |
Net decrease in net assets resulting from operations | (2,511,584) | (169,851) |
| Capital transactions | ||
| Transactions in investors’ beneficial interests | ||
Contributions | 10,033,276 | 9,652,126 |
Withdrawals | (11,352,841) | (15,111,545) |
Net decrease in net assets resulting from capital transactions | (1,319,565) | (5,459,419) |
Total decrease in net assets | (3,831,149) | (5,629,270) |
| Net assets | ||
Beginning of period | 36,918,418 | 42,547,688 |
End of period | $ 33,087,269 | $ 36,918,418 |
| Year ended February 28 | |||||
| 2022 | 2021 | 2020 1 | 2019 | 2018 2 | |
Total return3 | (7.29)% | (0.31)% | 8.59% | 2.84% | 0.62% |
| Ratios to average net assets (annualized) | |||||
Gross expenses | 0.62% | 0.54% | 0.51% | 0.44% | 0.44% |
Net expenses | 0.28% * | 0.29% * | 0.35% | 0.40% | 0.43% |
Net investment income | 4.41% | 4.37% | 4.95% | 4.70% | 4.19% |
| Supplemental data | |||||
Portfolio turnover rate | 25% | 31% | 36% | 38% | 174% |
| * | Ratio includes expenses which were voluntarily waived by the adviser. Without these voluntary waivers, the net expense ratios would be increased by the following amounts: |
| Year ended February 28, 2022 | 0.34% |
| Year ended February 28, 2021 | 0.25% |
| 1 | Year ended February 29 |
| 2 | For the period from May 23, 2017 (commencement of operations) to February 28, 2018 |
| 3 | Returns for periods of less than one year are not annualized. |
| Gross unrealized gains | $ 475,043 |
| Gross unrealized losses | (4,342,397) |
| Net unrealized losses | $(3,867,354) |
| ■ | Level 1 – quoted prices in active markets for identical securities |
| ■ | Level 2 – other significant observable inputs (including quoted prices for similar securities, interest rates, prepayment speeds, credit risk, etc.) |
| ■ | Level 3 – significant unobservable inputs (including the Portfolio’s own assumptions in determining the fair value of investments) |
| Quoted prices (Level 1) | Other significant observable inputs (Level 2) | Significant unobservable inputs (Level 3) | Total | |
| Assets | ||||
| Investments in: | ||||
| Yankee corporate bonds and notes | $ 0 | $ 5,352,198 | $0 | $ 5,352,198 |
| Yankee government bonds | 0 | 26,518,038 | 0 | 26,518,038 |
| Short-term investments | ||||
| Investment companies | 783,628 | 0 | 0 | 783,628 |
| Total assets | $783,628 | $31,870,236 | $0 | $32,653,864 |
| Average daily net assets | Advisory fee |
| First $5 billion | 0.250% |
| Next $5 billion | 0.230 |
| Over $10 billion | 0.210 |
Allspring Master Trust:

| Name and year of birth | Position held and length of service* | Principal occupations during past five years or longer | Current other public company or investment company directorships |
| William R. Ebsworth (Born 1957) | Trustee, since 2015 | Retired. From 1984 to 2013, equities analyst, portfolio manager, research director and chief investment officer at Fidelity Management and Research Company in Boston, Tokyo, and Hong Kong, and retired in 2013 as Chief Investment Officer of Fidelity Strategic Advisers, Inc. where he led a team of investment professionals managing client assets. Prior thereto, Board member of Hong Kong Securities Clearing Co., Hong Kong Options Clearing Corp., the Thailand International Fund, Ltd., Fidelity Investments Life Insurance Company, and Empire Fidelity Investments Life Insurance Company. Audit Committee Chair and Investment Committee Chair of the Vincent Memorial Hospital Endowment (non-profit organization). Mr. Ebsworth is a CFA® charterholder. | N/A |
| Jane A. Freeman (Born 1953) | Trustee, since 2015; Chair Liaison, since 2018 | Retired. From 2012 to 2014 and 1999 to 2008, Chief Financial Officer of Scientific Learning Corporation. From 2008 to 2012, Ms. Freeman provided consulting services related to strategic business projects. Prior to 1999, Portfolio Manager at Rockefeller & Co. and Scudder, Stevens & Clark. Board member of the Harding Loevner Funds from 1996 to 2014, serving as both Lead Independent Director and chair of the Audit Committee. Board member of the Russell Exchange Traded Funds Trust from 2011 to 2012 and the chair of the Audit Committee. Ms. Freeman is also an inactive Chartered Financial Analyst. | N/A |
| Isaiah Harris, Jr. (Born 1952) | Trustee, since 2009; Audit Committee Chair, since 2019 | Retired. Chairman of the Board of CIGNA Corporation from 2009 to 2021, and Director from 2005 to 2008. From 2003 to 2011, Director of Deluxe Corporation. Prior thereto, President and CEO of BellSouth Advertising and Publishing Corp. from 2005 to 2007, President and CEO of BellSouth Enterprises from 2004 to 2005 and President of BellSouth Consumer Services from 2000 to 2003. Emeritus member of the Iowa State University Foundation Board of Governors. Emeritus Member of the Advisory Board of Iowa State University School of Business. Advisory Board Member, Palm Harbor Academy (private school). Advisory Board Member, Fellowship of Christian Athletes. Mr. Harris is a certified public accountant (inactive status). | N/A |
| David F. Larcker (Born 1950) | Trustee, since 2009 | James Irvin Miller Professor of Accounting at the Graduate School of Business (Emeritus), Stanford University, Director of the Corporate Governance Research Initiative and Senior Faculty of The Rock Center for Corporate Governance since 2006. From 2005 to 2008, Professor of Accounting at the Graduate School of Business, Stanford University. Prior thereto, Ernst & Young Professor of Accounting at The Wharton School, University of Pennsylvania from 1985 to 2005. | N/A |
| Name and year of birth | Position held and length of service* | Principal occupations during past five years or longer | Current other public company or investment company directorships |
| Olivia S. Mitchell (Born 1953) | Trustee, since 2006; Nominating and Governance Committee Chair, since 2018 | International Foundation of Employee Benefit Plans Professor since 1993, Wharton School of the University of Pennsylvania. Director of Wharton’s Pension Research Council and Boettner Center on Pensions & Retirement Research, and Research Associate at the National Bureau of Economic Research. Previously taught at Cornell University from 1978 to 1993. | N/A |
| Timothy J. Penny (Born 1951) | Trustee, since 1996; Chair, since 2018 | President and Chief Executive Officer of Southern Minnesota Initiative Foundation, a non-profit organization, since 2007. Member of the Board of Trustees of NorthStar Education Finance, Inc., a non-profit organization, since 2007. | N/A |
| James G. Polisson (Born 1959) | Trustee, since 2018 | Retired. Chief Marketing Officer, Source (ETF) UK Services, Ltd, from 2015 to 2017. From 2012 to 2015, Principal of The Polisson Group, LLC, a management consulting, corporate advisory and principal investing company. Chief Executive Officer and Managing Director at Russell Investments, Global Exchange Traded Funds from 2010 to 2012. Managing Director of Barclays Global Investors from 1998 to 2010 and Global Chief Marketing Officer for iShares and Barclays Global Investors from 2000 to 2010. Trustee of the San Francisco Mechanics’ Institute, a non-profit organization, from 2013 to 2015. Board member of the Russell Exchange Traded Fund Trust from 2011 to 2012. Director of Barclays Global Investors Holdings Deutschland GmbH from 2006 to 2009. Mr. Polisson is an attorney and has a retired status with the Massachusetts and District of Columbia Bar Associations. | N/A |
| Pamela Wheelock (Born 1959) | Trustee, since January 2020; previously Trustee from January 2018 to July 2019 | Board member of the Destination Medical Center Economic Development Agency, Rochester, Minnesota since 2019. Interim President of the McKnight Foundation from January to September 2020. McKnight Foundation Consultant, November 2020 to February 2021. Acting Commissioner, Minnesota Department of Human Services, July 2019 through September 2019. Consultant (part-time), Minnesota Department of Human Services, October 2019 through December 2019. Chief Operating Officer, Twin Cities Habitat for Humanity from 2017 to 2019. Vice President of University Services, University of Minnesota from 2012 to 2016. Prior thereto, on the Board of Directors, Governance Committee and Finance Committee for the Minnesota Philanthropy Partners (Saint Paul Foundation) from 2012 to 2018, Interim Chief Executive Officer of Blue Cross Blue Shield of Minnesota from 2011 to 2012, Chairman of the Board from 2009 to 2012 and Board Director from 2003 to 2015. Vice President, Leadership and Community Engagement, Bush Foundation, Saint Paul, Minnesota (a private foundation) from 2009 to 2011. Executive Vice President and Chief Financial Officer, Minnesota Sports and Entertainment from 2004 to 2009 and Senior Vice President from 2002 to 2004. Executive Vice President of the Minnesota Wild Foundation from 2004 to 2008. Commissioner of Finance, State of Minnesota, from 1999 to 2002. Currently Board Chair of the Minnesota Wild Foundation since 2010. | N/A |
| Name and year of birth | Position held and length of service | Principal occupations during past five years or longer |
| Andrew Owen (Born 1960) | President, since 2017 | President, Chief Executive Officer and Director of Allspring Funds Management, LLC since 2017 and co-president of Galliard Capital Management, LLC, an affiliate of Allspring Funds Management, LLC, since 2019. Prior thereto, Head of Affiliated Managers, Allspring Global Investments, from 2014 to 2019 and Executive Vice President responsible for marketing, investments and product development for Allspring Funds Management, LLC, from 2009 to 2014. In addition, Mr. Owen was an Executive Vice President of Wells Fargo & Company from 2014 to 2021. |
| Jeremy DePalma (Born 1974) | Treasurer, since 2012 (for certain funds in the Fund Complex); since 2021 (for the remaining funds in the Fund Complex) | Senior Vice President of Allspring Funds Management, LLC since 2009. Senior Vice President of Evergreen Investment Management Company, LLC from 2008 to 2010 and head of the Fund Reporting and Control Team within Fund Administration from 2005 to 2010. |
| Kate McKinley (Born 1977) | Chief Legal Officer, since 2021 | Chief Legal Officer of Allspring Global Investments since 2021. Prior thereto, held various roles at State Street Global Advisors beginning in 2010, including serving as Senior Vice President and General Counsel from 2019 to 2021, and Chief Operating Officer of the Institutional Client Group from 2016 - 2019. Prior to working at State Street Global Advisors served as Assistant General Counsel for Bank of America Corporation from 2005 to 2010 and as an Associate at WilmerHale from 2002 to 2005. |
| Christopher Baker (Born 1976) | Chief Compliance Officer, since 2022 | Global Chief Compliance Officer for Allspring Global Investments since 2022. Prior thereto, Chief Compliance Officer for State Street Global Advisors from 2018 to 2021. Senior Compliance Officer for the State Street divisions of Alternative Investment Solutions, Sector Solutions, and Global Marketing from 2015 to 2018. From 2010 to 2015 Vice President, Global Head of Investment and Marketing Compliance for State Street Global Advisors. |
| Matthew Prasse (Born 1983) | Secretary, since 2021 | Senior Counsel of the Allspring Legal Department since 2021. Senior Counsel of the Wells Fargo Legal Department from 2018 to 2021. Previously, Counsel for Barings LLC from 2015 to 2018. Prior to joining Barings, Associate at Morgan, Lewis & Bockius LLP from 2008 to 2015. |
P.O. Box 219967
Kansas City, MO 64121-9967
1-800-222-8222. Read the prospectus carefully before you invest or send money.

| Investment objective | The Portfolio seeks long-term capital appreciation. |
| Adviser | Allspring Funds Management, LLC |
| Subadviser | Allspring Global Investments, LLC |
| Portfolio managers | Dennis Bein, CFA®‡†, Harindra de Silva, Ph.D., CFA®‡, Monisha Jayakumar |
| Ten largest holdings (%) as of February 28, 20221 | |
| Taiwan Semiconductor Manufacturing Company Limited | 6.77 |
| Tencent Holdings Limited | 3.99 |
| Samsung Electronics Company Limited | 3.62 |
| Alibaba Group Holding Limited ADR | 2.48 |
| Meituan Dianping | 1.09 |
| Infosys Limited | 1.09 |
| Reliance Industries Limited | 0.87 |
| JD.com Incorporated ADR | 0.80 |
| SK Hynix Incorporated | 0.72 |
| Housing Development Finance Corporation Limited | 0.71 |
| 1 | Figures represent the percentage of the Portfolio's net assets. Holdings are subject to change and may have changed since the date specified. |
| Sector allocation as of February 28, 20221 |
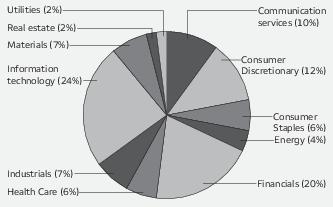
| 1 | Figures represent the percentage of the Portfolio's long-term investments. These amounts are subject to change and may have changed since the date specified. |
| Country allocation as of February 28, 20221 |

| 1 | Figures represent the percentage of the Portfolio's long-term investments. These amounts are subject to change and may have changed since the date specified. |
| ‡ | CFA® and Chartered Financial Analyst® are trademarks owned by CFA Institute. |
| † | Mr. Bein is expected to retire on September 30, 2022. He will remain a portfolio manager of the Portfolio through June 30, 2022, at which time he will transition to the role of advisor to the team until his retirement. |
| Shares | Value | |||||
| Common stocks: 94.98% | ||||||
| Brazil: 2.89% | ||||||
| Ambev SA (Consumer staples, Beverages) | 61,000 | $ 179,020 | ||||
| Atacadao Distribuicao Comercio e Industria Limitada (Consumer staples, Food & staples retailing) | 38,400 | 141,548 | ||||
| B3 Brasil Bolsa Balcao SA (Financials, Capital markets) | 95,400 | 268,397 | ||||
| Banco BTG Pactual SA (Financials, Capital markets) | 9,700 | 48,192 | ||||
| Banco do Brasil SA (Financials, Banks) | 30,400 | 205,537 | ||||
| Banco Santander Brasil SA (Financials, Banks) | 20,500 | 121,508 | ||||
| BB Seguridade Participacoes SA (Financials, Insurance) | 107,500 | 474,023 | ||||
| BRF SA (Consumer staples, Food products) † | 38,100 | 120,150 | ||||
| CCR SA (Industrials, Transportation infrastructure) | 62,500 | 142,190 | ||||
| Cia Siderurgica Nacional SA (Materials, Metals & mining) | 31,000 | 152,574 | ||||
| Companhia de Saneamento Basico do Estado de Sao Paulo SA (Utilities, Water utilities) | 19,300 | 154,867 | ||||
| Equatorial Energia SA (Utilities, Electric utilities) | 17,500 | 86,543 | ||||
| JBS SA (Consumer staples, Food products) | 76,700 | 537,268 | ||||
| Klabin SA (Materials, Containers & packaging) | 23,000 | 103,308 | ||||
| Localiza Rent A Car SA (Industrials, Road & rail) | 20,260 | 225,541 | ||||
| Petróleo Brasileiro SA (Consumer discretionary, Specialty retail) | 55,700 | 396,050 | ||||
| Raia Drogasil SA (Consumer staples, Food & staples retailing) | 16,500 | 74,698 | ||||
| Suzano Papel e Celulose SA (Materials, Paper & forest products) | 17,500 | 188,632 | ||||
| Telefonica Brasil SA (Communication services, Diversified telecommunication services) | 19,255 | 188,827 | ||||
| TIM SA (Communication services, Wireless telecommunication services) | 43,500 | 115,383 | ||||
| Totvs SA (Information technology, Software) | 19,700 | 126,203 | ||||
| Vibra Energia SA (Consumer discretionary, Specialty retail) | 115,800 | 527,459 | ||||
| 4,577,918 | ||||||
| Chile: 0.51% | ||||||
| Banco de Chile (Financials, Banks) | 1,043,543 | 110,639 | ||||
| Banco de Credito e Inversiones (Financials, Banks) | 2,285 | 81,688 | ||||
| Banco Santander Chile SA (Financials, Banks) | 2,672,070 | 131,209 | ||||
| Cencosud SA (Consumer staples, Food & staples retailing) | 140,070 | 257,636 | ||||
| Compania Cervecerias Unidas SA (Consumer staples, Beverages) | 16,494 | 130,765 | ||||
| Enel Americas SA (Utilities, Electric utilities) | 126,231 | 14,781 | ||||
| S.A.C.I. Falabella (Consumer discretionary, Multiline retail) | 25,394 | 83,566 | ||||
| 810,284 | ||||||
| China: 30.27% | ||||||
| 360 DigiTech Incorporated ADR Class A (Financials, Consumer finance) | 522 | 9,788 | ||||
| 3SBio Incorporated (Health care, Biotechnology) 144A† | 429,000 | 340,956 | ||||
| A Living Services Company Limited Class H (Real estate, Real estate management & development) 144A | 12,000 | 21,510 | ||||
| Agile Property Holdings Limited (Real estate, Real estate management & development) | 26,000 | 11,846 | ||||
| Agricultural Bank of China Limited Class H (Financials, Banks) | 56,000 | 21,208 | ||||
| Airtac International Group (Industrials, Machinery) | 1,000 | 33,262 |
| Shares | Value | |||||
| China: (continued) | ||||||
| Alibaba Group Holding Limited ADR (Consumer discretionary, Internet & direct marketing retail) † | 37,364 | $ 3,930,319 | ||||
| Aluminum Corporation of China Limited Class A (Materials, Metals & mining) † | 55,700 | 57,684 | ||||
| Aluminum Corporation of China Limited Class H (Materials, Metals & mining) † | 83,334 | 58,902 | ||||
| Angel Yeast Company Limited Class A (Consumer staples, Food products) | 8,300 | 65,893 | ||||
| Anhui Conch Cement Company Limited Class H (Materials, Construction materials) | 30,000 | 160,996 | ||||
| Anhui Gujing Distillery Company Class B (Consumer staples, Beverages) | 13,613 | 199,606 | ||||
| Anhui Yingjia Distillery Company Limited Class A (Consumer staples, Beverages) | 13,700 | 161,224 | ||||
| ANTA Sports Products Limited (Consumer discretionary, Textiles, apparel & luxury goods) | 5,600 | 85,530 | ||||
| Apeloa Pharmaceutical Company Limited Class A (Health care, Pharmaceuticals) | 44,900 | 201,767 | ||||
| AviChina Industry & Technology Company Limited Class H (Industrials, Aerospace & defense) | 205,000 | 127,272 | ||||
| Avicopter plc Class A (Industrials, Aerospace & defense) | 1,500 | 13,961 | ||||
| Baidu Incorporated ADR (Communication services, Interactive media & services) † | 5,506 | 839,335 | ||||
| Bank of China Limited Class H (Financials, Banks) | 2,046,000 | 796,511 | ||||
| Bank of Communications Company Limited Class A (Financials, Banks) | 89,500 | 67,909 | ||||
| Bank of Communications Company Limited Class H (Financials, Banks) | 494,000 | 338,651 | ||||
| Bank of Jiangsu Company Limited Class A (Financials, Banks) | 23,900 | 25,253 | ||||
| Bank of Nanjing Company Limited Class A (Financials, Banks) | 20,400 | 31,616 | ||||
| Beijing E-Hualu Information Technology Company Limited Class A (Information technology, Software) | 35,200 | 157,063 | ||||
| Beijing Enlight Media Company Limited Class A (Communication services, Media) | 52,600 | 78,883 | ||||
| Beijing Kingsoft Office Software Incorporated Class A (Information technology, Software) | 698 | 23,702 | ||||
| Beijing Shiji Information Technology Company Limited Class A (Information technology, Software) | 12,000 | 45,627 | ||||
| Beijing United Information Technology Company Limited Class A (Industrials, Trading companies & distributors) | 2,200 | 41,313 | ||||
| Beijing Wantai Biological Pharmacy Enterprise Company Limited Class A (Health care, Biotechnology) | 6,500 | 259,339 | ||||
| Beijing Yuanliu Hongyuan Electronic Technology Company Class A (Information technology, Electronic equipment, instruments & components) | 1,907 | 48,910 | ||||
| BYD Company Limited Class A (Consumer discretionary, Automobiles) | 300 | 12,075 | ||||
| BYD Company Limited Class H (Consumer discretionary, Automobiles) | 12,000 | 371,848 | ||||
| C&S Paper Company Limited Class A (Consumer staples, Household products) | 32,500 | 75,699 | ||||
| CGN Power Company Limited H Shares (Utilities, Independent power & renewable electricity producers) 144A | 944,000 | 267,634 |
| Shares | Value | |||||
| China: (continued) | ||||||
| Chengxin Lithium Group Company Limited Class A (Materials, Paper & forest products) † | 4,400 | $ 41,284 | ||||
| Chifeng Jilong Gold Mining Company Limited Class A (Materials, Metals & mining) † | 15,700 | 39,105 | ||||
| China Baoan Group Company Limited Class A (Industrials, Industrial conglomerates) | 49,700 | 109,093 | ||||
| China Bohai Bank Company Limited Class H (Financials, Banks) | 313,500 | 52,152 | ||||
| China Cinda Asset Management Company Limited Class H (Financials, Capital markets) | 1,435,000 | 259,037 | ||||
| China CITIC Bank Class H (Financials, Banks) | 727,000 | 341,627 | ||||
| China Coal Energy Company Limited H Shares (Energy, Oil, gas & consumable fuels) | 480,000 | 299,200 | ||||
| China Communications Services Corporation Limited H Shares (Industrials, Construction & engineering) | 462,000 | 253,463 | ||||
| China Construction Bank Class A (Financials, Banks) | 92,900 | 88,959 | ||||
| China Construction Bank Class H (Financials, Banks) | 1,452,000 | 1,088,949 | ||||
| China Evergrande Group (Real estate, Real estate management & development) | 83,000 | 16,988 | ||||
| China Feihe Limited (Consumer staples, Food products) 144A | 87,000 | 103,814 | ||||
| China Galaxy Securities Company Limited Class H (Financials, Capital markets) | 226,000 | 129,359 | ||||
| China Hongqiao Group Limited (Materials, Metals & mining) | 48,000 | 67,200 | ||||
| China International Capital Corporation Limited Class H (Financials, Capital markets) 144A | 20,000 | 48,658 | ||||
| China Lesso Group Holdings Limited (Industrials, Building products) | 16,000 | 24,633 | ||||
| China Life Insurance Company Limited Class H (Financials, Insurance) | 107,000 | 177,259 | ||||
| China Longyuan Power Group Corporation Class H (Utilities, Independent power & renewable electricity producers) | 104,000 | 214,613 | ||||
| China Medical System Holding Limited (Health care, Pharmaceuticals) | 217,000 | 386,402 | ||||
| China MeiDong Auto Holdings Limited (Consumer discretionary, Specialty retail) | 26,000 | 122,421 | ||||
| China Merchants Bank Company Limited Class A (Financials, Banks) | 16,100 | 127,382 | ||||
| China Merchants Bank Company Limited Class H (Financials, Banks) | 89,000 | 750,208 | ||||
| China Molybdenum Company Limited Class H (Materials, Metals & mining) | 309,000 | 185,988 | ||||
| China National Building Material Company Limited Class H (Materials, Construction materials) | 180,000 | 230,909 | ||||
| China National Medicines Corporation Limited Class A (Health care, Health care equipment & supplies) | 5,200 | 22,973 | ||||
| China Oilfield Services Limited H Shares (Energy, Energy equipment & services) | 178,000 | 202,919 | ||||
| China Petroleum & Chemical Corporation Class H (Energy, Oil, gas & consumable fuels) | 760,000 | 378,090 | ||||
| China Railway Group Limited H Shares (Industrials, Construction & engineering) | 363,000 | 213,138 | ||||
| China Resources Cement Holdings Limited (Materials, Construction materials) | 50,000 | 42,784 | ||||
| China Resources Land Limited (Real estate, Real estate management & development) | 54,000 | 262,672 |
| Shares | Value | |||||
| China: (continued) | ||||||
| China Resources Sanjiu Medical & Pharmaceutical Company Limited Class A (Health care, Pharmaceuticals) | 10,100 | $ 57,309 | ||||
| China Shenhua Energy Company Limited Class H (Energy, Oil, gas & consumable fuels) | 119,000 | 327,962 | ||||
| China Southern Airlines Company Class H (Industrials, Airlines) † | 34,000 | 21,511 | ||||
| China State Construction International Holdings (Industrials, Construction & engineering) | 42,000 | 59,149 | ||||
| China Suntien Green Energy H Shares (Energy, Oil, gas & consumable fuels) | 244,000 | 162,536 | ||||
| China Yuhua Education Corporation Limited (Consumer discretionary, Diversified consumer services) 144A | 1,256,000 | 325,177 | ||||
| China Zhenhua (Group) Science & Technology Company Limited Class A (Information technology, Electronic equipment, instruments & components) | 5,200 | 97,010 | ||||
| Chinasoft International Limited (Information technology, IT services) | 54,000 | 49,270 | ||||
| Chongqing Zhifei Biological Products Company Limited (Health care, Biotechnology) | 3,200 | 65,551 | ||||
| COSCO Shipping Holdings Company Limited Class H (Industrials, Transportation infrastructure) † | 171,175 | 345,983 | ||||
| Country Garden Holdings Company Limited (Real estate, Real estate management & development) | 66,000 | 51,277 | ||||
| CRRC Corporation Limited H Shares (Industrials, Machinery) | 693,000 | 307,993 | ||||
| Da An Gene Company Limited of Sun Yat-Sen University Class A (Health care, Health care equipment & supplies) | 111,540 | 328,202 | ||||
| Dali Foods Group Company Limited (Consumer staples, Food products) 144A | 175,000 | 92,169 | ||||
| DAQO New Energy Corporation ADR (Information technology, Semiconductors & semiconductor equipment) † | 1,720 | 82,491 | ||||
| Dong E E Jiao Company Limited Class A (Health care, Pharmaceuticals) | 9,100 | 54,828 | ||||
| Dongfeng Motor Group Company Limited Class H (Consumer discretionary, Automobiles) | 262,000 | 225,510 | ||||
| Dongyue Group (Materials, Chemicals) | 155,000 | 224,865 | ||||
| Ecovacs Robotics Company Limited (Consumer discretionary, Household durables) | 5,400 | 115,914 | ||||
| ENN Energy Holdings Limited (Utilities, Gas utilities) | 13,400 | 194,064 | ||||
| Fangda Carbon New Material Company Limited Class A (Information technology, Electronic equipment, instruments & components) | 1,600 | 2,626 | ||||
| Flat Grass Group Company Limited Class H (Information technology, Semiconductors & semiconductor equipment) | 37,000 | 153,001 | ||||
| Fujian Sunner Development Company Limited Class A (Consumer staples, Food products) † | 9,900 | 31,024 | ||||
| Fuyao Glass Industry Group Company Limited Class H (Consumer discretionary, Auto components) | 12,400 | 60,836 | ||||
| G-bits Network Technology (Xiamen) Company Limited Class A (Information technology, Software) | 1,900 | 105,846 | ||||
| GD Power Development Company Limited Class A (Utilities, Independent power & renewable electricity producers) | 82,100 | 36,873 | ||||
| Geely Automobile Holdings Limited (Consumer discretionary, Automobiles) | 123,000 | 229,105 |
| Shares | Value | |||||
| China: (continued) | ||||||
| GF Securities Company Limited Class A (Financials, Capital markets) | 34,000 | $ 100,793 | ||||
| GF Securities Company Limited Class H (Financials, Capital markets) | 58,000 | 87,074 | ||||
| Great Wall Motor Company Limited Class H (Consumer discretionary, Automobiles) | 80,000 | 168,424 | ||||
| Greentown Service Group Company Limited (Real estate, Real estate management & development) | 30,000 | 30,136 | ||||
| Guangzhou Automobile Group Company Limited Class H (Consumer discretionary, Automobiles) | 316,400 | 313,252 | ||||
| Guangzhou Baiyunshan Pharmaceutical Holdings Company Limited Class A (Health care, Pharmaceuticals) | 18,000 | 84,965 | ||||
| Guangzhou Kingmed Diagnostics Group Company Limited Class A (Health care, Health care providers & services) | 4,800 | 64,040 | ||||
| Guangzhou R&F Properties Company Limited Class H (Real estate, Real estate management & development) | 36,800 | 15,666 | ||||
| Haier Smart Home Company Limited Class H (Consumer discretionary, Household durables) | 13,800 | 48,356 | ||||
| Haitong Securities Company Limited Class H (Financials, Capital markets) | 48,800 | 41,992 | ||||
| Hangzhou First Applied Material Company Limited (Industrials, Building products) | 5,800 | 110,170 | ||||
| Hangzhou Silan Microelectronics Company Limited Class A (Information technology, Semiconductors & semiconductor equipment) | 7,900 | 72,278 | ||||
| Hefei Meyer Optoelectronic Technology Incorporated Class A (Industrials, Machinery) | 23,900 | 137,280 | ||||
| Hithink RoyalFlush Information Network Company Limited Class A (Financials, Capital markets) | 5,800 | 99,702 | ||||
| Hongfa Technology Company Limited Class A (Industrials, Machinery) | 9,400 | 94,029 | ||||
| Hopson Development Holdings Limited (Real estate, Real estate management & development) | 59,750 | 122,999 | ||||
| Hoshine Silicon Industry Company Limited Class A (Materials, Chemicals) | 4,100 | 97,615 | ||||
| Huadian Power International Corporation Limited Class A (Utilities, Independent power & renewable electricity producers) | 81,300 | 55,622 | ||||
| Huadong Medicine Company Limited (Health care, Pharmaceuticals) | 23,500 | 141,907 | ||||
| Hualan Biological Engineering Incorporated Class A (Health care, Biotechnology) | 3,100 | 12,669 | ||||
| Huaneng Power International Incorporated Class H (Utilities, Independent power & renewable electricity producers) | 69,334 | 40,700 | ||||
| Huaxin Cement Company Limited Class A (Materials, Construction materials) | 3,900 | 12,701 | ||||
| Hubei Xingfa Chemicals Group Company Limited Class A (Materials, Chemicals) | 28,700 | 188,437 | ||||
| Hunan Valin Steel Company Limited Class A (Materials, Metals & mining) | 49,900 | 46,221 | ||||
| Hundsun Technologies Incorporated Class A (Information technology, Software) | 4,400 | 36,601 | ||||
| iFLYTEK Company Limited Class A (Information technology, IT services) | 19,600 | 153,299 | ||||
| Industrial & Commercial Bank of China Limited Class H (Financials, Banks) | 1,068,000 | 637,548 |
| Shares | Value | |||||
| China: (continued) | ||||||
| Industrial Securities Company (Industrials, Professional services) | 19,400 | $ 25,257 | ||||
| Inner Mongilia Junzheng Energy & Chemical Industry Group Company Limited Class A (Materials, Chemicals) | 80,200 | 63,184 | ||||
| Inner Mongolia Yuan Xing Energy Company Limited Class A (Materials, Chemicals) † | 129,600 | 185,805 | ||||
| Inspur Electronic Information Industry Company Limited Class A (Information technology, Technology hardware, storage & peripherals) | 6,800 | 35,590 | ||||
| Intco Medical Technology Company Limited Class A (Health care, Health care equipment & supplies) | 12,750 | 103,498 | ||||
| IQIYI Incorporated ADR (Communication services, Entertainment) † | 2,269 | 9,394 | ||||
| Jafron Biomedical Company Limited Class A (Health care, Health care equipment & supplies) | 3,800 | 27,685 | ||||
| JD.com Incorporated ADR (Consumer discretionary, Internet & direct marketing retail) † | 17,645 | 1,263,911 | ||||
| JD.com Incorporated Class A (Consumer discretionary, Internet & direct marketing retail) † | 5,885 | 210,209 | ||||
| Jiangsu Express Company Limited Class H (Industrials, Transportation infrastructure) | 236,000 | 252,506 | ||||
| Jiangsu Yuyue Medical Equipment & Supply Company Limited Class A (Health care, Health care equipment & supplies) | 23,700 | 110,318 | ||||
| Jiangxi Copper Company Limited Class A (Materials, Metals & mining) | 18,500 | 65,639 | ||||
| Jiangxi Copper Company Limited Class H (Materials, Metals & mining) | 180,000 | 324,000 | ||||
| Jiumaojiu International Holdings Limited (Consumer discretionary, Hotels, restaurants & leisure) 144A | 14,000 | 31,451 | ||||
| Joinn Laboratories China Company Limited Class A (Health care, Health care technology) | 4,200 | 76,732 | ||||
| Juewei Food Company Limited Class A (Consumer staples, Food products) | 3,900 | 32,789 | ||||
| Kunlun Energy Company Limited (Utilities, Gas utilities) | 166,000 | 163,291 | ||||
| Kunlun Tech Company Limited Class A (Communication services, Interactive media & services) | 3,800 | 10,657 | ||||
| Kweichow Moutai Company Limited Class A (Consumer staples, Beverages) | 1,000 | 284,648 | ||||
| Lenovo Group Limited (Information technology, Technology hardware, storage & peripherals) | 226,000 | 251,667 | ||||
| Leyard Optoelectronic Company Limited Class A (Information technology, Electronic equipment, instruments & components) | 33,900 | 45,676 | ||||
| Li Ning Company Limited (Consumer discretionary, Textiles, apparel & luxury goods) | 30,500 | 304,639 | ||||
| Logan Property Holdings Company Limited (Real estate, Real estate management & development) | 26,000 | 8,650 | ||||
| Luxi Chemical Group Company Limited Class A (Materials, Chemicals) | 29,300 | 78,371 | ||||
| Meituan Dianping (Consumer discretionary, Internet & direct marketing retail) † | 78,000 | 1,732,782 | ||||
| Mianyang Fulin Precision Company Limited Class A (Consumer discretionary, Auto components) † | 30,000 | 127,384 | ||||
| Nari Technology Company Limited (Industrials, Electrical equipment) | 8,580 | 48,471 |
| Shares | Value | |||||
| China: (continued) | ||||||
| NetEase Incorporated ADR (Communication services, Entertainment) | 6,186 | $ 589,773 | ||||
| Nine Dragons Paper Holdings Limited (Materials, Paper & forest products) | 34,000 | 32,571 | ||||
| NIO Incorporated ADR Class A (Consumer discretionary, Automobiles) † | 10,119 | 231,118 | ||||
| North Industries Group Red Arrow Company Limited Class A (Industrials, Machinery) † | 37,600 | 134,587 | ||||
| Northeast Securities Company Limited Class A (Financials, Diversified financial services) | 47,600 | 62,535 | ||||
| OFILM Group Company Limited Class A (Information technology, Electronic equipment, instruments & components) † | 11,700 | 14,894 | ||||
| Pangang Group Vanadium Titanium and Resources Company Limited Class A (Materials, Metals & mining) † | 176,400 | 118,222 | ||||
| People's Insurance Company Group of China Limited Class H (Financials, Insurance) | 1,285,000 | 413,237 | ||||
| PetroChina Company Limited Class H (Energy, Oil, gas & consumable fuels) | 846,000 | 453,139 | ||||
| PharmaBlock Sciences Nanjing Incorporated Class A (Health care, Pharmaceuticals) | 2,100 | 30,957 | ||||
| Pharmaron Beijing Company Limited Class A (Health care, Life sciences tools & services) | 5,200 | 99,888 | ||||
| Pharmaron Beijing Company Limited Class H (Health care, Life sciences tools & services) 144A | 7,600 | 92,143 | ||||
| PICC Property & Casualty Company Limited Class H (Financials, Insurance) | 538,000 | 567,905 | ||||
| Pinduoduo Incorporated ADR (Consumer discretionary, Internet & direct marketing retail) † | 5,368 | 278,384 | ||||
| Ping An Insurance Group Company Class H (Financials, Insurance) | 52,500 | 407,067 | ||||
| Postal Savings Bank of China Company Limited Class H (Financials, Banks) 144A | 312,000 | 256,178 | ||||
| Powerlong Real Estate Holdings Limited (Real estate, Real estate management & development) | 32,000 | 15,338 | ||||
| Proya Cosmetics Company Limited (Consumer discretionary, Specialty retail) | 1,900 | 56,120 | ||||
| Sailun Group Company Limited Class A (Consumer discretionary, Auto components) | 51,600 | 99,070 | ||||
| Sany Heavy Equipment International Holdings Company Limited (Industrials, Machinery) | 163,000 | 169,030 | ||||
| Seazen Group Limited (Real estate, Real estate management & development) | 134,000 | 70,706 | ||||
| SG Micro Corporation Class A (Information technology, Semiconductors & semiconductor equipment) | 2,300 | 127,413 | ||||
| Shaanxi Coal Industry Company Limited (Materials, Chemicals) | 9,300 | 21,030 | ||||
| Shandong Hualu-Hengsheng Chemical Company Limited Class A (Materials, Chemicals) | 489 | 2,750 | ||||
| Shanghai Baosight Software Company Limited Class A (Information technology, IT services) | 26,110 | 223,551 | ||||
| Shanghai Baosight Software Company Limited Class B (Information technology, Software) | 109,390 | 472,407 | ||||
| Shanghai Fosun Pharmaceutical Company Limited Class H (Health care, Pharmaceuticals) | 10,000 | 40,095 | ||||
| Shanghai International Port (Group) Company Limited Class A (Industrials, Transportation infrastructure) | 69,100 | 62,607 |
| Shares | Value | |||||
| China: (continued) | ||||||
| Shanghai Jahwa United Company (Consumer staples, Personal products) | 12,200 | $ 75,097 | ||||
| Shanghai Lujiazui Finance & Trade Zone Development Company Limited (Real estate, Real estate management & development) | 440,254 | 392,266 | ||||
| Shanghai Medicilon Incorporated Class A (Health care, Life sciences tools & services) | 1,320 | 81,318 | ||||
| Shanghai Pharmaceuticals Holding Company Limited Class A (Health care, Health care providers & services) | 46,500 | 138,236 | ||||
| Shanghai Pharmaceuticals Holding Company Limited Class H (Health care, Health care providers & services) | 69,834 | 126,055 | ||||
| Shanxi Taigang Stainless Steel Company Limited (Materials, Metals & mining) | 175,300 | 203,801 | ||||
| Shenzhen New Industries Biomedical Engineering Company Limited Class A (Health care, Health care equipment & supplies) | 2,300 | 14,858 | ||||
| Shenzhen Overseas Chinese Town Holding Company Class A (Consumer discretionary, Hotels, restaurants & leisure) | 10,700 | 11,716 | ||||
| Shenzhen Sunlord Electronics Company Limited Class A (Information technology, Electronic equipment, instruments & components) | 5,300 | 27,026 | ||||
| Shimao Property Holding Limited (Real estate, Real estate management & development) | 28,000 | 16,803 | ||||
| Shimao Services Holdings Company Limited (Real estate, Real estate management & development) 144A | 13,000 | 9,501 | ||||
| Sichuan Hebang Biotechnology Company Limited Class A (Materials, Chemicals) † | 274,000 | 170,625 | ||||
| Sichuan Kelun Pharmaceutical Company Limited Class A (Health care, Pharmaceuticals) | 13,400 | 36,964 | ||||
| Sichuan Swellfun Company Limited Class A (Consumer staples, Beverages) | 5,500 | 87,105 | ||||
| Sieyuan Electric Company Limited Class A (Industrials, Electrical equipment) | 14,600 | 109,639 | ||||
| Sinopec Shanghai Petrochemical Company Limited Class A (Materials, Chemicals) | 323,400 | 209,394 | ||||
| Sinopharm Group Company Limited Class H (Health care, Health care providers & services) | 159,600 | 386,900 | ||||
| Sinotrans Limited Class A (Industrials, Air freight & logistics) | 172,600 | 117,861 | ||||
| Sunac China Holdings Limited (Real estate, Real estate management & development) | 55,000 | 44,957 | ||||
| Sunny Optical Technology Group Company Limited (Information technology, Electronic equipment, instruments & components) | 12,400 | 297,153 | ||||
| Suzhou TA&A Ultra Clean Technology Company Limited Class A (Consumer discretionary, Textiles, apparel & luxury goods) | 6,800 | 97,167 | ||||
| Tebian Electric Apparatus Stock Company Limited Class A (Industrials, Electrical equipment) | 6,500 | 20,964 | ||||
| Tencent Holdings Limited (Communication services, Interactive media & services) | 117,200 | 6,324,266 | ||||
| The Hello Group Incorporated ADR (Communication services, Interactive media & services) | 5,672 | 54,054 | ||||
| Thunder Software Technology Company Limited Class A (Industrials, Commercial services & supplies) | 2,700 | 60,204 | ||||
| Tibet Summit Resources Company Limited Class A (Materials, Metals & mining) | 23,400 | 127,243 |
| Shares | Value | |||||
| China: (continued) | ||||||
| Tingyi Holding Corporation (Consumer staples, Food products) | 74,000 | $ 163,718 | ||||
| Titan Wind Energy (Suzhou) Company Limited Class A (Industrials, Electrical equipment) | 52,200 | 172,677 | ||||
| Tongcheng-Elong Holdings Limited (Consumer discretionary, Hotels, restaurants & leisure) † | 94,000 | 175,070 | ||||
| Tongling Nonferrous Metals Group Company Limited Class A (Materials, Metals & mining) | 117,100 | 74,293 | ||||
| Topsec Technologies Group Incorporated Class A (Information technology, Software) | 42,700 | 99,908 | ||||
| Topsports International Holdings Limited (Consumer discretionary, Specialty retail) 144A | 33,000 | 34,304 | ||||
| Transfar Zhilian Company Limited Class A (Materials, Chemicals) | 63,700 | 78,057 | ||||
| Trip.com Group Limited ADR (Consumer discretionary, Hotels, restaurants & leisure) † | 5,466 | 141,132 | ||||
| Unigroup Guoxin Microelectronics Company Limited Class A (Information technology, Semiconductors & semiconductor equipment) | 1,400 | 49,211 | ||||
| Uni-President China Holdings Limited (Consumer staples, Food products) | 179,000 | 186,138 | ||||
| Unisplendour Corporation Limited Class A (Information technology, Electronic equipment, instruments & components) | 19,100 | 66,642 | ||||
| Vipshop Holdings Limited ADR (Consumer discretionary, Internet & direct marketing retail) † | 9,918 | 85,989 | ||||
| Walvax Biotechnology Company Limited Class A (Health care, Biotechnology) | 16,500 | 123,086 | ||||
| Want Want China Holdings Limited (Consumer staples, Food products) | 243,000 | 258,680 | ||||
| Weibo Corporation ADR (Communication services, Interactive media & services) † | 1,227 | 33,657 | ||||
| Weichai Power Company Limited Class H (Industrials, Machinery) | 91,000 | 153,984 | ||||
| Westone Information Industry Incorporated Class A (Information technology, Electronic equipment, instruments & components) | 6,100 | 44,698 | ||||
| Will Semiconductor Company Limited Class A (Information technology, Semiconductors & semiconductor equipment) | 400 | 15,711 | ||||
| Winning Health Technology Group Company Limited Class A (Information technology, IT services) | 87,500 | 159,201 | ||||
| Wuhu Sanqi Interactive Entertainment Network Technology Group Company Limited Class A (Consumer discretionary, Auto components) | 12,300 | 40,885 | ||||
| Wuhu Token Science Company Limited Class A (Information technology, Electronic equipment, instruments & components) | 27,400 | 42,131 | ||||
| WuXi AppTec Company Limited (Health care, Life sciences tools & services) 144A | 1,636 | 23,288 | ||||
| Wuxi Biologics (Cayman) Incorporated (Health care, Life sciences tools & services) 144A† | 42,500 | 351,535 | ||||
| Wuxi Shangji Automation Company Limited Class A (Industrials, Machinery) | 1,100 | 27,797 | ||||
| Xiamen Faratronic Company Limited Class A (Information technology, Electronic equipment, instruments & components) | 5,300 | 180,001 |
| Shares | Value | |||||
| China: (continued) | ||||||
| Xiaomi Corporation Class B (Information technology, Technology hardware, storage & peripherals) 144A† | 136,400 | $ 256,734 | ||||
| Xinjiang Zhongtai Chemical Company Limited Class A (Materials, Chemicals) | 91,000 | 156,592 | ||||
| Yanzhou Coal Mining Company Limited Class H (Energy, Oil, gas & consumable fuels) | 104,000 | 254,989 | ||||
| Yealink Network Technology (Information technology, Communications equipment) | 4,100 | 49,746 | ||||
| Yonyou Network Technology Company Limited Class A (Information technology, Software) | 2,700 | 13,486 | ||||
| Youngor Group Company Limited (Real estate, Real estate management & development) | 98,400 | 105,788 | ||||
| YTO Express Group Company Limited Class A (Industrials, Air freight & logistics) | 7,900 | 21,768 | ||||
| Yum China Holdings Incorporated (Consumer discretionary, Hotels, restaurants & leisure) | 6,405 | 333,188 | ||||
| Yunnan Aluminium Company Limited Class A (Materials, Metals & mining) † | 10,600 | 24,428 | ||||
| Yunnan Tin Company Group Limited Class A (Materials, Metals & mining) † | 13,300 | 53,125 | ||||
| Zhangzhou Pientzehuang Pharmaceutical Company (Health care, Pharmaceuticals) | 1,800 | 103,718 | ||||
| Zhejiang China Commodities City Group Company Limited Class A (Real estate, Real estate management & development) | 39,300 | 29,084 | ||||
| Zhejiang Expressway Company Limited Class H (Industrials, Transportation infrastructure) | 420,000 | 378,885 | ||||
| Zhejiang Jinsheng Mechanical & Electrical Company Limited Class A (Information technology, Semiconductors & semiconductor equipment) | 5,300 | 54,981 | ||||
| Zhejiang Jiuzhou Pharmaceutical Company Limited Class A (Health care, Pharmaceuticals) | 8,400 | 64,029 | ||||
| Zhejiang Juhua Company Limited Class A (Materials, Chemicals) | 7,100 | 16,544 | ||||
| Zhejiang NHU Company Limited (Health care, Biotechnology) | 1,480 | 7,984 | ||||
| Zhejiang Supor Company Limited Class A (Consumer discretionary, Household durables) | 8,600 | 69,125 | ||||
| Zhongsheng Group Holdings Limited (Consumer discretionary, Specialty retail) | 24,000 | 167,590 | ||||
| Zhuzhou CSR Times Electric Company Limited Class H (Industrials, Electrical equipment) | 27,900 | 145,429 | ||||
| Zhuzhou Kibing Group Company Limited Class A (Industrials, Building products) | 24,800 | 62,062 | ||||
| Zibo Qixiang Tengda Chemical Company Limited Class A (Materials, Chemicals) | 51,000 | 78,344 | ||||
| Zijin Mining Group Company Limited Class H (Materials, Metals & mining) | 88,000 | 130,608 | ||||
| ZTE Corporation Class H (Information technology, Communications equipment) | 98,800 | 243,399 | ||||
| 47,948,440 | ||||||
| Colombia: 0.16% | ||||||
| Bancolombia SA (Financials, Banks) | 14,015 | 138,975 |
| Shares | Value | |||||
| Colombia: (continued) | ||||||
| Ecopetrol SA (Energy, Oil, gas & consumable fuels) | 85,772 | $ 71,088 | ||||
| Grupo de Inversiones Suramericana SA (Industrials, Professional services) | 4,471 | 36,284 | ||||
| 246,347 | ||||||
| Czech Republic: 0.15% | ||||||
| Komercni Banka AS (Financials, Banks) | 2,093 | 82,339 | ||||
| Moneta Money Bank (Financials, Banks) 144A | 39,681 | 157,117 | ||||
| 239,456 | ||||||
| Egypt: 0.14% | ||||||
| Commercial International Bank ADR (Financials, Banks) † | 72,287 | 214,692 | ||||
| Greece: 0.57% | ||||||
| Eurobank Ergasias SA (Financials, Banks) † | 265,865 | 291,237 | ||||
| FF Group (Consumer discretionary, Textiles, apparel & luxury goods) ♦† | 3,820 | 0 | ||||
| Hellenic Telecommunications Organization SA (Communication services, Diversified telecommunication services) | 14,608 | 292,189 | ||||
| OPAP SA (Consumer discretionary, Hotels, restaurants & leisure) | 21,586 | 314,610 | ||||
| 898,036 | ||||||
| Hong Kong: 2.44% | ||||||
| Beijing Enterprises Holdings Limited (Utilities, Gas utilities) | 10,500 | 35,894 | ||||
| Beijing Enterprises Water Group Limited (Utilities, Water utilities) | 226,000 | 89,289 | ||||
| Brilliance China Automotive Holdings Limited (Consumer discretionary, Automobiles) ♦† | 100,000 | 45,812 | ||||
| BYD Electronic International Company Limited (Information technology, Communications equipment) | 31,000 | 87,476 | ||||
| China Everbright International Limited (Industrials, Commercial services & supplies) | 57,000 | 40,925 | ||||
| China Mengniu Dairy Company Limited (Consumer staples, Food products) | 45,334 | 294,781 | ||||
| China Merchants Port Holdings Company Limited (Industrials, Transportation infrastructure) | 160,000 | 301,663 | ||||
| China Overseas Land & Investment Limited (Real estate, Real estate management & development) | 76,500 | 233,567 | ||||
| China Overseas Property Holding Limited (Real estate, Real estate management & development) | 220,000 | 238,861 | ||||
| China Resources Power Holdings Company (Utilities, Independent power & renewable electricity producers) | 68,000 | 151,883 | ||||
| China Taiping Insurance Holdings Company Limited (Financials, Insurance) | 48,400 | 57,287 | ||||
| China Traditional Chinese Medicine Holdings Company Limited (Health care, Pharmaceuticals) | 290,000 | 165,317 | ||||
| CITIC Pacific Limited (Industrials, Industrial conglomerates) | 113,000 | 131,862 | ||||
| COSCO Shipping Ports Limited (Industrials, Transportation infrastructure) | 358,000 | 295,018 | ||||
| CSPC Pharmaceutical Group Limited (Health care, Pharmaceuticals) | 266,000 | 315,306 | ||||
| Far East Horizon Limited (Financials, Diversified financial services) | 4,000 | 3,409 |
| Shares | Value | |||||
| Hong Kong: (continued) | ||||||
| Haitian International Holdings Limited (Industrials, Machinery) | 14,000 | $ 37,300 | ||||
| Kingboard Chemicals Holdings Limited (Information technology, Electronic equipment, instruments & components) | 74,500 | 348,522 | ||||
| Kingboard Laminates Holdings Limited (Information technology, Electronic equipment, instruments & components) | 181,000 | 301,609 | ||||
| KWG Property Holding Limited (Real estate, Real estate management & development) | 28,000 | 13,110 | ||||
| Lee & Man Paper Manufacturing Limited (Materials, Paper & forest products) | 27,000 | 17,357 | ||||
| MMG Limited (Materials, Metals & mining) † | 60,000 | 21,734 | ||||
| Shenzhou International Group Holdings Limited (Consumer discretionary, Textiles, apparel & luxury goods) | 400 | 6,719 | ||||
| Sino Biopharmaceutical Limited (Health care, Pharmaceuticals) | 447,000 | 285,349 | ||||
| Sinotruk Hong Kong Limited (Industrials, Machinery) | 14,500 | 21,644 | ||||
| Sun Art Retail Group Limited (Consumer staples, Food & staples retailing) | 40,000 | 14,431 | ||||
| Vinda International Holdings Limited (Consumer staples, Household products) | 45,000 | 128,126 | ||||
| Wharf Holdings Limited (Real estate, Real estate management & development) | 42,000 | 151,956 | ||||
| Yuexiu Property Company Limited (Real estate, Real estate management & development) | 28,400 | 28,408 | ||||
| 3,864,615 | ||||||
| Hungary: 0.24% | ||||||
| MOL Hungarian Oil & Gas plc (Energy, Oil, gas & consumable fuels) | 6,366 | 49,657 | ||||
| OTP Bank plc (Financials, Banks) † | 6,070 | 231,626 | ||||
| Richter Gedeon (Health care, Pharmaceuticals) | 4,652 | 97,677 | ||||
| 378,960 | ||||||
| India: 12.76% | ||||||
| ACC Limited (Materials, Construction materials) | 5,865 | 163,358 | ||||
| Adani Enterprises Limited (Industrials, Trading companies & distributors) | 1,494 | 32,854 | ||||
| Adani Ports & Special Economic Zone Limited (Industrials, Transportation infrastructure) | 12,134 | 114,735 | ||||
| Ambuja Cements Limited (Materials, Construction materials) | 37,130 | 155,616 | ||||
| Apollo Hospitals Enterprise Limited (Health care, Health care providers & services) | 6,228 | 398,623 | ||||
| Asian Paints Limited (Materials, Chemicals) | 2,048 | 86,551 | ||||
| Aurobindo Pharma Limited (Health care, Pharmaceuticals) | 5,457 | 45,427 | ||||
| Avenue Supermarts Limited (Consumer staples, Food & staples retailing) † | 2,849 | 164,827 | ||||
| Axis Bank Limited (Financials, Banks) † | 42,073 | 417,412 | ||||
| Bajaj Auto Limited (Consumer discretionary, Automobiles) | 2,225 | 104,703 | ||||
| Bajaj Finance Limited (Financials, Consumer finance) | 3,995 | 374,033 | ||||
| Bajaj Finserv Limited (Financials, Diversified financial services) | 795 | 170,439 | ||||
| Balkrishna Industries Limited (Consumer discretionary, Auto components) | 2,705 | 65,777 |
| Shares | Value | |||||
| India: (continued) | ||||||
| Bharat Electronics Limited (Industrials, Aerospace & defense) | 74,661 | $ 209,819 | ||||
| Bharat Petroleum Corporation Limited (Energy, Oil, gas & consumable fuels) | 46,537 | 217,069 | ||||
| Bharti Airtel Limited (Communication services, Wireless telecommunication services) † | 31,397 | 287,103 | ||||
| Britannia Industries Limited (Consumer staples, Food products) | 3,099 | 141,454 | ||||
| Cholamandalam Investment & Finance Company Limited (Financials, Consumer finance) | 3,712 | 34,245 | ||||
| Cipla India Limited (Health care, Pharmaceuticals) | 17,450 | 214,775 | ||||
| Coal India Limited (Materials, Metals & mining) | 38,920 | 88,031 | ||||
| Colgate-Palmolive Company India Limited (Consumer staples, Personal products) | 8,899 | 171,675 | ||||
| Container Corporation of India Limited (Industrials, Transportation infrastructure) | 34,312 | 274,619 | ||||
| Dabur India Limited (Consumer staples, Personal products) | 6,341 | 47,541 | ||||
| Divi's Laboratories Limited (Health care, Life sciences tools & services) | 4,416 | 250,968 | ||||
| DLF Limited (Real estate, Real estate management & development) | 25,532 | 119,803 | ||||
| Gail India Limited (Utilities, Gas utilities) | 94,056 | 181,867 | ||||
| Godrej Consumer Products Limited (Consumer staples, Personal products) † | 10,408 | 106,442 | ||||
| Grasim Industries Limited (Industrials, Industrial conglomerates) | 5,638 | 120,318 | ||||
| Havells India Limited (Industrials, Electrical equipment) | 2,309 | 36,479 | ||||
| HCL Technologies Limited (Information technology, IT services) | 27,309 | 410,652 | ||||
| HDFC Asset Management Company Limited (Financials, Capital markets) 144A | 3,065 | 85,229 | ||||
| Hero Motorcorp Limited (Consumer discretionary, Automobiles) | 1,380 | 46,746 | ||||
| Hindalco Industries Limited (Materials, Metals & mining) | 31,085 | 238,892 | ||||
| Hindustan Petroleum Corporation Limited (Energy, Oil, gas & consumable fuels) | 81,609 | 296,880 | ||||
| Hindustan Unilever Limited (Consumer staples, Personal products) | 1,435 | 41,498 | ||||
| Housing Development Finance Corporation Limited (Financials, Thrifts & mortgage finance) | 35,421 | 1,119,509 | ||||
| ICICI Bank Limited (Financials, Banks) | 106,300 | 1,052,873 | ||||
| ICICI Lombard General Insurance Company Limited (Financials, Insurance) 144A | 1,929 | 32,467 | ||||
| Indian Oil Corporation Limited (Energy, Oil, gas & consumable fuels) | 169,637 | 260,375 | ||||
| Indian Railway Catering & Tourism Corporation (Industrials, Commercial services & supplies) | 7,723 | 83,802 | ||||
| Indus Towers Limited (Communication services, Diversified telecommunication services) | 25,639 | 73,589 | ||||
| Info Edge India Limited (Communication services, Interactive media & services) | 4,248 | 252,517 | ||||
| Infosys Limited (Information technology, IT services) | 75,487 | 1,720,339 | ||||
| ITC Limited (Consumer staples, Tobacco) | 73,317 | 211,109 | ||||
| JSW Steel Limited (Materials, Metals & mining) | 23,656 | 198,467 | ||||
| Jubilant Foodworks Limited (Consumer discretionary, Hotels, restaurants & leisure) | 5,630 | 218,891 | ||||
| Kotak Mahindra Bank Limited (Financials, Banks) | 8,207 | 202,024 |
| Shares | Value | |||||
| India: (continued) | ||||||
| Larsen & Toubro Infotech Limited (Information technology, IT services) 144A | 2,267 | $ 177,182 | ||||
| Larsen & Toubro Limited (Industrials, Construction & engineering) | 2,893 | 70,134 | ||||
| Lupin Limited (Health care, Pharmaceuticals) | 14,328 | 142,341 | ||||
| Mahindra & Mahindra Limited (Consumer discretionary, Automobiles) | 12,096 | 127,693 | ||||
| Marico Limited (Consumer staples, Food products) | 39,795 | 272,440 | ||||
| Maruti Suzuki India Limited (Consumer discretionary, Automobiles) | 1,829 | 202,715 | ||||
| Mindtree Limited (Information technology, IT services) | 6,961 | 361,212 | ||||
| Motherson Sumi Systems Limited (Consumer discretionary, Auto components) | 26,201 | 52,678 | ||||
| Motherson Sumi Wiring India Limited (Consumer discretionary, Auto components) ♦‡† | 26,201 | 12,101 | ||||
| Mphasis Limited (Information technology, IT services) | 7,215 | 299,749 | ||||
| Nestle India Limited (Consumer staples, Food products) | 810 | 190,232 | ||||
| NTPC Limited (Utilities, Independent power & renewable electricity producers) | 104,537 | 186,090 | ||||
| Oil & Natural Gas Corporation Limited (Energy, Oil, gas & consumable fuels) | 106,697 | 229,800 | ||||
| Page Industries Limited (Consumer discretionary, Textiles, apparel & luxury goods) | 248 | 139,598 | ||||
| Petronet LNG Limited (Energy, Oil, gas & consumable fuels) | 52,109 | 149,527 | ||||
| Piramal Enterprises Limited (Financials, Diversified financial services) | 4,912 | 135,795 | ||||
| Power Grid Corporation of India Limited (Utilities, Electric utilities) | 128,148 | 356,830 | ||||
| Reliance Industries Limited (Energy, Oil, gas & consumable fuels) | 43,991 | 1,384,911 | ||||
| SBI Life Insurance Company Limited (Financials, Insurance) 144A | 2,326 | 32,892 | ||||
| Shriram Transport Finance Company Limited (Financials, Consumer finance) | 4,464 | 67,098 | ||||
| SRF Limited (Materials, Chemicals) | 2,478 | 78,861 | ||||
| State Bank of India (Financials, Banks) | 44,484 | 287,376 | ||||
| Sun Pharmaceutical Industries Limited (Health care, Pharmaceuticals) | 21,531 | 241,867 | ||||
| Tata Consultancy Services Limited (Information technology, IT services) | 17,332 | 821,047 | ||||
| Tata Motors Limited (Consumer discretionary, Automobiles) † | 46,121 | 279,594 | ||||
| Tata Power Company Limited (Utilities, Electric utilities) | 44,868 | 133,797 | ||||
| Tata Steel Limited (Materials, Metals & mining) | 29,124 | 476,868 | ||||
| Tech Mahindra Limited (Information technology, IT services) | 22,948 | 432,060 | ||||
| Titan Industries Limited (Consumer discretionary, Textiles, apparel & luxury goods) | 4,093 | 139,025 | ||||
| Torrent Pharmaceuticals Limited (Health care, Pharmaceuticals) | 937 | 34,293 | ||||
| Ultra Tech Cement Limited (Materials, Construction materials) | 1,561 | 136,621 | ||||
| United Spirits Limited (Consumer staples, Beverages) † | 14,325 | 169,145 | ||||
| UPL Limited (Materials, Chemicals) | 4,156 | 36,936 | ||||
| Vedanta Limited (Materials, Metals & mining) | 89,446 | 455,252 |
| Shares | Value | |||||
| India: (continued) | ||||||
| Wipro Limited (Information technology, IT services) | 42,716 | $ 315,874 | ||||
| Yes Bank Limited (Financials, Banks) † | 1,367,196 | 241,532 | ||||
| 20,213,588 | ||||||
| Indonesia: 1.74% | ||||||
| PT Adaro Energy Tbk (Energy, Oil, gas & consumable fuels) | 302,300 | 51,794 | ||||
| PT Aneka Tambang Tbk (Materials, Metals & mining) | 484,200 | 75,438 | ||||
| PT Astra International Tbk (Consumer discretionary, Automobiles) | 485,200 | 196,766 | ||||
| PT Bank Central Asia Tbk (Financials, Banks) | 902,500 | 509,521 | ||||
| PT Bank Mandiri Persero Tbk (Financials, Banks) | 419,400 | 226,745 | ||||
| PT Bank Negara Indonesia Persero Tbk (Financials, Banks) | 259,700 | 145,513 | ||||
| PT Bank Rakyat Indonesia Tbk (Financials, Banks) | 1,187,100 | 379,587 | ||||
| PT Charoen Pokphand Indonesia Tbk (Consumer staples, Food products) | 325,400 | 131,761 | ||||
| PT Gudang Garam Tbk (Consumer staples, Tobacco) | 76,100 | 166,767 | ||||
| PT Hanson International Tbk (Real estate, Real estate management & development) ♦† | 10,045,000 | 0 | ||||
| PT Kalbe Farma Tbk (Health care, Pharmaceuticals) | 1,476,100 | 169,011 | ||||
| PT Sarana Menara Nusantara Tbk (Communication services, Diversified telecommunication services) | 1,503,600 | 108,732 | ||||
| PT Telekomunikasi Indonesia Persero Tbk (Communication services, Diversified telecommunication services) | 1,375,500 | 415,281 | ||||
| PT Unilever Indonesia Tbk (Consumer staples, Household products) | 365,700 | 94,104 | ||||
| PT United Tractors Tbk (Energy, Oil, gas & consumable fuels) | 46,100 | 80,444 | ||||
| 2,751,464 | ||||||
| Kuwait: 0.81% | ||||||
| Agility Company (Industrials, Transportation infrastructure) | 1,156 | 3,934 | ||||
| Boubyan Bank (Financials, Banks) † | 34,710 | 94,496 | ||||
| Kuwait Finance House (Financials, Banks) | 140,753 | 440,305 | ||||
| Mabanee Company KPSC (Real estate, Real estate management & development) | 60,784 | 170,227 | ||||
| National Bank of Kuwait (Financials, Banks) | 162,922 | 571,117 | ||||
| 1,280,079 | ||||||
| Malaysia: 2.18% | ||||||
| CIMB Group Holdings Bhd (Financials, Banks) | 233,000 | 317,391 | ||||
| Digi.com Bhd (Communication services, Wireless telecommunication services) | 62,600 | 60,519 | ||||
| Fraser & Neave Holdings Bhd (Consumer staples, Beverages) | 16,200 | 87,203 | ||||
| Genting Bhd (Consumer discretionary, Hotels, restaurants & leisure) | 109,800 | 121,708 | ||||
| Genting Malaysia Bhd (Consumer discretionary, Hotels, restaurants & leisure) | 90,400 | 64,701 | ||||
| Hartalega Holdings Bhd (Health care, Health care equipment & supplies) | 169,600 | 186,627 | ||||
| Hong Leong Bank Bhd (Financials, Banks) | 17,500 | 83,781 | ||||
| Hong Leong Financial Group Bhd (Financials, Banks) | 24,567 | 113,049 | ||||
| IHH Healthcare Bhd (Health care, Health care providers & services) | 40,300 | 63,226 |
| Shares | Value | |||||
| Malaysia: (continued) | ||||||
| Inari Amertron Bhd (Information technology, Electronic equipment, instruments & components) | 242,500 | $ 187,761 | ||||
| IOI Corporation Bhd (Consumer staples, Food products) | 73,400 | 80,652 | ||||
| Kuala Lumpur Kepong Bhd (Consumer staples, Food products) | 11,400 | 70,597 | ||||
| Malayan Banking Bhd (Financials, Banks) | 101,300 | 211,662 | ||||
| Nestle Malaysia Bhd (Consumer staples, Food products) | 1,600 | 51,130 | ||||
| Petronas Chemicals Group Bhd (Materials, Chemicals) | 48,600 | 110,547 | ||||
| Petronas Dagangan Bhd (Energy, Oil, gas & consumable fuels) | 17,200 | 88,161 | ||||
| Petronas Gas Bhd (Utilities, Gas utilities) | 19,900 | 82,613 | ||||
| Public Bank Bhd (Financials, Banks) | 255,600 | 271,459 | ||||
| RHB Bank Bhd (Financials, Banks) | 122,100 | 172,075 | ||||
| Sime Darby Bhd (Industrials, Industrial conglomerates) | 557,900 | 302,124 | ||||
| Sime Darby Plantation Bhd (Consumer staples, Food products) | 31,200 | 36,605 | ||||
| Supermax Corporation Bhd (Health care, Health care equipment & supplies) | 1 | 0 | ||||
| Telecom Malaysia Bhd (Communication services, Diversified telecommunication services) | 166,500 | 200,665 | ||||
| Top Glove Corporation Bhd (Health care, Health care equipment & supplies) | 496,350 | 242,353 | ||||
| Westports Holdings Bhd (Industrials, Transportation infrastructure) | 256,700 | 239,061 | ||||
| 3,445,670 | ||||||
| Mexico: 2.23% | ||||||
| Alfa SAB de CV Class A (Industrials, Industrial conglomerates) | 439,400 | 325,243 | ||||
| America Movil SAB de CV Series L (Communication services, Wireless telecommunication services) | 709,423 | 644,961 | ||||
| Arca Continental SAB de CV (Consumer staples, Beverages) | 22,500 | 148,308 | ||||
| Cemex SAB de CV Series CPO (Materials, Construction materials) † | 131,600 | 67,596 | ||||
| Coca-Cola Femsa SAB de CV (Consumer staples, Beverages) | 46,050 | 254,971 | ||||
| Fibra Uno Administracion SAB de CV (Real estate, Equity REITs) | 52,800 | 59,191 | ||||
| Fomento Economico Mexicano SAB de CV (Consumer staples, Beverages) | 13,700 | 110,083 | ||||
| Gruma SAB de CV Class B (Consumer staples, Food products) | 10,950 | 148,283 | ||||
| Grupo Aeroportuario del Pacifico SAB de CV Class B (Industrials, Transportation infrastructure) | 3,600 | 52,725 | ||||
| Grupo Aeroportuario del Sureste SAB de CV Class B (Industrials, Transportation infrastructure) | 6,260 | 134,767 | ||||
| Grupo Bimbo SAB de CV Series A (Consumer staples, Food products) | 47,000 | 145,491 | ||||
| Grupo Financiero Banorte SAB de CV (Financials, Banks) | 62,000 | 420,750 | ||||
| Grupo Financiero Inbursa SAB de CV (Financials, Banks) † | 92,500 | 151,163 | ||||
| Grupo Mexico SAB de CV Series B (Materials, Metals & mining) | 40,700 | 207,902 | ||||
| Grupo Televisa SAB de CV Series B (Communication services, Media) | 46,200 | 98,824 | ||||
| Kimberly-Clark de Mexico SAB de CV Class A (Consumer staples, Household products) | 58,300 | 81,496 |
| Shares | Value | |||||
| Mexico: (continued) | ||||||
| Orbia Advance Corporation SAB de CV (Materials, Chemicals) | 25,800 | $ 65,908 | ||||
| Walmart de Mexico SAB de CV (Consumer staples, Food & staples retailing) | 110,239 | 419,835 | ||||
| 3,537,497 | ||||||
| Peru: 0.20% | ||||||
| Credicorp Limited (Financials, Banks) | 2,151 | 325,339 | ||||
| Philippines: 1.04% | ||||||
| Aboitiz Equity Ventures Incorporated (Industrials, Industrial conglomerates) | 60,100 | 70,216 | ||||
| Bank of the Philippine Islands (Financials, Banks) | 105,800 | 206,777 | ||||
| BDO Unibank Incorporated (Financials, Banks) | 118,020 | 299,082 | ||||
| Energy Development Corporation (Utilities, Independent power & renewable electricity producers) ♦† | 231,800 | 0 | ||||
| Globe Telecom Incorporated (Communication services, Wireless telecommunication services) | 1,265 | 63,562 | ||||
| GT Capital Holdings Incorporated (Industrials, Industrial conglomerates) | 13,813 | 156,428 | ||||
| International Container Terminal Services Incorporated (Industrials, Transportation infrastructure) | 58,520 | 240,381 | ||||
| Jollibee Foods Corporation (Consumer discretionary, Hotels, restaurants & leisure) | 26,050 | 122,451 | ||||
| Metro Pacific Investments Corporation (Financials, Diversified financial services) | 1,830,100 | 138,484 | ||||
| Metropolitan Bank & Trust Company (Financials, Banks) | 197,317 | 219,754 | ||||
| PLDT Incorporated (Communication services, Wireless telecommunication services) | 2,920 | 102,459 | ||||
| Universal Robina Corporation (Consumer staples, Food products) | 10,530 | 24,646 | ||||
| 1,644,240 | ||||||
| Poland: 0.91% | ||||||
| Allegro SA (Consumer discretionary, Internet & direct marketing retail) 144A† | 17,587 | 131,069 | ||||
| Bank Pekao SA (Financials, Banks) | 7,498 | 205,700 | ||||
| CD Projekt SA (Communication services, Entertainment) | 330 | 13,107 | ||||
| Cyfrowy Polsat SA (Communication services, Media) | 3,355 | 21,754 | ||||
| Dino Polska SA (Consumer staples, Food & staples retailing) 144A† | 711 | 49,995 | ||||
| KGHM Polska Miedz SA (Materials, Metals & mining) | 56 | 2,199 | ||||
| LPP SA (Consumer discretionary, Textiles, apparel & luxury goods) | 16 | 32,906 | ||||
| mBank SA (Financials, Banks) † | 1,801 | 176,015 | ||||
| Orange Polska SA (Communication services, Diversified telecommunication services) † | 69,406 | 128,793 | ||||
| PGE SA (Utilities, Electric utilities) † | 115,052 | 223,182 | ||||
| PKO Bank Polski SA (Financials, Banks) † | 5,152 | 49,513 | ||||
| Polski Koncern Naftowy Orlen SA (Energy, Oil, gas & consumable fuels) | 6,086 | 102,804 | ||||
| Powszechny Zaklad Ubezpieczen SA (Financials, Insurance) | 20,840 | 156,355 | ||||
| Santander Bank Polska SA (Financials, Banks) | 2,067 | 154,951 | ||||
| 1,448,343 |
| Shares | Value | |||||
| Russia: 0.43% | ||||||
| Alrosa PJSC (Materials, Metals & mining) ♦‡ | 52,390 | $ 14,827 | ||||
| Gazprom PJSC (Energy, Oil, gas & consumable fuels) ♦‡ | 143,160 | 109,744 | ||||
| Inter Rao Ues PJSC (Utilities, Electric utilities) ♦‡ | 862,002 | 8,052 | ||||
| Lukoil PJSC (Energy, Oil, gas & consumable fuels) ♦‡ | 8,545 | 142,464 | ||||
| Magnit PJSC (Consumer staples, Food & staples retailing) | 7,384 | 11,719 | ||||
| MMC Norilsk Nickel PJSC (Materials, Metals & mining) ♦‡ | 1,210 | 81,216 | ||||
| Mobile TeleSystems PJSC ADR (Communication services, Wireless telecommunication services) ♦‡ | 6,364 | 14,935 | ||||
| Novolipetsk Steel PJSC (Materials, Metals & mining) ♦‡ | 28,410 | 17,912 | ||||
| Ozon Holdings plc (Consumer discretionary, Internet & direct marketing retail) ♦‡† | 828 | 3,003 | ||||
| Phosagro PJSC (Materials, Chemicals) | 2,756 | 16,861 | ||||
| Polyus PJSC (Materials, Metals & mining) ♦‡ | 772 | 28,718 | ||||
| Rosneft Oil Company PJSC (Energy, Oil, gas & consumable fuels) ♦‡ | 17,010 | 17,319 | ||||
| Sberbank of Russia PJSC (Financials, Banks) ♦‡ | 194,870 | 87,872 | ||||
| Severstal PJSC (Materials, Metals & mining) ♦‡ | 4,920 | 23,189 | ||||
| Tatneft PJSC (Energy, Oil, gas & consumable fuels) ♦‡ | 28,052 | 34,855 | ||||
| TCS Group Holding plc (Financials, Banks) ♦‡ | 2,546 | 28,662 | ||||
| VTB Bank PJSC (Financials, Banks) ♦‡ | 17,390,000 | 1,179 | ||||
| Yandex NV (Communication services, Interactive media & services) ♦‡† | 6,310 | 41,560 | ||||
| 684,087 | ||||||
| South Africa: 3.64% | ||||||
| Absa Group Limited (Financials, Banks) | 19,636 | 225,575 | ||||
| Anglo American Platinum Limited (Materials, Metals & mining) | 260 | 40,582 | ||||
| Anglogold Ashanti Limited (Materials, Metals & mining) | 2,955 | 69,138 | ||||
| Aspen Pharmacare Holdings Limited (Health care, Pharmaceuticals) | 13,842 | 180,944 | ||||
| Bid Corporation Limited (Consumer staples, Food & staples retailing) | 8,670 | 176,149 | ||||
| Capitec Bank Holdings Limited (Financials, Banks) | 870 | 117,461 | ||||
| Clicks Group Limited (Consumer staples, Food & staples retailing) | 5,241 | 101,897 | ||||
| Exxaro Resources Limited (Energy, Oil, gas & consumable fuels) | 15,877 | 204,794 | ||||
| FirstRand Limited (Financials, Diversified financial services) | 41,376 | 178,151 | ||||
| Gold Fields Limited (Materials, Metals & mining) | 4,486 | 62,462 | ||||
| Impala Platinum Holdings Limited (Materials, Metals & mining) | 16,388 | 312,591 | ||||
| Mr Price Group Limited (Consumer discretionary, Specialty retail) | 3,015 | 41,103 | ||||
| MTN Group Limited (Communication services, Wireless telecommunication services) † | 42,947 | 536,088 | ||||
| MultiChoice Group Limited (Communication services, Media) | 6,146 | 50,371 | ||||
| Naspers Limited (Consumer discretionary, Internet & direct marketing retail) | 4,340 | 546,539 | ||||
| Nedbank Group Limited (Financials, Banks) | 23,994 | 341,101 | ||||
| Northam Platinum Holdings Limited (Materials, Metals & mining) † | 8,112 | 130,979 | ||||
| Old Mutual Limited (Financials, Insurance) | 139,251 | 114,109 | ||||
| Rand Merchant Investment Holdings Limited (Financials, Insurance) | 53,270 | 167,609 |
| Shares | Value | |||||
| South Africa: (continued) | ||||||
| Remgro Limited (Financials, Diversified financial services) | 18,758 | $ 170,461 | ||||
| Sanlam Limited (Financials, Insurance) | 3,482 | 14,674 | ||||
| Sasol Limited (Materials, Chemicals) † | 19,407 | 445,292 | ||||
| Shoprite Holdings Limited (Consumer staples, Food & staples retailing) | 20,736 | 309,304 | ||||
| Sibanye Stillwater Limited (Materials, Metals & mining) | 49,674 | 234,343 | ||||
| SPAR Group Limited (Consumer staples, Food & staples retailing) | 7,200 | 76,831 | ||||
| Standard Bank Group Limited (Financials, Banks) | 21,598 | 228,853 | ||||
| The Bidvest Group Limited (Industrials, Industrial conglomerates) | 7,057 | 96,690 | ||||
| Tiger Brands Limited (Consumer staples, Food products) | 10,173 | 108,067 | ||||
| Vodacom Group Limited (Communication services, Wireless telecommunication services) | 12,229 | 117,715 | ||||
| Woolworths Holdings Limited (Consumer discretionary, Multiline retail) | 108,790 | 358,212 | ||||
| 5,758,085 | ||||||
| South Korea: 12.78% | ||||||
| Amorepacific Group (Consumer staples, Personal products) | 2,112 | 86,289 | ||||
| BGF Retail Company Limited (Consumer staples, Food & staples retailing) | 2,611 | 369,891 | ||||
| Celltrion Healthcare Company Limited (Health care, Health care providers & services) | 1,907 | 101,429 | ||||
| Celltrion Incorporated (Health care, Pharmaceuticals) | 1,490 | 198,885 | ||||
| Cheil Worldwide Incorporated (Communication services, Media) | 14,383 | 270,428 | ||||
| CJ Cheiljedang Corporation (Consumer staples, Food products) | 359 | 113,715 | ||||
| CJ Corporation (Industrials, Industrial conglomerates) | 3,708 | 261,212 | ||||
| CJ ENM Company Limited (Communication services, Entertainment) | 237 | 25,862 | ||||
| CJ Korea Express Corporation (Industrials, Road & rail) † | 1,369 | 141,940 | ||||
| Coway Company Limited (Consumer discretionary, Household durables) | 3,477 | 208,824 | ||||
| Daelim Industrial Company Limited (Industrials, Construction & engineering) | 1 | 51 | ||||
| Dongbu Insurance Company Limited (Financials, Insurance) | 6,440 | 331,012 | ||||
| Doosan Bobcat Incorporated (Industrials, Machinery) | 7,784 | 249,826 | ||||
| Douzone Bizon Company Limited (Information technology, Software) | 1,855 | 75,121 | ||||
| Ecopro BM Company Limited (Industrials, Electrical equipment) | 520 | 164,555 | ||||
| E-MART Incorporated (Consumer staples, Food & staples retailing) | 389 | 42,422 | ||||
| F&F Holdings Company Limited (Consumer discretionary, Textiles, apparel & luxury goods) | 350 | 261,603 | ||||
| Green Cross Corporation (Health care, Biotechnology) | 746 | 113,510 | ||||
| GS Engineering & Construction Corporation (Industrials, Construction & engineering) | 757 | 27,206 | ||||
| GS Holdings Corporation (Energy, Oil, gas & consumable fuels) | 2,697 | 90,185 | ||||
| Hana Financial Group Incorporated (Financials, Banks) | 6,209 | 252,258 | ||||
| Hankook Tire Company Limited (Consumer discretionary, Auto components) | 4,898 | 144,311 |
| Shares | Value | |||||
| South Korea: (continued) | ||||||
| Hotel Shilla Company Limited (Consumer discretionary, Specialty retail) | 149 | $ 10,070 | ||||
| HYBE Company Limited (Communication services, Entertainment) † | 333 | 80,914 | ||||
| Hyundai Engineering & Construction Company Limited (Industrials, Construction & engineering) | 1,633 | 59,494 | ||||
| Hyundai Glovis Company Limited (Industrials, Air freight & logistics) | 765 | 112,849 | ||||
| Hyundai Heavy Industries Holdings Company Limited (Energy, Oil, gas & consumable fuels) | 1,042 | 44,868 | ||||
| Hyundai Merchant Marine Company Limited (Industrials, Marine) † | 1,308 | 31,684 | ||||
| Hyundai Mobis Company Limited (Consumer discretionary, Auto components) | 982 | 184,386 | ||||
| Hyundai Motor Company Limited (Consumer discretionary, Automobiles) | 2,213 | 325,636 | ||||
| Hyundai Steel Company Limited (Materials, Metals & mining) | 697 | 23,246 | ||||
| Industrial Bank of Korea (Financials, Banks) | 20,755 | 186,454 | ||||
| Kakao Corporation (Communication services, Interactive media & services) | 6,433 | 509,473 | ||||
| Kakao Games Corporation (Communication services, Entertainment) † | 2,414 | 149,986 | ||||
| KakaoBank Corporation (Financials, Banks) † | 2,358 | 95,201 | ||||
| Kangwon Land Incorporated (Consumer discretionary, Hotels, restaurants & leisure) † | 1,472 | 32,740 | ||||
| KB Financial Group Incorporated (Financials, Banks) | 9,344 | 460,981 | ||||
| Kia Corporation (Consumer discretionary, Automobiles) | 5,654 | 350,522 | ||||
| Korea Investment Holdings Company Limited (Financials, Capital markets) | 5,180 | 344,134 | ||||
| Korea Zinc Company Limited (Materials, Metals & mining) | 266 | 121,998 | ||||
| Korean Air Lines Company Limited (Industrials, Airlines) † | 3,679 | 90,639 | ||||
| Krafton Incorporated (Communication services, Entertainment) † | 488 | 121,065 | ||||
| KT&G Corporation (Consumer staples, Tobacco) | 1,096 | 72,858 | ||||
| Kumho Petrochemical Company Limited (Materials, Chemicals) | 2,565 | 346,046 | ||||
| L&F Company Limited (Information technology, Electronic equipment, instruments & components) | 50 | 8,227 | ||||
| LG Chem Limited (Materials, Chemicals) | 611 | 289,946 | ||||
| LG Corporation (Industrials, Industrial conglomerates) | 3,731 | 234,494 | ||||
| LG Display Company Limited (Information technology, Electronic equipment, instruments & components) | 11,907 | 187,254 | ||||
| LG Electronics Incorporated (Consumer discretionary, Household durables) | 2,249 | 234,787 | ||||
| LG Household & Health Care Limited (Consumer staples, Personal products) | 62 | 49,193 | ||||
| LG Innotek Company Limited (Information technology, Electronic equipment, instruments & components) | 1,304 | 359,973 | ||||
| LG Uplus Corporation (Communication services, Diversified telecommunication services) | 20,847 | 228,991 | ||||
| Lotte Chemical Corporation (Materials, Chemicals) | 374 | 68,928 | ||||
| Lotte Shopping Company Limited (Consumer discretionary, Multiline retail) | 1,363 | 97,390 | ||||
| Meritz Securities Company Limited (Financials, Capital markets) | 6,570 | 32,173 |
| Shares | Value | |||||
| South Korea: (continued) | ||||||
| Mirae Asset Daewoo Company Limited (Financials, Capital markets) | 12,157 | $ 89,711 | ||||
| Naver Corporation (Communication services, Interactive media & services) | 2,580 | 687,460 | ||||
| NH Investment & Securities Company Limited (Financials, Capital markets) | 28,528 | 276,063 | ||||
| Orion Corporation of Republic of Korea (Consumer staples, Food products) | 588 | 44,996 | ||||
| Pearl Abyss Corporation (Communication services, Entertainment) † | 2,273 | 182,302 | ||||
| POSCO (Materials, Metals & mining) | 1,528 | 363,547 | ||||
| Samsung Biologics Company Limited (Health care, Life sciences tools & services) † | 59 | 38,383 | ||||
| Samsung Electro-Mechanics Company Limited (Information technology, Electronic equipment, instruments & components) | 1,253 | 175,180 | ||||
| Samsung Electronics Company Limited (Information technology, Technology hardware, storage & peripherals) | 95,202 | 5,736,242 | ||||
| Samsung Engineering Company Limited (Industrials, Construction & engineering) † | 8,913 | 174,116 | ||||
| Samsung Fire & Marine Insurance Company Limited (Financials, Insurance) | 1,090 | 173,332 | ||||
| Samsung SDI Company Limited (Information technology, Electronic equipment, instruments & components) | 715 | 329,501 | ||||
| Samsung Securities Company Limited (Financials, Capital markets) | 5,911 | 209,497 | ||||
| SD Biosensor Incorporated (Health care, Health care equipment & supplies) | 154 | 6,993 | ||||
| Seegene Incorporated (Health care, Biotechnology) | 10,096 | 432,715 | ||||
| Shinhan Financial Group Company Limited (Financials, Banks) | 9,078 | 295,359 | ||||
| Sillajen Incorporated (Health care, Biotechnology) ♦‡† | 2,972 | 7,910 | ||||
| SK Bioscience Company Limited (Health care, Biotechnology) † | 1,121 | 137,276 | ||||
| SK Company Limited (Industrials, Industrial conglomerates) | 816 | 155,864 | ||||
| SK Hynix Incorporated (Information technology, Semiconductors & semiconductor equipment) | 10,931 | 1,139,606 | ||||
| SK Telecom Company Limited (Communication services, Wireless telecommunication services) | 1 | 46 | ||||
| S-Oil Corporation (Energy, Oil, gas & consumable fuels) | 2,554 | 181,894 | ||||
| Soulbrain Company Limited (Materials, Chemicals) | 1 | 24 | ||||
| Woori Financial Group Incorporated (Financials, Banks) | 27,628 | 330,475 | ||||
| 20,245,627 | ||||||
| Taiwan: 15.82% | ||||||
| Accton Technology Corporation (Information technology, Communications equipment) | 13,000 | 117,891 | ||||
| Acer Incorporated (Information technology, Technology hardware, storage & peripherals) | 144,000 | 149,447 | ||||
| Advantech Company Limited (Information technology, Technology hardware, storage & peripherals) | 2,000 | 26,337 | ||||
| ASE Technology Holding Company Limited (Information technology, Semiconductors & semiconductor equipment) | 96,000 | 346,974 | ||||
| Asia Cement Corporation (Materials, Construction materials) | 7,500 | 12,122 |
| Shares | Value | |||||
| Taiwan: (continued) | ||||||
| Asustek Computer Incorporated (Information technology, Technology hardware, storage & peripherals) | 21,000 | $ 280,150 | ||||
| AU Optronics Corporation (Industrials, Machinery) | 294,000 | 220,111 | ||||
| Cathay Financial Holding Company (Financials, Insurance) | 191,000 | 429,489 | ||||
| Chailease Holding Company Limited (Financials, Diversified financial services) | 16,014 | 145,335 | ||||
| China Development Financial Holding Corporation (Financials, Insurance) | 418,000 | 286,252 | ||||
| China Steel Corporation (Materials, Metals & mining) | 126,000 | 163,845 | ||||
| Chunghwa Telecom Company Limited (Communication services, Diversified telecommunication services) | 63,000 | 280,011 | ||||
| Compal Electronic Incorporated (Information technology, Technology hardware, storage & peripherals) | 225,000 | 204,978 | ||||
| CTBC Financial Holding Company Limited (Financials, Banks) | 493,000 | 481,896 | ||||
| Delta Electronics Incorporated (Information technology, Electronic equipment, instruments & components) | 18,000 | 160,418 | ||||
| E.SUN Financial Holding Company Limited (Financials, Banks) | 127,001 | 134,247 | ||||
| Eclat Textile Company Limited (Consumer discretionary, Textiles, apparel & luxury goods) | 4,667 | 96,738 | ||||
| eMemory Technology Incorporated (Information technology, Semiconductors & semiconductor equipment) | 4,000 | 269,949 | ||||
| Evergreen Marine Corporation (Taiwan) Limited (Industrials, Marine) | 42,000 | 220,637 | ||||
| Feng Tay Enterprise Company Limited (Consumer discretionary, Textiles, apparel & luxury goods) | 1,000 | 7,454 | ||||
| First Financial Holding Company Limited (Financials, Banks) | 92,000 | 84,708 | ||||
| Formosa Plastics Corporation (Materials, Chemicals) | 48,000 | 181,249 | ||||
| Fubon Financial Holding Company Limited (Financials, Insurance) | 203,400 | 549,193 | ||||
| Giant Manufacturing Company Limited (Consumer discretionary, Leisure products) | 38,000 | 394,508 | ||||
| GlobalWafers Company Limited (Information technology, Semiconductors & semiconductor equipment) | 6,000 | 148,515 | ||||
| Hon Hai Precision Industry Company Limited (Information technology, Electronic equipment, instruments & components) | 242,400 | 900,409 | ||||
| Innolux Display Corporation (Information technology, Electronic equipment, instruments & components) | 349,000 | 212,371 | ||||
| Inventec Company Limited (Information technology, Technology hardware, storage & peripherals) | 252,834 | 233,492 | ||||
| Lite-On Technology Corporation (Information technology, Technology hardware, storage & peripherals) | 132,000 | 324,572 | ||||
| Mediatek Incorporated (Information technology, Semiconductors & semiconductor equipment) | 28,000 | 1,106,443 | ||||
| Mega Financial Holding Company Limited (Financials, Banks) | 169,000 | 227,745 | ||||
| Micro-Star International Company Limited (Information technology, Technology hardware, storage & peripherals) | 42,000 | 236,745 | ||||
| Momo.com Incorporated (Consumer discretionary, Internet & direct marketing retail) | 13,000 | 462,788 | ||||
| Nan Ya Plastics Corporation (Materials, Chemicals) | 68,000 | 214,472 | ||||
| Nan Ya Printed Circuit Board Corporation (Information technology, Electronic equipment, instruments & components) | 13,000 | 248,945 |
| Shares | Value | |||||
| Taiwan: (continued) | ||||||
| Nien Made Enterprise Company Limited (Consumer discretionary, Specialty retail) | 5,000 | $ 64,819 | ||||
| Novatek Microelectronics Corporation Limited (Information technology, Semiconductors & semiconductor equipment) | 22,000 | 364,726 | ||||
| Pegatron Corporation (Information technology, Technology hardware, storage & peripherals) | 81,000 | 200,763 | ||||
| Pharmally International Holding Company Limited (Health care, Pharmaceuticals) ♦† | 2,064 | 0 | ||||
| Pou Chen Corporation (Consumer discretionary, Textiles, apparel & luxury goods) | 50,000 | 57,661 | ||||
| President Chain Store Corporation (Consumer staples, Food & staples retailing) | 7,000 | 65,412 | ||||
| Quanta Computer Incorporated (Information technology, Technology hardware, storage & peripherals) | 55,000 | 183,914 | ||||
| Realtek Semiconductor Corporation (Information technology, Semiconductors & semiconductor equipment) | 16,000 | 263,807 | ||||
| Ruentex Development Company Limited (Real estate, Real estate management & development) | 37,000 | 95,535 | ||||
| Shin Kong Financial Holding Company Limited (Financials, Insurance) | 269,000 | 109,089 | ||||
| Silergy Corporation (Information technology, Semiconductors & semiconductor equipment) | 1,000 | 133,251 | ||||
| Sinopac Financial Holdings Company Limited (Financials, Banks) | 395,400 | 242,800 | ||||
| Synnex Technology International Corporation (Information technology, Electronic equipment, instruments & components) | 113,000 | 292,553 | ||||
| Taishin Financial Holdings Company Limited (Financials, Banks) | 318,165 | 222,978 | ||||
| Taiwan Cement Corporation (Materials, Construction materials) | 31,843 | 54,057 | ||||
| Taiwan Cooperative Financial Holdings Company Limited (Financials, Banks) | 202,000 | 191,634 | ||||
| Taiwan Semiconductor Manufacturing Company Limited (Information technology, Semiconductors & semiconductor equipment) | 499,000 | 10,728,279 | ||||
| The Shanghai Commercial & Savings Bank Limited (Financials, Banks) | 99,000 | 163,077 | ||||
| Unimicron Technology Corporation (Information technology, Electronic equipment, instruments & components) | 22,000 | 204,552 | ||||
| Uni-President Enterprises Corporation (Consumer staples, Food products) | 64,000 | 153,977 | ||||
| United Microelectronics Corporation (Information technology, Semiconductors & semiconductor equipment) | 249,000 | 469,203 | ||||
| Vanguard International Semiconductor Corporation (Information technology, Semiconductors & semiconductor equipment) | 39,000 | 176,996 | ||||
| Wan Hai Lines Limited (Industrials, Marine) | 6,000 | 40,869 | ||||
| Windbond Electronics Corporation (Information technology, Semiconductors & semiconductor equipment) | 40,000 | 48,172 | ||||
| Wistron Corporation (Information technology, Technology hardware, storage & peripherals) | 129,000 | 135,949 |
| Shares | Value | |||||
| Taiwan: (continued) | ||||||
| Wiwynn Corporation (Information technology, Technology hardware, storage & peripherals) | 6,000 | $ 214,294 | ||||
| WPG Holdings Company Limited (Information technology, Electronic equipment, instruments & components) | 176,440 | 352,123 | ||||
| Yang Ming Marine Transport Corporation (Industrials, Marine) † | 59,000 | 249,363 | ||||
| Yuanta Financial Holding Company Limited (Financials, Diversified financial services) | 9,560 | 8,540 | ||||
| 25,048,829 | ||||||
| Thailand: 2.50% | ||||||
| Advanced Info Service PCL (Communication services, Wireless telecommunication services) | 30,800 | 216,811 | ||||
| Bangkok Commercial Asset Management PCL NVDR (Financials, Capital markets) | 155,700 | 104,820 | ||||
| Bangkok Dusit Medical Services PCL (Health care, Health care providers & services) | 266,700 | 193,908 | ||||
| Bangkok Expressway and Metro PCL (Industrials, Transportation infrastructure) | 22,400 | 6,125 | ||||
| Berli Jucker PCL (Consumer staples, Food & staples retailing) | 10,800 | 11,105 | ||||
| BTS Group Holdings PCL (Industrials, Road & rail) | 22,700 | 6,617 | ||||
| Bumrungrad Hospital PCL (Health care, Health care providers & services) | 43,300 | 204,043 | ||||
| Carabao Group PCL (Consumer staples, Beverages) | 54,800 | 179,413 | ||||
| Central Pattana PCL NVDR (Real estate, Real estate management & development) | 2,800 | 4,761 | ||||
| Central Retail Corporation PCL (Consumer discretionary, Multiline retail) | 27,700 | 32,571 | ||||
| Charoen Pokphand Foods PCL (Consumer staples, Food products) | 25,500 | 19,758 | ||||
| CP All PCL (Consumer staples, Food & staples retailing) | 16,600 | 34,681 | ||||
| Electricity Genera PCL (Utilities, Independent power & renewable electricity producers) | 14,600 | 80,422 | ||||
| Energy Absolute PCL (Utilities, Independent power & renewable electricity producers) | 15,600 | 45,593 | ||||
| Home Product Center PCL (Consumer discretionary, Specialty retail) | 180,800 | 84,665 | ||||
| Indorama Ventures PCL (Materials, Chemicals) | 52,800 | 73,152 | ||||
| Intouch Holdings PCL (Communication services, Wireless telecommunication services) | 104,500 | 242,999 | ||||
| Krung Thai Bank PCL (Financials, Banks) | 380,100 | 163,530 | ||||
| Krungthai Card PCL (Financials, Consumer finance) | 25,300 | 49,234 | ||||
| Land & Houses PCL (Real estate, Real estate management & development) | 742,867 | 218,775 | ||||
| Osotspa PCL (Consumer staples, Beverages) | 89,400 | 96,773 | ||||
| PTT Exploration & Production PCL (Energy, Oil, gas & consumable fuels) | 30,400 | 127,992 | ||||
| PTT Global Chemical PCL (Materials, Chemicals) | 53,700 | 87,513 | ||||
| PTT Oil & Retail Business PCL (Consumer discretionary, Specialty retail) | 227,700 | 180,431 | ||||
| PTT PCL (Energy, Oil, gas & consumable fuels) | 47,500 | 57,820 | ||||
| Ratchaburi Electricity Generating Holding PCL (Utilities, Independent power & renewable electricity producers) | 50,600 | 71,357 | ||||
| SCG Packaging PCL (Materials, Containers & packaging) | 11,000 | 20,690 | ||||
| Siam Commercial Bank PCL (Financials, Banks) | 84,800 | 327,689 |
| Shares | Value | |||||
| Thailand: (continued) | ||||||
| Sri Trang Gloves Thailand PCL (Health care, Health care equipment & supplies) | 352,500 | $ 277,793 | ||||
| Srisawad Power 1979 PCL (Financials, Diversified financial services) | 100,940 | 179,201 | ||||
| Thai Union Group PCL (Consumer staples, Food products) | 673,000 | 420,174 | ||||
| The Siam Cement PCL (Materials, Construction materials) | 11,500 | 138,398 | ||||
| 3,958,814 | ||||||
| Turkey: 0.40% | ||||||
| Akbank TAS (Financials, Banks) | 282,055 | 143,969 | ||||
| Bim Birlesik Magazalar AS (Consumer staples, Food & staples retailing) | 7,241 | 38,245 | ||||
| Ford Otomotiv Sanayi AS (Consumer discretionary, Automobiles) | 9,676 | 188,483 | ||||
| Turk Sise ve Cam Fabrikalari AS (Industrials, Industrial conglomerates) | 139,649 | 124,915 | ||||
| Turkcell Iletisim Hizmetleri AS (Communication services, Wireless telecommunication services) | 28,546 | 42,323 | ||||
| Turkiye Is Bankasi Class C AS (Financials, Banks) | 165,089 | 95,590 | ||||
| 633,525 | ||||||
| United States: 0.17% | ||||||
| Parade Technologies Limited (Information technology, Semiconductors & semiconductor equipment) | 4,000 | 276,167 | ||||
| Total Common stocks (Cost $145,486,806) | 150,430,102 |
| Dividend yield | ||||||
| Preferred stocks: 2.90% | ||||||
| Brazil: 2.45% | ||||||
| Alpargatas SA (Consumer discretionary, Textiles, apparel & luxury goods) | 1.55% | 11,900 | 59,252 | |||
| Banco Bradesco SA (Financials, Banks) | 4.83 | 119,631 | 468,632 | |||
| Braskem SA Class A (Materials, Chemicals) | 14.40 | 46,100 | 431,984 | |||
| Centrais Elétricas Brasileiras SA-Eletrobras Class B (Utilities, Electric utilities) | 2.95 | 54,600 | 362,640 | |||
| Companhia Energetica de Minas Gerais SA (Utilities, Electric utilities) | 8.17 | 140,306 | 344,770 | |||
| Gerdau SA (Materials, Metals & mining) | 11.36 | 71,700 | 355,619 | |||
| Itau Unibanco Holding SA (Financials, Banks) | 2.72 | 109,770 | 538,878 | |||
| Itaúsa SA (Financials, Banks) | 1.25 | 266,014 | 515,167 | |||
| Petroleo Brasileiro SA (Energy, Oil, gas & consumable fuels) | 15.55 | 121,600 | 799,332 | |||
| 3,876,274 | ||||||
| South Korea: 0.45% | ||||||
| Hyundai Motor Company Limited (Consumer discretionary, Automobiles) | 5.86 | 128 | 9,388 |
| Dividend yield | Shares | Value | ||||
| South Korea: 0.45% (continued) | ||||||
| LG Household & Health Care Limited (Consumer staples, Personal products) | 2.32% | 235 | $ 103,002 | |||
| Samsung Electronics Company Limited (Information technology, Technology hardware, storage & peripherals) | 2.25 | 10,916 | 603,300 | |||
| 715,690 | ||||||
| Total Preferred stocks (Cost $4,253,106) | 4,591,964 |
| Expiration date | ||||||
| Rights: 0.00% | ||||||
| South Korea: 0.00% | ||||||
| Samsung Biologics Company Limited (Health care, Life sciences tools & services) ♦† | 3-29-2022 | 4 | 466 | |||
| Total Rights (Cost $0) | 466 |
| Yield | ||||||
| Short-term investments: 1.69% | ||||||
| Investment companies: 1.69% | ||||||
| Allspring Government Money Market Fund Select Class ♠∞ | 0.03 | 2,681,400 | 2,681,400 | |||
| Total Short-term investments (Cost $2,681,400) | 2,681,400 | |||||
| Total investments in securities (Cost $152,421,312) | 99.57% | 157,703,932 | ||||
| Other assets and liabilities, net | 0.43 | 673,323 | ||||
| Total net assets | 100.00% | $158,377,255 |
| † | Non-income-earning security |
| 144A | The security may be resold in transactions exempt from registration, normally to qualified institutional buyers, pursuant to Rule 144A under the Securities Act of 1933. |
| ♦ | The security is fair valued in accordance with procedures approved by the Board of Trustees. |
| ‡ | Security is valued using significant unobservable inputs. |
| ♠ | The issuer of the security is an affiliated person of the Portfolio as defined in the Investment Company Act of 1940. |
| ∞ | The rate represents the 7-day annualized yield at period end. |
| Abbreviations: | |
| ADR | American depositary receipt |
| REIT | Real estate investment trust |
| Value, beginning of period | Purchases | Sales proceeds | Net realized gains (losses) | Net change in unrealized gains (losses) | Value, end of period | Shares, end of period | Income from affiliated securities | |
| Short-term investments | ||||||||
| Allspring Government Money Market Fund Select Class | $5,365,153 | $79,778,897 | $(82,462,650) | $0 | $0 | $2,681,400 | 2,681,400 | $1,427 |
| Description | Number of contracts | Expiration date | Notional cost | Notional value | Unrealized gains | Unrealized losses |
| Long | ||||||
| MSCI Emerging Markets Index | 63 | 3-18-2022 | $3,754,858 | $3,702,825 | $0 | $(52,033) |
| Assets | |
Investments in unaffiliated securities, at value (cost $149,739,912) | $ 155,022,532 |
Investments in affiliated securities, at value (cost $2,681,400) | 2,681,400 |
Cash | 24,245 |
Cash at broker segregated for futures contracts | 840,340 |
Foreign currency, at value (cost $377,850) | 373,249 |
Receivable for dividends | 566,292 |
Prepaid expenses and other assets | 2,021 |
Total assets | 159,510,079 |
| Liabilities | |
Custody and accounting fees payable | 516,554 |
Payable for investments purchased | 213,874 |
Contingent tax liability | 290,915 |
Payable for daily variation margin on open futures contracts | 46,305 |
Advisory fee payable | 12,735 |
Accrued expenses and other liabilities | 52,441 |
Total liabilities | 1,132,824 |
Total net assets | $158,377,255 |
| Investment income | |
Dividends (net of foreign withholdings taxes of $614,501) | $ 5,014,192 |
Income from affiliated securities | 1,427 |
Total investment income | 5,015,619 |
| Expenses | |
Advisory fee | 264,584 |
Custody and accounting fees | 344,123 |
Professional fees | 63,356 |
Interest holder report expenses | 18,437 |
Trustees’ fees and expenses | 20,121 |
Other fees and expenses | 40,084 |
Total expenses | 750,705 |
Less: Fee waivers and/or expense reimbursements | (420,857) |
Net expenses | 329,848 |
Net investment income | 4,685,771 |
| Realized and unrealized gains (losses) on investments | |
| Net realized gains (losses) on | |
Unaffiliated securities | 13,259,795 |
Foreign currency and foreign currency translations | (136,882) |
Futures contracts | (419,363) |
Net realized gains on investments | 12,703,550 |
| Net change in unrealized gains (losses) on | |
Unaffiliated securities (net of foreign taxes of $(239,938)) | (34,021,620) |
Foreign currency and foreign currency translations | (2,026) |
Futures contracts | 292,575 |
Net change in unrealized gains (losses) on investments | (33,731,071) |
Net realized and unrealized gains (losses) on investments | (21,027,521) |
Net decrease in net assets resulting from operations | $(16,341,750) |
| Year ended February 28, 2022 | Year ended February 28, 2021 | |
| Operations | ||
Net investment income | $ 4,685,771 | $ 4,382,426 |
Net realized gains (losses) on investments | 12,703,550 | (5,841,255) |
Net change in unrealized gains (losses) on investments | (33,731,071) | 48,370,662 |
Net increase (decrease) in net assets resulting from operations | (16,341,750) | 46,911,833 |
| Capital transactions | ||
| Transactions in investors’ beneficial interests | ||
Contributions | 43,860,415 | 52,744,158 |
Withdrawals | (40,306,725) | (145,512,035) |
Net increase (decrease) in net assets resulting from capital transactions | 3,553,690 | (92,767,877) |
Total decrease in net assets | (12,788,060) | (45,856,044) |
| Net assets | ||
Beginning of period | 171,165,315 | 217,021,359 |
End of period | $158,377,255 | $ 171,165,315 |
| Year ended February 28 | |||||
| 2022 | 2021 | 2020 1 | 2019 | 2018 2 | |
Total return3 | (9.21)% | 23.70% | (6.15)% | (11.16)% | 13.43% |
| Ratios to average net assets (annualized) | |||||
Gross expenses | 0.43% | 0.53% | 0.52% | 0.58% | 0.49% |
Net expenses | 0.19% * | 0.22% * | 0.39% | 0.45% | 0.49% |
Net investment income | 2.66% | 2.15% | 2.51% | 2.33% | 1.56% |
| Supplemental data | |||||
Portfolio turnover rate | 87% | 133% | 59% | 81% | 136% |
| * | Ratio includes expenses which were voluntarily waived by the adviser. Without these voluntary waivers, the net expense ratios would be increased by the following amounts: |
| Year ended February 28, 2022 | 0.24% |
| Year ended February 28, 2021 | 0.31% |
| 1 | Year ended February 29 |
| 2 | For the period from May 23, 2017 (commencement of operations) to February 28, 2018 |
| 3 | Returns for periods of less than one year are not annualized. |
| Gross unrealized gains | $ 22,711,010 |
| Gross unrealized losses | (20,916,794) |
| Net unrealized gains | $ 1,794,216 |
| ■ | Level 1 – quoted prices in active markets for identical securities |
| ■ | Level 2 – other significant observable inputs (including quoted prices for similar securities, interest rates, prepayment speeds, credit risk, etc.) |
| ■ | Level 3 – significant unobservable inputs (including the Portfolio’s own assumptions in determining the fair value of investments) |
| Quoted prices (Level 1) | Other significant observable inputs (Level 2) | Significant unobservable inputs (Level 3) | Total | |
| Assets | ||||
| Investments in: | ||||
| Common stocks | ||||
| Brazil | $ 0 | $ 4,577,918 | $ 0 | $ 4,577,918 |
| Chile | 553,655 | 256,629 | 0 | 810,284 |
| China | 10,693,016 | 37,255,424 | 0 | 47,948,440 |
| Colombia | 246,347 | 0 | 0 | 246,347 |
| Czech Republic | 157,117 | 82,339 | 0 | 239,456 |
| Egypt | 214,692 | 0 | 0 | 214,692 |
| Greece | 0 | 898,036 | 0 | 898,036 |
| Hong Kong | 131,535 | 3,733,080 | 0 | 3,864,615 |
| Hungary | 97,677 | 281,283 | 0 | 378,960 |
| India | 0 | 20,201,487 | 12,101 | 20,213,588 |
| Indonesia | 169,011 | 2,582,453 | 0 | 2,751,464 |
| Kuwait | 170,227 | 1,109,852 | 0 | 1,280,079 |
| Malaysia | 1,338,263 | 2,107,407 | 0 | 3,445,670 |
| Mexico | 3,537,497 | 0 | 0 | 3,537,497 |
| Peru | 325,339 | 0 | 0 | 325,339 |
| Philippines | 779,907 | 864,333 | 0 | 1,644,240 |
| Poland | 305,498 | 1,142,845 | 0 | 1,448,343 |
| Russia | 0 | 28,580 | 655,507 | 684,087 |
| South Africa | 2,043,493 | 3,714,592 | 0 | 5,758,085 |
| South Korea | 338,005 | 19,899,712 | 7,910 | 20,245,627 |
| Taiwan | 0 | 25,048,829 | 0 | 25,048,829 |
| Thailand | 697,967 | 3,260,847 | 0 | 3,958,814 |
| Turkey | 393,966 | 239,559 | 0 | 633,525 |
| United States | 0 | 276,167 | 0 | 276,167 |
| Preferred stocks | ||||
| Brazil | 0 | 3,876,274 | 0 | 3,876,274 |
| South Korea | 0 | 715,690 | 0 | 715,690 |
| Rights | ||||
| South Korea | 0 | 466 | 0 | 466 |
| Short-term investments | ||||
| Investment companies | 2,681,400 | 0 | 0 | 2,681,400 |
| Total assets | $24,874,612 | $132,153,802 | $675,518 | $157,703,932 |
| Liabilities | ||||
| Futures contracts | $ 52,033 | $ 0 | $ 0 | $ 52,033 |
| Total liabilities | $ 52,033 | $ 0 | $ 0 | $ 52,033 |
| Average daily net assets | Advisory fee |
| First $5 billion | 0.150% |
| Next $5 billion | 0.130 |
| Over $10 billion | 0.110 |
Allspring Master Trust:

| Name and year of birth | Position held and length of service* | Principal occupations during past five years or longer | Current other public company or investment company directorships |
| William R. Ebsworth (Born 1957) | Trustee, since 2015 | Retired. From 1984 to 2013, equities analyst, portfolio manager, research director and chief investment officer at Fidelity Management and Research Company in Boston, Tokyo, and Hong Kong, and retired in 2013 as Chief Investment Officer of Fidelity Strategic Advisers, Inc. where he led a team of investment professionals managing client assets. Prior thereto, Board member of Hong Kong Securities Clearing Co., Hong Kong Options Clearing Corp., the Thailand International Fund, Ltd., Fidelity Investments Life Insurance Company, and Empire Fidelity Investments Life Insurance Company. Audit Committee Chair and Investment Committee Chair of the Vincent Memorial Hospital Endowment (non-profit organization). Mr. Ebsworth is a CFA® charterholder. | N/A |
| Jane A. Freeman (Born 1953) | Trustee, since 2015; Chair Liaison, since 2018 | Retired. From 2012 to 2014 and 1999 to 2008, Chief Financial Officer of Scientific Learning Corporation. From 2008 to 2012, Ms. Freeman provided consulting services related to strategic business projects. Prior to 1999, Portfolio Manager at Rockefeller & Co. and Scudder, Stevens & Clark. Board member of the Harding Loevner Funds from 1996 to 2014, serving as both Lead Independent Director and chair of the Audit Committee. Board member of the Russell Exchange Traded Funds Trust from 2011 to 2012 and the chair of the Audit Committee. Ms. Freeman is also an inactive Chartered Financial Analyst. | N/A |
| Isaiah Harris, Jr. (Born 1952) | Trustee, since 2009; Audit Committee Chair, since 2019 | Retired. Chairman of the Board of CIGNA Corporation from 2009 to 2021, and Director from 2005 to 2008. From 2003 to 2011, Director of Deluxe Corporation. Prior thereto, President and CEO of BellSouth Advertising and Publishing Corp. from 2005 to 2007, President and CEO of BellSouth Enterprises from 2004 to 2005 and President of BellSouth Consumer Services from 2000 to 2003. Emeritus member of the Iowa State University Foundation Board of Governors. Emeritus Member of the Advisory Board of Iowa State University School of Business. Advisory Board Member, Palm Harbor Academy (private school). Advisory Board Member, Fellowship of Christian Athletes. Mr. Harris is a certified public accountant (inactive status). | N/A |
| David F. Larcker (Born 1950) | Trustee, since 2009 | James Irvin Miller Professor of Accounting at the Graduate School of Business (Emeritus), Stanford University, Director of the Corporate Governance Research Initiative and Senior Faculty of The Rock Center for Corporate Governance since 2006. From 2005 to 2008, Professor of Accounting at the Graduate School of Business, Stanford University. Prior thereto, Ernst & Young Professor of Accounting at The Wharton School, University of Pennsylvania from 1985 to 2005. | N/A |
| Name and year of birth | Position held and length of service* | Principal occupations during past five years or longer | Current other public company or investment company directorships |
| Olivia S. Mitchell (Born 1953) | Trustee, since 2006; Nominating and Governance Committee Chair, since 2018 | International Foundation of Employee Benefit Plans Professor since 1993, Wharton School of the University of Pennsylvania. Director of Wharton’s Pension Research Council and Boettner Center on Pensions & Retirement Research, and Research Associate at the National Bureau of Economic Research. Previously taught at Cornell University from 1978 to 1993. | N/A |
| Timothy J. Penny (Born 1951) | Trustee, since 1996; Chair, since 2018 | President and Chief Executive Officer of Southern Minnesota Initiative Foundation, a non-profit organization, since 2007. Member of the Board of Trustees of NorthStar Education Finance, Inc., a non-profit organization, since 2007. | N/A |
| James G. Polisson (Born 1959) | Trustee, since 2018 | Retired. Chief Marketing Officer, Source (ETF) UK Services, Ltd, from 2015 to 2017. From 2012 to 2015, Principal of The Polisson Group, LLC, a management consulting, corporate advisory and principal investing company. Chief Executive Officer and Managing Director at Russell Investments, Global Exchange Traded Funds from 2010 to 2012. Managing Director of Barclays Global Investors from 1998 to 2010 and Global Chief Marketing Officer for iShares and Barclays Global Investors from 2000 to 2010. Trustee of the San Francisco Mechanics’ Institute, a non-profit organization, from 2013 to 2015. Board member of the Russell Exchange Traded Fund Trust from 2011 to 2012. Director of Barclays Global Investors Holdings Deutschland GmbH from 2006 to 2009. Mr. Polisson is an attorney and has a retired status with the Massachusetts and District of Columbia Bar Associations. | N/A |
| Pamela Wheelock (Born 1959) | Trustee, since January 2020; previously Trustee from January 2018 to July 2019 | Board member of the Destination Medical Center Economic Development Agency, Rochester, Minnesota since 2019. Interim President of the McKnight Foundation from January to September 2020. McKnight Foundation Consultant, November 2020 to February 2021. Acting Commissioner, Minnesota Department of Human Services, July 2019 through September 2019. Consultant (part-time), Minnesota Department of Human Services, October 2019 through December 2019. Chief Operating Officer, Twin Cities Habitat for Humanity from 2017 to 2019. Vice President of University Services, University of Minnesota from 2012 to 2016. Prior thereto, on the Board of Directors, Governance Committee and Finance Committee for the Minnesota Philanthropy Partners (Saint Paul Foundation) from 2012 to 2018, Interim Chief Executive Officer of Blue Cross Blue Shield of Minnesota from 2011 to 2012, Chairman of the Board from 2009 to 2012 and Board Director from 2003 to 2015. Vice President, Leadership and Community Engagement, Bush Foundation, Saint Paul, Minnesota (a private foundation) from 2009 to 2011. Executive Vice President and Chief Financial Officer, Minnesota Sports and Entertainment from 2004 to 2009 and Senior Vice President from 2002 to 2004. Executive Vice President of the Minnesota Wild Foundation from 2004 to 2008. Commissioner of Finance, State of Minnesota, from 1999 to 2002. Currently Board Chair of the Minnesota Wild Foundation since 2010. | N/A |
| Name and year of birth | Position held and length of service | Principal occupations during past five years or longer |
| Andrew Owen (Born 1960) | President, since 2017 | President, Chief Executive Officer and Director of Allspring Funds Management, LLC since 2017 and co-president of Galliard Capital Management, LLC, an affiliate of Allspring Funds Management, LLC, since 2019. Prior thereto, Head of Affiliated Managers, Allspring Global Investments, from 2014 to 2019 and Executive Vice President responsible for marketing, investments and product development for Allspring Funds Management, LLC, from 2009 to 2014. In addition, Mr. Owen was an Executive Vice President of Wells Fargo & Company from 2014 to 2021. |
| Jeremy DePalma (Born 1974) | Treasurer, since 2012 (for certain funds in the Fund Complex); since 2021 (for the remaining funds in the Fund Complex) | Senior Vice President of Allspring Funds Management, LLC since 2009. Senior Vice President of Evergreen Investment Management Company, LLC from 2008 to 2010 and head of the Fund Reporting and Control Team within Fund Administration from 2005 to 2010. |
| Kate McKinley (Born 1977) | Chief Legal Officer, since 2021 | Chief Legal Officer of Allspring Global Investments since 2021. Prior thereto, held various roles at State Street Global Advisors beginning in 2010, including serving as Senior Vice President and General Counsel from 2019 to 2021, and Chief Operating Officer of the Institutional Client Group from 2016 - 2019. Prior to working at State Street Global Advisors served as Assistant General Counsel for Bank of America Corporation from 2005 to 2010 and as an Associate at WilmerHale from 2002 to 2005. |
| Christopher Baker (Born 1976) | Chief Compliance Officer, since 2022 | Global Chief Compliance Officer for Allspring Global Investments since 2022. Prior thereto, Chief Compliance Officer for State Street Global Advisors from 2018 to 2021. Senior Compliance Officer for the State Street divisions of Alternative Investment Solutions, Sector Solutions, and Global Marketing from 2015 to 2018. From 2010 to 2015 Vice President, Global Head of Investment and Marketing Compliance for State Street Global Advisors. |
| Matthew Prasse (Born 1983) | Secretary, since 2021 | Senior Counsel of the Allspring Legal Department since 2021. Senior Counsel of the Wells Fargo Legal Department from 2018 to 2021. Previously, Counsel for Barings LLC from 2015 to 2018. Prior to joining Barings, Associate at Morgan, Lewis & Bockius LLP from 2008 to 2015. |
P.O. Box 219967
Kansas City, MO 64121-9967
1-800-222-8222. Read the prospectus carefully before you invest or send money.

International Equity Portfolio
| Investment objective | The Portfolio seeks long-term capital appreciation. |
| Adviser | Allspring Funds Management, LLC |
| Subadviser | Allspring Global Investments, LLC |
| Portfolio managers | Dennis Bein, CFA®‡†, Harindra de Silva, Ph.D., CFA®‡, Monisha Jayakumar |
| Ten largest holdings (%) as of February 28, 20221 | |
| Nestle SA | 1.93 |
| Roche Holding AG | 1.38 |
| ASML Holding NV | 1.36 |
| Novo Nordisk AS Class B | 1.09 |
| Novartis AG | 0.98 |
| Toyota Motor Corporation | 0.95 |
| LVMH Moët Hennessy Louis Vuitton SE | 0.91 |
| AstraZeneca plc | 0.90 |
| Shell plc | 0.85 |
| Royal Bank of Canada | 0.79 |
| 1 | Figures represent the percentage of the Portfolio's net assets. Holdings are subject to change and may have changed since the date specified. |
| Sector allocation as of February 28, 20221 |
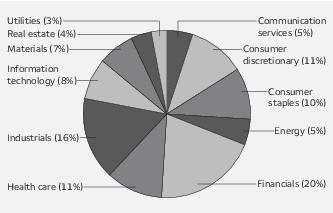
| 1 | Figures represent the percentage of the Portfolio's long-term investments. These amounts are subject to change and may have changed since the date specified. |
| Country allocation as of February 28, 20221 |
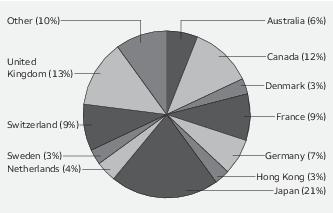
| 1 | Figures represent the percentage of the Portfolio's long-term investments. These amounts are subject to change and may have changed since the date specified. |
| ‡ | CFA® and Chartered Financial Analyst® are trademarks owned by CFA Institute. |
| † | Mr. Bein is expected to retire on September 30, 2022. He will remain a portfolio manager of the Portfolio through June 30, 2022, at which time he will transition to the role of advisor to the team until his retirement. |
| Shares | Value | |||||
| Common stocks: 96.79% | ||||||
| Australia: 5.60% | ||||||
| Ampol Limited (Energy, Oil, gas & consumable fuels) | 8,402 | $ 181,486 | ||||
| Aristocrat Leisure Limited (Consumer discretionary, Hotels, restaurants & leisure) | 37,812 | 1,037,183 | ||||
| ASX Limited (Financials, Capital markets) | 6,341 | 380,850 | ||||
| Aurizon Holdings Limited (Industrials, Road & rail) | 64,020 | 163,309 | ||||
| Australia & New Zealand Banking Group Limited (Financials, Banks) | 90,120 | 1,706,138 | ||||
| BlueScope Steel Limited (Materials, Metals & mining) | 73,164 | 1,083,402 | ||||
| Brambles Limited (Industrials, Commercial services & supplies) | 63,534 | 457,618 | ||||
| Cochlear Limited (Health care, Health care equipment & supplies) | 977 | 159,489 | ||||
| Coles Group Limited (Consumer staples, Food & staples retailing) | 24,594 | 311,141 | ||||
| Commonwealth Bank of Australia (Financials, Banks) | 47,387 | 3,214,898 | ||||
| Computershare Limited (Information technology, IT services) | 66,250 | 1,046,772 | ||||
| CSL Limited (Health care, Biotechnology) | 18,305 | 3,480,220 | ||||
| Dexus Property Group (Real estate, Equity REITs) | 116,146 | 919,410 | ||||
| Domino's Pizza Enterprises Limited (Consumer discretionary, Hotels, restaurants & leisure) | 12,999 | 750,591 | ||||
| Fortescue Metals Group Limited (Materials, Metals & mining) | 58,332 | 777,119 | ||||
| Goodman Group (Real estate, Equity REITs) | 47,218 | 763,971 | ||||
| IDP Education Limited (Consumer discretionary, Diversified consumer services) | 6,831 | 132,109 | ||||
| Lendlease Corporation Limited (Real estate, Real estate management & development) | 10,464 | 80,727 | ||||
| Macquarie Group Limited (Financials, Capital markets) | 8,987 | 1,182,718 | ||||
| Magellan Financial Group Limited (Financials, Capital markets) | 4,827 | 64,586 | ||||
| Medibank Private Limited (Financials, Insurance) | 609,776 | 1,406,455 | ||||
| Mirvac Group (Real estate, Equity REITs) | 193,062 | 360,044 | ||||
| National Australia Bank Limited (Financials, Banks) | 94,589 | 1,986,656 | ||||
| Origin Energy Limited (Energy, Oil, gas & consumable fuels) | 115,484 | 479,566 | ||||
| Qantas Airways Limited (Industrials, Airlines) † | 234,339 | 868,337 | ||||
| QBE Insurance Group Limited (Financials, Insurance) | 32,818 | 273,867 | ||||
| REA Group Limited (Communication services, Interactive media & services) | 3,166 | 305,168 | ||||
| Rio Tinto Limited (Materials, Metals & mining) | 13,024 | 1,123,151 | ||||
| Scentre Group (Real estate, Equity REITs) | 153,124 | 340,180 | ||||
| SEEK Limited (Communication services, Interactive media & services) | 19,105 | 372,983 | ||||
| Sonic Healthcare Limited (Health care, Health care providers & services) | 33,255 | 848,588 | ||||
| South32 Limited (Materials, Metals & mining) | 187,498 | 658,120 | ||||
| Stockland Corporation Limited (Real estate, Equity REITs) | 148,340 | 448,861 | ||||
| Suncorp Group Limited (Financials, Insurance) | 56,679 | 440,890 | ||||
| Tabcorp Holdings Limited (Consumer discretionary, Hotels, restaurants & leisure) | 362,634 | 1,311,439 | ||||
| Telstra Corporation Limited (Communication services, Diversified telecommunication services) | 383,650 | 1,102,469 | ||||
| The GPT Group (Real estate, Equity REITs) | 264,475 | 943,667 | ||||
| Transurban Group (Industrials, Transportation infrastructure) | 33,690 | 311,174 | ||||
| Treasury Wine Estates Limited (Consumer staples, Beverages) | 96,718 | 815,835 | ||||
| Wesfarmers Limited (Consumer discretionary, Multiline retail) | 31,425 | 1,102,070 | ||||
| Westpac Banking Corporation (Financials, Banks) | 97,349 | 1,608,813 | ||||
| Wisetech Global Limited (Information technology, Software) | 3,622 | 115,962 | ||||
| Woodside Petroleum Limited (Energy, Oil, gas & consumable fuels) | 5,088 | 106,320 | ||||
| Woolworths Group Limited (Consumer staples, Food & staples retailing) | 15,751 | 407,284 | ||||
| 35,631,636 | ||||||
| Austria: 0.17% | ||||||
| Erste Bank Der Oesterreichischen Sparkassen AG (Financials, Banks) | 10,719 | 381,026 |
| Shares | Value | |||||
| Austria: (continued) | ||||||
| OMV AG (Energy, Oil, gas & consumable fuels) | 4,473 | $ 212,930 | ||||
| Raiffeisen Bank International AG (Financials, Banks) | 28,209 | 459,663 | ||||
| 1,053,619 | ||||||
| Belgium: 0.86% | ||||||
| Ageas NV (Financials, Insurance) | 15,132 | 727,942 | ||||
| Anheuser-Busch InBev SA (Consumer staples, Beverages) | 27,110 | 1,672,899 | ||||
| KBC Group NV (Financials, Banks) | 10,632 | 766,003 | ||||
| Proximus SA (Communication services, Diversified telecommunication services) | 5,286 | 105,087 | ||||
| Sofina SA (Financials, Diversified financial services) | 1,274 | 494,765 | ||||
| Solvay SA (Materials, Chemicals) | 8,549 | 953,389 | ||||
| UCB SA (Health care, Pharmaceuticals) | 4,372 | 477,146 | ||||
| Umicore SA (Materials, Chemicals) | 6,708 | 274,422 | ||||
| 5,471,653 | ||||||
| Canada: 11.46% | ||||||
| Air Canada (Industrials, Airlines) † | 18,700 | 353,345 | ||||
| Alimentation Couche-Tard Incorporated (Consumer staples, Food & staples retailing) | 22,670 | 889,809 | ||||
| Altagas Limited (Utilities, Gas utilities) | 42,200 | 929,565 | ||||
| Bank of Montreal (Financials, Banks) | 23,391 | 2,670,911 | ||||
| Barrick Gold Corporation (Materials, Metals & mining) | 20,500 | 463,373 | ||||
| Bausch Health Companies Incorporated (Health care, Pharmaceuticals) † | 15,200 | 365,639 | ||||
| BCE Incorporated (Communication services, Diversified telecommunication services) | 6,286 | 330,145 | ||||
| Brookfield Asset Management Incorporated Class A (Financials, Capital markets) | 38,528 | 2,105,589 | ||||
| CAE Incorporated (Industrials, Aerospace & defense) † | 1,100 | 29,429 | ||||
| Canadian Apartment Properties (Real estate, Equity REITs) | 20,200 | 840,830 | ||||
| Canadian Imperial Bank of Commerce (Financials, Banks) | 14,974 | 1,895,289 | ||||
| Canadian National Railway Company (Industrials, Road & rail) | 29,037 | 3,602,192 | ||||
| Canadian Natural Resources Limited (Energy, Oil, gas & consumable fuels) | 51,400 | 2,871,506 | ||||
| Canadian Pacific Railway Limited (Industrials, Road & rail) | 31,810 | 2,239,876 | ||||
| Canadian Tire Corporation Limited Class A (Consumer discretionary, Multiline retail) | 4,000 | 589,728 | ||||
| Canadian Utilities Limited Class A (Utilities, Multi-utilities) | 22,600 | 629,412 | ||||
| Cenovus Energy Incorporated (Energy, Oil, gas & consumable fuels) | 61,200 | 962,301 | ||||
| CGI Incorporated (Information technology, IT services) † | 13,565 | 1,112,169 | ||||
| Constellation Software Incorporated (Information technology, Software) | 728 | 1,226,923 | ||||
| Dollarama Incorporated (Consumer discretionary, Multiline retail) | 1,800 | 93,018 | ||||
| Emera Incorporated (Utilities, Electric utilities) | 6,600 | 308,781 | ||||
| Empire Company Limited Class A (Consumer staples, Food & staples retailing) | 26,800 | 830,113 | ||||
| Enbridge Incorporated (Energy, Oil, gas & consumable fuels) | 59,600 | 2,574,908 | ||||
| Fairfax Financial Holdings Limited (Financials, Insurance) | 3,300 | 1,599,751 | ||||
| First Quantum Minerals Limited (Materials, Metals & mining) | 7,800 | 228,738 | ||||
| FirstService Corporation (Real estate, Real estate management & development) | 2,800 | 398,605 | ||||
| Fortis Incorporated (Utilities, Electric utilities) | 7,644 | 350,267 | ||||
| George Weston Limited (Consumer staples, Food & staples retailing) | 4,800 | 520,483 | ||||
| Gildan Activewear Incorporated (Consumer discretionary, Textiles, apparel & luxury goods) | 49,300 | 1,935,438 | ||||
| iA Financial Corporation (Financials, Insurance) | 12,500 | 742,702 | ||||
| IGM Financial Incorporated (Financials, Capital markets) | 25,500 | 905,929 |
| Shares | Value | |||||
| Canada: (continued) | ||||||
| Imperial Oil Limited (Energy, Oil, gas & consumable fuels) | 25,300 | $ 1,135,556 | ||||
| Intact Financial Corporation (Financials, Insurance) | 3,275 | 469,714 | ||||
| Keyera Corporation (Energy, Oil, gas & consumable fuels) | 3,500 | 81,984 | ||||
| Kinross Gold Corporation (Materials, Metals & mining) | 5,000 | 24,931 | ||||
| Loblaw Companies Limited (Consumer staples, Food & staples retailing) | 13,700 | 1,068,654 | ||||
| Lundin Mining Corporation (Materials, Metals & mining) | 38,100 | 367,624 | ||||
| Magna International Incorporated (Consumer discretionary, Auto components) | 10,027 | 744,965 | ||||
| Manulife Financial Corporation (Financials, Insurance) | 79,100 | 1,602,594 | ||||
| Metro Incorporated (Consumer staples, Food & staples retailing) | 6,330 | 330,409 | ||||
| National Bank of Canada (Financials, Banks) | 11,708 | 938,765 | ||||
| Northland Power Incorporated (Utilities, Independent power & renewable electricity producers) | 5,800 | 184,410 | ||||
| Nutrien Limited (Materials, Chemicals) | 24,900 | 2,141,498 | ||||
| Onex Corporation (Financials, Diversified financial services) | 11,800 | 792,439 | ||||
| Open Text Corporation (Information technology, Software) | 8,218 | 357,483 | ||||
| Open Text Corporation (Toronto Exchange) (Information technology, Software) | 13,600 | 591,855 | ||||
| Parkland Corporation (Energy, Oil, gas & consumable fuels) | 21,900 | 573,115 | ||||
| Power Corporation of Canada (Financials, Insurance) | 20,696 | 638,270 | ||||
| Quebecor Incorporated Class B (Communication services, Media) | 11,800 | 258,064 | ||||
| Restaurant Brands International Incorporated (Consumer discretionary, Hotels, restaurants & leisure) | 19,003 | 1,063,718 | ||||
| RioCan REIT (Real estate, Equity REITs) | 70,400 | 1,395,225 | ||||
| Rogers Communications Incorporated Class B (Communication services, Wireless telecommunication services) | 9,937 | 513,431 | ||||
| Royal Bank of Canada (Financials, Banks) | 45,431 | 5,025,547 | ||||
| Saputo Incorporated (Consumer staples, Food products) | 8,500 | 208,292 | ||||
| Shopify Incorporated Class A (Information technology, IT services) † | 1,800 | 1,249,591 | ||||
| Sun Life Financial Incorporated (Financials, Insurance) | 20,558 | 1,081,181 | ||||
| Suncor Energy Incorporated (Energy, Oil, gas & consumable fuels) | 62,900 | 1,923,475 | ||||
| TC Energy Corporation (Energy, Oil, gas & consumable fuels) | 17,200 | 924,118 | ||||
| Tecl Rresources Limited Class B (Materials, Metals & mining) | 9,700 | 349,277 | ||||
| TFI International Incorporated (Industrials, Road & rail) | 18,800 | 1,959,650 | ||||
| The Bank of Nova Scotia (Financials, Banks) | 43,008 | 3,116,596 | ||||
| The Toronto-Dominion Bank (Financials, Banks) | 58,018 | 4,681,721 | ||||
| Thomson Reuters Corporation (Industrials, Professional services) | 2,200 | 222,447 | ||||
| TMX Group Limited (Financials, Capital markets) | 5,800 | 585,903 | ||||
| Toromont Industries Limited (Industrials, Trading companies & distributors) | 4,500 | 381,444 | ||||
| Tourmaline Oil Corporation (Energy, Oil, gas & consumable fuels) | 27,800 | 1,096,647 | ||||
| WSP Global Incorporated (Industrials, Construction & engineering) | 2,400 | 294,457 | ||||
| 72,971,814 | ||||||
| Denmark: 2.46% | ||||||
| A.P. Moller-Mærsk AS Class B (Industrials, Marine) | 307 | 971,198 | ||||
| Carlsberg AS Class B (Consumer staples, Beverages) | 6,731 | 987,099 | ||||
| Coloplast AS Class B (Health care, Health care equipment & supplies) | 6,993 | 1,052,013 | ||||
| Danske Bank AS (Financials, Banks) | 42,932 | 727,183 | ||||
| DSV Panalpina AS (Industrials, Air freight & logistics) | 5,488 | 1,010,103 | ||||
| Genmab AS (Health care, Biotechnology) † | 1,935 | 650,346 | ||||
| GN Store Nord AS (Health care, Health care equipment & supplies) | 4,412 | 233,232 | ||||
| Novo Nordisk AS Class B (Health care, Pharmaceuticals) | 66,953 | 6,928,524 | ||||
| Novozymes AS Class B (Materials, Chemicals) | 6,909 | 453,456 | ||||
| Pandora AS (Consumer discretionary, Textiles, apparel & luxury goods) | 13,855 | 1,418,715 | ||||
| Rockwool International Class A (Industrials, Building products) | 1,161 | 398,003 |
| Shares | Value | |||||
| Denmark: (continued) | ||||||
| Vestas Wind System AS Class A (Industrials, Electrical equipment) | 4,877 | $ 157,267 | ||||
| William Demant Holding (Health care, Health care equipment & supplies) † | 15,783 | 667,000 | ||||
| 15,654,139 | ||||||
| Finland: 1.18% | ||||||
| Elisa Oyj (Communication services, Diversified telecommunication services) | 9,258 | 512,959 | ||||
| Fortum Oyj (Utilities, Electric utilities) | 30,774 | 644,032 | ||||
| Kesko Oyj Class B (Consumer staples, Food & staples retailing) | 20,566 | 605,251 | ||||
| Kone Oyj Class B (Industrials, Machinery) | 7,105 | 414,602 | ||||
| Nokia Oyj (Information technology, Communications equipment) † | 197,332 | 1,067,041 | ||||
| Nordea Bank AB (Financials, Banks) | 109,216 | 1,208,314 | ||||
| Orion Oyj Class B (Health care, Pharmaceuticals) | 30,283 | 1,422,055 | ||||
| Sampo Oyj Class A (Financials, Insurance) | 13,516 | 637,746 | ||||
| UPM-Kymmene Oyj (Materials, Paper & forest products) | 11,126 | 384,439 | ||||
| Wartsila Oyj Abp (Industrials, Machinery) | 53,409 | 598,158 | ||||
| 7,494,597 | ||||||
| France: 8.46% | ||||||
| Accor SA (Consumer discretionary, Hotels, restaurants & leisure) † | 5,670 | 193,649 | ||||
| Aeroports de Paris SA (Industrials, Transportation infrastructure) † | 1,052 | 148,742 | ||||
| Air Liquide SA (Materials, Chemicals) | 10,685 | 1,774,833 | ||||
| Amundi SA (Financials, Capital markets) 144A | 867 | 60,132 | ||||
| Arkema SA (Materials, Chemicals) | 5,151 | 683,111 | ||||
| AXA SA (Financials, Insurance) | 66,919 | 1,810,668 | ||||
| BNP Paribas SA (Financials, Banks) | 38,158 | 2,214,100 | ||||
| Bolloré SA (Industrials, Air freight & logistics) | 20,747 | 104,982 | ||||
| Bouygues SA (Industrials, Construction & engineering) | 5,769 | 206,288 | ||||
| Bureau Veritas SA (Industrials, Professional services) | 10,929 | 312,491 | ||||
| Capgemini SE (Information technology, IT services) | 6,472 | 1,354,781 | ||||
| Carrefour SA (Consumer staples, Food & staples retailing) | 51,993 | 1,045,280 | ||||
| Compagnie de Saint-Gobain SA (Industrials, Building products) | 21,515 | 1,334,039 | ||||
| Compagnie Generale des Etablissements Michelin SCA (Consumer discretionary, Auto components) | 5,621 | 773,773 | ||||
| Covivio (Real estate, Equity REITs) | 1,756 | 143,659 | ||||
| Credit Agricole SA (Financials, Banks) | 15,612 | 198,871 | ||||
| Danone SA (Consumer staples, Food products) | 18,407 | 1,119,868 | ||||
| Dassault Avation SA (Industrials, Aerospace & defense) | 5,557 | 826,937 | ||||
| Dassault Systèmes SE (Information technology, Software) | 17,281 | 833,571 | ||||
| Eiffage SA (Industrials, Construction & engineering) | 3,117 | 317,510 | ||||
| Engie SA (Utilities, Multi-utilities) | 30,396 | 484,283 | ||||
| Essilor International (Compagnie Generale d'Optique) (Consumer discretionary, Textiles, apparel & luxury goods) | 6,331 | 1,105,204 | ||||
| Eurazeo SA (Financials, Diversified financial services) | 3,959 | 305,796 | ||||
| Hermes International SA (Consumer discretionary, Textiles, apparel & luxury goods) | 676 | 932,229 | ||||
| Ipsen SA (Health care, Pharmaceuticals) | 10,134 | 1,179,188 | ||||
| Kering SA (Consumer discretionary, Textiles, apparel & luxury goods) | 1,514 | 1,050,161 | ||||
| Klepierre SA (Real estate, Equity REITs) | 56,761 | 1,622,487 | ||||
| La Francaise Des Jeux SA (Consumer discretionary, Hotels, restaurants & leisure) 144A | 23,188 | 961,196 | ||||
| Legrand SA (Industrials, Electrical equipment) | 10,093 | 952,174 | ||||
| L'Oréal SA (Consumer staples, Personal products) | 8,482 | 3,353,140 | ||||
| LVMH Moët Hennessy Louis Vuitton SE (Consumer discretionary, Textiles, apparel & luxury goods) | 7,917 | 5,818,242 |
| Shares | Value | |||||
| France: (continued) | ||||||
| Orange SA (Communication services, Diversified telecommunication services) | 18,532 | $ 224,083 | ||||
| Pernod-Ricard SA (Consumer staples, Beverages) | 6,910 | 1,508,454 | ||||
| Publicis Groupe SA (Communication services, Media) | 21,867 | 1,451,219 | ||||
| Safran SA (Industrials, Aerospace & defense) | 10,479 | 1,332,375 | ||||
| Sanofi SA (Health care, Pharmaceuticals) | 37,628 | 3,933,349 | ||||
| Schneider Electric SE (Industrials, Electrical equipment) | 17,251 | 2,672,803 | ||||
| Societe Generale SA (Financials, Banks) | 39,648 | 1,121,148 | ||||
| Sodexho Alliance SA (Consumer discretionary, Hotels, restaurants & leisure) | 16,703 | 1,394,479 | ||||
| Thales SA (Industrials, Aerospace & defense) | 5,633 | 643,981 | ||||
| Total SA (Energy, Oil, gas & consumable fuels) | 85,355 | 4,348,428 | ||||
| Veolia Environnement SA (Utilities, Multi-utilities) | 17,442 | 608,145 | ||||
| Vinci SA (Industrials, Construction & engineering) | 12,615 | 1,322,700 | ||||
| Wendel SA (Financials, Diversified financial services) | 425 | 43,145 | ||||
| 53,825,694 | ||||||
| Germany: 6.26% | ||||||
| adidas AG (Consumer discretionary, Textiles, apparel & luxury goods) | 4,071 | 962,554 | ||||
| Allianz AG (Financials, Insurance) | 12,953 | 2,919,830 | ||||
| BASF SE (Materials, Chemicals) | 30,114 | 2,005,178 | ||||
| Bayer AG (Health care, Pharmaceuticals) | 34,675 | 2,002,931 | ||||
| Bayerische Motoren Werke AG (Consumer discretionary, Automobiles) | 15,944 | 1,535,522 | ||||
| Bechtle AG (Information technology, IT services) | 9,305 | 477,311 | ||||
| Beiersdorf AG (Consumer staples, Personal products) | 5,042 | 511,097 | ||||
| Brenntag AG (Industrials, Trading companies & distributors) | 4,088 | 342,707 | ||||
| Carl Zeiss Meditec AG (Health care, Health care equipment & supplies) | 1,427 | 223,946 | ||||
| Continental AG (Consumer discretionary, Auto components) | 3,846 | 327,730 | ||||
| Covestro AG (Materials, Chemicals) 144A | 13,760 | 727,707 | ||||
| Daimler Truck Holding AG (Industrials, Machinery) † | 10,075 | 307,041 | ||||
| Deutsche Bank AG (Financials, Capital markets) † | 115,802 | 1,429,551 | ||||
| Deutsche Boerse AG (Financials, Capital markets) | 4,286 | 729,574 | ||||
| Deutsche Lufthansa AG (Industrials, Airlines) † | 122,381 | 929,489 | ||||
| Deutsche Post AG (Industrials, Air freight & logistics) | 30,312 | 1,523,548 | ||||
| Deutsche Telekom AG (Communication services, Diversified telecommunication services) | 75,277 | 1,349,316 | ||||
| E.ON SE (Utilities, Multi-utilities) | 123,551 | 1,680,484 | ||||
| Evonik Industries AG (Materials, Chemicals) | 4,386 | 132,026 | ||||
| Fresenius Medical Care AG & Company KGaA (Health care, Health care providers & services) | 6,503 | 417,224 | ||||
| Fresenius SE & Company KGaA (Health care, Health care providers & services) | 25,170 | 878,237 | ||||
| GEA Group AG (Industrials, Machinery) | 13,572 | 593,487 | ||||
| Hannover Rueck SE (Financials, Insurance) | 3,604 | 663,503 | ||||
| Heidelbergcement AG (Materials, Construction materials) | 5,279 | 342,538 | ||||
| Henkel AG & Company KGaA (Consumer staples, Household products) | 2,311 | 177,686 | ||||
| Infineon Technologies AG (Information technology, Semiconductors & semiconductor equipment) | 9,522 | 322,185 | ||||
| Kion Group AG (Industrials, Machinery) | 1,252 | 100,368 | ||||
| Mercedes Benz Group AG (Consumer discretionary, Automobiles) | 28,975 | 2,263,512 | ||||
| Merck KGaA (Health care, Pharmaceuticals) | 6,868 | 1,362,250 | ||||
| MTU Aero Engines AG (Industrials, Aerospace & defense) | 288 | 68,943 | ||||
| Muenchener Rueckversicherungs Gesellschaft AG (Financials, Insurance) | 4,581 | 1,256,738 | ||||
| Nemetschek SE (Information technology, Software) | 4,335 | 384,651 | ||||
| Puma AG Rudolf Dassler Sport (Consumer discretionary, Textiles, apparel & luxury goods) | 583 | 53,464 | ||||
| Rational AG (Industrials, Machinery) | 145 | 106,714 |
| Shares | Value | |||||
| Germany: (continued) | ||||||
| SAP SE (Information technology, Software) | 35,859 | $ 4,045,038 | ||||
| Scout24 AG (Communication services, Interactive media & services) 144A | 6,927 | 404,054 | ||||
| Siemens AG (Industrials, Industrial conglomerates) | 26,896 | 3,789,171 | ||||
| Siemens Healthineers AG (Health care, Health care equipment & supplies) 144A | 6,357 | 407,931 | ||||
| Uniper SE (Utilities, Independent power & renewable electricity producers) | 49,311 | 1,577,516 | ||||
| United Internet AG (Communication services, Diversified telecommunication services) | 1,678 | 57,066 | ||||
| Zalando SE (Consumer discretionary, Internet & direct marketing retail) 144A† | 6,475 | 428,559 | ||||
| 39,818,377 | ||||||
| Hong Kong: 2.99% | ||||||
| AIA Group Limited (Financials, Insurance) | 309,800 | 3,216,915 | ||||
| BOC Hong Kong (Holdings) Limited (Financials, Banks) | 45,000 | 161,778 | ||||
| Chow Tai Fook Jewellery Company Limited (Consumer discretionary, Specialty retail) | 661,800 | 1,374,253 | ||||
| CK Asset Holdings Limited (Real estate, Real estate management & development) | 177,690 | 1,122,298 | ||||
| CK Hutchison Holdings Limited (Industrials, Industrial conglomerates) | 119,570 | 838,313 | ||||
| CK Infrastructure Holdings Limited (Utilities, Electric utilities) | 172,500 | 1,070,880 | ||||
| CLP Holdings Limited (Utilities, Electric utilities) | 99,000 | 1,008,542 | ||||
| Hang Seng Bank Limited (Financials, Banks) | 19,127 | 352,723 | ||||
| Henderson Land Development Company Limited (Real estate, Real estate management & development) | 128,198 | 532,988 | ||||
| Hong Kong & China Gas Company Limited (Utilities, Gas utilities) | 145,000 | 219,276 | ||||
| Hong Kong Exchanges & Clearing Limited (Financials, Capital markets) | 24,300 | 1,177,497 | ||||
| Hong Kong Land Holdings Limited (Real estate, Real estate management & development) | 189,200 | 1,024,593 | ||||
| Hong Kong Telecommunications Trust & Hong Kong Trust Limited (Communication services, Diversified telecommunication services) | 370,574 | 499,814 | ||||
| Jardine Matheson Holdings Limited (Industrials, Industrial conglomerates) | 4,300 | 255,850 | ||||
| Link REIT (Real estate, Equity REITs) | 110,800 | 895,352 | ||||
| MTR Corporation Limited (Industrials, Road & rail) | 13,500 | 69,977 | ||||
| New World Development Company Limited (Real estate, Real estate management & development) | 28,000 | 111,990 | ||||
| Power Assets Holdings Limited (Utilities, Electric utilities) | 152,500 | 961,135 | ||||
| Sino Land Company (Real estate, Real estate management & development) | 785,899 | 991,961 | ||||
| Sun Hung Kai Properties Limited (Real estate, Real estate management & development) | 91,000 | 1,057,946 | ||||
| Swire Pacific Limited Class A (Real estate, Real estate management & development) | 73,478 | 406,055 | ||||
| Techtronic Industries Company Limited (Industrials, Machinery) | 15,243 | 255,413 | ||||
| WH Group Limited (Consumer staples, Food products) 144A | 1,785,500 | 1,246,950 | ||||
| Xinyi Glass Holdings Limited (Consumer discretionary, Auto components) | 66,000 | 175,807 | ||||
| 19,028,306 | ||||||
| Ireland: 0.46% | ||||||
| CRH plc (Materials, Construction materials) | 30,464 | 1,384,839 | ||||
| DCC plc (Industrials, Industrial conglomerates) | 8,972 | 704,064 | ||||
| Kerry Group plc Class A (Consumer staples, Food products) | 5,306 | 632,152 | ||||
| Kingspan Group plc (Industrials, Building products) | 2,319 | 226,479 | ||||
| 2,947,534 |
| Shares | Value | |||||
| Israel: 1.15% | ||||||
| Azrieli Group Limited (Real estate, Real estate management & development) | 587 | $ 50,078 | ||||
| Bank Hapoalim BM (Financials, Banks) | 85,415 | 905,270 | ||||
| Bank Leumi Le-Israel (Financials, Banks) | 111,440 | 1,207,221 | ||||
| Check Point Software Technologies Limited (Information technology, Software) † | 9,184 | 1,330,578 | ||||
| Elbit Systems Limited (Industrials, Aerospace & defense) | 2,048 | 421,021 | ||||
| ICL Group Limited (Materials, Chemicals) | 97,734 | 1,109,918 | ||||
| InMode Limited (Health care, Health care equipment & supplies) † | 21,101 | 900,802 | ||||
| Israel Discount Bank Limited Class A (Financials, Banks) | 123,512 | 814,457 | ||||
| Mizrahi Tefahot Bank Limited (Financials, Banks) | 15,704 | 613,702 | ||||
| 7,353,047 | ||||||
| Italy: 1.40% | ||||||
| Assicurazioni Generali SpA (Financials, Insurance) | 52,617 | 1,040,598 | ||||
| Atlantia SpA (Industrials, Transportation infrastructure) † | 17,099 | 314,540 | ||||
| Enel SpA (Utilities, Electric utilities) | 185,362 | 1,365,921 | ||||
| Eni SpA (Energy, Oil, gas & consumable fuels) | 103,071 | 1,603,239 | ||||
| Intesa Sanpaolo SpA (Financials, Banks) | 363,271 | 928,639 | ||||
| Mediobanca SpA (Financials, Banks) | 76,556 | 797,271 | ||||
| Poste Italiane SpA (Financials, Insurance) 144A | 22,878 | 262,400 | ||||
| Prysmian SpA (Industrials, Electrical equipment) | 26,671 | 877,992 | ||||
| Recordati SpA (Health care, Pharmaceuticals) | 5,955 | 291,268 | ||||
| Snam SpA (Utilities, Gas utilities) | 64,969 | 360,984 | ||||
| Telecom Italia SpA (Communication services, Diversified telecommunication services) | 342,946 | 144,087 | ||||
| UniCredit SpA (Financials, Banks) | 72,935 | 921,498 | ||||
| 8,908,437 | ||||||
| Japan: 20.23% | ||||||
| Advantest Corporation (Information technology, Semiconductors & semiconductor equipment) | 7,700 | 618,809 | ||||
| Aisin Seiki Company Limited (Consumer discretionary, Auto components) | 16,700 | 608,285 | ||||
| Ajinomoto Company Incorporated (Consumer staples, Food products) | 25,150 | 732,896 | ||||
| All Nippon Airways Company Limited (Industrials, Airlines) † | 18,300 | 402,933 | ||||
| Asahi Breweries Limited (Consumer staples, Beverages) | 2,300 | 92,781 | ||||
| Asahi Glass Company Limited (Industrials, Building products) | 9,300 | 412,572 | ||||
| Asahi Kasei Corporation (Materials, Chemicals) | 11,700 | 109,802 | ||||
| Astellas Pharma Incorporated (Health care, Pharmaceuticals) | 40,600 | 677,379 | ||||
| Azbil Corporation (Information technology, Electronic equipment, instruments & components) | 4,500 | 170,815 | ||||
| Bandai Namco Holdings Incorporated (Consumer discretionary, Leisure products) | 6,100 | 447,198 | ||||
| Benefit One Incorporated (Industrials, Professional services) | 18,400 | 426,180 | ||||
| Bridgestone Corporation (Consumer discretionary, Auto components) | 15,800 | 650,659 | ||||
| Brother Industries Limited (Information technology, Technology hardware, storage & peripherals) | 10,100 | 183,829 | ||||
| Canon Incorporated (Information technology, Technology hardware, storage & peripherals) | 33,000 | 776,587 | ||||
| Capcom Company Limited (Communication services, Entertainment) | 9,600 | 233,000 | ||||
| Central Japan Railway Company (Industrials, Road & rail) | 800 | 108,093 | ||||
| Chiba Bank Limited (Financials, Banks) | 29,400 | 184,807 | ||||
| Chubu Electric Power Company Incorporated (Utilities, Electric utilities) | 73,400 | 733,168 | ||||
| Concordia Financial Group Limited (Financials, Banks) | 26,700 | 108,623 | ||||
| CyberAgent Incorporated (Communication services, Media) | 23,700 | 310,130 |
| Shares | Value | |||||
| Japan: (continued) | ||||||
| Dai Nippon Printing Company Limited (Industrials, Commercial services & supplies) | 36,300 | $ 947,600 | ||||
| Dai-ichi Life Holdings Incorporated (Financials, Insurance) | 57,500 | 1,194,168 | ||||
| Daiichi Sankyo Company Limited (Health care, Pharmaceuticals) | 11,000 | 268,349 | ||||
| Daikin Industries Limited (Industrials, Building products) | 4,766 | 880,778 | ||||
| Daito Trust Construction Company Limited (Real estate, Real estate management & development) | 13,000 | 1,438,318 | ||||
| Daiwa House Industry Company Limited (Real estate, Real estate management & development) | 33,900 | 961,413 | ||||
| Daiwa House REIT Investment Corporation (Real estate, Equity REITs) | 21 | 56,953 | ||||
| Daiwa Securities Group Incorporated (Financials, Capital markets) | 47,500 | 280,844 | ||||
| DENSO Corporation (Consumer discretionary, Auto components) | 12,600 | 886,034 | ||||
| Dentsu Incorporated (Communication services, Media) | 300 | 11,970 | ||||
| East Japan Railway Company (Industrials, Road & rail) | 600 | 35,645 | ||||
| ENEOS Holdings Incorporated (Energy, Oil, gas & consumable fuels) | 292,000 | 1,156,258 | ||||
| FANUC Corporation (Industrials, Machinery) | 2,600 | 477,625 | ||||
| Fuji Electric Holdings Company Limited (Industrials, Electrical equipment) | 28,500 | 1,466,371 | ||||
| FUJIFILM Holdings Incorporated (Information technology, Technology hardware, storage & peripherals) | 15,500 | 985,244 | ||||
| Fujitsu Limited (Information technology, IT services) | 11,900 | 1,728,879 | ||||
| Hakuhodo DY Holdings Incorporated (Communication services, Media) | 75,100 | 997,962 | ||||
| Hankyu Hanshin Holdings Incorporated (Industrials, Road & rail) | 1,100 | 32,909 | ||||
| Hino Motors Limited (Industrials, Machinery) | 132,100 | 1,241,315 | ||||
| Hirose Electric Company Limited (Information technology, Electronic equipment, instruments & components) | 2,700 | 405,979 | ||||
| Hitachi Construction Machinery Company Limited (Industrials, Machinery) | 13,000 | 318,131 | ||||
| Hitachi Limited (Industrials, Industrial conglomerates) | 47,700 | 2,358,894 | ||||
| Honda Motor Company Limited (Consumer discretionary, Automobiles) | 52,100 | 1,582,844 | ||||
| Hoya Corporation (Health care, Health care equipment & supplies) | 11,900 | 1,550,197 | ||||
| Idemitsu Kosan Company Limited (Energy, Oil, gas & consumable fuels) | 15,300 | 410,140 | ||||
| Iida Group Holdings Company Limited (Consumer discretionary, Household durables) | 19,900 | 369,327 | ||||
| Inpex Holdings Incorporated (Energy, Oil, gas & consumable fuels) | 92,500 | 953,445 | ||||
| Isuzu Motors Limited (Consumer discretionary, Automobiles) | 57,600 | 779,017 | ||||
| ITO EN Limited (Consumer staples, Beverages) | 12,800 | 736,151 | ||||
| Itochu Corporation (Industrials, Trading companies & distributors) | 24,000 | 782,126 | ||||
| Itochu Techno-Solutions Corporation (Information technology, IT services) | 9,600 | 248,865 | ||||
| Japan Airlines Company Limited (Industrials, Airlines) † | 5,000 | 99,143 | ||||
| Japan Post Holdings Company Limited (Financials, Insurance) | 14,100 | 240,811 | ||||
| Japan Tobacco Incorporated (Consumer staples, Tobacco) | 14,300 | 262,994 | ||||
| JFE Holdings Incorporated (Materials, Metals & mining) | 48,700 | 725,024 | ||||
| Kajima Corporation (Industrials, Construction & engineering) | 47,100 | 633,895 | ||||
| Kakaku.com Incorporated (Communication services, Interactive media & services) | 36,800 | 809,632 | ||||
| Kansai Electric Power Company Incorporated (Utilities, Electric utilities) | 16,100 | 162,332 | ||||
| Kao Corporation (Consumer staples, Personal products) | 8,300 | 387,999 | ||||
| KDDI Corporation (Communication services, Wireless telecommunication services) | 45,400 | 1,477,372 | ||||
| Keyence Corporation (Information technology, Electronic equipment, instruments & components) | 4,700 | 2,223,103 | ||||
| Kikkoman Corporation (Consumer staples, Food products) | 900 | 67,093 | ||||
| Kobe Bussan Company Limited (Consumer staples, Food & staples retailing) | 3,400 | 112,573 | ||||
| KOEI TECMO Holdings Company Limited (Communication services, Entertainment) | 12,300 | 427,124 | ||||
| Komatsu Limited (Industrials, Machinery) | 20,000 | 460,078 | ||||
| Konami Holdings Corporation (Communication services, Entertainment) | 15,700 | 893,185 |
| Shares | Value | |||||
| Japan: (continued) | ||||||
| KOSE Corporation (Consumer staples, Personal products) | 2,000 | $ 229,278 | ||||
| Kubota Corporation (Industrials, Machinery) | 22,600 | 405,482 | ||||
| Kurita Water Industries Limited (Industrials, Machinery) | 7,800 | 322,333 | ||||
| Kyocera Corporation (Information technology, Electronic equipment, instruments & components) | 500 | 28,776 | ||||
| Kyowa Hakko Kogyo Company Limited (Health care, Pharmaceuticals) | 2,300 | 58,859 | ||||
| Lasertec Corporation (Information technology, Semiconductors & semiconductor equipment) | 1,500 | 278,059 | ||||
| M3 Incorporated (Health care, Health care technology) | 9,800 | 368,710 | ||||
| Makita Corporation (Industrials, Machinery) | 12,000 | 427,694 | ||||
| Marubeni Corporation (Industrials, Trading companies & distributors) | 170,800 | 1,792,826 | ||||
| Mazda Motor Corporation (Consumer discretionary, Automobiles) † | 110,000 | 813,599 | ||||
| McDonald's Holdings Company Japan Limited (Consumer discretionary, Hotels, restaurants & leisure) | 23,000 | 988,960 | ||||
| MediPal Holdings Corporation (Health care, Health care providers & services) | 73,400 | 1,343,366 | ||||
| Meiji Holdings Company Limited (Consumer staples, Food products) | 9,000 | 540,162 | ||||
| Mercari Incorporated (Consumer discretionary, Internet & direct marketing retail) † | 11,300 | 353,916 | ||||
| Minebea Company Limited (Industrials, Machinery) | 17,400 | 381,945 | ||||
| Misumi Group Incorporated (Industrials, Machinery) | 13,400 | 429,573 | ||||
| Mitsubishi Chemical Holdings Corporation (Materials, Chemicals) | 108,700 | 772,187 | ||||
| Mitsubishi Corporation (Industrials, Trading companies & distributors) | 28,200 | 948,188 | ||||
| Mitsubishi Electric Corporation (Industrials, Electrical equipment) | 87,000 | 1,052,310 | ||||
| Mitsubishi Gas Chemical Company Incorporated (Materials, Chemicals) | 28,200 | 500,325 | ||||
| Mitsubishi Heavy Industries Limited (Industrials, Machinery) | 21,300 | 628,192 | ||||
| Mitsubishi UFJ Financial Group Incorporated (Financials, Banks) | 319,800 | 1,963,247 | ||||
| Mitsui & Company Limited (Industrials, Trading companies & distributors) | 61,000 | 1,520,895 | ||||
| Mitsui Chemicals Incorporated (Materials, Chemicals) | 29,700 | 759,267 | ||||
| Mitsui Fudosan Company Limited (Real estate, Real estate management & development) | 6,400 | 142,439 | ||||
| Mizuho Financial Group Incorporated (Financials, Banks) | 40,070 | 528,087 | ||||
| MS&AD Insurance Group Holdings Incorporated (Financials, Insurance) | 19,800 | 669,967 | ||||
| Murata Manufacturing Company Limited (Information technology, Electronic equipment, instruments & components) | 11,300 | 768,006 | ||||
| NEC Corporation (Information technology, IT services) | 8,900 | 385,064 | ||||
| Nexon Company Limited (Communication services, Entertainment) | 4,700 | 102,682 | ||||
| NGK Insulators Limited (Industrials, Machinery) | 57,000 | 885,204 | ||||
| Nidec Corporation (Industrials, Electrical equipment) | 7,100 | 617,229 | ||||
| Nintendo Company Limited (Communication services, Entertainment) | 3,700 | 1,873,872 | ||||
| Nippon Express Holdings Incorporated (Industrials, Road & rail) † | 30,100 | 1,824,655 | ||||
| Nippon Shinyaku Company Limited (Health care, Pharmaceuticals) | 12,700 | 827,152 | ||||
| Nippon Steel Corporation (Materials, Metals & mining) | 48,300 | 884,323 | ||||
| Nippon Telegraph & Telephone Corporation (Communication services, Diversified telecommunication services) | 52,200 | 1,500,274 | ||||
| Nippon Yusen Kabushiki Kaisha (Industrials, Marine) | 10,900 | 1,021,232 | ||||
| Nissan Chemical Industries Limited (Materials, Chemicals) | 900 | 51,156 | ||||
| Nisshin Seifun Group Incorporated (Consumer staples, Food products) | 5,300 | 75,228 | ||||
| Nitori Holdings Company Limited (Consumer discretionary, Specialty retail) | 800 | 120,383 | ||||
| Nomura Holdings Incorporated (Financials, Capital markets) | 6,500 | 29,660 | ||||
| Nomura Real Estate Holding Incorporated (Real estate, Real estate management & development) | 20,600 | 512,912 | ||||
| Nomura Research Institute Limited (Information technology, IT services) | 24,400 | 856,508 | ||||
| NTT Data Corporation (Information technology, IT services) | 49,567 | 941,481 | ||||
| Obayashi Corporation (Industrials, Construction & engineering) | 58,100 | 486,471 | ||||
| Oji Holdings Corporation (Materials, Paper & forest products) | 65,300 | 333,627 | ||||
| Olympus Corporation (Health care, Health care equipment & supplies) | 21,600 | 438,706 |
| Shares | Value | |||||
| Japan: (continued) | ||||||
| Omron Corporation (Information technology, Electronic equipment, instruments & components) | 5,900 | $ 401,486 | ||||
| Ono Pharmaceutical Company Limited (Health care, Pharmaceuticals) | 600 | 14,772 | ||||
| Open house Group Company Limited (Consumer discretionary, Household durables) | 12,100 | 550,177 | ||||
| Oracle Corporation (Japan) (Information technology, Software) | 10,800 | 771,397 | ||||
| ORIX Corporation (Financials, Diversified financial services) | 42,100 | 834,554 | ||||
| Osaka Gas Company Limited (Utilities, Gas utilities) | 10,600 | 193,994 | ||||
| Otsuka Corporation (Information technology, IT services) | 15,100 | 586,537 | ||||
| Otsuka Holdings Company Limited (Health care, Pharmaceuticals) | 10,600 | 365,426 | ||||
| Pan Pacific International Holdings (Consumer discretionary, Multiline retail) | 4,900 | 80,203 | ||||
| Panasonic Corporation (Consumer discretionary, Household durables) | 54,500 | 569,160 | ||||
| Persol Holdings Company Limited (Industrials, Professional services) | 55,900 | 1,252,253 | ||||
| Pola Orbis Holdings Incorporated (Consumer staples, Personal products) | 81,900 | 1,290,154 | ||||
| Recruit Holdings Company Limited (Industrials, Professional services) | 30,000 | 1,266,306 | ||||
| Renesas Electronics Corporation (Information technology, Semiconductors & semiconductor equipment) † | 37,000 | 435,886 | ||||
| Resona Holdings Incorporated (Financials, Banks) | 54,200 | 242,398 | ||||
| Rohm Company Limited (Information technology, Semiconductors & semiconductor equipment) | 1,600 | 127,606 | ||||
| Ryohin Keikaku Company Limited (Consumer discretionary, Multiline retail) | 5,000 | 73,638 | ||||
| SBI Holdings Incorporated (Financials, Capital markets) | 8,450 | 221,660 | ||||
| SCSK Corporation (Information technology, IT services) | 47,600 | 814,933 | ||||
| Seiko Epson Corporation (Information technology, Technology hardware, storage & peripherals) | 25,800 | 396,815 | ||||
| Sekisui House Limited (Consumer discretionary, Household durables) | 25,600 | 521,935 | ||||
| Seven & I Holdings Company Limited (Consumer staples, Food & staples retailing) | 18,700 | 909,899 | ||||
| SG Holdings Company Limited (Industrials, Air freight & logistics) | 8,300 | 175,920 | ||||
| Shimadzu Corporation (Information technology, Electronic equipment, instruments & components) | 17,400 | 626,694 | ||||
| Shimano Incorporated (Consumer discretionary, Leisure products) | 1,100 | 256,155 | ||||
| Shimizu Corporation (Industrials, Construction & engineering) | 89,300 | 591,091 | ||||
| Shin-Etsu Chemical Company Limited (Materials, Chemicals) | 6,400 | 999,604 | ||||
| Shionogi & Company Limited (Health care, Pharmaceuticals) | 12,800 | 851,102 | ||||
| Shiseido Company Limited (Consumer staples, Personal products) | 5,100 | 292,669 | ||||
| Shizuoka Bank Limited (Financials, Banks) | 1,000 | 7,393 | ||||
| SMC Corporation (Industrials, Machinery) | 1,100 | 657,106 | ||||
| SoftBank Corporation (Communication services, Wireless telecommunication services) | 95,700 | 1,209,110 | ||||
| SoftBank Group Corporation (Communication services, Wireless telecommunication services) | 41,600 | 1,866,841 | ||||
| Sohgo Security Services Company Limited (Industrials, Commercial services & supplies) | 7,400 | 267,171 | ||||
| Sompo Holdings Incorporated (Financials, Insurance) | 16,800 | 729,423 | ||||
| Sony Corporation (Consumer discretionary, Household durables) | 31,900 | 3,259,293 | ||||
| Square Enix Company Limited (Communication services, Entertainment) | 12,600 | 614,484 | ||||
| Stanley Electric Company Limited (Consumer discretionary, Auto components) | 200 | 4,753 | ||||
| Sumco Corporation (Information technology, Semiconductors & semiconductor equipment) | 5,633 | 94,009 | ||||
| Sumitomo Chemical Company Limited (Materials, Chemicals) | 54,700 | 261,150 | ||||
| Sumitomo Electric Industries Limited (Industrials, Electrical equipment) | 55,200 | 732,786 | ||||
| Sumitomo Metal Mining Company Limited (Materials, Metals & mining) | 5,700 | 284,330 | ||||
| Sumitomo Mitsui Financial Group Incorporated (Financials, Banks) | 28,900 | 1,024,859 | ||||
| Sumitomo Mitsui Trust Holdings Incorporated (Financials, Banks) | 11,100 | 394,405 |
| Shares | Value | |||||
| Japan: (continued) | ||||||
| Sumitomo Realty & Development Company Limited (Real estate, Real estate management & development) | 13,600 | $ 400,089 | ||||
| Suntory Beverage & Food Limited (Consumer staples, Beverages) | 16,000 | 637,585 | ||||
| Suzuki Motor Corporation (Consumer discretionary, Automobiles) | 8,933 | 355,694 | ||||
| T&D Holdings Incorporated (Financials, Insurance) | 22,300 | 323,873 | ||||
| Taisei Corporation (Industrials, Construction & engineering) | 14,700 | 488,796 | ||||
| Takeda Pharmaceutical Company Limited (Health care, Pharmaceuticals) | 39,800 | 1,213,514 | ||||
| TDK Corporation (Information technology, Electronic equipment, instruments & components) | 11,400 | 461,394 | ||||
| Terumo Corporation (Health care, Health care equipment & supplies) | 2,500 | 81,196 | ||||
| TIS Incorporated (Information technology, Software) | 60,900 | 1,441,419 | ||||
| Toho Company Limited Tokyo (Communication services, Entertainment) | 13,400 | 558,852 | ||||
| Tokio Marine Holdings Incorporated (Financials, Insurance) | 10,200 | 580,391 | ||||
| Tokyo Electron Limited (Information technology, Semiconductors & semiconductor equipment) | 6,700 | 3,288,209 | ||||
| Tokyu Corporation (Industrials, Road & rail) | 36,900 | 492,112 | ||||
| Toppan Printing Company Limited (Industrials, Commercial services & supplies) | 43,700 | 861,078 | ||||
| Toray Industries Incorporated (Materials, Chemicals) | 62,800 | 358,129 | ||||
| Toshiba Corporation (Industrials, Industrial conglomerates) | 37,000 | 1,475,183 | ||||
| Tosoh Corporation (Materials, Chemicals) | 69,300 | 1,075,403 | ||||
| Toyo Suisan Kaisha Limited (Consumer staples, Food products) | 9,900 | 416,165 | ||||
| Toyota Industries Corporation (Consumer discretionary, Auto components) | 1,000 | 76,061 | ||||
| Toyota Motor Corporation (Consumer discretionary, Automobiles) | 330,300 | 6,043,227 | ||||
| Toyota Tsusho Corporation (Industrials, Trading companies & distributors) | 16,300 | 676,694 | ||||
| Trend Micro Incorporated (Information technology, Software) | 11,200 | 625,706 | ||||
| Tsuruha Holdings Incorporated (Consumer staples, Food & staples retailing) | 700 | 56,276 | ||||
| Unicharm Corporation (Consumer staples, Household products) | 10,100 | 380,711 | ||||
| Yakult Honsha Company Limited (Consumer staples, Food products) | 3,700 | 200,795 | ||||
| Yamaha Corporation (Consumer discretionary, Leisure products) | 8,933 | 419,124 | ||||
| Yamaha Motor Company Limited (Consumer discretionary, Automobiles) | 38,700 | 869,961 | ||||
| Yamato Holdings Company Limited (Industrials, Air freight & logistics) | 15,800 | 310,293 | ||||
| Yokogawa Electric Corporation (Information technology, Electronic equipment, instruments & components) | 15,400 | 248,468 | ||||
| ZOZO Incorporated (Consumer discretionary, Internet & direct marketing retail) | 67,300 | 1,916,396 | ||||
| 128,753,453 | ||||||
| Luxembourg: 0.36% | ||||||
| ArcelorMittal SA (Materials, Metals & mining) | 52,395 | 1,625,745 | ||||
| Eurofins Scientific SE (Health care, Life sciences tools & services) | 1,780 | 180,631 | ||||
| Tenaris SA (Energy, Energy equipment & services) | 37,768 | 486,726 | ||||
| 2,293,102 | ||||||
| Netherlands: 4.36% | ||||||
| ABN AMRO Group NV (Financials, Banks) 144A | 6,627 | 88,187 | ||||
| Adyen NV (Information technology, IT services) 144A† | 158 | 329,315 | ||||
| Aegon NV (Financials, Insurance) | 188,350 | 930,410 | ||||
| Airbus SE (Industrials, Aerospace & defense) † | 18,538 | 2,366,914 | ||||
| Akzo Nobel NV (Materials, Chemicals) | 2,982 | 283,714 | ||||
| ASM International NV (Information technology, Semiconductors & semiconductor equipment) | 2,234 | 721,509 | ||||
| ASML Holding NV (Information technology, Semiconductors & semiconductor equipment) | 12,943 | 8,659,175 | ||||
| CNH Industrial NV (Industrials, Machinery) | 2,740 | 38,975 |
| Shares | Value | |||||
| Netherlands: (continued) | ||||||
| Davide Campari-Milano NV (Consumer staples, Beverages) | 40,205 | $ 437,545 | ||||
| Exor NV (Financials, Diversified financial services) | 16,517 | 1,251,420 | ||||
| Heineken Holding NV (Consumer staples, Beverages) | 6,536 | 533,788 | ||||
| Heineken NV (Consumer staples, Beverages) | 8,498 | 862,024 | ||||
| ING Groep NV (Financials, Banks) | 165,531 | 1,933,152 | ||||
| Koninklijke Ahold Delhaize NV (Consumer staples, Food & staples retailing) | 50,100 | 1,541,188 | ||||
| Koninklijke KPN NV (Communication services, Diversified telecommunication services) | 189,716 | 649,233 | ||||
| Koninklijke Philips NV (Health care, Health care equipment & supplies) | 12,081 | 412,671 | ||||
| NN Group NV (Financials, Insurance) | 22,847 | 1,096,539 | ||||
| Prosus NV (Consumer discretionary, Internet & direct marketing retail) | 31,043 | 1,927,200 | ||||
| Randstad Holdings NV (Industrials, Professional services) | 19,349 | 1,318,609 | ||||
| Stellantis NV (Consumer discretionary, Automobiles) | 76,507 | 1,390,276 | ||||
| Universal Music Group NV (Communication services, Entertainment) | 24,591 | 561,475 | ||||
| Wolters Kluwer NV (Communication services, Media) | 4,190 | 426,918 | ||||
| 27,760,237 | ||||||
| New Zealand: 0.23% | ||||||
| Auckland International Airport Limited (Industrials, Transportation infrastructure) † | 43,662 | 211,412 | ||||
| Fisher & Paykel Healthcare Corporation (Health care, Health care equipment & supplies) | 19,110 | 359,115 | ||||
| Meridian Energy Limited (Utilities, Independent power & renewable electricity producers) | 54,425 | 184,778 | ||||
| Spark New Zealand Limited (Communication services, Diversified telecommunication services) | 240,711 | 739,055 | ||||
| 1,494,360 | ||||||
| Norway: 1.07% | ||||||
| Aker BP ASA (Energy, Oil, gas & consumable fuels) | 4,065 | 127,318 | ||||
| DNB Bank ASA (Financials, Banks) | 47,590 | 1,065,457 | ||||
| Equinor ASA (Energy, Oil, gas & consumable fuels) | 42,746 | 1,343,742 | ||||
| Gjensidige Forsikring ASA (Financials, Insurance) | 13,348 | 330,158 | ||||
| Mowi ASA (Consumer staples, Food products) | 14,567 | 375,083 | ||||
| Norsk Hydro ASA (Materials, Metals & mining) | 170,571 | 1,619,757 | ||||
| Orkla ASA (Consumer staples, Food products) | 28,210 | 264,253 | ||||
| Telenor ASA (Communication services, Diversified telecommunication services) | 23,610 | 349,324 | ||||
| Yara International ASA (Materials, Chemicals) | 26,649 | 1,357,231 | ||||
| 6,832,323 | ||||||
| Portugal: 0.22% | ||||||
| Galp Energia SGPS SA (Energy, Oil, gas & consumable fuels) | 91,983 | 1,018,188 | ||||
| Jeronimo Martins SA (Consumer staples, Food & staples retailing) | 16,449 | 358,616 | ||||
| 1,376,804 | ||||||
| Singapore: 1.15% | ||||||
| Capitaland Investments Limited (Real estate, Real estate management & development) † | 298,400 | 817,693 | ||||
| DBS Group Holdings Limited (Financials, Banks) | 65,913 | 1,657,062 | ||||
| Genting Singapore Limited (Consumer discretionary, Hotels, restaurants & leisure) | 1,688,524 | 965,281 | ||||
| Keppel Corporation Limited (Industrials, Industrial conglomerates) | 15,700 | 69,896 | ||||
| Oversea-Chinese Banking Corporation Limited (Financials, Banks) | 138,196 | 1,197,526 | ||||
| Singapore Exchange Limited (Financials, Capital markets) | 56,000 | 388,516 |
| Shares | Value | |||||
| Singapore: (continued) | ||||||
| Singapore Technologies Engineering Limited (Industrials, Aerospace & defense) | 53,969 | $ 152,944 | ||||
| Singapore Telecommunications Limited (Communication services, Diversified telecommunication services) | 284,100 | 532,908 | ||||
| United Overseas Bank Limited (Financials, Banks) | 51,886 | 1,153,186 | ||||
| UOL Group Limited (Real estate, Real estate management & development) | 12,473 | 64,641 | ||||
| Wilmar International Limited (Consumer staples, Food products) | 102,285 | 332,430 | ||||
| 7,332,083 | ||||||
| Spain: 2.05% | ||||||
| Actividades de Construccion y Servicios SA (Industrials, Construction & engineering) | 8,530 | 207,284 | ||||
| Aena SA (Industrials, Transportation infrastructure) 144A† | 2,628 | 428,903 | ||||
| Banco Bilbao Vizcaya Argentaria SA (Financials, Banks) | 357,415 | 2,120,802 | ||||
| Banco Santander Central Hispano SA (Financials, Banks) | 788,210 | 2,624,751 | ||||
| CaixaBank SA (Financials, Banks) | 151,148 | 496,458 | ||||
| Enagás SA (Utilities, Gas utilities) | 36,853 | 778,836 | ||||
| Grifols SA (Health care, Biotechnology) | 10,119 | 191,857 | ||||
| Iberdrola SA (Utilities, Electric utilities) | 122,955 | 1,394,996 | ||||
| Industria de Diseno Textil SA (Consumer discretionary, Specialty retail) | 48,196 | 1,257,230 | ||||
| Naturgy Energy Group SA (Utilities, Gas utilities) | 6,929 | 185,903 | ||||
| Red Eléctrica Corporacion SA (Utilities, Electric utilities) | 25,596 | 507,068 | ||||
| Repsol SA (Energy, Oil, gas & consumable fuels) | 155,347 | 2,015,788 | ||||
| Telefónica SA (Communication services, Diversified telecommunication services) | 182,439 | 871,314 | ||||
| 13,081,190 | ||||||
| Sweden: 2.91% | ||||||
| Alfa Laval AB (Industrials, Machinery) | 19,930 | 646,348 | ||||
| Assa Abloy AB Class B (Industrials, Building products) | 35,391 | 928,932 | ||||
| Atlas Copco AB Class A (Industrials, Machinery) | 22,265 | 1,141,841 | ||||
| Atlas Copco AB Class B (Industrials, Machinery) | 11,534 | 521,166 | ||||
| Boliden AB (Materials, Metals & mining) | 13,415 | 596,705 | ||||
| Electrolux AB (Industrials, Electronic equipment, instruments & components) | 20,314 | 363,725 | ||||
| Epiroc AB Class A (Industrials, Machinery) | 30,863 | 579,936 | ||||
| Epiroc AB Class B (Industrials, Machinery) | 19,183 | 310,964 | ||||
| EQT AB (Financials, Capital markets) | 4,720 | 157,979 | ||||
| Ericsson LM Class B (Information technology, Communications equipment) | 84,122 | 774,082 | ||||
| Essity Aktiebolag AB (Consumer staples, Household products) | 26,091 | 671,476 | ||||
| Evolution Gaming Group (Consumer discretionary, Hotels, restaurants & leisure) 144A | 2,521 | 289,056 | ||||
| Fastighets AB Balder B Shares (Real estate, Real estate management & development) † | 482 | 30,047 | ||||
| Getinge AB Class B (Health care, Health care equipment & supplies) | 25,966 | 1,007,858 | ||||
| Hennes & Mauritz AB Class B (Consumer discretionary, Specialty retail) | 24,544 | 409,617 | ||||
| Hexagon AB Class B (Information technology, Electronic equipment, instruments & components) | 28,109 | 379,743 | ||||
| Husqvarna AB Class B (Industrials, Machinery) | 31,708 | 381,895 | ||||
| Industrivarden AB Class A (Financials, Diversified financial services) | 8,614 | 237,875 | ||||
| Investor AB (Financials, Diversified financial services) | 72,810 | 1,482,592 | ||||
| Investor AB Class A (Financials, Diversified financial services) | 11,962 | 264,510 | ||||
| Kinnevik AB (Financials, Diversified financial services) | 4,237 | 107,875 | ||||
| Lundin Energy AB (Energy, Oil, gas & consumable fuels) | 18,726 | 690,971 | ||||
| Sagax AB Class B (Real estate, Real estate management & development) | 4,354 | 118,391 | ||||
| Sandvik AB (Industrials, Machinery) | 49,682 | 1,070,772 |
| Shares | Value | |||||
| Sweden: (continued) | ||||||
| Securitas AB Class B (Industrials, Commercial services & supplies) | 10,678 | $ 129,277 | ||||
| Skandinaviska Enskilda Banken AB Class A (Financials, Banks) | 55,189 | 635,798 | ||||
| Skanska AB Class B (Industrials, Construction & engineering) | 34,224 | 774,602 | ||||
| SKF AB Class B (Industrials, Machinery) | 34,230 | 632,029 | ||||
| Svenska Handelsbanken AB Class A (Financials, Banks) | 55,674 | 529,282 | ||||
| Swedbank AB Class A (Financials, Banks) | 31,178 | 503,745 | ||||
| Swedish Match AB (Consumer staples, Tobacco) | 60,321 | 438,518 | ||||
| Tele2 AB Class B (Communication services, Wireless telecommunication services) | 54,461 | 721,671 | ||||
| Volvo AB Class A (Industrials, Machinery) | 650 | 12,702 | ||||
| Volvo AB Class B (Industrials, Machinery) | 51,363 | 987,909 | ||||
| 18,529,889 | ||||||
| Switzerland: 8.81% | ||||||
| ABB Limited (Industrials, Electrical equipment) | 83,450 | 2,820,018 | ||||
| Adecco SA (Industrials, Professional services) | 15,346 | 724,771 | ||||
| Alcon Incorporated (Health care, Health care equipment & supplies) | 11,606 | 896,651 | ||||
| Bachem Holding AG Class B (Health care, Life sciences tools & services) | 670 | 398,734 | ||||
| Baloise Holding AG (Financials, Insurance) | 399 | 66,929 | ||||
| Barry Callebaut AG (Consumer staples, Food products) | 86 | 198,373 | ||||
| Chocoladefabriken Lindt & Sprungli AG (Participation Certificates) (Consumer staples, Food products) | 12 | 127,292 | ||||
| Chocoladefabriken Lindt & Sprungli AG (Registered Shares) (Consumer staples, Food products) | 2 | 224,490 | ||||
| Clariant AG (Materials, Chemicals) | 22,313 | 402,811 | ||||
| Coca-Cola HBC AG (Consumer staples, Beverages) | 16,773 | 426,144 | ||||
| Compagnie Financière Richemont SA (Consumer discretionary, Textiles, apparel & luxury goods) | 15,739 | 2,107,555 | ||||
| Credit Suisse Group AG (Financials, Capital markets) | 42,897 | 359,353 | ||||
| Geberit AG (Industrials, Building products) | 1,101 | 720,249 | ||||
| Givaudan SA (Materials, Chemicals) | 107 | 446,768 | ||||
| Julius Bär Gruppe AG (Financials, Capital markets) | 9,339 | 546,858 | ||||
| LafargeHolcim Limited (Materials, Construction materials) | 8,468 | 426,262 | ||||
| Lonza Group AG (Health care, Life sciences tools & services) | 496 | 343,183 | ||||
| Nestle SA (Consumer staples, Food products) | 94,287 | 12,285,192 | ||||
| Novartis AG (Health care, Pharmaceuticals) | 71,031 | 6,243,014 | ||||
| Partners Group Holding AG (Financials, Capital markets) | 1,088 | 1,470,746 | ||||
| Roche Holding AG (Health care, Pharmaceuticals) | 23,193 | 8,783,962 | ||||
| Roche Holding AG (Bearer Shares) (Health care, Pharmaceuticals) | 2,950 | 1,231,357 | ||||
| Schindler Holding AG (Industrials, Machinery) | 2,937 | 673,881 | ||||
| Sika AG (Materials, Chemicals) | 3,126 | 1,037,315 | ||||
| Sonova Holding AG (Health care, Health care equipment & supplies) | 2,193 | 849,117 | ||||
| Straumann Holding AG (Health care, Health care equipment & supplies) | 559 | 887,951 | ||||
| Swiss Life Holding AG (Financials, Insurance) | 1,472 | 898,181 | ||||
| Swiss Prime Site AG (Real estate, Real estate management & development) | 5,616 | 550,331 | ||||
| Swiss Reinsurance AG (Financials, Insurance) | 19,775 | 1,889,613 | ||||
| Swisscom AG (Communication services, Diversified telecommunication services) | 1,532 | 917,687 | ||||
| Temenos AG (Information technology, Software) | 4,818 | 484,279 | ||||
| The Swatch Group AG (Bearer Shares) (Consumer discretionary, Textiles, apparel & luxury goods) | 2,980 | 916,399 | ||||
| The Swatch Group AG (Registered Shares) (Consumer discretionary, Textiles, apparel & luxury goods) | 5,143 | 304,685 | ||||
| UBS Group AG (Financials, Capital markets) | 143,616 | 2,642,070 |
| Shares | Value | |||||
| Switzerland: (continued) | ||||||
| VAT Group AG (Industrials, Machinery) 144A | 1,672 | $ 631,840 | ||||
| Zurich Insurance Group AG (Financials, Insurance) | 4,618 | 2,119,649 | ||||
| 56,053,710 | ||||||
| United Kingdom: 12.66% | ||||||
| 3i Group plc (Financials, Capital markets) | 66,888 | 1,191,551 | ||||
| Anglo American plc (Materials, Metals & mining) | 41,953 | 2,129,607 | ||||
| Ashtead Group plc (Industrials, Trading companies & distributors) | 12,649 | 821,956 | ||||
| Associated British Foods plc (Consumer staples, Food products) | 7,312 | 187,084 | ||||
| AstraZeneca plc (Health care, Pharmaceuticals) | 47,186 | 5,735,285 | ||||
| Auto Trader Group plc (Communication services, Interactive media & services) 144A | 117,381 | 1,038,126 | ||||
| Aviva plc (Financials, Insurance) | 51,233 | 287,078 | ||||
| BAE Systems plc (Industrials, Aerospace & defense) | 185,813 | 1,783,989 | ||||
| Barclays plc (Financials, Banks) | 691,057 | 1,688,639 | ||||
| Barratt Developments plc (Consumer discretionary, Household durables) | 44,033 | 358,658 | ||||
| BP plc (Energy, Oil, gas & consumable fuels) | 835,647 | 4,073,037 | ||||
| British American Tobacco plc (Consumer staples, Tobacco) | 62,307 | 2,730,722 | ||||
| BT Group plc (Communication services, Diversified telecommunication services) | 306,322 | 764,302 | ||||
| Burberry Group plc (Consumer discretionary, Textiles, apparel & luxury goods) | 10,332 | 267,869 | ||||
| Compass Group plc (Consumer discretionary, Hotels, restaurants & leisure) | 111,382 | 2,517,573 | ||||
| Diageo plc (Consumer staples, Beverages) | 84,461 | 4,184,396 | ||||
| Entain plc (Consumer discretionary, Hotels, restaurants & leisure) † | 16,620 | 373,658 | ||||
| Ferguson plc (Industrials, Trading companies & distributors) | 5,827 | 887,906 | ||||
| GlaxoSmithKline plc (Health care, Pharmaceuticals) | 183,225 | 3,820,998 | ||||
| Glencore plc (Materials, Metals & mining) | 483,739 | 2,844,388 | ||||
| Halma plc (Information technology, Electronic equipment, instruments & components) | 5,918 | 190,879 | ||||
| Hargreaves Lansdown plc (Financials, Capital markets) | 8,500 | 128,828 | ||||
| Hikma Pharmaceuticals plc (Health care, Pharmaceuticals) | 18,438 | 513,313 | ||||
| HSBC Holdings plc (Financials, Banks) | 695,688 | 4,829,662 | ||||
| Imperial Tobacco Group plc (Consumer staples, Tobacco) | 61,223 | 1,338,718 | ||||
| Intertek Group plc (Industrials, Professional services) | 453 | 32,517 | ||||
| J Sainsbury plc (Consumer staples, Food & staples retailing) | 255,038 | 940,611 | ||||
| JD Sports Fashion plc (Consumer discretionary, Specialty retail) | 117,009 | 235,380 | ||||
| Johnson Matthey plc (Materials, Chemicals) | 6,501 | 163,367 | ||||
| Kingfisher plc (Consumer discretionary, Specialty retail) | 196,405 | 801,206 | ||||
| Land Securities Group plc (Real estate, Equity REITs) | 80,582 | 853,905 | ||||
| Legal & General Group plc (Financials, Insurance) | 231,097 | 854,464 | ||||
| Lloyds Banking Group plc (Financials, Banks) | 2,833,667 | 1,826,313 | ||||
| Mondi plc (Materials, Paper & forest products) | 13,019 | 273,158 | ||||
| National Grid plc (Utilities, Multi-utilities) | 97,887 | 1,479,990 | ||||
| NatWest Group plc (Financials, Banks) | 188,538 | 577,711 | ||||
| Next plc (Consumer discretionary, Multiline retail) | 4,510 | 412,946 | ||||
| NMC Health plc (Health care, Health care providers & services) ♦† | 7,509 | 150 | ||||
| Pearson plc (Communication services, Media) | 68,041 | 588,616 | ||||
| Persimmon plc (Consumer discretionary, Household durables) | 11,012 | 354,405 | ||||
| Prudential plc (Financials, Insurance) | 41,297 | 624,347 | ||||
| Reckitt Benckiser Group plc (Consumer staples, Household products) | 14,603 | 1,236,540 | ||||
| RELX plc (Industrials, Professional services) | 57,051 | 1,737,374 | ||||
| Rio Tinto plc (Materials, Metals & mining) | 33,455 | 2,615,914 | ||||
| Rolls-Royce Holdings plc (Industrials, Aerospace & defense) † | 1,058,221 | 1,459,774 | ||||
| Schroders plc (Financials, Capital markets) | 4,846 | 198,386 | ||||
| Segro plc (Real estate, Equity REITs) | 29,164 | 507,192 |
| Shares | Value | |||||
| United Kingdom: (continued) | ||||||
| Shell plc (Energy, Oil, gas & consumable fuels) | 205,459 | $ 5,418,116 | ||||
| Spirax-Sarco Engineering plc (Industrials, Machinery) | 2,250 | 358,548 | ||||
| SSE plc (Utilities, Electric utilities) | 23,779 | 539,658 | ||||
| St. James's Place plc (Financials, Capital markets) | 4,976 | 93,290 | ||||
| Standard Chartered plc (Financials, Banks) | 93,556 | 666,736 | ||||
| Taylor Wimpey plc (Consumer discretionary, Household durables) | 177,810 | 356,649 | ||||
| Tesco plc (Consumer staples, Food & staples retailing) | 439,316 | 1,701,891 | ||||
| The British Land Company plc (Real estate, Equity REITs) | 141,550 | 1,000,294 | ||||
| The Sage Group plc (Information technology, Software) | 145,679 | 1,366,679 | ||||
| Unilever plc (London Exchange) (Consumer staples, Personal products) | 89,897 | 4,515,703 | ||||
| United Utilities Group plc (Utilities, Water utilities) | 8,446 | 121,223 | ||||
| Vodafone Group plc (Communication services, Wireless telecommunication services) | 818,491 | 1,440,821 | ||||
| WPP plc (Communication services, Media) | 40,686 | 572,244 | ||||
| 80,614,340 | ||||||
| United States: 0.29% | ||||||
| Venture Corporation Limited (Information technology, Electronic equipment, instruments & components) | 9,900 | 129,139 | ||||
| West Fraser Timber Company Limited (Industrials, Professional services) | 17,100 | 1,706,897 | ||||
| 1,836,036 | ||||||
| Total Common stocks (Cost $544,498,277) | 616,116,380 |
| Dividend yield | ||||||
| Preferred stocks: 0.49% | ||||||
| Germany: 0.49% | ||||||
| Bayerische Motoren Werke AG (Consumer discretionary, Automobiles) | 2.87% | 5,934 | 479,871 | |||
| Fuchs Petrolub SE (Materials, Chemicals) | 3.01 | 14,745 | 582,585 | |||
| Henkel AG & Company KGaA (Consumer staples, Household products) | 2.81 | 15,586 | 1,237,025 | |||
| Porsche Automobil Holding SE (Consumer discretionary, Automobiles) | 2.62 | 8,016 | 800,063 | |||
| 3,099,544 | ||||||
| Total Preferred stocks (Cost $3,379,480) | 3,099,544 |
| Yield | ||||||
| Short-term investments: 1.25% | ||||||
| Investment companies: 1.25% | ||||||
| Allspring Government Money Market Fund Select Class ♠∞ | 0.03 | 7,971,045 | 7,971,045 | |||
| Total Short-term investments (Cost $7,971,045) | 7,971,045 | |||||
| Total investments in securities (Cost $555,848,802) | 98.53% | 627,186,969 | ||||
| Other assets and liabilities, net | 1.47 | 9,344,408 | ||||
| Total net assets | 100.00% | $636,531,377 |
| † | Non-income-earning security |
| 144A | The security may be resold in transactions exempt from registration, normally to qualified institutional buyers, pursuant to Rule 144A under the Securities Act of 1933. |
| ♦ | The security is fair valued in accordance with procedures approved by the Board of Trustees. |
| ♠ | The issuer of the security is an affiliated person of the Portfolio as defined in the Investment Company Act of 1940. |
| ∞ | The rate represents the 7-day annualized yield at period end. |
| Abbreviations: | |
| REIT | Real estate investment trust |
| Value, beginning of period | Purchases | Sales proceeds | Net realized gains (losses) | Net change in unrealized gains (losses) | Value, end of period | Shares, end of period | Income from affiliated securities | |
| Short-term investments | ||||||||
| Allspring Government Money Market Fund Select Class | $13,944,761 | $174,025,895 | $(179,999,611) | $0 | $0 | $7,971,045 | 7,971,045 | $4,413 |
| Description | Number of contracts | Expiration date | Notional cost | Notional value | Unrealized gains | Unrealized losses |
| Long | ||||||
| MSCI EAFE Index | 145 | 3-18-2022 | $16,007,996 | $15,658,550 | $0 | $(349,446) |
| Assets | |
Investments in unaffiliated securities, at value (cost $547,877,757) | $ 619,215,924 |
Investments in affiliated securities, at value (cost $7,971,045) | 7,971,045 |
Cash at broker segregated for futures contracts | 3,374,220 |
Foreign currency, at value (cost $3,771,146) | 3,810,166 |
Receivable for dividends | 2,743,770 |
Prepaid expenses and other assets | 8,792 |
Total assets | 637,123,917 |
| Liabilities | |
Payable for daily variation margin on open futures contracts | 312,948 |
Custody and accounting fees payable | 164,358 |
Advisory fee payable | 52,024 |
Professional fees payable | 43,322 |
Trustees’ fees and expenses payable | 2,357 |
Accrued expenses and other liabilities | 17,531 |
Total liabilities | 592,540 |
Total net assets | $636,531,377 |
| Investment income | |
Dividends (net of foreign withholdings taxes of $2,569,210) | $ 20,286,165 |
Income from affiliated securities | 4,413 |
Total investment income | 20,290,578 |
| Expenses | |
Advisory fee | 1,059,508 |
Custody and accounting fees | 227,383 |
Professional fees | 57,817 |
Interest holder report expenses | 21,409 |
Trustees’ fees and expenses | 19,328 |
Other fees and expenses | 44,037 |
Total expenses | 1,429,482 |
Less: Fee waivers and/or expense reimbursements | (320,531) |
Net expenses | 1,108,951 |
Net investment income | 19,181,627 |
| Realized and unrealized gains (losses) on investments | |
| Net realized gains (losses) on | |
Unaffiliated securities | 72,435,247 |
Foreign currency and foreign currency translations | (200,243) |
Futures contracts | 1,937,088 |
Net realized gains on investments | 74,172,092 |
| Net change in unrealized gains (losses) on | |
Unaffiliated securities | (54,559,122) |
Foreign currency and foreign currency translations | 59,645 |
Futures contracts | (698,900) |
Net change in unrealized gains (losses) on investments | (55,198,377) |
Net realized and unrealized gains (losses) on investments | 18,973,715 |
Net increase in net assets resulting from operations | $ 38,155,342 |
| Year ended February 28, 2022 | Year ended February 28, 2021 | |
| Operations | ||
Net investment income | $ 19,181,627 | $ 13,815,670 |
Net realized gains on investments | 74,172,092 | 7,915,170 |
Net change in unrealized gains (losses) on investments | (55,198,377) | 114,970,151 |
Net increase in net assets resulting from operations | 38,155,342 | 136,700,991 |
| Capital transactions | ||
| Transactions in investors’ beneficial interests | ||
Contributions | 111,767,336 | 220,263,714 |
Withdrawals | (191,154,689) | (265,046,603) |
Net decrease in net assets resulting from capital transactions | (79,387,353) | (44,782,889) |
Total increase (decrease) in net assets | (41,232,011) | 91,918,102 |
| Net assets | ||
Beginning of period | 677,763,388 | 585,845,286 |
End of period | $ 636,531,377 | $ 677,763,388 |
| Year ended February 28 | |||||
| 2022 | 2021 | 2020 1 | 2019 | 2018 2 | |
Total return3 | 5.25% | 22.14% | 1.23% | (2.91)% | 8.99% |
| Ratios to average net assets (annualized) | |||||
Gross expenses | 0.20% | 0.22% | 0.24% | 0.23% | 0.21% |
Net expenses | 0.16% * | 0.16% * | 0.19% | 0.20% | 0.21% |
Net investment income | 2.72% | 2.25% | 2.58% | 3.03% | 1.74% |
| Supplemental data | |||||
Portfolio turnover rate | 70% | 92% | 44% | 47% | 106% |
| * | Ratio includes expenses which were voluntarily waived by the adviser. Without these voluntary waivers, the net expense ratios would be increased by the following amounts: |
| Year ended February 28, 2022 | 0.04% |
| Year ended February 28, 2021 | 0.06% |
| 1 | Year ended February 29 |
| 2 | For the period from May 23, 2017 (commencement of operations) to February 28, 2018 |
| 3 | Returns for periods of less than one year are not annualized. |
| Gross unrealized gains | $ 94,123,908 |
| Gross unrealized losses | (31,178,308) |
| Net unrealized gains | $ 62,945,600 |
| ■ | Level 1 – quoted prices in active markets for identical securities |
| ■ | Level 2 – other significant observable inputs (including quoted prices for similar securities, interest rates, prepayment speeds, credit risk, etc.) |
| ■ | Level 3 – significant unobservable inputs (including the Portfolio’s own assumptions in determining the fair value of investments) |
| Quoted prices (Level 1) | Other significant observable inputs (Level 2) | Significant unobservable inputs (Level 3) | Total | |
| Assets | ||||
| Investments in: | ||||
| Common stocks | ||||
| Australia | $ 0 | $ 35,631,636 | $0 | $ 35,631,636 |
| Austria | 0 | 1,053,619 | 0 | 1,053,619 |
| Belgium | 0 | 5,471,653 | 0 | 5,471,653 |
| Canada | 72,971,814 | 0 | 0 | 72,971,814 |
| Denmark | 0 | 15,654,139 | 0 | 15,654,139 |
| Finland | 0 | 7,494,597 | 0 | 7,494,597 |
| France | 0 | 53,825,694 | 0 | 53,825,694 |
| Germany | 307,041 | 39,511,336 | 0 | 39,818,377 |
| Hong Kong | 755,664 | 18,272,642 | 0 | 19,028,306 |
| Ireland | 0 | 2,947,534 | 0 | 2,947,534 |
| Israel | 2,231,380 | 5,121,667 | 0 | 7,353,047 |
| Italy | 0 | 8,908,437 | 0 | 8,908,437 |
| Japan | 0 | 128,753,453 | 0 | 128,753,453 |
| Luxembourg | 0 | 2,293,102 | 0 | 2,293,102 |
| Netherlands | 0 | 27,760,237 | 0 | 27,760,237 |
| New Zealand | 0 | 1,494,360 | 0 | 1,494,360 |
| Norway | 0 | 6,832,323 | 0 | 6,832,323 |
| Portugal | 0 | 1,376,804 | 0 | 1,376,804 |
| Singapore | 0 | 7,332,083 | 0 | 7,332,083 |
| Spain | 0 | 13,081,190 | 0 | 13,081,190 |
| Sweden | 0 | 18,529,889 | 0 | 18,529,889 |
| Switzerland | 0 | 56,053,710 | 0 | 56,053,710 |
| United Kingdom | 0 | 80,614,340 | 0 | 80,614,340 |
| United States | 1,706,897 | 129,139 | 0 | 1,836,036 |
| Preferred stocks | ||||
| Germany | 0 | 3,099,544 | 0 | 3,099,544 |
| Short-term investments | ||||
| Investment companies | 7,971,045 | 0 | 0 | 7,971,045 |
| Total assets | $85,943,841 | $541,243,128 | $0 | $627,186,969 |
| Liabilities | ||||
| Futures contracts | $ 349,446 | $ 0 | $0 | $ 349,446 |
| Total liabilities | $ 349,446 | $ 0 | $0 | $ 349,446 |
| Average daily net assets | Advisory fee |
| First $5 billion | 0.150% |
| Next $5 billion | 0.130 |
| Over $10 billion | 0.110 |
Allspring Master Trust:

| Name and year of birth | Position held and length of service* | Principal occupations during past five years or longer | Current other public company or investment company directorships |
| William R. Ebsworth (Born 1957) | Trustee, since 2015 | Retired. From 1984 to 2013, equities analyst, portfolio manager, research director and chief investment officer at Fidelity Management and Research Company in Boston, Tokyo, and Hong Kong, and retired in 2013 as Chief Investment Officer of Fidelity Strategic Advisers, Inc. where he led a team of investment professionals managing client assets. Prior thereto, Board member of Hong Kong Securities Clearing Co., Hong Kong Options Clearing Corp., the Thailand International Fund, Ltd., Fidelity Investments Life Insurance Company, and Empire Fidelity Investments Life Insurance Company. Audit Committee Chair and Investment Committee Chair of the Vincent Memorial Hospital Endowment (non-profit organization). Mr. Ebsworth is a CFA® charterholder. | N/A |
| Jane A. Freeman (Born 1953) | Trustee, since 2015; Chair Liaison, since 2018 | Retired. From 2012 to 2014 and 1999 to 2008, Chief Financial Officer of Scientific Learning Corporation. From 2008 to 2012, Ms. Freeman provided consulting services related to strategic business projects. Prior to 1999, Portfolio Manager at Rockefeller & Co. and Scudder, Stevens & Clark. Board member of the Harding Loevner Funds from 1996 to 2014, serving as both Lead Independent Director and chair of the Audit Committee. Board member of the Russell Exchange Traded Funds Trust from 2011 to 2012 and the chair of the Audit Committee. Ms. Freeman is also an inactive Chartered Financial Analyst. | N/A |
| Isaiah Harris, Jr. (Born 1952) | Trustee, since 2009; Audit Committee Chair, since 2019 | Retired. Chairman of the Board of CIGNA Corporation from 2009 to 2021, and Director from 2005 to 2008. From 2003 to 2011, Director of Deluxe Corporation. Prior thereto, President and CEO of BellSouth Advertising and Publishing Corp. from 2005 to 2007, President and CEO of BellSouth Enterprises from 2004 to 2005 and President of BellSouth Consumer Services from 2000 to 2003. Emeritus member of the Iowa State University Foundation Board of Governors. Emeritus Member of the Advisory Board of Iowa State University School of Business. Advisory Board Member, Palm Harbor Academy (private school). Advisory Board Member, Fellowship of Christian Athletes. Mr. Harris is a certified public accountant (inactive status). | N/A |
| David F. Larcker (Born 1950) | Trustee, since 2009 | James Irvin Miller Professor of Accounting at the Graduate School of Business (Emeritus), Stanford University, Director of the Corporate Governance Research Initiative and Senior Faculty of The Rock Center for Corporate Governance since 2006. From 2005 to 2008, Professor of Accounting at the Graduate School of Business, Stanford University. Prior thereto, Ernst & Young Professor of Accounting at The Wharton School, University of Pennsylvania from 1985 to 2005. | N/A |
| Name and year of birth | Position held and length of service* | Principal occupations during past five years or longer | Current other public company or investment company directorships |
| Olivia S. Mitchell (Born 1953) | Trustee, since 2006; Nominating and Governance Committee Chair, since 2018 | International Foundation of Employee Benefit Plans Professor since 1993, Wharton School of the University of Pennsylvania. Director of Wharton’s Pension Research Council and Boettner Center on Pensions & Retirement Research, and Research Associate at the National Bureau of Economic Research. Previously taught at Cornell University from 1978 to 1993. | N/A |
| Timothy J. Penny (Born 1951) | Trustee, since 1996; Chair, since 2018 | President and Chief Executive Officer of Southern Minnesota Initiative Foundation, a non-profit organization, since 2007. Member of the Board of Trustees of NorthStar Education Finance, Inc., a non-profit organization, since 2007. | N/A |
| James G. Polisson (Born 1959) | Trustee, since 2018 | Retired. Chief Marketing Officer, Source (ETF) UK Services, Ltd, from 2015 to 2017. From 2012 to 2015, Principal of The Polisson Group, LLC, a management consulting, corporate advisory and principal investing company. Chief Executive Officer and Managing Director at Russell Investments, Global Exchange Traded Funds from 2010 to 2012. Managing Director of Barclays Global Investors from 1998 to 2010 and Global Chief Marketing Officer for iShares and Barclays Global Investors from 2000 to 2010. Trustee of the San Francisco Mechanics’ Institute, a non-profit organization, from 2013 to 2015. Board member of the Russell Exchange Traded Fund Trust from 2011 to 2012. Director of Barclays Global Investors Holdings Deutschland GmbH from 2006 to 2009. Mr. Polisson is an attorney and has a retired status with the Massachusetts and District of Columbia Bar Associations. | N/A |
| Pamela Wheelock (Born 1959) | Trustee, since January 2020; previously Trustee from January 2018 to July 2019 | Board member of the Destination Medical Center Economic Development Agency, Rochester, Minnesota since 2019. Interim President of the McKnight Foundation from January to September 2020. McKnight Foundation Consultant, November 2020 to February 2021. Acting Commissioner, Minnesota Department of Human Services, July 2019 through September 2019. Consultant (part-time), Minnesota Department of Human Services, October 2019 through December 2019. Chief Operating Officer, Twin Cities Habitat for Humanity from 2017 to 2019. Vice President of University Services, University of Minnesota from 2012 to 2016. Prior thereto, on the Board of Directors, Governance Committee and Finance Committee for the Minnesota Philanthropy Partners (Saint Paul Foundation) from 2012 to 2018, Interim Chief Executive Officer of Blue Cross Blue Shield of Minnesota from 2011 to 2012, Chairman of the Board from 2009 to 2012 and Board Director from 2003 to 2015. Vice President, Leadership and Community Engagement, Bush Foundation, Saint Paul, Minnesota (a private foundation) from 2009 to 2011. Executive Vice President and Chief Financial Officer, Minnesota Sports and Entertainment from 2004 to 2009 and Senior Vice President from 2002 to 2004. Executive Vice President of the Minnesota Wild Foundation from 2004 to 2008. Commissioner of Finance, State of Minnesota, from 1999 to 2002. Currently Board Chair of the Minnesota Wild Foundation since 2010. | N/A |
| Name and year of birth | Position held and length of service | Principal occupations during past five years or longer |
| Andrew Owen (Born 1960) | President, since 2017 | President, Chief Executive Officer and Director of Allspring Funds Management, LLC since 2017 and co-president of Galliard Capital Management, LLC, an affiliate of Allspring Funds Management, LLC, since 2019. Prior thereto, Head of Affiliated Managers, Allspring Global Investments, from 2014 to 2019 and Executive Vice President responsible for marketing, investments and product development for Allspring Funds Management, LLC, from 2009 to 2014. In addition, Mr. Owen was an Executive Vice President of Wells Fargo & Company from 2014 to 2021. |
| Jeremy DePalma (Born 1974) | Treasurer, since 2012 (for certain funds in the Fund Complex); since 2021 (for the remaining funds in the Fund Complex) | Senior Vice President of Allspring Funds Management, LLC since 2009. Senior Vice President of Evergreen Investment Management Company, LLC from 2008 to 2010 and head of the Fund Reporting and Control Team within Fund Administration from 2005 to 2010. |
| Kate McKinley (Born 1977) | Chief Legal Officer, since 2021 | Chief Legal Officer of Allspring Global Investments since 2021. Prior thereto, held various roles at State Street Global Advisors beginning in 2010, including serving as Senior Vice President and General Counsel from 2019 to 2021, and Chief Operating Officer of the Institutional Client Group from 2016 - 2019. Prior to working at State Street Global Advisors served as Assistant General Counsel for Bank of America Corporation from 2005 to 2010 and as an Associate at WilmerHale from 2002 to 2005. |
| Christopher Baker (Born 1976) | Chief Compliance Officer, since 2022 | Global Chief Compliance Officer for Allspring Global Investments since 2022. Prior thereto, Chief Compliance Officer for State Street Global Advisors from 2018 to 2021. Senior Compliance Officer for the State Street divisions of Alternative Investment Solutions, Sector Solutions, and Global Marketing from 2015 to 2018. From 2010 to 2015 Vice President, Global Head of Investment and Marketing Compliance for State Street Global Advisors. |
| Matthew Prasse (Born 1983) | Secretary, since 2021 | Senior Counsel of the Allspring Legal Department since 2021. Senior Counsel of the Wells Fargo Legal Department from 2018 to 2021. Previously, Counsel for Barings LLC from 2015 to 2018. Prior to joining Barings, Associate at Morgan, Lewis & Bockius LLP from 2008 to 2015. |
P.O. Box 219967
Kansas City, MO 64121-9967
1-800-222-8222. Read the prospectus carefully before you invest or send money.

U.S. Large Cap Equity Portfolio
| Investment objective | The Portfolio seeks long-term capital appreciation. |
| Adviser | Allspring Funds Management, LLC |
| Subadviser | Allspring Global Investments, LLC |
| Portfolio managers | Dennis Bein, CFA®‡†, Harindra de Silva, Ph.D., CFA®‡, Monisha Jayakumar |
| Ten largest holdings (%) as of February 28, 20221 | |
| Apple Incorporated | 5.70 |
| Microsoft Corporation | 5.55 |
| Amazon.com Incorporated | 3.01 |
| Alphabet Incorporated Class A | 2.13 |
| Alphabet Incorporated Class C | 1.93 |
| Berkshire Hathaway Incorporated Class B | 1.42 |
| Tesla Motors Incorporated | 1.37 |
| NVIDIA Corporation | 1.35 |
| Meta Platforms Incorporated Class A | 1.15 |
| UnitedHealth Group Incorporated | 1.06 |
| 1 | Figures represent the percentage of the Portfolio's net assets. Holdings are subject to change and may have changed since the date specified. |
| Sector allocation as of February 28, 20221 |
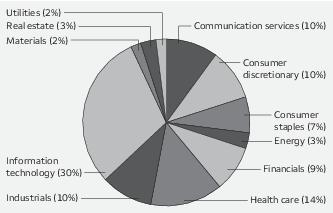
| 1 | Figures represent the percentage of the Portfolio's long-term investments. These amounts are subject to change and may have changed since the date specified. |
| ‡ | CFA® and Chartered Financial Analyst® are trademarks owned by CFA Institute. |
| † | Mr. Bein is expected to retire on September 30, 2022. He will remain a portfolio manager of the Portfolio through June 30, 2022, at which time he will transition to the role of advisor to the team until his retirement. |
| Shares | Value | ||||
| Common stocks: 97.14% | |||||
| Communication services: 9.37% | |||||
| Diversified telecommunication services: 0.91% | |||||
| AT&T Incorporated | 133,480 | $ 3,162,141 | |||
| Lumen Technologies Incorporated | 19,605 | 203,108 | |||
| Verizon Communications Incorporated | 64,617 | 3,467,994 | |||
| 6,833,243 | |||||
| Entertainment: 1.63% | |||||
| Activision Blizzard Incorporated | 11,554 | 941,651 | |||
| Electronic Arts Incorporated | 5,834 | 758,945 | |||
| Netflix Incorporated † | 7,884 | 3,110,396 | |||
| Playtika Holding Corporation † | 28,973 | 596,844 | |||
| Roku Incorporated † | 1,845 | 257,433 | |||
| Spotify Technology † | 2,277 | 355,645 | |||
| Take-Two Interactive Software Incorporated † | 1,927 | 312,174 | |||
| The Madison Square Garden Company Class A † | 331 | 57,263 | |||
| The Walt Disney Company † | 31,493 | 4,675,451 | |||
| World Wrestling Entertainment Incorporated Class A | 17,571 | 1,041,257 | |||
| Zynga Incorporated Class A † | 17,789 | 161,524 | |||
| 12,268,583 | |||||
| Interactive media & services: 5.43% | |||||
| Alphabet Incorporated Class A † | 5,911 | 15,966,439 | |||
| Alphabet Incorporated Class C † | 5,373 | 14,495,387 | |||
| Match Group Incorporated † | 9,160 | 1,021,248 | |||
| Meta Platforms Incorporated Class A † | 40,860 | 8,622,686 | |||
| Pinterest Incorporated Class A † | 10,019 | 268,008 | |||
| TripAdvisor Incorporated † | 13,395 | 340,769 | |||
| Twitter Incorporated † | 2,001 | 71,136 | |||
| Zillow Group Incorporated Class A † | 80 | 4,582 | |||
| 40,790,255 | |||||
| Media: 1.19% | |||||
| Altice USA Incorporated † | 3,655 | 42,252 | |||
| Charter Communications Incorporated Class A † | 2,083 | 1,253,508 | |||
| Comcast Corporation Class A | 55,946 | 2,616,035 | |||
| Discovery Incorporated Class A † | 2,923 | 81,990 | |||
| Discovery Incorporated Class C † | 5,598 | 156,576 | |||
| Fox Corporation Class A | 16,435 | 687,476 | |||
| Interpublic Group of Companies Incorporated | 29,757 | 1,095,058 | |||
| Loyalty Ventures Incorporated † | 4,510 | 108,240 | |||
| News Corporation Class A | 18,691 | 417,183 | |||
| News Corporation Class B | 16,690 | 374,357 | |||
| Nexstar Media Group Incorporated Class A | 5,137 | 950,602 | |||
| Omnicom Group Incorporated | 6,763 | 567,348 | |||
| Sirius XM Holdings Incorporated | 89,342 | 550,347 | |||
| ViacomCBS Incorporated Class B | 1 | 31 | |||
| 8,901,003 | |||||
| Wireless telecommunication services: 0.21% | |||||
| T-Mobile US Incorporated † | 12,703 | 1,565,137 |
| Shares | Value | ||||
| Consumer discretionary: 9.95% | |||||
| Auto components: 0.16% | |||||
| Aptiv plc † | 5,462 | $ 707,001 | |||
| BorgWarner Incorporated | 4,267 | 174,990 | |||
| Gentex Corporation | 4,314 | 130,585 | |||
| Lear Corporation | 1,069 | 168,196 | |||
| 1,180,772 | |||||
| Automobiles: 1.80% | |||||
| Ford Motor Company | 94,266 | 1,655,311 | |||
| General Motors Company † | 25,321 | 1,182,997 | |||
| Tesla Motors Incorporated † | 11,842 | 10,307,632 | |||
| Thor Industries Incorporated | 4,175 | 377,838 | |||
| 13,523,778 | |||||
| Distributors: 0.07% | |||||
| Genuine Parts Company | 1,241 | 151,601 | |||
| LKQ Corporation | 8,545 | 401,188 | |||
| 552,789 | |||||
| Diversified consumer services: 0.10% | |||||
| Frontdoor Incorporated † | 19,537 | 587,087 | |||
| Grand Canyon Education Incorporated † | 866 | 75,195 | |||
| H&R Block Incorporated | 4,581 | 113,655 | |||
| 775,937 | |||||
| Hotels, restaurants & leisure: 2.19% | |||||
| Aramark | 4,028 | 148,875 | |||
| Booking Holdings Incorporated † | 453 | 984,029 | |||
| Boyd Gaming Corporation † | 16,479 | 1,169,020 | |||
| Chipotle Mexican Grill Incorporated † | 655 | 997,794 | |||
| Choice Hotels International Incorporated | 4,606 | 664,876 | |||
| Churchill Downs Incorporated | 559 | 134,646 | |||
| Darden Restaurants Incorporated | 6,099 | 885,697 | |||
| Domino's Pizza Incorporated | 2,805 | 1,212,349 | |||
| Expedia Group Incorporated † | 1,974 | 387,121 | |||
| Hilton Worldwide Holdings Incorporated † | 2,481 | 369,322 | |||
| Marriott International Incorporated Class A † | 4,226 | 719,012 | |||
| Marriott Vacations Worldwide Corporation | 2,021 | 324,714 | |||
| McDonald's Corporation | 12,026 | 2,943,604 | |||
| Six Flags Entertainment Corporation † | 13,261 | 578,975 | |||
| Starbucks Corporation | 20,493 | 1,881,052 | |||
| The Wendy's Company | 19,471 | 442,771 | |||
| Travel Leisure Company | 1,576 | 88,335 | |||
| Wyndham Hotels & Resorts Incorporated | 5,835 | 504,202 | |||
| Yum China Holdings Incorporated | 7,726 | 401,907 | |||
| Yum! Brands Incorporated | 12,876 | 1,578,340 | |||
| 16,416,641 | |||||
| Household durables: 0.04% | |||||
| Lennar Corporation Class A | 528 | 47,457 | |||
| Newell Rubbermaid Incorporated | 234 | 5,558 | |||
| Tempur-Pedic International Incorporated | 7,119 | 234,998 | |||
| Whirlpool Corporation | 159 | 32,002 | |||
| 320,015 |
| Shares | Value | ||||
| Internet & direct marketing retail: 3.12% | |||||
| Amazon.com Incorporated † | 7,363 | $ 22,613,687 | |||
| eBay Incorporated | 10,534 | 575,051 | |||
| Etsy Incorporated † | 287 | 44,453 | |||
| Wayfair Incorporated Class A † | 1,365 | 192,288 | |||
| 23,425,479 | |||||
| Leisure products: 0.24% | |||||
| Mattel Incorporated † | 33,556 | 838,229 | |||
| Polaris Industries Incorporated | 995 | 120,902 | |||
| The Brunswick Corporation | 7,597 | 725,665 | |||
| YETI Holdings Incorporated † | 1,857 | 114,317 | |||
| 1,799,113 | |||||
| Multiline retail: 0.39% | |||||
| Dollar General Corporation | 1,368 | 271,329 | |||
| Kohl's Corporation | 12,898 | 717,387 | |||
| Nordstrom Incorporated † | 1,912 | 39,655 | |||
| Target Corporation | 9,590 | 1,915,794 | |||
| 2,944,165 | |||||
| Specialty retail: 1.64% | |||||
| AutoNation Incorporated † | 13,013 | 1,492,071 | |||
| Bath & Body Works Incorporated | 4,349 | 232,106 | |||
| Best Buy Company Incorporated | 3,414 | 329,929 | |||
| Dick's Sporting Goods Incorporated | 6,847 | 718,935 | |||
| Foot Locker Incorporated | 1,565 | 49,485 | |||
| Lithia Motors Incorporated Class A | 760 | 259,023 | |||
| Lowe's Companies Incorporated | 9,769 | 2,159,535 | |||
| O'Reilly Automotive Incorporated † | 42 | 27,268 | |||
| Penske Auto Group Incorporated | 10,553 | 1,037,254 | |||
| Petco Health & Wellness Company † | 6,633 | 116,210 | |||
| The Gap Incorporated | 3,538 | 51,478 | |||
| The Home Depot Incorporated | 16,171 | 5,107,287 | |||
| The TJX Companies Incorporated | 2,501 | 165,316 | |||
| Tractor Supply Company | 326 | 66,436 | |||
| Ulta Beauty Incorporated † | 289 | 108,231 | |||
| Victoria's Secret Corporation † | 1,297 | 69,558 | |||
| Williams-Sonoma Incorporated | 1,981 | 286,968 | |||
| 12,277,090 | |||||
| Textiles, apparel & luxury goods: 0.20% | |||||
| Capri Holdings Limited † | 3,001 | 203,288 | |||
| Deckers Outdoor Corporation † | 264 | 76,201 | |||
| HanesBrands Incorporated | 16,761 | 258,957 | |||
| Skechers USA Incorporated Class A † | 2,296 | 105,570 | |||
| Tapestry Incorporated | 3,711 | 151,780 | |||
| Under Armour Incorporated Class A † | 24,192 | 432,795 | |||
| Under Armour Incorporated Class C † | 15,108 | 236,138 | |||
| 1,464,729 | |||||
| Consumer staples: 6.51% | |||||
| Beverages: 1.57% | |||||
| Boston Beer Company Incorporated Class A † | 172 | 65,955 | |||
| Constellation Brands Incorporated Class A | 3,023 | 651,819 |
| Shares | Value | ||||
| Beverages (continued) | |||||
| Keurig Dr. Pepper Incorporated | 16,790 | $ 649,269 | |||
| Molson Coors Brewing Company Class B | 22,365 | 1,167,006 | |||
| Monster Beverage Corporation † | 6,610 | 557,884 | |||
| PepsiCo Incorporated | 26,775 | 4,384,139 | |||
| The Coca-Cola Company | 69,520 | 4,326,925 | |||
| 11,802,997 | |||||
| Food & staples retailing: 1.37% | |||||
| Albertsons Companies LLC | 25,850 | 753,528 | |||
| Costco Wholesale Corporation | 7,960 | 4,133,230 | |||
| Sysco Corporation | 3,913 | 340,822 | |||
| The Kroger Company | 31,573 | 1,477,616 | |||
| US Foods Holding Corporation † | 3,875 | 151,474 | |||
| Walgreens Boots Alliance Incorporated | 12,318 | 567,737 | |||
| Walmart Incorporated | 20,987 | 2,836,603 | |||
| 10,261,010 | |||||
| Food products: 1.63% | |||||
| Archer Daniels Midland Company | 21,625 | 1,696,481 | |||
| Bunge Limited | 17,429 | 1,822,202 | |||
| Campbell Soup Company | 3,519 | 158,249 | |||
| ConAgra Foods Incorporated | 4,138 | 144,706 | |||
| Darling Ingredients Incorporated † | 9,365 | 678,775 | |||
| Flowers Foods Incorporated | 33,971 | 931,145 | |||
| General Mills Incorporated | 3,728 | 251,379 | |||
| Hain Celestial Group Incorporated † | 12,321 | 447,992 | |||
| Ingredion Incorporated | 5,574 | 494,637 | |||
| Kellogg Company | 5,609 | 358,639 | |||
| Mondelez International Incorporated Class A | 13,037 | 853,663 | |||
| Pilgrim's Pride Corporation † | 48,363 | 1,140,400 | |||
| Post Holdings Incorporated † | 1,018 | 107,033 | |||
| Seaboard Corporation | 32 | 123,503 | |||
| The Hershey Company | 4,091 | 827,446 | |||
| The J.M. Smucker Company | 3,067 | 413,278 | |||
| The Kraft Heinz Company | 4,786 | 187,707 | |||
| Tyson Foods Incorporated Class A | 17,592 | 1,630,075 | |||
| 12,267,310 | |||||
| Household products: 1.25% | |||||
| Church & Dwight Company Incorporated | 1,601 | 156,658 | |||
| Colgate-Palmolive Company | 19,248 | 1,481,134 | |||
| Kimberly-Clark Corporation | 5,918 | 770,228 | |||
| Reynolds Consumer Products Incorporated | 1,005 | 29,919 | |||
| Spectrum Brands Holdings Incorporated | 735 | 68,193 | |||
| The Clorox Company | 572 | 83,392 | |||
| The Procter & Gamble Company | 43,625 | 6,800,701 | |||
| 9,390,225 | |||||
| Personal products: 0.08% | |||||
| Herbalife Nutrition Limited † | 1,938 | 68,954 | |||
| The Estee Lauder Companies Incorporated Class A | 1,718 | 509,095 | |||
| 578,049 |
| Shares | Value | ||||
| Tobacco: 0.61% | |||||
| Altria Group Incorporated | 32,990 | $ 1,692,057 | |||
| Philip Morris International Incorporated | 28,142 | 2,844,312 | |||
| 4,536,369 | |||||
| Energy: 2.88% | |||||
| Energy equipment & services: 0.14% | |||||
| Baker Hughes Incorporated | 12,154 | 357,085 | |||
| Schlumberger Limited | 17,676 | 693,606 | |||
| 1,050,691 | |||||
| Oil, gas & consumable fuels: 2.74% | |||||
| Antero Midstream Corporation | 23,715 | 238,099 | |||
| APA Corporation | 29,055 | 1,035,230 | |||
| Cabot Oil & Gas Corporation | 14,125 | 329,536 | |||
| Cheniere Energy Incorporated | 4,466 | 593,531 | |||
| Chevron Corporation | 31,243 | 4,498,992 | |||
| ConocoPhillips | 12,840 | 1,218,002 | |||
| Continental Resources Incorporated | 5,238 | 290,342 | |||
| Devon Energy Corporation | 1,595 | 94,982 | |||
| Diamondback Energy Incorporated | 3,660 | 505,446 | |||
| EOG Resources Incorporated | 8,535 | 980,842 | |||
| Exxon Mobil Corporation | 79,645 | 6,245,761 | |||
| Marathon Oil Corporation | 9,527 | 214,929 | |||
| Marathon Petroleum Corporation | 17,498 | 1,362,569 | |||
| Occidental Petroleum Corporation | 4,005 | 175,139 | |||
| ONEOK Incorporated | 6,117 | 399,440 | |||
| Phillips 66 | 7,738 | 651,849 | |||
| Targa Resources Corporation | 17,657 | 1,154,238 | |||
| Valero Energy Corporation | 7,279 | 607,869 | |||
| 20,596,796 | |||||
| Financials: 9.12% | |||||
| Banks: 2.99% | |||||
| Bank of America Corporation | 116,801 | 5,162,604 | |||
| Bank of Hawaii Corporation | 409 | 35,248 | |||
| Bank OZK | 11,657 | 548,112 | |||
| BOK Financial Corporation | 3,888 | 399,298 | |||
| Citigroup Incorporated | 31,930 | 1,891,214 | |||
| Citizens Financial Group Incorporated | 6,638 | 347,964 | |||
| Fifth Third Bancorp | 8,698 | 416,112 | |||
| First Citizens BancShares Corporation Class A | 107 | 84,364 | |||
| First Hawaiian Incorporated | 3,119 | 90,669 | |||
| First Republic Bank | 436 | 75,541 | |||
| FNB Corporation | 36,563 | 491,041 | |||
| Huntington Bancshares Incorporated | 4,444 | 68,971 | |||
| JPMorgan Chase & Company | 50,362 | 7,141,332 | |||
| KeyCorp | 8,762 | 219,663 | |||
| M&T Bank Corporation | 736 | 134,121 | |||
| PacWest Bancorp | 6,934 | 342,678 | |||
| Pinnacle Financial Partners Incorporated | 2,618 | 264,627 | |||
| PNC Financial Services Group Incorporated | 5,436 | 1,083,123 | |||
| Popular Incorporated | 4,885 | 448,687 | |||
| Regions Financial Corporation | 11,841 | 286,434 | |||
| SVB Financial Group † | 145 | 87,870 |
| Shares | Value | ||||
| Banks (continued) | |||||
| Synovus Financial Corporation | 5,343 | $ 281,309 | |||
| Truist Financial Corporation | 15,984 | 994,524 | |||
| US Bancorp | 20,859 | 1,179,368 | |||
| Webster Financial Corporation | 1,580 | 95,132 | |||
| Wintrust Financial Corporation | 1,688 | 167,720 | |||
| Zions Bancorporation | 1,258 | 89,180 | |||
| 22,426,906 | |||||
| Capital markets: 2.49% | |||||
| Affiliated Managers Group Incorporated | 7,901 | 1,093,182 | |||
| Ameriprise Financial Incorporated | 1,788 | 536,025 | |||
| Bank of New York Mellon Corporation | 4,866 | 258,628 | |||
| BlackRock Incorporated | 2,030 | 1,510,097 | |||
| Evercore Partners Incorporated Class A | 8,879 | 1,127,722 | |||
| Franklin Resources Incorporated | 5,667 | 168,480 | |||
| Invesco Limited | 40,480 | 859,795 | |||
| Janus Henderson Group plc | 32,289 | 1,083,942 | |||
| Jefferies Financial Group Incorporated | 12,875 | 457,578 | |||
| KKR & Company Incorporated Class A | 1,614 | 97,034 | |||
| LPL Financial Holdings Incorporated | 1,403 | 253,873 | |||
| Moody's Corporation | 1,110 | 357,453 | |||
| Morgan Stanley | 18,403 | 1,669,888 | |||
| MSCI Incorporated | 540 | 270,913 | |||
| Raymond James Financial Incorporated | 3,029 | 332,130 | |||
| S&P Global Incorporated | 4,220 | 1,585,454 | |||
| SEI Investments Company | 13,182 | 772,202 | |||
| Stifel Financial Corporation | 6,365 | 467,828 | |||
| T. Rowe Price Group Incorporated | 3,978 | 575,060 | |||
| The Blackstone Group Incorporated Class A | 20,950 | 2,670,497 | |||
| The Carlyle Group Incorporated | 2,893 | 135,595 | |||
| The Goldman Sachs Group Incorporated | 4,929 | 1,682,218 | |||
| The NASDAQ Incorporated | 3,779 | 646,776 | |||
| VIRTU Financial Incorporated Class A | 1,662 | 58,303 | |||
| 18,670,673 | |||||
| Consumer finance: 0.39% | |||||
| Ally Financial Incorporated | 3,627 | 180,987 | |||
| American Express Company | 6,580 | 1,280,073 | |||
| Capital One Financial Corporation | 4,592 | 703,816 | |||
| Discover Financial Services | 1,246 | 153,806 | |||
| OneMain Holdings Incorporated | 1,974 | 100,635 | |||
| SLM Corporation | 5,561 | 109,552 | |||
| Synchrony Financial | 9,161 | 391,908 | |||
| 2,920,777 | |||||
| Diversified financial services: 1.45% | |||||
| Berkshire Hathaway Incorporated Class B † | 33,233 | 10,682,748 | |||
| Equitable Holdings Incorporated | 3,243 | 105,916 | |||
| Voya Financial Incorporated | 1,934 | 130,255 | |||
| 10,918,919 | |||||
| Insurance: 1.73% | |||||
| AFLAC Incorporated | 5,907 | 360,859 | |||
| Alleghany Corporation † | 241 | 159,523 | |||
| American Financial Group Incorporated | 9,443 | 1,278,488 |
| Shares | Value | ||||
| Insurance (continued) | |||||
| American International Group Incorporated | 5,882 | $ 360,214 | |||
| Aon plc Class A | 2,002 | 584,864 | |||
| Assurant Incorporated | 995 | 168,861 | |||
| Assured Guaranty Limited | 511 | 31,667 | |||
| Axis Capital Holdings Limited | 7,377 | 402,932 | |||
| Chubb Limited | 6,630 | 1,350,133 | |||
| Cincinnati Financial Corporation | 11 | 1,351 | |||
| CNA Financial Corporation | 2,481 | 113,382 | |||
| Erie Indemnity Company Class A | 8 | 1,401 | |||
| Everest Reinsurance Group Limited | 922 | 274,959 | |||
| First American Financial Corporation | 7,193 | 482,219 | |||
| Kemper Corporation | 291 | 15,551 | |||
| Marsh & McLennan Companies Incorporated | 8,115 | 1,261,152 | |||
| Mercury General Corporation | 465 | 25,575 | |||
| MetLife Incorporated | 9,196 | 621,190 | |||
| Old Republic International Corporation | 40,045 | 1,055,186 | |||
| Progressive Corporation | 6,519 | 690,558 | |||
| Prudential Financial Incorporated | 6,247 | 697,540 | |||
| The Allstate Corporation | 5,000 | 611,800 | |||
| The Hanover Insurance Group Incorporated | 5,543 | 773,304 | |||
| The Travelers Companies Incorporated | 5,770 | 991,459 | |||
| UnumProvident Corporation | 25,795 | 720,196 | |||
| 13,034,364 | |||||
| Mortgage REITs: 0.05% | |||||
| AGNC Investment Corporation | 11,677 | 150,750 | |||
| Annaly Capital Management Incorporated | 22,908 | 159,440 | |||
| New Residential Investment Corporation | 4,050 | 42,039 | |||
| 352,229 | |||||
| Thrifts & mortgage finance: 0.02% | |||||
| MGIC Investment Corporation | 1 | 15 | |||
| New York Community Bancorp Incorporated | 7,950 | 91,743 | |||
| Rocket Companies Incorporated Class A | 2,400 | 30,984 | |||
| UWM Holdings Corporation | 1,739 | 7,547 | |||
| 130,289 | |||||
| Health care: 14.04% | |||||
| Biotechnology: 2.54% | |||||
| AbbVie Incorporated | 39,233 | 5,797,460 | |||
| Amgen Incorporated | 13,331 | 3,019,205 | |||
| Biogen Incorporated † | 2,703 | 570,360 | |||
| BioMarin Pharmaceutical Incorporated † | 2,514 | 196,394 | |||
| Exelixis Incorporated † | 20,671 | 424,376 | |||
| Gilead Sciences Incorporated | 35,773 | 2,160,689 | |||
| Horizon Therapeutics plc † | 6,512 | 593,699 | |||
| Incyte Corporation † | 11,534 | 787,772 | |||
| Ionis Pharmaceuticals Incorporated † | 15,089 | 503,671 | |||
| Moderna Incorporated † | 8,539 | 1,311,590 | |||
| Natera Incorporated † | 433 | 28,470 | |||
| Neurocrine Biosciences Incorporated † | 1,641 | 147,477 | |||
| Novavax Incorporated † | 1,267 | 105,630 | |||
| Regeneron Pharmaceuticals Incorporated † | 3,385 | 2,093,149 | |||
| Seagen Incorporated † | 428 | 55,156 |
| Shares | Value | ||||
| Biotechnology (continued) | |||||
| United Therapeutics Corporation † | 7,433 | $ 1,235,365 | |||
| Vertex Pharmaceuticals Incorporated † | 196 | 45,084 | |||
| 19,075,547 | |||||
| Health care equipment & supplies: 2.83% | |||||
| Abbott Laboratories | 32,208 | 3,884,929 | |||
| Align Technology Incorporated † | 1,319 | 674,616 | |||
| Baxter International Incorporated | 7,950 | 675,512 | |||
| Becton Dickinson & Company | 5,413 | 1,468,439 | |||
| Boston Scientific Corporation † | 20,553 | 907,826 | |||
| Dentsply Sirona Incorporated | 9,622 | 520,935 | |||
| Edwards Lifesciences Corporation † | 9,106 | 1,023,241 | |||
| Envista Holdings Corporation † | 28,845 | 1,384,560 | |||
| Figs Incorporated Class A † | 7,069 | 116,144 | |||
| Globus Medical Incorporated Class A † | 7,436 | 522,900 | |||
| Hologic Incorporated † | 6,755 | 480,753 | |||
| ICU Medical Incorporated † | 351 | 83,092 | |||
| IDEXX Laboratories Incorporated † | 2,440 | 1,298,934 | |||
| Integra LifeSciences Holdings Corporation † | 8,016 | 537,553 | |||
| Intuitive Surgical Incorporated † | 4,881 | 1,417,101 | |||
| Masimo Corporation † | 171 | 26,924 | |||
| Medtronic plc | 23,635 | 2,481,439 | |||
| Quidel Corporation † | 668 | 70,668 | |||
| ResMed Incorporated | 4,292 | 1,059,051 | |||
| STERIS plc | 2,319 | 556,560 | |||
| Stryker Corporation | 5,529 | 1,456,062 | |||
| Teleflex Incorporated | 108 | 36,321 | |||
| The Cooper Companies Incorporated | 268 | 109,617 | |||
| Zimmer Biomet Holdings Incorporated | 3,669 | 466,660 | |||
| 21,259,837 | |||||
| Health care providers & services: 2.78% | |||||
| Acadia Healthcare Company Incorporated † | 8,236 | 467,064 | |||
| Anthem Incorporated | 4,661 | 2,106,073 | |||
| Centene Corporation † | 7,926 | 654,846 | |||
| Cigna Corporation | 5,675 | 1,349,402 | |||
| CVS Health Corporation | 29,873 | 3,096,336 | |||
| DaVita HealthCare Partners Incorporated † | 1,173 | 132,279 | |||
| HCA Healthcare Incorporated | 5,956 | 1,490,846 | |||
| Henry Schein Incorporated † | 7,028 | 607,079 | |||
| Humana Incorporated | 1,864 | 809,572 | |||
| Laboratory Corporation of America Holdings † | 2,677 | 726,163 | |||
| Molina Healthcare Incorporated † | 3,588 | 1,101,050 | |||
| Quest Diagnostics Incorporated | 945 | 124,050 | |||
| UnitedHealth Group Incorporated | 16,798 | 7,993,664 | |||
| Universal Health Services Incorporated Class B | 1,326 | 190,851 | |||
| 20,849,275 | |||||
| Health care technology: 0.10% | |||||
| Certara Incorporated † | 3,065 | 77,667 | |||
| Veeva Systems Incorporated Class A † | 3,090 | 707,765 | |||
| 785,432 | |||||
| Life sciences tools & services: 2.19% | |||||
| Agilent Technologies Incorporated | 8,493 | 1,107,147 |
| Shares | Value | ||||
| Life sciences tools & services (continued) | |||||
| Avantor Incorporated † | 25,677 | $ 890,735 | |||
| Bio-Techne Corporation | 1,178 | 494,065 | |||
| Bruker Corporation | 14,633 | 1,029,724 | |||
| Charles River Laboratories International Incorporated † | 2,018 | 587,561 | |||
| Danaher Corporation | 10,775 | 2,956,768 | |||
| Illumina Incorporated † | 1,053 | 343,910 | |||
| IQVIA Holdings Incorporated † | 4,489 | 1,033,009 | |||
| Mettler-Toledo International Incorporated † | 860 | 1,211,516 | |||
| PerkinElmer Incorporated | 1,319 | 236,906 | |||
| Syneos Health Incorporated † | 9,795 | 775,764 | |||
| Thermo Fisher Scientific Incorporated | 6,557 | 3,567,008 | |||
| Waters Corporation † | 4,193 | 1,328,049 | |||
| West Pharmaceutical Services Incorporated | 2,238 | 866,285 | |||
| 16,428,447 | |||||
| Pharmaceuticals: 3.60% | |||||
| Bristol-Myers Squibb Company | 39,626 | 2,721,117 | |||
| Catalent Incorporated † | 1,969 | 200,917 | |||
| Eli Lilly & Company | 15,387 | 3,845,981 | |||
| Jazz Pharmaceuticals plc † | 1,209 | 166,141 | |||
| Johnson & Johnson | 48,127 | 7,920,260 | |||
| Merck & Company Incorporated | 43,635 | 3,341,568 | |||
| Organon & Company | 54,670 | 2,040,831 | |||
| Perrigo Company plc | 2,360 | 83,827 | |||
| Pfizer Incorporated | 111,006 | 5,210,622 | |||
| Viatris Incorporated | 14,869 | 163,708 | |||
| Zoetis Incorporated | 6,917 | 1,339,477 | |||
| 27,034,449 | |||||
| Industrials: 9.31% | |||||
| Aerospace & defense: 1.81% | |||||
| BWX Technologies Incorporated | 4,419 | 236,063 | |||
| Curtiss-Wright Corporation | 1,916 | 282,648 | |||
| General Dynamics Corporation | 8,625 | 2,022,131 | |||
| Hexcel Corporation | 1,491 | 86,329 | |||
| Howmet Aerospace Incorporated | 22,988 | 825,729 | |||
| Huntington Ingalls Industries Incorporated | 6,707 | 1,370,911 | |||
| L3Harris Technologies Incorporated | 3,682 | 929,005 | |||
| Lockheed Martin Corporation | 4,322 | 1,874,884 | |||
| Northrop Grumman Corporation | 4,059 | 1,794,646 | |||
| Raytheon Technologies Corporation | 22,038 | 2,263,303 | |||
| Textron Incorporated | 11,142 | 814,814 | |||
| The Boeing Company † | 5,385 | 1,105,756 | |||
| 13,606,219 | |||||
| Air freight & logistics: 0.64% | |||||
| C.H. Robinson Worldwide Incorporated | 6,827 | 660,034 | |||
| Expeditors International of Washington Incorporated | 5,046 | 521,555 | |||
| FedEx Corporation | 2,918 | 648,584 | |||
| United Parcel Service Incorporated Class B | 13,300 | 2,798,586 | |||
| XPO Logistics Incorporated | 1,798 | 130,679 | |||
| 4,759,438 |
| Shares | Value | ||||
| Airlines: 0.12% | |||||
| Alaska Air Group Incorporated † | 3,545 | $ 199,016 | |||
| Copa Holdings SA Class A † | 6,298 | 534,322 | |||
| Delta Air Lines Incorporated † | 3,970 | 158,482 | |||
| 891,820 | |||||
| Building products: 0.52% | |||||
| A.O. Smith Corporation | 3,616 | 247,985 | |||
| Builders FirstSource Incorporated † | 2,778 | 206,739 | |||
| Carlisle Companies Incorporated | 1,225 | 290,815 | |||
| Carrier Global Corporation | 8,395 | 376,768 | |||
| Johnson Controls International plc | 18,320 | 1,190,067 | |||
| Lennox International Incorporated | 1,805 | 481,809 | |||
| Masco Corporation | 1,043 | 58,450 | |||
| Owens Corning Incorporated | 4,480 | 417,491 | |||
| Trane Technologies plc | 4,201 | 646,660 | |||
| 3,916,784 | |||||
| Commercial services & supplies: 0.58% | |||||
| ADT Incorporated | 2,916 | 21,316 | |||
| Cintas Corporation | 1,031 | 386,955 | |||
| Clean Harbors Incorporated † | 20,851 | 1,989,811 | |||
| MSA Safety Incorporated | 644 | 89,580 | |||
| Republic Services Incorporated | 2,529 | 304,188 | |||
| Rollins Incorporated | 3,925 | 128,073 | |||
| Stericycle Incorporated † | 6,532 | 381,208 | |||
| Waste Management Incorporated | 7,441 | 1,074,480 | |||
| 4,375,611 | |||||
| Construction & engineering: 0.01% | |||||
| AECOM Technology Corporation | 1,072 | 77,892 | |||
| Electrical equipment: 1.05% | |||||
| Acuity Brands Incorporated | 4,704 | 857,868 | |||
| AMETEK Incorporated | 1,199 | 155,618 | |||
| Eaton Corporation plc | 10,409 | 1,606,005 | |||
| Emerson Electric Company | 13,107 | 1,217,902 | |||
| Generac Holdings Incorporated † | 1,002 | 316,101 | |||
| Hubbell Incorporated | 5,717 | 1,019,055 | |||
| nVent Electric plc | 25,600 | 868,608 | |||
| Regal-Beloit Corporation | 5,853 | 938,529 | |||
| Rockwell Automation Incorporated | 2,289 | 610,202 | |||
| Sensata Technologies Holding plc † | 2,744 | 158,905 | |||
| Shoals Technologies Group Class A † | 1,867 | 29,517 | |||
| Vertiv Holdings Company | 5,273 | 68,654 | |||
| 7,846,964 | |||||
| Industrial conglomerates: 0.77% | |||||
| 3M Company | 10,592 | 1,574,490 | |||
| General Electric Company | 19,007 | 1,815,359 | |||
| Honeywell International Incorporated | 12,581 | 2,387,245 | |||
| 5,777,094 | |||||
| Machinery: 1.22% | |||||
| AGCO Corporation | 6,668 | 801,227 | |||
| Allison Transmission Holdings Incorporated | 6,097 | 243,514 |
| Shares | Value | ||||
| Machinery (continued) | |||||
| Caterpillar Incorporated | 7,458 | $ 1,398,972 | |||
| Crane Company | 3,026 | 305,868 | |||
| Cummins Incorporated | 1,400 | 285,768 | |||
| Deere & Company | 4,016 | 1,445,840 | |||
| Donaldson Company Incorporated | 2,306 | 125,147 | |||
| Dover Corporation | 2,517 | 394,817 | |||
| Flowserve Corporation | 5,622 | 170,740 | |||
| Gates Industrial Corporation plc † | 1,674 | 26,516 | |||
| Illinois Tool Works Incorporated | 2,948 | 637,770 | |||
| ITT Incorporated | 4,582 | 402,620 | |||
| Lincoln Electric Holdings Incorporated | 6,492 | 827,470 | |||
| Oshkosh Corporation | 1,200 | 133,248 | |||
| Otis Worldwide Corporation | 8,496 | 665,492 | |||
| PACCAR Incorporated | 382 | 35,071 | |||
| Parker-Hannifin Corporation | 1,613 | 478,077 | |||
| Pentair plc | 10,096 | 584,659 | |||
| The Middleby Corporation † | 25 | 4,441 | |||
| The Timken Company | 1,119 | 73,362 | |||
| The Toro Company | 697 | 65,386 | |||
| Xylem Incorporated | 394 | 35,046 | |||
| 9,141,051 | |||||
| Professional services: 1.00% | |||||
| Booz Allen Hamilton Holding Corporation | 5,662 | 456,867 | |||
| CACI International Incorporated Class A † | 2,839 | 794,324 | |||
| FTI Consulting Incorporated † | 6,255 | 913,230 | |||
| Jacobs Engineering Group Incorporated | 5,583 | 686,709 | |||
| Legalzoom.com Incorporated † | 349 | 5,448 | |||
| Leidos Holdings Incorporated | 2,467 | 251,239 | |||
| Manpower Incorporated | 15,434 | 1,640,326 | |||
| Nielsen Holdings plc | 32,322 | 563,049 | |||
| Robert Half International Incorporated | 12,594 | 1,514,932 | |||
| Science Applications International Corporation | 7,863 | 689,506 | |||
| 7,515,630 | |||||
| Road & rail: 1.27% | |||||
| AMERCO | 52 | 30,036 | |||
| CSX Corporation | 20,774 | 704,446 | |||
| J.B. Hunt Transport Services Incorporated | 5,485 | 1,113,071 | |||
| Knight-Swift Transportation Holdings Incorporated | 9,743 | 530,799 | |||
| Landstar System Incorporated | 8,739 | 1,349,389 | |||
| Norfolk Southern Corporation | 1 | 257 | |||
| Old Dominion Freight Line Incorporated | 2,477 | 777,852 | |||
| Ryder System Incorporated | 18,964 | 1,495,122 | |||
| Schneider National Incorporated Class B | 62,638 | 1,636,105 | |||
| Union Pacific Corporation | 7,834 | 1,926,772 | |||
| 9,563,849 | |||||
| Trading companies & distributors: 0.32% | |||||
| Fastenal Company | 1,381 | 71,066 | |||
| MSC Industrial Direct Company Class A | 8,476 | 656,720 | |||
| Univar Incorporated † | 30,086 | 923,941 | |||
| W.W. Grainger Incorporated | 849 | 405,024 | |||
| Watsco Incorporated | 1,346 | 367,539 | |||
| 2,424,290 |
| Shares | Value | ||||
| Information technology: 28.80% | |||||
| Communications equipment: 0.71% | |||||
| Ciena Corporation † | 2,820 | $ 192,944 | |||
| Cisco Systems Incorporated | 69,298 | 3,864,749 | |||
| CommScope Holdings Incorporated † | 3,548 | 33,848 | |||
| Juniper Networks Incorporated | 9,741 | 329,148 | |||
| Motorola Solutions Incorporated | 3,806 | 838,957 | |||
| Ubiquiti Incorporated | 384 | 97,494 | |||
| 5,357,140 | |||||
| Electronic equipment, instruments & components: 0.79% | |||||
| Arrow Electronics Incorporated † | 12,826 | 1,563,233 | |||
| Avnet Incorporated | 45,271 | 1,904,551 | |||
| CDW Corporation of Delaware | 4,256 | 733,990 | |||
| Jabil Circuit Incorporated | 19,033 | 1,100,298 | |||
| Keysight Technologies Incorporated † | 1,477 | 232,435 | |||
| SYNNEX Corporation | 4,097 | 417,198 | |||
| 5,951,705 | |||||
| IT services: 5.22% | |||||
| Accenture plc Class A | 13,304 | 4,204,330 | |||
| Akamai Technologies Incorporated † | 2,497 | 270,325 | |||
| Alliance Data Systems Corporation | 11,276 | 760,566 | |||
| Amdocs Limited | 10,762 | 846,969 | |||
| Automatic Data Processing Incorporated | 7,429 | 1,518,785 | |||
| Broadridge Financial Solutions Incorporated | 5,422 | 792,751 | |||
| Cloudflare Incorporated Class A † | 1,369 | 159,379 | |||
| Cognizant Technology Solutions Corporation Class A | 19,230 | 1,656,280 | |||
| Concentrix Corporation | 18,772 | 3,752,335 | |||
| DXC Technology Company † | 59,446 | 2,022,947 | |||
| EPAM Systems Incorporated † | 2,344 | 486,966 | |||
| Euronet Worldwide Incorporated † | 946 | 121,306 | |||
| Fidelity National Information Services Incorporated | 5,575 | 530,907 | |||
| Fiserv Incorporated † | 10,054 | 981,974 | |||
| FleetCor Technologies Incorporated † | 612 | 143,330 | |||
| Gartner Incorporated † | 4,240 | 1,188,981 | |||
| Genpact Limited | 15,443 | 646,135 | |||
| Global Payments Incorporated | 2,601 | 346,921 | |||
| Globant SA † | 383 | 104,942 | |||
| GoDaddy Incorporated Class A † | 254 | 21,186 | |||
| International Business Machines Corporation | 20,117 | 2,464,534 | |||
| Jack Henry & Associates Incorporated | 4,350 | 769,080 | |||
| Kyndryl Holdings Incorporated † | 129,121 | 2,047,859 | |||
| MasterCard Incorporated Class A | 11,207 | 4,043,710 | |||
| Paychex Incorporated | 9,681 | 1,152,620 | |||
| PayPal Holdings Incorporated † | 4,544 | 508,610 | |||
| Shift4 Payments Incorporated Class A † | 3,175 | 167,164 | |||
| Solarwinds Corporation | 637 | 8,631 | |||
| Square Incorporated Class A † | 7,099 | 905,123 | |||
| Switch Incorporated Class A | 4,543 | 118,209 | |||
| The Western Union Company | 41,347 | 751,688 | |||
| VeriSign Incorporated † | 3,447 | 736,693 | |||
| Visa Incorporated Class A | 22,914 | 4,952,174 | |||
| 39,183,410 |
| Shares | Value | ||||
| Semiconductors & semiconductor equipment: 5.61% | |||||
| Advanced Micro Devices Incorporated † | 20,888 | $ 2,576,326 | |||
| Allegro MicroSystems Incorporated † | 29,951 | 858,695 | |||
| Analog Devices Incorporated | 8,489 | 1,360,702 | |||
| Applied Materials Incorporated | 18,813 | 2,524,705 | |||
| Broadcom Incorporated | 7,173 | 4,213,707 | |||
| Cirrus Logic Incorporated † | 6,350 | 551,625 | |||
| Entegris Incorporated | 2,398 | 312,891 | |||
| First Solar Incorporated † | 1,463 | 110,149 | |||
| Intel Corporation | 70,000 | 3,339,000 | |||
| KLA Corporation | 3,785 | 1,319,073 | |||
| Lam Research Corporation | 2,876 | 1,614,443 | |||
| Microchip Technology Incorporated | 11,226 | 789,525 | |||
| Micron Technology Incorporated | 20,141 | 1,789,729 | |||
| MKS Instruments Incorporated | 987 | 148,642 | |||
| Monolithic Power Systems Incorporated | 416 | 190,819 | |||
| NVIDIA Corporation | 41,562 | 10,134,894 | |||
| NXP Semiconductors NV | 6,893 | 1,310,497 | |||
| ON Semiconductor Corporation † | 28,629 | 1,792,462 | |||
| Qorvo Incorporated † | 1,955 | 267,405 | |||
| Qualcomm Incorporated | 16,478 | 2,834,051 | |||
| Skyworks Solutions Incorporated | 3,702 | 511,505 | |||
| Teradyne Incorporated | 3,353 | 395,386 | |||
| Texas Instruments Incorporated | 18,427 | 3,132,406 | |||
| 42,078,637 | |||||
| Software: 10.50% | |||||
| Adobe Incorporated † | 8,501 | 3,975,748 | |||
| Anaplan Incorporated † | 71 | 3,363 | |||
| ANSYS Incorporated † | 267 | 86,559 | |||
| Atlassian Corporation plc Class A † | 3,703 | 1,132,081 | |||
| Autodesk Incorporated † | 4,192 | 923,204 | |||
| Bentley Systems Incorporated Class B | 8,998 | 345,433 | |||
| Cadence Design Systems Incorporated † | 8,669 | 1,312,747 | |||
| CDK Global Incorporated | 2,228 | 101,018 | |||
| Crowdstrike Holdings Incorporated Class A † | 2,636 | 514,574 | |||
| Datadog Incorporated Class A † | 271 | 43,661 | |||
| Datto Holding Corporation † | 3,976 | 93,277 | |||
| DocuSign Incorporated † | 3,636 | 430,611 | |||
| Dolby Laboratories Incorporated Class A | 1,127 | 84,638 | |||
| Doubleverify Holdings Incorporated † | 303 | 8,378 | |||
| Dropbox Incorporated Class A † | 52,483 | 1,190,839 | |||
| Dynatrace Incorporated † | 5,034 | 223,610 | |||
| Elastic NV † | 365 | 31,627 | |||
| Fair Isaac Corporation † | 2,085 | 982,431 | |||
| Fortinet Incorporated † | 5,198 | 1,790,815 | |||
| Guidewire Software Incorporated † | 510 | 44,957 | |||
| HubSpot Incorporated † | 827 | 434,175 | |||
| Intuit Incorporated | 5,584 | 2,648,882 | |||
| Mandiant Incorporated † | 4,216 | 83,477 | |||
| Manhattan Associates Incorporated † | 6,886 | 920,520 | |||
| Microsoft Corporation | 139,536 | 41,691,961 | |||
| N-able Incorporated † | 64,923 | 751,159 | |||
| NCR Corporation † | 32,184 | 1,304,096 | |||
| New Relic Incorporated † | 7,961 | 527,337 | |||
| NortonLifeLock Incorporated | 9,736 | 282,149 | |||
| Nutanix Incorporated Class A † | 10,501 | 280,377 |
| Shares | Value | ||||
| Software (continued) | |||||
| Oracle Corporation | 33,593 | $ 2,552,060 | |||
| Palantir Technologies Incorporated Class A † | 6,582 | 77,997 | |||
| Palo Alto Networks Incorporated † | 1,814 | 1,077,970 | |||
| Pegasystems Incorporated | 77 | 6,708 | |||
| PTC Incorporated † | 4,783 | 532,252 | |||
| RingCentral Incorporated Class A † | 973 | 127,307 | |||
| Salesforce.com Incorporated † | 14,692 | 3,093,107 | |||
| ServiceNow Incorporated † | 3,402 | 1,972,888 | |||
| Smartsheet Incorporated Class A † | 6,879 | 365,756 | |||
| SS&C Technologies Holdings Incorporated | 13,120 | 983,606 | |||
| Synopsys Incorporated † | 4,369 | 1,364,832 | |||
| Teradata Corporation † | 56,667 | 2,832,783 | |||
| Tyler Technologies Incorporated † | 699 | 299,354 | |||
| VMware Incorporated Class A | 3,996 | 468,811 | |||
| Workday Incorporated Class A † | 3,304 | 756,781 | |||
| Zendesk Incorporated † | 856 | 99,870 | |||
| 78,855,786 | |||||
| Technology hardware, storage & peripherals: 5.97% | |||||
| Apple Incorporated | 259,047 | 42,773,841 | |||
| Hewlett Packard Enterprise Company | 17,516 | 278,855 | |||
| HP Incorporated | 41,772 | 1,435,286 | |||
| Western Digital Corporation † | 5,448 | 277,521 | |||
| Xerox Holdings Corporation | 827 | 16,300 | |||
| 44,781,803 | |||||
| Materials: 2.11% | |||||
| Chemicals: 1.24% | |||||
| Ashland Global Holdings Incorporated | 963 | 88,866 | |||
| Axalta Coating Systems Limited † | 3,637 | 98,344 | |||
| Celanese Corporation Series A | 1,201 | 167,275 | |||
| Corteva Incorporated | 8,206 | 426,958 | |||
| Diversey Holdings Limited † | 4,821 | 46,137 | |||
| Dow Incorporated | 17,355 | 1,023,251 | |||
| DuPont de Nemours Incorporated | 5,093 | 394,045 | |||
| Eastman Chemical Company | 2,339 | 277,101 | |||
| Ecolab Incorporated | 1,886 | 332,426 | |||
| Element Solutions Incorporated | 14,063 | 345,669 | |||
| Huntsman Corporation | 23,396 | 946,134 | |||
| LyondellBasell Industries NV Class A | 5,643 | 548,669 | |||
| Olin Corporation | 37,570 | 1,935,231 | |||
| PPG Industries Incorporated | 1,154 | 154,001 | |||
| The Chemours Company | 23,952 | 661,075 | |||
| The Mosaic Company | 9,950 | 521,679 | |||
| The Sherwin-Williams Company | 3,582 | 942,532 | |||
| Valvoline Incorporated | 8,992 | 290,711 | |||
| Westlake Chemical Corporation | 961 | 106,008 | |||
| 9,306,112 | |||||
| Construction materials: 0.06% | |||||
| Eagle Materials Incorporated | 3,323 | 454,686 | |||
| Martin Marietta Materials Incorporated | 66 | 25,040 | |||
| 479,726 |
| Shares | Value | ||||
| Containers & packaging: 0.23% | |||||
| Avery Dennison Corporation | 1,686 | $ 297,073 | |||
| Berry Global Group Incorporated † | 3,190 | 193,474 | |||
| Graphic Packaging Holding Company | 12,237 | 251,837 | |||
| International Paper Company | 6,764 | 294,437 | |||
| Packaging Corporation of America | 1,116 | 164,264 | |||
| Sealed Air Corporation | 2,813 | 188,837 | |||
| Sonoco Products Company | 2,746 | 161,245 | |||
| WestRock Company | 4,615 | 208,921 | |||
| 1,760,088 | |||||
| Metals & mining: 0.57% | |||||
| Alcoa Corporation | 5,116 | 385,439 | |||
| Cleveland Cliffs Incorporated † | 1,755 | 39,242 | |||
| Freeport-McMoRan Incorporated | 7,637 | 358,557 | |||
| Nucor Corporation | 7,745 | 1,019,397 | |||
| Reliance Steel & Aluminum Company | 3,506 | 669,190 | |||
| Steel Dynamics Incorporated | 13,227 | 933,562 | |||
| United States Steel Corporation | 31,978 | 870,121 | |||
| 4,275,508 | |||||
| Paper & forest products: 0.01% | |||||
| Sylvamo Corporation † | 1,268 | 44,253 | |||
| Real estate: 2.72% | |||||
| Equity REITs: 2.38% | |||||
| American Campus Communities Incorporated | 11,412 | 614,080 | |||
| American Homes 4 Rent Class A | 7,542 | 286,671 | |||
| American Tower Corporation | 4,043 | 917,235 | |||
| Apartment Income Corporation REIT | 6,637 | 342,536 | |||
| AvalonBay Communities Incorporated | 2,140 | 510,583 | |||
| Brixmor Property Group Incorporated | 7,644 | 192,017 | |||
| Camden Property Trust | 4,139 | 683,390 | |||
| Crown Castle International Corporation | 6,011 | 1,001,372 | |||
| CubeSmart | 7,951 | 383,318 | |||
| Duke Realty Corporation | 3,952 | 209,456 | |||
| Equinix Incorporated | 740 | 525,200 | |||
| Equity Lifestyle Properties Incorporated | 2,413 | 180,058 | |||
| Equity Residential | 6,846 | 583,964 | |||
| Essex Property Trust Incorporated | 1,619 | 513,498 | |||
| Extra Space Storage Incorporated | 3,328 | 626,163 | |||
| First Industrial Realty Trust Incorporated | 5,716 | 329,127 | |||
| Gaming and Leisure Properties Incorporated | 5,311 | 241,173 | |||
| Healthpeak Properties Incorporated | 5,701 | 177,073 | |||
| Highwoods Properties Incorporated | 2,941 | 128,228 | |||
| Invitation Homes Incorporated | 12,782 | 483,160 | |||
| Iron Mountain Incorporated | 27,721 | 1,363,319 | |||
| Lamar Advertising Company Class A | 6,445 | 702,892 | |||
| Life Storage Incorporated | 3,339 | 422,684 | |||
| Mid-America Apartment Communities Incorporated | 3,968 | 811,892 | |||
| National Retail Properties Incorporated | 1,493 | 63,617 | |||
| Omega Healthcare Investors Incorporated | 2,256 | 63,552 | |||
| Orion Office Incorporated † | 706 | 12,023 | |||
| Prologis Incorporated | 6,500 | 948,025 | |||
| Public Storage Incorporated | 3,017 | 1,071,095 | |||
| Realty Income Corporation | 7,061 | 466,661 |
| Shares | Value | ||||
| Equity REITs (continued) | |||||
| Regency Centers Corporation | 4,984 | $ 328,396 | |||
| SBA Communications Corporation | 875 | 265,466 | |||
| Simon Property Group Incorporated | 5,212 | 716,963 | |||
| SL Green Realty Corporation | 349 | 27,752 | |||
| UDR Incorporated | 3,051 | 167,408 | |||
| Ventas Incorporated | 2,705 | 146,070 | |||
| VICI Properties Incorporated | 10,513 | 293,943 | |||
| Welltower Incorporated | 6,538 | 544,550 | |||
| Weyerhaeuser Company | 13,634 | 530,090 | |||
| 17,874,700 | |||||
| Real estate management & development: 0.34% | |||||
| CBRE Group Incorporated Class A † | 10,988 | 1,064,188 | |||
| Jones Lang LaSalle Incorporated † | 5,905 | 1,453,929 | |||
| 2,518,117 | |||||
| Utilities: 2.33% | |||||
| Electric utilities: 1.41% | |||||
| Alliant Energy Corporation | 1,172 | 68,445 | |||
| American Electric Power Company Incorporated | 4,919 | 445,907 | |||
| Avangrid Incorporated | 988 | 44,332 | |||
| Constellation Newenergy | 8,350 | 383,933 | |||
| Duke Energy Corporation | 11,396 | 1,144,272 | |||
| Edison International | 6,182 | 392,062 | |||
| Entergy Corporation | 310 | 32,615 | |||
| Evergy Incorporated | 8,461 | 528,051 | |||
| Eversource Energy | 1,486 | 121,555 | |||
| Exelon Corporation | 25,050 | 1,066,128 | |||
| FirstEnergy Corporation | 20,352 | 851,731 | |||
| Hawaiian Electric Industries Incorporated | 6,355 | 260,428 | |||
| IDACORP Incorporated | 3,326 | 345,738 | |||
| NextEra Energy Incorporated | 26,529 | 2,076,425 | |||
| NRG Energy Incorporated | 4,244 | 160,593 | |||
| OGE Energy Corporation | 20,641 | 775,070 | |||
| PG&E Corporation † | 23,616 | 268,514 | |||
| PPL Corporation | 11,844 | 309,957 | |||
| The Southern Company | 16,942 | 1,097,333 | |||
| Xcel Energy Incorporated | 3,252 | 218,957 | |||
| 10,592,046 | |||||
| Gas utilities: 0.06% | |||||
| National Fuel Gas Company | 5,014 | 312,071 | |||
| UGI Corporation | 3,771 | 144,957 | |||
| 457,028 | |||||
| Independent power & renewable electricity producers: 0.11% | |||||
| AES Corporation | 29,815 | 632,972 | |||
| Vistra Energy Corporation | 8,432 | 192,418 | |||
| 825,390 | |||||
| Multi-utilities: 0.67% | |||||
| CenterPoint Energy Incorporated | 20,833 | 569,783 | |||
| CMS Energy Corporation | 158 | 10,114 | |||
| Consolidated Edison Incorporated | 2,253 | 193,240 |
| Shares | Value | ||||
| Multi-utilities (continued) | |||||
| Dominion Energy Incorporated | 9,983 | $ 793,948 | |||
| DTE Energy Company | 3,711 | 451,220 | |||
| MDU Resources Group Incorporated | 50,893 | 1,362,406 | |||
| NiSource Incorporated | 5,665 | 163,888 | |||
| Public Service Enterprise Group Incorporated | 8,564 | 555,204 | |||
| Sempra Energy | 5,125 | 739,128 | |||
| WEC Energy Group Incorporated | 1,707 | 155,132 | |||
| 4,994,063 | |||||
| Water utilities: 0.08% | |||||
| American Water Works Company Incorporated | 3,164 | 478,049 | |||
| Essential Utilities Incorporated | 2,759 | 129,976 | |||
| 608,025 | |||||
| Total Common stocks (Cost $558,702,079) | 729,249,499 |
| Yield | |||||
| Short-term investments: 2.22% | |||||
| Investment companies: 2.22% | |||||
| Allspring Government Money Market Fund Select Class ♠∞ | 0.03% | 16,689,254 | 16,689,254 | ||
| Total Short-term investments (Cost $16,689,254) | 16,689,254 | ||||
| Total investments in securities (Cost $575,391,333) | 99.36% | 745,938,753 | |||
| Other assets and liabilities, net | 0.64 | 4,799,338 | |||
| Total net assets | 100.00% | $750,738,091 |
| † | Non-income-earning security |
| ♠ | The issuer of the security is an affiliated person of the Portfolio as defined in the Investment Company Act of 1940. |
| ∞ | The rate represents the 7-day annualized yield at period end. |
| Abbreviations: | |
| REIT | Real estate investment trust |
| Value, beginning of period | Purchases | Sales proceeds | Net realized gains (losses) | Net change in unrealized gains (losses) | Value, end of period | Shares, end of period | Income from affiliated securities | |
| Short-term investments | ||||||||
| Allspring Government Money Market Fund Select Class | $18,864,948 | $181,031,151 | $(183,206,845) | $0 | $0 | $16,689,254 | 16,689,254 | $6,105 |
| Description | Number of contracts | Expiration date | Notional cost | Notional value | Unrealized gains | Unrealized losses |
| Long | ||||||
| E-Mini S&P 500 Index | 96 | 3-18-2022 | $21,976,551 | $20,966,400 | $0 | $(1,010,151) |
| Assets | |
Investments in unaffiliated securities, at value (cost $558,702,079) | $ 729,249,499 |
Investments in affiliated securities, at value (cost $16,689,254) | 16,689,254 |
Cash at broker segregated for futures contracts | 3,983,600 |
Receivable for dividends | 935,971 |
Prepaid expenses and other assets | 72,298 |
Total assets | 750,930,622 |
| Liabilities | |
Payable for daily variation margin on open futures contracts | 75,439 |
Advisory fee payable | 45,950 |
Professional fees payable | 38,455 |
Custody and accounting fees payable | 23,927 |
Trustees’ fees and expenses payable | 1,150 |
Accrued expenses and other liabilities | 7,610 |
Total liabilities | 192,531 |
Total net assets | $750,738,091 |
| Investment income | |
Dividends (net of foreign withholdings taxes of $48,684) | $ 10,880,710 |
Income from affiliated securities | 6,105 |
Total investment income | 10,886,815 |
| Expenses | |
Advisory fee | 820,060 |
Custody and accounting fees | 57,484 |
Professional fees | 57,023 |
Interest holder report expenses | 17,058 |
Trustees’ fees and expenses | 20,121 |
Other fees and expenses | 20,649 |
Total expenses | 992,395 |
Less: Fee waivers and/or expense reimbursements | (156,380) |
Net expenses | 836,015 |
Net investment income | 10,050,800 |
| Realized and unrealized gains (losses) on investments | |
| Net realized gains on | |
Unaffiliated securities | 143,442,581 |
Futures contracts | 4,701,992 |
Net realized gains on investments | 148,144,573 |
| Net change in unrealized gains (losses) on | |
Unaffiliated securities | (33,024,754) |
Futures contracts | (1,253,843) |
Net change in unrealized gains (losses) on investments | (34,278,597) |
Net realized and unrealized gains (losses) on investments | 113,865,976 |
Net increase in net assets resulting from operations | $123,916,776 |
| Year ended February 28, 2022 | Year ended February 28, 2021 | |
| Operations | ||
Net investment income | $ 10,050,800 | $ 15,062,223 |
Net realized gains on investments | 148,144,573 | 109,367,052 |
Net change in unrealized gains (losses) on investments | (34,278,597) | 68,934,110 |
Net increase in net assets resulting from operations | 123,916,776 | 193,363,385 |
| Capital transactions | ||
| Transactions in investors’ beneficial interests | ||
Contributions | 80,236,932 | 187,853,147 |
Withdrawals | (257,231,310) | (538,830,448) |
Net decrease in net assets resulting from capital transactions | (176,994,378) | (350,977,301) |
Total decrease in net assets | (53,077,602) | (157,613,916) |
| Net assets | ||
Beginning of period | 803,815,693 | 961,429,609 |
End of period | $ 750,738,091 | $ 803,815,693 |
| Year ended February 28 | |||||
| 2022 | 2021 | 2020 1 | 2019 | 2018 2 | |
Total return3 | 15.65% | 24.03% | 4.00% | 7.60% | 11.92% |
| Ratios to average net assets (annualized) | |||||
Gross expenses | 0.12% | 0.12% | 0.12% | 0.12% | 0.12% |
Net expenses | 0.10% * | 0.10% * | 0.11% | 0.11% | 0.12% |
Net investment income | 1.23% | 1.72% | 2.10% | 2.09% | 1.94% |
| Supplemental data | |||||
Portfolio turnover rate | 50% | 71% | 25% | 23% | 75% |
| * | Ratio includes expenses which were voluntarily waived by the adviser. Without these voluntary waivers, the net expense ratios would be increased by the following amounts: |
| Year ended February 28, 2022 | 0.02% |
| Year ended February 28, 2021 | 0.02% |
| 1 | Year ended February 29 |
| 2 | For the period from May 23, 2017 (commencement of operations) to February 28, 2018 |
| 3 | Returns for periods of less than one year are not annualized. |
| Gross unrealized gains | $187,833,224 |
| Gross unrealized losses | (22,979,097) |
| Net unrealized gains | $164,854,127 |
| ■ | Level 1 – quoted prices in active markets for identical securities |
| ■ | Level 2 – other significant observable inputs (including quoted prices for similar securities, interest rates, prepayment speeds, credit risk, etc.) |
| ■ | Level 3 – significant unobservable inputs (including the Portfolio’s own assumptions in determining the fair value of investments) |
| Quoted prices (Level 1) | Other significant observable inputs (Level 2) | Significant unobservable inputs (Level 3) | Total | |
| Assets | ||||
| Investments in: | ||||
| Common stocks | ||||
| Communication services | $ 70,358,221 | $0 | $0 | $ 70,358,221 |
| Consumer discretionary | 74,680,508 | 0 | 0 | 74,680,508 |
| Consumer staples | 48,835,960 | 0 | 0 | 48,835,960 |
| Energy | 21,647,487 | 0 | 0 | 21,647,487 |
| Financials | 68,454,157 | 0 | 0 | 68,454,157 |
| Health care | 105,432,987 | 0 | 0 | 105,432,987 |
| Industrials | 69,896,642 | 0 | 0 | 69,896,642 |
| Information technology | 216,208,481 | 0 | 0 | 216,208,481 |
| Materials | 15,865,687 | 0 | 0 | 15,865,687 |
| Real estate | 20,392,817 | 0 | 0 | 20,392,817 |
| Utilities | 17,476,552 | 0 | 0 | 17,476,552 |
| Short-term investments | ||||
| Investment companies | 16,689,254 | 0 | 0 | 16,689,254 |
| Total assets | $745,938,753 | $0 | $0 | $745,938,753 |
| Liabilities | ||||
| Futures contracts | $ 1,010,151 | $0 | $0 | $ 1,010,151 |
| Total liabilities | $ 1,010,151 | $0 | $0 | $ 1,010,151 |
| Average daily net assets | Advisory fee |
| First $5 billion | 0.100% |
| Next $5 billion | 0.080 |
| Over $10 billion | 0.060 |
Allspring Master Trust:

| Name and year of birth | Position held and length of service* | Principal occupations during past five years or longer | Current other public company or investment company directorships |
| William R. Ebsworth (Born 1957) | Trustee, since 2015 | Retired. From 1984 to 2013, equities analyst, portfolio manager, research director and chief investment officer at Fidelity Management and Research Company in Boston, Tokyo, and Hong Kong, and retired in 2013 as Chief Investment Officer of Fidelity Strategic Advisers, Inc. where he led a team of investment professionals managing client assets. Prior thereto, Board member of Hong Kong Securities Clearing Co., Hong Kong Options Clearing Corp., the Thailand International Fund, Ltd., Fidelity Investments Life Insurance Company, and Empire Fidelity Investments Life Insurance Company. Audit Committee Chair and Investment Committee Chair of the Vincent Memorial Hospital Endowment (non-profit organization). Mr. Ebsworth is a CFA® charterholder. | N/A |
| Jane A. Freeman (Born 1953) | Trustee, since 2015; Chair Liaison, since 2018 | Retired. From 2012 to 2014 and 1999 to 2008, Chief Financial Officer of Scientific Learning Corporation. From 2008 to 2012, Ms. Freeman provided consulting services related to strategic business projects. Prior to 1999, Portfolio Manager at Rockefeller & Co. and Scudder, Stevens & Clark. Board member of the Harding Loevner Funds from 1996 to 2014, serving as both Lead Independent Director and chair of the Audit Committee. Board member of the Russell Exchange Traded Funds Trust from 2011 to 2012 and the chair of the Audit Committee. Ms. Freeman is also an inactive Chartered Financial Analyst. | N/A |
| Isaiah Harris, Jr. (Born 1952) | Trustee, since 2009; Audit Committee Chair, since 2019 | Retired. Chairman of the Board of CIGNA Corporation from 2009 to 2021, and Director from 2005 to 2008. From 2003 to 2011, Director of Deluxe Corporation. Prior thereto, President and CEO of BellSouth Advertising and Publishing Corp. from 2005 to 2007, President and CEO of BellSouth Enterprises from 2004 to 2005 and President of BellSouth Consumer Services from 2000 to 2003. Emeritus member of the Iowa State University Foundation Board of Governors. Emeritus Member of the Advisory Board of Iowa State University School of Business. Advisory Board Member, Palm Harbor Academy (private school). Advisory Board Member, Fellowship of Christian Athletes. Mr. Harris is a certified public accountant (inactive status). | N/A |
| David F. Larcker (Born 1950) | Trustee, since 2009 | James Irvin Miller Professor of Accounting at the Graduate School of Business (Emeritus), Stanford University, Director of the Corporate Governance Research Initiative and Senior Faculty of The Rock Center for Corporate Governance since 2006. From 2005 to 2008, Professor of Accounting at the Graduate School of Business, Stanford University. Prior thereto, Ernst & Young Professor of Accounting at The Wharton School, University of Pennsylvania from 1985 to 2005. | N/A |
| Name and year of birth | Position held and length of service* | Principal occupations during past five years or longer | Current other public company or investment company directorships |
| Olivia S. Mitchell (Born 1953) | Trustee, since 2006; Nominating and Governance Committee Chair, since 2018 | International Foundation of Employee Benefit Plans Professor since 1993, Wharton School of the University of Pennsylvania. Director of Wharton’s Pension Research Council and Boettner Center on Pensions & Retirement Research, and Research Associate at the National Bureau of Economic Research. Previously taught at Cornell University from 1978 to 1993. | N/A |
| Timothy J. Penny (Born 1951) | Trustee, since 1996; Chair, since 2018 | President and Chief Executive Officer of Southern Minnesota Initiative Foundation, a non-profit organization, since 2007. Member of the Board of Trustees of NorthStar Education Finance, Inc., a non-profit organization, since 2007. | N/A |
| James G. Polisson (Born 1959) | Trustee, since 2018 | Retired. Chief Marketing Officer, Source (ETF) UK Services, Ltd, from 2015 to 2017. From 2012 to 2015, Principal of The Polisson Group, LLC, a management consulting, corporate advisory and principal investing company. Chief Executive Officer and Managing Director at Russell Investments, Global Exchange Traded Funds from 2010 to 2012. Managing Director of Barclays Global Investors from 1998 to 2010 and Global Chief Marketing Officer for iShares and Barclays Global Investors from 2000 to 2010. Trustee of the San Francisco Mechanics’ Institute, a non-profit organization, from 2013 to 2015. Board member of the Russell Exchange Traded Fund Trust from 2011 to 2012. Director of Barclays Global Investors Holdings Deutschland GmbH from 2006 to 2009. Mr. Polisson is an attorney and has a retired status with the Massachusetts and District of Columbia Bar Associations. | N/A |
| Pamela Wheelock (Born 1959) | Trustee, since January 2020; previously Trustee from January 2018 to July 2019 | Board member of the Destination Medical Center Economic Development Agency, Rochester, Minnesota since 2019. Interim President of the McKnight Foundation from January to September 2020. McKnight Foundation Consultant, November 2020 to February 2021. Acting Commissioner, Minnesota Department of Human Services, July 2019 through September 2019. Consultant (part-time), Minnesota Department of Human Services, October 2019 through December 2019. Chief Operating Officer, Twin Cities Habitat for Humanity from 2017 to 2019. Vice President of University Services, University of Minnesota from 2012 to 2016. Prior thereto, on the Board of Directors, Governance Committee and Finance Committee for the Minnesota Philanthropy Partners (Saint Paul Foundation) from 2012 to 2018, Interim Chief Executive Officer of Blue Cross Blue Shield of Minnesota from 2011 to 2012, Chairman of the Board from 2009 to 2012 and Board Director from 2003 to 2015. Vice President, Leadership and Community Engagement, Bush Foundation, Saint Paul, Minnesota (a private foundation) from 2009 to 2011. Executive Vice President and Chief Financial Officer, Minnesota Sports and Entertainment from 2004 to 2009 and Senior Vice President from 2002 to 2004. Executive Vice President of the Minnesota Wild Foundation from 2004 to 2008. Commissioner of Finance, State of Minnesota, from 1999 to 2002. Currently Board Chair of the Minnesota Wild Foundation since 2010. | N/A |
| Name and year of birth | Position held and length of service | Principal occupations during past five years or longer |
| Andrew Owen (Born 1960) | President, since 2017 | President, Chief Executive Officer and Director of Allspring Funds Management, LLC since 2017 and co-president of Galliard Capital Management, LLC, an affiliate of Allspring Funds Management, LLC, since 2019. Prior thereto, Head of Affiliated Managers, Allspring Global Investments, from 2014 to 2019 and Executive Vice President responsible for marketing, investments and product development for Allspring Funds Management, LLC, from 2009 to 2014. In addition, Mr. Owen was an Executive Vice President of Wells Fargo & Company from 2014 to 2021. |
| Jeremy DePalma (Born 1974) | Treasurer, since 2012 (for certain funds in the Fund Complex); since 2021 (for the remaining funds in the Fund Complex) | Senior Vice President of Allspring Funds Management, LLC since 2009. Senior Vice President of Evergreen Investment Management Company, LLC from 2008 to 2010 and head of the Fund Reporting and Control Team within Fund Administration from 2005 to 2010. |
| Kate McKinley (Born 1977) | Chief Legal Officer, since 2021 | Chief Legal Officer of Allspring Global Investments since 2021. Prior thereto, held various roles at State Street Global Advisors beginning in 2010, including serving as Senior Vice President and General Counsel from 2019 to 2021, and Chief Operating Officer of the Institutional Client Group from 2016 - 2019. Prior to working at State Street Global Advisors served as Assistant General Counsel for Bank of America Corporation from 2005 to 2010 and as an Associate at WilmerHale from 2002 to 2005. |
| Christopher Baker (Born 1976) | Chief Compliance Officer, since 2022 | Global Chief Compliance Officer for Allspring Global Investments since 2022. Prior thereto, Chief Compliance Officer for State Street Global Advisors from 2018 to 2021. Senior Compliance Officer for the State Street divisions of Alternative Investment Solutions, Sector Solutions, and Global Marketing from 2015 to 2018. From 2010 to 2015 Vice President, Global Head of Investment and Marketing Compliance for State Street Global Advisors. |
| Matthew Prasse (Born 1983) | Secretary, since 2021 | Senior Counsel of the Allspring Legal Department since 2021. Senior Counsel of the Wells Fargo Legal Department from 2018 to 2021. Previously, Counsel for Barings LLC from 2015 to 2018. Prior to joining Barings, Associate at Morgan, Lewis & Bockius LLP from 2008 to 2015. |
P.O. Box 219967
Kansas City, MO 64121-9967
1-800-222-8222. Read the prospectus carefully before you invest or send money.

Low Volatility Equity Portfolio
| Investment objective | The Portfolio seeks long-term capital appreciation. |
| Adviser | Allspring Funds Management, LLC |
| Subadviser | Allspring Global Investments, LLC |
| Portfolio managers | Dennis Bein, CFA®‡†, Harindra de Silva, Ph.D., CFA®‡, Monisha Jayakumar |
| Ten largest holdings (%) as of February 28, 20221 | |
| The Kroger Company | 1.68 |
| PepsiCo Incorporated | 1.59 |
| Johnson & Johnson | 1.58 |
| Regeneron Pharmaceuticals Incorporated | 1.54 |
| T-Mobile US Incorporated | 1.53 |
| The Procter & Gamble Company | 1.46 |
| Waste Management Incorporated | 1.43 |
| Verizon Communications Incorporated | 1.43 |
| Microsoft Corporation | 1.43 |
| Accenture plc Class A | 1.41 |
| 1 | Figures represent the percentage of the Portfolio's net assets. Holdings are subject to change and may have changed since the date specified. |
| Sector allocation as of February 28, 20221 |

| 1 | Figures represent the percentage of the Portfolio's long-term investments. These amounts are subject to change and may have changed since the date specified. |
| ‡ | CFA® and Chartered Financial Analyst® are trademarks owned by CFA Institute. |
| † | Mr. Bein is expected to retire on September 30, 2022. He will remain a portfolio manager of the Portfolio through June 30, 2022, at which time he will transition to the role of advisor to the team until his retirement. |
| Shares | Value | ||||
| Common stocks: 96.87% | |||||
| Communication services: 10.81% | |||||
| Diversified telecommunication services: 1.98% | |||||
| AT&T Incorporated | 5,605 | $ 132,782 | |||
| Lumen Technologies Incorporated | 393 | 4,071 | |||
| Verizon Communications Incorporated | 6,563 | 352,236 | |||
| 489,089 | |||||
| Entertainment: 3.49% | |||||
| Activision Blizzard Incorporated | 2,511 | 204,647 | |||
| Electronic Arts Incorporated | 1,589 | 206,713 | |||
| Netflix Incorporated † | 352 | 138,871 | |||
| Roku Incorporated † | 11 | 1,535 | |||
| Take-Two Interactive Software Incorporated † | 952 | 154,224 | |||
| The Walt Disney Company † | 1,039 | 154,250 | |||
| 860,240 | |||||
| Interactive media & services: 1.70% | |||||
| Alphabet Incorporated Class A † | 21 | 56,724 | |||
| Alphabet Incorporated Class C † | 126 | 339,925 | |||
| Match Group Incorporated † | 57 | 6,355 | |||
| Meta Platforms Incorporated Class A † | 76 | 16,038 | |||
| 419,042 | |||||
| Media: 2.11% | |||||
| Charter Communications Incorporated Class A † | 205 | 123,365 | |||
| Comcast Corporation Class A | 1,884 | 88,096 | |||
| Fox Corporation Class A | 719 | 30,076 | |||
| Fox Corporation Class B | 479 | 18,327 | |||
| Interpublic Group of Companies Incorporated | 770 | 28,336 | |||
| Liberty Broadband Corporation Class C † | 1,332 | 195,404 | |||
| News Corporation Class A | 344 | 7,678 | |||
| Omnicom Group Incorporated | 255 | 21,392 | |||
| Sirius XM Holdings Incorporated | 981 | 6,043 | |||
| 518,717 | |||||
| Wireless telecommunication services: 1.53% | |||||
| T-Mobile US Incorporated † | 3,061 | 377,146 | |||
| Consumer discretionary: 6.92% | |||||
| Automobiles: 0.07% | |||||
| Ford Motor Company | 504 | 8,850 | |||
| General Motors Company † | 111 | 5,186 | |||
| Lucid Group Incorporated † | 78 | 2,260 | |||
| 16,296 | |||||
| Hotels, restaurants & leisure: 2.31% | |||||
| Domino's Pizza Incorporated | 323 | 139,604 | |||
| McDonald's Corporation | 1,163 | 284,668 | |||
| Starbucks Corporation | 1,347 | 123,641 | |||
| Yum! Brands Incorporated | 164 | 20,103 | |||
| 568,016 |
| Shares | Value | ||||
| Household durables: 0.04% | |||||
| Garmin Limited | 85 | $ 9,387 | |||
| Internet & direct marketing retail: 0.75% | |||||
| Amazon.com Incorporated † | 53 | 162,777 | |||
| Chewy Incorporated Class A † | 191 | 9,004 | |||
| eBay Incorporated | 222 | 12,119 | |||
| 183,900 | |||||
| Leisure products: 0.06% | |||||
| Hasbro Incorporated | 24 | 2,329 | |||
| Peloton Interactive Incorporated Class A † | 449 | 13,048 | |||
| 15,377 | |||||
| Multiline retail: 1.94% | |||||
| Dollar General Corporation | 854 | 169,382 | |||
| Dollar Tree Incorporated † | 455 | 64,646 | |||
| Target Corporation | 1,224 | 244,518 | |||
| 478,546 | |||||
| Specialty retail: 1.60% | |||||
| AutoZone Incorporated † | 81 | 150,935 | |||
| O'Reilly Automotive Incorporated † | 147 | 95,438 | |||
| The Home Depot Incorporated | 471 | 148,756 | |||
| 395,129 | |||||
| Textiles, apparel & luxury goods: 0.15% | |||||
| Nike Incorporated Class B | 272 | 37,142 | |||
| Consumer staples: 11.74% | |||||
| Beverages: 1.60% | |||||
| Boston Beer Company Incorporated Class A † | 4 | 1,534 | |||
| Molson Coors Brewing Company Class B | 35 | 1,826 | |||
| PepsiCo Incorporated | 2,390 | 391,339 | |||
| 394,699 | |||||
| Food & staples retailing: 3.23% | |||||
| Costco Wholesale Corporation | 112 | 58,156 | |||
| The Kroger Company | 8,854 | 414,359 | |||
| Walmart Incorporated | 2,399 | 324,249 | |||
| 796,764 | |||||
| Food products: 3.82% | |||||
| Archer Daniels Midland Company | 397 | 31,145 | |||
| Bunge Limited | 172 | 17,983 | |||
| Campbell Soup Company | 1,021 | 45,914 | |||
| General Mills Incorporated | 1,562 | 105,326 | |||
| Hormel Foods Corporation | 2,937 | 139,919 | |||
| Kellogg Company | 1,635 | 104,542 | |||
| McCormick & Company Incorporated | 128 | 12,182 | |||
| Mondelez International Incorporated Class A | 1,041 | 68,165 | |||
| The Hershey Company | 1,449 | 293,075 | |||
| The J.M. Smucker Company | 644 | 86,779 | |||
| Tyson Foods Incorporated Class A | 375 | 34,748 | |||
| 939,778 |
| Shares | Value | ||||
| Household products: 3.09% | |||||
| Church & Dwight Company Incorporated | 1,095 | $ 107,146 | |||
| Colgate-Palmolive Company | 1,102 | 84,799 | |||
| Kimberly-Clark Corporation | 514 | 66,897 | |||
| The Clorox Company | 987 | 143,895 | |||
| The Procter & Gamble Company | 2,306 | 359,482 | |||
| 762,219 | |||||
| Energy: 0.35% | |||||
| Oil, gas & consumable fuels: 0.35% | |||||
| Cabot Oil & Gas Corporation | 606 | 14,138 | |||
| Cheniere Energy Incorporated | 539 | 71,633 | |||
| 85,771 | |||||
| Financials: 6.64% | |||||
| Capital markets: 1.84% | |||||
| Cboe Global Markets Incorporated | 670 | 78,584 | |||
| CME Group Incorporated | 461 | 109,040 | |||
| FactSet Research Systems Incorporated | 52 | 21,117 | |||
| Intercontinental Exchange Incorporated | 860 | 110,183 | |||
| MarketAxess Holdings Incorporated | 20 | 7,629 | |||
| Raymond James Financial Incorporated | 32 | 3,509 | |||
| Robinhood Markets Incorporated Class A † | 391 | 4,696 | |||
| The Blackstone Group Incorporated Class A | 74 | 9,433 | |||
| The NASDAQ Incorporated | 188 | 32,176 | |||
| Tradeweb Markets Incorporated Class A | 919 | 77,637 | |||
| 454,004 | |||||
| Diversified financial services: 1.39% | |||||
| Berkshire Hathaway Incorporated Class B † | 1,063 | 341,701 | |||
| Insurance: 3.41% | |||||
| Alleghany Corporation † | 13 | 8,605 | |||
| American Financial Group Incorporated | 231 | 31,275 | |||
| Aon plc Class A | 335 | 97,867 | |||
| Arthur J. Gallagher & Company | 921 | 145,693 | |||
| Assurant Incorporated | 41 | 6,958 | |||
| Brown & Brown Incorporated | 1,547 | 104,593 | |||
| Erie Indemnity Company Class A | 294 | 51,479 | |||
| Marsh & McLennan Companies Incorporated | 1,444 | 224,412 | |||
| Progressive Corporation | 1,065 | 112,815 | |||
| The Travelers Companies Incorporated | 79 | 13,575 | |||
| Willis Towers Watson plc | 199 | 44,238 | |||
| 841,510 | |||||
| Health care: 17.57% | |||||
| Biotechnology: 6.18% | |||||
| AbbVie Incorporated | 15 | 2,217 | |||
| Amgen Incorporated | 487 | 110,296 | |||
| Biogen Incorporated † | 79 | 16,670 | |||
| BioMarin Pharmaceutical Incorporated † | 843 | 65,855 | |||
| Gilead Sciences Incorporated | 5,361 | 323,804 | |||
| Horizon Therapeutics plc † | 818 | 74,577 | |||
| Incyte Corporation † | 1,331 | 90,907 |
| Shares | Value | ||||
| Biotechnology (continued) | |||||
| Moderna Incorporated † | 26 | $ 3,994 | |||
| Neurocrine Biosciences Incorporated † | 469 | 42,149 | |||
| Regeneron Pharmaceuticals Incorporated † | 613 | 379,055 | |||
| Seagen Incorporated † | 681 | 87,760 | |||
| Vertex Pharmaceuticals Incorporated † | 1,420 | 326,628 | |||
| 1,523,912 | |||||
| Health care equipment & supplies: 2.88% | |||||
| Abbott Laboratories | 779 | 93,963 | |||
| Baxter International Incorporated | 1,749 | 148,613 | |||
| Becton Dickinson & Company | 789 | 214,040 | |||
| Boston Scientific Corporation † | 151 | 6,670 | |||
| Dentsply Sirona Incorporated | 107 | 5,793 | |||
| Hologic Incorporated † | 73 | 5,195 | |||
| Masimo Corporation † | 243 | 38,260 | |||
| Medtronic plc | 1,177 | 123,573 | |||
| ResMed Incorporated | 35 | 8,636 | |||
| The Cooper Companies Incorporated | 156 | 63,807 | |||
| 708,550 | |||||
| Health care providers & services: 0.92% | |||||
| CVS Health Corporation | 21 | 2,177 | |||
| Humana Incorporated | 50 | 21,716 | |||
| Molina Healthcare Incorporated † | 48 | 14,730 | |||
| Quest Diagnostics Incorporated | 36 | 4,726 | |||
| UnitedHealth Group Incorporated | 388 | 184,638 | |||
| 227,987 | |||||
| Health care technology: 0.08% | |||||
| Veeva Systems Incorporated Class A † | 84 | 19,240 | |||
| Life sciences tools & services: 1.97% | |||||
| Avantor Incorporated † | 145 | 5,030 | |||
| Bio-Rad Laboratories Incorporated Class A † | 96 | 60,092 | |||
| Bio-Techne Corporation | 3 | 1,258 | |||
| Charles River Laboratories International Incorporated † | 15 | 4,367 | |||
| Danaher Corporation | 1,040 | 285,386 | |||
| IQVIA Holdings Incorporated † | 6 | 1,381 | |||
| Thermo Fisher Scientific Incorporated | 130 | 70,720 | |||
| Waters Corporation † | 24 | 7,602 | |||
| West Pharmaceutical Services Incorporated | 126 | 48,772 | |||
| 484,608 | |||||
| Pharmaceuticals: 5.54% | |||||
| Bristol-Myers Squibb Company | 1,343 | 92,224 | |||
| Eli Lilly & Company | 843 | 210,708 | |||
| Jazz Pharmaceuticals plc † | 21 | 2,886 | |||
| Johnson & Johnson | 2,366 | 389,373 | |||
| Merck & Company Incorporated | 4,147 | 317,577 | |||
| Pfizer Incorporated | 5,773 | 270,985 | |||
| Zoetis Incorporated | 421 | 81,527 | |||
| 1,365,280 |
| Shares | Value | ||||
| Industrials: 8.86% | |||||
| Aerospace & defense: 0.39% | |||||
| General Dynamics Corporation | 115 | $ 26,962 | |||
| Huntington Ingalls Industries Incorporated | 86 | 17,578 | |||
| Lockheed Martin Corporation | 54 | 23,425 | |||
| Northrop Grumman Corporation | 62 | 27,413 | |||
| 95,378 | |||||
| Air freight & logistics: 1.71% | |||||
| C.H. Robinson Worldwide Incorporated | 1,701 | 164,453 | |||
| Expeditors International of Washington Incorporated | 1,960 | 202,586 | |||
| United Parcel Service Incorporated Class B | 258 | 54,288 | |||
| 421,327 | |||||
| Commercial services & supplies: 4.35% | |||||
| Republic Services Incorporated | 2,747 | 330,409 | |||
| Rollins Incorporated | 1,724 | 56,254 | |||
| Waste Connections Incorporated | 2,686 | 331,694 | |||
| Waste Management Incorporated | 2,449 | 353,636 | |||
| 1,071,993 | |||||
| Electrical equipment: 0.09% | |||||
| Eaton Corporation plc | 74 | 11,417 | |||
| Emerson Electric Company | 102 | 9,478 | |||
| 20,895 | |||||
| Industrial conglomerates: 0.55% | |||||
| 3M Company | 620 | 92,163 | |||
| Honeywell International Incorporated | 233 | 44,212 | |||
| 136,375 | |||||
| Machinery: 0.09% | |||||
| Otis Worldwide Corporation | 148 | 11,593 | |||
| Pentair plc | 198 | 11,466 | |||
| 23,059 | |||||
| Professional services: 0.53% | |||||
| Booz Allen Hamilton Holding Corporation | 816 | 65,843 | |||
| Jacobs Engineering Group Incorporated | 51 | 6,273 | |||
| Robert Half International Incorporated | 353 | 42,462 | |||
| Verisk Analytics Incorporated | 85 | 15,074 | |||
| 129,652 | |||||
| Road & rail: 1.15% | |||||
| AMERCO | 102 | 58,916 | |||
| J.B. Hunt Transport Services Incorporated | 83 | 16,843 | |||
| Knight-Swift Transportation Holdings Incorporated | 193 | 10,515 | |||
| Old Dominion Freight Line Incorporated | 628 | 197,211 | |||
| 283,485 | |||||
| Information technology: 22.29% | |||||
| Communications equipment: 2.61% | |||||
| Arista Networks Incorporated † | 144 | 17,673 | |||
| Cisco Systems Incorporated | 5,729 | 319,506 |
| Shares | Value | ||||
| Communications equipment (continued) | |||||
| Juniper Networks Incorporated | 1,462 | $ 49,401 | |||
| Motorola Solutions Incorporated | 1,165 | 256,801 | |||
| 643,381 | |||||
| Electronic equipment, instruments & components: 1.85% | |||||
| Amphenol Corporation Class A | 1,826 | 138,794 | |||
| Arrow Electronics Incorporated † | 519 | 63,256 | |||
| CDW Corporation of Delaware | 92 | 15,866 | |||
| Keysight Technologies Incorporated † | 1,296 | 203,952 | |||
| Zebra Technologies Corporation Class A † | 85 | 35,134 | |||
| 457,002 | |||||
| IT services: 9.75% | |||||
| Accenture plc Class A | 1,098 | 346,990 | |||
| Akamai Technologies Incorporated † | 1,377 | 149,074 | |||
| Automatic Data Processing Incorporated | 708 | 144,744 | |||
| Broadridge Financial Solutions Incorporated | 721 | 105,417 | |||
| Cognizant Technology Solutions Corporation Class A | 1,523 | 131,176 | |||
| EPAM Systems Incorporated † | 221 | 45,913 | |||
| Fidelity National Information Services Incorporated | 527 | 50,186 | |||
| Fiserv Incorporated † | 831 | 81,164 | |||
| Gartner Incorporated † | 55 | 15,423 | |||
| International Business Machines Corporation | 547 | 67,013 | |||
| Jack Henry & Associates Incorporated | 1,016 | 179,629 | |||
| MasterCard Incorporated Class A | 451 | 162,730 | |||
| Paychex Incorporated | 2,747 | 327,058 | |||
| The Western Union Company | 4,868 | 88,500 | |||
| VeriSign Incorporated † | 948 | 202,607 | |||
| Visa Incorporated Class A | 1,406 | 303,865 | |||
| 2,401,489 | |||||
| Semiconductors & semiconductor equipment: 1.23% | |||||
| Analog Devices Incorporated | 13 | 2,084 | |||
| Broadcom Incorporated | 124 | 72,843 | |||
| Intel Corporation | 397 | 18,937 | |||
| ON Semiconductor Corporation † | 70 | 4,383 | |||
| Skyworks Solutions Incorporated | 22 | 3,040 | |||
| Texas Instruments Incorporated | 1,188 | 201,948 | |||
| 303,235 | |||||
| Software: 6.81% | |||||
| Adobe Incorporated † | 558 | 260,965 | |||
| Bentley Systems Incorporated Class B | 23 | 883 | |||
| Black Knight Incorporated † | 1,408 | 79,116 | |||
| Citrix Systems Incorporated | 1,277 | 130,893 | |||
| Dropbox Incorporated Class A † | 1,109 | 25,163 | |||
| Fair Isaac Corporation † | 20 | 9,424 | |||
| Fortinet Incorporated † | 123 | 42,376 | |||
| Intuit Incorporated | 162 | 76,848 | |||
| Microsoft Corporation | 1,177 | 351,676 | |||
| NortonLifeLock Incorporated | 1,667 | 48,310 | |||
| Oracle Corporation | 3,723 | 282,836 | |||
| Palo Alto Networks Incorporated † | 84 | 49,917 | |||
| PTC Incorporated † | 9 | 1,002 | |||
| SS&C Technologies Holdings Incorporated | 128 | 9,596 |
| Shares | Value | ||||
| Software (continued) | |||||
| Tyler Technologies Incorporated † | 434 | $ 185,865 | |||
| VMware Incorporated Class A | 250 | 29,330 | |||
| Zoom Video Communications Incorporated † | 399 | 52,907 | |||
| Zscaler Incorporated † | 166 | 39,699 | |||
| 1,676,806 | |||||
| Technology hardware, storage & peripherals: 0.04% | |||||
| Apple Incorporated | 63 | 10,403 | |||
| Materials: 1.49% | |||||
| Chemicals: 0.18% | |||||
| Air Products & Chemicals Incorporated | 92 | 21,740 | |||
| CF Industries Holdings Incorporated | 66 | 5,359 | |||
| Linde plc | 19 | 5,572 | |||
| The Mosaic Company | 239 | 12,531 | |||
| 45,202 | |||||
| Containers & packaging: 0.06% | |||||
| Amcor plc | 851 | 9,897 | |||
| Packaging Corporation of America | 39 | 5,740 | |||
| 15,637 | |||||
| Metals & mining: 1.25% | |||||
| Newmont Corporation | 4,639 | 307,102 | |||
| Real estate: 2.61% | |||||
| Equity REITs: 2.59% | |||||
| American Tower Corporation | 131 | 29,720 | |||
| AvalonBay Communities Incorporated | 48 | 11,452 | |||
| Camden Property Trust | 66 | 10,897 | |||
| Crown Castle International Corporation | 706 | 117,613 | |||
| Equinix Incorporated | 11 | 7,807 | |||
| Equity Residential | 120 | 10,236 | |||
| Essex Property Trust Incorporated | 18 | 5,709 | |||
| Extra Space Storage Incorporated | 180 | 33,867 | |||
| Iron Mountain Incorporated | 132 | 6,492 | |||
| Mid-America Apartment Communities Incorporated | 90 | 18,415 | |||
| Public Storage Incorporated | 886 | 314,548 | |||
| Regency Centers Corporation | 35 | 2,306 | |||
| SBA Communications Corporation | 227 | 68,870 | |||
| 637,932 | |||||
| Real estate management & development: 0.02% | |||||
| CBRE Group Incorporated Class A † | 64 | 6,198 | |||
| Utilities: 7.59% | |||||
| Electric utilities: 4.78% | |||||
| Alliant Energy Corporation | 738 | 43,099 | |||
| American Electric Power Company Incorporated | 1,003 | 90,922 | |||
| Constellation Newenergy | 70 | 3,219 | |||
| Duke Energy Corporation | 2,264 | 227,328 | |||
| Evergy Incorporated | 400 | 24,964 | |||
| Eversource Energy | 452 | 36,974 | |||
| Exelon Corporation | 210 | 8,938 |
| Shares | Value | ||||
| Electric utilities (continued) | |||||
| FirstEnergy Corporation | 391 | $ 16,363 | |||
| NextEra Energy Incorporated | 3,810 | 298,209 | |||
| The Southern Company | 3,213 | 208,106 | |||
| Xcel Energy Incorporated | 3,257 | 219,294 | |||
| 1,177,416 | |||||
| Gas utilities: 0.04% | |||||
| UGI Corporation | 256 | 9,841 | |||
| Multi-utilities: 2.70% | |||||
| Ameren Corporation | 486 | 41,772 | |||
| CenterPoint Energy Incorporated | 124 | 3,391 | |||
| CMS Energy Corporation | 781 | 49,992 | |||
| Consolidated Edison Incorporated | 2,733 | 234,409 | |||
| Dominion Energy Incorporated | 1,111 | 88,358 | |||
| DTE Energy Company | 38 | 4,620 | |||
| NiSource Incorporated | 908 | 26,268 | |||
| Public Service Enterprise Group Incorporated | 204 | 13,225 | |||
| WEC Energy Group Incorporated | 2,225 | 202,208 | |||
| 664,243 | |||||
| Water utilities: 0.07% | |||||
| American Water Works Company Incorporated | 105 | 15,864 | |||
| Essential Utilities Incorporated | 34 | 1,602 | |||
| 17,466 | |||||
| Total Common stocks (Cost $21,363,373) | 23,869,567 |
| Yield | |||||
| Short-term investments: 2.59% | |||||
| Investment companies: 2.59% | |||||
| Allspring Government Money Market Fund Select Class ♠∞ | 0.03% | 637,405 | 637,405 | ||
| Total Short-term investments (Cost $637,405) | 637,405 | ||||
| Total investments in securities (Cost $22,000,778) | 99.46% | 24,506,972 | |||
| Other assets and liabilities, net | 0.54 | 133,341 | |||
| Total net assets | 100.00% | $24,640,313 |
| † | Non-income-earning security |
| ♠ | The issuer of the security is an affiliated person of the Portfolio as defined in the Investment Company Act of 1940. |
| ∞ | The rate represents the 7-day annualized yield at period end. |
| Abbreviations: | |
| REIT | Real estate investment trust |
| Value, beginning of period | Purchases | Sales proceeds | Net realized gains (losses) | Net change in unrealized gains (losses) | Value, end of period | Shares, end of period | Income from affiliated securities | |
| Short-term investments | ||||||||
| Allspring Government Money Market Fund Select Class | $302,669 | $9,306,341 | $(8,971,605) | $0 | $0 | $637,405 | 637,405 | $177 |
| Description | Number of contracts | Expiration date | Notional cost | Notional value | Unrealized gains | Unrealized losses |
| Long | ||||||
| E-Mini S&P 500 Index | 3 | 3-18-2022 | $678,156 | $655,200 | $0 | $(22,956) |
| Assets | |
Investments in unaffiliated securities, at value (cost $21,363,373) | $ 23,869,567 |
Investments in affiliated securities, at value (cost $637,405) | 637,405 |
Cash at broker segregated for futures contracts | 140,000 |
Receivable for dividends | 32,746 |
Receivable from adviser | 5,239 |
Prepaid expenses and other assets | 632 |
Total assets | 24,685,589 |
| Liabilities | |
Professional fees payable | 37,019 |
Custody and accounting fees payable | 2,706 |
Payable for daily variation margin on open futures contracts | 1,800 |
Trustees’ fees and expenses payable | 1,208 |
Accrued expenses and other liabilities | 2,543 |
Total liabilities | 45,276 |
Total net assets | $24,640,313 |
| Investment income | |
Dividends (net of foreign withholdings taxes of $3,566) | $ 394,532 |
Income from affiliated securities | 177 |
Total investment income | 394,709 |
| Expenses | |
Advisory fee | 25,260 |
Custody and accounting fees | 10,417 |
Professional fees | 51,930 |
Interest holder report expenses | 11,843 |
Trustees’ fees and expenses | 20,065 |
Other fees and expenses | 4,186 |
Total expenses | 123,701 |
Less: Fee waivers and/or expense reimbursements | (88,336) |
Net expenses | 35,365 |
Net investment income | 359,344 |
| Realized and unrealized gains (losses) on investments | |
| Net realized gains on | |
Unaffiliated securities | 1,862,689 |
Futures contracts | 134,553 |
Net realized gains on investments | 1,997,242 |
| Net change in unrealized gains (losses) on | |
Unaffiliated securities | 1,113,723 |
Futures contracts | (19,059) |
Net change in unrealized gains (losses) on investments | 1,094,664 |
Net realized and unrealized gains (losses) on investments | 3,091,906 |
Net increase in net assets resulting from operations | $3,451,250 |
| Year ended February 28, 2022 | Year ended February 28, 20211 | |
| Operations | ||
Net investment income | $ 359,344 | $ 264,813 |
Net realized gains on investments | 1,997,242 | 580,835 |
Net change in unrealized gains (losses) on investments | 1,094,664 | 1,388,574 |
Net increase in net assets resulting from operations | 3,451,250 | 2,234,222 |
| Capital transactions | ||
| Transactions in investors’ beneficial interests | ||
Contributions | 4,299,036 | 27,817,254 |
Withdrawals | (8,615,350) | (4,546,099) |
Net increase (decrease) in net assets resulting from capital transactions | (4,316,314) | 23,271,155 |
Total increase (decrease) in net assets | (865,064) | 25,505,377 |
| Net assets | ||
Beginning of period | 25,505,377 | 0 |
End of period | $24,640,313 | $25,505,377 |
| 1 | For the period from July 1, 2020 (commencement of operations) to February 28, 2021 |
| Year ended February 28 | ||
| 2022 | 2021 1 | |
Total return2 | 13.50% | 9.42% |
| Ratios to average net assets (annualized) | ||
Gross expenses | 0.49% | 0.63% |
Net expenses | 0.14% * | 0.14% * |
Net investment income | 1.42% | 1.64% |
| Supplemental data | ||
Portfolio turnover rate | 44% | 18% |
| * | Ratio includes expenses which were voluntarily waived by the adviser. Without these voluntary waivers, the net expense ratios would be increased by the following amounts: |
| Year ended February 28, 2022 | 0.35% |
| Year ended February 28, 20211 | 0.49% |
| 1 | For the period from July 1, 2020 (commencement of operations) to February 28, 2021 |
| 2 | Returns for periods of less than one year are not annualized. |
| Gross unrealized gains | $3,307,578 |
| Gross unrealized losses | (837,982) |
| Net unrealized gains | $2,469,596 |
| ■ | Level 1 – quoted prices in active markets for identical securities |
| ■ | Level 2 – other significant observable inputs (including quoted prices for similar securities, interest rates, prepayment speeds, credit risk, etc.) |
| ■ | Level 3 – significant unobservable inputs (including the Portfolio’s own assumptions in determining the fair value of investments) |
| Quoted prices (Level 1) | Other significant observable inputs (Level 2) | Significant unobservable inputs (Level 3) | Total | |
| Assets | ||||
| Investments in: | ||||
| Common stocks | ||||
| Communication services | $ 2,664,234 | $0 | $0 | $ 2,664,234 |
| Consumer discretionary | 1,703,793 | 0 | 0 | 1,703,793 |
| Consumer staples | 2,893,460 | 0 | 0 | 2,893,460 |
| Energy | 85,771 | 0 | 0 | 85,771 |
| Financials | 1,637,215 | 0 | 0 | 1,637,215 |
| Health care | 4,329,577 | 0 | 0 | 4,329,577 |
| Industrials | 2,182,164 | 0 | 0 | 2,182,164 |
| Information technology | 5,492,316 | 0 | 0 | 5,492,316 |
| Materials | 367,941 | 0 | 0 | 367,941 |
| Real estate | 644,130 | 0 | 0 | 644,130 |
| Utilities | 1,868,966 | 0 | 0 | 1,868,966 |
| Short-term investments | ||||
| Investment companies | 637,405 | 0 | 0 | 637,405 |
| Total assets | $24,506,972 | $0 | $0 | $24,506,972 |
| Liabilities | ||||
| Futures contracts | $ 22,956 | $0 | $0 | $ 22,956 |
| Total liabilities | $ 22,956 | $0 | $0 | $ 22,956 |
| Average daily net assets | Advisory fee |
| First $5 billion | 0.100% |
| Next $5 billion | 0.080 |
| Over $10 billion | 0.060 |
Allspring Master Trust:

| Name and year of birth | Position held and length of service* | Principal occupations during past five years or longer | Current other public company or investment company directorships |
| William R. Ebsworth (Born 1957) | Trustee, since 2015 | Retired. From 1984 to 2013, equities analyst, portfolio manager, research director and chief investment officer at Fidelity Management and Research Company in Boston, Tokyo, and Hong Kong, and retired in 2013 as Chief Investment Officer of Fidelity Strategic Advisers, Inc. where he led a team of investment professionals managing client assets. Prior thereto, Board member of Hong Kong Securities Clearing Co., Hong Kong Options Clearing Corp., the Thailand International Fund, Ltd., Fidelity Investments Life Insurance Company, and Empire Fidelity Investments Life Insurance Company. Audit Committee Chair and Investment Committee Chair of the Vincent Memorial Hospital Endowment (non-profit organization). Mr. Ebsworth is a CFA® charterholder. | N/A |
| Jane A. Freeman (Born 1953) | Trustee, since 2015; Chair Liaison, since 2018 | Retired. From 2012 to 2014 and 1999 to 2008, Chief Financial Officer of Scientific Learning Corporation. From 2008 to 2012, Ms. Freeman provided consulting services related to strategic business projects. Prior to 1999, Portfolio Manager at Rockefeller & Co. and Scudder, Stevens & Clark. Board member of the Harding Loevner Funds from 1996 to 2014, serving as both Lead Independent Director and chair of the Audit Committee. Board member of the Russell Exchange Traded Funds Trust from 2011 to 2012 and the chair of the Audit Committee. Ms. Freeman is also an inactive Chartered Financial Analyst. | N/A |
| Isaiah Harris, Jr. (Born 1952) | Trustee, since 2009; Audit Committee Chair, since 2019 | Retired. Chairman of the Board of CIGNA Corporation from 2009 to 2021, and Director from 2005 to 2008. From 2003 to 2011, Director of Deluxe Corporation. Prior thereto, President and CEO of BellSouth Advertising and Publishing Corp. from 2005 to 2007, President and CEO of BellSouth Enterprises from 2004 to 2005 and President of BellSouth Consumer Services from 2000 to 2003. Emeritus member of the Iowa State University Foundation Board of Governors. Emeritus Member of the Advisory Board of Iowa State University School of Business. Advisory Board Member, Palm Harbor Academy (private school). Advisory Board Member, Fellowship of Christian Athletes. Mr. Harris is a certified public accountant (inactive status). | N/A |
| David F. Larcker (Born 1950) | Trustee, since 2009 | James Irvin Miller Professor of Accounting at the Graduate School of Business (Emeritus), Stanford University, Director of the Corporate Governance Research Initiative and Senior Faculty of The Rock Center for Corporate Governance since 2006. From 2005 to 2008, Professor of Accounting at the Graduate School of Business, Stanford University. Prior thereto, Ernst & Young Professor of Accounting at The Wharton School, University of Pennsylvania from 1985 to 2005. | N/A |
| Name and year of birth | Position held and length of service* | Principal occupations during past five years or longer | Current other public company or investment company directorships |
| Olivia S. Mitchell (Born 1953) | Trustee, since 2006; Nominating and Governance Committee Chair, since 2018 | International Foundation of Employee Benefit Plans Professor since 1993, Wharton School of the University of Pennsylvania. Director of Wharton’s Pension Research Council and Boettner Center on Pensions & Retirement Research, and Research Associate at the National Bureau of Economic Research. Previously taught at Cornell University from 1978 to 1993. | N/A |
| Timothy J. Penny (Born 1951) | Trustee, since 1996; Chair, since 2018 | President and Chief Executive Officer of Southern Minnesota Initiative Foundation, a non-profit organization, since 2007. Member of the Board of Trustees of NorthStar Education Finance, Inc., a non-profit organization, since 2007. | N/A |
| James G. Polisson (Born 1959) | Trustee, since 2018 | Retired. Chief Marketing Officer, Source (ETF) UK Services, Ltd, from 2015 to 2017. From 2012 to 2015, Principal of The Polisson Group, LLC, a management consulting, corporate advisory and principal investing company. Chief Executive Officer and Managing Director at Russell Investments, Global Exchange Traded Funds from 2010 to 2012. Managing Director of Barclays Global Investors from 1998 to 2010 and Global Chief Marketing Officer for iShares and Barclays Global Investors from 2000 to 2010. Trustee of the San Francisco Mechanics’ Institute, a non-profit organization, from 2013 to 2015. Board member of the Russell Exchange Traded Fund Trust from 2011 to 2012. Director of Barclays Global Investors Holdings Deutschland GmbH from 2006 to 2009. Mr. Polisson is an attorney and has a retired status with the Massachusetts and District of Columbia Bar Associations. | N/A |
| Pamela Wheelock (Born 1959) | Trustee, since January 2020; previously Trustee from January 2018 to July 2019 | Board member of the Destination Medical Center Economic Development Agency, Rochester, Minnesota since 2019. Interim President of the McKnight Foundation from January to September 2020. McKnight Foundation Consultant, November 2020 to February 2021. Acting Commissioner, Minnesota Department of Human Services, July 2019 through September 2019. Consultant (part-time), Minnesota Department of Human Services, October 2019 through December 2019. Chief Operating Officer, Twin Cities Habitat for Humanity from 2017 to 2019. Vice President of University Services, University of Minnesota from 2012 to 2016. Prior thereto, on the Board of Directors, Governance Committee and Finance Committee for the Minnesota Philanthropy Partners (Saint Paul Foundation) from 2012 to 2018, Interim Chief Executive Officer of Blue Cross Blue Shield of Minnesota from 2011 to 2012, Chairman of the Board from 2009 to 2012 and Board Director from 2003 to 2015. Vice President, Leadership and Community Engagement, Bush Foundation, Saint Paul, Minnesota (a private foundation) from 2009 to 2011. Executive Vice President and Chief Financial Officer, Minnesota Sports and Entertainment from 2004 to 2009 and Senior Vice President from 2002 to 2004. Executive Vice President of the Minnesota Wild Foundation from 2004 to 2008. Commissioner of Finance, State of Minnesota, from 1999 to 2002. Currently Board Chair of the Minnesota Wild Foundation since 2010. | N/A |
| Name and year of birth | Position held and length of service | Principal occupations during past five years or longer |
| Andrew Owen (Born 1960) | President, since 2017 | President, Chief Executive Officer and Director of Allspring Funds Management, LLC since 2017 and co-president of Galliard Capital Management, LLC, an affiliate of Allspring Funds Management, LLC, since 2019. Prior thereto, Head of Affiliated Managers, Allspring Global Investments, from 2014 to 2019 and Executive Vice President responsible for marketing, investments and product development for Allspring Funds Management, LLC, from 2009 to 2014. In addition, Mr. Owen was an Executive Vice President of Wells Fargo & Company from 2014 to 2021. |
| Jeremy DePalma (Born 1974) | Treasurer, since 2012 (for certain funds in the Fund Complex); since 2021 (for the remaining funds in the Fund Complex) | Senior Vice President of Allspring Funds Management, LLC since 2009. Senior Vice President of Evergreen Investment Management Company, LLC from 2008 to 2010 and head of the Fund Reporting and Control Team within Fund Administration from 2005 to 2010. |
| Kate McKinley (Born 1977) | Chief Legal Officer, since 2021 | Chief Legal Officer of Allspring Global Investments since 2021. Prior thereto, held various roles at State Street Global Advisors beginning in 2010, including serving as Senior Vice President and General Counsel from 2019 to 2021, and Chief Operating Officer of the Institutional Client Group from 2016 - 2019. Prior to working at State Street Global Advisors served as Assistant General Counsel for Bank of America Corporation from 2005 to 2010 and as an Associate at WilmerHale from 2002 to 2005. |
| Christopher Baker (Born 1976) | Chief Compliance Officer, since 2022 | Global Chief Compliance Officer for Allspring Global Investments since 2022. Prior thereto, Chief Compliance Officer for State Street Global Advisors from 2018 to 2021. Senior Compliance Officer for the State Street divisions of Alternative Investment Solutions, Sector Solutions, and Global Marketing from 2015 to 2018. From 2010 to 2015 Vice President, Global Head of Investment and Marketing Compliance for State Street Global Advisors. |
| Matthew Prasse (Born 1983) | Secretary, since 2021 | Senior Counsel of the Allspring Legal Department since 2021. Senior Counsel of the Wells Fargo Legal Department from 2018 to 2021. Previously, Counsel for Barings LLC from 2015 to 2018. Prior to joining Barings, Associate at Morgan, Lewis & Bockius LLP from 2008 to 2015. |
P.O. Box 219967
Kansas City, MO 64121-9967
1-800-222-8222. Read the prospectus carefully before you invest or send money.

U.S. Small Cap Equity Portfolio
| Investment objective | The Portfolio seeks long-term capital appreciation. |
| Adviser | Allspring Funds Management, LLC |
| Subadviser | Allspring Global Investments, LLC |
| Portfolio managers | Dennis Bein, CFA®‡†, Harindra de Silva, Ph.D., CFA®‡, Monisha Jayakumar |
| Holdings (%) as of February 28, 20221 | |
| Ovintiv Incorporated | 0.40 |
| Macy's Incorporated | 0.38 |
| Tenet Healthcare Corporation | 0.35 |
| Chimera Investment Corporation | 0.35 |
| AMC Entertainment Holdings Class A | 0.35 |
| Houghton Mifflin Harcourt Company | 0.34 |
| Prestige Consumer Healthcare Incorporated | 0.32 |
| Retail Opportunity Investment Corporation | 0.31 |
| Halozyme Therapeutics Incorporated | 0.29 |
| RPT Realty | 0.28 |
| 1 | Figures represent the percentage of the Portfolio's net assets. Holdings are subject to change and may have changed since the date specified. |
| Sector allocation as of February 28, 20221 |
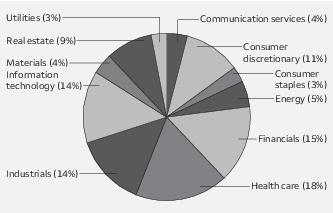
| 1 | Figures represent the percentage of the Portfolio's long-term investments. These amounts are subject to change and may have changed since the date specified. |
| ‡ | CFA® and Chartered Financial Analyst® are trademarks owned by CFA Institute. |
| † | Mr. Bein is expected to retire on September 30, 2022. He will remain a portfolio manager of the Portfolio through June 30, 2022, at which time he will transition to the role of advisor to the team until his retirement. |
| Shares | Value | ||||
| Common stocks: 97.09% | |||||
| Communication services: 3.59% | |||||
| Diversified telecommunication services: 0.74% | |||||
| ATN International Incorporated | 16 | $ 533 | |||
| Cogent Communications Group Incorporated | 2,613 | 165,664 | |||
| Consolidated Communications Holdings Incorporated † | 4,498 | 32,026 | |||
| Echostar Corporation † | 7,682 | 186,980 | |||
| Globalstar Incorporated † | 41,947 | 49,497 | |||
| IDT Corporation Class B † | 7,486 | 269,945 | |||
| Iridium Communications Incorporated † | 6,807 | 269,489 | |||
| Liberty Latin America Class A † | 14,749 | 148,227 | |||
| Liberty Latin America Class C † | 10,131 | 102,222 | |||
| Ooma Incorporated † | 5,116 | 85,540 | |||
| Radius Global Infrastructure Incorporated Class A † | 8,564 | 110,133 | |||
| 1,420,256 | |||||
| Entertainment: 0.75% | �� | ||||
| Akazoo SA ♦† | 5,400 | 0 | |||
| AMC Entertainment Holdings Class A † | 35,183 | 663,551 | |||
| Chicken Soup for the Soul Entertainment Incorporated † | 3,433 | 33,300 | |||
| Cinemark Holdings Incorporated † | 7,526 | 132,006 | |||
| CuriosityStream Incorporated † | 1,854 | 6,786 | |||
| IMAX Corporation † | 3,207 | 66,321 | |||
| Lions Gate Entertainment Class A † | 4,024 | 61,809 | |||
| Lions Gate Entertainment Class B † | 8,161 | 116,294 | |||
| LiveOne Incorporated † | 13,645 | 11,672 | |||
| Marcus Corporation † | 15,592 | 283,463 | |||
| The Madison Square Garden Entertainment Corporation † | 728 | 57,046 | |||
| 1,432,248 | |||||
| Interactive media & services: 0.82% | |||||
| Actua Corporation ♦† | 9,483 | 0 | |||
| CarGurus Incorporated † | 8,424 | 408,143 | |||
| Cars.com Incorporated † | 21,064 | 340,816 | |||
| Eventbrite Incorporated Class A † | 1,508 | 22,786 | |||
| EverQuote Incorporated Class A † | 1,205 | 17,930 | |||
| FuboTV Incorporated † | 6,390 | 54,635 | |||
| MediaAlpha Incorporated Class A † | 1,447 | 20,779 | |||
| Outbrain Incorporated † | 4,729 | 61,666 | |||
| QuinStreet Incorporated † | 3,469 | 39,026 | |||
| TrueCar Incorporated † | 1,807 | 6,035 | |||
| Yelp Incorporated † | 6,102 | 206,797 | |||
| Ziff Davis Incorporated | 4,033 | 405,720 | |||
| 1,584,333 | |||||
| Media: 1.13% | |||||
| AMC Networks Incorporated Class A † | 2,010 | 83,315 | |||
| Audacy Incorporated † | 7,925 | 24,568 | |||
| Boston Omaha Corporation Class A † | 325 | 9,097 | |||
| Clear Channel Outdoor Holdings † | 4,655 | 17,410 | |||
| Entravision Communications Corporation Class A | 30,796 | 197,094 | |||
| Fluent Incorporated † | 23,478 | 33,339 | |||
| Gannett Company Incorporated † | 9,566 | 47,447 | |||
| Gray Television Incorporated | 5,844 | 136,925 | |||
| Hemisphere Media Group Incorporated † | 1,097 | 5,869 |
| Shares | Value | ||||
| Media (continued) | |||||
| iHeartMedia Incorporated Class A † | 9,917 | $ 212,720 | |||
| John Wiley & Sons Incorporated Class A | 4,254 | 214,019 | |||
| Magnite Incorporated † | 4,536 | 66,135 | |||
| Scholastic Corporation | 3,169 | 133,352 | |||
| Sinclair Broadcast Group Incorporated Class A | 685 | 20,550 | |||
| Stagwell Incorporated † | 17,543 | 132,976 | |||
| TechTarget Incorporated † | 457 | 35,820 | |||
| Tegna Incorporated | 20,171 | 462,319 | |||
| The E.W. Scripps Company Class A † | 5,305 | 118,089 | |||
| Thryv Holdings Incorporated † | 5,298 | 161,059 | |||
| WideOpenWest Incorporated † | 2,953 | 50,171 | |||
| 2,162,274 | |||||
| Wireless telecommunication services: 0.15% | |||||
| Gogo Incorporated † | 5,567 | 79,274 | |||
| NII Holdings Incorporated ♦‡† | 14,979 | 7,490 | |||
| Shenandoah Telecommunications Company | 1,526 | 34,106 | |||
| Telephone & Data Systems Incorporated | 8,459 | 146,764 | |||
| United States Cellular Corporation † | 1,040 | 28,610 | |||
| 296,244 | |||||
| Consumer discretionary: 10.88% | |||||
| Auto components: 1.13% | |||||
| Adient plc † | 6,333 | 283,402 | |||
| American Axle & Manufacturing Holdings Incorporated † | 21,952 | 203,276 | |||
| Dana Incorporated | 10,761 | 200,370 | |||
| Dorman Products Incorporated † | 443 | 41,385 | |||
| Fox Factory Holding Corporation † | 1,871 | 220,815 | |||
| Gentherm Incorporated † | 1,893 | 160,602 | |||
| LCI Industries | 1,251 | 155,775 | |||
| Modine Manufacturing Company † | 3,389 | 34,229 | |||
| Patrick Industries Incorporated | 1,603 | 114,358 | |||
| Standard Motor Products Incorporated | 588 | 25,701 | |||
| Tenneco Incorporated † | 12,880 | 248,326 | |||
| The Goodyear Tire & Rubber Company † | 15,989 | 247,670 | |||
| Visteon Corporation † | 1,447 | 173,886 | |||
| XPEL Incorporated † | 740 | 53,724 | |||
| 2,163,519 | |||||
| Automobiles: 0.41% | |||||
| Canoo Incorporated † | 36,144 | 207,467 | |||
| Fisker Incorporated † | 1,282 | 15,640 | |||
| Lordstown Motors Corporation Class A † | 6,612 | 16,993 | |||
| Winnebago Industries Incorporated | 8,201 | 525,438 | |||
| Workhorse Group Incorporated † | 8,451 | 26,452 | |||
| 791,990 | |||||
| Distributors: 0.05% | |||||
| Funko Incorporated Class A † | 5,370 | 93,760 | |||
| Diversified consumer services: 0.92% | |||||
| 2U Incorporated † | 4,849 | 50,915 | |||
| Adtalem Global Education Incorporated † | 3,340 | 69,405 | |||
| American Public Education Incorporated † | 1,328 | 26,507 | |||
| Carriage Services Incorporated | 3,011 | 148,171 |
| Shares | Value | ||||
| Diversified consumer services (continued) | |||||
| European Wax Center Incorporated † | 1,055 | $ 26,238 | |||
| Graham Holdings Company Class B | 506 | 304,172 | |||
| Houghton Mifflin Harcourt Company † | 30,840 | 646,098 | |||
| Laureate Education Incorporated Class A | 8,212 | 89,018 | |||
| Perdoceo Education Corporation † | 15,100 | 158,097 | |||
| Regis Corporation † | 1,693 | 3,064 | |||
| StoneMor Incorporated † | 2,188 | 5,689 | |||
| Strategic Education Incorporated | 1,250 | 73,775 | |||
| Stride Incorporated † | 3,661 | 122,936 | |||
| WW International Incorporated † | 3,584 | 36,521 | |||
| 1,760,606 | |||||
| Hotels, restaurants & leisure: 2.64% | |||||
| Biglari Holdings Incorporated Class B † | 923 | 126,848 | |||
| BJ's Restaurants Incorporated † | 1,449 | 46,469 | |||
| Bloomin' Brands Incorporated | 14,847 | 365,385 | |||
| Bluegreen Vacations Holding † | 11,181 | 316,870 | |||
| Brinker International Incorporated † | 3,139 | 133,533 | |||
| Carrols Restaurant Group Incorporated | 2,162 | 5,708 | |||
| Chuy's Holding Incorporated † | 1,687 | 54,996 | |||
| Cracker Barrel Old Country Store Incorporated | 1,596 | 214,295 | |||
| Dave & Buster's Entertainment Incorporated † | 2,949 | 127,810 | |||
| Denny’s Corporation † | 7,986 | 126,339 | |||
| Dine Brands Global Incorporated | 1,740 | 145,882 | |||
| Drive Shack Incorporated † | 5,825 | 7,747 | |||
| El Pollo Loco Holdings Incorporated † | 2,818 | 37,395 | |||
| Everi Holdings Incorporated † | 8,334 | 195,016 | |||
| F45 Training Holdings Incorporated † | 2,965 | 45,602 | |||
| Fiesta Restaurant Group Incorporated † | 1,346 | 13,554 | |||
| Full House Resorts Incorporated † | 5,507 | 48,462 | |||
| Golden Entertainment Incorporated † | 3,762 | 214,171 | |||
| Hall of Fame Resort & Entertainment Company † | 3,623 | 3,840 | |||
| Hilton Grand Vacations Incorporated † | 2,639 | 136,859 | |||
| International Game Technology plc | 2,986 | 91,431 | |||
| Jack In The Box Incorporated | 1,531 | 132,079 | |||
| Kura Sushi USA Incorporated Class A † | 105 | 5,534 | |||
| Monarch Casino & Resort Incorporated † | 398 | 31,004 | |||
| Nathan's Famous Incorporated | 834 | 48,497 | |||
| Noodles & Company † | 10,787 | 73,783 | |||
| Papa John's International Incorporated | 2,111 | 225,497 | |||
| RCI Hospitality Holdings Incorporated | 1,576 | 102,314 | |||
| Red Robin Gourmet Burgers Incorporated † | 2,242 | 39,347 | |||
| Red Rock Resorts Incorporated Class A | 5,693 | 286,244 | |||
| Rush Street Interactive Incorporated † | 3,432 | 35,453 | |||
| Ruth's Hospitality Group Incorporated | 2,297 | 56,989 | |||
| Scientific Games Corporation † | 4,838 | 304,407 | |||
| SeaWorld Entertainment Incorporated † | 2,482 | 172,226 | |||
| Target Hospitality Corporation † | 9,850 | 31,028 | |||
| Texas Roadhouse Incorporated | 4,369 | 414,662 | |||
| The Cheesecake Factory Incorporated † | 3,184 | 136,243 | |||
| The ONE Group Hospitality Incorporated † | 26,605 | 312,343 | |||
| Wingstop Incorporated | 1,419 | 206,252 | |||
| 5,072,114 |
| Shares | Value | ||||
| Household durables: 1.56% | |||||
| Bassett Furniture Industries Incorporated | 3,645 | $ 63,970 | |||
| Beazer Homes Incorporated † | 5,777 | 94,569 | |||
| Cavco Industries Incorporated † | 309 | 84,243 | |||
| Century Communities Incorporated | 3,515 | 223,976 | |||
| Ethan Allen Interiors Incorporated | 5,503 | 143,408 | |||
| Flexsteel Industries Incorporated | 1,142 | 24,656 | |||
| GoPro Incorporated Class A † | 9,097 | 78,234 | |||
| Green Brick Partners Incorporated † | 3,099 | 71,866 | |||
| Hamilton Beach Brand Class A | 3,344 | 50,494 | |||
| Helen of Troy Limited † | 830 | 170,706 | |||
| Hooker Furniture Corporation | 2,608 | 54,768 | |||
| Installed Building Products Incorporated | 425 | 41,098 | |||
| KB Home Incorporated | 4,646 | 179,382 | |||
| La-Z-Boy Incorporated | 657 | 19,171 | |||
| LGI Homes Incorporated † | 1,300 | 163,969 | |||
| Lifetime Brands Incorporated | 2,492 | 32,645 | |||
| M/I Homes Incorporated † | 2,695 | 132,837 | |||
| MDC Holdings Incorporated | 3,363 | 149,115 | |||
| Meritage Corporation † | 2,212 | 218,059 | |||
| Skyline Champion Corporation † | 3,342 | 224,716 | |||
| Snap One Holdings Corporation † | 65 | 1,277 | |||
| Sonos Incorporated † | 5,662 | 155,082 | |||
| Taylor Morrison Home Corporation † | 7,217 | 212,902 | |||
| The Lovesac Company † | 157 | 6,671 | |||
| Traeger Incorporated † | 1,581 | 15,604 | |||
| TRI Pointe Homes Incorporated † | 8,546 | 191,174 | |||
| Tupperware Brands Corporation † | 6,434 | 117,292 | |||
| Universal Electronics Incorporated † | 880 | 29,242 | |||
| Voxx International Corporation † | 4,802 | 51,525 | |||
| 3,002,651 | |||||
| Internet & direct marketing retail: 0.56% | |||||
| 1-800-Flowers.com Incorporated Class A † | 1,842 | 28,514 | |||
| CarParts.com Incorporated † | 5,497 | 46,010 | |||
| Duluth Holdings Incorporated Class B † | 7,222 | 100,602 | |||
| Groupon Incorporated † | 1,643 | 35,686 | |||
| Lands End Incorporated † | 5,698 | 96,638 | |||
| Liquidity Services Incorporated † | 5,394 | 92,939 | |||
| Overstock.com Incorporated † | 2,917 | 165,977 | |||
| PetMed Express Incorporated | 1,372 | 36,975 | |||
| Quotient Technology Incorporated † | 11 | 73 | |||
| Revolve Group Incorporated † | 4,795 | 227,427 | |||
| Shutterstock Incorporated | 1,990 | 180,155 | |||
| Stitch Fix Incorporated Class A † | 5,264 | 66,063 | |||
| 1,077,059 | |||||
| Leisure products: 0.59% | |||||
| Acushnet Holdings Corporation | 1,769 | 77,482 | |||
| American Outdoor Brands Incorporated † | 1,052 | 16,443 | |||
| Ammo Incorporated † | 6,027 | 28,387 | |||
| Callaway Golf Company † | 1,518 | 37,555 | |||
| Escalade Incorporated | 2,064 | 27,348 | |||
| Johnson Outdoors Incorporated Class A | 176 | 14,515 | |||
| Malibu Boats Incorporated Class A † | 1,562 | 108,825 | |||
| Mastercraft Boat Holdings Incorporated † | 6,049 | 173,243 | |||
| Nautilus Incorporated † | 2,103 | 10,242 |
| Shares | Value | ||||
| Leisure products (continued) | |||||
| Smith & Wesson Brands Incorporated | 13,258 | $ 233,739 | |||
| Sturm, Ruger & Company Incorporated | 2,353 | 170,381 | |||
| Vista Outdoor Incorporated † | 6,425 | 234,191 | |||
| 1,132,351 | |||||
| Multiline retail: 0.55% | |||||
| Big Lots Stores Incorporated | 1,942 | 67,504 | |||
| Dillard's Incorporated Class A | 973 | 243,941 | |||
| Macy's Incorporated | 28,490 | 738,461 | |||
| 1,049,906 | |||||
| Specialty retail: 1.82% | |||||
| Aaron's Incorporated | 4,901 | 102,872 | |||
| Abercrombie & Fitch Company Class A † | 3,643 | 138,725 | |||
| Academy Sports & Outdoors Corporation † | 6,796 | 219,987 | |||
| American Eagle Outfitters Incorporated | 7,007 | 147,708 | |||
| ARKO Corporation † | 7,856 | 65,598 | |||
| Asbury Automotive Group Incorporated † | 1,270 | 246,520 | |||
| Bed Bath & Beyond Incorporated † | 6,931 | 117,065 | |||
| Big 5 Sporting Goods Corporation | 3,717 | 61,554 | |||
| Boot Barn Holdings Incorporated † | 1,607 | 139,841 | |||
| Caleres Incorporated | 3,021 | 62,716 | |||
| Camping World Holdings Incorporated Class A | 2,293 | 70,418 | |||
| Chico's FAS Incorporated † | 6,490 | 30,503 | |||
| Children's Place Retail Stores Incorporated † | 793 | 49,927 | |||
| Citi Trends Incorporated † | 847 | 31,602 | |||
| Conn's Incorporated † | 2,199 | 40,330 | |||
| Container Store Group Incorporated † | 780 | 6,887 | |||
| Genesco Incorporated † | 1,488 | 95,455 | |||
| Group 1 Automotive Incorporated | 1,601 | 291,270 | |||
| Guess Incorporated | 848 | 18,571 | |||
| Haverty Furniture Companies Incorporated | 234 | 6,648 | |||
| Hibbett Incorporated | 2,422 | 109,184 | |||
| JOANN Incorporated | 808 | 9,195 | |||
| Kirkland's Incorporated † | 913 | 12,636 | |||
| Lazydays Holdings Incorporated † | 2,368 | 43,169 | |||
| MarineMax Incorporated † | 2,190 | 100,214 | |||
| Murphy USA Incorporated | 839 | 151,641 | |||
| National Vision Holdings Incorporated † | 1,909 | 70,003 | |||
| ODP Corporation † | 3,115 | 137,060 | |||
| Onewater Marine Incorporated Class A | 700 | 35,567 | |||
| Party City Holdco Incorporated † | 9,076 | 39,299 | |||
| Rent-A-Center Incorporated | 2,904 | 82,503 | |||
| Sally Beauty Holdings Incorporated † | 7,788 | 134,577 | |||
| Shoe Carnival Incorporated | 1,337 | 38,987 | |||
| Signet Jewelers Limited | 2,356 | 166,098 | |||
| Sleep Number Corporation † | 1,450 | 95,265 | |||
| Sonic Automotive Incorporated Class A | 1,495 | 80,296 | |||
| The Buckle Incorporated | 1,818 | 65,448 | |||
| The Cato Corporation Class A | 297 | 5,227 | |||
| Tilly's Incorporated Class A | 3,295 | 41,847 | |||
| Urban Outfitters Incorporated † | 2,055 | 56,533 | |||
| Winmark Corporation | 228 | 51,578 | |||
| Zumiez Incorporated † | 388 | 17,262 | |||
| 3,487,786 |
| Shares | Value | ||||
| Textiles, apparel & luxury goods: 0.65% | |||||
| Crocs Incorporated † | 3,810 | $ 319,011 | |||
| G-III Apparel Group Limited † | 3,999 | 110,932 | |||
| Kontoor Brands Incorporated | 3,705 | 183,546 | |||
| Movado Group Incorporated | 3,855 | 151,964 | |||
| Oxford Industries Incorporated | 2,257 | 199,496 | |||
| Rocky Brands Incorporated | 34 | 1,310 | |||
| Steven Madden Limited | 4,630 | 197,516 | |||
| Unifi Incorporated † | 1,125 | 21,116 | |||
| Vera Bradley Incorporated † | 1,720 | 13,003 | |||
| Wolverine World Wide Incorporated | 2,196 | 50,574 | |||
| 1,248,468 | |||||
| Consumer staples: 3.08% | |||||
| Beverages: 0.47% | |||||
| Celsius Holdings Incorporated † | 2,921 | 186,623 | |||
| Coca Cola Bottling Corporation | 700 | 347,851 | |||
| Duckhorn Portfolio Incorporated † | 961 | 18,855 | |||
| MGP Ingredients Incorporated | 1,554 | 123,714 | |||
| National Beverage Corporation | 2,292 | 100,871 | |||
| Primo Water Corporation | 8,358 | 121,525 | |||
| Zevia PBC Class A † | 1,210 | 7,563 | |||
| 907,002 | |||||
| Food & staples retailing: 0.80% | |||||
| BJ's Wholesale Club Holdings Incorporated † | 8,108 | 509,750 | |||
| Ingles Markets Incorporated Class A | 1,922 | 158,027 | |||
| Natural Grocers by Vitamin Cottage Incorporated | 679 | 11,523 | |||
| Performance Food Group Company † | 1,847 | 103,506 | |||
| Rite Aid Corporation † | 3,558 | 32,591 | |||
| SpartanNash Company | 2,461 | 69,253 | |||
| Sprouts Farmers Market Incorporated † | 7,733 | 220,236 | |||
| The Andersons Incorporated | 3,218 | 146,741 | |||
| United Natural Foods Incorporated † | 6,565 | 264,110 | |||
| Weis Markets Incorporated | 131 | 8,079 | |||
| 1,523,816 | |||||
| Food products: 0.94% | |||||
| AppHarvest Incorporated † | 4,489 | 17,148 | |||
| B&G Foods Incorporated | 4,870 | 144,152 | |||
| Calavo Growers Incorporated | 1,123 | 47,941 | |||
| Cal-Maine Foods Incorporated | 1,506 | 66,671 | |||
| Fresh Del Monte Produce Incorporated | 2,331 | 60,326 | |||
| Hostess Brands Incorporated † | 13,447 | 289,648 | |||
| J & J Snack Foods Corporation | 1,016 | 166,340 | |||
| John B. Sanfilippo & Son Incorporated | 2,304 | 183,214 | |||
| Lancaster Colony Corporation | 1,174 | 197,479 | |||
| Landec Corporation † | 6,849 | 78,900 | |||
| Limoneira Company | 532 | 7,767 | |||
| Mission Produce Incorporated † | 3,917 | 50,843 | |||
| Seneca Foods Corporation Class A † | 2,096 | 104,276 | |||
| Tattooed Chef Incorporated † | 2,488 | 30,204 | |||
| The Simply Good Foods Company † | 3,945 | 156,340 |
| Shares | Value | ||||
| Food products (continued) | |||||
| Tootsie Roll Industries Incorporated | 1,880 | $ 63,450 | |||
| TreeHouse Foods Incorporated † | 3,431 | 134,667 | |||
| 1,799,366 | |||||
| Household products: 0.28% | |||||
| Central Garden & Pet Company † | 3,352 | 158,684 | |||
| Central Garden & Pet Company Class A † | 1,754 | 77,246 | |||
| Energizer Holdings Incorporated | 3,771 | 125,914 | |||
| Oil Dri Corporation of America | 628 | 19,393 | |||
| WD-40 Company | 764 | 161,884 | |||
| 543,121 | |||||
| Personal products: 0.47% | |||||
| Beauty Health Company † | 9,070 | 175,777 | |||
| e.l.f. Beauty Incorporated † | 2,225 | 58,807 | |||
| Edgewell Personal Care Company | 3,915 | 139,687 | |||
| Inter Parfums Incorporated | 1,282 | 119,072 | |||
| Medifast Incorporated | 795 | 147,870 | |||
| Natures Sunshine Products Incorporated | 1,404 | 24,612 | |||
| Newage Incorporated † | 9,360 | 6,335 | |||
| NU Skin Enterprises Incorporated Class A | 3,393 | 157,401 | |||
| USANA Health Sciences Incorporated † | 828 | 72,872 | |||
| 902,433 | |||||
| Tobacco: 0.12% | |||||
| Turning Point Brands Incorporated | 858 | 28,760 | |||
| Universal Corporation | 74 | 4,004 | |||
| Vector Group Limited | 17,988 | 201,645 | |||
| 234,409 | |||||
| Energy: 5.23% | |||||
| Energy equipment & services: 0.93% | |||||
| Archrock Incorporated | 9,147 | 76,377 | |||
| Bristow Group Incorporated † | 1,012 | 33,538 | |||
| Cactus Incorporated Class A | 2,565 | 129,943 | |||
| ChampionX Corporation † | 8,191 | 175,369 | |||
| Expro Group Holdings † | 1,685 | 27,112 | |||
| Helix Energy Solutions Group Incorporated † | 2,011 | 8,145 | |||
| Helmerich & Payne Incorporated | 2,877 | 104,234 | |||
| National Energy Services Reunited Corporation † | 2,515 | 22,409 | |||
| Newpark Resources Incorporated † | 32,495 | 122,506 | |||
| Nextier Oilfield Solutions Incorporated † | 14,079 | 112,069 | |||
| Oceaneering International Incorporated † | 12,312 | 180,248 | |||
| Oil States International Incorporated † | 6,498 | 33,985 | |||
| Patterson-UTI Energy Incorporated | 6,717 | 96,926 | |||
| ProPetro Holding Corporation † | 6,489 | 82,865 | |||
| RPC Incorporated † | 18,397 | 161,342 | |||
| Select Energy Services Incorporated Class A † | 2,279 | 18,870 | |||
| Tetra Technologies Incorporated † | 47,321 | 151,427 | |||
| Tidewater Incorporated † | 11,624 | 172,151 | |||
| US Silica Holdings Incorporated † | 4,712 | 68,136 | |||
| 1,777,652 |
| Shares | Value | ||||
| Oil, gas & consumable fuels: 4.30% | |||||
| Alto Ingredients Incorporated † | 7,295 | $ 42,530 | |||
| Antero Resources Corporation † | 19,536 | 447,960 | |||
| Arch Resources Incorporated | 2,334 | 278,610 | |||
| Berry Corporation | 1,781 | 17,810 | |||
| Brigham Minerals Incorporated Class A | 1,006 | 22,917 | |||
| California Resources Corporation | 5,802 | 239,216 | |||
| Callon Petroleum Company † | 4,162 | 234,570 | |||
| Centennial Resource Development Class A † | 39,948 | 350,743 | |||
| Centrus Energy Corporation Class A † | 889 | 40,245 | |||
| Chesapeake Energy Corporation | 6,638 | 512,786 | |||
| Civitas Resources Incorporated | 2,024 | 102,151 | |||
| Clean Energy Fuels Corporation † | 10,530 | 76,553 | |||
| CNX Resources Corporation † | 10,255 | 167,567 | |||
| Consol Energy Incorporated † | 5,776 | 177,554 | |||
| Crescent Energy Company Class A † | 2,026 | 30,694 | |||
| CVR Energy Incorporated | 627 | 10,904 | |||
| Delek US Holdings Incorporated † | 2,789 | 48,054 | |||
| Denbury Incorporated † | 3,728 | 270,876 | |||
| DHT Holdings Incorporated | 9,486 | 59,667 | |||
| Dorian LPG Limited | 2,834 | 39,053 | |||
| Earthstone Energy Incorporated Class A † | 1,751 | 22,763 | |||
| Equitrans Midstream Corporation | 19,160 | 122,816 | |||
| Falcon Minerals Corporation | 9,368 | 53,772 | |||
| Golar LNG Limited † | 2,885 | 50,199 | |||
| Green Plains Renewable Energy Incorporated † | 1,649 | 53,988 | |||
| Kinetik Holdings Incorporated | 1,136 | 77,248 | |||
| Kosmos Energy Limited † | 46,260 | 224,824 | |||
| Laredo Petroleum Incorporated † | 3,257 | 249,356 | |||
| Magnolia Oil & Gas Corporation | 18,981 | 424,225 | |||
| Matador Resources Company | 7,063 | 350,325 | |||
| Murphy Oil Corporation | 9,377 | 325,101 | |||
| Northern Oil and Gas Incorporated | 4,617 | 115,794 | |||
| Oasis Petroleum Incorporated | 1,422 | 188,429 | |||
| Ovintiv Incorporated | 16,834 | 771,808 | |||
| Par Pacific Holdings Incorporated † | 1,506 | 20,482 | |||
| PBF Energy Incorporated Class A † | 5,492 | 91,277 | |||
| PDC Energy Incorporated | 4,789 | 308,986 | |||
| Peabody Energy Corporation † | 5,864 | 101,682 | |||
| Range Resources Corporation † | 11,700 | 268,515 | |||
| Ranger Oil Corporation Class A † | 956 | 32,275 | |||
| Rex American Resources Corporation † | 396 | 37,406 | |||
| Scorpio Tankers Incorporated | 1,451 | 25,233 | |||
| SM Energy Company | 9,113 | 323,603 | |||
| Southwestern Energy Company † | 40,316 | 201,177 | |||
| Tellurian Incorporated † | 15,916 | 60,640 | |||
| W&T Offshore Incorporated † | 5,138 | 24,971 | |||
| Whiting Petroleum Corporation | 5,897 | 435,493 | |||
| World Fuel Services Corporation | 4,286 | 121,465 | |||
| 8,254,313 | |||||
| Financials: 14.82% | |||||
| Banks: 8.10% | |||||
| 1st Source Corporation | 1,613 | 77,892 | |||
| Amerant Bancorp Incorporated Class A | 1,664 | 53,997 | |||
| American National Bankshares Incorporated | 1,282 | 49,485 |
| Shares | Value | ||||
| Banks (continued) | |||||
| Ameris Bancorp | 4,862 | $ 240,669 | |||
| Arrow Financial Corporation | 934 | 32,083 | |||
| Associated Banc Corporation | 10,171 | 248,071 | |||
| Atlantic Union Bankshares Corporation | 4,858 | 197,381 | |||
| Banc of California Incorporated | 4,240 | 83,316 | |||
| BancFirst Corporation | 41 | 3,203 | |||
| Bank of N.T. Butterfield & Son Limited | 2,669 | 102,490 | |||
| BankUnited Incorporated | 6,047 | 267,277 | |||
| Banner Corporation | 2,120 | 130,613 | |||
| Berkshire Hills Bancorp Incorporated | 4,415 | 137,307 | |||
| Blue Ridge Bankshares Incorporated | 8,132 | 130,519 | |||
| Brookline Bancorp Incorporated | 6,832 | 117,100 | |||
| Business First Bancshares Incorporated | 1,084 | 28,390 | |||
| Byline Bancorp Incorporated | 11,119 | 303,215 | |||
| Cadence Bank | 3,004 | 94,986 | |||
| Cambridge Bancorp | 983 | 86,651 | |||
| Camden National Corporation | 998 | 47,455 | |||
| Capital Bancorp Incorporated | 4,562 | 113,183 | |||
| Capstar Financial Holdings Class I | 2,041 | 43,677 | |||
| Cathay General Bancorp | 6,069 | 285,425 | |||
| Central Pacific Financial Company | 2,641 | 77,091 | |||
| Citizens & Northern Corporation | 376 | 9,314 | |||
| City Holding Company | 862 | 68,676 | |||
| Civista Bancshares Incorporated | 2,591 | 63,194 | |||
| CNB Financial Corporation | 1,333 | 34,858 | |||
| Columbia Banking System Incorporated | 3,901 | 142,894 | |||
| Community Bank System Incorporated | 2,407 | 175,567 | |||
| Community Trust Bancorp | 1,365 | 57,712 | |||
| ConnectOne Bancorp Incorporated | 6,666 | 219,978 | |||
| CrossFirst Bankshares Incorporated † | 1,254 | 19,725 | |||
| Customers Bancorp Incorporated † | 4,936 | 303,811 | |||
| CVB Financial Corporation | 5,517 | 130,091 | |||
| Dime Community Bank | 1,184 | 40,244 | |||
| Eagle Bancorp Incorporated | 2,135 | 127,929 | |||
| Eastern Bankshares Incorporated | 5,011 | 109,540 | |||
| Enterprise Financial Service Corporation | 1,640 | 81,082 | |||
| Equity Bancshares Incorporated Class A | 2,849 | 89,601 | |||
| Farmers National Banc Corporation | 1,949 | 33,581 | |||
| FB Financial Corporation | 653 | 29,019 | |||
| Financial Institutions Incorporated | 3,163 | 101,026 | |||
| First Bancorp of North Carolina | 1,885 | 84,599 | |||
| First Bancorp of Puerto Rico | 14,030 | 198,104 | |||
| First Bancshares Incorporated | 1,309 | 46,221 | |||
| First Bank | 7,161 | 104,336 | |||
| First Busey Corporation | 2,881 | 79,083 | |||
| First Commonwealth Financial Corporation | 9,677 | 156,284 | |||
| First Community Bancshares | 1,957 | 57,399 | |||
| First Financial Bancorp | 7,083 | 174,100 | |||
| First Financial Bankshares Incorporated | 5,284 | 253,209 | |||
| First Financial Corporation | 716 | 33,301 | |||
| First Foundation Incorporated | 2,707 | 72,196 | |||
| First Internet Bancorp | 1,908 | 93,263 | |||
| First Interstate BancSystem Class A | 2,702 | 109,701 | |||
| First Merchants Corporation | 3,302 | 144,429 | |||
| First of Long Island Corporation | 1,533 | 33,373 | |||
| Flushing Financial Corporation | 2,038 | 47,873 |
| Shares | Value | ||||
| Banks (continued) | |||||
| Fulton Financial Corporation | 10,252 | $ 184,741 | |||
| German American Bancorp | 432 | 17,185 | |||
| Glacier Bancorp Incorporated | 4,406 | 244,092 | |||
| Great Southern Bancorp Incorporated | 1,232 | 75,669 | |||
| Hancock Whitney Corporation | 6,361 | 354,180 | |||
| Hanmi Financial Corporation | 6,048 | 157,974 | |||
| HarborOne Bancorp Incorporated | 3,307 | 48,911 | |||
| HBT Financial Incorporated | 787 | 15,063 | |||
| Heartland Financial USA Incorporated | 2,515 | 124,794 | |||
| Heritage Financial Corporation | 1,350 | 35,397 | |||
| Hilltop Holdings Incorporated | 4,277 | 132,245 | |||
| Home BancShares Incorporated | 8,754 | 204,931 | |||
| Homestreet Incorporated | 1,360 | 69,986 | |||
| Hometrust Bancshares Incorporated | 6,978 | 209,898 | |||
| Hope Bancorp Incorporated | 11,276 | 191,241 | |||
| Horizon Bancorp Indiana | 2,894 | 58,112 | |||
| Independent Bank Corporation | 3,531 | 84,038 | |||
| Independent Bank Corporation | 2,155 | 185,352 | |||
| Independent Bank Group Incorporated | 1,953 | 150,674 | |||
| International Bancshares Corporation | 1,315 | 56,558 | |||
| Lakeland Bancorp Incorporated | 4,344 | 78,366 | |||
| Lakeland Financial Corporation | 984 | 78,927 | |||
| Live Oak Bancshares Incorporated | 657 | 42,015 | |||
| Macatawa Bank Corporation | 433 | 3,975 | |||
| Mercantile Bank Corporation | 1,670 | 61,573 | |||
| Meta Financial Group Incorporated | 2,329 | 129,003 | |||
| Metrocity Bankshares Incorporated | 4,356 | 105,894 | |||
| Metropolitan Bank Holding Corporation † | 524 | 53,579 | |||
| Mid Penn Bancorp Incorporated | 660 | 18,473 | |||
| Midland States Bancorp Incorporated | 1,913 | 56,166 | |||
| MidWestOne Financial Group Incorporated | 443 | 13,374 | |||
| MVB Financial Corporation | 540 | 20,801 | |||
| National Bank Holdings Corporation Class A | 2,835 | 125,817 | |||
| NBT Bancorp Incorporated | 2,770 | 106,285 | |||
| Nicolet Bankshares Incorporated † | 704 | 67,063 | |||
| Northrim BanCorp Incorporated | 970 | 43,446 | |||
| Northwest Bancshares Incorporated | 3,736 | 52,603 | |||
| OceanFirst Financial Corporation | 2,203 | 49,303 | |||
| OFG Bancorp | 5,280 | 148,790 | |||
| Old National Bancorp | 10,862 | 198,557 | |||
| Old Second Bancorp Incorporated | 1,865 | 26,539 | |||
| Origin Bancorp Incorporated | 1,622 | 74,904 | |||
| Orrstown Financial Services Incorporated | 4,163 | 101,660 | |||
| Pacific Premier Bancorp Incorporated | 4,764 | 184,414 | |||
| Park National Corporation | 937 | 125,614 | |||
| Peapack-Gladstone Financial Corporation | 1,229 | 46,358 | |||
| Peoples Bancorp Incorporated | 1,719 | 53,770 | |||
| Preferred Bank | 1,230 | 96,530 | |||
| Premier Financial Corporation | 1,859 | 57,016 | |||
| Primis Financial Corporation | 1,621 | 23,180 | |||
| QCR Holdings Incorporated | 2,497 | 139,482 | |||
| RBB Bancorp | 5,385 | 129,886 | |||
| Renasant Corporation | 2,908 | 106,171 | |||
| Republic Bancorp Incorporated Class A | 1,331 | 61,066 | |||
| S&T Bancorp Incorporated | 3,435 | 106,794 | |||
| Sandy Spring Bancorp Incorporated | 4,155 | 195,659 |
| Shares | Value | ||||
| Banks (continued) | |||||
| Seacoast Banking Corporation | 2,435 | $ 89,243 | |||
| ServisFirst Bancshares Incorporated | 2,638 | 230,508 | |||
| Sierra Bancorp | 943 | 25,310 | |||
| Silvergate Capital Corporation Class A † | 1,009 | 129,233 | |||
| Simmons First National Corporation Class A | 6,568 | 187,319 | |||
| Smartfinancial Incorporated | 937 | 24,446 | |||
| South Plains Financial Incorporated | 2,361 | 65,329 | |||
| Southern First Bancshares † | 1,877 | 107,102 | |||
| Southside Bancshares Incorporated | 2,535 | 105,684 | |||
| Stock Yards Bancorp Incorporated | 326 | 17,431 | |||
| Summit Financial Group Incorporated | 964 | 26,288 | |||
| Texas Capital Bancshares Incorporated † | 2,627 | 174,958 | |||
| The Bancorp Incorporated † | 5,300 | 155,290 | |||
| Tompkins Trust Company Incorporated | 546 | 43,189 | |||
| Towne Bank | 4,665 | 145,455 | |||
| TriCo Bancshares | 1,677 | 72,782 | |||
| Triumph Bancorp Incorporated † | 1,246 | 124,999 | |||
| Trustmark Corporation | 4,051 | 127,566 | |||
| UMB Financial Corporation | 2,254 | 229,592 | |||
| United Bankshares Incorporated | 6,464 | 236,712 | |||
| United Community Bank | 4,787 | 185,065 | |||
| Univest Financial Corporation | 4,034 | 116,905 | |||
| Valley National Bancorp | 25,726 | 359,392 | |||
| Veritex Holdings Incorporated | 4,049 | 164,511 | |||
| Washington Trust Bancorp | 1,589 | 86,235 | |||
| WesBanco Incorporated | 4,184 | 152,883 | |||
| West Bancorporation | 3,523 | 101,815 | |||
| 15,546,125 | |||||
| Capital markets: 1.37% | |||||
| Artisan Partners Asset Management Incorporated Class A | 4,045 | 154,155 | |||
| Associated Capital Group Incorporated Class A | 1,415 | 55,369 | |||
| BGC Partners Incorporated Class A | 22,796 | 104,406 | |||
| BrightSphere Investment Group Incorporated | 5,592 | 133,481 | |||
| Cohen & Steers Incorporated | 1,409 | 114,495 | |||
| Cowen Incorporated Class A | 1,885 | 55,890 | |||
| Diamond Hill Investment Group | 206 | 39,939 | |||
| Donnelley Financial Solutions † | 3,669 | 117,775 | |||
| Federated Hermes Incorporated | 6,194 | 202,358 | |||
| Focus Financial Partners Class A † | 1,920 | 96,077 | |||
| Gamco Investors Incorporated Class A | 5,171 | 111,280 | |||
| Greenhill & Company Incorporated | 967 | 17,097 | |||
| Hamilton Lane Incorporated Class A | 939 | 73,336 | |||
| Houlihan Lokey Incorporated | 2,843 | 292,431 | |||
| Moelis Company Class A | 4,675 | 225,382 | |||
| Open Lending Corporation Class A † | 2,158 | 44,951 | |||
| Piper Sandler Companies | 1,256 | 185,901 | |||
| PJT Partners Incorporated Class A | 1,248 | 79,647 | |||
| Pzena Investment Management Class A | 15,715 | 145,049 | |||
| Sculptor Capital Management Incorporated | 1,503 | 19,253 | |||
| Stepstone Group Incorporated Class A | 1,743 | 60,186 | |||
| Stonex Group Incorporated † | 1,914 | 144,411 | |||
| Virtus Investment Partners Incorporated | 499 | 120,069 | |||
| Wisdomtree Investments Incorporated | 7,411 | 41,724 | |||
| 2,634,662 |
| Shares | Value | ||||
| Consumer finance: 0.76% | |||||
| Atlanticus Holdings Corporation † | 1,569 | $ 83,581 | |||
| Curo Group Holdings Corporation | 1,414 | 18,905 | |||
| Encore Capital Group Incorporated † | 3,554 | 234,528 | |||
| Enova International Incorporated † | 4,262 | 173,762 | |||
| FirstCash Holdings Incorporated | 1,763 | 127,007 | |||
| LendingClub Corporation † | 4,663 | 86,639 | |||
| Navient Corporation | 15,423 | 271,599 | |||
| Nelnet Incorporated Class A | 1,173 | 94,485 | |||
| PRA Group Incorporated † | 1,259 | 56,189 | |||
| PROG Holdings Incorporated † | 4,516 | 138,370 | |||
| Regional Management Corporation | 2,753 | 141,311 | |||
| World Acceptance Corporation † | 144 | 28,292 | |||
| 1,454,668 | |||||
| Diversified financial services: 0.06% | |||||
| A-Mark Precious Metals Incorporated | 1,412 | 101,240 | |||
| Banco Latinoamericano de Comercio Exterior SA | 498 | 7,694 | |||
| Cannae Holdings Incorporated † | 370 | 9,935 | |||
| 118,869 | |||||
| Insurance: 1.97% | |||||
| American Equity Investment Life Holding Company | 6,508 | 245,287 | |||
| Amerisafe Incorporated | 1,924 | 90,620 | |||
| Argo Group International Holdings Limited | 5,449 | 229,784 | |||
| CNO Financial Group Incorporated | 11,842 | 286,221 | |||
| Crawford & Company Class A | 10,053 | 77,509 | |||
| Donegal Group Incorporated Class A | 2,703 | 36,923 | |||
| eHealth Incorporated † | 528 | 8,205 | |||
| Employers Holdings Incorporated | 4,488 | 174,404 | |||
| Enstar Group Limited † | 1,294 | 368,829 | |||
| Genworth Financial Incorporated Class A † | 54,445 | 221,047 | |||
| Goosehead Insurance Incorporated Class A | 339 | 29,486 | |||
| Greenlight Capital Limited † | 35,268 | 253,577 | |||
| HCI Group Incorporated | 391 | 24,344 | |||
| Heritage Insurance Holdings Incorporated | 1,757 | 9,804 | |||
| Horace Mann Educators Corporation | 2,981 | 123,980 | |||
| Investors Title Company | 108 | 20,687 | |||
| Kinsale Capital Group Incorporated | 597 | 125,227 | |||
| Maiden Holdings Limited † | 16,438 | 40,109 | |||
| ProAssurance Corporation | 836 | 20,148 | |||
| RLI Corporation | 2,275 | 230,913 | |||
| Safety Insurance Group Incorporated | 2,030 | 169,383 | |||
| Selective Insurance Group Incorporated | 4,730 | 393,489 | |||
| SelectQuote Incorporated † | 6,824 | 21,223 | |||
| SiriusPoint Limited † | 12,368 | 91,400 | |||
| Stewart Information Services Corporation | 4,149 | 281,634 | |||
| Trean Insurance Group Incorporated † | 1,220 | 8,662 | |||
| Trupanion Incorporated † | 1,050 | 94,112 | |||
| United Fire Group Incorporated | 896 | 24,739 | |||
| Universal Insurance Holdings Company | 6,144 | 71,025 | |||
| 3,772,771 | |||||
| Mortgage REITs: 1.52% | |||||
| Apollo Commercial Real Estate Finance Incorporated | 6,973 | 90,998 | |||
| Arbor Realty Trust Incorporated | 7,121 | 128,178 |
| Shares | Value | ||||
| Mortgage REITs (continued) | |||||
| Ares Commercial Real Estate | 23 | $ 337 | |||
| Armour Residential REIT Incorporated | 6,573 | 53,438 | |||
| Blackstone Mortgage Trust Incorporated Class A | 6,586 | 209,303 | |||
| Broadmark Realty Capital Incorporated REIT | 8,630 | 74,736 | |||
| Chimera Investment Corporation | 54,873 | 667,804 | |||
| Dynex Capital Incorporated REIT | 6,195 | 95,217 | |||
| Ellington Financial Incorporated | 5,963 | 105,366 | |||
| Granite Point Mortgage Trust Incorporated | 3,867 | 43,388 | |||
| Invesco Mortgage Capital Incorporated | 38,628 | 84,209 | |||
| KKR Real Estate Finance Trust | 22 | 472 | |||
| Ladder Capital Corporation | 10,403 | 119,218 | |||
| MFA Financial Incorporated | 116,199 | 471,768 | |||
| New York Mortgage Trust Incorporated | 26,234 | 92,081 | |||
| PennyMac Mortgage Investment Trust | 3,415 | 53,274 | |||
| Redwood Trust Incorporated | 46,716 | 485,379 | |||
| TPG Real Estate Finance Trust Incorporated | 1,596 | 18,897 | |||
| Two Harbors Investment Corporation | 23,777 | 120,312 | |||
| 2,914,375 | |||||
| Thrifts & mortgage finance: 1.04% | |||||
| Axos Financial Incorporated † | 3,088 | 169,037 | |||
| Blue Foundry Bancorp † | 1,892 | 26,280 | |||
| Federal Agricultural Mortgage Corporation Class C | 376 | 46,511 | |||
| FS Bancorp Incorporated | 1,763 | 56,451 | |||
| Hingham Institution For Savings Corporation | 72 | 25,908 | |||
| Home Bancorp Incorporated | 887 | 34,779 | |||
| Home Point Capital Incorporated | 509 | 1,680 | |||
| Kearny Financial Corporation | 3,269 | 43,183 | |||
| Luther Burbank Corporation | 635 | 8,217 | |||
| Merchants Bancorp Incorporated | 993 | 28,747 | |||
| Mr. Cooper Group Incorporated † | 4,560 | 231,785 | |||
| NMI Holdings Incorporated Class A † | 5,220 | 120,791 | |||
| Northfield Bancorp Incorporated | 2,258 | 35,451 | |||
| Ocwen Financial Corporation † | 558 | 15,976 | |||
| PennyMac Financial Services Incorporated | 1,499 | 86,567 | |||
| Provident Financial Services Incorporated | 3,304 | 78,404 | |||
| Radian Group Incorporated | 12,422 | 296,886 | |||
| Southern Missouri Bancorp | 1,298 | 69,547 | |||
| Velocity Financial Incorporated † | 3,277 | 41,913 | |||
| Walker & Dunlop Incorporated | 1,456 | 201,438 | |||
| Washington Federal Incorporated | 3,366 | 119,762 | |||
| Waterstone Financial Incorporated | 5,471 | 106,903 | |||
| WSFS Financial Corporation | 3,091 | 157,116 | |||
| 2,003,332 | |||||
| Health care: 17.26% | |||||
| Biotechnology: 7.43% | |||||
| 4D Molecular Therapeutics Incorporated † | 1,359 | 18,618 | |||
| Acadia Pharmaceuticals Incorporated † | 8,321 | 211,437 | |||
| Adagio Therapeutics Incorporated † | 1,187 | 7,941 | |||
| Aduro Biotech Incorporated ♦† | 9,490 | 0 | |||
| Aerovate Therapeutics Incorporated † | 144 | 1,408 | |||
| Affimed NV † | 7,952 | 35,068 | |||
| Agenus Incorporated † | 14,265 | 38,516 | |||
| Agios Pharmaceuticals Incorporated † | 3,337 | 103,881 |
| Shares | Value | ||||
| Biotechnology (continued) | |||||
| Akebia Therapeutics Incorporated † | 45,237 | $ 97,712 | |||
| Alector Incorporated † | 9,120 | 144,461 | |||
| Alkermes plc † | 19,196 | 477,213 | |||
| Allakos Incorporated † | 1,251 | 6,993 | |||
| Allogene Therapeutics Incorporated † | 274 | 2,507 | |||
| Alpine Immune Sciences Incorporated † | 9,498 | 78,264 | |||
| Amicus Therapeutics Incorporated † | 22,493 | 183,093 | |||
| Anaptysbio Incorporated † | 6,541 | 199,958 | |||
| Anavex Life Sciences Corporation † | 2,613 | 28,638 | |||
| Anika Therapeutics Incorporated † | 4,531 | 147,258 | |||
| Apellis Pharmaceuticals Incorporated † | 4,389 | 186,664 | |||
| Arbutus Biopharma Corporation † | 14,585 | 46,672 | |||
| Arcturus Therapeutics Holdings Incorporated † | 69 | 1,654 | |||
| Arcus Biosciences Incorporated † | 3,149 | 117,143 | |||
| Arrowhead Pharmaceuticals Incorporated † | 5,133 | 225,852 | |||
| Avid Bioservices Incorporated † | 12,537 | 256,758 | |||
| Beam Therapeutics Incorporated † | 1,713 | 134,214 | |||
| Biocryst Pharmaceuticals Incorporated † | 20,947 | 347,930 | |||
| Biohaven Pharmaceutical Holding Company † | 3,037 | 360,522 | |||
| Blueprint Medicines Corporation † | 4,043 | 244,804 | |||
| Bridgebio Pharma Incorporated † | 5,526 | 43,103 | |||
| Brooklyn ImmunoTherapeutics Incorporated † | 21,776 | 49,214 | |||
| C4 Therapeutics Incorporated † | 2,344 | 52,576 | |||
| CareDx Incorporated † | 5,036 | 193,282 | |||
| Caribou Biosciences Incorporated † | 1,401 | 13,982 | |||
| Catalyst Pharmaceuticals Incorporated † | 67,704 | 528,091 | |||
| Celcuity Incorporated † | 2,748 | 27,755 | |||
| Celldex Therapeutics Incorporated † | 3,312 | 99,029 | |||
| Century Therapeutics Incorporated † | 2,446 | 34,489 | |||
| Chimerix Incorporated † | 4,602 | 25,955 | |||
| Clene Incorporated † | 17,894 | 55,292 | |||
| Clovis Oncology Incorporated † | 7,511 | 15,473 | |||
| Codiak BioSciences Incorporated † | 484 | 2,284 | |||
| Cogent Biosciences Incorporated † | 93 | 551 | |||
| Coherus Biosciences Incorporated † | 4,295 | 50,638 | |||
| Cortexyme Incorporated † | 1,114 | 4,846 | |||
| Cullinan Oncology Incorporated † | 1,762 | 25,267 | |||
| Curis Incorporated † | 8,579 | 28,740 | |||
| Cyteir Therapeutics Incorporated † | 573 | 3,323 | |||
| Cytokinetics Incorporated † | 5,452 | 192,565 | |||
| CytomX Therapeutics Incorporated † | 13,046 | 49,966 | |||
| Deciphera Pharmaceuticals Incorporated † | 2,419 | 18,650 | |||
| Denali Therapeutics Incorporated † | 6,024 | 196,141 | |||
| Dermtech Incorporated † | 1,644 | 21,027 | |||
| Dynavax Technologies Corporation † | 16,449 | 201,665 | |||
| Eagle Pharmaceuticals Incorporated † | 7,206 | 341,492 | |||
| Editas Medicine Incorporated † | 5,054 | 86,524 | |||
| Eiger BioPharmaceuticals Incorporated † | 2,151 | 8,604 | |||
| Eliem Therapeutics Incorporated † | 480 | 4,325 | |||
| Emergent BioSolutions Incorporated † | 7,662 | 317,054 | |||
| Enanta Pharmaceuticals Incorporated † | 1,850 | 130,277 | |||
| ERASCA Incorporated † | 4,538 | 56,271 | |||
| Exagen Incorporated † | 1,508 | 11,461 | |||
| Fate Therapeutics Incorporated † | 5,061 | 174,858 | |||
| Fibrogen Incorporated † | 5,988 | 84,251 | |||
| Fortress Biotech Incorporated † | 16,808 | 27,061 |
| Shares | Value | ||||
| Biotechnology (continued) | |||||
| G1 Therapeutics Incorporated † | 2,677 | $ 28,403 | |||
| Gemini Therapeutics Incorporated † | 8,130 | 11,057 | |||
| Global Blood Therapeutics Incorporated † | 566 | 17,093 | |||
| Graphite Bio Incorporated † | 1,140 | 10,488 | |||
| Gritstone bio Incorporated † | 10,851 | 55,340 | |||
| Halozyme Therapeutics Incorporated † | 15,653 | 555,212 | |||
| Harpoon Therapeutics Incorporated † | 246 | 1,009 | |||
| Heron Therapeutics Incorporated † | 6,087 | 43,218 | |||
| Homology Medicines Incorporated † | 8,831 | 30,820 | |||
| Hookipa Pharma Incorporated † | 1,262 | 3,029 | |||
| Icosavax Incorporated † | 897 | 15,626 | |||
| Ideaya Biosciences Incorporated † | 4,393 | 57,988 | |||
| Imago Biosciences Incorporated † | 632 | 14,884 | |||
| Immuneering Corporation † | 1,459 | 10,899 | |||
| Immunitybio Incorporated † | 4,651 | 31,813 | |||
| Immunogen Incorporated † | 30,417 | 171,552 | |||
| Impel NeuroPharma Incorporated † | 358 | 2,585 | |||
| Infinity Pharmaceuticals Incorporated † | 12,018 | 13,220 | |||
| Inhibrx Incorporated † | 1 | 22 | |||
| Inovio Pharmaceuticals Incorporated † | 7,616 | 24,676 | |||
| Insmed Incorporated † | 7,169 | 171,339 | |||
| Intellia Therapeutics Incorporated † | 4,418 | 436,719 | |||
| Intercept Pharmaceuticals Incorporated † | 1,901 | 27,108 | |||
| Ironwood Pharmaceuticals Incorporated † | 41,100 | 442,236 | |||
| Iveric Bio Incorporated † | 5,632 | 90,337 | |||
| Janux Therapeutics Incorporated † | 891 | 15,396 | |||
| Jounce Therapeutics Incorporated † | 9,598 | 71,601 | |||
| KalVista Pharmaceuticals Incorporated † | 43 | 690 | |||
| Karuna Therapeutics Incorporated † | 976 | 102,480 | |||
| Karyopharm Therapeutics Incorporated † | 4,895 | 50,565 | |||
| Kodiak Sciences Incorporated † | 912 | 7,880 | |||
| Krystal Biotech Incorporated † | 93 | 5,910 | |||
| Kymera Therapeutics Incorporated † | 2,640 | 104,966 | |||
| Lexicon Pharmaceuticals Incorporated † | 88,780 | 183,775 | |||
| Ligand Pharmaceuticals Incorporated † | 1,042 | 105,471 | |||
| Lineage Cell Therapeutics Incorporated † | 74,340 | 104,819 | |||
| Macrogenics Incorporated † | 3,787 | 35,408 | |||
| Madrigal Pharmaceuticals Incorporated † | 748 | 69,452 | |||
| Mannkind Corporation † | 16,807 | 44,034 | |||
| Mei Pharma Incorporated † | 5,999 | 12,958 | |||
| MeiraGTx Holdings plc † | 2,203 | 31,569 | |||
| MiMedx Group Incorporated † | 36,757 | 185,623 | |||
| Monte Rosa Therapeutics Incorporated † | 2,453 | 35,176 | |||
| Morphic Holding Incorporated † | 1,417 | 56,482 | |||
| Myriad Genetics Incorporated † | 5,275 | 128,605 | |||
| Nurix Therapeutics Incorporated † | 895 | 14,472 | |||
| Nuvalent Incorporated † | 689 | 10,301 | |||
| Ocugen Incorporated † | 12,582 | 44,289 | |||
| Omega Therapeutics Incorporated † | 2,479 | 29,426 | |||
| Oncocyte Corporation † | 4,192 | 6,120 | |||
| Oncternal Therapeutics Incorporated † | 19,226 | 35,184 | |||
| OPKO Health Incorporated † | 27,606 | 86,407 | |||
| Organogenesis Holdings Incorporated Class A † | 38,862 | 289,133 | |||
| PDL BioPharma Incorporated ♦‡† | 91,928 | 315,313 | |||
| Precigen Incorporated † | 6,293 | 14,159 | |||
| Precision BioSciences Incorporated † | 13,767 | 58,510 |
| Shares | Value | ||||
| Biotechnology (continued) | |||||
| Prometheus Biosciences Incorporated † | 806 | $ 35,093 | |||
| Protagonist Therapeutics Incorporated † | 3,005 | 72,961 | |||
| Prothema Corporation plc † | 2,468 | 85,393 | |||
| PTC Therapeutics Incorporated † | 4,715 | 165,591 | |||
| Puma Biotechnology Incorporated † | 48,702 | 112,015 | |||
| Radius Health Incorporated † | 3,134 | 26,075 | |||
| Rallybio Corporation † | 496 | 5,451 | |||
| RAPT Therapeutics Incorporated † | 604 | 12,080 | |||
| Regenxbio Incorporated † | 2,727 | 71,475 | |||
| Relay Therapeutics Incorporated † | 2,930 | 70,642 | |||
| Revolution Medicines Incorporated † | 2,072 | 39,202 | |||
| Rigel Pharmaceuticals Incorporated † | 11,680 | 29,317 | |||
| Rocket Pharmaceuticals Incorporated † | 32 | 570 | |||
| Rubius Therapeutics Incorporated † | 5,377 | 26,831 | |||
| Sana Biotechnology Incorporated † | 607 | 3,921 | |||
| Sangamo Therapeutics Incorporated † | 12,832 | 75,067 | |||
| Scholar Rock Holding Corporation † | 1,303 | 22,672 | |||
| Selecta Biosciences Incorporated † | 11,459 | 21,199 | |||
| Shattuck Labs Incorporated † | 1,812 | 9,060 | |||
| Sigilon Therapeutics Incorporated † | 1,051 | 1,524 | |||
| Sorrento Therapeutics Incorporated † | 26,801 | 67,807 | |||
| Spero Therapeutics Incorporated † | 1,664 | 15,974 | |||
| Springworks Therapeutics Incorporated † | 2,254 | 127,554 | |||
| SQZ Biotechnologies Company † | 2,357 | 12,421 | |||
| Summit Therapeutics Incorporated † | 1,771 | 4,853 | |||
| Surface Oncology Incorporated † | 20,831 | 74,992 | |||
| Sutro Biopharma Incorporated † | 5,404 | 48,204 | |||
| Tenaya Therapeutics Incorporated † | 2,744 | 31,995 | |||
| TG Therapeutics Incorporated † | 3,693 | 36,450 | |||
| Travere Therapeutics Incorporated † | 5,930 | 161,652 | |||
| Turning Point Therapeutics Incorporated † | 2,144 | 67,879 | |||
| Twist Bioscience Corporation † | 2,807 | 157,024 | |||
| UroGen Pharma Limited † | 6,327 | 37,962 | |||
| Vanda Pharmaceuticals Incorporated † | 3,770 | 42,827 | |||
| Vaxart Incorporated † | 3,483 | 17,694 | |||
| Veracyte Incorporated † | 4,719 | 131,188 | |||
| Verastem Incorporated † | 55,757 | 66,908 | |||
| Vericel Corporation † | 3,212 | 132,367 | |||
| Viking Therapeutics Incorporated † | 6,300 | 21,105 | |||
| Vincerx Pharma Incorporated † | 1,290 | 6,540 | |||
| VIR Biotechnology Incorporated † | 3,062 | 77,132 | |||
| Viracta Therapeutics Incorporated † | 14,124 | 38,559 | |||
| XBiotech Incorporated | 5,134 | 50,621 | |||
| Xencor Incorporated † | 7,784 | 243,717 | |||
| XOMA Corporation † | 8,941 | 196,076 | |||
| Y-mAbs Therapeutics Incorporated † | 2,275 | 20,725 | |||
| Zentalis Pharmaceuticals Incorporated † | 1,213 | 60,517 | |||
| Ziopharm Oncology Incorporated † | 15,296 | 15,080 | |||
| 14,256,070 | |||||
| Health care equipment & supplies: 3.85% | |||||
| Accuray Incorporated † | 40,760 | 141,437 | |||
| Alphatec Holdings Incorporated † | 4,888 | 53,866 | |||
| AngioDynamics Incorporated † | 8,022 | 188,758 | |||
| Apyx Medical Corporation † | 9,062 | 91,707 | |||
| Artivion Incorporated † | 2,627 | 51,358 |
| Shares | Value | ||||
| Health care equipment & supplies (continued) | |||||
| Atricure Incorporated † | 2,677 | $ 185,918 | |||
| Atrion Corporation | 255 | 182,442 | |||
| Avanos Medical Incorporated † | 3,233 | 114,416 | |||
| Axogen Incorporated † | 2,361 | 22,052 | |||
| Axonics Modulation Technologies Incorporated † | 1,923 | 109,149 | |||
| BioLife Solutions Incorporated † | 297 | 6,980 | |||
| Bioventus Incorporated Class A † | 1,978 | 25,714 | |||
| Butterfly Network Incorporated † | 20,630 | 106,245 | |||
| Cardiovascular Systems Incorporated † | 1,961 | 41,299 | |||
| Cerus Corporation † | 6,246 | 36,664 | |||
| ClearPoint Neuro Incorporated † | 282 | 2,468 | |||
| Conmed Corporation | 2,893 | 422,841 | |||
| Cryoport Incorporated † | 806 | 27,670 | |||
| Cutera Incorporated † | 2,879 | 110,438 | |||
| CVRx Incorporated † | 1,094 | 9,605 | |||
| Glaukos Corporation † | 1,694 | 93,695 | |||
| Haemonetics Corporation † | 3,359 | 193,848 | |||
| Heska Corporation † | 661 | 93,862 | |||
| Inari Medical Incorporated † | 2,225 | 195,756 | |||
| Inogen Incorporated † | 3,479 | 121,382 | |||
| Integer Holdings Corporation † | 3,991 | 334,725 | |||
| Invacare Corporation † | 2,114 | 4,334 | |||
| IRadimed Corporation | 5,071 | 252,029 | |||
| Lantheus Holdings Incorporated † | 6,385 | 305,331 | |||
| LeMaitre Vascular Incorporated | 3,429 | 162,775 | |||
| LivaNova plc † | 4,166 | 328,364 | |||
| Meridian Bioscience Incorporated † | 8,258 | 208,927 | |||
| Merit Medical Systems Incorporated † | 5,623 | 365,664 | |||
| Mesa Laboratories Incorporated | 209 | 53,364 | |||
| Natus Medical Incorporated † | 10,082 | 280,481 | |||
| Neogen Corporation † | 7,438 | 265,537 | |||
| Neuronetics Incorporated † | 1,773 | 5,922 | |||
| Nevro Corporation † | 1,610 | 115,437 | |||
| NuVasive Incorporated † | 4,678 | 253,173 | |||
| OraSure Technologies Incorporated † | 4,629 | 36,106 | |||
| Orthofix Medical Incorporated † | 5,046 | 171,463 | |||
| Outset Medical Incorporated † | 354 | 15,565 | |||
| Retractable Technologies Incorporated † | 12,150 | 57,591 | |||
| RxSight Incorporated † | 7,333 | 98,409 | |||
| Seaspine Holdings Corporation † | 58 | 735 | |||
| Senseonics Holdings Incorporated † | 29,862 | 53,752 | |||
| Shockwave Medical Incorporated † | 1,934 | 342,763 | |||
| Sientra Incorporated † | 13,320 | 37,696 | |||
| Sight Sciences Incorporated † | 2,805 | 48,835 | |||
| Silk Road Medical Incorporated † | 355 | 13,181 | |||
| STAAR Surgical Company † | 3,790 | 300,623 | |||
| Stereotaxis Incorporated † | 6,842 | 31,610 | |||
| Surmodics Incorporated † | 924 | 41,469 | |||
| Tactile Systems Technology Class I † | 1,276 | 25,979 | |||
| TransMedics Group Incorporated † | 784 | 14,520 | |||
| Utah Medical Products Incorporated | 2,447 | 220,254 | |||
| Varex Imaging Corporation † | 8,720 | 206,141 | |||
| ViewRay Incorporated † | 14,047 | 58,436 | |||
| Zynex Incorporated | 6,678 | 42,005 | |||
| 7,382,766 |
| Shares | Value | ||||
| Health care providers & services: 2.31% | |||||
| Addus Homecare Corporation † | 523 | $ 44,476 | |||
| Agiliti Incorporated † | 3,688 | 66,421 | |||
| AMN Healthcare Services Incorporated † | 3,718 | 394,629 | |||
| Apollo Medical Holdings Incorporated † | 2,739 | 131,801 | |||
| Brookdale Senior Living Incorporated † | 11,471 | 78,920 | |||
| Community Health Systems Incorporated † | 8,581 | 90,186 | |||
| CorVel Corporation † | 711 | 113,092 | |||
| Covetrus Incorporated † | 2,722 | 48,234 | |||
| Cross Country Healthcare Incorporated † | 10,671 | 238,283 | |||
| Fulgent Genetics Incorporated † | 2,142 | 133,447 | |||
| Hanger Incorporated † | 2,595 | 47,021 | |||
| HealthEquity Incorporated † | 390 | 20,947 | |||
| InfuSystem Holdings Incorporated † | 2,571 | 29,541 | |||
| Innovage Holding Corporation † | 1,254 | 6,182 | |||
| Mednax Incorporated † | 6,938 | 162,835 | |||
| Modivcare Incorporated † | 694 | 81,892 | |||
| National Healthcare Corporation | 518 | 33,680 | |||
| Option Care Health Incorporated † | 10,043 | 258,105 | |||
| Owens & Minor Incorporated | 5,744 | 253,598 | |||
| Patterson Companies Incorporated | 11,279 | 337,242 | |||
| PetIQ Incorporated † | 157 | 3,115 | |||
| Progyny Incorporated † | 2,742 | 107,925 | |||
| R1 RCM Incorporated † | 1,014 | 27,571 | |||
| RadNet Incorporated † | 3,074 | 75,836 | |||
| Select Medical Holdings Corporation | 7,635 | 176,750 | |||
| Sharps Compliance Corporation † | 2,356 | 14,513 | |||
| Surgery Partners Incorporated † | 251 | 13,120 | |||
| Tenet Healthcare Corporation † | 7,854 | 675,365 | |||
| The Ensign Group Incorporated | 3,659 | 307,502 | |||
| The Joint Corporation † | 2,117 | 86,797 | |||
| Tivity Health Incorporated † | 9,152 | 249,667 | |||
| U.S. Physical Therapy Incorporated | 1,043 | 95,925 | |||
| Viemed Healthcare Incorporated † | 8,850 | 33,984 | |||
| 4,438,602 | |||||
| Health care technology: 0.82% | |||||
| Allscripts Healthcare Solutions Incorporated † | 22,232 | 432,635 | |||
| Computer Programs & Systems Incorporated † | 952 | 29,303 | |||
| Evolent Health Incorporated Class A † | 6,663 | 177,569 | |||
| Forian Incorporated † | 4,773 | 33,172 | |||
| Health Catalyst Incorporated † | 1,527 | 41,412 | |||
| HealthStream Incorporated † | 5,273 | 108,044 | |||
| Inspire Medical Systems Incorporated † | 1,210 | 295,313 | |||
| MultiPlan Corporation † | 1,737 | 6,531 | |||
| Nanthealth Incorporated † | 26,849 | 22,287 | |||
| NextGen Healthcare Incorporated † | 12,931 | 252,542 | |||
| OptimizeRx Corporation † | 1,367 | 61,911 | |||
| Phreesia Incorporated † | 2,653 | 81,686 | |||
| Schrodinger Incorporated † | 962 | 33,439 | |||
| Tabula Rasa Healthcare Incorporated † | 1,480 | 8,436 | |||
| 1,584,280 | |||||
| Life sciences tools & services: 0.73% | |||||
| Akoya Biosciences Incorporated † | 1,979 | 21,927 | |||
| Alpha Teknova Incorporated † | 290 | 4,930 | |||
| Bionano Genomics Incorporated † | 17,215 | 36,840 |
| Shares | Value | ||||
| Life sciences tools & services (continued) | |||||
| Chromadex Corporation † | 12,461 | $ 34,019 | |||
| Codex DNA Incorporated † | 302 | 3,080 | |||
| Codexis Incorporated † | 6,702 | 133,571 | |||
| Cytek Biosciences Incorporated † | 3,018 | 41,166 | |||
| Harvard Bioscience Incorporated † | 43,070 | 232,578 | |||
| Inotiv Incorporated † | 1,002 | 26,483 | |||
| MaxCyte Incorporated † | 2,627 | 18,284 | |||
| Medpace Holdings Incorporated † | 2,539 | 388,391 | |||
| Nanostring Technologies Incorporated † | 2,249 | 79,750 | |||
| Neogenomics Incorporated † | 7,723 | 165,349 | |||
| Pacific Biosciences of California † | 11,842 | 141,157 | |||
| Personalis Incorporated † | 1,194 | 12,537 | |||
| Quanterix Corporation † | 1,986 | 67,008 | |||
| Rapid Micro Biosystems Incorporated Class A † | 548 | 3,831 | |||
| 1,410,901 | |||||
| Pharmaceuticals: 2.12% | |||||
| Aclaris Therapeutics Incorporated † | 1,282 | 19,102 | |||
| Aerie Pharmaceuticals Incorporated † | 2,925 | 24,278 | |||
| Amneal Pharmaceuticals Incorporated † | 56,574 | 256,280 | |||
| Amphastar Pharmaceuticals Incorporated † | 9,838 | 272,611 | |||
| ANI Pharmaceuticals Incorporated † | 657 | 24,605 | |||
| Antares Pharma Incorporated † | 42,360 | 148,260 | |||
| Arvinas Incorporated † | 1,539 | 99,743 | |||
| Atea Pharmaceuticals Incorporated † | 4,184 | 26,527 | |||
| Cara Therapeutics Incorporated † | 3,097 | 32,116 | |||
| Collegium Pharmaceutical Incorporated † | 5,727 | 111,505 | |||
| Corcept Therapeutics Incorporated † | 14,360 | 320,084 | |||
| Dova Pharmaceuticals Incorporated ♦† | 2,458 | 0 | |||
| Evolus Incorporated † | 2,233 | 20,432 | |||
| EyePoint Pharmaceuticals Incorporated † | 758 | 7,542 | |||
| Fulcrum Therapeutics Incorporated † | 902 | 9,922 | |||
| Harmony Biosciences Holdings † | 1,542 | 61,618 | |||
| Innoviva Incorporated † | 21,034 | 404,063 | |||
| Intra-Cellular Therapies Incorporated † | 1,893 | 105,024 | |||
| NGM Biopharmaceuticals Incorporated † | 1,316 | 19,556 | |||
| Nuvation Bio Incorporated † | 8,652 | 43,779 | |||
| Oramed Pharmaceuticals Incorporated † | 3,283 | 33,815 | |||
| Pacira Biosciences Incorporated † | 5,235 | 349,122 | |||
| Paratek Pharmaceuticals Incorporated † | 37,663 | 132,574 | |||
| Phibro Animal Health Corporation Class A | 16,096 | 342,845 | |||
| Prestige Consumer Healthcare Incorporated † | 10,259 | 610,718 | |||
| Reata Pharmaceuticals Incorporated Class A † | 573 | 18,760 | |||
| Revance Therapeutics Incorporated † | 257 | 3,487 | |||
| Siga Technologies Incorporated † | 42,588 | 255,528 | |||
| Supernus Pharmaceuticals Incorporated † | 9,397 | 300,234 | |||
| TherapeuticsMD Incorporated † | 36,454 | 8,720 | |||
| Verrica Pharmaceuticals Incorporated † | 890 | 7,458 | |||
| 4,070,308 | |||||
| Industrials: 13.83% | |||||
| Aerospace & defense: 0.69% | |||||
| AAR Corporation † | 5,777 | 259,618 | |||
| Aersale Corporation † | 8,884 | 139,123 | |||
| Astronics Corporation † | 4,999 | 73,535 |
| Shares | Value | ||||
| Aerospace & defense (continued) | |||||
| Byrna Technologies Incorporated † | 4,531 | $ 45,355 | |||
| Ducommun Incorporated † | 908 | 45,863 | |||
| Kaman Corporation | 1,415 | 61,425 | |||
| Kratos Defense & Security Solutions Incorporated † | 3,497 | 73,157 | |||
| Maxar Technologies Incorporated | 3,675 | 119,217 | |||
| Moog Incorporated Class A | 1,977 | 164,308 | |||
| National Presto Industries Incorporated | 29 | 2,306 | |||
| Park Aerospace Corporation | 3,388 | 46,992 | |||
| Triumph Group Incorporated † | 7,135 | 178,660 | |||
| Vectrus Incorporated † | 2,374 | 108,824 | |||
| 1,318,383 | |||||
| Air freight & logistics: 0.33% | |||||
| Air Transport Services Group † | 710 | 22,372 | |||
| Atlas Air Worldwide Holdings Incorporated † | 1,980 | 155,153 | |||
| Forward Air Corporation | 1,655 | 170,763 | |||
| Hub Group Incorporated Class A † | 2,159 | 182,220 | |||
| Radiant Logistics Incorporated † | 14,404 | 99,388 | |||
| 629,896 | |||||
| Airlines: 0.30% | |||||
| Allegiant Travel Company † | 1,009 | 175,657 | |||
| Frontier Group Holdings Incorporated † | 8,920 | 114,890 | |||
| Hawaiian Holdings Incorporated † | 921 | 17,665 | |||
| Mesa Air Group Incorporated † | 27,066 | 117,737 | |||
| SkyWest Incorporated † | 3,441 | 96,727 | |||
| Sun Country Airlines Holding † | 2,140 | 57,887 | |||
| 580,563 | |||||
| Building products: 1.01% | |||||
| AAON Incorporated | 763 | 44,681 | |||
| American Woodmark Corporation † | 475 | 25,451 | |||
| Apogee Enterprises Incorporated | 1,700 | 76,619 | |||
| Cornerstone Building Brands Incorporated † | 7,936 | 175,227 | |||
| CSW Industrials Incorporated | 103 | 12,394 | |||
| Gibraltar Industries Incorporated † | 780 | 37,690 | |||
| Griffon Corporation | 1,603 | 36,949 | |||
| Insteel Industries Incorporated | 2,806 | 104,131 | |||
| JELD-WEN Holding Incorporated † | 4,414 | 101,875 | |||
| Masonite International Corporation † | 1,151 | 108,574 | |||
| PGT Incorporated † | 296 | 6,367 | |||
| Quanex Building Products Corporation | 3,838 | 87,737 | |||
| Resideo Technologies Incorporated † | 9,498 | 244,479 | |||
| Simpson Manufacturing Company Incorporated | 2,216 | 262,618 | |||
| UFP Industries Incorporated | 3,898 | 334,254 | |||
| View Incorporated † | 3,641 | 8,811 | |||
| Zurn Water Solutions Corporation | 8,236 | 267,835 | |||
| 1,935,692 | |||||
| Commercial services & supplies: 1.24% | |||||
| ABM Industries Incorporated | 4,656 | 208,728 | |||
| ACCO Brands Corporation | 8,573 | 73,728 | |||
| Brady Corporation Class A | 3,091 | 142,433 | |||
| BrightView Holdings Incorporated † | 822 | 11,105 | |||
| Casella Waste Systems Incorporated Class A † | 1,188 | 89,575 |
| Shares | Value | ||||
| Commercial services & supplies (continued) | |||||
| Cimpress plc † | 525 | $ 33,070 | |||
| Deluxe Corporation | 3,664 | 113,987 | |||
| Ennis Incorporated | 2,437 | 45,767 | |||
| Healthcare Services Group Incorporated | 4,958 | 78,436 | |||
| Heritage Crystal Clean Incorporated † | 2,853 | 79,998 | |||
| HNI Corporation | 2,845 | 115,763 | |||
| Interface Incorporated | 7,816 | 101,999 | |||
| KAR Auction Services Incorporated † | 2,222 | 41,018 | |||
| Matthews International Corporation Class A | 2,650 | 87,927 | |||
| MillerKnoll Incorporated | 5,088 | 197,821 | |||
| NL Industries | 7,355 | 46,925 | |||
| Pitney Bowes Incorporated | 11,549 | 57,514 | |||
| SP Plus Corporation † | 764 | 22,805 | |||
| Steelcase Incorporated Class A | 6,053 | 73,665 | |||
| Team Incorporated † | 1,961 | 1,852 | |||
| Tetra Tech Incorporated | 2,691 | 427,250 | |||
| The Brink's Company | 1,611 | 112,867 | |||
| The Geo Group Incorporated † | 8,140 | 48,514 | |||
| UniFirst Corporation | 586 | 106,213 | |||
| Viad Corporation † | 1,418 | 49,545 | |||
| VSE Corporation | 454 | 21,633 | |||
| 2,390,138 | |||||
| Construction & engineering: 1.22% | |||||
| Ameresco Incorporated Class A † | 1,158 | 74,402 | |||
| APi Group Corporation † | 12,987 | 280,130 | |||
| Arcosa Incorporated | 934 | 49,194 | |||
| Comfort Systems Incorporated | 2,103 | 180,816 | |||
| Construction Partners Incorporated Class A † | 1,255 | 33,584 | |||
| Dycom Industries Incorporated † | 2,005 | 174,555 | |||
| EMCOR Group Incorporated | 3,415 | 394,569 | |||
| Fluor Corporation † | 9,508 | 205,943 | |||
| Granite Construction Incorporated | 4,159 | 125,893 | |||
| Great Lakes Dredge & Dock Company † | 3,669 | 51,770 | |||
| Infrastructure and Energy Alternatives Incorporated † | 1,895 | 20,618 | |||
| Matrix Service Company † | 1,750 | 12,145 | |||
| MYR Group Incorporated † | 2,223 | 199,514 | |||
| Nv5 Global Incorporated † | 144 | 15,444 | |||
| Primoris Services Corporation | 3,532 | 93,139 | |||
| Sterling Construction Company Incorporated † | 4,039 | 119,272 | |||
| Tutor Perini Corporation † | 6,468 | 63,386 | |||
| WillScot Mobile Mini Holdings Corporation † | 6,798 | 241,533 | |||
| 2,335,907 | |||||
| Electrical equipment: 1.37% | |||||
| Allied Motion Technologies | 1,819 | 63,338 | |||
| Array Technologies Incorporated † | 8,541 | 96,001 | |||
| Atkore International Incorporated † | 4,913 | 499,701 | |||
| AZZ Incorporated | 4,796 | 236,107 | |||
| Babcock & Wilcox Enterprises Incorporated † | 21,252 | 148,977 | |||
| Bloom Energy Corporation Class A † | 5,774 | 128,183 | |||
| Encore Wire Corporation | 3,620 | 421,440 | |||
| EnerSys | 3,805 | 276,738 | |||
| Eos Energy Enterprises Incorporated † | 2,929 | 8,494 | |||
| Fuelcell Energy Incorporated † | 6,762 | 40,572 | |||
| GrafTech International Limited | 34,964 | 352,437 |
| Shares | Value | ||||
| Electrical equipment (continued) | |||||
| Powell Industries Incorporated | 3,228 | $ 68,240 | |||
| Preformed Line Products Company | 1,085 | 60,489 | |||
| Romeo Power Incorporated † | 8,945 | 16,369 | |||
| Stem Incorporated † | 2,604 | 24,790 | |||
| Thermon Group Holdings Incorporated † | 4,464 | 76,424 | |||
| TPI Composites Incorporated † | 2,520 | 34,070 | |||
| Vicor Corporation † | 1,057 | 79,032 | |||
| 2,631,402 | |||||
| Machinery: 3.70% | |||||
| Alamo Group Incorporated | 650 | 90,422 | |||
| Albany International Corporation Class A | 2,201 | 193,292 | |||
| Altra Industrial Motion Corporation | 4,074 | 173,023 | |||
| Astec Industries Incorporated | 1,097 | 54,631 | |||
| Barnes Group Incorporated | 3,196 | 148,454 | |||
| Blue Bird Corporation † | 5,924 | 126,240 | |||
| Chart Industries Incorporated † | 2,037 | 294,143 | |||
| Circor International Incorporated † | 1,307 | 35,211 | |||
| Columbus McKinnon Corporation | 630 | 28,753 | |||
| Commercial Vehicle Group Incorporated † | 11,212 | 89,584 | |||
| Douglas Dynamics Incorporated | 3,443 | 126,496 | |||
| Energy Recovery Incorporated † | 1,860 | 35,340 | |||
| Enerpac Tool Group Corporation | 4,003 | 69,052 | |||
| EnPro Industries Incorporated | 1,287 | 142,136 | |||
| ESC Briggs & Stratton ♦† | 1,723 | 0 | |||
| ESCO Technologies Incorporated | 1,246 | 86,684 | |||
| Evoqua Water Technologies Company † | 6,490 | 276,863 | |||
| Federal Signal Corporation | 5,008 | 180,839 | |||
| Franklin Electric Company Incorporated | 3,353 | 283,530 | |||
| Gorman Rupp Company | 1,536 | 57,231 | |||
| Helios Technologies Incorporated | 2,225 | 174,462 | |||
| Hillenbrand Incorporated | 5,608 | 267,558 | |||
| Hyster Yale Materials Handeling Incorporated | 671 | 25,686 | |||
| John Bean Technologies Corporation | 1,830 | 207,467 | |||
| Kadant Incorporated | 922 | 181,957 | |||
| Kennametal Incorporated | 5,777 | 183,189 | |||
| Lindsay Manufacturing Company | 1,003 | 131,604 | |||
| Luxfer Holdings plc | 3,871 | 67,433 | |||
| Manitowoc Company Incorporated † | 7,301 | 120,686 | |||
| Mayville Engineering Company Incorporated † | 10,347 | 106,988 | |||
| Meritor Incorporated † | 8,986 | 319,991 | |||
| Miller Industries Incorporated | 847 | 26,240 | |||
| Mueller Industries Incorporated | 7,771 | 443,336 | |||
| Mueller Water Products Incorporated Class A | 10,606 | 134,590 | |||
| Nikola Corporation † | 15,182 | 119,938 | |||
| NN Incorporated † | 13,309 | 34,470 | |||
| Park Ohio Holdings Corporation | 571 | 9,073 | |||
| RBC Bearings Incorporated † | 1,152 | 223,315 | |||
| REV Group Incorporated | 11,115 | 150,275 | |||
| SPX Corporation † | 2,304 | 116,813 | |||
| Standex International Corporation | 1,175 | 124,468 | |||
| Tennant Company | 1,212 | 95,481 | |||
| Terex Corporation | 8,072 | 333,212 | |||
| The Greenbrier Companies Incorporated | 1,593 | 70,777 | |||
| The Shyft Group Incorporated | 6,230 | 251,754 | |||
| Titan International Incorporated † | 14,868 | 166,522 |
| Shares | Value | ||||
| Machinery (continued) | |||||
| Trinity Industries Incorporated | 2,567 | $ 74,084 | |||
| Wabash National Corporation | 8,217 | 140,018 | |||
| Watts Water Technologies Incorporated | 2,107 | 303,303 | |||
| 7,096,614 | |||||
| Marine: 0.15% | |||||
| Matson Incorporated | 2,605 | 288,556 | |||
| Professional services: 1.59% | |||||
| ASGN Incorporated † | 2,937 | 325,390 | |||
| Barrett Business Services Incorporated | 1,044 | 62,797 | |||
| CBIZ Incorporated † | 3,165 | 123,150 | |||
| CRA International Incorporated | 1,039 | 92,294 | |||
| Exponent Incorporated | 2,332 | 220,980 | |||
| Franklin Covey Company † | 1,467 | 67,629 | |||
| Heidrick & Struggles International Incorporated | 3,170 | 135,518 | |||
| HireQuest Incorporated | 2,539 | 47,632 | |||
| Huron Consulting Group Incorporated † | 1,031 | 50,859 | |||
| ICF International Incorporated | 1,897 | 168,112 | |||
| Insperity Incorporated | 2,173 | 195,461 | |||
| KBR Incorporated | 7,108 | 352,841 | |||
| Kelly Services Incorporated Class A | 5,423 | 115,076 | |||
| Kforce Incorporated | 2,639 | 198,400 | |||
| Korn Ferry International | 3,360 | 222,634 | |||
| ManTech International Corporation Class A | 1,748 | 145,731 | |||
| Mistras Group Incorporated † | 10,851 | 72,376 | |||
| Resources Connection Incorporated | 5,039 | 83,647 | |||
| TriNet Group Incorporated † | 1,803 | 157,420 | |||
| TrueBlue Incorporated † | 6,948 | 188,986 | |||
| UPwork Incorporated † | 1,273 | 32,181 | |||
| 3,059,114 | |||||
| Road & rail: 0.75% | |||||
| Arcbest Corporation | 2,399 | 222,339 | |||
| Avis Budget Group Incorporated † | 2,856 | 523,905 | |||
| Covenant Logistics Group Incorporated | 5,122 | 115,296 | |||
| Daseke Incorporated † | 1,865 | 23,406 | |||
| Saia Incorporated † | 1,415 | 406,430 | |||
| Universal Logistics Holdings Incorporated | 222 | 4,247 | |||
| US Xpress Enterprises Incorporated Class A † | 1,870 | 8,490 | |||
| Werner Enterprises Incorporated | 3,391 | 147,373 | |||
| 1,451,486 | |||||
| Trading companies & distributors: 1.48% | |||||
| Applied Industrial Technologies Incorporated | 1,955 | 197,651 | |||
| Beacon Roofing Supply Incorporated † | 3,874 | 231,239 | |||
| Bluelinx Holdings Incorporated † | 3,858 | 344,828 | |||
| Boise Cascade Company | 3,968 | 317,202 | |||
| GATX Corporation | 657 | 70,056 | |||
| Global Industrial Company | 53 | 1,684 | |||
| GMS Incorporated † | 3,405 | 184,721 | |||
| Herc Holdings Incorporated | 1,375 | 218,790 | |||
| McGrath RentCorp | 181 | 14,712 | |||
| MRC Global Incorporated † | 5,371 | 54,247 | |||
| NOW Incorporated † | 3,585 | 33,484 | |||
| Rush Enterprises Incorporated Class A | 3,571 | 185,478 |
| Shares | Value | ||||
| Trading companies & distributors (continued) | |||||
| Rush Enterprises Incorporated Class B | 1,405 | $ 68,859 | |||
| Textainer Group Holdings Limited | 1,677 | 59,550 | |||
| Titan Machinery Incorporated † | 5,268 | 149,242 | |||
| Transcat Incorporated † | 512 | 40,172 | |||
| Triton International Limited | 2,971 | 195,135 | |||
| Veritiv Corporation † | 2,242 | 240,275 | |||
| WESCO International Incorporated † | 1,918 | 233,478 | |||
| 2,840,803 | |||||
| Information technology: 13.57% | |||||
| Communications equipment: 0.59% | |||||
| Adtran Incorporated | 3,302 | 67,988 | |||
| Aviat Networks Incorporated † | 4,460 | 126,218 | |||
| Calamp Corporation † | 506 | 3,572 | |||
| Calix Incorporated † | 3,015 | 163,835 | |||
| Cambium Networks Corporation † | 1,157 | 32,176 | |||
| Casa Systems Incorporated † | 1 | 4 | |||
| Clearfield Incorporated † | 1,309 | 83,920 | |||
| Emcore Corporation † | 14,433 | 56,000 | |||
| Extreme Networks Incorporated † | 14,104 | 162,055 | |||
| Harmonic Incorporated † | 2,195 | 20,435 | |||
| Infinera Corporation † | 978 | 9,027 | |||
| Netgear Incorporated † | 1,990 | 52,954 | |||
| NetScout Systems Incorporated † | 1,885 | 58,680 | |||
| Plantronics Incorporated † | 2,916 | 82,144 | |||
| Ribbon Communications Incorporated † | 1,472 | 4,475 | |||
| Viavi Solutions Incorporated † | 12,726 | 208,706 | |||
| 1,132,189 | |||||
| Electronic equipment, instruments & components: 2.31% | |||||
| Advanced Energy Industries Incorporated | 2,453 | 210,590 | |||
| Aeva Technologies Incorporated † | 8,184 | 34,373 | |||
| Badger Meter Incorporated | 1,714 | 170,389 | |||
| Belden Incorporated | 4,301 | 242,361 | |||
| Benchmark Electronics Incorporated | 4,967 | 129,837 | |||
| CTS Corporation | 3,798 | 144,096 | |||
| Daktronics Incorporated † | 26,595 | 122,603 | |||
| ePlus Incorporated † | 2,444 | 114,624 | |||
| Fabrinet † | 3,329 | 333,333 | |||
| Identiv Incorporated † | 1,182 | 24,775 | |||
| II-VI Incorporated † | 4,661 | 323,753 | |||
| Insight Enterprises Incorporated † | 3,430 | 356,720 | |||
| Iteris Incorporated † | 1,474 | 4,849 | |||
| Itron Incorporated † | 1,903 | 90,716 | |||
| Kimball Electronics Incorporated † | 6,016 | 103,716 | |||
| Knowles Corporation † | 8,121 | 176,875 | |||
| Methode Electronics Incorporated | 4,258 | 194,335 | |||
| Napco Security Technologies Incorporated † | 1,898 | 38,700 | |||
| Novanta Incorporated † | 2,018 | 275,719 | |||
| OSI Systems Incorporated † | 1,676 | 135,203 | |||
| Ouster Incorporated † | 3,126 | 10,566 | |||
| PC Connection Incorporated | 2,194 | 107,045 | |||
| Plexus Corporation † | 1,933 | 157,482 | |||
| Sanmina Corporation † | 4,395 | 174,833 | |||
| ScanSource Incorporated † | 7,790 | 246,008 |
| Shares | Value | ||||
| Electronic equipment, instruments & components (continued) | |||||
| TTM Technologies Incorporated † | 14,173 | $ 178,155 | |||
| Velodyne Lidar Incorporated † | 2,283 | 8,424 | |||
| Vishay Intertechnology Incorporated | 14,627 | 280,692 | |||
| Vishay Precision Group † | 1,359 | 42,686 | |||
| 4,433,458 | |||||
| IT services: 1.59% | |||||
| BM Technologies Incorporated † | 1,827 | 17,430 | |||
| Brightcove Incorporated † | 2,732 | 20,435 | |||
| Conduent Incorporated † | 11,677 | 56,867 | |||
| CSG Systems International Incorporated | 4,260 | 262,927 | |||
| DigitalOcean Holdings Incorporated † | 767 | 45,498 | |||
| ESC Incorporated ♦† | 6,981 | 0 | |||
| Evertec Incorporated | 5,206 | 210,114 | |||
| EVO Payments Incorporated Class A † | 3,867 | 93,233 | |||
| ExlService Holdings Incorporated † | 3,100 | 374,449 | |||
| GreenBox POS † | 5,411 | 18,397 | |||
| Grid Dynamics Holdings Incorporated † | 5,345 | 64,942 | |||
| Hackett Group Incorporated | 10,844 | 224,688 | |||
| IBEX Holdings Limited † | 1,549 | 24,428 | |||
| International Money Express Incorporated † | 8,485 | 136,269 | |||
| LiveRamp Holdings Incorporated † | 3,061 | 132,113 | |||
| Maximus Incorporated | 4,941 | 389,647 | |||
| Paya Holdings Incorporated Class A † | 5,740 | 37,023 | |||
| Perficient Incorporated † | 3,016 | 307,330 | |||
| Priority Technology Holdings † | 2,797 | 14,712 | |||
| Rackspace Technology Incorporated † | 561 | 6,244 | |||
| StarTek Incorporated † | 21,829 | 95,611 | |||
| TTEC Holdings Incorporated | 2,415 | 191,993 | |||
| Tucows Incorporated Class A † | 309 | 20,759 | |||
| Unisys Corporation † | 8,059 | 172,221 | |||
| Verra Mobility Corporation † | 8,704 | 146,227 | |||
| 3,063,557 | |||||
| Semiconductors & semiconductor equipment: 3.26% | |||||
| Alpha & Omega Semiconductor † | 5,141 | 276,432 | |||
| Ambarella Incorporated † | 1,597 | 223,117 | |||
| Amkor Technology Incorporated | 7,048 | 159,778 | |||
| Axcelis Technologies Incorporated † | 4,688 | 324,503 | |||
| AXT Incorporated † | 4,107 | 30,597 | |||
| Ceva Incorporated † | 283 | 11,538 | |||
| Cohu Incorporated † | 3,270 | 101,959 | |||
| Diodes Incorporated † | 3,376 | 302,456 | |||
| FormFactor Incorporated † | 5,032 | 203,746 | |||
| Ichor Holdings Limited † | 3,462 | 121,966 | |||
| Impinj Incorporated † | 277 | 19,044 | |||
| Kopin Corporation † | 4,123 | 10,885 | |||
| Kulicke and Soffa Industries Incorporated | 6,800 | 355,232 | |||
| Lattice Semiconductor Corporation † | 8,494 | 531,894 | |||
| Macom Technology Solutions Holdings Incorporated † | 3,133 | 188,293 | |||
| Maxlinear Incorporated † | 3,415 | 209,510 | |||
| Metamaterial Incorporated | 46,895 | 100,824 | |||
| NVE Corporation | 2,278 | 130,302 | |||
| Onto Innovation Incorporated † | 3,661 | 315,615 | |||
| Photronics Incorporated † | 9,995 | 184,108 | |||
| Power Integrations Incorporated | 4,005 | 360,450 |
| Shares | Value | ||||
| Semiconductors & semiconductor equipment (continued) | |||||
| Rambus Incorporated † | 8,286 | $ 223,722 | |||
| Semtech Corporation † | 3,807 | 264,130 | |||
| Silicon Laboratories Incorporated † | 2,078 | 319,409 | |||
| Sitime Corporation † | 433 | 87,527 | |||
| Smart Global Holdings Incorporated † | 9,278 | 254,681 | |||
| SunPower Corporation † | 5,441 | 97,557 | |||
| Synaptics Incorporated † | 2,081 | 475,363 | |||
| Ultra Clean Holdings Incorporated † | 5,274 | 241,602 | |||
| Veeco Instruments Incorporated † | 4,612 | 131,765 | |||
| 6,258,005 | |||||
| Software: 5.55% | |||||
| 8x8 Incorporated † | 7,797 | 101,049 | |||
| A10 Networks Incorporated | 18,778 | 267,399 | |||
| ACI Worldwide Incorporated † | 10,217 | 342,474 | |||
| Agilysys Incorporated † | 2,407 | 101,166 | |||
| Alarm.com Holdings Incorporated † | 4,093 | 269,442 | |||
| Altair Engineering Incorporated Class A † | 4,695 | 311,842 | |||
| American Software Incorporated Class A | 11,548 | 253,710 | |||
| AppFolio Incorporated Class A † | 1,270 | 143,688 | |||
| Appian Corporation † | 2,037 | 124,176 | |||
| Arlo Technologies Incorporated † | 1,092 | 10,134 | |||
| Asana Incorporated Class A † | 4,699 | 257,458 | |||
| Avaya Holdings Corporation † | 5,690 | 78,351 | |||
| Benefitfocus Incorporated † | 3,010 | 30,341 | |||
| Blackbaud Incorporated † | 5,015 | 313,387 | |||
| BlackLine Incorporated † | 1,903 | 143,315 | |||
| Box Incorporated Class A † | 11,317 | 289,828 | |||
| BTRS Holdings Incorporated † | 19,863 | 121,164 | |||
| Cerence Incorporated † | 2,611 | 94,283 | |||
| ChannelAdvisor Corporation † | 7,163 | 128,576 | |||
| CleanSpark Incorporated † | 2,253 | 23,882 | |||
| CommVault Systems Incorporated † | 3,147 | 197,978 | |||
| Concensus Cloud Solution † | 1,344 | 74,807 | |||
| CoreCard Corporation † | 3,171 | 102,170 | |||
| Couchbase Incorporated † | 1,145 | 24,125 | |||
| CS Disco Incorporated † | 928 | 35,060 | |||
| Digital Turbine Incorporated † | 6,314 | 306,103 | |||
| Domo Incorporated Class B † | 3,053 | 135,859 | |||
| Ebix Incorporated | 7,317 | 215,925 | |||
| eGain Corporation † | 6,818 | 80,384 | |||
| Envestnet Incorporated † | 3,498 | 261,720 | |||
| GTY Technology Holdings Incorporated † | 10,827 | 48,072 | |||
| Intapp Incorporated † | 1,448 | 33,391 | |||
| InterDigital Incorporated | 3,462 | 223,022 | |||
| Kaltura Incorporated † | 4,774 | 10,694 | |||
| LivePerson Incorporated † | 3,291 | 66,741 | |||
| Marathon Digital Holdings Incorporated † | 8,908 | 225,818 | |||
| MeridianLink Incorporated † | 3,908 | 76,519 | |||
| MicroStrategy Incorporated Class A † | 516 | 228,588 | |||
| Mitek Systems Incorporated † | 6,434 | 95,609 | |||
| Model N Incorporated † | 1,209 | 29,729 | |||
| ON24 Incorporated † | 4,610 | 71,916 | |||
| OneSpan Incorporated † | 4,277 | 58,937 | |||
| Pagerduty Incorporated † | 4,651 | 157,297 | |||
| Ping Identity Holding Corporation † | 905 | 19,041 |
| Shares | Value | ||||
| Software (continued) | |||||
| Progress Software Corporation | 6,950 | $ 306,356 | |||
| PROS Holdings Incorporated † | 2,762 | 87,776 | |||
| Q2 Holdings Incorporated † | 1,738 | 113,057 | |||
| Qualys Incorporated † | 2,903 | 363,775 | |||
| Rapid7 Incorporated † | 3,198 | 330,865 | |||
| Rimini Street Incorporated † | 2,981 | 13,504 | |||
| Riot Blockchain Incorporated † | 6,088 | 104,896 | |||
| SailPoint Technologies Holdings Incorporated † | 6,006 | 248,468 | |||
| Sapiens International Corporation | 3,647 | 98,433 | |||
| Secureworks Corporation Class A † | 14,958 | 229,904 | |||
| Shotspotter Incorporated † | 2,539 | 65,202 | |||
| Smith Micro Software Incorporated † | 3,121 | 12,983 | |||
| Sprout Social Incorporated Class A † | 3,241 | 211,022 | |||
| SPS Commerce Incorporated † | 2,877 | 373,578 | |||
| Sumo Logic Incorporated † | 3,490 | 42,020 | |||
| Telos Corporation † | 2,687 | 30,686 | |||
| Tenable Holdings Incorporated † | 4,151 | 229,799 | |||
| Upland Software Incorporated † | 1,866 | 35,193 | |||
| Varonis Systems Incorporated † | 5,412 | 235,963 | |||
| Verint Systems Incorporated † | 7,614 | 382,451 | |||
| Veritone Incorporated † | 567 | 9,548 | |||
| Viant Technology † | 19,458 | 160,139 | |||
| Workiva Incorporated † | 3,221 | 339,171 | |||
| Xperi Holding Corporation | 14,511 | 251,331 | |||
| Zuora Incorporated † | 12,541 | 190,372 | |||
| 10,651,662 | |||||
| Technology hardware, storage & peripherals: 0.27% | |||||
| 3D Systems Corporation † | 7,879 | 140,404 | |||
| Avid Technology Incorporated † | 4,468 | 140,563 | |||
| Diebold Nixdorf Incorporated † | 4,671 | 40,638 | |||
| Super Micro Computer Incorporated † | 4,419 | 173,623 | |||
| Turtle Beach Corporation † | 1,060 | 25,196 | |||
| 520,424 | |||||
| Materials: 3.83% | |||||
| Chemicals: 1.97% | |||||
| Advansix Incorporated | 6,745 | 270,205 | |||
| American Vanguard Corporation | 1,421 | 21,414 | |||
| Amyris Incorporated † | 2,771 | 12,636 | |||
| Aspen Aerogels Incorporated † | 773 | 22,881 | |||
| Avient Corporation | 6,102 | 319,684 | |||
| Balchem Corporation | 1,890 | 261,463 | |||
| Cabot Corporation | 3,878 | 283,714 | |||
| Ecovyst Incorporated | 885 | 9,673 | |||
| Hawkins Incorporated | 1,835 | 83,052 | |||
| HB Fuller Company | 3,937 | 269,173 | |||
| Ingevity Corporation † | 2,617 | 178,558 | |||
| Innospec Incorporated | 2,246 | 214,493 | |||
| Intrepid Potash Incorporated † | 2,334 | 132,781 | |||
| Kooper Holdings Incorporated † | 1,435 | 41,084 | |||
| Kronos Worldwide Incorporated | 1,017 | 14,980 | |||
| Livent Corporation † | 6,314 | 148,695 | |||
| Minerals Technologies Incorporated | 2,728 | 190,933 | |||
| Orion Engineered Carbons SA | 6,339 | 98,508 |
| Shares | Value | ||||
| Chemicals (continued) | |||||
| Quaker Chemical Corporation | 667 | $ 123,802 | |||
| Rayonier Advanced Materials † | 1,632 | 9,580 | |||
| Sensient Technologies Corporation | 3,206 | 263,309 | |||
| Stepan Company | 1,362 | 141,130 | |||
| Tredegar Corporation | 3,868 | 44,521 | |||
| Trinseo plc | 5,290 | 274,868 | |||
| Tronox Holdings plc Class A | 10,141 | 205,862 | |||
| Valhi Incorporated | 5,439 | 138,531 | |||
| 3,775,530 | |||||
| Construction materials: 0.09% | |||||
| Summit Materials Incorporated Class A † | 5,415 | 169,056 | |||
| Containers & packaging: 0.24% | |||||
| Greif Incorporated Class A | 2,678 | 153,958 | |||
| O-I Glass Incorporated † | 13,702 | 175,112 | |||
| Ranpak Holdings Corporation † | 3,067 | 74,221 | |||
| Trimas Corporation | 2,017 | 65,573 | |||
| 468,864 | |||||
| Metals & mining: 1.50% | |||||
| Allegheny Technologies Incorporated † | 5,509 | 141,802 | |||
| Arconic Corporation † | 4,121 | 126,515 | |||
| Carpenter Technology | 925 | 35,511 | |||
| Century Aluminum Company † | 8,156 | 192,645 | |||
| Coeur Mining Corporation † | 17,273 | 74,274 | |||
| Commercial Metals Company | 9,471 | 365,107 | |||
| Compass Minerals International Incorporated | 1,722 | 100,944 | |||
| Constellium SE † | 10,871 | 211,224 | |||
| Haynes International Incorporated | 1,505 | 55,023 | |||
| Hecla Mining Company | 24,215 | 139,478 | |||
| Kaiser Aluminum Corporation | 564 | 54,426 | |||
| Materion Corporation | 1,354 | 113,127 | |||
| NovaGold Resources Incorporated † | 14,564 | 101,657 | |||
| Olympic Steel Incorporated | 8,101 | 216,864 | |||
| Ryerson Holding Corporation | 8,418 | 219,878 | |||
| Schnitzer Steel Industries Incorporated Class A | 1,791 | 87,132 | |||
| Suncoke Energy Incorporated | 16,375 | 129,854 | |||
| TimkenSteel Corporation † | 14,166 | 255,413 | |||
| Warrior Met Coal Incorporated | 2,717 | 85,586 | |||
| Worthington Industries Incorporated | 3,100 | 176,762 | |||
| 2,883,222 | |||||
| Paper & forest products: 0.03% | |||||
| Glatfelter Corporation | 2,843 | 39,063 | |||
| Schweitzer-Mauduit International Incorporated | 312 | 9,741 | |||
| 48,804 | |||||
| Real estate: 8.23% | |||||
| Equity REITs: 7.51% | |||||
| Acadia Realty Trust | 24,272 | 520,392 | |||
| Agree Realty Corporation | 3,487 | 223,691 | |||
| Alexander & Baldwin Incorporated | 8,175 | 183,365 | |||
| Alexander's Incorporated | 140 | 35,479 | |||
| American Assets Trust Incorporated | 2,684 | 98,127 |
| Shares | Value | ||||
| Equity REITs (continued) | |||||
| Apartment Investment & Management Company Class A † | 40,564 | $ 289,627 | |||
| Apple Hospitality REIT Incorporated | 12,966 | 229,369 | |||
| Armada Hoffler Properties Incorporated | 5,798 | 85,115 | |||
| Braemar Hotels & Resorts Incorporated REIT † | 3,948 | 23,530 | |||
| Brandywine Realty Trust | 20,754 | 276,651 | |||
| Broadstone Net Lease Incorporated REIT | 11,705 | 253,530 | |||
| BRT Apartments Corporation REIT | 2,692 | 59,251 | |||
| CareTrust REIT Incorporated | 6,669 | 116,708 | |||
| Catchmark Timber Trust Incorporated Class A | 1,749 | 13,397 | |||
| Centerspace REIT | 1,242 | 116,736 | |||
| City Office REIT Incorporated | 18,763 | 323,099 | |||
| Clipper Realty Incorporated | 858 | 8,168 | |||
| Community Healthcare Trust Incorporated | 169 | 7,047 | |||
| Corporate Office Properties Trust | 7,597 | 199,117 | |||
| CTO Realty Growth Incorporated REIT | 2,689 | 168,573 | |||
| DiamondRock Hospitality † | 9,843 | 94,001 | |||
| DigitalBridge Group Incorporated † | 32,148 | 233,073 | |||
| Easterly Government Properties Incorporated | 2,285 | 47,574 | |||
| EastGroup Properties Incorporated | 2,523 | 481,287 | |||
| Empire State Realty Trust Incorporated Class A | 17,224 | 162,939 | |||
| Equity Commonwealth † | 2,453 | 65,176 | |||
| Essential Properties Realty | 6,262 | 158,303 | |||
| Farmland Partners REIT Incorporated | 4,038 | 47,123 | |||
| Four Corners Property Trust Incorporated | 5,006 | 132,058 | |||
| Franklin Street Properties Corporation | 24,198 | 139,864 | |||
| Getty Realty Corporation | 4,803 | 132,323 | |||
| Gladstone Commercial Corporation | 2,553 | 54,098 | |||
| Gladstone Land REIT Corporation | 1,358 | 40,591 | |||
| Global Net Lease Incorporated | 1,952 | 27,738 | |||
| Healthcare Realty Trust Incorporated | 6,937 | 180,917 | |||
| Hersha Hospitality Trust † | 1,502 | 13,863 | |||
| Independence Realty Trust Incorporated | 7,003 | 176,966 | |||
| Industrial Logistics Properties Trust | 4,314 | 96,504 | |||
| Innovative Industrial Properties Incorporated | 1,325 | 249,710 | |||
| iStar Financial Incorporated | 4,697 | 117,989 | |||
| Kite Realty Group Trust | 12,179 | 267,085 | |||
| Lexington Corporate Properties Trust | 22,363 | 345,732 | |||
| LTC Properties Incorporated | 2,585 | 87,451 | |||
| National Health Investors Incorporated | 2,940 | 156,731 | |||
| National Storage Affiliates Trust | 6,247 | 364,013 | |||
| New York REIT Incorporated ♦‡† | 4,209 | 76,157 | |||
| NexPoint Residential Trust Incorporated | 1,236 | 105,023 | |||
| Office Properties Income Trust | 1,846 | 46,242 | |||
| One Liberty Properties Incorporated | 10,635 | 309,053 | |||
| Outfront Media Incorporated | 7,670 | 204,789 | |||
| Paramount Group Incorporated | 9,231 | 103,295 | |||
| Pebblebrook Hotel Trust | 5,966 | 134,295 | |||
| Philips Edison & Company Incorporated | 3,917 | 126,597 | |||
| Physicians Realty Trust | 12,426 | 202,047 | |||
| Piedmont Office Realty Trust Incorporated Class A | 8,773 | 149,492 | |||
| Plymouth Industrial Incorporated | 2,692 | 70,207 | |||
| PotlatchDeltic Corporation | 4,450 | 244,305 | |||
| Preferred Apartment Communities Incorporated Class A | 2,716 | 68,606 | |||
| PS Business Parks Incorporated | 1,691 | 269,359 | |||
| Retail Opportunity Investment Corporation | 32,544 | 590,999 | |||
| Retail Value Incorporated | 1,168 | 3,621 |
| Shares | Value | ||||
| Equity REITs (continued) | |||||
| RLJ Lodging Trust | 7,413 | $ 103,708 | |||
| RPT Realty | 41,201 | 533,553 | |||
| Ryman Hospitality Properties Incorporated † | 3,013 | 265,475 | |||
| Sabra Health Care REIT Incorporated | 12,184 | 163,631 | |||
| Safehold Incorporated REIT | 131 | 8,038 | |||
| Saul Centers Incorporated | 965 | 44,419 | |||
| Seritage Growth Property Class A † | 5,617 | 57,237 | |||
| Service Properties Trust | 5,883 | 50,770 | |||
| SITE Centers Corporation | 29,789 | 463,219 | |||
| STAG Industrial Incorporated | 9,680 | 377,133 | |||
| Summit Hotel Properties Incorporated † | 2,226 | 22,015 | |||
| Sunstone Hotel Investors Incorporated † | 12,253 | 129,637 | |||
| Tanger Factory Outlet Centers Incorporated | 20,888 | 348,412 | |||
| Terreno Realty Corporation | 4,405 | 303,020 | |||
| The Macerich Company | 23,515 | 359,780 | |||
| The Necessity Retail REIT Incorporated | 3,785 | 26,646 | |||
| UMH Properties Incorporated | 5,797 | 133,679 | |||
| Uniti Group Incorporated | 11,402 | 147,884 | |||
| Universal Health Realty Income Trust | 572 | 32,667 | |||
| Urban Edge Properties | 20,832 | 379,559 | |||
| Urstadt Biddle Properties Incorporated | 6,667 | 125,540 | |||
| Veris Residential Incorporated † | 13,471 | 227,660 | |||
| Washington REIT | 5,851 | 136,679 | |||
| Whitestone REIT | 6,540 | 77,041 | |||
| Xenia Hotels & Resorts Incorporated † | 5,289 | 98,058 | |||
| 14,423,628 | |||||
| Real estate management & development: 0.72% | |||||
| Cushman & Wakefield plc † | 9,473 | 207,648 | |||
| Douglas Elliman Incorporated † | 8,994 | 67,815 | |||
| eXp World Holdings Incorporated | 2,614 | 69,898 | |||
| Forestar Group Incorporated † | 2,602 | 47,643 | |||
| Kennedy Wilson Holdings Incorporated | 8,945 | 198,042 | |||
| Marcus & Millichap Incorporated † | 2,315 | 115,125 | |||
| Newmark Group Incorporated Class A | 17,670 | 312,406 | |||
| Realogy Holdings Corporation † | 7,881 | 143,277 | |||
| Redfin Corporation † | 2,526 | 54,637 | |||
| The RMR Group Incorporated Class A | 4,187 | 122,009 | |||
| The St. Joe Company | 588 | 31,770 | |||
| 1,370,270 | |||||
| Utilities: 2.77% | |||||
| Electric utilities: 0.53% | |||||
| Allete Incorporated | 3,271 | 205,877 | |||
| MGE Energy Incorporated | 1,818 | 130,932 | |||
| Otter Tail Corporation | 3,300 | 204,138 | |||
| Portland General Electric Company | 5,434 | 275,884 | |||
| Via Renewables Incorporated | 18,044 | 201,191 | |||
| 1,018,022 | |||||
| Gas utilities: 0.95% | |||||
| Brookfield Infrastructure Corporation Class A | 3,119 | 219,702 | |||
| Chesapeake Utilities Corporation | 1,731 | 230,136 | |||
| New Jersey Resources Corporation | 7,963 | 347,346 | |||
| Northwest Natural Holding Company | 3,508 | 182,451 |
| Shares | Value | ||||
| Gas utilities (continued) | |||||
| ONE Gas Incorporated | 2,985 | $ 248,024 | |||
| South Jersey Industries Incorporated | 8,712 | 295,598 | |||
| Southwest Gas Holdings Incorporated | 886 | 62,853 | |||
| Spire Incorporated | 3,461 | 232,268 | |||
| 1,818,378 | |||||
| Independent power & renewable electricity producers: 0.43% | |||||
| Clearway Energy Incorporated Class A | 9,251 | 282,988 | |||
| Clearway Energy Incorporated Class C | 7,893 | 263,626 | |||
| Ormat Technologies Incorporated | 3,064 | 218,616 | |||
| Sunnova Energy International Incorporated † | 2,960 | 59,644 | |||
| 824,874 | |||||
| Multi-utilities: 0.42% | |||||
| Avista Corporation | 4,483 | 200,076 | |||
| Black Hills Corporation | 4,297 | 300,747 | |||
| Northwestern Corporation | 3,490 | 211,075 | |||
| Unitil Corporation | 1,964 | 99,162 | |||
| 811,060 | |||||
| Water utilities: 0.44% | |||||
| American States Water Company | 2,485 | 209,138 | |||
| Artesian Resources Corporation Class A | 1,568 | 72,881 | |||
| California Water Service Group | 4,316 | 245,710 | |||
| Global Water Resources Incorporated | 2,333 | 35,578 | |||
| Middlesex Water Company | 1,342 | 134,187 | |||
| Pure Cycle Corporation † | 5,857 | 69,405 | |||
| SJW Corporation | 1,222 | 79,699 | |||
| 846,598 | |||||
| Total Common stocks (Cost $165,644,336) | 186,381,561 |
| Expiration date | |||||
| Rights: 0.00% | |||||
| Health care: 0.00% | |||||
| Pharmaceuticals: 0.00% | |||||
| Elanco Animal Health Incorporated ♦† | 3-31-2022 | 8,956 | 0 | ||
| Total Rights (Cost $225) | 0 |
| Warrants: 0.00% | |||||
| Energy: 0.00% | |||||
| Oil, gas & consumable fuels: 0.00% | |||||
| Battalion Oil Corporation ♦† | 10-8-2022 | 375 | 0 | ||
| Battalion Oil Corporation ♦† | 10-8-2022 | 300 | 0 | ||
| Battalion Oil Corporation ♦† | 10-8-2022 | 482 | 0 | ||
| 0 | |||||
| Total Warrants (Cost $0) | 0 |
| Yield | Shares | Value | |||
| Short-term investments: 2.57% | |||||
| Investment companies: 2.57% | |||||
| Allspring Government Money Market Fund Select Class ♠∞ | 0.03% | 4,940,136 | $ 4,940,136 | ||
| Total Short-term investments (Cost $4,940,136) | 4,940,136 | ||||
| Total investments in securities (Cost $170,584,697) | 99.66% | 191,321,697 | |||
| Other assets and liabilities, net | 0.34 | 647,704 | |||
| Total net assets | 100.00% | $191,969,401 |
| † | Non-income-earning security |
| ♦ | The security is fair valued in accordance with procedures approved by the Board of Trustees. |
| ‡ | Security is valued using significant unobservable inputs. |
| ♠ | The issuer of the security is an affiliated person of the Portfolio as defined in the Investment Company Act of 1940. |
| ∞ | The rate represents the 7-day annualized yield at period end. |
| Abbreviations: | |
| REIT | Real estate investment trust |
| Value, beginning of period | Purchases | Sales proceeds | Net realized gains (losses) | Net change in unrealized gains (losses) | Value, end of period | Shares, end of period | Income from affiliated securities | |
| Short-term investments | ||||||||
| Allspring Government Money Market Fund Select Class | $2,925,181 | $93,660,234 | $(91,645,279) | $0 | $0 | $4,940,136 | 4,940,136 | $1,958 |
| Description | Number of contracts | Expiration date | Notional cost | Notional value | Unrealized gains | Unrealized losses |
| Long | ||||||
| E-Mini Russell 2000 Index | 59 | 3-18-2022 | $5,826,665 | $6,031,275 | $204,610 | $0 |
| Assets | |
Investments in unaffiliated securities, at value (cost $165,644,561) | $ 186,381,561 |
Investments in affiliated securities, at value (cost $4,940,136) | 4,940,136 |
Cash | 79 |
Cash at broker segregated for futures contracts | 605,440 |
Receivable for dividends | 110,130 |
Receivable for daily variation margin on open futures contracts | 14,332 |
Prepaid expenses and other assets | 4,700 |
Total assets | 192,056,378 |
| Liabilities | |
Professional fees payable | 42,166 |
Custody and accounting fees payable | 31,492 |
Advisory fee payable | 11,169 |
Trustees’ fees and expenses payable | 2,150 |
Total liabilities | 86,977 |
Total net assets | $191,969,401 |
| Investment income | |
Dividends (net of foreign withholdings taxes of $11,343) | $ 1,946,659 |
Income from affiliated securities | 1,958 |
Total investment income | 1,948,617 |
| Expenses | |
Advisory fee | 316,873 |
Custody and accounting fees | 39,840 |
Professional fees | 53,636 |
Interest holder report expenses | 18,465 |
Trustees’ fees and expenses | 20,121 |
Other fees and expenses | 19,531 |
Total expenses | 468,466 |
Less: Fee waivers and/or expense reimbursements | (138,918) |
Net expenses | 329,548 |
Net investment income | 1,619,069 |
| Realized and unrealized gains (losses) on investments | |
| Net realized gains (losses) on | |
Unaffiliated securities | 50,051,472 |
Futures contracts | (917,601) |
Net realized gains on investments | 49,133,871 |
| Net change in unrealized gains (losses) on | |
Unaffiliated securities | (55,007,479) |
Futures contracts | 314,558 |
Net change in unrealized gains (losses) on investments | (54,692,921) |
Net realized and unrealized gains (losses) on investments | (5,559,050) |
Net decrease in net assets resulting from operations | $ (3,939,981) |
| Year ended February 28, 2022 | Year ended February 28, 2021 | |
| Operations | ||
Net investment income | $ 1,619,069 | $ 2,315,241 |
Net realized gains on investments | 49,133,871 | 13,262,319 |
Net change in unrealized gains (losses) on investments | (54,692,921) | 80,382,173 |
Net increase (decrease) in net assets resulting from operations | (3,939,981) | 95,959,733 |
| Capital transactions | ||
| Transactions in investors’ beneficial interests | ||
Contributions | 57,032,871 | 90,575,424 |
Withdrawals | (70,491,112) | (206,734,779) |
Net decrease in net assets resulting from capital transactions | (13,458,241) | (116,159,355) |
Total decrease in net assets | (17,398,222) | (20,199,622) |
| Net assets | ||
Beginning of period | 209,367,623 | 229,567,245 |
End of period | $191,969,401 | $ 209,367,623 |
| Year ended February 28 | |||||
| 2022 | 2021 | 2020 1 | 2019 | 2018 2 | |
Total return3 | (2.87)% | 43.18% | (5.94)% | 7.05% | 8.75% |
| Ratios to average net assets (annualized) | |||||
Gross expenses | 0.22% | 0.22% | 0.23% | 0.21% | 0.19% |
Net expenses | 0.16% * | 0.16% * | 0.18% | 0.19% | 0.19% |
Net investment income | 0.77% | 1.02% | 1.35% | 1.29% | 1.23% |
| Supplemental data | |||||
Portfolio turnover rate | 92% | 98% | 40% | 37% | 85% |
| * | Ratio includes expenses which were voluntarily waived by the adviser. Without these voluntary waivers, the net expense ratios would be increased by the following amounts: |
| Year ended February 28, 2022 | 0.06% |
| Year ended February 28, 2021 | 0.06% |
| 1 | Year ended February 29 |
| 2 | For the period from May 23, 2017 (commencement of operations) to February 28, 2018 |
| 3 | Returns for periods of less than one year are not annualized. |
| Gross unrealized gains | $ 37,727,147 |
| Gross unrealized losses | (19,607,575) |
| Net unrealized gains | $ 18,119,572 |
| ■ | Level 1 – quoted prices in active markets for identical securities |
| ■ | Level 2 – other significant observable inputs (including quoted prices for similar securities, interest rates, prepayment speeds, credit risk, etc.) |
| ■ | Level 3 – significant unobservable inputs (including the Portfolio’s own assumptions in determining the fair value of investments) |
| Quoted prices (Level 1) | Other significant observable inputs (Level 2) | Significant unobservable inputs (Level 3) | Total | |
| Assets | ||||
| Investments in: | ||||
| Common stocks | ||||
| Communication services | $ 6,887,865 | $0 | $ 7,490 | $ 6,895,355 |
| Consumer discretionary | 20,880,210 | 0 | 0 | 20,880,210 |
| Consumer staples | 5,910,147 | 0 | 0 | 5,910,147 |
| Energy | 10,031,965 | 0 | 0 | 10,031,965 |
| Financials | 28,444,802 | 0 | 0 | 28,444,802 |
| Health care | 32,827,614 | 0 | 315,313 | 33,142,927 |
| Industrials | 26,558,554 | 0 | 0 | 26,558,554 |
| Information technology | 26,059,295 | 0 | 0 | 26,059,295 |
| Materials | 7,345,476 | 0 | 0 | 7,345,476 |
| Real estate | 15,717,741 | 0 | 76,157 | 15,793,898 |
| Utilities | 5,318,932 | 0 | 0 | 5,318,932 |
| Rights | ||||
| Health care | 0 | 0 | 0 | 0 |
| Warrants | ||||
| Energy | 0 | 0 | 0 | 0 |
| Short-term investments | ||||
| Investment companies | 4,940,136 | 0 | 0 | 4,940,136 |
| 190,922,737 | 0 | 398,960 | 191,321,697 | |
| Futures contracts | 204,610 | 0 | 0 | 204,610 |
| Total assets | $191,127,347 | $0 | $398,960 | $191,526,307 |
| Average daily net assets | Advisory fee |
| First $5 billion | 0.150% |
| Next $5 billion | 0.130 |
| Over $10 billion | 0.110 |
Allspring Master Trust:

| Name and year of birth | Position held and length of service* | Principal occupations during past five years or longer | Current other public company or investment company directorships |
| William R. Ebsworth (Born 1957) | Trustee, since 2015 | Retired. From 1984 to 2013, equities analyst, portfolio manager, research director and chief investment officer at Fidelity Management and Research Company in Boston, Tokyo, and Hong Kong, and retired in 2013 as Chief Investment Officer of Fidelity Strategic Advisers, Inc. where he led a team of investment professionals managing client assets. Prior thereto, Board member of Hong Kong Securities Clearing Co., Hong Kong Options Clearing Corp., the Thailand International Fund, Ltd., Fidelity Investments Life Insurance Company, and Empire Fidelity Investments Life Insurance Company. Audit Committee Chair and Investment Committee Chair of the Vincent Memorial Hospital Endowment (non-profit organization). Mr. Ebsworth is a CFA® charterholder. | N/A |
| Jane A. Freeman (Born 1953) | Trustee, since 2015; Chair Liaison, since 2018 | Retired. From 2012 to 2014 and 1999 to 2008, Chief Financial Officer of Scientific Learning Corporation. From 2008 to 2012, Ms. Freeman provided consulting services related to strategic business projects. Prior to 1999, Portfolio Manager at Rockefeller & Co. and Scudder, Stevens & Clark. Board member of the Harding Loevner Funds from 1996 to 2014, serving as both Lead Independent Director and chair of the Audit Committee. Board member of the Russell Exchange Traded Funds Trust from 2011 to 2012 and the chair of the Audit Committee. Ms. Freeman is also an inactive Chartered Financial Analyst. | N/A |
| Isaiah Harris, Jr. (Born 1952) | Trustee, since 2009; Audit Committee Chair, since 2019 | Retired. Chairman of the Board of CIGNA Corporation from 2009 to 2021, and Director from 2005 to 2008. From 2003 to 2011, Director of Deluxe Corporation. Prior thereto, President and CEO of BellSouth Advertising and Publishing Corp. from 2005 to 2007, President and CEO of BellSouth Enterprises from 2004 to 2005 and President of BellSouth Consumer Services from 2000 to 2003. Emeritus member of the Iowa State University Foundation Board of Governors. Emeritus Member of the Advisory Board of Iowa State University School of Business. Advisory Board Member, Palm Harbor Academy (private school). Advisory Board Member, Fellowship of Christian Athletes. Mr. Harris is a certified public accountant (inactive status). | N/A |
| David F. Larcker (Born 1950) | Trustee, since 2009 | James Irvin Miller Professor of Accounting at the Graduate School of Business (Emeritus), Stanford University, Director of the Corporate Governance Research Initiative and Senior Faculty of The Rock Center for Corporate Governance since 2006. From 2005 to 2008, Professor of Accounting at the Graduate School of Business, Stanford University. Prior thereto, Ernst & Young Professor of Accounting at The Wharton School, University of Pennsylvania from 1985 to 2005. | N/A |
| Name and year of birth | Position held and length of service* | Principal occupations during past five years or longer | Current other public company or investment company directorships |
| Olivia S. Mitchell (Born 1953) | Trustee, since 2006; Nominating and Governance Committee Chair, since 2018 | International Foundation of Employee Benefit Plans Professor since 1993, Wharton School of the University of Pennsylvania. Director of Wharton’s Pension Research Council and Boettner Center on Pensions & Retirement Research, and Research Associate at the National Bureau of Economic Research. Previously taught at Cornell University from 1978 to 1993. | N/A |
| Timothy J. Penny (Born 1951) | Trustee, since 1996; Chair, since 2018 | President and Chief Executive Officer of Southern Minnesota Initiative Foundation, a non-profit organization, since 2007. Member of the Board of Trustees of NorthStar Education Finance, Inc., a non-profit organization, since 2007. | N/A |
| James G. Polisson (Born 1959) | Trustee, since 2018 | Retired. Chief Marketing Officer, Source (ETF) UK Services, Ltd, from 2015 to 2017. From 2012 to 2015, Principal of The Polisson Group, LLC, a management consulting, corporate advisory and principal investing company. Chief Executive Officer and Managing Director at Russell Investments, Global Exchange Traded Funds from 2010 to 2012. Managing Director of Barclays Global Investors from 1998 to 2010 and Global Chief Marketing Officer for iShares and Barclays Global Investors from 2000 to 2010. Trustee of the San Francisco Mechanics’ Institute, a non-profit organization, from 2013 to 2015. Board member of the Russell Exchange Traded Fund Trust from 2011 to 2012. Director of Barclays Global Investors Holdings Deutschland GmbH from 2006 to 2009. Mr. Polisson is an attorney and has a retired status with the Massachusetts and District of Columbia Bar Associations. | N/A |
| Pamela Wheelock (Born 1959) | Trustee, since January 2020; previously Trustee from January 2018 to July 2019 | Board member of the Destination Medical Center Economic Development Agency, Rochester, Minnesota since 2019. Interim President of the McKnight Foundation from January to September 2020. McKnight Foundation Consultant, November 2020 to February 2021. Acting Commissioner, Minnesota Department of Human Services, July 2019 through September 2019. Consultant (part-time), Minnesota Department of Human Services, October 2019 through December 2019. Chief Operating Officer, Twin Cities Habitat for Humanity from 2017 to 2019. Vice President of University Services, University of Minnesota from 2012 to 2016. Prior thereto, on the Board of Directors, Governance Committee and Finance Committee for the Minnesota Philanthropy Partners (Saint Paul Foundation) from 2012 to 2018, Interim Chief Executive Officer of Blue Cross Blue Shield of Minnesota from 2011 to 2012, Chairman of the Board from 2009 to 2012 and Board Director from 2003 to 2015. Vice President, Leadership and Community Engagement, Bush Foundation, Saint Paul, Minnesota (a private foundation) from 2009 to 2011. Executive Vice President and Chief Financial Officer, Minnesota Sports and Entertainment from 2004 to 2009 and Senior Vice President from 2002 to 2004. Executive Vice President of the Minnesota Wild Foundation from 2004 to 2008. Commissioner of Finance, State of Minnesota, from 1999 to 2002. Currently Board Chair of the Minnesota Wild Foundation since 2010. | N/A |
| Name and year of birth | Position held and length of service | Principal occupations during past five years or longer |
| Andrew Owen (Born 1960) | President, since 2017 | President, Chief Executive Officer and Director of Allspring Funds Management, LLC since 2017 and co-president of Galliard Capital Management, LLC, an affiliate of Allspring Funds Management, LLC, since 2019. Prior thereto, Head of Affiliated Managers, Allspring Global Investments, from 2014 to 2019 and Executive Vice President responsible for marketing, investments and product development for Allspring Funds Management, LLC, from 2009 to 2014. In addition, Mr. Owen was an Executive Vice President of Wells Fargo & Company from 2014 to 2021. |
| Jeremy DePalma (Born 1974) | Treasurer, since 2012 (for certain funds in the Fund Complex); since 2021 (for the remaining funds in the Fund Complex) | Senior Vice President of Allspring Funds Management, LLC since 2009. Senior Vice President of Evergreen Investment Management Company, LLC from 2008 to 2010 and head of the Fund Reporting and Control Team within Fund Administration from 2005 to 2010. |
| Kate McKinley (Born 1977) | Chief Legal Officer, since 2021 | Chief Legal Officer of Allspring Global Investments since 2021. Prior thereto, held various roles at State Street Global Advisors beginning in 2010, including serving as Senior Vice President and General Counsel from 2019 to 2021, and Chief Operating Officer of the Institutional Client Group from 2016 - 2019. Prior to working at State Street Global Advisors served as Assistant General Counsel for Bank of America Corporation from 2005 to 2010 and as an Associate at WilmerHale from 2002 to 2005. |
| Christopher Baker (Born 1976) | Chief Compliance Officer, since 2022 | Global Chief Compliance Officer for Allspring Global Investments since 2022. Prior thereto, Chief Compliance Officer for State Street Global Advisors from 2018 to 2021. Senior Compliance Officer for the State Street divisions of Alternative Investment Solutions, Sector Solutions, and Global Marketing from 2015 to 2018. From 2010 to 2015 Vice President, Global Head of Investment and Marketing Compliance for State Street Global Advisors. |
| Matthew Prasse (Born 1983) | Secretary, since 2021 | Senior Counsel of the Allspring Legal Department since 2021. Senior Counsel of the Wells Fargo Legal Department from 2018 to 2021. Previously, Counsel for Barings LLC from 2015 to 2018. Prior to joining Barings, Associate at Morgan, Lewis & Bockius LLP from 2008 to 2015. |
P.O. Box 219967
Kansas City, MO 64121-9967
1-800-222-8222. Read the prospectus carefully before you invest or send money.

Bond Portfolio
| Investment objective | The Portfolio seeks to replicate the total return of the Bloomberg U.S. High Yield 2% Issuer Capped Bond Index†, before fees and expenses. |
| Adviser | Allspring Funds Management, LLC |
| Subadviser | Allspring Global Investments, LLC |
| Portfolio managers | Manjunath Boraiah, Brian Prucyk#, Janet S. Rilling, CFA®‡, CPA, Michael J. Schueller, CFA®‡ |
| Ten largest holdings (%) as of February 28, 20221 | |
| MGM Growth Properties Operating Partnership LP, 4.50%, 9-1-2026 | 0.90 |
| Cheniere Energy Partners LP, 5.50%, 6-15-2031 | 0.73 |
| First Student Incorporated, 4.00%, 7-31-2029 | 0.72 |
| CCO Holdings LLC, 4.50%, 8-15-2030 | 0.72 |
| Bausch Health Companies Incorporated, 4.88%, 6-1-2028 | 0.72 |
| DaVita Incorporated, 3.75%, 2-15-2031 | 0.70 |
| VICI Properties Incorporated, 4.25%, 12-1-2026 | 0.68 |
| Ford Motor Company, 4.75%, 1-15-2043 | 0.68 |
| Post Holdings Incorporated, 5.50%, 12-15-2029 | 0.68 |
| Alcoa Europe Holding BV, 6.13%, 5-15-2028 | 0.68 |
| 1 | Figures represent the percentage of the Portfolio's net assets. Holdings are subject to change and may have changed since the date specified. |
| Credit quality as of February 28, 20221 |
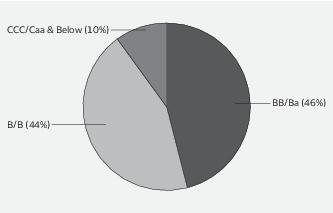
| 1 | The credit quality distribution of portfolio holdings reflected in the chart is based on ratings from Standard & Poor’s, Moody’s Investors Service, and/or Fitch Ratings Ltd. Credit quality ratings apply to the underlying holdings of the Portfolio and not to the Portfolio itself. The percentages of the portfolio with the ratings depicted in the chart are calculated based on the market value of fixed income securities held by the Portfolio. If a security was rated by all three rating agencies, the middle rating was utilized. If rated by two of the three rating agencies, the lower rating was utilized, and if rated by one of the rating agencies, that rating was utilized. Standard & Poor’s rates the creditworthiness of bonds, ranging from AAA (highest) to D (lowest). Ratings from A to CCC may be modified by the addition of a plus (+) or minus (-) sign to show relative standing within the rating categories. Standard & Poor’s rates the creditworthiness of short-term notes from SP-1 (highest) to SP-3 (lowest). Moody’s rates the creditworthiness of bonds, ranging from Aaa (highest) to C (lowest). Ratings Aa to B may be modified by the addition of a number 1 (highest) to 3 (lowest) to show relative standing within the ratings categories. Moody’s rates the creditworthiness of short-term U.S. tax-exempt municipal securities from MIG 1/VMIG 1 (highest) to SG (lowest). Fitch rates the creditworthiness of bonds, ranging from AAA (highest) to D (lowest). Credit quality distribution is subject to change and may have changed since the date specified. |
| ‡ | CFA® and Chartered Financial Analyst® are trademarks owned by CFA Institute. |
| † | The Bloomberg U.S. High Yield 2% Issuer Capped Bond Index is composed of fixed-rate, publicly issued, non-investment-grade debt with at least one year remaining to maturity as well as an outstanding par value of $100 million. You cannot invest directly in an index. |
| # | Mr. Prucyk became portfolio manager of the Portfolio on July 1, 2021. |
| Interest rate | Maturity date | Principal | Value | ||
| Corporate bonds and notes: 77.66% | |||||
| Communication services: 12.87% | |||||
| Diversified telecommunication services: 1.66% | |||||
| Cablevision Lightpath LLC 144A | 3.88% | 9-15-2027 | $ 200,000 | $ 187,678 | |
| Level 3 Financing Incorporated 144A | 3.75 | 7-15-2029 | 200,000 | 178,384 | |
| Lumen Technologies Incorporated 144A | 4.50 | 1-15-2029 | 240,000 | 200,864 | |
| 566,926 | |||||
| Entertainment: 0.59% | |||||
| Live Nation Entertainment Incorporated 144A | 4.88 | 11-1-2024 | 200,000 | 201,970 | |
| Media: 9.39% | |||||
| CCO Holdings LLC 144A | 4.50 | 8-15-2030 | 255,000 | 245,585 | |
| CCO Holdings LLC 144A | 4.50 | 6-1-2033 | 80,000 | 75,000 | |
| Clear Channel Outdoor Holdings 144A | 7.75 | 4-15-2028 | 165,000 | 172,425 | |
| CSC Holdings LLC 144A | 5.50 | 4-15-2027 | 200,000 | 199,500 | |
| CSC Holdings LLC 144A | 5.75 | 1-15-2030 | 200,000 | 176,848 | |
| DIRECTV Holdings LLC 144A | 5.88 | 8-15-2027 | 190,000 | 189,935 | |
| DISH DBS Corporation | 5.88 | 11-15-2024 | 200,000 | 200,000 | |
| Gray Television Incorporated 144A | 5.88 | 7-15-2026 | 200,000 | 204,500 | |
| Gray Television Incorporated 144A | 4.75 | 10-15-2030 | 205,000 | 192,230 | |
| Lamar Media Corporation | 3.75 | 2-15-2028 | 200,000 | 192,157 | |
| Nexstar Broadcasting Incorporated 144A | 5.63 | 7-15-2027 | 200,000 | 204,500 | |
| Nielsen Finance LLC 144A | 5.63 | 10-1-2028 | 200,000 | 193,271 | |
| Outfront Media Capital Corporation 144A | 4.63 | 3-15-2030 | 200,000 | 189,250 | |
| QVC Incorporated | 4.75 | 2-15-2027 | 210,000 | 197,400 | |
| Radiate Holdco LLC 144A | 4.50 | 9-15-2026 | 210,000 | 200,654 | |
| Sinclair Television Group Incorporated 144A | 5.50 | 3-1-2030 | 200,000 | 175,500 | |
| Univision Communications Incorporated 144A | 5.13 | 2-15-2025 | 200,000 | 201,279 | |
| 3,210,034 | |||||
| Wireless telecommunication services: 1.23% | |||||
| Frontier Communications 144A | 5.00 | 5-1-2028 | 200,000 | 194,150 | |
| Sprint Corporation | 7.88 | 9-15-2023 | 210,000 | 225,750 | |
| 419,900 | |||||
| Consumer discretionary: 11.88% | |||||
| Auto components: 1.76% | |||||
| Allison Transmission Incorporated 144A | 5.88 | 6-1-2029 | 200,000 | 209,770 | |
| Clarios Global LP 144A | 6.25 | 5-15-2026 | 180,000 | 186,199 | |
| Dana Incorporated | 5.63 | 6-15-2028 | 200,000 | 204,500 | |
| 600,469 | |||||
| Automobiles: 0.68% | |||||
| Ford Motor Company | 4.75 | 1-15-2043 | 240,000 | 232,200 | |
| Hotels, restaurants & leisure: 5.88% | |||||
| Caesars Entertainment Incorporated 144A | 8.13 | 7-1-2027 | 210,000 | 226,376 | |
| Carnival Corporation 144A | 5.75 | 3-1-2027 | 195,000 | 189,931 | |
| Hilton Domestic Operating Company | 4.88 | 1-15-2030 | 200,000 | 205,748 | |
| MGM Resorts International | 4.63 | 9-1-2026 | 154,000 | 153,615 | |
| NCL Corporation Limited 144A | 3.63 | 12-15-2024 | 210,000 | 196,931 | |
| Penn National Gaming Incorporated 144A | 4.13 | 7-1-2029 | 235,000 | 217,375 |
| Interest rate | Maturity date | Principal | Value | ||
| Hotels, restaurants & leisure (continued) | |||||
| Royal Caribbean Cruises Limited 144A | 5.50% | 4-1-2028 | $ 205,000 | $ 200,918 | |
| Scientific Games International Incorporated 144A | 5.00 | 10-15-2025 | 210,000 | 212,100 | |
| Six Flags Entertainment Company 144A | 4.88 | 7-31-2024 | 200,000 | 199,842 | |
| Yum! Brands Incorporated 144A | 7.75 | 4-1-2025 | 200,000 | 208,390 | |
| 2,011,226 | |||||
| Household durables: 0.30% | |||||
| Newell Brands Incorporated | 4.35 | 4-1-2023 | 101,000 | 102,768 | |
| Multiline retail: 0.60% | |||||
| Macy's Retail Holdings LLC 144A | 5.88 | 4-1-2029 | 200,000 | 204,500 | |
| Specialty retail: 1.57% | |||||
| ABC Supply Company Incorporated 144A | 4.00 | 1-15-2028 | 200,000 | 195,500 | |
| At Home Group Incorporated 144A | 7.13 | 7-15-2029 | 175,000 | 155,313 | |
| Carvana Company 144A | 5.50 | 4-15-2027 | 210,000 | 187,643 | |
| 538,456 | |||||
| Textiles, apparel & luxury goods: 1.09% | |||||
| HanesBrands Incorporated 144A | 4.63 | 5-15-2024 | 200,000 | 202,750 | |
| Wolverine World Wide Incorporated 144A | 8.50 | 11-15-2024 | 198,000 | 168,637 | |
| 371,387 | |||||
| Consumer staples: 4.77% | |||||
| Food & staples retailing: 0.59% | |||||
| Performance Food Group Company 144A | 5.50 | 10-15-2027 | 200,000 | 203,500 | |
| Food products: 3.11% | |||||
| Kraft Heinz Foods Company | 4.38 | 6-1-2046 | 200,000 | 205,000 | |
| Kraft Heinz Foods Company | 5.20 | 7-15-2045 | 175,000 | 197,458 | |
| Lamb Weston Holdings Incorporated 144A | 4.38 | 1-31-2032 | 230,000 | 223,445 | |
| Pilgrim's Pride Corporation 144A | 5.88 | 9-30-2027 | 200,000 | 205,561 | |
| Post Holdings Incorporated 144A | 5.50 | 12-15-2029 | 230,000 | 231,929 | |
| 1,063,393 | |||||
| Household products: 0.53% | |||||
| Energizer Holdings Incorporated 144A | 4.38 | 3-31-2029 | 200,000 | 180,250 | |
| Tobacco: 0.54% | |||||
| Vector Group Limited 144A | 5.75 | 2-1-2029 | 200,000 | 184,500 | |
| Energy: 12.03% | |||||
| Energy equipment & services: 0.59% | |||||
| USA Compression Partners LP | 6.88 | 4-1-2026 | 200,000 | 200,850 | |
| Oil, gas & consumable fuels: 11.44% | |||||
| Antero Midstream Partners LP 144A | 5.75 | 1-15-2028 | 200,000 | 203,000 | |
| Apache Corporation | 4.38 | 10-15-2028 | 190,000 | 192,375 | |
| Buckeye Partners LP 144A | 4.50 | 3-1-2028 | 200,000 | 190,000 | |
| Cheniere Energy Incorporated | 4.63 | 10-15-2028 | 200,000 | 204,332 | |
| Cheniere Energy Partners LP | 4.50 | 10-1-2029 | 210,000 | 214,032 | |
| Cheniere Energy Partners LP 144A | 5.50 | 6-15-2031 | 250,000 | 248,750 | |
| CrownRock LP 144A | 5.63 | 10-15-2025 | 200,000 | 202,260 | |
| EQM Midstream Partners LP | 5.50 | 7-15-2028 | 200,000 | 196,352 |
| Interest rate | Maturity date | Principal | Value | ||
| Oil, gas & consumable fuels (continued) | |||||
| EQT Corporation | 3.90% | 10-1-2027 | $ 200,000 | $ 202,139 | |
| Moss Creek Resources Holdings Incorporated 144A | 10.50 | 5-15-2027 | 200,000 | 188,500 | |
| Murphy Oil Corporation | 6.88 | 8-15-2024 | 90,000 | 91,013 | |
| Occidental Petroleum Corporation | 6.60 | 3-15-2046 | 190,000 | 227,050 | |
| Occidental Petroleum Corporation | 7.88 | 9-15-2031 | 90,000 | 111,314 | |
| Range Resources Corporation | 4.88 | 5-15-2025 | 200,000 | 203,000 | |
| Rockies Express Pipeline LLC 144A | 4.95 | 7-15-2029 | 225,000 | 217,688 | |
| SM Energy Company | 6.75 | 9-15-2026 | 200,000 | 202,000 | |
| Southwestern Energy Company | 7.75 | 10-1-2027 | 200,000 | 211,000 | |
| Sunoco LP | 4.50 | 5-15-2029 | 200,000 | 191,660 | |
| Weatherford International Limited 144A | 11.00 | 12-1-2024 | 181,000 | 187,335 | |
| Western Midstream Operating LP | 4.55 | 2-1-2030 | 220,000 | 226,281 | |
| 3,910,081 | |||||
| Financials: 5.54% | |||||
| Capital markets: 0.59% | |||||
| MSCI Incorporated 144A | 4.00 | 11-15-2029 | 200,000 | 201,076 | |
| Consumer finance: 1.54% | |||||
| Navient Corporation | 5.50 | 3-15-2029 | 200,000 | 189,000 | |
| Navient Corporation | 7.25 | 9-25-2023 | 120,000 | 125,879 | |
| Springleaf Finance Corporation | 5.38 | 11-15-2029 | 210,000 | 211,231 | |
| 526,110 | |||||
| Diversified financial services: 1.62% | |||||
| CHS Incorporation 144A | 4.75 | 2-15-2031 | 210,000 | 197,663 | |
| Compass Group Diversified Holdings LLC 144A | 5.25 | 4-15-2029 | 170,000 | 164,327 | |
| Northwest Fiber LLC 144A | 4.75 | 4-30-2027 | 205,000 | 190,560 | |
| 552,550 | |||||
| Insurance: 1.17% | |||||
| Acrisure LLC 144A | 7.00 | 11-15-2025 | 200,000 | 199,220 | |
| HUB International Limited 144A | 7.00 | 5-1-2026 | 200,000 | 201,340 | |
| 400,560 | |||||
| Thrifts & mortgage finance: 0.62% | |||||
| Nationstar Mortgage Holdings Incorporated 144A | 6.00 | 1-15-2027 | 210,000 | 213,150 | |
| Health care: 8.22% | |||||
| Health care equipment & supplies: 1.77% | |||||
| Avantor Funding Incorporated 144A | 4.63 | 7-15-2028 | 200,000 | 203,000 | |
| Mozart Debt Merger Sub Incorporated 144A | 5.25 | 10-1-2029 | 205,000 | 195,775 | |
| Teleflex Incorporated 144A | 4.25 | 6-1-2028 | 210,000 | 207,375 | |
| 606,150 | |||||
| Health care providers & services: 5.87% | |||||
| Centene Corporation | 3.00 | 10-15-2030 | 210,000 | 200,171 | |
| DaVita Incorporated 144A | 3.75 | 2-15-2031 | 260,000 | 237,575 | |
| Encompass Health Corporation | 4.63 | 4-1-2031 | 220,000 | 207,684 | |
| Envision Healthcare Corporation 144A | 8.75 | 10-15-2026 | 200,000 | 106,000 | |
| HCA Incorporated | 5.38 | 2-1-2025 | 175,000 | 185,327 | |
| HCA Incorporated | 5.88 | 5-1-2023 | 220,000 | 228,800 | |
| Molina Healthcare Incorporated 144A | 4.38 | 6-15-2028 | 200,000 | 199,750 |
| Interest rate | Maturity date | Principal | Value | ||
| Health care providers & services (continued) | |||||
| MPT Operating Partnership LP | 5.00% | 10-15-2027 | $ 200,000 | $ 204,600 | |
| RegionalCare Hospital Partners 144A | 9.75 | 12-1-2026 | 200,000 | 209,778 | |
| Tenet Healthcare Corporation 144A | 6.25 | 2-1-2027 | 220,000 | 226,259 | |
| 2,005,944 | |||||
| Pharmaceuticals: 0.58% | |||||
| Organon Finance 1 LLC 144A | 4.13 | 4-30-2028 | 200,000 | 196,722 | |
| Industrials: 8.22% | |||||
| Aerospace & defense: 0.59% | |||||
| TransDigm Group Incorporated | 6.38 | 6-15-2026 | 200,000 | 203,894 | |
| Air freight & logistics: 0.61% | |||||
| XPO Logistics Incorporated 144A | 6.25 | 5-1-2025 | 200,000 | 207,424 | |
| Airlines: 1.79% | |||||
| American Airlines Incorporated 144A | 11.75 | 7-15-2025 | 175,000 | 212,225 | |
| Delta Air Lines Incorporated | 3.75 | 10-28-2029 | 210,000 | 199,695 | |
| United Airlines Incorporated 144A | 4.38 | 4-15-2026 | 200,000 | 199,488 | |
| 611,408 | |||||
| Building products: 0.53% | |||||
| Builders FirstSource Incorporated 144A | 6.75 | 6-1-2027 | 174,000 | 180,836 | |
| Commercial services & supplies: 2.72% | |||||
| Allied Universal Holdco LLC 144A | 6.00 | 6-1-2029 | 200,000 | 186,000 | |
| Allied Universal Security Services 144A | 9.75 | 7-15-2027 | 200,000 | 209,000 | |
| APTIM Corporation 144A | 7.75 | 6-15-2025 | 200,000 | 168,500 | |
| Avis Budget Car Rental LLC 144A | 5.75 | 7-15-2027 | 210,000 | 211,684 | |
| Intrado Corporation 144A | 8.50 | 10-15-2025 | 167,000 | 153,640 | |
| 928,824 | |||||
| Electronic equipment, instruments & components: 0.66% | |||||
| WESCO Distribution Incorporated 144A | 7.25 | 6-15-2028 | 210,000 | 225,469 | |
| Trading companies & distributors: 0.60% | |||||
| Herc Holdings Incorporated 144A | 5.50 | 7-15-2027 | 200,000 | 205,000 | |
| Transportation infrastructure: 0.72% | |||||
| First Student Incorporated 144A | 4.00 | 7-31-2029 | 260,000 | 245,698 | |
| Information technology: 3.39% | |||||
| Communications equipment: 0.52% | |||||
| CommScope Technologies LLC 144A | 5.00 | 3-15-2027 | 200,000 | 178,332 | |
| IT services: 1.18% | |||||
| Block Incorporation 144A | 3.50 | 6-1-2031 | 200,000 | 187,808 | |
| Gartner Incorporated 144A | 3.75 | 10-1-2030 | 220,000 | 214,016 | |
| 401,824 | |||||
| Software: 1.69% | |||||
| IQVIA Incorporated 144A | 5.00 | 5-15-2027 | 200,000 | 204,586 |
| Interest rate | Maturity date | Principal | Value | ||
| Software (continued) | |||||
| SS&C Technologies Incorporated 144A | 5.50% | 9-30-2027 | $ 200,000 | $ 205,552 | |
| Ziff Davis Incorporation 144A | 4.63 | 10-15-2030 | 174,000 | 167,386 | |
| 577,524 | |||||
| Materials: 3.01% | |||||
| Chemicals: 0.59% | |||||
| Chemours Company | 5.38 | 5-15-2027 | 200,000 | 200,721 | |
| Containers & packaging: 1.85% | |||||
| Ball Corporation | 5.25 | 7-1-2025 | 200,000 | 212,000 | |
| Mauser Packaging Solutions 144A | 5.50 | 4-15-2024 | 210,000 | 208,950 | |
| Sealed Air Corporation 144A | 5.50 | 9-15-2025 | 200,000 | 209,504 | |
| 630,454 | |||||
| Metals & mining: 0.57% | |||||
| Novelis Corporation 144A | 4.75 | 1-30-2030 | 200,000 | 195,704 | |
| Real estate: 4.52% | |||||
| Equity REITs: 2.75% | |||||
| Iron Mountain Incorporated 144A | 5.00 | 7-15-2028 | 220,000 | 217,925 | |
| MGM Growth Properties Operating Partnership LP | 4.50 | 9-1-2026 | 300,000 | 306,069 | |
| Service Properties Trust Company | 4.38 | 2-15-2030 | 210,000 | 182,853 | |
| VICI Properties Incorporated 144A | 4.25 | 12-1-2026 | 230,000 | 232,300 | |
| 939,147 | |||||
| Real estate management & development: 1.77% | |||||
| Howard Hughes Corporation 144A | 4.13 | 2-1-2029 | 200,000 | 189,250 | |
| Icahn Enterprises Finance Corporation | 6.25 | 5-15-2026 | 220,000 | 221,917 | |
| Kennedy-Wilson Holdings Incorporated | 4.75 | 3-1-2029 | 200,000 | 195,338 | |
| 606,505 | |||||
| Utilities: 3.21% | |||||
| Electric utilities: 2.14% | |||||
| FirstEnergy Corporation | 5.35 | 7-15-2047 | 140,000 | 147,931 | |
| NRG Energy Incorporated 144A | 3.63 | 2-15-2031 | 220,000 | 202,270 | |
| PG&E Corporation | 5.00 | 7-1-2028 | 200,000 | 198,000 | |
| Talen Energy Supply LLC 144A | 7.63 | 6-1-2028 | 205,000 | 183,475 | |
| 731,676 | |||||
| Gas utilities: 0.55% | |||||
| Ferellgas Partners LP 144A | 5.38 | 4-1-2026 | 200,000 | 188,008 | |
| Independent power & renewable electricity producers: 0.52% | |||||
| Calpine Corporation 144A | 5.00 | 2-1-2031 | 190,000 | 175,922 | |
| Total Corporate bonds and notes (Cost $27,271,261) | 26,539,042 | ||||
| Yankee corporate bonds and notes: 17.47% | |||||
| Communication services: 3.08% | |||||
| Diversified telecommunication services: 0.54% | |||||
| Altice France Holding SA 144A | 6.00 | 2-15-2028 | 210,000 | 186,005 |
| Interest rate | Maturity date | Principal | Value | ||
| Entertainment: 0.47% | |||||
| Studio City Finance Limited 144A | 5.00% | 1-15-2029 | $ 200,000 | $ 159,054 | |
| Media: 1.16% | |||||
| Videotron Limited 144A | 5.13 | 4-15-2027 | 200,000 | 203,500 | |
| Ziggo BV 144A | 4.88 | 1-15-2030 | 200,000 | 192,036 | |
| 395,536 | |||||
| Wireless telecommunication services: 0.91% | |||||
| VEON Holdings BV 144A | 4.00 | 4-9-2025 | 210,000 | 89,250 | |
| Vodafone Group plc (USD Swap Semi Annual (vs. 3 Month LIBOR) 5 Year +4.87%) ± | 7.00 | 4-4-2079 | 200,000 | 222,000 | |
| 311,250 | |||||
| Consumer discretionary: 3.50% | |||||
| Auto components: 0.59% | |||||
| Adient Global Holdings Limited 144A | 4.88 | 8-15-2026 | 200,000 | 200,250 | |
| Automobiles: 1.16% | |||||
| IHO Verwaltungs GmbH (PIK at 6.75%) 144A¥ | 6.00 | 5-15-2027 | 210,000 | 213,675 | |
| Jaguar Land Rover Automotive plc 144A | 4.50 | 10-1-2027 | 200,000 | 184,000 | |
| 397,675 | |||||
| Hotels, restaurants & leisure: 1.19% | |||||
| International Game Technology plc 144A | 6.25 | 1-15-2027 | 200,000 | 212,000 | |
| MGM China Holdings Limited 144A | 5.38 | 5-15-2024 | 200,000 | 194,000 | |
| 406,000 | |||||
| Internet & direct marketing retail: 0.56% | |||||
| Rakuten Group Incorporated (5 Year Treasury Constant Maturity +4.96%) 144Aʊ± | 6.25 | 4-22-2031 | 200,000 | 190,000 | |
| Energy: 0.92% | |||||
| Oil, gas & consumable fuels: 0.92% | |||||
| Ithaca Energy plc 144A | 9.00 | 7-15-2026 | 200,000 | 201,500 | |
| Transocean Incorporated 144A | 11.50 | 1-30-2027 | 112,000 | 112,000 | |
| 313,500 | |||||
| Financials: 2.88% | |||||
| Banks: 0.65% | |||||
| Deutsche Bank AG (USD ICE Swap Rate 11:00am NY 5 Year +2.55%) ± | 4.88 | 12-1-2032 | 220,000 | 222,320 | |
| Consumer finance: 0.52% | |||||
| Telecom Italia Capital SA | 7.20 | 7-18-2036 | 175,000 | 177,625 | |
| Diversified financial services: 1.71% | |||||
| New Red Finance Incorporated 144A | 3.88 | 1-15-2028 | 200,000 | 194,500 | |
| New Red Finance Incorporated 144A | 4.00 | 10-15-2030 | 200,000 | 184,750 | |
| Trivium Packaging Finance BV 144A | 8.50 | 8-15-2027 | 200,000 | 205,136 | |
| 584,386 |
| Interest rate | Maturity date | Principal | Value | ||
| Health care: 1.38% | |||||
| Pharmaceuticals: 1.38% | |||||
| Bausch Health Companies Incorporated 144A | 4.88% | 6-1-2028 | $ 255,000 | $ 244,945 | |
| Endo Limited 144A | 6.00 | 7-15-2023 | 200,000 | 132,000 | |
| Endo Limited 144A | 6.00 | 6-30-2028 | 145,000 | 95,939 | |
| 472,884 | |||||
| Industrials: 2.71% | |||||
| Aerospace & defense: 1.23% | |||||
| Bombardier Incorporated 144A | 7.50 | 12-1-2024 | 184,000 | 190,440 | |
| Bombardier Incorporated 144A | 6.00 | 2-15-2028 | 240,000 | 229,202 | |
| 419,642 | |||||
| Electrical equipment: 0.60% | |||||
| Sensata Technologies BV 144A | 5.00 | 10-1-2025 | 200,000 | 206,819 | |
| Marine: 0.24% | |||||
| Seaspan Corporation 144A | 5.50 | 8-1-2029 | 85,000 | 80,963 | |
| Professional services: 0.64% | |||||
| S&P Global Incorporated | 4.25 | 5-1-2029 | 200,000 | 219,637 | |
| Information technology: 0.58% | |||||
| Technology hardware, storage & peripherals: 0.58% | |||||
| Seagate HDD Cayman | 4.13 | 1-15-2031 | 210,000 | 198,734 | |
| Materials: 1.86% | |||||
| Chemicals: 0.62% | |||||
| Methanex Corporation | 5.25 | 12-15-2029 | 210,000 | 212,100 | |
| Containers & packaging: 0.56% | |||||
| Ardagh Packaging Finance plc 144A | 5.25 | 8-15-2027 | 200,000 | 190,113 | |
| Metals & mining: 0.68% | |||||
| Alcoa Europe Holding BV 144A | 6.13 | 5-15-2028 | 220,000 | 231,550 | |
| Utilities: 0.56% | |||||
| Independent power & renewable electricity producers: 0.56% | |||||
| Atlantica Sustainable Infrastructure plc 144A | 4.13 | 6-15-2028 | 200,000 | 192,500 | |
| Total Yankee corporate bonds and notes (Cost $6,430,596) | 5,968,543 |
| Yield | Shares | ||||
| Short-term investments: 3.42% | |||||
| Investment companies: 3.42% | |||||
| Allspring Government Money Market Fund Select Class ♠∞ | 0.03 | 1,168,782 | 1,168,782 | ||
| Total Short-term investments (Cost $1,168,782) | 1,168,782 | ||||
| Total investments in securities (Cost $34,870,639) | 98.55% | 33,676,367 | |||
| Other assets and liabilities, net | 1.45 | 494,198 | |||
| Total net assets | 100.00% | $34,170,565 |
| 144A | The security may be resold in transactions exempt from registration, normally to qualified institutional buyers, pursuant to Rule 144A under the Securities Act of 1933. |
| ± | Variable rate investment. The rate shown is the rate in effect at period end. |
| ¥ | A payment-in-kind (PIK) security is a security in which the issuer may make interest or dividend payments in cash or additional securities or a combination of both. The rate shown is the rate in effect at period end. |
| ♠ | The issuer of the security is an affiliated person of the Portfolio as defined in the Investment Company Act of 1940. |
| ∞ | The rate represents the 7-day annualized yield at period end. |
| ʊ | Security is perpetual in nature and has no stated maturity date. The date shown reflects the next call date. |
| Abbreviations: | |
| LIBOR | London Interbank Offered Rate |
| REIT | Real estate investment trust |
| Value, beginning of period | Purchases | Sales proceeds | Net realized gains (losses) | Net change in unrealized gains (losses) | Value, end of period | Shares, end of period | Income from affiliated securities | |
| Short-term investments | ||||||||
| Allspring Government Money Market Fund Select Class | $333,484 | $14,981,066 | $(14,145,768) | $0 | $0 | $1,168,782 | 1,168,782 | $233 |
| Assets | |
Investments in unaffiliated securities, at value (cost $33,701,857) | $ 32,507,585 |
Investments in affiliated securities, at value (cost $1,168,782) | 1,168,782 |
Receivable for interest | 481,839 |
Receivable for investments sold | 48,741 |
Receivable from adviser | 5,357 |
Prepaid expenses and other assets | 1,063 |
Total assets | 34,213,367 |
| Liabilities | |
Professional fees payable | 36,308 |
Custody and accounting fees payable | 3,302 |
Interest holder report expenses payable | 2,165 |
Trustees’ fees and expenses payable | 650 |
Accrued expenses and other liabilities | 377 |
Total liabilities | 42,802 |
Total net assets | $34,170,565 |
| Investment income | |
Interest | $ 2,356,922 |
Income from affiliated securities | 233 |
Total investment income | 2,357,155 |
| Expenses | |
Advisory fee | 120,056 |
Custody and accounting fees | 14,000 |
Professional fees | 69,437 |
Interest holder report expenses | 21,517 |
Trustees’ fees and expenses | 20,121 |
Other fees and expenses | 11,092 |
Total expenses | 256,223 |
Less: Fee waivers and/or expense reimbursements | (126,563) |
Net expenses | 129,660 |
Net investment income | 2,227,495 |
| Realized and unrealized gains (losses) on investments | |
Net realized gains on investments | 791,670 |
Net change in unrealized gains (losses) on investments | (2,625,377) |
Net realized and unrealized gains (losses) on investments | (1,833,707) |
Net increase in net assets resulting from operations | $ 393,788 |
| Year ended February 28, 2022 | Year ended February 28, 2021 | |
| Operations | ||
Net investment income | $ 2,227,495 | $ 5,865,899 |
Net realized gains on investments | 791,670 | 2,256,834 |
Net change in unrealized gains (losses) on investments | (2,625,377) | 3,105,325 |
Net increase in net assets resulting from operations | 393,788 | 11,228,058 |
| Capital transactions | ||
| Transactions in investors’ beneficial interests | ||
Contributions | 6,966,904 | 145,893,143 |
Withdrawals | (23,301,894) | (160,998,466) |
Net decrease in net assets resulting from capital transactions | (16,334,990) | (15,105,323) |
Total decrease in net assets | (15,941,202) | (3,877,265) |
| Net assets | ||
Beginning of period | 50,111,767 | 53,989,032 |
End of period | $ 34,170,565 | $ 50,111,767 |
| Year ended February 28 | |||||
| 2022 | 2021 | 2020 1 | 2019 | 2018 2 | |
Total return3 | (0.21)% | 6.34% | 3.97% | 3.70% | 0.49% |
| Ratios to average net assets (annualized) | |||||
Gross expenses | 0.53% | 0.35% | 0.42% | 0.34% | 0.37% |
Net expenses | 0.27% * | 0.27% * | 0.30% | 0.32% | 0.37% |
Net investment income | 4.64% | 5.54% | 5.54% | 6.06% | 5.36% |
| Supplemental data | |||||
Portfolio turnover rate | 73% | 169% | 52% | 47% | 122% |
| * | Ratio includes expenses which were voluntarily waived by the adviser. Without these voluntary waivers, the net expense ratios would be increased by the following amounts: |
| Year ended February 28, 2022 | 0.26% |
| Year ended February 28, 2021 | 0.08% |
| 1 | Year ended February 29 |
| 2 | For the period from May 23, 2017 (commencement of operations) to February 28, 2018 |
| 3 | Returns for periods of less than one year are not annualized. |
| Gross unrealized gains | $ 374,841 |
| Gross unrealized losses | (1,677,150) |
| Net unrealized losses | $(1,302,309) |
| ■ | Level 1 – quoted prices in active markets for identical securities |
| ■ | Level 2 – other significant observable inputs (including quoted prices for similar securities, interest rates, prepayment speeds, credit risk, etc.) |
| ■ | Level 3 – significant unobservable inputs (including the Portfolio’s own assumptions in determining the fair value of investments) |
| Quoted prices (Level 1) | Other significant observable inputs (Level 2) | Significant unobservable inputs (Level 3) | Total | |
| Assets | ||||
| Investments in: | ||||
| Corporate bonds and notes | $ 0 | $ 26,539,042 | $0 | $ 26,539,042 |
| Yankee corporate bonds and notes | 0 | 5,968,543 | 0 | 5,968,543 |
| Short-term investments | ||||
| Investment companies | 1,168,782 | 0 | 0 | 1,168,782 |
| Total assets | $1,168,782 | $32,507,585 | $0 | $33,676,367 |
| Average daily net assets | Advisory fee |
| First $5 billion | 0.250% |
| Next $5 billion | 0.230 |
| Over $10 billion | 0.210 |
Allspring Master Trust:

| Name and year of birth | Position held and length of service* | Principal occupations during past five years or longer | Current other public company or investment company directorships |
| William R. Ebsworth (Born 1957) | Trustee, since 2015 | Retired. From 1984 to 2013, equities analyst, portfolio manager, research director and chief investment officer at Fidelity Management and Research Company in Boston, Tokyo, and Hong Kong, and retired in 2013 as Chief Investment Officer of Fidelity Strategic Advisers, Inc. where he led a team of investment professionals managing client assets. Prior thereto, Board member of Hong Kong Securities Clearing Co., Hong Kong Options Clearing Corp., the Thailand International Fund, Ltd., Fidelity Investments Life Insurance Company, and Empire Fidelity Investments Life Insurance Company. Audit Committee Chair and Investment Committee Chair of the Vincent Memorial Hospital Endowment (non-profit organization). Mr. Ebsworth is a CFA® charterholder. | N/A |
| Jane A. Freeman (Born 1953) | Trustee, since 2015; Chair Liaison, since 2018 | Retired. From 2012 to 2014 and 1999 to 2008, Chief Financial Officer of Scientific Learning Corporation. From 2008 to 2012, Ms. Freeman provided consulting services related to strategic business projects. Prior to 1999, Portfolio Manager at Rockefeller & Co. and Scudder, Stevens & Clark. Board member of the Harding Loevner Funds from 1996 to 2014, serving as both Lead Independent Director and chair of the Audit Committee. Board member of the Russell Exchange Traded Funds Trust from 2011 to 2012 and the chair of the Audit Committee. Ms. Freeman is also an inactive Chartered Financial Analyst. | N/A |
| Isaiah Harris, Jr. (Born 1952) | Trustee, since 2009; Audit Committee Chair, since 2019 | Retired. Chairman of the Board of CIGNA Corporation from 2009 to 2021, and Director from 2005 to 2008. From 2003 to 2011, Director of Deluxe Corporation. Prior thereto, President and CEO of BellSouth Advertising and Publishing Corp. from 2005 to 2007, President and CEO of BellSouth Enterprises from 2004 to 2005 and President of BellSouth Consumer Services from 2000 to 2003. Emeritus member of the Iowa State University Foundation Board of Governors. Emeritus Member of the Advisory Board of Iowa State University School of Business. Advisory Board Member, Palm Harbor Academy (private school). Advisory Board Member, Fellowship of Christian Athletes. Mr. Harris is a certified public accountant (inactive status). | N/A |
| David F. Larcker (Born 1950) | Trustee, since 2009 | James Irvin Miller Professor of Accounting at the Graduate School of Business (Emeritus), Stanford University, Director of the Corporate Governance Research Initiative and Senior Faculty of The Rock Center for Corporate Governance since 2006. From 2005 to 2008, Professor of Accounting at the Graduate School of Business, Stanford University. Prior thereto, Ernst & Young Professor of Accounting at The Wharton School, University of Pennsylvania from 1985 to 2005. | N/A |
| Name and year of birth | Position held and length of service* | Principal occupations during past five years or longer | Current other public company or investment company directorships |
| Olivia S. Mitchell (Born 1953) | Trustee, since 2006; Nominating and Governance Committee Chair, since 2018 | International Foundation of Employee Benefit Plans Professor since 1993, Wharton School of the University of Pennsylvania. Director of Wharton’s Pension Research Council and Boettner Center on Pensions & Retirement Research, and Research Associate at the National Bureau of Economic Research. Previously taught at Cornell University from 1978 to 1993. | N/A |
| Timothy J. Penny (Born 1951) | Trustee, since 1996; Chair, since 2018 | President and Chief Executive Officer of Southern Minnesota Initiative Foundation, a non-profit organization, since 2007. Member of the Board of Trustees of NorthStar Education Finance, Inc., a non-profit organization, since 2007. | N/A |
| James G. Polisson (Born 1959) | Trustee, since 2018 | Retired. Chief Marketing Officer, Source (ETF) UK Services, Ltd, from 2015 to 2017. From 2012 to 2015, Principal of The Polisson Group, LLC, a management consulting, corporate advisory and principal investing company. Chief Executive Officer and Managing Director at Russell Investments, Global Exchange Traded Funds from 2010 to 2012. Managing Director of Barclays Global Investors from 1998 to 2010 and Global Chief Marketing Officer for iShares and Barclays Global Investors from 2000 to 2010. Trustee of the San Francisco Mechanics’ Institute, a non-profit organization, from 2013 to 2015. Board member of the Russell Exchange Traded Fund Trust from 2011 to 2012. Director of Barclays Global Investors Holdings Deutschland GmbH from 2006 to 2009. Mr. Polisson is an attorney and has a retired status with the Massachusetts and District of Columbia Bar Associations. | N/A |
| Pamela Wheelock (Born 1959) | Trustee, since January 2020; previously Trustee from January 2018 to July 2019 | Board member of the Destination Medical Center Economic Development Agency, Rochester, Minnesota since 2019. Interim President of the McKnight Foundation from January to September 2020. McKnight Foundation Consultant, November 2020 to February 2021. Acting Commissioner, Minnesota Department of Human Services, July 2019 through September 2019. Consultant (part-time), Minnesota Department of Human Services, October 2019 through December 2019. Chief Operating Officer, Twin Cities Habitat for Humanity from 2017 to 2019. Vice President of University Services, University of Minnesota from 2012 to 2016. Prior thereto, on the Board of Directors, Governance Committee and Finance Committee for the Minnesota Philanthropy Partners (Saint Paul Foundation) from 2012 to 2018, Interim Chief Executive Officer of Blue Cross Blue Shield of Minnesota from 2011 to 2012, Chairman of the Board from 2009 to 2012 and Board Director from 2003 to 2015. Vice President, Leadership and Community Engagement, Bush Foundation, Saint Paul, Minnesota (a private foundation) from 2009 to 2011. Executive Vice President and Chief Financial Officer, Minnesota Sports and Entertainment from 2004 to 2009 and Senior Vice President from 2002 to 2004. Executive Vice President of the Minnesota Wild Foundation from 2004 to 2008. Commissioner of Finance, State of Minnesota, from 1999 to 2002. Currently Board Chair of the Minnesota Wild Foundation since 2010. | N/A |
| Name and year of birth | Position held and length of service | Principal occupations during past five years or longer |
| Andrew Owen (Born 1960) | President, since 2017 | President, Chief Executive Officer and Director of Allspring Funds Management, LLC since 2017 and co-president of Galliard Capital Management, LLC, an affiliate of Allspring Funds Management, LLC, since 2019. Prior thereto, Head of Affiliated Managers, Allspring Global Investments, from 2014 to 2019 and Executive Vice President responsible for marketing, investments and product development for Allspring Funds Management, LLC, from 2009 to 2014. In addition, Mr. Owen was an Executive Vice President of Wells Fargo & Company from 2014 to 2021. |
| Jeremy DePalma (Born 1974) | Treasurer, since 2012 (for certain funds in the Fund Complex); since 2021 (for the remaining funds in the Fund Complex) | Senior Vice President of Allspring Funds Management, LLC since 2009. Senior Vice President of Evergreen Investment Management Company, LLC from 2008 to 2010 and head of the Fund Reporting and Control Team within Fund Administration from 2005 to 2010. |
| Kate McKinley (Born 1977) | Chief Legal Officer, since 2021 | Chief Legal Officer of Allspring Global Investments since 2021. Prior thereto, held various roles at State Street Global Advisors beginning in 2010, including serving as Senior Vice President and General Counsel from 2019 to 2021, and Chief Operating Officer of the Institutional Client Group from 2016 - 2019. Prior to working at State Street Global Advisors served as Assistant General Counsel for Bank of America Corporation from 2005 to 2010 and as an Associate at WilmerHale from 2002 to 2005. |
| Christopher Baker (Born 1976) | Chief Compliance Officer, since 2022 | Global Chief Compliance Officer for Allspring Global Investments since 2022. Prior thereto, Chief Compliance Officer for State Street Global Advisors from 2018 to 2021. Senior Compliance Officer for the State Street divisions of Alternative Investment Solutions, Sector Solutions, and Global Marketing from 2015 to 2018. From 2010 to 2015 Vice President, Global Head of Investment and Marketing Compliance for State Street Global Advisors. |
| Matthew Prasse (Born 1983) | Secretary, since 2021 | Senior Counsel of the Allspring Legal Department since 2021. Senior Counsel of the Wells Fargo Legal Department from 2018 to 2021. Previously, Counsel for Barings LLC from 2015 to 2018. Prior to joining Barings, Associate at Morgan, Lewis & Bockius LLP from 2008 to 2015. |
P.O. Box 219967
Kansas City, MO 64121-9967
1-800-222-8222. Read the prospectus carefully before you invest or send money.

Corporate Bond Portfolio
| Investment objective | The Portfolio seeks to replicate the total return of the Bloomberg U.S. Corporate Bond Index†, before fees and expenses. |
| Adviser | Allspring Funds Management, LLC |
| Subadviser | Allspring Global Investments, LLC |
| Portfolio managers | Manjunath Boraiah, Mark Clegg, CFA®‡, Brian Prucyk#, Janet S. Rilling, CFA®‡ |
| Ten largest holdings (%) as of February 28, 20221 | |
| Oracle Corporation, 4.30%, 7-8-2034 | 0.77 |
| Arthur J. Gallagher & Company, 2.40%, 11-9-2031 | 0.76 |
| BNP Paribas, 4.25%, 10-15-2024 | 0.69 |
| The Boeing Company, 3.20%, 3-1-2029 | 0.69 |
| McDonald's Corporation, 3.50%, 7-1-2027 | 0.65 |
| Activision Blizzard , 1.35%, 9-15-2030 | 0.62 |
| Home Depot Incorporated, 2.70%, 4-15-2030 | 0.62 |
| Physicians Realty Trust, 2.63%, 11-1-2031 | 0.62 |
| Goldman Sachs Group Incorporated, 4.75%, 10-21-2045 | 0.61 |
| The Southern Company, 0.60%, 2-26-2024 | 0.59 |
| 1 | Figures represent the percentage of the Portfolio's net assets. Holdings are subject to change and may have changed since the date specified. |
| Sector allocation as of February 28, 20221 |
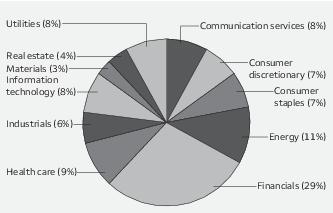
| 1 | Figures represent the percentage of the Portfolio's long-term investments. These amounts are subject to change and may have changed since the date specified. |
| ‡ | CFA® and Chartered Financial Analyst® are trademarks owned by CFA Institute. |
| † | The Bloomberg U.S. Corporate Bond Index measures the investment grade, fixed-rate, taxable corporate bond market. It includes USD-denominated securities publicly issued by US and non-US industrial, utility and financial issuers. You cannot invest directly in an index. |
| # | Mr. Prucyk became portfolio manager of the Portfolio on July 1, 2021. |
| Interest rate | Maturity date | Principal | Value | ||
| Corporate bonds and notes: 78.20% | |||||
| Communication services: 6.33% | |||||
| Diversified telecommunication services: 1.69% | |||||
| AT&T Incorporated | 2.55% | 12-1-2033 | $ 180,000 | $ 166,955 | |
| AT&T Incorporated | 3.50 | 2-1-2061 | 285,000 | 251,061 | |
| AT&T Incorporated | 3.65 | 9-15-2059 | 370,000 | 335,653 | |
| AT&T Incorporated | 3.80 | 12-1-2057 | 450,000 | 422,191 | |
| AT&T Incorporated | 4.30 | 12-15-2042 | 795,000 | 808,955 | |
| AT&T Incorporated | 4.90 | 6-15-2042 | 36,000 | 39,785 | |
| Verizon Communications Incorporated | 3.70 | 3-22-2061 | 1,100,000 | 1,048,467 | |
| Verizon Communications Incorporated | 4.13 | 3-16-2027 | 200,000 | 212,435 | |
| Verizon Communications Incorporated | 4.67 | 3-15-2055 | 225,000 | 264,449 | |
| 3,549,951 | |||||
| Entertainment: 1.58% | |||||
| Activision Blizzard | 1.35 | 9-15-2030 | 1,465,000 | 1,304,760 | |
| Walt Disney Company | 2.20 | 1-13-2028 | 1,195,000 | 1,170,610 | |
| Walt Disney Company | 2.65 | 1-13-2031 | 855,000 | 846,752 | |
| 3,322,122 | |||||
| Interactive media & services: 0.58% | |||||
| Alphabet Incorporated | 2.25 | 8-15-2060 | 125,000 | 99,837 | |
| Alphabet Incorporated | 3.38 | 2-25-2024 | 1,087,000 | 1,119,344 | |
| 1,219,181 | |||||
| Media: 2.36% | |||||
| CBS Corporation | 3.70 | 8-15-2024 | 350,000 | 363,613 | |
| CBS Corporation | 4.85 | 7-1-2042 | 140,000 | 147,825 | |
| CBS Corporation | 4.90 | 8-15-2044 | 350,000 | 367,522 | |
| Charter Communications Operating LLC | 4.40 | 12-1-2061 | 365,000 | 325,262 | |
| Charter Communications Operating LLC | 4.91 | 7-23-2025 | 400,000 | 424,013 | |
| Charter Communications Operating LLC | 6.83 | 10-23-2055 | 335,000 | 419,644 | |
| Comcast Corporation | 1.50 | 2-15-2031 | 555,000 | 493,346 | |
| Comcast Corporation | 2.35 | 1-15-2027 | 210,000 | 208,354 | |
| Comcast Corporation 144A | 2.99 | 11-1-2063 | 1,135,000 | 944,993 | |
| Discovery Communications LLC | 3.95 | 3-20-2028 | 400,000 | 412,592 | |
| Discovery Communications LLC | 4.00 | 9-15-2055 | 241,000 | 219,004 | |
| Fox Corporation | 5.58 | 1-25-2049 | 135,000 | 162,424 | |
| Time Warner Cable Incorporated | 8.38 | 3-15-2023 | 175,000 | 186,634 | |
| Time Warner Entertainment Company LP | 8.38 | 7-15-2033 | 210,000 | 286,526 | |
| 4,961,752 | |||||
| Wireless telecommunication services: 0.12% | |||||
| T-Mobile USA Incorporated | 3.60 | 11-15-2060 | 295,000 | 258,037 | |
| Consumer discretionary: 5.47% | |||||
| Auto components: 0.11% | |||||
| AEP Transmission Company | 3.75 | 12-1-2047 | 230,000 | 232,515 | |
| Automobiles: 0.20% | |||||
| General Motors Company | 6.25 | 10-2-2043 | 345,000 | 419,048 | |
| Diversified consumer services: 1.00% | |||||
| California Institute of Technology | 3.65 | 9-1-2119 | 375,000 | 351,794 |
| Interest rate | Maturity date | Principal | Value | ||
| Diversified consumer services (continued) | |||||
| Claremont McKenna College | 3.78% | 1-1-2122 | $ 335,000 | $ 312,358 | |
| Ford Foundation | 2.82 | 6-1-2070 | 485,000 | 450,435 | |
| Massachusetts Institute of Technology | 5.60 | 12-31-2099 | 305,000 | 459,492 | |
| University of Pennsylvania | 3.61 | 2-15-2119 | 300,000 | 298,852 | |
| University of Southern California | 5.25 | 10-1-2111 | 160,000 | 219,532 | |
| 2,092,463 | |||||
| Hotels, restaurants & leisure: 1.62% | |||||
| GLP Capital LP | 5.30 | 1-15-2029 | 400,000 | 434,851 | |
| Marriott International Incorporated | 4.63 | 6-15-2030 | 400,000 | 431,899 | |
| McDonald's Corporation | 3.38 | 5-26-2025 | 245,000 | 253,852 | |
| McDonald's Corporation | 3.50 | 7-1-2027 | 1,300,000 | 1,361,988 | |
| McDonald's Corporation | 4.60 | 5-26-2045 | 175,000 | 191,719 | |
| Starbucks Corporation | 3.75 | 12-1-2047 | 205,000 | 199,949 | |
| Starbucks Corporation | 4.00 | 11-15-2028 | 500,000 | 535,631 | |
| 3,409,889 | |||||
| Household durables: 0.04% | |||||
| Whirlpool Corporation | 4.00 | 3-1-2024 | 87,000 | 90,519 | |
| Internet & direct marketing retail: 0.70% | |||||
| Amazon.com Incorporated | 4.05 | 8-22-2047 | 400,000 | 445,618 | |
| Amazon.com Incorporated | 4.95 | 12-5-2044 | 630,000 | 781,347 | |
| eBay Incorporated | 4.00 | 7-15-2042 | 175,000 | 174,809 | |
| Expedia Incorporated | 4.50 | 8-15-2024 | 70,000 | 73,105 | |
| 1,474,879 | |||||
| Leisure products: 0.07% | |||||
| Hasbro Incorporated | 6.35 | 3-15-2040 | 108,000 | 137,403 | |
| Multiline retail: 0.33% | |||||
| Dollar General Corporation | 3.25 | 4-15-2023 | 245,000 | 248,411 | |
| Target Corporation | 3.63 | 4-15-2046 | 430,000 | 452,902 | |
| 701,313 | |||||
| Specialty retail: 1.33% | |||||
| Home Depot Incorporated | 2.70 | 4-15-2030 | 1,300,000 | 1,295,704 | |
| Lowe's Companies Incorporated | 2.50 | 4-15-2026 | 350,000 | 353,849 | |
| Lowe's Companies Incorporated | 3.88 | 9-15-2023 | 175,000 | 179,684 | |
| Lowe's Companies Incorporated | 4.50 | 4-15-2030 | 300,000 | 330,893 | |
| TJX Companies Incorporated | 3.88 | 4-15-2030 | 600,000 | 645,757 | |
| 2,805,887 | |||||
| Textiles, apparel & luxury goods: 0.07% | |||||
| Nike Incorporated | 2.25 | 5-1-2023 | 70,000 | 70,571 | |
| Nike Incorporated | 3.63 | 5-1-2043 | 70,000 | 72,946 | |
| 143,517 | |||||
| Consumer staples: 6.85% | |||||
| Beverages: 2.03% | |||||
| Anheuser-Busch InBev Finance Company | 4.00 | 1-17-2043 | 435,000 | 441,576 | |
| Anheuser-Busch InBev Worldwide Incorporated | 4.60 | 6-1-2060 | 105,000 | 114,765 | |
| Anheuser-Busch InBev Worldwide Incorporated | 4.75 | 4-15-2058 | 160,000 | 176,848 |
| Interest rate | Maturity date | Principal | Value | ||
| Beverages (continued) | |||||
| Anheuser-Busch InBev Worldwide Incorporated | 4.90% | 2-1-2046 | $ 415,000 | $ 468,934 | |
| Anheuser-Busch InBev Worldwide Incorporated | 5.80 | 1-23-2059 | �� 75,000 | 96,131 | |
| Coca Cola Company | 2.75 | 6-1-2060 | 280,000 | 244,312 | |
| Constellation Brands Incorporated | 3.15 | 8-1-2029 | 300,000 | 300,153 | |
| Constellation Brands Incorporated | 4.25 | 5-1-2023 | 360,000 | 369,984 | |
| Keurig Dr Pepper Incorporated | 4.60 | 5-25-2028 | 700,000 | 763,770 | |
| PepsiCo Incorporated | 1.40 | 2-25-2031 | 1,105,000 | 994,968 | |
| PepsiCo Incorporated | 3.63 | 3-19-2050 | 285,000 | 304,013 | |
| 4,275,454 | |||||
| Food & staples retailing: 2.02% | |||||
| Costco Wholesale Corporation | 1.60 | 4-20-2030 | 1,000,000 | 927,437 | |
| Sysco Corporation | 3.30 | 7-15-2026 | 1,100,000 | 1,131,693 | |
| Sysco Corporation | 5.38 | 9-21-2035 | 200,000 | 237,482 | |
| The Kroger Company | 3.85 | 8-1-2023 | 175,000 | 179,293 | |
| The Kroger Company | 5.00 | 4-15-2042 | 175,000 | 204,029 | |
| The Kroger Company | 5.15 | 8-1-2043 | 205,000 | 238,995 | |
| Walgreens Boots Alliance Incorporated | 3.45 | 6-1-2026 | 200,000 | 207,421 | |
| Walgreens Boots Alliance Incorporated | 4.80 | 11-18-2044 | 180,000 | 196,769 | |
| Wal-Mart Stores Incorporated | 3.40 | 6-26-2023 | 900,000 | 922,810 | |
| 4,245,929 | |||||
| Food products: 1.53% | |||||
| Archer Daniels Midland | 3.75 | 9-15-2047 | 400,000 | 442,299 | |
| Conagra Brands Incorporated | 4.60 | 11-1-2025 | 200,000 | 212,830 | |
| Conagra Brands Incorporated | 8.25 | 9-15-2030 | 584,000 | 788,516 | |
| General Mills Incorporated | 3.65 | 2-15-2024 | 175,000 | 180,337 | |
| Mead Johnson Nutrition Company | 5.90 | 11-1-2039 | 70,000 | 93,210 | |
| Mondelez International | 2.75 | 4-13-2030 | 1,000,000 | 985,759 | |
| Tyson Foods Incorporated | 4.35 | 3-1-2029 | 300,000 | 324,801 | |
| Tyson Foods Incorporated | 4.88 | 8-15-2034 | 175,000 | 197,926 | |
| 3,225,678 | |||||
| Household products: 0.22% | |||||
| Clorox Company | 3.50 | 12-15-2024 | 140,000 | 144,967 | |
| Kimberly-Clark Corporation | 2.40 | 6-1-2023 | 105,000 | 106,086 | |
| Kimberly-Clark Corporation | 6.63 | 8-1-2037 | 140,000 | 198,870 | |
| 449,923 | |||||
| Personal products: 0.09% | |||||
| Estee Lauder Companies Incorporated | 6.00 | 5-15-2037 | 140,000 | 187,624 | |
| Tobacco: 0.96% | |||||
| Altria Group Incorporated | 3.88 | 9-16-2046 | 430,000 | 369,522 | |
| Altria Group Incorporated | 4.00 | 1-31-2024 | 62,000 | 64,223 | |
| Altria Group Incorporated | 4.50 | 5-2-2043 | 175,000 | 163,486 | |
| BAT Capital Corporation | 4.54 | 8-15-2047 | 140,000 | 129,257 | |
| Philip Morris International Incorporated | 2.63 | 3-6-2023 | 122,000 | 123,325 | |
| Philip Morris International Incorporated | 3.25 | 11-10-2024 | 210,000 | 216,613 | |
| Philip Morris International Incorporated | 4.25 | 11-10-2044 | 210,000 | 216,776 | |
| Philip Morris International Incorporated | 4.50 | 3-20-2042 | 140,000 | 145,878 | |
| Reynolds American Incorporated | 4.45 | 6-12-2025 | 350,000 | 366,018 | |
| Reynolds American Incorporated | 5.70 | 8-15-2035 | 210,000 | 229,454 | |
| 2,024,552 |
| Interest rate | Maturity date | Principal | Value | ||
| Energy: 7.51% | |||||
| Energy equipment & services: 0.81% | |||||
| Baker Hughes LLC | 3.34% | 12-15-2027 | $1,000,000 | $ 1,030,652 | |
| Halliburton Company | 3.50 | 8-1-2023 | 350,000 | 356,944 | |
| Halliburton Company | 3.80 | 11-15-2025 | 140,000 | 146,521 | |
| Halliburton Company | 4.50 | 11-15-2041 | 175,000 | 181,771 | |
| 1,715,888 | |||||
| Oil, gas & consumable fuels: 6.70% | |||||
| Boardwalk Pipelines LP | 3.38 | 2-1-2023 | 70,000 | 70,525 | |
| BP Capital Markets America Incorporated | 3.00 | 2-24-2050 | 200,000 | 170,913 | |
| BP Capital Markets America Incorporated | 3.38 | 2-8-2061 | 465,000 | 409,600 | |
| BP Capital Markets America Incorporated | 3.94 | 9-21-2028 | 200,000 | 212,085 | |
| Columbia Pipeline Group Incorporated | 5.80 | 6-1-2045 | 140,000 | 167,220 | |
| ConocoPhillips Company 144A | 2.40 | 2-15-2031 | 800,000 | 786,921 | |
| ConocoPhillips Company | 5.90 | 10-15-2032 | 175,000 | 217,724 | |
| ConocoPhillips Company | 6.95 | 4-15-2029 | 210,000 | 268,331 | |
| Consolidated Edison Company of New York Incorporated | 4.13 | 5-15-2049 | 520,000 | 539,450 | |
| Devon Energy Corporation | 7.95 | 4-15-2032 | 150,000 | 202,643 | |
| Diamondback Energy Incorporated | 3.50 | 12-1-2029 | 900,000 | 910,111 | |
| Enbridge Energy Partners LP | 5.50 | 9-15-2040 | 140,000 | 163,806 | |
| Energy Transfer Partners LP | 4.90 | 2-1-2024 | 210,000 | 218,564 | |
| Energy Transfer Partners LP | 5.95 | 10-1-2043 | 140,000 | 154,772 | |
| Energy Transfer Partners LP | 7.50 | 7-1-2038 | 240,000 | 303,504 | |
| Enterprise Products Operating LLC | 4.85 | 3-15-2044 | 280,000 | 305,285 | |
| Enterprise Products Operating LLC | 5.70 | 2-15-2042 | 140,000 | 166,489 | |
| Enterprise Products Operating LLC | 5.95 | 2-1-2041 | 200,000 | 243,675 | |
| Enterprise Products Operating LLC | 7.55 | 4-15-2038 | 70,000 | 94,946 | |
| Exxon Mobil Corporation | 2.71 | 3-6-2025 | 630,000 | 642,262 | |
| Exxon Mobil Corporation | 3.04 | 3-1-2026 | 605,000 | 625,877 | |
| Hess Corporation | 7.30 | 8-15-2031 | 269,000 | 341,125 | |
| Kinder Morgan Energy Partners LP | 5.00 | 8-15-2042 | 175,000 | 183,666 | |
| Kinder Morgan Energy Partners LP | 5.00 | 3-1-2043 | 157,000 | 166,804 | |
| Kinder Morgan Energy Partners LP | 5.50 | 3-1-2044 | 210,000 | 236,046 | |
| Kinder Morgan Energy Partners LP | 5.80 | 3-15-2035 | 70,000 | 82,007 | |
| Magellan Midstream Partners LP | 5.15 | 10-15-2043 | 140,000 | 153,199 | |
| Marathon Oil Corporation | 5.20 | 6-1-2045 | 140,000 | 153,904 | |
| Marathon Petroleum Corporation | 3.63 | 9-15-2024 | 350,000 | 359,094 | |
| Marathon Petroleum Corporation | 3.80 | 4-1-2028 | 385,000 | 397,888 | |
| MPLX LP | 4.13 | 3-1-2027 | 200,000 | 210,322 | |
| MPLX LP | 4.88 | 6-1-2025 | 200,000 | 212,946 | |
| MPLX LP | 5.20 | 3-1-2047 | 220,000 | 242,307 | |
| ONEOK Incorporated | 4.55 | 7-15-2028 | 500,000 | 532,545 | |
| PECO Energy Company | 3.90 | 3-1-2048 | 415,000 | 443,216 | |
| Phillips 66 | 4.65 | 11-15-2034 | 140,000 | 154,160 | |
| Plains All American Pipeline LP | 3.60 | 11-1-2024 | 210,000 | 214,913 | |
| Plains All American Pipeline LP | 3.85 | 10-15-2023 | 350,000 | 357,369 | |
| Plains All American Pipeline LP | 4.90 | 2-15-2045 | 175,000 | 168,636 | |
| Sabine Pass Liquefaction LLC | 5.00 | 3-15-2027 | 400,000 | 433,994 | |
| Sabine Pass Liquefaction LLC | 5.63 | 3-1-2025 | 200,000 | 215,811 | |
| Sabine Pass Liquefaction LLC | 5.88 | 6-30-2026 | 200,000 | 221,774 | |
| Spectra Energy Partners LP | 3.38 | 10-15-2026 | 300,000 | 308,565 | |
| Spectra Energy Partners LP | 4.75 | 3-15-2024 | 245,000 | 256,082 | |
| Sunoco Logistics Partner LP | 4.95 | 1-15-2043 | 105,000 | 102,750 | |
| Sunoco Logistics Partner LP | 5.35 | 5-15-2045 | 285,000 | 301,240 |
| Interest rate | Maturity date | Principal | Value | ||
| Oil, gas & consumable fuels (continued) | |||||
| Tennessee Gas Pipeline Company | 7.00% | 10-15-2028 | $ 175,000 | $ 212,479 | |
| Williams Companies Incorporated | 4.85 | 3-1-2048 | 200,000 | 216,845 | |
| Williams Partners LP | 6.30 | 4-15-2040 | 273,000 | 335,606 | |
| 14,089,996 | |||||
| Financials: 18.04% | |||||
| Banks: 6.56% | |||||
| Banc One Corporation | 8.00 | 4-29-2027 | 765,000 | 950,337 | |
| Bank of America Corporation (3 Month LIBOR +1.19%) ± | 3.95 | 1-23-2049 | 1,075,000 | 1,122,637 | |
| Bank of America Corporation (3 Month LIBOR +3.15%) ± | 4.08 | 3-20-2051 | 135,000 | 144,850 | |
| Bank of America Corporation | 4.18 | 11-25-2027 | 725,000 | 761,709 | |
| BB&T Corporation | 2.85 | 10-26-2024 | 500,000 | 508,966 | |
| Citigroup Incorporated (U.S. SOFR +1.15%) ± | 2.67 | 1-29-2031 | 790,000 | 761,656 | |
| Citigroup Incorporated | 4.13 | 7-25-2028 | 500,000 | 525,632 | |
| Citigroup Incorporated | 4.65 | 7-30-2045 | 625,000 | 712,168 | |
| Citizens Financial Group | 4.30 | 2-11-2031 | 200,000 | 204,087 | |
| Compass Bank | 3.88 | 4-10-2025 | 250,000 | 260,944 | |
| Discover Bank | 4.20 | 8-8-2023 | 1,060,000 | 1,090,989 | |
| Discover Bank | 4.25 | 3-13-2026 | 250,000 | 264,843 | |
| Discover Bank | 4.65 | 9-13-2028 | 250,000 | 270,698 | |
| Fifth Third Bancorp | 2.25 | 2-1-2027 | 250,000 | 248,548 | |
| Fifth Third Bancorp | 3.95 | 3-14-2028 | 400,000 | 425,394 | |
| JPMorgan Chase & Company (U.S. SOFR +2.44%) ± | 3.11 | 4-22-2051 | 630,000 | 581,759 | |
| JPMorgan Chase & Company (U.S. SOFR +1.58%) ± | 3.33 | 4-22-2052 | 220,000 | 211,317 | |
| JPMorgan Chase & Company (3 Month LIBOR +1.22%) ± | 3.90 | 1-23-2049 | 270,000 | 281,100 | |
| Key Bank NA | 3.30 | 6-1-2025 | 250,000 | 258,316 | |
| KeyCorp Incorporated | 4.10 | 4-30-2028 | 400,000 | 429,014 | |
| PNC Bank NA | 3.25 | 1-22-2028 | 1,050,000 | 1,082,134 | |
| PNC Bank NA | 4.20 | 11-1-2025 | 250,000 | 265,778 | |
| Santander Holdings USA Incorporated | 4.50 | 7-17-2025 | 350,000 | 367,436 | |
| Truist Bank | 2.20 | 3-16-2023 | 1,100,000 | 1,106,079 | |
| Truist Bank | 3.30 | 5-15-2026 | 400,000 | 413,448 | |
| US Bancorp | 2.38 | 7-22-2026 | 190,000 | 191,545 | |
| US Bancorp | 3.60 | 9-11-2024 | 350,000 | 362,923 | |
| 13,804,307 | |||||
| Capital markets: 4.54% | |||||
| Bain Capital Specialty Finance | 2.55 | 10-13-2026 | 185,000 | 173,797 | |
| Bank of New York Mellon Corporation | 3.00 | 10-30-2028 | 700,000 | 706,894 | |
| Bank of New York Mellon Corporation | 3.40 | 1-29-2028 | 300,000 | 314,370 | |
| BlackRock Incorporated | 3.25 | 4-30-2029 | 900,000 | 942,901 | |
| CME Group Incorporated | 4.15 | 6-15-2048 | 290,000 | 331,383 | |
| Goldman Sachs Group Incorporated | 3.75 | 5-22-2025 | 350,000 | 362,026 | |
| Goldman Sachs Group Incorporated | 4.75 | 10-21-2045 | 1,125,000 | 1,279,169 | |
| Intercontinental Exchange | 3.00 | 9-15-2060 | 215,000 | 182,065 | |
| Intercontinental Exchange | 3.75 | 9-21-2028 | 500,000 | 529,480 | |
| Jefferies Group Incorporated | 6.45 | 6-8-2027 | 285,000 | 334,508 | |
| Moody's Corporation | 5.25 | 7-15-2044 | 210,000 | 254,742 | |
| Morgan Stanley (U.S. SOFR +1.36%) ± | 2.48 | 9-16-2036 | 175,000 | 158,926 | |
| Morgan Stanley | 4.30 | 1-27-2045 | 890,000 | 967,646 | |
| Morgan Stanley | 5.00 | 11-24-2025 | 200,000 | 216,157 | |
| Morgan Stanley | 6.25 | 8-9-2026 | 300,000 | 344,542 | |
| Northern Trust Corporation | 3.95 | 10-30-2025 | 175,000 | 185,133 | |
| PPL Capital Funding Incorporated | 3.10 | 5-15-2026 | 100,000 | 101,820 |
| Interest rate | Maturity date | Principal | Value | ||
| Capital markets (continued) | |||||
| Prospect Capital Corporation | 3.44% | 10-15-2028 | $ 115,000 | $ 103,241 | |
| S&P Global Incorporated | 4.00 | 6-15-2025 | 227,000 | 239,108 | |
| State Street Corporation | 2.65 | 5-19-2026 | 1,100,000 | 1,123,424 | |
| The Charles Schwab Corporation | 3.63 | 4-1-2025 | 140,000 | 145,604 | |
| The Charles Schwab Corporation | 4.63 | 3-22-2030 | 500,000 | 565,921 | |
| 9,562,857 | |||||
| Consumer finance: 1.89% | |||||
| American Express Company | 4.20 | 11-6-2025 | 200,000 | 212,564 | |
| American Honda Finance Corporation | 2.90 | 2-16-2024 | 200,000 | 204,233 | |
| American Honda Finance Corporation | 3.45 | 7-14-2023 | 200,000 | 204,540 | |
| Capital One Financial Corporation | 3.75 | 7-28-2026 | 525,000 | 542,721 | |
| Caterpillar Financial Services Corporation | 2.63 | 3-1-2023 | 260,000 | 263,150 | |
| Caterpillar Financial Services Corporation | 3.25 | 12-1-2024 | 200,000 | 206,999 | |
| Caterpillar Financial Services Corporation | 3.75 | 11-24-2023 | 175,000 | 181,465 | |
| General Motors Financial Company Incorporated | 3.70 | 5-9-2023 | 380,000 | 386,840 | |
| John Deere Capital Corporation | 0.45 | 6-7-2024 | 810,000 | 785,692 | |
| Synchrony Financial | 5.15 | 3-19-2029 | 900,000 | 978,525 | |
| 3,966,729 | |||||
| Diversified financial services: 0.62% | |||||
| Berkshire Hathaway Incorporated | 3.00 | 2-11-2023 | 75,000 | 76,181 | |
| Berkshire Hathaway Incorporated | 3.13 | 3-15-2026 | 945,000 | 980,240 | |
| British American Tobacco Capital Corporation | 5.28 | 4-2-2050 | 95,000 | 96,371 | |
| National Rural Utilities Cooperative Finance Corporation | 4.02 | 11-1-2032 | 140,000 | 150,601 | |
| 1,303,393 | |||||
| Insurance: 3.55% | |||||
| Allstate Corporation (3 Month LIBOR +2.12%) ± | 6.50 | 5-15-2067 | 230,000 | 286,350 | |
| American International Group Incorporated (3 Month LIBOR +2.87%) ± | 5.75 | 4-1-2048 | 200,000 | 205,500 | |
| Aon Corporation | 6.25 | 9-30-2040 | 70,000 | 92,443 | |
| Arch Capital Group Limited | 5.14 | 11-1-2043 | 147,000 | 172,071 | |
| Arthur J. Gallagher & Compnay | 2.40 | 11-9-2031 | 1,720,000 | 1,608,351 | |
| Chubb Corporation | 6.00 | 5-11-2037 | 196,000 | 259,551 | |
| Hartford Financial Services Group Incorporated | 4.30 | 4-15-2043 | 30,000 | 31,834 | |
| Lincoln National Corporation | 4.00 | 9-1-2023 | 175,000 | 180,679 | |
| Loews Corporation | 2.63 | 5-15-2023 | 105,000 | 105,989 | |
| Loews Corporation | 4.13 | 5-15-2043 | 140,000 | 147,609 | |
| Marsh & McLennan Company Incorporated | 3.50 | 6-3-2024 | 200,000 | 205,876 | |
| Marsh & McLennan Company Incorporated | 3.88 | 3-15-2024 | 200,000 | 206,954 | |
| Marsh & McLennan Company Incorporated | 4.90 | 3-15-2049 | 110,000 | 131,651 | |
| MetLife Incorporated | 4.13 | 8-13-2042 | 115,000 | 122,740 | |
| MetLife Incorporated | 4.72 | 12-15-2044 | 175,000 | 202,871 | |
| MetLife Incorporated | 6.38 | 6-15-2034 | 196,000 | 257,385 | |
| Principal Financial Group Incorporated | 3.40 | 5-15-2025 | 140,000 | 143,493 | |
| Progressive Corporation | 6.25 | 12-1-2032 | 252,000 | 327,733 | |
| Progressive Corporation | 7.75 | 3-1-2031 | 865,000 | 1,150,002 | |
| Prudential Financial Incorporated | 3.91 | 12-7-2047 | 155,000 | 161,407 | |
| Prudential Financial Incorporated (3 Month LIBOR +3.04%) ± | 5.20 | 3-15-2044 | 175,000 | 175,875 | |
| Prudential Financial Incorporated | 5.75 | 7-15-2033 | 350,000 | 429,474 | |
| Prudential Financial Incorporated | 6.63 | 12-1-2037 | 45,000 | 60,835 |
| Interest rate | Maturity date | Principal | Value | ||
| Insurance (continued) | |||||
| Transatlantic Holdings Incorporated | 8.00% | 11-30-2039 | $ 70,000 | $ 103,678 | |
| Travelers Companies Incorporated | 4.60 | 8-1-2043 | 600,000 | 693,933 | |
| 7,464,284 | |||||
| Mortgage REITs: 0.88% | |||||
| CC Holdings GS V LLC | 3.85 | 4-15-2023 | 350,000 | 357,442 | |
| ERP Operating LP | 4.00 | 8-1-2047 | 400,000 | 435,445 | |
| Ventas Realty LP | 3.50 | 2-1-2025 | 400,000 | 412,067 | |
| Ventas Realty LP | 4.40 | 1-15-2029 | 600,000 | 652,106 | |
| 1,857,060 | |||||
| Health care: 7.25% | |||||
| Biotechnology: 1.87% | |||||
| AbbVie Incorporated | 3.20 | 5-14-2026 | 530,000 | 543,477 | |
| AbbVie Incorporated | 4.45 | 5-14-2046 | 500,000 | 538,685 | |
| AbbVie Incorporated | 4.85 | 6-15-2044 | 350,000 | 394,558 | |
| Amgen Incorporated | 2.77 | 9-1-2053 | 584,000 | 473,823 | |
| Amgen Incorporated | 3.63 | 5-22-2024 | 350,000 | 361,576 | |
| Biogen Incorporated | 2.25 | 5-1-2030 | 700,000 | 639,724 | |
| Gilead Sciences Incorporated | 3.65 | 3-1-2026 | 350,000 | 364,971 | |
| Gilead Sciences Incorporated | 4.50 | 2-1-2045 | 200,000 | 216,406 | |
| Gilead Sciences Incorporated | 4.75 | 3-1-2046 | 350,000 | 396,457 | |
| 3,929,677 | |||||
| Health care equipment & supplies: 0.62% | |||||
| Abbott Laboratories | 6.00 | 4-1-2039 | 105,000 | 138,615 | |
| Abbott Laboratories | 6.15 | 11-30-2037 | 166,000 | 225,404 | |
| Boston Scientific Corporation | 3.85 | 5-15-2025 | 200,000 | 208,661 | |
| Catholic Health Initiatives | 4.35 | 11-1-2042 | 175,000 | 184,517 | |
| Medtronic Incorporated | 3.50 | 3-15-2025 | 140,000 | 145,861 | |
| Stryker Corporation | 4.63 | 3-15-2046 | 350,000 | 398,652 | |
| 1,301,710 | |||||
| Health care providers & services: 2.48% | |||||
| Aetna Incorporated | 4.13 | 11-15-2042 | 75,000 | 76,887 | |
| Aetna Incorporated | 4.50 | 5-15-2042 | 105,000 | 113,073 | |
| AmerisourceBergen Corporation | 4.25 | 3-1-2045 | 175,000 | 180,143 | |
| Anthem Incorporated | 4.38 | 12-1-2047 | 15,000 | 16,481 | |
| Ascension Healthcare Company | 3.11 | 11-15-2039 | 500,000 | 492,494 | |
| Ascension Healthcare Company | 3.95 | 11-15-2046 | 95,000 | 104,675 | |
| Baptist Health South Florida Obligated Group | 3.12 | 11-15-2071 | 295,000 | 258,726 | |
| CIGNA Corporation Company | 3.00 | 7-15-2023 | 300,000 | 304,455 | |
| CIGNA Corporation Company | 4.80 | 7-15-2046 | 210,000 | 234,379 | |
| CIGNA Corporation Company | 6.13 | 11-15-2041 | 175,000 | 226,168 | |
| CVS Health Corporation | 5.05 | 3-25-2048 | 705,000 | 823,205 | |
| McKesson Corporation | 2.85 | 3-15-2023 | 140,000 | 141,866 | |
| NewYork-Presbyterian Hospital | 3.95 | 12-31-2099 | 215,000 | 228,022 | |
| Quest Diagnostics Incorporated | 2.95 | 6-30-2030 | 300,000 | 295,766 | |
| UnitedHealth Group Incorporated | 4.20 | 1-15-2047 | 200,000 | 221,379 | |
| UnitedHealth Group Incorporated | 4.25 | 3-15-2043 | 175,000 | 192,934 | |
| UnitedHealth Group Incorporated | 4.25 | 4-15-2047 | 300,000 | 333,254 | |
| UnitedHealth Group Incorporated | 4.25 | 6-15-2048 | 300,000 | 334,675 |
| Interest rate | Maturity date | Principal | Value | ||
| Health care providers & services (continued) | |||||
| WellPoint Incorporated | 4.65% | 8-15-2044 | $ 345,000 | $ 386,311 | |
| WellPoint Incorporated | 5.85 | 1-15-2036 | 200,000 | 251,063 | |
| 5,215,956 | |||||
| Pharmaceuticals: 2.28% | |||||
| Bristol-Myers Squibb Company | 3.25 | 11-1-2023 | 109,000 | 111,821 | |
| Bristol-Myers Squibb Company | 3.88 | 8-15-2025 | 400,000 | 422,111 | |
| Bristol-Myers Squibb Company | 4.50 | 3-1-2044 | 200,000 | 231,822 | |
| Bristol-Myers Squibb Company | 4.63 | 5-15-2044 | 240,000 | 281,636 | |
| Eli Lilly & Company | 2.50 | 9-15-2060 | 195,000 | 159,735 | |
| Eli Lilly & Company | 2.75 | 6-1-2025 | 70,000 | 71,176 | |
| GlaxoSmithKline Capital Incorporated | 2.80 | 3-18-2023 | 140,000 | 141,911 | |
| GlaxoSmithKline Capital Incorporated | 5.38 | 4-15-2034 | 210,000 | 260,258 | |
| Johnson & Johnson | 2.45 | 9-1-2060 | 455,000 | 379,085 | |
| Johnson & Johnson | 4.38 | 12-5-2033 | 200,000 | 233,188 | |
| Merck & Company Incorporated | 2.75 | 2-10-2025 | 380,000 | 388,602 | |
| Merck & Company Incorporated | 3.70 | 2-10-2045 | 200,000 | 208,380 | |
| Mylan Incorporated | 4.20 | 11-29-2023 | 200,000 | 205,801 | |
| Pfizer Incorporated | 3.00 | 12-15-2026 | 510,000 | 528,536 | |
| Pfizer Incorporated | 3.90 | 3-15-2039 | 200,000 | 216,894 | |
| Pfizer Incorporated | 4.30 | 6-15-2043 | 210,000 | 235,985 | |
| Schering-Plough Corporation | 6.50 | 12-1-2033 | 175,000 | 236,388 | |
| Viatris Incorporated | 4.00 | 6-22-2050 | 100,000 | 88,677 | |
| Zoetis Incorporated | 4.70 | 2-1-2043 | 350,000 | 402,951 | |
| 4,804,957 | |||||
| Industrials: 5.04% | |||||
| Aerospace & defense: 2.03% | |||||
| L3Harris Technologies Incorporated | 2.90 | 12-15-2029 | 900,000 | 892,467 | |
| Lockheed Martin Corporation | 4.07 | 12-15-2042 | 229,000 | 249,738 | |
| Lockheed Martin Corporation | 6.15 | 9-1-2036 | 122,000 | 160,276 | |
| Northrop Grumman Corporation | 4.03 | 10-15-2047 | 305,000 | 321,656 | |
| Northrop Grumman Corporation | 5.05 | 11-15-2040 | 70,000 | 82,595 | |
| Precision Castparts Corporation | 3.90 | 1-15-2043 | 140,000 | 150,634 | |
| Raytheon Technologies Corporation | 7.20 | 8-15-2027 | 84,000 | 103,257 | |
| Textron Incorporated | 4.30 | 3-1-2024 | 140,000 | 145,368 | |
| The Boeing Company | 2.60 | 10-30-2025 | 300,000 | 298,468 | |
| The Boeing Company | 3.20 | 3-1-2029 | 1,475,000 | 1,458,237 | |
| The Boeing Company | 5.88 | 2-15-2040 | 186,000 | 215,389 | |
| United Technologies Corporation | 3.75 | 11-1-2046 | 200,000 | 202,126 | |
| 4,280,211 | |||||
| Air freight & logistics: 0.34% | |||||
| FedEx Corporation | 4.90 | 1-15-2034 | 175,000 | 200,675 | |
| FedEx Corporation | 5.10 | 1-15-2044 | 210,000 | 242,735 | |
| United Parcel Service Incorporated | 6.20 | 1-15-2038 | 206,000 | 278,923 | |
| 722,333 | |||||
| Airlines: 0.09% | |||||
| American Airlines Incorporated | 3.20 | 12-15-2029 | 47,399 | 46,650 | |
| United Airlines Incorporated | 4.30 | 2-15-2027 | 144,448 | 147,935 | |
| 194,585 |
| Interest rate | Maturity date | Principal | Value | ||
| Commercial services & supplies: 0.13% | |||||
| Republic Services Incorporated | 2.90% | 7-1-2026 | $ 260,000 | $ 263,659 | |
| Industrial conglomerates: 0.28% | |||||
| Honeywell International Incorporated | 3.35 | 12-1-2023 | 140,000 | 143,955 | |
| Honeywell International Incorporated | 3.81 | 11-21-2047 | 405,000 | 445,457 | |
| 589,412 | |||||
| Machinery: 0.40% | |||||
| Caterpillar Incorporated | 4.75 | 5-15-2064 | 300,000 | 377,107 | |
| Deere & Company | 5.38 | 10-16-2029 | 210,000 | 250,147 | |
| Dover Corporation | 5.38 | 10-15-2035 | 140,000 | 164,517 | |
| Parker Hannifin Corporation | 6.25 | 5-15-2038 | 42,000 | 53,757 | |
| 845,528 | |||||
| Road & rail: 1.52% | |||||
| Burlington Northern Santa Fe LLC | 3.00 | 3-15-2023 | 210,000 | 212,745 | |
| Burlington Northern Santa Fe LLC | 3.40 | 9-1-2024 | 210,000 | 216,173 | |
| Burlington Northern Santa Fe LLC | 4.55 | 9-1-2044 | 330,000 | 377,059 | |
| CSX Corporation | 3.40 | 8-1-2024 | 278,000 | 286,495 | |
| Kansas City Southern | 3.00 | 5-15-2023 | 51,000 | 51,499 | |
| Kansas City Southern | 3.15 | 3-15-2023 | 140,000 | 141,725 | |
| Norfolk Southern Corporation | 2.90 | 6-15-2026 | 250,000 | 255,875 | |
| Norfolk Southern Corporation | 3.15 | 6-1-2027 | 300,000 | 309,882 | |
| Norfolk Southern Corporation | 3.85 | 1-15-2024 | 140,000 | 144,493 | |
| Norfolk Southern Corporation | 4.10 | 5-15-2121 | 150,000 | 144,018 | |
| Norfolk Southern Corporation | 5.10 | 12-31-2049 | 80,000 | 90,712 | |
| Union Pacific Corporation | 2.75 | 4-15-2023 | 200,000 | 202,206 | |
| Union Pacific Corporation | 2.97 | 9-16-2062 | 175,000 | 150,724 | |
| Union Pacific Corporation | 3.25 | 1-15-2025 | 175,000 | 180,176 | |
| Union Pacific Corporation | 3.75 | 3-15-2024 | 140,000 | 144,798 | |
| Union Pacific Corporation | 3.80 | 4-6-2071 | 285,000 | 287,175 | |
| 3,195,755 | |||||
| Trading companies & distributors: 0.25% | |||||
| Air Lease Corporation | 3.25 | 3-1-2025 | 200,000 | 201,181 | |
| W.W. Grainger Incorporated | 4.60 | 6-15-2045 | 280,000 | 324,108 | |
| 525,289 | |||||
| Information technology: 7.50% | |||||
| Communications equipment: 0.31% | |||||
| Cisco Systems Incorporated | 2.20 | 9-20-2023 | 300,000 | 302,197 | |
| Cisco Systems Incorporated | 2.95 | 2-28-2026 | 340,000 | 352,751 | |
| 654,948 | |||||
| Electronic equipment, instruments & components: 0.34% | |||||
| Corning Incorporated | 5.45 | 11-15-2079 | 110,000 | 126,924 | |
| Corning Incorporated | 5.75 | 8-15-2040 | 105,000 | 131,798 | |
| Dell International LLC | 6.10 | 7-15-2027 | 230,000 | 264,892 | |
| Keysight Technologies Incorporated | 4.55 | 10-30-2024 | 175,000 | 184,183 | |
| 707,797 | |||||
| IT services: 1.62% | |||||
| Fiserv Incorporated | 3.85 | 6-1-2025 | 210,000 | 218,476 |
| Interest rate | Maturity date | Principal | Value | ||
| IT services (continued) | |||||
| IBM Corporation | 3.38% | 8-1-2023 | $ 210,000 | $ 215,232 | |
| IBM Corporation | 7.00 | 10-30-2025 | 210,000 | 244,212 | |
| IBM Corporation | 7.13 | 12-1-2096 | 230,000 | 376,455 | |
| IBM Corporation | 3.00 | 5-15-2024 | 300,000 | 306,833 | |
| Mastercard Incorporated | 3.50 | 2-26-2028 | 400,000 | 424,927 | |
| Mastercard Incorporated | 3.95 | 2-26-2048 | 370,000 | 405,303 | |
| Visa Incorporated | 2.75 | 9-15-2027 | 300,000 | 307,354 | |
| Visa Incorporated | 2.05 | 4-15-2030 | 800,000 | 774,770 | |
| Western Union Company | 6.20 | 11-17-2036 | 122,000 | 139,431 | |
| 3,412,993 | |||||
| Semiconductors & semiconductor equipment: 2.42% | |||||
| Applied Materials Incorporated | 5.85 | 6-15-2041 | 905,000 | 1,197,845 | |
| Broadcom Incorporated 144A | 3.14 | 11-15-2035 | 600,000 | 555,730 | |
| Broadcom Incorporated | 3.88 | 1-15-2027 | 1,020,000 | 1,062,023 | |
| Intel Corporation | 2.60 | 5-19-2026 | 220,000 | 224,686 | |
| Intel Corporation | 4.10 | 5-19-2046 | 300,000 | 319,439 | |
| Intel Corporation | 4.25 | 12-15-2042 | 175,000 | 191,475 | |
| Intel Corporation | 4.90 | 7-29-2045 | 230,000 | 274,506 | |
| Lam Research Corporation | 4.88 | 3-15-2049 | 155,000 | 187,244 | |
| NVIDIA Corporation | 2.85 | 4-1-2030 | 900,000 | 911,140 | |
| Texas Instruments Incorporated | 2.25 | 5-1-2023 | 175,000 | 176,174 | |
| 5,100,262 | |||||
| Software: 2.03% | |||||
| Microsoft Corporation | 3.04 | 3-17-2062 | 740,000 | 706,235 | |
| Microsoft Corporation | 5.20 | 6-1-2039 | 77,000 | 98,758 | |
| Oracle Corporation | 3.40 | 7-8-2024 | 110,000 | 112,531 | |
| Oracle Corporation | 3.85 | 4-1-2060 | 365,000 | 314,570 | |
| Oracle Corporation | 4.30 | 7-8-2034 | 1,575,000 | 1,626,353 | |
| Salesforce.com Incorporated | 3.05 | 7-15-2061 | 130,000 | 117,451 | |
| Salesforce.com Incorporated | 3.70 | 4-11-2028 | 200,000 | 213,260 | |
| Vmware Incorporated | 4.65 | 5-15-2027 | 1,000,000 | 1,082,895 | |
| 4,272,053 | |||||
| Technology hardware, storage & peripherals: 0.78% | |||||
| Apple Incorporated | 2.85 | 8-5-2061 | 440,000 | 390,912 | |
| Apple Incorporated | 3.75 | 11-13-2047 | 400,000 | 427,364 | |
| Apple Incorporated | 4.38 | 5-13-2045 | 350,000 | 400,102 | |
| Apple Incorporated | 4.65 | 2-23-2046 | 345,000 | 418,595 | |
| 1,636,973 | |||||
| Materials: 2.27% | |||||
| Chemicals: 1.37% | |||||
| Dow Chemical Company | 4.25 | 10-1-2034 | 175,000 | 189,311 | |
| Dow Chemical Company | 5.25 | 11-15-2041 | 175,000 | 205,075 | |
| DuPont de Nemours Incorporated | 4.73 | 11-15-2028 | 800,000 | 885,225 | |
| Eastman Chemical Company | 4.80 | 9-1-2042 | 140,000 | 154,714 | |
| Ecolab Incorporated | 2.70 | 11-1-2026 | 1,000,000 | 1,017,150 | |
| Praxair Incorporated | 2.70 | 2-21-2023 | 105,000 | 106,082 | |
| The Sherwin-Williams Company | 4.50 | 6-1-2047 | 205,000 | 224,865 | |
| Westlake Chemical Corporation | 3.38 | 8-15-2061 | 125,000 | 103,995 | |
| 2,886,417 |
| Interest rate | Maturity date | Principal | Value | ||
| Containers & packaging: 0.23% | |||||
| International Paper Company | 7.30% | 11-15-2039 | $ 175,000 | $ 246,646 | |
| MeadWestvaco Corporation | 7.95 | 2-15-2031 | 35,000 | 46,666 | |
| Packaging Corporation of America | 3.65 | 9-15-2024 | 175,000 | 180,740 | |
| 474,052 | |||||
| Metals & mining: 0.60% | |||||
| Newmont Mining Corporation | 2.60 | 7-15-2032 | 1,180,000 | 1,120,396 | |
| Nucor Corporation | 4.00 | 8-1-2023 | 132,000 | 135,505 | |
| 1,255,901 | |||||
| Paper & forest products: 0.07% | |||||
| Georgia-Pacific LLC | 8.00 | 1-15-2024 | 140,000 | 155,501 | |
| Real estate: 4.14% | |||||
| Equity REITs: 4.14% | |||||
| ACE INA Holdings Incorporated | 2.70 | 3-13-2023 | 280,000 | 283,128 | |
| ACE INA Holdings Incorporated | 3.35 | 5-15-2024 | 350,000 | 360,683 | |
| Alexandria Real Estate Equities Incorporated | 4.70 | 7-1-2030 | 615,000 | 685,853 | |
| American Campus Communities Incorporated | 3.75 | 4-15-2023 | 70,000 | 71,050 | |
| American Tower Corporation | 4.00 | 6-1-2025 | 350,000 | 364,402 | |
| AvalonBay Communities Incorporated | 3.45 | 6-1-2025 | 140,000 | 144,610 | |
| AvalonBay Communities Incorporated | 4.20 | 12-15-2023 | 175,000 | 180,990 | |
| Boston Properties LP | 2.75 | 10-1-2026 | 500,000 | 501,510 | |
| Boston Properties LP | 3.80 | 2-1-2024 | 300,000 | 308,337 | |
| Equinix Incorporated | 1.55 | 3-15-2028 | 1,100,000 | 1,010,932 | |
| Essex Portfolio LP | 3.25 | 5-1-2023 | 70,000 | 70,940 | |
| Federal Realty Investment Trust | 4.50 | 12-1-2044 | 175,000 | 190,053 | |
| HCP Incorporated | 6.75 | 2-1-2041 | 95,000 | 132,757 | |
| Health Care REIT Incorporated | 4.00 | 6-1-2025 | 210,000 | 219,856 | |
| Health Care REIT Incorporated | 4.50 | 1-15-2024 | 140,000 | 145,798 | |
| Kimco Realty Corporation | 2.80 | 10-1-2026 | 350,000 | 352,227 | |
| Mid-America Apartments LP | 4.30 | 10-15-2023 | 35,000 | 35,956 | |
| Physicians Realty Trust | 2.63 | 11-1-2031 | 1,380,000 | 1,294,275 | |
| Prologis LP | 1.25 | 10-15-2030 | 1,100,000 | 969,905 | |
| Realty Income Corporation | 4.60 | 2-6-2024 | 98,000 | 102,010 | |
| Realty Income Corporation | 4.88 | 6-1-2026 | 119,000 | 129,288 | |
| Simon Property Group LP | 3.30 | 1-15-2026 | 410,000 | 420,169 | |
| Simon Property Group LP | 3.75 | 2-1-2024 | 175,000 | 180,340 | |
| Welltower Incorporated | 4.95 | 9-1-2048 | 240,000 | 284,768 | |
| Weyerhaeuser Company | 7.38 | 3-15-2032 | 200,000 | 270,713 | |
| 8,710,550 | |||||
| Utilities: 7.80% | |||||
| Electric utilities: 6.49% | |||||
| AGL Capital Corporation | 4.40 | 6-1-2043 | 140,000 | 144,962 | |
| Alabama Power Company | 3.55 | 12-1-2023 | 175,000 | 179,819 | |
| Appalachian Power Company | 3.40 | 6-1-2025 | 175,000 | 180,411 | |
| Appalachian Power Company | 4.45 | 6-1-2045 | 175,000 | 184,188 | |
| Appalachian Power Company | 7.00 | 4-1-2038 | 70,000 | 93,909 | |
| Arizona Public Service Company | 3.15 | 5-15-2025 | 105,000 | 107,307 | |
| Arizona Public Service Company | 4.50 | 4-1-2042 | 70,000 | 73,823 | |
| Baltimore Gas & Electric Company | 3.50 | 8-15-2046 | 50,000 | 49,601 | |
| Berkshire Hathaway Energy | 3.65 | 4-15-2029 | 800,000 | 852,508 |
| Interest rate | Maturity date | Principal | Value | ||
| Electric utilities (continued) | |||||
| Berkshire Hathaway Energy | 6.75% | 12-30-2031 | $ 105,000 | $ 138,240 | |
| Berkshire Hathaway Finance Corporation | 4.40 | 5-15-2042 | 180,000 | 202,385 | |
| Berkshire Hathaway Finance Corporation | 5.75 | 1-15-2040 | 340,000 | 446,691 | |
| CenterPoint Energy Houston | 4.50 | 4-1-2044 | 175,000 | 199,460 | |
| Commonwealth Edison Company | 3.80 | 10-1-2042 | 70,000 | 72,606 | |
| Connecticut Light & Power Company | 4.15 | 6-1-2045 | 227,000 | 246,569 | |
| Consolidated Edison Company of New York Incorporated Series 16-C | 4.30 | 12-1-2056 | 30,000 | 31,454 | |
| Duke Energy Corporation | 3.95 | 10-15-2023 | 140,000 | 143,683 | |
| Duke Energy Florida Incorporated | 3.85 | 11-15-2042 | 165,000 | 166,743 | |
| Duke Energy Indiana Incorporated | 4.90 | 7-15-2043 | 105,000 | 119,477 | |
| Duke Energy Indiana Incorporated | 6.45 | 4-1-2039 | 45,000 | 59,273 | |
| Duke Energy Progress Incorporated | 4.10 | 3-15-2043 | 105,000 | 110,057 | |
| Entergy Arkansas Incorporated | 3.70 | 6-1-2024 | 175,000 | 180,791 | |
| Entergy Arkansas Incorporated | 4.20 | 4-1-2049 | 280,000 | 303,894 | |
| Entergy Gulf States Louisiana LLC | 5.59 | 10-1-2024 | 84,000 | 90,697 | |
| Exelon Corporation | 4.95 | 6-15-2035 | 140,000 | 156,461 | |
| Florida Power & Light Company | 5.95 | 2-1-2038 | 224,000 | 289,926 | |
| Florida Power & Light Company | 5.96 | 4-1-2039 | 175,000 | 229,443 | |
| Florida Power Corporation | 5.65 | 4-1-2040 | 87,000 | 107,257 | |
| Interstate Power & Light Company | 6.25 | 7-15-2039 | 21,000 | 27,956 | |
| Northeast Utilities | 2.80 | 5-1-2023 | 122,000 | 123,088 | |
| Northern States Power Company of Minnesota | 2.60 | 5-15-2023 | 105,000 | 105,661 | |
| Northern States Power Company of Minnesota | 5.35 | 11-1-2039 | 713,000 | 893,123 | |
| NSTAR Electric Company | 5.50 | 3-15-2040 | 70,000 | 87,179 | |
| Oglethorpe Power Corporation | 5.95 | 11-1-2039 | 105,000 | 129,324 | |
| Ohio Edison Company | 6.88 | 7-15-2036 | 175,000 | 237,334 | |
| Oncor Electric Delivery Company LLC | 7.00 | 5-1-2032 | 122,000 | 161,810 | |
| Pacific Gas & Electric Company | 2.50 | 2-1-2031 | 1,300,000 | 1,157,599 | |
| PacifiCorp | 3.60 | 4-1-2024 | 175,000 | 180,687 | |
| PacifiCorp | 4.10 | 2-1-2042 | 70,000 | 72,663 | |
| Potomac Electric Power Company | 3.60 | 3-15-2024 | 175,000 | 179,804 | |
| PPL Electric Utilities | 4.75 | 7-15-2043 | 105,000 | 121,320 | |
| PPL Electric Utilities | 6.25 | 5-15-2039 | 31,000 | 41,136 | |
| Public Service Electric & Gas Company | 2.38 | 5-15-2023 | 140,000 | 141,020 | |
| Public Service Electric & Gas Company | 3.80 | 1-1-2043 | 140,000 | 142,374 | |
| Public Service Electric & Gas Company | 3.95 | 5-1-2042 | 70,000 | 74,124 | |
| Public Service Electric & Gas Company | 4.05 | 5-1-2048 | 165,000 | 176,314 | |
| Public Service Electric & Gas Company | 5.80 | 5-1-2037 | 70,000 | 88,768 | |
| South Carolina Electric & Gas Company | 5.10 | 6-1-2065 | 30,000 | 37,171 | |
| Southern California Edison Company | 3.90 | 3-15-2043 | 105,000 | 101,418 | |
| Southern California Edison Company | 5.35 | 7-15-2035 | 126,000 | 145,601 | |
| Southern California Edison Company | 5.50 | 3-15-2040 | 140,000 | 161,922 | |
| Southern California Edison Company | 6.00 | 1-15-2034 | 70,000 | 86,061 | |
| Southwestern Electric Power Company | 6.20 | 3-15-2040 | 35,000 | 44,476 | |
| The Southern Company | 0.60 | 2-26-2024 | 1,270,000 | 1,231,717 | |
| The Southern Company | 2.95 | 7-1-2023 | 200,000 | 202,451 | |
| The Southern Company | 4.40 | 7-1-2046 | 185,000 | 193,833 | |
| TXU Electric Delivery Company | 7.25 | 1-15-2033 | 237,000 | 324,148 | |
| Union Electric Company | 3.90 | 9-15-2042 | 175,000 | 182,360 | |
| Union Electric Company | 8.45 | 3-15-2039 | 56,000 | 88,922 | |
| Virginia Electric & Power Company | 3.10 | 5-15-2025 | 70,000 | 71,652 | |
| Virginia Electric & Power Company | 4.20 | 5-15-2045 | 105,000 | 113,583 | |
| Virginia Electric & Power Company | 4.45 | 2-15-2044 | 105,000 | 116,627 | |
| Virginia Electric & Power Company | 6.00 | 1-15-2036 | 70,000 | 88,557 |
| Interest rate | Maturity date | Principal | Value | ||
| Electric utilities (continued) | |||||
| Westar Energy Incorporated | 4.10% | 4-1-2043 | $ 210,000 | $ 221,089 | |
| Wisconsin Electric Power Company | 5.63 | 5-15-2033 | 70,000 | 84,375 | |
| Wisconsin Electric Power Company | 5.70 | 12-1-2036 | 105,000 | 130,141 | |
| XCEL Energy Incorporated | 3.40 | 6-1-2030 | 700,000 | 722,839 | |
| 13,651,862 | |||||
| Gas utilities: 0.47% | |||||
| Atmos Energy Corporation | 4.13 | 10-15-2044 | 245,000 | 255,084 | |
| Atmos Energy Corporation | 5.50 | 6-15-2041 | 42,000 | 50,913 | |
| CenterPoint Energy Resources Corporation | 5.85 | 1-15-2041 | 77,000 | 95,503 | |
| National Fuel Gas Company | 3.75 | 3-1-2023 | 218,000 | 220,680 | |
| One Gas Incorporated | 3.61 | 2-1-2024 | 70,000 | 71,632 | |
| One Gas Incorporated | 4.66 | 2-1-2044 | 150,000 | 169,861 | |
| Piedmont Natural Gas Company | 4.65 | 8-1-2043 | 35,000 | 39,276 | |
| Southern California Gas Company | 5.13 | 11-15-2040 | 70,000 | 83,504 | |
| 986,453 | |||||
| Multi-utilities: 0.74% | |||||
| Ameren Illinois Company | 3.70 | 12-1-2047 | 165,000 | 170,002 | |
| Black Hills Corporation | 4.25 | 11-30-2023 | 210,000 | 217,180 | |
| Consumers Energy Company | 3.95 | 5-15-2043 | 140,000 | 150,228 | |
| Consumers Energy Company | 4.05 | 5-15-2048 | 290,000 | 313,551 | |
| Dominion Resources Incorporated | 5.95 | 6-15-2035 | 157,000 | 189,567 | |
| Puget Energy Incorporated | 3.65 | 5-15-2025 | 140,000 | 144,782 | |
| Sempra Energy | 3.25 | 6-15-2027 | 300,000 | 306,502 | |
| Sempra Energy | 4.00 | 2-1-2048 | 70,000 | 70,321 | |
| 1,562,133 | |||||
| Water utilities: 0.10% | |||||
| American Water Capital Corporation | 3.40 | 3-1-2025 | 210,000 | 216,922 | |
| Total Corporate bonds and notes (Cost $166,554,062) | 164,546,039 | ||||
| Yankee corporate bonds and notes: 18.48% | |||||
| Communication services: 1.04% | |||||
| Diversified telecommunication services: 0.54% | |||||
| Bell Canada Company | 4.46 | 4-1-2048 | 305,000 | 333,084 | |
| Orange SA | 5.50 | 2-6-2044 | 200,000 | 248,586 | |
| Telefonica Emisiones SA | 4.90 | 3-6-2048 | 150,000 | 157,578 | |
| Telefonica Europe BV | 8.25 | 9-15-2030 | 294,000 | 396,526 | |
| 1,135,774 | |||||
| Wireless telecommunication services: 0.50% | |||||
| America Movil SAB de CV | 4.38 | 4-22-2049 | 100,000 | 110,181 | |
| Rogers Communications Incorporated | 3.70 | 11-15-2049 | 105,000 | 93,869 | |
| Vodafone Group plc | 4.38 | 2-19-2043 | 350,000 | 355,788 | |
| Vodafone Group plc | 6.25 | 11-30-2032 | 210,000 | 257,380 | |
| Vodafone Group plc | 7.88 | 2-15-2030 | 175,000 | 230,261 | |
| 1,047,479 | |||||
| Consumer discretionary: 1.22% | |||||
| Auto components: 0.09% | |||||
| Magna International Incorporated | 4.15 | 10-1-2025 | 175,000 | 185,466 |
| Interest rate | Maturity date | Principal | Value | ||
| Hotels, restaurants & leisure: 0.19% | |||||
| Sands China Limited | 5.13% | 8-8-2025 | $ 400,000 | $ 395,920 | |
| Internet & direct marketing retail: 0.94% | |||||
| Alibaba Group Holding Limited | 3.25 | 2-9-2061 | 200,000 | 155,771 | |
| Alibaba Group Holding Limited | 3.40 | 12-6-2027 | 800,000 | 811,993 | |
| Alibaba Group Holding Limited | 3.60 | 11-28-2024 | 1,000,000 | 1,026,041 | |
| 1,993,805 | |||||
| Consumer staples: 0.18% | |||||
| Beverages: 0.18% | |||||
| Diageo Capital plc | 2.63 | 4-29-2023 | 210,000 | 212,139 | |
| Diageo Capital plc | 5.88 | 9-30-2036 | 122,000 | 159,719 | |
| 371,858 | |||||
| Energy: 2.28% | |||||
| Oil, gas & consumable fuels: 2.28% | |||||
| BP Capital Markets plc | 3.81 | 2-10-2024 | 350,000 | 362,781 | |
| Canadian Natural Resources Limited | 3.85 | 6-1-2027 | 200,000 | 208,590 | |
| Canadian Natural Resources Limited | 3.90 | 2-1-2025 | 210,000 | 217,979 | |
| Canadian Natural Resources Limited | 4.95 | 6-1-2047 | 110,000 | 124,025 | |
| Cenovus Energy Incorporated | 5.38 | 7-15-2025 | 1,000,000 | 1,082,995 | |
| Husky Energy Incorporated | 6.80 | 9-15-2037 | 70,000 | 88,621 | |
| Petro-Canada | 5.95 | 5-15-2035 | 140,000 | 169,149 | |
| Shell International Finance BV | 2.88 | 5-10-2026 | 230,000 | 236,501 | |
| Shell International Finance BV | 3.25 | 5-11-2025 | 350,000 | 363,056 | |
| Shell International Finance BV | 3.63 | 8-21-2042 | 730,000 | 735,571 | |
| Suncor Energy Incorporated | 5.95 | 12-1-2034 | 52,000 | 62,140 | |
| Total Capital Canada Limited | 2.75 | 7-15-2023 | 245,000 | 248,875 | |
| Total Capital International SA | 3.39 | 6-29-2060 | 105,000 | 97,228 | |
| Total Capital International SA | 3.75 | 4-10-2024 | 350,000 | 363,222 | |
| TransCanada PipeLines Limited | 3.75 | 10-16-2023 | 175,000 | 179,350 | |
| TransCanada PipeLines Limited | 6.10 | 6-1-2040 | 210,000 | 264,872 | |
| 4,804,955 | |||||
| Financials: 9.71% | |||||
| Banks: 7.99% | |||||
| Banco Santander SA | 2.75 | 12-3-2030 | 200,000 | 182,262 | |
| Bank of Nova Scotia | 4.50 | 12-16-2025 | 500,000 | 532,788 | |
| Barclays plc | 4.38 | 1-12-2026 | 200,000 | 210,720 | |
| Barclays plc (3 Month LIBOR +1.90%) ± | 4.97 | 5-16-2029 | 1,100,000 | 1,191,239 | |
| Barclays plc | 5.25 | 8-17-2045 | 200,000 | 234,401 | |
| BNP Paribas | 4.25 | 10-15-2024 | 1,400,000 | 1,460,385 | |
| Cooperatieve Rabobank UA | 3.75 | 7-21-2026 | 780,000 | 804,232 | |
| Deutsche Bank | 3.95 | 2-27-2023 | 1,100,000 | 1,117,330 | |
| HSBC Holdings plc (U.S. SOFR +0.53%) ± | 0.73 | 8-17-2024 | 400,000 | 391,284 | |
| HSBC Holdings plc (U.S. SOFR +0.71%) ± | 0.98 | 5-24-2025 | 400,000 | 386,631 | |
| HSBC Holdings plc (U.S. SOFR +1.19%) ± | 2.80 | 5-24-2032 | 400,000 | 377,592 | |
| HSBC Holdings plc (3 Month LIBOR +1.53%) ± | 4.58 | 6-19-2029 | 400,000 | 425,564 | |
| HSBC Holdings plc | 4.95 | 3-31-2030 | 400,000 | 442,462 | |
| ING Banking Group plc | 4.55 | 10-2-2028 | 900,000 | 977,422 | |
| Lloyds Banking Group plc | 4.55 | 8-16-2028 | 900,000 | 971,125 | |
| Lloyds Banking Group plc | 4.58 | 12-10-2025 | 250,000 | 262,699 |
| Interest rate | Maturity date | Principal | Value | ||
| Banks (continued) | |||||
| Mitsubishi UFJ Financial Group Incorporated | 3.68% | 2-22-2027 | $ 200,000 | $ 209,265 | |
| Mitsubishi UFJ Financial Group Incorporated | 4.05 | 9-11-2028 | 600,000 | 638,060 | |
| Mizuho Financial Group | 3.17 | 9-11-2027 | 600,000 | 610,457 | |
| National Australia Bank Limited | 2.50 | 7-12-2026 | 800,000 | 810,958 | |
| Natwest Group plc | 3.88 | 9-12-2023 | 300,000 | 307,253 | |
| Royal Bank of Canada | 0.43 | 1-19-2024 | 125,000 | 121,507 | |
| Royal Bank of Canada | 4.65 | 1-27-2026 | 700,000 | 753,857 | |
| Royal Bank of Scotland Group plc | 4.80 | 4-5-2026 | 400,000 | 428,863 | |
| Sumitomo Mitsui Financial Group | 3.01 | 10-19-2026 | 655,000 | 665,609 | |
| Toronto Dominion Bank | 3.50 | 7-19-2023 | 300,000 | 307,827 | |
| Toronto Dominion Bank (USD Swap Semi Annual (vs. 3 Month LIBOR) 5 Year +2.21%) ± | 3.63 | 9-15-2031 | 790,000 | 814,665 | |
| Westpac Banking Corporation | 2.15 | 6-3-2031 | 305,000 | 290,586 | |
| Westpac Banking Corporation (5 Year Treasury Constant Maturity +1.75%) ± | 2.67 | 11-15-2035 | 180,000 | 163,028 | |
| Westpac Banking Corporation | 2.85 | 5-13-2026 | 700,000 | 718,187 | |
| 16,808,258 | |||||
| Capital markets: 0.56% | |||||
| Credit Suisse Group Funding Limited | 4.55 | 4-17-2026 | 950,000 | 1,003,192 | |
| Invesco Finance plc | 4.00 | 1-30-2024 | 175,000 | 180,688 | |
| 1,183,880 | |||||
| Consumer finance: 0.07% | |||||
| Vale Overseas Limited Company | 3.75 | 7-8-2030 | 150,000 | 148,425 | |
| Diversified financial services: 0.80% | |||||
| AerCap Ireland Capital | 3.30 | 1-30-2032 | 150,000 | 142,406 | |
| AerCap Ireland Capital | 3.65 | 7-21-2027 | 300,000 | 304,876 | |
| Brookfield Finance Incorporated | 4.25 | 6-2-2026 | 200,000 | 213,727 | |
| GE Capital International Funding Company | 3.37 | 11-15-2025 | 550,000 | 566,638 | |
| Ingersoll-Rand Finance SA | 4.50 | 3-21-2049 | 130,000 | 143,509 | |
| Medtronic Global Holdings Company | 3.35 | 4-1-2027 | 300,000 | 313,053 | |
| 1,684,209 | |||||
| Insurance: 0.29% | |||||
| Aon plc | 3.88 | 12-15-2025 | 405,000 | 422,946 | |
| XLIT Limited | 5.25 | 12-15-2043 | 140,000 | 177,536 | |
| 600,482 | |||||
| Health care: 1.53% | |||||
| Health care equipment & supplies: 0.00% | |||||
| DH Europe Finance II | 3.40 | 11-15-2049 | 10,000 | 9,800 | |
| Pharmaceuticals: 1.53% | |||||
| AstraZeneca plc | 3.38 | 11-16-2025 | 500,000 | 520,428 | |
| AstraZeneca plc | 4.38 | 11-16-2045 | 200,000 | 227,938 | |
| Royalty Pharma Company | 2.20 | 9-2-2030 | 725,000 | 657,843 | |
| Shire Acquisitions Investments Ireland Designated Activity Company | 2.88 | 9-23-2023 | 1,215,000 | 1,230,660 | |
| Shire plc | 3.20 | 9-23-2026 | 560,000 | 574,791 | |
| 3,211,660 |
| Interest rate | Maturity date | Principal | Value | ||
| Industrials: 1.20% | |||||
| Building products: 0.35% | |||||
| Johnson Control International plc | 1.75% | 9-15-2030 | $ 800,000 | $ 729,061 | |
| Professional services: 0.16% | |||||
| Thomson Reuters Corporation | 4.30 | 11-23-2023 | 210,000 | 217,140 | |
| Thomson Reuters Corporation | 5.85 | 4-15-2040 | 94,000 | 121,477 | |
| 338,617 | |||||
| Road & rail: 0.69% | |||||
| Canadian National Railway Company | 3.65 | 2-3-2048 | 100,000 | 102,398 | |
| Canadian National Railway Company | 6.20 | 6-1-2036 | 140,000 | 182,231 | |
| Canadian Pacific Railway Company | 4.45 | 3-15-2023 | 140,000 | 143,214 | |
| Canadian Pacific Railway Company | 5.95 | 5-15-2037 | 810,000 | 1,030,923 | |
| 1,458,766 | |||||
| Information technology: 0.45% | |||||
| Technology hardware, storage & peripherals: 0.45% | |||||
| NXP BV 144A | 4.30 | 6-18-2029 | 900,000 | 958,791 | |
| Materials: 0.87% | |||||
| Chemicals: 0.41% | |||||
| LyondellBasell Industries NV | 4.63 | 2-26-2055 | 350,000 | 367,359 | |
| Nutrien Limited | 5.00 | 4-1-2049 | 295,000 | 356,031 | |
| Nutrien Limited | 6.13 | 1-15-2041 | 115,000 | 146,346 | |
| 869,736 | |||||
| Metals & mining: 0.25% | |||||
| Rio Tinto Finance (USA) Limited | 4.13 | 8-21-2042 | 175,000 | 190,989 | |
| Southern Copper Corporation | 5.25 | 11-8-2042 | 285,000 | 331,811 | |
| 522,800 | |||||
| Paper & forest products: 0.21% | |||||
| Suzano Austria GmbH | 6.00 | 1-15-2029 | 400,000 | 438,004 | |
| Total Yankee corporate bonds and notes (Cost $39,060,899) | 38,897,746 |
| Yield | Shares | ||||
| Short-term investments: 2.38% | |||||
| Investment companies: 2.38% | |||||
| Allspring Government Money Market Fund Select Class ♠∞ | 0.03 | 5,000,151 | 5,000,151 | ||
| Total Short-term investments (Cost $5,000,151) | 5,000,151 | ||||
| Total investments in securities (Cost $210,615,112) | 99.06% | 208,443,936 | |||
| Other assets and liabilities, net | 0.94 | 1,975,071 | |||
| Total net assets | 100.00% | $210,419,007 |
| 144A | The security may be resold in transactions exempt from registration, normally to qualified institutional buyers, pursuant to Rule 144A under the Securities Act of 1933. |
| ± | Variable rate investment. The rate shown is the rate in effect at period end. |
| ♠ | The issuer of the security is an affiliated person of the Portfolio as defined in the Investment Company Act of 1940. |
| ∞ | The rate represents the 7-day annualized yield at period end. |
| Abbreviations: | |
| LIBOR | London Interbank Offered Rate |
| REIT | Real estate investment trust |
| SOFR | Secured Overnight Financing Rate |
| Value, beginning of period | Purchases | Sales proceeds | Net realized gains (losses) | Net change in unrealized gains (losses) | Value, end of period | Shares, end of period | Income from affiliated securities | |
| Short-term investments | ||||||||
| Allspring Government Money Market Fund Select Class | $877,655 | $60,791,186 | $(56,668,690) | $0 | $0 | $5,000,151 | 5,000,151 | $488 |
| Assets | |
Investments in unaffiliated securities, at value (cost $205,614,961) | $ 203,443,785 |
Investments in affiliated securities, at value (cost $5,000,151) | 5,000,151 |
Receivable for interest | 2,031,295 |
Receivable from adviser | 2,202 |
Prepaid expenses and other assets | 3,600 |
Total assets | 210,481,033 |
| Liabilities | |
Professional fees payable | 48,406 |
Interest holder report expenses payable | 6,173 |
Trustees’ fees and expenses payable | 3,240 |
Accrued expenses and other liabilities | 4,207 |
Total liabilities | 62,026 |
Total net assets | $210,419,007 |
| Investment income | |
Interest | $ 6,751,873 |
Income from affiliated securities | 488 |
Total investment income | 6,752,361 |
| Expenses | |
Advisory fee | 112,602 |
Custody and accounting fees | 14,900 |
Professional fees | 54,972 |
Interest holder report expenses | 15,380 |
Trustees’ fees and expenses | 20,121 |
Other fees and expenses | 12,838 |
Total expenses | 230,813 |
Less: Fee waivers and/or expense reimbursements | (106,951) |
Net expenses | 123,862 |
Net investment income | 6,628,499 |
| Realized and unrealized gains (losses) on investments | |
Net realized gains on investments | 5,904,063 |
Net change in unrealized gains (losses) on investments | (20,234,065) |
Net realized and unrealized gains (losses) on investments | (14,330,002) |
Net decrease in net assets resulting from operations | $ (7,701,503) |
| Year ended February 28, 2022 | Year ended February 28, 2021 | |
| Operations | ||
Net investment income | $ 6,628,499 | $ 7,098,310 |
Net realized gains on investments | 5,904,063 | 5,454,647 |
Net change in unrealized gains (losses) on investments | (20,234,065) | (8,090,410) |
Net increase (decrease) in net assets resulting from operations | (7,701,503) | 4,462,547 |
| Capital transactions | ||
| Transactions in investors’ beneficial interests | ||
Contributions | 41,021,656 | 58,677,235 |
Withdrawals | (52,684,124) | (95,272,661) |
Net decrease in net assets resulting from capital transactions | (11,662,468) | (36,595,426) |
Total decrease in net assets | (19,363,971) | (32,132,879) |
| Net assets | ||
Beginning of period | 229,782,978 | 261,915,857 |
End of period | $210,419,007 | $229,782,978 |
| Year ended February 28 | |||||
| 2022 | 2021 | 2020 1 | 2019 | 2018 2 | |
Total return3 | (3.73)% | 2.46% | 15.72% | 2.29% | (0.12)% |
| Ratios to average net assets (annualized) | |||||
Gross expenses | 0.10% | 0.10% | 0.10% | 0.09% | 0.08% |
Net expenses | 0.06% * | 0.06% * | 0.07% | 0.08% | 0.08% |
Net investment income | 2.94% | 3.24% | 3.59% | 3.74% | 3.48% |
| Supplemental data | |||||
Portfolio turnover rate | 46% | 37% | 18% | 25% | 61% |
| * | Ratio includes expenses which were voluntarily waived by the adviser. Without these voluntary waivers, the net expense ratios would be increased by the following amounts: |
| Year ended February 28, 2022 | 0.04% |
| Year ended February 28, 2021 | 0.04% |
| 1 | Year ended February 29 |
| 2 | For the period from May 23, 2017 (commencement of operations) to February 28, 2018 |
| 3 | Returns for periods of less than one year are not annualized. |
| Gross unrealized gains | $ 5,737,270 |
| Gross unrealized losses | (8,204,971) |
| Net unrealized losses | $(2,467,701) |
| ■ | Level 1 – quoted prices in active markets for identical securities |
| ■ | Level 2 – other significant observable inputs (including quoted prices for similar securities, interest rates, prepayment speeds, credit risk, etc.) |
| ■ | Level 3 – significant unobservable inputs (including the Portfolio’s own assumptions in determining the fair value of investments) |
| Quoted prices (Level 1) | Other significant observable inputs (Level 2) | Significant unobservable inputs (Level 3) | Total | |
| Assets | ||||
| Investments in: | ||||
| Corporate bonds and notes | $ 0 | $ 164,546,039 | $0 | $ 164,546,039 |
| Yankee corporate bonds and notes | 0 | 38,897,746 | 0 | 38,897,746 |
| Short-term investments | ||||
| Investment companies | 5,000,151 | 0 | 0 | 5,000,151 |
| Total assets | $5,000,151 | $203,443,785 | $0 | $208,443,936 |
| Average daily net assets | Advisory fee |
| First $5 billion | 0.050% |
| Next $5 billion | 0.040 |
| Over $10 billion | 0.030 |
Allspring Master Trust:

| Name and year of birth | Position held and length of service* | Principal occupations during past five years or longer | Current other public company or investment company directorships |
| William R. Ebsworth (Born 1957) | Trustee, since 2015 | Retired. From 1984 to 2013, equities analyst, portfolio manager, research director and chief investment officer at Fidelity Management and Research Company in Boston, Tokyo, and Hong Kong, and retired in 2013 as Chief Investment Officer of Fidelity Strategic Advisers, Inc. where he led a team of investment professionals managing client assets. Prior thereto, Board member of Hong Kong Securities Clearing Co., Hong Kong Options Clearing Corp., the Thailand International Fund, Ltd., Fidelity Investments Life Insurance Company, and Empire Fidelity Investments Life Insurance Company. Audit Committee Chair and Investment Committee Chair of the Vincent Memorial Hospital Endowment (non-profit organization). Mr. Ebsworth is a CFA® charterholder. | N/A |
| Jane A. Freeman (Born 1953) | Trustee, since 2015; Chair Liaison, since 2018 | Retired. From 2012 to 2014 and 1999 to 2008, Chief Financial Officer of Scientific Learning Corporation. From 2008 to 2012, Ms. Freeman provided consulting services related to strategic business projects. Prior to 1999, Portfolio Manager at Rockefeller & Co. and Scudder, Stevens & Clark. Board member of the Harding Loevner Funds from 1996 to 2014, serving as both Lead Independent Director and chair of the Audit Committee. Board member of the Russell Exchange Traded Funds Trust from 2011 to 2012 and the chair of the Audit Committee. Ms. Freeman is also an inactive Chartered Financial Analyst. | N/A |
| Isaiah Harris, Jr. (Born 1952) | Trustee, since 2009; Audit Committee Chair, since 2019 | Retired. Chairman of the Board of CIGNA Corporation from 2009 to 2021, and Director from 2005 to 2008. From 2003 to 2011, Director of Deluxe Corporation. Prior thereto, President and CEO of BellSouth Advertising and Publishing Corp. from 2005 to 2007, President and CEO of BellSouth Enterprises from 2004 to 2005 and President of BellSouth Consumer Services from 2000 to 2003. Emeritus member of the Iowa State University Foundation Board of Governors. Emeritus Member of the Advisory Board of Iowa State University School of Business. Advisory Board Member, Palm Harbor Academy (private school). Advisory Board Member, Fellowship of Christian Athletes. Mr. Harris is a certified public accountant (inactive status). | N/A |
| David F. Larcker (Born 1950) | Trustee, since 2009 | James Irvin Miller Professor of Accounting at the Graduate School of Business (Emeritus), Stanford University, Director of the Corporate Governance Research Initiative and Senior Faculty of The Rock Center for Corporate Governance since 2006. From 2005 to 2008, Professor of Accounting at the Graduate School of Business, Stanford University. Prior thereto, Ernst & Young Professor of Accounting at The Wharton School, University of Pennsylvania from 1985 to 2005. | N/A |
| Name and year of birth | Position held and length of service* | Principal occupations during past five years or longer | Current other public company or investment company directorships |
| Olivia S. Mitchell (Born 1953) | Trustee, since 2006; Nominating and Governance Committee Chair, since 2018 | International Foundation of Employee Benefit Plans Professor since 1993, Wharton School of the University of Pennsylvania. Director of Wharton’s Pension Research Council and Boettner Center on Pensions & Retirement Research, and Research Associate at the National Bureau of Economic Research. Previously taught at Cornell University from 1978 to 1993. | N/A |
| Timothy J. Penny (Born 1951) | Trustee, since 1996; Chair, since 2018 | President and Chief Executive Officer of Southern Minnesota Initiative Foundation, a non-profit organization, since 2007. Member of the Board of Trustees of NorthStar Education Finance, Inc., a non-profit organization, since 2007. | N/A |
| James G. Polisson (Born 1959) | Trustee, since 2018 | Retired. Chief Marketing Officer, Source (ETF) UK Services, Ltd, from 2015 to 2017. From 2012 to 2015, Principal of The Polisson Group, LLC, a management consulting, corporate advisory and principal investing company. Chief Executive Officer and Managing Director at Russell Investments, Global Exchange Traded Funds from 2010 to 2012. Managing Director of Barclays Global Investors from 1998 to 2010 and Global Chief Marketing Officer for iShares and Barclays Global Investors from 2000 to 2010. Trustee of the San Francisco Mechanics’ Institute, a non-profit organization, from 2013 to 2015. Board member of the Russell Exchange Traded Fund Trust from 2011 to 2012. Director of Barclays Global Investors Holdings Deutschland GmbH from 2006 to 2009. Mr. Polisson is an attorney and has a retired status with the Massachusetts and District of Columbia Bar Associations. | N/A |
| Pamela Wheelock (Born 1959) | Trustee, since January 2020; previously Trustee from January 2018 to July 2019 | Board member of the Destination Medical Center Economic Development Agency, Rochester, Minnesota since 2019. Interim President of the McKnight Foundation from January to September 2020. McKnight Foundation Consultant, November 2020 to February 2021. Acting Commissioner, Minnesota Department of Human Services, July 2019 through September 2019. Consultant (part-time), Minnesota Department of Human Services, October 2019 through December 2019. Chief Operating Officer, Twin Cities Habitat for Humanity from 2017 to 2019. Vice President of University Services, University of Minnesota from 2012 to 2016. Prior thereto, on the Board of Directors, Governance Committee and Finance Committee for the Minnesota Philanthropy Partners (Saint Paul Foundation) from 2012 to 2018, Interim Chief Executive Officer of Blue Cross Blue Shield of Minnesota from 2011 to 2012, Chairman of the Board from 2009 to 2012 and Board Director from 2003 to 2015. Vice President, Leadership and Community Engagement, Bush Foundation, Saint Paul, Minnesota (a private foundation) from 2009 to 2011. Executive Vice President and Chief Financial Officer, Minnesota Sports and Entertainment from 2004 to 2009 and Senior Vice President from 2002 to 2004. Executive Vice President of the Minnesota Wild Foundation from 2004 to 2008. Commissioner of Finance, State of Minnesota, from 1999 to 2002. Currently Board Chair of the Minnesota Wild Foundation since 2010. | N/A |
| Name and year of birth | Position held and length of service | Principal occupations during past five years or longer |
| Andrew Owen (Born 1960) | President, since 2017 | President, Chief Executive Officer and Director of Allspring Funds Management, LLC since 2017 and co-president of Galliard Capital Management, LLC, an affiliate of Allspring Funds Management, LLC, since 2019. Prior thereto, Head of Affiliated Managers, Allspring Global Investments, from 2014 to 2019 and Executive Vice President responsible for marketing, investments and product development for Allspring Funds Management, LLC, from 2009 to 2014. In addition, Mr. Owen was an Executive Vice President of Wells Fargo & Company from 2014 to 2021. |
| Jeremy DePalma (Born 1974) | Treasurer, since 2012 (for certain funds in the Fund Complex); since 2021 (for the remaining funds in the Fund Complex) | Senior Vice President of Allspring Funds Management, LLC since 2009. Senior Vice President of Evergreen Investment Management Company, LLC from 2008 to 2010 and head of the Fund Reporting and Control Team within Fund Administration from 2005 to 2010. |
| Kate McKinley (Born 1977) | Chief Legal Officer, since 2021 | Chief Legal Officer of Allspring Global Investments since 2021. Prior thereto, held various roles at State Street Global Advisors beginning in 2010, including serving as Senior Vice President and General Counsel from 2019 to 2021, and Chief Operating Officer of the Institutional Client Group from 2016 - 2019. Prior to working at State Street Global Advisors served as Assistant General Counsel for Bank of America Corporation from 2005 to 2010 and as an Associate at WilmerHale from 2002 to 2005. |
| Christopher Baker (Born 1976) | Chief Compliance Officer, since 2022 | Global Chief Compliance Officer for Allspring Global Investments since 2022. Prior thereto, Chief Compliance Officer for State Street Global Advisors from 2018 to 2021. Senior Compliance Officer for the State Street divisions of Alternative Investment Solutions, Sector Solutions, and Global Marketing from 2015 to 2018. From 2010 to 2015 Vice President, Global Head of Investment and Marketing Compliance for State Street Global Advisors. |
| Matthew Prasse (Born 1983) | Secretary, since 2021 | Senior Counsel of the Allspring Legal Department since 2021. Senior Counsel of the Wells Fargo Legal Department from 2018 to 2021. Previously, Counsel for Barings LLC from 2015 to 2018. Prior to joining Barings, Associate at Morgan, Lewis & Bockius LLP from 2008 to 2015. |
P.O. Box 219967
Kansas City, MO 64121-9967
1-800-222-8222. Read the prospectus carefully before you invest or send money.

Bond Portfolio
| Investment objective | The Portfolio seeks to replicate the total return of a blended index that is weighted 50% to the Bloomberg U.S. Treasury Inflation-Linked 1-10 Year Bond Index † and 50% to the Bloomberg U.S. Government Intermediate Bond Index††, before fees and expenses. |
| Adviser | Allspring Funds Management, LLC |
| Subadviser | Allspring Global Investments, LLC |
| Portfolio managers | Janet S. Rilling, CFA®‡, CPA, Michal Stanczyk |
| Ten largest holdings (%) as of February 28, 20221 | |
| TIPS, 0.63%, 4-15-2023 | 5.49 |
| TIPS, 0.13%, 7-15-2026 | 5.10 |
| TIPS, 2.00%, 1-15-2026 | 4.21 |
| TIPS, 0.13%, 1-15-2030 | 3.45 |
| TIPS, 3.88%, 4-15-2029 | 3.15 |
| TIPS, 0.88%, 1-15-2029 | 2.92 |
| TIPS, 0.38%, 7-15-2027 | 2.70 |
| TIPS, 0.38%, 1-15-2027 | 2.61 |
| TIPS, 0.63%, 1-15-2024 | 2.59 |
| TIPS, 0.50%, 4-15-2024 | 2.56 |
| 1 | Figures represent the percentage of the Portfolio's net assets. Holdings are subject to change and may have changed since the date specified. |
| Portfolio composition as of February 28, 20221 |
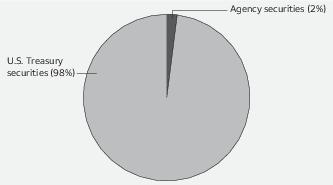
| 1 | Figures represent the percentage of the Portfolio's long-term investments. These amounts are subject to change and may have changed since the date specified. |
| ‡ | CFA® and Chartered Financial Analyst® are trademarks owned by CFA Institute. |
| † | The Bloomberg U.S. Treasury Inflation-Linked 1-10 Year Bond Index measures the performance of the U.S. Treasury Inflation-Protected Securities (TIPS) market with maturities of more than 1 year and less than 10 years. Federal Reserve holdings of U.S. TIPS are not index-eligible and are excluded from the face amount outstanding of each bond in the index. You cannot invest directly in an index. |
| †† | The Bloomberg U.S. Government Intermediate Bond Index is an unmanaged index composed of U.S. government securities with maturities in the 1- to 10-year range, including securities issued by the U.S. Treasury and U.S. government agencies. You cannot invest directly in an index. |
| Interest rate | Maturity date | Principal | Value | ||
| Agency securities: 1.52% | |||||
| FHLB | 0.80% | 3-4-2026 | $ 75,000 | $ 72,430 | |
| FHLB | 2.13 | 6-9-2023 | 35,000 | 35,365 | |
| FHLB | 2.50 | 2-13-2024 | 10,000 | 10,200 | |
| FHLB | 2.75 | 12-13-2024 | 20,000 | 20,592 | |
| FHLB | 3.25 | 6-9-2023 | 50,000 | 51,256 | |
| FHLB | 3.25 | 11-16-2028 | 200,000 | 216,114 | |
| FNMA | 0.38 | 7-21-2025 | 95,000 | 90,807 | |
| FNMA | 0.38 | 8-25-2025 | 60,000 | 57,208 | |
| FNMA | 1.88 | 9-24-2026 | 135,000 | 135,575 | |
| FNMA | 2.13 | 4-24-2026 | 28,000 | 28,373 | |
| FNMA | 2.63 | 9-6-2024 | 100,000 | 102,517 | |
| FNMA | 2.88 | 9-12-2023 | 175,000 | 178,937 | |
| Total Agency securities (Cost $1,012,982) | 999,374 | ||||
| U.S. Treasury securities: 97.78% | |||||
| TIPS | 0.13 | 7-15-2024 | 32,873 | 34,975 | |
| TIPS | 0.13 | 10-15-2024 | 1,244,100 | 1,323,606 | |
| TIPS | 0.13 | 10-15-2025 | 633,890 | 677,619 | |
| TIPS | 0.13 | 7-15-2026 | 3,130,796 | 3,361,937 | |
| TIPS | 0.13 | 1-15-2030 | 2,091,194 | 2,273,479 | |
| TIPS | 0.13 | 7-15-2030 | 462,098 | 505,068 | |
| TIPS | 0.13 | 1-15-2031 | 1,028,064 | 1,123,762 | |
| TIPS | 0.13 | 7-15-2031 | 1,315,739 | 1,445,129 | |
| TIPS | 0.25 | 1-15-2025 | 35,309 | 37,648 | |
| TIPS | 0.25 | 7-15-2029 | 16,347 | 17,943 | |
| TIPS | 0.38 | 7-15-2023 | 1,359,605 | 1,437,464 | |
| TIPS | 0.38 | 7-15-2025 | 41,144 | 44,346 | |
| TIPS | 0.38 | 1-15-2027 | 1,586,819 | 1,723,155 | |
| TIPS | 0.38 | 7-15-2027 | 1,629,657 | 1,780,877 | |
| TIPS | 0.50 | 4-15-2024 | 1,586,134 | 1,687,498 | |
| TIPS | 0.50 | 1-15-2028 | 1,497,462 | 1,645,366 | |
| TIPS | 0.63 | 4-15-2023 | 3,445,492 | 3,616,690 | |
| TIPS | 0.63 | 1-15-2024 | 1,608,134 | 1,709,176 | |
| TIPS | 0.63 | 1-15-2026 | 64,527 | 70,166 | |
| TIPS | 0.75 | 7-15-2028 | 1,299,367 | 1,459,783 | |
| TIPS | 0.88 | 1-15-2029 | 1,694,686 | 1,925,587 | |
| TIPS | 2.00 | 1-15-2026 | 2,429,872 | 2,776,033 | |
| TIPS | 2.38 | 1-15-2025 | 1,292,576 | 1,460,106 | |
| TIPS | 2.38 | 1-15-2027 | 1,275,909 | 1,517,335 | |
| TIPS | 2.50 | 1-15-2029 | 1,071,205 | 1,342,144 | |
| TIPS | 3.63 | 4-15-2028 | 17,236 | 22,437 | |
| TIPS | 3.88 | 4-15-2029 | 1,526,184 | 2,078,651 | |
| U.S. Treasury Bond | 6.13 | 11-15-2027 | 215,000 | 265,777 | |
| U.S. Treasury Bond | 6.13 | 8-15-2029 | 115,000 | 149,819 | |
| U.S. Treasury Bond | 6.38 | 8-15-2027 | 125,000 | 154,985 | |
| U.S. Treasury Bond | 6.88 | 8-15-2025 | 20,000 | 23,513 | |
| U.S. Treasury Note | 0.13 | 7-15-2023 | 1,135,000 | 1,117,532 | |
| U.S. Treasury Note | 0.13 | 8-31-2023 | 505,000 | 496,064 | |
| U.S. Treasury Note | 0.25 | 7-31-2025 | 470,000 | 447,565 | |
| U.S. Treasury Note | 0.38 | 8-15-2024 | 1,105,000 | 1,073,231 | |
| U.S. Treasury Note | 0.38 | 7-31-2027 | 185,000 | 171,754 | |
| U.S. Treasury Note | 0.50 | 6-30-2027 | 320,000 | 299,450 | |
| U.S. Treasury Note | 0.50 | 8-31-2027 | 10,000 | 9,330 | |
| U.S. Treasury Note | 0.63 | 10-15-2024 | 240,000 | 234,019 |
| Interest rate | Maturity date | Principal | Value | ||
| U.S. Treasury securities (continued) | |||||
| U.S. Treasury Note | 0.63% | 5-15-2030 | $ 30,000 | $ 27,263 | |
| U.S. Treasury Note | 0.63 | 8-15-2030 | 45,000 | 40,779 | |
| U.S. Treasury Note | 0.75 | 3-31-2026 | 505,000 | 485,372 | |
| U.S. Treasury Note | 0.88 | 11-15-2030 | 1,135,000 | 1,048,501 | |
| U.S. Treasury Note | 1.00 | 7-31-2028 | 630,000 | 598,623 | |
| U.S. Treasury Note | 1.13 | 2-15-2031 | 915,000 | 862,066 | |
| U.S. Treasury Note | 1.25 | 7-31-2023 | 488,000 | 487,771 | |
| U.S. Treasury Note | 1.25 | 4-30-2028 | 825,000 | 798,252 | |
| U.S. Treasury Note | 1.38 | 8-31-2023 | 490,000 | 490,249 | |
| U.S. Treasury Note | 1.38 | 9-30-2023 | 339,000 | 339,119 | |
| U.S. Treasury Note | 1.38 | 8-31-2026 | 380,000 | 373,855 | |
| U.S. Treasury Note | 1.38 | 10-31-2028 | 505,000 | 490,501 | |
| U.S. Treasury Note | 1.50 | 8-15-2026 | 325,000 | 321,547 | |
| U.S. Treasury Note | 1.50 | 11-30-2028 | 585,000 | 572,752 | |
| U.S. Treasury Note | 1.50 | 2-15-2030 | 475,000 | 463,979 | |
| U.S. Treasury Note | 1.63 | 10-31-2023 | 486,000 | 487,841 | |
| U.S. Treasury Note | 1.63 | 2-15-2026 | 663,000 | 660,099 | |
| U.S. Treasury Note | 1.63 | 11-30-2026 | 410,000 | 407,694 | |
| U.S. Treasury Note | 1.75 | 11-15-2029 | 85,000 | 84,724 | |
| U.S. Treasury Note | 1.88 | 8-31-2024 | 160,000 | 161,181 | |
| U.S. Treasury Note | 1.88 | 7-31-2026 | 20,000 | 20,103 | |
| U.S. Treasury Note | 2.00 | 4-30-2024 | 10,000 | 10,102 | |
| U.S. Treasury Note | 2.00 | 5-31-2024 | 269,000 | 271,785 | |
| U.S. Treasury Note | 2.00 | 6-30-2024 | 185,000 | 186,944 | |
| U.S. Treasury Note | 2.00 | 2-15-2025 | 597,000 | 603,203 | |
| U.S. Treasury Note | 2.00 | 8-15-2025 | 645,000 | 651,324 | |
| U.S. Treasury Note | 2.00 | 11-15-2026 | 520,000 | 525,789 | |
| U.S. Treasury Note | 2.13 | 2-29-2024 | 378,000 | 382,828 | |
| U.S. Treasury Note | 2.13 | 3-31-2024 | 500,000 | 506,387 | |
| U.S. Treasury Note | 2.25 | 12-31-2023 | 472,000 | 478,896 | |
| U.S. Treasury Note | 2.25 | 1-31-2024 | 474,000 | 481,147 | |
| U.S. Treasury Note | 2.25 | 4-30-2024 | 235,000 | 238,654 | |
| U.S. Treasury Note | 2.25 | 10-31-2024 | 490,000 | 498,269 | |
| U.S. Treasury Note | 2.25 | 2-15-2027 | 485,000 | 496,443 | |
| U.S. Treasury Note | 2.25 | 8-15-2027 | 480,000 | 491,869 | |
| U.S. Treasury Note | 2.25 | 11-15-2027 | 650,000 | 665,996 | |
| U.S. Treasury Note | 2.38 | 8-15-2024 | 500,000 | 509,570 | |
| U.S. Treasury Note | 2.50 | 5-15-2024 | 455,000 | 464,544 | |
| U.S. Treasury Note | 2.63 | 12-31-2023 | 375,000 | 383,071 | |
| U.S. Treasury Note | 2.63 | 3-31-2025 | 345,000 | 355,094 | |
| U.S. Treasury Note | 2.63 | 1-31-2026 | 445,000 | 459,984 | |
| U.S. Treasury Note | 2.63 | 2-15-2029 | 85,000 | 89,456 | |
| U.S. Treasury Note | 2.75 | 8-31-2023 | 15,000 | 15,314 | |
| U.S. Treasury Note | 2.75 | 11-15-2023 | 16,000 | 16,363 | |
| U.S. Treasury Note | 2.75 | 2-15-2024 | 585,000 | 599,579 | |
| U.S. Treasury Note | 2.75 | 8-31-2025 | 325,000 | 336,426 | |
| U.S. Treasury Note | 2.75 | 2-15-2028 | 520,000 | 548,011 | |
| U.S. Treasury Note | 2.88 | 4-30-2025 | 470,000 | 487,386 | |
| U.S. Treasury Note | 2.88 | 5-31-2025 | 490,000 | 508,279 | |
| U.S. Treasury Note | 2.88 | 11-30-2025 | 125,000 | 130,220 | |
| U.S. Treasury Note | 2.88 | 5-15-2028 | 645,000 | 685,010 | |
| U.S. Treasury Note | 3.13 | 11-15-2028 | 765,000 | 827,425 | |
| U.S. Treasury Note | 6.00 | 2-15-2026 | 146,000 | 170,238 | |
| U.S. Treasury Note | 6.50 | 11-15-2026 | 30,000 | 36,438 |
| Interest rate | Maturity date | Principal | Value | ||
| U.S. Treasury securities (continued) | |||||
| U.S. Treasury Note | 6.63% | 2-15-2027 | $ 235,000 | $ 289,068 | |
| U.S. Treasury Note | 6.75 | 8-15-2026 | 220,000 | 267,205 | |
| Total U.S. Treasury securities (Cost $63,442,186) | 64,431,607 |
| Yield | Shares | ||||
| Short-term investments: 0.50% | |||||
| Investment companies: 0.50% | |||||
| Allspring Government Money Market Fund Select Class ♠∞ | 0.03 | 331,202 | 331,202 | ||
| Total Short-term investments (Cost $331,202) | 331,202 | ||||
| Total investments in securities (Cost $64,786,370) | 99.80% | 65,762,183 | |||
| Other assets and liabilities, net | 0.20 | 130,058 | |||
| Total net assets | 100.00% | $65,892,241 |
| ♠ | The issuer of the security is an affiliated person of the Portfolio as defined in the Investment Company Act of 1940. |
| ∞ | The rate represents the 7-day annualized yield at period end. |
| Abbreviations: | |
| FHLB | Federal Home Loan Bank |
| FNMA | Federal National Mortgage Association |
| TIPS | Treasury Inflation-Protected Securities |
| Value, beginning of period | Purchases | Sales proceeds | Net realized gains (losses) | Net change in unrealized gains (losses) | Value, end of period | Shares, end of period | Income from affiliated securities | |
| Short-term investments | ||||||||
| Allspring Government Money Market Fund Select Class | $671,302 | $26,021,388 | $(26,361,488) | $0 | $0 | $331,202 | 331,202 | $205 |
| Assets | |
Investments in unaffiliated securities, at value (cost $64,455,168) | $ 65,430,981 |
Investments in affiliated securities, at value (cost $331,202) | 331,202 |
Receivable for interest | 154,033 |
Receivable from adviser | 7,920 |
Prepaid expenses and other assets | 1,693 |
Total assets | 65,925,829 |
| Liabilities | |
Professional fees payable | 24,592 |
Interest holder report expenses payable | 4,330 |
Trustees’ fees and expenses payable | 2,150 |
Accrued expenses and other liabilities | 2,516 |
Total liabilities | 33,588 |
Total net assets | $65,892,241 |
| Investment income | |
Interest | $ 4,686,857 |
Income from affiliated securities | 205 |
Total investment income | 4,687,062 |
| Expenses | |
Advisory fee | 71,499 |
Custody and accounting fees | 9,883 |
Professional fees | 52,904 |
Interest holder report expenses | 9,761 |
Trustees’ fees and expenses | 20,121 |
Other fees and expenses | 8,698 |
Total expenses | 172,866 |
Less: Fee waivers and/or expense reimbursements | (82,777) |
Net expenses | 90,089 |
Net investment income | 4,596,973 |
| Realized and unrealized gains (losses) on investments | |
Net realized gains on investments | 79,947 |
Net change in unrealized gains (losses) on investments | (2,573,630) |
Net realized and unrealized gains (losses) on investments | (2,493,683) |
Net increase in net assets resulting from operations | $ 2,103,290 |
| Year ended February 28, 2022 | Year ended February 28, 2021 | |
| Operations | ||
Net investment income | $ 4,596,973 | $ 933,425 |
Net realized gains on investments | 79,947 | 1,078,112 |
Net change in unrealized gains (losses) on investments | (2,573,630) | 620,830 |
Net increase in net assets resulting from operations | 2,103,290 | 2,632,367 |
| Capital transactions | ||
| Transactions in investors’ beneficial interests | ||
Contributions | 19,610,330 | 110,512,241 |
Withdrawals | (110,936,963) | (33,932,360) |
Net increase (decrease) in net assets resulting from capital transactions | (91,326,633) | 76,579,881 |
Total increase (decrease) in net assets | (89,223,343) | 79,212,248 |
| Net assets | ||
Beginning of period | 155,115,584 | 75,903,336 |
End of period | $ 65,892,241 | $155,115,584 |
| Year ended February 28 | |||||
| 2022 | 2021 | 2020 1 | 2019 | 2018 2 | |
Total return3 | 1.82% | 3.73% | 7.75% | 2.47% | (1.40)% |
| Ratios to average net assets (annualized) | |||||
Gross expenses | 0.12% | 0.15% | 0.18% | 0.16% | 0.17% |
Net expenses | 0.06% * | 0.07% * | 0.11% | 0.14% | 0.17% |
Net investment income | 3.21% | 1.01% | 2.27% | 2.23% | 1.45% |
| Supplemental data | |||||
Portfolio turnover rate | 27% | 44% | 41% | 23% | 193% |
| * | Ratio includes expenses which were voluntarily waived by the adviser. Without these voluntary waivers, the net expense ratios would be increased by the following amounts: |
| Year ended February 28, 2022 | 0.06% |
| Year ended February 28, 2021 | 0.08% |
| 1 | Year ended February 29 |
| 2 | For the period from May 23, 2017 (commencement of operations) to February 28, 2018 |
| 3 | Returns for periods of less than one year are not annualized. |
| Gross unrealized gains | $1,499,012 |
| Gross unrealized losses | (611,441) |
| Net unrealized gains | $ 887,571 |
| ■ | Level 1 – quoted prices in active markets for identical securities |
| ■ | Level 2 – other significant observable inputs (including quoted prices for similar securities, interest rates, prepayment speeds, credit risk, etc.) |
| ■ | Level 3 – significant unobservable inputs (including the Portfolio’s own assumptions in determining the fair value of investments) |
| Quoted prices (Level 1) | Other significant observable inputs (Level 2) | Significant unobservable inputs (Level 3) | Total | |
| Assets | ||||
| Investments in: | ||||
| Agency securities | $ 0 | $ 999,374 | $0 | $ 999,374 |
| U.S. Treasury securities | 64,431,607 | 0 | 0 | 64,431,607 |
| Short-term investments | ||||
| Investment companies | 331,202 | 0 | 0 | 331,202 |
| Total assets | $64,762,809 | $999,374 | $0 | $65,762,183 |
| Average daily net assets | Advisory fee |
| First $5 billion | 0.050% |
| Next $5 billion | 0.040 |
| Over $10 billion | 0.030 |
Allspring Master Trust:

| Name and year of birth | Position held and length of service* | Principal occupations during past five years or longer | Current other public company or investment company directorships |
| William R. Ebsworth (Born 1957) | Trustee, since 2015 | Retired. From 1984 to 2013, equities analyst, portfolio manager, research director and chief investment officer at Fidelity Management and Research Company in Boston, Tokyo, and Hong Kong, and retired in 2013 as Chief Investment Officer of Fidelity Strategic Advisers, Inc. where he led a team of investment professionals managing client assets. Prior thereto, Board member of Hong Kong Securities Clearing Co., Hong Kong Options Clearing Corp., the Thailand International Fund, Ltd., Fidelity Investments Life Insurance Company, and Empire Fidelity Investments Life Insurance Company. Audit Committee Chair and Investment Committee Chair of the Vincent Memorial Hospital Endowment (non-profit organization). Mr. Ebsworth is a CFA® charterholder. | N/A |
| Jane A. Freeman (Born 1953) | Trustee, since 2015; Chair Liaison, since 2018 | Retired. From 2012 to 2014 and 1999 to 2008, Chief Financial Officer of Scientific Learning Corporation. From 2008 to 2012, Ms. Freeman provided consulting services related to strategic business projects. Prior to 1999, Portfolio Manager at Rockefeller & Co. and Scudder, Stevens & Clark. Board member of the Harding Loevner Funds from 1996 to 2014, serving as both Lead Independent Director and chair of the Audit Committee. Board member of the Russell Exchange Traded Funds Trust from 2011 to 2012 and the chair of the Audit Committee. Ms. Freeman is also an inactive Chartered Financial Analyst. | N/A |
| Isaiah Harris, Jr. (Born 1952) | Trustee, since 2009; Audit Committee Chair, since 2019 | Retired. Chairman of the Board of CIGNA Corporation from 2009 to 2021, and Director from 2005 to 2008. From 2003 to 2011, Director of Deluxe Corporation. Prior thereto, President and CEO of BellSouth Advertising and Publishing Corp. from 2005 to 2007, President and CEO of BellSouth Enterprises from 2004 to 2005 and President of BellSouth Consumer Services from 2000 to 2003. Emeritus member of the Iowa State University Foundation Board of Governors. Emeritus Member of the Advisory Board of Iowa State University School of Business. Advisory Board Member, Palm Harbor Academy (private school). Advisory Board Member, Fellowship of Christian Athletes. Mr. Harris is a certified public accountant (inactive status). | N/A |
| David F. Larcker (Born 1950) | Trustee, since 2009 | James Irvin Miller Professor of Accounting at the Graduate School of Business (Emeritus), Stanford University, Director of the Corporate Governance Research Initiative and Senior Faculty of The Rock Center for Corporate Governance since 2006. From 2005 to 2008, Professor of Accounting at the Graduate School of Business, Stanford University. Prior thereto, Ernst & Young Professor of Accounting at The Wharton School, University of Pennsylvania from 1985 to 2005. | N/A |
| Name and year of birth | Position held and length of service* | Principal occupations during past five years or longer | Current other public company or investment company directorships |
| Olivia S. Mitchell (Born 1953) | Trustee, since 2006; Nominating and Governance Committee Chair, since 2018 | International Foundation of Employee Benefit Plans Professor since 1993, Wharton School of the University of Pennsylvania. Director of Wharton’s Pension Research Council and Boettner Center on Pensions & Retirement Research, and Research Associate at the National Bureau of Economic Research. Previously taught at Cornell University from 1978 to 1993. | N/A |
| Timothy J. Penny (Born 1951) | Trustee, since 1996; Chair, since 2018 | President and Chief Executive Officer of Southern Minnesota Initiative Foundation, a non-profit organization, since 2007. Member of the Board of Trustees of NorthStar Education Finance, Inc., a non-profit organization, since 2007. | N/A |
| James G. Polisson (Born 1959) | Trustee, since 2018 | Retired. Chief Marketing Officer, Source (ETF) UK Services, Ltd, from 2015 to 2017. From 2012 to 2015, Principal of The Polisson Group, LLC, a management consulting, corporate advisory and principal investing company. Chief Executive Officer and Managing Director at Russell Investments, Global Exchange Traded Funds from 2010 to 2012. Managing Director of Barclays Global Investors from 1998 to 2010 and Global Chief Marketing Officer for iShares and Barclays Global Investors from 2000 to 2010. Trustee of the San Francisco Mechanics’ Institute, a non-profit organization, from 2013 to 2015. Board member of the Russell Exchange Traded Fund Trust from 2011 to 2012. Director of Barclays Global Investors Holdings Deutschland GmbH from 2006 to 2009. Mr. Polisson is an attorney and has a retired status with the Massachusetts and District of Columbia Bar Associations. | N/A |
| Pamela Wheelock (Born 1959) | Trustee, since January 2020; previously Trustee from January 2018 to July 2019 | Board member of the Destination Medical Center Economic Development Agency, Rochester, Minnesota since 2019. Interim President of the McKnight Foundation from January to September 2020. McKnight Foundation Consultant, November 2020 to February 2021. Acting Commissioner, Minnesota Department of Human Services, July 2019 through September 2019. Consultant (part-time), Minnesota Department of Human Services, October 2019 through December 2019. Chief Operating Officer, Twin Cities Habitat for Humanity from 2017 to 2019. Vice President of University Services, University of Minnesota from 2012 to 2016. Prior thereto, on the Board of Directors, Governance Committee and Finance Committee for the Minnesota Philanthropy Partners (Saint Paul Foundation) from 2012 to 2018, Interim Chief Executive Officer of Blue Cross Blue Shield of Minnesota from 2011 to 2012, Chairman of the Board from 2009 to 2012 and Board Director from 2003 to 2015. Vice President, Leadership and Community Engagement, Bush Foundation, Saint Paul, Minnesota (a private foundation) from 2009 to 2011. Executive Vice President and Chief Financial Officer, Minnesota Sports and Entertainment from 2004 to 2009 and Senior Vice President from 2002 to 2004. Executive Vice President of the Minnesota Wild Foundation from 2004 to 2008. Commissioner of Finance, State of Minnesota, from 1999 to 2002. Currently Board Chair of the Minnesota Wild Foundation since 2010. | N/A |
| Name and year of birth | Position held and length of service | Principal occupations during past five years or longer |
| Andrew Owen (Born 1960) | President, since 2017 | President, Chief Executive Officer and Director of Allspring Funds Management, LLC since 2017 and co-president of Galliard Capital Management, LLC, an affiliate of Allspring Funds Management, LLC, since 2019. Prior thereto, Head of Affiliated Managers, Allspring Global Investments, from 2014 to 2019 and Executive Vice President responsible for marketing, investments and product development for Allspring Funds Management, LLC, from 2009 to 2014. In addition, Mr. Owen was an Executive Vice President of Wells Fargo & Company from 2014 to 2021. |
| Jeremy DePalma (Born 1974) | Treasurer, since 2012 (for certain funds in the Fund Complex); since 2021 (for the remaining funds in the Fund Complex) | Senior Vice President of Allspring Funds Management, LLC since 2009. Senior Vice President of Evergreen Investment Management Company, LLC from 2008 to 2010 and head of the Fund Reporting and Control Team within Fund Administration from 2005 to 2010. |
| Kate McKinley (Born 1977) | Chief Legal Officer, since 2021 | Chief Legal Officer of Allspring Global Investments since 2021. Prior thereto, held various roles at State Street Global Advisors beginning in 2010, including serving as Senior Vice President and General Counsel from 2019 to 2021, and Chief Operating Officer of the Institutional Client Group from 2016 - 2019. Prior to working at State Street Global Advisors served as Assistant General Counsel for Bank of America Corporation from 2005 to 2010 and as an Associate at WilmerHale from 2002 to 2005. |
| Christopher Baker (Born 1976) | Chief Compliance Officer, since 2022 | Global Chief Compliance Officer for Allspring Global Investments since 2022. Prior thereto, Chief Compliance Officer for State Street Global Advisors from 2018 to 2021. Senior Compliance Officer for the State Street divisions of Alternative Investment Solutions, Sector Solutions, and Global Marketing from 2015 to 2018. From 2010 to 2015 Vice President, Global Head of Investment and Marketing Compliance for State Street Global Advisors. |
| Matthew Prasse (Born 1983) | Secretary, since 2021 | Senior Counsel of the Allspring Legal Department since 2021. Senior Counsel of the Wells Fargo Legal Department from 2018 to 2021. Previously, Counsel for Barings LLC from 2015 to 2018. Prior to joining Barings, Associate at Morgan, Lewis & Bockius LLP from 2008 to 2015. |
P.O. Box 219967
Kansas City, MO 64121-9967
1-800-222-8222. Read the prospectus carefully before you invest or send money.

| Investment objective | The Portfolio seeks to replicate the total return of the Dow Jones U.S. Select REIT Index†, before fees and expenses. |
| Adviser | Allspring Funds Management, LLC |
| Subadviser | Allspring Global Investments, LLC |
| Portfolio manager | Petros N. Bocray, CFA®‡FRM |
| Ten largest holdings (%) as of February 28, 20221 | |
| Prologis Incorporated | 10.48 |
| Public Storage Incorporated | 5.26 |
| Simon Property Group Incorporated | 4.39 |
| Digital Realty Trust Incorporated | 3.72 |
| Realty Income Corporation | 3.63 |
| Welltower Incorporated | 3.52 |
| AvalonBay Communities Incorporated | 3.24 |
| Equity Residential | 2.83 |
| Alexandria Real Estate Equities Incorporated | 2.59 |
| Extra Space Storage Incorporated | 2.45 |
| 1 | Figures represent the percentage of the Portfolio's net assets. Holdings are subject to change and may have changed since the date specified. |
| ‡ | CFA® and Chartered Financial Analyst® are trademarks owned by CFA Institute. |
| † | The Dow Jones U.S. Select REIT Index tracks the performance of publicly traded REITs and REIT-like securities and is designed to serve as a proxy for direct real estate investment, in part by excluding companies whose performance may be driven by factors other than the value of real estate. You cannot invest directly in an index. |
| Shares | Value | ||||
| Common stocks: 99.38% | |||||
| Real estate: 99.38% | |||||
| Equity REITs: 99.38% | |||||
| Acadia Realty Trust | 2,105 | $ 45,131 | |||
| Agree Realty Corporation | 1,660 | 106,489 | |||
| Alexandria Real Estate Equities Incorporated | 3,357 | 635,810 | |||
| American Assets Trust Incorporated | 1,252 | 45,773 | |||
| American Campus Communities Incorporated | 3,313 | 178,273 | |||
| American Homes 4 Rent Class A | 6,754 | 256,720 | |||
| Americold Realty Trust | 6,351 | 169,699 | |||
| Apartment Income Corporation REIT | 3,737 | 192,867 | |||
| Apartment Investment & Management Company Class A † | 3,624 | 25,875 | |||
| Apple Hospitality REIT Incorporated | 5,056 | 89,441 | |||
| Ashford Hospitality Trust Incorporated † | 774 | 6,664 | |||
| AvalonBay Communities Incorporated | 3,328 | 794,028 | |||
| Boston Properties Incorporated | 3,384 | 413,897 | |||
| Brandywine Realty Trust | 4,073 | 54,293 | |||
| Brixmor Property Group Incorporated | 7,071 | 177,624 | |||
| Broadstone Net Lease Incorporated REIT | 3,839 | 83,153 | |||
| Camden Property Trust | 2,434 | 401,878 | |||
| CareTrust REIT Incorporated | 2,309 | 40,408 | |||
| Centerspace REIT | 340 | 31,957 | |||
| Chatham Lodging Trust † | 1,160 | 15,950 | |||
| City Office REIT Incorporated | 1,036 | 17,840 | |||
| Community Healthcare Trust Incorporated | 558 | 23,269 | |||
| Corporate Office Properties Trust | 2,673 | 70,059 | |||
| Cousins Properties Incorporated | 3,540 | 136,750 | |||
| CubeSmart | 5,161 | 248,812 | |||
| DiamondRock Hospitality † | 5,014 | 47,884 | |||
| Digital Realty Trust Incorporated | 6,757 | 911,654 | |||
| Diversified Healthcare Trust | 5,690 | 16,387 | |||
| Douglas Emmett Incorporated | 4,178 | 132,443 | |||
| Duke Realty Corporation | 9,068 | 480,604 | |||
| Easterly Government Properties Incorporated | 2,050 | 42,681 | |||
| EastGroup Properties Incorporated | 969 | 184,846 | |||
| Empire State Realty Trust Incorporated Class A | 3,366 | 31,842 | |||
| EPR Properties | 1,781 | 88,694 | |||
| Equity Commonwealth † | 2,878 | 76,468 | |||
| Equity Lifestyle Properties Incorporated | 4,069 | 303,629 | |||
| Equity Residential | 8,125 | 693,063 | |||
| Essential Properties Realty | 2,894 | 73,160 | |||
| Essex Property Trust Incorporated | 1,550 | 491,614 | |||
| Extra Space Storage Incorporated | 3,188 | 599,822 | |||
| Federal Realty Investment Trust | 1,667 | 196,006 | |||
| First Industrial Realty Trust Incorporated | 3,102 | 178,613 | |||
| Four Corners Property Trust Incorporated | 1,841 | 48,566 | |||
| Franklin Street Properties Corporation | 2,262 | 13,074 | |||
| Getty Realty Corporation | 938 | 25,842 | |||
| Global Medical REIT Incorporated | 1,436 | 22,545 | |||
| Global Net Lease Incorporated | 2,465 | 35,028 | |||
| Healthcare Realty Trust Incorporated | 3,512 | 91,593 | |||
| Healthcare Trust of America Incorporated Class A | 5,257 | 154,503 | |||
| Healthpeak Properties Incorporated | 12,835 | 398,655 | |||
| Hersha Hospitality Trust † | 785 | 7,246 | |||
| Highwoods Properties Incorporated | 2,484 | 108,302 |
| Shares | Value | ||||
| Equity REITs (continued) | |||||
| Host Hotels & Resorts Incorporated † | 17,001 | $ 310,608 | |||
| Hudson Pacific Properties Incorporated | 3,629 | 95,806 | |||
| Independence Realty Trust Incorporated | 2,488 | 62,872 | |||
| Industrial Logistics Properties Trust | 1,557 | 34,830 | |||
| Innovative Industrial Properties Incorporated | 513 | 96,680 | |||
| Invitation Homes Incorporated | 14,209 | 537,100 | |||
| JBG Smith Properties | 2,717 | 72,490 | |||
| Kilroy Realty Corporation | 2,494 | 178,620 | |||
| Kimco Realty Corporation | 14,677 | 345,350 | |||
| Kite Realty Group Trust | 5,214 | 114,343 | |||
| Lexington Corporate Properties Trust | 6,733 | 104,092 | |||
| Life Storage Incorporated | 1,953 | 247,230 | |||
| LTC Properties Incorporated | 936 | 31,665 | |||
| Medical Properties Trust Incorporated | 14,198 | 288,787 | |||
| Mid-America Apartment Communities Incorporated | 2,741 | 560,836 | |||
| National Health Investors Incorporated | 1,091 | 58,161 | |||
| National Retail Properties Incorporated | 4,181 | 178,152 | |||
| National Storage Affiliates Trust | 1,950 | 113,627 | |||
| Netstreit Corporation REIT | 942 | 20,856 | |||
| NexPoint Residential Trust Incorporated | 541 | 45,969 | |||
| Office Properties Income Trust | 1,152 | 28,858 | |||
| Omega Healthcare Investors Incorporated | 5,689 | 160,259 | |||
| Orion Office Incorporated † | 1,289 | 21,952 | |||
| Paramount Group Incorporated | 3,909 | 43,742 | |||
| Park Hotels & Resorts Incorporated † | 5,630 | 106,069 | |||
| Pebblebrook Hotel Trust | 3,127 | 70,389 | |||
| Piedmont Office Realty Trust Incorporated Class A | 2,955 | 50,353 | |||
| Prologis Incorporated | 17,604 | 2,567,543 | |||
| PS Business Parks Incorporated | 479 | 76,300 | |||
| Public Storage Incorporated | 3,632 | 1,289,433 | |||
| Realty Income Corporation | 13,470 | 890,232 | |||
| Regency Centers Corporation | 3,668 | 241,685 | |||
| Retail Opportunity Investment Corporation | 2,891 | 52,501 | |||
| Rexford Industrial Realty Incorporated | 3,606 | 252,889 | |||
| RLJ Lodging Trust | 3,966 | 55,484 | |||
| RPT Realty | 2,006 | 25,978 | |||
| Ryman Hospitality Properties Incorporated † | 1,311 | 115,512 | |||
| Seritage Growth Property Class A † | 862 | 8,784 | |||
| Service Properties Trust | 3,930 | 33,916 | |||
| Simon Property Group Incorporated | 7,824 | 1,076,269 | |||
| SITE Centers Corporation | 4,274 | 66,461 | |||
| SL Green Realty Corporation | 1,587 | 126,198 | |||
| Spirit Realty Capital Incorporated REIT | 2,935 | 136,096 | |||
| STAG Industrial Incorporated | 4,167 | 162,346 | |||
| Store Capital Corporation | 5,842 | 179,466 | |||
| Summit Hotel Properties Incorporated † | 2,534 | 25,061 | |||
| Sun Communities Incorporated | 2,761 | 499,741 | |||
| Sunstone Hotel Investors Incorporated † | 5,222 | 55,249 | |||
| Tanger Factory Outlet Centers Incorporated | 2,475 | 41,283 | |||
| Terreno Realty Corporation | 1,781 | 122,515 | |||
| The Macerich Company | 5,072 | 77,602 | |||
| The Necessity Retail REIT Incorporated | 2,940 | 20,698 | |||
| UDR Incorporated | 6,919 | 379,646 | |||
| Universal Health Realty Income Trust | 304 | 17,361 | |||
| Urban Edge Properties | 2,621 | 47,755 | |||
| Ventas Incorporated | 9,504 | 513,216 |
| Shares | Value | ||||
| Equity REITs (continued) | |||||
| Veris Residential Incorporated † | 1,906 | $ 32,211 | |||
| Vornado Realty Trust | 3,785 | 163,815 | |||
| Washington REIT | 2,014 | 47,047 | |||
| Welltower Incorporated | 10,363 | 863,134 | |||
| WP Carey Incorporated | 4,435 | 343,269 | |||
| Xenia Hotels & Resorts Incorporated † | 2,718 | 50,392 | |||
| Total Common stocks (Cost $17,534,301) | 24,354,208 |
| Yield | |||||
| Short-term investments: 0.42% | |||||
| Investment companies: 0.42% | |||||
| Allspring Government Money Market Fund Select Class ♠∞ | 0.03% | 102,224 | 102,224 | ||
| Total Short-term investments (Cost $102,224) | 102,224 | ||||
| Total investments in securities (Cost $17,636,525) | 99.80% | 24,456,432 | |||
| Other assets and liabilities, net | 0.20 | 48,151 | |||
| Total net assets | 100.00% | $24,504,583 |
| † | Non-income-earning security |
| ♠ | The issuer of the security is an affiliated person of the Portfolio as defined in the Investment Company Act of 1940. |
| ∞ | The rate represents the 7-day annualized yield at period end. |
| Abbreviations: | |
| REIT | Real estate investment trust |
| Value, beginning of period | Purchases | Sales proceeds | Net realized gains (losses) | Net change in unrealized gains (losses) | Value, end of period | Shares, end of period | Income from affiliated securities | |
| Short-term investments | ||||||||
| Allspring Government Money Market Fund Select Class | $133,673 | $8,834,283 | $(8,865,732) | $0 | $0 | $102,224 | 102,224 | $33 |
| Assets | |
Investments in unaffiliated securities, at value (cost $17,534,301) | $ 24,354,208 |
Investments in affiliated securities, at value (cost $102,224) | 102,224 |
Cash | 49,245 |
Receivable for dividends | 16,815 |
Receivable from adviser | 12,857 |
Total assets | 24,535,349 |
| Liabilities | |
Professional fees payable | 24,298 |
Interest holder report expenses payable | 5,196 |
Accrued expenses and other liabilities | 1,272 |
Total liabilities | 30,766 |
Total net assets | $24,504,583 |
| Investment income | |
Dividends | $ 506,656 |
Income from affiliated securities | 33 |
Total investment income | 506,689 |
| Expenses | |
Advisory fee | 25,546 |
Custody and accounting fees | 47,173 |
Professional fees | 48,855 |
Interest holder report expenses | 21,423 |
Trustees’ fees and expenses | 20,121 |
Other fees and expenses | 6,831 |
Total expenses | 169,949 |
Less: Fee waivers and/or expense reimbursements | (135,206) |
Net expenses | 34,743 |
Net investment income | 471,946 |
| Realized and unrealized gains (losses) on investments | |
Net realized gains on investments | 3,936,717 |
Net change in unrealized gains (losses) on investments | 1,722,342 |
Net realized and unrealized gains (losses) on investments | 5,659,059 |
Net increase in net assets resulting from operations | $6,131,005 |
| Year ended February 28, 2022 | Year ended February 28, 2021 | |
| Operations | ||
Net investment income | $ 471,946 | $ 468,359 |
Net realized gains (losses) on investments | 3,936,717 | (1,599,946) |
Net change in unrealized gains (losses) on investments | 1,722,342 | 2,960,497 |
Net increase in net assets resulting from operations | 6,131,005 | 1,828,910 |
| Capital transactions | ||
| Transactions in investors’ beneficial interests | ||
Contributions | 5,084,311 | 11,785,224 |
Withdrawals | (12,299,436) | (13,636,052) |
Net decrease in net assets resulting from capital transactions | (7,215,125) | (1,850,828) |
Total decrease in net assets | (1,084,120) | (21,918) |
| Net assets | ||
Beginning of period | 25,588,703 | 25,610,621 |
End of period | $ 24,504,583 | $ 25,588,703 |
| Year ended February 28 | |||||
| 2022 | 2021 | 2020 1 | 2019 | 2018 2 | |
Total return3 | 25.46% | 3.45% | 2.65% | 19.52% | (8.74)% |
| Ratios to average net assets (annualized) | |||||
Gross expenses | 0.67% | 0.48% | 0.43% | 0.26% | 0.33% |
Net expenses | 0.14% * | 0.14% * | 0.19% | 0.23% | 0.32% |
Net investment income | 1.85% | 1.93% | 2.73% | 2.91% | 2.53% |
| Supplemental data | |||||
Portfolio turnover rate | 41% | 71% | 26% | 20% | 51% |
| * | Ratio includes expenses which were voluntarily waived by the adviser. Without these voluntary waivers, the net expense ratios would be increased by the following amounts: |
| Year ended February 28, 2022 | 0.53% |
| Year ended February 28, 2021 | 0.34% |
| 1 | Year ended February 29 |
| 2 | For the period from May 23, 2017 (commencement of operations) to February 28, 2018 |
| 3 | Returns for periods of less than one year are not annualized. |
| Gross unrealized gains | $ 6,924,009 |
| Gross unrealized losses | (2,464,420) |
| Net unrealized gains | $ 4,459,589 |
| ■ | Level 1 – quoted prices in active markets for identical securities |
| ■ | Level 2 – other significant observable inputs (including quoted prices for similar securities, interest rates, prepayment speeds, credit risk, etc.) |
| ■ | Level 3 – significant unobservable inputs (including the Portfolio’s own assumptions in determining the fair value of investments) |
| Quoted prices (Level 1) | Other significant observable inputs (Level 2) | Significant unobservable inputs (Level 3) | Total | |
| Assets | ||||
| Investments in: | ||||
| Common stocks | ||||
| Real estate | $ 24,354,208 | $0 | $0 | $ 24,354,208 |
| Short-term investments | ||||
| Investment companies | 102,224 | 0 | 0 | 102,224 |
| Total assets | $24,456,432 | $0 | $0 | $24,456,432 |
| Average daily net assets | Advisory fee |
| First $5 billion | 0.100% |
| Next $5 billion | 0.080 |
| Over $10 billion | 0.060 |
Allspring Master Trust:

| Name and year of birth | Position held and length of service* | Principal occupations during past five years or longer | Current other public company or investment company directorships |
| William R. Ebsworth (Born 1957) | Trustee, since 2015 | Retired. From 1984 to 2013, equities analyst, portfolio manager, research director and chief investment officer at Fidelity Management and Research Company in Boston, Tokyo, and Hong Kong, and retired in 2013 as Chief Investment Officer of Fidelity Strategic Advisers, Inc. where he led a team of investment professionals managing client assets. Prior thereto, Board member of Hong Kong Securities Clearing Co., Hong Kong Options Clearing Corp., the Thailand International Fund, Ltd., Fidelity Investments Life Insurance Company, and Empire Fidelity Investments Life Insurance Company. Audit Committee Chair and Investment Committee Chair of the Vincent Memorial Hospital Endowment (non-profit organization). Mr. Ebsworth is a CFA® charterholder. | N/A |
| Jane A. Freeman (Born 1953) | Trustee, since 2015; Chair Liaison, since 2018 | Retired. From 2012 to 2014 and 1999 to 2008, Chief Financial Officer of Scientific Learning Corporation. From 2008 to 2012, Ms. Freeman provided consulting services related to strategic business projects. Prior to 1999, Portfolio Manager at Rockefeller & Co. and Scudder, Stevens & Clark. Board member of the Harding Loevner Funds from 1996 to 2014, serving as both Lead Independent Director and chair of the Audit Committee. Board member of the Russell Exchange Traded Funds Trust from 2011 to 2012 and the chair of the Audit Committee. Ms. Freeman is also an inactive Chartered Financial Analyst. | N/A |
| Isaiah Harris, Jr. (Born 1952) | Trustee, since 2009; Audit Committee Chair, since 2019 | Retired. Chairman of the Board of CIGNA Corporation from 2009 to 2021, and Director from 2005 to 2008. From 2003 to 2011, Director of Deluxe Corporation. Prior thereto, President and CEO of BellSouth Advertising and Publishing Corp. from 2005 to 2007, President and CEO of BellSouth Enterprises from 2004 to 2005 and President of BellSouth Consumer Services from 2000 to 2003. Emeritus member of the Iowa State University Foundation Board of Governors. Emeritus Member of the Advisory Board of Iowa State University School of Business. Advisory Board Member, Palm Harbor Academy (private school). Advisory Board Member, Fellowship of Christian Athletes. Mr. Harris is a certified public accountant (inactive status). | N/A |
| David F. Larcker (Born 1950) | Trustee, since 2009 | James Irvin Miller Professor of Accounting at the Graduate School of Business (Emeritus), Stanford University, Director of the Corporate Governance Research Initiative and Senior Faculty of The Rock Center for Corporate Governance since 2006. From 2005 to 2008, Professor of Accounting at the Graduate School of Business, Stanford University. Prior thereto, Ernst & Young Professor of Accounting at The Wharton School, University of Pennsylvania from 1985 to 2005. | N/A |
| Name and year of birth | Position held and length of service* | Principal occupations during past five years or longer | Current other public company or investment company directorships |
| Olivia S. Mitchell (Born 1953) | Trustee, since 2006; Nominating and Governance Committee Chair, since 2018 | International Foundation of Employee Benefit Plans Professor since 1993, Wharton School of the University of Pennsylvania. Director of Wharton’s Pension Research Council and Boettner Center on Pensions & Retirement Research, and Research Associate at the National Bureau of Economic Research. Previously taught at Cornell University from 1978 to 1993. | N/A |
| Timothy J. Penny (Born 1951) | Trustee, since 1996; Chair, since 2018 | President and Chief Executive Officer of Southern Minnesota Initiative Foundation, a non-profit organization, since 2007. Member of the Board of Trustees of NorthStar Education Finance, Inc., a non-profit organization, since 2007. | N/A |
| James G. Polisson (Born 1959) | Trustee, since 2018 | Retired. Chief Marketing Officer, Source (ETF) UK Services, Ltd, from 2015 to 2017. From 2012 to 2015, Principal of The Polisson Group, LLC, a management consulting, corporate advisory and principal investing company. Chief Executive Officer and Managing Director at Russell Investments, Global Exchange Traded Funds from 2010 to 2012. Managing Director of Barclays Global Investors from 1998 to 2010 and Global Chief Marketing Officer for iShares and Barclays Global Investors from 2000 to 2010. Trustee of the San Francisco Mechanics’ Institute, a non-profit organization, from 2013 to 2015. Board member of the Russell Exchange Traded Fund Trust from 2011 to 2012. Director of Barclays Global Investors Holdings Deutschland GmbH from 2006 to 2009. Mr. Polisson is an attorney and has a retired status with the Massachusetts and District of Columbia Bar Associations. | N/A |
| Pamela Wheelock (Born 1959) | Trustee, since January 2020; previously Trustee from January 2018 to July 2019 | Board member of the Destination Medical Center Economic Development Agency, Rochester, Minnesota since 2019. Interim President of the McKnight Foundation from January to September 2020. McKnight Foundation Consultant, November 2020 to February 2021. Acting Commissioner, Minnesota Department of Human Services, July 2019 through September 2019. Consultant (part-time), Minnesota Department of Human Services, October 2019 through December 2019. Chief Operating Officer, Twin Cities Habitat for Humanity from 2017 to 2019. Vice President of University Services, University of Minnesota from 2012 to 2016. Prior thereto, on the Board of Directors, Governance Committee and Finance Committee for the Minnesota Philanthropy Partners (Saint Paul Foundation) from 2012 to 2018, Interim Chief Executive Officer of Blue Cross Blue Shield of Minnesota from 2011 to 2012, Chairman of the Board from 2009 to 2012 and Board Director from 2003 to 2015. Vice President, Leadership and Community Engagement, Bush Foundation, Saint Paul, Minnesota (a private foundation) from 2009 to 2011. Executive Vice President and Chief Financial Officer, Minnesota Sports and Entertainment from 2004 to 2009 and Senior Vice President from 2002 to 2004. Executive Vice President of the Minnesota Wild Foundation from 2004 to 2008. Commissioner of Finance, State of Minnesota, from 1999 to 2002. Currently Board Chair of the Minnesota Wild Foundation since 2010. | N/A |
| Name and year of birth | Position held and length of service | Principal occupations during past five years or longer |
| Andrew Owen (Born 1960) | President, since 2017 | President, Chief Executive Officer and Director of Allspring Funds Management, LLC since 2017 and co-president of Galliard Capital Management, LLC, an affiliate of Allspring Funds Management, LLC, since 2019. Prior thereto, Head of Affiliated Managers, Allspring Global Investments, from 2014 to 2019 and Executive Vice President responsible for marketing, investments and product development for Allspring Funds Management, LLC, from 2009 to 2014. In addition, Mr. Owen was an Executive Vice President of Wells Fargo & Company from 2014 to 2021. |
| Jeremy DePalma (Born 1974) | Treasurer, since 2012 (for certain funds in the Fund Complex); since 2021 (for the remaining funds in the Fund Complex) | Senior Vice President of Allspring Funds Management, LLC since 2009. Senior Vice President of Evergreen Investment Management Company, LLC from 2008 to 2010 and head of the Fund Reporting and Control Team within Fund Administration from 2005 to 2010. |
| Kate McKinley (Born 1977) | Chief Legal Officer, since 2021 | Chief Legal Officer of Allspring Global Investments since 2021. Prior thereto, held various roles at State Street Global Advisors beginning in 2010, including serving as Senior Vice President and General Counsel from 2019 to 2021, and Chief Operating Officer of the Institutional Client Group from 2016 - 2019. Prior to working at State Street Global Advisors served as Assistant General Counsel for Bank of America Corporation from 2005 to 2010 and as an Associate at WilmerHale from 2002 to 2005. |
| Christopher Baker (Born 1976) | Chief Compliance Officer, since 2022 | Global Chief Compliance Officer for Allspring Global Investments since 2022. Prior thereto, Chief Compliance Officer for State Street Global Advisors from 2018 to 2021. Senior Compliance Officer for the State Street divisions of Alternative Investment Solutions, Sector Solutions, and Global Marketing from 2015 to 2018. From 2010 to 2015 Vice President, Global Head of Investment and Marketing Compliance for State Street Global Advisors. |
| Matthew Prasse (Born 1983) | Secretary, since 2021 | Senior Counsel of the Allspring Legal Department since 2021. Senior Counsel of the Wells Fargo Legal Department from 2018 to 2021. Previously, Counsel for Barings LLC from 2015 to 2018. Prior to joining Barings, Associate at Morgan, Lewis & Bockius LLP from 2008 to 2015. |
P.O. Box 219967
Kansas City, MO 64121-9967
1-800-222-8222. Read the prospectus carefully before you invest or send money.
ITEM 2. CODE OF ETHICS
(a) As of the end of the period covered by the report, Allspring Master Trust has adopted a code of ethics that applies to its President and Treasurer. A copy of the code of ethics is filed as an exhibit to this Form N-CSR.
(c) During the period covered by this report, there were no amendments to the provisions of the code of ethics adopted in Item 2(a) above.
(d) During the period covered by this report, there were no implicit or explicit waivers to the provisions of the code of ethics adopted in Item 2(a) above.
ITEM 3. AUDIT COMMITTEE FINANCIAL EXPERT
The Board of Trustees of Allspring Master Trust has determined that Isaiah Harris is an audit committee financial expert, as defined in Item 3 of Form N-CSR. Mr. Harris is independent for purposes of Item 3 of Form N-CSR.
ITEM 4. PRINCIPAL ACCOUNTANT FEES AND SERVICES
(a), (b), (c), (d) The following table presents aggregate fees billed in each of the last two fiscal years for services rendered to the Registrant by the Registrant’s principal accountant. These fees were billed to the registrant and were approved by the Registrant’s audit committee. | ||||
| Fiscal year ended February 28, 2022 | Fiscal year ended February 28, 2021 | |||||||
Audit fees | $ | 447,179 | $ | 438,160 | ||||
Audit-related fees | — | — | ||||||
Tax fees (1) | 78,570 | 83,100 | ||||||
All other fees | — | — | ||||||
|
|
|
| |||||
| $ | 525,749 | $ | 521,260 | |||||
|
|
|
| |||||
(1) Tax fees consist of fees for tax compliance, tax advice, tax planning and excise tax. |
| |||||||
(e) The Chair of the Audit Committees is authorized to pre-approve: (1) audit services for the mutual funds of Allspring Master Trust; (2) non-audit tax or compliance consulting or training services provided to the Funds by the independent auditors (“Auditors”) if the fees for any particular engagement are not anticipated to exceed $50,000; and (3) non-audit tax or compliance consulting or training services provided by the Auditors to a Fund’s investment adviser and its controlling entities (where pre-approval is required because the engagement relates directly to the operations and financial reporting of the Fund) if the fee to the Auditors for any particular engagement is not anticipated to exceed $50,000. For any such pre-approval sought from the Chair, Management shall prepare a brief description of the proposed services. If the Chair approves of such service, he or she shall sign the statement prepared by Management. Such written statement shall be presented to the full Committees at their next regularly scheduled meetings.
(f) Not applicable
(g) Not applicable
(h) Not applicable
ITEM 5. AUDIT COMMITTEE OF LISTED REGISTRANTS
Not applicable.
ITEM 6. INVESTMENTS
A Portfolio of Investments for each series of Allspring Master Trust is included as part of the report to shareholders filed under Item 1 of this Form.
ITEM 7. DISCLOSURE OF PROXY VOTING POLICIES AND PROCEDURES FOR CLOSED-END MANAGEMENT INVESTMENT COMPANIES
Not applicable.
ITEM 8. PORTFOLIO MANAGERS OF CLOSED-END MANAGEMENT INVESTMENT COMPANIES
Not applicable.
ITEM 9. PURCHASES OF EQUITY SECURITIES BY CLOSED-END MANAGEMENT INVESTMENT COMPANY AND AFFILIATED PURCHASERS
Not applicable.
ITEM 10. SUBMISSION OF MATTERS TO A VOTE OF SECURITY HOLDERS
There have been no material changes to the procedures by which shareholders may recommend nominees to the registrant’s Board of Trustees that have been implemented since the registrant’s last provided disclosure in response to the requirements of this Item.
ITEM 11. CONTROLS AND PROCEDURES
(a) The President and Treasurer have concluded that the Allspring Master Trust disclosure controls and procedures (as defined in Rule 30a-3(c) under the Investment Company Act of 1940) provide reasonable assurances that material information relating to the registrant is made known to them by the appropriate persons based on their evaluation of these controls and procedures as of a date within 90 days of the filing of this report.
(b) There were no significant changes in the registrant’s internal controls over financial reporting (as defined in Rule 30a-3(d) under the Investment Company Act of 1940) that occurred during the most recent fiscal half-year of the period covered by this report that materially affected, or is reasonably likely to materially affect, the registrant’s internal control over financial reporting.
ITEM 12. DISCLOSURES OF SECURITIES LENDING ACTIVITES FOR CLOSED-END MANAGEMENT INVESTMENT COMPANIES
Not applicable.
ITEM 13. EXHIBITS
| (a)(1) | Code of Ethics. | |
| (a)(2) | Certifications pursuant to Section 302 of the Sarbanes-Oxley Act of 2002. | |
| (b) | Certifications pursuant to Section 906 of the Sarbanes-Oxley Act of 2002. | |
SIGNATURES
Pursuant to the requirements of the Securities Exchange Act of 1934 and the Investment Company Act of 1940, the registrant has duly caused this report to be signed on its behalf by the undersigned, thereunto duly authorized.
| Allspring Master Trust | ||
| By: | /s/ Andrew Owen | |
| Andrew Owen | ||
| President | ||
| Date: April 28, 2022 | ||
Pursuant to the requirements of the Securities Exchange Act of 1934 and the Investment Company Act of 1940, this report has been signed below by the following persons on behalf of the registrant and in the capacities and on the date indicated.
| Allspring Master Trust | ||
| By: | /s/ Andrew Owen | |
| Andrew Owen | ||
| President | ||
| Date: April 28, 2022 | ||
| By: | /s/ Jeremy DePalma | |
| Jeremy DePalma | ||
| Treasurer | ||
| Date: April 28, 2022 | ||