UNITED STATES
SECURITIES AND EXCHANGE COMMISSION
Washington, D.C. 20549
FORM N-CSR
CERTIFIED SHAREHOLDER REPORT OF REGISTERED
MANAGEMENT INVESTMENT COMPANIES
Investment Company Act file number: 811-09689
Allspring Master Trust
(Exact name of registrant as specified in charter)
525 Market St., San Francisco, CA 94105
(Address of principal executive offices) (Zip code)
Matthew Prasse
Allspring Funds Management, LLC
525 Market St., San Francisco, CA 94105
(Name and address of agent for service)
Registrant’s telephone number, including area code: 800-222-8222
Date of fiscal year end: May 31
Registrant is making a filing for 12 of its series:
Allspring C&B Large Cap Value Portfolio, Allspring Emerging Growth Portfolio, Allspring Index Portfolio, Allspring Small Company Growth Portfolio, Allspring Small Company Value Portfolio, Allspring Core Bond Portfolio, Allspring Real Return Portfolio, Allspring Disciplined Large Cap Portfolio, Allspring Diversified Large Cap Growth Portfolio, Allspring Disciplined International Developed Markets Portfolio, Allspring Large Company Value Portfolio and Managed Fixed Income Portfolio
Date of reporting period: May 31, 2022
ITEM 1. REPORT TO STOCKHOLDERS
Annual Report
May 31, 2022
Allspring Diversified Large Cap
Growth Portfolio
Allspring Diversified Large Cap Growth Portfolio | 1
Notice to Shareholders
Russia launched a large-scale invasion of Ukraine on February 24, 2022. As a result of this military action, the United States and many other countries have instituted various economic sanctions against Russian and Belarus individuals and entities. The situation has led to increased financial market volatility and has had severe adverse effects on regional and global economic markets, including the markets for certain securities and commodities, such as oil and natural gas. The extent and duration of the military action, resulting sanctions imposed, other punitive action taken and the resulting market disruptions cannot be easily predicted.
Our solidarity and support goes out to our impacted employees and the people affected in Ukraine and their families. Allspring has a dedicated team of investment professionals actively monitoring the situation for any new developments and the potential impact to our clients and investment products. As the situation remains fluid, we are focused on the assessment of risks, valuation, and liquidity of impacted securities. Please visit our website at allspringglobal.com and click on “Russia-Ukraine Updates” for further information.
2 | Allspring Diversified Large Cap Growth Portfolio
This page is intentionally left blank.
Portfolio information (unaudited)
| Investment objective | The Portfolio seeks long-term capital appreciation. |
| Manager | Allspring Funds Management, LLC |
| Subadviser | Allspring Global Investments, LLC |
| Portfolio managers | John R. Campbell, CFA®‡, Vince Fioramonti, CFA®‡, Robert Gruendyke, CFA®#, CPA, Thomas C. Ognar, CFA®‡ |
| Ten largest holdings (%) as of May 31, 20221 |
| Microsoft Corporation | 9.25 |
| Apple Incorporated | 5.21 |
| Amazon.com Incorporated | 4.91 |
| Alphabet Incorporated Class A | 4.16 |
| MasterCard Incorporated Class A | 3.18 |
| Alphabet Incorporated Class C | 2.59 |
| NVIDIA Corporation | 1.75 |
| Qualcomm Incorporated | 1.46 |
| Copart Incorporated | 1.46 |
| The Charles Schwab Corporation | 1.21 |
| 1 | Figures represent the percentage of the Portfolio's net assets. Holdings are subject to change and may have changed since the date specified. |
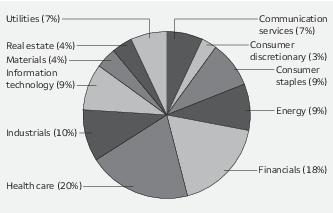
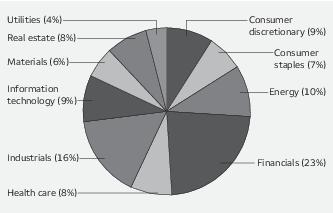
| Sector allocation as of May 31, 20221 |
| 1 | Figures represent the percentage of the Portfolio's long-term investments. These amounts are subject to change and may have changed since the date specified. |
| ‡ | CFA® and Chartered Financial Analyst® are trademarks owned by CFA Institute. |
| # | Mr. Gruendyke became a portfolio manager of the Portfolio on December 6, 2021. |
4 | Allspring Diversified Large Cap Growth Portfolio
Portfolio of investments—May 31, 2022
| | | | | Shares | Value |
| Common stocks: 96.51% | | | | | |
| Communication services: 8.98% | | | | | |
| Entertainment: 1.37% | | | | | |
| Activision Blizzard Incorporated | | | | 16,054 | $ 1,250,286 |
| Live Nation Entertainment Incorporated † | | | | 8,943 | 850,032 |
| Warner Bros. Discovery Incorporated † | | | | 30,950 | 571,028 |
| | | | | | 2,671,346 |
| Interactive media & services: 7.61% | | | | | |
| Alphabet Incorporated Class A † | | | | 3,574 | 8,131,708 |
| Alphabet Incorporated Class C † | | | | 2,225 | 5,074,736 |
| Meta Platforms Incorporated Class A † | | | | 4,944 | 957,356 |
| ZoomInfo Technologies Incorporated † | | | | 18,137 | 732,553 |
| | | | | | 14,896,353 |
| Consumer discretionary: 14.60% | | | | | |
| Hotels, restaurants & leisure: 2.12% | | | | | |
| Airbnb Incorporated Class A † | | | | 14,491 | 1,751,527 |
| Chipotle Mexican Grill Incorporated † | | | | 1,256 | 1,761,603 |
| Hilton Worldwide Holdings Incorporated | | | | 3,072 | 432,722 |
| Starbucks Corporation | | | | 2,462 | 193,267 |
| | | | | | 4,139,119 |
| Household durables: 1.11% | | | | | |
| Lennar Corporation Class A | | | | 13,615 | 1,092,604 |
| PulteGroup Incorporated | | | | 23,865 | 1,080,130 |
| | | | | | 2,172,734 |
| Internet & direct marketing retail: 4.91% | | | | | |
| Amazon.com Incorporated † | | | | 3,998 | 9,611,952 |
| Leisure products: 0.44% | | | | | |
| The Brunswick Corporation | | | | 11,527 | 867,176 |
| Multiline retail: 0.48% | | | | | |
| Target Corporation | | | | 5,832 | 944,084 |
| Specialty retail: 3.74% | | | | | |
| Five Below Incorporated † | | | | 2,182 | 284,947 |
| Floor & Decor Holdings Incorporated Class A † | | | | 16,263 | 1,226,881 |
| O'Reilly Automotive Incorporated † | | | | 2,203 | 1,403,686 |
| Petco Health & Wellness Company †« | | | | 6,604 | 105,400 |
| The Home Depot Incorporated | | | | 1,143 | 346,043 |
| The TJX Companies Incorporated | | | | 30,121 | 1,914,792 |
| Tractor Supply Company | | | | 2,438 | 456,784 |
| Ulta Beauty Incorporated † | | | | 3,746 | 1,584,933 |
| | | | | | 7,323,466 |
| Textiles, apparel & luxury goods: 1.80% | | | | | |
| Deckers Outdoor Corporation † | | | | 3,399 | 912,835 |
| lululemon athletica Incorporated † | | | | 5,840 | 1,709,310 |
| Nike Incorporated Class B | | | | 7,526 | 894,465 |
| | | | | | 3,516,610 |
The accompanying notes are an integral part of these financial statements.
Allspring Diversified Large Cap Growth Portfolio | 5
Portfolio of investments—May 31, 2022
| | | | | Shares | Value |
| Consumer staples: 1.19% | | | | | |
| Food & staples retailing: 1.09% | | | | | |
| Costco Wholesale Corporation | | | | 4,578 | $ 2,134,355 |
| Personal products: 0.10% | | | | | |
| The Estee Lauder Companies Incorporated Class A | | | | 749 | 190,733 |
| Energy: 2.76% | | | | | |
| Oil, gas & consumable fuels: 2.76% | | | | | |
| Chevron Corporation | | | | 8,673 | 1,514,826 |
| ConocoPhillips | | | | 16,750 | 1,882,030 |
| Devon Energy Corporation | | | | 26,760 | 2,004,324 |
| | | | | | 5,401,180 |
| Financials: 9.74% | | | | | |
| Banks: 1.83% | | | | | |
| Citigroup Incorporated | | | | 19,768 | 1,055,809 |
| Citizens Financial Group Incorporated | | | | 27,940 | 1,156,157 |
| JPMorgan Chase & Company | | | | 10,413 | 1,376,911 |
| | | | | | 3,588,877 |
| Capital markets: 7.27% | | | | | |
| BlackRock Incorporated | | | | 2,166 | 1,449,227 |
| CME Group Incorporated | | | | 1,726 | 343,181 |
| Evercore Partners Incorporated Class A | | | | 9,732 | 1,111,394 |
| Intercontinental Exchange Incorporated | | | | 3,091 | 316,487 |
| LPL Financial Holdings Incorporated | | | | 8,111 | 1,591,297 |
| MarketAxess Holdings Incorporated | | | | 4,381 | 1,234,040 |
| MSCI Incorporated | | | | 2,044 | 904,163 |
| Stifel Financial Corporation�� | | | | 7,101 | 455,671 |
| The Charles Schwab Corporation | | | | 33,695 | 2,362,020 |
| The Goldman Sachs Group Incorporated | | | | 3,855 | 1,260,007 |
| Tradeweb Markets Incorporated Class A | | | | 30,825 | 2,084,078 |
| VIRTU Financial Incorporated Class A | | | | 42,235 | 1,103,601 |
| | | | | | 14,215,166 |
| Insurance: 0.64% | | | | | |
| Fidelity National Financial Incorporated | | | | 29,707 | 1,256,606 |
| Health care: 14.87% | | | | | |
| Biotechnology: 3.77% | | | | | |
| AbbVie Incorporated | | | | 8,050 | 1,186,329 |
| Alnylam Pharmaceuticals Incorporated † | | | | 2,600 | 327,080 |
| Biohaven Pharmaceutical Holding Company † | | | | 4,742 | 681,568 |
| Horizon Therapeutics plc † | | | | 14,717 | 1,319,968 |
| Regeneron Pharmaceuticals Incorporated † | | | | 1,806 | 1,200,520 |
| Seagen Incorporated † | | | | 3,201 | 434,312 |
| United Therapeutics Corporation † | | | | 6,144 | 1,415,209 |
| Vertex Pharmaceuticals Incorporated † | | | | 3,010 | 808,637 |
| | | | | | 7,373,623 |
| Health care equipment & supplies: 3.87% | | | | | |
| Abbott Laboratories | | | | 10,552 | 1,239,438 |
| Boston Scientific Corporation † | | | | 30,533 | 1,252,158 |
The accompanying notes are an integral part of these financial statements.
6 | Allspring Diversified Large Cap Growth Portfolio
Portfolio of investments—May 31, 2022
| | | | | Shares | Value |
| Health care equipment & supplies (continued) | | | | | |
| Edwards Lifesciences Corporation † | | | | 22,529 | $ 2,272,050 |
| Hologic Incorporated † | | | | 13,746 | 1,034,661 |
| Insulet Corporation † | | | | 2,668 | 569,565 |
| Intuitive Surgical Incorporated † | | | | 1,096 | 249,493 |
| Stryker Corporation | | | | 4,066 | 953,477 |
| | | | | | 7,570,842 |
| Health care providers & services: 3.19% | | | | | |
| Amedisys Incorporated † | | | | 2,343 | 271,577 |
| Anthem Incorporated | | | | 3,280 | 1,671,521 |
| CVS Health Corporation | | | | 14,557 | 1,408,390 |
| Laboratory Corporation of America Holdings | | | | 4,826 | 1,190,671 |
| UnitedHealth Group Incorporated | | | | 3,435 | 1,706,439 |
| | | | | | 6,248,598 |
| Health care technology: 0.26% | | | | | |
| Veeva Systems Incorporated Class A † | | | | 2,988 | 508,737 |
| Life sciences tools & services: 1.45% | | | | | |
| Agilent Technologies Incorporated | | | | 7,103 | 906,059 |
| Bio-Techne Corporation | | | | 2,333 | 862,580 |
| Repligen Corporation † | | | | 5,280 | 868,402 |
| Thermo Fisher Scientific Incorporated | | | | 368 | 208,866 |
| | | | | | 2,845,907 |
| Pharmaceuticals: 2.33% | | | | | |
| Bristol-Myers Squibb Company | | | | 15,127 | 1,141,332 |
| Pfizer Incorporated | | | | 29,744 | 1,577,622 |
| Royalty Pharma plc Class A | | | | 11,640 | 478,870 |
| Zoetis Incorporated | | | | 7,903 | 1,350,860 |
| | | | | | 4,548,684 |
| Industrials: 7.85% | | | | | |
| Aerospace & defense: 0.44% | | | | | |
| HEICO Corporation | | | | 6,033 | 863,021 |
| Air freight & logistics: 0.61% | | | | | |
| United Parcel Service Incorporated Class B | | | | 6,576 | 1,198,476 |
| Building products: 1.82% | | | | | |
| Advanced Drainage Systems Incorporated | | | | 7,547 | 826,472 |
| Johnson Controls International plc | | | | 28,958 | 1,578,501 |
| Masco Corporation | | | | 20,292 | 1,150,353 |
| | | | | | 3,555,326 |
| Commercial services & supplies: 1.46% | | | | | |
| Copart Incorporated † | | | | 24,998 | 2,863,021 |
| Construction & engineering: 0.61% | | | | | |
| EMCOR Group Incorporated | | | | 11,281 | 1,191,612 |
The accompanying notes are an integral part of these financial statements.
Allspring Diversified Large Cap Growth Portfolio | 7
Portfolio of investments—May 31, 2022
| | | | | Shares | Value |
| Electrical equipment: 0.82% | | | | | |
| Generac Holdings Incorporated † | | | | 5,858 | $ 1,447,395 |
| Rockwell Automation Incorporated | | | | 695 | 148,174 |
| | | | | | 1,595,569 |
| Machinery: 0.83% | | | | | |
| AGCO Corporation | | | | 10,488 | 1,343,827 |
| Deere & Company | | | | 801 | 286,582 |
| | | | | | 1,630,409 |
| Road & rail: 1.26% | | | | | |
| CSX Corporation | | | | 9,902 | 314,785 |
| J.B. Hunt Transport Services Incorporated | | | | 10,025 | 1,730,115 |
| Union Pacific Corporation | | | | 1,882 | 413,626 |
| | | | | | 2,458,526 |
| Information technology: 32.49% | | | | | |
| Communications equipment: 0.24% | | | | | |
| Arista Networks Incorporated † | | | | 4,506 | 460,874 |
| Electronic equipment, instruments & components: 0.39% | | | | | |
| Zebra Technologies Corporation Class A † | | | | 2,278 | 770,397 |
| IT services: 4.35% | | | | | |
| Cognizant Technology Solutions Corporation Class A | | | | 14,305 | 1,068,584 |
| MasterCard Incorporated Class A | | | | 17,390 | 6,223,359 |
| MongoDB Incorporated † | | | | 924 | 219,127 |
| Square Incorporated Class A † | | | | 1,632 | 142,816 |
| Visa Incorporated Class A | | | | 4,053 | 859,925 |
| | | | | | 8,513,811 |
| Semiconductors & semiconductor equipment: 8.56% | | | | | |
| Advanced Micro Devices Incorporated † | | | | 11,625 | 1,184,123 |
| Allegro MicroSystems Incorporated † | | | | 17,237 | 443,853 |
| Applied Materials Incorporated | | | | 10,272 | 1,204,803 |
| Broadcom Incorporated | | | | 2,469 | 1,432,341 |
| Enphase Energy Incorporated † | | | | 6,537 | 1,217,124 |
| Marvell Technology Incorporated | | | | 2,894 | 171,180 |
| Microchip Technology Incorporated | | | | 30,569 | 2,220,838 |
| Monolithic Power Systems Incorporated | | | | 2,535 | 1,141,739 |
| NVIDIA Corporation | | | | 18,312 | 3,419,217 |
| NXP Semiconductors NV | | | | 3,001 | 569,470 |
| Qorvo Incorporated † | | | | 7,976 | 891,318 |
| Qualcomm Incorporated | | | | 20,000 | 2,864,400 |
| | | | | | 16,760,406 |
| Software: 13.74% | | | | | |
| Adobe Incorporated † | | | | 2,619 | 1,090,761 |
| Atlassian Corporation plc Class A † | | | | 1,731 | 306,941 |
| Autodesk Incorporated † | | | | 469 | 97,435 |
| Avalara Incorporated † | | | | 3,860 | 326,826 |
| Crowdstrike Holdings Incorporated Class A † | | | | 6,669 | 1,066,973 |
| Dynatrace Incorporated † | | | | 30,754 | 1,158,503 |
| Fair Isaac Corporation † | | | | 379 | 155,219 |
| Fortinet Incorporated † | | | | 4,248 | 1,249,507 |
The accompanying notes are an integral part of these financial statements.
8 | Allspring Diversified Large Cap Growth Portfolio
Portfolio of investments—May 31, 2022
| | | | | Shares | Value |
| Software (continued) | | | | | |
| Microsoft Corporation | | | | 66,592 | $ 18,104,356 |
| Oracle Corporation | | | | 15,148 | 1,089,444 |
| Salesforce.com Incorporated † | | | | 700 | 112,168 |
| ServiceNow Incorporated † | | | | 4,296 | 2,008,251 |
| Unity Software Incorporated † | | | | 3,192 | 127,584 |
| | | | | | 26,893,968 |
| Technology hardware, storage & peripherals: 5.21% | | | | | |
| Apple Incorporated | | | | 68,455 | 10,188,843 |
| Materials: 2.67% | | | | | |
| Chemicals: 1.10% | | | | | |
| Linde plc | | | | 6,647 | 2,158,148 |
| Metals & mining: 1.57% | | | | | |
| Nucor Corporation | | | | 11,035 | 1,461,696 |
| Reliance Steel & Aluminum Company | | | | 8,214 | 1,596,802 |
| | | | | | 3,058,498 |
| Real estate: 1.36% | | | | | |
| Equity REITs: 1.19% | | | | | |
| Equinix Incorporated | | | | 137 | 94,131 |
| SBA Communications Corporation | | | | 2,005 | 674,903 |
| Weyerhaeuser Company | | | | 39,411 | 1,557,523 |
| | | | | | 2,326,557 |
| Real estate management & development: 0.17% | | | | | |
| CBRE Group Incorporated Class A † | | | | 4,095 | 339,230 |
| Total Common stocks (Cost $124,793,555) | | | | | 188,852,840 |
| | | Yield | | | |
| Short-term investments: 3.54% | | | | | |
| Investment companies: 3.54% | | | | | |
| Allspring Government Money Market Fund Select Class ♠∞ | | 0.65% | | 6,825,985 | 6,825,985 |
| Securities Lending Cash Investments LLC ♠∩∞ | | 0.91 | | 100,300 | 100,300 |
| Total Short-term investments (Cost $6,926,285) | | | | | 6,926,285 |
| Total investments in securities (Cost $131,719,840) | 100.05% | | | | 195,779,125 |
| Other assets and liabilities, net | (0.05) | | | | (89,545) |
| Total net assets | 100.00% | | | | $195,689,580 |
| † | Non-income-earning security |
| « | All or a portion of this security is on loan. |
| ♠ | The issuer of the security is an affiliated person of the Portfolio as defined in the Investment Company Act of 1940. |
| ∩ | The investment is a non-registered investment company purchased with cash collateral received from securities on loan. |
| ∞ | The rate represents the 7-day annualized yield at period end. |
| Abbreviations: |
| REIT | Real estate investment trust |
The accompanying notes are an integral part of these financial statements.
Allspring Diversified Large Cap Growth Portfolio | 9
Portfolio of investments—May 31, 2022
Investments in affiliates
An affiliated investment is an investment in which the Portfolio owns at least 5% of the outstanding voting shares of the issuer or as a result of other relationships, such as the Portfolio and the issuer having the same adviser or investment manager. Transactions with issuers that were affiliates of the Portfolio at the end of the period were as follows:
| | Value,
beginning of
period | Purchases | Sales
proceeds | Net
realized
gains
(losses) | | Net
change in
unrealized
gains
(losses) | | Value,
end of
period | Shares,
end
of period | Income
from
affiliated
securities |
| Short-term investments | | | | | | | | | |
| Allspring Government Money Market Fund Select Class | $1,367,980 | $46,880,343 | $(41,422,338) | $0 | | $0 | | $ 6,825,985 | 6,825,985 | $ 5,113 |
| Securities Lending Cash Investments LLC | 1,198,950 | 6,733,345 | (7,831,995) | 0 | | 0 | | 100,300 | 100,300 | 649 # |
| | | | | $0 | | $0 | | $6,926,285 | | $5,762 |
| # | Amount shown represents income before fees and rebates. |
The accompanying notes are an integral part of these financial statements.
10 | Allspring Diversified Large Cap Growth Portfolio
Statement of assets and liabilities—May 31, 2022
| | |
| Assets | |
Investments in unaffiliated securities (including $97,114 of securities loaned), at value (cost $124,793,555)
| $ 188,852,840 |
Investments in affiliated securities, at value (cost $6,926,285)
| 6,926,285 |
Receivable for dividends
| 236,138 |
Receivable for investments sold
| 230,033 |
Receivable for securities lending income, net
| 31 |
Total assets
| 196,245,327 |
| Liabilities | |
Payable for investments purchased
| 325,845 |
Payable upon receipt of securities loaned
| 100,300 |
Advisory fee payable
| 84,988 |
Trustees’ fees and expenses payable
| 1,943 |
Accrued expenses and other liabilities
| 42,671 |
Total liabilities
| 555,747 |
Total net assets
| $195,689,580 |
The accompanying notes are an integral part of these financial statements.
Allspring Diversified Large Cap Growth Portfolio | 11
Statement of operations—year ended May 31, 2022
| | |
| Investment income | |
Dividends (net of foreign withholdings taxes of $4,005)
| $ 1,777,856 |
Income from affiliated securities
| 9,712 |
Total investment income
| 1,787,568 |
| Expenses | |
Advisory fee
| 1,601,531 |
Custody and accounting fees
| 39,034 |
Professional fees
| 48,563 |
Interest holder report expenses
| 10,438 |
Trustees’ fees and expenses
| 19,821 |
Interest expense
| 1,073 |
Other fees and expenses
| 5,281 |
Total expenses
| 1,725,741 |
Less: Fee waivers and/or expense reimbursements
| (246,331) |
Net expenses
| 1,479,410 |
Net investment income
| 308,158 |
| Realized and unrealized gains (losses) on investments | |
| Net realized gains (losses) on | |
Unaffiliated securities
| 35,268,787 |
Futures contracts
| (22,501) |
Net realized gains on investments
| 35,246,286 |
Net change in unrealized gains (losses) on investments
| (57,276,470) |
Net realized and unrealized gains (losses) on investments
| (22,030,184) |
Net decrease in net assets resulting from operations
| $(21,722,026) |
The accompanying notes are an integral part of these financial statements.
12 | Allspring Diversified Large Cap Growth Portfolio
Statement of changes in net assets
| | | |
| | Year ended
May 31, 2022 | Year ended
May 31, 2021 |
| Operations | | |
Net investment income
| $ 308,158 | $ 354,603 |
Net realized gains on investments
| 35,246,286 | 30,420,160 |
Net change in unrealized gains (losses) on investments
| (57,276,470) | 42,384,795 |
Net increase (decrease) in net assets resulting from operations
| (21,722,026) | 73,159,558 |
| Capital transactions | | |
| Transactions in investors’ beneficial interests | | |
Contributions
| 4,492,383 | 41,984,976 |
Withdrawals
| (72,417,721) | (56,173,469) |
Net decrease in net assets resulting from capital transactions
| (67,925,338) | (14,188,493) |
Total increase (decrease) in net assets
| (89,647,364) | 58,971,065 |
| Net assets | | |
Beginning of period
| 285,336,944 | 226,365,879 |
End of period
| $195,689,580 | $285,336,944 |
The accompanying notes are an integral part of these financial statements.
Allspring Diversified Large Cap Growth Portfolio | 13
| | Year ended May 31 |
| | 2022 | 2021 | 2020 | 2019 | 2018 |
Total return
| (11.89)% | 35.78% | 16.10% | 3.79% | 24.12% |
| Ratios to average net assets (annualized) | | | | | |
Gross expenses
| 0.70% | 0.70% | 0.71% | 0.70% | 0.80% |
Net expenses1
| 0.60% | 0.60% | 0.62% | 0.62% | 0.62% |
Net investment income
| 0.13% | 0.14% | 0.46% | 0.68% | 0.53% |
| Supplemental data | | | | | |
Portfolio turnover rate
| 45% | 58% | 43% | 100% | 37% |
| 1 | Net expense ratios reflect voluntary waivers. |
The accompanying notes are an integral part of these financial statements.
14 | Allspring Diversified Large Cap Growth Portfolio
Notes to financial statements
1. ORGANIZATION
Allspring Master Trust (the "Trust"), a Delaware statutory trust organized on March 10, 1999, is an open-end management investment company registered under the Investment Company Act of 1940, as amended (the "1940 Act"). As an investment company, the Trust follows the accounting and reporting guidance in Financial Accounting Standards Board ("FASB") Accounting Standards Codification Topic 946, Financial Services – Investment Companies. These financial statements report on the Allspring Diversified Large Cap Growth Portfolio (the "Portfolio") which is a diversified series of the Trust.
Interests in the Portfolio are available solely through private placement transactions that do not involve any "public offering" within the meaning of Section 4(a)(2) of the Securities Act of 1933.
Effective on November 1, 2021, the sale transaction of Wells Fargo Asset Management ("WFAM") by Wells Fargo & Company to GTCR LLC and Reverence Capital Partners, L.P. was closed. In connection with the closing of the transaction, WFAM became known as Allspring Global Investments (“Allspring”) and various entities that provided services to the Portfolio changed their names to "Allspring", including Allspring Funds Management, LLC, the adviser to the Portfolio, Allspring Global Investments, LLC and Allspring Global Investments (UK) Limited, both registered investment advisers providing subadvisory services to certain funds, and Allspring Funds Distributor, LLC. Consummation of the transaction resulted in a new advisory agreement and subadvisory agreement which became effective on November 1, 2021.
2. SIGNIFICANT ACCOUNTING POLICIES
The following significant accounting policies, which are consistently followed in the preparation of the financial statements of the Portfolio, are in conformity with U.S. generally accepted accounting principles which require management to make estimates and assumptions that affect the reported amounts of assets and liabilities, disclosure of contingent assets and liabilities at the date of the financial statements, and the reported amounts of income and expenses during the reporting period. Actual results could differ from those estimates.
Securities valuation
All investments are valued each business day as of the close of regular trading on the New York Stock Exchange (generally 4 p.m. Eastern Time), although the Portfolio may deviate from this calculation time under unusual or unexpected circumstances.
Equity securities and futures contracts that are listed on a foreign or domestic exchange or market are valued at the official closing price or, if none, the last sales price.
Investments in registered open-end investment companies are valued at net asset value. Interests in non-registered investment companies that are redeemable at net asset value are fair valued normally at net asset value.
Investments which are not valued using any of the methods discussed above are valued at their fair value, as determined in good faith by the Board of Trustees. The Board of Trustees has established a Valuation Committee comprised of the Trustees and has delegated to it the authority to take any actions regarding the valuation of portfolio securities that the Valuation Committee deems necessary or appropriate, including determining the fair value of portfolio securities, unless the determination has been delegated to the Allspring Global Investments Pricing Committee at Allspring Funds Management, LLC ("Allspring Funds Management"). The Board of Trustees retains the authority to make or ratify any valuation decisions or approve any changes to the Valuation Procedures as it deems appropriate. On a quarterly basis, the Board of Trustees receives reports on any valuation actions taken by the Valuation Committee or the Allspring Global Investments Pricing Committee which may include items for ratification.
Foreign currency translation
The accounting records of the Portfolio are maintained in U.S. dollars. The values of other assets and liabilities denominated in foreign currencies are translated into U.S. dollars at rates provided by an independent foreign currency pricing source at a time each business day specified by the Allspring Global Investments Pricing Committee. Purchases and sales of securities, and income and expenses are converted at the rate of exchange on the respective dates of such transactions. Net realized foreign exchange gains or losses arise from sales of foreign currencies, currency gains or losses realized between the trade and settlement dates on securities transactions, and the difference between the amounts of dividends, interest and foreign withholding taxes recorded and the U.S. dollar equivalent of the amounts actually paid or received. Net unrealized foreign exchange gains and losses arise from changes in the fair value of assets and liabilities other than investments in securities resulting from changes in exchange rates. The changes in net assets arising from changes in exchange rates of securities and the changes in net assets resulting from changes in market prices of securities are not separately presented. Such changes are included in net realized and unrealized gains or losses from investments.
Allspring Diversified Large Cap Growth Portfolio | 15
Notes to financial statements
Securities lending
The Portfolio may lend its securities from time to time in order to earn additional income in the form of fees or interest on securities received as collateral or the investment of any cash received as collateral. When securities are on loan, the Portfolio receives interest or dividends on those securities. Cash collateral received in connection with its securities lending transactions is invested in Securities Lending Cash Investments, LLC (the "Securities Lending Fund"), an affiliated non-registered investment company. Investments in Securities Lending Fund are valued at the evaluated bid price provided by an independent pricing service. Income earned from investment in the Securities Lending Fund (net of fees and rebates), if any, is included in income from affiliated securities on the Statement of Operations.
In a securities lending transaction, the net asset value of the Portfolio is affected by an increase or decrease in the value of the securities loaned and by an increase or decrease in the value of the instrument in which collateral is invested. The amount of securities lending activity undertaken by the Portfolio fluctuates from time to time. The Portfolio has the right under the lending agreement to recover the securities from the borrower on demand. In the event of default or bankruptcy by the borrower, the Portfolio may be prevented from recovering the loaned securities or gaining access to the collateral or may experience delays or costs in doing so. In such an event, the terms of the agreement allow the unaffiliated securities lending agent to use the collateral to purchase replacement securities on behalf of the Portfolio or pay the Portfolio the market value of the loaned securities. The Portfolio bears the risk of loss with respect to depreciation of its investment of the cash collateral.
Futures contracts
Futures contracts are agreements between the Portfolio and a counterparty to buy or sell a specific amount of a commodity, financial instrument or currency at a specified price on a specified date. The Portfolio may buy and sell futures contracts in order to gain exposure to, or protect against, changes in security values and is subject to equity price risk. The primary risks associated with the use of futures contracts are the imperfect correlation between changes in market values of securities held by the Portfolio and the prices of futures contracts, and the possibility of an illiquid market. Futures contracts are generally entered into on a regulated futures exchange and cleared through a clearinghouse associated with the exchange. With futures contracts, there is minimal counterparty risk to the Portfolio since futures contracts are exchange traded and the exchange’s clearinghouse, as the counterparty to all exchange traded futures, guarantees the futures contracts against default.
Upon entering into a futures contract, the Portfolio is required to deposit either cash or securities (initial margin) with the broker in an amount equal to a certain percentage of the contract value. Subsequent payments (variation margin) are paid to or from the broker each day equal to the daily changes in the contract value. Such payments are recorded as unrealized gains or losses and, if any, shown as variation margin receivable (payable) in the Statement of Assets and Liabilities. Should the Portfolio fail to make requested variation margin payments, the broker can gain access to the initial margin to satisfy the Portfolio’s payment obligations. When the contracts are closed, a realized gain or loss is recorded in the Statement of Operations.
Security transactions and income recognition
Securities transactions are recorded on a trade date basis. Realized gains or losses are recorded on the basis of identified cost.
Dividend income is recognized on the ex-dividend date. Dividend income is recorded net of foreign taxes withheld where recovery of such taxes is not assured.
Federal and other taxes
The Portfolio is not required to pay federal income taxes on its net investment income and net capital gains as it is treated as a partnership for federal income tax purposes. All income, gains and losses of the Portfolio are deemed to have been “passed through” to the interest holders in proportion to their holdings of the Portfolio regardless of whether income and gains have been distributed by the Portfolio.
The Portfolio’s income tax returns and all financial records supporting those returns for the prior three fiscal years are subject to examination by the federal revenue authority. Management has analyzed the Portfolio’s tax positions taken on federal, state, and foreign tax returns, as applicable, for all open tax years and does not believe that there are any uncertain tax positions that require recognition of a tax liability.
As of May 31, 2022, the aggregate cost of all investments for federal income tax purposes was $133,306,280 and the unrealized gains (losses) consisted of:
| Gross unrealized gains | $71,700,617 |
| Gross unrealized losses | (9,227,772) |
| Net unrealized gains | $62,472,845 |
16 | Allspring Diversified Large Cap Growth Portfolio
Notes to financial statements
3. FAIR VALUATION MEASUREMENTS
Fair value measurements of investments are determined within a framework that has established a fair value hierarchy based upon the various data inputs utilized in determining the value of the Portfolio’s investments. The three-level hierarchy gives the highest priority to unadjusted quoted prices in active markets for identical assets or liabilities (Level 1) and the lowest priority to unobservable inputs (Level 3). The Portfolio’s investments are classified within the fair value hierarchy based on the lowest level of input that is significant to the fair value measurement. The inputs are summarized into three broad levels as follows:
| ■ | Level 1 – quoted prices in active markets for identical securities |
| ■ | Level 2 – other significant observable inputs (including quoted prices for similar securities, interest rates, prepayment speeds, credit risk, etc.) |
| ■ | Level 3 – significant unobservable inputs (including the Portfolio’s own assumptions in determining the fair value of investments) |
The inputs or methodologies used for valuing investments in securities are not necessarily an indication of the risk associated with investing in those securities.
The following is a summary of the inputs used in valuing the Portfolio’s assets and liabilities as of May 31, 2022:
| | Quoted prices
(Level 1) | Other significant
observable inputs
(Level 2) | Significant
unobservable inputs
(Level 3) | Total |
| Assets | | | | |
| Investments in: | | | | |
| Common stocks | | | | |
| Communication services | $ 17,567,699 | $0 | $0 | $ 17,567,699 |
| Consumer discretionary | 28,575,141 | 0 | 0 | 28,575,141 |
| Consumer staples | 2,325,088 | 0 | 0 | 2,325,088 |
| Energy | 5,401,180 | 0 | 0 | 5,401,180 |
| Financials | 19,060,649 | 0 | 0 | 19,060,649 |
| Health care | 29,096,391 | 0 | 0 | 29,096,391 |
| Industrials | 15,355,960 | 0 | 0 | 15,355,960 |
| Information technology | 63,588,299 | 0 | 0 | 63,588,299 |
| Materials | 5,216,646 | 0 | 0 | 5,216,646 |
| Real estate | 2,665,787 | 0 | 0 | 2,665,787 |
| Short-term investments | | | | |
| Investment companies | 6,926,285 | 0 | 0 | 6,926,285 |
| Total assets | $195,779,125 | $0 | $0 | $195,779,125 |
Additional sector, industry or geographic detail, if any, is included in the Portfolio of Investments.
For the year ended May 31, 2022, the Portfolio did not have any transfers into/out of Level 3.
4. TRANSACTIONS WITH AFFILIATES
Advisory fee
The Trust has entered into an advisory contract with Allspring Funds Management, a wholly owned subsidiary of Allspring Global Investments Holdings, LLC, a holding company indirectly owned by certain private funds of GTCR LLC and Reverence Capital Partners, L.P. The adviser is responsible for implementing investment policies and guidelines and for supervising the subadviser, who is responsible for day-to-day portfolio management of the Portfolio. Pursuant to the contract, Allspring Funds Management is entitled to receive an advisory fee at the following annual rate based on the Portfolio’s average daily net assets:
Allspring Diversified Large Cap Growth Portfolio | 17
Notes to financial statements
| Average daily net assets | Advisory fee |
| First $500 million | 0.650% |
| Next $500 million | 0.625 |
| Next $1 billion | 0.600 |
| Next $2 billion | 0.575 |
| Next $4 billion | 0.550 |
| Next $4 billion | 0.525 |
| Next $4 billion | 0.500 |
| Over $16 billion | 0.475 |
For the year ended May 31, 2022, the advisory fee was equivalent to an annual rate of 0.65% of the Portfolio’s average daily net assets.
Allspring Funds Management has retained the services of a subadviser to provide daily portfolio management to the Portfolio. The fee for subadvisory services is borne by Allspring Funds Management. Allspring Global Investments, LLC ("Allspring Investments"), an affiliate of Allspring Funds Management and a wholly owned subsidiary of Allspring Global Investments Holdings, LLC, is the subadviser to the Portfolio and is entitled to receive a fee from Allspring Funds Management at an annual rate starting at 0.35% and declining to 0.30% as the average daily net assets of the asset sleeve managed by the Golden Capital team increase and an annual rate starting at 0.30% and declining to 0.20% as the average daily net assets of all other asset sleeves increase.
Allspring Funds Management has voluntarily waived and/or reimbursed advisory fees to reduce the net operating expense ratio of the Portfolio. These voluntary waivers may be discontinued at any time.
Interfund transactions
The Portfolio may purchase or sell portfolio investment securities to certain affiliates pursuant to Rule 17a-7 under the 1940 Act and under procedures adopted by the Board of Trustees. The procedures have been designed to ensure that these interfund transactions, which do not incur broker commissions, are effected at current market prices.
5. INVESTMENT PORTFOLIO TRANSACTIONS
Purchases and sales of investments, excluding U.S. government obligations (if any) and short-term securities, for the year ended May 31, 2022 were $109,331,130 and $181,961,176, respectively.
6. SECURITIES LENDING TRANSACTIONS
The Portfolio lends its securities through an unaffiliated securities lending agent and receives collateral in the form of cash or securities with a value at least equal to the value of the securities on loan. The value of the loaned securities is determined at the close of each business day and any increases or decreases in the required collateral are exchanged between the Portfolio and the counterparty on the next business day. Cash collateral received is invested in the Securities Lending Fund which seeks to provide a positive return compared to the daily Federal Funds Open Rate by investing in high-quality, U.S. dollar-denominated short-term money market instruments and is exempt from registration under Section 3(c)(7) of the 1940 Act. Securities Lending Fund is managed by Allspring Funds Management and is subadvised by Allspring Investments. Allspring Funds Management receives an advisory fee starting at 0.05% and declining to 0.01% as the average daily net assets of the Securities Lending Fund increase. All of the fees received by Allspring Funds Management are paid to Allspring Investments for its services as subadviser.
In the event of counterparty default or the failure of a borrower to return a loaned security, the Portfolio has the right to use the collateral to offset any losses incurred. As of May 31, 2022, the Portfolio had securities lending transactions with the following counterparties which are subject to offset:
| Counterparty | Value of
securities on
loan | Collateral
received1 | Net amount |
| Bank of America Securities Incorporated | $97,114 | $(97,114) | $0 |
1 Collateral received within this table is limited to the collateral for the net transaction with the counterparty.
18 | Allspring Diversified Large Cap Growth Portfolio
Notes to financial statements
7. DERIVATIVE TRANSACTIONS
During the year ended May 31, 2022, the Portfolio entered into futures contracts to gain market exposure. The Portfolio had an average notional amount of $11,300 in long futures contracts during the year ended May 31, 2022.
The fair value, realized gains or losses and change in unrealized gains or losses, if any, on derivative instruments are reflected in the corresponding financial statement captions.
8. BANK BORROWINGS
The Trust, along with Allspring Variable Trust and Allspring Funds Trust (excluding the money market funds), are parties to a $350,000,000 revolving credit agreement whereby the Portfolio is permitted to use bank borrowings for temporary or emergency purposes, such as to fund interest holders withdrawal requests. Interest under the credit agreement is charged to the Portfolio based on a borrowing rate equal to the higher of the Federal Funds rate in effect on that day plus 1.25% or the overnight bank funding rate in effect on that day plus 1.25%. In addition, an annual commitment fee equal to 0.25% of the unused balance is allocated to each participating fund.
During the year ended May 31, 2022, the Portfolio had average borrowings outstanding of $78,321 at an average rate of 1.37% and paid interest in the amount of $1,073.
9. CONCENTRATION RISKS
As of the end of the period, the Portfolio concentrated its portfolio of investments in the information technology sector. A fund that invests a substantial portion of its assets in any sector may be more affected by changes in that sector than would be a fund whose investments are not heavily weighted in any sector.
10. INDEMNIFICATION
Under the Portfolio's organizational documents, the officers and Trustees have been granted certain indemnification rights against certain liabilities that may arise out of performance of their duties to the Portfolio. The Portfolio has entered into a separate agreement with each Trustee that converts indemnification rights currently existing under the Portfolio’s organizational documents into contractual rights that cannot be changed in the future without the consent of the Trustee. Additionally, in the normal course of business, the Portfolio may enter into contracts with service providers that contain a variety of indemnification clauses. The Portfolio’s maximum exposure under these arrangements is dependent on future claims that may be made against the Portfolio and, therefore, cannot be estimated.
11. CORONAVIRUS (COVID-19) PANDEMIC
On March 11, 2020, the World Health Organization announced that it had made the assessment that coronavirus disease 2019 (“COVID-19”) is a pandemic. The impacts of COVID-19 are affecting the entire global economy, individual companies and investment products, the funds, and the market in general. There is significant uncertainty around the extent and duration of business disruptions related to COVID-19 and the impacts may last for an extended period of time. COVID-19 has led to significant uncertainty and volatility in the financial markets.
Allspring Diversified Large Cap Growth Portfolio | 19
Report of independent registered public accounting firm
To the Interest Holders of the Portfolio and Board of Trustees
Allspring Master Trust:
Opinion on the Financial Statements
We have audited the accompanying statement of assets and liabilities of Allspring Diversified Large Cap Growth Portfolio (formerly, Wells Fargo Diversified Large Cap Growth Portfolio) (the Portfolio), one of the portfolios constituting Allspring Master Trust (formerly, Wells Fargo Master Trust), including the portfolio of investments, as of May 31, 2022, the related statement of operations for the year then ended, the statements of changes in net assets for each of the years in the two-year period then ended, and the related notes (collectively, the financial statements) and the financial highlights for each of the years in the five-year period then ended. In our opinion, the financial statements and financial highlights present fairly, in all material respects, the financial position of the Portfolio as of May 31, 2022, the results of its operations for the year then ended, the changes in its net assets for each of the years in the two-year period then ended, and the financial highlights for each of the years in the five-year period then ended, in conformity with U.S. generally accepted accounting principles.
Basis for Opinion
These financial statements and financial highlights are the responsibility of the Portfolio’s management. Our responsibility is to express an opinion on these financial statements and financial highlights based on our audits. We are a public accounting firm registered with the Public Company Accounting Oversight Board (United States) (PCAOB) and are required to be independent with respect to the Portfolio in accordance with the U.S. federal securities laws and the applicable rules and regulations of the Securities and Exchange Commission and the PCAOB.
We conducted our audits in accordance with the standards of the PCAOB. Those standards require that we plan and perform the audit to obtain reasonable assurance about whether the financial statements and financial highlights are free of material misstatement, whether due to error or fraud. Our audits included performing procedures to assess the risks of material misstatement of the financial statements and financial highlights, whether due to error or fraud, and performing procedures that respond to those risks. Such procedures included examining, on a test basis, evidence regarding the amounts and disclosures in the financial statements and financial highlights. Such procedures also included confirmation of securities owned as of May 31, 2022, by correspondence with the custodian, transfer agent and brokers, or by other appropriate auditing procedures. Our audits also included evaluating the accounting principles used and significant estimates made by management, as well as evaluating the overall presentation of the financial statements and financial highlights. We believe that our audits provide a reasonable basis for our opinion.

We have not been able to determine the specific year that we began serving as the auditor of one or more Allspring Funds investment companies; however, we are aware that we have served as the auditor of one or more Allspring Funds investment companies since at least 1955.
Boston, Massachusetts
July 27, 2022
20 | Allspring Diversified Large Cap Growth Portfolio
Other information (unaudited)
PROXY VOTING INFORMATION
A description of the policies and procedures used to determine how to vote proxies relating to portfolio securities is available without charge, upon request, by calling 1-800-222-8222, visiting our website at allspringglobal.com, or visiting the SEC website at sec.gov. Information regarding how the proxies related to portfolio securities were voted during the most recent 12-month period ended June 30 is available on the website at allspringglobal.com or by visiting the SEC website at sec.gov.
QUARTERLY PORTFOLIO HOLDINGS INFORMATION
The Portfolio files its complete schedule of portfolio holdings with the SEC for the first and third quarters of each fiscal year as an exhibit to its reports on Form N-PORT. Interest holders may view the filed Form N-PORT by visiting the SEC website at sec.gov.
Allspring Diversified Large Cap Growth Portfolio | 21
Other information (unaudited)
BOARD OF TRUSTEES AND OFFICERS
Each of the Trustees and Officers listed in the table below acts in identical capacities for each fund in the Allspring family of funds, which consists of 137 mutual funds comprising the Allspring Funds Trust, Allspring Variable Trust, Allspring Master Trust and four closed-end funds (collectively the “Fund Complex”). This table should be read in conjunction with the Prospectus and the Statement of Additional Information. The mailing address of each Trustee and Officer is 525 Market Street, 12th Floor, San Francisco, CA 94105. Each Trustee and Officer serves an indefinite term, however, each Trustee serves such term until reaching the mandatory retirement age established by the Trustees.
Independent Trustees
Name and
year of birth | Position held and
length of service* | Principal occupations during past five years or longer | Current other
public company or
investment
company
directorships |
William R. Ebsworth
(Born 1957) | Trustee,
since 2015 | Retired. From 1984 to 2013, equities analyst, portfolio manager, research director and chief investment officer at Fidelity Management and Research Company in Boston, Tokyo, and Hong Kong, and retired in 2013 as Chief Investment Officer of Fidelity Strategic Advisers, Inc. where he led a team of investment professionals managing client assets. Prior thereto, Board member of Hong Kong Securities Clearing Co., Hong Kong Options Clearing Corp., the Thailand International Fund, Ltd., Fidelity Investments Life Insurance Company, and Empire Fidelity Investments Life Insurance Company. Audit Committee Chair and Investment Committee Chair of the Vincent Memorial Hospital Endowment (non-profit organization). Mr. Ebsworth is a CFA® charterholder. | N/A |
Jane A. Freeman
(Born 1953) | Trustee,
since 2015;
Chair Liaison,
since 2018 | Retired. From 2012 to 2014 and 1999 to 2008, Chief Financial Officer of Scientific Learning Corporation. From 2008 to 2012, Ms. Freeman provided consulting services related to strategic business projects. Prior to 1999, Portfolio Manager at Rockefeller & Co. and Scudder, Stevens & Clark. Board member of the Harding Loevner Funds from 1996 to 2014, serving as both Lead Independent Director and chair of the Audit Committee. Board member of the Russell Exchange Traded Funds Trust from 2011 to 2012 and the chair of the Audit Committee. Ms. Freeman is also an inactive Chartered Financial Analyst. | N/A |
Isaiah Harris, Jr.
(Born 1952) | Trustee,
since 2009; Audit
Committee
Chair,
since 2019 | Retired. Chairman of the Board of CIGNA Corporation from 2009 to 2021, and Director from 2005 to 2008. From 2003 to 2011, Director of Deluxe Corporation. Prior thereto, President and CEO of BellSouth Advertising and Publishing Corp. from 2005 to 2007, President and CEO of BellSouth Enterprises from 2004 to 2005 and President of BellSouth Consumer Services from 2000 to 2003. Emeritus member of the Iowa State University Foundation Board of Governors. Emeritus Member of the Advisory Board of Iowa State University School of Business. Advisory Board Member, Palm Harbor Academy (private school). Advisory Board Member, Fellowship of Christian Athletes. Mr. Harris is a certified public accountant (inactive status). | N/A |
David F. Larcker
(Born 1950) | Trustee,
since 2009 | James Irvin Miller Professor of Accounting at the Graduate School of Business (Emeritus), Stanford University, Director of the Corporate Governance Research Initiative and Senior Faculty of The Rock Center for Corporate Governance since 2006. From 2005 to 2008, Professor of Accounting at the Graduate School of Business, Stanford University. Prior thereto, Ernst & Young Professor of Accounting at The Wharton School, University of Pennsylvania from 1985 to 2005. | N/A |
22 | Allspring Diversified Large Cap Growth Portfolio
Other information (unaudited)
Name and
year of birth | Position held and
length of service* | Principal occupations during past five years or longer | Current other
public company or
investment
company
directorships |
Olivia S. Mitchell
(Born 1953) | Trustee,
since 2006;
Nominating and
Governance
Committee Chair,
since 2018 | International Foundation of Employee Benefit Plans Professor since 1993, Wharton School of the University of Pennsylvania. Director of Wharton’s Pension Research Council and Boettner Center on Pensions & Retirement Research, and Research Associate at the National Bureau of Economic Research. Previously taught at Cornell University from 1978 to 1993. | N/A |
Timothy J. Penny
(Born 1951) | Trustee,
since 1996;
Chair,
since 2018 | President and Chief Executive Officer of Southern Minnesota Initiative Foundation, a non-profit organization, since 2007. Member of the Board of Trustees of NorthStar Education Finance, Inc., a non-profit organization, since 2007. | N/A |
James G. Polisson
(Born 1959) | Trustee,
since 2018 | Retired. Chief Marketing Officer, Source (ETF) UK Services, Ltd, from 2015 to 2017. From 2012 to 2015, Principal of The Polisson Group, LLC, a management consulting, corporate advisory and principal investing company. Chief Executive Officer and Managing Director at Russell Investments, Global Exchange Traded Funds from 2010 to 2012. Managing Director of Barclays Global Investors from 1998 to 2010 and Global Chief Marketing Officer for iShares and Barclays Global Investors from 2000 to 2010. Trustee of the San Francisco Mechanics’ Institute, a non-profit organization, from 2013 to 2015. Board member of the Russell Exchange Traded Fund Trust from 2011 to 2012. Director of Barclays Global Investors Holdings Deutschland GmbH from 2006 to 2009. Mr. Polisson is an attorney and has a retired status with the Massachusetts and District of Columbia Bar Associations. | N/A |
Pamela Wheelock
(Born 1959) | Trustee,
since January
2020; previously
Trustee from
January 2018 to
July 2019 | Board member of the Destination Medical Center Economic Development Agency, Rochester, Minnesota since 2019. Interim President of the McKnight Foundation from January to September 2020. McKnight Foundation Consultant, November 2020 to February 2021. Acting Commissioner, Minnesota Department of Human Services, July 2019 through September 2019. Consultant (part-time), Minnesota Department of Human Services, October 2019 through December 2019. Chief Operating Officer, Twin Cities Habitat for Humanity from 2017 to 2019. Vice President of University Services, University of Minnesota from 2012 to 2016. Prior thereto, on the Board of Directors, Governance Committee and Finance Committee for the Minnesota Philanthropy Partners (Saint Paul Foundation) from 2012 to 2018, Interim Chief Executive Officer of Blue Cross Blue Shield of Minnesota from 2011 to 2012, Chairman of the Board from 2009 to 2012 and Board Director from 2003 to 2015. Vice President, Leadership and Community Engagement, Bush Foundation, Saint Paul, Minnesota (a private foundation) from 2009 to 2011. Executive Vice President and Chief Financial Officer, Minnesota Sports and Entertainment from 2004 to 2009 and Senior Vice President from 2002 to 2004. Executive Vice President of the Minnesota Wild Foundation from 2004 to 2008. Commissioner of Finance, State of Minnesota, from 1999 to 2002. Currently Board Chair of the Minnesota Wild Foundation since 2010. | N/A |
* Length of service dates reflect the Trustee’s commencement of service with the Trust’s predecessor entities, where applicable.
Allspring Diversified Large Cap Growth Portfolio | 23
Other information (unaudited)
Officers2
Name and
year of birth | Position held and
length of service | Principal occupations during past five years or longer |
Andrew Owen
(Born 1960) | President,
since 2017 | President, Chief Executive Officer and Director of Allspring Funds Management, LLC since 2017 and co-president of Galliard Capital Management, LLC, an affiliate of Allspring Funds Management, LLC, since 2019. Prior thereto, Head of Affiliated Managers, Allspring Global Investments, from 2014 to 2019 and Executive Vice President responsible for marketing, investments and product development for Allspring Funds Management, LLC, from 2009 to 2014. In addition, Mr. Owen was an Executive Vice President of Wells Fargo & Company from 2014 to 2021. |
Jeremy DePalma
(Born 1974) | Treasurer,
since 2012
(for certain funds in
the Fund Complex);
since 2021 (for
the remaining funds in the
Fund Complex) | Senior Vice President of Allspring Funds Management, LLC since 2009. Senior Vice President of Evergreen Investment Management Company, LLC from 2008 to 2010 and head of the Fund Reporting and Control Team within Fund Administration from 2005 to 2010. |
Kate McKinley
(Born 1977) | Chief Legal Officer,
since 2021 | Chief Legal Officer of Allspring Global Investments since 2021. Prior thereto, held various roles at State Street Global Advisors beginning in 2010, including serving as Senior Vice President and General Counsel from 2019 to 2021, and Chief Operating Officer of the Institutional Client Group from 2016 - 2019. Prior to working at State Street Global Advisors served as Assistant General Counsel for Bank of America Corporation from 2005 to 2010 and as an Associate at WilmerHale from 2002 to 2005. |
Christopher Baker
(Born 1976) | Chief Compliance Officer, since 2022 | Global Chief Compliance Officer for Allspring Global Investments since 2022. Prior thereto, Chief Compliance Officer for State Street Global Advisors from 2018 to 2021. Senior Compliance Officer for the State Street divisions of Alternative Investment Solutions, Sector Solutions, and Global Marketing from 2015 to 2018. From 2010 to 2015 Vice President, Global Head of Investment and Marketing Compliance for State Street Global Advisors. |
Matthew Prasse
(Born 1983) | Secretary,
since 2021 | Senior Counsel of the Allspring Legal Department since 2021. Senior Counsel of the Wells Fargo Legal Department from 2018 to 2021. Previously, Counsel for Barings LLC from 2015 to 2018. Prior to joining Barings, Associate at Morgan, Lewis & Bockius LLP from 2008 to 2015. |
1 The Statement of Additional Information includes additional information about the Trustees and is available, without charge, upon request, by calling 1-800-222-8222.
2 For those Officers with tenures at Allspring Global Investments and/or Allspring Funds Management, LLC that began prior to 2021, such tenures include years of service during which these businesses/entities were known as Wells Fargo Asset Management and Wells Fargo Funds Management, LLC, respectively.
24 | Allspring Diversified Large Cap Growth Portfolio
Other information (unaudited)
LIQUIDITY RISK MANAGEMENT PROGRAM
In accordance with Rule 22e-4 under the Investment Company Act of 1940, as amended (the “Liquidity Rule”), Allspring Master Trust (the “Trust”) has adopted and implemented a liquidity risk management program (the “Program”) on behalf of each of its series, including the Portfolio, which is reasonably designed to assess and manage the Portfolio's liquidity risk. “Liquidity risk” is defined under the Liquidity Rule as the risk that the Portfolio is unable to meet redemption requests without significantly diluting remaining investors’ interests in the Portfolio. The Trust’s Board of Trustees (the “Board”) previously approved the designation of Allspring Funds Management, LLC (“Allspring Funds Management”), the Portfolio's investment adviser, to administer the Program, and Allspring Funds Management has established a Liquidity Risk Management Council (the "Council") composed of personnel from multiple departments within Allspring Funds Management and its affiliates to assist Allspring Funds Management in the administration of the Program.
The Program is comprised of various components designed to support the assessment and/or management of liquidity risk, including: (1) the periodic assessment (no less frequently than annually) of certain factors that influence the Portfolio's liquidity risk; (2) the periodic classification (no less frequently than monthly) of the Portfolio's investments into one of four liquidity categories that reflect an estimate of their liquidity under current market conditions; (3) a 15% limit on the acquisition of “illiquid investments” (as defined under the Liquidity Rule); (4) to the extent the Portfolio does not invest primarily in “highly liquid investments” (as defined under the Liquidity Rule), the determination of a minimum percentage of the Portfolio's assets that generally will be invested in highly liquid investments (an “HLIM”); (5) if the Portfolio has established an HLIM, the periodic review (no less frequently than annually) of the HLIM and the adoption of policies and procedures for responding to a shortfall of the Portfolio's “highly liquid investments” below its HLIM; and (6) periodic reporting to the Board.
At a meeting of the Board held on May 24-25, 2022, the Board received and reviewed a written report (the “Report”) from Allspring Funds Management that, among other things, addressed the operation of the Program and assessed its adequacy and effectiveness for the period from January 1, 2021 through December 31, 2021 (the “Reporting Period”). Other than extended foreign market holidays, no significant liquidity events impacting the Portfolios were noted in the Report. In addition, other than corporate-related changes to the Program, there were no material changes to the Program during the Reporting Period.
Allspring Funds Management determined in the Report that the Program has been implemented and operates effectively to manage each Portfolio’s, including the Portfolio’s, liquidity risk, and Allspring Funds Management continues to believe that the Program has been and continues to be adequately and effectively implemented to monitor and, as applicable, respond to the Portfolio’s liquidity developments.
There can be no assurance that the Program will achieve its objectives under all circumstances in the future.
Allspring Diversified Large Cap Growth Portfolio | 25
For more information
More information about Allspring Funds is available free upon request. To obtain literature, please write, visit the Portfolio's website, or call:
Allspring Funds
P.O. Box 219967
Kansas City, MO 64121-9967
Website: allspringglobal.com
Individual investors: 1-800-222-8222
Retail investment professionals: 1-888-877-9275
Institutional investment professionals: 1-800-260-5969
This report and the financial statements contained herein are submitted for the general information of the interest holders of the Portfolio. If this report is used for promotional purposes, distribution of the report must be accompanied or preceded by a current prospectus. Before investing, please consider the investment objectives, risks, charges, and expenses of the investment. For a current prospectus and, if available, a summary prospectus, containing this information, call
1-800-222-8222. Read the prospectus carefully before you invest or send money.
Allspring Global InvestmentsTM is the trade name for the asset management firms of Allspring Global Investments Holdings, LLC, a holding company indirectly owned by certain private funds of GTCR LLC and Reverence Capital Partners, L.P. These firms include but are not limited to Allspring Global Investments, LLC, and Allspring Funds Management, LLC. Certain products managed by Allspring entities are distributed by Allspring Funds Distributor, LLC (a broker-dealer and Member FINRA/SIPC).
This material is for general informational and educational purposes only and is NOT intended to provide investment advice or a recommendation of any kind - including a recommendation for any specific investment, strategy, or plan.
© 2022 Allspring Global Investments Holdings, LLC. All rights reserved.
Annual Report
May 31, 2022
Allspring
Disciplined Large Cap Portfolio
Allspring Disciplined Large Cap Portfolio | 1
Notice to Shareholders
Russia launched a large-scale invasion of Ukraine on February 24, 2022. As a result of this military action, the United States and many other countries have instituted various economic sanctions against Russian and Belarus individuals and entities. The situation has led to increased financial market volatility and has had severe adverse effects on regional and global economic markets, including the markets for certain securities and commodities, such as oil and natural gas. The extent and duration of the military action, resulting sanctions imposed, other punitive action taken and the resulting market disruptions cannot be easily predicted.
Our solidarity and support goes out to our impacted employees and the people affected in Ukraine and their families. Allspring has a dedicated team of investment professionals actively monitoring the situation for any new developments and the potential impact to our clients and investment products. As the situation remains fluid, we are focused on the assessment of risks, valuation, and liquidity of impacted securities. Please visit our website at allspringglobal.com and click on “Russia-Ukraine Updates” for further information.
2 | Allspring Disciplined Large Cap Portfolio
This page is intentionally left blank.
Portfolio information (unaudited)
| Investment objective | The Portfolio seeks long-term capital appreciation. |
| Manager | Allspring Funds Management, LLC |
| Subadviser | Allspring Global Investments, LLC |
| Portfolio managers | Justin P. Carr, CFA®‡, Robert M. Wicentowski, CFA®‡ |
| Ten largest holdings (%) as of May 31, 20221 |
| Apple Incorporated | 5.87 |
| Microsoft Corporation | 5.37 |
| Amazon.com Incorporated | 2.51 |
| Alphabet Incorporated Class C | 1.90 |
| Alphabet Incorporated Class A | 1.79 |
| Berkshire Hathaway Incorporated Class B | 1.57 |
| Tesla Motors Incorporated | 1.55 |
| Johnson & Johnson | 1.48 |
| NVIDIA Corporation | 1.28 |
| Exxon Mobil Corporation | 1.26 |
| 1 | Figures represent the percentage of the Portfolio's net assets. Holdings are subject to change and may have changed since the date specified. |
| Sector allocation as of May 31, 20221 |
| 1 | Figures represent the percentage of the Portfolio's long-term investments. These amounts are subject to change and may have changed since the date specified. |
| ‡ | CFA® and Chartered Financial Analyst® are trademarks owned by CFA Institute. |
4 | Allspring Disciplined Large Cap Portfolio
Portfolio of investments—May 31, 2022
| | | | | Shares | Value |
| Common stocks: 97.24% | | | | | |
| Communication services: 7.79% | | | | | |
| Diversified telecommunication services: 1.34% | | | | | |
| AT&T Incorporated | | | | 67,865 | $ 1,444,846 |
| Verizon Communications Incorporated | | | | 41,707 | 2,139,152 |
| | | | | | 3,583,998 |
| Entertainment: 0.94% | | | | | |
| Activision Blizzard Incorporated | | | | 10,190 | 793,597 |
| Netflix Incorporated † | | | | 2,423 | 478,397 |
| The Walt Disney Company † | | | | 6,631 | 732,328 |
| Warner Bros. Discovery Incorporated † | | | | 27,831 | 513,482 |
| | | | | | 2,517,804 |
| Interactive media & services: 4.82% | | | | | |
| Alphabet Incorporated Class A † | | | | 2,107 | 4,793,931 |
| Alphabet Incorporated Class C † | | | | 2,241 | 5,111,228 |
| Meta Platforms Incorporated Class A † | | | | 15,710 | 3,042,084 |
| | | | | | 12,947,243 |
| Media: 0.69% | | | | | |
| Comcast Corporation Class A | | | | 28,985 | 1,283,456 |
| Interpublic Group of Companies Incorporated | | | | 10,949 | 352,886 |
| Omnicom Group Incorporated | | | | 3,002 | 223,979 |
| | | | | | 1,860,321 |
| Consumer discretionary: 10.03% | | | | | |
| Automobiles: 1.76% | | | | | |
| General Motors Company † | | | | 14,361 | 555,483 |
| Tesla Motors Incorporated † | | | | 5,498 | 4,168,913 |
| | | | | | 4,724,396 |
| Diversified consumer services: 0.34% | | | | | |
| Service Corporation International | | | | 13,146 | 920,614 |
| Hotels, restaurants & leisure: 1.39% | | | | | |
| Boyd Gaming Corporation | | | | 9,699 | 570,010 |
| Chipotle Mexican Grill Incorporated † | | | | 156 | 218,798 |
| Darden Restaurants Incorporated | | | | 7,828 | 978,500 |
| McDonald's Corporation | | | | 5,825 | 1,469,123 |
| Starbucks Corporation | | | | 6,198 | 486,543 |
| | | | | | 3,722,974 |
| Household durables: 0.73% | | | | | |
| D.R. Horton Incorporated | | | | 10,948 | 822,742 |
| Lennar Corporation Class A | | | | 3,919 | 314,500 |
| PulteGroup Incorporated | | | | 18,143 | 821,152 |
| | | | | | 1,958,394 |
| Internet & direct marketing retail: 2.51% | | | | | |
| Amazon.com Incorporated † | | | | 2,805 | 6,743,753 |
| Multiline retail: 0.45% | | | | | |
| Target Corporation | | | | 7,500 | 1,214,100 |
The accompanying notes are an integral part of these financial statements.
Allspring Disciplined Large Cap Portfolio | 5
Portfolio of investments—May 31, 2022
| | | | | Shares | Value |
| Specialty retail: 2.15% | | | | | |
| AutoNation Incorporated † | | | | 2,743 | $ 327,953 |
| AutoZone Incorporated † | | | | 379 | 780,607 |
| Best Buy Company Incorporated | | | | 5,105 | 418,916 |
| Dick's Sporting Goods Incorporated « | | | | 4,501 | 365,616 |
| Lowe's Companies Incorporated | | | | 6,291 | 1,228,632 |
| The Home Depot Incorporated | | | | 7,835 | 2,372,046 |
| The TJX Companies Incorporated | | | | 4,309 | 273,923 |
| | | | | | 5,767,693 |
| Textiles, apparel & luxury goods: 0.70% | | | | | |
| lululemon athletica Incorporated † | | | | 2,265 | 662,943 |
| Nike Incorporated Class B | | | | 7,036 | 836,229 |
| Tapestry Incorporated | | | | 10,522 | 363,009 |
| | | | | | 1,862,181 |
| Consumer staples: 5.66% | | | | | |
| Beverages: 0.66% | | | | | |
| Monster Beverage Corporation † | | | | 4,844 | 431,697 |
| PepsiCo Incorporated | | | | 3,437 | 576,557 |
| The Coca-Cola Company | | | | 12,026 | 762,208 |
| | | | | | 1,770,462 |
| Food & staples retailing: 1.74% | | | | | |
| Costco Wholesale Corporation | | | | 4,358 | 2,031,787 |
| The Kroger Company | | | | 7,104 | 376,299 |
| Walmart Incorporated | | | | 17,508 | 2,252,054 |
| | | | | | 4,660,140 |
| Food products: 1.33% | | | | | |
| Archer Daniels Midland Company | | | | 16,027 | 1,455,572 |
| Bunge Limited | | | | 5,961 | 705,306 |
| Tyson Foods Incorporated Class A | | | | 15,865 | 1,421,663 |
| | | | | | 3,582,541 |
| Household products: 1.13% | | | | | |
| The Procter & Gamble Company | | | | 20,588 | 3,044,553 |
| Personal products: 0.10% | | | | | |
| The Estee Lauder Companies Incorporated Class A | | | | 1,067 | 271,712 |
| Tobacco: 0.70% | | | | | |
| Altria Group Incorporated | | | | 14,846 | 803,020 |
| Philip Morris International Incorporated | | | | 10,083 | 1,071,319 |
| | | | | | 1,874,339 |
| Energy: 4.53% | | | | | |
| Oil, gas & consumable fuels: 4.53% | | | | | |
| Chevron Corporation | | | | 17,732 | 3,097,071 |
| ConocoPhillips | | | | 13,247 | 1,488,433 |
| Diamondback Energy Incorporated | | | | 10,054 | 1,528,409 |
| EOG Resources Incorporated | | | | 11,253 | 1,541,211 |
| EQT Corporation | | | | 16,452 | 785,089 |
The accompanying notes are an integral part of these financial statements.
6 | Allspring Disciplined Large Cap Portfolio
Portfolio of investments—May 31, 2022
| | | | | Shares | Value |
| Oil, gas & consumable fuels (continued) | | | | | |
| Exxon Mobil Corporation | | | | 35,288 | $ 3,387,648 |
| Phillips 66 | | | | 3,309 | 333,580 |
| | | | | | 12,161,441 |
| Financials: 10.91% | | | | | |
| Banks: 3.53% | | | | | |
| Bank of America Corporation | | | | 49,893 | 1,856,020 |
| Bank OZK | | | | 14,971 | 620,847 |
| Citigroup Incorporated | | | | 13,817 | 737,966 |
| JPMorgan Chase & Company | | | | 23,187 | 3,066,017 |
| Regions Financial Corporation | | | | 53,437 | 1,180,423 |
| Signature Bank | | | | 1,539 | 332,840 |
| US Bancorp | | | | 26,736 | 1,418,880 |
| Wells Fargo & Company | | | | 5,721 | 261,850 |
| | | | | | 9,474,843 |
| Capital markets: 2.17% | | | | | |
| Bank of New York Mellon Corporation | | | | 8,510 | 396,651 |
| CME Group Incorporated | | | | 2,300 | 457,309 |
| Jefferies Financial Group Incorporated | | | | 29,682 | 980,100 |
| KKR & Company Incorporated Class A | | | | 15,978 | 875,754 |
| Northern Trust Corporation | | | | 8,702 | 972,449 |
| The Blackstone Group Incorporated Class A | | | | 2,205 | 259,727 |
| The Carlyle Group Incorporated | | | | 16,363 | 630,466 |
| The Goldman Sachs Group Incorporated | | | | 3,796 | 1,240,723 |
| | | | | | 5,813,179 |
| Consumer finance: 0.61% | | | | | |
| Capital One Financial Corporation | | | | 10,237 | 1,308,903 |
| Synchrony Financial | | | | 8,796 | 325,804 |
| | | | | | 1,634,707 |
| Diversified financial services: 1.93% | | | | | |
| Apollo Global Management Incorporated | | | | 16,922 | 975,384 |
| Berkshire Hathaway Incorporated Class B † | | | | 13,314 | 4,206,958 |
| | | | | | 5,182,342 |
| Insurance: 2.67% | | | | | |
| Arch Capital Group Limited † | | | | 20,287 | 962,821 |
| Axis Capital Holdings Limited | | | | 10,634 | 622,833 |
| Chubb Limited | | | | 645 | 136,282 |
| Everest Reinsurance Group Limited | | | | 4,352 | 1,229,440 |
| Fidelity National Financial Incorporated | | | | 6,882 | 291,109 |
| Lincoln National Corporation | | | | 11,484 | 665,268 |
| Markel Corporation † | | | | 225 | 308,122 |
| MetLife Incorporated | | | | 24,388 | 1,643,507 |
| Old Republic International Corporation | | | | 28,467 | 680,931 |
| Prudential Financial Incorporated | | | | 5,970 | 634,313 |
| | | | | | 7,174,626 |
| Health care: 13.56% | | | | | |
| Biotechnology: 2.11% | | | | | |
| AbbVie Incorporated | | | | 10,220 | 1,506,121 |
The accompanying notes are an integral part of these financial statements.
Allspring Disciplined Large Cap Portfolio | 7
Portfolio of investments—May 31, 2022
| | | | | Shares | Value |
| Biotechnology (continued) | | | | | |
| Exelixis Incorporated † | | | | 46,197 | $ 846,791 |
| Moderna Incorporated † | | | | 3,665 | 532,634 |
| United Therapeutics Corporation † | | | | 4,951 | 1,140,413 |
| Vertex Pharmaceuticals Incorporated † | | | | 6,038 | 1,622,109 |
| | | | | | 5,648,068 |
| Health care equipment & supplies: 1.76% | | | | | |
| Abbott Laboratories | | | | 14,986 | 1,760,256 |
| Edwards Lifesciences Corporation † | | | | 8,198 | 826,768 |
| Intuitive Surgical Incorporated † | | | | 3,969 | 903,503 |
| Medtronic plc | | | | 12,297 | 1,231,545 |
| | | | | | 4,722,072 |
| Health care providers & services: 3.75% | | | | | |
| AmerisourceBergen Corporation | | | | 8,715 | 1,348,995 |
| Anthem Incorporated | | | | 2,340 | 1,192,487 |
| CVS Health Corporation | | | | 19,035 | 1,841,636 |
| McKesson Corporation | | | | 4,608 | 1,514,604 |
| Molina Healthcare Incorporated † | | | | 3,793 | 1,100,804 |
| UnitedHealth Group Incorporated | | | | 6,180 | 3,070,100 |
| | | | | | 10,068,626 |
| Health care technology: 0.20% | | | | | |
| Veeva Systems Incorporated Class A † | | | | 3,168 | 539,384 |
| Life sciences tools & services: 1.49% | | | | | |
| Danaher Corporation | | | | 6,177 | 1,629,616 |
| Maravai LifeSciences Holdings Class A † | | | | 17,395 | 541,854 |
| Thermo Fisher Scientific Incorporated | | | | 3,219 | 1,827,008 |
| | | | | | 3,998,478 |
| Pharmaceuticals: 4.25% | | | | | |
| Bristol-Myers Squibb Company | | | | 27,875 | 2,103,169 |
| Eli Lilly & Company | | | | 1,968 | 616,850 |
| Johnson & Johnson | | | | 22,147 | 3,976,051 |
| Merck & Company Incorporated | | | | 19,414 | 1,786,670 |
| Nektar Therapeutics † | | | | 66,868 | 232,701 |
| Pfizer Incorporated | | | | 50,705 | 2,689,393 |
| | | | | | 11,404,834 |
| Industrials: 8.70% | | | | | |
| Aerospace & defense: 0.81% | | | | | |
| General Dynamics Corporation | | | | 2,011 | 452,294 |
| Lockheed Martin Corporation | | | | 3,920 | 1,725,231 |
| | | | | | 2,177,525 |
| Air freight & logistics: 1.42% | | | | | |
| Expeditors International of Washington Incorporated | | | | 9,444 | 1,027,885 |
| FedEx Corporation | | | | 5,650 | 1,268,877 |
| United Parcel Service Incorporated Class B | | | | 8,338 | 1,519,601 |
| | | | | | 3,816,363 |
| Airlines: 0.19% | | | | | |
| Delta Air Lines Incorporated † | | | | 12,378 | 516,039 |
The accompanying notes are an integral part of these financial statements.
8 | Allspring Disciplined Large Cap Portfolio
Portfolio of investments—May 31, 2022
| | | | | Shares | Value |
| Building products: 1.16% | | | | | |
| Builders FirstSource Incorporated † | | | | 16,347 | $ 1,064,026 |
| Masco Corporation | | | | 18,125 | 1,027,506 |
| Owens Corning Incorporated | | | | 10,750 | 1,027,485 |
| | | | | | 3,119,017 |
| Commercial services & supplies: 0.65% | | | | | |
| Copart Incorporated † | | | | 5,379 | 616,057 |
| Waste Management Incorporated | | | | 7,108 | 1,126,689 |
| | | | | | 1,742,746 |
| Construction & engineering: 0.32% | | | | | |
| Quanta Services Incorporated | | | | 7,185 | 855,015 |
| Electrical equipment: 0.94% | | | | | |
| Acuity Brands Incorporated | | | | 4,386 | 767,638 |
| AMETEK Incorporated | | | | 2,861 | 347,526 |
| Eaton Corporation plc | | | | 6,973 | 966,458 |
| Regal Rexnord Corporation | | | | 3,462 | 432,577 |
| | | | | | 2,514,199 |
| Industrial conglomerates: 0.35% | | | | | |
| Honeywell International Incorporated | | | | 1,521 | 294,496 |
| Roper Technologies Incorporated | | | | 1,449 | 641,096 |
| | | | | | 935,592 |
| Machinery: 1.55% | | | | | |
| AGCO Corporation | | | | 7,401 | 948,290 |
| Crane Holdings Company | | | | 2,967 | 283,823 |
| Cummins Incorporated | | | | 5,450 | 1,139,704 |
| Parker-Hannifin Corporation | | | | 4,547 | 1,237,557 |
| Snap-on Incorporated | | | | 2,534 | 562,244 |
| | | | | | 4,171,618 |
| Professional services: 0.12% | | | | | |
| Manpower Incorporated | | | | 3,516 | 315,069 |
| Road & rail: 1.01% | | | | | |
| CSX Corporation | | | | 24,513 | 779,268 |
| Landstar System Incorporated | | | | 3,277 | 496,236 |
| Schneider National Incorporated Class B | | | | 38,325 | 925,166 |
| Union Pacific Corporation | | | | 2,304 | 506,373 |
| | | | | | 2,707,043 |
| Trading companies & distributors: 0.18% | | | | | |
| W.W. Grainger Incorporated | | | | 983 | 478,790 |
| Information technology: 25.85% | | | | | |
| Communications equipment: 0.79% | | | | | |
| Cisco Systems Incorporated | | | | 46,911 | 2,113,341 |
| Electronic equipment, instruments & components: 0.28% | | | | | |
| Keysight Technologies Incorporated † | | | | 2,669 | 388,606 |
| TD SYNNEX Corporation | | | | 3,387 | 351,740 |
| | | | | | 740,346 |
The accompanying notes are an integral part of these financial statements.
Allspring Disciplined Large Cap Portfolio | 9
Portfolio of investments—May 31, 2022
| | | | | Shares | Value |
| IT services: 4.06% | | | | | |
| Accenture plc Class A | | | | 8,732 | $ 2,606,153 |
| Amdocs Limited | | | | 8,875 | 771,149 |
| Cognizant Technology Solutions Corporation Class A | | | | 10,356 | 773,593 |
| EPAM Systems Incorporated † | | | | 1,300 | 440,076 |
| MasterCard Incorporated Class A | | | | 6,316 | 2,260,307 |
| PayPal Holdings Incorporated † | | | | 6,583 | 560,937 |
| Snowflake Incorporated Class A † | | | | 2,953 | 376,950 |
| Visa Incorporated Class A | | | | 14,684 | 3,115,504 |
| | | | | | 10,904,669 |
| Semiconductors & semiconductor equipment: 5.56% | | | | | |
| Advanced Micro Devices Incorporated † | | | | 9,747 | 992,829 |
| Applied Materials Incorporated | | | | 13,426 | 1,574,736 |
| Broadcom Incorporated | | | | 4,642 | 2,692,963 |
| Intel Corporation | | | | 26,864 | 1,193,299 |
| KLA Corporation | | | | 3,289 | 1,199,992 |
| Micron Technology Incorporated | | | | 20,571 | 1,518,963 |
| NVIDIA Corporation | | | | 18,443 | 3,443,677 |
| ON Semiconductor Corporation † | | | | 4,572 | 277,429 |
| Qualcomm Incorporated | | | | 14,188 | 2,032,005 |
| | | | | | 14,925,893 |
| Software: 8.81% | | | | | |
| Adobe Incorporated † | | | | 3,508 | 1,461,012 |
| Atlassian Corporation plc Class A † | | | | 1,672 | 296,479 |
| Bill.com Holdings Incorporated † | | | | 2,372 | 280,465 |
| Cadence Design Systems Incorporated † | | | | 3,476 | 534,365 |
| Fortinet Incorporated † | | | | 2,813 | 827,416 |
| Intuit Incorporated | | | | 2,559 | 1,060,603 |
| Microsoft Corporation | | | | 52,985 | 14,405,032 |
| Oracle Corporation | | | | 19,308 | 1,388,631 |
| Paycom Software Incorporated † | | | | 521 | 148,141 |
| Salesforce.com Incorporated † | | | | 6,183 | 990,764 |
| ServiceNow Incorporated † | | | | 841 | 393,142 |
| Synopsys Incorporated † | | | | 2,111 | 673,831 |
| The Trade Desk Incorporated † | | | | 5,971 | 310,791 |
| VMware Incorporated Class A | | | | 5,573 | 713,901 |
| Zoom Video Communications Incorporated † | | | | 1,611 | 173,102 |
| | | | | | 23,657,675 |
| Technology hardware, storage & peripherals: 6.35% | | | | | |
| Apple Incorporated | | | | 105,819 | 15,750,100 |
| HP Incorporated | | | | 33,193 | 1,289,216 |
| | | | | | 17,039,316 |
| Materials: 3.24% | | | | | |
| Chemicals: 1.44% | | | | | |
| Celanese Corporation Series A | | | | 3,508 | 549,072 |
| Dow Incorporated | | | | 6,105 | 415,018 |
| LyondellBasell Industries NV Class A | | | | 10,403 | 1,188,543 |
| Olin Corporation | | | | 8,150 | 536,189 |
| Westlake Chemical Corporation | | | | 9,018 | 1,191,368 |
| | | | | | 3,880,190 |
The accompanying notes are an integral part of these financial statements.
10 | Allspring Disciplined Large Cap Portfolio
Portfolio of investments—May 31, 2022
| | | | | Shares | Value |
| Containers & packaging: 0.16% | | | | | |
| Packaging Corporation of America | | | | 2,665 | $ 419,151 |
| Metals & mining: 1.14% | | | | | |
| Alcoa Corporation | | | | 8,069 | 498,019 |
| Cleveland-Cliffs Incorporated † | | | | 34,023 | 788,653 |
| Freeport-McMoRan Incorporated | | | | 11,354 | 443,714 |
| Nucor Corporation | | | | 4,836 | 640,577 |
| Reliance Steel & Aluminum Company | | | | 3,547 | 689,537 |
| | | | | | 3,060,500 |
| Paper & forest products: 0.50% | | | | | |
| Louisiana-Pacific Corporation | | | | 19,292 | 1,332,306 |
| Real estate: 3.54% | | | | | |
| Equity REITs: 3.54% | | | | | |
| Alexandria Real Estate Equities Incorporated | | | | 3,980 | 660,481 |
| American Tower Corporation | | | | 1,828 | 468,206 |
| AvalonBay Communities Incorporated | | | | 3,585 | 745,537 |
| Extra Space Storage Incorporated | | | | 7,467 | 1,330,619 |
| Gaming and Leisure Properties Incorporated | | | | 14,543 | 680,903 |
| Invitation Homes Incorporated | | | | 17,455 | 658,403 |
| National Retail Properties Incorporated | | | | 8,380 | 371,234 |
| Prologis Incorporated | | | | 10,873 | 1,386,090 |
| Public Storage Incorporated | | | | 2,171 | 717,819 |
| SBA Communications Corporation | | | | 2,393 | 805,508 |
| Store Capital Corporation | | | | 10,430 | 287,764 |
| Weyerhaeuser Company | | | | 35,059 | 1,385,532 |
| | | | | | 9,498,096 |
| Utilities: 3.43% | | | | | |
| Electric utilities: 2.03% | | | | | |
| Exelon Corporation | | | | 28,056 | 1,378,952 |
| NextEra Energy Incorporated | | | | 6,628 | 501,673 |
| NRG Energy Incorporated | | | | 25,306 | 1,165,088 |
| PG&E Corporation † | | | | 43,573 | 531,591 |
| PPL Corporation | | | | 28,627 | 863,963 |
| The Southern Company | | | | 13,499 | 1,021,334 |
| | | | | | 5,462,601 |
| Gas utilities: 0.27% | | | | | |
| UGI Corporation | | | | 16,872 | 721,109 |
| Independent power & renewable electricity producers: 0.40% | | | | | |
| AES Corporation | | | | 48,151 | 1,061,248 |
| Multi-utilities: 0.73% | | | | | |
| Consolidated Edison Incorporated | | | | 2,277 | 226,015 |
| DTE Energy Company | | | | 7,970 | 1,057,699 |
| Sempra Energy | | | | 4,133 | 677,233 |
| | | | | | 1,960,947 |
| Total Common stocks (Cost $181,885,858) | | | | | 260,976,222 |
The accompanying notes are an integral part of these financial statements.
Allspring Disciplined Large Cap Portfolio | 11
Portfolio of investments—May 31, 2022
| | | Yield | | Shares | Value |
| Short-term investments: 2.61% | | | | | |
| Investment companies: 2.61% | | | | | |
| Allspring Government Money Market Fund Select Class ♠∞ | | 0.65% | | 6,635,991 | $ 6,635,991 |
| Securities Lending Cash Investments LLC ♠∩∞ | | 0.91 | | 380,600 | 380,600 |
| Total Short-term investments (Cost $7,016,591) | | | | | 7,016,591 |
| Total investments in securities (Cost $188,902,449) | 99.85% | | | | 267,992,813 |
| Other assets and liabilities, net | 0.15 | | | | 404,574 |
| Total net assets | 100.00% | | | | $268,397,387 |
| † | Non-income-earning security |
| « | All or a portion of this security is on loan. |
| ♠ | The issuer of the security is an affiliated person of the Portfolio as defined in the Investment Company Act of 1940. |
| ∩ | The investment is a non-registered investment company purchased with cash collateral received from securities on loan. |
| ∞ | The rate represents the 7-day annualized yield at period end. |
| Abbreviations: |
| REIT | Real estate investment trust |
Investments in affiliates
An affiliated investment is an investment in which the Portfolio owns at least 5% of the outstanding voting shares of the issuer or as a result of other relationships, such as the Portfolio and the issuer having the same adviser or investment manager. Transactions with issuers that were affiliates of the Portfolio at the end of the period were as follows:
| | Value,
beginning of
period | Purchases | Sales
proceeds | Net
realized
gains
(losses) | | Net
change in
unrealized
gains
(losses) | | Value,
end of
period | Shares,
end
of period | Income
from
affiliated
securities |
| Short-term investments | | | | | | | | | |
| Allspring Government Money Market Fund Select Class | $5,124,422 | $129,696,505 | $(128,184,936) | $0 | | $0 | | $ 6,635,991 | 6,635,991 | $ 6,145 |
| Securities Lending Cash Investments LLC | 202,520 | 2,689,005 | (2,510,925) | 0 | | 0 | | 380,600 | 380,600 | 562 # |
| | | | | $0 | | $0 | | $7,016,591 | | $6,707 |
| # | Amount shown represents income before fees and rebates. |
Futures contracts
| Description | Number of
contracts | Expiration
date | Notional
cost | Notional
value | Unrealized
gains | Unrealized
losses |
| Long | | | | | | |
| E-Mini S&P 500 Index | 32 | 6-17-2022 | $6,712,210 | $6,610,000 | $0 | $(102,210) |
The accompanying notes are an integral part of these financial statements.
12 | Allspring Disciplined Large Cap Portfolio
Statement of assets and liabilities—May 31, 2022
| | |
| Assets | |
Investments in unaffiliated securities (including $357,412 of securities loaned), at value (cost $181,885,858)
| $ 260,976,222 |
Investments in affiliated securities, at value (cost $7,016,591)
| 7,016,591 |
Cash at broker segregated for futures contracts
| 507,604 |
Receivable for dividends
| 378,517 |
Receivable for securities lending income, net
| 114 |
Prepaid expenses and other assets
| 902 |
Total assets
| 268,879,950 |
| Liabilities | |
Payable upon receipt of securities loaned
| 380,600 |
Advisory fee payable
| 55,192 |
Payable for daily variation margin on open futures contracts
| 40,783 |
Accrued expenses and other liabilities
| 5,988 |
Total liabilities
| 482,563 |
Total net assets
| $268,397,387 |
The accompanying notes are an integral part of these financial statements.
Allspring Disciplined Large Cap Portfolio | 13
Statement of operations—year ended May 31, 2022
| | |
| Investment income | |
Dividends (net of foreign withholdings taxes of $26,287)
| $ 4,809,907 |
Income from affiliated securities
| 6,873 |
Total investment income
| 4,816,780 |
| Expenses | |
Advisory fee
| 847,333 |
Custody and accounting fees
| 45,475 |
Professional fees
| 61,709 |
Interest holder report expenses
| 27,905 |
Trustees’ fees and expenses
| 19,821 |
Other fees and expenses
| 10,902 |
Total expenses
| 1,013,145 |
Net investment income
| 3,803,635 |
| Realized and unrealized gains (losses) on investments | |
| Net realized gains (losses) on | |
Unaffiliated securities
| 44,942,851 |
Futures contracts
| (67,661) |
Net realized gains on investments
| 44,875,190 |
| Net change in unrealized gains (losses) on | |
Unaffiliated securities
| (38,523,693) |
Futures contracts
| (76,899) |
Net change in unrealized gains (losses) on investments
| (38,600,592) |
Net realized and unrealized gains (losses) on investments
| 6,274,598 |
Net increase in net assets resulting from operations
| $ 10,078,233 |
The accompanying notes are an integral part of these financial statements.
14 | Allspring Disciplined Large Cap Portfolio
Statement of changes in net assets
| | | |
| | Year ended
May 31, 2022 | Year ended
May 31, 2021 |
| Operations | | |
Net investment income
| $ 3,803,635 | $ 4,374,651 |
Net realized gains on investments
| 44,875,190 | 21,928,585 |
Net change in unrealized gains (losses) on investments
| (38,600,592) | 84,159,527 |
Net increase in net assets resulting from operations
| 10,078,233 | 110,462,763 |
| Capital transactions | | |
| Transactions in investors’ beneficial interests | | |
Contributions
| 116,619,198 | 87,991,362 |
Withdrawals
| (187,709,657) | (122,800,676) |
Net decrease in net assets resulting from capital transactions
| (71,090,459) | (34,809,314) |
Total increase (decrease) in net assets
| (61,012,226) | 75,653,449 |
| Net assets | | |
Beginning of period
| 329,409,613 | 253,756,164 |
End of period
| $ 268,397,387 | $ 329,409,613 |
The accompanying notes are an integral part of these financial statements.
Allspring Disciplined Large Cap Portfolio | 15
| | Year ended May 31 |
| | 2022 | 2021 | 2020 | 2019 1 |
Total return2
| 0.87% | 41.79% | 11.56% | (2.40)% |
| Ratios to average net assets (annualized) | | | | |
Gross expenses
| 0.30% | 0.29% | 0.29% | 0.28% |
Net expenses
| 0.30% | 0.29% | 0.29% | 0.28% |
Net investment income
| 1.12% | 1.36% | 1.82% | 1.84% |
| Supplemental data | | | | |
Portfolio turnover rate
| 48% | 53% | 81% | 92% |
| 1 | For the period from June 12, 2018 (commencement of operations) to May 31, 2019. |
| 2 | Returns for periods of less than one year are not annualized. |
The accompanying notes are an integral part of these financial statements.
16 | Allspring Disciplined Large Cap Portfolio
Notes to financial statements
1. ORGANIZATION
Allspring Master Trust (the "Trust"), a Delaware statutory trust organized on March 10, 1999, is an open-end management investment company registered under the Investment Company Act of 1940, as amended (the "1940 Act"). As an investment company, the Trust follows the accounting and reporting guidance in Financial Accounting Standards Board ("FASB") Accounting Standards Codification Topic 946, Financial Services – Investment Companies. These financial statements report on the Allspring Disciplined Large Cap Portfolio (the "Portfolio") which is a diversified series of the Trust.
Interests in the Portfolio are available solely through private placement transactions that do not involve any "public offering" within the meaning of Section 4(a)(2) of the Securities Act of 1933.
Effective on November 1, 2021, the sale transaction of Wells Fargo Asset Management ("WFAM") by Wells Fargo & Company to GTCR LLC and Reverence Capital Partners, L.P. was closed. In connection with the closing of the transaction, WFAM became known as Allspring Global Investments (“Allspring”) and various entities that provided services to the Portfolio changed their names to "Allspring", including Allspring Funds Management, LLC, the adviser to the Portfolio, Allspring Global Investments, LLC and Allspring Global Investments (UK) Limited, both registered investment advisers providing subadvisory services to certain funds, and Allspring Funds Distributor, LLC. Consummation of the transaction resulted in a new advisory agreement and subadvisory agreement which became effective on November 1, 2021.
2. SIGNIFICANT ACCOUNTING POLICIES
The following significant accounting policies, which are consistently followed in the preparation of the financial statements of the Portfolio, are in conformity with U.S. generally accepted accounting principles which require management to make estimates and assumptions that affect the reported amounts of assets and liabilities, disclosure of contingent assets and liabilities at the date of the financial statements, and the reported amounts of income and expenses during the reporting period. Actual results could differ from those estimates.
Securities valuation
All investments are valued each business day as of the close of regular trading on the New York Stock Exchange (generally 4 p.m. Eastern Time), although the Portfolio may deviate from this calculation time under unusual or unexpected circumstances.
Equity securities and futures contracts that are listed on a foreign or domestic exchange or market are valued at the official closing price or, if none, the last sales price.
Investments in registered open-end investment companies are valued at net asset value. Interests in non-registered investment companies that are redeemable at net asset value are fair valued normally at net asset value.
Investments which are not valued using any of the methods discussed above are valued at their fair value, as determined in good faith by the Board of Trustees. The Board of Trustees has established a Valuation Committee comprised of the Trustees and has delegated to it the authority to take any actions regarding the valuation of portfolio securities that the Valuation Committee deems necessary or appropriate, including determining the fair value of portfolio securities, unless the determination has been delegated to the Allspring Global Investments Pricing Committee at Allspring Funds Management, LLC ("Allspring Funds Management"). The Board of Trustees retains the authority to make or ratify any valuation decisions or approve any changes to the Valuation Procedures as it deems appropriate. On a quarterly basis, the Board of Trustees receives reports on any valuation actions taken by the Valuation Committee or the Allspring Global Investments Pricing Committee which may include items for ratification.
Securities lending
The Portfolio may lend its securities from time to time in order to earn additional income in the form of fees or interest on securities received as collateral or the investment of any cash received as collateral. When securities are on loan, the Portfolio receives interest or dividends on those securities. Cash collateral received in connection with its securities lending transactions is invested in Securities Lending Cash Investments, LLC (the "Securities Lending Fund"), an affiliated non-registered investment company. Investments in Securities Lending Fund are valued at the evaluated bid price provided by an independent pricing service. Income earned from investment in the Securities Lending Fund (net of fees and rebates), if any, is included in income from affiliated securities on the Statement of Operations.
In a securities lending transaction, the net asset value of the Portfolio is affected by an increase or decrease in the value of the securities loaned and by an increase or decrease in the value of the instrument in which collateral is invested. The amount of securities lending activity undertaken by the Portfolio fluctuates from time to time. The Portfolio has the right under the lending agreement to recover the securities from the borrower on demand. In the event of default or bankruptcy by the
Allspring Disciplined Large Cap Portfolio | 17
Notes to financial statements
borrower, the Portfolio may be prevented from recovering the loaned securities or gaining access to the collateral or may experience delays or costs in doing so. In such an event, the terms of the agreement allow the unaffiliated securities lending agent to use the collateral to purchase replacement securities on behalf of the Portfolio or pay the Portfolio the market value of the loaned securities. The Portfolio bears the risk of loss with respect to depreciation of its investment of the cash collateral.
Futures contracts
Futures contracts are agreements between the Portfolio and a counterparty to buy or sell a specific amount of a commodity, financial instrument or currency at a specified price on a specified date. The Portfolio may buy and sell futures contracts in order to gain exposure to, or protect against, changes in security values and is subject to equity price risk. The primary risks associated with the use of futures contracts are the imperfect correlation between changes in market values of securities held by the Portfolio and the prices of futures contracts, and the possibility of an illiquid market. Futures contracts are generally entered into on a regulated futures exchange and cleared through a clearinghouse associated with the exchange. With futures contracts, there is minimal counterparty risk to the Portfolio since futures contracts are exchange traded and the exchange’s clearinghouse, as the counterparty to all exchange traded futures, guarantees the futures contracts against default.
Upon entering into a futures contract, the Portfolio is required to deposit either cash or securities (initial margin) with the broker in an amount equal to a certain percentage of the contract value. Subsequent payments (variation margin) are paid to or from the broker each day equal to the daily changes in the contract value. Such payments are recorded as unrealized gains or losses and, if any, shown as variation margin receivable (payable) in the Statement of Assets and Liabilities. Should the Portfolio fail to make requested variation margin payments, the broker can gain access to the initial margin to satisfy the Portfolio’s payment obligations. When the contracts are closed, a realized gain or loss is recorded in the Statement of Operations.
Security transactions and income recognition
Securities transactions are recorded on a trade date basis. Realized gains or losses are recorded on the basis of identified cost.
Dividend income is recognized on the ex-dividend date. Dividend income is recorded net of foreign taxes withheld where recovery of such taxes is not assured.
Federal and other taxes
The Portfolio is not required to pay federal income taxes on its net investment income and net capital gains as it is treated as a partnership for federal income tax purposes. All income, gains and losses of the Portfolio are deemed to have been “passed through” to the interest holders in proportion to their holdings of the Portfolio regardless of whether income and gains have been distributed by the Portfolio.
The Portfolio’s income tax returns and all financial records supporting those returns for the prior three fiscal years are subject to examination by the federal revenue authority. Management has analyzed the Portfolio’s tax positions taken on federal, state, and foreign tax returns, as applicable, for all open tax years and does not believe that there are any uncertain tax positions that require recognition of a tax liability.
As of May 31, 2022, the aggregate cost of all investments for federal income tax purposes was $193,275,435 and the unrealized gains (losses) consisted of:
| Gross unrealized gains | $ 85,043,856 |
| Gross unrealized losses | (10,428,688) |
| Net unrealized gains | $ 74,615,168 |
18 | Allspring Disciplined Large Cap Portfolio
Notes to financial statements
3. FAIR VALUATION MEASUREMENTS
Fair value measurements of investments are determined within a framework that has established a fair value hierarchy based upon the various data inputs utilized in determining the value of the Portfolio’s investments. The three-level hierarchy gives the highest priority to unadjusted quoted prices in active markets for identical assets or liabilities (Level 1) and the lowest priority to unobservable inputs (Level 3). The Portfolio’s investments are classified within the fair value hierarchy based on the lowest level of input that is significant to the fair value measurement. The inputs are summarized into three broad levels as follows:
| ■ | Level 1 – quoted prices in active markets for identical securities |
| ■ | Level 2 – other significant observable inputs (including quoted prices for similar securities, interest rates, prepayment speeds, credit risk, etc.) |
| ■ | Level 3 – significant unobservable inputs (including the Portfolio’s own assumptions in determining the fair value of investments) |
The inputs or methodologies used for valuing investments in securities are not necessarily an indication of the risk associated with investing in those securities.
The following is a summary of the inputs used in valuing the Portfolio’s assets and liabilities as of May 31, 2022:
| | Quoted prices
(Level 1) | Other significant
observable inputs
(Level 2) | Significant
unobservable inputs
(Level 3) | Total |
| Assets | | | | |
| Investments in: | | | | |
| Common stocks | | | | |
| Communication services | $ 20,909,366 | $0 | $0 | $ 20,909,366 |
| Consumer discretionary | 26,914,105 | 0 | 0 | 26,914,105 |
| Consumer staples | 15,203,747 | 0 | 0 | 15,203,747 |
| Energy | 12,161,441 | 0 | 0 | 12,161,441 |
| Financials | 29,279,697 | 0 | 0 | 29,279,697 |
| Health care | 36,381,462 | 0 | 0 | 36,381,462 |
| Industrials | 23,349,016 | 0 | 0 | 23,349,016 |
| Information technology | 69,381,240 | 0 | 0 | 69,381,240 |
| Materials | 8,692,147 | 0 | 0 | 8,692,147 |
| Real estate | 9,498,096 | 0 | 0 | 9,498,096 |
| Utilities | 9,205,905 | 0 | 0 | 9,205,905 |
| Short-term investments | | | | |
| Investment companies | 7,016,591 | 0 | 0 | 7,016,591 |
| Total assets | $267,992,813 | $0 | $0 | $267,992,813 |
| Liabilities | | | | |
| Futures contracts | $ 102,210 | $0 | $0 | $ 102,210 |
| Total liabilities | $ 102,210 | $0 | $0 | $ 102,210 |
Futures contracts are reported at their cumulative unrealized gains (losses) at measurement date as reported in the table following the Portfolio of Investments. For futures contracts, the current day’s variation margin is reported on the Statement of Assets and Liabilities. All other assets and liabilities are reported at their market value at measurement date.
Additional sector, industry or geographic detail, if any, is included in the Portfolio of Investments.
For the year ended May 31, 2022, the Portfolio did not have any transfers into/out of Level 3.
4. TRANSACTIONS WITH AFFILIATES
Advisory fee
The Trust has entered into an advisory contract with Allspring Funds Management, a wholly owned subsidiary of Allspring Global Investments Holdings, LLC, a holding company indirectly owned by certain private funds of GTCR LLC and Reverence Capital Partners, L.P. The adviser is responsible for implementing investment policies and guidelines and for supervising the
Allspring Disciplined Large Cap Portfolio | 19
Notes to financial statements
subadviser, who is responsible for day-to-day portfolio management of the Portfolio. Pursuant to the contract, Allspring Funds Management is entitled to receive an advisory fee at the following annual rate based on the Portfolio’s average daily net assets:
| Average daily net assets | Advisory fee |
| First $1 billion | 0.250% |
| Next $4 billion | 0.225 |
| Over $5 billion | 0.200 |
For the year ended May 31, 2022, the advisory fee was equivalent to an annual rate of 0.25% of the Portfolio’s average daily net assets.
Allspring Funds Management has retained the services of a subadviser to provide daily portfolio management to the Portfolio. The fee for subadvisory services is borne by Allspring Funds Management. Allspring Global Investments, LLC ("Allspring Investments"), an affiliate of Allspring Funds Management and a wholly owned subsidiary of Allspring Global Investments Holdings, LLC, is the subadviser to the Portfolio and is entitled to receive a fee from Allspring Funds Management at an annual rate starting at 0.20% and declining to 0.15% as the average daily net assets of the Portfolio increase.
Interfund transactions
The Portfolio may purchase or sell portfolio investment securities to certain affiliates pursuant to Rule 17a-7 under the 1940 Act and under procedures adopted by the Board of Trustees. The procedures have been designed to ensure that these interfund transactions, which do not incur broker commissions, are effected at current market prices.
5. INVESTMENT PORTFOLIO TRANSACTIONS
Purchases and sales of investments, excluding U.S. government obligations (if any) and short-term securities, for the year ended May 31, 2022 were $157,781,257 and $226,317,158, respectively.
6. SECURITIES LENDING TRANSACTIONS
The Portfolio lends its securities through an unaffiliated securities lending agent and receives collateral in the form of cash or securities with a value at least equal to the value of the securities on loan. The value of the loaned securities is determined at the close of each business day and any increases or decreases in the required collateral are exchanged between the Portfolio and the counterparty on the next business day. Cash collateral received is invested in the Securities Lending Fund which seeks to provide a positive return compared to the daily Federal Funds Open Rate by investing in high-quality, U.S. dollar-denominated short-term money market instruments and is exempt from registration under Section 3(c)(7) of the 1940 Act. Securities Lending Fund is managed by Allspring Funds Management and is subadvised by Allspring Investments. Allspring Funds Management receives an advisory fee starting at 0.05% and declining to 0.01% as the average daily net assets of the Securities Lending Fund increase. All of the fees received by Allspring Funds Management are paid to Allspring Investments for its services as subadviser.
In the event of counterparty default or the failure of a borrower to return a loaned security, the Portfolio has the right to use the collateral to offset any losses incurred. As of May 31, 2022, the Portfolio had securities lending transactions with the following counterparties which are subject to offset:
| Counterparty | Value of
securities on
loan | Collateral
received1 | Net amount |
| Scotia Capital Incorporated | $357,412 | $(357,412) | $0 |
1 Collateral received within this table is limited to the collateral for the net transaction with the counterparty.
7. DERIVATIVE TRANSACTIONS
During the year ended May 31, 2022, the Portfolio entered into futures contracts to gain market exposure. The Portfolio had an average notional amount of $6,059,303 in long futures contracts during the year ended May 31, 2022.
The fair value, realized gains or losses and change in unrealized gains or losses, if any, on derivative instruments are reflected in the corresponding financial statement captions.
20 | Allspring Disciplined Large Cap Portfolio
Notes to financial statements
8. BANK BORROWINGS
The Trust, along with Allspring Variable Trust and Allspring Funds Trust (excluding the money market funds), are parties to a $350,000,000 revolving credit agreement whereby the Portfolio is permitted to use bank borrowings for temporary or emergency purposes, such as to fund interest holders withdrawal requests. Interest under the credit agreement is charged to the Portfolio based on a borrowing rate equal to the higher of the Federal Funds rate in effect on that day plus 1.25% or the overnight bank funding rate in effect on that day plus 1.25%. In addition, an annual commitment fee equal to 0.25% of the unused balance is allocated to each participating fund.
For the year ended May 31, 2022, there were no borrowings by the Portfolio under the agreement.
9. CONCENTRATION RISKS
As of the end of the period, the Portfolio concentrated its portfolio of investments in the information technology sector. A fund that invests a substantial portion of its assets in any sector may be more affected by changes in that sector than would be a fund whose investments are not heavily weighted in any sector.
10. INDEMNIFICATION
Under the Portfolio's organizational documents, the officers and Trustees have been granted certain indemnification rights against certain liabilities that may arise out of performance of their duties to the Portfolio. The Portfolio has entered into a separate agreement with each Trustee that converts indemnification rights currently existing under the Portfolio’s organizational documents into contractual rights that cannot be changed in the future without the consent of the Trustee. Additionally, in the normal course of business, the Portfolio may enter into contracts with service providers that contain a variety of indemnification clauses. The Portfolio’s maximum exposure under these arrangements is dependent on future claims that may be made against the Portfolio and, therefore, cannot be estimated.
11. CORONAVIRUS (COVID-19) PANDEMIC
On March 11, 2020, the World Health Organization announced that it had made the assessment that coronavirus disease 2019 (“COVID-19”) is a pandemic. The impacts of COVID-19 are affecting the entire global economy, individual companies and investment products, the funds, and the market in general. There is significant uncertainty around the extent and duration of business disruptions related to COVID-19 and the impacts may last for an extended period of time. COVID-19 has led to significant uncertainty and volatility in the financial markets.
Allspring Disciplined Large Cap Portfolio | 21
Report of independent registered public accounting firm
To the Interest Holders of the Portfolio and Board of Trustees
Allspring Master Trust:
Opinion on the Financial Statements
We have audited the accompanying statement of assets and liabilities of Allspring Disciplined Large Cap Portfolio (formerly, Wells Fargo Disciplined Large Cap Portfolio) (the Portfolio), one of the portfolios constituting Allspring Master Trust (formerly, Wells Fargo Master Trust), including the portfolio of investments, as of May 31, 2022, the related statement of operations for the year then ended, the statements of changes in net assets for each of the years in the two-year period then ended, and the related notes (collectively, the financial statements) and the financial highlights for each of the years in the three-year period then ended and the period from June 12, 2018 (commencement of operations) to May 31, 2019. In our opinion, the financial statements and financial highlights present fairly, in all material respects, the financial position of the Portfolio as of May 31, 2022, the results of its operations for the year then ended, the changes in its net assets for each of the years in the two-year period then ended, and the financial highlights for each of the years in the three-year period then ended and the period from June 12, 2018 to May 31, 2019, in conformity with U.S. generally accepted accounting principles.
Basis for Opinion
These financial statements and financial highlights are the responsibility of the Portfolio’s management. Our responsibility is to express an opinion on these financial statements and financial highlights based on our audits. We are a public accounting firm registered with the Public Company Accounting Oversight Board (United States) (PCAOB) and are required to be independent with respect to the Portfolio in accordance with the U.S. federal securities laws and the applicable rules and regulations of the Securities and Exchange Commission and the PCAOB.
We conducted our audits in accordance with the standards of the PCAOB. Those standards require that we plan and perform the audit to obtain reasonable assurance about whether the financial statements and financial highlights are free of material misstatement, whether due to error or fraud. Our audits included performing procedures to assess the risks of material misstatement of the financial statements and financial highlights, whether due to error or fraud, and performing procedures that respond to those risks. Such procedures included examining, on a test basis, evidence regarding the amounts and disclosures in the financial statements and financial highlights. Such procedures also included confirmation of securities owned as of May 31, 2022, by correspondence with the custodian, transfer agent and brokers. Our audits also included evaluating the accounting principles used and significant estimates made by management, as well as evaluating the overall presentation of the financial statements and financial highlights. We believe that our audits provide a reasonable basis for our opinion.

We have not been able to determine the specific year that we began serving as the auditor of one or more Allspring Funds investment companies; however, we are aware that we have served as the auditor of one or more Allspring Funds investment companies since at least 1955.
Boston, Massachusetts
July 27, 2022
22 | Allspring Disciplined Large Cap Portfolio
Other information (unaudited)
PROXY VOTING INFORMATION
A description of the policies and procedures used to determine how to vote proxies relating to portfolio securities is available without charge, upon request, by calling 1-800-222-8222, visiting our website at allspringglobal.com, or visiting the SEC website at sec.gov. Information regarding how the proxies related to portfolio securities were voted during the most recent 12-month period ended June 30 is available on the website at allspringglobal.com or by visiting the SEC website at sec.gov.
QUARTERLY PORTFOLIO HOLDINGS INFORMATION
The Portfolio files its complete schedule of portfolio holdings with the SEC for the first and third quarters of each fiscal year as an exhibit to its reports on Form N-PORT. Interest holders may view the filed Form N-PORT by visiting the SEC website at sec.gov.
Allspring Disciplined Large Cap Portfolio | 23
Other information (unaudited)
BOARD OF TRUSTEES AND OFFICERS
Each of the Trustees and Officers listed in the table below acts in identical capacities for each fund in the Allspring family of funds, which consists of 137 mutual funds comprising the Allspring Funds Trust, Allspring Variable Trust, Allspring Master Trust and four closed-end funds (collectively the “Fund Complex”). This table should be read in conjunction with the Prospectus and the Statement of Additional Information. The mailing address of each Trustee and Officer is 525 Market Street, 12th Floor, San Francisco, CA 94105. Each Trustee and Officer serves an indefinite term, however, each Trustee serves such term until reaching the mandatory retirement age established by the Trustees.
Independent Trustees
Name and
year of birth | Position held and
length of service* | Principal occupations during past five years or longer | Current other
public company or
investment
company
directorships |
William R. Ebsworth
(Born 1957) | Trustee,
since 2015 | Retired. From 1984 to 2013, equities analyst, portfolio manager, research director and chief investment officer at Fidelity Management and Research Company in Boston, Tokyo, and Hong Kong, and retired in 2013 as Chief Investment Officer of Fidelity Strategic Advisers, Inc. where he led a team of investment professionals managing client assets. Prior thereto, Board member of Hong Kong Securities Clearing Co., Hong Kong Options Clearing Corp., the Thailand International Fund, Ltd., Fidelity Investments Life Insurance Company, and Empire Fidelity Investments Life Insurance Company. Audit Committee Chair and Investment Committee Chair of the Vincent Memorial Hospital Endowment (non-profit organization). Mr. Ebsworth is a CFA® charterholder. | N/A |
Jane A. Freeman
(Born 1953) | Trustee,
since 2015;
Chair Liaison,
since 2018 | Retired. From 2012 to 2014 and 1999 to 2008, Chief Financial Officer of Scientific Learning Corporation. From 2008 to 2012, Ms. Freeman provided consulting services related to strategic business projects. Prior to 1999, Portfolio Manager at Rockefeller & Co. and Scudder, Stevens & Clark. Board member of the Harding Loevner Funds from 1996 to 2014, serving as both Lead Independent Director and chair of the Audit Committee. Board member of the Russell Exchange Traded Funds Trust from 2011 to 2012 and the chair of the Audit Committee. Ms. Freeman is also an inactive Chartered Financial Analyst. | N/A |
Isaiah Harris, Jr.
(Born 1952) | Trustee,
since 2009; Audit
Committee
Chair,
since 2019 | Retired. Chairman of the Board of CIGNA Corporation from 2009 to 2021, and Director from 2005 to 2008. From 2003 to 2011, Director of Deluxe Corporation. Prior thereto, President and CEO of BellSouth Advertising and Publishing Corp. from 2005 to 2007, President and CEO of BellSouth Enterprises from 2004 to 2005 and President of BellSouth Consumer Services from 2000 to 2003. Emeritus member of the Iowa State University Foundation Board of Governors. Emeritus Member of the Advisory Board of Iowa State University School of Business. Advisory Board Member, Palm Harbor Academy (private school). Advisory Board Member, Fellowship of Christian Athletes. Mr. Harris is a certified public accountant (inactive status). | N/A |
David F. Larcker
(Born 1950) | Trustee,
since 2009 | James Irvin Miller Professor of Accounting at the Graduate School of Business (Emeritus), Stanford University, Director of the Corporate Governance Research Initiative and Senior Faculty of The Rock Center for Corporate Governance since 2006. From 2005 to 2008, Professor of Accounting at the Graduate School of Business, Stanford University. Prior thereto, Ernst & Young Professor of Accounting at The Wharton School, University of Pennsylvania from 1985 to 2005. | N/A |
24 | Allspring Disciplined Large Cap Portfolio
Other information (unaudited)
Name and
year of birth | Position held and
length of service* | Principal occupations during past five years or longer | Current other
public company or
investment
company
directorships |
Olivia S. Mitchell
(Born 1953) | Trustee,
since 2006;
Nominating and
Governance
Committee Chair,
since 2018 | International Foundation of Employee Benefit Plans Professor since 1993, Wharton School of the University of Pennsylvania. Director of Wharton’s Pension Research Council and Boettner Center on Pensions & Retirement Research, and Research Associate at the National Bureau of Economic Research. Previously taught at Cornell University from 1978 to 1993. | N/A |
Timothy J. Penny
(Born 1951) | Trustee,
since 1996;
Chair,
since 2018 | President and Chief Executive Officer of Southern Minnesota Initiative Foundation, a non-profit organization, since 2007. Member of the Board of Trustees of NorthStar Education Finance, Inc., a non-profit organization, since 2007. | N/A |
James G. Polisson
(Born 1959) | Trustee,
since 2018 | Retired. Chief Marketing Officer, Source (ETF) UK Services, Ltd, from 2015 to 2017. From 2012 to 2015, Principal of The Polisson Group, LLC, a management consulting, corporate advisory and principal investing company. Chief Executive Officer and Managing Director at Russell Investments, Global Exchange Traded Funds from 2010 to 2012. Managing Director of Barclays Global Investors from 1998 to 2010 and Global Chief Marketing Officer for iShares and Barclays Global Investors from 2000 to 2010. Trustee of the San Francisco Mechanics’ Institute, a non-profit organization, from 2013 to 2015. Board member of the Russell Exchange Traded Fund Trust from 2011 to 2012. Director of Barclays Global Investors Holdings Deutschland GmbH from 2006 to 2009. Mr. Polisson is an attorney and has a retired status with the Massachusetts and District of Columbia Bar Associations. | N/A |
Pamela Wheelock
(Born 1959) | Trustee,
since January
2020; previously
Trustee from
January 2018 to
July 2019 | Board member of the Destination Medical Center Economic Development Agency, Rochester, Minnesota since 2019. Interim President of the McKnight Foundation from January to September 2020. McKnight Foundation Consultant, November 2020 to February 2021. Acting Commissioner, Minnesota Department of Human Services, July 2019 through September 2019. Consultant (part-time), Minnesota Department of Human Services, October 2019 through December 2019. Chief Operating Officer, Twin Cities Habitat for Humanity from 2017 to 2019. Vice President of University Services, University of Minnesota from 2012 to 2016. Prior thereto, on the Board of Directors, Governance Committee and Finance Committee for the Minnesota Philanthropy Partners (Saint Paul Foundation) from 2012 to 2018, Interim Chief Executive Officer of Blue Cross Blue Shield of Minnesota from 2011 to 2012, Chairman of the Board from 2009 to 2012 and Board Director from 2003 to 2015. Vice President, Leadership and Community Engagement, Bush Foundation, Saint Paul, Minnesota (a private foundation) from 2009 to 2011. Executive Vice President and Chief Financial Officer, Minnesota Sports and Entertainment from 2004 to 2009 and Senior Vice President from 2002 to 2004. Executive Vice President of the Minnesota Wild Foundation from 2004 to 2008. Commissioner of Finance, State of Minnesota, from 1999 to 2002. Currently Board Chair of the Minnesota Wild Foundation since 2010. | N/A |
* Length of service dates reflect the Trustee’s commencement of service with the Trust’s predecessor entities, where applicable.
Allspring Disciplined Large Cap Portfolio | 25
Other information (unaudited)
Officers2
Name and
year of birth | Position held and
length of service | Principal occupations during past five years or longer |
Andrew Owen
(Born 1960) | President,
since 2017 | President, Chief Executive Officer and Director of Allspring Funds Management, LLC since 2017 and co-president of Galliard Capital Management, LLC, an affiliate of Allspring Funds Management, LLC, since 2019. Prior thereto, Head of Affiliated Managers, Allspring Global Investments, from 2014 to 2019 and Executive Vice President responsible for marketing, investments and product development for Allspring Funds Management, LLC, from 2009 to 2014. In addition, Mr. Owen was an Executive Vice President of Wells Fargo & Company from 2014 to 2021. |
Jeremy DePalma
(Born 1974) | Treasurer,
since 2012
(for certain funds in
the Fund Complex);
since 2021 (for
the remaining funds in the
Fund Complex) | Senior Vice President of Allspring Funds Management, LLC since 2009. Senior Vice President of Evergreen Investment Management Company, LLC from 2008 to 2010 and head of the Fund Reporting and Control Team within Fund Administration from 2005 to 2010. |
Kate McKinley
(Born 1977) | Chief Legal Officer,
since 2021 | Chief Legal Officer of Allspring Global Investments since 2021. Prior thereto, held various roles at State Street Global Advisors beginning in 2010, including serving as Senior Vice President and General Counsel from 2019 to 2021, and Chief Operating Officer of the Institutional Client Group from 2016 - 2019. Prior to working at State Street Global Advisors served as Assistant General Counsel for Bank of America Corporation from 2005 to 2010 and as an Associate at WilmerHale from 2002 to 2005. |
Christopher Baker
(Born 1976) | Chief Compliance Officer, since 2022 | Global Chief Compliance Officer for Allspring Global Investments since 2022. Prior thereto, Chief Compliance Officer for State Street Global Advisors from 2018 to 2021. Senior Compliance Officer for the State Street divisions of Alternative Investment Solutions, Sector Solutions, and Global Marketing from 2015 to 2018. From 2010 to 2015 Vice President, Global Head of Investment and Marketing Compliance for State Street Global Advisors. |
Matthew Prasse
(Born 1983) | Secretary,
since 2021 | Senior Counsel of the Allspring Legal Department since 2021. Senior Counsel of the Wells Fargo Legal Department from 2018 to 2021. Previously, Counsel for Barings LLC from 2015 to 2018. Prior to joining Barings, Associate at Morgan, Lewis & Bockius LLP from 2008 to 2015. |
1 The Statement of Additional Information includes additional information about the Trustees and is available, without charge, upon request, by calling 1-800-222-8222.
2 For those Officers with tenures at Allspring Global Investments and/or Allspring Funds Management, LLC that began prior to 2021, such tenures include years of service during which these businesses/entities were known as Wells Fargo Asset Management and Wells Fargo Funds Management, LLC, respectively.
26 | Allspring Disciplined Large Cap Portfolio
Other information (unaudited)
LIQUIDITY RISK MANAGEMENT PROGRAM
In accordance with Rule 22e-4 under the Investment Company Act of 1940, as amended (the “Liquidity Rule”), Allspring Master Trust (the “Trust”) has adopted and implemented a liquidity risk management program (the “Program”) on behalf of each of its series, including the Portfolio, which is reasonably designed to assess and manage the Portfolio's liquidity risk. “Liquidity risk” is defined under the Liquidity Rule as the risk that the Portfolio is unable to meet redemption requests without significantly diluting remaining investors’ interests in the Portfolio. The Trust’s Board of Trustees (the “Board”) previously approved the designation of Allspring Funds Management, LLC (“Allspring Funds Management”), the Portfolio's investment adviser, to administer the Program, and Allspring Funds Management has established a Liquidity Risk Management Council (the "Council") composed of personnel from multiple departments within Allspring Funds Management and its affiliates to assist Allspring Funds Management in the administration of the Program.
The Program is comprised of various components designed to support the assessment and/or management of liquidity risk, including: (1) the periodic assessment (no less frequently than annually) of certain factors that influence the Portfolio's liquidity risk; (2) the periodic classification (no less frequently than monthly) of the Portfolio's investments into one of four liquidity categories that reflect an estimate of their liquidity under current market conditions; (3) a 15% limit on the acquisition of “illiquid investments” (as defined under the Liquidity Rule); (4) to the extent the Portfolio does not invest primarily in “highly liquid investments” (as defined under the Liquidity Rule), the determination of a minimum percentage of the Portfolio's assets that generally will be invested in highly liquid investments (an “HLIM”); (5) if the Portfolio has established an HLIM, the periodic review (no less frequently than annually) of the HLIM and the adoption of policies and procedures for responding to a shortfall of the Portfolio's “highly liquid investments” below its HLIM; and (6) periodic reporting to the Board.
At a meeting of the Board held on May 24-25, 2022, the Board received and reviewed a written report (the “Report”) from Allspring Funds Management that, among other things, addressed the operation of the Program and assessed its adequacy and effectiveness for the period from January 1, 2021 through December 31, 2021 (the “Reporting Period”). Other than extended foreign market holidays, no significant liquidity events impacting the Portfolios were noted in the Report. In addition, other than corporate-related changes to the Program, there were no material changes to the Program during the Reporting Period.
Allspring Funds Management determined in the Report that the Program has been implemented and operates effectively to manage each Portfolio’s, including the Portfolio’s, liquidity risk, and Allspring Funds Management continues to believe that the Program has been and continues to be adequately and effectively implemented to monitor and, as applicable, respond to the Portfolio’s liquidity developments.
There can be no assurance that the Program will achieve its objectives under all circumstances in the future.
Allspring Disciplined Large Cap Portfolio | 27
For more information
More information about Allspring Funds is available free upon request. To obtain literature, please write, visit the Portfolio's website, or call:
Allspring Funds
P.O. Box 219967
Kansas City, MO 64121-9967
Website: allspringglobal.com
Individual investors: 1-800-222-8222
Retail investment professionals: 1-888-877-9275
Institutional investment professionals: 1-800-260-5969
This report and the financial statements contained herein are submitted for the general information of the interest holders of the Portfolio. If this report is used for promotional purposes, distribution of the report must be accompanied or preceded by a current prospectus. Before investing, please consider the investment objectives, risks, charges, and expenses of the investment. For a current prospectus and, if available, a summary prospectus, containing this information, call
1-800-222-8222. Read the prospectus carefully before you invest or send money.
Allspring Global InvestmentsTM is the trade name for the asset management firms of Allspring Global Investments Holdings, LLC, a holding company indirectly owned by certain private funds of GTCR LLC and Reverence Capital Partners, L.P. These firms include but are not limited to Allspring Global Investments, LLC, and Allspring Funds Management, LLC. Certain products managed by Allspring entities are distributed by Allspring Funds Distributor, LLC (a broker-dealer and Member FINRA/SIPC).
This material is for general informational and educational purposes only and is NOT intended to provide investment advice or a recommendation of any kind - including a recommendation for any specific investment, strategy, or plan.
© 2022 Allspring Global Investments Holdings, LLC. All rights reserved.
Annual Report
May 31, 2022
Allspring Disciplined International
Developed Markets Portfolio
Allspring Disciplined International Developed Markets Portfolio | 1
Notice to Shareholders
Russia launched a large-scale invasion of Ukraine on February 24, 2022. As a result of this military action, the United States and many other countries have instituted various economic sanctions against Russian and Belarus individuals and entities. The situation has led to increased financial market volatility and has had severe adverse effects on regional and global economic markets, including the markets for certain securities and commodities, such as oil and natural gas. The extent and duration of the military action, resulting sanctions imposed, other punitive action taken and the resulting market disruptions cannot be easily predicted.
Our solidarity and support goes out to our impacted employees and the people affected in Ukraine and their families. Allspring has a dedicated team of investment professionals actively monitoring the situation for any new developments and the potential impact to our clients and investment products. As the situation remains fluid, we are focused on the assessment of risks, valuation, and liquidity of impacted securities. Please visit our website at allspringglobal.com and click on “Russia-Ukraine Updates” for further information.
2 | Allspring Disciplined International Developed Markets Portfolio
This page is intentionally left blank.
Portfolio information (unaudited)
| Investment objective | The Portfolio seeks long-term capital appreciation. |
| Manager | Allspring Funds Management, LLC |
| Subadviser | Allspring Global Investments, LLC |
| Portfolio managers | Justin P. Carr, CFA®‡, Vince Fioramonti, CFA®‡ |
| Ten largest holdings (%) as of May 31, 20221 |
| Nestle SA | 2.18 |
| Roche Holding AG | 1.70 |
| ASML Holding NV | 1.63 |
| Shell plc | 1.52 |
| AstraZeneca plc | 1.42 |
| Novo Nordisk AS Class B | 1.33 |
| LVMH Moët Hennessy Louis Vuitton SE | 1.30 |
| Novartis AG | 1.14 |
| Toyota Motor Corporation | 1.04 |
| Total SA | 0.92 |
| 1 | Figures represent the percentage of the Portfolio's net assets. Holdings are subject to change and may have changed since the date specified. |
| Sector allocation as of May 31, 20221 |
| 1 | Figures represent the percentage of the Portfolio's long-term investments. These amounts are subject to change and may have changed since the date specified. |
| Geographic allocation as of May 31, 20221 |
| 1 | Figures represent the percentage of the Portfolio's long-term investments. These amounts are subject to change and may have changed since the date specified. |
| ‡ | CFA® and Chartered Financial Analyst® are trademarks owned by CFA Institute. |
4 | Allspring Disciplined International Developed Markets Portfolio
Portfolio of investments—May 31, 2022
| | | | | | Shares | Value |
| Common stocks: 97.07% | | | | | | |
| Australia: 7.69% | | | | | | |
| Aristocrat Leisure Limited (Consumer discretionary, Hotels, restaurants & leisure) | | | | | 15,994 | $ 387,845 |
| Aurizon Holdings Limited (Industrials, Road & rail) | | | | | 89,040 | 256,876 |
| Australia & New Zealand Banking Group Limited (Financials, Banks) | | | | | 39,884 | 716,714 |
| BHP Billiton Limited (Materials, Metals & mining) | | | | | 31,504 | 1,008,581 |
| BHP Group Limited (Materials, Metals & mining) | | | | | 21,402 | 678,262 |
| Brambles Limited (Industrials, Commercial services & supplies) | | | | | 41,372 | 323,034 |
| Coles Group Limited (Consumer staples, Food & staples retailing) | | | | | 19,463 | 244,852 |
| Commonwealth Bank of Australia (Financials, Banks) | | | | | 19,470 | 1,458,185 |
| CSL Limited (Health care, Biotechnology) | | | | | 5,182 | 1,010,898 |
| Fortescue Metals Group Limited (Materials, Metals & mining) | | | | | 19,567 | 282,390 |
| Goodman Group (Real estate, Equity REITs) | | | | | 22,188 | 327,222 |
| Macquarie Group Limited (Financials, Capital markets) | | | | | 5,307 | 708,318 |
| National Australia Bank Limited (Financials, Banks) | | | | | 37,728 | 846,380 |
| Newcrest Mining Limited (Materials, Metals & mining) | | | | | 12,669 | 227,661 |
| Reece Limited (Industrials, Trading companies & distributors) | | | | | 5,634 | 64,813 |
| Rio Tinto Limited (Materials, Metals & mining) | | | | | 5,088 | 417,903 |
| Scentre Group (Real estate, Equity REITs) | | | | | 75,370 | 155,236 |
| Sonic Healthcare Limited (Health care, Health care providers & services) | | | | | 8,097 | 213,024 |
| Stockland Corporation Limited (Real estate, Equity REITs) | | | | | 23,677 | 67,967 |
| Suncorp Group Limited (Financials, Insurance) | | | | | 26,498 | 215,835 |
| Transurban Group (Industrials, Transportation infrastructure) | | | | | 43,709 | 450,755 |
| Wesfarmers Limited (Consumer discretionary, Multiline retail) | | | | | 16,286 | 551,540 |
| Westpac Banking Corporation (Financials, Banks) | | | | | 41,107 | 704,175 |
| Woodside Energy Group Limited (Energy, Oil, gas & consumable fuels) | | | | | 27,782 | 593,343 |
| Woodside Energy Group Limited - London Stock Exchange (Energy, Oil, gas & consumable fuels) ♦ | | | | | 3,867 | 70,126 |
| Woolworths Group Limited (Consumer staples, Food & staples retailing) | | | | | 12,786 | 317,944 |
| | | | | | | 12,299,879 |
| Austria: 0.23% | | | | | | |
| Erste Bank Der Oesterreichischen Sparkassen AG (Financials, Banks) | | | | | 5,596 | 174,280 |
| Voestalpine AG (Materials, Metals & mining) | | | | | 6,640 | 194,462 |
| | | | | | | 368,742 |
| Belgium: 0.48% | | | | | | |
| Anheuser-Busch InBev SA (Consumer staples, Beverages) | | | | | 2,613 | 146,347 |
| KBC Group NV (Financials, Banks) | | | | | 8,061 | 502,791 |
| Umicore SA (Materials, Chemicals) | | | | | 2,686 | 119,350 |
| | | | | | | 768,488 |
| Denmark: 2.75% | | | | | | |
| A.P. Moller - Maersk AS Class B (Industrials, Marine) | | | | | 137 | 395,786 |
| Carlsberg AS Class B (Consumer staples, Beverages) | | | | | 1,302 | 165,750 |
| Coloplast AS Class B (Health care, Health care equipment & supplies) | | | | | 1,301 | 154,734 |
| DSV Panalpina AS (Industrials, Air freight & logistics) | | | | | 3,707 | 608,485 |
| Genmab AS (Health care, Biotechnology) † | | | | | 1,196 | 364,676 |
| GN Store Nord AS (Health care, Health care equipment & supplies) | | | | | 5,136 | 202,702 |
| Novo Nordisk AS Class B (Health care, Pharmaceuticals) | | | | | 19,164 | 2,123,019 |
| Vestas Wind System AS Class A (Industrials, Electrical equipment) | | | | | 10,261 | 262,172 |
| William Demant Holding (Health care, Health care equipment & supplies) † | | | | | 2,769 | 121,911 |
| | | | | | | 4,399,235 |
The accompanying notes are an integral part of these financial statements.
Allspring Disciplined International Developed Markets Portfolio | 5
Portfolio of investments—May 31, 2022
| | | | | | Shares | Value |
| Finland: 1.12% | | | | | | |
| Elisa Oyj (Communication services, Diversified telecommunication services) | | | | | 2,739 | $ 154,962 |
| Fortum Oyj (Utilities, Electric utilities) | | | | | 15,670 | 289,347 |
| Kesko Oyj Class B (Consumer staples, Food & staples retailing) | | | | | 6,678 | 167,185 |
| Kone Oyj Class B (Industrials, Machinery) | | | | | 3,457 | 176,211 |
| Neste Oil Oyj (Energy, Oil, gas & consumable fuels) | | | | | 2,083 | 95,508 |
| Nordea Bank Abp (Financials, Banks) | | | | | 43,441 | 441,351 |
| Sampo Oyj Class A (Financials, Insurance) | | | | | 4,602 | 207,895 |
| Stora Enso Oyj (Materials, Paper & forest products) | | | | | 13,643 | 263,856 |
| | | | | | | 1,796,315 |
| France: 11.22% | | | | | | |
| Air Liquide SA (Materials, Chemicals) | | | | | 3,706 | 647,871 |
| Amundi SA (Financials, Capital markets) 144A« | | | | | 2,037 | 118,416 |
| Arkema SA (Materials, Chemicals) | | | | | 1,638 | 197,916 |
| AXA SA (Financials, Insurance) | | | | | 23,796 | 600,591 |
| BNP Paribas SA (Financials, Banks) « | | | | | 15,217 | 867,616 |
| Bolloré SA (Industrials, Air freight & logistics) | | | | | 35,890 | 191,107 |
| Bouygues SA (Industrials, Construction & engineering) | | | | | 6,647 | 229,276 |
| Capgemini SE (Information technology, IT services) | | | | | 2,085 | 404,022 |
| Carrefour SA (Consumer staples, Food & staples retailing) « | | | | | 12,066 | 246,504 |
| Compagnie de Saint-Gobain SA (Industrials, Building products) | | | | | 8,167 | 483,099 |
| Compagnie Generale des Etablissements Michelin SCA (Consumer discretionary, Auto components) | | | | | 2,837 | 369,286 |
| Credit Agricole SA (Financials, Banks) « | | | | | 23,120 | 255,998 |
| Danone SA (Consumer staples, Food products) | | | | | 6,662 | 391,428 |
| Edenred Group (Information technology, IT services) | | | | | 6,891 | 339,708 |
| Eiffage SA (Industrials, Construction & engineering) | | | | | 4,122 | 407,558 |
| Electricite de France SA (Utilities, Electric utilities) « | | | | | 22,187 | 196,696 |
| Engie SA (Utilities, Multi-utilities) | | | | | 23,497 | 315,214 |
| Essilor International (Consumer discretionary, Textiles, apparel & luxury goods) « | | | | | 3,242 | 522,241 |
| Euroapi Sasu (Health care, Pharmaceuticals) † | | | | | 476 | 6,919 |
| Hermes International SA (Consumer discretionary, Textiles, apparel & luxury goods) | | | | | 347 | 413,499 |
| Kering SA (Consumer discretionary, Textiles, apparel & luxury goods) | | | | | 732 | 400,542 |
| La Francaise des Jeux SA (Consumer discretionary, Hotels, restaurants & leisure) 144A | | | | | 3,504 | 127,673 |
| Legrand SA (Industrials, Electrical equipment) | | | | | 4,437 | 383,735 |
| L'Oréal SA (Consumer staples, Personal products) | | | | | 2,550 | 899,423 |
| LVMH Moët Hennessy Louis Vuitton SE (Consumer discretionary, Textiles, apparel & luxury goods) | | | | | 3,239 | 2,076,601 |
| Orange SA (Communication services, Diversified telecommunication services) | | | | | 25,802 | 322,647 |
| Pernod-Ricard SA (Consumer staples, Beverages) | | | | | 3,327 | 651,835 |
| Publicis Groupe SA (Communication services, Media) | | | | | 5,586 | 305,120 |
| Safran SA (Industrials, Aerospace & defense) | | | | | 3,273 | 338,196 |
| Sanofi SA (Health care, Pharmaceuticals) « | | | | | 10,969 | 1,170,276 |
| Sartorius Stedim Biotech SA (Health care, Life sciences tools & services) | | | | | 526 | 181,321 |
| Schneider Electric SE (Industrials, Electrical equipment) « | | | | | 6,591 | 913,057 |
| Societe Generale SA (Financials, Banks) « | | | | | 8,340 | 223,880 |
| Teleperformance SE (Industrials, Professional services) | | | | | 983 | 325,771 |
| Thales SA (Industrials, Aerospace & defense) | | | | | 2,112 | 257,570 |
| Total SA (Energy, Oil, gas & consumable fuels) | | | | | 24,675 | 1,472,571 |
The accompanying notes are an integral part of these financial statements.
6 | Allspring Disciplined International Developed Markets Portfolio
Portfolio of investments—May 31, 2022
| | | | | | Shares | Value |
| France: (continued) | | | | | | |
| Vinci SA (Industrials, Construction & engineering) | | | | | 5,880 | $ 566,103 |
| Vivendi SE (Communication services, Entertainment) | | | | | 10,227 | 121,869 |
| | | | | | | 17,943,155 |
| Germany: 7.72% | | | | | | |
| adidas AG (Consumer discretionary, Textiles, apparel & luxury goods) | | | | | 1,688 | 334,270 |
| Allianz AG (Financials, Insurance) | | | | | 4,469 | 935,646 |
| BASF SE (Materials, Chemicals) | | | | | 11,091 | 610,697 |
| Bayer AG (Health care, Pharmaceuticals) | | | | | 9,858 | 704,620 |
| Bayerische Motoren Werke AG (Consumer discretionary, Automobiles) | | | | | 5,325 | 460,934 |
| Bechtle AG (Information technology, IT services) | | | | | 2,917 | 130,084 |
| Beiersdorf AG (Consumer staples, Personal products) | | | | | 2,304 | 238,738 |
| Brenntag AG (Industrials, Trading companies & distributors) | | | | | 2,495 | 192,745 |
| Continental AG (Consumer discretionary, Auto components) | | | | | 1,500 | 114,784 |
| Covestro AG (Materials, Chemicals) 144A | | | | | 4,594 | 209,605 |
| Daimler Truck Holding AG (Industrials, Machinery) † | | | | | 5,595 | 174,369 |
| Delivery Hero SE (Consumer discretionary, Internet & direct marketing retail) 144A† | | | | | 1,365 | 52,373 |
| Deutsche Bank AG (Financials, Capital markets) | | | | | 20,053 | 223,330 |
| Deutsche Boerse AG (Financials, Capital markets) | | | | | 3,429 | 575,188 |
| Deutsche Post AG (Industrials, Air freight & logistics) | | | | | 13,402 | 553,999 |
| Deutsche Telekom AG (Communication services, Diversified telecommunication services) | | | | | 35,490 | 728,630 |
| E.ON SE (Utilities, Multi-utilities) | | | | | 33,054 | 336,541 |
| Heidelbergcement AG (Materials, Construction materials) | | | | | 3,820 | 221,862 |
| Hellofresh SE (Consumer discretionary, Internet & direct marketing retail) † | | | | | 2,674 | 99,383 |
| Infineon Technologies AG (Information technology, Semiconductors & semiconductor equipment) | | | | | 10,989 | 341,412 |
| LEG Immobilien AG (Real estate, Real estate management & development) | | | | | 1,906 | 196,147 |
| Mercedes Benz Group AG (Consumer discretionary, Automobiles) | | | | | 10,000 | 710,690 |
| Merck KGaA (Health care, Pharmaceuticals) | | | | | 2,129 | 399,978 |
| Muenchener Rueckversicherungs Gesellschaft AG (Financials, Insurance) | | | | | 1,419 | 346,871 |
| RWE AG (Utilities, Multi-utilities) | | | | | 11,052 | 486,460 |
| SAP SE (Information technology, Software) | | | | | 10,940 | 1,089,785 |
| Siemens AG (Industrials, Industrial conglomerates) | | | | | 9,574 | 1,258,459 |
| Siemens Healthineers AG (Health care, Health care equipment & supplies) 144A | | | | | 3,557 | 213,384 |
| Uniper SE (Utilities, Independent power & renewable electricity producers) | | | | | 4,445 | 114,717 |
| Vonovia SE (Real estate, Real estate management & development) | | | | | 5,410 | 205,890 |
| Zalando SE (Consumer discretionary, Internet & direct marketing retail) 144A† | | | | | 2,067 | 83,990 |
| | | | | | | 12,345,581 |
| Hong Kong: 3.12% | | | | | | |
| AIA Group Limited (Financials, Insurance) | | | | | 114,200 | 1,177,335 |
| BOC Hong Kong (Holdings) Limited (Financials, Banks) | | | | | 83,000 | 318,897 |
| CK Asset Holdings Limited (Real estate, Real estate management & development) | | | | | 42,000 | 274,302 |
| Galaxy Entertainment Group Limited (Consumer discretionary, Hotels, restaurants & leisure) | | | | | 30,000 | 159,993 |
| Henderson Land Development Company Limited (Real estate, Real estate management & development) | | | | | 41,000 | 173,986 |
| Hong Kong Exchanges & Clearing Limited (Financials, Capital markets) | | | | | 12,300 | 531,675 |
| Hong Kong Land Holdings Limited (Real estate, Real estate management & development) | | | | | 58,940 | 273,482 |
The accompanying notes are an integral part of these financial statements.
Allspring Disciplined International Developed Markets Portfolio | 7
Portfolio of investments—May 31, 2022
| | | | | | Shares | Value |
| Hong Kong: (continued) | | | | | | |
| New World Development Company Limited (Real estate, Real estate management & development) | | | | | 90,000 | $ 342,925 |
| Sino Land Company (Real estate, Real estate management & development) | | | | | 300,000 | 425,120 |
| SITC International Holdings Incorporated (Industrials, Marine) | | | | | 39,000 | 147,110 |
| Sun Hung Kai Properties Limited (Real estate, Real estate management & development) | | | | | 21,000 | 256,639 |
| Swire Pacific Limited Class A (Real estate, Real estate management & development) | | | | | 47,500 | 288,734 |
| Techtronic Industries Company Limited (Industrials, Machinery) | | | | | 18,500 | 242,354 |
| WH Group Limited (Consumer staples, Food products) 144A | | | | | 322,000 | 247,023 |
| Xinyi Glass Holdings Limited (Consumer discretionary, Auto components) | | | | | 48,000 | 121,970 |
| | | | | | | 4,981,545 |
| Ireland: 0.78% | | | | | | |
| CRH plc (Materials, Construction materials) | | | | | 8,568 | 355,280 |
| DCC plc (Industrials, Industrial conglomerates) | | | | | 5,729 | 404,992 |
| Flutter Entertainment plc (Consumer discretionary, Hotels, restaurants & leisure) † | | | | | 3,127 | 382,193 |
| James Hardie Industries CDI (Materials, Construction materials) | | | | | 4,328 | 112,126 |
| | | | | | | 1,254,591 |
| Israel: 0.45% | | | | | | |
| Bank Leumi Le-Israel (Financials, Banks) | | | | | 21,253 | 211,288 |
| Check Point Software Technologies Limited (Information technology, Software) † | | | | | 2,299 | 287,559 |
| Nice Systems Limited ADR (Information technology, Software) † | | | | | 925 | 186,790 |
| Wix.com Limited (Information technology, IT services) † | | | | | 637 | 40,137 |
| | | | | | | 725,774 |
| Italy: 1.55% | | | | | | |
| Assicurazioni Generali SpA (Financials, Insurance) « | | | | | 22,498 | 409,389 |
| Enel SpA (Utilities, Electric utilities) | | | | | 84,196 | 546,309 |
| Eni SpA (Energy, Oil, gas & consumable fuels) | | | | | 29,326 | 446,995 |
| Moncler SpA (Consumer discretionary, Textiles, apparel & luxury goods) | | | | | 4,700 | 225,542 |
| Poste Italiane SpA (Financials, Insurance) 144A | | | | | 16,122 | 174,376 |
| Snam SpA (Utilities, Gas utilities) | | | | | 34,956 | 203,021 |
| UniCredit SpA (Financials, Banks) | | | | | 40,403 | 472,784 |
| | | | | | | 2,478,416 |
| Japan: 21.91% | | | | | | |
| Advantest Corporation (Information technology, Semiconductors & semiconductor equipment) | | | | | 3,300 | 228,143 |
| Astellas Pharma Incorporated (Health care, Pharmaceuticals) | | | | | 22,800 | 365,285 |
| Bridgestone Corporation (Consumer discretionary, Auto components) | | | | | 8,200 | 323,771 |
| Brother Industries Limited (Information technology, Technology hardware, storage & peripherals) | | | | | 20,100 | 371,132 |
| Canon Incorporated (Information technology, Technology hardware, storage & peripherals) | | | | | 15,900 | 400,418 |
| Capcom Company Limited (Communication services, Entertainment) | | | | | 7,800 | 221,758 |
| Chugai Pharmaceutical Company Limited (Health care, Pharmaceuticals) | | | | | 7,600 | 208,279 |
| CyberAgent Incorporated (Communication services, Media) | | | | | 9,600 | 103,729 |
| Dai Nippon Printing Company Limited (Industrials, Commercial services & supplies) | | | | | 9,000 | 205,539 |
| Dai-ichi Life Holdings Incorporated (Financials, Insurance) | | | | | 17,400 | 355,947 |
| Daiichi Sankyo Company Limited (Health care, Pharmaceuticals) | | | | | 16,900 | 448,838 |
The accompanying notes are an integral part of these financial statements.
8 | Allspring Disciplined International Developed Markets Portfolio
Portfolio of investments—May 31, 2022
| | | | | | Shares | Value |
| Japan: (continued) | | | | | | |
| Daiwa House Industry Company Limited (Real estate, Real estate management & development) | | | | | 6,700 | $ 161,599 |
| DENSO Corporation (Consumer discretionary, Auto components) | | | | | 4,000 | 244,751 |
| Dentsu Incorporated (Communication services, Media) | | | | | 6,200 | 207,092 |
| Disco Corporation (Information technology, Semiconductors & semiconductor equipment) | | | | | 900 | 245,388 |
| Eisai Company Limited (Health care, Pharmaceuticals) | | | | | 2,800 | 115,232 |
| ENEOS Holdings Incorporated (Energy, Oil, gas & consumable fuels) | | | | | 49,500 | 200,407 |
| FANUC Corporation (Industrials, Machinery) | | | | | 2,300 | 377,065 |
| Fast Retailing Company Limited (Consumer discretionary, Specialty retail) | | | | | 600 | 288,733 |
| FUJIFILM Holdings Incorporated (Information technology, Technology hardware, storage & peripherals) | | | | | 4,900 | 270,512 |
| Fujitsu Limited (Information technology, IT services) | | | | | 3,200 | 480,864 |
| Hitachi Limited (Industrials, Industrial conglomerates) | | | | | 9,000 | 470,152 |
| Honda Motor Company Limited (Consumer discretionary, Automobiles) | | | | | 23,300 | 576,821 |
| Hoya Corporation (Health care, Health care equipment & supplies) | | | | | 4,400 | 472,008 |
| Iida Group Holdings Company Limited (Consumer discretionary, Household durables) | | | | | 12,800 | 202,338 |
| Inpex Holdings Incorporated (Energy, Oil, gas & consumable fuels) | | | | | 27,100 | 353,446 |
| Isuzu Motors Limited (Consumer discretionary, Automobiles) | | | | | 13,300 | 156,106 |
| Itochu Corporation (Industrials, Trading companies & distributors) | | | | | 17,900 | 513,772 |
| Itochu Techno-Solutions Corporation (Information technology, IT services) | | | | | 6,500 | 162,330 |
| Japan Post Holdings Company Limited (Financials, Insurance) | | | | | 14,600 | 241,112 |
| Japan Post Holdings Company Limited (Financials, Insurance) | | | | | 43,000 | 320,525 |
| Japan Post Holdings Company Limited (Financials, Insurance) | | | | | 38,200 | 292,283 |
| Kao Corporation (Consumer staples, Personal products) | | | | | 4,800 | 193,738 |
| KDDI Corporation (Communication services, Wireless telecommunication services) | | | | | 16,500 | 574,972 |
| Keyence Corporation (Information technology, Electronic equipment, instruments & components) | | | | | 2,000 | 801,491 |
| Kirin Holdings Company Limited (Consumer staples, Beverages) | | | | | 10,600 | 164,062 |
| Komatsu Limited (Industrials, Machinery) | | | | | 10,800 | 268,123 |
| Konami Holdings Corporation (Communication services, Entertainment) | | | | | 4,500 | 307,609 |
| Kubota Corporation (Industrials, Machinery) | | | | | 13,100 | 241,577 |
| Lawson Incorporated (Consumer staples, Food & staples retailing) | | | | | 7,600 | 269,204 |
| M3 Incorporated (Health care, Health care technology) | | | | | 5,900 | 171,269 |
| Marubeni Corporation (Industrials, Trading companies & distributors) | | | | | 40,400 | 424,759 |
| MediPal Holdings Corporation (Health care, Health care providers & services) | | | | | 11,200 | 156,862 |
| Mitsubishi Corporation (Industrials, Trading companies & distributors) | | | | | 18,000 | 619,831 |
| Mitsubishi Electric Corporation (Industrials, Electrical equipment) | | | | | 25,000 | 274,983 |
| Mitsubishi Estate Company Limited (Real estate, Real estate management & development) | | | | | 37,400 | 554,601 |
| Mitsui & Company Limited (Industrials, Trading companies & distributors) | | | | | 25,500 | 640,199 |
| Murata Manufacturing Company Limited (Information technology, Electronic equipment, instruments & components) | | | | | 7,600 | 489,999 |
| NEC Corporation (Information technology, IT services) | | | | | 3,700 | 149,742 |
| Nexon Company Limited (Communication services, Entertainment) | | | | | 9,200 | 228,687 |
| Nidec Corporation (Industrials, Electrical equipment) | | | | | 4,500 | 303,379 |
| Nintendo Company Limited (Communication services, Entertainment) | | | | | 1,900 | 847,462 |
| Nissan Motor Company Limited (Consumer discretionary, Automobiles) | | | | | 56,900 | 221,262 |
| Nitori Holdings Company Limited (Consumer discretionary, Specialty retail) | | | | | 900 | 90,954 |
| Nitto Denko Corporation (Materials, Chemicals) | | | | | 5,800 | 421,253 |
| Nomura Research Institute Limited (Information technology, IT services) | | | | | 5,500 | 151,668 |
| NTT Data Corporation (Information technology, IT services) | | | | | 13,700 | 215,394 |
| OBIC Company Limited (Information technology, IT services) | | | | | 1,800 | 266,781 |
| Olympus Corporation (Health care, Health care equipment & supplies) | | | | | 16,600 | 346,932 |
The accompanying notes are an integral part of these financial statements.
Allspring Disciplined International Developed Markets Portfolio | 9
Portfolio of investments—May 31, 2022
| | | | | | Shares | Value |
| Japan: (continued) | | | | | | |
| Omron Corporation (Information technology, Electronic equipment, instruments & components) | | | | | 3,400 | $ 196,127 |
| Ono Pharmaceutical Company Limited (Health care, Pharmaceuticals) | | | | | 9,900 | 261,775 |
| ORIX Corporation (Financials, Diversified financial services) | | | | | 25,200 | 479,883 |
| Osaka Gas Company Limited (Utilities, Gas utilities) | | | | | 24,500 | 457,894 |
| Otsuka Corporation (Information technology, IT services) | | | | | 3,800 | 120,581 |
| Otsuka Holdings Company Limited (Health care, Pharmaceuticals) | | | | | 9,800 | 326,502 |
| Panasonic Corporation (Consumer discretionary, Household durables) | | | | | 33,100 | 304,427 |
| Rakuten Incorporated (Consumer discretionary, Internet & direct marketing retail) | | | | | 21,900 | 123,165 |
| Recruit Holdings Company Limited (Industrials, Professional services) | | | | | 19,000 | 698,691 |
| Rohm Company Limited (Information technology, Semiconductors & semiconductor equipment) | | | | | 3,000 | 247,485 |
| Secom Company Limited (Industrials, Commercial services & supplies) | | | | | 4,200 | 277,216 |
| Seiko Epson Corporation (Information technology, Technology hardware, storage & peripherals) | | | | | 11,200 | 187,660 |
| Sekisui House Limited (Consumer discretionary, Household durables) | | | | | 8,800 | 156,026 |
| Seven & I Holdings Company Limited (Consumer staples, Food & staples retailing) | | | | | 8,800 | 369,814 |
| Sharp Corporation (Consumer discretionary, Household durables) | | | | | 13,700 | 111,635 |
| Shimano Incorporated (Consumer discretionary, Leisure products) | | | | | 1,300 | 230,089 |
| Shin-Etsu Chemical Company Limited (Materials, Chemicals) | | | | | 3,500 | 498,485 |
| SMC Corporation (Industrials, Machinery) | | | | | 700 | 362,194 |
| SoftBank Corporation (Communication services, Wireless telecommunication services) | | | | | 37,500 | 431,118 |
| SoftBank Group Corporation (Communication services, Wireless telecommunication services) | | | | | 14,200 | 593,326 |
| Sompo Holdings Incorporated (Financials, Insurance) | | | | | 3,600 | 163,536 |
| Sony Corporation (Consumer discretionary, Household durables) | | | | | 13,900 | 1,308,102 |
| Square Enix Company Limited (Communication services, Entertainment) | | | | | 3,500 | 174,273 |
| Sumitomo Chemical Company Limited (Materials, Chemicals) | | | | | 68,900 | 284,195 |
| Sumitomo Corporation (Industrials, Trading companies & distributors) | | | | | 29,600 | 425,370 |
| Sumitomo Metal Mining Company Limited (Materials, Metals & mining) | | | | | 2,700 | 113,591 |
| Suntory Beverage & Food Limited (Consumer staples, Beverages) | | | | | 6,800 | 254,336 |
| Suzuki Motor Corporation (Consumer discretionary, Automobiles) | | | | | 4,900 | 145,323 |
| Sysmex Corporation (Health care, Health care equipment & supplies) | | | | | 4,900 | 319,612 |
| T&D Holdings Incorporated (Financials, Insurance) | | | | | 18,600 | 212,968 |
| Taisho Pharmaceutical (Health care, Pharmaceuticals) | | | | | 3,800 | 146,409 |
| Takeda Pharmaceutical Company Limited (Health care, Pharmaceuticals) | | | | | 18,600 | 535,020 |
| TDK Corporation (Information technology, Electronic equipment, instruments & components) | | | | | 8,900 | 308,685 |
| Terumo Corporation (Health care, Health care equipment & supplies) | | | | | 6,600 | 213,788 |
| Tokio Marine Holdings Incorporated (Financials, Insurance) | | | | | 7,300 | 423,364 |
| Tokyo Electron Limited (Information technology, Semiconductors & semiconductor equipment) | | | | | 1,800 | 824,671 |
| Tokyo Gas Company Limited (Utilities, Gas utilities) | | | | | 10,300 | 200,903 |
| Toray Industries Incorporated (Materials, Chemicals) | | | | | 36,800 | 190,468 |
| Tosoh Corporation (Materials, Chemicals) | | | | | 17,200 | 250,515 |
| Toyo Suisan Kaisha Limited (Consumer staples, Food products) | | | | | 3,800 | 142,129 |
| Toyota Motor Corporation (Consumer discretionary, Automobiles) | | | | | 101,000 | 1,665,223 |
| Toyota Tsusho Corporation (Industrials, Trading companies & distributors) | | | | | 5,400 | 206,587 |
| Trend Micro Incorporated (Information technology, Software) | | | | | 5,000 | 294,015 |
| Unicharm Corporation (Consumer staples, Household products) | | | | | 5,900 | 202,663 |
| USS Company Limited (Consumer discretionary, Specialty retail) | | | | | 9,000 | 164,221 |
| Yahoo! Japan Corporation (Communication services, Interactive media & services) | | | | | 46,500 | 153,946 |
The accompanying notes are an integral part of these financial statements.
10 | Allspring Disciplined International Developed Markets Portfolio
Portfolio of investments—May 31, 2022
| | | | | | Shares | Value |
| Japan: (continued) | | | | | | |
| Yamaha Motor Company Limited (Consumer discretionary, Automobiles) | | | | | 6,400 | $ 129,904 |
| Yamato Holdings Company Limited (Industrials, Air freight & logistics) | | | | | 9,900 | 171,184 |
| | | | | | | 35,041,262 |
| Luxembourg: 0.38% | | | | | | |
| ArcelorMittal SA (Materials, Metals & mining) | | | | | 10,401 | 334,477 |
| Eurofins Scientific SE (Health care, Life sciences tools & services) | | | | | 2,857 | 266,288 |
| | | | | | | 600,765 |
| Netherlands: 5.04% | | | | | | |
| Adyen NV (Information technology, IT services) 144A† | | | | | 199 | 309,175 |
| Airbus SE (Industrials, Aerospace & defense) | | | | | 7,500 | 875,856 |
| Akzo Nobel NV (Materials, Chemicals) | | | | | 1,887 | 164,697 |
| ASML Holding NV (Information technology, Semiconductors & semiconductor equipment) | | | | | 4,518 | 2,599,760 |
| CNH Industrial NV (Industrials, Machinery) | | | | | 22,214 | 330,770 |
| ING Groep NV (Financials, Banks) | | | | | 71,748 | 810,612 |
| Iveco Group N.V. (Industrials, Machinery) † | | | | | 4,443 | 28,261 |
| Koninklijke Ahold Delhaize NV (Consumer staples, Food & staples retailing) | | | | | 19,345 | 533,837 |
| Koninklijke Philips NV (Health care, Health care equipment & supplies) | | | | | 10,837 | 279,101 |
| NN Group NV (Financials, Insurance) « | | | | | 8,112 | 403,297 |
| Prosus NV (Consumer discretionary, Internet & direct marketing retail) | | | | | 8,779 | 455,024 |
| Qiagen NV (Health care, Life sciences tools & services) † | | | | | 4,075 | 187,282 |
| Randstad Holdings NV (Industrials, Professional services) | | | | | 3,239 | 182,763 |
| Stellantis NV (Consumer discretionary, Automobiles) | | | | | 15,902 | 237,876 |
| STMicroelectronics NV (Information technology, Semiconductors & semiconductor equipment) | | | | | 8,413 | 336,253 |
| Universal Music Group NV (Communication services, Entertainment) | | | | | 14,283 | 320,317 |
| | | | | | | 8,054,881 |
| New Zealand: 0.10% | | | | | | |
| Fisher & Paykel Healthcare Corporation (Health care, Health care equipment & supplies) | | | | | 11,354 | 155,364 |
| Norway: 0.64% | | | | | | |
| DNB Bank ASA (Financials, Banks) | | | | | 10,436 | 211,723 |
| Equinor ASA (Energy, Oil, gas & consumable fuels) | | | | | 21,030 | 809,101 |
| | | | | | | 1,020,824 |
| Singapore: 0.88% | | | | | | |
| DBS Group Holdings Limited (Financials, Banks) | | | | | 20,600 | 465,212 |
| Genting Singapore Limited (Consumer discretionary, Hotels, restaurants & leisure) | | | | | 245,200 | 139,598 |
| Oversea-Chinese Banking Corporation Limited (Financials, Banks) | | | | | 41,200 | 355,751 |
| Sea Limited ADR (Communication services, Entertainment) † | | | | | 2,167 | 179,124 |
| Wilmar International Limited (Consumer staples, Food products) | | | | | 90,500 | 275,453 |
| | | | | | | 1,415,138 |
| Spain: 2.56% | | | | | | |
| Banco Bilbao Vizcaya Argentaria SA (Financials, Banks) | | | | | 83,745 | 456,625 |
| Banco Santander Central Hispano SA (Financials, Banks) | | | | | 172,638 | 558,694 |
| CaixaBank SA (Financials, Banks) | | | | | 123,004 | 444,748 |
| Enagás SA (Utilities, Gas utilities) | | | | | 10,779 | 246,595 |
| Endesa SA (Utilities, Electric utilities) | | | | | 10,934 | 242,159 |
| Iberdrola SA (Utilities, Electric utilities) | | | | | 66,290 | 785,313 |
The accompanying notes are an integral part of these financial statements.
Allspring Disciplined International Developed Markets Portfolio | 11
Portfolio of investments—May 31, 2022
| | | | | | Shares | Value |
| Spain: (continued) | | | | | | |
| Industria de Diseno Textil SA (Consumer discretionary, Specialty retail) | | | | | 11,162 | $ 268,299 |
| Red Eléctrica Corporacion SA (Utilities, Electric utilities) | | | | | 11,588 | 239,973 |
| Repsol SA (Energy, Oil, gas & consumable fuels) | | | | | 21,614 | 347,940 |
| Telefónica SA (Communication services, Diversified telecommunication services) | | | | | 93,282 | 506,723 |
| | | | | | | 4,097,069 |
| Sweden: 2.83% | | | | | | |
| Alfa Laval AB (Industrials, Machinery) | | | | | 5,360 | 144,676 |
| Assa Abloy AB Class B (Industrials, Building products) | | | | | 12,172 | 299,378 |
| Atlas Copco AB (Industrials, Machinery) | | | | | 54,808 | 613,633 |
| Electrolux AB (Industrials, Electronic equipment, instruments & components) | | | | | 11,048 | 171,479 |
| Epiroc AB Class A (Industrials, Machinery) | | | | | 9,641 | 186,483 |
| Ericsson LM Class B (Information technology, Communications equipment) | | | | | 43,484 | 352,602 |
| Evolution Gaming Group (Consumer discretionary, Hotels, restaurants & leisure) 144A | | | | | 920 | 96,221 |
| Hennes & Mauritz AB Class B (Consumer discretionary, Specialty retail) | | | | | 4,677 | 64,471 |
| Hexagon AB Class B (Information technology, Electronic equipment, instruments & components) | | | | | 27,383 | 333,387 |
| Husqvarna AB Class B (Industrials, Machinery) | | | | | 22,926 | 206,631 |
| Industrivarden AB Class A (Financials, Diversified financial services) | | | | | 6,583 | 170,541 |
| Investor AB (Financials, Diversified financial services) | | | | | 32,769 | 614,112 |
| Kinnevik AB (Financials, Diversified financial services) | | | | | 6,604 | 131,763 |
| Sandvik AB (Industrials, Machinery) | | | | | 15,460 | 316,610 |
| Skanska AB Class B (Industrials, Construction & engineering) | | | | | 9,846 | 169,780 |
| Swedbank AB Class A (Financials, Banks) | | | | | 10,765 | 162,644 |
| Swedish Match AB (Consumer staples, Tobacco) | | | | | 27,408 | 283,174 |
| Volvo AB Class B (Industrials, Machinery) | | | | | 11,913 | 208,668 |
| | | | | | | 4,526,253 |
| Switzerland: 10.10% | | | | | | |
| ABB Limited (Industrials, Electrical equipment) | | | | | 16,954 | 519,296 |
| Adecco SA (Industrials, Professional services) | | | | | 2,875 | 111,769 |
| Alcon Incorporated (Health care, Health care equipment & supplies) | | | | | 3,795 | 284,071 |
| Barry Callebaut AG (Consumer staples, Food products) | | | | | 137 | 300,223 |
| Chocoladefabriken Lindt & Sprungli AG (Participation Certificates) (Consumer staples, Food products) | | | | | 32 | 321,601 |
| Compagnie Financière Richemont SA (Consumer discretionary, Textiles, apparel & luxury goods) | | | | | 5,266 | 583,861 |
| Geberit AG (Industrials, Building products) | | | | | 652 | 357,404 |
| Givaudan SA (Materials, Chemicals) | | | | | 52 | 190,934 |
| Kuehne & Nagel International AG (Industrials, Marine) | | | | | 1,087 | 286,482 |
| LafargeHolcim Limited (Materials, Construction materials) | | | | | 8,081 | 400,006 |
| Logitech International SA (Information technology, Technology hardware, storage & peripherals) | | | | | 3,163 | 192,906 |
| Lonza Group AG (Health care, Life sciences tools & services) | | | | | 554 | 333,370 |
| Nestle SA (Consumer staples, Food products) | | | | | 28,599 | 3,488,413 |
| Novartis AG (Health care, Pharmaceuticals) | | | | | 20,053 | 1,815,892 |
| Partners Group Holding AG (Financials, Capital markets) | | | | | 321 | 344,526 |
| Roche Holding AG (Health care, Pharmaceuticals) | | | | | 7,968 | 2,711,380 |
| Roche Holding AG (Bearer Shares) (Health care, Pharmaceuticals) | | | | | 731 | 285,480 |
| Schindler Holding AG (Industrials, Machinery) | | | | | 1,024 | 204,544 |
| Sika AG (Materials, Chemicals) | | | | | 1,638 | 453,387 |
| Sonova Holding AG (Health care, Health care equipment & supplies) | | | | | 944 | 333,628 |
| Straumann Holding AG (Health care, Health care equipment & supplies) | | | | | 970 | 123,323 |
The accompanying notes are an integral part of these financial statements.
12 | Allspring Disciplined International Developed Markets Portfolio
Portfolio of investments—May 31, 2022
| | | | | | Shares | Value |
| Switzerland: (continued) | | | | | | |
| Swiss Life Holding AG (Financials, Insurance) | | | | | 492 | $ 278,520 |
| Swisscom AG (Communication services, Diversified telecommunication services) | | | | | 516 | 304,909 |
| The Swatch Group AG (Bearer Shares) (Consumer discretionary, Textiles, apparel & luxury goods) | | | | | 1,292 | 331,890 |
| UBS Group AG (Financials, Capital markets) | | | | | 49,184 | 925,277 |
| Zurich Insurance Group AG (Financials, Insurance) | | | | | 1,458 | 665,767 |
| | | | | | | 16,148,859 |
| United Kingdom: 15.47% | | | | | | |
| Admiral Group plc (Financials, Insurance) | | | | | 6,366 | 178,325 |
| Anglo American plc (Materials, Metals & mining) | | | | | 15,375 | 753,069 |
| Ashtead Group plc (Industrials, Trading companies & distributors) | | | | | 6,192 | 324,039 |
| AstraZeneca plc (Health care, Pharmaceuticals) | | | | | 17,285 | 2,276,967 |
| Aviva plc (Financials, Insurance) | | | | | 38,981 | 211,216 |
| BAE Systems plc (Industrials, Aerospace & defense) | | | | | 38,476 | 366,536 |
| Barclays plc (Financials, Banks) | | | | | 126,951 | 270,447 |
| Barratt Developments plc (Consumer discretionary, Household durables) | | | | | 23,963 | 152,428 |
| Berkeley Group Holdings (Consumer discretionary, Household durables) | | | | | 3,284 | 173,803 |
| BP plc (Energy, Oil, gas & consumable fuels) | | | | | 218,801 | 1,197,275 |
| British American Tobacco plc (Consumer staples, Tobacco) | | | | | 30,585 | 1,349,676 |
| BT Group plc (Communication services, Diversified telecommunication services) | | | | | 108,448 | 255,887 |
| Bunzl plc (Industrials, Trading companies & distributors) | | | | | 9,167 | 319,625 |
| Burberry Group plc (Consumer discretionary, Textiles, apparel & luxury goods) | | | | | 7,271 | 156,948 |
| Compass Group plc (Consumer discretionary, Hotels, restaurants & leisure) | | | | | 19,819 | 443,911 |
| Diageo plc (Consumer staples, Beverages) | | | | | 30,093 | 1,393,567 |
| Entain plc (Consumer discretionary, Hotels, restaurants & leisure) † | | | | | 7,532 | 138,759 |
| Experian Group Limited plc (Industrials, Professional services) | | | | | 13,088 | 438,032 |
| Ferguson plc (Industrials, Trading companies & distributors) | | | | | 3,050 | 366,344 |
| GlaxoSmithKline plc (Health care, Pharmaceuticals) | | | | | 40,158 | 876,749 |
| Glencore plc (Materials, Metals & mining) | | | | | 134,196 | 882,873 |
| Hargreaves Lansdown plc (Financials, Capital markets) | | | | | 8,496 | 91,749 |
| HSBC Holdings plc (Financials, Banks) | | | | | 213,498 | 1,433,923 |
| Imperial Tobacco Group plc (Consumer staples, Tobacco) | | | | | 17,481 | 394,408 |
| Johnson Matthey plc (Materials, Chemicals) | | | | | 3,893 | 103,507 |
| Kingfisher plc (Consumer discretionary, Specialty retail) | | | | | 47,944 | 159,252 |
| Lloyds Banking Group plc (Financials, Banks) | | | | | 1,022,144 | 578,185 |
| London Stock Exchange Group plc (Financials, Capital markets) | | | | | 2,962 | 276,273 |
| National Grid plc (Utilities, Multi-utilities) | | | | | 27,967 | 412,675 |
| Persimmon plc (Consumer discretionary, Household durables) | | | | | 4,919 | 134,940 |
| Phoenix Group Holdings plc (Financials, Insurance) | | | | | 20,415 | 164,022 |
| Prudential plc (Financials, Insurance) | | | | | 28,225 | 369,001 |
| RELX plc (Industrials, Professional services) | | | | | 24,027 | 689,091 |
| Rentokil Initial plc (Industrials, Commercial services & supplies) | | | | | 18,813 | 120,001 |
| Rio Tinto plc (Materials, Metals & mining) | | | | | 11,114 | 805,273 |
| Rolls-Royce Holdings plc (Industrials, Aerospace & defense) † | | | | | 71,196 | 77,773 |
| Schroders plc (Financials, Capital markets) | | | | | 5,978 | 223,124 |
| Segro plc (Real estate, Equity REITs) | | | | | 13,563 | 189,365 |
| Shell plc (Energy, Oil, gas & consumable fuels) | | | | | 81,413 | 2,438,016 |
| Smith & Nephew plc (Health care, Health care equipment & supplies) | | | | | 11,092 | 180,723 |
| Smiths Group plc (Industrials, Industrial conglomerates) | | | | | 9,920 | 194,378 |
| SSE plc (Utilities, Electric utilities) | | | | | 23,391 | 522,297 |
| Unilever plc (Consumer staples, Personal products) | | | | | 14,457 | 695,388 |
| Unilever plc (London Exchange) (Consumer staples, Personal products) | | | | | 20,345 | 980,605 |
The accompanying notes are an integral part of these financial statements.
Allspring Disciplined International Developed Markets Portfolio | 13
Portfolio of investments—May 31, 2022
| | | | | | Shares | Value |
| United Kingdom: (continued) | | | | | | |
| Vodafone Group plc (Communication services, Wireless telecommunication services) | | | | | 344,150 | $ 566,278 |
| WPP plc (Communication services, Media) | | | | | 35,284 | 409,311 |
| | | | | | | 24,736,034 |
| United States: 0.05% | | | | | | |
| Block Incorporated (Information technology, IT services) † | | | | | 833 | 75,323 |
| Total Common stocks (Cost $138,471,671) | | | | | | 155,233,493 |
| | | Dividend
yield | | | | |
| Preferred stocks: 0.60% | | | | | | |
| Germany: 0.60% | | | | | | |
| Fuchs Petrolub SE (Materials, Chemicals) | | 3.54% | | | 3,603 | 110,625 |
| Henkel AG & Company KGaA (Consumer staples, Household products) | | 2.95 | | | 2,992 | 204,608 |
| Sartorius AG Vorzug (Health care, Health care equipment & supplies) | | 0.34 | | | 368 | 148,387 |
| Volkswagen AG ADR (Consumer discretionary, Automobiles) | | 4.74 | | | 2,970 | 493,188 |
| Total Preferred stocks (Cost $1,193,050) | | | | | | 956,808 |
| | | Yield | | | | |
| Short-term investments: 3.97% | | | | | | |
| Investment companies: 3.97% | | | | | | |
| Allspring Government Money Market Fund Select Class ♠∞ | | 0.65 | | | 1,578,533 | 1,578,533 |
| Securities Lending Cash Investments LLC ♠∩∞ | | 0.91 | | | 4,760,248 | 4,760,248 |
| Total Short-term investments (Cost $6,338,781) | | | | | | 6,338,781 |
| Total investments in securities (Cost $146,003,502) | 101.64% | | | | | 162,529,082 |
| Other assets and liabilities, net | (1.64) | | | | | (2,614,627) |
| Total net assets | 100.00% | | | | | $159,914,455 |
| ♦ | The security is fair valued in accordance with procedures approved by the Board of Trustees. |
| † | Non-income-earning security |
| 144A | The security may be resold in transactions exempt from registration, normally to qualified institutional buyers, pursuant to Rule 144A under the Securities Act of 1933. |
| « | All or a portion of this security is on loan. |
| ♠ | The issuer of the security is an affiliated person of the Portfolio as defined in the Investment Company Act of 1940. |
| ∩ | The investment is a non-registered investment company purchased with cash collateral received from securities on loan. |
| ∞ | The rate represents the 7-day annualized yield at period end. |
| Abbreviations: |
| ADR | American depositary receipt |
| REIT | Real estate investment trust |
The accompanying notes are an integral part of these financial statements.
14 | Allspring Disciplined International Developed Markets Portfolio
Portfolio of investments—May 31, 2022
Investments in affiliates
An affiliated investment is an investment in which the Portfolio owns at least 5% of the outstanding voting shares of the issuer or as a result of other relationships, such as the Portfolio and the issuer having the same adviser or investment manager. Transactions with issuers that were affiliates of the Portfolio at the end of the period were as follows:
| | Value,
beginning of
period | Purchases | Sales
proceeds | Net
realized
gains
(losses) | | Net
change in
unrealized
gains
(losses) | | Value,
end of
period | Shares,
end
of period | Income
from
affiliated
securities |
| Short-term investments | | | | | | | | | |
| Allspring Government Money Market Fund Select Class | $1,648,018 | $27,730,268 | $(27,799,753) | $0 | | $0 | | $ 1,578,533 | 1,578,533 | $ 2,053 |
| Securities Lending Cash Investments LLC | 2,186,481 | 21,832,763 | (19,258,996) | 0 | | 0 | | 4,760,248 | 4,760,248 | 4,792 # |
| | | | | $0 | | $0 | | $6,338,781 | | $6,845 |
| # | Amount shown represents income before fees and rebates. |
Futures contracts
| Description | Number of
contracts | Expiration
date | Notional
cost | Notional
value | Unrealized
gains | Unrealized
losses |
| Long | | | | | | |
| MSCI EAFE Index | 23 | 6-17-2022 | $2,332,991 | $2,342,550 | $9,559 | $0 |
The accompanying notes are an integral part of these financial statements.
Allspring Disciplined International Developed Markets Portfolio | 15
Statement of assets and liabilities—May 31, 2022
| | |
| Assets | |
Investments in unaffiliated securities (including $4,444,223 of securities loaned), at value (cost $139,664,721)
| $ 156,190,301 |
Investments in affiliated securities, at value (cost $6,338,781)
| 6,338,781 |
Cash at broker segregated for futures contracts
| 315,068 |
Foreign currency, at value (cost $428,444)
| 430,879 |
Receivable for dividends
| 1,477,428 |
Receivable for investments sold
| 157,164 |
Receivable for securities lending income, net
| 10,437 |
Total assets
| 164,920,058 |
| Liabilities | |
Payable upon receipt of securities loaned
| 4,760,248 |
Payable for investments purchased
| 186,633 |
Advisory fee payable
| 33,119 |
Payable for daily variation margin on open futures contracts
| 13,390 |
Accrued expenses and other liabilities
| 12,213 |
Total liabilities
| 5,005,603 |
Total net assets
| $159,914,455 |
The accompanying notes are an integral part of these financial statements.
16 | Allspring Disciplined International Developed Markets Portfolio
Statement of operations—year ended May 31, 2022
| | |
| Investment income | |
Dividends (net of foreign withholdings taxes of $765,515)
| $ 5,444,529 |
Income from affiliated securities
| 108,536 |
Total investment income
| 5,553,065 |
| Expenses | |
Advisory fee
| 454,581 |
Custody and accounting fees
| 159,254 |
Professional fees
| 58,907 |
Interest holder report expenses
| 27,349 |
Trustees’ fees and expenses
| 19,821 |
Other fees and expenses
| 69,650 |
Total expenses
| 789,562 |
Net investment income
| 4,763,503 |
| Realized and unrealized gains (losses) on investments | |
| Net realized gains on | |
Unaffiliated securities
| 6,801,496 |
Futures contracts
| 46,457 |
Net realized gains on investments
| 6,847,953 |
| Net change in unrealized gains (losses) on | |
Unaffiliated securities
| (28,685,771) |
Futures contracts
| (48,510) |
Net change in unrealized gains (losses) on investments
| (28,734,281) |
Net realized and unrealized gains (losses) on investments
| (21,886,328) |
Net decrease in net assets resulting from operations
| $(17,122,825) |
The accompanying notes are an integral part of these financial statements.
Allspring Disciplined International Developed Markets Portfolio | 17
Statement of changes in net assets
| | | |
| | Year ended
May 31, 2022 | Year ended
May 31, 2021 |
| Operations | | |
Net investment income
| $ 4,763,503 | $ 4,321,572 |
Net realized gains on investments
| 6,847,953 | 41,094,177 |
Net change in unrealized gains (losses) on investments
| (28,734,281) | 19,528,673 |
Net increase (decrease) in net assets resulting from operations
| (17,122,825) | 64,944,422 |
| Capital transactions | | |
| Transactions in investors’ beneficial interests | | |
Contributions
| 922,417 | 3,259,460 |
Withdrawals
| (28,522,295) | (42,716,944) |
Net decrease in net assets resulting from capital transactions
| (27,599,878) | (39,457,484) |
Total increase (decrease) in net assets
| (44,722,703) | 25,486,938 |
| Net assets | | |
Beginning of period
| 204,637,158 | 179,150,220 |
End of period
| $159,914,455 | $204,637,158 |
The accompanying notes are an integral part of these financial statements.
18 | Allspring Disciplined International Developed Markets Portfolio
| | Year ended May 31 |
| | 2022 | 2021 | 2020 | 2019 | 2018 |
Total return
| (9.56)% | 39.97% | 1.76% | (0.14)% | 9.46% |
| Ratios to average net assets (annualized) | | | | | |
Gross expenses
| 0.43% | 0.43% | 0.91% | 0.89% | 1.10% |
Net expenses1
| 0.43% | 0.43% | 0.91% | 0.89% | 1.06% |
Net investment income
| 2.62% | 2.23% | 0.34% | 1.24% | 0.70% |
| Supplemental data | | | | | |
Portfolio turnover rate
| 17% | 127% | 53% | 100% | 71% |
| 1 | Net expense ratios reflect voluntary waivers. |
The accompanying notes are an integral part of these financial statements.
Allspring Disciplined International Developed Markets Portfolio | 19
Notes to financial statements
1. ORGANIZATION
Allspring Master Trust (the "Trust"), a Delaware statutory trust organized on March 10, 1999, is an open-end management investment company registered under the Investment Company Act of 1940, as amended (the "1940 Act"). As an investment company, the Trust follows the accounting and reporting guidance in Financial Accounting Standards Board ("FASB") Accounting Standards Codification Topic 946, Financial Services – Investment Companies. These financial statements report on the Allspring Disciplined International Developed Markets Portfolio (the "Portfolio") which is a diversified series of the Trust.
Interests in the Portfolio are available solely through private placement transactions that do not involve any "public offering" within the meaning of Section 4(a)(2) of the Securities Act of 1933.
Effective on November 1, 2021, the sale transaction of Wells Fargo Asset Management ("WFAM") by Wells Fargo & Company to GTCR LLC and Reverence Capital Partners, L.P. was closed. In connection with the closing of the transaction, WFAM became known as Allspring Global Investments (“Allspring”) and various entities that provided services to the Portfolio changed their names to "Allspring", including Allspring Funds Management, LLC, the adviser to the Portfolio, Allspring Global Investments, LLC and Allspring Global Investments (UK) Limited, both registered investment advisers providing subadvisory services to certain funds, and Allspring Funds Distributor, LLC. Consummation of the transaction resulted in a new advisory agreement and subadvisory agreement which became effective on November 1, 2021.
2. SIGNIFICANT ACCOUNTING POLICIES
The following significant accounting policies, which are consistently followed in the preparation of the financial statements of the Portfolio, are in conformity with U.S. generally accepted accounting principles which require management to make estimates and assumptions that affect the reported amounts of assets and liabilities, disclosure of contingent assets and liabilities at the date of the financial statements, and the reported amounts of income and expenses during the reporting period. Actual results could differ from those estimates.
Securities valuation
All investments are valued each business day as of the close of regular trading on the New York Stock Exchange (generally 4 p.m. Eastern Time), although the Portfolio may deviate from this calculation time under unusual or unexpected circumstances.
Equity securities and futures contracts that are listed on a foreign or domestic exchange or market are valued at the official closing price or, if none, the last sales price.
The values of securities denominated in foreign currencies are translated into U.S. dollars at rates provided by an independent foreign currency pricing source at a time each business day specified by the Allspring Global Investments Pricing Committee at Allspring Funds Management, LLC ("Allspring Funds Management").
Many securities markets and exchanges outside the U.S. close prior to the close of the New York Stock Exchange and therefore may not fully reflect trading or events that occur after the close of the principal exchange in which the foreign securities are traded, but before the close of the New York Stock Exchange. If such trading or events are expected to materially affect the value of such securities, then fair value pricing procedures approved by the Board of Trustees of the Portfolio are applied. These procedures take into account multiple factors including movements in U.S. securities markets after foreign exchanges close. Foreign securities that are fair valued under these procedures are categorized as Level 2 and the application of these procedures may result in transfers between Level 1 and Level 2. Depending on market activity, such fair valuations may be frequent. Such fair value pricing may result in net asset values that are higher or lower than net asset values based on the last reported sales price or latest quoted bid price. On May 31, 2022, such fair value pricing was not used in pricing foreign securities.
Investments in registered open-end investment companies are valued at net asset value. Interests in non-registered investment companies that are redeemable at net asset value are fair valued normally at net asset value.
Investments which are not valued using any of the methods discussed above are valued at their fair value, as determined in good faith by the Board of Trustees. The Board of Trustees has established a Valuation Committee comprised of the Trustees and has delegated to it the authority to take any actions regarding the valuation of portfolio securities that the Valuation Committee deems necessary or appropriate, including determining the fair value of portfolio securities, unless the determination has been delegated to the Allspring Global Investments Pricing Committee. The Board of Trustees retains the authority to make or ratify any valuation decisions or approve any changes to the Valuation Procedures as it deems appropriate. On a quarterly basis, the Board of Trustees receives reports on any valuation actions taken by the Valuation Committee or the Allspring Global Investments Pricing Committee which may include items for ratification.
20 | Allspring Disciplined International Developed Markets Portfolio
Notes to financial statements
Foreign currency translation
The accounting records of the Portfolio are maintained in U.S. dollars. The values of other assets and liabilities denominated in foreign currencies are translated into U.S. dollars at rates provided by an independent foreign currency pricing source at a time each business day specified by the Allspring Global Investments Pricing Committee. Purchases and sales of securities, and income and expenses are converted at the rate of exchange on the respective dates of such transactions. Net realized foreign exchange gains or losses arise from sales of foreign currencies, currency gains or losses realized between the trade and settlement dates on securities transactions, and the difference between the amounts of dividends, interest and foreign withholding taxes recorded and the U.S. dollar equivalent of the amounts actually paid or received. Net unrealized foreign exchange gains and losses arise from changes in the fair value of assets and liabilities other than investments in securities resulting from changes in exchange rates. The changes in net assets arising from changes in exchange rates of securities and the changes in net assets resulting from changes in market prices of securities are not separately presented. Such changes are included in net realized and unrealized gains or losses from investments.
Securities lending
The Portfolio may lend its securities from time to time in order to earn additional income in the form of fees or interest on securities received as collateral or the investment of any cash received as collateral. When securities are on loan, the Portfolio receives interest or dividends on those securities. Cash collateral received in connection with its securities lending transactions is invested in Securities Lending Cash Investments, LLC (the "Securities Lending Fund"), an affiliated non-registered investment company. Investments in Securities Lending Fund are valued at the evaluated bid price provided by an independent pricing service. Income earned from investment in the Securities Lending Fund (net of fees and rebates), if any, is included in income from affiliated securities on the Statement of Operations.
In a securities lending transaction, the net asset value of the Portfolio is affected by an increase or decrease in the value of the securities loaned and by an increase or decrease in the value of the instrument in which collateral is invested. The amount of securities lending activity undertaken by the Portfolio fluctuates from time to time. The Portfolio has the right under the lending agreement to recover the securities from the borrower on demand. In the event of default or bankruptcy by the borrower, the Portfolio may be prevented from recovering the loaned securities or gaining access to the collateral or may experience delays or costs in doing so. In such an event, the terms of the agreement allow the unaffiliated securities lending agent to use the collateral to purchase replacement securities on behalf of the Portfolio or pay the Portfolio the market value of the loaned securities. The Portfolio bears the risk of loss with respect to depreciation of its investment of the cash collateral.
Futures contracts
Futures contracts are agreements between the Portfolio and a counterparty to buy or sell a specific amount of a commodity, financial instrument or currency at a specified price on a specified date. The Portfolio may buy and sell futures contracts in order to gain exposure to, or protect against, changes in security values and is subject to equity price risk. The primary risks associated with the use of futures contracts are the imperfect correlation between changes in market values of securities held by the Portfolio and the prices of futures contracts, and the possibility of an illiquid market. Futures contracts are generally entered into on a regulated futures exchange and cleared through a clearinghouse associated with the exchange. With futures contracts, there is minimal counterparty risk to the Portfolio since futures contracts are exchange traded and the exchange’s clearinghouse, as the counterparty to all exchange traded futures, guarantees the futures contracts against default.
Upon entering into a futures contract, the Portfolio is required to deposit either cash or securities (initial margin) with the broker in an amount equal to a certain percentage of the contract value. Subsequent payments (variation margin) are paid to or from the broker each day equal to the daily changes in the contract value. Such payments are recorded as unrealized gains or losses and, if any, shown as variation margin receivable (payable) in the Statement of Assets and Liabilities. Should the Portfolio fail to make requested variation margin payments, the broker can gain access to the initial margin to satisfy the Portfolio’s payment obligations. When the contracts are closed, a realized gain or loss is recorded in the Statement of Operations.
Security transactions and income recognition
Securities transactions are recorded on a trade date basis. Realized gains or losses are recorded on the basis of identified cost.
Dividend income is recognized on the ex-dividend date. Dividend income is recorded net of foreign taxes withheld where recovery of such taxes is not assured.
Federal and other taxes
The Portfolio is not required to pay federal income taxes on its net investment income and net capital gains as it is treated as a partnership for federal income tax purposes. All income, gains and losses of the Portfolio are deemed to have been “passed through” to the interest holders in proportion to their holdings of the Portfolio regardless of whether income and gains have been distributed by the Portfolio.
Allspring Disciplined International Developed Markets Portfolio | 21
Notes to financial statements
The Portfolio’s income tax returns and all financial records supporting those returns for the prior three fiscal years are subject to examination by the federal revenue authority. Management has analyzed the Portfolio’s tax positions taken on federal, state, and foreign tax returns, as applicable, for all open tax years and does not believe that there are any uncertain tax positions that require recognition of a tax liability.
As of May 31, 2022, the aggregate cost of all investments for federal income tax purposes was $146,914,694 and the unrealized gains (losses) consisted of:
| Gross unrealized gains | $ 25,995,460 |
| Gross unrealized losses | (10,371,513) |
| Net unrealized gains | $ 15,623,947 |
3. FAIR VALUATION MEASUREMENTS
Fair value measurements of investments are determined within a framework that has established a fair value hierarchy based upon the various data inputs utilized in determining the value of the Portfolio’s investments. The three-level hierarchy gives the highest priority to unadjusted quoted prices in active markets for identical assets or liabilities (Level 1) and the lowest priority to unobservable inputs (Level 3). The Portfolio’s investments are classified within the fair value hierarchy based on the lowest level of input that is significant to the fair value measurement. The inputs are summarized into three broad levels as follows:
| ■ | Level 1 – quoted prices in active markets for identical securities |
| ■ | Level 2 – other significant observable inputs (including quoted prices for similar securities, interest rates, prepayment speeds, credit risk, etc.) |
| ■ | Level 3 – significant unobservable inputs (including the Portfolio’s own assumptions in determining the fair value of investments) |
The inputs or methodologies used for valuing investments in securities are not necessarily an indication of the risk associated with investing in those securities.
22 | Allspring Disciplined International Developed Markets Portfolio
Notes to financial statements
The following is a summary of the inputs used in valuing the Portfolio’s assets and liabilities as of May 31, 2022:
| | Quoted prices
(Level 1) | Other significant
observable inputs
(Level 2) | Significant
unobservable inputs
(Level 3) | Total |
| Assets | | | | |
| Investments in: | | | | |
| Common stocks | | | | |
| Australia | $ 12,229,753 | $ 70,126 | $0 | $ 12,299,879 |
| Austria | 368,742 | 0 | 0 | 368,742 |
| Belgium | 768,488 | 0 | 0 | 768,488 |
| Denmark | 4,399,235 | 0 | 0 | 4,399,235 |
| Finland | 1,796,315 | 0 | 0 | 1,796,315 |
| France | 17,943,155 | 0 | 0 | 17,943,155 |
| Germany | 12,345,581 | 0 | 0 | 12,345,581 |
| Hong Kong | 4,981,545 | 0 | 0 | 4,981,545 |
| Ireland | 1,254,591 | 0 | 0 | 1,254,591 |
| Israel | 725,774 | 0 | 0 | 725,774 |
| Italy | 2,478,416 | 0 | 0 | 2,478,416 |
| Japan | 35,041,262 | 0 | 0 | 35,041,262 |
| Luxembourg | 600,765 | 0 | 0 | 600,765 |
| Netherlands | 8,054,881 | 0 | 0 | 8,054,881 |
| New Zealand | 155,364 | 0 | 0 | 155,364 |
| Norway | 1,020,824 | 0 | 0 | 1,020,824 |
| Singapore | 1,415,138 | 0 | 0 | 1,415,138 |
| Spain | 4,097,069 | 0 | 0 | 4,097,069 |
| Sweden | 4,526,253 | 0 | 0 | 4,526,253 |
| Switzerland | 16,148,859 | 0 | 0 | 16,148,859 |
| United Kingdom | 24,736,034 | 0 | 0 | 24,736,034 |
| United States | 75,323 | 0 | 0 | 75,323 |
| Preferred stocks | | | | |
| Germany | 956,808 | 0 | 0 | 956,808 |
| Short-term investments | | | | |
| Investment companies | 6,338,781 | 0 | 0 | 6,338,781 |
| | 162,458,956 | 70,126 | 0 | 162,529,082 |
| Futures contracts | 9,559 | 0 | 0 | 9,559 |
| Total assets | $162,468,515 | $70,126 | $0 | $162,538,641 |
Futures contracts are reported at their cumulative unrealized gains (losses) at measurement date as reported in the table following the Portfolio of Investments. For futures contracts, the current day’s variation margin is reported on the Statement of Assets and Liabilities. All other assets and liabilities are reported at their market value at measurement date.
Additional sector, industry or geographic detail, if any, is included in the Portfolio of Investments.
For the year ended May 31, 2022, the Portfolio did not have any transfers into/out of Level 3.
4. TRANSACTIONS WITH AFFILIATES
Advisory fee
The Trust has entered into an advisory contract with Allspring Funds Management, a wholly owned subsidiary of Allspring Global Investments Holdings, LLC, a holding company indirectly owned by certain private funds of GTCR LLC and Reverence Capital Partners, L.P. The adviser is responsible for implementing investment policies and guidelines and for supervising the subadviser, who is responsible for day-to-day portfolio management of the Portfolio. Pursuant to the contract, Allspring Funds Management is entitled to receive an advisory fee at the following annual rate based on the Portfolio’s average daily net assets:
Allspring Disciplined International Developed Markets Portfolio | 23
Notes to financial statements
| Average daily net assets | Advisory fee |
| First $1 billion | 0.250% |
| Next $4 billion | 0.225 |
| Over $5 billion | 0.200 |
For the year ended May 31, 2022, the advisory fee was equivalent to an annual rate of 0.25% of the Portfolio’s average daily net assets.
Allspring Funds Management has retained the services of a subadviser to provide daily portfolio management to the Portfolio. The fee for subadvisory services is borne by Allspring Funds Management. Allspring Global Investments, LLC ("Allspring Investments"), an affiliate of Allspring Funds Management and a wholly owned subsidiary of Allspring Global Investments Holdings, LLC, is the subadviser to the Portfolio and is entitled to receive a fee from Allspring Funds Management at an annual rate starting at 0.20% and declining to 0.15% as the average daily net assets of the Portfolio increase.
Interfund transactions
The Portfolio may purchase or sell portfolio investment securities to certain affiliates pursuant to Rule 17a-7 under the 1940 Act and under procedures adopted by the Board of Trustees. The procedures have been designed to ensure that these interfund transactions, which do not incur broker commissions, are effected at current market prices.
5. INVESTMENT PORTFOLIO TRANSACTIONS
Purchases and sales of investments, excluding U.S. government obligations (if any) and short-term securities, for the year ended May 31, 2022 were $29,453,690 and $52,734,612, respectively.
6. SECURITIES LENDING TRANSACTIONS
The Portfolio lends its securities through an unaffiliated securities lending agent and receives collateral in the form of cash or securities with a value at least equal to the value of the securities on loan. The value of the loaned securities is determined at the close of each business day and any increases or decreases in the required collateral are exchanged between the Portfolio and the counterparty on the next business day. Cash collateral received is invested in the Securities Lending Fund which seeks to provide a positive return compared to the daily Federal Funds Open Rate by investing in high-quality, U.S. dollar-denominated short-term money market instruments and is exempt from registration under Section 3(c)(7) of the 1940 Act. Securities Lending Fund is managed by Allspring Funds Management and is subadvised by Allspring Investments. Allspring Funds Management receives an advisory fee starting at 0.05% and declining to 0.01% as the average daily net assets of the Securities Lending Fund increase. All of the fees received by Allspring Funds Management are paid to Allspring Investments for its services as subadviser.
In the event of counterparty default or the failure of a borrower to return a loaned security, the Portfolio has the right to use the collateral to offset any losses incurred. As of May 31, 2022, the Portfolio had securities lending transactions with the following counterparties which are subject to offset:
| Counterparty | Value of
securities on
loan | Collateral
received1 | Net amount |
| Bank of America Securities Incorporated | $1,107,193 | $(1,107,193) | $0 |
| BMO Capital Markets Corporation | 83 | (83) | 0 |
| Citigroup Global Markets Incorporated | 2,473,188 | (2,473,188) | 0 |
| JPMorgan Securities LLC | 381,311 | (381,311) | 0 |
| UBS Securities LLC | 482,448 | (482,448) | 0 |
1 Collateral received within this table is limited to the collateral for the net transaction with the counterparty.
7. DERIVATIVE TRANSACTIONS
During the year ended May 31, 2022, the Portfolio entered into futures contracts to gain market exposure. The Portfolio had an average notional amount of $3,512,659 in long futures contracts during the year ended May 31, 2022.
24 | Allspring Disciplined International Developed Markets Portfolio
Notes to financial statements
The fair value, realized gains or losses and change in unrealized gains or losses, if any, on derivative instruments are reflected in the corresponding financial statement captions.
8. BANK BORROWINGS
The Trust, along with Allspring Variable Trust and Allspring Funds Trust (excluding the money market funds), are parties to a $350,000,000 revolving credit agreement whereby the Portfolio is permitted to use bank borrowings for temporary or emergency purposes, such as to fund interest holders withdrawal requests. Interest under the credit agreement is charged to the Portfolio based on a borrowing rate equal to the higher of the Federal Funds rate in effect on that day plus 1.25% or the overnight bank funding rate in effect on that day plus 1.25%. In addition, an annual commitment fee equal to 0.25% of the unused balance is allocated to each participating fund.
For the year ended May 31, 2022, there were no borrowings by the Portfolio under the agreement.
9. CONCENTRATION RISKS
As of the end of the period, the Portfolio concentrated its portfolio of investments in Europe. A fund that invests a substantial portion of its assets in any country or geographic region will be more vulnerable than a fund that invests its assets more broadly to the economic, financial, political or other developments affecting that country or region. Such developments may have a significant impact on the Portfolio’s investment performance causing such performance to be more volatile than the investment performance of a more geographically diversified fund.
10. INDEMNIFICATION
Under the Portfolio's organizational documents, the officers and Trustees have been granted certain indemnification rights against certain liabilities that may arise out of performance of their duties to the Portfolio. The Portfolio has entered into a separate agreement with each Trustee that converts indemnification rights currently existing under the Portfolio’s organizational documents into contractual rights that cannot be changed in the future without the consent of the Trustee. Additionally, in the normal course of business, the Portfolio may enter into contracts with service providers that contain a variety of indemnification clauses. The Portfolio’s maximum exposure under these arrangements is dependent on future claims that may be made against the Portfolio and, therefore, cannot be estimated.
11. CORONAVIRUS (COVID-19) PANDEMIC
On March 11, 2020, the World Health Organization announced that it had made the assessment that coronavirus disease 2019 (“COVID-19”) is a pandemic. The impacts of COVID-19 are affecting the entire global economy, individual companies and investment products, the funds, and the market in general. There is significant uncertainty around the extent and duration of business disruptions related to COVID-19 and the impacts may last for an extended period of time. COVID-19 has led to significant uncertainty and volatility in the financial markets.
Allspring Disciplined International Developed Markets Portfolio | 25
Report of independent registered public accounting firm
To the Interest Holders of the Portfolio and Board of Trustees
Allspring Master Trust:
Opinion on the Financial Statements
We have audited the accompanying statement of assets and liabilities of Allspring Disciplined International Developed Markets Portfolio (formerly, Wells Fargo Disciplined International Developed Markets Portfolio) (the Portfolio), one of the portfolios constituting Allspring Master Trust (formerly, Wells Fargo Master Trust), including the portfolio of investments, as of May 31, 2022, the related statement of operations for the year then ended, the statements of changes in net assets for each of the years in the two-year period then ended, and the related notes (collectively, the financial statements) and the financial highlights for each of the years in the five-year period then ended. In our opinion, the financial statements and financial highlights present fairly, in all material respects, the financial position of the Portfolio as of May 31, 2022, the results of its operations for the year then ended, the changes in its net assets for each of the years in the two-year period then ended, and the financial highlights for each of the years in the five-year period then ended, in conformity with U.S. generally accepted accounting principles.
Basis for Opinion
These financial statements and financial highlights are the responsibility of the Portfolio’s management. Our responsibility is to express an opinion on these financial statements and financial highlights based on our audits. We are a public accounting firm registered with the Public Company Accounting Oversight Board (United States) (PCAOB) and are required to be independent with respect to the Portfolio in accordance with the U.S. federal securities laws and the applicable rules and regulations of the Securities and Exchange Commission and the PCAOB.
We conducted our audits in accordance with the standards of the PCAOB. Those standards require that we plan and perform the audit to obtain reasonable assurance about whether the financial statements and financial highlights are free of material misstatement, whether due to error or fraud. Our audits included performing procedures to assess the risks of material misstatement of the financial statements and financial highlights, whether due to error or fraud, and performing procedures that respond to those risks. Such procedures included examining, on a test basis, evidence regarding the amounts and disclosures in the financial statements and financial highlights. Such procedures also included confirmation of securities owned as of May 31, 2022, by correspondence with the custodian, transfer agent and brokers, or by other appropriate auditing procedures. Our audits also included evaluating the accounting principles used and significant estimates made by management, as well as evaluating the overall presentation of the financial statements and financial highlights. We believe that our audits provide a reasonable basis for our opinion.

We have not been able to determine the specific year that we began serving as the auditor of one or more Allspring Funds investment companies; however, we are aware that we have served as the auditor of one or more Allspring Funds investment companies since at least 1955.
Boston, Massachusetts
July 27, 2022
26 | Allspring Disciplined International Developed Markets Portfolio
Other information (unaudited)
PROXY VOTING INFORMATION
A description of the policies and procedures used to determine how to vote proxies relating to portfolio securities is available without charge, upon request, by calling 1-800-222-8222, visiting our website at allspringglobal.com, or visiting the SEC website at sec.gov. Information regarding how the proxies related to portfolio securities were voted during the most recent 12-month period ended June 30 is available on the website at allspringglobal.com or by visiting the SEC website at sec.gov.
QUARTERLY PORTFOLIO HOLDINGS INFORMATION
The Portfolio files its complete schedule of portfolio holdings with the SEC for the first and third quarters of each fiscal year as an exhibit to its reports on Form N-PORT. Interest holders may view the filed Form N-PORT by visiting the SEC website at sec.gov.
Allspring Disciplined International Developed Markets Portfolio | 27
Other information (unaudited)
BOARD OF TRUSTEES AND OFFICERS
Each of the Trustees and Officers listed in the table below acts in identical capacities for each fund in the Allspring family of funds, which consists of 137 mutual funds comprising the Allspring Funds Trust, Allspring Variable Trust, Allspring Master Trust and four closed-end funds (collectively the “Fund Complex”). This table should be read in conjunction with the Prospectus and the Statement of Additional Information. The mailing address of each Trustee and Officer is 525 Market Street, 12th Floor, San Francisco, CA 94105. Each Trustee and Officer serves an indefinite term, however, each Trustee serves such term until reaching the mandatory retirement age established by the Trustees.
Independent Trustees
Name and
year of birth | Position held and
length of service* | Principal occupations during past five years or longer | Current other
public company or
investment
company
directorships |
William R. Ebsworth
(Born 1957) | Trustee,
since 2015 | Retired. From 1984 to 2013, equities analyst, portfolio manager, research director and chief investment officer at Fidelity Management and Research Company in Boston, Tokyo, and Hong Kong, and retired in 2013 as Chief Investment Officer of Fidelity Strategic Advisers, Inc. where he led a team of investment professionals managing client assets. Prior thereto, Board member of Hong Kong Securities Clearing Co., Hong Kong Options Clearing Corp., the Thailand International Fund, Ltd., Fidelity Investments Life Insurance Company, and Empire Fidelity Investments Life Insurance Company. Audit Committee Chair and Investment Committee Chair of the Vincent Memorial Hospital Endowment (non-profit organization). Mr. Ebsworth is a CFA® charterholder. | N/A |
Jane A. Freeman
(Born 1953) | Trustee,
since 2015;
Chair Liaison,
since 2018 | Retired. From 2012 to 2014 and 1999 to 2008, Chief Financial Officer of Scientific Learning Corporation. From 2008 to 2012, Ms. Freeman provided consulting services related to strategic business projects. Prior to 1999, Portfolio Manager at Rockefeller & Co. and Scudder, Stevens & Clark. Board member of the Harding Loevner Funds from 1996 to 2014, serving as both Lead Independent Director and chair of the Audit Committee. Board member of the Russell Exchange Traded Funds Trust from 2011 to 2012 and the chair of the Audit Committee. Ms. Freeman is also an inactive Chartered Financial Analyst. | N/A |
Isaiah Harris, Jr.
(Born 1952) | Trustee,
since 2009; Audit
Committee
Chair,
since 2019 | Retired. Chairman of the Board of CIGNA Corporation from 2009 to 2021, and Director from 2005 to 2008. From 2003 to 2011, Director of Deluxe Corporation. Prior thereto, President and CEO of BellSouth Advertising and Publishing Corp. from 2005 to 2007, President and CEO of BellSouth Enterprises from 2004 to 2005 and President of BellSouth Consumer Services from 2000 to 2003. Emeritus member of the Iowa State University Foundation Board of Governors. Emeritus Member of the Advisory Board of Iowa State University School of Business. Advisory Board Member, Palm Harbor Academy (private school). Advisory Board Member, Fellowship of Christian Athletes. Mr. Harris is a certified public accountant (inactive status). | N/A |
David F. Larcker
(Born 1950) | Trustee,
since 2009 | James Irvin Miller Professor of Accounting at the Graduate School of Business (Emeritus), Stanford University, Director of the Corporate Governance Research Initiative and Senior Faculty of The Rock Center for Corporate Governance since 2006. From 2005 to 2008, Professor of Accounting at the Graduate School of Business, Stanford University. Prior thereto, Ernst & Young Professor of Accounting at The Wharton School, University of Pennsylvania from 1985 to 2005. | N/A |
28 | Allspring Disciplined International Developed Markets Portfolio
Other information (unaudited)
Name and
year of birth | Position held and
length of service* | Principal occupations during past five years or longer | Current other
public company or
investment
company
directorships |
Olivia S. Mitchell
(Born 1953) | Trustee,
since 2006;
Nominating and
Governance
Committee Chair,
since 2018 | International Foundation of Employee Benefit Plans Professor since 1993, Wharton School of the University of Pennsylvania. Director of Wharton’s Pension Research Council and Boettner Center on Pensions & Retirement Research, and Research Associate at the National Bureau of Economic Research. Previously taught at Cornell University from 1978 to 1993. | N/A |
Timothy J. Penny
(Born 1951) | Trustee,
since 1996;
Chair,
since 2018 | President and Chief Executive Officer of Southern Minnesota Initiative Foundation, a non-profit organization, since 2007. Member of the Board of Trustees of NorthStar Education Finance, Inc., a non-profit organization, since 2007. | N/A |
James G. Polisson
(Born 1959) | Trustee,
since 2018 | Retired. Chief Marketing Officer, Source (ETF) UK Services, Ltd, from 2015 to 2017. From 2012 to 2015, Principal of The Polisson Group, LLC, a management consulting, corporate advisory and principal investing company. Chief Executive Officer and Managing Director at Russell Investments, Global Exchange Traded Funds from 2010 to 2012. Managing Director of Barclays Global Investors from 1998 to 2010 and Global Chief Marketing Officer for iShares and Barclays Global Investors from 2000 to 2010. Trustee of the San Francisco Mechanics’ Institute, a non-profit organization, from 2013 to 2015. Board member of the Russell Exchange Traded Fund Trust from 2011 to 2012. Director of Barclays Global Investors Holdings Deutschland GmbH from 2006 to 2009. Mr. Polisson is an attorney and has a retired status with the Massachusetts and District of Columbia Bar Associations. | N/A |
Pamela Wheelock
(Born 1959) | Trustee,
since January
2020; previously
Trustee from
January 2018 to
July 2019 | Board member of the Destination Medical Center Economic Development Agency, Rochester, Minnesota since 2019. Interim President of the McKnight Foundation from January to September 2020. McKnight Foundation Consultant, November 2020 to February 2021. Acting Commissioner, Minnesota Department of Human Services, July 2019 through September 2019. Consultant (part-time), Minnesota Department of Human Services, October 2019 through December 2019. Chief Operating Officer, Twin Cities Habitat for Humanity from 2017 to 2019. Vice President of University Services, University of Minnesota from 2012 to 2016. Prior thereto, on the Board of Directors, Governance Committee and Finance Committee for the Minnesota Philanthropy Partners (Saint Paul Foundation) from 2012 to 2018, Interim Chief Executive Officer of Blue Cross Blue Shield of Minnesota from 2011 to 2012, Chairman of the Board from 2009 to 2012 and Board Director from 2003 to 2015. Vice President, Leadership and Community Engagement, Bush Foundation, Saint Paul, Minnesota (a private foundation) from 2009 to 2011. Executive Vice President and Chief Financial Officer, Minnesota Sports and Entertainment from 2004 to 2009 and Senior Vice President from 2002 to 2004. Executive Vice President of the Minnesota Wild Foundation from 2004 to 2008. Commissioner of Finance, State of Minnesota, from 1999 to 2002. Currently Board Chair of the Minnesota Wild Foundation since 2010. | N/A |
* Length of service dates reflect the Trustee’s commencement of service with the Trust’s predecessor entities, where applicable.
Allspring Disciplined International Developed Markets Portfolio | 29
Other information (unaudited)
Officers2
Name and
year of birth | Position held and
length of service | Principal occupations during past five years or longer |
Andrew Owen
(Born 1960) | President,
since 2017 | President, Chief Executive Officer and Director of Allspring Funds Management, LLC since 2017 and co-president of Galliard Capital Management, LLC, an affiliate of Allspring Funds Management, LLC, since 2019. Prior thereto, Head of Affiliated Managers, Allspring Global Investments, from 2014 to 2019 and Executive Vice President responsible for marketing, investments and product development for Allspring Funds Management, LLC, from 2009 to 2014. In addition, Mr. Owen was an Executive Vice President of Wells Fargo & Company from 2014 to 2021. |
Jeremy DePalma
(Born 1974) | Treasurer,
since 2012
(for certain funds in
the Fund Complex);
since 2021 (for
the remaining funds in the
Fund Complex) | Senior Vice President of Allspring Funds Management, LLC since 2009. Senior Vice President of Evergreen Investment Management Company, LLC from 2008 to 2010 and head of the Fund Reporting and Control Team within Fund Administration from 2005 to 2010. |
Kate McKinley
(Born 1977) | Chief Legal Officer,
since 2021 | Chief Legal Officer of Allspring Global Investments since 2021. Prior thereto, held various roles at State Street Global Advisors beginning in 2010, including serving as Senior Vice President and General Counsel from 2019 to 2021, and Chief Operating Officer of the Institutional Client Group from 2016 - 2019. Prior to working at State Street Global Advisors served as Assistant General Counsel for Bank of America Corporation from 2005 to 2010 and as an Associate at WilmerHale from 2002 to 2005. |
Christopher Baker
(Born 1976) | Chief Compliance Officer, since 2022 | Global Chief Compliance Officer for Allspring Global Investments since 2022. Prior thereto, Chief Compliance Officer for State Street Global Advisors from 2018 to 2021. Senior Compliance Officer for the State Street divisions of Alternative Investment Solutions, Sector Solutions, and Global Marketing from 2015 to 2018. From 2010 to 2015 Vice President, Global Head of Investment and Marketing Compliance for State Street Global Advisors. |
Matthew Prasse
(Born 1983) | Secretary,
since 2021 | Senior Counsel of the Allspring Legal Department since 2021. Senior Counsel of the Wells Fargo Legal Department from 2018 to 2021. Previously, Counsel for Barings LLC from 2015 to 2018. Prior to joining Barings, Associate at Morgan, Lewis & Bockius LLP from 2008 to 2015. |
1 The Statement of Additional Information includes additional information about the Trustees and is available, without charge, upon request, by calling 1-800-222-8222.
2 For those Officers with tenures at Allspring Global Investments and/or Allspring Funds Management, LLC that began prior to 2021, such tenures include years of service during which these businesses/entities were known as Wells Fargo Asset Management and Wells Fargo Funds Management, LLC, respectively.
30 | Allspring Disciplined International Developed Markets Portfolio
Other information (unaudited)
LIQUIDITY RISK MANAGEMENT PROGRAM
In accordance with Rule 22e-4 under the Investment Company Act of 1940, as amended (the “Liquidity Rule”), Allspring Master Trust (the “Trust”) has adopted and implemented a liquidity risk management program (the “Program”) on behalf of each of its series, including the Portfolio, which is reasonably designed to assess and manage the Portfolio's liquidity risk. “Liquidity risk” is defined under the Liquidity Rule as the risk that the Portfolio is unable to meet redemption requests without significantly diluting remaining investors’ interests in the Portfolio. The Trust’s Board of Trustees (the “Board”) previously approved the designation of Allspring Funds Management, LLC (“Allspring Funds Management”), the Portfolio's investment adviser, to administer the Program, and Allspring Funds Management has established a Liquidity Risk Management Council (the "Council") composed of personnel from multiple departments within Allspring Funds Management and its affiliates to assist Allspring Funds Management in the administration of the Program.
The Program is comprised of various components designed to support the assessment and/or management of liquidity risk, including: (1) the periodic assessment (no less frequently than annually) of certain factors that influence the Portfolio's liquidity risk; (2) the periodic classification (no less frequently than monthly) of the Portfolio's investments into one of four liquidity categories that reflect an estimate of their liquidity under current market conditions; (3) a 15% limit on the acquisition of “illiquid investments” (as defined under the Liquidity Rule); (4) to the extent the Portfolio does not invest primarily in “highly liquid investments” (as defined under the Liquidity Rule), the determination of a minimum percentage of the Portfolio's assets that generally will be invested in highly liquid investments (an “HLIM”); (5) if the Portfolio has established an HLIM, the periodic review (no less frequently than annually) of the HLIM and the adoption of policies and procedures for responding to a shortfall of the Portfolio's “highly liquid investments” below its HLIM; and (6) periodic reporting to the Board.
At a meeting of the Board held on May 24-25, 2022, the Board received and reviewed a written report (the “Report”) from Allspring Funds Management that, among other things, addressed the operation of the Program and assessed its adequacy and effectiveness for the period from January 1, 2021 through December 31, 2021 (the “Reporting Period”). Other than extended foreign market holidays, no significant liquidity events impacting the Portfolios were noted in the Report. In addition, other than corporate-related changes to the Program, there were no material changes to the Program during the Reporting Period.
Allspring Funds Management determined in the Report that the Program has been implemented and operates effectively to manage each Portfolio’s, including the Portfolio’s, liquidity risk, and Allspring Funds Management continues to believe that the Program has been and continues to be adequately and effectively implemented to monitor and, as applicable, respond to the Portfolio’s liquidity developments.
There can be no assurance that the Program will achieve its objectives under all circumstances in the future.
Allspring Disciplined International Developed Markets Portfolio | 31
For more information
More information about Allspring Funds is available free upon request. To obtain literature, please write, visit the Portfolio's website, or call:
Allspring Funds
P.O. Box 219967
Kansas City, MO 64121-9967
Website: allspringglobal.com
Individual investors: 1-800-222-8222
Retail investment professionals: 1-888-877-9275
Institutional investment professionals: 1-800-260-5969
This report and the financial statements contained herein are submitted for the general information of the interest holders of the Portfolio. If this report is used for promotional purposes, distribution of the report must be accompanied or preceded by a current prospectus. Before investing, please consider the investment objectives, risks, charges, and expenses of the investment. For a current prospectus and, if available, a summary prospectus, containing this information, call
1-800-222-8222. Read the prospectus carefully before you invest or send money.
Allspring Global InvestmentsTM is the trade name for the asset management firms of Allspring Global Investments Holdings, LLC, a holding company indirectly owned by certain private funds of GTCR LLC and Reverence Capital Partners, L.P. These firms include but are not limited to Allspring Global Investments, LLC, and Allspring Funds Management, LLC. Certain products managed by Allspring entities are distributed by Allspring Funds Distributor, LLC (a broker-dealer and Member FINRA/SIPC).
This material is for general informational and educational purposes only and is NOT intended to provide investment advice or a recommendation of any kind - including a recommendation for any specific investment, strategy, or plan.
© 2022 Allspring Global Investments Holdings, LLC. All rights reserved.
Annual Report
May 31, 2022
Allspring
Large Company Value Portfolio
Allspring Large Company Value Portfolio | 1
Notice to Shareholders
Russia launched a large-scale invasion of Ukraine on February 24, 2022. As a result of this military action, the United States and many other countries have instituted various economic sanctions against Russian and Belarus individuals and entities. The situation has led to increased financial market volatility and has had severe adverse effects on regional and global economic markets, including the markets for certain securities and commodities, such as oil and natural gas. The extent and duration of the military action, resulting sanctions imposed, other punitive action taken and the resulting market disruptions cannot be easily predicted.
Our solidarity and support goes out to our impacted employees and the people affected in Ukraine and their families. Allspring has a dedicated team of investment professionals actively monitoring the situation for any new developments and the potential impact to our clients and investment products. As the situation remains fluid, we are focused on the assessment of risks, valuation, and liquidity of impacted securities. Please visit our website at allspringglobal.com and click on “Russia-Ukraine Updates” for further information.
2 | Allspring Large Company Value Portfolio
This page is intentionally left blank.
Portfolio information (unaudited)
| Investment objective | The Portfolio seeks long-term capital appreciation. |
| Manager | Allspring Funds Management, LLC |
| Subadviser | Allspring Global Investments, LLC |
| Portfolio managers | Ryan Brown, CFA®‡, Harindra de Silva, Ph.D., CFA®‡ |
| Ten largest holdings (%) as of May 31, 20221 |
| Pfizer Incorporated | 3.48 |
| Exxon Mobil Corporation | 3.43 |
| NextEra Energy Incorporated | 2.81 |
| Comcast Corporation Class A | 2.61 |
| Emerson Electric Company | 2.20 |
| Cigna Corporation | 2.19 |
| General Dynamics Corporation | 2.15 |
| Altria Group Incorporated | 2.14 |
| Humana Incorporated | 2.10 |
| Verizon Communications Incorporated | 1.94 |
| 1 | Figures represent the percentage of the Portfolio's net assets. Holdings are subject to change and may have changed since the date specified. |
| Sector allocation as of May 31, 20221 |
| 1 | Figures represent the percentage of the Portfolio's long-term investments. These amounts are subject to change and may have changed since the date specified. |
| ‡ | CFA® and Chartered Financial Analyst® are trademarks owned by CFA Institute. |
4 | Allspring Large Company Value Portfolio
Portfolio of investments—May 31, 2022
| | | | | Shares | Value |
| Common stocks: 97.51% | | | | | |
| Communication services: 6.50% | | | | | |
| Diversified telecommunication services: 2.47% | | | | | |
| AT&T Incorporated | | | | 54,580 | $ 1,162,008 |
| Verizon Communications Incorporated | | | | 81,897 | 4,200,497 |
| | | | | | 5,362,505 |
| Entertainment: 0.67% | | | | | |
| The Walt Disney Company † | | | | 9,208 | 1,016,932 |
| Warner Bros. Discovery Incorporated † | | | | 23,299 | 429,867 |
| | | | | | 1,446,799 |
| Media: 2.61% | | | | | |
| Comcast Corporation Class A | | | | 127,919 | 5,664,253 |
| Wireless telecommunication services: 0.75% | | | | | |
| T-Mobile US Incorporated † | | | | 12,175 | 1,622,806 |
| Consumer discretionary: 3.38% | | | | | |
| Automobiles: 0.80% | | | | | |
| Ford Motor Company | | | | 43,159 | 590,415 |
| General Motors Company † | | | | 29,245 | 1,131,197 |
| | | | | | 1,721,612 |
| Hotels, restaurants & leisure: 1.71% | | | | | |
| Bloomin' Brands Incorporated | | | | 39,016 | 823,628 |
| McDonald's Corporation | | | | 11,464 | 2,891,335 |
| | | | | | 3,714,963 |
| Multiline retail: 0.12% | | | | | |
| Target Corporation | | | | 1,628 | 263,541 |
| Specialty retail: 0.75% | | | | | |
| Ulta Beauty Incorporated † | | | | 3,820 | 1,616,242 |
| Consumer staples: 8.66% | | | | | |
| Beverages: 1.60% | | | | | |
| PepsiCo Incorporated | | | | 20,626 | 3,460,012 |
| Food & staples retailing: 1.04% | | | | | |
| Costco Wholesale Corporation | | | | 2,313 | 1,078,367 |
| Sysco Corporation | | | | 8,856 | 745,498 |
| Walmart Incorporated | | | | 3,307 | 425,379 |
| | | | | | 2,249,244 |
| Food products: 3.11% | | | | | |
| Archer Daniels Midland Company | | | | 22,936 | 2,083,048 |
| Bunge Limited | | | | 21,740 | 2,572,277 |
| Tyson Foods Incorporated Class A | | | | 23,384 | 2,095,440 |
| | | | | | 6,750,765 |
| Household products: 0.77% | | | | | |
| The Procter & Gamble Company | | | | 11,229 | 1,660,545 |
The accompanying notes are an integral part of these financial statements.
Allspring Large Company Value Portfolio | 5
Portfolio of investments—May 31, 2022
| | | | | Shares | Value |
| Tobacco: 2.14% | | | | | |
| Altria Group Incorporated | | | | 85,821 | $ 4,642,058 |
| Energy: 8.32% | | | | | |
| Oil, gas & consumable fuels: 8.32% | | | | | |
| Chevron Corporation | | | | 1,588 | 277,360 |
| ConocoPhillips | | | | 27,036 | 3,037,765 |
| EOG Resources Incorporated | | | | 14,255 | 1,952,365 |
| Exxon Mobil Corporation | | | | 77,418 | 7,432,128 |
| Marathon Petroleum Corporation | | | | 22,665 | 2,307,070 |
| PDC Energy Incorporated | | | | 838 | 66,319 |
| SM Energy Company | | | | 15,003 | 724,195 |
| Targa Resources Corporation | | | | 5,107 | 367,806 |
| Valero Energy Corporation | | | | 14,392 | 1,865,203 |
| | | | | | 18,030,211 |
| Financials: 17.74% | | | | | |
| Banks: 9.05% | | | | | |
| Bank of America Corporation | | | | 111,236 | 4,137,979 |
| Citigroup Incorporated | | | | 16,256 | 868,233 |
| Comerica Incorporated | | | | 18,296 | 1,522,410 |
| Community Bank System Incorporated | | | | 9,922 | 654,852 |
| First Financial Bankshares Incorporated | | | | 40,299 | 1,661,931 |
| Hancock Whitney Corporation | | | | 28,376 | 1,414,260 |
| JPMorgan Chase & Company | | | | 31,612 | 4,180,055 |
| PNC Financial Services Group Incorporated | | | | 4,562 | 800,220 |
| Truist Financial Corporation | | | | 40,360 | 2,007,506 |
| US Bancorp | | | | 14,448 | 766,755 |
| Zions Bancorporation | | | | 27,935 | 1,593,412 |
| | | | | | 19,607,613 |
| Capital markets: 2.07% | | | | | |
| BlackRock Incorporated | | | | 62 | 41,483 |
| CME Group Incorporated | | | | 1,163 | 231,239 |
| Intercontinental Exchange Incorporated | | | | 36,544 | 3,741,740 |
| S&P Global Incorporated | | | | 1,381 | 482,632 |
| | | | | | 4,497,094 |
| Consumer finance: 1.78% | | | | | |
| Capital One Financial Corporation | | | | 21,006 | 2,685,827 |
| Discover Financial Services | | | | 5,852 | 664,143 |
| OneMain Holdings Incorporated | | | | 11,409 | 502,681 |
| | | | | | 3,852,651 |
| Diversified financial services: 1.09% | | | | | |
| Berkshire Hathaway Incorporated Class B † | | | | 7,507 | 2,372,062 |
| Insurance: 3.75% | | | | | |
| American Financial Group Incorporated | | | | 708 | 100,040 |
| Axis Capital Holdings Limited | | | | 37,150 | 2,175,876 |
| MetLife Incorporated | | | | 30,883 | 2,081,205 |
| Old Republic International Corporation | | | | 2,861 | 68,435 |
| Progressive Corporation | | | | 6,038 | 720,816 |
| Stewart Information Services Corporation | | | | 13,171 | 730,859 |
The accompanying notes are an integral part of these financial statements.
6 | Allspring Large Company Value Portfolio
Portfolio of investments—May 31, 2022
| | | | | Shares | Value |
| Insurance (continued) | | | | | |
| The Hanover Insurance Group Incorporated | | | | 12,927 | $ 1,895,098 |
| W.R. Berkley Corporation | | | | 4,880 | 347,114 |
| | | | | | 8,119,443 |
| Health care: 19.28% | | | | | |
| Biotechnology: 3.06% | | | | | |
| AbbVie Incorporated | | | | 28,398 | 4,185,013 |
| Vertex Pharmaceuticals Incorporated † | | | | 9,135 | 2,454,118 |
| | | | | | 6,639,131 |
| Health care equipment & supplies: 2.47% | | | | | |
| Abbott Laboratories | | | | 20,201 | 2,372,809 |
| Baxter International Incorporated | | | | 2,368 | 180,086 |
| Becton Dickinson & Company | | | | 2,392 | 611,874 |
| Stryker Corporation | | | | 9,333 | 2,188,589 |
| | | | | | 5,353,358 |
| Health care providers & services: 6.79% | | | | | |
| Anthem Incorporated | | | | 7,056 | 3,595,808 |
| Cigna Corporation | | | | 17,668 | 4,740,148 |
| CVS Health Corporation | | | | 15,525 | 1,502,044 |
| Humana Incorporated | | | | 10,011 | 4,547,297 |
| UnitedHealth Group Incorporated | | | | 643 | 319,430 |
| | | | | | 14,704,727 |
| Life sciences tools & services: 1.59% | | | | | |
| IQVIA Holdings Incorporated † | | | | 994 | 213,959 |
| Thermo Fisher Scientific Incorporated | | | | 5,707 | 3,239,122 |
| | | | | | 3,453,081 |
| Pharmaceuticals: 5.37% | | | | | |
| Johnson & Johnson | | | | 3,658 | 656,721 |
| Merck & Company Incorporated | | | | 17,377 | 1,599,205 |
| Pfizer Incorporated | | | | 142,259 | 7,545,417 |
| Viatris Incorporated | | | | 149,133 | 1,829,862 |
| | | | | | 11,631,205 |
| Industrials: 10.15% | | | | | |
| Aerospace & defense: 3.90% | | | | | |
| General Dynamics Corporation | | | | 20,754 | 4,667,782 |
| Lockheed Martin Corporation | | | | 3,134 | 1,379,305 |
| Raytheon Technologies Corporation | | | | 25,246 | 2,401,400 |
| | | | | | 8,448,487 |
| Electrical equipment: 2.20% | | | | | |
| Emerson Electric Company | | | | 53,769 | 4,767,160 |
| Industrial conglomerates: 1.30% | | | | | |
| 3M Company | | | | 1,874 | 279,769 |
| General Electric Company | | | | 7,842 | 613,950 |
The accompanying notes are an integral part of these financial statements.
Allspring Large Company Value Portfolio | 7
Portfolio of investments—May 31, 2022
| | | | | Shares | Value |
| Industrial conglomerates (continued) | | | | | |
| Honeywell International Incorporated | | | | 6,001 | $ 1,161,914 |
| Roper Technologies Incorporated | | | | 1,709 | 756,130 |
| | | | | | 2,811,763 |
| Machinery: 1.59% | | | | | |
| Mueller Industries Incorporated | | | | 63,832 | 3,437,353 |
| Marine: 0.91% | | | | | |
| Matson Incorporated | | | | 22,041 | 1,981,045 |
| Road & rail: 0.25% | | | | | |
| CSX Corporation | | | | 16,921 | 537,919 |
| Information technology: 9.09% | | | | | |
| Communications equipment: 0.67% | | | | | |
| Cisco Systems Incorporated | | | | 32,194 | 1,450,340 |
| Electronic equipment, instruments & components: 1.77% | | | | | |
| Amphenol Corporation Class A | | | | 17,381 | 1,231,618 |
| Arrow Electronics Incorporated † | | | | 12,596 | 1,519,707 |
| Avnet Incorporated | | | | 22,534 | 1,091,772 |
| | | | | | 3,843,097 |
| IT services: 1.26% | | | | | |
| Automatic Data Processing Incorporated | | | | 12,242 | 2,729,231 |
| Semiconductors & semiconductor equipment: 2.07% | | | | | |
| Intel Corporation | | | | 30,108 | 1,337,397 |
| Micron Technology Incorporated | | | | 42,538 | 3,141,006 |
| | | | | | 4,478,403 |
| Software: 3.32% | | | | | |
| InterDigital Incorporated | | | | 11,399 | 744,241 |
| Intuit Incorporated | | | | 3,271 | 1,355,699 |
| Oracle Corporation | | | | 20,387 | 1,466,233 |
| SS&C Technologies Holdings Incorporated | | | | 43,749 | 2,799,499 |
| Synopsys Incorporated † | | | | 2,569 | 820,025 |
| | | | | | 7,185,697 |
| Materials: 3.48% | | | | | |
| Chemicals: 1.89% | | | | | |
| Dow Incorporated | | | | 60,073 | 4,083,763 |
| Metals & mining: 1.59% | | | | | |
| Freeport-McMoRan Incorporated | | | | 88,291 | 3,450,412 |
| Real estate: 4.28% | | | | | |
| Equity REITs: 4.28% | | | | | |
| Apple Hospitality REIT Incorporated | | | | 9,756 | 163,023 |
| EPR Properties | | | | 10,347 | 530,180 |
| Outfront Media Incorporated | | | | 71,291 | 1,470,733 |
| PotlatchDeltic Corporation | | | | 45,246 | 2,373,605 |
| Prologis Incorporated | | | | 7,153 | 911,864 |
| Public Storage Incorporated | | | | 5,954 | 1,968,631 |
The accompanying notes are an integral part of these financial statements.
8 | Allspring Large Company Value Portfolio
Portfolio of investments—May 31, 2022
| | | | | Shares | Value |
| Equity REITs (continued) | | | | | |
| SITE Centers Corporation | | | | 3,554 | $ 55,869 |
| VICI Properties Incorporated | | | | 1,431 | 44,146 |
| Weyerhaeuser Company | | | | 44,638 | 1,764,094 |
| | | | | | 9,282,145 |
| Utilities: 6.63% | | | | | |
| Electric utilities: 3.24% | | | | | |
| American Electric Power Company Incorporated | | | | 9,064 | 924,800 |
| NextEra Energy Incorporated | | | | 80,581 | 6,099,174 |
| | | | | | 7,023,974 |
| Gas utilities: 1.00% | | | | | |
| Atmos Energy Corporation | | | | 18,533 | 2,155,573 |
| Independent power & renewable electricity producers: 1.81% | | | | | |
| Vistra Energy Corporation | | | | 148,618 | 3,919,057 |
| Multi-utilities: 0.58% | | | | | |
| Sempra Energy | | | | 7,724 | 1,265,655 |
| Total Common stocks (Cost $205,780,613) | | | | | 211,286,995 |
| | | Yield | | | |
| Short-term investments: 2.07% | | | | | |
| Investment companies: 2.07% | | | | | |
| Allspring Government Money Market Fund Select Class ♠∞ | | 0.65% | | 4,485,592 | 4,485,592 |
| Total Short-term investments (Cost $4,485,592) | | | | | 4,485,592 |
| Total investments in securities (Cost $210,266,205) | 99.58% | | | | 215,772,587 |
| Other assets and liabilities, net | 0.42 | | | | 902,738 |
| Total net assets | 100.00% | | | | $216,675,325 |
| † | Non-income-earning security |
| ♠ | The issuer of the security is an affiliated person of the Portfolio as defined in the Investment Company Act of 1940. |
| ∞ | The rate represents the 7-day annualized yield at period end. |
| Abbreviations: |
| REIT | Real estate investment trust |
Investments in affiliates
An affiliated investment is an investment in which the Portfolio owns at least 5% of the outstanding voting shares of the issuer or as a result of other relationships, such as the Portfolio and the issuer having the same adviser or investment manager. Transactions with issuers that were affiliates of the Portfolio at the end of the period were as follows:
| | Value,
beginning of
period | Purchases | Sales
proceeds | Net
realized
gains
(losses) | Net
change in
unrealized
gains
(losses) | Value,
end of
period | Shares,
end
of period | Income
from
affiliated
securities |
| Short-term investments | | | | | | | |
| Allspring Government Money Market Fund Select Class | $3,849,497 | $58,979,368 | $(58,343,273) | $0 | $0 | $4,485,592 | 4,485,592 | $3,977 |
The accompanying notes are an integral part of these financial statements.
Allspring Large Company Value Portfolio | 9
Portfolio of investments—May 31, 2022
Futures contracts
| Description | Number of
contracts | Expiration
date | Notional
cost | Notional
value | Unrealized
gains | Unrealized
losses |
| Long | | | | | | |
| E-Mini S&P 500 Index | 23 | 6-17-2022 | $4,834,435 | $4,750,938 | $0 | $(83,497) |
The accompanying notes are an integral part of these financial statements.
10 | Allspring Large Company Value Portfolio
Statement of assets and liabilities—May 31, 2022
| | |
| Assets | |
Investments in unaffiliated securities, at value (cost $205,780,613)
| $ 211,286,995 |
Investments in affiliated securities, at value (cost $4,485,592)
| 4,485,592 |
Cash at broker segregated for futures contracts
| 535,000 |
Receivable for dividends
| 458,412 |
Prepaid expenses and other assets
| 4,169 |
Total assets
| 216,770,168 |
| Liabilities | |
Advisory fee payable
| 54,904 |
Payable for daily variation margin on open futures contracts
| 30,388 |
Custody and accounting fees payable
| 6,607 |
Accrued expenses and other liabilities
| 2,944 |
Total liabilities
| 94,843 |
Total net assets
| $216,675,325 |
The accompanying notes are an integral part of these financial statements.
Allspring Large Company Value Portfolio | 11
Statement of operations—year ended May 31, 2022
| | |
| Investment income | |
Dividends (net of foreign withholdings taxes of $22,794)
| $ 5,066,179 |
Income from affiliated securities
| 3,977 |
Total investment income
| 5,070,156 |
| Expenses | |
Advisory fee
| 881,332 |
Custody and accounting fees
| 29,370 |
Professional fees
| 73,022 |
Interest holder report expenses
| 26,155 |
Trustees’ fees and expenses
| 19,821 |
Other fees and expenses
| 12,079 |
Total expenses
| 1,041,779 |
Less: Fee waivers and/or expense reimbursements
| (36,411) |
Net expenses
| 1,005,368 |
Net investment income
| 4,064,788 |
| Realized and unrealized gains (losses) on investments | |
| Net realized gains on | |
Unaffiliated securities
| 18,747,454 |
Futures contracts
| 515,588 |
Net realized gains on investments
| 19,263,042 |
| Net change in unrealized gains (losses) on | |
Unaffiliated securities
| (15,950,924) |
Futures contracts
| (143,939) |
Net change in unrealized gains (losses) on investments
| (16,094,863) |
Net realized and unrealized gains (losses) on investments
| 3,168,179 |
Net increase in net assets resulting from operations
| $ 7,232,967 |
The accompanying notes are an integral part of these financial statements.
12 | Allspring Large Company Value Portfolio
Statement of changes in net assets
| | | |
| | Year ended
May 31, 2022 | Year ended
May 31, 2021 |
| Operations | | |
Net investment income
| $ 4,064,788 | $ 3,775,447 |
Net realized gains on investments
| 19,263,042 | 101,388,910 |
Net change in unrealized gains (losses) on investments
| (16,094,863) | (3,681,890) |
Net increase in net assets resulting from operations
| 7,232,967 | 101,482,467 |
| Capital transactions | | |
| Transactions in investors’ beneficial interests | | |
Contributions
| 876,482 | 42,173,014 |
Withdrawals
| (81,048,833) | (76,489,354) |
Net decrease in net assets resulting from capital transactions
| (80,172,351) | (34,316,340) |
Total increase (decrease) in net assets
| (72,939,384) | 67,166,127 |
| Net assets | | |
Beginning of period
| 289,614,709 | 222,448,582 |
End of period
| $216,675,325 | $289,614,709 |
The accompanying notes are an integral part of these financial statements.
Allspring Large Company Value Portfolio | 13
| | Year ended May 31 |
| | 2022 | 2021 | 2020 | 2019 | 2018 |
Total return
| 2.39% | 51.44% | (0.09)% | (0.94)% | 9.80% |
| Ratios to average net assets (annualized) | | | | | |
Gross expenses
| 0.41% | 0.40% | 0.39% | 0.39% | 0.49% |
Net expenses1
| 0.40% | 0.40% | 0.39% | 0.39% | 0.42% |
Net investment income
| 1.61% | 1.55% | 2.05% | 2.29% | 1.56% |
| Supplemental data | | | | | |
Portfolio turnover rate
| 399% | 482% | 335% | 246% | 244% |
| 1 | Net expense ratios reflect voluntary waivers. |
The accompanying notes are an integral part of these financial statements.
14 | Allspring Large Company Value Portfolio
Notes to financial statements
1. ORGANIZATION
Allspring Master Trust (the "Trust"), a Delaware statutory trust organized on March 10, 1999, is an open-end management investment company registered under the Investment Company Act of 1940, as amended (the "1940 Act"). As an investment company, the Trust follows the accounting and reporting guidance in Financial Accounting Standards Board ("FASB") Accounting Standards Codification Topic 946, Financial Services – Investment Companies. These financial statements report on the Allspring Large Company Value Portfolio (the "Portfolio") which is a diversified series of the Trust.
Interests in the Portfolio are available solely through private placement transactions that do not involve any "public offering" within the meaning of Section 4(a)(2) of the Securities Act of 1933.
Effective on November 1, 2021, the sale transaction of Wells Fargo Asset Management ("WFAM") by Wells Fargo & Company to GTCR LLC and Reverence Capital Partners, L.P. was closed. In connection with the closing of the transaction, WFAM became known as Allspring Global Investments (“Allspring”) and various entities that provided services to the Portfolio changed their names to "Allspring", including Allspring Funds Management, LLC, the adviser to the Portfolio, Allspring Global Investments, LLC and Allspring Global Investments (UK) Limited, both registered investment advisers providing subadvisory services to certain funds, and Allspring Funds Distributor, LLC. Consummation of the transaction resulted in a new advisory agreement and subadvisory agreement which became effective on November 1, 2021.
2. SIGNIFICANT ACCOUNTING POLICIES
The following significant accounting policies, which are consistently followed in the preparation of the financial statements of the Portfolio, are in conformity with U.S. generally accepted accounting principles which require management to make estimates and assumptions that affect the reported amounts of assets and liabilities, disclosure of contingent assets and liabilities at the date of the financial statements, and the reported amounts of income and expenses during the reporting period. Actual results could differ from those estimates.
Securities valuation
All investments are valued each business day as of the close of regular trading on the New York Stock Exchange (generally 4 p.m. Eastern Time), although the Portfolio may deviate from this calculation time under unusual or unexpected circumstances.
Equity securities and futures contracts that are listed on a foreign or domestic exchange or market are valued at the official closing price or, if none, the last sales price.
Investments in registered open-end investment companies are valued at net asset value. Interests in non-registered investment companies that are redeemable at net asset value are fair valued normally at net asset value.
Investments which are not valued using any of the methods discussed above are valued at their fair value, as determined in good faith by the Board of Trustees. The Board of Trustees has established a Valuation Committee comprised of the Trustees and has delegated to it the authority to take any actions regarding the valuation of portfolio securities that the Valuation Committee deems necessary or appropriate, including determining the fair value of portfolio securities, unless the determination has been delegated to the Allspring Global Investments Pricing Committee at Allspring Funds Management, LLC ("Allspring Funds Management"). The Board of Trustees retains the authority to make or ratify any valuation decisions or approve any changes to the Valuation Procedures as it deems appropriate. On a quarterly basis, the Board of Trustees receives reports on any valuation actions taken by the Valuation Committee or the Allspring Global Investments Pricing Committee which may include items for ratification.
Securities lending
The Portfolio may lend its securities from time to time in order to earn additional income in the form of fees or interest on securities received as collateral or the investment of any cash received as collateral. When securities are on loan, the Portfolio receives interest or dividends on those securities. Cash collateral received in connection with its securities lending transactions is invested in Securities Lending Cash Investments, LLC (the "Securities Lending Fund"), an affiliated non-registered investment company. Investments in Securities Lending Fund are valued at the evaluated bid price provided by an independent pricing service. Income earned from investment in the Securities Lending Fund (net of fees and rebates), if any, is included in income from affiliated securities on the Statement of Operations.
In a securities lending transaction, the net asset value of the Portfolio is affected by an increase or decrease in the value of the securities loaned and by an increase or decrease in the value of the instrument in which collateral is invested. The amount of
Allspring Large Company Value Portfolio | 15
Notes to financial statements
securities lending activity undertaken by the Portfolio fluctuates from time to time. The Portfolio has the right under the lending agreement to recover the securities from the borrower on demand. In the event of default or bankruptcy by the borrower, the Portfolio may be prevented from recovering the loaned securities or gaining access to the collateral or may experience delays or costs in doing so. In such an event, the terms of the agreement allow the unaffiliated securities lending agent to use the collateral to purchase replacement securities on behalf of the Portfolio or pay the Portfolio the market value of the loaned securities. The Portfolio bears the risk of loss with respect to depreciation of its investment of the cash collateral.
Futures contracts
Futures contracts are agreements between the Portfolio and a counterparty to buy or sell a specific amount of a commodity, financial instrument or currency at a specified price on a specified date. The Portfolio may buy and sell futures contracts in order to gain exposure to, or protect against, changes in security values and is subject to equity price risk. The primary risks associated with the use of futures contracts are the imperfect correlation between changes in market values of securities held by the Portfolio and the prices of futures contracts, and the possibility of an illiquid market. Futures contracts are generally entered into on a regulated futures exchange and cleared through a clearinghouse associated with the exchange. With futures contracts, there is minimal counterparty risk to the Portfolio since futures contracts are exchange traded and the exchange’s clearinghouse, as the counterparty to all exchange traded futures, guarantees the futures contracts against default.
Upon entering into a futures contract, the Portfolio is required to deposit either cash or securities (initial margin) with the broker in an amount equal to a certain percentage of the contract value. Subsequent payments (variation margin) are paid to or from the broker each day equal to the daily changes in the contract value. Such payments are recorded as unrealized gains or losses and, if any, shown as variation margin receivable (payable) in the Statement of Assets and Liabilities. Should the Portfolio fail to make requested variation margin payments, the broker can gain access to the initial margin to satisfy the Portfolio’s payment obligations. When the contracts are closed, a realized gain or loss is recorded in the Statement of Operations.
Security transactions and income recognition
Securities transactions are recorded on a trade date basis. Realized gains or losses are recorded on the basis of identified cost.
Dividend income is recognized on the ex-dividend date. Dividend income is recorded net of foreign taxes withheld where recovery of such taxes is not assured.
Federal and other taxes
The Portfolio is not required to pay federal income taxes on its net investment income and net capital gains as it is treated as a partnership for federal income tax purposes. All income, gains and losses of the Portfolio are deemed to have been “passed through” to the interest holders in proportion to their holdings of the Portfolio regardless of whether income and gains have been distributed by the Portfolio.
The Portfolio’s income tax returns and all financial records supporting those returns for the prior three fiscal years are subject to examination by the federal revenue authority. Management has analyzed the Portfolio’s tax positions taken on federal, state, and foreign tax returns, as applicable, for all open tax years and does not believe that there are any uncertain tax positions that require recognition of a tax liability.
As of May 31, 2022, the aggregate cost of all investments for federal income tax purposes was $211,427,509 and the unrealized gains (losses) consisted of:
| Gross unrealized gains | $ 15,042,513 |
| Gross unrealized losses | (10,780,932) |
| Net unrealized gains | $ 4,261,581 |
16 | Allspring Large Company Value Portfolio
Notes to financial statements
3. FAIR VALUATION MEASUREMENTS
Fair value measurements of investments are determined within a framework that has established a fair value hierarchy based upon the various data inputs utilized in determining the value of the Portfolio’s investments. The three-level hierarchy gives the highest priority to unadjusted quoted prices in active markets for identical assets or liabilities (Level 1) and the lowest priority to unobservable inputs (Level 3). The Portfolio’s investments are classified within the fair value hierarchy based on the lowest level of input that is significant to the fair value measurement. The inputs are summarized into three broad levels as follows:
| ■ | Level 1 – quoted prices in active markets for identical securities |
| ■ | Level 2 – other significant observable inputs (including quoted prices for similar securities, interest rates, prepayment speeds, credit risk, etc.) |
| ■ | Level 3 – significant unobservable inputs (including the Portfolio’s own assumptions in determining the fair value of investments) |
The inputs or methodologies used for valuing investments in securities are not necessarily an indication of the risk associated with investing in those securities.
The following is a summary of the inputs used in valuing the Portfolio’s assets and liabilities as of May 31, 2022:
| | Quoted prices
(Level 1) | Other significant
observable inputs
(Level 2) | Significant
unobservable inputs
(Level 3) | Total |
| Assets | | | | |
| Investments in: | | | | |
| Common stocks | | | | |
| Communication services | $ 14,096,363 | $0 | $0 | $ 14,096,363 |
| Consumer discretionary | 7,316,358 | 0 | 0 | 7,316,358 |
| Consumer staples | 18,762,624 | 0 | 0 | 18,762,624 |
| Energy | 18,030,211 | 0 | 0 | 18,030,211 |
| Financials | 38,448,863 | 0 | 0 | 38,448,863 |
| Health care | 41,781,502 | 0 | 0 | 41,781,502 |
| Industrials | 21,983,727 | 0 | 0 | 21,983,727 |
| Information technology | 19,686,768 | 0 | 0 | 19,686,768 |
| Materials | 7,534,175 | 0 | 0 | 7,534,175 |
| Real estate | 9,282,145 | 0 | 0 | 9,282,145 |
| Utilities | 14,364,259 | 0 | 0 | 14,364,259 |
| Short-term investments | | | | |
| Investment companies | 4,485,592 | 0 | 0 | 4,485,592 |
| Total assets | $215,772,587 | $0 | $0 | $215,772,587 |
| Liabilities | | | | |
| Futures contracts | $ 83,497 | $0 | $0 | $ 83,497 |
| Total liabilities | $ 83,497 | $0 | $0 | $ 83,497 |
Futures contracts are reported at their cumulative unrealized gains (losses) at measurement date as reported in the table following the Portfolio of Investments. For futures contracts, the current day’s variation margin is reported on the Statement of Assets and Liabilities. All other assets and liabilities are reported at their market value at measurement date.
Additional sector, industry or geographic detail, if any, is included in the Portfolio of Investments.
For the year ended May 31, 2022, the Portfolio did not have any transfers into/out of Level 3.
4. TRANSACTIONS WITH AFFILIATES
Advisory fee
The Trust has entered into an advisory contract with Allspring Funds Management, a wholly owned subsidiary of Allspring Global Investments Holdings, LLC, a holding company indirectly owned by certain private funds of GTCR LLC and Reverence
Allspring Large Company Value Portfolio | 17
Notes to financial statements
Capital Partners, L.P. The adviser is responsible for implementing investment policies and guidelines and for supervising the subadviser, who is responsible for day-to-day portfolio management of the Portfolio. Pursuant to the contract, Allspring Funds Management is entitled to receive an advisory fee at the following annual rate based on the Portfolio’s average daily net assets:
| Average daily net assets | Advisory fee |
| First $1 billion | 0.350% |
| Next $4 billion | 0.325 |
| Over $5 billion | 0.300 |
For the year ended May 31, 2022, the advisory fee was equivalent to an annual rate of 0.35% of the Portfolio’s average daily net assets.
Allspring Funds Management has retained the services of a subadviser to provide daily portfolio management to the Portfolio. The fee for subadvisory services is borne by Allspring Funds Management. Allspring Global Investments, LLC ("Allspring Investments"), an affiliate of Allspring Funds Management and a wholly owned subsidiary of Allspring Global Investments Holdings, LLC, is the subadviser to the Portfolio and is entitled to receive a fee from Allspring Funds Management at an annual rate starting at 0.25% and declining to 0.15% as the average daily net assets of the Portfolio increase.
Allspring Funds Management has voluntarily waived and/or reimbursed advisory fees to reduce the net operating expense ratio of the Portfolio. These voluntary waivers may be discontinued at any time.
Interfund transactions
The Portfolio may purchase or sell portfolio investment securities to certain affiliates pursuant to Rule 17a-7 under the 1940 Act and under procedures adopted by the Board of Trustees. The procedures have been designed to ensure that these interfund transactions, which do not incur broker commissions, are effected at current market prices.
5. INVESTMENT PORTFOLIO TRANSACTIONS
Purchases and sales of investments, excluding U.S. government obligations (if any) and short-term securities, for the year ended May 31, 2022 were $978,388,105 and $1,053,181,690, respectively.
6. SECURITIES LENDING TRANSACTIONS
The Portfolio lends its securities through an unaffiliated securities lending agent and receives collateral in the form of cash or securities with a value at least equal to the value of the securities on loan. The value of the loaned securities is determined at the close of each business day and any increases or decreases in the required collateral are exchanged between the Portfolio and the counterparty on the next business day. Cash collateral received is invested in the Securities Lending Fund which seeks to provide a positive return compared to the daily Federal Funds Open Rate by investing in high-quality, U.S. dollar-denominated short-term money market instruments and is exempt from registration under Section 3(c)(7) of the 1940 Act. Securities Lending Fund is managed by Allspring Funds Management and is subadvised by Allspring Investments. Allspring Funds Management receives an advisory fee starting at 0.05% and declining to 0.01% as the average daily net assets of the Securities Lending Fund increase. All of the fees received by Allspring Funds Management are paid to Allspring Investments for its services as subadviser.
In the event of counterparty default or the failure of a borrower to return a loaned security, the Portfolio has the right to use the collateral to offset any losses incurred. As of May 31, 2022, the Portfolio did not have any securities on loan.
7. DERIVATIVE TRANSACTIONS
During the year ended May 31, 2022, the Portfolio entered into futures contracts to gain market exposure. The Portfolio had an average notional amount of $5,120,187 in long futures contracts during the year ended May 31, 2022.
The fair value, realized gains or losses and change in unrealized gains or losses, if any, on derivative instruments are reflected in the corresponding financial statement captions.
8. BANK BORROWINGS
The Trust, along with Allspring Variable Trust and Allspring Funds Trust (excluding the money market funds), are parties to a $350,000,000 revolving credit agreement whereby the Portfolio is permitted to use bank borrowings for temporary or
18 | Allspring Large Company Value Portfolio
Notes to financial statements
emergency purposes, such as to fund interest holders withdrawal requests. Interest under the credit agreement is charged to the Portfolio based on a borrowing rate equal to the higher of the Federal Funds rate in effect on that day plus 1.25% or the overnight bank funding rate in effect on that day plus 1.25%. In addition, an annual commitment fee equal to 0.25% of the unused balance is allocated to each participating fund.
For the year ended May 31, 2022, there were no borrowings by the Portfolio under the agreement.
9. INDEMNIFICATION
Under the Portfolio's organizational documents, the officers and Trustees have been granted certain indemnification rights against certain liabilities that may arise out of performance of their duties to the Portfolio. The Portfolio has entered into a separate agreement with each Trustee that converts indemnification rights currently existing under the Portfolio’s organizational documents into contractual rights that cannot be changed in the future without the consent of the Trustee. Additionally, in the normal course of business, the Portfolio may enter into contracts with service providers that contain a variety of indemnification clauses. The Portfolio’s maximum exposure under these arrangements is dependent on future claims that may be made against the Portfolio and, therefore, cannot be estimated.
10. CORONAVIRUS (COVID-19) PANDEMIC
On March 11, 2020, the World Health Organization announced that it had made the assessment that coronavirus disease 2019 (“COVID-19”) is a pandemic. The impacts of COVID-19 are affecting the entire global economy, individual companies and investment products, the funds, and the market in general. There is significant uncertainty around the extent and duration of business disruptions related to COVID-19 and the impacts may last for an extended period of time. COVID-19 has led to significant uncertainty and volatility in the financial markets.
Allspring Large Company Value Portfolio | 19
Report of independent registered public accounting firm
To the Interest Holders of the Portfolio and Board of Trustees
Allspring Master Trust:
Opinion on the Financial Statements
We have audited the accompanying statement of assets and liabilities of Allspring Large Company Value Portfolio (formerly, Wells Fargo Large Company Value Portfolio) (the Portfolio), one of the portfolios constituting Allspring Master Trust (formerly, Wells Fargo Master Trust), including the portfolio of investments, as of May 31, 2022, the related statement of operations for the year then ended, the statements of changes in net assets for each of the years in the two-year period then ended, and the related notes (collectively, the financial statements) and the financial highlights for each of the years in the five-year period then ended. In our opinion, the financial statements and financial highlights present fairly, in all material respects, the financial position of the Portfolio as of May 31, 2022, the results of its operations for the year then ended, the changes in its net assets for each of the years in the two-year period then ended, and the financial highlights for each of the years in the five-year period then ended, in conformity with U.S. generally accepted accounting principles.
Basis for Opinion
These financial statements and financial highlights are the responsibility of the Portfolio’s management. Our responsibility is to express an opinion on these financial statements and financial highlights based on our audits. We are a public accounting firm registered with the Public Company Accounting Oversight Board (United States) (PCAOB) and are required to be independent with respect to the Portfolio in accordance with the U.S. federal securities laws and the applicable rules and regulations of the Securities and Exchange Commission and the PCAOB.
We conducted our audits in accordance with the standards of the PCAOB. Those standards require that we plan and perform the audit to obtain reasonable assurance about whether the financial statements and financial highlights are free of material misstatement, whether due to error or fraud. Our audits included performing procedures to assess the risks of material misstatement of the financial statements and financial highlights, whether due to error or fraud, and performing procedures that respond to those risks. Such procedures included examining, on a test basis, evidence regarding the amounts and disclosures in the financial statements and financial highlights. Such procedures also included confirmation of securities owned as of May 31, 2022, by correspondence with the custodian, transfer agent and brokers. Our audits also included evaluating the accounting principles used and significant estimates made by management, as well as evaluating the overall presentation of the financial statements and financial highlights. We believe that our audits provide a reasonable basis for our opinion.

We have not been able to determine the specific year that we began serving as the auditor of one or more Allspring Funds investment companies; however, we are aware that we have served as the auditor of one or more Allspring Funds investment companies since at least 1955.
Boston, Massachusetts
July 27, 2022
20 | Allspring Large Company Value Portfolio
Other information (unaudited)
PROXY VOTING INFORMATION
A description of the policies and procedures used to determine how to vote proxies relating to portfolio securities is available without charge, upon request, by calling 1-800-222-8222, visiting our website at allspringglobal.com, or visiting the SEC website at sec.gov. Information regarding how the proxies related to portfolio securities were voted during the most recent 12-month period ended June 30 is available on the website at allspringglobal.com or by visiting the SEC website at sec.gov.
QUARTERLY PORTFOLIO HOLDINGS INFORMATION
The Portfolio files its complete schedule of portfolio holdings with the SEC for the first and third quarters of each fiscal year as an exhibit to its reports on Form N-PORT. Interest holders may view the filed Form N-PORT by visiting the SEC website at sec.gov.
Allspring Large Company Value Portfolio | 21
Other information (unaudited)
BOARD OF TRUSTEES AND OFFICERS
Each of the Trustees and Officers listed in the table below acts in identical capacities for each fund in the Allspring family of funds, which consists of 137 mutual funds comprising the Allspring Funds Trust, Allspring Variable Trust, Allspring Master Trust and four closed-end funds (collectively the “Fund Complex”). This table should be read in conjunction with the Prospectus and the Statement of Additional Information. The mailing address of each Trustee and Officer is 525 Market Street, 12th Floor, San Francisco, CA 94105. Each Trustee and Officer serves an indefinite term, however, each Trustee serves such term until reaching the mandatory retirement age established by the Trustees.
Independent Trustees
Name and
year of birth | Position held and
length of service* | Principal occupations during past five years or longer | Current other
public company or
investment
company
directorships |
William R. Ebsworth
(Born 1957) | Trustee,
since 2015 | Retired. From 1984 to 2013, equities analyst, portfolio manager, research director and chief investment officer at Fidelity Management and Research Company in Boston, Tokyo, and Hong Kong, and retired in 2013 as Chief Investment Officer of Fidelity Strategic Advisers, Inc. where he led a team of investment professionals managing client assets. Prior thereto, Board member of Hong Kong Securities Clearing Co., Hong Kong Options Clearing Corp., the Thailand International Fund, Ltd., Fidelity Investments Life Insurance Company, and Empire Fidelity Investments Life Insurance Company. Audit Committee Chair and Investment Committee Chair of the Vincent Memorial Hospital Endowment (non-profit organization). Mr. Ebsworth is a CFA® charterholder. | N/A |
Jane A. Freeman
(Born 1953) | Trustee,
since 2015;
Chair Liaison,
since 2018 | Retired. From 2012 to 2014 and 1999 to 2008, Chief Financial Officer of Scientific Learning Corporation. From 2008 to 2012, Ms. Freeman provided consulting services related to strategic business projects. Prior to 1999, Portfolio Manager at Rockefeller & Co. and Scudder, Stevens & Clark. Board member of the Harding Loevner Funds from 1996 to 2014, serving as both Lead Independent Director and chair of the Audit Committee. Board member of the Russell Exchange Traded Funds Trust from 2011 to 2012 and the chair of the Audit Committee. Ms. Freeman is also an inactive Chartered Financial Analyst. | N/A |
Isaiah Harris, Jr.
(Born 1952) | Trustee,
since 2009; Audit
Committee
Chair,
since 2019 | Retired. Chairman of the Board of CIGNA Corporation from 2009 to 2021, and Director from 2005 to 2008. From 2003 to 2011, Director of Deluxe Corporation. Prior thereto, President and CEO of BellSouth Advertising and Publishing Corp. from 2005 to 2007, President and CEO of BellSouth Enterprises from 2004 to 2005 and President of BellSouth Consumer Services from 2000 to 2003. Emeritus member of the Iowa State University Foundation Board of Governors. Emeritus Member of the Advisory Board of Iowa State University School of Business. Advisory Board Member, Palm Harbor Academy (private school). Advisory Board Member, Fellowship of Christian Athletes. Mr. Harris is a certified public accountant (inactive status). | N/A |
David F. Larcker
(Born 1950) | Trustee,
since 2009 | James Irvin Miller Professor of Accounting at the Graduate School of Business (Emeritus), Stanford University, Director of the Corporate Governance Research Initiative and Senior Faculty of The Rock Center for Corporate Governance since 2006. From 2005 to 2008, Professor of Accounting at the Graduate School of Business, Stanford University. Prior thereto, Ernst & Young Professor of Accounting at The Wharton School, University of Pennsylvania from 1985 to 2005. | N/A |
22 | Allspring Large Company Value Portfolio
Other information (unaudited)
Name and
year of birth | Position held and
length of service* | Principal occupations during past five years or longer | Current other
public company or
investment
company
directorships |
Olivia S. Mitchell
(Born 1953) | Trustee,
since 2006;
Nominating and
Governance
Committee Chair,
since 2018 | International Foundation of Employee Benefit Plans Professor since 1993, Wharton School of the University of Pennsylvania. Director of Wharton’s Pension Research Council and Boettner Center on Pensions & Retirement Research, and Research Associate at the National Bureau of Economic Research. Previously taught at Cornell University from 1978 to 1993. | N/A |
Timothy J. Penny
(Born 1951) | Trustee,
since 1996;
Chair,
since 2018 | President and Chief Executive Officer of Southern Minnesota Initiative Foundation, a non-profit organization, since 2007. Member of the Board of Trustees of NorthStar Education Finance, Inc., a non-profit organization, since 2007. | N/A |
James G. Polisson
(Born 1959) | Trustee,
since 2018 | Retired. Chief Marketing Officer, Source (ETF) UK Services, Ltd, from 2015 to 2017. From 2012 to 2015, Principal of The Polisson Group, LLC, a management consulting, corporate advisory and principal investing company. Chief Executive Officer and Managing Director at Russell Investments, Global Exchange Traded Funds from 2010 to 2012. Managing Director of Barclays Global Investors from 1998 to 2010 and Global Chief Marketing Officer for iShares and Barclays Global Investors from 2000 to 2010. Trustee of the San Francisco Mechanics’ Institute, a non-profit organization, from 2013 to 2015. Board member of the Russell Exchange Traded Fund Trust from 2011 to 2012. Director of Barclays Global Investors Holdings Deutschland GmbH from 2006 to 2009. Mr. Polisson is an attorney and has a retired status with the Massachusetts and District of Columbia Bar Associations. | N/A |
Pamela Wheelock
(Born 1959) | Trustee,
since January
2020; previously
Trustee from
January 2018 to
July 2019 | Board member of the Destination Medical Center Economic Development Agency, Rochester, Minnesota since 2019. Interim President of the McKnight Foundation from January to September 2020. McKnight Foundation Consultant, November 2020 to February 2021. Acting Commissioner, Minnesota Department of Human Services, July 2019 through September 2019. Consultant (part-time), Minnesota Department of Human Services, October 2019 through December 2019. Chief Operating Officer, Twin Cities Habitat for Humanity from 2017 to 2019. Vice President of University Services, University of Minnesota from 2012 to 2016. Prior thereto, on the Board of Directors, Governance Committee and Finance Committee for the Minnesota Philanthropy Partners (Saint Paul Foundation) from 2012 to 2018, Interim Chief Executive Officer of Blue Cross Blue Shield of Minnesota from 2011 to 2012, Chairman of the Board from 2009 to 2012 and Board Director from 2003 to 2015. Vice President, Leadership and Community Engagement, Bush Foundation, Saint Paul, Minnesota (a private foundation) from 2009 to 2011. Executive Vice President and Chief Financial Officer, Minnesota Sports and Entertainment from 2004 to 2009 and Senior Vice President from 2002 to 2004. Executive Vice President of the Minnesota Wild Foundation from 2004 to 2008. Commissioner of Finance, State of Minnesota, from 1999 to 2002. Currently Board Chair of the Minnesota Wild Foundation since 2010. | N/A |
* Length of service dates reflect the Trustee’s commencement of service with the Trust’s predecessor entities, where applicable.
Allspring Large Company Value Portfolio | 23
Other information (unaudited)
Officers2
Name and
year of birth | Position held and
length of service | Principal occupations during past five years or longer |
Andrew Owen
(Born 1960) | President,
since 2017 | President, Chief Executive Officer and Director of Allspring Funds Management, LLC since 2017 and co-president of Galliard Capital Management, LLC, an affiliate of Allspring Funds Management, LLC, since 2019. Prior thereto, Head of Affiliated Managers, Allspring Global Investments, from 2014 to 2019 and Executive Vice President responsible for marketing, investments and product development for Allspring Funds Management, LLC, from 2009 to 2014. In addition, Mr. Owen was an Executive Vice President of Wells Fargo & Company from 2014 to 2021. |
Jeremy DePalma
(Born 1974) | Treasurer,
since 2012
(for certain funds in
the Fund Complex);
since 2021 (for
the remaining funds in the
Fund Complex) | Senior Vice President of Allspring Funds Management, LLC since 2009. Senior Vice President of Evergreen Investment Management Company, LLC from 2008 to 2010 and head of the Fund Reporting and Control Team within Fund Administration from 2005 to 2010. |
Kate McKinley
(Born 1977) | Chief Legal Officer,
since 2021 | Chief Legal Officer of Allspring Global Investments since 2021. Prior thereto, held various roles at State Street Global Advisors beginning in 2010, including serving as Senior Vice President and General Counsel from 2019 to 2021, and Chief Operating Officer of the Institutional Client Group from 2016 - 2019. Prior to working at State Street Global Advisors served as Assistant General Counsel for Bank of America Corporation from 2005 to 2010 and as an Associate at WilmerHale from 2002 to 2005. |
Christopher Baker
(Born 1976) | Chief Compliance Officer, since 2022 | Global Chief Compliance Officer for Allspring Global Investments since 2022. Prior thereto, Chief Compliance Officer for State Street Global Advisors from 2018 to 2021. Senior Compliance Officer for the State Street divisions of Alternative Investment Solutions, Sector Solutions, and Global Marketing from 2015 to 2018. From 2010 to 2015 Vice President, Global Head of Investment and Marketing Compliance for State Street Global Advisors. |
Matthew Prasse
(Born 1983) | Secretary,
since 2021 | Senior Counsel of the Allspring Legal Department since 2021. Senior Counsel of the Wells Fargo Legal Department from 2018 to 2021. Previously, Counsel for Barings LLC from 2015 to 2018. Prior to joining Barings, Associate at Morgan, Lewis & Bockius LLP from 2008 to 2015. |
1 The Statement of Additional Information includes additional information about the Trustees and is available, without charge, upon request, by calling 1-800-222-8222.
2 For those Officers with tenures at Allspring Global Investments and/or Allspring Funds Management, LLC that began prior to 2021, such tenures include years of service during which these businesses/entities were known as Wells Fargo Asset Management and Wells Fargo Funds Management, LLC, respectively.
24 | Allspring Large Company Value Portfolio
Other information (unaudited)
LIQUIDITY RISK MANAGEMENT PROGRAM
In accordance with Rule 22e-4 under the Investment Company Act of 1940, as amended (the “Liquidity Rule”), Allspring Master Trust (the “Trust”) has adopted and implemented a liquidity risk management program (the “Program”) on behalf of each of its series, including the Portfolio, which is reasonably designed to assess and manage the Portfolio's liquidity risk. “Liquidity risk” is defined under the Liquidity Rule as the risk that the Portfolio is unable to meet redemption requests without significantly diluting remaining investors’ interests in the Portfolio. The Trust’s Board of Trustees (the “Board”) previously approved the designation of Allspring Funds Management, LLC (“Allspring Funds Management”), the Portfolio's investment adviser, to administer the Program, and Allspring Funds Management has established a Liquidity Risk Management Council (the "Council") composed of personnel from multiple departments within Allspring Funds Management and its affiliates to assist Allspring Funds Management in the administration of the Program.
The Program is comprised of various components designed to support the assessment and/or management of liquidity risk, including: (1) the periodic assessment (no less frequently than annually) of certain factors that influence the Portfolio's liquidity risk; (2) the periodic classification (no less frequently than monthly) of the Portfolio's investments into one of four liquidity categories that reflect an estimate of their liquidity under current market conditions; (3) a 15% limit on the acquisition of “illiquid investments” (as defined under the Liquidity Rule); (4) to the extent the Portfolio does not invest primarily in “highly liquid investments” (as defined under the Liquidity Rule), the determination of a minimum percentage of the Portfolio's assets that generally will be invested in highly liquid investments (an “HLIM”); (5) if the Portfolio has established an HLIM, the periodic review (no less frequently than annually) of the HLIM and the adoption of policies and procedures for responding to a shortfall of the Portfolio's “highly liquid investments” below its HLIM; and (6) periodic reporting to the Board.
At a meeting of the Board held on May 24-25, 2022, the Board received and reviewed a written report (the “Report”) from Allspring Funds Management that, among other things, addressed the operation of the Program and assessed its adequacy and effectiveness for the period from January 1, 2021 through December 31, 2021 (the “Reporting Period”). Other than extended foreign market holidays, no significant liquidity events impacting the Portfolios were noted in the Report. In addition, other than corporate-related changes to the Program, there were no material changes to the Program during the Reporting Period.
Allspring Funds Management determined in the Report that the Program has been implemented and operates effectively to manage each Portfolio’s, including the Portfolio’s, liquidity risk, and Allspring Funds Management continues to believe that the Program has been and continues to be adequately and effectively implemented to monitor and, as applicable, respond to the Portfolio’s liquidity developments.
There can be no assurance that the Program will achieve its objectives under all circumstances in the future.
Allspring Large Company Value Portfolio | 25
For more information
More information about Allspring Funds is available free upon request. To obtain literature, please write, visit the Portfolio's website, or call:
Allspring Funds
P.O. Box 219967
Kansas City, MO 64121-9967
Website: allspringglobal.com
Individual investors: 1-800-222-8222
Retail investment professionals: 1-888-877-9275
Institutional investment professionals: 1-800-260-5969
This report and the financial statements contained herein are submitted for the general information of the interest holders of the Portfolio. If this report is used for promotional purposes, distribution of the report must be accompanied or preceded by a current prospectus. Before investing, please consider the investment objectives, risks, charges, and expenses of the investment. For a current prospectus and, if available, a summary prospectus, containing this information, call
1-800-222-8222. Read the prospectus carefully before you invest or send money.
Allspring Global InvestmentsTM is the trade name for the asset management firms of Allspring Global Investments Holdings, LLC, a holding company indirectly owned by certain private funds of GTCR LLC and Reverence Capital Partners, L.P. These firms include but are not limited to Allspring Global Investments, LLC, and Allspring Funds Management, LLC. Certain products managed by Allspring entities are distributed by Allspring Funds Distributor, LLC (a broker-dealer and Member FINRA/SIPC).
This material is for general informational and educational purposes only and is NOT intended to provide investment advice or a recommendation of any kind - including a recommendation for any specific investment, strategy, or plan.
© 2022 Allspring Global Investments Holdings, LLC. All rights reserved.
Annual Report
May 31, 2022
Allspring
Managed Fixed Income Portfolio
Allspring Managed Fixed Income Portfolio | 1
Notice to Shareholders
Russia launched a large-scale invasion of Ukraine on February 24, 2022. As a result of this military action, the United States and many other countries have instituted various economic sanctions against Russian and Belarus individuals and entities. The situation has led to increased financial market volatility and has had severe adverse effects on regional and global economic markets, including the markets for certain securities and commodities, such as oil and natural gas. The extent and duration of the military action, resulting sanctions imposed, other punitive action taken and the resulting market disruptions cannot be easily predicted.
Our solidarity and support goes out to our impacted employees and the people affected in Ukraine and their families. Allspring has a dedicated team of investment professionals actively monitoring the situation for any new developments and the potential impact to our clients and investment products. As the situation remains fluid, we are focused on the assessment of risks, valuation, and liquidity of impacted securities. Please visit our website at allspringglobal.com and click on “Russia-Ukraine Updates” for further information.
2 | Allspring Managed Fixed Income Portfolio
This page is intentionally left blank.
Portfolio information (unaudited)
| Investment objective | The Portfolio seeks consistent fixed-income returns. |
| Manager | Allspring Funds Management, LLC |
| Subadviser | Galliard Capital Management, LLC |
| Portfolio managers | Andrea Johnson, CFA®‡, Brandon Kanz, CFA®‡ |
| Ten largest holdings (%) as of May 31, 20221 |
| U.S. Treasury Bond, 2.38%, 11-15-2049 | 2.06 |
| FNMA, 4.50%, 1-1-2051 | 1.90 |
| FNMA, 4.00%, 8-1-2051 | 1.71 |
| FNMA, 3.97%, 6-1-2025 | 1.64 |
| U.S. Treasury Bond, 1.38%, 11-15-2040 | 1.22 |
| FNMA, 2.50%, 1-1-2052 | 1.14 |
| FNMA, 2.50%, 1-1-2052 | 1.08 |
| U.S. Treasury Note, 1.50%, 2-29-2024 | 1.07 |
| WFRBS Commercial Mortgage Trust Series 2013-C17 Class A4, 4.02%, 12-15-2046 | 1.05 |
| JPMorgan Chase Commercial Mortgage Securities Trust Series 2014-C20 Class A5, 3.80%, 7-15-2047 | 0.98 |
| 1 | Figures represent the percentage of the Portfolio's net assets. Holdings are subject to change and may have changed since the date specified. |
| Portfolio allocation as of May 31, 20221 |
| 1 | Figures represent the percentage of the Portfolio's long-term investments. These amounts are subject to change and may have changed since the date specified. |
| ‡ | CFA® and Chartered Financial Analyst® are trademarks owned by CFA Institute. |
4 | Allspring Managed Fixed Income Portfolio
Portfolio of investments—May 31, 2022
| | | Interest
rate | Maturity
date | Principal | Value |
| Agency securities: 24.64% | | | | | | |
| FHLMC | | 2.00% | 12-1-2051 | $ | 946,939 | $ 846,304 |
| FHLMC | | 2.00 | 12-1-2051 | | 1,615,556 | 1,443,862 |
| FHLMC | | 2.00 | 11-25-2059 | | 987,757 | 902,542 |
| FHLMC | | 2.50 | 12-1-2051 | | 3,093,142 | 2,855,488 |
| FHLMC | | 2.50 | 1-1-2052 | | 3,762,786 | 3,476,065 |
| FHLMC | | 3.00 | 7-1-2046 | | 315,911 | 306,116 |
| FHLMC | | 3.00 | 7-1-2046 | | 372,561 | 361,009 |
| FHLMC | | 3.00 | 11-1-2049 | | 1,412,750 | 1,353,809 |
| FHLMC | | 3.50 | 4-1-2043 | | 398,331 | 397,884 |
| FHLMC | | 3.50 | 5-1-2044 | | 253,363 | 253,079 |
| FHLMC | | 3.50 | 6-1-2046 | | 164,506 | 163,923 |
| FHLMC | | 3.50 | 2-1-2047 | | 985,673 | 981,365 |
| FHLMC | | 3.50 | 4-1-2047 | | 197,102 | 196,881 |
| FHLMC | | 3.50 | 12-1-2047 | | 749,170 | 748,330 |
| FHLMC | | 3.50 | 3-1-2048 | | 791,748 | 787,429 |
| FHLMC | | 3.50 | 8-1-2049 | | 204,362 | 203,696 |
| FHLMC | | 4.00 | 4-1-2044 | | 292,347 | 300,728 |
| FHLMC | | 4.00 | 8-1-2044 | | 167,889 | 172,043 |
| FHLMC | | 4.00 | 6-1-2048 | | 849,264 | 862,558 |
| FHLMC | | 4.50 | 8-1-2048 | | 1,153,432 | 1,183,108 |
| FHLMC | | 4.50 | 11-1-2048 | | 1,041,861 | 1,078,257 |
| FHLMC | | 4.50 | 11-1-2048 | | 1,916,023 | 1,990,651 |
| FHLMC Series 2018-3 Class MA ±± | | 3.50 | 8-25-2057 | | 3,123,325 | 3,129,704 |
| FHLMC Series 2019-3 Class M55D | | 4.00 | 10-25-2058 | | 610,002 | 614,393 |
| FHLMC Structured Pass-Through Securities Series T-20 Class A6 øø | | 7.99 | 9-25-2029 | | 6,041 | 6,158 |
| FHLMC Structured Pass-Through Securities Series T-58 Class 4A | | 7.50 | 9-25-2043 | | 534,831 | 576,680 |
| FNMA | | 1.47 | 11-1-2029 | | 2,020,000 | 1,781,888 |
| FNMA | | 2.00 | 12-1-2051 | | 2,232,898 | 1,995,597 |
| FNMA | | 2.27 | 4-1-2029 | | 710,000 | 662,600 |
| FNMA ±± | | 2.50 | 5-1-2023 | | 140,126 | 140,019 |
| FNMA | | 2.50 | 8-1-2031 | | 160,895 | 158,308 |
| FNMA | | 2.50 | 2-1-2035 | | 669,666 | 649,770 |
| FNMA | | 2.50 | 2-1-2035 | | 830,945 | 806,256 |
| FNMA | | 2.50 | 12-1-2051 | | 2,520,490 | 2,326,831 |
| FNMA | | 2.50 | 1-1-2052 | | 3,874,554 | 3,576,968 |
| FNMA | | 2.50 | 1-1-2052 | | 4,872,479 | 4,510,886 |
| FNMA | | 2.50 | 1-1-2052 | | 5,164,205 | 4,770,545 |
| FNMA | | 2.73 | 1-1-2023 | | 507,711 | 507,735 |
| FNMA | | 3.00 | 12-1-2032 | | 22,268 | 22,113 |
| FNMA | | 3.00 | 7-1-2046 | | 235,123 | 227,674 |
| FNMA | | 3.00 | 4-1-2047 | | 959,639 | 926,042 |
| FNMA | | 3.00 | 12-1-2049 | | 1,355,332 | 1,298,784 |
| FNMA | | 3.00 | 12-1-2049 | | 1,169,619 | 1,121,021 |
| FNMA ±± | | 3.05 | 11-1-2022 | | 74,717 | 74,607 |
| FNMA | | 3.07 | 2-1-2026 | | 350,623 | 347,695 |
| FNMA ±± | | 3.08 | 9-1-2025 | | 2,943,355 | 2,928,055 |
| FNMA | | 3.08 | 1-1-2026 | | 469,693 | 467,485 |
| FNMA ±± | | 3.31 | 11-1-2026 | | 1,825,708 | 1,828,255 |
| FNMA ±± | | 3.34 | 12-1-2027 | | 878,933 | 880,852 |
| FNMA | | 3.35 | 1-1-2028 | | 265,683 | 266,754 |
| FNMA | | 3.50 | 10-1-2032 | | 348,007 | 350,749 |
| FNMA | | 3.50 | 11-1-2042 | | 138,703 | 138,436 |
The accompanying notes are an integral part of these financial statements.
Allspring Managed Fixed Income Portfolio | 5
Portfolio of investments—May 31, 2022
| | | Interest
rate | Maturity
date | Principal | Value |
| Agency securities (continued) | | | | | | |
| FNMA | | 3.50% | 11-1-2042 | $ | 141,174 | $ 140,901 |
| FNMA | | 3.50 | 2-1-2043 | | 60,769 | 60,547 |
| FNMA | | 3.50 | 11-1-2045 | | 631,174 | 628,725 |
| FNMA | | 3.50 | 4-1-2046 | | 78,528 | 78,200 |
| FNMA | | 3.50 | 7-1-2046 | | 203,502 | 202,618 |
| FNMA | | 3.50 | 11-1-2046 | | 286,764 | 285,373 |
| FNMA | | 3.50 | 8-1-2047 | | 1,374,830 | 1,367,767 |
| FNMA | | 3.97 | 6-1-2025 | | 6,721,547 | 6,855,357 |
| FNMA | | 4.00 | 11-1-2040 | | 120,288 | 121,822 |
| FNMA | | 4.00 | 4-1-2041 | | 172,988 | 175,191 |
| FNMA | | 4.00 | 8-1-2046 | | 193,039 | 198,347 |
| FNMA | | 4.00 | 3-1-2049 | | 502,389 | 507,526 |
| FNMA | | 4.00 | 8-1-2051 | | 6,886,974 | 7,145,323 |
| FNMA | | 4.00 | 7-1-2056 | | 307,516 | 315,639 |
| FNMA | | 4.50 | 8-1-2048 | | 685,417 | 699,473 |
| FNMA | | 4.50 | 1-1-2051 | | 7,579,454 | 7,956,394 |
| FNMA %% | | 4.50 | 7-14-2052 | | 1,410,000 | 1,430,214 |
| FNMA | | 4.50 | 6-1-2056 | | 242,548 | 254,801 |
| FNMA | | 4.50 | 6-1-2056 | | 228,298 | 239,831 |
| FNMA | | 4.50 | 6-1-2056 | | 311,006 | 326,692 |
| FNMA | | 5.00 | 9-1-2033 | | 63,515 | 67,489 |
| FNMA | | 5.50 | 2-1-2036 | | 28,623 | 29,042 |
| FNMA Series 2002-90 Class A2 | | 6.50 | 11-25-2042 | | 239,451 | 264,454 |
| FNMA Series 2002-T4 Class A2 | | 7.00 | 12-25-2041 | | 82,316 | 89,999 |
| FNMA Series 2002-W4 Class A4 | | 6.25 | 5-25-2042 | | 777,456 | 832,873 |
| FNMA Series 2003-W4 Class 3A ±± | | 5.10 | 10-25-2042 | | 137,746 | 146,996 |
| FNMA Series 2004-T2 Class 1A1 | | 6.00 | 11-25-2043 | | 274,460 | 291,852 |
| FNMA Series 2004-T3 Class A1 | | 6.00 | 2-25-2044 | | 436,143 | 462,078 |
| FNMA Series 2004-W01 Class 2A2 | | 7.00 | 12-25-2033 | | 72,512 | 79,915 |
| FNMA Series 2004-W11 Class 1A3 | | 7.00 | 5-25-2044 | | 478,334 | 505,317 |
| FNMA Series 2004-W8 Class 3A | | 7.50 | 6-25-2044 | | 99,359 | 107,293 |
| GNMA | | 6.50 | 10-15-2023 | | 2,317 | 2,445 |
| GNMA | | 6.50 | 11-15-2023 | | 1,279 | 1,349 |
| GNMA | | 6.50 | 12-15-2023 | | 1,937 | 2,044 |
| GNMA | | 6.50 | 1-15-2024 | | 2,836 | 2,994 |
| GNMA | | 7.00 | 8-15-2027 | | 22,078 | 23,392 |
| SBA Series 2006-20B Class 1 | | 5.35 | 2-1-2026 | | 66,788 | 67,749 |
| SBA Series 2006-20H Class 1 | | 5.70 | 8-1-2026 | | 40,891 | 42,011 |
| SBA Series 2007-20J Class 1 | | 5.57 | 10-1-2027 | | 114,337 | 117,508 |
| SBA Series 2013-20A Class 1 | | 2.13 | 1-1-2033 | | 163,201 | 155,033 |
| SBA Series 2013-20J Class 1 | | 3.37 | 10-1-2033 | | 153,464 | 150,126 |
| SBA Series 2014-10A Class 1 | | 3.19 | 3-10-2024 | | 60,594 | 60,625 |
| SBA Series 2014-10B Class 1 | | 3.02 | 9-10-2024 | | 49,024 | 47,356 |
| SBA Series 2014-20A Class 1 | | 3.46 | 1-1-2034 | | 168,266 | 166,681 |
| SBA Series 2015-10B Class 1 | | 2.83 | 9-10-2025 | | 117,568 | 114,218 |
| SBA Series 2015-20C Class 1 | | 2.72 | 3-1-2035 | | 209,657 | 203,447 |
| SBA Series 2015-20E Class 1 | | 2.77 | 5-1-2035 | | 297,472 | 291,837 |
| SBA Series 2015-20F Class 1 | | 2.98 | 6-1-2035 | | 250,855 | 245,479 |
| SBA Series 2017-10A Class 1 | | 2.85 | 3-10-2027 | | 218,235 | 210,854 |
| SBA Series 2017-20F Class 1 | | 2.81 | 6-1-2037 | | 183,407 | 178,235 |
| SBA Series 2018-10B Class 1 | | 3.55 | 9-10-2028 | | 3,103,152 | 3,078,379 |
| SBA Series 2018-20E Class 1 | | 3.50 | 5-1-2038 | | 1,547,705 | 1,561,748 |
| SBA Series 2018-20G Class 1 | | 3.54 | 7-1-2038 | | 2,029,660 | 2,039,141 |
The accompanying notes are an integral part of these financial statements.
6 | Allspring Managed Fixed Income Portfolio
Portfolio of investments—May 31, 2022
| | | Interest
rate | Maturity
date | Principal | Value |
| Agency securities (continued) | | | | | | |
| SBA Series 2018-20H Class 1 | | 3.58% | 8-1-2038 | $ | 2,584,708 | $ 2,599,471 |
| SBA Series 2018-20K Class 1 | | 3.87 | 11-1-2038 | | 1,753,496 | 1,775,451 |
| Total Agency securities (Cost $106,220,969) | | | | | | 102,963,609 |
| Asset-backed securities: 1.59% | | | | | | |
| ECMC Group Student Loan Trust Series 2016-1A Class A (1 Month LIBOR +1.35%) 144A± | | 2.02 | 7-26-2066 | | 276,297 | 272,545 |
| ECMC Group Student Loan Trust Series 2018-2A Class A (1 Month LIBOR +0.80%) 144A± | | 1.81 | 9-25-2068 | | 1,994,558 | 1,959,391 |
| Ford Credit Auto Owner Trust Series 2018-2 Class A 144A | | 3.47 | 1-15-2030 | | 1,200,000 | 1,204,080 |
| Ford Credit Auto Owner Trust Series 2021-1 Class A 144A | | 1.37 | 10-17-2033 | | 1,225,000 | 1,126,880 |
| MMAF Equipment Finance LLC Series 2017-AA Class A5 144A | | 2.68 | 7-16-2027 | | 329,988 | 329,616 |
| SLM Student Loan Trust Series 2003-10A Class A4 (3 Month LIBOR +0.67%) 144A± | | 1.50 | 12-17-2068 | | 1,310,000 | 1,277,038 |
| South Carolina Student Loan Corporation Series 2014-1 Class B (1 Month LIBOR +1.50%) ± | | 1.96 | 8-1-2035 | | 500,000 | 489,438 |
| Total Asset-backed securities (Cost $6,818,273) | | | | | | 6,658,988 |
| Corporate bonds and notes: 39.82% | | | | | | |
| Communication services: 2.23% | | | | | | |
| Diversified telecommunication services: 1.22% | | | | | | |
| AT&T Incorporated | | 2.25 | 2-1-2032 | | 460,000 | 388,925 |
| AT&T Incorporated | | 2.75 | 6-1-2031 | | 535,000 | 478,849 |
| AT&T Incorporated | | 4.75 | 5-15-2046 | | 1,280,000 | 1,261,272 |
| T-Mobile USA Incorporated | | 3.38 | 4-15-2029 | | 875,000 | 810,578 |
| Verizon Communications Incorporated | | 2.10 | 3-22-2028 | | 500,000 | 454,779 |
| Verizon Communications Incorporated | | 2.36 | 3-15-2032 | | 470,000 | 404,791 |
| Verizon Communications Incorporated | | 4.81 | 3-15-2039 | | 1,228,000 | 1,275,020 |
| | | | | | | 5,074,214 |
| Entertainment: 0.16% | | | | | | |
| Take-Two Interactive Software Incorporated | | 3.70 | 4-14-2027 | | 180,000 | 177,792 |
| Walt Disney Company | | 2.65 | 1-13-2031 | | 540,000 | 488,690 |
| | | | | | | 666,482 |
| Media: 0.82% | | | | | | |
| CCO Holdings LLC 144A | | 4.50 | 8-15-2030 | | 381,000 | 344,081 |
| CCO Holdings LLC 144A | | 5.13 | 5-1-2027 | | 925,000 | 911,680 |
| Charter Communications Operating LLC | | 4.40 | 4-1-2033 | | 340,000 | 319,528 |
| Comcast Corporation | | 1.95 | 1-15-2031 | | 550,000 | 473,095 |
| Lamar Media Corporation | | 4.88 | 1-15-2029 | | 550,000 | 540,375 |
| Magallanes Incorporated 144A | | 4.28 | 3-15-2032 | | 900,000 | 841,181 |
| | | | | | | 3,429,940 |
| Wireless telecommunication services: 0.03% | | | | | | |
| T-Mobile USA Incorporated 144A | | 2.40 | 3-15-2029 | | 150,000 | 132,576 |
| Consumer discretionary: 3.85% | | | | | | |
| Auto components: 0.25% | | | | | | |
| Allison Transmission Incorporated 144A | | 4.75 | 10-1-2027 | | 1,075,000 | 1,028,223 |
The accompanying notes are an integral part of these financial statements.
Allspring Managed Fixed Income Portfolio | 7
Portfolio of investments—May 31, 2022
| | | Interest
rate | Maturity
date | Principal | Value |
| Automobiles: 0.26% | | | | | | |
| General Motors Company | | 4.88% | 10-2-2023 | $ | 400,000 | $ 407,594 |
| Volkswagen Group of America Incorporated 144A | | 2.85 | 9-26-2024 | | 300,000 | 295,260 |
| Volkswagen Group of America Incorporated 144A%% | | 4.60 | 6-8-2029 | | 370,000 | 369,519 |
| | | | | | | 1,072,373 |
| Diversified consumer services: 2.45% | | | | | | |
| Duke University | | 3.20 | 10-1-2038 | | 1,175,000 | 1,044,449 |
| Johns Hopkins University | | 2.81 | 1-1-2060 | | 280,000 | 207,866 |
| Massachusetts Institute of Technology | | 3.96 | 7-1-2038 | | 500,000 | 498,898 |
| Massachusetts Institute of Technology | | 4.68 | 7-1-2114 | | 120,000 | 122,426 |
| Massachusetts Institute of Technology | | 7.25 | 11-2-2096 | | 500,000 | 795,238 |
| Northwestern University | | 3.66 | 12-1-2057 | | 105,000 | 95,175 |
| Northwestern University | | 3.69 | 12-1-2038 | | 1,915,000 | 1,815,667 |
| President and Fellows of Harvard College | | 3.62 | 10-1-2037 | | 275,000 | 261,738 |
| President and Fellows of Harvard College | | 4.88 | 10-15-2040 | | 183,000 | 201,022 |
| President and Fellows of Harvard College | | 5.63 | 10-1-2038 | | 525,000 | 618,959 |
| Princeton University | | 5.70 | 3-1-2039 | | 1,640,000 | 1,944,732 |
| Service Corporation International | | 4.63 | 12-15-2027 | | 450,000 | 447,458 |
| Service Corporation International | | 7.50 | 4-1-2027 | | 345,000 | 373,604 |
| University of Southern California | | 3.03 | 10-1-2039 | | 1,250,000 | 1,076,757 |
| Washington University | | 4.35 | 4-15-2122 | | 850,000 | 756,834 |
| | | | | | | 10,260,823 |
| Hotels, restaurants & leisure: 0.03% | | | | | | |
| Starbucks Corporation | | 2.25 | 3-12-2030 | | 140,000 | 121,042 |
| Specialty retail: 0.33% | | | | | | |
| Foot Locker Incorporated 144A | | 4.00 | 10-1-2029 | | 400,000 | 329,244 |
| Home Depot Incorporated | | 3.25 | 4-15-2032 | | 570,000 | 545,569 |
| Lowe's Companies Incorporated | | 1.70 | 9-15-2028 | | 420,000 | 366,857 |
| Lowe's Companies Incorporated | | 3.75 | 4-1-2032 | | 170,000 | 162,103 |
| | | | | | | 1,403,773 |
| Textiles, apparel & luxury goods: 0.53% | | | | | | |
| HanesBrands Incorporated 144A | | 4.63 | 5-15-2024 | | 200,000 | 199,000 |
| HanesBrands Incorporated 144A | | 4.88 | 5-15-2026 | | 1,250,000 | 1,237,163 |
| The William Carter Company 144A | | 5.63 | 3-15-2027 | | 185,000 | 183,951 |
| Wolverine World Wide Company 144A | | 4.00 | 8-15-2029 | | 700,000 | 580,583 |
| | | | | | | 2,200,697 |
| Consumer staples: 0.65% | | | | | | |
| Beverages: 0.21% | | | | | | |
| Anheuser-Busch InBev Worldwide Incorporated | | 4.70 | 2-1-2036 | | 870,000 | 880,607 |
| Food products: 0.28% | | | | | | |
| 7 Eleven Incorporated 144A | | 0.95 | 2-10-2026 | | 220,000 | 197,879 |
| Ingredion Incorporated | | 2.90 | 6-1-2030 | | 880,000 | 785,672 |
| Mondelez International Incorporated | | 3.00 | 3-17-2032 | | 230,000 | 207,658 |
| | | | | | | 1,191,209 |
The accompanying notes are an integral part of these financial statements.
8 | Allspring Managed Fixed Income Portfolio
Portfolio of investments—May 31, 2022
| | | Interest
rate | Maturity
date | Principal | Value |
| Household products: 0.16% | | | | | | |
| Central Garden & Pet Company | | 5.13% | 2-1-2028 | $ | 460,000 | $ 439,300 |
| Clorox Incorporated | | 3.90 | 5-15-2028 | | 220,000 | 219,403 |
| | | | | | | 658,703 |
| Energy: 4.84% | | | | | | |
| Energy equipment & services: 0.53% | | | | | | |
| Baker Hughes LLC | | 3.34 | 12-15-2027 | | 1,500,000 | 1,453,164 |
| Halliburton Company | | 2.92 | 3-1-2030 | | 820,000 | 751,386 |
| | | | | | | 2,204,550 |
| Oil, gas & consumable fuels: 4.31% | | | | | | |
| Antero Resources Corporation 144A | | 5.38 | 3-1-2030 | | 465,000 | 471,617 |
| Apache Corporation | | 4.38 | 10-15-2028 | | 100,000 | 95,500 |
| BP Capital Markets plc | | 2.72 | 1-12-2032 | | 930,000 | 836,834 |
| Buckeye Partners LP | | 3.95 | 12-1-2026 | | 247,000 | 236,552 |
| Cheniere Energy Partners LP | | 4.50 | 10-1-2029 | | 875,000 | 853,615 |
| Coterra Energy Incorporated 144A | | 3.90 | 5-15-2027 | | 500,000 | 492,225 |
| Enable Midstream Partners | | 4.95 | 5-15-2028 | | 790,000 | 793,673 |
| EnLink Midstream Partners LP | | 4.85 | 7-15-2026 | | 430,000 | 432,380 |
| Enterprise Products Operating LLC | | 4.15 | 10-16-2028 | | 260,000 | 261,248 |
| Florida Gas Transmission Company 144A | | 4.35 | 7-15-2025 | | 1,521,000 | 1,553,451 |
| Gray Oak Pipeline LLC 144A | | 2.60 | 10-15-2025 | | 860,000 | 813,742 |
| Gulfstream Natural Gas System LLC 144A | | 6.19 | 11-1-2025 | | 210,000 | 224,752 |
| Hess Corporation | | 4.30 | 4-1-2027 | | 100,000 | 99,780 |
| HF Sinclair Corporation 144A | | 4.50 | 10-1-2030 | | 910,000 | 830,076 |
| Magellan Midstream Partners LP | | 5.00 | 3-1-2026 | | 170,000 | 176,367 |
| Marathon Petroleum Corporation | | 5.13 | 12-15-2026 | | 1,500,000 | 1,560,755 |
| MPLX LP | | 4.13 | 3-1-2027 | | 1,500,000 | 1,485,370 |
| Newfield Exploration Company | | 5.38 | 1-1-2026 | | 519,000 | 537,011 |
| Newfield Exploration Company | | 5.63 | 7-1-2024 | | 249,000 | 261,900 |
| NuStar Logistics LP | | 6.00 | 6-1-2026 | | 600,000 | 605,022 |
| Plains All American Pipeline LP | | 4.70 | 6-15-2044 | | 600,000 | 504,841 |
| Plains All American Pipeline LP | | 4.90 | 2-15-2045 | | 80,000 | 69,040 |
| Range Resources Corporation | | 4.88 | 5-15-2025 | | 625,000 | 635,938 |
| Range Resources Corporation | | 5.00 | 3-15-2023 | | 753,000 | 753,941 |
| Sabine Pass Liquefaction LLC | | 4.50 | 5-15-2030 | | 300,000 | 298,978 |
| Transcontinental Gas Pipe Line Company LLC | | 3.25 | 5-15-2030 | | 790,000 | 731,205 |
| Transcontinental Gas Pipe Line Company LLC | | 7.85 | 2-1-2026 | | 1,200,000 | 1,347,982 |
| Western Midstream Operating LP | | 4.55 | 2-1-2030 | | 1,100,000 | 1,051,457 |
| | | | | | | 18,015,252 |
| Financials: 6.65% | | | | | | |
| Banks: 3.71% | | | | | | |
| Bank of America Corporation (U.S. SOFR +1.15%) ± | | 1.32 | 6-19-2026 | | 790,000 | 728,932 |
| Bank of America Corporation (U.S. SOFR +0.96%) ± | | 1.73 | 7-22-2027 | | 1,400,000 | 1,274,698 |
| Bank of America Corporation (U.S. SOFR +1.37%) ± | | 1.92 | 10-24-2031 | | 540,000 | 445,827 |
| Bank of America Corporation (3 Month LIBOR +1.51%) ± | | 3.71 | 4-24-2028 | | 1,440,000 | 1,407,310 |
| Bank of America Corporation (U.S. SOFR +1.21%) ± | | 2.57 | 10-20-2032 | | 170,000 | 145,796 |
| Citigroup Incorporated (U.S. SOFR +0.77%) ± | | 1.12 | 1-28-2027 | | 330,000 | 296,857 |
| Citigroup Incorporated (U.S. SOFR +1.18%) ± | | 2.52 | 11-3-2032 | | 450,000 | 380,657 |
| Citigroup Incorporated (U.S. SOFR +2.11%) ± | | 2.57 | 6-3-2031 | | 370,000 | 321,428 |
| Citigroup Incorporated (U.S. SOFR +1.35%) ± | | 3.06 | 1-25-2033 | | 240,000 | 212,089 |
| Citigroup Incorporated (U.S. SOFR +1.28%) ± | | 3.07 | 2-24-2028 | | 340,000 | 324,212 |
The accompanying notes are an integral part of these financial statements.
Allspring Managed Fixed Income Portfolio | 9
Portfolio of investments—May 31, 2022
| | | Interest
rate | Maturity
date | Principal | Value |
| Banks (continued) | | | | | | |
| Citigroup Incorporated (3 Month LIBOR +1.39%) ± | | 3.67% | 7-24-2028 | $ | 900,000 | $ 873,370 |
| Citigroup Incorporated (U.S. SOFR +2.09%) ± | | 4.91 | 5-24-2033 | | 160,000 | 164,308 |
| Fifth Third Bancorp (U.S. SOFR +1.66%) ± | | 4.34 | 4-25-2033 | | 260,000 | 257,128 |
| Huntington Bancshares Incorporated (U.S. SOFR +2.05%) ± | | 5.02 | 5-17-2033 | | 210,000 | 214,435 |
| JPMorgan Chase & Company (U.S. SOFR +0.77%) ± | | 1.47 | 9-22-2027 | | 660,000 | 594,455 |
| JPMorgan Chase & Company (U.S. SOFR +1.89%) ± | | 2.18 | 6-1-2028 | | 310,000 | 282,135 |
| JPMorgan Chase & Company (U.S. SOFR +1.25%) ± | | 2.58 | 4-22-2032 | | 110,000 | 95,938 |
| JPMorgan Chase & Company (U.S. SOFR +1.26%) ± | | 2.96 | 1-25-2033 | | 390,000 | 348,184 |
| JPMorgan Chase & Company (3 Month LIBOR +1.34%) ± | | 3.78 | 2-1-2028 | | 1,100,000 | 1,082,579 |
| JPMorgan Chase & Company (3 Month LIBOR +1.26%) ± | | 4.20 | 7-23-2029 | | 600,000 | 596,219 |
| JPMorgan Chase & Company (U.S. SOFR +1.56%) ± | | 4.32 | 4-26-2028 | | 260,000 | 262,317 |
| JPMorgan Chase & Company (3 Month LIBOR +1.33%) ± | | 4.45 | 12-5-2029 | | 470,000 | 473,236 |
| KeyCorp | | 2.25 | 4-6-2027 | | 690,000 | 633,777 |
| KeyCorp (U.S. SOFR +2.06%) ± | | 4.79 | 6-1-2033 | | 410,000 | 415,112 |
| National Capital Commerce Incorporated (3 Month LIBOR +0.98%) ± | | 1.95 | 4-1-2027 | | 400,000 | 384,317 |
| PNC Bank | | 4.05 | 7-26-2028 | | 1,000,000 | 994,693 |
| Regions Financial Corporation | | 1.80 | 8-12-2028 | | 540,000 | 470,789 |
| U.S. Bancorp (U.S. SOFR +1.02%) ± | | 2.68 | 1-27-2033 | | 560,000 | 496,305 |
| Wells Fargo & Company (U.S. SOFR +1.50%) ± | | 3.35 | 3-2-2033 | | 680,000 | 627,309 |
| Wells Fargo & Company (U.S. SOFR +1.51%) ± | | 3.53 | 3-24-2028 | | 720,000 | 699,981 |
| | | | | | | 15,504,393 |
| Capital markets: 1.58% | | | | | | |
| Charles Schwab Corporation | | 2.90 | 3-3-2032 | | 550,000 | 496,807 |
| Goldman Sachs Capital II (3 Month LIBOR +0.77%) ± | | 4.00 | 12-29-2049 | | 6,000 | 4,380 |
| Goldman Sachs Group Incorporated (U.S. SOFR +0.91%) ± | | 1.95 | 10-21-2027 | | 210,000 | 191,447 |
| Goldman Sachs Group Incorporated (U.S. SOFR +1.11%) ± | | 2.64 | 2-24-2028 | | 390,000 | 363,673 |
| Goldman Sachs Group Incorporated (U.S. SOFR +1.85%) ± | | 3.62 | 3-15-2028 | | 1,720,000 | 1,677,245 |
| Goldman Sachs Group Incorporated (3 Month LIBOR +1.30%) ± | | 4.22 | 5-1-2029 | | 570,000 | 566,102 |
| Morgan Stanley (U.S. SOFR +1.00%) ± | | 2.48 | 1-21-2028 | | 740,000 | 689,156 |
| Morgan Stanley | | 3.88 | 1-27-2026 | | 1,000,000 | 1,002,076 |
| Morgan Stanley (U.S. SOFR +0.86%) ± | | 1.51 | 7-20-2027 | | 300,000 | 271,227 |
| MSCI Incorporated 144A | | 4.00 | 11-15-2029 | | 590,000 | 558,612 |
| State Street Corporation (U.S. SOFR +1.00%) ± | | 2.62 | 2-7-2033 | | 770,000 | 674,046 |
| State Street Corporation (U.S. SOFR +1.61%) ± | | 4.42 | 5-13-2033 | | 90,000 | 91,533 |
| | | | | | | 6,586,304 |
| Consumer finance: 0.93% | | | | | | |
| American Express | | 4.05 | 5-3-2029 | | 240,000 | 240,463 |
| American Honda Finance Corporation | | 2.25 | 1-12-2029 | | 440,000 | 396,133 |
| Capital One Financial Company (U.S. SOFR +1.79%) ± | | 3.27 | 3-1-2030 | | 450,000 | 409,290 |
| Capital One Financial Company (U.S. SOFR +2.37%) ± | | 5.27 | 5-10-2033 | | 290,000 | 297,104 |
| CRH Ameria Finance Incorporated 144A | | 3.95 | 4-4-2028 | | 210,000 | 208,182 |
| Daimler Finance North America LLC 144A | | 2.00 | 12-14-2026 | | 270,000 | 248,298 |
| Daimler Finance North America LLC 144A | | 2.38 | 12-14-2028 | | 450,000 | 399,360 |
| Ford Motor Credit Company LLC | | 4.95 | 5-28-2027 | | 1,200,000 | 1,194,339 |
| General Motors Financial Company | | 2.40 | 10-15-2028 | | 380,000 | 325,877 |
| General Motors Financial Company | | 4.30 | 4-6-2029 | | 180,000 | 171,637 |
| | | | | | | 3,890,683 |
| Insurance: 0.40% | | | | | | |
| AON Corporation | | 2.85 | 5-28-2027 | | 180,000 | 171,804 |
The accompanying notes are an integral part of these financial statements.
10 | Allspring Managed Fixed Income Portfolio
Portfolio of investments—May 31, 2022
| | | Interest
rate | Maturity
date | Principal | Value |
| Insurance (continued) | | | | | | |
| Marsh & McLennan Incorporated | | 2.38% | 12-15-2031 | $ | 510,000 | $ 440,762 |
| NLV Financial Corporation 144A | | 7.50 | 8-15-2033 | | 565,000 | 675,730 |
| Northwestern Mutual Life 144A | | 3.45 | 3-30-2051 | | 470,000 | 377,668 |
| | | | | | | 1,665,964 |
| Mortgage REITs: 0.03% | | | | | | |
| Ventas Realty LP | | 3.50 | 2-1-2025 | | 150,000 | 148,764 |
| Health care: 3.66% | | | | | | |
| Biotechnology: 0.29% | | | | | | |
| AbbVie Incorporated | | 4.55 | 3-15-2035 | | 1,200,000 | 1,212,612 |
| Health care equipment & supplies: 0.76% | | | | | | |
| Baxter International Incorporated 144A | | 1.92 | 2-1-2027 | | 260,000 | 237,888 |
| Baxter International Incorporated 144A | | 2.27 | 12-1-2028 | | 1,130,000 | 1,009,585 |
| Hologic Incorporated 144A | | 3.25 | 2-15-2029 | | 505,000 | 454,500 |
| Hologic Incorporated 144A | | 4.63 | 2-1-2028 | | 575,000 | 571,533 |
| Teleflex Incorporated 144A | | 4.25 | 6-1-2028 | | 800,000 | 768,284 |
| Teleflex Incorporated | | 4.63 | 11-15-2027 | | 150,000 | 148,260 |
| | | | | | | 3,190,050 |
| Health care providers & services: 1.69% | | | | | | |
| Advocate Health Corporation | | 4.27 | 8-15-2048 | | 290,000 | 280,372 |
| BayCare Health System Incorporated | | 3.83 | 11-15-2050 | | 145,000 | 134,318 |
| Cleveland Clinic Foundation | | 4.86 | 1-1-2114 | | 347,000 | 333,994 |
| CVS Health Corporation | | 1.75 | 8-21-2030 | | 200,000 | 165,894 |
| CVS Health Corporation | | 4.30 | 3-25-2028 | | 285,000 | 288,551 |
| CVS Health Corporation | | 5.05 | 3-25-2048 | | 130,000 | 132,417 |
| Inova Health System | | 4.07 | 5-15-2052 | | 355,000 | 341,788 |
| Kaiser Foundation Hospitals | | 3.27 | 11-1-2049 | | 160,000 | 129,518 |
| Mayo Clinic | | 4.13 | 11-15-2052 | | 500,000 | 488,809 |
| Mednax Incorporated 144A« | | 5.38 | 2-15-2030 | | 500,000 | 439,260 |
| Memorial Sloan Kettering Cancer Center | | 4.20 | 7-1-2055 | | 185,000 | 174,815 |
| Nationwide Children Hospital | | 4.56 | 11-1-2052 | | 325,000 | 334,558 |
| Northwestern Memorial Hospital « | | 2.63 | 7-15-2051 | | 355,000 | 261,618 |
| NYU Hospitals Center | | 3.38 | 7-1-2055 | | 550,000 | 426,284 |
| OhioHealth Corporation | | 2.83 | 11-15-2041 | | 150,000 | 119,463 |
| OhioHealth Corporation | | 3.04 | 11-15-2050 | | 260,000 | 207,181 |
| Presbyterian Healthcare Services | | 4.88 | 8-1-2052 | | 600,000 | 619,651 |
| Stanford Health Care | | 3.80 | 11-15-2048 | | 446,000 | 401,235 |
| The New York-Presbyterian Hospital | | 3.56 | 8-1-2036 | | 750,000 | 695,199 |
| UnitedHealth Group Incorporated | | 4.00 | 5-15-2029 | | 180,000 | 182,802 |
| UnitedHealth Group Incorporated | | 4.20 | 5-15-2032 | | 690,000 | 706,531 |
| WakeMed Health & Hospitals | | 3.29 | 10-1-2052 | | 280,000 | 219,467 |
| | | | | | | 7,083,725 |
| Health care technology: 0.11% | | | | | | |
| IQVIA Incorporated 144A | | 5.00 | 10-15-2026 | | 445,000 | 443,715 |
| Life sciences tools & services: 0.40% | | | | | | |
| Agilent Technologies Incorporated | | 2.75 | 9-15-2029 | | 600,000 | 538,514 |
| Charles River Laboratories Incorporated 144A | | 4.25 | 5-1-2028 | | 745,000 | 720,691 |
| Perkinelmer Incorporated | | 1.90 | 9-15-2028 | | 490,000 | 422,253 |
| | | | | | | 1,681,458 |
The accompanying notes are an integral part of these financial statements.
Allspring Managed Fixed Income Portfolio | 11
Portfolio of investments—May 31, 2022
| | | Interest
rate | Maturity
date | Principal | Value |
| Pharmaceuticals: 0.41% | | | | | | |
| Bayer US Finance LLC 144A | | 3.38% | 10-8-2024 | $ | 240,000 | $ 238,060 |
| Bayer US Finance LLC 144A | | 4.38 | 12-15-2028 | | 1,170,000 | 1,169,204 |
| Bristol Myers Squibb Company | | 2.95 | 3-15-2032 | | 310,000 | 291,018 |
| | | | | | | 1,698,282 |
| Industrials: 4.06% | | | | | | |
| Aerospace & defense: 1.26% | | | | | | |
| BAE Systems Holdings Incorporated 144A | | 3.80 | 10-7-2024 | | 1,345,000 | 1,342,111 |
| Hexcel Corporation | | 4.20 | 2-15-2027 | | 1,302,000 | 1,268,559 |
| Lockheed Martin Corporation | | 3.90 | 6-15-2032 | | 410,000 | 412,170 |
| Moog Incorporated 144A | | 4.25 | 12-15-2027 | | 700,000 | 663,250 |
| Raytheon Technologies Corporation | | 2.25 | 7-1-2030 | | 360,000 | 316,864 |
| Raytheon Technologies Corporation | | 2.38 | 3-15-2032 | | 250,000 | 217,863 |
| The Boeing Company | | 2.70 | 2-1-2027 | | 840,000 | 772,970 |
| The Boeing Company | | 5.15 | 5-1-2030 | | 155,000 | 154,099 |
| The Boeing Company | | 5.71 | 5-1-2040 | | 110,000 | 108,385 |
| | | | | | | 5,256,271 |
| Air freight & logistics: 0.22% | | | | | | |
| Fedex Corporation | | 3.90 | 2-1-2035 | | 280,000 | 258,684 |
| Fedex Corporation | | 4.25 | 5-15-2030 | | 660,000 | 658,799 |
| | | | | | | 917,483 |
| Building products: 0.37% | | | | | | |
| Fortune Brands Home | | 3.25 | 9-15-2029 | | 460,000 | 411,209 |
| Lennox International Incorporated | | 1.70 | 8-1-2027 | | 530,000 | 470,390 |
| Masco Corporation | | 6.50 | 8-15-2032 | | 150,000 | 167,493 |
| Masonite International Company 144A | | 5.38 | 2-1-2028 | | 510,000 | 509,847 |
| | | | | | | 1,558,939 |
| Chemicals: 0.29% | | | | | | |
| Axalta Coating Systems LLC 144A | | 4.75 | 6-15-2027 | | 670,000 | 638,175 |
| GrafTech International Incorporated 144A | | 4.63 | 12-15-2028 | | 640,000 | 585,773 |
| | | | | | | 1,223,948 |
| Commercial services & supplies: 0.38% | | | | | | |
| Clean Harbors Incorporated 144A | | 4.88 | 7-15-2027 | | 425,000 | 419,688 |
| Stericycle Incorporated 144A | | 3.88 | 1-15-2029 | | 1,010,000 | 916,979 |
| Waste Management Incorporated | | 4.15 | 4-15-2032 | | 260,000 | 262,046 |
| | | | | | | 1,598,713 |
| Electrical equipment: 0.37% | | | | | | |
| Carrier Global Corporation | | 2.49 | 2-15-2027 | | 780,000 | 724,219 |
| Emerson Electric Company | | 2.20 | 12-21-2031 | | 930,000 | 809,440 |
| | | | | | | 1,533,659 |
| Industrial conglomerates: 0.10% | | | | | | |
| Roper Technologies Incorporated | | 2.95 | 9-15-2029 | | 470,000 | 427,860 |
| Machinery: 0.40% | | | | | | |
| Cintas Corporation No.2 | | 4.00 | 5-1-2032 | | 250,000 | 250,432 |
| Mueller Water Products Incorporated 144A | | 4.00 | 6-15-2029 | | 700,000 | 630,000 |
The accompanying notes are an integral part of these financial statements.
12 | Allspring Managed Fixed Income Portfolio
Portfolio of investments—May 31, 2022
| | | Interest
rate | Maturity
date | Principal | Value |
| Machinery (continued) | | | | | | |
| Oshkosh Corporation | | 3.10% | 3-1-2030 | $ | 490,000 | $ 427,924 |
| Oshkosh Corporation | | 4.60 | 5-15-2028 | | 200,000 | 201,413 |
| Stanley Black & Decker Incorporated | | 3.00 | 5-15-2032 | | 180,000 | 163,587 |
| | | | | | | 1,673,356 |
| Professional services: 0.11% | | | | | | |
| Equifax Incorporated | | 2.35 | 9-15-2031 | | 180,000 | 149,037 |
| Relx Capital Incorporated | | 3.00 | 5-22-2030 | | 70,000 | 63,462 |
| Relx Capital Incorporated | | 4.00 | 3-18-2029 | | 240,000 | 238,507 |
| | | | | | | 451,006 |
| Road & rail: 0.56% | | | | | | |
| Burlington North Santa Fe Company %% | | 4.45 | 1-15-2053 | | 210,000 | 208,839 |
| Norfolk Southern Corporation | | 3.00 | 3-15-2032 | | 300,000 | 275,335 |
| Norfolk Southern Corporation | | 5.10 | 12-31-2049 | | 760,000 | 723,902 |
| Ryder System Incorporated | | 2.85 | 3-1-2027 | | 300,000 | 283,797 |
| Union Pacific Corporation | | 2.80 | 2-14-2032 | | 450,000 | 410,563 |
| Union Pacific Corporation | | 3.70 | 3-1-2029 | | 441,000 | 435,864 |
| | | | | | | 2,338,300 |
| Information technology: 2.54% | | | | | | |
| Electronic equipment, instruments & components: 0.31% | | | | | | |
| Amphenol Corporation | | 2.20 | 9-15-2031 | | 480,000 | 401,509 |
| Jabil Incorporated | | 3.95 | 1-12-2028 | | 900,000 | 881,550 |
| | | | | | | 1,283,059 |
| IT services: 0.26% | | | | | | |
| Gartner Incorporated 144A | | 4.50 | 7-1-2028 | | 580,000 | 564,021 |
| Paypal Holdings Incorporated | | 3.90 | 6-1-2027 | | 220,000 | 222,694 |
| Verisign Incorporated | | 4.75 | 7-15-2027 | | 300,000 | 299,353 |
| | | | | | | 1,086,068 |
| Semiconductors & semiconductor equipment: 0.93% | | | | | | |
| KLA Tencor Corporation | | 4.10 | 3-15-2029 | | 150,000 | 151,007 |
| Maxim Integrated Products Incorporated | | 3.45 | 6-15-2027 | | 1,550,000 | 1,510,800 |
| Microchip Technology Incorporated | | 4.25 | 9-1-2025 | | 375,000 | 373,057 |
| Microchip Technology Incorporated | | 4.33 | 6-1-2023 | | 1,370,000 | 1,385,988 |
| ON Semiconductor Corporation 144A | | 3.88 | 9-1-2028 | | 500,000 | 474,305 |
| | | | | | | 3,895,157 |
| Software: 0.65% | | | | | | |
| CDK Global Incorporated 144A | | 5.25 | 5-15-2029 | | 475,000 | 475,000 |
| Fair Isaac Corporation 144A | | 4.00 | 6-15-2028 | | 725,000 | 688,591 |
| Fair Isaac Corporation 144A | | 5.25 | 5-15-2026 | | 705,000 | 704,119 |
| Oracle Corporation | | 2.30 | 3-25-2028 | | 970,000 | 856,442 |
| | | | | | | 2,724,152 |
| Technology hardware, storage & peripherals: 0.39% | | | | | | |
| Extra Space Storage LP | | 3.90 | 4-1-2029 | | 110,000 | 105,558 |
| Hewlett Packard Enterprise Company | | 4.90 | 10-15-2025 | | 375,000 | 387,325 |
| HP Incorporated | | 1.45 | 6-17-2026 | | 350,000 | 314,908 |
The accompanying notes are an integral part of these financial statements.
Allspring Managed Fixed Income Portfolio | 13
Portfolio of investments—May 31, 2022
| | | Interest
rate | Maturity
date | Principal | Value |
| Technology hardware, storage & peripherals (continued) | | | | | | |
| HP Incorporated | | 4.00% | 4-15-2029 | $ | 270,000 | $ 258,267 |
| TSMC Arizona Corporation | | 1.75 | 10-25-2026 | | 600,000 | 554,899 |
| | | | | | | 1,620,957 |
| Materials: 4.32% | | | | | | |
| Chemicals: 2.39% | | | | | | |
| Albemarle Corporation | | 4.15 | 12-1-2024 | | 1,390,000 | 1,427,739 |
| Albemarle Corporation | | 5.05 | 6-1-2032 | | 190,000 | 191,444 |
| Ashland LLC 144A | | 3.38 | 9-1-2031 | | 875,000 | 750,313 |
| DuPont de Nemours Incorporated | | 4.49 | 11-15-2025 | | 430,000 | 441,372 |
| DuPont de Nemours Incorporated | | 4.73 | 11-15-2028 | | 930,000 | 963,870 |
| ECOLAB Incorporated « | | 2.13 | 2-1-2032 | | 570,000 | 491,915 |
| FMC Corporation | | 3.20 | 10-1-2026 | | 1,120,000 | 1,086,102 |
| Ingevity Corporation 144A | | 3.88 | 11-1-2028 | | 200,000 | 179,500 |
| Mosaic Company | | 4.05 | 11-15-2027 | | 1,090,000 | 1,088,610 |
| PPG Industries Incorporated | | 2.55 | 6-15-2030 | | 770,000 | 692,991 |
| RPM International Incorporated | | 4.55 | 3-1-2029 | | 420,000 | 417,246 |
| Scotts Miracle-Gro Company | | 4.50 | 10-15-2029 | | 120,000 | 107,702 |
| Scotts Miracle-Gro Company | | 5.25 | 12-15-2026 | | 800,000 | 772,000 |
| The Sherwin-Williams Company | | 2.95 | 8-15-2029 | | 450,000 | 414,921 |
| The Sherwin-Williams Company | | 3.30 | 2-1-2025 | | 100,000 | 99,372 |
| Valvoline Incorporated 144A | | 4.25 | 2-15-2030 | | 720,000 | 656,100 |
| WR Grace Holding LLC 144A | | 5.63 | 10-1-2024 | | 200,000 | 199,000 |
| | | | | | | 9,980,197 |
| Construction materials: 0.06% | | | | | | |
| Martin Marietta Materials Incorporated | | 2.50 | 3-15-2030 | | 280,000 | 242,804 |
| Containers & packaging: 1.27% | | | | | | |
| Ball Corporation | | 3.13 | 9-15-2031 | | 550,000 | 480,453 |
| Graphic Packaging International Company 144A | | 3.50 | 3-15-2028 | | 275,000 | 255,445 |
| Graphic Packaging International Company 144A | | 3.50 | 3-1-2029 | | 420,000 | 379,050 |
| Graphic Packaging International Company | | 4.13 | 8-15-2024 | | 355,000 | 352,781 |
| Packaging Corporation of America | | 3.00 | 12-15-2029 | | 480,000 | 441,711 |
| Sealed Air Corporation 144A | | 5.50 | 9-15-2025 | | 450,000 | 461,066 |
| Silgan Holdings Incorporated | | 4.13 | 2-1-2028 | | 760,000 | 730,846 |
| Westrock Company | | 3.00 | 9-15-2024 | | 1,680,000 | 1,660,557 |
| Wrkco Incorporated | | 3.90 | 6-1-2028 | | 560,000 | 553,334 |
| | | | | | | 5,315,243 |
| Metals & mining: 0.44% | | | | | | |
| Freeport-McMoRan Incorporated | | 4.13 | 3-1-2028 | | 840,000 | 805,518 |
| Freeport-McMoRan Incorporated | | 4.55 | 11-14-2024 | | 385,000 | 391,613 |
| Newmont Mining Corporation | | 2.60 | 7-15-2032 | | 485,000 | 416,705 |
| NuCor Corporation | | 4.30 | 5-23-2027 | | 210,000 | 213,270 |
| | | | | | | 1,827,106 |
| Paper & forest products: 0.16% | | | | | | |
| Clearwater Paper Corporation 144A | | 4.75 | 8-15-2028 | | 775,000 | 697,060 |
| Real estate: 2.32% | | | | | | |
| Equity REITs: 2.32% | | | | | | |
| Alexandria Real Estate Equities Incorporated | | 2.95 | 3-15-2034 | | 290,000 | 253,441 |
The accompanying notes are an integral part of these financial statements.
14 | Allspring Managed Fixed Income Portfolio
Portfolio of investments—May 31, 2022
| | | Interest
rate | Maturity
date | Principal | Value |
| Equity REITs (continued) | | | | | | |
| Alexandria Real Estate Equities Incorporated | | 3.95% | 1-15-2027 | $ | 240,000 | $ 240,795 |
| Boston Properties LP | | 2.75 | 10-1-2026 | | 780,000 | 738,011 |
| CubeSmart LP | | 2.25 | 12-15-2028 | | 160,000 | 140,705 |
| Digital Realty Trust LP | | 4.45 | 7-15-2028 | | 510,000 | 510,539 |
| Duke Realty LP | | 3.25 | 6-30-2026 | | 1,500,000 | 1,466,119 |
| Duke Realty LP | | 4.00 | 9-15-2028 | | 230,000 | 229,610 |
| HCP Incorporated | | 3.50 | 7-15-2029 | | 560,000 | 535,256 |
| Healthpeak Properties Incorporated | | 2.13 | 12-1-2028 | | 40,000 | 35,603 |
| Healthpeak Properties Incorporated | | 2.88 | 1-15-2031 | | 190,000 | 169,412 |
| Host Hotels & Resorts Incorporated | | 3.88 | 4-1-2024 | | 265,000 | 264,059 |
| Kimco Realty Corporation | | 3.30 | 2-1-2025 | | 1,500,000 | 1,485,772 |
| Mid-America Apartments LP | | 3.60 | 6-1-2027 | | 845,000 | 823,940 |
| Mid-America Apartments LP | | 4.20 | 6-15-2028 | | 160,000 | 159,618 |
| National Retail Properties Incorporated | | 4.30 | 10-15-2028 | | 370,000 | 368,231 |
| UDR Incorporated | | 3.20 | 1-15-2030 | | 350,000 | 323,258 |
| Ventas Realty LP | | 3.85 | 4-1-2027 | | 1,500,000 | 1,482,944 |
| Welltower Incorporated | | 2.05 | 1-15-2029 | | 190,000 | 165,103 |
| Welltower Incorporated | | 2.75 | 1-15-2032 | | 320,000 | 276,203 |
| | | | | | | 9,668,619 |
| Utilities: 4.70% | | | | | | |
| Electric utilities: 3.41% | | | | | | |
| Alabama Power Company | | 3.05 | 3-15-2032 | | 390,000 | 364,119 |
| American Transmission System Incorporated 144A | | 2.65 | 1-15-2032 | | 380,000 | 330,815 |
| Commonwealth Edison Company | | 3.85 | 3-15-2052 | | 450,000 | 421,154 |
| Dominion Energy South Carolina Incorporated | | 2.30 | 12-1-2031 | | 450,000 | 392,967 |
| Duke Energy Carolinas LLC | | 3.55 | 3-15-2052 | | 230,000 | 199,935 |
| Duke Energy Carolinas LLC | | 6.05 | 4-15-2038 | | 830,000 | 953,533 |
| Duke Energy Progress LLC | | 2.00 | 8-15-2031 | | 620,000 | 526,003 |
| Evergy Metro Incorporated | | 2.25 | 6-1-2030 | | 350,000 | 307,336 |
| Evergy Missouri West Incorporated 144A | | 3.75 | 3-15-2032 | | 330,000 | 318,896 |
| FirstEnergy Corporation | | 4.40 | 7-15-2027 | | 365,000 | 362,263 |
| Florida Power & Light Company | | 2.45 | 2-3-2032 | | 460,000 | 410,635 |
| ITC Holdings Corporation | | 3.65 | 6-15-2024 | | 120,000 | 120,135 |
| MidAmerican Energy Holdings Company | | 5.80 | 10-15-2036 | | 900,000 | 1,003,741 |
| Monongahela Power Company 144A | | 4.10 | 4-15-2024 | | 1,660,000 | 1,673,926 |
| NextEra Energy Operating Partners LP | | 1.88 | 1-15-2027 | | 1,060,000 | 977,261 |
| NextEra Energy Operating Partners LP 144A | | 4.25 | 9-15-2024 | | 6,000 | 5,910 |
| NextEra Energy Operating Partners LP 144A | | 4.50 | 9-15-2027 | | 500,000 | 485,115 |
| Northern States Power Company of Minnesota | | 4.50 | 6-1-2052 | | 210,000 | 218,766 |
| Northern States Power Company of Minnesota | | 5.35 | 11-1-2039 | | 1,580,000 | 1,749,730 |
| Public Service Electric & Gas Company | | 5.70 | 12-1-2036 | | 590,000 | 656,700 |
| Rochester Gas & Electric Corporation 144A | | 3.10 | 6-1-2027 | | 1,790,000 | 1,737,557 |
| Southern California Edison Company | | 6.00 | 1-15-2034 | | 188,000 | 205,131 |
| Trans-Allegheny Interstate Line Company 144A | | 3.85 | 6-1-2025 | | 200,000 | 199,260 |
| Tuscon Electric Power Company | | 3.25 | 5-15-2032 | | 420,000 | 386,861 |
| Virginia Electric and Power Company | | 3.75 | 5-15-2027 | | 250,000 | 251,732 |
| | | | | | | 14,259,481 |
| Gas utilities: 0.52% | | | | | | |
| AmeriGas Partners LP | | 5.50 | 5-20-2025 | | 450,000 | 445,500 |
| AmeriGas Partners LP | | 5.88 | 8-20-2026 | | 500,000 | 508,500 |
| Boardwalk Pipelines Company | | 3.60 | 9-1-2032 | | 625,000 | 552,872 |
| Boardwalk Pipelines Company | | 5.95 | 6-1-2026 | | 250,000 | 263,097 |
The accompanying notes are an integral part of these financial statements.
Allspring Managed Fixed Income Portfolio | 15
Portfolio of investments—May 31, 2022
| | | Interest
rate | Maturity
date | Principal | Value |
| Gas utilities (continued) | | | | | | |
| CenterPoint Energy Incorporated | | 1.75% | 10-1-2030 | $ | 330,000 | $ 274,559 |
| CenterPoint Energy Incorporated | | 3.00 | 3-1-2032 | | 120,000 | 111,501 |
| | | | | | | 2,156,029 |
| Multi-utilities: 0.77% | | | | | | |
| Black Hills Corporation | | 4.35 | 5-1-2033 | | 710,000 | 682,772 |
| DTE Energy Company | | 3.00 | 3-1-2032 | | 730,000 | 675,724 |
| San Diego Gas & Electric Company | | 3.00 | 3-15-2032 | | 490,000 | 452,550 |
| Sempra Infrastructure 144A | | 3.25 | 1-15-2032 | | 825,000 | 713,870 |
| WEC Energy Group Incorporated | | 2.20 | 12-15-2028 | | 790,000 | 705,198 |
| | | | | | | 3,230,114 |
| Total Corporate bonds and notes (Cost $175,492,395) | | | | | | 166,411,995 |
| Municipal obligations: 9.68% | | | | | | |
| Alabama: 0.21% | | | | | | |
| Miscellaneous revenue: 0.21% | | | | | | |
| Alabama Federal Aid Highway Finance Authority Special Obligation Revenue Taxable Series B | | 1.86 | 9-1-2029 | | 1,000,000 | 875,552 |
| Arizona: 0.09% | | | | | | |
| Miscellaneous revenue: 0.09% | | | | | | |
| Yuma AZ Pledged Revenue Obligations Series 2021 | | 2.10 | 7-15-2030 | | 430,000 | 375,316 |
| California: 1.78% | | | | | | |
| GO revenue: 1.68% | | | | | | |
| Alameda County CA Series A | | 3.70 | 8-1-2031 | | 275,000 | 278,730 |
| Campbell Union High School District | | 2.31 | 8-1-2035 | | 660,000 | 518,068 |
| Coast Community College District | | 2.89 | 8-1-2035 | | 1,165,000 | 986,840 |
| Desert Community College District | | 2.78 | 8-1-2035 | | 450,000 | 380,722 |
| Oxnard Union High School District | | 1.87 | 8-1-2030 | | 800,000 | 702,046 |
| Palomar Community College District | | 2.32 | 8-1-2034 | | 500,000 | 413,694 |
| San Diego Community College District Series B | | 2.88 | 8-1-2033 | | 1,935,000 | 1,744,787 |
| San Ramon Valley Unified School District | | 1.91 | 8-1-2030 | | 740,000 | 642,939 |
| Santa Monica California Community College District Taxable Election 2016 Series B1 | | 4.16 | 8-1-2033 | | 555,000 | 545,987 |
| Solano California Community College District Series B | | 1.76 | 8-1-2030 | | 950,000 | 823,823 |
| | | | | | | 7,037,636 |
| Tax revenue: 0.10% | | | | | | |
| San Jose CA RDA Senior Taxable Refunding Bonds Series A-T | | 3.38 | 8-1-2034 | | 455,000 | 423,638 |
| Florida: 0.26% | | | | | | |
| Water & sewer revenue: 0.26% | | | | | | |
| Florida Water Pollution Control Financing Corporation Series A | | 2.60 | 1-15-2030 | | 1,175,000 | 1,105,530 |
| Georgia: 0.29% | | | | | | |
| GO revenue: 0.13% | | | | | | |
| Cherokee County GA School System Build America Bonds | | 5.87 | 8-1-2028 | | 500,000 | 535,887 |
The accompanying notes are an integral part of these financial statements.
16 | Allspring Managed Fixed Income Portfolio
Portfolio of investments—May 31, 2022
| | | Interest
rate | Maturity
date | Principal | Value |
| Tax revenue: 0.16% | | | | | | |
| Metro Atlanta Rapid Transit Authority Sales Tax Refunding Series 2021D | | 2.64% | 7-1-2035 | $ | 815,000 | $ 681,523 |
| Hawaii: 0.37% | | | | | | |
| GO revenue: 0.37% | | | | | | |
| Hawaii State Taxable Series FZ | | 1.60 | 8-1-2031 | | 770,000 | 632,394 |
| Hawaii State Taxable Series GD | | 2.52 | 10-1-2035 | | 1,110,000 | 929,290 |
| | | | | | | 1,561,684 |
| Idaho: 0.04% | | | | | | |
| Miscellaneous revenue: 0.04% | | | | | | |
| Idaho Building Authority State Office Campus Project Series B | | 3.28 | 9-1-2028 | | 170,000 | 170,565 |
| Indiana: 0.43% | | | | | | |
| Education revenue: 0.10% | | | | | | |
| University of Notre Dame Taxable Series 2010 | | 4.90 | 3-1-2041 | | 400,000 | 428,813 |
| Health revenue: 0.27% | | | | | | |
| Indiana Finance Authority Community Foundation | | 3.63 | 3-1-2039 | | 1,235,000 | 1,118,864 |
| Miscellaneous revenue: 0.06% | | | | | | |
| Indianapolis IN Local Public Improvement Bonds Series A-2 | | 6.00 | 1-15-2040 | | 235,000 | 266,768 |
| Louisiana: 0.43% | | | | | | |
| Tax revenue: 0.43% | | | | | | |
| Louisiana Local Government Environmental Facilities and Community Development Authority Taxable Louisiana Utilities Restoration | | 4.28 | 2-1-2036 | | 1,365,000 | 1,375,884 |
| State of Louisiana Gasoline & Fuels Tax Revenue | | 2.80 | 5-1-2035 | | 500,000 | 429,463 |
| | | | | | | 1,805,347 |
| Massachusetts: 0.45% | | | | | | |
| GO revenue: 0.19% | | | | | | |
| Andover MA Taxable Pension Bonds | | 2.52 | 11-1-2035 | | 575,000 | 478,316 |
| Boston MA Qualified School Construction Bonds Series C | | 4.40 | 4-1-2026 | | 305,000 | 305,475 |
| | | | | | | 783,791 |
| Tax revenue: 0.20% | | | | | | |
| Massachusetts State Taxable Consolidated Loan Series E | | 5.46 | 12-1-2039 | | 750,000 | 844,859 |
| Water & sewer revenue: 0.06% | | | | | | |
| Massachusetts Water Resources Authority Series C | | 2.49 | 8-1-2034 | | 300,000 | 254,256 |
| Michigan: 0.55% | | | | | | |
| Education revenue: 0.35% | | | | | | |
| University of Michigan Taxable Bond General Series A | | 4.45 | 10-1-2122 | | 1,555,000 | 1,450,988 |
| Health revenue: 0.20% | | | | | | |
| Michigan Finance Authority Trinity Health Credit Group Series T | | 3.08 | 12-1-2034 | | 930,000 | 837,948 |
The accompanying notes are an integral part of these financial statements.
Allspring Managed Fixed Income Portfolio | 17
Portfolio of investments—May 31, 2022
| | | Interest
rate | Maturity
date | Principal | Value |
| Minnesota: 0.07% | | | | | | |
| Education revenue: 0.07% | | | | | | |
| University of Minnesota | | 4.05% | 4-1-2052 | $ | 280,000 | $ 277,205 |
| Mississippi: 0.33% | | | | | | |
| Education revenue: 0.06% | | | | | | |
| Mississippi Higher Education Assistance Corporation Series 2014-1 Class A1 (1 Month LIBOR +0.68%) ± | | 1.69 | 10-25-2035 | | 257,141 | 254,571 |
| Miscellaneous revenue: 0.27% | | | | | | |
| Mississippi Series E | | 2.49 | 10-1-2035 | | 1,350,000 | 1,135,341 |
| New Jersey: 0.14% | | | | | | |
| Miscellaneous revenue: 0.14% | | | | | | |
| Hudson County NJ Improvement Authority Hudson County Lease Project (AGM Insured) | | 7.40 | 12-1-2025 | | 540,000 | 580,503 |
| New York: 0.32% | | | | | | |
| GO revenue: 0.11% | | | | | | |
| New York Refunding Bond Series B | | 2.65 | 2-15-2030 | | 500,000 | 462,850 |
| Miscellaneous revenue: 0.21% | | | | | | |
| New York Dormitory Authority Personal Income Taxable General Purpose Series C | | 1.54 | 3-15-2027 | | 660,000 | 597,849 |
| New York State Taxable Bonds Series 2010C | | 5.62 | 3-1-2040 | | 250,000 | 283,731 |
| | | | | | | 881,580 |
| North Carolina: 0.42% | | | | | | |
| Education revenue: 0.42% | | | | | | |
| North Carolina Education Assistance Authority Student Loan (3 Month LIBOR +0.90%) ± | | 2.08 | 7-25-2041 | | 1,173,420 | 1,170,051 |
| North Carolina Education Assistance Authority Student Loan Series A3 (3 Month LIBOR +0.90%) ± | | 2.08 | 10-25-2041 | | 341,545 | 341,507 |
| University of North Carolina Chapel Hill Refunding Bonds Series C | | 3.33 | 12-1-2036 | | 250,000 | 235,961 |
| | | | | | | 1,747,519 |
| North Dakota: 0.16% | | | | | | |
| Miscellaneous revenue: 0.16% | | | | | | |
| North Dakota Public Finance Authority Series 2021 | | 2.68 | 12-1-2035 | | 750,000 | 650,437 |
| Ohio: 0.27% | | | | | | |
| Education revenue: 0.06% | | | | | | |
| Ohio State University Build America Bonds | | 4.91 | 6-1-2040 | | 250,000 | 272,306 |
| GO revenue: 0.06% | | | | | | |
| Ohio State Refunding Taxable Bond Common Schools Higher Education | | 1.88 | 9-15-2034 | | 300,000 | 238,021 |
| Health revenue: 0.15% | | | | | | |
| Ohio Hospital Facility Refunding Bond Cleveland Clinic | | 3.28 | 1-1-2042 | | 725,000 | 612,137 |
The accompanying notes are an integral part of these financial statements.
18 | Allspring Managed Fixed Income Portfolio
Portfolio of investments—May 31, 2022
| | | Interest
rate | Maturity
date | Principal | Value |
| Oklahoma: 0.17% | | | | | | |
| Water & sewer revenue: 0.17% | | | | | | |
| Oklahoma Water Resources Board Refunding Bond Series 2019 (Oklahoma Credit Enhancement Reserve Fund Insured) | | 2.56% | 4-1-2031 | $ | 770,000 | $ 705,501 |
| Oregon: 0.14% | | | | | | |
| Education revenue: 0.14% | | | | | | |
| Oregon State Taxable Higher Education Series A | | 5.90 | 8-1-2038 | | 500,000 | 566,655 |
| Pennsylvania: 0.53% | | | | | | |
| Education revenue: 0.53% | | | | | | |
| Pennsylvania HEFAR Refunding Taxable Bonds Series B | | 2.94 | 8-15-2039 | | 1,000,000 | 835,223 |
| Pennsylvania Higher Education Authority Class A (1 Month LIBOR +1.15%) 144A± | | 2.16 | 9-25-2065 | | 696,619 | 689,081 |
| University of Pittsburgh Series A | | 3.65 | 9-15-2036 | | 715,000 | 679,669 |
| | | | | | | 2,203,973 |
| Rhode Island: 0.37% | | | | | | |
| Education revenue: 0.37% | | | | | | |
| Rhode Island Student Loan Authority Class A-1 (1 Month LIBOR +0.90%) ± | | 1.70 | 7-1-2031 | | 1,537,394 | 1,535,317 |
| Texas: 0.86% | | | | | | |
| Education revenue: 0.21% | | | | | | |
| University of Texas Build America Bonds Series A | | 5.26 | 7-1-2039 | | 550,000 | 615,005 |
| University of Texas Build America Bonds Series D | | 5.13 | 8-15-2042 | | 215,000 | 243,789 |
| | | | | | | 858,794 |
| GO revenue: 0.50% | | | | | | |
| Hidalgo County TX Refunding Bonds Series 2018C | | 4.04 | 8-15-2030 | | 1,270,000 | 1,327,134 |
| Houston TX Pension Obligation Bonds Series 2017 | | 3.73 | 3-1-2030 | | 110,000 | 110,639 |
| Stafford TX Municipal School District Refunding Bond Series B | | 3.08 | 8-15-2041 | | 750,000 | 634,483 |
| | | | | | | 2,072,256 |
| Miscellaneous revenue: 0.09% | | | | | | |
| Texas Transportation Commission Series 2020 | | 1.88 | 10-1-2034 | | 500,000 | 397,712 |
| Tax revenue: 0.06% | | | | | | |
| Texas Transportation Commission Highway Fund Series B | | 5.18 | 4-1-2030 | | 250,000 | 269,142 |
| Vermont: 0.03% | | | | | | |
| Housing revenue: 0.03% | | | | | | |
| Vermont Housing Finance Agency | | 3.80 | 11-1-2037 | | 110,000 | 106,663 |
| Virginia: 0.17% | | | | | | |
| Education revenue: 0.15% | | | | | | |
| University of Virginia Build America Bonds | | 6.20 | 9-1-2039 | | 315,000 | 396,602 |
| University of Virginia Revenue Bond Series C | | 4.18 | 9-1-2117 | | 265,000 | 232,709 |
| | | | | | | 629,311 |
| Housing revenue: 0.02% | | | | | | |
| Virginia Housing Development Authority | | 3.10 | 6-25-2041 | | 82,113 | 81,205 |
The accompanying notes are an integral part of these financial statements.
Allspring Managed Fixed Income Portfolio | 19
Portfolio of investments—May 31, 2022
| | | Interest
rate | Maturity
date | Principal | Value |
| Washington: 0.52% | | | | | | |
| GO revenue: 0.52% | | | | | | |
| King County WA Build America Bonds Series B | | 6.05% | 12-1-2030 | $ | 350,000 | $ 395,929 |
| King County WA Public Hospital District | | 2.70 | 12-1-2035 | | 915,000 | 779,966 |
| Washington Series T | | 3.45 | 8-1-2029 | | 1,000,000 | 984,455 |
| | | | | | | 2,160,350 |
| West Virginia: 0.10% | | | | | | |
| Tax revenue: 0.10% | | | | | | |
| Ohio County WV Special District Excise Tax Series A | | 8.25 | 3-1-2035 | | 405,000 | 401,937 |
| Wisconsin: 0.18% | | | | | | |
| Miscellaneous revenue: 0.13% | | | | | | |
| Wisconsin State Refunding Bond Taxable Series 4 | | 2.10 | 5-1-2035 | | 690,000 | 555,696 |
| Tax revenue: 0.05% | | | | | | |
| Wisconsin State Refunding Bond Taxable Series 2 | | 2.61 | 5-1-2032 | | 240,000 | 217,740 |
| Total Municipal obligations (Cost $44,311,985) | | | | | | 40,433,687 |
| Non-agency mortgage-backed securities: 7.61% | | | | | | |
| Commercial Mortgage Pass-Through Certificate Series 2012-UBS5 Class A3 | | 3.55 | 9-10-2047 | | 265,282 | 265,908 |
| Commercial Mortgage Pass-Through Certificate Series 2013-CR12 Class ASB | | 3.62 | 10-10-2046 | | 153,112 | 153,571 |
| Commercial Mortgage Pass-Through Certificate Series 2013-CR13 Class A4 ±± | | 4.19 | 11-10-2046 | | 600,000 | 605,362 |
| Commercial Mortgage Pass-Through Certificate Series 2014-CR17 Class A5 | | 3.98 | 5-10-2047 | | 1,795,000 | 1,804,253 |
| Commercial Mortgage Pass-Through Certificate Series 2014-CR21 Class A3 | | 3.53 | 12-10-2047 | | 2,649,561 | 2,635,145 |
| Commercial Mortgage Pass-Through Certificate Series 2014-UBS5 Class A4 | | 3.84 | 9-10-2047 | | 620,000 | 617,449 |
| Goldman Sachs Mortgage Securities Trust Series 2013-GC14 Class A5 | | 4.24 | 8-10-2046 | | 615,000 | 617,976 |
| Goldman Sachs Mortgage Securities Trust Series 2013-GC16 Class A4 | | 4.27 | 11-10-2046 | | 350,000 | 352,197 |
| Goldman Sachs Mortgage Securities Trust Series 2014-GC26 Class A5 | | 3.63 | 11-10-2047 | | 2,565,000 | 2,558,374 |
| JPMorgan Chase Commercial Mortgage Securities Trust Series 2014-C19 Class A4 | | 4.00 | 4-15-2047 | | 450,000 | 450,825 |
| JPMorgan Chase Commercial Mortgage Securities Trust Series 2014-C20 Class A5 | | 3.80 | 7-15-2047 | | 4,065,000 | 4,073,569 |
| JPMorgan Chase Commercial Mortgage Securities Trust Series 2014-GC26 Class A4 | | 3.49 | 1-15-2048 | | 1,338,000 | 1,323,798 |
| Morgan Stanley Bank of America Merrill Lynch Trust Series 2014-C15 Class ASB | | 3.65 | 4-15-2047 | | 174,849 | 175,560 |
| Morgan Stanley Bank of America Merrill Lynch Trust Series 2014-C19 Class A4 | | 3.53 | 12-15-2047 | | 1,790,000 | 1,770,556 |
| Small Business Investment Company Series 2021-10A Class 1 | | 1.67 | 3-10-2031 | | 578,841 | 535,974 |
| Small Business Investment Company Series 2021-10B Class 1 | | 1.30 | 9-10-2031 | | 1,664,339 | 1,523,479 |
| Small Business Investment Company Series 2022-10A Class 1 | | 2.94 | 3-10-2032 | | 3,505,000 | 3,479,303 |
The accompanying notes are an integral part of these financial statements.
20 | Allspring Managed Fixed Income Portfolio
Portfolio of investments—May 31, 2022
| | | Interest
rate | Maturity
date | Principal | Value |
| Non-agency mortgage-backed securities (continued) | | | | | | |
| Towd Point Mortgage Trust Series 2016-2 Class A1A 144A±± | | 2.75% | 8-25-2055 | $ | 2,067 | $ 2,062 |
| Towd Point Mortgage Trust Series 2018-3 Class A1 144A±± | | 3.75 | 5-25-2058 | | 1,214,265 | 1,198,556 |
| Towd Point Mortgage Trust Series 2019-4 Class A1 144A±± | | 2.90 | 10-25-2059 | | 1,435,593 | 1,388,320 |
| WFRBS Commercial Mortgage Trust Series 2013-C17 Class A4 | | 4.02 | 12-15-2046 | | 4,370,000 | 4,393,275 |
| WFRBS Commercial Mortgage Trust Series 2014-C20 Class A5 | | 4.00 | 5-15-2047 | | 1,876,047 | 1,868,376 |
| Total Non-agency mortgage-backed securities (Cost $32,192,853) | | | | | | 31,793,888 |
| U.S. Treasury securities: 8.41% | | | | | | |
| U.S. Treasury Bond | | 1.13 | 5-15-2040 | | 930,000 | 659,464 |
| U.S. Treasury Bond | | 1.13 | 8-15-2040 | | 2,200,000 | 1,550,227 |
| U.S. Treasury Bond | | 1.38 | 11-15-2040 | | 6,905,000 | 5,075,445 |
| U.S. Treasury Bond | | 1.88 | 2-15-2041 | | 3,095,000 | 2,480,111 |
| U.S. Treasury Bond | | 1.88 | 2-15-2051 | | 2,244,000 | 1,708,596 |
| U.S. Treasury Bond | | 2.38 | 11-15-2049 | | 10,063,000 | 8,621,551 |
| U.S. Treasury Note | | 1.50 | 2-29-2024 | | 4,550,000 | 4,477,129 |
| U.S. Treasury Note | | 1.88 | 11-15-2051 | | 5,130,000 | 3,908,419 |
| U.S. Treasury Note | | 2.00 | 8-15-2051 | | 2,140,000 | 1,679,148 |
| U.S. Treasury Note | | 2.25 | 2-15-2052 | | 1,015,000 | 848,952 |
| U.S. Treasury Note | | 2.38 | 2-15-2042 | | 2,855,000 | 2,471,805 |
| U.S. Treasury Note | | 2.38 | 5-15-2051 | | 1,185,000 | 1,017,295 |
| U.S. Treasury Note | | 3.25 | 5-15-2042 | | 660,000 | 657,834 |
| Total U.S. Treasury securities (Cost $43,805,987) | | | | | | 35,155,976 |
| Yankee corporate bonds and notes: 7.38% | | | | | | |
| Consumer discretionary: 0.07% | | | | | | |
| Automobiles: 0.07% | | | | | | |
| Honda Motor Company Limited | | 2.97 | 3-10-2032 | | 340,000 | 311,052 |
| Energy: 0.39% | | | | | | |
| Oil, gas & consumable fuels: 0.39% | | | | | | |
| BP Capital Markets plc | | 3.28 | 9-19-2027 | | 155,000 | 151,788 |
| Cenovus Energy Incorporated | | 4.25 | 4-15-2027 | | 550,000 | 551,498 |
| Petroleos Mexicanos Company | | 2.29 | 2-15-2024 | | 55,000 | 54,757 |
| Petroleos Mexicanos Company | | 2.83 | 2-15-2024 | | 115,000 | 115,063 |
| Petroleos Mexicanos Company | | 6.38 | 1-23-2045 | | 1,080,000 | 768,161 |
| | | | | | | 1,641,267 |
| Financials: 3.90% | | | | | | |
| Banks: 3.17% | | | | | | |
| Bank of Montreal | | 1.25 | 9-15-2026 | | 765,000 | 688,169 |
| Bank of Montreal | | 2.65 | 3-8-2027 | | 450,000 | 424,955 |
| Bank of Nova Scotia | | 1.30 | 9-15-2026 | | 1,040,000 | 936,758 |
| Bank of Nova Scotia | | 1.95 | 2-2-2027 | | 110,000 | 100,821 |
| Bank of Nova Scotia | | 4.50 | 12-16-2025 | | 80,000 | 81,241 |
| BNP Paribas SA (3 Month LIBOR +1.11%) 144A± | | 2.82 | 11-19-2025 | | 820,000 | 793,127 |
| BNP Paribas SA 144A | | 4.40 | 8-14-2028 | | 520,000 | 512,019 |
The accompanying notes are an integral part of these financial statements.
Allspring Managed Fixed Income Portfolio | 21
Portfolio of investments—May 31, 2022
| | | Interest
rate | Maturity
date | Principal | Value |
| Banks (continued) | | | | | | |
| Cooperatieve Rabobank UA (1 Year Treasury Constant Maturity +1.00%) 144A± | | 1.34% | 6-24-2026 | $ | 530,000 | $ 490,881 |
| Cooperatieve RaboBank UA (1 Year Treasury Constant Maturity +0.73%) 144A± | | 1.98 | 12-15-2027 | | 1,060,000 | 960,671 |
| HSBC Holdings plc (U.S. SOFR +1.41%) ± | | 2.87 | 11-22-2032 | | 270,000 | 228,792 |
| HSBC Holdings plc (3 Month LIBOR +1.35%) ± | | 4.29 | 9-12-2026 | | 950,000 | 946,555 |
| HSBC Holdings plc (3 Month LIBOR +1.53%) ± | | 4.58 | 6-19-2029 | | 1,500,000 | 1,483,559 |
| Mitsubishi UFJ Financial Group (1 Year Treasury Constant Maturity +0.75%) ± | | 1.54 | 7-20-2027 | | 1,050,000 | 942,766 |
| Mitsubishi UFJ Financial Group (1 Year Treasury Constant Maturity +0.83%) ± | | 2.34 | 1-19-2028 | | 300,000 | 275,704 |
| Mitsubishi UFJ Financial Group (1 Year Treasury Constant Maturity +0.97%) ± | | 2.49 | 10-13-2032 | | 260,000 | 219,792 |
| National Australia Bank %% | | 3.91 | 6-9-2027 | | 250,000 | 250,000 |
| Royal Bank of Canada | | 1.40 | 11-2-2026 | | 830,000 | 747,603 |
| Royal Bank of Canada | | 3.88 | 5-4-2032 | | 430,000 | 416,328 |
| Sumitomo Mitsui Financial Group Incorporated | | 1.47 | 7-8-2025 | | 430,000 | 401,251 |
| Sumitomo Mitsui Financial Group Incorporated | | 1.90 | 9-17-2028 | | 660,000 | 573,171 |
| Sumitomo Mitsui Financial Group Incorporated | | 2.17 | 1-14-2027 | | 200,000 | 184,115 |
| TD Bank National Association | | 2.45 | 1-12-2032 | | 230,000 | 197,635 |
| Toronto Dominion Bank | | 1.25 | 9-10-2026 | | 1,130,000 | 1,017,379 |
| Toronto Dominion Bank | | 3.20 | 3-10-2032 | | 410,000 | 375,515 |
| | | | | | | 13,248,807 |
| Capital markets: 0.73% | | | | | | |
| Credit Suisse Group AG (3 Month LIBOR +1.41%) 144A± | | 3.87 | 1-12-2029 | | 1,500,000 | 1,405,847 |
| UBS Group AG (1 Year Treasury Constant Maturity +1.10%) 144A± | | 2.75 | 2-11-2033 | | 200,000 | 170,186 |
| UBS Group Funding Switzerland 144A | | 4.25 | 3-23-2028 | | 1,500,000 | 1,488,675 |
| | | | | | | 3,064,708 |
| Health care: 0.21% | | | | | | |
| Pharmaceuticals: 0.21% | | | | | | |
| Teva Pharmaceutical Finance BV | | 3.15 | 10-1-2026 | | 975,000 | 864,981 |
| Industrials: 1.18% | | | | | | |
| Aerospace & defense: 0.29% | | | | | | |
| Embraer Netherlands Finance BV | | 5.05 | 6-15-2025 | | 1,200,000 | 1,211,124 |
| Electrical equipment: 0.28% | | | | | | |
| Sensata Technologies BV 144A | | 4.00 | 4-15-2029 | | 935,000 | 890,588 |
| Sensata Technologies BV 144A | | 5.63 | 11-1-2024 | | 265,000 | 269,457 |
| | | | | | | 1,160,045 |
| Machinery: 0.50% | | | | | | |
| CNH Industrial NV | | 4.50 | 8-15-2023 | | 600,000 | 608,436 |
| Siemens Finance 144A | | 1.70 | 3-11-2028 | | 660,000 | 589,193 |
| Trane Technologies plc | | 3.80 | 3-21-2029 | | 930,000 | 892,932 |
| | | | | | | 2,090,561 |
| Road & rail: 0.11% | | | | | | |
| Canadian Pacific Railway Company | | 2.45 | 12-2-2031 | | 520,000 | 458,120 |
The accompanying notes are an integral part of these financial statements.
22 | Allspring Managed Fixed Income Portfolio
Portfolio of investments—May 31, 2022
| | | Interest
rate | Maturity
date | Principal | Value |
| Information technology: 0.75% | | | | | | |
| Electronic equipment, instruments & components: 0.08% | | | | | | |
| Tyco Electronics Corporation | | 2.50% | 2-4-2032 | $ | 360,000 | $ 319,777 |
| Semiconductors & semiconductor equipment: 0.20% | | | | | | |
| NXP BV | | 2.65 | 2-15-2032 | | 870,000 | 723,543 |
| NXP BV | | 5.00 | 1-15-2033 | | 110,000 | 110,003 |
| | | | | | | 833,546 |
| Software: 0.24% | | | | | | |
| Experian Finance plc 144A | | 4.25 | 2-1-2029 | | 510,000 | 509,496 |
| OpenText Corporation 144A | | 3.88 | 2-15-2028 | | 520,000 | 488,691 |
| | | | | | | 998,187 |
| Technology hardware, storage & peripherals: 0.23% | | | | | | |
| Seagate HDD | | 3.13 | 7-15-2029 | | 375,000 | 328,069 |
| TSMC Global Limited 144A | | 1.25 | 4-23-2026 | | 700,000 | 640,350 |
| | | | | | | 968,419 |
| Materials: 0.88% | | | | | | |
| Chemicals: 0.04% | | | | | | |
| Nutrien Limited | | 2.95 | 5-13-2030 | | 180,000 | 164,823 |
| Metals & mining: 0.84% | | | | | | |
| Anglo American Capital plc 144A | | 4.75 | 4-10-2027 | | 1,000,000 | 1,016,355 |
| South23 Treasury Limited 144A | | 4.35 | 4-14-2032 | | 900,000 | 862,065 |
| Vale Overseas Limited | | 6.25 | 8-10-2026 | | 1,500,000 | 1,613,550 |
| | | | | | | 3,491,970 |
| Total Yankee corporate bonds and notes (Cost $32,783,006) | | | | | | 30,827,387 |
| | | Yield | | Shares | |
| Short-term investments: 0.91% | | | | | | |
| Investment companies: 0.91% | | | | | | |
| Allspring Government Money Market Fund Select Class ♠∞## | | 0.65 | | | 3,324,978 | 3,324,978 |
| Securities Lending Cash Investments LLC ♠∩∞ | | 0.91 | | | 479,633 | 479,633 |
| Total Short-term investments (Cost $3,804,611) | | | | | | 3,804,611 |
| Total investments in securities (Cost $445,430,079) | 100.04% | | | | | 418,050,141 |
| Other assets and liabilities, net | (0.04) | | | | | (165,222) |
| Total net assets | 100.00% | | | | | $417,884,919 |
The accompanying notes are an integral part of these financial statements.
Allspring Managed Fixed Income Portfolio | 23
Portfolio of investments—May 31, 2022
| ±± | The coupon of the security is adjusted based on the principal and/or interest payments received from the underlying pool of mortgages as well as the credit quality and the actual prepayment speed of the underlying mortgages. The rate shown is the rate in effect at period end. |
| øø | The interest rate is determined and reset by the issuer periodically depending upon the terms of the security. The rate shown is the rate in effect at period end. |
| 144A | The security may be resold in transactions exempt from registration, normally to qualified institutional buyers, pursuant to Rule 144A under the Securities Act of 1933. |
| ± | Variable rate investment. The rate shown is the rate in effect at period end. |
| ## | All or a portion of this security is segregated for when-issued securities. |
| « | All or a portion of this security is on loan. |
| ♠ | The issuer of the security is an affiliated person of the Portfolio as defined in the Investment Company Act of 1940. |
| ∩ | The investment is a non-registered investment company purchased with cash collateral received from securities on loan. |
| ∞ | The rate represents the 7-day annualized yield at period end. |
| %% | The security is purchased on a when-issued basis. |
| Abbreviations: |
| AGM | Assured Guaranty Municipal |
| FHLMC | Federal Home Loan Mortgage Corporation |
| FNMA | Federal National Mortgage Association |
| GNMA | Government National Mortgage Association |
| GO | General obligation |
| HEFAR | Higher Education Facilities Authority Revenue |
| LIBOR | London Interbank Offered Rate |
| RDA | Redevelopment Authority |
| REIT | Real estate investment trust |
| SBA | Small Business Authority |
| SOFR | Secured Overnight Financing Rate |
Investments in affiliates
An affiliated investment is an investment in which the Portfolio owns at least 5% of the outstanding voting shares of the issuer or as a result of other relationships, such as the Portfolio and the issuer having the same adviser or investment manager. Transactions with issuers that were affiliates of the Portfolio at the end of the period were as follows:
| | Value,
beginning of
period | Purchases | Sales
proceeds | Net
realized
gains
(losses) | | Net
change in
unrealized
gains
(losses) | | Value,
end of
period | Shares,
end
of period | Income
from
affiliated
securities |
| Short-term investments | | | | | | | | | |
| Allspring Government Money Market Fund Select Class | $23,036,815 | $168,600,811 | $(188,312,648) | $0 | | $0 | | $ 3,324,978 | 3,324,978 | $ 8,697 |
| Securities Lending Cash Investments LLC | 127,000 | 2,414,118 | (2,061,485) | 0 | | 0 | | 479,633 | 479,633 | 141 # |
| | | | | $0 | | $0 | | $3,804,611 | | $8,838 |
| # | Amount shown represents income before fees and rebates. |
The accompanying notes are an integral part of these financial statements.
24 | Allspring Managed Fixed Income Portfolio
Statement of assets and liabilities—May 31, 2022
| | |
| Assets | |
Investments in unaffiliated securities (including $470,113 of securities loaned), at value (cost $441,625,468)
| $ 414,245,530 |
Investments in affiliated securities, at value (cost $3,804,611)
| 3,804,611 |
Receivable for interest
| 3,039,128 |
Receivable for investments sold
| 148,217 |
Receivable for securities lending income, net
| 173 |
Prepaid expenses and other assets
| 13,691 |
Total assets
| 421,251,350 |
| Liabilities | |
Payable for when-issued transactions
| 2,252,766 |
Payable for investments purchased
| 515,230 |
Payable upon receipt of securities loaned
| 479,633 |
Advisory fee payable
| 118,802 |
Total liabilities
| 3,366,431 |
Total net assets
| $417,884,919 |
The accompanying notes are an integral part of these financial statements.
Allspring Managed Fixed Income Portfolio | 25
Statement of operations—year ended May 31, 2022
| | |
| Investment income | |
Interest (net of foreign withholding taxes of $511)
| $ 14,056,730 |
Income from affiliated securities
| 9,493 |
Total investment income
| 14,066,223 |
| Expenses | |
Advisory fee
| 1,931,248 |
Custody and accounting fees
| 43,077 |
Professional fees
| 77,926 |
Interest holder report expenses
| 38,442 |
Trustees’ fees and expenses
| 19,821 |
Other fees and expenses
| 37,457 |
Total expenses
| 2,147,971 |
Less: Fee waivers and/or expense reimbursements
| (269,853) |
Net expenses
| 1,878,118 |
Net investment income
| 12,188,105 |
| Realized and unrealized gains (losses) on investments | |
Net realized losses on investments
| (1,161,647) |
Net change in unrealized gains (losses) on investments
| (48,938,887) |
Net realized and unrealized gains (losses) on investments
| (50,100,534) |
Net decrease in net assets resulting from operations
| $(37,912,429) |
The accompanying notes are an integral part of these financial statements.
26 | Allspring Managed Fixed Income Portfolio
Statement of changes in net assets
| | | |
| | Year ended
May 31, 2022 | Year ended
May 31, 2021 |
| Operations | | |
Net investment income
| $ 12,188,105 | $ 11,781,229 |
Net realized gains (losses) on investments
| (1,161,647) | 3,530,420 |
Net change in unrealized gains (losses) on investments
| (48,938,887) | (3,700,898) |
Net increase (decrease) in net assets resulting from operations
| (37,912,429) | 11,610,751 |
| Capital transactions | | |
| Transactions in investors’ beneficial interests | | |
Contributions
| 43,182,233 | 59,804,501 |
Withdrawals
| (83,560,206) | (37,488,593) |
Net increase (decrease) in net assets resulting from capital transactions
| (40,377,973) | 22,315,908 |
Total increase (decrease) in net assets
| (78,290,402) | 33,926,659 |
| Net assets | | |
Beginning of period
| 496,175,321 | 462,248,662 |
End of period
| $417,884,919 | $496,175,321 |
The accompanying notes are an integral part of these financial statements.
Allspring Managed Fixed Income Portfolio | 27
| | Year ended May 31 |
| | 2022 | 2021 | 2020 | 2019 | 2018 |
Total return
| (8.13)% | 2.52% | 7.51% | 7.22% | 0.05% |
| Ratios to average net assets (annualized) | | | | | |
Gross expenses
| 0.44% | 0.44% | 0.42% | 0.41% | 0.49% |
Net expenses1
| 0.39% | 0.39% | 0.39% | 0.39% | 0.39% |
Net investment income
| 2.52% | 2.49% | 3.10% | 3.24% | 3.09% |
| Supplemental data | | | | | |
Portfolio turnover rate
| 74% | 31% | 40% | 232% | 23% |
| 1 | Net expense ratios reflect voluntary waivers. |
The accompanying notes are an integral part of these financial statements.
28 | Allspring Managed Fixed Income Portfolio
Notes to financial statements
1. ORGANIZATION
Allspring Master Trust (the "Trust"), a Delaware statutory trust organized on March 10, 1999, is an open-end management investment company registered under the Investment Company Act of 1940, as amended (the "1940 Act"). As an investment company, the Trust follows the accounting and reporting guidance in Financial Accounting Standards Board ("FASB") Accounting Standards Codification Topic 946, Financial Services – Investment Companies. These financial statements report on the Allspring Managed Fixed Income Portfolio (the "Portfolio") which is a diversified series of the Trust.
Interests in the Portfolio are available solely through private placement transactions that do not involve any "public offering" within the meaning of Section 4(a)(2) of the Securities Act of 1933.
Effective on November 1, 2021, the sale transaction of Wells Fargo Asset Management ("WFAM") by Wells Fargo & Company to GTCR LLC and Reverence Capital Partners, L.P. was closed. In connection with the closing of the transaction, WFAM became known as Allspring Global Investments (“Allspring”) and various entities that provided services to the Portfolio changed their names to "Allspring", including Allspring Funds Management, LLC, the adviser to the Portfolio, Allspring Global Investments, LLC and Allspring Global Investments (UK) Limited, both registered investment advisers providing subadvisory services to certain funds, and Allspring Funds Distributor, LLC. Consummation of the transaction resulted in a new advisory agreement and subadvisory agreement which became effective on November 1, 2021.
2. SIGNIFICANT ACCOUNTING POLICIES
The following significant accounting policies, which are consistently followed in the preparation of the financial statements of the Portfolio, are in conformity with U.S. generally accepted accounting principles which require management to make estimates and assumptions that affect the reported amounts of assets and liabilities, disclosure of contingent assets and liabilities at the date of the financial statements, and the reported amounts of income and expenses during the reporting period. Actual results could differ from those estimates.
Securities valuation
All investments are valued each business day as of the close of regular trading on the New York Stock Exchange (generally 4 p.m. Eastern Time), although the Portfolio may deviate from this calculation time under unusual or unexpected circumstances.
Debt securities are valued at the evaluated bid price provided by an independent pricing service (e.g. taking into account various factors, including yields, maturities, or credit ratings) or, if a reliable price is not available, the quoted bid price from an independent broker-dealer.
Investments in registered open-end investment companies are valued at net asset value. Interests in non-registered investment companies that are redeemable at net asset value are fair valued normally at net asset value.
Investments which are not valued using any of the methods discussed above are valued at their fair value, as determined in good faith by the Board of Trustees. The Board of Trustees has established a Valuation Committee comprised of the Trustees and has delegated to it the authority to take any actions regarding the valuation of portfolio securities that the Valuation Committee deems necessary or appropriate, including determining the fair value of portfolio securities, unless the determination has been delegated to the Allspring Global Investments Pricing Committee at Allspring Funds Management, LLC ("Allspring Funds Management"). The Board of Trustees retains the authority to make or ratify any valuation decisions or approve any changes to the Valuation Procedures as it deems appropriate. On a quarterly basis, the Board of Trustees receives reports on any valuation actions taken by the Valuation Committee or the Allspring Global Investments Pricing Committee which may include items for ratification.
Securities lending
The Portfolio may lend its securities from time to time in order to earn additional income in the form of fees or interest on securities received as collateral or the investment of any cash received as collateral. When securities are on loan, the Portfolio receives interest or dividends on those securities. Cash collateral received in connection with its securities lending transactions is invested in Securities Lending Cash Investments, LLC (the "Securities Lending Fund"), an affiliated non-registered investment company. Investments in Securities Lending Fund are valued at the evaluated bid price provided by an independent pricing service. Income earned from investment in the Securities Lending Fund (net of fees and rebates), if any, is included in income from affiliated securities on the Statement of Operations.
In a securities lending transaction, the net asset value of the Portfolio is affected by an increase or decrease in the value of the securities loaned and by an increase or decrease in the value of the instrument in which collateral is invested. The amount of securities lending activity undertaken by the Portfolio fluctuates from time to time. The Portfolio has the right under the
Allspring Managed Fixed Income Portfolio | 29
Notes to financial statements
lending agreement to recover the securities from the borrower on demand. In the event of default or bankruptcy by the borrower, the Portfolio may be prevented from recovering the loaned securities or gaining access to the collateral or may experience delays or costs in doing so. In such an event, the terms of the agreement allow the unaffiliated securities lending agent to use the collateral to purchase replacement securities on behalf of the Portfolio or pay the Portfolio the market value of the loaned securities. The Portfolio bears the risk of loss with respect to depreciation of its investment of the cash collateral.
When-issued transactions
The Portfolio may purchase securities on a forward commitment or when-issued basis. The Portfolio records a when-issued transaction on the trade date and will segregate assets in an amount at least equal in value to the Portfolio's commitment to purchase when-issued securities. Securities purchased on a when-issued basis are marked-to-market daily and the Portfolio begins earning interest on the settlement date. Losses may arise due to changes in the market value of the underlying securities or if the counterparty does not perform under the contract.
Security transactions and income recognition
Securities transactions are recorded on a trade date basis. Realized gains or losses are recorded on the basis of identified cost.
Interest income is accrued daily and bond discounts are accreted and premiums are amortized daily. To the extent debt obligations are placed on non-accrual status, any related interest income may be reduced by writing off interest receivables when the collection of all or a portion of interest has been determined to be doubtful based on consistently applied procedures and the fair value has decreased. If the issuer subsequently resumes interest payments or when the collectability of interest is reasonably assured, the debt obligation is removed from non-accrual status. Interest income is recorded net of foreign taxes withheld where recovery of such taxes is not assured. Paydown gains and losses are included in interest income.
Federal and other taxes
The Portfolio is not required to pay federal income taxes on its net investment income and net capital gains as it is treated as a partnership for federal income tax purposes. All income, gains and losses of the Portfolio are deemed to have been “passed through” to the interest holders in proportion to their holdings of the Portfolio regardless of whether income and gains have been distributed by the Portfolio.
The Portfolio’s income tax returns and all financial records supporting those returns for the prior three fiscal years are subject to examination by the federal revenue authority. Management has analyzed the Portfolio’s tax positions taken on federal, state, and foreign tax returns, as applicable, for all open tax years and does not believe that there are any uncertain tax positions that require recognition of a tax liability.
As of May 31, 2022, the aggregate cost of all investments for federal income tax purposes was $445,696,336 and the unrealized gains (losses) consisted of:
| Gross unrealized gains | $ 2,001,262 |
| Gross unrealized losses | (29,647,457) |
| Net unrealized losses | $(27,646,195) |
3. FAIR VALUATION MEASUREMENTS
Fair value measurements of investments are determined within a framework that has established a fair value hierarchy based upon the various data inputs utilized in determining the value of the Portfolio’s investments. The three-level hierarchy gives the highest priority to unadjusted quoted prices in active markets for identical assets or liabilities (Level 1) and the lowest priority to unobservable inputs (Level 3). The Portfolio’s investments are classified within the fair value hierarchy based on the lowest level of input that is significant to the fair value measurement. The inputs are summarized into three broad levels as follows:
| ■ | Level 1 – quoted prices in active markets for identical securities |
| ■ | Level 2 – other significant observable inputs (including quoted prices for similar securities, interest rates, prepayment speeds, credit risk, etc.) |
| ■ | Level 3 – significant unobservable inputs (including the Portfolio’s own assumptions in determining the fair value of investments) |
The inputs or methodologies used for valuing investments in securities are not necessarily an indication of the risk associated with investing in those securities.
30 | Allspring Managed Fixed Income Portfolio
Notes to financial statements
The following is a summary of the inputs used in valuing the Portfolio’s assets and liabilities as of May 31, 2022:
| | Quoted prices
(Level 1) | Other significant
observable inputs
(Level 2) | Significant
unobservable inputs
(Level 3) | Total |
| Assets | | | | |
| Investments in: | | | | |
| Agency securities | $ 0 | $ 102,963,609 | $0 | $ 102,963,609 |
| Asset-backed securities | 0 | 6,658,988 | 0 | 6,658,988 |
| Corporate bonds and notes | 0 | 166,411,995 | 0 | 166,411,995 |
| Municipal obligations | 0 | 40,433,687 | 0 | 40,433,687 |
| Non-agency mortgage-backed securities | 0 | 31,793,888 | 0 | 31,793,888 |
| U.S. Treasury securities | 35,155,976 | 0 | 0 | 35,155,976 |
| Yankee corporate bonds and notes | 0 | 30,827,387 | 0 | 30,827,387 |
| Short-term investments | | | | |
| Investment companies | 3,804,611 | 0 | 0 | 3,804,611 |
| Total assets | $38,960,587 | $379,089,554 | $0 | $418,050,141 |
Additional sector, industry or geographic detail, if any, is included in the Portfolio of Investments.
For the year ended May 31, 2022, the Portfolio did not have any transfers into/out of Level 3.
4. TRANSACTIONS WITH AFFILIATES
Advisory fee
The Trust has entered into an advisory contract with Allspring Funds Management, a wholly owned subsidiary of Allspring Global Investments Holdings, LLC, a holding company indirectly owned by certain private funds of GTCR LLC and Reverence Capital Partners, L.P. The adviser is responsible for implementing investment policies and guidelines and for supervising the subadviser, who is responsible for day-to-day portfolio management of the Portfolio. Pursuant to the contract, Allspring Funds Management is entitled to receive an advisory fee at the following annual rate based on the Portfolio’s average daily net assets:
| Average daily net assets | Advisory fee |
| First $500 million | 0.400% |
| Next $500 million | 0.375 |
| Next $2 billion | 0.350 |
| Next $2 billion | 0.325 |
| Next $5 billion | 0.300 |
| Over $10 billion | 0.290 |
For the year ended May 31, 2022, the advisory fee was equivalent to an annual rate of 0.40% of the Portfolio’s average daily net assets.
Allspring Funds Management has retained the services of a subadviser to provide daily portfolio management to the Portfolio. The fee for subadvisory services is borne by Allspring Funds Management. Galliard Capital Management, LLC, an affiliate of Allspring Funds Management and a wholly owned subsidiary of Allspring Global Investments Holdings, LLC, is the subadviser to the Portfolio and is entitled to receive a fee from Allspring Funds Management at an annual rate starting at 0.20% and declining to 0.10% as the average daily net assets of the Portfolio increase.
Allspring Funds Management has voluntarily waived and/or reimbursed advisory fees to reduce the net operating expense ratio of the Portfolio. These voluntary waivers may be discontinued at any time.
Interfund transactions
The Portfolio may purchase or sell portfolio investment securities to certain affiliates pursuant to Rule 17a-7 under the 1940 Act and under procedures adopted by the Board of Trustees. The procedures have been designed to ensure that these interfund transactions, which do not incur broker commissions, are effected at current market prices.
Allspring Managed Fixed Income Portfolio | 31
Notes to financial statements
5. INVESTMENT PORTFOLIO TRANSACTIONS
Purchases and sales of investments, excluding short-term securities, for the year ended May 31, 2022 were as follows:
| Purchases at cost | | Sales proceeds |
U.S.
government | Non-U.S.
government | | U.S.
government | Non-U.S.
government |
| $216,485,737 | $155,279,880 | | $279,215,552 | $72,543,850 |
6. SECURITIES LENDING TRANSACTIONS
The Portfolio lends its securities through an unaffiliated securities lending agent and receives collateral in the form of cash or securities with a value at least equal to the value of the securities on loan. The value of the loaned securities is determined at the close of each business day and any increases or decreases in the required collateral are exchanged between the Portfolio and the counterparty on the next business day. Cash collateral received is invested in the Securities Lending Fund which seeks to provide a positive return compared to the daily Federal Funds Open Rate by investing in high-quality, U.S. dollar-denominated short-term money market instruments and is exempt from registration under Section 3(c)(7) of the 1940 Act. Securities Lending Fund is managed by Allspring Funds Management and is subadvised by Allspring Global Investments, LLC ("Allspring Investments"), an affiliate of Allspring Funds Management and a wholly owned subsidiary of Allspring Global Investments Holdings, LLC. Allspring Funds Management receives an advisory fee starting at 0.05% and declining to 0.01% as the average daily net assets of the Securities Lending Fund increase. All of the fees received by Allspring Funds Management are paid to Allspring Investments for its services as subadviser.
In the event of counterparty default or the failure of a borrower to return a loaned security, the Portfolio has the right to use the collateral to offset any losses incurred. As of May 31, 2022, the Portfolio had securities lending transactions with the following counterparties which are subject to offset:
| Counterparty | Value of
securities on
loan | Collateral
received1 | Net amount |
| Bank of America Securities Incorporated | $ 7,467 | $ (7,467) | $0 |
| BNP Paribas Securities Corporation | 103,039 | (103,039) | 0 |
| UBS Securities LLC | 359,607 | (359,607) | 0 |
1 Collateral received within this table is limited to the collateral for the net transaction with the counterparty.
7. BANK BORROWINGS
The Trust, along with Allspring Variable Trust and Allspring Funds Trust (excluding the money market funds), are parties to a $350,000,000 revolving credit agreement whereby the Portfolio is permitted to use bank borrowings for temporary or emergency purposes, such as to fund interest holders withdrawal requests. Interest under the credit agreement is charged to the Portfolio based on a borrowing rate equal to the higher of the Federal Funds rate in effect on that day plus 1.25% or the overnight bank funding rate in effect on that day plus 1.25%. In addition, an annual commitment fee equal to 0.25% of the unused balance is allocated to each participating fund.
For the year ended May 31, 2022, there were no borrowings by the Portfolio under the agreement.
8. INDEMNIFICATION
Under the Portfolio's organizational documents, the officers and Trustees have been granted certain indemnification rights against certain liabilities that may arise out of performance of their duties to the Portfolio. The Portfolio has entered into a separate agreement with each Trustee that converts indemnification rights currently existing under the Portfolio’s organizational documents into contractual rights that cannot be changed in the future without the consent of the Trustee. Additionally, in the normal course of business, the Portfolio may enter into contracts with service providers that contain a variety of indemnification clauses. The Portfolio’s maximum exposure under these arrangements is dependent on future claims that may be made against the Portfolio and, therefore, cannot be estimated.
32 | Allspring Managed Fixed Income Portfolio
Notes to financial statements
9. CORONAVIRUS (COVID-19) PANDEMIC
On March 11, 2020, the World Health Organization announced that it had made the assessment that coronavirus disease 2019 (“COVID-19”) is a pandemic. The impacts of COVID-19 are affecting the entire global economy, individual companies and investment products, the funds, and the market in general. There is significant uncertainty around the extent and duration of business disruptions related to COVID-19 and the impacts may last for an extended period of time. COVID-19 has led to significant uncertainty and volatility in the financial markets.
Allspring Managed Fixed Income Portfolio | 33
Report of independent registered public accounting firm
To the Interest Holders of the Portfolio and Board of Trustees
Allspring Master Trust:
Opinion on the Financial Statements
We have audited the accompanying statement of assets and liabilities of Allspring Managed Fixed Income Portfolio (formerly, Wells Fargo Managed Fixed Income Portfolio) (the Portfolio), one of the portfolios constituting Allspring Master Trust (formerly, Wells Fargo Master Trust), including the portfolio of investments, as of May 31, 2022, the related statement of operations for the year then ended, the statements of changes in net assets for each of the years in the two-year period then ended, and the related notes (collectively, the financial statements) and the financial highlights for each of the years in the five-year period then ended. In our opinion, the financial statements and financial highlights present fairly, in all material respects, the financial position of the Portfolio as of May 31, 2022, the results of its operations for the year then ended, the changes in its net assets for each of the years in the two-year period then ended, and the financial highlights for each of the years in the five-year period then ended, in conformity with U.S. generally accepted accounting principles.
Basis for Opinion
These financial statements and financial highlights are the responsibility of the Portfolio’s management. Our responsibility is to express an opinion on these financial statements and financial highlights based on our audits. We are a public accounting firm registered with the Public Company Accounting Oversight Board (United States) (PCAOB) and are required to be independent with respect to the Portfolio in accordance with the U.S. federal securities laws and the applicable rules and regulations of the Securities and Exchange Commission and the PCAOB.
We conducted our audits in accordance with the standards of the PCAOB. Those standards require that we plan and perform the audit to obtain reasonable assurance about whether the financial statements and financial highlights are free of material misstatement, whether due to error or fraud. Our audits included performing procedures to assess the risks of material misstatement of the financial statements and financial highlights, whether due to error or fraud, and performing procedures that respond to those risks. Such procedures included examining, on a test basis, evidence regarding the amounts and disclosures in the financial statements and financial highlights. Such procedures also included confirmation of securities owned as of May 31, 2022, by correspondence with the custodian, transfer agent and brokers, or by other appropriate auditing procedures. Our audits also included evaluating the accounting principles used and significant estimates made by management, as well as evaluating the overall presentation of the financial statements and financial highlights. We believe that our audits provide a reasonable basis for our opinion.

We have not been able to determine the specific year that we began serving as the auditor of one or more Allspring Funds investment companies; however, we are aware that we have served as the auditor of one or more Allspring Funds investment companies since at least 1955.
Boston, Massachusetts
July 27, 2022
34 | Allspring Managed Fixed Income Portfolio
Other information (unaudited)
PROXY VOTING INFORMATION
A description of the policies and procedures used to determine how to vote proxies relating to portfolio securities is available without charge, upon request, by calling 1-800-222-8222, visiting our website at allspringglobal.com, or visiting the SEC website at sec.gov. Information regarding how the proxies related to portfolio securities were voted during the most recent 12-month period ended June 30 is available on the website at allspringglobal.com or by visiting the SEC website at sec.gov.
QUARTERLY PORTFOLIO HOLDINGS INFORMATION
The Portfolio files its complete schedule of portfolio holdings with the SEC for the first and third quarters of each fiscal year as an exhibit to its reports on Form N-PORT. Interest holders may view the filed Form N-PORT by visiting the SEC website at sec.gov.
Allspring Managed Fixed Income Portfolio | 35
Other information (unaudited)
BOARD OF TRUSTEES AND OFFICERS
Each of the Trustees and Officers listed in the table below acts in identical capacities for each fund in the Allspring family of funds, which consists of 137 mutual funds comprising the Allspring Funds Trust, Allspring Variable Trust, Allspring Master Trust and four closed-end funds (collectively the “Fund Complex”). This table should be read in conjunction with the Prospectus and the Statement of Additional Information. The mailing address of each Trustee and Officer is 525 Market Street, 12th Floor, San Francisco, CA 94105. Each Trustee and Officer serves an indefinite term, however, each Trustee serves such term until reaching the mandatory retirement age established by the Trustees.
Independent Trustees
Name and
year of birth | Position held and
length of service* | Principal occupations during past five years or longer | Current other
public company or
investment
company
directorships |
William R. Ebsworth
(Born 1957) | Trustee,
since 2015 | Retired. From 1984 to 2013, equities analyst, portfolio manager, research director and chief investment officer at Fidelity Management and Research Company in Boston, Tokyo, and Hong Kong, and retired in 2013 as Chief Investment Officer of Fidelity Strategic Advisers, Inc. where he led a team of investment professionals managing client assets. Prior thereto, Board member of Hong Kong Securities Clearing Co., Hong Kong Options Clearing Corp., the Thailand International Fund, Ltd., Fidelity Investments Life Insurance Company, and Empire Fidelity Investments Life Insurance Company. Audit Committee Chair and Investment Committee Chair of the Vincent Memorial Hospital Endowment (non-profit organization). Mr. Ebsworth is a CFA® charterholder. | N/A |
Jane A. Freeman
(Born 1953) | Trustee,
since 2015;
Chair Liaison,
since 2018 | Retired. From 2012 to 2014 and 1999 to 2008, Chief Financial Officer of Scientific Learning Corporation. From 2008 to 2012, Ms. Freeman provided consulting services related to strategic business projects. Prior to 1999, Portfolio Manager at Rockefeller & Co. and Scudder, Stevens & Clark. Board member of the Harding Loevner Funds from 1996 to 2014, serving as both Lead Independent Director and chair of the Audit Committee. Board member of the Russell Exchange Traded Funds Trust from 2011 to 2012 and the chair of the Audit Committee. Ms. Freeman is also an inactive Chartered Financial Analyst. | N/A |
Isaiah Harris, Jr.
(Born 1952) | Trustee,
since 2009; Audit
Committee
Chair,
since 2019 | Retired. Chairman of the Board of CIGNA Corporation from 2009 to 2021, and Director from 2005 to 2008. From 2003 to 2011, Director of Deluxe Corporation. Prior thereto, President and CEO of BellSouth Advertising and Publishing Corp. from 2005 to 2007, President and CEO of BellSouth Enterprises from 2004 to 2005 and President of BellSouth Consumer Services from 2000 to 2003. Emeritus member of the Iowa State University Foundation Board of Governors. Emeritus Member of the Advisory Board of Iowa State University School of Business. Advisory Board Member, Palm Harbor Academy (private school). Advisory Board Member, Fellowship of Christian Athletes. Mr. Harris is a certified public accountant (inactive status). | N/A |
David F. Larcker
(Born 1950) | Trustee,
since 2009 | James Irvin Miller Professor of Accounting at the Graduate School of Business (Emeritus), Stanford University, Director of the Corporate Governance Research Initiative and Senior Faculty of The Rock Center for Corporate Governance since 2006. From 2005 to 2008, Professor of Accounting at the Graduate School of Business, Stanford University. Prior thereto, Ernst & Young Professor of Accounting at The Wharton School, University of Pennsylvania from 1985 to 2005. | N/A |
36 | Allspring Managed Fixed Income Portfolio
Other information (unaudited)
Name and
year of birth | Position held and
length of service* | Principal occupations during past five years or longer | Current other
public company or
investment
company
directorships |
Olivia S. Mitchell
(Born 1953) | Trustee,
since 2006;
Nominating and
Governance
Committee Chair,
since 2018 | International Foundation of Employee Benefit Plans Professor since 1993, Wharton School of the University of Pennsylvania. Director of Wharton’s Pension Research Council and Boettner Center on Pensions & Retirement Research, and Research Associate at the National Bureau of Economic Research. Previously taught at Cornell University from 1978 to 1993. | N/A |
Timothy J. Penny
(Born 1951) | Trustee,
since 1996;
Chair,
since 2018 | President and Chief Executive Officer of Southern Minnesota Initiative Foundation, a non-profit organization, since 2007. Member of the Board of Trustees of NorthStar Education Finance, Inc., a non-profit organization, since 2007. | N/A |
James G. Polisson
(Born 1959) | Trustee,
since 2018 | Retired. Chief Marketing Officer, Source (ETF) UK Services, Ltd, from 2015 to 2017. From 2012 to 2015, Principal of The Polisson Group, LLC, a management consulting, corporate advisory and principal investing company. Chief Executive Officer and Managing Director at Russell Investments, Global Exchange Traded Funds from 2010 to 2012. Managing Director of Barclays Global Investors from 1998 to 2010 and Global Chief Marketing Officer for iShares and Barclays Global Investors from 2000 to 2010. Trustee of the San Francisco Mechanics’ Institute, a non-profit organization, from 2013 to 2015. Board member of the Russell Exchange Traded Fund Trust from 2011 to 2012. Director of Barclays Global Investors Holdings Deutschland GmbH from 2006 to 2009. Mr. Polisson is an attorney and has a retired status with the Massachusetts and District of Columbia Bar Associations. | N/A |
Pamela Wheelock
(Born 1959) | Trustee,
since January
2020; previously
Trustee from
January 2018 to
July 2019 | Board member of the Destination Medical Center Economic Development Agency, Rochester, Minnesota since 2019. Interim President of the McKnight Foundation from January to September 2020. McKnight Foundation Consultant, November 2020 to February 2021. Acting Commissioner, Minnesota Department of Human Services, July 2019 through September 2019. Consultant (part-time), Minnesota Department of Human Services, October 2019 through December 2019. Chief Operating Officer, Twin Cities Habitat for Humanity from 2017 to 2019. Vice President of University Services, University of Minnesota from 2012 to 2016. Prior thereto, on the Board of Directors, Governance Committee and Finance Committee for the Minnesota Philanthropy Partners (Saint Paul Foundation) from 2012 to 2018, Interim Chief Executive Officer of Blue Cross Blue Shield of Minnesota from 2011 to 2012, Chairman of the Board from 2009 to 2012 and Board Director from 2003 to 2015. Vice President, Leadership and Community Engagement, Bush Foundation, Saint Paul, Minnesota (a private foundation) from 2009 to 2011. Executive Vice President and Chief Financial Officer, Minnesota Sports and Entertainment from 2004 to 2009 and Senior Vice President from 2002 to 2004. Executive Vice President of the Minnesota Wild Foundation from 2004 to 2008. Commissioner of Finance, State of Minnesota, from 1999 to 2002. Currently Board Chair of the Minnesota Wild Foundation since 2010. | N/A |
* Length of service dates reflect the Trustee’s commencement of service with the Trust’s predecessor entities, where applicable.
Allspring Managed Fixed Income Portfolio | 37
Other information (unaudited)
Officers2
Name and
year of birth | Position held and
length of service | Principal occupations during past five years or longer |
Andrew Owen
(Born 1960) | President,
since 2017 | President, Chief Executive Officer and Director of Allspring Funds Management, LLC since 2017 and co-president of Galliard Capital Management, LLC, an affiliate of Allspring Funds Management, LLC, since 2019. Prior thereto, Head of Affiliated Managers, Allspring Global Investments, from 2014 to 2019 and Executive Vice President responsible for marketing, investments and product development for Allspring Funds Management, LLC, from 2009 to 2014. In addition, Mr. Owen was an Executive Vice President of Wells Fargo & Company from 2014 to 2021. |
Jeremy DePalma
(Born 1974) | Treasurer,
since 2012
(for certain funds in
the Fund Complex);
since 2021 (for
the remaining funds in the
Fund Complex) | Senior Vice President of Allspring Funds Management, LLC since 2009. Senior Vice President of Evergreen Investment Management Company, LLC from 2008 to 2010 and head of the Fund Reporting and Control Team within Fund Administration from 2005 to 2010. |
Kate McKinley
(Born 1977) | Chief Legal Officer,
since 2021 | Chief Legal Officer of Allspring Global Investments since 2021. Prior thereto, held various roles at State Street Global Advisors beginning in 2010, including serving as Senior Vice President and General Counsel from 2019 to 2021, and Chief Operating Officer of the Institutional Client Group from 2016 - 2019. Prior to working at State Street Global Advisors served as Assistant General Counsel for Bank of America Corporation from 2005 to 2010 and as an Associate at WilmerHale from 2002 to 2005. |
Christopher Baker
(Born 1976) | Chief Compliance Officer, since 2022 | Global Chief Compliance Officer for Allspring Global Investments since 2022. Prior thereto, Chief Compliance Officer for State Street Global Advisors from 2018 to 2021. Senior Compliance Officer for the State Street divisions of Alternative Investment Solutions, Sector Solutions, and Global Marketing from 2015 to 2018. From 2010 to 2015 Vice President, Global Head of Investment and Marketing Compliance for State Street Global Advisors. |
Matthew Prasse
(Born 1983) | Secretary,
since 2021 | Senior Counsel of the Allspring Legal Department since 2021. Senior Counsel of the Wells Fargo Legal Department from 2018 to 2021. Previously, Counsel for Barings LLC from 2015 to 2018. Prior to joining Barings, Associate at Morgan, Lewis & Bockius LLP from 2008 to 2015. |
1 The Statement of Additional Information includes additional information about the Trustees and is available, without charge, upon request, by calling 1-800-222-8222.
2 For those Officers with tenures at Allspring Global Investments and/or Allspring Funds Management, LLC that began prior to 2021, such tenures include years of service during which these businesses/entities were known as Wells Fargo Asset Management and Wells Fargo Funds Management, LLC, respectively.
38 | Allspring Managed Fixed Income Portfolio
Other information (unaudited)
LIQUIDITY RISK MANAGEMENT PROGRAM
In accordance with Rule 22e-4 under the Investment Company Act of 1940, as amended (the “Liquidity Rule”), Allspring Master Trust (the “Trust”) has adopted and implemented a liquidity risk management program (the “Program”) on behalf of each of its series, including the Portfolio, which is reasonably designed to assess and manage the Portfolio's liquidity risk. “Liquidity risk” is defined under the Liquidity Rule as the risk that the Portfolio is unable to meet redemption requests without significantly diluting remaining investors’ interests in the Portfolio. The Trust’s Board of Trustees (the “Board”) previously approved the designation of Allspring Funds Management, LLC (“Allspring Funds Management”), the Portfolio's investment adviser, to administer the Program, and Allspring Funds Management has established a Liquidity Risk Management Council (the "Council") composed of personnel from multiple departments within Allspring Funds Management and its affiliates to assist Allspring Funds Management in the administration of the Program.
The Program is comprised of various components designed to support the assessment and/or management of liquidity risk, including: (1) the periodic assessment (no less frequently than annually) of certain factors that influence the Portfolio's liquidity risk; (2) the periodic classification (no less frequently than monthly) of the Portfolio's investments into one of four liquidity categories that reflect an estimate of their liquidity under current market conditions; (3) a 15% limit on the acquisition of “illiquid investments” (as defined under the Liquidity Rule); (4) to the extent the Portfolio does not invest primarily in “highly liquid investments” (as defined under the Liquidity Rule), the determination of a minimum percentage of the Portfolio's assets that generally will be invested in highly liquid investments (an “HLIM”); (5) if the Portfolio has established an HLIM, the periodic review (no less frequently than annually) of the HLIM and the adoption of policies and procedures for responding to a shortfall of the Portfolio's “highly liquid investments” below its HLIM; and (6) periodic reporting to the Board.
At a meeting of the Board held on May 24-25, 2022, the Board received and reviewed a written report (the “Report”) from Allspring Funds Management that, among other things, addressed the operation of the Program and assessed its adequacy and effectiveness for the period from January 1, 2021 through December 31, 2021 (the “Reporting Period”). Other than extended foreign market holidays, no significant liquidity events impacting the Portfolios were noted in the Report. In addition, other than corporate-related changes to the Program, there were no material changes to the Program during the Reporting Period.
Allspring Funds Management determined in the Report that the Program has been implemented and operates effectively to manage each Portfolio’s, including the Portfolio’s, liquidity risk, and Allspring Funds Management continues to believe that the Program has been and continues to be adequately and effectively implemented to monitor and, as applicable, respond to the Portfolio’s liquidity developments.
There can be no assurance that the Program will achieve its objectives under all circumstances in the future.
Allspring Managed Fixed Income Portfolio | 39
For more information
More information about Allspring Funds is available free upon request. To obtain literature, please write, visit the Portfolio's website, or call:
Allspring Funds
P.O. Box 219967
Kansas City, MO 64121-9967
Website: allspringglobal.com
Individual investors: 1-800-222-8222
Retail investment professionals: 1-888-877-9275
Institutional investment professionals: 1-800-260-5969
This report and the financial statements contained herein are submitted for the general information of the interest holders of the Portfolio. If this report is used for promotional purposes, distribution of the report must be accompanied or preceded by a current prospectus. Before investing, please consider the investment objectives, risks, charges, and expenses of the investment. For a current prospectus and, if available, a summary prospectus, containing this information, call
1-800-222-8222. Read the prospectus carefully before you invest or send money.
Allspring Global InvestmentsTM is the trade name for the asset management firms of Allspring Global Investments Holdings, LLC, a holding company indirectly owned by certain private funds of GTCR LLC and Reverence Capital Partners, L.P. These firms include but are not limited to Allspring Global Investments, LLC, and Allspring Funds Management, LLC. Certain products managed by Allspring entities are distributed by Allspring Funds Distributor, LLC (a broker-dealer and Member FINRA/SIPC).
This material is for general informational and educational purposes only and is NOT intended to provide investment advice or a recommendation of any kind - including a recommendation for any specific investment, strategy, or plan.
© 2022 Allspring Global Investments Holdings, LLC. All rights reserved.
Annual Report
May 31, 2022
Allspring
C&B Large Cap Value Fund
The views expressed and any forward-looking statements are as of May 31, 2022, unless otherwise noted, and are those of the Fund's portfolio managers and/or Allspring Global Investments. Discussions of individual securities or the markets generally are not intended as individual recommendations. Future events or results may vary significantly from those expressed in any forward-looking statements. The views expressed are subject to change at any time in response to changing circumstances in the market. Allspring Global Investments disclaims any obligation to publicly update or revise any views expressed or forward-looking statements.
Allspring C&B Large Cap Value Fund | 1
Letter to shareholders (unaudited)
Andrew Owen
President
Allspring Funds
Dear Shareholder:
We are pleased to offer you this annual report for the Allspring C&B Large Cap Value Fund for the 12-month period that ended May 31, 2022. Globally, stocks experienced rising volatility through the period, but overall, U.S. stocks outperformed non-U.S. equities as the global economy faced multiple challenges. Bonds also had poor performance during a difficult period, with major fixed income indexes all down for the 12-month period.
Earlier tailwinds provided by global stimulus programs, vaccination rollouts, and recovering consumer and corporate sentiment were more than offset by the highest rate of inflation in decades, concerns about sharp central bank rate hikes, more highly contagious COVID-19 variants, and the Russian invasion of Ukraine. The impact of already-significant supply chain disruptions were made worse by China’s COVID-19 lockdowns.
For the 12-month period, U.S. large-cap stocks led both non-U.S. developed market equities and emerging market stocks. Returns by fixed-income securities were negative as rising inflation created new challenges. For the period, U.S. stocks, based on the S&P 500 Index,1 lost 0.30%. International stocks, as measured by the MSCI ACWI ex USA Index (Net),2 returned -12.41%, while the MSCI EM Index (Net) (USD)3 had weaker performance with a loss of 19.83%. Among bond indexes, the Bloomberg U.S. Aggregate Bond Index4 returned -8.22%, the Bloomberg Global Aggregate ex-USD Index (unhedged)5 returned -16.68%, the Bloomberg Municipal Bond Index6 lost 6.79%, and the ICE BofA U.S. High Yield Index7 fell 5.00%.
Rising inflation, COVID, and the Russian invasion of Ukraine in February drove market performance.
The period began with the S&P 500 Index reaching an all-time high in June 2021. In late June, the U.S. Congress reached a deal on a $1 trillion infrastructure package for road, bridge, and broadband network upgrades over the next eight years. The U.S. Federal Reserve’s (Fed) June meeting yielded no change to policy, but it forecast a possible interest rate rise in 2023. This, combined with a rebound in economic activity and investors searching for yield, led to a decline in U.S. Treasury yields. Many European and Asian countries saw vaccination momentum increase, while COVID-19 infections rose in the U.K. Meanwhile, the price of crude oil jumped over 10% in June as global economic activity picked up and the Organization of the Petroleum Exporting Countries (OPEC) slowed the pace of supply growth.
| 1 | The S&P 500 Index consists of 500 stocks chosen for market size, liquidity, and industry group representation. It is a market-value-weighted index with each stock's weight in the index proportionate to its market value. You cannot invest directly in an index. |
| 2 | The Morgan Stanley Capital International (MSCI) All Country World Index (ACWI) ex USA Index (Net) is a free-float-adjusted market-capitalization-weighted index that is designed to measure the equity market performance of developed and emerging markets, excluding the U.S. Source: MSCI. MSCI makes no express or implied warranties or representations and shall have no liability whatsoever with respect to any MSCI data contained herein. The MSCI data may not be further redistributed or used as a basis for other indexes or any securities or financial products. This report is not approved, reviewed, or produced by MSCI. You cannot invest directly in an index. |
| 3 | The MSCI Emerging Markets (EM) Index (Net) (USD) is a free-float-adjusted market-capitalization-weighted index that is designed to measure equity market performance of emerging markets. You cannot invest directly in an index. |
| 4 | The Bloomberg U.S. Aggregate Bond Index is a broad-based benchmark that measures the investment-grade, U.S.-dollar-denominated, fixed-rate taxable bond market, including Treasuries, government-related and corporate securities, mortgage-backed securities (agency fixed-rate and hybrid adjustable-rate mortgage pass-throughs), asset-backed securities, and commercial mortgage-backed securities. You cannot invest directly in an index. |
| 5 | The Bloomberg Global Aggregate ex-USD Index (unhedged) is an unmanaged index that provides a broad-based measure of the global investment-grade fixed-income markets excluding the U.S.-dollar-denominated debt market. You cannot invest directly in an index. |
| 6 | The Bloomberg Municipal Bond Index is an unmanaged index composed of long-term tax-exempt bonds with a minimum credit rating of Baa. You cannot invest directly in an index. |
| 7 | The ICE BofA U.S. High Yield Index is a market-capitalization-weighted index of domestic and Yankee high-yield bonds. The index tracks the performance of high-yield securities traded in the U.S. bond market. You cannot invest directly in an index. Copyright 2022. ICE Data Indices, LLC. All rights reserved. |
2 | Allspring C&B Large Cap Value Fund
Letter to shareholders (unaudited)
Inflation continued to climb in July, fueled by the ongoing supply bottleneck and high demand. Monthly U.S. equity gains led those of international developed markets. In contrast, emerging markets had losses for the month, hindered by China’s plans for new regulations, particularly in education and technology. The U.S. 10-year Treasury bond yield continued to decline as strong demand swallowed up supply. After hitting a multiyear high earlier in the month, oil prices leveled off as OPEC agreed to raise oil production.
The COVID-19 Delta variant produced outbreaks globally in August, feeding market volatility and casting doubts over the ongoing economic recovery. The U.S. economy remained strong despite the Delta variant, ongoing inflationary pressures, and worries over Hurricane Ida. Emerging market equities experienced elevated volatility, largely influenced by China’s regulatory stance. Municipal debt had its first monthly loss since February. Among commodities, crude oil fell sharply as the Delta variant caused expectations to dampen. However, oil remained a leading asset-class performer for the year.
Global markets suffered their broadest retreat in a year during September, except for commodities, as concerns over inflation and the interest rate outlook depressed investor confidence. Emerging markets declined on concerns over supply chain disruptions along with rising energy and food prices. Meanwhile, the Fed indicated it would soon start to slow the pace of asset purchases. U.S. concerns included a congressional showdown over the debt ceiling, the 2022 federal government budget, and the infrastructure package. Meanwhile, commodities thrived in September, driven by sharply higher energy prices.
Elevated inflation pressures and the global supply bottleneck continued in October, but strong earnings provided a bright spot in the U.S., the eurozone, and many Asian countries. Government bond yields rose globally as central banks prepared to tighten monetary policy. Commodity prices continued to rise, driven by sharply higher energy costs.
In November, as COVID-19 hospitalizations rose, most major global asset classes declined. Two exceptions were U.S. investment-grade bonds and Treasury Inflation-Protected Securities. President Biden signed a long-awaited infrastructure bill to upgrade U.S. roads, bridges, and railways. Meanwhile, the Consumer Price Index (CPI)1, a measure of domestic inflation conditions, jumped to its highest level in 31 years. While the threat of consistently high inflation led the Fed to discuss a faster pace of tapering, the Omicron strain created uncertainty. Commodities lost ground for the month, driven by sharp declines in oil prices (and energy costs in general) as well as precious metals.
Global volatility lessened in December as data indicated a lower risk of severe disease and death from the Omicron variant. Even so, several countries introduced restrictions on travel and hospitality, among other sectors, in an effort to reduce the spread. In the U.S., data indicated a stable economy overall, with robust corporate earnings. Consumer spending potential looked strong heading into 2022 on elevated household savings and the lowest household debt ratio since 1973. U.S. corporate and high-yield bonds had monthly gains while Treasuries declined. Bonds were strongly affected by the projection of multiple rate hikes in 2022 by senior Federal Open Market Committee members.
In January 2022, the main focus was on potential U.S. interest rate hikes and the Russia-Ukraine conflict. The Fed hinted that a March interest rate hike was likely. Meanwhile, Russia threatened a potential invasion of Ukraine, which could disrupt Russia’s massive energy supplies and drive demand from non-Russian oil-producing countries. Elsewhere overseas, Europe saw food and energy prices spike, leading to rising inflation. Within fixed income, corporate bonds struggled in January, underperforming government bonds, as investors focused on continued elevated inflation and ongoing uncertainty over the U.S. monetary path.
“ Global markets suffered their broadest retreat in a year during September, except for commodities, as concerns over inflation and the interest rate outlook depressed investor confidence.”
| 1 | The Consumer Price Index (CPI) is a measure of the average change over time in the prices paid by urban consumers for a market basket of consumer goods and services. You cannot invest directly in an index. |
Allspring C&B Large Cap Value Fund | 3
Letter to shareholders (unaudited)
“ The Russian invasion of Ukraine dominated the financial world in February and March. Equity, bond, and commodity markets were shaken by fear, uncertainty, and an upending of demand-supply dynamics.” |
The Russian invasion of Ukraine dominated the financial world in February and March. Equity, bond, and commodity markets were shaken by fear, uncertainty, and an upending of demand-supply dynamics. Major global stock indexes were down in February, along with global bonds overall, with ongoing high levels of volatility in March along with mixed results that favored U.S. large-cap stocks. Prices of commodities spiked, including crude oil, natural gas, wheat, and precious metals, on elevated concerns of supply shortages. All of this fed already-high inflation concerns and added to expectations of more aggressive central bank interest rate hikes. Sweeping sanctions against Russia and corporate pullouts contributed to market volatility. Despite the geopolitical turmoil, the U.S. economic outlook remained largely unchanged, with a healthy job market and signs of economic resilience accompanying higher prices.
In April, market volatility continued, with deepening losses across major capital markets, as both the S&P 500 and MSCI ACWI (Net)1 fell 8% or more for the month. The Chinese economy struggled through a strict lockdown as the government tried to contain a major COVID-19 outbreak, creating a global ripple effect that compounded existing supply shortages. This was exacerbated by the impact of the Russia-Ukraine war on global commodities. Meanwhile, U.S. annual inflation raged at 8.5%, its highest level since 1981, and investors braced themselves for aggressive Fed monetary tightening moves.
Market volatility continued in May, but full-month returns belied that as markets recovered ground late in the month. Value stocks continued to outperform growth stocks. The concerns that had dominated markets for months continued, including high inflation (the CPI remained above 8%) and geopolitical tensions that exacerbated high crude oil, gasoline, and food prices. In response, the Fed raised the federal funds rate by 0.50%, with broad expectations of multiple rate hikes to come. Meanwhile, highly contagious COVID-19 variants persisted. However, labor markets in the U.S., the U.K., and Europe remained strong. The U.S. recorded a 3.6% unemployment rate, although labor market participation remained low. U.S. retail sales increased for the fourth consecutive month in April, indicating continued consumer resilience.
Don’t let short-term uncertainty derail long-term investment goals.
Periods of investment uncertainty can present challenges, but experience has taught us that maintaining long-term investment goals can be an effective way to plan for the future. To help you create a sound strategy based on your personal goals and risk tolerance, Allspring Funds offers more than 100 mutual funds spanning a wide range of asset classes and investment styles. Although diversification cannot guarantee an investment profit or prevent losses, we believe it can be an effective way to manage investment risk and potentially smooth out overall portfolio performance. We encourage investors to know their investments and to understand that appropriate levels of risk-taking may unlock opportunities.
Thank you for choosing to invest with Allspring Funds. We appreciate your confidence in us and remain committed to helping you meet your financial needs.
Sincerely,
Andrew Owen
President
Allspring Funds
For further information about your fund, contact your investment professional, visit our website at allspringglobal.com, or call us directly at 1-800-222-8222.
| 1 | The MSCI ACWI (Net) is a free-float-adjusted market-capitalization-weighted index that is designed to measure the equity market performance of developed and emerging markets. You cannot invest directly in an index. |
4 | Allspring C&B Large Cap Value Fund
Letter to shareholders (unaudited)
Notice to Shareholders
Russia launched a large-scale invasion of Ukraine on February 24, 2022. As a result of this military action, the United States and many other countries have instituted various economic sanctions against Russian and Belarus individuals and entities. The situation has led to increased financial market volatility and has had severe adverse effects on regional and global economic markets, including the markets for certain securities and commodities, such as oil and natural gas. The extent and duration of the military action, resulting sanctions imposed, other punitive action taken and the resulting market disruptions cannot be easily predicted.
Our solidarity and support goes out to our impacted employees and the people affected in Ukraine and their families. Allspring has a dedicated team of investment professionals actively monitoring the situation for any new developments and the potential impact to our clients and investment products. As the situation remains fluid, we are focused on the assessment of risks, valuation, and liquidity of impacted securities. Please visit our website at allspringglobal.com and click on “Russia-Ukraine Updates” for further information.
Allspring C&B Large Cap Value Fund | 5
Performance highlights (unaudited)
Investment objectiveThe Fund seeks maximum long-term total return (current income and capital appreciation), consistent with minimizing risk to principal.
| Manager | Allspring Funds Management, LLC |
Subadviser for the affiliated master portfolio*
Cooke & Bieler, L.P.
| Portfolio managers | Andrew B. Armstrong, CFA®‡, Wesley Lim, CFA®‡, Steve Lyons, CFA®‡, Michael M. Meyer, CFA®‡, Edward W. O'Connor, CFA®‡, R. James O'Neil, CFA®‡, Mehul Trivedi, CFA®‡, William Weber, CFA®‡ |
| Average annual total returns (%) as of May 31, 2022 |
| | | Including sales charge | | Excluding sales charge | | Expense ratios1 (%) |
| | Inception date | 1 year | 5 year | 10 year | | 1 year | 5 year | 10 year | | Gross | Net 2 |
| Class A (CBEAX) | 7-26-2004 | -7.06 | 8.66 | 11.52 | | -1.37 | 9.96 | 12.19 | | 1.25 | 1.08 |
| Class C (CBECX) | 7-26-2004 | -3.22 | 9.11 | 11.50 | | -2.22 | 9.11 | 11.50 | | 2.00 | 1.83 |
| Class R6 (CBEJX)3 | 10-31-2016 | – | – | – | | -0.98 | 10.42 | 12.61 | | 0.82 | 0.65 |
| Administrator Class (CBLLX) | 7-26-2004 | – | – | – | | -1.29 | 10.05 | 12.34 | | 1.17 | 1.00 |
| Institutional Class (CBLSX) | 7-26-2004 | – | – | – | | -1.08 | 10.32 | 12.60 | | 0.92 | 0.75 |
| Russell 1000® Value Index4 | – | – | – | – | | 0.93 | 9.50 | 12.06 | | – | – |
Figures quoted represent past performance, which is no guarantee of future results, and do not reflect taxes that a shareholder may pay on an investment in a fund. Investment return and principal value of an investment will fluctuate so that an investor’s shares, when redeemed, may be worth more or less than their original cost. Performance shown without sales charges would be lower if sales charges were reflected. Current performance may be lower or higher than the performance data quoted, which assumes the reinvestment of dividends and capital gains. Current month-end performance is available on the Fund’s website, allspringglobal.com.
Index returns do not include transaction costs associated with buying and selling securities, any mutual fund fees or expenses, or any taxes. It is not possible to invest directly in an index.
For Class A shares, the maximum front-end sales charge is 5.75%. For Class C shares, the maximum contingent deferred sales charge is 1.00%. Performance including a contingent deferred sales charge assumes the sales charge for the corresponding time period. Class R6, Administrator Class and Institutional Class shares are sold without a front-end sales charge or contingent deferred sales charge.
| 1 | Reflects the expense ratios as stated in the most recent prospectuses, which include the impact of 0.01% in acquired fund fees and expenses. The expense ratios shown are subject to change and may differ from the annualized expense ratios shown in the financial highlights of this report, which do not include acquired fund fees and expenses. |
| 2 | The manager has contractually committed through September 30, 2022, to waive fees and/or reimburse expenses to the extent necessary to cap total annual fund operating expenses after fee waivers at 1.08% for Class A, 1.83% for Class C, 0.65% for Class R6, 1.00% for Administrator Class, and 0.75% for Institutional Class. Brokerage commissions, stamp duty fees, interest, taxes, acquired fund fees and expenses (if any) from funds in which the affiliated master portfolio invests, and extraordinary expenses are excluded from the expense caps. Net expenses from the affiliated master portfolio are included in the expense caps. Prior to or after the commitment expiration date, the caps may be increased or the commitment to maintain the caps may be terminated only with the approval of the Board of Trustees. Without these caps, the Fund’s returns would have been lower. The expense ratio paid by an investor is the net expense ratio (the total annual fund operating expenses after fee waivers) as stated in the prospectuses. |
| 3 | Historical performance shown for the Class R6 shares prior to their inception reflects the performance of the Institutional Class shares, and includes the higher expenses applicable to the Institutional Class shares. If these expenses had not been included, returns for the Class R6 shares would be higher. |
| 4 | The Russell 1000® Value Index measures the performance of those Russell 1000 companies with lower price/book ratios and lower forecasted growth values. You cannot invest directly in an index. |
Stock values fluctuate in response to the activities of individual companies and general market and economic conditions. Consult the Fund’s prospectus for additional information on these and other risks.
| * | The Fund is a feeder fund in a master-feeder structure that invests substantially all of its assets in a single affiliated master portfolio of the Allspring Master Trust with a substantially identical investment objective and substantially similar investment strategies. References to the investment activities of the Fund are intended to refer to the investment activities of the affiliated master portfolio in which it invests. |
| ‡ | CFA® and Chartered Financial Analyst® are trademarks owned by CFA Institute. |
6 | Allspring C&B Large Cap Value Fund
Performance highlights (unaudited)
Growth of $10,000 investment as of May 31, 20221
| 1 | The chart compares the performance of Class A shares for the most recent ten years with the Russell 1000® Value Index. The chart assumes a hypothetical investment of $10,000 in Class A shares and reflects all operating expenses and assumes the maximum initial sales charge of 5.75%. |
Allspring C&B Large Cap Value Fund | 7
Performance highlights (unaudited)
MANAGER'S DISCUSSION
Fund highlights
| ■ | The Fund underperformed its benchmark, the Russell 1000® Value Index, for the 12-month period that ended May 31, 2022. |
| ■ | Stock selection in health care and industrials, as well as an underweight in energy, detracted from relative performance. |
| ■ | Stock selection in financials, information technology (IT), and communication services, as well as an underweight position in IT, were key contributors to relative performance. |
Portfolio overview and updates
The tumultuous macro backdrop over the trailing 12 months led to considerable volatility and a wide dispersion of returns across sectors, though, surprisingly, the U.S. markets ended up mostly flat at the end of the period. For the first quarter of 2022, stocks turned in their worst performance since the onset of the COVID-19 pandemic two years ago as investors processed a seeming tsunami of bad news and pushed all major indexes into negative territory. The Russian invasion of Ukraine signaled not just the largest European war in 75 years but perhaps the most aggressive set of sanctions in history. The combination touched off a price surge in oil and other commodities, further fueling inflationary trends that were already running at 40-year highs and sending 10-year U.S. Treasury yields to their highest level in two years. Recent history would suggest the U.S. Federal Reserve (Fed) would react to these shocks by communicating its willingness to ease monetary conditions to protect the economy. However, with COVID-19-era stimulus measures still very much in force and inflation at worrying levels, the Fed instead has embarked on what is forecast to be an extended tightening process.
| Ten largest holdings (%) as of May 31, 20221 |
| Arrow Electronics Incorporated | 3.42 |
| Brookfield Asset Management Incorporated Class A | 3.19 |
| Johnson & Johnson | 2.99 |
| Arch Capital Group Limited | 2.84 |
| State Street Corporation | 2.80 |
| Verizon Communications Incorporated | 2.59 |
| Progressive Corporation | 2.53 |
| London Stock Exchange Group plc ADR | 2.51 |
| Fidelity National Financial Incorporated | 2.48 |
| AerCap Holdings NV | 2.36 |
| 1 | Each holding represents the Fund’s allocable portion of the affiliated master portfolio security. Figures represent each holding as a percentage of the Fund’s net assets. Holdings are subject to change and may have changed since the date specified. |
Amid the volatility of the past year, stock initiations occurred across multiple sectors and included CarMax, Inc.; Ingredion Inc.; The Kraft Heinz Co.; The Williams Companies, Inc.; Globe Life Inc.; London Stock Exchange; Wells Fargo & Co.; Dentsply Sirona Inc.; and PACCAR Inc. Making room for
these holdings, we also eliminated positions across multiple sectors, including Schlumberger Ltd.; Intercontinental Exchange, Inc.; Synchrony Financial; United Parcel Service, Inc.; Axalta Coating Systems Ltd.; Reliance Steel & Aluminum Co.; and CBRE Group, Inc.
Detractors included an underweight to the high-performing energy sector.
Allocation effect detracted from performance, most prominently due to the underweight to energy—a sector that boasted a 76% return over the period. The overweight to financials and industrials, as well as the underweight to utilities, also hindered results. From a stock selection perspective, Stanley Black & Decker, Inc., a global manufacturer and marketer of hand/power tools, industrial products, and outdoor landscaping tools/mowers, was the largest detractor as it struggled alongside other building products companies amid supply chain, labor, and inflation headwinds. Dentsply Sirona Inc., a dental products manufacturer, was the second-largest detractor as the company suffered from negative press and turnover of C-suite employees. Hanesbrands Inc., a manufacturer and marketer of basic apparel products, was the third-largest detractor. The company suffered from concerns that inflation would affect both its input costs and its customers’ ability to make discretionary clothing purchases. Notably, we added to all three holdings during the period.
Contributors included an underweight to IT and stock selection within financials.
Stock selection was additive across multiple sectors, and though allocation effect was negative overall, the underweight to IT was a bright spot. Selection effect was strongest within financials, where the Fund’s insurance companies in particular outperformed the broader market and sector. Top-performing stocks included Arch Capital Group Ltd.; Chubb Ltd.; The Progressive Corp.; and Alleghany Corp. Stock selection within IT was also additive, with Amdocs Ltd. and Arrow Electronics, Inc., contributing most, as well as stocks within communication services, including Omnicom Group Inc. and Verizon Communications Inc. However, the best-performing holding was energy company Williams, which is primarily a gas infrastructure company with operations in 15 supply areas that provides natural gas gathering; processing; transmission services; and natural gas
8 | Allspring C&B Large Cap Value Fund
Performance highlights (unaudited)
liquids fractionation, transportation, and storage services. UnitedHealth Group Inc. was another top-five holding over the period.
| Sector allocation as of May 31, 20221 |
| 1 | Figures represent the sector allocation of the affiliated master portfolio as a percentage of the long-term investments of the affiliated master portfolio. These amounts are subject to change and may have changed since the date specified. |
Outlook: Despite negative current sentiment, we remain confident in the prospects of higher-quality holdings.
The extremely unsettled macro backdrop is creating challenges both for managements forced to reevaluate their supply chain and pricing strategies and investors struggling to untangle the complicated interactions between inflation, monetary policy, and geopolitical tension. So far, the market seems to be pricing in a severe and long-lasting consumer recession and a lasting boom in oil prices. We take these potential outcomes seriously and have re-underwritten consumer-exposed holdings and reexamined our underweight to energy. The portfolio remains overweight in the economically sensitive consumer discretionary and industrials sectors, which may present a short-term headwind to performance. Over a full cycle, however, we believe the Fund’s higher-quality holdings—businesses with more pricing power and more favorable demand environments—will generate attractive returns. Conversely, we believe the run-up in energy prices is, if anything, likely to undermine the long-term attractiveness of energy companies as adding geopolitical risks to existing climate pressures will only speed the move away from fossil fuels. Short-term relative performance is highly challenging to manage, and the Fund’s decidedly out-of-consensus positioning may not work in the short term. However, our experience is that patience and steadfast focus is generally rewarded over time.
Allspring C&B Large Cap Value Fund | 9
Fund expenses (unaudited)
As a shareholder of the Fund, you incur two types of costs: (1) transaction costs, including sales charges (loads) on purchase payments and contingent deferred sales charges (if any) on redemptions and (2) ongoing costs, including management fees, distribution (12b-1) and/or shareholder servicing fees, and other Fund expenses. This example is intended to help you understand your ongoing costs (in dollars) of investing in the Fund and to compare these costs with the ongoing costs of investing in other mutual funds.
The example is based on an investment of $1,000 invested at the beginning of the six-month period and held for the entire period from December 1, 2021 to May 31, 2022.
Actual expenses
The “Actual” line of the table below provides information about actual account values and actual expenses. You may use the information in this line, together with the amount you invested, to estimate the expenses that you paid over the period. Simply divide your account value by $1,000 (for example, an $8,600 account value divided by $1,000 = 8.6), then multiply the result by the number in the “Actual” line under the heading entitled “Expenses paid during period” for your applicable class of shares to estimate the expenses you paid on your account during this period.
Hypothetical example for comparison purposes
The “Hypothetical” line of the table below provides information about hypothetical account values and hypothetical expenses based on the Fund’s actual expense ratio and an assumed rate of return of 5% per year before expenses, which is not the Fund’s actual return. The hypothetical account values and expenses may not be used to estimate the actual ending account balance or expenses you paid for the period. You may use this information to compare the ongoing costs of investing in the Fund and other funds. To do so, compare this 5% hypothetical example with the 5% hypothetical examples that appear in the shareholder reports of the other funds.
Please note that the expenses shown in the table are meant to highlight your ongoing costs only and do not reflect any transactional costs, such as sales charges (loads) and contingent deferred sales charges. Therefore, the “Hypothetical” line of the table is useful in comparing ongoing costs only, and will not help you determine the relative total costs of owning different funds. In addition, if these transactional costs were included, your costs would have been higher.
| | Beginning
account value
12-1-2021 | Ending
account value
5-31-2022 | Expenses
paid during
the period1,2 | Annualized net
expense ratio2 |
| Class A | | | | |
| Actual | $1,000.00 | $1,035.14 | $5.43 | 1.07% |
| Hypothetical (5% return before expenses) | $1,000.00 | $1,019.60 | $5.39 | 1.07% |
| Class C | | | | |
| Actual | $1,000.00 | $1,030.69 | $9.26 | 1.83% |
| Hypothetical (5% return before expenses) | $1,000.00 | $1,015.81 | $9.20 | 1.83% |
| Class R6 | | | | |
| Actual | $1,000.00 | $1,037.14 | $3.30 | 0.65% |
| Hypothetical (5% return before expenses) | $1,000.00 | $1,021.69 | $3.28 | 0.65% |
| Administrator Class | | | | |
| Actual | $1,000.00 | $1,035.27 | $5.02 | 0.99% |
| Hypothetical (5% return before expenses) | $1,000.00 | $1,020.00 | $4.99 | 0.99% |
| Institutional Class | | | | |
| Actual | $1,000.00 | $1,036.75 | $3.81 | 0.75% |
| Hypothetical (5% return before expenses) | $1,000.00 | $1,021.19 | $3.78 | 0.75% |
1 Expenses paid is equal to the annualized net expense ratio of each class multiplied by the average account value over the period, multiplied by 182 divided by 366 (to reflect the one-half-year period).
2 Amounts reflect net expenses allocated from the affiliated Master Portfolio in which the Fund invests.
10 | Allspring C&B Large Cap Value Fund
Portfolio of investments—May 31, 2022
| | | | | | Value |
| Investment companies: 100.03% | | | | | |
| Affiliated master portfolio: 100.03% | | | | | |
| Allspring C&B Large Cap Value Portfolio | | | | | $ 266,094,197 |
| Total Investment companies (Cost $207,427,303) | | | | | 266,094,197 |
| Total investments in securities (Cost $207,427,303) | 100.03% | | | | 266,094,197 |
| Other assets and liabilities, net | (0.03) | | | | (91,733) |
| Total net assets | 100.00% | | | | $266,002,464 |
Transactions with the affiliated Master Portfolio were as follows:
| | % of
ownership,
beginning
of period | % of
ownership,
end of
period | Net realized
gains
(losses) on
securities
transactions
allocated
from
affiliated
Master
Portfolio | Net
change in
unrealized
gains
(losses) on
securities
transactions
allocated
from
affiliated
Master
Portfolio | Dividends
allocated
from
affiliated
Master
Portfolio | Affiliated
income
allocated
from
affiliated
Master
Portfolio | Value,
end of
period | |
| Allspring C&B Large Cap Value Portfolio | 76.92% | 79.89% | $47,346,569 | $(53,785,190) | $5,257,129 | $13,471 | $266,094,197 | |
The accompanying notes are an integral part of these financial statements.
Allspring C&B Large Cap Value Fund | 11
Statement of assets and liabilities—May 31, 2022
| | |
| Assets | |
Investments in affiliated Master Portfolio, at value (cost $207,427,303)
| $ 266,094,197 |
Receivable for Fund shares sold
| 106,554 |
Receivable from manager
| 15,524 |
Prepaid expenses and other assets
| 38,159 |
Total assets
| 266,254,434 |
| Liabilities | |
Payable for Fund shares redeemed
| 174,615 |
Administration fees payable
| 33,978 |
Shareholder servicing fees payable
| 23,259 |
Distribution fee payable
| 2,581 |
Trustees’ fees and expenses payable
| 2,195 |
Accrued expenses and other liabilities
| 15,342 |
Total liabilities
| 251,970 |
Total net assets
| $266,002,464 |
| Net assets consist of | |
Paid-in capital
| $ 177,287,883 |
Total distributable earnings
| 88,714,581 |
Total net assets
| $266,002,464 |
| Computation of net asset value and offering price per share | |
Net assets – Class A
| $ 101,496,273 |
Shares outstanding – Class A1
| 6,850,518 |
Net asset value per share – Class A
| $14.82 |
Maximum offering price per share – Class A2
| $15.72 |
Net assets – Class C
| $ 4,103,009 |
Shares outstanding – Class C1
| 280,755 |
Net asset value per share – Class C
| $14.61 |
Net assets – Class R6
| $ 23,486,548 |
Shares outstanding – Class R61
| 1,576,379 |
Net asset value per share – Class R6
| $14.90 |
Net assets – Administrator Class
| $ 6,001,168 |
Shares outstanding – Administrator Class1
| 403,977 |
Net asset value per share – Administrator Class
| $14.86 |
Net assets – Institutional Class
| $ 130,915,466 |
Shares outstanding – Institutional Class1
| 8,788,498 |
Net asset value per share – Institutional Class
| $14.90 |
| 1 | The Fund has an unlimited number of authorized shares. |
| 2 | Maximum offering price is computed as 100/94.25 of net asset value. On investments of $50,000 or more, the offering price is reduced. |
The accompanying notes are an integral part of these financial statements.
12 | Allspring C&B Large Cap Value Fund
Statement of operations—year ended May 31, 2022
| | |
| Investment income | |
Dividends allocated from affiliated Master Portfolio (net of foreign withholding taxes of $97,607)
| $ 5,257,129 |
Affiliated income allocated from affiliated Master Portfolio
| 13,471 |
Expenses allocated from affiliated Master Portfolio
| (2,062,297) |
Waivers allocated from affiliated Master Portfolio
| 144,027 |
Total investment income
| 3,352,330 |
| Expenses | |
Management fee
| 149,837 |
| Administration fees | |
Class A
| 217,465 |
Class C
| 9,475 |
Class R6
| 13,003 |
Administrator Class
| 8,112 |
Institutional Class
| 184,629 |
| Shareholder servicing fees | |
Class A
| 258,887 |
Class C
| 11,272 |
Administrator Class
| 15,583 |
| Distribution fee | |
Class C
| 33,815 |
Custody and accounting fees
| 6,466 |
Professional fees
| 35,362 |
Registration fees
| 23,452 |
Shareholder report expenses
| 17,652 |
Trustees’ fees and expenses
| 20,687 |
Other fees and expenses
| 6,220 |
Total expenses
| 1,011,917 |
| Less: Fee waivers and/or expense reimbursements | |
Fund-level
| (319,924) |
Class A
| (8,728) |
Administrator Class
| (726) |
Net expenses
| 682,539 |
Net investment income
| 2,669,791 |
| Realized and unrealized gains (losses) on investments | |
Net realized gains on securities transactions allocated from affiliated Master Portfolio
| 47,346,569 |
Net change in unrealized gains (losses) on securities transactions allocated from affiliated Master Portfolio
| (53,785,190) |
Net realized and unrealized gains (losses) on investments
| (6,438,621) |
Net decrease in net assets resulting from operations
| $ (3,768,830) |
The accompanying notes are an integral part of these financial statements.
Allspring C&B Large Cap Value Fund | 13
Statement of changes in net assets
| | | | | |
| | Year ended
May 31, 2022 | Year ended
May 31, 2021 |
| Operations | | | | |
Net investment income
| | $ 2,669,791 | | $ 2,415,023 |
Net realized gains on investments
| | 47,346,569 | | 25,510,777 |
Net change in unrealized gains (losses) on investments
| | (53,785,190) | | 89,716,793 |
Net increase (decrease) in net assets resulting from operations
| | (3,768,830) | | 117,642,593 |
| Distributions to shareholders from | | | | |
| Net investment income and net realized gains | | | | |
Class A
| | (12,919,436) | | (4,170,269) |
Class C
| | (535,250) | | (154,865) |
Class R6
| | (6,057,662) | | (2,183,532) |
Administrator Class
| | (841,849) | | (299,002) |
Institutional Class
| | (17,599,026) | | (6,446,162) |
Total distributions to shareholders
| | (37,953,223) | | (13,253,830) |
| Capital share transactions | Shares | | Shares | |
| Proceeds from shares sold | | | | |
Class A
| 989,891 | 15,969,277 | 610,000 | 8,963,843 |
Class C
| 43,159 | 682,181 | 68,098 | 996,267 |
Class R6
| 349,706 | 5,728,171 | 281,375 | 4,009,424 |
Administrator Class
| 55,766 | 954,376 | 19,784 | 279,674 |
Institutional Class
| 1,764,097 | 28,100,206 | 3,644,970 | 49,931,868 |
| | | 51,434,211 | | 64,181,076 |
| Reinvestment of distributions | | | | |
Class A
| 845,770 | 12,689,368 | 291,093 | 4,115,619 |
Class C
| 36,313 | 535,250 | 11,107 | 154,614 |
Class R6
| 80,021 | 1,208,696 | 24,172 | 343,838 |
Administrator Class
| 34,924 | 525,330 | 13,379 | 189,677 |
Institutional Class
| 1,158,450 | 17,489,868 | 451,083 | 6,414,372 |
| | | 32,448,512 | | 11,218,120 |
| Payment for shares redeemed | | | | |
Class A
| (946,956) | (15,053,324) | (1,092,566) | (14,863,709) |
Class C
| (76,840) | (1,207,888) | (115,785) | (1,529,367) |
Class R6
| (1,596,640) | (24,419,329) | (844,970) | (11,496,464) |
Administrator Class
| (34,305) | (524,769) | (221,462) | (3,119,176) |
Institutional Class
| (3,201,272) | (51,615,218) | (3,426,687) | (47,236,282) |
| | | (92,820,528) | | (78,244,998) |
Net decrease in net assets resulting from capital share transactions
| | (8,937,805) | | (2,845,802) |
Total increase (decrease) in net assets
| | (50,659,858) | | 101,542,961 |
| Net assets | | | | |
Beginning of period
| | 316,662,322 | | 215,119,361 |
End of period
| | $266,002,464 | | $316,662,322 |
The accompanying notes are an integral part of these financial statements.
14 | Allspring C&B Large Cap Value Fund
Financial highlights
(For a share outstanding throughout each period)
| | Year ended May 31 |
| Class A | 2022 | 2021 | 2020 | 2019 | 2018 |
Net asset value, beginning of period
| $17.16 | $11.49 | $13.01 | $13.91 | $14.54 |
Net investment income
| 0.11 | 0.10 | 0.12 | 0.11 | 0.09 1 |
Net realized and unrealized gains (losses) on investments
| (0.34) | 6.29 | (0.33) | 0.02 | 0.87 |
Total from investment operations
| (0.23) | 6.39 | (0.21) | 0.13 | 0.96 |
| Distributions to shareholders from | | | | | |
Net investment income
| (0.11) | (0.11) | (0.13) | (0.12) | (0.06) |
Net realized gains
| (2.00) | (0.61) | (1.18) | (0.91) | (1.53) |
Total distributions to shareholders
| (2.11) | (0.72) | (1.31) | (1.03) | (1.59) |
Net asset value, end of period
| $14.82 | $17.16 | $11.49 | $13.01 | $13.91 |
Total return2
| (1.37)% | 56.98% | (3.61)% | 1.33% | 6.29% |
| Ratios to average net assets (annualized)* | | | | | |
Gross expenses
| 1.19% | 1.24% | 1.27% | 1.23% | 1.21% |
Net expenses
| 1.07% | 1.07% | 1.07% | 1.08% | 1.10% |
Net investment income
| 0.69% | 0.73% | 0.92% | 0.83% | 0.58% |
| Supplemental data | | | | | |
Portfolio turnover rate3
| 32% | 38% | 33% | 47% | 42% |
Net assets, end of period (000s omitted)
| $101,496 | $102,332 | $70,680 | $79,172 | $85,707 |
| * | Ratios include net expenses allocated from the affiliated Master Portfolio which were as follows: |
| Year ended May 31, 2022 | 0.64% |
| Year ended May 31, 2021 | 0.64% |
| Year ended May 31, 2020 | 0.64% |
| Year ended May 31, 2019 | 0.65% |
| Year ended May 31, 2018 | 0.66% |
| 1 | Calculated based upon average shares outstanding |
| 2 | Total return calculations do not include any sales charges. |
| 3 | Portfolio turnover rate is calculated by multiplying the affiliated Master Portfolio’s percentage of the Fund’s total investment in securities at the end of the period by the affiliated Master Portfolio’s portfolio turnover rate. |
The accompanying notes are an integral part of these financial statements.
Allspring C&B Large Cap Value Fund | 15
Financial highlights
(For a share outstanding throughout each period)
| | Year ended May 31 |
| Class C | 2022 | 2021 | 2020 | 2019 | 2018 |
Net asset value, beginning of period
| $16.97 | $11.36 | $12.87 | $13.75 | $14.44 |
Net investment income (loss)
| (0.01) | (0.03) | 0.02 1 | 0.01 1 | (0.02) 1 |
Net realized and unrealized gains (losses) on investments
| (0.35) | 6.25 | (0.35) | 0.03 | 0.86 |
Total from investment operations
| (0.36) | 6.22 | (0.33) | 0.04 | 0.84 |
| Distributions to shareholders from | | | | | |
Net investment income
| 0.00 | 0.00 | 0.00 | (0.01) | 0.00 |
Net realized gains
| (2.00) | (0.61) | (1.18) | (0.91) | (1.53) |
Total distributions to shareholders
| (2.00) | (0.61) | (1.18) | (0.92) | (1.53) |
Net asset value, end of period
| $14.61 | $16.97 | $11.36 | $12.87 | $13.75 |
Total return2
| (2.22)% | 55.94% | (4.41)% | 0.61% | 5.46% |
| Ratios to average net assets (annualized)* | | | | | |
Gross expenses
| 1.94% | 1.99% | 2.02% | 1.97% | 1.96% |
Net expenses
| 1.83% | 1.83% | 1.83% | 1.83% | 1.85% |
Net investment income (loss)
| (0.08)% | (0.04)% | 0.16% | 0.07% | (0.16)% |
| Supplemental data | | | | | |
Portfolio turnover rate3
| 32% | 38% | 33% | 47% | 42% |
Net assets, end of period (000s omitted)
| $4,103 | $4,719 | $3,576 | $5,098 | $11,031 |
| * | Ratios include net expenses allocated from the affiliated Master Portfolio which were as follows: |
| Year ended May 31, 2022 | 0.64% |
| Year ended May 31, 2021 | 0.64% |
| Year ended May 31, 2020 | 0.64% |
| Year ended May 31, 2019 | 0.65% |
| Year ended May 31, 2018 | 0.66% |
| 1 | Calculated based upon average shares outstanding |
| 2 | Total return calculations do not include any sales charges. |
| 3 | Portfolio turnover rate is calculated by multiplying the affiliated Master Portfolio’s percentage of the Fund’s total investment in securities at the end of the period by the affiliated Master Portfolio’s portfolio turnover rate. |
The accompanying notes are an integral part of these financial statements.
16 | Allspring C&B Large Cap Value Fund
Financial highlights
(For a share outstanding throughout each period)
| | Year ended May 31 |
| Class R6 | 2022 | 2021 | 2020 | 2019 | 2018 |
Net asset value, beginning of period
| $17.24 | $11.53 | $13.06 | $13.97 | $14.59 |
Net investment income
| 0.18 1 | 0.16 1 | 0.18 1 | 0.18 1 | 0.18 1 |
Net realized and unrealized gains (losses) on investments
| (0.34) | 6.32 | (0.33) | 0.00 2 | 0.85 |
Total from investment operations
| (0.16) | 6.48 | (0.15) | 0.18 | 1.03 |
| Distributions to shareholders from | | | | | |
Net investment income
| (0.18) | (0.16) | (0.20) | (0.18) | (0.12) |
Net realized gains
| (2.00) | (0.61) | (1.18) | (0.91) | (1.53) |
Total distributions to shareholders
| (2.18) | (0.77) | (1.38) | (1.09) | (1.65) |
Net asset value, end of period
| $14.90 | $17.24 | $11.53 | $13.06 | $13.97 |
Total return
| (0.98)% | 57.75% | (3.25)% | 1.74% | 6.76% |
| Ratios to average net assets (annualized)* | | | | | |
Gross expenses
| 0.76% | 0.82% | 0.84% | 0.79% | 0.77% |
Net expenses
| 0.65% | 0.65% | 0.65% | 0.65% | 0.65% |
Net investment income
| 1.11% | 1.14% | 1.33% | 1.27% | 1.28% |
| Supplemental data | | | | | |
Portfolio turnover rate3
| 32% | 38% | 33% | 47% | 42% |
Net assets, end of period (000s omitted)
| $23,487 | $47,301 | $37,859 | $68,366 | $110,665 |
| * | Ratios include net expenses allocated from the affiliated Master Portfolio which were as follows: |
| Year ended May 31, 2022 | 0.64% |
| Year ended May 31, 2021 | 0.64% |
| Year ended May 31, 2020 | 0.64% |
| Year ended May 31, 2019 | 0.65% |
| Year ended May 31, 2018 | 0.65% |
| 1 | Calculated based upon average shares outstanding |
| 2 | Amount is less than $0.005. |
| 3 | Portfolio turnover rate is calculated by multiplying the affiliated Master Portfolio’s percentage of the Fund’s total investment in securities at the end of the period by the affiliated Master Portfolio’s portfolio turnover rate. |
The accompanying notes are an integral part of these financial statements.
Allspring C&B Large Cap Value Fund | 17
Financial highlights
(For a share outstanding throughout each period)
| | Year ended May 31 |
| Administrator Class | 2022 | 2021 | 2020 | 2019 | 2018 |
Net asset value, beginning of period
| $17.20 | $11.51 | $13.03 | $13.92 | $14.56 |
Net investment income
| 0.12 1 | 0.11 1 | 0.13 1 | 0.12 1 | 0.10 1 |
Net realized and unrealized gains (losses) on investments
| (0.33) | 6.30 | (0.33) | 0.02 | 0.87 |
Total from investment operations
| (0.21) | 6.41 | (0.20) | 0.14 | 0.97 |
| Distributions to shareholders from | | | | | |
Net investment income
| (0.13) | (0.11) | (0.14) | (0.12) | (0.08) |
Net realized gains
| (2.00) | (0.61) | (1.18) | (0.91) | (1.53) |
Total distributions to shareholders
| (2.13) | (0.72) | (1.32) | (1.03) | (1.61) |
Net asset value, end of period
| $14.86 | $17.20 | $11.51 | $13.03 | $13.92 |
Total return
| (1.29)% | 57.12% | (3.56)% | 1.44% | 6.36% |
| Ratios to average net assets (annualized)* | | | | | |
Gross expenses
| 1.11% | 1.17% | 1.19% | 1.15% | 1.13% |
Net expenses
| 0.99% | 0.99% | 0.99% | 1.00% | 1.00% |
Net investment income
| 0.76% | 0.81% | 1.00% | 0.90% | 0.69% |
| Supplemental data | | | | | |
Portfolio turnover rate2
| 32% | 38% | 33% | 47% | 42% |
Net assets, end of period (000s omitted)
| $6,001 | $5,980 | $6,167 | $9,274 | $12,742 |
| * | Ratios include net expenses allocated from the affiliated Master Portfolio which were as follows: |
| Year ended May 31, 2022 | 0.64% |
| Year ended May 31, 2021 | 0.64% |
| Year ended May 31, 2020 | 0.64% |
| Year ended May 31, 2019 | 0.65% |
| Year ended May 31, 2018 | 0.66% |
| 1 | Calculated based upon average shares outstanding |
| 2 | Portfolio turnover rate is calculated by multiplying the affiliated Master Portfolio’s percentage of the Fund’s total investment in securities at the end of the period by the affiliated Master Portfolio’s portfolio turnover rate. |
The accompanying notes are an integral part of these financial statements.
18 | Allspring C&B Large Cap Value Fund
Financial highlights
(For a share outstanding throughout each period)
| | Year ended May 31 |
| Institutional Class | 2022 | 2021 | 2020 | 2019 | 2018 |
Net asset value, beginning of period
| $17.24 | $11.53 | $13.05 | $13.96 | $14.58 |
Net investment income
| 0.16 | 0.15 | 0.16 | 0.14 | 0.13 1 |
Net realized and unrealized gains (losses) on investments
| (0.34) | 6.32 | (0.33) | 0.02 | 0.89 |
Total from investment operations
| (0.18) | 6.47 | (0.17) | 0.16 | 1.02 |
| Distributions to shareholders from | | | | | |
Net investment income
| (0.16) | (0.15) | (0.17) | (0.16) | (0.11) |
Net realized gains
| (2.00) | (0.61) | (1.18) | (0.91) | (1.53) |
Total distributions to shareholders
| (2.16) | (0.76) | (1.35) | (1.07) | (1.64) |
Net asset value, end of period
| $14.90 | $17.24 | $11.53 | $13.05 | $13.96 |
Total return
| (1.08)% | 57.58% | (3.33)% | 1.64% | 6.68% |
| Ratios to average net assets (annualized)* | | | | | |
Gross expenses
| 0.86% | 0.91% | 0.94% | 0.90% | 0.88% |
Net expenses
| 0.75% | 0.75% | 0.75% | 0.75% | 0.77% |
Net investment income
| 1.01% | 1.05% | 1.25% | 1.17% | 0.87% |
| Supplemental data | | | | | |
Portfolio turnover rate2
| 32% | 38% | 33% | 47% | 42% |
Net assets, end of period (000s omitted)
| $130,915 | $156,330 | $96,838 | $108,613 | $135,082 |
| * | Ratios include net expenses allocated from the affiliated Master Portfolio which were as follows: |
| Year ended May 31, 2022 | 0.64% |
| Year ended May 31, 2021 | 0.64% |
| Year ended May 31, 2020 | 0.64% |
| Year ended May 31, 2019 | 0.65% |
| Year ended May 31, 2018 | 0.66% |
| 1 | Calculated based upon average shares outstanding |
| 2 | Portfolio turnover rate is calculated by multiplying the affiliated Master Portfolio’s percentage of the Fund’s total investment in securities at the end of the period by the affiliated Master Portfolio’s portfolio turnover rate. |
The accompanying notes are an integral part of these financial statements.
Allspring C&B Large Cap Value Fund | 19
Notes to financial statements
1. ORGANIZATION
Allspring Funds Trust (the "Trust"), a Delaware statutory trust organized on March 10, 1999, is an open-end management investment company registered under the Investment Company Act of 1940, as amended (the "1940 Act"). As an investment company, the Trust follows the accounting and reporting guidance in Financial Accounting Standards Board ("FASB") Accounting Standards Codification Topic 946, Financial Services – Investment Companies. These financial statements report on the Allspring C&B Large Cap Value Fund (the "Fund") which is a diversified series of the Trust.
The Fund is a feeder fund in a master-feeder structure that invests substantially all of its assets in a single master portfolio with a substantially identical investment objective and substantially similar investment strategies. The Fund invests in Allspring C&B Large Cap Value Portfolio, a separate diversified portfolio (the “affiliated Master Portfolio”) of Allspring Master Trust, a registered open-end management investment company. As of May 31, 2022, the Fund owned 79.89% of Allspring C&B Large Cap Value Portfolio. The affiliated Master Portfolio directly acquires portfolio securities and the Fund acquires an indirect interest in those securities. The Fund accounts for its investment in the affiliated Master Portfolio as a partnership investment and records on a daily basis its share of the affiliated Master Portfolio’s income, expense and realized and unrealized gains and losses. The financial statements of the affiliated Master Portfolio for the year ended May 31, 2022 are included in this report and should be read in conjunction with the Fund’s financial statements.
Effective on November 1, 2021, the sale transaction of Wells Fargo Asset Management ("WFAM") by Wells Fargo & Company to GTCR LLC and Reverence Capital Partners, L.P. was closed. In connection with the closing of the transaction, WFAM became known as Allspring Global Investments (“Allspring”) and various entities that provided services to the Fund changed their names to "Allspring", including Allspring Funds Management, LLC, the investment manager to the Fund, Allspring Global Investments, LLC and Allspring Global Investments (UK) Limited, both registered investment advisers providing subadvisory services to certain funds, and Allspring Funds Distributor, LLC, the Fund's principal underwriter. Consummation of the transaction resulted in a new investment management agreement and subadvisory agreement which became effective on November 1, 2021.
2. SIGNIFICANT ACCOUNTING POLICIES
The following significant accounting policies, which are consistently followed in the preparation of the financial statements of the Fund, are in conformity with U.S. generally accepted accounting principles which require management to make estimates and assumptions that affect the reported amounts of assets and liabilities, disclosure of contingent assets and liabilities at the date of the financial statements, and the reported amounts of income and expenses during the reporting period. Actual results could differ from those estimates.
Securities valuation
All investments are valued each business day as of the close of regular trading on the New York Stock Exchange (generally 4 p.m. Eastern Time), although the Fund may deviate from this calculation time under unusual or unexpected circumstances.
Investments in the affiliated Master Portfolio are valued daily based on the Fund’s proportionate share of the affiliated Master Portfolio’s net assets, which are also valued daily. Securities held in the affiliated Master Portfolio are valued as discussed in the Notes to Financial Statements of the affiliated Master Portfolio, which are included elsewhere in this report.
Investments which are not valued using the method discussed above are valued at their fair value, as determined in good faith by the Board of Trustees. The Board of Trustees has established a Valuation Committee comprised of the Trustees and has delegated to it the authority to take any actions regarding the valuation of portfolio securities that the Valuation Committee deems necessary or appropriate, including determining the fair value of portfolio securities, unless the determination has been delegated to the Allspring Global Investments Pricing Committee at Allspring Funds Management, LLC ("Allspring Funds Management"). The Board of Trustees retains the authority to make or ratify any valuation decisions or approve any changes to the Valuation Procedures as it deems appropriate. On a quarterly basis, the Board of Trustees receives reports on any valuation actions taken by the Valuation Committee or the Allspring Global Investments Pricing Committee which may include items for ratification.
Investment transactions, income and expenses
Investments in the affiliated Master Portfolio are recorded on a trade date basis. The Fund records daily its proportionate share of the affiliated Master Portfolio’s income, expenses and realized and unrealized gains or losses. The Fund also accrues its own expenses.
20 | Allspring C&B Large Cap Value Fund
Notes to financial statements
Distributions to shareholders
Distributions to shareholders from net investment income and any net realized gains are recorded on the ex-dividend date and paid at least annually. Such distributions are determined in accordance with income tax regulations and may differ from U.S. generally accepted accounting principles. Dividend sources are estimated at the time of declaration. The tax character of distributions is determined as of the Fund's fiscal year end. Therefore, a portion of the Fund's distributions made prior to the Fund’s fiscal year end may be categorized as a tax return of capital at year end.
Federal and other taxes
The Fund intends to continue to qualify as a regulated investment company by distributing substantially all of its investment company taxable income and any net realized capital gains (after reduction for capital loss carryforwards) sufficient to relieve it from all, or substantially all, federal income taxes. Accordingly, no provision for federal income taxes was required.
The Fund’s income and federal excise tax returns and all financial records supporting those returns for the prior three fiscal years are subject to examination by the federal and Delaware revenue authorities. Management has analyzed the Fund's tax positions taken on federal, state, and foreign tax returns, as applicable, for all open tax years and does not believe that there are any uncertain tax positions that require recognition of a tax liability.
As of May 31, 2022, the aggregate cost of all investments for federal income tax purposes was $209,311,057 and the unrealized gains (losses) consisted of:
| Gross unrealized gains | $56,783,140 |
| Gross unrealized losses | 0 |
| Net unrealized gains | $56,783,140 |
Class allocations
The separate classes of shares offered by the Fund differ principally in applicable sales charges, distribution, shareholder servicing, and administration fees. Class specific expenses are charged directly to that share class. Investment income, common fund-level expenses, and realized and unrealized gains (losses) on investments are allocated daily to each class of shares based on the relative proportion of net assets of each class.
3. FAIR VALUATION MEASUREMENTS
At May 31, 2022, the Fund’s investment in the affiliated Master Portfolio was measured at fair value using the net asset value per share (or its equivalent) as a practical expedient. The investment objective and fair value of the affiliated Master Portfolio is as follows:
| Affiliated Master Portfolio | Investment objective | Fair value of affiliated
Master Portfolio |
| Allspring C&B Large Cap Value Portfolio | Seeks maximum long-term total return (current income and capital appreciation), consistent with minimizing risk to principal | $266,094,197 |
The affiliated Master Portfolio does not have a redemption period notice, can be redeemed daily and does not have any unfunded commitments.
4. TRANSACTIONS WITH AFFILIATES
Management fee
Allspring Funds Management, a wholly owned subsidiary of Allspring Global Investments Holdings, LLC, a holding company indirectly owned by certain private funds of GTCR LLC and Reverence Capital Partners, L.P., is the manager of the Fund and provides advisory and fund-level administrative services under an investment management agreement. Under the investment management agreement, Allspring Funds Management is responsible for, among other services, implementing the investment objectives and strategies of the Fund and providing fund-level administrative services in connection with the Fund’s operations. As long as the Fund continues to invest substantially all of its assets in a single affiliated Master Portfolio, the Fund pays Allspring Funds Management an investment management fee only for fund-level administrative services at the following annual rate based on the Fund’s average daily net assets:
Allspring C&B Large Cap Value Fund | 21
Notes to financial statements
| Average daily net assets | Management fee |
| First $5 billion | 0.050% |
| Next $5 billion | 0.040 |
| Over $10 billion | 0.030 |
For the year ended May 31, 2022, the management fee was equivalent to an annual rate of 0.05% of the Fund’s average daily net assets.
Allspring Funds Management also serves as the adviser to the affiliated Master Portfolio and is entitled to receive a fee from the affiliated Master Portfolio for those services.
Administration fees
Under a class-level administration agreement, Allspring Funds Management provides class-level administrative services to the Fund, which includes paying fees and expenses for services provided by the transfer agent, sub-transfer agents, omnibus account servicers and record-keepers. As compensation for its services under the class-level administration agreement, Allspring Funds Management receives an annual fee which is calculated based on the average daily net assets of each class as follows:
| | Class-level
administration fee |
| Class A | 0.21% |
| Class C | 0.21 |
| Class R6 | 0.03 |
| Administrator Class | 0.13 |
| Institutional Class | 0.13 |
Waivers and/or expense reimbursements
Allspring Funds Management has contractually committed to waive and/or reimburse management and administration fees to the extent necessary to maintain certain net operating expense ratios for the Fund. When each class of the Fund has exceeded its expense cap, Allspring Funds Management will waive fees and/or reimburse expenses from fund-level expenses on a proportionate basis and then from class specific expenses. When only certain classes exceed their expense caps, waivers and/or reimbursements are applied against class specific expenses before fund-level expenses. Net expenses from the affiliated Master Portfolio are included in the expense caps. Allspring Funds Management has contractually committed through September 30, 2022 to waive fees and/or reimburse expenses to the extent necessary to cap expenses. Prior to or after the commitment expiration date, the caps may be increased or the commitment to maintain the caps may be terminated only with the approval of the Board of Trustees. As of May 31, 2022, the contractual expense caps are as follows:
| | Expense ratio caps |
| Class A | 1.08% |
| Class C | 1.83 |
| Class R6 | 0.65 |
| Administrator Class | 1.00 |
| Institutional Class | 0.75 |
Distribution fee
The Trust has adopted a distribution plan for Class C shares pursuant to Rule 12b-1 under the 1940 Act. A distribution fee is charged to Class C shares and paid to Allspring Funds Distributor, LLC ("Allspring Funds Distributor"), the principal underwriter, an affiliate of Allspring Funds Management, at an annual rate of 0.75% of the average daily net assets of Class C shares.
In addition, Allspring Funds Distributor is entitled to receive the front-end sales charge from the purchase of Class A shares and a contingent deferred sales charge on the redemption of certain Class A shares. Allspring Funds Distributor is also entitled to receive the contingent deferred sales charges from redemptions of Class C shares. For the year ended May 31, 2022, Allspring
22 | Allspring C&B Large Cap Value Fund
Notes to financial statements
Funds Distributor received $3,373 from the sale of Class A shares. No contingent deferred sales charges were incurred by Class A and Class C shares for the year ended May 31, 2022.
Shareholder servicing fees
The Trust has entered into contracts with one or more shareholder servicing agents, whereby Class A, Class C and Administrator Class are charged a fee at an annual rate of 0.25% of the average daily net assets of each respective class. A portion of these total shareholder servicing fees were paid to affiliates, and to certain entities that were affiliates of the Fund until November 1, 2021.
5. INVESTMENT PORTFOLIO TRANSACTIONS
The Fund seeks to achieve its investment objective by investing substantially all of its assets in the affiliated Master Portfolio. Purchases and sales have been calculated by multiplying the Fund's ownership percentage of the affiliated Master Portfolio at the end of the period by the affiliated Master Portfolio's purchases and sales. Purchases and sales of investments, excluding U.S. government obligations (if any) and short-term securities, for the year ended May 31, 2022 were $94,136,861 and $143,314,002, respectively.
6. BANK BORROWINGS
The Trust (excluding the money market funds), Allspring Master Trust and Allspring Variable Trust are parties to a $350,000,000 revolving credit agreement whereby the Fund is permitted to use bank borrowings for temporary or emergency purposes, such as to fund shareholder redemption requests. Interest under the credit agreement is charged to the Fund based on a borrowing rate equal to the higher of the Federal Funds rate in effect on that day plus 1.25% or the overnight bank funding rate in effect on that day plus 1.25%. In addition, an annual commitment fee equal to 0.25% of the unused balance is allocated to each participating fund.
For the year ended May 31, 2022, there were no borrowings by the Fund under the agreement.
7. DISTRIBUTIONS TO SHAREHOLDERS
The tax character of distributions paid during the years ended May 31, 2022 and May 31, 2021 were as follows:
| | Year ended May 31 |
| | 2022 | 2021 |
| Ordinary income | $ 4,587,798 | $4,722,816 |
| Long-term capital gain | 33,365,425 | 8,531,014 |
As of May 31, 2022, the components of distributable earnings on a tax basis were as follows:
Undistributed
ordinary
income | Undistributed
long-term
gain | Unrealized
gains |
| $1,934,550 | $29,996,891 | $56,783,140 |
8. CONCENTRATION RISKS
Concentration risks result from exposure to a limited number of sectors. Through its investment in the affiliated Master Portfolio which may invest a substantial portion of its assets in any sector, the Fund may in turn be more affected by changes in that sector than a fund whose investments are not heavily weighted in any sector. As of the end of the period, the affiliated Master Portfolio concentrated its portfolio in investments related to the financials sector.
9. INDEMNIFICATION
Under the Fund's organizational documents, the officers and Trustees have been granted certain indemnification rights against certain liabilities that may arise out of performance of their duties to the Fund. The Fund has entered into a separate agreement with each Trustee that converts indemnification rights currently existing under the Fund’s organizational documents into contractual rights that cannot be changed in the future without the consent of the Trustee. Additionally, in the normal course of business, the Fund may enter into contracts with service providers that contain a variety of indemnification
Allspring C&B Large Cap Value Fund | 23
Notes to financial statements
clauses. The Fund’s maximum exposure under these arrangements is dependent on future claims that may be made against the Fund and, therefore, cannot be estimated.
10. CORONAVIRUS (COVID-19) PANDEMIC
On March 11, 2020, the World Health Organization announced that it had made the assessment that coronavirus disease 2019 (“COVID-19”) is a pandemic. The impacts of COVID-19 are affecting the entire global economy, individual companies and investment products, the funds, and the market in general. There is significant uncertainty around the extent and duration of business disruptions related to COVID-19 and the impacts may last for an extended period of time. COVID-19 has led to significant uncertainty and volatility in the financial markets.
24 | Allspring C&B Large Cap Value Fund
Report of independent registered public accounting firm
To the Shareholders of the Fund and Board of Trustees
Allspring Funds Trust:
Opinion on the Financial Statements
We have audited the accompanying statement of assets and liabilities of Allspring C&B Large Cap Value Fund (formerly, Wells Fargo C&B Large Cap Value Fund) (the Fund), one of the funds constituting Allspring Funds Trust (formerly, Wells Fargo Funds Trust), including the portfolio of investments, as of May 31, 2022, the related statement of operations for the year then ended, the statements of changes in net assets for each of the years in the two-year period then ended, and the related notes (collectively, the financial statements) and the financial highlights for each of the years in the five-year period then ended. In our opinion, the financial statements and financial highlights present fairly, in all material respects, the financial position of the Fund as of May 31, 2022, the results of its operations for the year then ended, the changes in its net assets for each of the years in the two-year period then ended, and the financial highlights for each of the years in the five-year period then ended, in conformity with U.S. generally accepted accounting principles.
Basis for Opinion
These financial statements and financial highlights are the responsibility of the Fund’s management. Our responsibility is to express an opinion on these financial statements and financial highlights based on our audits. We are a public accounting firm registered with the Public Company Accounting Oversight Board (United States) (PCAOB) and are required to be independent with respect to the Fund in accordance with the U.S. federal securities laws and the applicable rules and regulations of the Securities and Exchange Commission and the PCAOB.
We conducted our audits in accordance with the standards of the PCAOB. Those standards require that we plan and perform the audit to obtain reasonable assurance about whether the financial statements and financial highlights are free of material misstatement, whether due to error or fraud. Our audits included performing procedures to assess the risks of material misstatement of the financial statements and financial highlights, whether due to error or fraud, and performing procedures that respond to those risks. Such procedures included examining, on a test basis, evidence regarding the amounts and disclosures in the financial statements and financial highlights. Such procedures also included confirmation of securities owned as of May 31, 2022, by correspondence with the transfer agent. Our audits also included evaluating the accounting principles used and significant estimates made by management, as well as evaluating the overall presentation of the financial statements and financial highlights. We believe that our audits provide a reasonable basis for our opinion.

We have not been able to determine the specific year that we began serving as the auditor of one or more Allspring Funds investment companies; however, we are aware that we have served as the auditor of one or more Allspring Funds investment companies since at least 1955.
Boston, Massachusetts
July 27, 2022
Allspring C&B Large Cap Value Fund | 25
Portfolio of investments—May 31, 2022
| | | | | Shares | Value |
| Common stocks: 96.54% | | | | | |
| Communication services: 6.67% | | | | | |
| Diversified telecommunication services: 2.59% | | | | | |
| Verizon Communications Incorporated | | | | 168,000 | $ 8,616,720 |
| Entertainment: 1.77% | | | | | |
| Activision Blizzard Incorporated | | | | 75,500 | 5,879,940 |
| Media: 2.31% | | | | | |
| Omnicom Group Incorporated | | | | 103,350 | 7,710,944 |
| Consumer discretionary: 9.11% | | | | | |
| Household durables: 1.79% | | | | | |
| Whirlpool Corporation | | | | 32,300 | 5,950,952 |
| Leisure products: 1.66% | | | | | |
| Hasbro Incorporated | | | | 61,820 | 5,548,345 |
| Specialty retail: 1.76% | | | | | |
| CarMax Incorporated † | | | | 59,050 | 5,861,894 |
| Textiles, apparel & luxury goods: 3.90% | | | | | |
| Gildan Activewear Incorporated | | | | 205,900 | 6,481,732 |
| HanesBrands Incorporated | | | | 549,500 | 6,522,565 |
| | | | | | 13,004,297 |
| Consumer staples: 8.92% | | | | | |
| Food products: 4.83% | | | | | |
| General Mills Incorporated | | | | 108,100 | 7,550,785 |
| Ingredion Incorporated | | | | 36,260 | 3,433,459 |
| The Kraft Heinz Company | | | | 134,480 | 5,087,378 |
| | | | | | 16,071,622 |
| Personal products: 2.34% | | | | | |
| Unilever plc ADR | | | | 161,150 | 7,788,380 |
| Tobacco: 1.75% | | | | | |
| Philip Morris International Incorporated | | | | 55,000 | 5,843,750 |
| Energy: 2.24% | | | | | |
| Oil, gas & consumable fuels: 2.24% | | | | | |
| The Williams Companies Incorporated | | | | 201,100 | 7,452,766 |
| Financials: 32.47% | | | | | |
| Banks: 5.79% | | | | | |
| JPMorgan Chase & Company | | | | 44,900 | 5,937,127 |
| PNC Financial Services Group Incorporated | | | | 12,800 | 2,245,248 |
| US Bancorp | | | | 146,900 | 7,795,983 |
| Wells Fargo & Company | | | | 72,350 | 3,311,460 |
| | | | | | 19,289,818 |
| Capital markets: 10.33% | | | | | |
| Brookfield Asset Management Incorporated Class A | | | | 209,810 | 10,616,386 |
| London Stock Exchange Group plc ADR | | | | 356,200 | 8,370,700 |
The accompanying notes are an integral part of these financial statements.
26 | Allspring C&B Large Cap Value Portfolio
Portfolio of investments—May 31, 2022
| | | | | Shares | Value |
| Capital markets (continued) | | | | | |
| State Street Corporation | | | | 128,820 | $ 9,338,162 |
| The Charles Schwab Corporation | | | | 86,800 | 6,084,680 |
| | | | | | 34,409,928 |
| Diversified financial services: 1.88% | | | | | |
| Berkshire Hathaway Incorporated Class B † | | | | 19,820 | 6,262,724 |
| Insurance: 14.47% | | | | | |
| Alleghany Corporation † | | | | 6,255 | 5,215,294 |
| Arch Capital Group Limited † | | | | 199,580 | 9,472,067 |
| Chubb Limited | | | | 33,270 | 7,029,618 |
| Fidelity National Financial Incorporated | | | | 195,100 | 8,252,730 |
| Globe Life Incorporated | | | | 55,300 | 5,395,621 |
| Progressive Corporation | | | | 70,697 | 8,439,808 |
| The Allstate Corporation | | | | 32,100 | 4,387,749 |
| | | | | | 48,192,887 |
| Health care: 14.23% | | | | | |
| Health care equipment & supplies: 6.05% | | | | | |
| Becton Dickinson & Company | | | | 25,620 | 6,553,596 |
| Dentsply Sirona Incorporated | | | | 185,770 | 7,349,061 |
| Medtronic plc | | | | 62,500 | 6,259,375 |
| | | | | | 20,162,032 |
| Health care providers & services: 5.19% | | | | | |
| HCA Healthcare Incorporated | | | | 32,050 | 6,743,320 |
| Laboratory Corporation of America Holdings | | | | 23,100 | 5,699,232 |
| UnitedHealth Group Incorporated | | | | 9,750 | 4,843,605 |
| | | | | | 17,286,157 |
| Pharmaceuticals: 2.99% | | | | | |
| Johnson & Johnson | | | | 55,450 | 9,954,939 |
| Industrials: 14.13% | | | | | |
| Aerospace & defense: 1.19% | | | | | |
| Woodward Incorporated | | | | 39,139 | 3,976,914 |
| Commercial services & supplies: 2.12% | | | | | |
| IAA Incorporated † | | | | 180,640 | 7,050,379 |
| Electrical equipment: 1.65% | | | | | |
| AMETEK Incorporated | | | | 45,140 | 5,483,156 |
| Industrial conglomerates: 0.89% | | | | | |
| 3M Company | | | | 19,950 | 2,978,336 |
| Machinery: 4.45% | | | | | |
| ESAB Corporation † | | | | 46,493 | 2,324,650 |
| PACCAR Incorporated | | | | 55,700 | 4,836,988 |
| Stanley Black & Decker Incorporated | | | | 64,510 | 7,656,688 |
| | | | | | 14,818,326 |
| Professional services: 1.47% | | | | | |
| Leidos Holdings Incorporated | | | | 46,950 | 4,906,275 |
The accompanying notes are an integral part of these financial statements.
Allspring C&B Large Cap Value Portfolio | 27
Portfolio of investments—May 31, 2022
| | | | | Shares | Value |
| Trading companies & distributors: 2.36% | | | | | |
| AerCap Holdings NV † | | | | 158,700 | $ 7,846,128 |
| Information technology: 6.78% | | | | | |
| Electronic equipment, instruments & components: 5.77% | | | | | |
| Arrow Electronics Incorporated † | | | | 94,440 | 11,394,186 |
| TE Connectivity Limited | | | | 60,525 | 7,831,330 |
| | | | | | 19,225,516 |
| IT services: 1.01% | | | | | |
| Amdocs Limited | | | | 38,550 | 3,349,610 |
| Utilities: 1.99% | | | | | |
| Gas utilities: 1.99% | | | | | |
| Atmos Energy Corporation | | | | 57,060 | 6,636,649 |
| Total Common stocks (Cost $239,929,010) | | | | | 321,559,384 |
| | | Yield | | | |
| Short-term investments: 3.67% | | | | | |
| Investment companies: 3.67% | | | | | |
| Allspring Government Money Market Fund Select Class ♠∞ | | 0.65% | | 12,217,232 | 12,217,232 |
| Total Short-term investments (Cost $12,217,232) | | | | | 12,217,232 |
| Total investments in securities (Cost $252,146,242) | 100.21% | | | | 333,776,616 |
| Other assets and liabilities, net | (0.21) | | | | (715,844) |
| Total net assets | 100.00% | | | | $333,060,772 |
| † | Non-income-earning security |
| ♠ | The issuer of the security is an affiliated person of the Portfolio as defined in the Investment Company Act of 1940. |
| ∞ | The rate represents the 7-day annualized yield at period end. |
| Abbreviations: |
| ADR | American depositary receipt |
The accompanying notes are an integral part of these financial statements.
28 | Allspring C&B Large Cap Value Portfolio
Portfolio of investments—May 31, 2022
Investments in affiliates
An affiliated investment is an investment in which the Portfolio owns at least 5% of the outstanding voting shares of the issuer or as a result of other relationships, such as the Portfolio and the issuer having the same adviser or investment manager. Transactions with issuers that were affiliates of the Portfolio at the end of the period were as follows:
| | Value,
beginning of
period | Purchases | Sales
proceeds | Net
realized
gains
(losses) | | Net
change in
unrealized
gains
(losses) | | Value,
end of
period | Shares,
end
of period | Income
from
affiliated
securities |
| Short-term investments | | | | | | | | | |
| Allspring Government Money Market Fund Select Class | $20,061,602 | $106,661,154 | $(114,505,524) | $0 | | $0 | | $ 12,217,232 | 12,217,232 | $ 10,638 |
| Affiliated securities no longer held at end of period | | | | | | | | | |
| Securities Lending Cash Investments LLC | 0 | 38,191,280 | (38,191,280) | 0 | | 0 | | 0 | 0 | 191 # |
| | | | | $0 | | $0 | | $12,217,232 | | $10,829 |
| # | Amount shown represents income before fees and rebates. |
The accompanying notes are an integral part of these financial statements.
Allspring C&B Large Cap Value Portfolio | 29
Statement of assets and liabilities—May 31, 2022
| | |
| Assets | |
Investments in unaffiliated securities, at value (cost $239,929,010)
| $ 321,559,384 |
Investments in affiliated securities, at value (cost $12,217,232)
| 12,217,232 |
Receivable for dividends
| 522,161 |
Receivable for securities lending income, net
| 17 |
Prepaid expenses and other assets
| 12,158 |
Total assets
| 334,310,952 |
| Liabilities | |
Payable for investments purchased
| 1,085,053 |
Advisory fee payable
| 165,127 |
Total liabilities
| 1,250,180 |
Total net assets
| $333,060,772 |
The accompanying notes are an integral part of these financial statements.
30 | Allspring C&B Large Cap Value Portfolio
Statement of operations—year ended May 31, 2022
| | |
| Investment income | |
Dividends (net of foreign withholdings taxes of $123,303)
| $ 6,629,744 |
Income from affiliated securities
| 16,900 |
Total investment income
| 6,646,644 |
| Expenses | |
Advisory fee
| 2,456,058 |
Custody and accounting fees
| 21,385 |
Professional fees
| 54,265 |
Interest holder report expenses
| 19,814 |
Trustees’ fees and expenses
| 21,440 |
Other fees and expenses
| 26,709 |
Total expenses
| 2,599,671 |
Less: Fee waivers and/or expense reimbursements
| (181,399) |
Net expenses
| 2,418,272 |
Net investment income
| 4,228,372 |
| Realized and unrealized gains (losses) on investments | |
Net realized gains on investments
| 59,295,012 |
Net change in unrealized gains (losses) on investments
| (67,362,442) |
Net realized and unrealized gains (losses) on investments
| (8,067,430) |
Net decrease in net assets resulting from operations
| $ (3,839,058) |
The accompanying notes are an integral part of these financial statements.
Allspring C&B Large Cap Value Portfolio | 31
Statement of changes in net assets
| | | |
| | Year ended
May 31, 2022 | Year ended
May 31, 2021 |
| Operations | | |
Net investment income
| $ 4,228,372 | $ 3,900,892 |
Net realized gains on investments
| 59,295,012 | 33,139,971 |
Net change in unrealized gains (losses) on investments
| (67,362,442) | 117,846,464 |
Net increase (decrease) in net assets resulting from operations
| (3,839,058) | 154,887,327 |
| Capital transactions | | |
| Transactions in investors’ beneficial interests | | |
Contributions
| 20,407,586 | 49,283,346 |
Withdrawals
| (94,906,626) | (79,684,157) |
Net decrease in net assets resulting from capital transactions
| (74,499,040) | (30,400,811) |
Total increase (decrease) in net assets
| (78,338,098) | 124,486,516 |
| Net assets | | |
Beginning of period
| 411,398,870 | 286,912,354 |
End of period
| $333,060,772 | $411,398,870 |
The accompanying notes are an integral part of these financial statements.
32 | Allspring C&B Large Cap Value Portfolio
| | Year ended May 31 |
| | 2022 | 2021 | 2020 | 2019 | 2018 |
Total return
| (1.05)% | 57.96% | (3.40)% | 1.80% | 6.65% |
| Ratios to average net assets (annualized) | | | | | |
Gross expenses
| 0.69% | 0.68% | 0.68% | 0.67% | 0.67% |
Net expenses1
| 0.64% | 0.64% | 0.64% | 0.65% | 0.66% |
Net investment income
| 1.12% | 1.16% | 1.36% | 1.27% | 1.02% |
| Supplemental data | | | | | |
Portfolio turnover rate
| 32% | 38% | 33% | 47% | 42% |
| 1 | Net expense ratios reflect voluntary waivers. |
The accompanying notes are an integral part of these financial statements.
Allspring C&B Large Cap Value Portfolio | 33
Notes to financial statements
1. ORGANIZATION
Allspring Master Trust (the "Trust"), a Delaware statutory trust organized on March 10, 1999, is an open-end management investment company registered under the Investment Company Act of 1940, as amended (the "1940 Act"). As an investment company, the Trust follows the accounting and reporting guidance in Financial Accounting Standards Board ("FASB") Accounting Standards Codification Topic 946, Financial Services – Investment Companies. These financial statements report on the Allspring C&B Large Cap Value Portfolio (the "Portfolio") which is a diversified series of the Trust.
Interests in the Portfolio are available solely through private placement transactions that do not involve any "public offering" within the meaning of Section 4(a)(2) of the Securities Act of 1933.
Effective on November 1, 2021, the sale transaction of Wells Fargo Asset Management ("WFAM") by Wells Fargo & Company to GTCR LLC and Reverence Capital Partners, L.P. was closed. In connection with the closing of the transaction, WFAM became known as Allspring Global Investments (“Allspring”) and various entities that provided services to the Portfolio changed their names to "Allspring", including Allspring Funds Management, LLC, the adviser to the Portfolio, Allspring Global Investments, LLC and Allspring Global Investments (UK) Limited, both registered investment advisers providing subadvisory services to certain funds, and Allspring Funds Distributor, LLC. Consummation of the transaction resulted in a new advisory agreement and subadvisory agreement which became effective on November 1, 2021.
2. SIGNIFICANT ACCOUNTING POLICIES
The following significant accounting policies, which are consistently followed in the preparation of the financial statements of the Portfolio, are in conformity with U.S. generally accepted accounting principles which require management to make estimates and assumptions that affect the reported amounts of assets and liabilities, disclosure of contingent assets and liabilities at the date of the financial statements, and the reported amounts of income and expenses during the reporting period. Actual results could differ from those estimates.
Securities valuation
All investments are valued each business day as of the close of regular trading on the New York Stock Exchange (generally 4 p.m. Eastern Time), although the Portfolio may deviate from this calculation time under unusual or unexpected circumstances.
Equity securities that are listed on a foreign or domestic exchange or market are valued at the official closing price or, if none, the last sales price.
Investments in registered open-end investment companies are valued at net asset value. Interests in non-registered investment companies that are redeemable at net asset value are fair valued normally at net asset value.
Investments which are not valued using any of the methods discussed above are valued at their fair value, as determined in good faith by the Board of Trustees. The Board of Trustees has established a Valuation Committee comprised of the Trustees and has delegated to it the authority to take any actions regarding the valuation of portfolio securities that the Valuation Committee deems necessary or appropriate, including determining the fair value of portfolio securities, unless the determination has been delegated to the Allspring Global Investments Pricing Committee at Allspring Funds Management, LLC ("Allspring Funds Management"). The Board of Trustees retains the authority to make or ratify any valuation decisions or approve any changes to the Valuation Procedures as it deems appropriate. On a quarterly basis, the Board of Trustees receives reports on any valuation actions taken by the Valuation Committee or the Allspring Global Investments Pricing Committee which may include items for ratification.
Securities lending
The Portfolio may lend its securities from time to time in order to earn additional income in the form of fees or interest on securities received as collateral or the investment of any cash received as collateral. When securities are on loan, the Portfolio receives interest or dividends on those securities. Cash collateral received in connection with its securities lending transactions is invested in Securities Lending Cash Investments, LLC (the "Securities Lending Fund"), an affiliated non-registered investment company. Investments in Securities Lending Fund are valued at the evaluated bid price provided by an independent pricing service. Income earned from investment in the Securities Lending Fund (net of fees and rebates), if any, is included in income from affiliated securities on the Statement of Operations.
In a securities lending transaction, the net asset value of the Portfolio is affected by an increase or decrease in the value of the securities loaned and by an increase or decrease in the value of the instrument in which collateral is invested. The amount of securities lending activity undertaken by the Portfolio fluctuates from time to time. The Portfolio has the right under the lending agreement to recover the securities from the borrower on demand. In the event of default or bankruptcy by the
34 | Allspring C&B Large Cap Value Portfolio
Notes to financial statements
borrower, the Portfolio may be prevented from recovering the loaned securities or gaining access to the collateral or may experience delays or costs in doing so. In such an event, the terms of the agreement allow the unaffiliated securities lending agent to use the collateral to purchase replacement securities on behalf of the Portfolio or pay the Portfolio the market value of the loaned securities. The Portfolio bears the risk of loss with respect to depreciation of its investment of the cash collateral.
Security transactions and income recognition
Securities transactions are recorded on a trade date basis. Realized gains or losses are recorded on the basis of identified cost.
Dividend income is recognized on the ex-dividend date. Dividend income is recorded net of foreign taxes withheld where recovery of such taxes is not assured.
Federal and other taxes
The Portfolio is not required to pay federal income taxes on its net investment income and net capital gains as it is treated as a partnership for federal income tax purposes. All income, gains and losses of the Portfolio are deemed to have been “passed through” to the interest holders in proportion to their holdings of the Portfolio regardless of whether income and gains have been distributed by the Portfolio.
The Portfolio’s income tax returns and all financial records supporting those returns for the prior three fiscal years are subject to examination by the federal revenue authority. Management has analyzed the Portfolio’s tax positions taken on federal, state, and foreign tax returns, as applicable, for all open tax years and does not believe that there are any uncertain tax positions that require recognition of a tax liability.
As of May 31, 2022, the aggregate cost of all investments for federal income tax purposes was $256,501,252 and the unrealized gains (losses) consisted of:
| Gross unrealized gains | $ 94,285,255 |
| Gross unrealized losses | (17,009,891) |
| Net unrealized gains | $ 77,275,364 |
3. FAIR VALUATION MEASUREMENTS
Fair value measurements of investments are determined within a framework that has established a fair value hierarchy based upon the various data inputs utilized in determining the value of the Portfolio’s investments. The three-level hierarchy gives the highest priority to unadjusted quoted prices in active markets for identical assets or liabilities (Level 1) and the lowest priority to unobservable inputs (Level 3). The Portfolio’s investments are classified within the fair value hierarchy based on the lowest level of input that is significant to the fair value measurement. The inputs are summarized into three broad levels as follows:
| ■ | Level 1 – quoted prices in active markets for identical securities |
| ■ | Level 2 – other significant observable inputs (including quoted prices for similar securities, interest rates, prepayment speeds, credit risk, etc.) |
| ■ | Level 3 – significant unobservable inputs (including the Portfolio’s own assumptions in determining the fair value of investments) |
The inputs or methodologies used for valuing investments in securities are not necessarily an indication of the risk associated with investing in those securities.
Allspring C&B Large Cap Value Portfolio | 35
Notes to financial statements
The following is a summary of the inputs used in valuing the Portfolio’s assets and liabilities as of May 31, 2022:
| | Quoted prices
(Level 1) | Other significant
observable inputs
(Level 2) | Significant
unobservable inputs
(Level 3) | Total |
| Assets | | | | |
| Investments in: | | | | |
| Common stocks | | | | |
| Communication services | $ 22,207,604 | $0 | $0 | $ 22,207,604 |
| Consumer discretionary | 30,365,488 | 0 | 0 | 30,365,488 |
| Consumer staples | 29,703,752 | 0 | 0 | 29,703,752 |
| Energy | 7,452,766 | 0 | 0 | 7,452,766 |
| Financials | 108,155,357 | 0 | 0 | 108,155,357 |
| Health care | 47,403,128 | 0 | 0 | 47,403,128 |
| Industrials | 47,059,514 | 0 | 0 | 47,059,514 |
| Information technology | 22,575,126 | 0 | 0 | 22,575,126 |
| Utilities | 6,636,649 | 0 | 0 | 6,636,649 |
| Short-term investments | | | | |
| Investment companies | 12,217,232 | 0 | 0 | 12,217,232 |
| Total assets | $333,776,616 | $0 | $0 | $333,776,616 |
Additional sector, industry or geographic detail, if any, is included in the Portfolio of Investments.
For the year ended May 31, 2022, the Portfolio did not have any transfers into/out of Level 3.
4. TRANSACTIONS WITH AFFILIATES AND OTHER EXPENSES
Advisory fee
The Trust has entered into an advisory contract with Allspring Funds Management, a wholly owned subsidiary of Allspring Global Investments Holdings, LLC, a holding company indirectly owned by certain private funds of GTCR LLC and Reverence Capital Partners, L.P. The adviser is responsible for implementing investment policies and guidelines and for supervising the subadviser, who is responsible for day-to-day portfolio management of the Portfolio. Pursuant to the contract, Allspring Funds Management is entitled to receive an advisory fee at the following annual rate based on the Portfolio’s average daily net assets:
| Average daily net assets | Advisory fee |
| First $500 million | 0.650% |
| Next $500 million | 0.625 |
| Next $1 billion | 0.600 |
| Next $2 billion | 0.575 |
| Next $4 billion | 0.550 |
| Next $4 billion | 0.525 |
| Next $4 billion | 0.500 |
| Over $16 billion | 0.475 |
For the year ended May 31, 2022, the advisory fee was equivalent to an annual rate of 0.65% of the Portfolio's average daily net assets.
Allspring Funds Management has retained the services of a subadviser to provide daily portfolio management to the Portfolio. The fee for subadvisory services is borne by Allspring Funds Management. Cooke & Bieler, L.P., which is not an affiliate of Allspring Funds Management, is the subadviser to the Portfolio and is entitled to receive a fee from Allspring Funds Management at an annual rate starting at 0.38% and declining to 0.30% as the average daily net assets of the Fund increase.
Allspring Funds Management has voluntarily waived and/or reimbursed advisory fees to reduce the net operating expense ratio of the Portfolio. These voluntary waivers may be discontinued at any time.
36 | Allspring C&B Large Cap Value Portfolio
Notes to financial statements
Interfund transactions
The Portfolio may purchase or sell portfolio investment securities to certain affiliates pursuant to Rule 17a-7 under the 1940 Act and under procedures adopted by the Board of Trustees. The procedures have been designed to ensure that these interfund transactions, which do not incur broker commissions, are effected at current market prices.
5. INVESTMENT PORTFOLIO TRANSACTIONS
Purchases and sales of investments, excluding U.S. government obligations (if any) and short-term securities, for the year ended May 31, 2022 were $117,827,807 and $179,381,109, respectively.
6. SECURITIES LENDING TRANSACTIONS
The Portfolio lends its securities through an unaffiliated securities lending agent and receives collateral in the form of cash or securities with a value at least equal to the value of the securities on loan. The value of the loaned securities is determined at the close of each business day and any increases or decreases in the required collateral are exchanged between the Portfolio and the counterparty on the next business day. Cash collateral received is invested in the Securities Lending Fund which seeks to provide a positive return compared to the daily Federal Funds Open Rate by investing in high-quality, U.S. dollar-denominated short-term money market instruments and is exempt from registration under Section 3(c)(7) of the 1940 Act. Securities Lending Fund is managed by Allspring Funds Management and is subadvised by Allspring Global Investments, LLC ("Allspring Investments"), an affiliate of Allspring Funds Management and a wholly owned subsidiary of Allspring Global Investments Holdings, LLC. Allspring Funds Management receives an advisory fee starting at 0.05% and declining to 0.01% as the average daily net assets of the Securities Lending Fund increase. All of the fees received by Allspring Funds Management are paid to Allspring Investments for its services as subadviser.
In the event of counterparty default or the failure of a borrower to return a loaned security, the Portfolio has the right to use the collateral to offset any losses incurred. As of May 31, 2022, the Portfolio did not have any securities on loan.
7. BANK BORROWINGS
The Trust, along with Allspring Variable Trust and Allspring Funds Trust (excluding the money market funds), are parties to a $350,000,000 revolving credit agreement whereby the Portfolio is permitted to use bank borrowings for temporary or emergency purposes, such as to fund interest holders withdrawal requests. Interest under the credit agreement is charged to the Portfolio based on a borrowing rate equal to the higher of the Federal Funds rate in effect on that day plus 1.25% or the overnight bank funding rate in effect on that day plus 1.25%. In addition, an annual commitment fee equal to 0.25% of the unused balance is allocated to each participating fund.
For the year ended May 31, 2022, there were no borrowings by the Portfolio under the agreement.
8. CONCENTRATION RISKS
As of the end of the period, the Portfolio concentrated its portfolio of investments in the financials sector. A fund that invests a substantial portion of its assets in any sector may be more affected by changes in that sector than would be a fund whose investments are not heavily weighted in any sector.
9. INDEMNIFICATION
Under the Portfolio's organizational documents, the officers and Trustees have been granted certain indemnification rights against certain liabilities that may arise out of performance of their duties to the Portfolio. The Portfolio has entered into a separate agreement with each Trustee that converts indemnification rights currently existing under the Portfolio’s organizational documents into contractual rights that cannot be changed in the future without the consent of the Trustee. Additionally, in the normal course of business, the Portfolio may enter into contracts with service providers that contain a variety of indemnification clauses. The Portfolio’s maximum exposure under these arrangements is dependent on future claims that may be made against the Portfolio and, therefore, cannot be estimated.
10. CORONAVIRUS (COVID-19) PANDEMIC
On March 11, 2020, the World Health Organization announced that it had made the assessment that coronavirus disease 2019 (“COVID-19”) is a pandemic. The impacts of COVID-19 are affecting the entire global economy, individual companies and investment products, the funds, and the market in general. There is significant uncertainty around the extent and duration of business disruptions related to COVID-19 and the impacts may last for an extended period of time. COVID-19 has led to significant uncertainty and volatility in the financial markets.
Allspring C&B Large Cap Value Portfolio | 37
Report of independent registered public accounting firm
To the Interest Holders of the Portfolio and Board of Trustees
Allspring Master Trust:
Opinion on the Financial Statements
We have audited the accompanying statement of assets and liabilities of Allspring C&B Large Cap Value Portfolio (formerly, Wells Fargo C&B Large Cap Value Portfolio) (the Portfolio), one of the portfolios constituting Allspring Master Trust (formerly, Wells Fargo Master Trust), including the portfolio of investments, as of May 31, 2022, the related statement of operations for the year then ended, the statements of changes in net assets for each of the years in the two-year period then ended, and the related notes (collectively, the financial statements) and the financial highlights for each of the years in the five-year period then ended. In our opinion, the financial statements and financial highlights present fairly, in all material respects, the financial position of the Portfolio as of May 31, 2022, the results of its operations for the year then ended, the changes in its net assets for each of the years in the two-year period then ended, and the financial highlights for each of the years in the five-year period then ended, in conformity with U.S. generally accepted accounting principles.
Basis for Opinion
These financial statements and financial highlights are the responsibility of the Portfolio’s management. Our responsibility is to express an opinion on these financial statements and financial highlights based on our audits. We are a public accounting firm registered with the Public Company Accounting Oversight Board (United States) (PCAOB) and are required to be independent with respect to the Portfolio in accordance with the U.S. federal securities laws and the applicable rules and regulations of the Securities and Exchange Commission and the PCAOB.
We conducted our audits in accordance with the standards of the PCAOB. Those standards require that we plan and perform the audit to obtain reasonable assurance about whether the financial statements and financial highlights are free of material misstatement, whether due to error or fraud. Our audits included performing procedures to assess the risks of material misstatement of the financial statements and financial highlights, whether due to error or fraud, and performing procedures that respond to those risks. Such procedures included examining, on a test basis, evidence regarding the amounts and disclosures in the financial statements and financial highlights. Such procedures also included confirmation of securities owned as of May 31, 2022, by correspondence with the custodian, transfer agent and brokers, or by other appropriate auditing procedures. Our audits also included evaluating the accounting principles used and significant estimates made by management, as well as evaluating the overall presentation of the financial statements and financial highlights. We believe that our audits provide a reasonable basis for our opinion.
We have not been able to determine the specific year that we began serving as the auditor of one or more Allspring Funds investment companies; however, we are aware that we have served as the auditor of one or more Allspring Funds investment companies since at least 1955.
Boston, Massachusetts
July 27, 2022
38 | Allspring C&B Large Cap Value Portfolio
Other information (unaudited)
TAX INFORMATION
For corporate shareholders, pursuant to Section 854 of the Internal Revenue Code, 91% of ordinary income dividends qualify for the corporate dividends-received deduction for the fiscal year ended May 31, 2022.
Pursuant to Section 852 of the Internal Revenue Code, $33,365,425 was designated as a 20% rate gain distribution for the fiscal year ended May 31, 2022.
Pursuant to Section 854 of the Internal Revenue Code, $4,567,738 of income dividends paid during the fiscal year ended May 31, 2022 has been designated as qualified dividend income (QDI).
For the fiscal year ended May 31, 2022, $4,866 has been designated as interest-related dividends for nonresident alien shareholders pursuant to Section 871 of the Internal Revenue Code.
For the fiscal year ended May 31, 2022, $1,819,408 has been designated as short-term capital gain dividends for nonresident alien shareholders pursuant to Section 871 of the Internal Revenue Code.
PROXY VOTING INFORMATION
A description of the policies and procedures used to determine how to vote proxies relating to portfolio securities is available without charge, upon request, by calling 1-800-222-8222, visiting our website at allspringglobal.com, or visiting the SEC website at sec.gov. Information regarding how the proxies related to portfolio securities were voted during the most recent 12-month period ended June 30 is available on the website at allspringglobal.com or by visiting the SEC website at sec.gov.
QUARTERLY PORTFOLIO HOLDINGS INFORMATION
The Fund and Portfolio file their complete schedule of portfolio holdings with the SEC for the first and third quarters of each fiscal year as an exhibit to their reports on Form N-PORT. Shareholders and Interest holders may view the filed Form N-PORT by visiting the SEC website at sec.gov.
Allspring C&B Large Cap Value Fund | 39
Other information (unaudited)
BOARD OF TRUSTEES AND OFFICERS
Each of the Trustees and Officers listed in the table below acts in identical capacities for each fund in the Allspring family of funds, which consists of 137 mutual funds comprising the Allspring Funds Trust, Allspring Variable Trust, Allspring Master Trust and four closed-end funds (collectively the “Fund Complex”). This table should be read in conjunction with the Prospectus and the Statement of Additional Information1. The mailing address of each Trustee and Officer is 525 Market Street, 12th Floor, San Francisco, CA 94105. Each Trustee and Officer serves an indefinite term, however, each Trustee serves such term until reaching the mandatory retirement age established by the Trustees.
Independent Trustees
Name and
year of birth | Position held and
length of service* | Principal occupations during past five years or longer | Current other
public company or
investment
company
directorships |
William R. Ebsworth
(Born 1957) | Trustee,
since 2015 | Retired. From 1984 to 2013, equities analyst, portfolio manager, research director and chief investment officer at Fidelity Management and Research Company in Boston, Tokyo, and Hong Kong, and retired in 2013 as Chief Investment Officer of Fidelity Strategic Advisers, Inc. where he led a team of investment professionals managing client assets. Prior thereto, Board member of Hong Kong Securities Clearing Co., Hong Kong Options Clearing Corp., the Thailand International Fund, Ltd., Fidelity Investments Life Insurance Company, and Empire Fidelity Investments Life Insurance Company. Audit Committee Chair and Investment Committee Chair of the Vincent Memorial Hospital Endowment (non-profit organization). Mr. Ebsworth is a CFA® charterholder. | N/A |
Jane A. Freeman
(Born 1953) | Trustee,
since 2015;
Chair Liaison,
since 2018 | Retired. From 2012 to 2014 and 1999 to 2008, Chief Financial Officer of Scientific Learning Corporation. From 2008 to 2012, Ms. Freeman provided consulting services related to strategic business projects. Prior to 1999, Portfolio Manager at Rockefeller & Co. and Scudder, Stevens & Clark. Board member of the Harding Loevner Funds from 1996 to 2014, serving as both Lead Independent Director and chair of the Audit Committee. Board member of the Russell Exchange Traded Funds Trust from 2011 to 2012 and the chair of the Audit Committee. Ms. Freeman is also an inactive Chartered Financial Analyst. | N/A |
Isaiah Harris, Jr.
(Born 1952) | Trustee,
since 2009; Audit
Committee
Chair,
since 2019 | Retired. Chairman of the Board of CIGNA Corporation from 2009 to 2021, and Director from 2005 to 2008. From 2003 to 2011, Director of Deluxe Corporation. Prior thereto, President and CEO of BellSouth Advertising and Publishing Corp. from 2005 to 2007, President and CEO of BellSouth Enterprises from 2004 to 2005 and President of BellSouth Consumer Services from 2000 to 2003. Emeritus member of the Iowa State University Foundation Board of Governors. Emeritus Member of the Advisory Board of Iowa State University School of Business. Advisory Board Member, Palm Harbor Academy (private school). Advisory Board Member, Fellowship of Christian Athletes. Mr. Harris is a certified public accountant (inactive status). | N/A |
David F. Larcker
(Born 1950) | Trustee,
since 2009 | James Irvin Miller Professor of Accounting at the Graduate School of Business (Emeritus), Stanford University, Director of the Corporate Governance Research Initiative and Senior Faculty of The Rock Center for Corporate Governance since 2006. From 2005 to 2008, Professor of Accounting at the Graduate School of Business, Stanford University. Prior thereto, Ernst & Young Professor of Accounting at The Wharton School, University of Pennsylvania from 1985 to 2005. | N/A |
40 | Allspring C&B Large Cap Value Fund
Other information (unaudited)
Name and
year of birth | Position held and
length of service* | Principal occupations during past five years or longer | Current other
public company or
investment
company
directorships |
Olivia S. Mitchell
(Born 1953) | Trustee,
since 2006;
Nominating and
Governance
Committee Chair,
since 2018 | International Foundation of Employee Benefit Plans Professor since 1993, Wharton School of the University of Pennsylvania. Director of Wharton’s Pension Research Council and Boettner Center on Pensions & Retirement Research, and Research Associate at the National Bureau of Economic Research. Previously taught at Cornell University from 1978 to 1993. | N/A |
Timothy J. Penny
(Born 1951) | Trustee,
since 1996;
Chair,
since 2018 | President and Chief Executive Officer of Southern Minnesota Initiative Foundation, a non-profit organization, since 2007. Member of the Board of Trustees of NorthStar Education Finance, Inc., a non-profit organization, since 2007. | N/A |
James G. Polisson
(Born 1959) | Trustee,
since 2018 | Retired. Chief Marketing Officer, Source (ETF) UK Services, Ltd, from 2015 to 2017. From 2012 to 2015, Principal of The Polisson Group, LLC, a management consulting, corporate advisory and principal investing company. Chief Executive Officer and Managing Director at Russell Investments, Global Exchange Traded Funds from 2010 to 2012. Managing Director of Barclays Global Investors from 1998 to 2010 and Global Chief Marketing Officer for iShares and Barclays Global Investors from 2000 to 2010. Trustee of the San Francisco Mechanics’ Institute, a non-profit organization, from 2013 to 2015. Board member of the Russell Exchange Traded Fund Trust from 2011 to 2012. Director of Barclays Global Investors Holdings Deutschland GmbH from 2006 to 2009. Mr. Polisson is an attorney and has a retired status with the Massachusetts and District of Columbia Bar Associations. | N/A |
Pamela Wheelock
(Born 1959) | Trustee,
since January
2020; previously
Trustee from
January 2018 to
July 2019 | Board member of the Destination Medical Center Economic Development Agency, Rochester, Minnesota since 2019. Interim President of the McKnight Foundation from January to September 2020. McKnight Foundation Consultant, November 2020 to February 2021. Acting Commissioner, Minnesota Department of Human Services, July 2019 through September 2019. Consultant (part-time), Minnesota Department of Human Services, October 2019 through December 2019. Chief Operating Officer, Twin Cities Habitat for Humanity from 2017 to 2019. Vice President of University Services, University of Minnesota from 2012 to 2016. Prior thereto, on the Board of Directors, Governance Committee and Finance Committee for the Minnesota Philanthropy Partners (Saint Paul Foundation) from 2012 to 2018, Interim Chief Executive Officer of Blue Cross Blue Shield of Minnesota from 2011 to 2012, Chairman of the Board from 2009 to 2012 and Board Director from 2003 to 2015. Vice President, Leadership and Community Engagement, Bush Foundation, Saint Paul, Minnesota (a private foundation) from 2009 to 2011. Executive Vice President and Chief Financial Officer, Minnesota Sports and Entertainment from 2004 to 2009 and Senior Vice President from 2002 to 2004. Executive Vice President of the Minnesota Wild Foundation from 2004 to 2008. Commissioner of Finance, State of Minnesota, from 1999 to 2002. Currently Board Chair of the Minnesota Wild Foundation since 2010. | N/A |
* Length of service dates reflect the Trustee’s commencement of service with the Trust’s predecessor entities, where applicable.
Allspring C&B Large Cap Value Fund | 41
Other information (unaudited)
Officers2
Name and
year of birth | Position held and
length of service | Principal occupations during past five years or longer |
Andrew Owen
(Born 1960) | President,
since 2017 | President, Chief Executive Officer and Director of Allspring Funds Management, LLC since 2017 and co-president of Galliard Capital Management, LLC, an affiliate of Allspring Funds Management, LLC, since 2019. Prior thereto, Head of Affiliated Managers, Allspring Global Investments, from 2014 to 2019 and Executive Vice President responsible for marketing, investments and product development for Allspring Funds Management, LLC, from 2009 to 2014. In addition, Mr. Owen was an Executive Vice President of Wells Fargo & Company from 2014 to 2021. |
Jeremy DePalma
(Born 1974) | Treasurer,
since 2012
(for certain funds in
the Fund Complex);
since 2021 (for
the remaining funds in the
Fund Complex) | Senior Vice President of Allspring Funds Management, LLC since 2009. Senior Vice President of Evergreen Investment Management Company, LLC from 2008 to 2010 and head of the Fund Reporting and Control Team within Fund Administration from 2005 to 2010. |
Kate McKinley
(Born 1977) | Chief Legal Officer,
since 2021 | Chief Legal Officer of Allspring Global Investments since 2021. Prior thereto, held various roles at State Street Global Advisors beginning in 2010, including serving as Senior Vice President and General Counsel from 2019 to 2021, and Chief Operating Officer of the Institutional Client Group from 2016 - 2019. Prior to working at State Street Global Advisors served as Assistant General Counsel for Bank of America Corporation from 2005 to 2010 and as an Associate at WilmerHale from 2002 to 2005. |
Christopher Baker
(Born 1976) | Chief Compliance Officer, since 2022 | Global Chief Compliance Officer for Allspring Global Investments since 2022. Prior thereto, Chief Compliance Officer for State Street Global Advisors from 2018 to 2021. Senior Compliance Officer for the State Street divisions of Alternative Investment Solutions, Sector Solutions, and Global Marketing from 2015 to 2018. From 2010 to 2015 Vice President, Global Head of Investment and Marketing Compliance for State Street Global Advisors. |
Matthew Prasse
(Born 1983) | Secretary,
since 2021 | Senior Counsel of the Allspring Legal Department since 2021. Senior Counsel of the Wells Fargo Legal Department from 2018 to 2021. Previously, Counsel for Barings LLC from 2015 to 2018. Prior to joining Barings, Associate at Morgan, Lewis & Bockius LLP from 2008 to 2015. |
1 The Statement of Additional Information includes additional information about the Trustees and is available, without charge, upon request, by calling 1-800-222-8222 or by visiting the website at allspringglobal.com.
2 For those Officers with tenures at Allspring Global Investments and/or Allspring Funds Management, LLC that began prior to 2021, such tenures include years of service during which these businesses/entities were known as Wells Fargo Asset Management and Wells Fargo Funds Management, LLC, respectively.
42 | Allspring C&B Large Cap Value Fund
Other information (unaudited)
LIQUIDITY RISK MANAGEMENT PROGRAM
In accordance with Rule 22e-4 under the Investment Company Act of 1940, as amended (the “Liquidity Rule”), Allspring Funds Trust (“Funds Trust”) has adopted and implemented a liquidity risk management program (the “Program”) on behalf of each of its series (other than the series that operate as money market funds), including the Fund, and Allspring Master Trust (“Master Trust” and together with Funds Trust, the “Trusts”) has adopted and implemented the Program on behalf of each of its series, including the Portfolio, which is reasonably designed to assess and manage the Fund's and the Portfolio’s liquidity risk. “Liquidity risk” is defined under the Liquidity Rule as the risk that the Fund or Portfolio is unable to meet redemption requests without significantly diluting remaining investors’ interests in the Fund or Portfolio. The Trusts’ Boards of Trustees (the “Boards”) previously approved the designation of Allspring Funds Management, LLC (“Allspring Funds Management”), the Fund's investment manager and the Portfolio’s investment adviser, to administer the Program, and Allspring Funds Management has established a Liquidity Risk Management Council (the "Council") composed of personnel from multiple departments within Allspring Funds Management and its affiliates to assist Allspring Funds Management in the administration of the Program.
The Program is comprised of various components designed to support the assessment and/or management of liquidity risk, including: (1) the periodic assessment (no less frequently than annually) of certain factors that influence the Fund's and the Portfolio’s liquidity risk; (2) the periodic classification (no less frequently than monthly) of the Fund's and the Portfolio’s investments into one of four liquidity categories that reflect an estimate of their liquidity under current market conditions; (3) a 15% limit on the acquisition of “illiquid investments” (as defined under the Liquidity Rule); (4) to the extent the Fund or the Portfolio does not invest primarily in “highly liquid investments” (as defined under the Liquidity Rule), the determination of a minimum percentage of the Fund's or Portfolio’s assets that generally will be invested in highly liquid investments (an “HLIM”); (5) if the Fund or the Portfolio has established an HLIM, the periodic review (no less frequently than annually) of the HLIM and the adoption of policies and procedures for responding to a shortfall of the Fund's or the Portfolio’s “highly liquid investments” below its HLIM; and (6) periodic reporting to the Boards.
At a meeting of the Boards held on May 24-25, 2022, the Boards received and reviewed a written report (the “Report”) from Allspring Funds Management that, among other things, addressed the operation of the Program and assessed its adequacy and effectiveness for the period from January 1, 2021 through December 31, 2021 (the “Reporting Period”). Other than extended foreign market holidays, no significant liquidity events impacting the Funds or the Portfolios were noted in the Report. In addition, other than corporate-related changes to the Program, there were no material changes to the Program during the Reporting Period.
Allspring Funds Management determined in the Report that the Program has been implemented and operates effectively to manage each Fund’s and Portfolio’s, including the Fund’s and the Portfolio’s, liquidity risk, and Allspring Funds Management continues to believe that the Program has been and continues to be adequately and effectively implemented to monitor and, as applicable, respond to the Fund’s and the Portfolio’s liquidity developments.
There can be no assurance that the Program will achieve its objectives under all circumstances in the future. With respect to the Fund, please refer to the Fund’s prospectus for more information regarding the Fund’s exposure to liquidity risk and other risks to which an investment in the Fund may be subject.
Allspring C&B Large Cap Value Fund | 43
For more information
More information about Allspring Funds is available free upon request. To obtain literature, please write, visit the Fund's website, or call:
Allspring Funds
P.O. Box 219967
Kansas City, MO 64121-9967
Website: allspringglobal.com
Individual investors: 1-800-222-8222
Retail investment professionals: 1-888-877-9275
Institutional investment professionals: 1-800-260-5969
This report and the financial statements contained herein are submitted for the general information of the shareholders of the Fund. If this report is used for promotional purposes, distribution of the report must be accompanied or preceded by a current prospectus. Before investing, please consider the investment objectives, risks, charges, and expenses of the investment. For a current prospectus and, if available, a summary prospectus, containing this information, call
1-800-222-8222 or visit the Fund's website at allspringglobal.com. Read the prospectus carefully before you invest or send money.
Allspring Global InvestmentsTM is the trade name for the asset management firms of Allspring Global Investments Holdings, LLC, a holding company indirectly owned by certain private funds of GTCR LLC and Reverence Capital Partners, L.P. These firms include but are not limited to Allspring Global Investments, LLC, and Allspring Funds Management, LLC. Certain products managed by Allspring entities are distributed by Allspring Funds Distributor, LLC (a broker-dealer and Member FINRA/SIPC).
This material is for general informational and educational purposes only and is NOT intended to provide investment advice or a recommendation of any kind - including a recommendation for any specific investment, strategy, or plan.
© 2022 Allspring Global Investments Holdings, LLC. All rights reserved.
PAR-0622-00147 07-22
A280/AR280 05-22
Annual Report
May 31, 2022
Allspring Real Return Fund
The views expressed and any forward-looking statements are as of May 31, 2022, unless otherwise noted, and are those of the Fund's portfolio managers and/or Allspring Global Investments. Discussions of individual securities or the markets generally are not intended as individual recommendations. Future events or results may vary significantly from those expressed in any forward-looking statements. The views expressed are subject to change at any time in response to changing circumstances in the market. Allspring Global Investments disclaims any obligation to publicly update or revise any views expressed or forward-looking statements.
Allspring Real Return Fund | 1
Letter to shareholders (unaudited)
Andrew Owen
President
Allspring Funds
Dear Shareholder:
We are pleased to offer you this annual report for the Allspring Real Return Fund for the 12-month period that ended May 31, 2022. Globally, stocks experienced rising volatility through the period, but overall, U.S. stocks outperformed non-U.S. equities as the global economy faced multiple challenges. Bonds also had poor performance during a difficult period, with major fixed income indexes all down for the 12-month period.
Earlier tailwinds provided by global stimulus programs, vaccination rollouts, and recovering consumer and corporate sentiment were more than offset by the highest rate of inflation in decades, concerns about sharp central bank rate hikes, more highly contagious COVID-19 variants, and the Russian invasion of Ukraine. The impact of already-significant supply chain disruptions were made worse by China’s COVID-19 lockdowns.
For the 12-month period, U.S. large-cap stocks led both non-U.S. developed market equities and emerging market stocks. Returns by fixed-income securities were negative as rising inflation created new challenges. For the period, U.S. stocks, based on the S&P 500 Index,1 lost 0.30%. International stocks, as measured by the MSCI ACWI ex USA Index (Net),2 returned -12.41%, while the MSCI EM Index (Net) (USD)3 had weaker performance with a loss of 19.83%. Among bond indexes, the Bloomberg U.S. Aggregate Bond Index4 returned -8.22%, the Bloomberg Global Aggregate ex-USD Index (unhedged)5 returned -16.68%, the Bloomberg Municipal Bond Index6 lost 6.79%, and the ICE BofA U.S. High Yield Index7 fell 5.00%.
Rising inflation, COVID, and the Russian invasion of Ukraine in February drove market performance.
The period began with the S&P 500 Index reaching an all-time high in June 2021. In late June, the U.S. Congress reached a deal on a $1 trillion infrastructure package for road, bridge, and broadband network upgrades over the next eight years. The U.S. Federal Reserve’s (Fed) June meeting yielded no change to policy, but it forecast a possible interest rate rise in 2023. This, combined with a rebound in economic activity and investors searching for yield, led to a decline in U.S. Treasury yields. Many European and Asian countries saw vaccination momentum increase, while COVID-19 infections rose in the U.K. Meanwhile, the price of crude oil jumped over 10% in June as global economic activity picked up and the Organization of the Petroleum Exporting Countries (OPEC) slowed the pace of supply growth.
| 1 | The S&P 500 Index consists of 500 stocks chosen for market size, liquidity, and industry group representation. It is a market-value-weighted index with each stock's weight in the index proportionate to its market value. You cannot invest directly in an index. |
| 2 | The Morgan Stanley Capital International (MSCI) All Country World Index (ACWI) ex USA Index (Net) is a free-float-adjusted market-capitalization-weighted index that is designed to measure the equity market performance of developed and emerging markets, excluding the U.S. Source: MSCI. MSCI makes no express or implied warranties or representations and shall have no liability whatsoever with respect to any MSCI data contained herein. The MSCI data may not be further redistributed or used as a basis for other indexes or any securities or financial products. This report is not approved, reviewed, or produced by MSCI. You cannot invest directly in an index. |
| 3 | The MSCI Emerging Markets (EM) Index (Net) (USD) is a free-float-adjusted market-capitalization-weighted index that is designed to measure equity market performance of emerging markets. You cannot invest directly in an index. |
| 4 | The Bloomberg U.S. Aggregate Bond Index is a broad-based benchmark that measures the investment-grade, U.S.-dollar-denominated, fixed-rate taxable bond market, including Treasuries, government-related and corporate securities, mortgage-backed securities (agency fixed-rate and hybrid adjustable-rate mortgage pass-throughs), asset-backed securities, and commercial mortgage-backed securities. You cannot invest directly in an index. |
| 5 | The Bloomberg Global Aggregate ex-USD Index (unhedged) is an unmanaged index that provides a broad-based measure of the global investment-grade fixed-income markets excluding the U.S.-dollar-denominated debt market. You cannot invest directly in an index. |
| 6 | The Bloomberg Municipal Bond Index is an unmanaged index composed of long-term tax-exempt bonds with a minimum credit rating of Baa. You cannot invest directly in an index. |
| 7 | The ICE BofA U.S. High Yield Index is a market-capitalization-weighted index of domestic and Yankee high-yield bonds. The index tracks the performance of high-yield securities traded in the U.S. bond market. You cannot invest directly in an index. Copyright 2022. ICE Data Indices, LLC. All rights reserved. |
2 | Allspring Real Return Fund
Letter to shareholders (unaudited)
Inflation continued to climb in July, fueled by the ongoing supply bottleneck and high demand. Monthly U.S. equity gains led those of international developed markets. In contrast, emerging markets had losses for the month, hindered by China’s plans for new regulations, particularly in education and technology. The U.S. 10-year Treasury bond yield continued to decline as strong demand swallowed up supply. After hitting a multiyear high earlier in the month, oil prices leveled off as OPEC agreed to raise oil production.
The COVID-19 Delta variant produced outbreaks globally in August, feeding market volatility and casting doubts over the ongoing economic recovery. The U.S. economy remained strong despite the Delta variant, ongoing inflationary pressures, and worries over Hurricane Ida. Emerging market equities experienced elevated volatility, largely influenced by China’s regulatory stance. Municipal debt had its first monthly loss since February. Among commodities, crude oil fell sharply as the Delta variant caused expectations to dampen. However, oil remained a leading asset-class performer for the year.
Global markets suffered their broadest retreat in a year during September, except for commodities, as concerns over inflation and the interest rate outlook depressed investor confidence. Emerging markets declined on concerns over supply chain disruptions along with rising energy and food prices. Meanwhile, the Fed indicated it would soon start to slow the pace of asset purchases. U.S. concerns included a congressional showdown over the debt ceiling, the 2022 federal government budget, and the infrastructure package. Meanwhile, commodities thrived in September, driven by sharply higher energy prices.
Elevated inflation pressures and the global supply bottleneck continued in October, but strong earnings provided a bright spot in the U.S., the eurozone, and many Asian countries. Government bond yields rose globally as central banks prepared to tighten monetary policy. Commodity prices continued to rise, driven by sharply higher energy costs.
In November, as COVID-19 hospitalizations rose, most major global asset classes declined. Two exceptions were U.S. investment-grade bonds and Treasury Inflation-Protected Securities. President Biden signed a long-awaited infrastructure bill to upgrade U.S. roads, bridges, and railways. Meanwhile, the Consumer Price Index (CPI)1, a measure of domestic inflation conditions, jumped to its highest level in 31 years. While the threat of consistently high inflation led the Fed to discuss a faster pace of tapering, the Omicron strain created uncertainty. Commodities lost ground for the month, driven by sharp declines in oil prices (and energy costs in general) as well as precious metals.
Global volatility lessened in December as data indicated a lower risk of severe disease and death from the Omicron variant. Even so, several countries introduced restrictions on travel and hospitality, among other sectors, in an effort to reduce the spread. In the U.S., data indicated a stable economy overall, with robust corporate earnings. Consumer spending potential looked strong heading into 2022 on elevated household savings and the lowest household debt ratio since 1973. U.S. corporate and high-yield bonds had monthly gains while Treasuries declined. Bonds were strongly affected by the projection of multiple rate hikes in 2022 by senior Federal Open Market Committee members.
In January 2022, the main focus was on potential U.S. interest rate hikes and the Russia-Ukraine conflict. The Fed hinted that a March interest rate hike was likely. Meanwhile, Russia threatened a potential invasion of Ukraine, which could disrupt Russia’s massive energy supplies and drive demand from non-Russian oil-producing countries. Elsewhere overseas, Europe saw food and energy prices spike, leading to rising inflation. Within fixed income, corporate bonds struggled in January, underperforming government bonds, as investors focused on continued elevated inflation and ongoing uncertainty over the U.S. monetary path.
“ Global markets suffered their broadest retreat in a year during September, except for commodities, as concerns over inflation and the interest rate outlook depressed investor confidence.”
| 1 | The Consumer Price Index (CPI) is a measure of the average change over time in the prices paid by urban consumers for a market basket of consumer goods and services. You cannot invest directly in an index. |
Allspring Real Return Fund | 3
Letter to shareholders (unaudited)
“ The Russian invasion of Ukraine dominated the financial world in February and March. Equity, bond, and commodity markets were shaken by fear, uncertainty, and an upending of demand-supply dynamics.” |
The Russian invasion of Ukraine dominated the financial world in February and March. Equity, bond, and commodity markets were shaken by fear, uncertainty, and an upending of demand-supply dynamics. Major global stock indexes were down in February, along with global bonds overall, with ongoing high levels of volatility in March along with mixed results that favored U.S. large-cap stocks. Prices of commodities spiked, including crude oil, natural gas, wheat, and precious metals, on elevated concerns of supply shortages. All of this fed already-high inflation concerns and added to expectations of more aggressive central bank interest rate hikes. Sweeping sanctions against Russia and corporate pullouts contributed to market volatility. Despite the geopolitical turmoil, the U.S. economic outlook remained largely unchanged, with a healthy job market and signs of economic resilience accompanying higher prices.
In April, market volatility continued, with deepening losses across major capital markets, as both the S&P 500 and MSCI ACWI (Net)1 fell 8% or more for the month. The Chinese economy struggled through a strict lockdown as the government tried to contain a major COVID-19 outbreak, creating a global ripple effect that compounded existing supply shortages. This was exacerbated by the impact of the Russia-Ukraine war on global commodities. Meanwhile, U.S. annual inflation raged at 8.5%, its highest level since 1981, and investors braced themselves for aggressive Fed monetary tightening moves.
Market volatility continued in May, but full-month returns belied that as markets recovered ground late in the month. Value stocks continued to outperform growth stocks. The concerns that had dominated markets for months continued, including high inflation (the CPI remained above 8%) and geopolitical tensions that exacerbated high crude oil, gasoline, and food prices. In response, the Fed raised the federal funds rate by 0.50%, with broad expectations of multiple rate hikes to come. Meanwhile, highly contagious COVID-19 variants persisted. However, labor markets in the U.S., the U.K., and Europe remained strong. The U.S. recorded a 3.6% unemployment rate, although labor market participation remained low. U.S. retail sales increased for the fourth consecutive month in April, indicating continued consumer resilience.
Don’t let short-term uncertainty derail long-term investment goals.
Periods of investment uncertainty can present challenges, but experience has taught us that maintaining long-term investment goals can be an effective way to plan for the future. To help you create a sound strategy based on your personal goals and risk tolerance, Allspring Funds offers more than 100 mutual funds spanning a wide range of asset classes and investment styles. Although diversification cannot guarantee an investment profit or prevent losses, we believe it can be an effective way to manage investment risk and potentially smooth out overall portfolio performance. We encourage investors to know their investments and to understand that appropriate levels of risk-taking may unlock opportunities.
Thank you for choosing to invest with Allspring Funds. We appreciate your confidence in us and remain committed to helping you meet your financial needs.
Sincerely,
Andrew Owen
President
Allspring Funds
For further information about your fund, contact your investment professional, visit our website at allspringglobal.com, or call us directly at 1-800-222-8222.
| 1 | The MSCI ACWI (Net) is a free-float-adjusted market-capitalization-weighted index that is designed to measure the equity market performance of developed and emerging markets. You cannot invest directly in an index. |
4 | Allspring Real Return Fund
Letter to shareholders (unaudited)
Notice to Shareholders
Russia launched a large-scale invasion of Ukraine on February 24, 2022. As a result of this military action, the United States and many other countries have instituted various economic sanctions against Russian and Belarus individuals and entities. The situation has led to increased financial market volatility and has had severe adverse effects on regional and global economic markets, including the markets for certain securities and commodities, such as oil and natural gas. The extent and duration of the military action, resulting sanctions imposed, other punitive action taken and the resulting market disruptions cannot be easily predicted.
Our solidarity and support goes out to our impacted employees and the people affected in Ukraine and their families. Allspring has a dedicated team of investment professionals actively monitoring the situation for any new developments and the potential impact to our clients and investment products. As the situation remains fluid, we are focused on the assessment of risks, valuation, and liquidity of impacted securities. Please visit our website at allspringglobal.com and click on “Russia-Ukraine Updates” for further information.
Allspring Real Return Fund | 5
Performance highlights (unaudited)
Investment objectiveThe Fund seeks returns that exceed the rate of inflation over the long-term.
| Manager | Allspring Funds Management, LLC |
Subadviser for the affiliated master portfolio*
Allspring Global Investments, LLC
| Portfolio managers | Kandarp R. Acharya, CFA®‡, FRM, Petros N. Bocray, CFA®‡, FRM, Michael Bradshaw, CFA®‡, Travis L. Keshemberg, CFA®‡#, CIPM, FRM, Garth B. Newport, CFA®‡, Michael Schueller, CFA®‡, Michal Stanczyk† |
| Average annual total returns (%) as of May 31, 2022 |
| | | Including sales charge | | Excluding sales charge | | Expense ratios1 (%) |
| | Inception date | 1 year | 5 year | 10 year | | 1 year | 5 year | 10 year | | Gross | Net 2 |
| Class A (IPBAX) | 2-28-2003 | -4.99 | 2.57 | 1.42 | | -0.52 | 3.52 | 1.88 | | 1.26 | 0.78 |
| Class C (IPBCX) | 2-28-2003 | -2.26 | 2.77 | 1.28 | | -1.26 | 2.77 | 1.28 | | 2.01 | 1.53 |
| Class R6 (IPBJX)3 | 10-31-2016 | – | – | – | | -0.15 | 3.93 | 2.22 | | 0.88 | 0.40 |
| Administrator Class (IPBIX) | 2-28-2003 | – | – | – | | -0.36 | 3.73 | 2.11 | | 1.20 | 0.60 |
| Institutional Class (IPBNX)4 | 10-31-2016 | – | – | – | | -0.19 | 3.86 | 2.19 | | 0.93 | 0.45 |
| Bloomberg U.S. TIPS Index5 | – | – | – | – | | -1.45 | 3.68 | 2.00 | | – | – |
| CPI 6 | – | – | – | – | | 8.58 | 3.62 | 2.43 | | – | – |
Figures quoted represent past performance, which is no guarantee of future results, and do not reflect taxes that a shareholder may pay on an investment in a fund. Investment return and principal value of an investment will fluctuate so that an investor’s shares, when redeemed, may be worth more or less than their original cost. Performance shown without sales charges would be lower if sales charges were reflected. Current performance may be lower or higher than the performance data quoted, which assumes the reinvestment of dividends and capital gains. Current month-end performance is available on the Fund’s website, allspringglobal.com.
Index returns do not include transaction costs associated with buying and selling securities, any mutual fund fees or expenses, or any taxes. It is not possible to invest directly in an index.
For Class A shares, the maximum front-end sales charge is 4.50%. For Class C shares, the maximum contingent deferred sales charge is 1.00%. Performance including a contingent deferred sales charge assumes the sales charge for the corresponding time period. Class R6, Administrator Class and Institutional Class shares are sold without a front-end sales charge or contingent deferred sales charge.
| 1 | Reflects the expense ratios as stated in the most recent prospectuses. The expense ratios shown are subject to change and may differ from the annualized expense ratios shown in the financial highlights of this report. |
| 2 | The manager has contractually committed through September 30, 2022, to waive fees and/or reimburse expenses to the extent necessary to cap total annual fund operating expenses after fee waivers at 0.78% for Class A, 1.53% for Class C, 0.40% for Class R6, 0.60% for Administrator Class, and 0.45% for Institutional Class. Brokerage commissions, stamp duty fees, interest, taxes, acquired fund fees and expenses (if any) from funds in which the affiliated master portfolio invests, and extraordinary expenses are excluded from the expense caps. Net expenses from the affiliated master portfolio are included in the expense caps. Prior to or after the commitment expiration date, the caps may be increased or the commitment to maintain the caps may be terminated only with the approval of the Board of Trustees. Without these caps, the Fund’s returns would have been lower. The expense ratio paid by an investor is the net expense ratio (the total annual fund operating expenses after fee waivers) as stated in the prospectuses. |
| 3 | Historical performance shown for the Class R6 shares prior to their inception reflects the performance of the Administrator Class shares, and is not adjusted to reflect the Class R6 expenses. If these expenses had been included, returns for the Class R6 shares would be higher. |
| 4 | Historical performance shown for the Institutional Class shares prior to their inception reflects the performance of the Administrator Class shares, and includes the higher expenses applicable to the Administrator Class shares. If these expenses had not been included, returns for the Institutional Class shares would be higher. |
| 5 | The Bloomberg U.S. Treasury Inflation-Protected Securities (TIPS) Index is an index of inflation-indexed-linked U.S. Treasury securities. You cannot invest directly in an index. |
| * | The Fund is a feeder fund in a master-feeder structure that invests substantially all of its assets in a single affiliated master portfolio of the Allspring Master Trust with a substantially identical investment objective and substantially similar investment strategies. References to the investment activities of the Fund are intended to refer to the investment activities of the affiliated master portfolio in which it invests. |
| ‡ | CFA® and Chartered Financial Analyst® are trademarks owned by CFA Institute. |
| # | Mr. Keshemberg became a portfolio manager of the Fund on March 24, 2022. |
| † | Michal Stanczyk became a portfolio manager of the Fund on June 30, 2021. |
6 | Allspring Real Return Fund
Performance highlights (unaudited)
Growth of $10,000 investment as of May 31, 20221
| 1 | The chart compares the performance of Class A shares for the most recent ten years with the Bloomberg U.S. TIPS Index and CPI. The chart assumes a hypothetical investment of $10,000 in Class A shares and reflects all operating expenses and assumes the maximum initial sales charge of 4.50%. |
| 6 | The Consumer Price Index (CPI) for All Urban Consumers in U.S. All Items is published monthly by the U.S. government as an indicator of changes in price levels (or inflation) paid by urban consumers for a representative basket of goods and services. You cannot invest directly in an index. |
Bond values fluctuate in response to the financial condition of individual issuers, general market and economic conditions, and changes in interest rates. Changes in market conditions and government policies may lead to periods of heightened volatility in the bond market and reduced liquidity for certain bonds held by the Fund. In general, when interest rates rise, bond values fall and investors may lose principal value. Interest rate changes and their impact on the Fund and its share price can be sudden and unpredictable. Stock values fluctuate in response to the activities of individual companies and general market and economic conditions. High-yield securities have a greater risk of default and tend to be more volatile than higher-rated debt securities. Loans are subject to risks similar to those associated with other below-investment-grade bond investments, such as credit risk (for example, risk of issuer default), below-investment-grade bond risk (for example, risk of greater volatility in value), and risk that the loan may become illiquid or difficult to price. The use of derivatives may reduce returns and/or increase volatility. Foreign investments are especially volatile and can rise or fall dramatically due to differences in the political and economic conditions of the host country. These risks are generally intensified in emerging markets. Securities issued by U.S. government agencies or government-sponsored entities may not be guaranteed by the U.S. Treasury. This fund is exposed to mortgage- and asset-backed securities risk and small-company securities risk. Consult the Fund’s prospectus for additional information on these and other risks.
Allspring Real Return Fund | 7
Performance highlights (unaudited)
MANAGER'S DISCUSSION
Fund highlights
| ■ | The Fund outperformed its benchmark, the Bloomberg U.S. Treasury Inflation-Protected Securities (TIPS) Index, for the 12-month period that ended May 31, 2022. |
| ■ | Strong performance from real estate investment trusts (REITs) and inflation-sensitive common stocks had the largest positive impact on relative performance. |
| ■ | Poor absolute performance from the common stocks within the precious metals portfolio was the largest detractor from relative performance. |
Strong economic growth was followed by rapidly increasing inflation and uncertainty. Both stocks and bonds decreased in value over the period, although inflation-sensitive assets did better on a relative basis.
The 12-month period that ended May 31, 2022, saw weak results from the broad U.S. equity markets, as illustrated by the Russell 3000® Index* return of -3.68%. The broad foreign markets did worse, as reflected by the MSCI ACWI ex USA Index (Net)** return of -12.41%. Inflation-sensitive sectors such as energy and REITs outperformed the broad market. The broad U.S. fixed income market, as represented by the Bloomberg U.S. Aggregate Bond Index***, returned -8.22%. Although negative in absolute terms, here, too, inflation-sensitive bonds outperformed the broad market, as represented by the Bloomberg U.S. TIPS Index return of -1.45%. Commodity prices increased in the face of higher inflation, and the Bloomberg Commodity Index† advanced 41.85%.
No material changes
There were no material changes in the portfolio over the trailing 12 months.
| Ten largest holdings (%) as of May 31, 20221 |
| TIPS, 0.63%, 1-15-2024 | 4.31 |
| TIPS, 0.13%, 1-15-2032 | 2.80 |
| TIPS, 0.63%, 1-15-2026 | 2.68 |
| TIPS, 0.13%, 4-15-2026 | 2.67 |
| TIPS, 0.25%, 1-15-2025 | 2.24 |
| TIPS, 0.13%, 1-15-2031 | 2.05 |
| TIPS, 0.13%, 1-15-2030 | 2.02 |
| TIPS, 0.13%, 10-15-2024 | 1.84 |
| TIPS, 0.13%, 4-15-2025 | 1.84 |
| TIPS, 0.13%, 7-15-2030 | 1.83 |
| 1 | Each holding represents the Fund’s allocable portion of the affiliated master portfolio security. Figures represent each holding as a percentage of the Fund’s net assets. Holdings are subject to change and may have changed since the date specified. |
The Fund uses a multi-asset-class strategy to target inflation protection.
During the 12-month period, we maintained allocations to TIPS as well as other inflation-sensitive sectors, such as REITs, short-term high-yield bonds, and inflation-sensitive equities. We used this multi-asset-class strategy to target greater inflation protection and real returns than a traditional inflation-hedged strategy might while adhering to similar levels of volatility.
Relative to the broad TIPS benchmark, four of the five sleeves contributed to the relative performance of the Fund. The largest allocation within the Fund is our investment in TIPS. Due to some duration positioning, this sleeve
| * | The Russell 3000® Index measures the performance of the 3,000 largest U.S. companies based on total market capitalization, which represents approximately 98% of the investable U.S. equity market. You cannot invest directly in an index. |
| ** | The Morgan Stanley Capital International (MSCI) All Country World Index (ACWI) ex USA Index (Net) is a free-float-adjusted market-capitalization-weighted index that is designed to measure the equity market performance of developed and emerging markets, excluding the U.S. You cannot invest directly in an index. |
| *** | The Bloomberg U.S. Aggregate Bond Index is a broad-based benchmark that measures the investment-grade, U.S.-dollar-denominated, fixed-rate taxable bond market, including Treasuries, government-related and corporate securities, mortgage-backed securities (agency fixed-rate and hybrid adjustable-rate mortgage pass-throughs), asset-backed securities, and commercial mortgage-backed securities. You cannot invest directly in an index. |
| † | The Bloomberg Commodity Index (BCOM) provides broad-based exposure to commodities, and no single commodity or commodity sector dominates the index. Rather than being driven by micro-economic events affecting one commodity market or sector, the diversified commodity exposure of BCOM potentially reduces volatility in comparison with non-diversified commodity investments. You cannot invest directly in an index. |
8 | Allspring Real Return Fund
Performance highlights (unaudited)
outperformed the benchmark by about 10 basis points (bps; 100 bps equal 1.00%). The STEM (consumer staples, energy, and materials) sleeve had the largest positive impact on performance as it advanced more than 13% over the period. The precious metals mining stocks sleeve was the only detractor from relative performance. This sleeve posted a -16.15% return; as it represents only 1.3% of the portfolio, this detracted only 23 bps from relative performance.
| Portfolio allocation as of May 31, 20221 |
| 1 | Figures represent the portfolio allocation of the affiliated master portfolio as a percentage of the long-term investments of the affiliated master portfolio. These amounts are subject to change and may have changed since the date specified. |
Looking ahead, we are guarded.
At this time last year, we held an outlook we classified as “guardedly optimistic” as the massive amount of uncertainty we faced in 2020 had faded. Uncertainty is back and today our look is guarded. Along with the financial markets, we are digesting a great deal of data related to central bank tightening, geopolitical concerns, the war in Ukraine, and deteriorating consumer sentiment. Our base case doesn’t foresee a major geopolitical spillover from the Russia-Ukraine war, but we expect to see continued price increases for energy and some agricultural commodities. We suspect that the supply chain bottleneck issues within the U.S. will improve, which will help economic growth stay at or return to positive levels. We see the U.S. Federal Reserve (Fed) raising rates by another 50 bps in June, but future rate hikes will be dependent upon the data. While inflation is at 40-year-high levels, the Fed shifted from being super-hawkish to something more moderate. Members of the Federal Open Market Committee will continue to focus on inflation, but we think they are concerned about overreacting. Along with the Fed, we will continue to monitor the data and make adjustments to the portfolio as needed. While the picture is not particularly clear for the economy and the broad financial markets, we believe the Fund is well positioned in the current environment.
Allspring Real Return Fund | 9
Fund expenses (unaudited)
As a shareholder of the Fund, you incur two types of costs: (1) transaction costs, including sales charges (loads) on purchase payments and contingent deferred sales charges (if any) on redemptions and (2) ongoing costs, including management fees, distribution (12b-1) and/or shareholder servicing fees, and other Fund expenses. This example is intended to help you understand your ongoing costs (in dollars) of investing in the Fund and to compare these costs with the ongoing costs of investing in other mutual funds.
The example is based on an investment of $1,000 invested at the beginning of the six-month period and held for the entire period from December 1, 2021 to May 31, 2022.
Actual expenses
The “Actual” line of the table below provides information about actual account values and actual expenses. You may use the information in this line, together with the amount you invested, to estimate the expenses that you paid over the period. Simply divide your account value by $1,000 (for example, an $8,600 account value divided by $1,000 = 8.6), then multiply the result by the number in the “Actual” line under the heading entitled “Expenses paid during period” for your applicable class of shares to estimate the expenses you paid on your account during this period.
Hypothetical example for comparison purposes
The “Hypothetical” line of the table below provides information about hypothetical account values and hypothetical expenses based on the Fund’s actual expense ratio and an assumed rate of return of 5% per year before expenses, which is not the Fund’s actual return. The hypothetical account values and expenses may not be used to estimate the actual ending account balance or expenses you paid for the period. You may use this information to compare the ongoing costs of investing in the Fund and other funds. To do so, compare this 5% hypothetical example with the 5% hypothetical examples that appear in the shareholder reports of the other funds.
Please note that the expenses shown in the table are meant to highlight your ongoing costs only and do not reflect any transactional costs, such as sales charges (loads) and contingent deferred sales charges. Therefore, the “Hypothetical” line of the table is useful in comparing ongoing costs only, and will not help you determine the relative total costs of owning different funds. In addition, if these transactional costs were included, your costs would have been higher.
| | Beginning
account value
12-1-2021 | Ending
account value
5-31-2022 | Expenses
paid during
the period1,2 | Annualized net
expense ratio2 |
| Class A | | | | |
| Actual | $1,000.00 | $ 959.83 | $3.81 | 0.78% |
| Hypothetical (5% return before expenses) | $1,000.00 | $1,021.04 | $3.93 | 0.78% |
| Class C | | | | |
| Actual | $1,000.00 | $ 957.31 | $7.47 | 1.53% |
| Hypothetical (5% return before expenses) | $1,000.00 | $1,017.30 | $7.70 | 1.53% |
| Class R6 | | | | |
| Actual | $1,000.00 | $ 962.02 | $1.96 | 0.40% |
| Hypothetical (5% return before expenses) | $1,000.00 | $1,022.94 | $2.02 | 0.40% |
| Administrator Class | | | | |
| Actual | $1,000.00 | $ 960.83 | $2.93 | 0.60% |
| Hypothetical (5% return before expenses) | $1,000.00 | $1,021.94 | $3.02 | 0.60% |
| Institutional Class | | | | |
| Actual | $1,000.00 | $ 961.80 | $2.20 | 0.45% |
| Hypothetical (5% return before expenses) | $1,000.00 | $1,022.69 | $2.27 | 0.45% |
1 Expenses paid is equal to the annualized net expense ratio of each class multiplied by the average account value over the period, multiplied by 182 divided by 366 (to reflect the one-half-year period).
2 Amounts reflect net expenses allocated from the affiliated Master Portfolio in which the Fund invests.
10 | Allspring Real Return Fund
Portfolio of investments—May 31, 2022
| | | | | | Value |
| Investment companies: 100.06% | | | | | |
| Affiliated master portfolio: 100.06% | | | | | |
| Allspring Real Return Portfolio | | | | | $ 92,824,953 |
| Total Investment companies (Cost $91,230,231) | | | | | 92,824,953 |
| Total investments in securities (Cost $91,230,231) | 100.06% | | | | 92,824,953 |
| Other assets and liabilities, net | (0.06) | | | | (58,628) |
| Total net assets | 100.00% | | | | $92,766,325 |
Transactions with the affiliated Master Portfolio were as follows:
| | % of
ownership,
beginning
of period | % of
ownership,
end of
period | Net realized
gains
(losses) on
securities
transactions
allocated
from
affiliated
Master
Portfolio | Net
change in
unrealized
gains
(losses) on
securities
transactions
allocated
from
affiliated
Master
Portfolio | Interest
allocated
from
affiliated
Master
Portfolio | Dividends
allocated
from
affiliated
Master
Portfolio | Affiliated
income
allocated
from
affiliated
Master
Portfolio | Value,
end of
period | |
| Allspring Real Return Portfolio | 31.19% | 40.08% | $935,582 | $(6,398,528) | $4,284,787 | $222,646 | $1,267 | $92,824,953 | |
The accompanying notes are an integral part of these financial statements.
Allspring Real Return Fund | 11
Statement of assets and liabilities—May 31, 2022
| | |
| Assets | |
Investments in affiliated Master Portfolio, at value (cost $91,230,231)
| $ 92,824,953 |
Receivable for Fund shares sold
| 524,413 |
Receivable from manager
| 25,665 |
Prepaid expenses and other assets
| 34,313 |
Total assets
| 93,409,344 |
| Liabilities | |
Payable for Fund shares redeemed
| 613,205 |
Administration fees payable
| 7,278 |
Trustees’ fees and expenses payable
| 1,206 |
Distribution fee payable
| 1,135 |
Accrued expenses and other liabilities
| 20,195 |
Total liabilities
| 643,019 |
Total net assets
| $92,766,325 |
| Net assets consist of | |
Paid-in capital
| $ 91,521,115 |
Total distributable earnings
| 1,245,210 |
Total net assets
| $92,766,325 |
| Computation of net asset value and offering price per share | |
Net assets – Class A
| $ 17,712,522 |
Shares outstanding – Class A1
| 1,711,131 |
Net asset value per share – Class A
| $10.35 |
Maximum offering price per share – Class A2
| $10.84 |
Net assets – Class C
| $ 1,708,626 |
Shares outstanding – Class C1
| 168,202 |
Net asset value per share – Class C
| $10.16 |
Net assets – Class R6
| $ 14,282,015 |
Shares outstanding – Class R61
| 1,363,951 |
Net asset value per share – Class R6
| $10.47 |
Net assets – Administrator Class
| $ 15,266,781 |
Shares outstanding – Administrator Class1
| 1,446,712 |
Net asset value per share – Administrator Class
| $10.55 |
Net assets – Institutional Class
| $ 43,796,381 |
Shares outstanding – Institutional Class1
| 4,183,259 |
Net asset value per share – Institutional Class
| $10.47 |
| 1 | The Fund has an unlimited number of authorized shares. |
| 2 | Maximum offering price is computed as 100/95.50 of net asset value. On investments of $50,000 or more, the offering price is reduced. |
The accompanying notes are an integral part of these financial statements.
12 | Allspring Real Return Fund
Statement of operations—year ended May 31, 2022
| | |
| Investment income | |
Interest allocated from affiliated Master Portfolio
| $ 4,284,787 |
Dividends allocated from affiliated Master Portfolio (net of foreign withholding taxes of $2,475)
| 222,646 |
Affiliated income allocated from affiliated Master Portfolio
| 1,267 |
Expenses allocated from affiliated Master Portfolio
| (358,052) |
Waivers allocated from affiliated Master Portfolio
| 69,281 |
Total investment income
| 4,219,929 |
| Expenses | |
Management fee
| 37,101 |
| Administration fees | |
Class A
| 27,033 |
Class C
| 2,486 |
Class R6
| 4,357 |
Administrator Class
| 13,045 |
Institutional Class
| 22,549 |
| Shareholder servicing fees | |
Class A
| 42,213 |
Class C
| 3,872 |
Administrator Class
| 31,217 |
| Distribution fee | |
Class C
| 11,618 |
Custody and accounting fees
| 2,977 |
Professional fees
| 47,578 |
Registration fees
| 32,326 |
Shareholder report expenses
| 48,275 |
Trustees’ fees and expenses
| 20,688 |
Other fees and expenses
| 8,456 |
Total expenses
| 355,791 |
| Less: Fee waivers and/or expense reimbursements | |
Fund-level
| (207,452) |
Class A
| (1,690) |
Administrator Class
| (14,349) |
Institutional Class
| (2,819) |
Net expenses
| 129,481 |
Net investment income
| 4,090,448 |
| Realized and unrealized gains (losses) on investments | |
Net realized gains on securities transactions allocated from affiliated Master Portfolio
| 935,582 |
Net change in unrealized gains (losses) on securities transactions allocated from affiliated Master Portfolio
| (6,398,528) |
Net realized and unrealized gains (losses) on investments
| (5,462,946) |
Net decrease in net assets resulting from operations
| $(1,372,498) |
The accompanying notes are an integral part of these financial statements.
Allspring Real Return Fund | 13
Statement of changes in net assets
| | | | | |
| | Year ended
May 31, 2022 | Year ended
May 31, 2021 |
| Operations | | | | |
Net investment income
| | $ 4,090,448 | | $ 1,568,068 |
Net realized gains on investments
| | 935,582 | | 277,416 |
Net change in unrealized gains (losses) on investments
| | (6,398,528) | | 3,967,421 |
Net increase (decrease) in net assets resulting from operations
| | (1,372,498) | | 5,812,905 |
| Distributions to shareholders from | | | | |
| Net investment income and net realized gains | | | | |
Class A
| | (836,596) | | (268,219) |
Class C
| | (65,210) | | (19,136) |
Class R6
| | (755,640) | | (676,727) |
Administrator Class
| | (640,606) | | (261,977) |
Institutional Class
| | (1,520,901) | | (233,102) |
Total distributions to shareholders
| | (3,818,953) | | (1,459,161) |
| Capital share transactions | Shares | | Shares | |
| Proceeds from shares sold | | | | |
Class A
| 791,258 | 8,668,328 | 476,116 | 5,061,849 |
Class C
| 91,579 | 986,457 | 26,515 | 273,931 |
Class R6
| 486,424 | 5,304,807 | 2,143,575 | 23,199,949 |
Administrator Class
| 894,909 | 9,920,837 | 574,541 | 6,217,286 |
Institutional Class
| 4,023,778 | 44,177,808 | 358,193 | 3,851,836 |
| | | 69,058,237 | | 38,604,851 |
| Reinvestment of distributions | | | | |
Class A
| 63,937 | 691,464 | 18,861 | 202,368 |
Class C
| 6,087 | 64,531 | 1,759 | 18,532 |
Class R6
| 60,586 | 663,004 | 28,247 | 306,213 |
Administrator Class
| 55,532 | 610,960 | 23,163 | 252,526 |
Institutional Class
| 139,813 | 1,520,105 | 21,437 | 232,476 |
| | | 3,550,064 | | 1,012,115 |
| Payment for shares redeemed | | | | |
Class A
| (408,579) | (4,414,389) | (521,552) | (5,567,275) |
Class C
| (40,714) | (429,356) | (87,496) | (914,008) |
Class R6
| (2,460,305) | (27,125,717) | (659,480) | (7,182,858) |
Administrator Class
| (691,012) | (7,672,910) | (715,288) | (7,756,050) |
Institutional Class
| (956,389) | (10,220,364) | (428,493) | (4,604,300) |
| | | (49,862,736) | | (26,024,491) |
Net increase in net assets resulting from capital share transactions
| | 22,745,565 | | 13,592,475 |
Total increase in net assets
| | 17,554,114 | | 17,946,219 |
| Net assets | | | | |
Beginning of period
| | 75,212,211 | | 57,265,992 |
End of period
| | $ 92,766,325 | | $ 75,212,211 |
The accompanying notes are an integral part of these financial statements.
14 | Allspring Real Return Fund
Financial highlights
(For a share outstanding throughout each period)
| | Year ended May 31 |
| Class A | 2022 | 2021 | 2020 | 2019 | 2018 |
Net asset value, beginning of period
| $10.93 | $10.22 | $9.89 | $9.87 | $9.96 |
Net investment income
| 0.56 1 | 0.22 | 0.12 | 0.15 | 0.21 |
Net realized and unrealized gains (losses) on investments
| (0.60) | 0.70 | 0.42 | 0.09 | (0.09) |
Total from investment operations
| (0.04) | 0.92 | 0.54 | 0.24 | 0.12 |
| Distributions to shareholders from | | | | | |
Net investment income
| (0.54) | (0.21) | (0.21) | (0.19) | (0.21) |
Net realized gains
| 0.00 | 0.00 | 0.00 | (0.03) | 0.00 |
Total distributions to shareholders
| (0.54) | (0.21) | (0.21) | (0.22) | (0.21) |
Net asset value, end of period
| $10.35 | $10.93 | $10.22 | $9.89 | $9.87 |
Total return2
| (0.52)% | 9.10% | 5.48% | 2.56% | 1.25% |
| Ratios to average net assets (annualized)* | | | | | |
Gross expenses
| 1.07% | 1.29% | 1.43% | 1.16% | 1.04% |
Net expenses
| 0.78% | 0.78% | 0.78% | 0.77% | 0.80% |
Net investment income
| 5.13% | 2.09% | 1.79% | 1.95% | 2.15% |
| Supplemental data | | | | | |
Portfolio turnover rate3
| 31% | 20% | 24% | 39% | 29% |
Net assets, end of period (000s omitted)
| $17,713 | $13,825 | $13,196 | $17,716 | $26,133 |
| * | Ratios include net expenses allocated from the affiliated Master Portfolio which were as follows: |
| Year ended May 31, 2022 | 0.39% |
| Year ended May 31, 2021 | 0.39% |
| Year ended May 31, 2020 | 0.39% |
| Year ended May 31, 2019 | 0.39% |
| Year ended May 31, 2018 | 0.41% |
| 1 | Calculated based upon average shares outstanding |
| 2 | Total return calculations do not include any sales charges. |
| 3 | Portfolio turnover rate is calculated by multiplying the affiliated Master Portfolio’s percentage of the Fund’s total investment in securities at the end of the period by the affiliated Master Portfolio’s portfolio turnover rate. |
The accompanying notes are an integral part of these financial statements.
Allspring Real Return Fund | 15
Financial highlights
(For a share outstanding throughout each period)
| | Year ended May 31 |
| Class C | 2022 | 2021 | 2020 | 2019 | 2018 |
Net asset value, beginning of period
| $10.74 | $10.06 | $9.73 | $9.73 | $9.82 |
Net investment income
| 0.47 1 | 0.12 1 | 0.11 1 | 0.10 1 | 0.03 |
Net realized and unrealized gains (losses) on investments
| (0.59) | 0.71 | 0.35 | 0.07 | 0.02 |
Total from investment operations
| (0.12) | 0.83 | 0.46 | 0.17 | 0.05 |
| Distributions to shareholders from | | | | | |
Net investment income
| (0.46) | (0.15) | (0.13) | (0.14) | (0.14) |
Net realized gains
| 0.00 | 0.00 | 0.00 | (0.03) | 0.00 |
Total distributions to shareholders
| (0.46) | (0.15) | (0.13) | (0.17) | (0.14) |
Net asset value, end of period
| $10.16 | $10.74 | $10.06 | $9.73 | $9.73 |
Total return2
| (1.26)% | 8.27% | 4.77% | 1.79% | 0.53% |
| Ratios to average net assets (annualized)* | | | | | |
Gross expenses
| 1.81% | 2.06% | 2.18% | 1.91% | 1.79% |
Net expenses
| 1.53% | 1.53% | 1.53% | 1.52% | 1.56% |
Net investment income
| 4.42% | 1.17% | 1.09% | 1.08% | 1.39% |
| Supplemental data | | | | | |
Portfolio turnover rate3
| 31% | 20% | 24% | 39% | 29% |
Net assets, end of period (000s omitted)
| $1,709 | $1,195 | $1,714 | $2,553 | $3,517 |
| * | Ratios include net expenses allocated from the affiliated Master Portfolio which were as follows: |
| Year ended May 31, 2022 | 0.39% |
| Year ended May 31, 2021 | 0.39% |
| Year ended May 31, 2020 | 0.39% |
| Year ended May 31, 2019 | 0.39% |
| Year ended May 31, 2018 | 0.41% |
| 1 | Calculated based upon average shares outstanding |
| 2 | Total return calculations do not include any sales charges. |
| 3 | Portfolio turnover rate is calculated by multiplying the affiliated Master Portfolio’s percentage of the Fund’s total investment in securities at the end of the period by the affiliated Master Portfolio’s portfolio turnover rate. |
The accompanying notes are an integral part of these financial statements.
16 | Allspring Real Return Fund
Financial highlights
(For a share outstanding throughout each period)
| | Year ended May 31 |
| Class R6 | 2022 | 2021 | 2020 | 2019 | 2018 |
Net asset value, beginning of period
| $11.05 | $10.33 | $9.99 | $9.96 | $10.05 |
Net investment income
| 0.63 1 | 0.29 | 0.22 | 0.23 1 | 0.22 |
Net realized and unrealized gains (losses) on investments
| (0.63) | 0.69 | 0.37 | 0.06 | (0.06) |
Total from investment operations
| 0.00 | 0.98 | 0.59 | 0.29 | 0.16 |
| Distributions to shareholders from | | | | | |
Net investment income
| (0.58) | (0.26) | (0.25) | (0.23) | (0.25) |
Net realized gains
| 0.00 | 0.00 | 0.00 | (0.03) | 0.00 |
Total distributions to shareholders
| (0.58) | (0.26) | (0.25) | (0.26) | (0.25) |
Net asset value, end of period
| $10.47 | $11.05 | $10.33 | $9.99 | $9.96 |
Total return
| (0.15)% | 9.52% | 5.94% | 2.99% | 1.63% |
| Ratios to average net assets (annualized)* | | | | | |
Gross expenses
| 0.68% | 0.85% | 1.05% | 0.82% | 0.66% |
Net expenses
| 0.40% | 0.40% | 0.40% | 0.39% | 0.42% |
Net investment income
| 5.68% | 2.70% | 2.08% | 2.34% | 2.52% |
| Supplemental data | | | | | |
Portfolio turnover rate2
| 31% | 20% | 24% | 39% | 29% |
Net assets, end of period (000s omitted)
| $14,282 | $36,202 | $18,224 | $14,358 | $11,750 |
| * | Ratios include net expenses allocated from the affiliated Master Portfolio which were as follows: |
| Year ended May 31, 2022 | 0.39% |
| Year ended May 31, 2021 | 0.39% |
| Year ended May 31, 2020 | 0.39% |
| Year ended May 31, 2019 | 0.39% |
| Year ended May 31, 2018 | 0.41% |
| 1 | Calculated based upon average shares outstanding |
| 2 | Portfolio turnover rate is calculated by multiplying the affiliated Master Portfolio’s percentage of the Fund’s total investment in securities at the end of the period by the affiliated Master Portfolio’s portfolio turnover rate. |
The accompanying notes are an integral part of these financial statements.
Allspring Real Return Fund | 17
Financial highlights
(For a share outstanding throughout each period)
| | Year ended May 31 |
| Administrator Class | 2022 | 2021 | 2020 | 2019 | 2018 |
Net asset value, beginning of period
| $11.12 | $10.38 | $10.03 | $9.99 | $10.06 |
Net investment income
| 0.60 1 | 0.25 1 | 0.20 1 | 0.21 1 | 0.24 1 |
Net realized and unrealized gains (losses) on investments
| (0.63) | 0.71 | 0.36 | 0.06 | (0.09) |
Total from investment operations
| (0.03) | 0.96 | 0.56 | 0.27 | 0.15 |
| Distributions to shareholders from | | | | | |
Net investment income
| (0.54) | (0.22) | (0.21) | (0.20) | (0.22) |
Net realized gains
| 0.00 | 0.00 | 0.00 | (0.03) | 0.00 |
Total distributions to shareholders
| (0.54) | (0.22) | (0.21) | (0.23) | (0.22) |
Net asset value, end of period
| $10.55 | $11.12 | $10.38 | $10.03 | $9.99 |
Total return
| (0.36)% | 9.31% | 5.67% | 2.78% | 1.50% |
| Ratios to average net assets (annualized)* | | | | | |
Gross expenses
| 0.99% | 1.23% | 1.37% | 1.10% | 0.97% |
Net expenses
| 0.60% | 0.60% | 0.60% | 0.59% | 0.60% |
Net investment income
| 5.42% | 2.26% | 1.92% | 2.15% | 2.39% |
| Supplemental data | | | | | |
Portfolio turnover rate2
| 31% | 20% | 24% | 39% | 29% |
Net assets, end of period (000s omitted)
| $15,267 | $13,203 | $13,544 | $13,562 | $23,331 |
| * | Ratios include net expenses allocated from the affiliated Master Portfolio which were as follows: |
| Year ended May 31, 2022 | 0.39% |
| Year ended May 31, 2021 | 0.39% |
| Year ended May 31, 2020 | 0.39% |
| Year ended May 31, 2019 | 0.39% |
| Year ended May 31, 2018 | 0.41% |
| 1 | Calculated based upon average shares outstanding |
| 2 | Portfolio turnover rate is calculated by multiplying the affiliated Master Portfolio’s percentage of the Fund’s total investment in securities at the end of the period by the affiliated Master Portfolio’s portfolio turnover rate. |
The accompanying notes are an integral part of these financial statements.
18 | Allspring Real Return Fund
Financial highlights
(For a share outstanding throughout each period)
| | Year ended May 31 |
| Institutional Class | 2022 | 2021 | 2020 | 2019 | 2018 |
Net asset value, beginning of period
| $11.05 | $10.33 | $9.99 | $9.97 | $10.06 |
Net investment income
| 0.63 1 | 0.26 | 0.21 | 0.22 | 0.24 |
Net realized and unrealized gains (losses) on investments
| (0.64) | 0.71 | 0.37 | 0.05 | (0.08) |
Total from investment operations
| (0.01) | 0.97 | 0.58 | 0.27 | 0.16 |
| Distributions to shareholders from | | | | | |
Net investment income
| (0.57) | (0.25) | (0.24) | (0.22) | (0.25) |
Net realized gains
| 0.00 | 0.00 | 0.00 | (0.03) | 0.00 |
Total distributions to shareholders
| (0.57) | (0.25) | (0.24) | (0.25) | (0.25) |
Net asset value, end of period
| $10.47 | $11.05 | $10.33 | $9.99 | $9.97 |
Total return
| (0.19)% | 9.46% | 5.88% | 2.84% | 1.57% |
| Ratios to average net assets (annualized)* | | | | | |
Gross expenses
| 0.74% | 0.95% | 1.10% | 0.84% | 0.71% |
Net expenses
| 0.45% | 0.45% | 0.45% | 0.44% | 0.47% |
Net investment income
| 5.76% | 2.37% | 2.09% | 2.20% | 2.62% |
| Supplemental data | | | | | |
Portfolio turnover rate2
| 31% | 20% | 24% | 39% | 29% |
Net assets, end of period (000s omitted)
| $43,796 | $10,787 | $10,587 | $11,094 | $12,110 |
| * | Ratios include net expenses allocated from the affiliated Master Portfolio which were as follows: |
| Year ended May 31, 2022 | 0.39% |
| Year ended May 31, 2021 | 0.39% |
| Year ended May 31, 2020 | 0.39% |
| Year ended May 31, 2019 | 0.39% |
| Year ended May 31, 2018 | 0.41% |
| 1 | Calculated based upon average shares outstanding |
| 2 | Portfolio turnover rate is calculated by multiplying the affiliated Master Portfolio’s percentage of the Fund’s total investment in securities at the end of the period by the affiliated Master Portfolio’s portfolio turnover rate. |
The accompanying notes are an integral part of these financial statements.
Allspring Real Return Fund | 19
Notes to financial statements
1. ORGANIZATION
Allspring Funds Trust (the "Trust"), a Delaware statutory trust organized on March 10, 1999, is an open-end management investment company registered under the Investment Company Act of 1940, as amended (the "1940 Act"). As an investment company, the Trust follows the accounting and reporting guidance in Financial Accounting Standards Board ("FASB") Accounting Standards Codification Topic 946, Financial Services – Investment Companies. These financial statements report on the Allspring Real Return Fund (the "Fund") which is a diversified series of the Trust.
The Fund is a feeder fund in a master-feeder structure that invests substantially all of its assets in a single master portfolio with a substantially identical investment objective and substantially similar investment strategies. The Fund invests in Allspring Real Return Portfolio, a separate diversified portfolio (the “affiliated Master Portfolio”) of Allspring Master Trust, a registered open-end management investment company. As of May 31, 2022, the Fund owned 40.08% of Allspring Real Return Portfolio. The affiliated Master Portfolio directly acquires portfolio securities and the Fund acquires an indirect interest in those securities. The Fund accounts for its investment in the affiliated Master Portfolio as a partnership investment and records on a daily basis its share of the affiliated Master Portfolio’s income, expense and realized and unrealized gains and losses. The financial statements of the affiliated Master Portfolio for the year ended May 31, 2022 are included in this report and should be read in conjunction with the Fund’s financial statements.
Effective on November 1, 2021, the sale transaction of Wells Fargo Asset Management ("WFAM") by Wells Fargo & Company to GTCR LLC and Reverence Capital Partners, L.P. was closed. In connection with the closing of the transaction, WFAM became known as Allspring Global Investments (“Allspring”) and various entities that provided services to the Fund changed their names to "Allspring", including Allspring Funds Management, LLC, the investment manager to the Fund, Allspring Global Investments, LLC and Allspring Global Investments (UK) Limited, both registered investment advisers providing subadvisory services to certain funds, and Allspring Funds Distributor, LLC, the Fund's principal underwriter. Consummation of the transaction resulted in a new investment management agreement and subadvisory agreement which became effective on November 1, 2021.
2. SIGNIFICANT ACCOUNTING POLICIES
The following significant accounting policies, which are consistently followed in the preparation of the financial statements of the Fund, are in conformity with U.S. generally accepted accounting principles which require management to make estimates and assumptions that affect the reported amounts of assets and liabilities, disclosure of contingent assets and liabilities at the date of the financial statements, and the reported amounts of income and expenses during the reporting period. Actual results could differ from those estimates.
Securities valuation
All investments are valued each business day as of the close of regular trading on the New York Stock Exchange (generally 4 p.m. Eastern Time), although the Fund may deviate from this calculation time under unusual or unexpected circumstances.
Investments in the affiliated Master Portfolio are valued daily based on the Fund’s proportionate share of the affiliated Master Portfolio’s net assets, which are also valued daily. Securities held in the affiliated Master Portfolio are valued as discussed in the Notes to Financial Statements of the affiliated Master Portfolio, which are included elsewhere in this report.
Investments which are not valued using the method discussed above are valued at their fair value, as determined in good faith by the Board of Trustees. The Board of Trustees has established a Valuation Committee comprised of the Trustees and has delegated to it the authority to take any actions regarding the valuation of portfolio securities that the Valuation Committee deems necessary or appropriate, including determining the fair value of portfolio securities, unless the determination has been delegated to the Allspring Global Investments Pricing Committee at Allspring Funds Management, LLC ("Allspring Funds Management"). The Board of Trustees retains the authority to make or ratify any valuation decisions or approve any changes to the Valuation Procedures as it deems appropriate. On a quarterly basis, the Board of Trustees receives reports on any valuation actions taken by the Valuation Committee or the Allspring Global Investments Pricing Committee which may include items for ratification.
Investment transactions, income and expenses
Investments in the affiliated Master Portfolio are recorded on a trade date basis. The Fund records daily its proportionate share of the affiliated Master Portfolio’s income, expenses and realized and unrealized gains or losses. The Fund also accrues its own expenses.
20 | Allspring Real Return Fund
Notes to financial statements
Distributions to shareholders
Distributions to shareholders are recorded on the ex-dividend date and paid from net investment income monthly and any net realized gains are paid at least annually. Such distributions are determined in accordance with income tax regulations and may differ from U.S. generally accepted accounting principles. Dividend sources are estimated at the time of declaration. The tax character of distributions is determined as of the Fund's fiscal year end. Therefore, a portion of the Fund's distributions made prior to the Fund’s fiscal year end may be categorized as a tax return of capital at year end.
Federal and other taxes
The Fund intends to continue to qualify as a regulated investment company by distributing substantially all of its investment company taxable income and any net realized capital gains (after reduction for capital loss carryforwards) sufficient to relieve it from all, or substantially all, federal income taxes. Accordingly, no provision for federal income taxes was required.
The Fund’s income and federal excise tax returns and all financial records supporting those returns for the prior three fiscal years are subject to examination by the federal and Delaware revenue authorities. Management has analyzed the Fund's tax positions taken on federal, state, and foreign tax returns, as applicable, for all open tax years and does not believe that there are any uncertain tax positions that require recognition of a tax liability.
As of May 31, 2022, the aggregate cost of all investments for federal income tax purposes was $91,333,545 and the unrealized gains (losses) consisted of:
| Gross unrealized gains | $1,491,408 |
| Gross unrealized losses | 0 |
| Net unrealized gains | $1,491,408 |
Reclassifications are made to the Fund’s capital accounts for permanent tax differences to reflect income and gains available for distribution (or available capital loss carryforwards) under federal income tax regulations. U.S. generally accepted accounting principles require that certain components of net assets be adjusted to reflect permanent differences between financial and tax reporting. These reclassifications have no effect on net assets or net asset values per share. At May 31, 2022, as a result of permanent book-to-tax differences, the following reclassification adjustments were made on the Statement of Assets and Liabilities:
| Paid-in capital | Total distributable
earnings |
| $(33,676) | $33,676 |
As of May 31, 2022, the Fund had capital loss carryforwards which consisted of $740,836 in short-term capital losses.
Class allocations
The separate classes of shares offered by the Fund differ principally in applicable sales charges, distribution, shareholder servicing, and administration fees. Class specific expenses are charged directly to that share class. Investment income, common fund-level expenses, and realized and unrealized gains (losses) on investments are allocated daily to each class of shares based on the relative proportion of net assets of each class.
3. FAIR VALUATION MEASUREMENTS
At May 31, 2022, the Fund’s investment in the affiliated Master Portfolio was measured at fair value using the net asset value per share (or its equivalent) as a practical expedient. The investment objective and fair value of the affiliated Master Portfolio is as follows:
| Affiliated Master Portfolio | Investment objective | Fair value of affiliated
Master Portfolio |
| Allspring Real Return Portfolio | Seeks returns that exceed the rate of inflation over the long-term | $92,824,953 |
The affiliated Master Portfolio does not have a redemption period notice and can be redeemed daily. The affiliated Master Portfolio had unfunded commitments at May 31, 2022.
Allspring Real Return Fund | 21
Notes to financial statements
4. TRANSACTIONS WITH AFFILIATES
Management fee
Allspring Funds Management, a wholly owned subsidiary of Allspring Global Investments Holdings, LLC, a holding company indirectly owned by certain private funds of GTCR LLC and Reverence Capital Partners, L.P., is the manager of the Fund and provides advisory and fund-level administrative services under an investment management agreement. Under the investment management agreement, Allspring Funds Management is responsible for, among other services, implementing the investment objectives and strategies of the Fund and providing fund-level administrative services in connection with the Fund’s operations. As long as the Fund continues to invest substantially all of its assets in a single affiliated Master Portfolio, the Fund pays Allspring Funds Management an investment management fee only for fund-level administrative services at the following annual rate based on the Fund’s average daily net assets:
| Average daily net assets | Management fee |
| First $5 billion | 0.050% |
| Next $5 billion | 0.040 |
| Over $10 billion | 0.030 |
For the year ended May 31, 2022, the management fee was equivalent to an annual rate of 0.05% of the Fund’s average daily net assets.
Allspring Funds Management also serves as the adviser to the affiliated Master Portfolio and is entitled to receive a fee from the affiliated Master Portfolio for those services.
Administration fees
Under a class-level administration agreement, Allspring Funds Management provides class-level administrative services to the Fund, which includes paying fees and expenses for services provided by the transfer agent, sub-transfer agents, omnibus account servicers and record-keepers. As compensation for its services under the class-level administration agreement, Allspring Funds Management receives an annual fee which is calculated based on the average daily net assets of each class as follows:
| | Class-level
administration fee |
| Class A | 0.16% |
| Class C | 0.16 |
| Class R6 | 0.03 |
| Administrator Class | 0.10 |
| Institutional Class | 0.08 |
Waivers and/or expense reimbursements
Allspring Funds Management has contractually committed to waive and/or reimburse management and administration fees to the extent necessary to maintain certain net operating expense ratios for the Fund. When each class of the Fund has exceeded its expense cap, Allspring Funds Management will waive fees and/or reimburse expenses from fund-level expenses on a proportionate basis and then from class specific expenses. When only certain classes exceed their expense caps, waivers and/or reimbursements are applied against class specific expenses before fund-level expenses. Net expenses from the affiliated Master Portfolio are included in the expense caps. Allspring Funds Management has contractually committed through September 30, 2022 to waive fees and/or reimburse expenses to the extent necessary to cap expenses. Prior to or after the commitment expiration date, the caps may be increased or the commitment to maintain the caps may be terminated only with the approval of the Board of Trustees. As of May 31, 2022, the contractual expense caps are as follows:
22 | Allspring Real Return Fund
Notes to financial statements
| | Expense ratio caps |
| Class A | 0.78% |
| Class C | 1.53 |
| Class R6 | 0.40 |
| Administrator Class | 0.60 |
| Institutional Class | 0.45 |
Distribution fee
The Trust has adopted a distribution plan for Class C shares pursuant to Rule 12b-1 under the 1940 Act. A distribution fee is charged to Class C shares and paid to Allspring Funds Distributor, LLC ("Allspring Funds Distributor"), the principal underwriter, an affiliate of Allspring Funds Management, at an annual rate of 0.75% of the average daily net assets of Class C shares.
In addition, Allspring Funds Distributor is entitled to receive the front-end sales charge from the purchase of Class A shares and a contingent deferred sales charge on the redemption of certain Class A shares. Allspring Funds Distributor is also entitled to receive the contingent deferred sales charges from redemptions of Class C shares. For the year ended May 31, 2022, Allspring Funds Distributor received $2,919 from the sale of Class A shares. No contingent deferred sales charges were incurred by Class A and Class C shares for the year ended May 31, 2022.
Shareholder servicing fees
The Trust has entered into contracts with one or more shareholder servicing agents, whereby Class A, Class C and Administrator Class are charged a fee at an annual rate of 0.25% of the average daily net assets of each respective class. A portion of these total shareholder servicing fees were paid to affiliates, and to certain entities that were affiliates of the Fund until November 1, 2021.
5. INVESTMENT PORTFOLIO TRANSACTIONS
The Fund seeks to achieve its investment objective by investing substantially all of its assets in the affiliated Master Portfolio. Purchases and sales have been calculated by multiplying the Fund's ownership percentage of the affiliated Master Portfolio at the end of the period by the affiliated Master Portfolio's purchases and sales. Purchases and sales of investments, excluding short-term securities, for the year ended May 31, 2022 were as follows:
| Purchases at cost | | Sales proceeds |
U.S.
government | Non-U.S.
government | | U.S.
government | Non-U.S.
government |
| $13,642,424 | $14,526,914 | | $13,986,042 | $14,346,241 |
6. BANK BORROWINGS
The Trust (excluding the money market funds), Allspring Master Trust and Allspring Variable Trust are parties to a $350,000,000 revolving credit agreement whereby the Fund is permitted to use bank borrowings for temporary or emergency purposes, such as to fund shareholder redemption requests. Interest under the credit agreement is charged to the Fund based on a borrowing rate equal to the higher of the Federal Funds rate in effect on that day plus 1.25% or the overnight bank funding rate in effect on that day plus 1.25%. In addition, an annual commitment fee equal to 0.25% of the unused balance is allocated to each participating fund.
For the year ended May 31, 2022, there were no borrowings by the Fund under the agreement.
7. DISTRIBUTIONS TO SHAREHOLDERS
The tax character of distributions paid was $3,818,953 and $1,459,161 of ordinary income for the years ended May 31, 2022 and May 31, 2021, respectively.
Allspring Real Return Fund | 23
Notes to financial statements
As of May 31, 2022, the components of distributable earnings on a tax basis were as follows:
Undistributed
ordinary
income | Unrealized
gains | Capital loss
carryforward |
| $494,638 | $1,491,408 | $(740,836) |
8. INDEMNIFICATION
Under the Fund's organizational documents, the officers and Trustees have been granted certain indemnification rights against certain liabilities that may arise out of performance of their duties to the Fund. The Fund has entered into a separate agreement with each Trustee that converts indemnification rights currently existing under the Fund’s organizational documents into contractual rights that cannot be changed in the future without the consent of the Trustee. Additionally, in the normal course of business, the Fund may enter into contracts with service providers that contain a variety of indemnification clauses. The Fund’s maximum exposure under these arrangements is dependent on future claims that may be made against the Fund and, therefore, cannot be estimated.
9. CORONAVIRUS (COVID-19) PANDEMIC
On March 11, 2020, the World Health Organization announced that it had made the assessment that coronavirus disease 2019 (“COVID-19”) is a pandemic. The impacts of COVID-19 are affecting the entire global economy, individual companies and investment products, the funds, and the market in general. There is significant uncertainty around the extent and duration of business disruptions related to COVID-19 and the impacts may last for an extended period of time. COVID-19 has led to significant uncertainty and volatility in the financial markets.
24 | Allspring Real Return Fund
Report of independent registered public accounting firm
To the Shareholders of the Fund and Board of Trustees
Allspring Funds Trust:
Opinion on the Financial Statements
We have audited the accompanying statement of assets and liabilities of Allspring Real Return Fund (formerly, Wells Fargo Real Return Fund) (the Fund), one of the funds constituting Allspring Funds Trust (formerly, Wells Fargo Funds Trust), including the portfolio of investments, as of May 31, 2022, the related statement of operations for the year then ended, the statements of changes in net assets for each of the years in the two-year period then ended, and the related notes (collectively, the financial statements) and the financial highlights for each of the years in the five-year period then ended. In our opinion, the financial statements and financial highlights present fairly, in all material respects, the financial position of the Fund as of May 31, 2022, the results of its operations for the year then ended, the changes in its net assets for each of the years in the two-year period then ended, and the financial highlights for each of the years in the five-year period then ended, in conformity with U.S. generally accepted accounting principles.
Basis for Opinion
These financial statements and financial highlights are the responsibility of the Fund’s management. Our responsibility is to express an opinion on these financial statements and financial highlights based on our audits. We are a public accounting firm registered with the Public Company Accounting Oversight Board (United States) (PCAOB) and are required to be independent with respect to the Fund in accordance with the U.S. federal securities laws and the applicable rules and regulations of the Securities and Exchange Commission and the PCAOB.
We conducted our audits in accordance with the standards of the PCAOB. Those standards require that we plan and perform the audit to obtain reasonable assurance about whether the financial statements and financial highlights are free of material misstatement, whether due to error or fraud. Our audits included performing procedures to assess the risks of material misstatement of the financial statements and financial highlights, whether due to error or fraud, and performing procedures that respond to those risks. Such procedures included examining, on a test basis, evidence regarding the amounts and disclosures in the financial statements and financial highlights. Such procedures also included confirmation of securities owned as of May 31, 2022, by correspondence with the transfer agent. Our audits also included evaluating the accounting principles used and significant estimates made by management, as well as evaluating the overall presentation of the financial statements and financial highlights. We believe that our audits provide a reasonable basis for our opinion.

We have not been able to determine the specific year that we began serving as the auditor of one or more Allspring Funds investment companies; however, we are aware that we have served as the auditor of one or more Allspring Funds investment companies since at least 1955.
Boston, Massachusetts
July 27, 2022
Allspring Real Return Fund | 25
Portfolio of investments—May 31, 2022
| | | | | Shares | Value |
| Common stocks: 15.89% | | | | | | |
| Consumer staples: 4.81% | | | | | | |
| Beverages: 0.77% | | | | | | |
| PepsiCo Incorporated | | | | | 10,613 | $ 1,780,331 |
| Food & staples retailing: 1.54% | | | | | | |
| Costco Wholesale Corporation | | | | | 2,814 | 1,311,943 |
| Sysco Corporation | | | | | 10,046 | 845,672 |
| Walmart Incorporated | | | | | 10,943 | 1,407,598 |
| | | | | | | 3,565,213 |
| Food products: 0.62% | | | | | | |
| Mondelez International Incorporated Class A | | | | | 13,629 | 866,259 |
| Nomad Foods Limited † | | | | | 26,842 | 560,193 |
| | | | | | | 1,426,452 |
| Household products: 1.65% | | | | | | |
| Church & Dwight Company Incorporated | | | | | 10,758 | 968,865 |
| The Clorox Company | | | | | 2,330 | 338,689 |
| The Procter & Gamble Company | | | | | 16,948 | 2,506,270 |
| | | | | | | 3,813,824 |
| Personal products: 0.11% | | | | | | |
| The Estee Lauder Companies Incorporated Class A | | | | | 1,044 | 265,855 |
| Tobacco: 0.12% | | | | | | |
| Philip Morris International Incorporated | | | | | 2,670 | 283,688 |
| Energy: 1.97% | | | | | | |
| Oil, gas & consumable fuels: 1.97% | | | | | | |
| Chevron Corporation | | | | | 15,879 | 2,773,426 |
| EOG Resources Incorporated | | | | | 1,813 | 248,308 |
| Phillips 66 | | | | | 15,245 | 1,536,848 |
| | | | | | | 4,558,582 |
| Materials: 3.72% | | | | | | |
| Chemicals: 1.69% | | | | | | |
| Ashland Global Holdings Incorporated | | | | | 5,483 | 586,791 |
| Ecolab Incorporated | | | | | 2,932 | 480,584 |
| Linde plc | | | | | 4,806 | 1,560,412 |
| Olin Corporation | | | | | 3,973 | 261,384 |
| The Sherwin-Williams Company | | | | | 1,000 | 268,040 |
| Westlake Chemical Corporation | | | | | 5,775 | 762,935 |
| | | | | | | 3,920,146 |
| Construction materials: 0.19% | | | | | | |
| Martin Marietta Materials Incorporated | | | | | 1,290 | 437,800 |
| Containers & packaging: 0.21% | | | | | | |
| Crown Holdings Incorporated | | | | | 4,684 | 489,197 |
| Metals & mining: 1.63% | | | | | | |
| Agnico-Eagle Mines Limited | | | | | 2,489 | 131,923 |
| Agnico-Eagle Mines Limited-U.S. Exchange Traded Shares | | | | | 2,700 | 142,911 |
| Alamos Gold Incorporated Class A | | | | | 11,500 | 85,828 |
The accompanying notes are an integral part of these financial statements.
26 | Allspring Real Return Portfolio
Portfolio of investments—May 31, 2022
| | | | | Shares | Value |
| Metals & mining (continued) | | | | | | |
| AngloGold Ashanti Limited ADR | | | | | 3,500 | $ 60,130 |
| Artemis Gold Incorporated † | | | | | 6,000 | 26,422 |
| B2Gold Corporation | | | | | 27,500 | 109,143 |
| Barrick Gold Corporation | | | | | 11,656 | 238,831 |
| Centerra Gold Incorporated | | | | | 6,600 | 51,502 |
| Dundee Precious Metals Incorporated | | | | | 8,800 | 52,111 |
| Endeavour Mining plc | | | | | 7,080 | 162,943 |
| Evolution Mining Limited | | | | | 22,000 | 60,627 |
| Franco-Nevada Corporation | | | | | 1,200 | 169,756 |
| Gold Fields Limited ADR | | | | | 13,000 | 121,420 |
| Kinross Gold Corporation | | | | | 30,500 | 136,965 |
| Lundin Gold Incorporated † | | | | | 8,000 | 62,490 |
| MAG Silver Corporation † | | | | | 4,400 | 62,199 |
| Marathon Gold Corporation † | | | | | 7,000 | 9,298 |
| Newcrest Mining Limited | | | | | 6,600 | 118,602 |
| Newmont Corporation | | | | | 4,090 | 277,507 |
| Northern Star Resources Limited | | | | | 15,000 | 96,345 |
| Osisko Mining Incorporated † | | | | | 3,000 | 8,633 |
| Pan American Silver Corporation | | | | | 3,000 | 65,910 |
| Royal Gold Incorporated | | | | | 3,312 | 374,521 |
| SilverCrest Metals Incorporated † | | | | | 8,600 | 61,805 |
| Skeena Resources Limited † | | | | | 2,000 | 13,709 |
| SSR Mining Incorporated | | | | | 4,500 | 87,435 |
| SSR Mining Incorporated-U.S. Exchange Traded Shares | | | | | 1,272 | 24,739 |
| Steel Dynamics Incorporated | | | | | 7,264 | 620,200 |
| Torex Gold Resources Incorporated † | | | | | 5,400 | 53,024 |
| Triple Flag Precious Metals Corporation | | | | | 1,500 | 18,868 |
| Wheaton Precious Metals Corporation | | | | | 4,400 | 181,726 |
| Yamana Gold Incorporated | | | | | 16,000 | 86,018 |
| | | | | | | 3,773,541 |
| Real estate: 5.39% | | | | | | |
| Equity REITs: 5.39% | | | | | | |
| Alexandria Real Estate Equities Incorporated | | | | | 2,916 | 483,910 |
| American Homes 4 Rent Class A | | | | | 13,216 | 488,463 |
| American Tower Corporation | | | | | 5,709 | 1,462,246 |
| Apartment Income Corporation REIT | | | | | 7,670 | 344,076 |
| Camden Property Trust | | | | | 2,799 | 401,629 |
| Duke Realty Corporation | | | | | 13,225 | 698,677 |
| Equinix Incorporated | | | | | 1,831 | 1,258,062 |
| Federal Realty Investment Trust | | | | | 2,760 | 317,317 |
| Four Corners Property Trust Incorporated | | | | | 18,234 | 502,711 |
| Gaming and Leisure Properties Incorporated | | | | | 9,150 | 428,403 |
| Invitation Homes Incorporated | | | | | 14,484 | 546,336 |
| Life Storage Incorporated | | | | | 5,203 | 607,502 |
| Mid-America Apartment Communities Incorporated | | | | | 2,133 | 386,073 |
| Prologis Incorporated | | | | | 7,820 | 996,894 |
| SBA Communications Corporation | | | | | 2,948 | 992,326 |
| Simon Property Group Incorporated | | | | | 2,483 | 284,676 |
| Sun Communities Incorporated | | | | | 4,313 | 707,893 |
| VICI Properties Incorporated | | | | | 27,710 | 854,854 |
| Welltower Incorporated | | | | | 8,056 | 717,709 |
| | | | | | | 12,479,757 |
| Total Common stocks (Cost $25,495,204) | | | | | | 36,794,386 |
The accompanying notes are an integral part of these financial statements.
Allspring Real Return Portfolio | 27
Portfolio of investments—May 31, 2022
| | | Interest
rate | Maturity
date | Principal | Value |
| Corporate bonds and notes: 12.72% | | | | | | |
| Communication services: 1.21% | | | | | | |
| Diversified telecommunication services: 0.25% | | | | | | |
| CenturyLink Incorporated | | 6.75% | 12-1-2023 | $ | 260,000 | $ 266,175 |
| Level 3 Financing Incorporated | | 5.38 | 5-1-2025 | | 85,000 | 84,895 |
| Lumen Technologies Incorporated | | 7.50 | 4-1-2024 | | 215,000 | 222,461 |
| | | | | | | 573,531 |
| Entertainment: 0.23% | | | | | | |
| Live Nation Entertainment Incorporated 144A | | 4.88 | 11-1-2024 | | 190,000 | 188,260 |
| Live Nation Entertainment Incorporated 144A | | 6.50 | 5-15-2027 | | 335,000 | 346,745 |
| | | | | | | 535,005 |
| Media: 0.56% | | | | | | |
| Cinemark USA Incorporated 144A | | 8.75 | 5-1-2025 | | 420,000 | 432,642 |
| DISH DBS Corporation | | 5.00 | 3-15-2023 | | 200,000 | 196,000 |
| Gray Television Incorporated 144A | | 5.88 | 7-15-2026 | | 460,000 | 453,316 |
| Townsquare Media Incorporated 144A | | 6.88 | 2-1-2026 | | 215,000 | 207,821 |
| | | | | | | 1,289,779 |
| Wireless telecommunication services: 0.17% | | | | | | |
| Sprint Corporation | | 7.13 | 6-15-2024 | | 383,000 | 406,934 |
| Consumer discretionary: 2.00% | | | | | | |
| Auto components: 0.16% | | | | | | |
| Clarios Global LP 144A | | 6.25 | 5-15-2026 | | 201,000 | 201,626 |
| Clarios Global LP 144A | | 6.75 | 5-15-2025 | | 167,000 | 168,039 |
| | | | | | | 369,665 |
| Hotels, restaurants & leisure: 0.99% | | | | | | |
| Carnival Corporation 144A | | 10.50 | 2-1-2026 | | 285,000 | 306,803 |
| CCM Merger Incorporated 144A | | 6.38 | 5-1-2026 | | 145,000 | 139,916 |
| Cedar Fair LP 144A | | 5.50 | 5-1-2025 | | 280,000 | 284,259 |
| Hilton Domestic Operating Company Incorporated 144A | | 5.38 | 5-1-2025 | | 280,000 | 284,256 |
| NCL Corporation Limited 144A | | 5.88 | 2-15-2027 | | 160,000 | 149,058 |
| Royal Caribbean Cruises Limited 144A | | 9.13 | 6-15-2023 | | 325,000 | 331,500 |
| Royal Caribbean Cruises Limited 144A | | 10.88 | 6-1-2023 | | 160,000 | 166,410 |
| Royal Caribbean Cruises Limited 144A | | 11.50 | 6-1-2025 | | 221,000 | 239,557 |
| SeaWorld Parks & Entertainment Incorporated 144A | | 8.75 | 5-1-2025 | | 373,000 | 386,428 |
| | | | | | | 2,288,187 |
| Household durables: 0.09% | | | | | | |
| Allied Universal Holdco LLC 144A | | 6.63 | 7-15-2026 | | 205,000 | 203,167 |
| Internet & direct marketing retail: 0.36% | | | | | | |
| QVC Incorporated | | 4.85 | 4-1-2024 | | 865,000 | 843,375 |
| Specialty retail: 0.18% | | | | | | |
| Bath & Body Works Incorporated 144A | | 9.38 | 7-1-2025 | | 259,000 | 279,382 |
| Penske Automotive Group Incorporated | | 3.50 | 9-1-2025 | | 140,000 | 136,987 |
| | | | | | | 416,369 |
The accompanying notes are an integral part of these financial statements.
28 | Allspring Real Return Portfolio
Portfolio of investments—May 31, 2022
| | | Interest
rate | Maturity
date | Principal | Value |
| Textiles, apparel & luxury goods: 0.22% | | | | | | |
| G-III Apparel Group Limited 144A | | 7.88% | 8-15-2025 | $ | 400,000 | $ 406,520 |
| Michael Kors USA Incorporated 144A | | 4.25 | 11-1-2024 | | 110,000 | 106,923 |
| | | | | | | 513,443 |
| Consumer staples: 0.12% | | | | | | |
| Food products: 0.12% | | | | | | |
| Performance Food Group Incorporated 144A | | 6.88 | 5-1-2025 | | 280,000 | 285,971 |
| Energy: 2.91% | | | | | | |
| Energy equipment & services: 0.32% | | | | | | |
| Oceaneering International Incorporated | | 4.65 | 11-15-2024 | | 650,000 | 638,281 |
| USA Compression Partners LP | | 6.88 | 4-1-2026 | | 115,000 | 112,269 |
| | | | | | | 750,550 |
| Oil, gas & consumable fuels: 2.59% | | | | | | |
| Antero Midstream Company 144A | | 7.88 | 5-15-2026 | | 105,000 | 111,075 |
| Antero Resources Corporation 144A | | 8.38 | 7-15-2026 | | 390,000 | 424,125 |
| Buckeye Partners LP 144A | | 4.13 | 3-1-2025 | | 35,000 | 34,407 |
| Buckeye Partners LP | | 4.15 | 7-1-2023 | | 200,000 | 200,862 |
| Crestwood Midstream Partners LP | | 5.75 | 4-1-2025 | | 605,000 | 599,858 |
| DCP Midstream Operating LP | | 5.38 | 7-15-2025 | | 455,000 | 466,366 |
| EnLink Midstream Partners LP | | 4.15 | 6-1-2025 | | 545,000 | 545,109 |
| Enviva Partners LP 144A | | 6.50 | 1-15-2026 | | 645,000 | 645,000 |
| EQM Midstream Partners LP | | 4.75 | 7-15-2023 | | 175,000 | 177,765 |
| EQT Corporation | | 6.63 | 2-1-2025 | | 405,000 | 422,318 |
| Murphy Oil Corporation | | 5.75 | 8-15-2025 | | 300,000 | 304,487 |
| New Fortress Energy Incorporated 144A | | 6.50 | 9-30-2026 | | 220,000 | 214,238 |
| Occidental Petroleum Corporation | | 8.00 | 7-15-2025 | | 305,000 | 332,450 |
| Range Resources Corporation | | 8.25 | 1-15-2029 | | 90,000 | 97,445 |
| Rockies Express Pipeline LLC 144A | | 3.60 | 5-15-2025 | | 529,000 | 511,067 |
| Southwestern Energy Company | | 5.95 | 1-23-2025 | | 32,000 | 33,056 |
| Southwestern Energy Company | | 7.75 | 10-1-2027 | | 110,000 | 116,026 |
| Tallgrass Energy Partners LP 144A | | 7.50 | 10-1-2025 | | 360,000 | 370,800 |
| Western Gas Partners LP | | 4.65 | 7-1-2026 | | 385,000 | 384,038 |
| | | | | | | 5,990,492 |
| Financials: 2.45% | | | | | | |
| Consumer finance: 1.13% | | | | | | |
| Ford Motor Credit Company LLC | | 5.58 | 3-18-2024 | | 460,000 | 465,463 |
| LFS TopCo LLC 144A | | 5.88 | 10-15-2026 | | 215,000 | 192,569 |
| Navient Corporation | | 5.88 | 10-25-2024 | | 590,000 | 591,800 |
| Navient Corporation | | 7.25 | 9-25-2023 | | 87,000 | 88,965 |
| OneMain Finance Corporation | | 6.13 | 3-15-2024 | | 295,000 | 297,993 |
| OneMain Finance Corporation | | 3.50 | 1-15-2027 | | 120,000 | 107,363 |
| PRA Group Incorporated 144A | | 7.38 | 9-1-2025 | | 290,000 | 292,335 |
| Rocket Mortgage LLC 144A | | 2.88 | 10-15-2026 | | 165,000 | 147,594 |
| Springleaf Finance Corporation | | 8.88 | 6-1-2025 | | 414,000 | 432,373 |
| | | | | | | 2,616,455 |
| Diversified financial services: 0.48% | | | | | | |
| Hat Holdings LLC 144A | | 3.38 | 6-15-2026 | | 245,000 | 226,668 |
The accompanying notes are an integral part of these financial statements.
Allspring Real Return Portfolio | 29
Portfolio of investments—May 31, 2022
| | | Interest
rate | Maturity
date | Principal | Value |
| Diversified financial services (continued) | | | | | | |
| Hat Holdings LLC 144A | | 6.00% | 4-15-2025 | $ | 270,000 | $ 273,610 |
| United Wholesale Mortgage LLC 144A | | 5.50 | 11-15-2025 | | 650,000 | 614,250 |
| | | | | | | 1,114,528 |
| Mortgage REITs: 0.32% | | | | | | |
| Starwood Property Trust Incorporated 144A | | 3.75 | 12-31-2024 | | 110,000 | 105,949 |
| Starwood Property Trust Incorporated | | 4.75 | 3-15-2025 | | 495,000 | 489,441 |
| Starwood Property Trust Incorporated 144A | | 5.50 | 11-1-2023 | | 150,000 | 150,750 |
| | | | | | | 746,140 |
| Thrifts & mortgage finance: 0.52% | | | | | | |
| Enact Holdings Incorporated 144A | | 6.50 | 8-15-2025 | | 750,000 | 751,965 |
| Ladder Capital Finance Holdings LP 144A | | 5.25 | 10-1-2025 | | 475,000 | 454,813 |
| | | | | | | 1,206,778 |
| Health care: 0.56% | | | | | | |
| Health care providers & services: 0.45% | | | | | | |
| Select Medical Corporation 144A | | 6.25 | 8-15-2026 | | 664,000 | 662,386 |
| Tenet Healthcare Corporation 144A | | 4.88 | 1-1-2026 | | 375,000 | 374,160 |
| | | | | | | 1,036,546 |
| Health care technology: 0.11% | | | | | | |
| IQVIA Incorporated 144A | | 5.00 | 10-15-2026 | | 250,000 | 249,278 |
| Industrials: 1.74% | | | | | | |
| Aerospace & defense: 0.56% | | | | | | |
| Spirit AeroSystems Holdings Incorporated 144A | | 5.50 | 1-15-2025 | | 620,000 | 612,250 |
| TransDigm Group Incorporated 144A | | 6.25 | 3-15-2026 | | 305,000 | 310,264 |
| TransDigm Group Incorporated 144A | | 8.00 | 12-15-2025 | | 364,000 | 379,696 |
| | | | | | | 1,302,210 |
| Airlines: 0.43% | | | | | | |
| Hawaiian Airlines Incorporated | | 3.90 | 7-15-2027 | | 191,416 | 168,439 |
| Hawaiian Brand Intellectual Property Limited 144A | | 5.75 | 1-20-2026 | | 340,000 | 337,707 |
| Mileage Plus Holdings LLC 144A | | 6.50 | 6-20-2027 | | 190,000 | 192,869 |
| Spirit Loyalty Cayman Limited 144A | | 8.00 | 9-20-2025 | | 275,000 | 287,898 |
| | | | | | | 986,913 |
| Commercial services & supplies: 0.09% | | | | | | |
| CoreCivic Incorporated | | 8.25 | 4-15-2026 | | 200,000 | 205,856 |
| Construction & engineering: 0.05% | | | | | | |
| Taylor Morrison Communities Incorporated 144A | | 5.88 | 4-15-2023 | | 110,000 | 110,590 |
| Electronic equipment, instruments & components: 0.09% | | | | | | |
| Wesco Distribution Incorporated 144A | | 7.13 | 6-15-2025 | | 210,000 | 218,033 |
| Machinery: 0.01% | | | | | | |
| Stevens Holding Company Incorporated 144A | | 6.13 | 10-1-2026 | | 10,000 | 9,925 |
| Road & rail: 0.23% | | | | | | |
| Uber Technologies Incorporated 144A | | 7.50 | 5-15-2025 | | 525,000 | 541,522 |
The accompanying notes are an integral part of these financial statements.
30 | Allspring Real Return Portfolio
Portfolio of investments—May 31, 2022
| | | Interest
rate | Maturity
date | Principal | Value |
| Trading companies & distributors: 0.28% | | | | | | |
| Fortress Transportation & Infrastructure Investors LLC 144A | | 6.50% | 10-1-2025 | $ | 660,000 | $ 645,150 |
| Information technology: 0.46% | | | | | | |
| IT services: 0.30% | | | | | | |
| Block Incorporated 144A | | 2.75 | 6-1-2026 | | 85,000 | 78,398 |
| Sabre GLBL Incorporated 144A | | 7.38 | 9-1-2025 | | 55,000 | 54,313 |
| Sabre GLBL Incorporated 144A | | 9.25 | 4-15-2025 | | 530,000 | 548,508 |
| | | | | | | 681,219 |
| Software: 0.16% | | | | | | |
| NCR Corporation 144A | | 5.75 | 9-1-2027 | | 98,000 | 94,911 |
| NortonLifeLock Incorporated 144A | | 5.00 | 4-15-2025 | | 285,000 | 284,644 |
| | | | | | | 379,555 |
| Materials: 0.24% | | | | | | |
| Containers & packaging: 0.02% | | | | | | |
| Sealed Air Corporation 144A | | 5.13 | 12-1-2024 | | 50,000 | 50,250 |
| Metals & mining: 0.09% | | | | | | |
| Cleveland-Cliffs Incorporated 144A | | 6.75 | 3-15-2026 | | 195,000 | 203,288 |
| Paper & forest products: 0.13% | | | | | | |
| Clearwater Paper Corporation 144A | | 5.38 | 2-1-2025 | | 315,000 | 307,913 |
| Real estate: 0.29% | | | | | | |
| Equity REITs: 0.29% | | | | | | |
| Service Properties Trust Company | | 4.35 | 10-1-2024 | | 500,000 | 456,048 |
| Service Properties Trust Company | | 7.50 | 9-15-2025 | | 210,000 | 207,963 |
| | | | | | | 664,011 |
| Utilities: 0.74% | | | | | | |
| Electric utilities: 0.24% | | | | | | |
| NextEra Energy Operating Partners LP 144A | | 4.25 | 7-15-2024 | | 560,000 | 560,302 |
| Independent power & renewable electricity producers: 0.50% | | | | | | |
| NSG Holdings LLC 144A | | 7.75 | 12-15-2025 | | 318,172 | 318,172 |
| Vistra Operations Company LLC 144A | | 5.63 | 2-15-2027 | | 825,000 | 825,413 |
| | | | | | | 1,143,585 |
| Total Corporate bonds and notes (Cost $30,298,999) | | | | | | 29,446,515 |
| Loans: 1.85% | | | | | | |
| Communication services: 0.11% | | | | | | |
| Entertainment: 0.05% | | | | | | |
| Live Nation Entertainment Incorporated (1 Month LIBOR +1.75%) ± | | 2.69 | 10-17-2026 | | 122,754 | 117,615 |
| Media: 0.06% | | | | | | |
| Gray Television Incorporated (1 Month LIBOR +2.50%) <± | | 3.62 | 2-7-2024 | | 120,000 | 117,800 |
| Hubbard Radio LLC (3 Month LIBOR +4.25%) ± | | 5.31 | 3-28-2025 | | 29,149 | 28,348 |
| | | | | | | 146,148 |
The accompanying notes are an integral part of these financial statements.
Allspring Real Return Portfolio | 31
Portfolio of investments—May 31, 2022
| | | Interest
rate | Maturity
date | Principal | Value |
| Consumer discretionary: 0.49% | | | | | | |
| Auto components: 0.19% | | | | | | |
| Clarios Global LP (1 Month LIBOR +3.25%) ± | | 4.31% | 4-30-2026 | $ | 118,779 | $ 113,899 |
| Tenneco Incorporated (3 Month LIBOR +3.00%) ± | | 4.06 | 10-1-2025 | | 356,634 | 338,582 |
| | | | | | | 452,481 |
| Hotels, restaurants & leisure: 0.10% | | | | | | |
| Carnival Corporation (1 Month LIBOR +3.00%) ± | | 3.75 | 6-30-2025 | | 78,823 | 75,768 |
| Wyndham Hotels & Resorts Incorporated (3 Month LIBOR +1.75%) ± | | 2.81 | 5-30-2025 | | 157,300 | 153,835 |
| | | | | | | 229,603 |
| Leisure products: 0.16% | | | | | | |
| SeaWorld Parks & Entertainment Incorporated (1 Month LIBOR +3.00%) ± | | 4.06 | 8-25-2028 | | 372,153 | 360,430 |
| Specialty retail: 0.04% | | | | | | |
| Rent-A-Center Incorporated (1 Month LIBOR +3.25%) ± | | 4.31 | 2-17-2028 | | 93,800 | 87,615 |
| Energy: 0.21% | | | | | | |
| Oil, gas & consumable fuels: 0.21% | | | | | | |
| Apergy Corporation (1 Month LIBOR +5.00%) ౠ| | 8.00 | 6-3-2027 | | 314,146 | 313,754 |
| GIP II Blue Holdings LP (1 Month LIBOR +4.50%) ± | | 5.51 | 9-29-2028 | | 177,393 | 172,811 |
| | | | | | | 486,565 |
| Financials: 0.29% | | | | | | |
| Diversified financial services: 0.24% | | | | | | |
| Resolute Investment Managers Incorporated (1 Month LIBOR +4.25%) ౠ| | 5.26 | 4-30-2024 | | 94,046 | 89,108 |
| Russell Investments US Institutional Holdco Incorporated (1 Month LIBOR +3.50%) <± | | 5.00 | 5-30-2025 | | 491,009 | 463,389 |
| | | | | | | 552,497 |
| Mortgage REITs: 0.05% | | | | | | |
| Claros Mortgage Trust Incorporated (U.S. SOFR +4.50%) ౠ| | 5.00 | 8-9-2026 | | 119,700 | 115,511 |
| Health care: 0.11% | | | | | | |
| Health care equipment & supplies: 0.01% | | | | | | |
| Ortho Clinical Diagnostics SA (3 Month LIBOR +3.00%) ± | | 4.40 | 6-30-2025 | | 32,229 | 31,932 |
| Health care technology: 0.10% | | | | | | |
| Change Healthcare Holdings Incorporated (1 Month LIBOR +2.50%) <± | | 3.56 | 3-1-2024 | | 225,000 | 220,923 |
| Industrials: 0.51% | | | | | | |
| Aerospace & defense: 0.03% | | | | | | |
| Spirit AeroSystems Incorporated (1 Month LIBOR +3.75%) ± | | 4.81 | 1-15-2025 | | 74,065 | 72,152 |
| Airlines: 0.28% | | | | | | |
| Mileage Plus Holdings LLC (1 Month LIBOR +5.25%) ± | | 6.25 | 6-21-2027 | | 425,000 | 430,665 |
| SkyMiles IP Limited (3 Month LIBOR +3.75%) ± | | 4.81 | 10-20-2027 | | 215,000 | 216,828 |
| | | | | | | 647,493 |
The accompanying notes are an integral part of these financial statements.
32 | Allspring Real Return Portfolio
Portfolio of investments—May 31, 2022
| | | Interest
rate | Maturity
date | Principal | Value |
| Machinery: 0.10% | | | | | | |
| Vertical US Newco Incorporated (1 Month LIBOR +3.50%) ± | | 4.02% | 7-30-2027 | $ | 227,820 | $ 219,136 |
| Road & rail: 0.05% | | | | | | |
| Uber Technologies Incorporated (1 Month LIBOR +3.50%) ± | | 5.07 | 4-4-2025 | | 118,462 | 115,204 |
| Software: 0.05% | | | | | | |
| SS&C Technologies Incorporated Term Loan B3 (1 Month LIBOR +1.75%) ± | | 2.81 | 4-16-2025 | | 69,593 | 67,549 |
| SS&C Technologies Incorporated Term Loan B4 (1 Month LIBOR +1.75%) ± | | 2.81 | 4-16-2025 | | 56,494 | 54,835 |
| | | | | | | 122,384 |
| Utilities: 0.13% | | | | | | |
| Electric utilities: 0.13% | | | | | | |
| ExGen Renewables IV LLC (1 Month LIBOR +2.50%) ± | | 4.08 | 12-15-2027 | | 306,706 | 299,373 |
| Total Loans (Cost $4,416,929) | | | | | | 4,277,062 |
| U.S. Treasury securities: 65.70% | | | | | | |
| TIPS | | 0.13 | 7-15-2024 | | 2,759,484 | 2,849,167 |
| TIPS | | 0.13 | 10-15-2024 | | 4,144,407 | 4,263,343 |
| TIPS | | 0.13 | 4-15-2025 | | 4,161,087 | 4,255,036 |
| TIPS | | 0.13 | 10-15-2025 | | 2,192,989 | 2,245,500 |
| TIPS | | 0.13 | 4-15-2026 | | 6,081,857 | 6,185,794 |
| TIPS | | 0.13 | 7-15-2026 | | 4,070,333 | 4,152,018 |
| TIPS | | 0.13 | 10-15-2026 | | 3,155,070 | 3,213,981 |
| TIPS | | 0.13 | 4-15-2027 | | 2,046,408 | 2,074,187 |
| TIPS | | 0.13 | 1-15-2030 | | 4,691,316 | 4,669,646 |
| TIPS | | 0.13 | 7-15-2030 | | 4,236,889 | 4,225,883 |
| TIPS | | 0.13 | 1-15-2031 | | 4,780,190 | 4,753,488 |
| TIPS | | 0.13 | 7-15-2031 | | 2,921,854 | 2,910,669 |
| TIPS | | 0.13 | 1-15-2032 | | 6,531,336 | 6,487,794 |
| TIPS | | 0.13 | 2-15-2051 | | 2,958,238 | 2,498,729 |
| TIPS | | 0.13 | 2-15-2052 | | 681,351 | 578,869 |
| TIPS | | 0.25 | 1-15-2025 | | 5,035,320 | 5,180,134 |
| TIPS | | 0.25 | 7-15-2029 | | 2,308,772 | 2,334,069 |
| TIPS | | 0.25 | 2-15-2050 | | 4,091,148 | 3,534,848 |
| TIPS | | 0.38 | 7-15-2023 | | 1,080,529 | 1,115,730 |
| TIPS | | 0.38 | 7-15-2025 | | 2,823,611 | 2,922,400 |
| TIPS | | 0.38 | 1-15-2027 | | 3,170,551 | 3,251,239 |
| TIPS | | 0.38 | 7-15-2027 | | 3,876,906 | 3,981,199 |
| TIPS | | 0.50 | 4-15-2024 | | 3,549,418 | 3,673,694 |
| TIPS | | 0.50 | 1-15-2028 | | 2,982,579 | 3,063,202 |
| TIPS | | 0.63 | 1-15-2024 | | 9,637,661 | 9,984,642 |
| TIPS | | 0.63 | 1-15-2026 | | 5,980,780 | 6,209,186 |
| TIPS | | 0.63 | 2-15-2043 | | 2,293,695 | 2,192,838 |
| TIPS | | 0.75 | 7-15-2028 | | 3,904,007 | 4,082,241 |
| TIPS | | 0.75 | 2-15-2042 | | 3,096,882 | 3,056,175 |
| TIPS | | 0.75 | 2-15-2045 | | 1,775,682 | 1,721,597 |
| TIPS | | 0.88 | 1-15-2029 | | 3,209,527 | 3,371,288 |
| TIPS | | 0.88 | 2-15-2047 | | 1,756,017 | 1,764,163 |
| TIPS | | 1.00 | 2-15-2046 | | 1,734,404 | 1,777,138 |
| TIPS | | 1.00 | 2-15-2048 | | 1,334,372 | 1,388,007 |
| TIPS | | 1.00 | 2-15-2049 | | 1,524,650 | 1,595,483 |
| TIPS | | 1.38 | 2-15-2044 | | 2,503,173 | 2,756,717 |
The accompanying notes are an integral part of these financial statements.
Allspring Real Return Portfolio | 33
Portfolio of investments—May 31, 2022
| | | Interest
rate | Maturity
date | Principal | Value |
| U.S. Treasury securities (continued) | | | | | | |
| TIPS | | 1.75% | 1-15-2028 | $ | 2,626,940 | $ 2,882,964 |
| TIPS | | 2.00 | 1-15-2026 | | 3,257,843 | 3,546,722 |
| TIPS | | 2.13 | 2-15-2040 | | 1,382,794 | 1,723,132 |
| TIPS | | 2.13 | 2-15-2041 | | 1,765,044 | 2,199,099 |
| TIPS | | 2.38 | 1-15-2025 | | 3,354,120 | 3,642,408 |
| TIPS | | 2.38 | 1-15-2027 | | 2,415,460 | 2,704,843 |
| TIPS | | 2.50 | 1-15-2029 | | 2,529,822 | 2,926,564 |
| TIPS | | 3.38 | 4-15-2032 | | 1,020,002 | 1,330,524 |
| TIPS | | 3.63 | 4-15-2028 | | 2,052,216 | 2,480,803 |
| TIPS | | 3.88 | 4-15-2029 | | 2,692,136 | 3,369,411 |
| U.S. Treasury Note | | 2.88 | 5-15-2032 | | 1,040,000 | 1,041,300 |
| Total U.S. Treasury securities (Cost $153,451,646) | | | | | | 152,167,864 |
| Yankee corporate bonds and notes: 1.61% | | | | | | |
| Communication services: 0.03% | | | | | | |
| Media: 0.03% | | | | | | |
| Nielsen Holding and Finance BV 144A | | 5.00 | 2-1-2025 | | 65,000 | 64,347 |
| Consumer discretionary: 0.09% | | | | | | |
| Auto components: 0.09% | | | | | | |
| Adient Global Holdings Limited 144A | | 4.88 | 8-15-2026 | | 220,000 | 204,631 |
| Energy: 0.23% | | | | | | |
| Oil, gas & consumable fuels: 0.23% | | | | | | |
| Northriver Midstream Finance LP 144A | | 5.63 | 2-15-2026 | | 555,000 | 527,944 |
| Financials: 0.20% | | | | | | |
| Diversified financial services: 0.20% | | | | | | |
| DAE Funding LLC 144A | | 2.63 | 3-20-2025 | | 370,000 | 344,009 |
| FMG Resources Proprietary Limited 144A | | 5.13 | 5-15-2024 | | 115,000 | 117,044 |
| | | | | | | 461,053 |
| Health care: 0.36% | | | | | | |
| Pharmaceuticals: 0.36% | | | | | | |
| Bausch Health Companies Incorporated 144A | | 5.50 | 11-1-2025 | | 220,000 | 207,440 |
| Teva Pharmaceutical Finance Netherlands III BV | | 6.00 | 4-15-2024 | | 625,000 | 631,250 |
| | | | | | | 838,690 |
| Industrials: 0.26% | | | | | | |
| Airlines: 0.13% | | | | | | |
| Air Canada Pass-Through Trust Series 2020-1 Class C 144A | | 10.50 | 7-15-2026 | | 290,000 | 311,749 |
| Trading companies & distributors: 0.13% | | | | | | |
| Fly Leasing Limited 144A | | 7.00 | 10-15-2024 | | 355,000 | 293,351 |
| Materials: 0.44% | | | | | | |
| Containers & packaging: 0.31% | | | | | | |
| Ardagh Packaging Finance plc 144A | | 5.25 | 4-30-2025 | | 730,000 | 726,963 |
The accompanying notes are an integral part of these financial statements.
34 | Allspring Real Return Portfolio
Portfolio of investments—May 31, 2022
| | | Interest
rate | Maturity
date | Principal | Value |
| Metals & mining: 0.13% | | | | | | |
| Constellium SE 144A | | 5.88% | 2-15-2026 | $ | 300,000 | $ 296,788 |
| Total Yankee corporate bonds and notes (Cost $3,951,378) | | | | | | 3,725,516 |
| | | Yield | | Shares | |
| Short-term investments: 1.19% | | | | | | |
| Investment companies: 1.19% | | | | | | |
| Allspring Government Money Market Fund Select Class ♠∞## | | 0.65 | | | 2,766,670 | 2,766,670 |
| Total Short-term investments (Cost $2,766,670) | | | | | | 2,766,670 |
| Total investments in securities (Cost $220,380,826) | 98.96% | | | | | 229,178,013 |
| Other assets and liabilities, net | 1.04 | | | | | 2,417,278 |
| Total net assets | 100.00% | | | | | $231,595,291 |
| † | Non-income-earning security |
| 144A | The security may be resold in transactions exempt from registration, normally to qualified institutional buyers, pursuant to Rule 144A under the Securities Act of 1933. |
| ± | Variable rate investment. The rate shown is the rate in effect at period end. |
| < | All or a portion of the position represents an unfunded loan commitment. The rate represents the current interest rate if the loan is partially funded. |
| ‡ | Security is valued using significant unobservable inputs. |
| ## | All or a portion of this security is segregated for unfunded loans. |
| ♠ | The issuer of the security is an affiliated person of the Portfolio as defined in the Investment Company Act of 1940. |
| ∞ | The rate represents the 7-day annualized yield at period end. |
| Abbreviations: |
| ADR | American depositary receipt |
| LIBOR | London Interbank Offered Rate |
| REIT | Real estate investment trust |
| SOFR | Secured Overnight Financing Rate |
| TIPS | Treasury Inflation-Protected Securities |
Investments in affiliates
An affiliated investment is an investment in which the Portfolio owns at least 5% of the outstanding voting shares of the issuer or as a result of other relationships, such as the Portfolio and the issuer having the same adviser or investment manager. Transactions with issuers that were affiliates of the Portfolio at the end of the period were as follows:
| | Value,
beginning of
period | Purchases | Sales
proceeds | Net
realized
gains
(losses) | | Net
change in
unrealized
gains
(losses) | | Value,
end of
period | Shares,
end
of period | Income
from
affiliated
securities |
| Short-term investments | | | | | | | | | |
| Allspring Government Money Market Fund Select Class | $2,265,095 | $73,771,432 | $(73,269,857) | $0 | | $0 | | $ 2,766,670 | 2,766,670 | $ 2,586 |
| Affiliated securities no longer held at end of period | | | | | | | | | |
| Securities Lending Cash Investments LLC | 0 | 3,400,622 | (3,400,622) | 0 | | 0 | | 0 | 0 | 219 # |
| | | | | $0 | | $0 | | $2,766,670 | | $2,805 |
| # | Amount shown represents income before fees and rebates. |
The accompanying notes are an integral part of these financial statements.
Allspring Real Return Portfolio | 35
Portfolio of investments—May 31, 2022
Futures contracts
| Description | Number of
contracts | Expiration
date | Notional
cost | Notional
value | Unrealized
gains | | Unrealized
losses |
| Long | | | | | | | |
| 2-Year U.S. Treasury Notes | 14 | 9-30-2022 | $ 2,959,435 | $ 2,955,422 | $ 0 | | $ (4,013) |
| Short | | | | | | | |
| 10-Year Ultra Futures | (3) | 9-21-2022 | (388,166) | (385,453) | 2,713 | | 0 |
| U.S. Ultra Bond | (19) | 9-21-2022 | (3,015,023) | (2,959,250) | 55,773 | | 0 |
| | | | | | $58,486 | | $(4,013) |
The accompanying notes are an integral part of these financial statements.
36 | Allspring Real Return Portfolio
Statement of assets and liabilities—May 31, 2022
| | |
| Assets | |
Investments in unaffiliated securities, at value (cost $217,614,156)
| $ 226,411,343 |
Investments in affiliated securities, at value (cost $2,766,670)
| 2,766,670 |
Cash at broker segregated for futures contracts
| 336,000 |
Foreign currency, at value (cost $12,841)
| 12,867 |
Receivable for investments sold
| 1,665,567 |
Receivable for dividends and interest
| 914,137 |
Receivable for daily variation margin on open futures contracts
| 46,577 |
Receivable for securities lending income, net
| 135 |
Prepaid expenses and other assets
| 20,833 |
Total assets
| 232,174,129 |
| Liabilities | |
Payable for investments purchased
| 521,219 |
Advisory fee payable
| 55,322 |
Payable for daily variation margin on open futures contracts
| 2,297 |
Total liabilities
| 578,838 |
Total net assets
| $231,595,291 |
The accompanying notes are an integral part of these financial statements.
Allspring Real Return Portfolio | 37
Statement of operations—year ended May 31, 2022
| | |
| Investment income | |
Interest
| $ 13,110,697 |
Dividends (net of foreign withholdings taxes of $7,703)
| 705,675 |
Income from affiliated securities
| 3,547 |
Total investment income
| 13,819,919 |
| Expenses | |
Advisory fee
| 932,944 |
Custody and accounting fees
| 39,268 |
Professional fees
| 84,696 |
Interest holder report expenses
| 27,313 |
Trustees’ fees and expenses
| 19,821 |
Other fees and expenses
| 19,626 |
Total expenses
| 1,123,668 |
Less: Fee waivers and/or expense reimbursements
| (214,050) |
Net expenses
| 909,618 |
Net investment income
| 12,910,301 |
| Realized and unrealized gains (losses) on investments | |
| Net realized gains on | |
Unaffiliated securities
| 1,913,231 |
Futures contracts
| 930,436 |
Net realized gains on investments
| 2,843,667 |
| Net change in unrealized gains (losses) on | |
Unaffiliated securities
| (16,547,348) |
Futures contracts
| 46,215 |
Net change in unrealized gains (losses) on investments
| (16,501,133) |
Net realized and unrealized gains (losses) on investments
| (13,657,466) |
Net decrease in net assets resulting from operations
| $ (747,165) |
The accompanying notes are an integral part of these financial statements.
38 | Allspring Real Return Portfolio
Statement of changes in net assets
| | | |
| | Year ended
May 31, 2022 | Year ended
May 31, 2021 |
| Operations | | |
Net investment income
| $ 12,910,301 | $ 5,242,820 |
Net realized gains on investments
| 2,843,667 | 859,659 |
Net change in unrealized gains (losses) on investments
| (16,501,133) | 12,483,180 |
Net increase (decrease) in net assets resulting from operations
| (747,165) | 18,585,659 |
| Capital transactions | | |
| Transactions in investors’ beneficial interests | | |
Contributions
| 73,678,375 | 97,022,259 |
Withdrawals
| (80,677,859) | (38,320,850) |
Net increase (decrease) in net assets resulting from capital transactions
| (6,999,484) | 58,701,409 |
Total increase (decrease) in net assets
| (7,746,649) | 77,287,068 |
| Net assets | | |
Beginning of period
| 239,341,940 | 162,054,872 |
End of period
| $231,595,291 | $239,341,940 |
The accompanying notes are an integral part of these financial statements.
Allspring Real Return Portfolio | 39
| | Year ended May 31 |
| | 2022 | 2021 | 2020 | 2019 | 2018 |
Total return
| (0.14)% | 9.58% | 5.92% | 2.99% | 1.67% |
| Ratios to average net assets (annualized) | | | | | |
Gross expenses
| 0.48% | 0.47% | 0.45% | 0.45% | 0.48% |
Net expenses1
| 0.39% | 0.39% | 0.39% | 0.40% | 0.41% |
Net investment income
| 5.54% | 2.57% | 2.16% | 2.29% | 2.40% |
| Supplemental data | | | | | |
Portfolio turnover rate
| 31% | 20% | 24% | 39% | 29% |
| 1 | Net expense ratios reflect voluntary waivers. |
The accompanying notes are an integral part of these financial statements.
40 | Allspring Real Return Portfolio
Notes to financial statements
1. ORGANIZATION
Allspring Master Trust (the "Trust"), a Delaware statutory trust organized on March 10, 1999, is an open-end management investment company registered under the Investment Company Act of 1940, as amended (the "1940 Act"). As an investment company, the Trust follows the accounting and reporting guidance in Financial Accounting Standards Board ("FASB") Accounting Standards Codification Topic 946, Financial Services – Investment Companies. These financial statements report on the Allspring Real Return Portfolio (the "Portfolio") which is a diversified series of the Trust.
Interests in the Portfolio are available solely through private placement transactions that do not involve any "public offering" within the meaning of Section 4(a)(2) of the Securities Act of 1933.
Effective on November 1, 2021, the sale transaction of Wells Fargo Asset Management ("WFAM") by Wells Fargo & Company to GTCR LLC and Reverence Capital Partners, L.P. was closed. In connection with the closing of the transaction, WFAM became known as Allspring Global Investments (“Allspring”) and various entities that provided services to the Portfolio changed their names to "Allspring", including Allspring Funds Management, LLC, the adviser to the Portfolio, Allspring Global Investments, LLC and Allspring Global Investments (UK) Limited, both registered investment advisers providing subadvisory services to certain funds, and Allspring Funds Distributor, LLC. Consummation of the transaction resulted in a new advisory agreement and subadvisory agreement which became effective on November 1, 2021.
2. SIGNIFICANT ACCOUNTING POLICIES
The following significant accounting policies, which are consistently followed in the preparation of the financial statements of the Portfolio, are in conformity with U.S. generally accepted accounting principles which require management to make estimates and assumptions that affect the reported amounts of assets and liabilities, disclosure of contingent assets and liabilities at the date of the financial statements, and the reported amounts of income and expenses during the reporting period. Actual results could differ from those estimates.
Securities valuation
All investments are valued each business day as of the close of regular trading on the New York Stock Exchange (generally 4 p.m. Eastern Time), although the Portfolio may deviate from this calculation time under unusual or unexpected circumstances.
Debt securities are valued at the evaluated bid price provided by an independent pricing service (e.g. taking into account various factors, including yields, maturities, or credit ratings) or, if a reliable price is not available, the quoted bid price from an independent broker-dealer.
Equity securities and futures contracts that are listed on a foreign or domestic exchange or market are valued at the official closing price or, if none, the last sales price.
The values of securities denominated in foreign currencies are translated into U.S. dollars at rates provided by an independent foreign currency pricing source at a time each business day specified by the Allspring Global Investments Pricing Committee at Allspring Funds Management, LLC ("Allspring Funds Management").
Many securities markets and exchanges outside the U.S. close prior to the close of the New York Stock Exchange and therefore may not fully reflect trading or events that occur after the close of the principal exchange in which the foreign securities are traded, but before the close of the New York Stock Exchange. If such trading or events are expected to materially affect the value of such securities, then fair value pricing procedures approved by the Board of Trustees of the Portfolio are applied. These procedures take into account multiple factors including movements in U.S. securities markets after foreign exchanges close. Foreign securities that are fair valued under these procedures are categorized as Level 2 and the application of these procedures may result in transfers between Level 1 and Level 2. Depending on market activity, such fair valuations may be frequent. Such fair value pricing may result in net asset values that are higher or lower than net asset values based on the last reported sales price or latest quoted bid price. On May 31, 2022, such fair value pricing was not used in pricing foreign securities.
Investments in registered open-end investment companies are valued at net asset value. Interests in non-registered investment companies that are redeemable at net asset value are fair valued normally at net asset value.
Investments which are not valued using any of the methods discussed above are valued at their fair value, as determined in good faith by the Board of Trustees. The Board of Trustees has established a Valuation Committee comprised of the Trustees and has delegated to it the authority to take any actions regarding the valuation of portfolio securities that the Valuation Committee deems necessary or appropriate, including determining the fair value of portfolio securities, unless the determination has been delegated to the Allspring Global Investments Pricing Committee. The Board of Trustees retains the
Allspring Real Return Portfolio | 41
Notes to financial statements
authority to make or ratify any valuation decisions or approve any changes to the Valuation Procedures as it deems appropriate. On a quarterly basis, the Board of Trustees receives reports on any valuation actions taken by the Valuation Committee or the Allspring Global Investments Pricing Committee which may include items for ratification.
Foreign currency translation
The accounting records of the Portfolio are maintained in U.S. dollars. The values of other assets and liabilities denominated in foreign currencies are translated into U.S. dollars at rates provided by an independent foreign currency pricing source at a time each business day specified by the Allspring Global Investments Pricing Committee. Purchases and sales of securities, and income and expenses are converted at the rate of exchange on the respective dates of such transactions. Net realized foreign exchange gains or losses arise from sales of foreign currencies, currency gains or losses realized between the trade and settlement dates on securities transactions, and the difference between the amounts of dividends, interest and foreign withholding taxes recorded and the U.S. dollar equivalent of the amounts actually paid or received. Net unrealized foreign exchange gains and losses arise from changes in the fair value of assets and liabilities other than investments in securities resulting from changes in exchange rates. The changes in net assets arising from changes in exchange rates of securities and the changes in net assets resulting from changes in market prices of securities are not separately presented. Such changes are included in net realized and unrealized gains or losses from investments.
Securities lending
The Portfolio may lend its securities from time to time in order to earn additional income in the form of fees or interest on securities received as collateral or the investment of any cash received as collateral. When securities are on loan, the Portfolio receives interest or dividends on those securities. Cash collateral received in connection with its securities lending transactions is invested in Securities Lending Cash Investments, LLC (the "Securities Lending Fund"), an affiliated non-registered investment company. Investments in Securities Lending Fund are valued at the evaluated bid price provided by an independent pricing service. Income earned from investment in the Securities Lending Fund (net of fees and rebates), if any, is included in income from affiliated securities on the Statement of Operations.
In a securities lending transaction, the net asset value of the Portfolio is affected by an increase or decrease in the value of the securities loaned and by an increase or decrease in the value of the instrument in which collateral is invested. The amount of securities lending activity undertaken by the Portfolio fluctuates from time to time. The Portfolio has the right under the lending agreement to recover the securities from the borrower on demand. In the event of default or bankruptcy by the borrower, the Portfolio may be prevented from recovering the loaned securities or gaining access to the collateral or may experience delays or costs in doing so. In such an event, the terms of the agreement allow the unaffiliated securities lending agent to use the collateral to purchase replacement securities on behalf of the Portfolio or pay the Portfolio the market value of the loaned securities. The Portfolio bears the risk of loss with respect to depreciation of its investment of the cash collateral.
When-issued transactions
The Portfolio may purchase securities on a forward commitment or when-issued basis. The Portfolio records a when-issued transaction on the trade date and will segregate assets in an amount at least equal in value to the Portfolio's commitment to purchase when-issued securities. Securities purchased on a when-issued basis are marked-to-market daily and the Portfolio begins earning interest on the settlement date. Losses may arise due to changes in the market value of the underlying securities or if the counterparty does not perform under the contract.
Loans
The Portfolio may invest in direct debt instruments which are interests in amounts owed to lenders by corporate or other borrowers. The loans pay interest at rates which are periodically reset by reference to a base lending rate plus a spread. Investments in loans may be in the form of participations in loans or assignments of all or a portion of loans from third parties. When the Portfolio purchases participations, it generally has no rights to enforce compliance with the terms of the loan agreement with the borrower. As a result, the Portfolio assumes the credit risk of both the borrower and the lender that is selling the participation. When the Portfolio purchases assignments from lenders, it acquires direct rights against the borrower on the loan and may enforce compliance by the borrower with the terms of the loan agreement. Loans may include fully funded term loans or unfunded loan commitments, which are contractual obligations for future funding.
Futures contracts
Futures contracts are agreements between the Portfolio and a counterparty to buy or sell a specific amount of a commodity, financial instrument or currency at a specified price on a specified date. The Portfolio may buy and sell futures contracts in order to gain exposure to, or protect against, changes in interest rates and is subject to interest rate risk. The primary risks associated with the use of futures contracts are the imperfect correlation between changes in market values of securities held by the Portfolio and the prices of futures contracts, and the possibility of an illiquid market. Futures contracts are generally
42 | Allspring Real Return Portfolio
Notes to financial statements
entered into on a regulated futures exchange and cleared through a clearinghouse associated with the exchange. With futures contracts, there is minimal counterparty risk to the Portfolio since futures contracts are exchange traded and the exchange’s clearinghouse, as the counterparty to all exchange traded futures, guarantees the futures contracts against default.
Upon entering into a futures contract, the Portfolio is required to deposit either cash or securities (initial margin) with the broker in an amount equal to a certain percentage of the contract value. Subsequent payments (variation margin) are paid to or from the broker each day equal to the daily changes in the contract value. Such payments are recorded as unrealized gains or losses and, if any, shown as variation margin receivable (payable) in the Statement of Assets and Liabilities. Should the Portfolio fail to make requested variation margin payments, the broker can gain access to the initial margin to satisfy the Portfolio’s payment obligations. When the contracts are closed, a realized gain or loss is recorded in the Statement of Operations.
Inflation-indexed bonds and TIPS
The Portfolio may invest in inflation-indexed bonds, including Treasury inflation-protected securities (TIPS). Inflation-indexed bonds are fixed income securities whose principal value is periodically adjusted according to the rate of inflation. If the index measuring inflation falls, the principal value of inflation-indexed bonds (other than municipal inflation-indexed bonds and certain corporate inflation-indexed bonds) will be adjusted downward, and consequently the interest payable on these securities (calculated with respect to a smaller principal amount) will be reduced. Repayment of the original bond principal upon maturity (as adjusted for inflation) is guaranteed in the case of U.S. Treasury inflation-indexed bonds. For bonds that do not provide a similar guarantee, the adjusted principal value of the bond repaid at maturity may be less than the original principal. The value of inflation-indexed bonds is expected to change in response to changes in real interest rates. Real interest rates are tied to the relationship between nominal interest rates and the rate of inflation. If nominal interest rates increase at a faster rate than inflation, real interest rates may rise, leading to a decrease in value of inflation-indexed bonds. Inflation-indexed bonds, including TIPS, decline in value when real interest rates rise. In certain interest rate environments, such as when real interest rates are rising faster than nominal interest rates, inflation-indexed bonds may experience greater losses than other fixed income securities with similar durations.
Security transactions and income recognition
Securities transactions are recorded on a trade date basis. Realized gains or losses are recorded on the basis of identified cost.
Interest income is accrued daily and bond discounts are accreted and premiums are amortized daily. To the extent debt obligations are placed on non-accrual status, any related interest income may be reduced by writing off interest receivables when the collection of all or a portion of interest has been determined to be doubtful based on consistently applied procedures and the fair value has decreased. If the issuer subsequently resumes interest payments or when the collectability of interest is reasonably assured, the debt obligation is removed from non-accrual status. Paydown gains and losses are included in interest income.
Dividend income is recognized on the ex-dividend date, except for certain dividends from foreign securities, which are recorded as soon as the custodian verifies the ex-dividend date.
Income is recorded net of foreign taxes withheld where recovery of such taxes is not assured.
Federal and other taxes
The Portfolio is not required to pay federal income taxes on its net investment income and net capital gains as it is treated as a partnership for federal income tax purposes. All income, gains and losses of the Portfolio are deemed to have been “passed through” to the interest holders in proportion to their holdings of the Portfolio regardless of whether income and gains have been distributed by the Portfolio.
The Portfolio’s income tax returns and all financial records supporting those returns for the prior three fiscal years are subject to examination by the federal revenue authority. Management has analyzed the Portfolio’s tax positions taken on federal, state, and foreign tax returns, as applicable, for all open tax years and does not believe that there are any uncertain tax positions that require recognition of a tax liability.
As of May 31, 2022, the aggregate cost of all investments for federal income tax purposes was $220,755,637 and the unrealized gains (losses) consisted of:
| Gross unrealized gains | $14,986,054 |
| Gross unrealized losses | (6,563,678) |
| Net unrealized gains | $ 8,422,376 |
Allspring Real Return Portfolio | 43
Notes to financial statements
3. FAIR VALUATION MEASUREMENTS
Fair value measurements of investments are determined within a framework that has established a fair value hierarchy based upon the various data inputs utilized in determining the value of the Portfolio’s investments. The three-level hierarchy gives the highest priority to unadjusted quoted prices in active markets for identical assets or liabilities (Level 1) and the lowest priority to unobservable inputs (Level 3). The Portfolio’s investments are classified within the fair value hierarchy based on the lowest level of input that is significant to the fair value measurement. The inputs are summarized into three broad levels as follows:
| ■ | Level 1 – quoted prices in active markets for identical securities |
| ■ | Level 2 – other significant observable inputs (including quoted prices for similar securities, interest rates, prepayment speeds, credit risk, etc.) |
| ■ | Level 3 – significant unobservable inputs (including the Portfolio’s own assumptions in determining the fair value of investments) |
The inputs or methodologies used for valuing investments in securities are not necessarily an indication of the risk associated with investing in those securities.
The following is a summary of the inputs used in valuing the Portfolio’s assets and liabilities as of May 31, 2022:
| | Quoted prices
(Level 1) | Other significant
observable inputs
(Level 2) | Significant
unobservable inputs
(Level 3) | Total |
| Assets | | | | |
| Investments in: | | | | |
| Common stocks | | | | |
| Consumer staples | $ 11,135,363 | $ 0 | $ 0 | $ 11,135,363 |
| Energy | 4,558,582 | 0 | 0 | 4,558,582 |
| Materials | 8,620,684 | 0 | 0 | 8,620,684 |
| Real estate | 12,479,757 | 0 | 0 | 12,479,757 |
| Corporate bonds and notes | 0 | 29,446,515 | 0 | 29,446,515 |
| Loans | 0 | 3,758,689 | 518,373 | 4,277,062 |
| U.S. Treasury securities | 152,167,864 | 0 | 0 | 152,167,864 |
| Yankee corporate bonds and notes | 0 | 3,725,516 | 0 | 3,725,516 |
| Short-term investments | | | | |
| Investment companies | 2,766,670 | 0 | 0 | 2,766,670 |
| | 191,728,920 | 36,930,720 | 518,373 | 229,178,013 |
| Futures contracts | 58,486 | 0 | 0 | 58,486 |
| Total assets | $191,787,406 | $36,930,720 | $518,373 | $229,236,499 |
| Liabilities | | | | |
| Futures contracts | $ 4,013 | $ 0 | $ 0 | $ 4,013 |
| Total liabilities | $ 4,013 | $ 0 | $ 0 | $ 4,013 |
Futures contracts are reported at their cumulative unrealized gains (losses) at measurement date as reported in the table following the Portfolio of Investments. For futures contracts, the current day’s variation margin is reported on the Statement of Assets and Liabilities. All other assets and liabilities are reported at their market value at measurement date.
Additional sector, industry or geographic detail, if any, is included in the Portfolio of Investments.
For the year ended May 31, 2022, the Portfolio did not have any transfers into/out of Level 3.
4. TRANSACTIONS WITH AFFILIATES
Advisory fee
The Trust has entered into an advisory contract with Allspring Funds Management, a wholly owned subsidiary of Allspring Global Investments Holdings, LLC, a holding company indirectly owned by certain private funds of GTCR LLC and Reverence Capital Partners, L.P. The adviser is responsible for implementing investment policies and guidelines and for supervising the
44 | Allspring Real Return Portfolio
Notes to financial statements
subadviser, who is responsible for day-to-day portfolio management of the Portfolio. Pursuant to the contract, Allspring Funds Management is entitled to receive an advisory fee at the following annual rate based on the Portfolio’s average daily net assets:
| Average daily net assets | Advisory fee |
| First $500 million | 0.400% |
| Next $500 million | 0.375 |
| Next $2 billion | 0.350 |
| Next $2 billion | 0.325 |
| Next $5 billion | 0.300 |
| Over $10 billion | 0.290 |
For the year ended May 31, 2022, the advisory fee was equivalent to an annual rate of 0.40% of the Portfolio’s average daily net assets.
Allspring Funds Management has retained the services of a subadviser to provide daily portfolio management to the Portfolio. The fee for subadvisory services is borne by Allspring Funds Management. Allspring Global Investments, LLC ("Allspring Investments"), an affiliate of Allspring Funds Management and a wholly owned subsidiary of Allspring Global Investments Holdings, LLC, is the subadviser to the Portfolio and is entitled to receive a fee from Allspring Funds Management at an annual rate starting at 0.28% and declining to 0.18% as the average daily net assets of the Portfolio increase.
Allspring Funds Management has voluntarily waived and/or reimbursed advisory fees to reduce the net operating expense ratio of the Portfolio. These voluntary waivers may be discontinued at any time.
Interfund transactions
The Portfolio may purchase or sell portfolio investment securities to certain affiliates pursuant to Rule 17a-7 under the 1940 Act and under procedures adopted by the Board of Trustees. The procedures have been designed to ensure that these interfund transactions, which do not incur broker commissions, are effected at current market prices. Pursuant to these procedures, the Fund had $1,527,141, $2,422,699 and $(76,153) in interfund purchases, sales and net realized gains (losses), respectively, during the year ended May 31, 2022.
5. INVESTMENT PORTFOLIO TRANSACTIONS
Purchases and sales of investments, excluding short-term securities, for the year ended May 31, 2022 were as follows:
| Purchases at cost | | Sales proceeds |
U.S.
government | Non-U.S.
government | | U.S.
government | Non-U.S.
government |
| $34,037,411 | $36,244,185 | | $34,894,727 | $35,793,413 |
As of May 31, 2022, the Portfolio had unfunded loan commitments of $371,407.
6. SECURITIES LENDING TRANSACTIONS
The Portfolio lends its securities through an unaffiliated securities lending agent and receives collateral in the form of cash or securities with a value at least equal to the value of the securities on loan. The value of the loaned securities is determined at the close of each business day and any increases or decreases in the required collateral are exchanged between the Portfolio and the counterparty on the next business day. Cash collateral received is invested in the Securities Lending Fund which seeks to provide a positive return compared to the daily Federal Funds Open Rate by investing in high-quality, U.S. dollar-denominated short-term money market instruments and is exempt from registration under Section 3(c)(7) of the 1940 Act. Securities Lending Fund is managed by Allspring Funds Management and is subadvised by Allspring Investments. Allspring Funds Management receives an advisory fee starting at 0.05% and declining to 0.01% as the average daily net assets of the Securities Lending Fund increase. All of the fees received by Allspring Funds Management are paid to Allspring Investments for its services as subadviser.
In the event of counterparty default or the failure of a borrower to return a loaned security, the Portfolio has the right to use the collateral to offset any losses incurred. As of May 31, 2022, the Portfolio did not have any securities on loan.
Allspring Real Return Portfolio | 45
Notes to financial statements
7. DERIVATIVE TRANSACTIONS
During the year ended May 31, 2022, the Portfolio entered into futures contracts to speculate on interest rates and to help manage the duration of the portfolio. The Portfolio had an average notional amount of $3,064,108 in long futures contracts and $10,847,714 in short futures contracts during the year ended May 31, 2022.
The fair value, realized gains or losses and change in unrealized gains or losses, if any, on derivative instruments are reflected in the corresponding financial statement captions.
8. BANK BORROWINGS
The Trust, along with Allspring Variable Trust and Allspring Funds Trust (excluding the money market funds), are parties to a $350,000,000 revolving credit agreement whereby the Portfolio is permitted to use bank borrowings for temporary or emergency purposes, such as to fund interest holders withdrawal requests. Interest under the credit agreement is charged to the Portfolio based on a borrowing rate equal to the higher of the Federal Funds rate in effect on that day plus 1.25% or the overnight bank funding rate in effect on that day plus 1.25%. In addition, an annual commitment fee equal to 0.25% of the unused balance is allocated to each participating fund.
For the year ended May 31, 2022, there were no borrowings by the Portfolio under the agreement.
9. INDEMNIFICATION
Under the Portfolio's organizational documents, the officers and Trustees have been granted certain indemnification rights against certain liabilities that may arise out of performance of their duties to the Portfolio. The Portfolio has entered into a separate agreement with each Trustee that converts indemnification rights currently existing under the Portfolio’s organizational documents into contractual rights that cannot be changed in the future without the consent of the Trustee. Additionally, in the normal course of business, the Portfolio may enter into contracts with service providers that contain a variety of indemnification clauses. The Portfolio’s maximum exposure under these arrangements is dependent on future claims that may be made against the Portfolio and, therefore, cannot be estimated.
10. CORONAVIRUS (COVID-19) PANDEMIC
On March 11, 2020, the World Health Organization announced that it had made the assessment that coronavirus disease 2019 (“COVID-19”) is a pandemic. The impacts of COVID-19 are affecting the entire global economy, individual companies and investment products, the funds, and the market in general. There is significant uncertainty around the extent and duration of business disruptions related to COVID-19 and the impacts may last for an extended period of time. COVID-19 has led to significant uncertainty and volatility in the financial markets.
46 | Allspring Real Return Portfolio
Report of independent registered public accounting firm
To the Interest Holders of the Portfolio and Board of Trustees
Allspring Master Trust:
Opinion on the Financial Statements
We have audited the accompanying statement of assets and liabilities of Allspring Real Return Portfolio (formerly, Wells Fargo Real Return Portfolio) (the Portfolio), one of the portfolios constituting Allspring Master Trust (formerly, Wells Fargo Master Trust), including the portfolio of investments, as of May 31, 2022, the related statement of operations for the year then ended, the statements of changes in net assets for each of the years in the two-year period then ended, and the related notes (collectively, the financial statements) and the financial highlights for each of the years in the five-year period then ended. In our opinion, the financial statements and financial highlights present fairly, in all material respects, the financial position of the Portfolio as of May 31, 2022, the results of its operations for the year then ended, the changes in its net assets for each of the years in the two-year period then ended, and the financial highlights for each of the years in the five-year period then ended, in conformity with U.S. generally accepted accounting principles.
Basis for Opinion
These financial statements and financial highlights are the responsibility of the Portfolio’s management. Our responsibility is to express an opinion on these financial statements and financial highlights based on our audits. We are a public accounting firm registered with the Public Company Accounting Oversight Board (United States) (PCAOB) and are required to be independent with respect to the Portfolio in accordance with the U.S. federal securities laws and the applicable rules and regulations of the Securities and Exchange Commission and the PCAOB.
We conducted our audits in accordance with the standards of the PCAOB. Those standards require that we plan and perform the audit to obtain reasonable assurance about whether the financial statements and financial highlights are free of material misstatement, whether due to error or fraud. Our audits included performing procedures to assess the risks of material misstatement of the financial statements and financial highlights, whether due to error or fraud, and performing procedures that respond to those risks. Such procedures included examining, on a test basis, evidence regarding the amounts and disclosures in the financial statements and financial highlights. Such procedures also included confirmation of securities owned as of May 31, 2022, by correspondence with the custodian, transfer agent, agent banks and brokers, or by other appropriate auditing procedures. Our audits also included evaluating the accounting principles used and significant estimates made by management, as well as evaluating the overall presentation of the financial statements and financial highlights. We believe that our audits provide a reasonable basis for our opinion.
We have not been able to determine the specific year that we began serving as the auditor of one or more Allspring Funds investment companies; however, we are aware that we have served as the auditor of one or more Allspring Funds investment companies since at least 1955.
Boston, Massachusetts
July 27, 2022
Allspring Real Return Portfolio | 47
Other information (unaudited)
TAX INFORMATION
Pursuant to Section 854 of the Internal Revenue Code, $149,825 of income dividends paid during the fiscal year ended May 31, 2022 has been designated as qualified dividend income (QDI).
For the fiscal year ended May 31, 2022, $3,538,523 has been designated as interest-related dividends for nonresident alien shareholders pursuant to Section 871 of the Internal Revenue Code.
For the fiscal year ended May 31, 2022, 2% of the ordinary income distributed was derived from interest on U.S. government securities.
PROXY VOTING INFORMATION
A description of the policies and procedures used to determine how to vote proxies relating to portfolio securities is available without charge, upon request, by calling 1-800-222-8222, visiting our website at allspringglobal.com, or visiting the SEC website at sec.gov. Information regarding how the proxies related to portfolio securities were voted during the most recent 12-month period ended June 30 is available on the website at allspringglobal.com or by visiting the SEC website at sec.gov.
QUARTERLY PORTFOLIO HOLDINGS INFORMATION
The Fund and Portfolio file their complete schedule of portfolio holdings with the SEC for the first and third quarters of each fiscal year as an exhibit to their reports on Form N-PORT. Shareholders and Interest holders may view the filed Form N-PORT by visiting the SEC website at sec.gov.
48 | Allspring Real Return Fund
Other information (unaudited)
BOARD OF TRUSTEES AND OFFICERS
Each of the Trustees and Officers listed in the table below acts in identical capacities for each fund in the Allspring family of funds, which consists of 137 mutual funds comprising the Allspring Funds Trust, Allspring Variable Trust, Allspring Master Trust and four closed-end funds (collectively the “Fund Complex”). This table should be read in conjunction with the Prospectus and the Statement of Additional Information1. The mailing address of each Trustee and Officer is 525 Market Street, 12th Floor, San Francisco, CA 94105. Each Trustee and Officer serves an indefinite term, however, each Trustee serves such term until reaching the mandatory retirement age established by the Trustees.
Independent Trustees
Name and
year of birth | Position held and
length of service* | Principal occupations during past five years or longer | Current other
public company or
investment
company
directorships |
William R. Ebsworth
(Born 1957) | Trustee,
since 2015 | Retired. From 1984 to 2013, equities analyst, portfolio manager, research director and chief investment officer at Fidelity Management and Research Company in Boston, Tokyo, and Hong Kong, and retired in 2013 as Chief Investment Officer of Fidelity Strategic Advisers, Inc. where he led a team of investment professionals managing client assets. Prior thereto, Board member of Hong Kong Securities Clearing Co., Hong Kong Options Clearing Corp., the Thailand International Fund, Ltd., Fidelity Investments Life Insurance Company, and Empire Fidelity Investments Life Insurance Company. Audit Committee Chair and Investment Committee Chair of the Vincent Memorial Hospital Endowment (non-profit organization). Mr. Ebsworth is a CFA® charterholder. | N/A |
Jane A. Freeman
(Born 1953) | Trustee,
since 2015;
Chair Liaison,
since 2018 | Retired. From 2012 to 2014 and 1999 to 2008, Chief Financial Officer of Scientific Learning Corporation. From 2008 to 2012, Ms. Freeman provided consulting services related to strategic business projects. Prior to 1999, Portfolio Manager at Rockefeller & Co. and Scudder, Stevens & Clark. Board member of the Harding Loevner Funds from 1996 to 2014, serving as both Lead Independent Director and chair of the Audit Committee. Board member of the Russell Exchange Traded Funds Trust from 2011 to 2012 and the chair of the Audit Committee. Ms. Freeman is also an inactive Chartered Financial Analyst. | N/A |
Isaiah Harris, Jr.
(Born 1952) | Trustee,
since 2009; Audit
Committee
Chair,
since 2019 | Retired. Chairman of the Board of CIGNA Corporation from 2009 to 2021, and Director from 2005 to 2008. From 2003 to 2011, Director of Deluxe Corporation. Prior thereto, President and CEO of BellSouth Advertising and Publishing Corp. from 2005 to 2007, President and CEO of BellSouth Enterprises from 2004 to 2005 and President of BellSouth Consumer Services from 2000 to 2003. Emeritus member of the Iowa State University Foundation Board of Governors. Emeritus Member of the Advisory Board of Iowa State University School of Business. Advisory Board Member, Palm Harbor Academy (private school). Advisory Board Member, Fellowship of Christian Athletes. Mr. Harris is a certified public accountant (inactive status). | N/A |
David F. Larcker
(Born 1950) | Trustee,
since 2009 | James Irvin Miller Professor of Accounting at the Graduate School of Business (Emeritus), Stanford University, Director of the Corporate Governance Research Initiative and Senior Faculty of The Rock Center for Corporate Governance since 2006. From 2005 to 2008, Professor of Accounting at the Graduate School of Business, Stanford University. Prior thereto, Ernst & Young Professor of Accounting at The Wharton School, University of Pennsylvania from 1985 to 2005. | N/A |
Allspring Real Return Fund | 49
Other information (unaudited)
Name and
year of birth | Position held and
length of service* | Principal occupations during past five years or longer | Current other
public company or
investment
company
directorships |
Olivia S. Mitchell
(Born 1953) | Trustee,
since 2006;
Nominating and
Governance
Committee Chair,
since 2018 | International Foundation of Employee Benefit Plans Professor since 1993, Wharton School of the University of Pennsylvania. Director of Wharton’s Pension Research Council and Boettner Center on Pensions & Retirement Research, and Research Associate at the National Bureau of Economic Research. Previously taught at Cornell University from 1978 to 1993. | N/A |
Timothy J. Penny
(Born 1951) | Trustee,
since 1996;
Chair,
since 2018 | President and Chief Executive Officer of Southern Minnesota Initiative Foundation, a non-profit organization, since 2007. Member of the Board of Trustees of NorthStar Education Finance, Inc., a non-profit organization, since 2007. | N/A |
James G. Polisson
(Born 1959) | Trustee,
since 2018 | Retired. Chief Marketing Officer, Source (ETF) UK Services, Ltd, from 2015 to 2017. From 2012 to 2015, Principal of The Polisson Group, LLC, a management consulting, corporate advisory and principal investing company. Chief Executive Officer and Managing Director at Russell Investments, Global Exchange Traded Funds from 2010 to 2012. Managing Director of Barclays Global Investors from 1998 to 2010 and Global Chief Marketing Officer for iShares and Barclays Global Investors from 2000 to 2010. Trustee of the San Francisco Mechanics’ Institute, a non-profit organization, from 2013 to 2015. Board member of the Russell Exchange Traded Fund Trust from 2011 to 2012. Director of Barclays Global Investors Holdings Deutschland GmbH from 2006 to 2009. Mr. Polisson is an attorney and has a retired status with the Massachusetts and District of Columbia Bar Associations. | N/A |
Pamela Wheelock
(Born 1959) | Trustee,
since January
2020; previously
Trustee from
January 2018 to
July 2019 | Board member of the Destination Medical Center Economic Development Agency, Rochester, Minnesota since 2019. Interim President of the McKnight Foundation from January to September 2020. McKnight Foundation Consultant, November 2020 to February 2021. Acting Commissioner, Minnesota Department of Human Services, July 2019 through September 2019. Consultant (part-time), Minnesota Department of Human Services, October 2019 through December 2019. Chief Operating Officer, Twin Cities Habitat for Humanity from 2017 to 2019. Vice President of University Services, University of Minnesota from 2012 to 2016. Prior thereto, on the Board of Directors, Governance Committee and Finance Committee for the Minnesota Philanthropy Partners (Saint Paul Foundation) from 2012 to 2018, Interim Chief Executive Officer of Blue Cross Blue Shield of Minnesota from 2011 to 2012, Chairman of the Board from 2009 to 2012 and Board Director from 2003 to 2015. Vice President, Leadership and Community Engagement, Bush Foundation, Saint Paul, Minnesota (a private foundation) from 2009 to 2011. Executive Vice President and Chief Financial Officer, Minnesota Sports and Entertainment from 2004 to 2009 and Senior Vice President from 2002 to 2004. Executive Vice President of the Minnesota Wild Foundation from 2004 to 2008. Commissioner of Finance, State of Minnesota, from 1999 to 2002. Currently Board Chair of the Minnesota Wild Foundation since 2010. | N/A |
* Length of service dates reflect the Trustee’s commencement of service with the Trust’s predecessor entities, where applicable.
50 | Allspring Real Return Fund
Other information (unaudited)
Officers2
Name and
year of birth | Position held and
length of service | Principal occupations during past five years or longer |
Andrew Owen
(Born 1960) | President,
since 2017 | President, Chief Executive Officer and Director of Allspring Funds Management, LLC since 2017 and co-president of Galliard Capital Management, LLC, an affiliate of Allspring Funds Management, LLC, since 2019. Prior thereto, Head of Affiliated Managers, Allspring Global Investments, from 2014 to 2019 and Executive Vice President responsible for marketing, investments and product development for Allspring Funds Management, LLC, from 2009 to 2014. In addition, Mr. Owen was an Executive Vice President of Wells Fargo & Company from 2014 to 2021. |
Jeremy DePalma
(Born 1974) | Treasurer,
since 2012
(for certain funds in
the Fund Complex);
since 2021 (for
the remaining funds in the
Fund Complex) | Senior Vice President of Allspring Funds Management, LLC since 2009. Senior Vice President of Evergreen Investment Management Company, LLC from 2008 to 2010 and head of the Fund Reporting and Control Team within Fund Administration from 2005 to 2010. |
Kate McKinley
(Born 1977) | Chief Legal Officer,
since 2021 | Chief Legal Officer of Allspring Global Investments since 2021. Prior thereto, held various roles at State Street Global Advisors beginning in 2010, including serving as Senior Vice President and General Counsel from 2019 to 2021, and Chief Operating Officer of the Institutional Client Group from 2016 - 2019. Prior to working at State Street Global Advisors served as Assistant General Counsel for Bank of America Corporation from 2005 to 2010 and as an Associate at WilmerHale from 2002 to 2005. |
Christopher Baker
(Born 1976) | Chief Compliance Officer, since 2022 | Global Chief Compliance Officer for Allspring Global Investments since 2022. Prior thereto, Chief Compliance Officer for State Street Global Advisors from 2018 to 2021. Senior Compliance Officer for the State Street divisions of Alternative Investment Solutions, Sector Solutions, and Global Marketing from 2015 to 2018. From 2010 to 2015 Vice President, Global Head of Investment and Marketing Compliance for State Street Global Advisors. |
Matthew Prasse
(Born 1983) | Secretary,
since 2021 | Senior Counsel of the Allspring Legal Department since 2021. Senior Counsel of the Wells Fargo Legal Department from 2018 to 2021. Previously, Counsel for Barings LLC from 2015 to 2018. Prior to joining Barings, Associate at Morgan, Lewis & Bockius LLP from 2008 to 2015. |
1 The Statement of Additional Information includes additional information about the Trustees and is available, without charge, upon request, by calling 1-800-222-8222 or by visiting the website at allspringglobal.com.
2 For those Officers with tenures at Allspring Global Investments and/or Allspring Funds Management, LLC that began prior to 2021, such tenures include years of service during which these businesses/entities were known as Wells Fargo Asset Management and Wells Fargo Funds Management, LLC, respectively.
Allspring Real Return Fund | 51
Other information (unaudited)
LIQUIDITY RISK MANAGEMENT PROGRAM
In accordance with Rule 22e-4 under the Investment Company Act of 1940, as amended (the “Liquidity Rule”), Allspring Funds Trust (“Funds Trust”) has adopted and implemented a liquidity risk management program (the “Program”) on behalf of each of its series (other than the series that operate as money market funds), including the Fund, and Allspring Master Trust (“Master Trust” and together with Funds Trust, the “Trusts”) has adopted and implemented the Program on behalf of each of its series, including the Portfolio, which is reasonably designed to assess and manage the Fund's and the Portfolio’s liquidity risk. “Liquidity risk” is defined under the Liquidity Rule as the risk that the Fund or Portfolio is unable to meet redemption requests without significantly diluting remaining investors’ interests in the Fund or Portfolio. The Trusts’ Boards of Trustees (the “Boards”) previously approved the designation of Allspring Funds Management, LLC (“Allspring Funds Management”), the Fund's investment manager and the Portfolio’s investment adviser, to administer the Program, and Allspring Funds Management has established a Liquidity Risk Management Council (the "Council") composed of personnel from multiple departments within Allspring Funds Management and its affiliates to assist Allspring Funds Management in the administration of the Program.
The Program is comprised of various components designed to support the assessment and/or management of liquidity risk, including: (1) the periodic assessment (no less frequently than annually) of certain factors that influence the Fund's and the Portfolio’s liquidity risk; (2) the periodic classification (no less frequently than monthly) of the Fund's and the Portfolio’s investments into one of four liquidity categories that reflect an estimate of their liquidity under current market conditions; (3) a 15% limit on the acquisition of “illiquid investments” (as defined under the Liquidity Rule); (4) to the extent the Fund or the Portfolio does not invest primarily in “highly liquid investments” (as defined under the Liquidity Rule), the determination of a minimum percentage of the Fund's or Portfolio’s assets that generally will be invested in highly liquid investments (an “HLIM”); (5) if the Fund or the Portfolio has established an HLIM, the periodic review (no less frequently than annually) of the HLIM and the adoption of policies and procedures for responding to a shortfall of the Fund's or the Portfolio’s “highly liquid investments” below its HLIM; and (6) periodic reporting to the Boards.
At a meeting of the Boards held on May 24-25, 2022, the Boards received and reviewed a written report (the “Report”) from Allspring Funds Management that, among other things, addressed the operation of the Program and assessed its adequacy and effectiveness for the period from January 1, 2021 through December 31, 2021 (the “Reporting Period”). Other than extended foreign market holidays, no significant liquidity events impacting the Funds or the Portfolios were noted in the Report. In addition, other than corporate-related changes to the Program, there were no material changes to the Program during the Reporting Period.
Allspring Funds Management determined in the Report that the Program has been implemented and operates effectively to manage each Fund’s and Portfolio’s, including the Fund’s and the Portfolio’s, liquidity risk, and Allspring Funds Management continues to believe that the Program has been and continues to be adequately and effectively implemented to monitor and, as applicable, respond to the Fund’s and the Portfolio’s liquidity developments.
There can be no assurance that the Program will achieve its objectives under all circumstances in the future. With respect to the Fund, please refer to the Fund’s prospectus for more information regarding the Fund’s exposure to liquidity risk and other risks to which an investment in the Fund may be subject.
52 | Allspring Real Return Fund
For more information
More information about Allspring Funds is available free upon request. To obtain literature, please write, visit the Fund's website, or call:
Allspring Funds
P.O. Box 219967
Kansas City, MO 64121-9967
Website: allspringglobal.com
Individual investors: 1-800-222-8222
Retail investment professionals: 1-888-877-9275
Institutional investment professionals: 1-800-260-5969
This report and the financial statements contained herein are submitted for the general information of the shareholders of the Fund. If this report is used for promotional purposes, distribution of the report must be accompanied or preceded by a current prospectus. Before investing, please consider the investment objectives, risks, charges, and expenses of the investment. For a current prospectus and, if available, a summary prospectus, containing this information, call
1-800-222-8222 or visit the Fund's website at allspringglobal.com. Read the prospectus carefully before you invest or send money.
Allspring Global InvestmentsTM is the trade name for the asset management firms of Allspring Global Investments Holdings, LLC, a holding company indirectly owned by certain private funds of GTCR LLC and Reverence Capital Partners, L.P. These firms include but are not limited to Allspring Global Investments, LLC, and Allspring Funds Management, LLC. Certain products managed by Allspring entities are distributed by Allspring Funds Distributor, LLC (a broker-dealer and Member FINRA/SIPC).
This material is for general informational and educational purposes only and is NOT intended to provide investment advice or a recommendation of any kind - including a recommendation for any specific investment, strategy, or plan.
© 2022 Allspring Global Investments Holdings, LLC. All rights reserved.
PAR-0622-00236 07-22
A288/AR288 05-22
Annual Report
May 31, 2022
The views expressed and any forward-looking statements are as of May 31, 2022, unless otherwise noted, and are those of the Fund's portfolio managers and/or Allspring Global Investments. Discussions of individual securities or the markets generally are not intended as individual recommendations. Future events or results may vary significantly from those expressed in any forward-looking statements. The views expressed are subject to change at any time in response to changing circumstances in the market. Allspring Global Investments disclaims any obligation to publicly update or revise any views expressed or forward-looking statements.
Letter to shareholders (unaudited)
Andrew Owen
President
Allspring Funds
Dear Shareholder:
We are pleased to offer you this annual report for the Allspring Index Fund for the 12-month period that ended May 31, 2022. Globally, stocks experienced rising volatility through the period, but overall, U.S. stocks outperformed non-U.S. equities as the global economy faced multiple challenges. Bonds also had poor performance during a difficult period, with major fixed income indexes all down for the 12-month period.
Earlier tailwinds provided by global stimulus programs, vaccination rollouts, and recovering consumer and corporate sentiment were more than offset by the highest rate of inflation in decades, concerns about sharp central bank rate hikes, more highly contagious COVID-19 variants, and the Russian invasion of Ukraine. The impact of already-significant supply chain disruptions were made worse by China’s COVID-19 lockdowns.
For the 12-month period, U.S. large-cap stocks led both non-U.S. developed market equities and emerging market stocks. Returns by fixed-income securities were negative as rising inflation created new challenges. For the period, U.S. stocks, based on the S&P 500 Index,1 lost 0.30%. International stocks, as measured by the MSCI ACWI ex USA Index (Net),2 returned -12.41%, while the MSCI EM Index (Net) (USD)3 had weaker performance with a loss of 19.83%. Among bond indexes, the Bloomberg U.S. Aggregate Bond Index4 returned -8.22%, the Bloomberg Global Aggregate ex-USD Index (unhedged)5 returned -16.68%, the Bloomberg Municipal Bond Index6 lost 6.79%, and the ICE BofA U.S. High Yield Index7 fell 5.00%.
Rising inflation, COVID, and the Russian invasion of Ukraine in February drove market performance.
The period began with the S&P 500 Index reaching an all-time high in June 2021. In late June, the U.S. Congress reached a deal on a $1 trillion infrastructure package for road, bridge, and broadband network upgrades over the next eight years. The U.S. Federal Reserve’s (Fed) June meeting yielded no change to policy, but it forecast a possible interest rate rise in 2023. This, combined with a rebound in economic activity and investors searching for yield, led to a decline in U.S. Treasury yields. Many European and Asian countries saw vaccination momentum increase, while COVID-19 infections rose in the U.K. Meanwhile, the price of crude oil jumped over 10% in June as global economic activity picked up and the Organization of the Petroleum Exporting Countries (OPEC) slowed the pace of supply growth.
| 1 | The S&P 500 Index consists of 500 stocks chosen for market size, liquidity, and industry group representation. It is a market-value-weighted index with each stock's weight in the index proportionate to its market value. You cannot invest directly in an index. |
| 2 | The Morgan Stanley Capital International (MSCI) All Country World Index (ACWI) ex USA Index (Net) is a free-float-adjusted market-capitalization-weighted index that is designed to measure the equity market performance of developed and emerging markets, excluding the U.S. Source: MSCI. MSCI makes no express or implied warranties or representations and shall have no liability whatsoever with respect to any MSCI data contained herein. The MSCI data may not be further redistributed or used as a basis for other indexes or any securities or financial products. This report is not approved, reviewed, or produced by MSCI. You cannot invest directly in an index. |
| 3 | The MSCI Emerging Markets (EM) Index (Net) (USD) is a free-float-adjusted market-capitalization-weighted index that is designed to measure equity market performance of emerging markets. You cannot invest directly in an index. |
| 4 | The Bloomberg U.S. Aggregate Bond Index is a broad-based benchmark that measures the investment-grade, U.S.-dollar-denominated, fixed-rate taxable bond market, including Treasuries, government-related and corporate securities, mortgage-backed securities (agency fixed-rate and hybrid adjustable-rate mortgage pass-throughs), asset-backed securities, and commercial mortgage-backed securities. You cannot invest directly in an index. |
| 5 | The Bloomberg Global Aggregate ex-USD Index (unhedged) is an unmanaged index that provides a broad-based measure of the global investment-grade fixed-income markets excluding the U.S.-dollar-denominated debt market. You cannot invest directly in an index. |
| 6 | The Bloomberg Municipal Bond Index is an unmanaged index composed of long-term tax-exempt bonds with a minimum credit rating of Baa. You cannot invest directly in an index. |
| 7 | The ICE BofA U.S. High Yield Index is a market-capitalization-weighted index of domestic and Yankee high-yield bonds. The index tracks the performance of high-yield securities traded in the U.S. bond market. You cannot invest directly in an index. Copyright 2022. ICE Data Indices, LLC. All rights reserved. |
Letter to shareholders (unaudited)
Inflation continued to climb in July, fueled by the ongoing supply bottleneck and high demand. Monthly U.S. equity gains led those of international developed markets. In contrast, emerging markets had losses for the month, hindered by China’s plans for new regulations, particularly in education and technology. The U.S. 10-year Treasury bond yield continued to decline as strong demand swallowed up supply. After hitting a multiyear high earlier in the month, oil prices leveled off as OPEC agreed to raise oil production.
The COVID-19 Delta variant produced outbreaks globally in August, feeding market volatility and casting doubts over the ongoing economic recovery. The U.S. economy remained strong despite the Delta variant, ongoing inflationary pressures, and worries over Hurricane Ida. Emerging market equities experienced elevated volatility, largely influenced by China’s regulatory stance. Municipal debt had its first monthly loss since February. Among commodities, crude oil fell sharply as the Delta variant caused expectations to dampen. However, oil remained a leading asset-class performer for the year.
Global markets suffered their broadest retreat in a year during September, except for commodities, as concerns over inflation and the interest rate outlook depressed investor confidence. Emerging markets declined on concerns over supply chain disruptions along with rising energy and food prices. Meanwhile, the Fed indicated it would soon start to slow the pace of asset purchases. U.S. concerns included a congressional showdown over the debt ceiling, the 2022 federal government budget, and the infrastructure package. Meanwhile, commodities thrived in September, driven by sharply higher energy prices.
Elevated inflation pressures and the global supply bottleneck continued in October, but strong earnings provided a bright spot in the U.S., the eurozone, and many Asian countries. Government bond yields rose globally as central banks prepared to tighten monetary policy. Commodity prices continued to rise, driven by sharply higher energy costs.
In November, as COVID-19 hospitalizations rose, most major global asset classes declined. Two exceptions were U.S. investment-grade bonds and Treasury Inflation-Protected Securities. President Biden signed a long-awaited infrastructure bill to upgrade U.S. roads, bridges, and railways. Meanwhile, the Consumer Price Index (CPI)1, a measure of domestic inflation conditions, jumped to its highest level in 31 years. While the threat of consistently high inflation led the Fed to discuss a faster pace of tapering, the Omicron strain created uncertainty. Commodities lost ground for the month, driven by sharp declines in oil prices (and energy costs in general) as well as precious metals.
Global volatility lessened in December as data indicated a lower risk of severe disease and death from the Omicron variant. Even so, several countries introduced restrictions on travel and hospitality, among other sectors, in an effort to reduce the spread. In the U.S., data indicated a stable economy overall, with robust corporate earnings. Consumer spending potential looked strong heading into 2022 on elevated household savings and the lowest household debt ratio since 1973. U.S. corporate and high-yield bonds had monthly gains while Treasuries declined. Bonds were strongly affected by the projection of multiple rate hikes in 2022 by senior Federal Open Market Committee members.
In January 2022, the main focus was on potential U.S. interest rate hikes and the Russia-Ukraine conflict. The Fed hinted that a March interest rate hike was likely. Meanwhile, Russia threatened a potential invasion of Ukraine, which could disrupt Russia’s massive energy supplies and drive demand from non-Russian oil-producing countries. Elsewhere overseas, Europe saw food and energy prices spike, leading to rising inflation. Within fixed income, corporate bonds struggled in January, underperforming government bonds, as investors focused on continued elevated inflation and ongoing uncertainty over the U.S. monetary path.
“ Global markets suffered their broadest retreat in a year during September, except for commodities, as concerns over inflation and the interest rate outlook depressed investor confidence.”
| 1 | The Consumer Price Index (CPI) is a measure of the average change over time in the prices paid by urban consumers for a market basket of consumer goods and services. You cannot invest directly in an index. |
Letter to shareholders (unaudited)
“ The Russian invasion of Ukraine dominated the financial world in February and March. Equity, bond, and commodity markets were shaken by fear, uncertainty, and an upending of demand-supply dynamics.” |
The Russian invasion of Ukraine dominated the financial world in February and March. Equity, bond, and commodity markets were shaken by fear, uncertainty, and an upending of demand-supply dynamics. Major global stock indexes were down in February, along with global bonds overall, with ongoing high levels of volatility in March along with mixed results that favored U.S. large-cap stocks. Prices of commodities spiked, including crude oil, natural gas, wheat, and precious metals, on elevated concerns of supply shortages. All of this fed already-high inflation concerns and added to expectations of more aggressive central bank interest rate hikes. Sweeping sanctions against Russia and corporate pullouts contributed to market volatility. Despite the geopolitical turmoil, the U.S. economic outlook remained largely unchanged, with a healthy job market and signs of economic resilience accompanying higher prices.
In April, market volatility continued, with deepening losses across major capital markets, as both the S&P 500 and MSCI ACWI (Net)1 fell 8% or more for the month. The Chinese economy struggled through a strict lockdown as the government tried to contain a major COVID-19 outbreak, creating a global ripple effect that compounded existing supply shortages. This was exacerbated by the impact of the Russia-Ukraine war on global commodities. Meanwhile, U.S. annual inflation raged at 8.5%, its highest level since 1981, and investors braced themselves for aggressive Fed monetary tightening moves.
Market volatility continued in May, but full-month returns belied that as markets recovered ground late in the month. Value stocks continued to outperform growth stocks. The concerns that had dominated markets for months continued, including high inflation (the CPI remained above 8%) and geopolitical tensions that exacerbated high crude oil, gasoline, and food prices. In response, the Fed raised the federal funds rate by 0.50%, with broad expectations of multiple rate hikes to come. Meanwhile, highly contagious COVID-19 variants persisted. However, labor markets in the U.S., the U.K., and Europe remained strong. The U.S. recorded a 3.6% unemployment rate, although labor market participation remained low. U.S. retail sales increased for the fourth consecutive month in April, indicating continued consumer resilience.
Don’t let short-term uncertainty derail long-term investment goals.
Periods of investment uncertainty can present challenges, but experience has taught us that maintaining long-term investment goals can be an effective way to plan for the future. To help you create a sound strategy based on your personal goals and risk tolerance, Allspring Funds offers more than 100 mutual funds spanning a wide range of asset classes and investment styles. Although diversification cannot guarantee an investment profit or prevent losses, we believe it can be an effective way to manage investment risk and potentially smooth out overall portfolio performance. We encourage investors to know their investments and to understand that appropriate levels of risk-taking may unlock opportunities.
Thank you for choosing to invest with Allspring Funds. We appreciate your confidence in us and remain committed to helping you meet your financial needs.
Sincerely,
Andrew Owen
President
Allspring Funds
For further information about your fund, contact your investment professional, visit our website at allspringglobal.com, or call us directly at 1-800-222-8222.
| 1 | The MSCI ACWI (Net) is a free-float-adjusted market-capitalization-weighted index that is designed to measure the equity market performance of developed and emerging markets. You cannot invest directly in an index. |
Letter to shareholders (unaudited)
Notice to Shareholders
Russia launched a large-scale invasion of Ukraine on February 24, 2022. As a result of this military action, the United States and many other countries have instituted various economic sanctions against Russian and Belarus individuals and entities. The situation has led to increased financial market volatility and has had severe adverse effects on regional and global economic markets, including the markets for certain securities and commodities, such as oil and natural gas. The extent and duration of the military action, resulting sanctions imposed, other punitive action taken and the resulting market disruptions cannot be easily predicted.
Our solidarity and support goes out to our impacted employees and the people affected in Ukraine and their families. Allspring has a dedicated team of investment professionals actively monitoring the situation for any new developments and the potential impact to our clients and investment products. As the situation remains fluid, we are focused on the assessment of risks, valuation, and liquidity of impacted securities. Please visit our website at allspringglobal.com and click on “Russia-Ukraine Updates” for further information.
Notice to Shareholders
At a meeting held February 23-24, 2022, the Board of Trustees of the Fund approved a proposal to collapse the master-feeder structure under which the Fund invested 100% of its assets in the Allspring Index Portfolio. On June 1, 2022, the Fund began to invest substantially all of its assets directly in a portfolio of securities based on the Fund’s existing investment strategy. For additional details regarding this and related changes, please consult the Fund’s prospectuses, summary prospectuses and statement of additional information.
Performance highlights (unaudited)
Investment objectiveThe Fund seeks to replicate the total returns of the S&P 500 Index, before fees and expenses.
| Manager | Allspring Funds Management, LLC |
Subadviser for the affiliated master portfolio*
Allspring Global Investments, LLC
| Portfolio managers | John R. Campbell, CFA®‡, David Neal, CFA®‡, Robert M. Wicentowski, CFA®‡ |
| Average annual total returns (%) as of May 31, 2022 |
| | | Including sales charge | | Excluding sales charge | | Expense ratios1 (%) |
| | Inception date | 1 year | 5 year | 10 year | | 1 year | 5 year | 10 year | | Gross | Net 2 |
| Class A (WFILX) | 11-4-1998 | -6.44 | 11.49 | 13.15 | | -0.74 | 12.82 | 13.82 | | 0.66 | 0.45 |
| Class C (WFINX) | 4-30-1999 | -2.48 | 12.00 | 13.14 | | -1.48 | 12.00 | 13.14 | | 1.41 | 1.20 |
| Administrator Class (WFIOX) | 2-14-1985 | – | – | – | | -0.55 | 13.04 | 14.09 | | 0.43 | 0.25 |
| S&P 500 Index3 | – | – | – | – | | -0.30 | 13.38 | 14.40 | | – | – |
Figures quoted represent past performance, which is no guarantee of future results, and do not reflect taxes that a shareholder may pay on an investment in a fund. Investment return and principal value of an investment will fluctuate so that an investor’s shares, when redeemed, may be worth more or less than their original cost. Performance shown without sales charges would be lower if sales charges were reflected. Current performance may be lower or higher than the performance data quoted, which assumes the reinvestment of dividends and capital gains. Current month-end performance is available on the Fund’s website, allspringglobal.com.
Index returns do not include transaction costs associated with buying and selling securities, any mutual fund fees or expenses, or any taxes. It is not possible to invest directly in an index.
For Class A shares, the maximum front-end sales charge is 5.75%. For Class C shares, the maximum contingent deferred sales charge is 1.00%. Performance including a contingent deferred sales charge assumes the sales charge for the corresponding time period. Administrator Class shares are sold without a front-end sales charge or contingent deferred sales charge.
| 1 | Reflects the expense ratios as stated in the most recent prospectuses. The expense ratios shown are subject to change and may differ from the annualized expense ratios shown in the financial highlights of this report. |
| 2 | The manager has contractually committed through September 30, 2022, to waive fees and/or reimburse expenses to the extent necessary to cap total annual fund operating expenses after fee waivers at 0.45% for Class A, 1.20% for Class C and 0.25% for Administrator Class. Brokerage commissions, stamp duty fees, interest, taxes, acquired fund fees and expenses (if any) from funds in which the affiliated master portfolio invests, and extraordinary expenses are excluded from the expense caps. Net expenses from the affiliated master portfolio are included in the expense caps. Prior to or after the commitment expiration date, the caps may be increased or the commitment to maintain the caps may be terminated only with the approval of the Board of Trustees. Without these caps, the Fund’s returns would have been lower. The expense ratio paid by an investor is the net expense ratio (the total annual fund operating expenses after fee waivers) as stated in the prospectuses. |
| 3 | The S&P 500 Index consists of 500 stocks chosen for market size, liquidity, and industry group representation. It is a market-value weighted index with each stock’s weight in the index proportionate to its market value. You cannot invest directly in an index. |
Stock values fluctuate in response to the activities of individual companies and general market and economic conditions. The use of derivatives may reduce returns and/or increase volatility. Consult the Fund’s prospectus for additional information on these and other risks.
| * | The Fund is a feeder fund in a master-feeder structure that invests substantially all of its assets in a single affiliated master portfolio of the Allspring Master Trust with a substantially identical investment objective and substantially similar investment strategies. References to the investment activities of the Fund are intended to refer to the investment activities of the affiliated master portfolio in which it invests. |
| ‡ | CFA® and Chartered Financial Analyst® are trademarks owned by CFA Institute. |
Performance highlights (unaudited)
Growth of $10,000 investment as of May 31, 20221
| 1 | The chart compares the performance of Class A shares for the most recent ten years with the S&P 500 Index. The chart assumes a hypothetical investment of $10,000 in Class A shares and reflects all operating expenses and assumes the maximum initial sales charge of 5.75%. |
Performance highlights (unaudited)
MANAGER'S DISCUSSION
Fund highlights
| ■ | The Fund underperformed its benchmark, the S&P 500 Index, for the 12-month period that ended May 31, 2022. |
| ■ | During the period, the Fund experienced negative returns in the communication services, consumer discretionary, industrials, and financials sectors, while it benefited from positive returns in seven of the Global Industry Classification Standard economic sectors. |
| ■ | Communication services was the Fund’s lowest-performing sector, while energy was the best performer by far. |
Conditions supported equity markets through the end of 2021.
Throughout most of 2021, equity markets were supported by robust corporate earnings and consumer spending, still-accommodative monetary policy, and an improving labor market. Toward the end of the year, equities overcame rising inflation, slowing economic growth, supply chain disruptions, waning fiscal stimulus, and the emergence of the Omicron variant of COVID-19.
| Ten largest holdings (%) as of May 31, 20221 |
| Apple Incorporated | 6.48 |
| Microsoft Corporation | 5.72 |
| Amazon.com Incorporated | 2.95 |
| Alphabet Incorporated Class A | 1.92 |
| Tesla Motors Incorporated | 1.78 |
| Alphabet Incorporated Class C | 1.78 |
| Berkshire Hathaway Incorporated Class B | 1.63 |
| Johnson & Johnson | 1.33 |
| UnitedHealth Group Incorporated | 1.31 |
| NVIDIA Corporation | 1.31 |
| 1 | Each holding represents the Fund’s allocable portion of the affiliated master portfolio security. Figures represent each holding as a percentage of the Fund’s net assets. Holdings are subject to change and may have changed since the date specified. |
2022 was volatile in its first five months, with a market correction, a war in Ukraine, and surging inflation.
A volatile start to 2022 began with January’s market correction and included a rally in March that partially offset some of the earlier losses. The economy continued to rebound in early 2022, showing minimal disruption by the Omicron wave of COVID-19. However, the post–Cold War era effectively ended on February 24, when Russia’s full-scale invasion of Ukraine triggered the largest European military conflict since World War II. As shockwaves rippled across global commodities markets, a United States– and European Union–led coalition of governments, central banks, and corporations imposed unprecedented sanctions designed to isolate and financially cripple Russia, the world’s third-largest
oil producer. The fallout from Russia’s aggression sparked the worst global energy crisis since 1973. By April, global equity markets came under intense pressure from elevated inflation, surging energy prices, slowing growth, tightening monetary policy, and Russia’s ongoing war with Ukraine.
| Sector allocation as of May 31, 20221 |
| 1 | Figures represent the sector allocation of the affiliated master portfolio as a percentage of the long-term investments of the affiliated master portfolio. These amounts are subject to change and may have changed since the date specified. |
The Fund’s periodic rebalancing aligned with the changing weights and constituents of the S&P 500 Index.
The objective of the Fund is to replicate the performance of the S&P 500 Index before fees and expenses. The portfolio management team uses an investment process designed with the goal of controlling trading and implementation costs and reducing tracking error as much as possible. The portfolio holdings will be highly reflective of the index composition, and the strategy’s performance should closely align with that of the index. Periodic rebalancing takes place to reflect the frequently changing weights and constituents of the index. Consistent with its objective, during the period, the Fund performed closely in line with the return of the benchmark before fees and expenses.
Performance highlights (unaudited)
The communication services and consumer discretionary sectors produced the lowest returns.
Within communication services, 59% of the holdings (17 of 29) were down double digits and only two stocks finished with positive returns. Interactive media and entertainment companies, including Meta Platforms, Inc.; The Walt Disney Co.; and Netflix, Inc., were significant detractors. Within consumer discretionary, 59% of companies (44 of 74) also had double-digit losses. A significant decline in Amazon.com, Inc., one of the S&P 500’s largest constituents, was the largest detractor from the overall index over the period.
The energy sector led the S&P 500 Index.
Within the energy sector, 88% of companies (21 of 24) were up double digits, including six with triple-digit returns. The three largest oil, gas, and consumable fuels companies in the index returned more than 70% each and contributed about 1% to the index return. Crude oil prices have risen
significantly since the beginning of the war in Ukraine and these companies are reaping the benefits of those higher prices.
Accommodative monetary and fiscal policy could rapidly shift the economy into mid-cycle dynamics.
For 2022, given a slowing growth backdrop and tightening financial conditions, we doubt we will see broad-based expansion of stock valuations. Strong revenue growth could offset some margin compression, but we expect that in 2022 there will be a divergence between firms that can maintain their margins and expand market share versus those that cannot. As the economic data continues to decelerate from the lofty levels of the post-pandemic restart, we would expect the market to emphasize higher-quality stocks. The path forward will likely be volatile as equity markets are expected to be highly susceptible to geopolitical tensions and changes in monetary policy.
Fund expenses (unaudited)
As a shareholder of the Fund, you incur two types of costs: (1) transaction costs, including sales charges (loads) on purchase payments and contingent deferred sales charges (if any) on redemptions and (2) ongoing costs, including management fees, distribution (12b-1) and/or shareholder servicing fees, and other Fund expenses. This example is intended to help you understand your ongoing costs (in dollars) of investing in the Fund and to compare these costs with the ongoing costs of investing in other mutual funds.
The example is based on an investment of $1,000 invested at the beginning of the six-month period and held for the entire period from December 1, 2021 to May 31, 2022.
Actual expenses
The “Actual” line of the table below provides information about actual account values and actual expenses. You may use the information in this line, together with the amount you invested, to estimate the expenses that you paid over the period. Simply divide your account value by $1,000 (for example, an $8,600 account value divided by $1,000 = 8.6), then multiply the result by the number in the “Actual” line under the heading entitled “Expenses paid during period” for your applicable class of shares to estimate the expenses you paid on your account during this period.
Hypothetical example for comparison purposes
The “Hypothetical” line of the table below provides information about hypothetical account values and hypothetical expenses based on the Fund’s actual expense ratio and an assumed rate of return of 5% per year before expenses, which is not the Fund’s actual return. The hypothetical account values and expenses may not be used to estimate the actual ending account balance or expenses you paid for the period. You may use this information to compare the ongoing costs of investing in the Fund and other funds. To do so, compare this 5% hypothetical example with the 5% hypothetical examples that appear in the shareholder reports of the other funds.
Please note that the expenses shown in the table are meant to highlight your ongoing costs only and do not reflect any transactional costs, such as sales charges (loads) and contingent deferred sales charges. Therefore, the “Hypothetical” line of the table is useful in comparing ongoing costs only, and will not help you determine the relative total costs of owning different funds. In addition, if these transactional costs were included, your costs would have been higher.
| | Beginning
account value
12-1-2021 | Ending
account value
5-31-2022 | Expenses
paid during
the period1,2 | Annualized net
expense ratio2 |
| Class A | | | | |
| Actual | $1,000.00 | $ 909.60 | $2.09 | 0.44% |
| Hypothetical (5% return before expenses) | $1,000.00 | $1,022.74 | $2.22 | 0.44% |
| Class C | | | | |
| Actual | $1,000.00 | $ 906.04 | $5.70 | 1.20% |
| Hypothetical (5% return before expenses) | $1,000.00 | $1,018.95 | $6.04 | 1.20% |
| Administrator Class | | | | |
| Actual | $1,000.00 | $ 910.36 | $1.19 | 0.25% |
| Hypothetical (5% return before expenses) | $1,000.00 | $1,023.68 | $1.26 | 0.25% |
1 Expenses paid is equal to the annualized net expense ratio of each class multiplied by the average account value over the period, multiplied by 182 divided by 366 (to reflect the one-half-year period).
2 Amounts reflect net expenses allocated from the affiliated Master Portfolio in which the Fund invests.
10 | Allspring Index Fund
Portfolio of investments—May 31, 2022
| | | | | | Value |
| Investment companies: 100.09% | | | | | |
| Affiliated master portfolio: 100.09% | | | | | |
| Allspring Index Portfolio | | | | | $ 1,153,439,883 |
| Total Investment companies (Cost $130,653,830) | | | | | 1,153,439,883 |
| Total investments in securities (Cost $130,653,830) | 100.09% | | | | 1,153,439,883 |
| Other assets and liabilities, net | (0.09) | | | | (1,010,387) |
| Total net assets | 100.00% | | | | $1,152,429,496 |
Transactions with the affiliated Master Portfolio were as follows:
| | % of
ownership,
beginning
of period | % of
ownership,
end of
period | Net realized
gains
(losses) on
securities
transactions
allocated
from
affiliated
Master
Portfolio | Net
change in
unrealized
gains
(losses) on
securities
transactions
allocated
from
affiliated
Master
Portfolio | Dividends
allocated
from
affiliated
Master
Portfolio | Affiliated
income
allocated
from
affiliated
Master
Portfolio | Value,
end of
period | |
| Allspring Index Portfolio | 96.64% | 100.00% | $112,329,447 | $(127,015,886) | $17,490,724 | $19,097 | $1,153,439,883 | |
The accompanying notes are an integral part of these financial statements.
Allspring Index Fund | 11
Statement of assets and liabilities—May 31, 2022
| | |
| Assets | |
Investments in affiliated Master Portfolio, at value (cost $130,653,830)
| $ 1,153,439,883 |
Receivable for Fund shares sold
| 432,650 |
Receivable from manager
| 116,971 |
Total assets
| 1,153,989,504 |
| Liabilities | |
Payable for Fund shares redeemed
| 1,099,660 |
Shareholder servicing fees payable
| 184,145 |
Administration fees payable
| 177,521 |
Distribution fee payable
| 6,611 |
Trustees’ fees and expenses payable
| 3,206 |
Accrued expenses and other liabilities
| 88,865 |
Total liabilities
| 1,560,008 |
Total net assets
| $1,152,429,496 |
| Net assets consist of | |
Paid-in capital
| $ 57,774,580 |
Total distributable earnings
| 1,094,654,916 |
Total net assets
| $1,152,429,496 |
| Computation of net asset value and offering price per share | |
Net assets – Class A
| $ 771,924,921 |
Shares outstanding – Class A1
| 16,969,627 |
Net asset value per share – Class A
| $45.49 |
Maximum offering price per share – Class A2
| $48.27 |
Net assets – Class C
| $ 10,537,711 |
Shares outstanding – Class C1
| 226,607 |
Net asset value per share – Class C
| $46.50 |
Net assets – Administrator Class
| $ 369,966,864 |
Shares outstanding – Administrator Class1
| 7,916,603 |
Net asset value per share – Administrator Class
| $46.73 |
| 1 | The Fund has an unlimited number of authorized shares. |
| 2 | Maximum offering price is computed as 100/94.25 of net asset value. On investments of $50,000 or more, the offering price is reduced. |
The accompanying notes are an integral part of these financial statements.
12 | Allspring Index Fund
Statement of operations—year ended May 31, 2022
| | |
| Investment income | |
Dividends allocated from affiliated Master Portfolio (net of foreign withholding taxes of $85,108)
| $ 17,490,724 |
Affiliated income allocated from affiliated Master Portfolio
| 19,097 |
Expenses allocated from affiliated Master Portfolio
| (1,415,982) |
Total investment income
| 16,093,839 |
| Expenses | |
Management fee
| 643,597 |
| Administration fees | |
Class A
| 1,793,269 |
Class C
| 25,728 |
Administrator Class
| 547,307 |
| Shareholder servicing fees | |
Class A
| 2,134,845 |
Class C
| 30,542 |
Administrator Class
| 310,348 |
| Distribution fee | |
Class C
| 91,200 |
Custody and accounting fees
| 7,696 |
Professional fees
| 33,279 |
Registration fees
| 16,479 |
Shareholder report expenses
| 27,169 |
Trustees’ fees and expenses
| 20,687 |
Other fees and expenses
| 1,107 |
Total expenses
| 5,683,253 |
| Less: Fee waivers and/or expense reimbursements | |
Fund-level
| (1,531,621) |
Class A
| (597,756) |
Class C
| (6,126) |
Administrator Class
| (1,646) |
Net expenses
| 3,546,104 |
Net investment income
| 12,547,735 |
| Realized and unrealized gains (losses) on investments | |
Net realized gains on securities transactions allocated from affiliated Master Portfolio
| 112,329,479 |
Net change in unrealized gains (losses) on securities transactions allocated from affiliated Master Portfolio
| (127,015,918) |
Net realized and unrealized gains (losses) on investments
| (14,686,439) |
Net decrease in net assets resulting from operations
| $ (2,138,704) |
The accompanying notes are an integral part of these financial statements.
Allspring Index Fund | 13
Statement of changes in net assets
| | | | | |
| | Year ended
May 31, 2022 | Year ended
May 31, 2021 |
| Operations | | | | |
Net investment income
| | $ 12,547,735 | | $ 13,016,141 |
Net realized gains on investments
| | 112,329,479 | | 101,189,274 |
Net change in unrealized gains (losses) on investments
| | (127,015,918) | | 267,094,800 |
Net increase (decrease) in net assets resulting from operations
| | (2,138,704) | | 381,300,215 |
| Distributions to shareholders from | | | | |
| Net investment income and net realized gains | | | | |
Class A
| | (77,882,126) | | (99,506,178) |
Class C
| | (1,006,598) | | (1,661,488) |
Administrator Class
| | (38,543,455) | | (50,898,614) |
Total distributions to shareholders
| | (117,432,179) | | (152,066,280) |
| Capital share transactions | Shares | | Shares | |
| Proceeds from shares sold | | | | |
Class A
| 434,540 | 22,338,966 | 543,966 | 25,097,626 |
Class C
| 20,668 | 1,096,073 | 12,993 | 609,026 |
Administrator Class
| 541,048 | 28,070,542 | 1,009,053 | 47,555,074 |
| | | 51,505,581 | | 73,261,726 |
| Reinvestment of distributions | | | | |
Class A
| 1,474,352 | 75,486,719 | 2,188,868 | 96,461,288 |
Class C
| 16,134 | 841,241 | 31,396 | 1,403,441 |
Administrator Class
| 682,313 | 35,905,912 | 1,056,266 | 47,713,951 |
| | | 112,233,872 | | 145,578,680 |
| Payment for shares redeemed | | | | |
Class A
| (1,599,593) | (81,454,786) | (2,068,334) | (95,239,910) |
Class C
| (54,965) | (2,849,529) | (183,902) | (8,615,422) |
Administrator Class
| (1,365,467) | (70,021,494) | (2,159,572) | (101,444,640) |
| | | (154,325,809) | | (205,299,972) |
Net increase in net assets resulting from capital share transactions
| | 9,413,644 | | 13,540,434 |
Total increase (decrease) in net assets
| | (110,157,239) | | 242,774,369 |
| Net assets | | | | |
Beginning of period
| | 1,262,586,735 | | 1,019,812,366 |
End of period
| | $1,152,429,496 | | $1,262,586,735 |
The accompanying notes are an integral part of these financial statements.
14 | Allspring Index Fund
Financial highlights
(For a share outstanding throughout each period)
| | Year ended May 31 |
| Class A | 2022 | 2021 | 2020 | 2019 | 2018 |
Net asset value, beginning of period
| $50.17 | $41.27 | $49.48 | $63.35 | $66.85 |
Net investment income
| 0.46 | 0.48 | 0.65 | 0.82 | 0.99 1 |
Net realized and unrealized gains (losses) on investments
| (0.33) | 14.92 | 5.82 | 0.54 | 7.99 |
Total from investment operations
| 0.13 | 15.40 | 6.47 | 1.36 | 8.98 |
| Distributions to shareholders from | | | | | |
Net investment income
| (0.46) | (0.57) | (0.67) | (0.90) | (1.02) |
Net realized gains
| (4.35) | (5.93) | (14.01) | (14.33) | (11.46) |
Total distributions to shareholders
| (4.81) | (6.50) | (14.68) | (15.23) | (12.48) |
Net asset value, end of period
| $45.49 | $50.17 | $41.27 | $49.48 | $63.35 |
Total return2
| (0.74)% | 39.71% | 12.02% | 3.32% | 13.87% |
| Ratios to average net assets (annualized)* | | | | | |
Gross expenses
| 0.63% | 0.65% | 0.67% | 0.65% | 0.63% |
Net expenses
| 0.44% | 0.44% | 0.44% | 0.45% | 0.45% |
Net investment income
| 0.92% | 1.08% | 1.47% | 1.51% | 1.49% |
| Supplemental data | | | | | |
Portfolio turnover rate3
| 2% | 4% | 3% | 4% | 3% |
Net assets, end of period (000s omitted)
| $771,925 | $835,781 | $660,101 | $676,511 | $702,866 |
| * | Ratios include net expenses allocated from the affiliated Master Portfolio which were as follows: |
| Year ended May 31, 2022 | 0.11% |
| Year ended May 31, 2021 | 0.11% |
| Year ended May 31, 2020 | 0.12% |
| Year ended May 31, 2019 | 0.11% |
| Year ended May 31, 2018 | 0.10% |
| 1 | Calculated based upon average shares outstanding |
| 2 | Total return calculations do not include any sales charges. |
| 3 | Portfolio turnover rate is calculated by multiplying the affiliated Master Portfolio’s percentage of the Fund’s total investment in securities at the end of the period by the affiliated Master Portfolio’s portfolio turnover rate. |
The accompanying notes are an integral part of these financial statements.
Allspring Index Fund | 15
Financial highlights
(For a share outstanding throughout each period)
| | Year ended May 31 |
| Class C | 2022 | 2021 | 2020 | 2019 | 2018 |
Net asset value, beginning of period
| $51.19 | $41.90 | $50.02 | $63.67 | $67.11 |
Net investment income
| 0.08 1 | 0.16 1 | 0.30 | 0.46 1 | 0.50 1 |
Net realized and unrealized gains (losses) on investments
| (0.37) | 15.21 | 5.84 | 0.52 | 8.00 |
Total from investment operations
| (0.29) | 15.37 | 6.14 | 0.98 | 8.50 |
| Distributions to shareholders from | | | | | |
Net investment income
| (0.05) | (0.15) | (0.25) | (0.30) | (0.48) |
Net realized gains
| (4.35) | (5.93) | (14.01) | (14.33) | (11.46) |
Total distributions to shareholders
| (4.40) | (6.08) | (14.26) | (14.63) | (11.94) |
Net asset value, end of period
| $46.50 | $51.19 | $41.90 | $50.02 | $63.67 |
Total return2
| (1.48)% | 38.83% | 11.17% | 2.54% | 13.02% |
| Ratios to average net assets (annualized)* | | | | | |
Gross expenses
| 1.37% | 1.40% | 1.42% | 1.39% | 1.38% |
Net expenses
| 1.20% | 1.20% | 1.20% | 1.20% | 1.20% |
Net investment income
| 0.16% | 0.34% | 0.72% | 0.77% | 0.72% |
| Supplemental data | | | | | |
Portfolio turnover rate3
| 2% | 4% | 3% | 4% | 3% |
Net assets, end of period (000s omitted)
| $10,538 | $12,530 | $16,103 | $19,146 | $66,117 |
| * | Ratios include net expenses allocated from the affiliated Master Portfolio which were as follows: |
| Year ended May 31, 2022 | 0.11% |
| Year ended May 31, 2021 | 0.11% |
| Year ended May 31, 2020 | 0.12% |
| Year ended May 31, 2019 | 0.11% |
| Year ended May 31, 2018 | 0.10% |
| 1 | Calculated based upon average shares outstanding |
| 2 | Total return calculations do not include any sales charges. |
| 3 | Portfolio turnover rate is calculated by multiplying the affiliated Master Portfolio’s percentage of the Fund’s total investment in securities at the end of the period by the affiliated Master Portfolio’s portfolio turnover rate. |
The accompanying notes are an integral part of these financial statements.
16 | Allspring Index Fund
Financial highlights
(For a share outstanding throughout each period)
| | Year ended May 31 |
| Administrator Class | 2022 | 2021 | 2020 | 2019 | 2018 |
Net asset value, beginning of period
| $51.41 | $42.15 | $50.24 | $64.04 | $67.43 |
Net investment income
| 0.58 | 0.58 | 0.81 | 1.02 1 | 1.26 |
Net realized and unrealized gains (losses) on investments
| (0.36) | 15.26 | 5.85 | 0.48 | 7.94 |
Total from investment operations
| 0.22 | 15.84 | 6.66 | 1.50 | 9.20 |
| Distributions to shareholders from | | | | | |
Net investment income
| (0.55) | (0.65) | (0.74) | (0.97) | (1.13) |
Net realized gains
| (4.35) | (5.93) | (14.01) | (14.33) | (11.46) |
Total distributions to shareholders
| (4.90) | (6.58) | (14.75) | (15.30) | (12.59) |
Net asset value, end of period
| $46.73 | $51.41 | $42.15 | $50.24 | $64.04 |
Total return
| (0.55)% | 39.97% | 12.25% | 3.52% | 14.10% |
| Ratios to average net assets (annualized)* | | | | | |
Gross expenses
| 0.37% | 0.42% | 0.44% | 0.41% | 0.40% |
Net expenses
| 0.25% | 0.25% | 0.25% | 0.25% | 0.25% |
Net investment income
| 1.11% | 1.28% | 1.67% | 1.72% | 1.70% |
| Supplemental data | | | | | |
Portfolio turnover rate2
| 2% | 4% | 3% | 4% | 3% |
Net assets, end of period (000s omitted)
| $369,967 | $414,276 | $343,609 | $460,934 | $829,004 |
| * | Ratios include net expenses allocated from the affiliated Master Portfolio which were as follows: |
| Year ended May 31, 2022 | 0.11% |
| Year ended May 31, 2021 | 0.11% |
| Year ended May 31, 2020 | 0.12% |
| Year ended May 31, 2019 | 0.11% |
| Year ended May 31, 2018 | 0.10% |
| 1 | Calculated based upon average shares outstanding |
| 2 | Portfolio turnover rate is calculated by multiplying the affiliated Master Portfolio’s percentage of the Fund’s total investment in securities at the end of the period by the affiliated Master Portfolio’s portfolio turnover rate. |
The accompanying notes are an integral part of these financial statements.
Allspring Index Fund | 17
Notes to financial statements
1. ORGANIZATION
Allspring Funds Trust (the "Trust"), a Delaware statutory trust organized on March 10, 1999, is an open-end management investment company registered under the Investment Company Act of 1940, as amended (the "1940 Act"). As an investment company, the Trust follows the accounting and reporting guidance in Financial Accounting Standards Board ("FASB") Accounting Standards Codification Topic 946, Financial Services – Investment Companies. These financial statements report on the Allspring Index Fund (the "Fund") which is a diversified series of the Trust.
The Fund is a feeder fund in a master-feeder structure that invests substantially all of its assets in a single master portfolio with a substantially identical investment objective and substantially similar investment strategies. The Fund invests in Allspring Index Portfolio, a separate diversified portfolio (the “affiliated Master Portfolio”) of Allspring Master Trust, a registered open-end management investment company. As of May 31, 2022, the Fund owned 100.00% of Allspring Index Portfolio. The affiliated Master Portfolio directly acquires portfolio securities and the Fund acquires an indirect interest in those securities. The Fund accounts for its investment in the affiliated Master Portfolio as a partnership investment and records on a daily basis its share of the affiliated Master Portfolio’s income, expense and realized and unrealized gains and losses. The financial statements of the affiliated Master Portfolio for the year ended May 31, 2022 are included in this report and should be read in conjunction with the Fund’s financial statements.
Effective on November 1, 2021, the sale transaction of Wells Fargo Asset Management ("WFAM") by Wells Fargo & Company to GTCR LLC and Reverence Capital Partners, L.P. was closed. In connection with the closing of the transaction, WFAM became known as Allspring Global Investments (“Allspring”) and various entities that provided services to the Fund changed their names to "Allspring", including Allspring Funds Management, LLC, the investment manager to the Fund, Allspring Global Investments, LLC and Allspring Global Investments (UK) Limited, both registered investment advisers providing subadvisory services to certain funds, and Allspring Funds Distributor, LLC, the Fund's principal underwriter. Consummation of the transaction resulted in a new investment management agreement and subadvisory agreement which became effective on November 1, 2021.
2. SIGNIFICANT ACCOUNTING POLICIES
The following significant accounting policies, which are consistently followed in the preparation of the financial statements of the Fund, are in conformity with U.S. generally accepted accounting principles which require management to make estimates and assumptions that affect the reported amounts of assets and liabilities, disclosure of contingent assets and liabilities at the date of the financial statements, and the reported amounts of income and expenses during the reporting period. Actual results could differ from those estimates.
Securities valuation
All investments are valued each business day as of the close of regular trading on the New York Stock Exchange (generally 4 p.m. Eastern Time), although the Fund may deviate from this calculation time under unusual or unexpected circumstances.
Investments in the affiliated Master Portfolio are valued daily based on the Fund’s proportionate share of the affiliated Master Portfolio’s net assets, which are also valued daily. Securities held in the affiliated Master Portfolio are valued as discussed in the Notes to Financial Statements of the affiliated Master Portfolio, which are included elsewhere in this report.
Investments which are not valued using the method discussed above are valued at their fair value, as determined in good faith by the Board of Trustees. The Board of Trustees has established a Valuation Committee comprised of the Trustees and has delegated to it the authority to take any actions regarding the valuation of portfolio securities that the Valuation Committee deems necessary or appropriate, including determining the fair value of portfolio securities, unless the determination has been delegated to the Allspring Global Investments Pricing Committee at Allspring Funds Management, LLC ("Allspring Funds Management"). The Board of Trustees retains the authority to make or ratify any valuation decisions or approve any changes to the Valuation Procedures as it deems appropriate. On a quarterly basis, the Board of Trustees receives reports on any valuation actions taken by the Valuation Committee or the Allspring Global Investments Pricing Committee which may include items for ratification.
Investment transactions, income and expenses
Investments in the affiliated Master Portfolio are recorded on a trade date basis. The Fund records daily its proportionate share of the affiliated Master Portfolio’s income, expenses and realized and unrealized gains or losses. The Fund also accrues its own expenses.
18 | Allspring Index Fund
Notes to financial statements
Distributions to shareholders
Distributions to shareholders from net investment income and any net realized gains are recorded on the ex-dividend date and paid at least annually. Such distributions are determined in accordance with income tax regulations and may differ from U.S. generally accepted accounting principles. Dividend sources are estimated at the time of declaration. The tax character of distributions is determined as of the Fund's fiscal year end. Therefore, a portion of the Fund's distributions made prior to the Fund’s fiscal year end may be categorized as a tax return of capital at year end.
Federal and other taxes
The Fund intends to continue to qualify as a regulated investment company by distributing substantially all of its investment company taxable income and any net realized capital gains (after reduction for capital loss carryforwards) sufficient to relieve it from all, or substantially all, federal income taxes. Accordingly, no provision for federal income taxes was required.
The Fund’s income and federal excise tax returns and all financial records supporting those returns for the prior three fiscal years are subject to examination by the federal and Delaware revenue authorities. Management has analyzed the Fund's tax positions taken on federal, state, and foreign tax returns, as applicable, for all open tax years and does not believe that there are any uncertain tax positions that require recognition of a tax liability.
As of May 31, 2022, the aggregate cost of all investments for federal income tax purposes was $132,856,262 and the unrealized gains (losses) consisted of:
| Gross unrealized gains | $1,020,583,621 |
| Gross unrealized losses | 0 |
| Net unrealized gains | $1,020,583,621 |
Class allocations
The separate classes of shares offered by the Fund differ principally in applicable sales charges, distribution, shareholder servicing, and administration fees. Class specific expenses are charged directly to that share class. Investment income, common fund-level expenses, and realized and unrealized gains (losses) on investments are allocated daily to each class of shares based on the relative proportion of net assets of each class.
3. FAIR VALUATION MEASUREMENTS
At May 31, 2022, the Fund’s investment in the affiliated Master Portfolio was measured at fair value using the net asset value per share (or its equivalent) as a practical expedient. The investment objective and fair value of the affiliated Master Portfolio is as follows:
| Affiliated Master Portfolio | Investment objective | Fair value of affiliated
Master Portfolio |
| Allspring Index Portfolio | Seeks to replicate the total return of the S&P 500 Index, before fees and expenses | $1,153,439,833 |
The affiliated Master Portfolio does not have a redemption period notice, can be redeemed daily and does not have any unfunded commitments.
4. TRANSACTIONS WITH AFFILIATES
Management fee
Allspring Funds Management, a wholly owned subsidiary of Allspring Global Investments Holdings, LLC, a holding company indirectly owned by certain private funds of GTCR LLC and Reverence Capital Partners, L.P., is the manager of the Fund and provides advisory and fund-level administrative services under an investment management agreement. Under the investment management agreement, Allspring Funds Management is responsible for, among other services, implementing the investment objectives and strategies of the Fund and providing fund-level administrative services in connection with the Fund’s operations. As long as the Fund continues to invest substantially all of its assets in a single affiliated Master Portfolio, the Fund pays Allspring Funds Management an investment management fee only for fund-level administrative services at the following annual rate based on the Fund’s average daily net assets:
Allspring Index Fund | 19
Notes to financial statements
| Average daily net assets | Management fee |
| First $5 billion | 0.050% |
| Next $5 billion | 0.040 |
| Over $10 billion | 0.030 |
For the year ended May 31, 2022, the management fee was equivalent to an annual rate of 0.05% of the Fund’s average daily net assets.
Allspring Funds Management also serves as the adviser to the affiliated Master Portfolio and is entitled to receive a fee from the affiliated Master Portfolio for those services.
Administration fees
Under a class-level administration agreement, Allspring Funds Management provides class-level administrative services to the Fund, which includes paying fees and expenses for services provided by the transfer agent, sub-transfer agents, omnibus account servicers and record-keepers. As compensation for its services under the class-level administration agreement, Allspring Funds Management receives an annual fee which is calculated based on the average daily net assets of each class as follows:
| | Class-level
administration fee |
| Class A | 0.21% |
| Class C | 0.21 |
| Administrator Class | 0.13 |
Waivers and/or expense reimbursements
Allspring Funds Management has contractually committed to waive and/or reimburse management and administration fees to the extent necessary to maintain certain net operating expense ratios for the Fund. When each class of the Fund has exceeded its expense cap, Allspring Funds Management will waive fees and/or reimburse expenses from fund-level expenses on a proportionate basis and then from class specific expenses. When only certain classes exceed their expense caps, waivers and/or reimbursements are applied against class specific expenses before fund-level expenses. Net expenses from the affiliated Master Portfolio are included in the expense caps. Allspring Funds Management has contractually committed through September 30, 2022 to waive fees and/or reimburse expenses to the extent necessary to cap expenses. Prior to or after the commitment expiration date, the caps may be increased or the commitment to maintain the caps may be terminated only with the approval of the Board of Trustees. As of May 31, 2022, the contractual expense caps are as follows:
| | Expense ratio caps |
| Class A | 0.45% |
| Class C | 1.20 |
| Administrator Class | 0.25 |
Distribution fee
The Trust has adopted a distribution plan for Class C shares pursuant to Rule 12b-1 under the 1940 Act. A distribution fee is charged to Class C shares and paid to Allspring Funds Distributor, LLC ("Allspring Funds Distributor"), the principal underwriter, an affiliate of Allspring Funds Management, at an annual rate of 0.75% of the average daily net assets of Class C shares.
In addition, Allspring Funds Distributor is entitled to receive the front-end sales charge from the purchase of Class A shares and a contingent deferred sales charge on the redemption of certain Class A shares. Allspring Funds Distributor is also entitled to receive the contingent deferred sales charges from redemptions of Class C shares. For the year ended May 31, 2022, Allspring Funds Distributor received $2,547 from the sale of Class A shares. No contingent deferred sales charges were incurred by Class A and Class C shares for the year ended May 31, 2022.
Shareholder servicing fees
The Trust has entered into contracts with one or more shareholder servicing agents, whereby Class A and Class C shares are charged a fee at an annual rate of 0.25% of the average daily net assets of each respective class. Administrator Class is charged
20 | Allspring Index Fund
Notes to financial statements
a fee at an annual rate of 0.10% of its average daily net assets. A portion of these total shareholder servicing fees were paid to affiliates, and to certain entities that were affiliates of the Fund until November 1, 2021.
5. INVESTMENT PORTFOLIO TRANSACTIONS
The Fund seeks to achieve its investment objective by investing substantially all of its assets in the affiliated Master Portfolio. Purchases and sales have been calculated by multiplying the Fund's ownership percentage of the affiliated Master Portfolio at the end of the period by the affiliated Master Portfolio's purchases and sales. Purchases and sales of investments, excluding U.S. government obligations (if any) and short-term securities, for the year ended May 31, 2022 were $28,275,102 and $168,811,347, respectively.
6. BANK BORROWINGS
The Trust (excluding the money market funds), Allspring Master Trust and Allspring Variable Trust are parties to a $350,000,000 revolving credit agreement whereby the Fund is permitted to use bank borrowings for temporary or emergency purposes, such as to fund shareholder redemption requests. Interest under the credit agreement is charged to the Fund based on a borrowing rate equal to the higher of the Federal Funds rate in effect on that day plus 1.25% or the overnight bank funding rate in effect on that day plus 1.25%. In addition, an annual commitment fee equal to 0.25% of the unused balance is allocated to each participating fund.
For the year ended May 31, 2022, there were no borrowings by the Fund under the agreement.
7. DISTRIBUTIONS TO SHAREHOLDERS
The tax character of distributions paid during the years ended May 31, 2022 and May 31, 2021 were as follows:
| | Year ended May 31 |
| | 2022 | 2021 |
| Ordinary income | $18,177,161 | $ 16,705,769 |
| Long-term capital gain | 99,255,018 | 135,360,511 |
As of May 31, 2022, the components of distributable earnings on a tax basis were as follows:
Undistributed
ordinary
income | Undistributed
long-term
gain | Unrealized
gains | Post-October
capital
losses
deferred |
| $5,466,566 | $69,824,030 | $1,020,583,621 | $(1,202,385) |
As of May 31, 2022, the Fund had current year deferred post-October capital losses consisting of $1,202,385 in short-term capital losses which will be recognized in the first day of the following fiscal year.
8. CONCENTRATION RISKS
Concentration risks result from exposure to a limited number of sectors. Through its investment in the affiliated Master Portfolio which may invest a substantial portion of its assets in any sector, the Fund may in turn be more affected by changes in that sector than a fund whose investments are not heavily weighted in any sector. As of the end of the period, the affiliated Master Portfolio concentrated its portfolio in investments related to the information technology sector.
9. INDEMNIFICATION
Under the Fund's organizational documents, the officers and Trustees have been granted certain indemnification rights against certain liabilities that may arise out of performance of their duties to the Fund. The Fund has entered into a separate agreement with each Trustee that converts indemnification rights currently existing under the Fund’s organizational documents into contractual rights that cannot be changed in the future without the consent of the Trustee. Additionally, in the normal course of business, the Fund may enter into contracts with service providers that contain a variety of indemnification clauses. The Fund’s maximum exposure under these arrangements is dependent on future claims that may be made against the Fund and, therefore, cannot be estimated.
Allspring Index Fund | 21
Notes to financial statements
10. CORONAVIRUS (COVID-19) PANDEMIC
On March 11, 2020, the World Health Organization announced that it had made the assessment that coronavirus disease 2019 (“COVID-19”) is a pandemic. The impacts of COVID-19 are affecting the entire global economy, individual companies and investment products, the funds, and the market in general. There is significant uncertainty around the extent and duration of business disruptions related to COVID-19 and the impacts may last for an extended period of time. COVID-19 has led to significant uncertainty and volatility in the financial markets.
11. SUBSEQUENT EVENT
At a meeting held February 23-24, 2022, the Board of Trustees of the Fund approved a proposal to collapse the master-feeder structure under which the Fund invests 100% of its assets in the Allspring Index Portfolio. After the close of business on May 31, 2022, the Fund redeemed its investment in Allspring Index Portfolio, the affiliated Master Portfolio. The Fund received its redemption proceeds in the form of an in-kind distribution of the securities held by Allspring Index Portfolio along with acquiring the assets and assuming the liabilities of Allspring Index Portfolio. Immediately after this transaction, the Fund began operating as a stand-alone fund with its investments managed by Allspring Funds Management and Allspring Investments.
22 | Allspring Index Fund
Report of independent registered public accounting firm
To the Shareholders of the Fund and Board of Trustees
Allspring Funds Trust:
Opinion on the Financial Statements
We have audited the accompanying statement of assets and liabilities of Allspring Index Fund (formerly, Wells Fargo Index Fund) (the Fund), one of the funds constituting Allspring Funds Trust (formerly, Wells Fargo Funds Trust), including the portfolio of investments, as of May 31, 2022, the related statement of operations for the year then ended, the statements of changes in net assets for each of the years in the two-year period then ended, and the related notes (collectively, the financial statements) and the financial highlights for each of the years in the five-year period then ended. In our opinion, the financial statements and financial highlights present fairly, in all material respects, the financial position of the Fund as of May 31, 2022, the results of its operations for the year then ended, the changes in its net assets for each of the years in the two-year period then ended, and the financial highlights for each of the years in the five-year period then ended, in conformity with U.S. generally accepted accounting principles.
Basis for Opinion
These financial statements and financial highlights are the responsibility of the Fund’s management. Our responsibility is to express an opinion on these financial statements and financial highlights based on our audits. We are a public accounting firm registered with the Public Company Accounting Oversight Board (United States) (PCAOB) and are required to be independent with respect to the Fund in accordance with the U.S. federal securities laws and the applicable rules and regulations of the Securities and Exchange Commission and the PCAOB.
We conducted our audits in accordance with the standards of the PCAOB. Those standards require that we plan and perform the audit to obtain reasonable assurance about whether the financial statements and financial highlights are free of material misstatement, whether due to error or fraud. Our audits included performing procedures to assess the risks of material misstatement of the financial statements and financial highlights, whether due to error or fraud, and performing procedures that respond to those risks. Such procedures included examining, on a test basis, evidence regarding the amounts and disclosures in the financial statements and financial highlights. Such procedures also included confirmation of securities owned as of May 31, 2022, by correspondence with the transfer agent. Our audits also included evaluating the accounting principles used and significant estimates made by management, as well as evaluating the overall presentation of the financial statements and financial highlights. We believe that our audits provide a reasonable basis for our opinion.

We have not been able to determine the specific year that we began serving as the auditor of one or more Allspring Funds investment companies; however, we are aware that we have served as the auditor of one or more Allspring Funds investment companies since at least 1955.
Boston, Massachusetts
July 27, 2022
Allspring Index Fund | 23
Portfolio of investments—May 31, 2022
| | | | | Shares | Value |
| Common stocks: 98.06% | | | | | |
| Communication services: 8.64% | | | | | |
| Diversified telecommunication services: 1.06% | | | | | |
| AT&T Incorporated | | | | 231,141 | $ 4,920,992 |
| Lumen Technologies Incorporated | | | | 29,827 | 365,082 |
| Verizon Communications Incorporated | | | | 135,881 | 6,969,336 |
| | | | | | 12,255,410 |
| Entertainment: 1.30% | | | | | |
| Activision Blizzard Incorporated | | | | 25,217 | 1,963,900 |
| Electronic Arts Incorporated | | | | 9,103 | 1,262,131 |
| Live Nation Entertainment Incorporated † | | | | 4,372 | 415,559 |
| Netflix Incorporated † | | | | 14,370 | 2,837,213 |
| Take-Two Interactive Software Incorporated † | | | | 5,117 | 637,220 |
| The Walt Disney Company † | | | | 58,930 | 6,508,229 |
| Warner Bros. Discovery Incorporated † | | | | 71,579 | 1,320,633 |
| | | | | | 14,944,885 |
| Interactive media & services: 5.10% | | | | | |
| Alphabet Incorporated Class A † | | | | 9,735 | 22,149,461 |
| Alphabet Incorporated Class C † | | | | 8,991 | 20,506,493 |
| Match Group Incorporated † | | | | 9,163 | 721,861 |
| Meta Platforms Incorporated Class A † | | | | 74,741 | 14,472,847 |
| Twitter Incorporated † | | | | 25,882 | 1,024,927 |
| | | | | | 58,875,589 |
| Media: 0.96% | | | | | |
| Charter Communications Incorporated Class A † | | | | 3,858 | 1,955,736 |
| Comcast Corporation Class A | | | | 146,426 | 6,483,743 |
| DISH Network Corporation Class A † | | | | 8,083 | 184,535 |
| Fox Corporation Class A | | | | 10,222 | 362,983 |
| Fox Corporation Class B | | | | 4,719 | 154,358 |
| Interpublic Group of Companies Incorporated | | | | 12,741 | 410,642 |
| News Corporation Class A | | | | 12,652 | 220,145 |
| News Corporation Class B | | | | 3,919 | 68,896 |
| Omnicom Group Incorporated | | | | 6,765 | 504,737 |
| ViacomCBS Incorporated Class B | | | | 19,638 | 674,173 |
| | | | | | 11,019,948 |
| Wireless telecommunication services: 0.22% | | | | | |
| T-Mobile US Incorporated † | | | | 19,004 | 2,533,043 |
| Consumer discretionary: 10.68% | | | | | |
| Auto components: 0.11% | | | | | |
| Aptiv plc † | | | | 8,756 | 930,237 |
| BorgWarner Incorporated | | | | 7,761 | 312,924 |
| | | | | | 1,243,161 |
| Automobiles: 2.09% | | | | | |
| Ford Motor Company | | | | 127,317 | 1,741,697 |
| General Motors Company † | | | | 47,032 | 1,819,198 |
| Tesla Motors Incorporated † | | | | 27,097 | 20,546,571 |
| | | | | | 24,107,466 |
The accompanying notes are an integral part of these financial statements.
24 | Allspring Index Portfolio
Portfolio of investments—May 31, 2022
| | | | | Shares | Value |
| Distributors: 0.14% | | | | | |
| Genuine Parts Company | | | | 4,610 | $ 630,325 |
| LKQ Corporation | | | | 8,680 | 446,065 |
| Pool Corporation | | | | 1,298 | 517,409 |
| | | | | | 1,593,799 |
| Hotels, restaurants & leisure: 1.85% | | | | | |
| Booking Holdings Incorporated † | | | | 1,329 | 2,981,691 |
| Caesars Entertainment Incorporated † | | | | 6,919 | 347,126 |
| Carnival Corporation † | | | | 26,180 | 363,378 |
| Chipotle Mexican Grill Incorporated † | | | | 911 | 1,277,723 |
| Darden Restaurants Incorporated | | | | 4,134 | 516,750 |
| Domino's Pizza Incorporated | | | | 1,178 | 427,814 |
| Expedia Group Incorporated † | | | | 4,863 | 628,932 |
| Hilton Worldwide Holdings Incorporated | | | | 9,022 | 1,270,839 |
| Las Vegas Sands Corporation † | | | | 11,128 | 394,599 |
| Marriott International Incorporated Class A | | | | 8,855 | 1,519,341 |
| McDonald's Corporation | | | | 24,187 | 6,100,203 |
| MGM Resorts International | | | | 12,192 | 426,354 |
| Norwegian Cruise Line Holdings Limited † | | | | 13,494 | 216,039 |
| Penn National Gaming Incorporated † | | | | 5,377 | 171,849 |
| Royal Caribbean Cruises Limited † | | | | 7,258 | 421,472 |
| Starbucks Corporation | | | | 37,233 | 2,922,791 |
| Wynn Resorts Limited † | | | | 3,407 | 225,203 |
| Yum! Brands Incorporated | | | | 9,354 | 1,136,230 |
| | | | | | 21,348,334 |
| Household durables: 0.32% | | | | | |
| D.R. Horton Incorporated | | | | 10,438 | 784,416 |
| Garmin Limited | | | | 4,918 | 519,439 |
| Lennar Corporation Class A | | | | 8,460 | 678,915 |
| Mohawk Industries Incorporated † | | | | 1,776 | 251,233 |
| Newell Rubbermaid Incorporated | | | | 12,255 | 262,747 |
| NVR Incorporated † | | | | 106 | 471,766 |
| PulteGroup Incorporated | | | | 8,048 | 364,252 |
| Whirlpool Corporation | | | | 1,910 | 351,898 |
| | | | | | 3,684,666 |
| Internet & direct marketing retail: 3.07% | | | | | |
| Amazon.com Incorporated † | | | | 14,164 | 34,052,947 |
| eBay Incorporated | | | | 20,263 | 986,200 |
| Etsy Incorporated † | | | | 4,104 | 332,916 |
| | | | | | 35,372,063 |
| Leisure products: 0.03% | | | | | |
| Hasbro Incorporated | | | | 4,197 | 376,681 |
| Multiline retail: 0.46% | | | | | |
| Dollar General Corporation | | | | 7,500 | 1,652,550 |
| Dollar Tree Incorporated † | | | | 7,281 | 1,167,363 |
| Target Corporation | | | | 15,508 | 2,510,435 |
| | | | | | 5,330,348 |
| Specialty retail: 2.07% | | | | | |
| Advance Auto Parts Incorporated | | | | 2,018 | 383,137 |
| AutoZone Incorporated † | | | | 668 | 1,375,846 |
The accompanying notes are an integral part of these financial statements.
Allspring Index Portfolio | 25
Portfolio of investments—May 31, 2022
| | | | | Shares | Value |
| Specialty retail (continued) | | | | | |
| Bath & Body Works Incorporated | | | | 8,342 | $ 342,189 |
| Best Buy Company Incorporated | | | | 7,008 | 575,076 |
| CarMax Incorporated † | | | | 5,233 | 519,480 |
| Lowe's Companies Incorporated | | | | 21,808 | 4,259,102 |
| O'Reilly Automotive Incorporated † | | | | 2,181 | 1,389,668 |
| Ross Stores Incorporated | | | | 11,437 | 972,374 |
| The Home Depot Incorporated | | | | 33,800 | 10,232,950 |
| The TJX Companies Incorporated | | | | 38,611 | 2,454,501 |
| Tractor Supply Company | | | | 3,684 | 690,234 |
| Ulta Beauty Incorporated † | | | | 1,752 | 741,271 |
| | | | | | 23,935,828 |
| Textiles, apparel & luxury goods: 0.54% | | | | | |
| Nike Incorporated Class B | | | | 41,311 | 4,909,812 |
| PVH Corporation | | | | 2,265 | 160,521 |
| Ralph Lauren Corporation | | | | 1,498 | 151,433 |
| Tapestry Incorporated | | | | 8,545 | 294,803 |
| Under Armour Incorporated Class A † | | | | 6,106 | 64,601 |
| Under Armour Incorporated Class C † | | | | 6,961 | 67,522 |
| VF Corporation | | | | 10,448 | 527,206 |
| | | | | | 6,175,898 |
| Consumer staples: 6.37% | | | | | |
| Beverages: 1.61% | | | | | |
| Brown-Forman Corporation Class B | | | | 5,915 | 391,100 |
| Constellation Brands Incorporated Class A | | | | 5,319 | 1,305,655 |
| Molson Coors Brewing Company Class B | | | | 6,098 | 340,512 |
| Monster Beverage Corporation † | | | | 12,160 | 1,083,699 |
| PepsiCo Incorporated | | | | 44,780 | 7,511,845 |
| The Coca-Cola Company | | | | 125,830 | 7,975,105 |
| | | | | | 18,607,916 |
| Food & staples retailing: 1.40% | | | | | |
| Costco Wholesale Corporation | | | | 14,353 | 6,691,656 |
| Sysco Corporation | | | | 16,425 | 1,382,657 |
| The Kroger Company | | | | 21,657 | 1,147,171 |
| Walgreens Boots Alliance Incorporated | | | | 23,192 | 1,016,505 |
| Walmart Incorporated | | | | 45,790 | 5,889,968 |
| | | | | | 16,127,957 |
| Food products: 1.03% | | | | | |
| Archer Daniels Midland Company | | | | 18,112 | 1,644,932 |
| Campbell Soup Company | | | | 6,544 | 313,523 |
| ConAgra Foods Incorporated | | | | 15,527 | 510,683 |
| General Mills Incorporated | | | | 19,525 | 1,363,821 |
| Hormel Foods Corporation | | | | 9,132 | 444,454 |
| Kellogg Company | | | | 8,281 | 577,517 |
| Lamb Weston Holdings Incorporated | | | | 4,700 | 317,626 |
| McCormick & Company Incorporated | | | | 8,084 | 749,548 |
| Mondelez International Incorporated Class A | | | | 44,938 | 2,856,259 |
| The Hershey Company | | | | 4,706 | 996,307 |
| The J.M. Smucker Company | | | | 3,508 | 439,798 |
The accompanying notes are an integral part of these financial statements.
26 | Allspring Index Portfolio
Portfolio of investments—May 31, 2022
| | | | | Shares | Value |
| Food products (continued) | | | | | |
| The Kraft Heinz Company | | | | 22,980 | $ 869,333 |
| Tyson Foods Incorporated Class A | | | | 9,466 | 848,248 |
| | | | | | 11,932,049 |
| Household products: 1.42% | | | | | |
| Church & Dwight Company Incorporated | | | | 7,833 | 705,440 |
| Colgate-Palmolive Company | | | | 27,281 | 2,150,016 |
| Kimberly-Clark Corporation | | | | 10,902 | 1,450,184 |
| The Clorox Company | | | | 3,983 | 578,969 |
| The Procter & Gamble Company | | | | 77,589 | 11,473,861 |
| | | | | | 16,358,470 |
| Personal products: 0.17% | | | | | |
| The Estee Lauder Companies Incorporated Class A | | | | 7,523 | 1,915,732 |
| Tobacco: 0.74% | | | | | |
| Altria Group Incorporated | | | | 59,013 | 3,192,013 |
| Philip Morris International Incorporated | | | | 50,165 | 5,330,031 |
| | | | | | 8,522,044 |
| Energy: 4.70% | | | | | |
| Energy equipment & services: 0.37% | | | | | |
| Baker Hughes Incorporated | | | | 29,315 | 1,054,754 |
| Halliburton Company | | | | 29,085 | 1,177,943 |
| Schlumberger Limited | | | | 45,425 | 2,087,733 |
| | | | | | 4,320,430 |
| Oil, gas & consumable fuels: 4.33% | | | | | |
| APA Corporation | | | | 11,758 | 552,744 |
| Cabot Oil & Gas Corporation | | | | 26,334 | 904,046 |
| Chevron Corporation | | | | 62,396 | 10,898,085 |
| ConocoPhillips | | | | 42,151 | 4,736,086 |
| Devon Energy Corporation | | | | 20,379 | 1,526,387 |
| Diamondback Energy Incorporated | | | | 5,512 | 837,934 |
| EOG Resources Incorporated | | | | 18,938 | 2,593,748 |
| Exxon Mobil Corporation | | | | 137,033 | 13,155,168 |
| Hess Corporation | | | | 8,922 | 1,098,031 |
| Kinder Morgan Incorporated | | | | 63,119 | 1,242,813 |
| Marathon Oil Corporation | | | | 25,200 | 792,036 |
| Marathon Petroleum Corporation | | | | 18,741 | 1,907,646 |
| Occidental Petroleum Corporation | | | | 28,720 | 1,990,583 |
| ONEOK Incorporated | | | | 14,434 | 950,479 |
| Phillips 66 | | | | 15,144 | 1,526,667 |
| Pioneer Natural Resources Company | | | | 7,349 | 2,042,581 |
| The Williams Companies Incorporated�� | | | | 39,328 | 1,457,496 |
| Valero Energy Corporation | | | | 13,233 | 1,714,997 |
| | | | | | 49,927,527 |
| Financials: 11.02% | | | | | |
| Banks: 3.87% | | | | | |
| Bank of America Corporation | | | | 230,088 | 8,559,274 |
| Citigroup Incorporated | | | | 64,231 | 3,430,578 |
| Citizens Financial Group Incorporated | | | | 16,018 | 662,825 |
| Comerica Incorporated | | | | 4,230 | 351,978 |
The accompanying notes are an integral part of these financial statements.
Allspring Index Portfolio | 27
Portfolio of investments—May 31, 2022
| | | | | Shares | Value |
| Banks (continued) | | | | | |
| Fifth Third Bancorp | | | | 22,132 | $ 872,665 |
| First Republic Bank | | | | 5,802 | 899,484 |
| Huntington Bancshares Incorporated | | | | 46,537 | 645,934 |
| JPMorgan Chase & Company | | | | 95,656 | 12,648,593 |
| KeyCorp | | | | 30,065 | 600,097 |
| M&T Bank Corporation | | | | 5,800 | 1,043,826 |
| PNC Financial Services Group Incorporated | | | | 13,595 | 2,384,699 |
| Regions Financial Corporation | | | | 30,491 | 673,546 |
| Signature Bank | | | | 2,031 | 439,244 |
| SVB Financial Group † | | | | 1,902 | 929,260 |
| Truist Financial Corporation | | | | 43,208 | 2,149,166 |
| US Bancorp | | | | 43,711 | 2,319,743 |
| Wells Fargo & Company | | | | 125,776 | 5,756,768 |
| Zions Bancorporation | | | | 4,908 | 279,952 |
| | | | | | 44,647,632 |
| Capital markets: 2.82% | | | | | |
| Ameriprise Financial Incorporated | | | | 3,590 | 991,809 |
| Bank of New York Mellon Corporation | | | | 23,946 | 1,116,123 |
| BlackRock Incorporated | | | | 4,615 | 3,087,804 |
| Cboe Global Markets Incorporated | | | | 3,452 | 387,694 |
| CME Group Incorporated | | | | 11,633 | 2,312,989 |
| FactSet Research Systems Incorporated | | | | 1,223 | 466,917 |
| Franklin Resources Incorporated | | | | 9,102 | 246,482 |
| Intercontinental Exchange Incorporated | | | | 18,186 | 1,862,065 |
| Invesco Limited | | | | 11,047 | 213,649 |
| MarketAxess Holdings Incorporated | | | | 1,231 | 346,748 |
| Moody's Corporation | | | | 5,235 | 1,578,719 |
| Morgan Stanley | | | | 45,885 | 3,952,534 |
| MSCI Incorporated | | | | 2,630 | 1,163,381 |
| Northern Trust Corporation | | | | 6,725 | 751,519 |
| Raymond James Financial Incorporated | | | | 6,048 | 595,668 |
| S&P Global Incorporated | | | | 11,464 | 4,006,439 |
| State Street Corporation | | | | 11,846 | 858,717 |
| T. Rowe Price Group Incorporated | | | | 7,419 | 942,881 |
| The Charles Schwab Corporation | | | | 48,662 | 3,411,206 |
| The Goldman Sachs Group Incorporated | | | | 10,988 | 3,591,428 |
| The NASDAQ Incorporated | | | | 3,789 | 588,280 |
| | | | | | 32,473,052 |
| Consumer finance: 0.59% | | | | | |
| American Express Company | | | | 19,909 | 3,361,037 |
| Capital One Financial Corporation | | | | 13,397 | 1,712,940 |
| Discover Financial Services | | | | 9,322 | 1,057,954 |
| Synchrony Financial | | | | 16,873 | 624,976 |
| | | | | | 6,756,907 |
| Diversified financial services: 1.62% | | | | | |
| Berkshire Hathaway Incorporated Class B † | | | | 59,278 | 18,730,662 |
| Insurance: 2.12% | | | | | |
| AFLAC Incorporated | | | | 19,420 | 1,176,264 |
| American International Group Incorporated | | | | 26,875 | 1,577,025 |
| Aon plc Class A | | | | 6,953 | 1,916,734 |
| Arthur J. Gallagher & Company | | | | 6,747 | 1,092,609 |
| Assurant Incorporated | | | | 1,844 | 325,816 |
The accompanying notes are an integral part of these financial statements.
28 | Allspring Index Portfolio
Portfolio of investments—May 31, 2022
| | | | | Shares | Value |
| Insurance (continued) | | | | | |
| Brown & Brown Incorporated | | | | 7,589 | $ 450,559 |
| Chubb Limited | | | | 13,942 | 2,945,805 |
| Cincinnati Financial Corporation | | | | 4,851 | 620,249 |
| Everest Reinsurance Group Limited | | | | 1,274 | �� 359,905 |
| Globe Life Incorporated | | | | 3,007 | 293,393 |
| Lincoln National Corporation | | | | 5,391 | 312,301 |
| Loews Corporation | | | | 6,347 | 415,665 |
| Marsh & McLennan Companies Incorporated | | | | 16,343 | 2,614,063 |
| MetLife Incorporated | | | | 22,712 | 1,530,562 |
| Principal Financial Group Incorporated | | | | 7,864 | 573,522 |
| Progressive Corporation | | | | 18,916 | 2,258,192 |
| Prudential Financial Incorporated | | | | 12,235 | 1,299,969 |
| The Allstate Corporation | | | | 9,082 | 1,241,419 |
| The Hartford Financial Services Group Incorporated | | | | 10,840 | 786,008 |
| The Travelers Companies Incorporated | | | | 7,807 | 1,397,765 |
| W.R. Berkley Corporation | | | | 6,781 | 482,333 |
| Willis Towers Watson plc | | | | 3,951 | 833,938 |
| | | | | | 24,504,096 |
| Health care: 14.10% | | | | | |
| Biotechnology: 2.02% | | | | | |
| AbbVie Incorporated | | | | 57,223 | 8,432,954 |
| Amgen Incorporated | | | | 18,232 | 4,680,884 |
| Biogen Incorporated † | | | | 4,755 | 951,000 |
| Gilead Sciences Incorporated | | | | 40,602 | 2,633,040 |
| Incyte Corporation † | | | | 6,089 | 462,094 |
| Moderna Incorporated † | | | | 11,418 | 1,659,378 |
| Regeneron Pharmaceuticals Incorporated † | | | | 3,454 | 2,296,012 |
| Vertex Pharmaceuticals Incorporated † | | | | 8,240 | 2,213,676 |
| | | | | | 23,329,038 |
| Health care equipment & supplies: 2.71% | | | | | |
| Abbott Laboratories | | | | 57,236 | 6,722,941 |
| ABIOMED Incorporated † | | | | 1,473 | 388,430 |
| Align Technology Incorporated † | | | | 2,374 | 659,117 |
| Baxter International Incorporated | | | | 16,206 | 1,232,466 |
| Becton Dickinson & Company | | | | 9,218 | 2,357,964 |
| Boston Scientific Corporation † | | | | 46,124 | 1,891,545 |
| Dentsply Sirona Incorporated | | | | 7,076 | 279,927 |
| DexCom Incorporated † | | | | 3,137 | 934,638 |
| Edwards Lifesciences Corporation † | | | | 20,209 | 2,038,078 |
| Hologic Incorporated † | | | | 8,092 | 609,085 |
| IDEXX Laboratories Incorporated † | | | | 2,745 | 1,074,997 |
| Intuitive Surgical Incorporated † | | | | 11,580 | 2,636,071 |
| Medtronic plc | | | | 43,521 | 4,358,628 |
| ResMed Incorporated | | | | 4,733 | 962,976 |
| STERIS plc | | | | 3,241 | 739,596 |
| Stryker Corporation | | | | 10,867 | 2,548,312 |
| Teleflex Incorporated | | | | 1,516 | 436,214 |
| The Cooper Companies Incorporated | | | | 1,596 | 559,781 |
| Zimmer Biomet Holdings Incorporated | | | | 6,762 | 812,860 |
| | | | | | 31,243,626 |
The accompanying notes are an integral part of these financial statements.
Allspring Index Portfolio | 29
Portfolio of investments—May 31, 2022
| | | | | Shares | Value |
| Health care providers & services: 3.18% | | | | | |
| AmerisourceBergen Corporation | | | | 4,874 | $ 754,446 |
| Anthem Incorporated | | | | 7,856 | 4,003,496 |
| Cardinal Health Incorporated | | | | 8,968 | 505,078 |
| Centene Corporation † | | | | 18,887 | 1,538,157 |
| Cigna Corporation | | | | 10,453 | 2,804,435 |
| CVS Health Corporation | | | | 42,483 | 4,110,230 |
| DaVita HealthCare Partners Incorporated † | | | | 1,995 | 194,493 |
| HCA Healthcare Incorporated | | | | 7,752 | 1,631,021 |
| Henry Schein Incorporated † | | | | 4,489 | 384,438 |
| Humana Incorporated | | | | 4,160 | 1,889,597 |
| Laboratory Corporation of America Holdings | | | | 3,013 | 743,367 |
| McKesson Corporation | | | | 4,849 | 1,593,818 |
| Molina Healthcare Incorporated † | | | | 1,890 | 548,516 |
| Quest Diagnostics Incorporated | | | | 3,852 | 543,209 |
| UnitedHealth Group Incorporated | | | | 30,486 | 15,144,835 |
| Universal Health Services Incorporated Class B | | | | 2,367 | 294,952 |
| | | | | | 36,684,088 |
| Health care technology: 0.08% | | | | | |
| Cerner Corporation | | | | 9,523 | 903,257 |
| Life sciences tools & services: 1.79% | | | | | |
| Agilent Technologies Incorporated | | | | 9,722 | 1,240,138 |
| Bio-Rad Laboratories Incorporated Class A † | | | | 699 | 375,915 |
| Bio-Techne Corporation | | | | 1,272 | 470,297 |
| Charles River Laboratories International Incorporated † | | | | 1,633 | 382,253 |
| Danaher Corporation | | | | 20,597 | 5,433,901 |
| Illumina Incorporated † | | | | 5,059 | 1,211,529 |
| IQVIA Holdings Incorporated † | | | | 6,184 | 1,331,106 |
| Mettler-Toledo International Incorporated † | | | | 744 | 956,873 |
| PerkinElmer Incorporated | | | | 4,085 | 611,402 |
| Thermo Fisher Scientific Incorporated | | | | 12,755 | 7,239,355 |
| Waters Corporation † | | | | 1,976 | 648,029 |
| West Pharmaceutical Services Incorporated | | | | 2,398 | 744,291 |
| | | | | | 20,645,089 |
| Pharmaceuticals: 4.32% | | | | | |
| Bristol-Myers Squibb Company | | | | 70,553 | 5,323,224 |
| Catalent Incorporated † | | | | 5,797 | 597,439 |
| Eli Lilly & Company | | | | 25,699 | 8,055,095 |
| Johnson & Johnson | | | | 85,212 | 15,298,110 |
| Merck & Company Incorporated | | | | 81,760 | 7,524,373 |
| Organon & Company | | | | 8,207 | 311,538 |
| Pfizer Incorporated | | | | 181,678 | 9,636,201 |
| Viatris Incorporated | | | | 39,146 | 480,321 |
| Zoetis Incorporated | | | | 15,314 | 2,617,622 |
| | | | | | 49,843,923 |
| Industrials: 7.73% | | | | | |
| Aerospace & defense: 1.56% | | | | | |
| General Dynamics Corporation | | | | 7,461 | 1,678,054 |
| Howmet Aerospace Incorporated | | | | 12,284 | 439,399 |
| Huntington Ingalls Industries Incorporated | | | | 1,297 | 272,967 |
| L3 Harris Technologies Incorporated | | | | 6,351 | 1,529,956 |
| Lockheed Martin Corporation | | | | 7,845 | 3,452,663 |
The accompanying notes are an integral part of these financial statements.
30 | Allspring Index Portfolio
Portfolio of investments—May 31, 2022
| | | | | Shares | Value |
| Aerospace & defense (continued) | | | | | |
| Northrop Grumman Corporation | | | | 4,750 | $ 2,222,858 |
| Raytheon Technologies Corporation | | | | 48,304 | 4,594,676 |
| Textron Incorporated | | | | 7,135 | 465,844 |
| The Boeing Company † | | | | 17,738 | 2,330,773 |
| TransDigm Group Incorporated † | | | | 1,705 | 1,032,156 |
| | | | | | 18,019,346 |
| Air freight & logistics: 0.62% | | | | | |
| C.H. Robinson Worldwide Incorporated | | | | 4,207 | 456,502 |
| Expeditors International of Washington Incorporated | | | | 5,483 | 596,770 |
| FedEx Corporation | | | | 7,890 | 1,771,936 |
| United Parcel Service Incorporated Class B | | | | 23,601 | 4,301,282 |
| | | | | | 7,126,490 |
| Airlines: 0.24% | | | | | |
| Alaska Air Group Incorporated † | | | | 4,075 | 196,660 |
| American Airlines Group Incorporated † | | | | 20,966 | 374,662 |
| Delta Air Lines Incorporated † | | | | 20,716 | 863,650 |
| Southwest Airlines Company † | | | | 19,173 | 879,274 |
| United Airlines Holdings Incorporated † | | | | 10,481 | 499,210 |
| | | | | | 2,813,456 |
| Building products: 0.41% | | | | | |
| A.O. Smith Corporation | | | | 4,254 | 255,750 |
| Allegion plc | | | | 2,903 | 324,120 |
| Carrier Global Corporation | | | | 27,691 | 1,088,533 |
| Fortune Brands Home & Security Incorporated | | | | 4,393 | 304,655 |
| Johnson Controls International plc | | | | 22,743 | 1,239,721 |
| Masco Corporation | | | | 7,766 | 440,255 |
| Trane Technologies plc | | | | 7,559 | 1,043,596 |
| | | | | | 4,696,630 |
| Commercial services & supplies: 0.44% | | | | | |
| Cintas Corporation | | | | 2,854 | 1,136,834 |
| Copart Incorporated † | | | | 6,910 | 791,402 |
| Republic Services Incorporated | | | | 6,760 | 904,758 |
| Rollins Incorporated | | | | 7,326 | 259,780 |
| Waste Management Incorporated | | | | 12,457 | 1,974,559 |
| | | | | | 5,067,333 |
| Construction & engineering: 0.05% | | | | | |
| Quanta Services Incorporated | | | | 4,612 | 548,828 |
| Electrical equipment: 0.49% | | | | | |
| AMETEK Incorporated | | | | 7,488 | 909,567 |
| Eaton Corporation plc | | | | 12,902 | 1,788,217 |
| Emerson Electric Company | | | | 19,227 | 1,704,666 |
| Generac Holdings Incorporated † | | | | 2,042 | 504,537 |
| Rockwell Automation Incorporated | | | | 3,761 | 801,845 |
| | | | �� | | 5,708,832 |
| Industrial conglomerates: 0.98% | | | | | |
| 3M Company | | | | 18,485 | 2,759,626 |
| General Electric Company | | | | 35,583 | 2,785,793 |
The accompanying notes are an integral part of these financial statements.
Allspring Index Portfolio | 31
Portfolio of investments—May 31, 2022
| | | | | Shares | Value |
| Industrial conglomerates (continued) | | | | | |
| Honeywell International Incorporated | | | | 22,199 | $ 4,298,170 |
| Roper Technologies Incorporated | | | | 3,414 | 1,510,490 |
| | | | | | 11,354,079 |
| Machinery: 1.58% | | | | | |
| Caterpillar Incorporated | | | | 17,509 | 3,779,318 |
| Cummins Incorporated | | | | 4,610 | 964,043 |
| Deere & Company | | | | 9,078 | 3,247,927 |
| Dover Corporation | | | | 4,661 | 624,155 |
| Fortive Corporation | | | | 11,606 | 716,903 |
| IDEX Corporation | | | | 2,461 | 471,405 |
| Illinois Tool Works Incorporated | | | | 9,245 | 1,923,607 |
| Ingersoll Rand Incorporated | | | | 13,193 | 622,050 |
| Nordson Corporation | | | | 1,752 | 381,726 |
| Otis Worldwide Corporation | | | | 13,755 | 1,023,372 |
| PACCAR Incorporated | | | | 11,241 | 976,168 |
| Parker-Hannifin Corporation | | | | 4,159 | 1,131,955 |
| Pentair plc | | | | 5,356 | 268,711 |
| Snap-on Incorporated | | | | 1,730 | 383,852 |
| Stanley Black & Decker Incorporated | | | | 5,277 | 626,327 |
| Wabtec Corporation | | | | 6,047 | 571,200 |
| Xylem Incorporated | | | | 5,837 | 491,767 |
| | | | | | 18,204,486 |
| Professional services: 0.29% | | | | | |
| Equifax Incorporated | | | | 3,949 | 799,988 |
| Jacobs Engineering Group Incorporated | | | | 4,183 | 585,996 |
| Leidos Holdings Incorporated | | | | 4,543 | 474,744 |
| Nielsen Holdings plc | | | | 11,614 | 296,854 |
| Robert Half International Incorporated | | | | 3,544 | 319,492 |
| Verisk Analytics Incorporated | | | | 5,216 | 912,383 |
| | | | | | 3,389,457 |
| Road & rail: 0.86% | | | | | |
| CSX Corporation | | | | 71,792 | 2,282,268 |
| J.B. Hunt Transport Services Incorporated | | | | 2,719 | 469,245 |
| Norfolk Southern Corporation | | | | 7,761 | 1,860,001 |
| Old Dominion Freight Line Incorporated | | | | 3,015 | 778,594 |
| Union Pacific Corporation | | | | 20,615 | 4,530,765 |
| | | | | | 9,920,873 |
| Trading companies & distributors: 0.21% | | | | | |
| Fastenal Company | | | | 18,629 | 997,769 |
| United Rentals Incorporated † | | | | 2,344 | 698,934 |
| W.W. Grainger Incorporated | | | | 1,401 | 682,385 |
| | | | | | 2,379,088 |
| Information technology: 26.44% | | | | | |
| Communications equipment: 0.76% | | | | | |
| Arista Networks Incorporated † | | | | 7,261 | 742,655 |
| Cisco Systems Incorporated | | | | 136,516 | 6,150,046 |
| F5 Networks Incorporated † | | | | 1,966 | 320,537 |
The accompanying notes are an integral part of these financial statements.
32 | Allspring Index Portfolio
Portfolio of investments—May 31, 2022
| | | | | Shares | Value |
| Communications equipment (continued) | | | | | |
| Juniper Networks Incorporated | | | | 10,525 | $ 322,907 |
| Motorola Solutions Incorporated | | | | 5,467 | 1,201,319 |
| | | | | | 8,737,464 |
| Electronic equipment, instruments & components: 0.61% | | | | | |
| Amphenol Corporation Class A | | | | 19,387 | 1,373,763 |
| CDW Corporation of Delaware | | | | 4,393 | 746,195 |
| Corning Incorporated | | | | 24,179 | 866,092 |
| IPG Photonics Corporation † | | | | 1,156 | 121,946 |
| Keysight Technologies Incorporated † | | | | 5,925 | 862,680 |
| TE Connectivity Limited | | | | 10,538 | 1,363,512 |
| Teledyne Technologies Incorporated † | | | | 1,510 | 611,777 |
| Trimble Incorporated † | | | | 8,125 | 552,906 |
| Zebra Technologies Corporation Class A † | | | | 1,718 | 581,010 |
| | | | | | 7,079,881 |
| IT services: 4.32% | | | | | |
| Accenture plc Class A | | | | 20,457 | 6,105,596 |
| Akamai Technologies Incorporated † | | | | 5,259 | 531,369 |
| Automatic Data Processing Incorporated | | | | 13,596 | 3,031,092 |
| Broadridge Financial Solutions Incorporated | | | | 3,780 | 552,712 |
| Cognizant Technology Solutions Corporation Class A | | | | 17,001 | 1,269,975 |
| DXC Technology Company † | | | | 7,913 | 278,696 |
| EPAM Systems Incorporated † | | | | 1,836 | 621,523 |
| Fidelity National Information Services Incorporated | | | | 19,710 | 2,059,695 |
| Fiserv Incorporated † | | | | 19,233 | 1,926,762 |
| FleetCor Technologies Incorporated † | | | | 2,628 | 653,873 |
| Gartner Incorporated † | | | | 2,662 | 698,509 |
| Global Payments Incorporated | | | | 9,217 | 1,207,796 |
| International Business Machines Corporation | | | | 29,028 | 4,030,248 |
| Jack Henry & Associates Incorporated | | | | 2,357 | 443,399 |
| MasterCard Incorporated Class A | | | | 27,936 | 9,997,456 |
| Paychex Incorporated | | | | 10,393 | 1,286,965 |
| PayPal Holdings Incorporated † | | | | 37,709 | 3,213,184 |
| VeriSign Incorporated † | | | | 3,128 | 545,992 |
| Visa Incorporated Class A | | | | 53,680 | 11,389,286 |
| | | | | | 49,844,128 |
| Semiconductors & semiconductor equipment: 5.55% | | | | | |
| Advanced Micro Devices Incorporated † | | | | 52,916 | 5,390,024 |
| Analog Devices Incorporated | | | | 17,004 | 2,863,474 |
| Applied Materials Incorporated | | | | 28,743 | 3,371,266 |
| Broadcom Incorporated | | | | 13,364 | 7,752,857 |
| Enphase Energy Incorporated † | | | | 4,335 | 807,134 |
| Intel Corporation | | | | 131,803 | 5,854,689 |
| KLA Corporation | | | | 4,878 | 1,779,738 |
| Lam Research Corporation | | | | 4,515 | 2,347,935 |
| Microchip Technology Incorporated | | | | 17,996 | 1,307,409 |
| Micron Technology Incorporated | | | | 36,245 | 2,676,331 |
| Monolithic Power Systems Incorporated | | | | 1,402 | 631,447 |
| NVIDIA Corporation | | | | 80,920 | 15,109,382 |
| NXP Semiconductors NV | | | | 8,608 | 1,633,454 |
| Qorvo Incorporated † | | | | 3,510 | 392,243 |
| Qualcomm Incorporated | | | | 36,479 | 5,224,522 |
| Skyworks Solutions Incorporated | | | | 5,309 | 577,991 |
The accompanying notes are an integral part of these financial statements.
Allspring Index Portfolio | 33
Portfolio of investments—May 31, 2022
| | | | | Shares | Value |
| Semiconductors & semiconductor equipment (continued) | | | | | |
| Solaredge Technologies Incorporated † | | | | 1,700 | $ 463,743 |
| Teradyne Incorporated | | | | 5,276 | 576,456 |
| Texas Instruments Incorporated | | | | 29,893 | 5,283,887 |
| | | | | | 64,043,982 |
| Software: 8.40% | | | | | |
| Adobe Incorporated † | | | | 15,268 | 6,358,817 |
| ANSYS Incorporated † | | | | 2,824 | 735,257 |
| Autodesk Incorporated † | | | | 7,120 | 1,479,180 |
| Cadence Design Systems Incorporated † | | | | 8,971 | 1,379,112 |
| Ceridian HCM Holding Incorporated † | | | | 4,428 | 249,296 |
| Citrix Systems Incorporated | | | | 4,037 | 406,486 |
| Fortinet Incorporated † | | | | 4,393 | 1,292,157 |
| Intuit Incorporated | | | | 9,166 | 3,798,940 |
| Microsoft Corporation | | | | 242,659 | 65,971,702 |
| NortonLifeLock Incorporated | | | | 18,834 | 458,420 |
| Oracle Corporation | | | | 50,998 | 3,667,776 |
| Paycom Software Incorporated † | | | | 1,559 | 443,286 |
| PTC Incorporated † | | | | 3,407 | 397,018 |
| Salesforce.com Incorporated † | | | | 31,883 | 5,108,932 |
| ServiceNow Incorporated † | | | | 6,474 | 3,026,401 |
| Synopsys Incorporated † | | | | 4,966 | 1,585,147 |
| Tyler Technologies Incorporated † | | | | 1,326 | 471,817 |
| | | | | | 96,829,744 |
| Technology hardware, storage & peripherals: 6.80% | | | | | |
| Apple Incorporated | | | | 501,818 | 74,690,591 |
| Hewlett Packard Enterprise Company | | | | 41,866 | 653,110 |
| HP Incorporated | | | | 35,046 | 1,361,187 |
| NetApp Incorporated | | | | 7,195 | 517,680 |
| Seagate Technology Holdings plc | | | | 6,518 | 551,879 |
| Western Digital Corporation † | | | | 10,129 | 614,729 |
| | | | | | 78,389,176 |
| Materials: 2.74% | | | | | |
| Chemicals: 1.89% | | | | | |
| Air Products & Chemicals Incorporated | | | | 7,177 | 1,766,690 |
| Albemarle Corporation | | | | 3,786 | 985,950 |
| Celanese Corporation Series A | | | | 3,497 | 547,350 |
| CF Industries Holdings Incorporated | | | | 6,942 | 685,661 |
| Corteva Incorporated | | | | 23,532 | 1,473,574 |
| Dow Incorporated | | | | 23,815 | 1,618,944 |
| DuPont de Nemours Incorporated | | | | 16,602 | 1,126,446 |
| Eastman Chemical Company | | | | 4,175 | 459,918 |
| Ecolab Incorporated | | | | 8,070 | 1,322,754 |
| FMC Corporation | | | | 4,103 | 502,946 |
| International Flavors & Fragrances Incorporated | | | | 8,239 | 1,088,949 |
| Linde plc | | | | 16,590 | 5,386,441 |
| LyondellBasell Industries NV Class A | | | | 8,510 | 972,268 |
| PPG Industries Incorporated | | | | 7,684 | 971,949 |
| The Mosaic Company | | | | 11,989 | 751,111 |
| The Sherwin-Williams Company | | | | 7,808 | 2,092,856 |
| | | | | | 21,753,807 |
The accompanying notes are an integral part of these financial statements.
34 | Allspring Index Portfolio
Portfolio of investments—May 31, 2022
| | | | | Shares | Value |
| Construction materials: 0.12% | | | | | |
| Martin Marietta Materials Incorporated | | | | 2,019 | $ 685,208 |
| Vulcan Materials Company | | | | 4,295 | 708,117 |
| | | | | | 1,393,325 |
| Containers & packaging: 0.32% | | | | | |
| Amcor plc | | | | 48,996 | 641,848 |
| Avery Dennison Corporation | | | | 2,680 | 462,461 |
| Ball Corporation | | | | 10,484 | 743,211 |
| International Paper Company | | | | 12,535 | 607,321 |
| Packaging Corporation of America | | | | 3,075 | 483,636 |
| Sealed Air Corporation | | | | 4,796 | 298,215 |
| WestRock Company | | | | 8,520 | 413,135 |
| | | | | | 3,649,827 |
| Metals & mining: 0.41% | | | | | |
| Freeport-McMoRan Incorporated | | | | 47,518 | 1,857,003 |
| Newmont Corporation | | | | 25,811 | 1,751,276 |
| Nucor Corporation | | | | 8,804 | 1,166,178 |
| | | | | | 4,774,457 |
| Real estate: 2.72% | | | | | |
| Equity REITs: 2.64% | | | | | |
| Alexandria Real Estate Equities Incorporated | | | | 4,711 | 781,790 |
| American Tower Corporation | | | | 14,741 | 3,775,612 |
| AvalonBay Communities Incorporated | | | | 4,524 | 940,811 |
| Boston Properties Incorporated | | | | 4,601 | 511,539 |
| Camden Property Trust | | | | 3,308 | 474,665 |
| Crown Castle International Corporation | | | | 13,990 | 2,653,204 |
| Digital Realty Trust Incorporated | | | | 9,186 | 1,282,274 |
| Duke Realty Corporation | | | | 12,327 | 651,235 |
| Equinix Incorporated | | | | 2,914 | 2,002,180 |
| Equity Residential | | | | 11,061 | 849,817 |
| Essex Property Trust Incorporated | | | | 2,112 | 599,491 |
| Extra Space Storage Incorporated | | | | 4,334 | 772,319 |
| Federal Realty Investment Trust | | | | 2,290 | 263,281 |
| Healthpeak Properties Incorporated | | | | 17,456 | 518,269 |
| Host Hotels & Resorts Incorporated | | | | 23,112 | 462,009 |
| Iron Mountain Incorporated | | | | 9,372 | 505,151 |
| Kimco Realty Corporation | | | | 19,960 | 472,054 |
| Mid-America Apartment Communities Incorporated | | | | 3,733 | 675,673 |
| Prologis Incorporated | | | | 23,952 | 3,053,401 |
| Public Storage Incorporated | | | | 4,938 | 1,632,700 |
| Realty Income Corporation | | | | 18,313 | 1,249,313 |
| Regency Centers Corporation | | | | 4,988 | 340,231 |
| SBA Communications Corporation | | | | 3,521 | 1,185,204 |
| Simon Property Group Incorporated | | | | 10,637 | 1,219,532 |
| UDR Incorporated | | | | 9,680 | 462,704 |
| Ventas Incorporated | | | | 12,921 | 733,138 |
| Vornado Realty Trust | | | | 5,146 | 179,904 |
| Welltower Incorporated | | | | 14,089 | 1,255,189 |
| Weyerhaeuser Company | | | | 24,189 | 955,949 |
| | | | | | 30,458,639 |
The accompanying notes are an integral part of these financial statements.
Allspring Index Portfolio | 35
Portfolio of investments—May 31, 2022
| | | | | Shares | Value |
| Real estate management & development: 0.08% | | | | | |
| CBRE Group Incorporated Class A † | | | | 10,833 | $ 897,406 |
| Utilities: 2.92% | | | | | |
| Electric utilities: 1.84% | | | | | |
| Alliant Energy Corporation | | | | 8,104 | 517,197 |
| American Electric Power Company Incorporated | | | | 16,302 | 1,663,293 |
| Constellation Energy Corporation | | | | 10,568 | 656,061 |
| Duke Energy Corporation | | | | 24,898 | 2,801,523 |
| Edison International | | | | 12,297 | 859,683 |
| Entergy Corporation | | | | 6,505 | 782,682 |
| Evergy Incorporated | | | | 7,422 | 519,095 |
| Eversource Energy | | | | 11,128 | 1,027,337 |
| Exelon Corporation | | | | 31,705 | 1,558,301 |
| FirstEnergy Corporation | | | | 18,456 | 792,870 |
| NextEra Energy Incorporated | | | | 63,511 | 4,807,148 |
| NRG Energy Incorporated | | | | 7,925 | 364,867 |
| Pinnacle West Capital Corporation | | | | 3,652 | 283,578 |
| PPL Corporation | | | | 24,299 | 733,344 |
| The Southern Company | | | | 34,304 | 2,595,441 |
| Xcel Energy Incorporated | | | | 17,436 | 1,313,628 |
| | | | | | 21,276,048 |
| Gas utilities: 0.04% | | | | | |
| Atmos Energy Corporation | | | | 4,384 | 509,903 |
| Independent power & renewable electricity producers: 0.04% | | | | | |
| AES Corporation | | | | 21,580 | 475,623 |
| Multi-utilities: 0.92% | | | | | |
| Ameren Corporation | | | | 8,338 | 793,694 |
| CenterPoint Energy Incorporated | | | | 20,355 | 652,378 |
| CMS Energy Corporation | | | | 9,379 | 666,284 |
| Consolidated Edison Incorporated | | | | 11,450 | 1,136,527 |
| Dominion Energy Incorporated | | | | 26,218 | 2,208,080 |
| DTE Energy Company | | | | 6,271 | 832,224 |
| NiSource Incorporated | | | | 12,711 | 399,761 |
| Public Service Enterprise Group Incorporated | | | | 16,367 | 1,121,794 |
| Sempra Energy | | | | 10,336 | 1,693,657 |
| WEC Energy Group Incorporated | | | | 10,210 | 1,072,765 |
| | | | | | 10,577,164 |
| Water utilities: 0.08% | | | | | |
| American Water Works Company Incorporated | | | | 5,876 | 888,745 |
| Total Common stocks (Cost $269,500,633) | | | | | 1,131,078,831 |
| Total investments in securities (Cost $269,500,633) | 98.06% | | | | 1,131,078,831 |
| Other assets and liabilities, net | 1.94 | | | | 22,361,052 |
| Total net assets | 100.00% | | | | $1,153,439,883 |
| † | Non-income-earning security |
| Abbreviations: |
| REIT | Real estate investment trust |
The accompanying notes are an integral part of these financial statements.
36 | Allspring Index Portfolio
Portfolio of investments—May 31, 2022
Investments in affiliates
An affiliated investment is an investment in which the Portfolio owns at least 5% of the outstanding voting shares of the issuer or as a result of other relationships, such as the Portfolio and the issuer having the same adviser or investment manager. Transactions with issuers that were affiliates of the Portfolio at the end of the period were as follows:
| | Value,
beginning of
period | Purchases | Sales
proceeds | Net
realized
gains
(losses) | | Net
change in
unrealized
gains
(losses) | | Value,
end of
period | Shares,
end
of period | Income
from
affiliated
securities |
| Affiliated securities no longer held at end of period | | | | | | | | | |
| Allspring Government Money Market Fund Select Class | $14,730,757 | $118,684,105 | $(133,414,862) | $0 | | $0 | | $0 | 0 | $ 18,300 |
| Securities Lending Cash Investments LLC | 182,600 | 7,358,325 | (7,540,925) | 0 | | 0 | | 0 | 0 | 164 # |
| | | | | $0 | | $0 | | $0 | | $18,464 |
| # | Amount shown represents income before fees and rebates. |
Futures contracts
| Description | Number of
contracts | Expiration
date | Notional
cost | Notional
value | Unrealized
gains | Unrealized
losses |
| Long | | | | | | |
| E-Mini S&P 500 Index | 107 | 6-17-2022 | $21,075,030 | $22,102,188 | $1,027,158 | $0 |
The accompanying notes are an integral part of these financial statements.
Allspring Index Portfolio | 37
Statement of assets and liabilities—May 31, 2022
| | |
| Assets | |
Investments in unaffiliated securities, at value (cost $269,500,633)
| $ 1,131,078,831 |
Cash
| 18,849,090 |
Cash at broker segregated for futures contracts
| 1,954,799 |
Receivable for dividends
| 1,678,632 |
Prepaid expenses and other assets
| 120,367 |
Total assets
| 1,153,681,719 |
| Liabilities | |
Payable for daily variation margin on open futures contracts
| 131,075 |
Advisory fee payable
| 93,618 |
Custody and accounting fees payable
| 15,005 |
Accrued expenses and other liabilities
| 2,138 |
Total liabilities
| 241,836 |
Total net assets
| $1,153,439,883 |
The accompanying notes are an integral part of these financial statements.
38 | Allspring Index Portfolio
Statement of operations—year ended May 31, 2022
| | |
| Investment income | |
Dividends (net of foreign withholdings taxes of $87,142)
| $ 17,878,915 |
Income from affiliated securities
| 19,261 |
Total investment income
| 17,898,176 |
| Expenses | |
Advisory fee
| 1,238,357 |
Custody and accounting fees
| 65,492 |
Professional fees
| 75,782 |
Interest holder report expenses
| 12,638 |
Trustees’ fees and expenses
| 19,821 |
Other fees and expenses
| 35,740 |
Total expenses
| 1,447,830 |
Net investment income
| 16,450,346 |
| Realized and unrealized gains (losses) on investments | |
| Net realized gains on | |
Unaffiliated securities
| 112,904,432 |
Futures contracts
| 2,698,867 |
Net realized gains on investments
| 115,603,299 |
| Net change in unrealized gains (losses) on | |
Unaffiliated securities
| (128,688,277) |
Futures contracts
| (164,607) |
Net change in unrealized gains (losses) on investments
| (128,852,884) |
Net realized and unrealized gains (losses) on investments
| (13,249,585) |
Net increase in net assets resulting from operations
| $ 3,200,761 |
The accompanying notes are an integral part of these financial statements.
Allspring Index Portfolio | 39
Statement of changes in net assets
| | | |
| | Year ended
May 31, 2022 | Year ended
May 31, 2021 |
| Operations | | |
Net investment income
| $ 16,450,346 | $ 16,723,882 |
Net realized gains on investments
| 115,603,299 | 104,436,025 |
Net change in unrealized gains (losses) on investments
| (128,852,884) | 276,635,342 |
Net increase in net assets resulting from operations
| 3,200,761 | 397,795,249 |
| Capital transactions | | |
| Transactions in investors’ beneficial interests | | |
Contributions
| 5,401,131 | 13,277,558 |
Withdrawals
| (161,957,733) | (159,782,351) |
Net decrease in net assets resulting from capital transactions
| (156,556,602) | (146,504,793) |
Total increase (decrease) in net assets
| (153,355,841) | 251,290,456 |
| Net assets | | |
Beginning of period
| 1,306,795,724 | 1,055,505,268 |
End of period
| $1,153,439,883 | $1,306,795,724 |
The accompanying notes are an integral part of these financial statements.
40 | Allspring Index Portfolio
| | Year ended May 31 |
| | 2022 | 2021 | 2020 | 2019 | 2018 |
Total return
| (0.41)% | 40.16% | 12.74% | 3.67% | 14.27% |
| Ratios to average net assets (annualized) | | | | | |
Gross expenses
| 0.11% | 0.11% | 0.12% | 0.11% | 0.10% |
Net expenses
| 0.11% | 0.11% | 0.12% | 0.11% | 0.10% |
Net investment income
| 1.25% | 1.41% | 1.80% | 1.86% | 1.84% |
| Supplemental data | | | | | |
Portfolio turnover rate
| 2% | 4% | 3% | 4% | 3% |
The accompanying notes are an integral part of these financial statements.
Allspring Index Portfolio | 41
Notes to financial statements
1. ORGANIZATION
Allspring Master Trust (the "Trust"), a Delaware statutory trust organized on March 10, 1999, is an open-end management investment company registered under the Investment Company Act of 1940, as amended (the "1940 Act"). As an investment company, the Trust follows the accounting and reporting guidance in Financial Accounting Standards Board ("FASB") Accounting Standards Codification Topic 946, Financial Services – Investment Companies. These financial statements report on the Allspring Index Portfolio (the "Portfolio") which is a diversified series of the Trust.
Interests in the Portfolio are available solely through private placement transactions that do not involve any "public offering" within the meaning of Section 4(a)(2) of the Securities Act of 1933.
Effective on November 1, 2021, the sale transaction of Wells Fargo Asset Management ("WFAM") by Wells Fargo & Company to GTCR LLC and Reverence Capital Partners, L.P. was closed. In connection with the closing of the transaction, WFAM became known as Allspring Global Investments (“Allspring”) and various entities that provided services to the Portfolio changed their names to "Allspring", including Allspring Funds Management, LLC, the adviser to the Portfolio, Allspring Global Investments, LLC and Allspring Global Investments (UK) Limited, both registered investment advisers providing subadvisory services to certain funds, and Allspring Funds Distributor, LLC. Consummation of the transaction resulted in a new advisory agreement and subadvisory agreement which became effective on November 1, 2021.
2. SIGNIFICANT ACCOUNTING POLICIES
The following significant accounting policies, which are consistently followed in the preparation of the financial statements of the Portfolio, are in conformity with U.S. generally accepted accounting principles which require management to make estimates and assumptions that affect the reported amounts of assets and liabilities, disclosure of contingent assets and liabilities at the date of the financial statements, and the reported amounts of income and expenses during the reporting period. Actual results could differ from those estimates.
Securities valuation
All investments are valued each business day as of the close of regular trading on the New York Stock Exchange (generally 4 p.m. Eastern Time), although the Portfolio may deviate from this calculation time under unusual or unexpected circumstances.
Equity securities and futures contracts that are listed on a foreign or domestic exchange or market are valued at the official closing price or, if none, the last sales price.
Investments in registered open-end investment companies are valued at net asset value. Interests in non-registered investment companies that are redeemable at net asset value are fair valued normally at net asset value.
Investments which are not valued using any of the methods discussed above are valued at their fair value, as determined in good faith by the Board of Trustees. The Board of Trustees has established a Valuation Committee comprised of the Trustees and has delegated to it the authority to take any actions regarding the valuation of portfolio securities that the Valuation Committee deems necessary or appropriate, including determining the fair value of portfolio securities, unless the determination has been delegated to the Allspring Global Investments Pricing Committee at Allspring Funds Management, LLC ("Allspring Funds Management"). The Board of Trustees retains the authority to make or ratify any valuation decisions or approve any changes to the Valuation Procedures as it deems appropriate. On a quarterly basis, the Board of Trustees receives reports on any valuation actions taken by the Valuation Committee or the Allspring Global Investments Pricing Committee which may include items for ratification.
Securities lending
The Portfolio may lend its securities from time to time in order to earn additional income in the form of fees or interest on securities received as collateral or the investment of any cash received as collateral. When securities are on loan, the Portfolio receives interest or dividends on those securities. Cash collateral received in connection with its securities lending transactions is invested in Securities Lending Cash Investments, LLC (the "Securities Lending Fund"), an affiliated non-registered investment company. Investments in Securities Lending Fund are valued at the evaluated bid price provided by an independent pricing service. Income earned from investment in the Securities Lending Fund (net of fees and rebates), if any, is included in income from affiliated securities on the Statement of Operations.
In a securities lending transaction, the net asset value of the Portfolio is affected by an increase or decrease in the value of the securities loaned and by an increase or decrease in the value of the instrument in which collateral is invested. The amount of securities lending activity undertaken by the Portfolio fluctuates from time to time. The Portfolio has the right under the lending agreement to recover the securities from the borrower on demand. In the event of default or bankruptcy by the
42 | Allspring Index Portfolio
Notes to financial statements
borrower, the Portfolio may be prevented from recovering the loaned securities or gaining access to the collateral or may experience delays or costs in doing so. In such an event, the terms of the agreement allow the unaffiliated securities lending agent to use the collateral to purchase replacement securities on behalf of the Portfolio or pay the Portfolio the market value of the loaned securities. The Portfolio bears the risk of loss with respect to depreciation of its investment of the cash collateral.
Futures contracts
Futures contracts are agreements between the Portfolio and a counterparty to buy or sell a specific amount of a commodity, financial instrument or currency at a specified price on a specified date. The Portfolio may buy and sell futures contracts in order to gain exposure to, or protect against, changes in security values and is subject to equity price risk. The primary risks associated with the use of futures contracts are the imperfect correlation between changes in market values of securities held by the Portfolio and the prices of futures contracts, and the possibility of an illiquid market. Futures contracts are generally entered into on a regulated futures exchange and cleared through a clearinghouse associated with the exchange. With futures contracts, there is minimal counterparty risk to the Portfolio since futures contracts are exchange traded and the exchange’s clearinghouse, as the counterparty to all exchange traded futures, guarantees the futures contracts against default.
Upon entering into a futures contract, the Portfolio is required to deposit either cash or securities (initial margin) with the broker in an amount equal to a certain percentage of the contract value. Subsequent payments (variation margin) are paid to or from the broker each day equal to the daily changes in the contract value. Such payments are recorded as unrealized gains or losses and, if any, shown as variation margin receivable (payable) in the Statement of Assets and Liabilities. Should the Portfolio fail to make requested variation margin payments, the broker can gain access to the initial margin to satisfy the Portfolio’s payment obligations. When the contracts are closed, a realized gain or loss is recorded in the Statement of Operations.
Security transactions and income recognition
Securities transactions are recorded on a trade date basis. Realized gains or losses are recorded on the basis of identified cost.
Dividend income is recognized on the ex-dividend date. Dividend income is recorded net of foreign taxes withheld where recovery of such taxes is not assured.
Federal and other taxes
The Portfolio is not required to pay federal income taxes on its net investment income and net capital gains as it is treated as a partnership for federal income tax purposes. All income, gains and losses of the Portfolio are deemed to have been “passed through” to the interest holders in proportion to their holdings of the Portfolio regardless of whether income and gains have been distributed by the Portfolio.
The Portfolio’s income tax returns and all financial records supporting those returns for the prior three fiscal years are subject to examination by the federal revenue authority. Management has analyzed the Portfolio’s tax positions taken on federal, state, and foreign tax returns, as applicable, for all open tax years and does not believe that there are any uncertain tax positions that require recognition of a tax liability.
As of May 31, 2022, the aggregate cost of all investments for federal income tax purposes was $286,858,977 and the unrealized gains (losses) consisted of:
| Gross unrealized gains | $871,919,932 |
| Gross unrealized losses | (26,672,920) |
| Net unrealized gains | $845,247,012 |
Allspring Index Portfolio | 43
Notes to financial statements
3. FAIR VALUATION MEASUREMENTS
Fair value measurements of investments are determined within a framework that has established a fair value hierarchy based upon the various data inputs utilized in determining the value of the Portfolio’s investments. The three-level hierarchy gives the highest priority to unadjusted quoted prices in active markets for identical assets or liabilities (Level 1) and the lowest priority to unobservable inputs (Level 3). The Portfolio’s investments are classified within the fair value hierarchy based on the lowest level of input that is significant to the fair value measurement. The inputs are summarized into three broad levels as follows:
| ■ | Level 1 – quoted prices in active markets for identical securities |
| ■ | Level 2 – other significant observable inputs (including quoted prices for similar securities, interest rates, prepayment speeds, credit risk, etc.) |
| ■ | Level 3 – significant unobservable inputs (including the Portfolio’s own assumptions in determining the fair value of investments) |
The inputs or methodologies used for valuing investments in securities are not necessarily an indication of the risk associated with investing in those securities.
The following is a summary of the inputs used in valuing the Portfolio’s assets and liabilities as of May 31, 2022:
| | Quoted prices
(Level 1) | Other significant
observable inputs
(Level 2) | Significant
unobservable inputs
(Level 3) | Total |
| Assets | | | | |
| Investments in: | | | | |
| Common stocks | | | | |
| Communication services | $ 99,628,875 | $0 | $0 | $ 99,628,875 |
| Consumer discretionary | 123,168,244 | 0 | 0 | 123,168,244 |
| Consumer staples | 73,464,168 | 0 | 0 | 73,464,168 |
| Energy | 54,247,957 | 0 | 0 | 54,247,957 |
| Financials | 127,112,349 | 0 | 0 | 127,112,349 |
| Health care | 162,649,021 | 0 | 0 | 162,649,021 |
| Industrials | 89,228,898 | 0 | 0 | 89,228,898 |
| Information technology | 304,924,375 | 0 | 0 | 304,924,375 |
| Materials | 31,571,416 | 0 | 0 | 31,571,416 |
| Real estate | 31,356,045 | 0 | 0 | 31,356,045 |
| Utilities | 33,727,483 | 0 | 0 | 33,727,483 |
| | 1,131,078,831 | 0 | 0 | 1,131,078,831 |
| Futures contracts | 1,027,158 | 0 | 0 | 1,027,158 |
| Total assets | $1,132,105,989 | $0 | $0 | $1,132,105,989 |
Futures contracts are reported at their cumulative unrealized gains (losses) at measurement date as reported in the table following the Portfolio of Investments. For futures contracts, the current day’s variation margin is reported on the Statement of Assets and Liabilities. All other assets and liabilities are reported at their market value at measurement date.
Additional sector, industry or geographic detail, if any, is included in the Portfolio of Investments.
For the year ended May 31, 2022, the Portfolio did not have any transfers into/out of Level 3.
4. TRANSACTIONS WITH AFFILIATES
Advisory fee
The Trust has entered into an advisory contract with Allspring Funds Management, a wholly owned subsidiary of Allspring Global Investments Holdings, LLC, a holding company indirectly owned by certain private funds of GTCR LLC and Reverence Capital Partners, L.P. The adviser is responsible for implementing investment policies and guidelines and for supervising the subadviser, who is responsible for day-to-day portfolio management of the Portfolio. Pursuant to the contract, Allspring Funds Management is entitled to receive an advisory fee at the following annual rate based on the Portfolio’s average daily net assets:
44 | Allspring Index Portfolio
Notes to financial statements
| Average daily net assets | Advisory fee |
| First $500 million | 0.100% |
| Next $500 million | 0.100 |
| Next $2 billion | 0.075 |
| Next $2 billion | 0.075 |
| Over $5 billion | 0.050 |
For the year ended May 31, 2022, the advisory fee was equivalent to an annual rate of 0.09% of the Portfolio’s average daily net assets.
Allspring Funds Management has retained the services of a subadviser to provide daily portfolio management to the Portfolio. The fee for subadvisory services is borne by Allspring Funds Management. Allspring Global Investments, LLC ("Allspring Investments"), an affiliate of Allspring Funds Management and a wholly owned subsidiary of Allspring Global Investments Holdings, LLC, is the subadviser to the Portfolio and is entitled to receive a fee from Allspring Funds Management at an annual rate starting at 0.05% and declining to 0.02% as the average daily net assets of the Portfolio increase.
Interfund transactions
The Portfolio may purchase or sell portfolio investment securities to certain affiliates pursuant to Rule 17a-7 under the 1940 Act and under procedures adopted by the Board of Trustees. The procedures have been designed to ensure that these interfund transactions, which do not incur broker commissions, are effected at current market prices.
5. INVESTMENT PORTFOLIO TRANSACTIONS
Purchases and sales of investments, excluding U.S. government obligations (if any) and short-term securities, for the year ended May 31, 2022 were $28,275,102 and $168,811,347, respectively.
6. SECURITIES LENDING TRANSACTIONS
The Portfolio lends its securities through an unaffiliated securities lending agent and receives collateral in the form of cash or securities with a value at least equal to the value of the securities on loan. The value of the loaned securities is determined at the close of each business day and any increases or decreases in the required collateral are exchanged between the Portfolio and the counterparty on the next business day. Cash collateral received is invested in the Securities Lending Fund which seeks to provide a positive return compared to the daily Federal Funds Open Rate by investing in high-quality, U.S. dollar-denominated short-term money market instruments and is exempt from registration under Section 3(c)(7) of the 1940 Act. Securities Lending Fund is managed by Allspring Funds Management and is subadvised by Allspring Investments. Allspring Funds Management receives an advisory fee starting at 0.05% and declining to 0.01% as the average daily net assets of the Securities Lending Fund increase. All of the fees received by Allspring Funds Management are paid to Allspring Investments for its services as subadviser.
In the event of counterparty default or the failure of a borrower to return a loaned security, the Portfolio has the right to use the collateral to offset any losses incurred. As of May 31, 2022, the Portfolio did not have any securities on loan.
7. DERIVATIVE TRANSACTIONS
During the year ended May 31, 2022, the Portfolio entered into futures contracts to gain market exposure. The Portfolio had an average notional amount of $26,701,491 in long futures contracts during the year ended May 31, 2022.
The fair value, realized gains or losses and change in unrealized gains or losses, if any, on derivative instruments are reflected in the corresponding financial statement captions.
8. BANK BORROWINGS
The Trust, along with Allspring Variable Trust and Allspring Funds Trust (excluding the money market funds), are parties to a $350,000,000 revolving credit agreement whereby the Portfolio is permitted to use bank borrowings for temporary or emergency purposes, such as to fund interest holders withdrawal requests. Interest under the credit agreement is charged to the Portfolio based on a borrowing rate equal to the higher of the Federal Funds rate in effect on that day plus 1.25% or the overnight bank funding rate in effect on that day plus 1.25%. In addition, an annual commitment fee equal to 0.25% of the unused balance is allocated to each participating fund.
For the year ended May 31, 2022, there were no borrowings by the Portfolio under the agreement.
Allspring Index Portfolio | 45
Notes to financial statements
9. CONCENTRATION RISKS
As of the end of the period, the Portfolio concentrated its portfolio of investments in the information technology sector. A fund that invests a substantial portion of its assets in any sectors may be more affected by changes in that sectors than would be a fund whose investments are not heavily weighted in any sectors.
10. INDEMNIFICATION
Under the Portfolio's organizational documents, the officers and Trustees have been granted certain indemnification rights against certain liabilities that may arise out of performance of their duties to the Portfolio. The Portfolio has entered into a separate agreement with each Trustee that converts indemnification rights currently existing under the Portfolio’s organizational documents into contractual rights that cannot be changed in the future without the consent of the Trustee. Additionally, in the normal course of business, the Portfolio may enter into contracts with service providers that contain a variety of indemnification clauses. The Portfolio’s maximum exposure under these arrangements is dependent on future claims that may be made against the Portfolio and, therefore, cannot be estimated.
11. CORONAVIRUS (COVID-19) PANDEMIC
On March 11, 2020, the World Health Organization announced that it had made the assessment that coronavirus disease 2019 (“COVID-19”) is a pandemic. The impacts of COVID-19 are affecting the entire global economy, individual companies and investment products, the funds, and the market in general. There is significant uncertainty around the extent and duration of business disruptions related to COVID-19 and the impacts may last for an extended period of time. COVID-19 has led to significant uncertainty and volatility in the financial markets.
12. SUBSEQUENT EVENT
After the close of business on May 31, 2022, Allspring Index Fund (“Index Fund”), the sole investor in the Portfolio, redeemed its investment in the Portfolio. Index Fund received its redemption proceeds in the form of an in-kind distribution of the Portfolio’s securities. Subsequent to the redemption of Index Fund’s investment, the Portfolio was closed and liquidated effective June 1, 2022. The liquidation of the Portfolio after the redemption transaction by Index Fund was approved by the Board of Trustees at a meeting held February 23-24, 2022.
46 | Allspring Index Portfolio
Report of independent registered public accounting firm
To the Interest Holders of the Portfolio and Board of Trustees
Allspring Master Trust:
Opinion on the Financial Statements
We have audited the accompanying statement of assets and liabilities of Allspring Index Portfolio (formerly, Wells Fargo Index Portfolio) (the Portfolio), one of the portfolios constituting Allspring Master Trust (formerly, Wells Fargo Master Trust), including the portfolio of investments, as of May 31, 2022, the related statement of operations for the year then ended, the statements of changes in net assets for each of the years in the two-year period then ended, and the related notes (collectively, the financial statements) and the financial highlights for each of the years in the five-year period then ended. In our opinion, the financial statements and financial highlights present fairly, in all material respects, the financial position of the Portfolio as of May 31, 2022, the results of its operations for the year then ended, the changes in its net assets for each of the years in the two-year period then ended, and the financial highlights for each of the years in the five-year period then ended, in conformity with U.S. generally accepted accounting principles.
Basis for Opinion
These financial statements and financial highlights are the responsibility of the Portfolio’s management. Our responsibility is to express an opinion on these financial statements and financial highlights based on our audits. We are a public accounting firm registered with the Public Company Accounting Oversight Board (United States) (PCAOB) and are required to be independent with respect to the Portfolio in accordance with the U.S. federal securities laws and the applicable rules and regulations of the Securities and Exchange Commission and the PCAOB.
We conducted our audits in accordance with the standards of the PCAOB. Those standards require that we plan and perform the audit to obtain reasonable assurance about whether the financial statements and financial highlights are free of material misstatement, whether due to error or fraud. Our audits included performing procedures to assess the risks of material misstatement of the financial statements and financial highlights, whether due to error or fraud, and performing procedures that respond to those risks. Such procedures included examining, on a test basis, evidence regarding the amounts and disclosures in the financial statements and financial highlights. Such procedures also included confirmation of securities owned as of May 31, 2022, by correspondence with the custodian, transfer agent and brokers. Our audits also included evaluating the accounting principles used and significant estimates made by management, as well as evaluating the overall presentation of the financial statements and financial highlights. We believe that our audits provide a reasonable basis for our opinion.
We have not been able to determine the specific year that we began serving as the auditor of one or more Allspring Funds investment companies; however, we are aware that we have served as the auditor of one or more Allspring Funds investment companies since at least 1955.
Boston, Massachusetts
July 27, 2022
Allspring Index Portfolio | 47
Other information (unaudited)
TAX INFORMATION
For corporate shareholders, pursuant to Section 854 of the Internal Revenue Code, 95% of ordinary income dividends qualify for the corporate dividends-received deduction for the fiscal year ended May 31, 2022.
Pursuant to Section 852 of the Internal Revenue Code, $99,255,018 was designated as a 20% rate gain distribution for the fiscal year ended May 31, 2022.
Pursuant to Section 854 of the Internal Revenue Code, $17,471,154 of income dividends paid during the fiscal year ended May 31, 2022 has been designated as qualified dividend income (QDI).
For the fiscal year ended May 31, 2022, $5,496,380 has been designated as short-term capital gain dividends for nonresident alien shareholders pursuant to Section 871 of the Internal Revenue Code.
PROXY VOTING INFORMATION
A description of the policies and procedures used to determine how to vote proxies relating to portfolio securities is available without charge, upon request, by calling 1-800-222-8222, visiting our website at allspringglobal.com, or visiting the SEC website at sec.gov. Information regarding how the proxies related to portfolio securities were voted during the most recent 12-month period ended June 30 is available on the website at allspringglobal.com or by visiting the SEC website at sec.gov.
QUARTERLY PORTFOLIO HOLDINGS INFORMATION
The Fund and Portfolio file their complete schedule of portfolio holdings with the SEC for the first and third quarters of each fiscal year as an exhibit to their reports on Form N-PORT. Shareholders and Interest holders may view the filed Form N-PORT by visiting the SEC website at sec.gov.
48 | Allspring Index Fund
Other information (unaudited)
BOARD OF TRUSTEES AND OFFICERS
Each of the Trustees and Officers listed in the table below acts in identical capacities for each fund in the Allspring family of funds, which consists of 137 mutual funds comprising the Allspring Funds Trust, Allspring Variable Trust, Allspring Master Trust and four closed-end funds (collectively the “Fund Complex”). This table should be read in conjunction with the Prospectus and the Statement of Additional Information1. The mailing address of each Trustee and Officer is 525 Market Street, 12th Floor, San Francisco, CA 94105. Each Trustee and Officer serves an indefinite term, however, each Trustee serves such term until reaching the mandatory retirement age established by the Trustees.
Independent Trustees
Name and
year of birth | Position held and
length of service* | Principal occupations during past five years or longer | Current other
public company or
investment
company
directorships |
William R. Ebsworth
(Born 1957) | Trustee,
since 2015 | Retired. From 1984 to 2013, equities analyst, portfolio manager, research director and chief investment officer at Fidelity Management and Research Company in Boston, Tokyo, and Hong Kong, and retired in 2013 as Chief Investment Officer of Fidelity Strategic Advisers, Inc. where he led a team of investment professionals managing client assets. Prior thereto, Board member of Hong Kong Securities Clearing Co., Hong Kong Options Clearing Corp., the Thailand International Fund, Ltd., Fidelity Investments Life Insurance Company, and Empire Fidelity Investments Life Insurance Company. Audit Committee Chair and Investment Committee Chair of the Vincent Memorial Hospital Endowment (non-profit organization). Mr. Ebsworth is a CFA® charterholder. | N/A |
Jane A. Freeman
(Born 1953) | Trustee,
since 2015;
Chair Liaison,
since 2018 | Retired. From 2012 to 2014 and 1999 to 2008, Chief Financial Officer of Scientific Learning Corporation. From 2008 to 2012, Ms. Freeman provided consulting services related to strategic business projects. Prior to 1999, Portfolio Manager at Rockefeller & Co. and Scudder, Stevens & Clark. Board member of the Harding Loevner Funds from 1996 to 2014, serving as both Lead Independent Director and chair of the Audit Committee. Board member of the Russell Exchange Traded Funds Trust from 2011 to 2012 and the chair of the Audit Committee. Ms. Freeman is also an inactive Chartered Financial Analyst. | N/A |
Isaiah Harris, Jr.
(Born 1952) | Trustee,
since 2009; Audit
Committee
Chair,
since 2019 | Retired. Chairman of the Board of CIGNA Corporation from 2009 to 2021, and Director from 2005 to 2008. From 2003 to 2011, Director of Deluxe Corporation. Prior thereto, President and CEO of BellSouth Advertising and Publishing Corp. from 2005 to 2007, President and CEO of BellSouth Enterprises from 2004 to 2005 and President of BellSouth Consumer Services from 2000 to 2003. Emeritus member of the Iowa State University Foundation Board of Governors. Emeritus Member of the Advisory Board of Iowa State University School of Business. Advisory Board Member, Palm Harbor Academy (private school). Advisory Board Member, Fellowship of Christian Athletes. Mr. Harris is a certified public accountant (inactive status). | N/A |
David F. Larcker
(Born 1950) | Trustee,
since 2009 | James Irvin Miller Professor of Accounting at the Graduate School of Business (Emeritus), Stanford University, Director of the Corporate Governance Research Initiative and Senior Faculty of The Rock Center for Corporate Governance since 2006. From 2005 to 2008, Professor of Accounting at the Graduate School of Business, Stanford University. Prior thereto, Ernst & Young Professor of Accounting at The Wharton School, University of Pennsylvania from 1985 to 2005. | N/A |
Allspring Index Fund | 49
Other information (unaudited)
Name and
year of birth | Position held and
length of service* | Principal occupations during past five years or longer | Current other
public company or
investment
company
directorships |
Olivia S. Mitchell
(Born 1953) | Trustee,
since 2006;
Nominating and
Governance
Committee Chair,
since 2018 | International Foundation of Employee Benefit Plans Professor since 1993, Wharton School of the University of Pennsylvania. Director of Wharton’s Pension Research Council and Boettner Center on Pensions & Retirement Research, and Research Associate at the National Bureau of Economic Research. Previously taught at Cornell University from 1978 to 1993. | N/A |
Timothy J. Penny
(Born 1951) | Trustee,
since 1996;
Chair,
since 2018 | President and Chief Executive Officer of Southern Minnesota Initiative Foundation, a non-profit organization, since 2007. Member of the Board of Trustees of NorthStar Education Finance, Inc., a non-profit organization, since 2007. | N/A |
James G. Polisson
(Born 1959) | Trustee,
since 2018 | Retired. Chief Marketing Officer, Source (ETF) UK Services, Ltd, from 2015 to 2017. From 2012 to 2015, Principal of The Polisson Group, LLC, a management consulting, corporate advisory and principal investing company. Chief Executive Officer and Managing Director at Russell Investments, Global Exchange Traded Funds from 2010 to 2012. Managing Director of Barclays Global Investors from 1998 to 2010 and Global Chief Marketing Officer for iShares and Barclays Global Investors from 2000 to 2010. Trustee of the San Francisco Mechanics’ Institute, a non-profit organization, from 2013 to 2015. Board member of the Russell Exchange Traded Fund Trust from 2011 to 2012. Director of Barclays Global Investors Holdings Deutschland GmbH from 2006 to 2009. Mr. Polisson is an attorney and has a retired status with the Massachusetts and District of Columbia Bar Associations. | N/A |
Pamela Wheelock
(Born 1959) | Trustee,
since January
2020; previously
Trustee from
January 2018 to
July 2019 | Board member of the Destination Medical Center Economic Development Agency, Rochester, Minnesota since 2019. Interim President of the McKnight Foundation from January to September 2020. McKnight Foundation Consultant, November 2020 to February 2021. Acting Commissioner, Minnesota Department of Human Services, July 2019 through September 2019. Consultant (part-time), Minnesota Department of Human Services, October 2019 through December 2019. Chief Operating Officer, Twin Cities Habitat for Humanity from 2017 to 2019. Vice President of University Services, University of Minnesota from 2012 to 2016. Prior thereto, on the Board of Directors, Governance Committee and Finance Committee for the Minnesota Philanthropy Partners (Saint Paul Foundation) from 2012 to 2018, Interim Chief Executive Officer of Blue Cross Blue Shield of Minnesota from 2011 to 2012, Chairman of the Board from 2009 to 2012 and Board Director from 2003 to 2015. Vice President, Leadership and Community Engagement, Bush Foundation, Saint Paul, Minnesota (a private foundation) from 2009 to 2011. Executive Vice President and Chief Financial Officer, Minnesota Sports and Entertainment from 2004 to 2009 and Senior Vice President from 2002 to 2004. Executive Vice President of the Minnesota Wild Foundation from 2004 to 2008. Commissioner of Finance, State of Minnesota, from 1999 to 2002. Currently Board Chair of the Minnesota Wild Foundation since 2010. | N/A |
* Length of service dates reflect the Trustee’s commencement of service with the Trust’s predecessor entities, where applicable.
50 | Allspring Index Fund
Other information (unaudited)
Officers2
Name and
year of birth | Position held and
length of service | Principal occupations during past five years or longer |
Andrew Owen
(Born 1960) | President,
since 2017 | President, Chief Executive Officer and Director of Allspring Funds Management, LLC since 2017 and co-president of Galliard Capital Management, LLC, an affiliate of Allspring Funds Management, LLC, since 2019. Prior thereto, Head of Affiliated Managers, Allspring Global Investments, from 2014 to 2019 and Executive Vice President responsible for marketing, investments and product development for Allspring Funds Management, LLC, from 2009 to 2014. In addition, Mr. Owen was an Executive Vice President of Wells Fargo & Company from 2014 to 2021. |
Jeremy DePalma
(Born 1974) | Treasurer,
since 2012
(for certain funds in
the Fund Complex);
since 2021 (for
the remaining funds in the
Fund Complex) | Senior Vice President of Allspring Funds Management, LLC since 2009. Senior Vice President of Evergreen Investment Management Company, LLC from 2008 to 2010 and head of the Fund Reporting and Control Team within Fund Administration from 2005 to 2010. |
Kate McKinley
(Born 1977) | Chief Legal Officer,
since 2021 | Chief Legal Officer of Allspring Global Investments since 2021. Prior thereto, held various roles at State Street Global Advisors beginning in 2010, including serving as Senior Vice President and General Counsel from 2019 to 2021, and Chief Operating Officer of the Institutional Client Group from 2016 - 2019. Prior to working at State Street Global Advisors served as Assistant General Counsel for Bank of America Corporation from 2005 to 2010 and as an Associate at WilmerHale from 2002 to 2005. |
Christopher Baker
(Born 1976) | Chief Compliance Officer, since 2022 | Global Chief Compliance Officer for Allspring Global Investments since 2022. Prior thereto, Chief Compliance Officer for State Street Global Advisors from 2018 to 2021. Senior Compliance Officer for the State Street divisions of Alternative Investment Solutions, Sector Solutions, and Global Marketing from 2015 to 2018. From 2010 to 2015 Vice President, Global Head of Investment and Marketing Compliance for State Street Global Advisors. |
Matthew Prasse
(Born 1983) | Secretary,
since 2021 | Senior Counsel of the Allspring Legal Department since 2021. Senior Counsel of the Wells Fargo Legal Department from 2018 to 2021. Previously, Counsel for Barings LLC from 2015 to 2018. Prior to joining Barings, Associate at Morgan, Lewis & Bockius LLP from 2008 to 2015. |
1 The Statement of Additional Information includes additional information about the Trustees and is available, without charge, upon request, by calling 1-800-222-8222 or by visiting the website at allspringglobal.com.
2 For those Officers with tenures at Allspring Global Investments and/or Allspring Funds Management, LLC that began prior to 2021, such tenures include years of service during which these businesses/entities were known as Wells Fargo Asset Management and Wells Fargo Funds Management, LLC, respectively.
Allspring Index Fund | 51
Other information (unaudited)
LIQUIDITY RISK MANAGEMENT PROGRAM
In accordance with Rule 22e-4 under the Investment Company Act of 1940, as amended (the “Liquidity Rule”), Allspring Funds Trust (“Funds Trust”) has adopted and implemented a liquidity risk management program (the “Program”) on behalf of each of its series (other than the series that operate as money market funds), including the Fund, and Allspring Master Trust (“Master Trust” and together with Funds Trust, the “Trusts”) has adopted and implemented the Program on behalf of each of its series, including the Portfolio, which is reasonably designed to assess and manage the Fund's and the Portfolio’s liquidity risk. “Liquidity risk” is defined under the Liquidity Rule as the risk that the Fund or Portfolio is unable to meet redemption requests without significantly diluting remaining investors’ interests in the Fund or Portfolio. The Trusts’ Boards of Trustees (the “Boards”) previously approved the designation of Allspring Funds Management, LLC (“Allspring Funds Management”), the Fund's investment manager and the Portfolio’s investment adviser, to administer the Program, and Allspring Funds Management has established a Liquidity Risk Management Council (the "Council") composed of personnel from multiple departments within Allspring Funds Management and its affiliates to assist Allspring Funds Management in the administration of the Program.
The Program is comprised of various components designed to support the assessment and/or management of liquidity risk, including: (1) the periodic assessment (no less frequently than annually) of certain factors that influence the Fund's and the Portfolio’s liquidity risk; (2) the periodic classification (no less frequently than monthly) of the Fund's and the Portfolio’s investments into one of four liquidity categories that reflect an estimate of their liquidity under current market conditions; (3) a 15% limit on the acquisition of “illiquid investments” (as defined under the Liquidity Rule); (4) to the extent the Fund or the Portfolio does not invest primarily in “highly liquid investments” (as defined under the Liquidity Rule), the determination of a minimum percentage of the Fund's or Portfolio’s assets that generally will be invested in highly liquid investments (an “HLIM”); (5) if the Fund or the Portfolio has established an HLIM, the periodic review (no less frequently than annually) of the HLIM and the adoption of policies and procedures for responding to a shortfall of the Fund's or the Portfolio’s “highly liquid investments” below its HLIM; and (6) periodic reporting to the Boards.
At a meeting of the Boards held on May 24-25, 2022, the Boards received and reviewed a written report (the “Report”) from Allspring Funds Management that, among other things, addressed the operation of the Program and assessed its adequacy and effectiveness for the period from January 1, 2021 through December 31, 2021 (the “Reporting Period”). Other than extended foreign market holidays, no significant liquidity events impacting the Funds or the Portfolios were noted in the Report. In addition, other than corporate-related changes to the Program, there were no material changes to the Program during the Reporting Period.
Allspring Funds Management determined in the Report that the Program has been implemented and operates effectively to manage each Fund’s and Portfolio’s, including the Fund’s and the Portfolio’s, liquidity risk, and Allspring Funds Management continues to believe that the Program has been and continues to be adequately and effectively implemented to monitor and, as applicable, respond to the Fund’s and the Portfolio’s liquidity developments.
There can be no assurance that the Program will achieve its objectives under all circumstances in the future. With respect to the Fund, please refer to the Fund’s prospectus for more information regarding the Fund’s exposure to liquidity risk and other risks to which an investment in the Fund may be subject.
52 | Allspring Index Fund
For more information
More information about Allspring Funds is available free upon request. To obtain literature, please write, visit the Fund's website, or call:
Allspring Funds
P.O. Box 219967
Kansas City, MO 64121-9967
Website: allspringglobal.com
Individual investors: 1-800-222-8222
Retail investment professionals: 1-888-877-9275
Institutional investment professionals: 1-800-260-5969
This report and the financial statements contained herein are submitted for the general information of the shareholders of the Fund. If this report is used for promotional purposes, distribution of the report must be accompanied or preceded by a current prospectus. Before investing, please consider the investment objectives, risks, charges, and expenses of the investment. For a current prospectus and, if available, a summary prospectus, containing this information, call
1-800-222-8222 or visit the Fund's website at allspringglobal.com. Read the prospectus carefully before you invest or send money.
Allspring Global InvestmentsTM is the trade name for the asset management firms of Allspring Global Investments Holdings, LLC, a holding company indirectly owned by certain private funds of GTCR LLC and Reverence Capital Partners, L.P. These firms include but are not limited to Allspring Global Investments, LLC, and Allspring Funds Management, LLC. Certain products managed by Allspring entities are distributed by Allspring Funds Distributor, LLC (a broker-dealer and Member FINRA/SIPC).
This material is for general informational and educational purposes only and is NOT intended to provide investment advice or a recommendation of any kind - including a recommendation for any specific investment, strategy, or plan.
© 2022 Allspring Global Investments Holdings, LLC. All rights reserved.
PAR-0622-00230 07-22
A283/AR283 05-22
Annual Report
May 31, 2022
Allspring Emerging Growth Fund
The views expressed and any forward-looking statements are as of May 31, 2022, unless otherwise noted, and are those of the Fund's portfolio managers and/or Allspring Global Investments. Discussions of individual securities or the markets generally are not intended as individual recommendations. Future events or results may vary significantly from those expressed in any forward-looking statements. The views expressed are subject to change at any time in response to changing circumstances in the market. Allspring Global Investments disclaims any obligation to publicly update or revise any views expressed or forward-looking statements.
Allspring Emerging Growth Fund | 1
Letter to shareholders (unaudited)
Andrew Owen
President
Allspring Funds
Dear Shareholder:
We are pleased to offer you this annual report for the Allspring Emerging Growth Fund for the 12-month period that ended May 31, 2022. Globally, stocks experienced rising volatility through the period, but overall, U.S. stocks outperformed non-U.S. equities as the global economy faced multiple challenges. Bonds also had poor performance during a difficult period, with major fixed income indexes all down for the 12-month period.
Earlier tailwinds provided by global stimulus programs, vaccination rollouts, and recovering consumer and corporate sentiment were more than offset by the highest rate of inflation in decades, concerns about sharp central bank rate hikes, more highly contagious COVID-19 variants, and the Russian invasion of Ukraine. The impact of already-significant supply chain disruptions were made worse by China’s COVID-19 lockdowns.
For the 12-month period, U.S. large-cap stocks led both non-U.S. developed market equities and emerging market stocks. Returns by fixed-income securities were negative as rising inflation created new challenges. For the period, U.S. stocks, based on the S&P 500 Index,1 lost 0.30%. International stocks, as measured by the MSCI ACWI ex USA Index (Net),2 returned -12.41%, while the MSCI EM Index (Net) (USD)3 had weaker performance with a loss of 19.83%. Among bond indexes, the Bloomberg U.S. Aggregate Bond Index4 returned -8.22%, the Bloomberg Global Aggregate ex-USD Index (unhedged)5 returned -16.68%, the Bloomberg Municipal Bond Index6 lost 6.79%, and the ICE BofA U.S. High Yield Index7 fell 5.00%.
Rising inflation, COVID, and the Russian invasion of Ukraine in February drove market performance.
The period began with the S&P 500 Index reaching an all-time high in June 2021. In late June, the U.S. Congress reached a deal on a $1 trillion infrastructure package for road, bridge, and broadband network upgrades over the next eight years. The U.S. Federal Reserve’s (Fed) June meeting yielded no change to policy, but it forecast a possible interest rate rise in 2023. This, combined with a rebound in economic activity and investors searching for yield, led to a decline in U.S. Treasury yields. Many European and Asian countries saw vaccination momentum increase, while COVID-19 infections rose in the U.K. Meanwhile, the price of crude oil jumped over 10% in June as global economic activity picked up and the Organization of the Petroleum Exporting Countries (OPEC) slowed the pace of supply growth.
| 1 | The S&P 500 Index consists of 500 stocks chosen for market size, liquidity, and industry group representation. It is a market-value-weighted index with each stock's weight in the index proportionate to its market value. You cannot invest directly in an index. |
| 2 | The Morgan Stanley Capital International (MSCI) All Country World Index (ACWI) ex USA Index (Net) is a free-float-adjusted market-capitalization-weighted index that is designed to measure the equity market performance of developed and emerging markets, excluding the U.S. Source: MSCI. MSCI makes no express or implied warranties or representations and shall have no liability whatsoever with respect to any MSCI data contained herein. The MSCI data may not be further redistributed or used as a basis for other indexes or any securities or financial products. This report is not approved, reviewed, or produced by MSCI. You cannot invest directly in an index. |
| 3 | The MSCI Emerging Markets (EM) Index (Net) (USD) is a free-float-adjusted market-capitalization-weighted index that is designed to measure equity market performance of emerging markets. You cannot invest directly in an index. |
| 4 | The Bloomberg U.S. Aggregate Bond Index is a broad-based benchmark that measures the investment-grade, U.S.-dollar-denominated, fixed-rate taxable bond market, including Treasuries, government-related and corporate securities, mortgage-backed securities (agency fixed-rate and hybrid adjustable-rate mortgage pass-throughs), asset-backed securities, and commercial mortgage-backed securities. You cannot invest directly in an index. |
| 5 | The Bloomberg Global Aggregate ex-USD Index (unhedged) is an unmanaged index that provides a broad-based measure of the global investment-grade fixed-income markets excluding the U.S.-dollar-denominated debt market. You cannot invest directly in an index. |
| 6 | The Bloomberg Municipal Bond Index is an unmanaged index composed of long-term tax-exempt bonds with a minimum credit rating of Baa. You cannot invest directly in an index. |
| 7 | The ICE BofA U.S. High Yield Index is a market-capitalization-weighted index of domestic and Yankee high-yield bonds. The index tracks the performance of high-yield securities traded in the U.S. bond market. You cannot invest directly in an index. Copyright 2022. ICE Data Indices, LLC. All rights reserved. |
2 | Allspring Emerging Growth Fund
Letter to shareholders (unaudited)
Inflation continued to climb in July, fueled by the ongoing supply bottleneck and high demand. Monthly U.S. equity gains led those of international developed markets. In contrast, emerging markets had losses for the month, hindered by China’s plans for new regulations, particularly in education and technology. The U.S. 10-year Treasury bond yield continued to decline as strong demand swallowed up supply. After hitting a multiyear high earlier in the month, oil prices leveled off as OPEC agreed to raise oil production.
The COVID-19 Delta variant produced outbreaks globally in August, feeding market volatility and casting doubts over the ongoing economic recovery. The U.S. economy remained strong despite the Delta variant, ongoing inflationary pressures, and worries over Hurricane Ida. Emerging market equities experienced elevated volatility, largely influenced by China’s regulatory stance. Municipal debt had its first monthly loss since February. Among commodities, crude oil fell sharply as the Delta variant caused expectations to dampen. However, oil remained a leading asset-class performer for the year.
Global markets suffered their broadest retreat in a year during September, except for commodities, as concerns over inflation and the interest rate outlook depressed investor confidence. Emerging markets declined on concerns over supply chain disruptions along with rising energy and food prices. Meanwhile, the Fed indicated it would soon start to slow the pace of asset purchases. U.S. concerns included a congressional showdown over the debt ceiling, the 2022 federal government budget, and the infrastructure package. Meanwhile, commodities thrived in September, driven by sharply higher energy prices.
Elevated inflation pressures and the global supply bottleneck continued in October, but strong earnings provided a bright spot in the U.S., the eurozone, and many Asian countries. Government bond yields rose globally as central banks prepared to tighten monetary policy. Commodity prices continued to rise, driven by sharply higher energy costs.
In November, as COVID-19 hospitalizations rose, most major global asset classes declined. Two exceptions were U.S. investment-grade bonds and Treasury Inflation-Protected Securities. President Biden signed a long-awaited infrastructure bill to upgrade U.S. roads, bridges, and railways. Meanwhile, the Consumer Price Index (CPI)1, a measure of domestic inflation conditions, jumped to its highest level in 31 years. While the threat of consistently high inflation led the Fed to discuss a faster pace of tapering, the Omicron strain created uncertainty. Commodities lost ground for the month, driven by sharp declines in oil prices (and energy costs in general) as well as precious metals.
Global volatility lessened in December as data indicated a lower risk of severe disease and death from the Omicron variant. Even so, several countries introduced restrictions on travel and hospitality, among other sectors, in an effort to reduce the spread. In the U.S., data indicated a stable economy overall, with robust corporate earnings. Consumer spending potential looked strong heading into 2022 on elevated household savings and the lowest household debt ratio since 1973. U.S. corporate and high-yield bonds had monthly gains while Treasuries declined. Bonds were strongly affected by the projection of multiple rate hikes in 2022 by senior Federal Open Market Committee members.
In January 2022, the main focus was on potential U.S. interest rate hikes and the Russia-Ukraine conflict. The Fed hinted that a March interest rate hike was likely. Meanwhile, Russia threatened a potential invasion of Ukraine, which could disrupt Russia’s massive energy supplies and drive demand from non-Russian oil-producing countries. Elsewhere overseas, Europe saw food and energy prices spike, leading to rising inflation. Within fixed income, corporate bonds struggled in January, underperforming government bonds, as investors focused on continued elevated inflation and ongoing uncertainty over the U.S. monetary path.
“ Global markets suffered their broadest retreat in a year during September, except for commodities, as concerns over inflation and the interest rate outlook depressed investor confidence.”
| 1 | The Consumer Price Index (CPI) is a measure of the average change over time in the prices paid by urban consumers for a market basket of consumer goods and services. You cannot invest directly in an index. |
Allspring Emerging Growth Fund | 3
Letter to shareholders (unaudited)
“ The Russian invasion of Ukraine dominated the financial world in February and March. Equity, bond, and commodity markets were shaken by fear, uncertainty, and an upending of demand-supply dynamics.” |
The Russian invasion of Ukraine dominated the financial world in February and March. Equity, bond, and commodity markets were shaken by fear, uncertainty, and an upending of demand-supply dynamics. Major global stock indexes were down in February, along with global bonds overall, with ongoing high levels of volatility in March along with mixed results that favored U.S. large-cap stocks. Prices of commodities spiked, including crude oil, natural gas, wheat, and precious metals, on elevated concerns of supply shortages. All of this fed already-high inflation concerns and added to expectations of more aggressive central bank interest rate hikes. Sweeping sanctions against Russia and corporate pullouts contributed to market volatility. Despite the geopolitical turmoil, the U.S. economic outlook remained largely unchanged, with a healthy job market and signs of economic resilience accompanying higher prices.
In April, market volatility continued, with deepening losses across major capital markets, as both the S&P 500 and MSCI ACWI (Net)1 fell 8% or more for the month. The Chinese economy struggled through a strict lockdown as the government tried to contain a major COVID-19 outbreak, creating a global ripple effect that compounded existing supply shortages. This was exacerbated by the impact of the Russia-Ukraine war on global commodities. Meanwhile, U.S. annual inflation raged at 8.5%, its highest level since 1981, and investors braced themselves for aggressive Fed monetary tightening moves.
Market volatility continued in May, but full-month returns belied that as markets recovered ground late in the month. Value stocks continued to outperform growth stocks. The concerns that had dominated markets for months continued, including high inflation (the CPI remained above 8%) and geopolitical tensions that exacerbated high crude oil, gasoline, and food prices. In response, the Fed raised the federal funds rate by 0.50%, with broad expectations of multiple rate hikes to come. Meanwhile, highly contagious COVID-19 variants persisted. However, labor markets in the U.S., the U.K., and Europe remained strong. The U.S. recorded a 3.6% unemployment rate, although labor market participation remained low. U.S. retail sales increased for the fourth consecutive month in April, indicating continued consumer resilience.
Don’t let short-term uncertainty derail long-term investment goals.
Periods of investment uncertainty can present challenges, but experience has taught us that maintaining long-term investment goals can be an effective way to plan for the future. To help you create a sound strategy based on your personal goals and risk tolerance, Allspring Funds offers more than 100 mutual funds spanning a wide range of asset classes and investment styles. Although diversification cannot guarantee an investment profit or prevent losses, we believe it can be an effective way to manage investment risk and potentially smooth out overall portfolio performance. We encourage investors to know their investments and to understand that appropriate levels of risk-taking may unlock opportunities.
Thank you for choosing to invest with Allspring Funds. We appreciate your confidence in us and remain committed to helping you meet your financial needs.
Sincerely,
Andrew Owen
President
Allspring Funds
For further information about your fund, contact your investment professional, visit our website at allspringglobal.com, or call us directly at 1-800-222-8222.
| 1 | The MSCI ACWI (Net) is a free-float-adjusted market-capitalization-weighted index that is designed to measure the equity market performance of developed and emerging markets. You cannot invest directly in an index. |
4 | Allspring Emerging Growth Fund
Letter to shareholders (unaudited)
Notice to Shareholders
Russia launched a large-scale invasion of Ukraine on February 24, 2022. As a result of this military action, the United States and many other countries have instituted various economic sanctions against Russian and Belarus individuals and entities. The situation has led to increased financial market volatility and has had severe adverse effects on regional and global economic markets, including the markets for certain securities and commodities, such as oil and natural gas. The extent and duration of the military action, resulting sanctions imposed, other punitive action taken and the resulting market disruptions cannot be easily predicted.
Our solidarity and support goes out to our impacted employees and the people affected in Ukraine and their families. Allspring has a dedicated team of investment professionals actively monitoring the situation for any new developments and the potential impact to our clients and investment products. As the situation remains fluid, we are focused on the assessment of risks, valuation, and liquidity of impacted securities. Please visit our website at allspringglobal.com and click on “Russia-Ukraine Updates” for further information.
Allspring Emerging Growth Fund | 5
Performance highlights (unaudited)
Investment objectiveThe Fund seeks long-term capital appreciation.
| Manager | Allspring Funds Management, LLC |
Subadviser for the affiliated master portfolio*
Allspring Global Investments, LLC
| Portfolio managers | Robert Gruendyke, CFA®‡, David Nazaret, CFA®‡, Thomas C. Ognar, CFA®‡ |
| Average annual total returns (%) as of May 31, 2022 |
| | | Including sales charge | | Excluding sales charge | | Expense ratios1 (%) |
| | Inception date | 1 year | 5 year | 10 year | | 1 year | 5 year | 10 year | | Gross | Net 2 |
| Class A (WEMAX) | 3-31-2008 | -33.23 | 9.16 | 10.35 | | -29.16 | 10.46 | 11.00 | | 1.35 | 1.28 |
| Class C (WEMCX) | 3-31-2008 | -30.71 | 9.65 | 10.34 | | -29.71 | 9.65 | 10.34 | | 2.10 | 2.03 |
| Class R6 (WEGRX)3 | 7-31-2018 | – | – | – | | -28.91 | 10.96 | 11.51 | | 0.92 | 0.85 |
| Administrator Class (WFGDX) | 1-31-2007 | – | – | – | | -29.09 | 10.56 | 11.14 | | 1.27 | 1.20 |
| Institutional Class (WEMIX) | 3-31-2008 | – | – | – | | -28.95 | 10.87 | 11.47 | | 1.02 | 0.90 |
| Russell 2000® Growth Index4 | – | – | – | – | | -25.71 | 6.87 | 10.55 | | – | – |
Figures quoted represent past performance, which is no guarantee of future results, and do not reflect taxes that a shareholder may pay on an investment in a fund. Investment return and principal value of an investment will fluctuate so that an investor’s shares, when redeemed, may be worth more or less than their original cost. Performance shown without sales charges would be lower if sales charges were reflected. Current performance may be lower or higher than the performance data quoted, which assumes the reinvestment of dividends and capital gains. Current month-end performance is available on the Fund’s website, allspringglobal.com.
Index returns do not include transaction costs associated with buying and selling securities, any mutual fund fees or expenses, or any taxes. It is not possible to invest directly in an index.
For Class A shares, the maximum front-end sales charge is 5.75%. For Class C shares, the maximum contingent deferred sales charge is 1.00%. Performance including a contingent deferred sales charge assumes the sales charge for the corresponding time period. Class R6, Administrator Class and Institutional Class shares are sold without a front-end sales charge or contingent deferred sales charge.
| 1 | Reflects the expense ratios as stated in the most recent prospectuses. The expense ratios shown are subject to change and may differ from the annualized expense ratios shown in the financial highlights of this report. |
| 2 | The manager has contractually committed through September 30, 2022, to waive fees and/or reimburse expenses to the extent necessary to cap total annual fund operating expenses after fee waivers at 1.28% for Class A, 2.03% for Class C, 0.85% for Class R6, 1.20% for Administrator Class, and 0.90% for Institutional Class. Brokerage commissions, stamp duty fees, interest, taxes, acquired fund fees and expenses (if any) from funds in which the affiliated master portfolio invests, and extraordinary expenses are excluded from the expense caps. Net expenses from the affiliated master portfolio are included in the expense caps. Prior to or after the commitment expiration date, the caps may be increased or the commitment to maintain the caps may be terminated only with the approval of the Board of Trustees. Without these caps, the Fund’s returns would have been lower. The expense ratio paid by an investor is the net expense ratio (the total annual fund operating expenses after fee waivers) as stated in the prospectuses. |
| 3 | Historical performance shown for the Class R6 shares prior to their inception reflects the performance of the Institutional Class shares, and includes the higher expenses applicable to the Institutional Class shares. If these expenses had not been included, returns for the Class R6 shares would be higher. |
| 4 | The Russell 2000® Growth Index measures the performance of those Russell 2000 companies with higher price/book ratios and higher forecasted growth values. You cannot invest directly in an index. |
Stock values fluctuate in response to the activities of individual companies and general market and economic conditions. Smaller-company stocks tend to be more volatile and less liquid than those of larger companies. Certain investment strategies tend to increase the total risk of an investment (relative to the broader market). This fund is exposed to foreign investment risk. Consult the Fund’s prospectus for additional information on these and other risks.
| * | The Fund is a feeder fund in a master-feeder structure that invests substantially all of its assets in a single affiliated master portfolio of the Allspring Master Trust with a substantially identical investment objective and substantially similar investment strategies. References to the investment activities of the Fund are intended to refer to the investment activities of the affiliated master portfolio in which it invests. |
| ‡ | CFA® and Chartered Financial Analyst® are trademarks owned by CFA Institute. |
6 | Allspring Emerging Growth Fund
Performance highlights (unaudited)
Growth of $10,000 investment as of May 31, 20221
| 1 | The chart compares the performance of Class A shares for the most recent ten years with the Russell 2000® Growth Index. The chart assumes a hypothetical investment of $10,000 in Class A shares and reflects all operating expenses and assumes the maximum initial sales charge of 5.75%. |
Allspring Emerging Growth Fund | 7
Performance highlights (unaudited)
MANAGER'S DISCUSSION
Fund highlights
| ■ | The Fund underperformed the Russell 2000® Growth Index for the 12-month period that ended May 31, 2022. |
| ■ | Detractors from the Fund’s performance mainly stemmed from stocks within the information technology (IT) sector and select stocks within communication services and health care. |
| ■ | Relative performance contributions came from select specialty insurance stocks within financials and select medical device stocks. |
Stimulus measures helped support a strong economic recovery.
Over the past year, investors have toiled with myriad headwinds that included high inflation, rising interest rates, the uncertainty around U.S. Federal Reserve (Fed) policy, and Russia’s invasion of Ukraine. The confluence of these issues has permeated the entire market, with growth stocks bearing the brunt of the damage. The 10-year U.S. Treasury yield has risen from 1.61% at the start of the period to just under 3% at period-end. Higher interest rates are designed to slow down economic growth, and an environment of moderate growth actually favors growth stocks as growth premiums have tended to rise, hastening a scarcity of growth factor. This is the main reason that our portfolios have historically performed well during the rising rate cycles.
| Ten largest holdings (%) as of May 31, 20221 |
| Kinsale Capital Group Incorporated | 3.58 |
| ASGN Incorporated | 3.43 |
| SPS Commerce Incorporated | 3.20 |
| Rapid7 Incorporated | 2.87 |
| Shockwave Medical Incorporated | 2.76 |
| Zurn Water Solutions Corporation | 2.63 |
| Novanta Incorporated | 2.52 |
| Casella Waste Systems Incorporated Class A | 2.45 |
| Papa John's International Incorporated | 2.22 |
| Stifel Financial Corporation | 2.18 |
| 1 | Each holding represents the Fund’s allocable portion of the affiliated master portfolio security. Figures represent each holding as a percentage of the Fund’s net assets. Holdings are subject to change and may have changed since the date specified. |
Russia’s attack on Ukraine has added geopolitical risks to an already top-down-driven market, which has muted the impact of the strong earnings fundamentals of our companies. This has been frustrating as many of our stocks continue to exceed expectations, yet they have not been rewarded. Nevertheless, given the contraction of valuations in the small-cap growth space coupled with our companies’ dynamic innovation, we believe there is a strong opportunity going forward.
IT and select stocks within the communication services and health care sectors impeded relative performance.
Weakness in the Fund performance came mainly from select stocks within the IT and industrials sectors. Within IT, software stocks, which serve as a proxy for higher growth technology, were decimated, with some holdings falling sharply despite delivering strong fundamentals. Within communication services, Bandwidth Inc. a communications platform-as-a service provider, fell sharply after the company reported a sequential deceleration of revenue growth, with slower-than-expected execution from its acquisition of Voxbone S.A., which we believed would produce a material cross-sell opportunity into the international segments of Bandwidth’s domestic customers. With the deal taking longer to materialize, we sold our position. Within health care, FIGS, Inc., which makes scrubs for the health care industry, fell sharply after missing revenue targets, citing transportation problems and uncertainty around the macro environment. However, we remain attracted to its digitally native and direct-to-consumer strategy, which could disrupt the health care apparel industry.
Financials and health care contributed to the Fund.
Within financials, specialty insurance holding Kinsale Capital Group, Inc., was rewarded for its durable business model and strong fundamentals. Kinsale is the only publicly traded pure-play excess and surplus insurer. Its strong growth has been primarily driven by higher submission activity from brokers as well as a rise in premiums. Going forward, we remain attracted to its favorable cost structure over its peers, which is largely due to its technology innovation and lower commission payouts to brokers. Within health care, select medical device holdings, such as Shockwave Medical, Inc., rose sharply, driven by strong traction from its launch of Shockwave C2, which helped the firm post robust revenue growth and issue favorable fiscal-year guidance. Additionally, Inspire Medical Systems, Inc., which provides minimally invasive solutions for patients with obstructive sleep apnea, outperformed after showing strong activation in new medical centers for its therapy. Broadly within the medical
8 | Allspring Emerging Growth Fund
Performance highlights (unaudited)
device industry, we have seen positive indications for volume trends and less pessimism around staffing issues in recent months.
| Sector allocation as of May 31, 20221 |
| 1 | Figures represent the sector allocation of the affiliated master portfolio as a percentage of the long-term investments of the affiliated master portfolio. These amounts are subject to change and may have changed since the date specified. |
The setup for small-cap growth stocks is attractive.
We are constantly trimming and adding to the Fund through an opportunity cost lens. As the market has become more focused on companies with sustainable cash flow generation, at the margin, we have added to holdings like Hilton Grand Vacations, Inc., and Papa John’s International, Inc. Conversely, we have trimmed or sold longer-duration and less-cash-flow-generative stocks, including diagnostics companies CareDx, Inc., and NeoGenomics Inc. and online provider of aftermarket auto parts, Carparts.com Inc.
As growth investors, inflation affects our Fund in three main areas: discount rates, its effect on a company’s profit and loss, and the response of the Fed and its changing policy decisions. While inflation has been negative for the Fund, we believe it can be a further catalyst for the digitalization of the economy as companies seek to automate and become more efficient in order to drive down costs.
The outlook for small-cap growth stocks is very attractive in our opinion. As sentiment improves for growth stocks and the macro-dominated narrative around inflation and interest rates abates, we expect performance to broaden out and we hope to reap the benefits of our diversified approach. Historically, this type of market has provided great entry points to own world-class growth businesses. This is one reason why our Fund has tended to come out of underperforming periods and do well in the ensuing years.
Allspring Emerging Growth Fund | 9
Fund expenses (unaudited)
As a shareholder of the Fund, you incur two types of costs: (1) transaction costs, including sales charges (loads) on purchase payments and contingent deferred sales charges (if any) on redemptions and (2) ongoing costs, including management fees, distribution (12b-1) and/or shareholder servicing fees, and other Fund expenses. This example is intended to help you understand your ongoing costs (in dollars) of investing in the Fund and to compare these costs with the ongoing costs of investing in other mutual funds.
The example is based on an investment of $1,000 invested at the beginning of the six-month period and held for the entire period from December 1, 2021 to May 31, 2022.
Actual expenses
The “Actual” line of the table below provides information about actual account values and actual expenses. You may use the information in this line, together with the amount you invested, to estimate the expenses that you paid over the period. Simply divide your account value by $1,000 (for example, an $8,600 account value divided by $1,000 = 8.6), then multiply the result by the number in the “Actual” line under the heading entitled “Expenses paid during period” for your applicable class of shares to estimate the expenses you paid on your account during this period.
Hypothetical example for comparison purposes
The “Hypothetical” line of the table below provides information about hypothetical account values and hypothetical expenses based on the Fund’s actual expense ratio and an assumed rate of return of 5% per year before expenses, which is not the Fund’s actual return. The hypothetical account values and expenses may not be used to estimate the actual ending account balance or expenses you paid for the period. You may use this information to compare the ongoing costs of investing in the Fund and other funds. To do so, compare this 5% hypothetical example with the 5% hypothetical examples that appear in the shareholder reports of the other funds.
Please note that the expenses shown in the table are meant to highlight your ongoing costs only and do not reflect any transactional costs, such as sales charges (loads) and contingent deferred sales charges. Therefore, the “Hypothetical” line of the table is useful in comparing ongoing costs only, and will not help you determine the relative total costs of owning different funds. In addition, if these transactional costs were included, your costs would have been higher.
| | Beginning
account value
12-1-2021 | Ending
account value
5-31-2022 | Expenses
paid during
the period1,2 | Annualized net
expense ratio2 |
| Class A | | | | |
| Actual | $1,000.00 | $ 667.05 | $ 5.24 | 1.26% |
| Hypothetical (5% return before expenses) | $1,000.00 | $1,018.65 | $ 6.34 | 1.26% |
| Class C | | | | |
| Actual | $1,000.00 | $ 664.17 | $ 8.42 | 2.03% |
| Hypothetical (5% return before expenses) | $1,000.00 | $1,014.81 | $10.20 | 2.03% |
| Class R6 | | | | |
| Actual | $1,000.00 | $ 668.16 | $ 3.54 | 0.85% |
| Hypothetical (5% return before expenses) | $1,000.00 | $1,020.69 | $ 4.28 | 0.85% |
| Administrator Class | | | | |
| Actual | $1,000.00 | $ 667.22 | $ 4.99 | 1.20% |
| Hypothetical (5% return before expenses) | $1,000.00 | $1,018.95 | $ 6.04 | 1.20% |
| Institutional Class | | | | |
| Actual | $1,000.00 | $ 667.60 | $ 3.74 | 0.90% |
| Hypothetical (5% return before expenses) | $1,000.00 | $1,020.44 | $ 4.53 | 0.90% |
1 Expenses paid is equal to the annualized net expense ratio of each class multiplied by the average account value over the period, multiplied by 182 divided by 366 (to reflect the one-half-year period).
2 Amounts reflect net expenses allocated from the affiliated Master Portfolio in which the Fund invests.
10 | Allspring Emerging Growth Fund
Portfolio of investments—May 31, 2022
| | | | | | Value |
| Investment companies: 99.99% | | | | | |
| Affiliated master portfolio: 99.99% | | | | | |
| Allspring Emerging Growth Portfolio | | | | | $ 335,169,233 |
| Total Investment companies (Cost $267,783,215) | | | | | 335,169,233 |
| Total investments in securities (Cost $267,783,215) | 99.99% | | | | 335,169,233 |
| Other assets and liabilities, net | 0.01 | | | | 25,574 |
| Total net assets | 100.00% | | | | $335,194,807 |
Transactions with the affiliated Master Portfolio were as follows:
| | % of
ownership,
beginning
of period | % of
ownership,
end of
period | Net realized
gains
(losses) on
securities
transactions
allocated
from
affiliated
Master
Portfolio | Net
change in
unrealized
gains
(losses) on
securities
transactions
allocated
from
affiliated
Master
Portfolio | Dividends
allocated
from
affiliated
Master
Portfolio | Securities
lending
income
allocated
from
affiliated
Master
Portfolio | Affiliated
income
allocated
from
affiliated
Master
Portfolio | Value,
end of
period | |
| Allspring Emerging Growth Portfolio | 95.20% | 90.11% | $232,050,592 | $(327,135,019) | $595,068 | $283,904 | $8,173 | $335,169,233 | |
The accompanying notes are an integral part of these financial statements.
Allspring Emerging Growth Fund | 11
Statement of assets and liabilities—May 31, 2022
| | |
| Assets | |
Investments in affiliated Master Portfolio, at value (cost $267,783,215)
| $ 335,169,233 |
Receivable for Fund shares sold
| 433,005 |
Receivable from manager
| 25,882 |
Prepaid expenses and other assets
| 68,916 |
Total assets
| 335,697,036 |
| Liabilities | |
Payable for Fund shares redeemed
| 351,880 |
Administration fees payable
| 44,115 |
Shareholder report expenses payable
| 40,835 |
Shareholder servicing fees payable
| 32,602 |
Trustees’ fees and expenses payable
| 3,171 |
Distribution fee payable
| 1,088 |
Accrued expenses and other liabilities
| 28,538 |
Total liabilities
| 502,229 |
Total net assets
| $335,194,807 |
| Net assets consist of | |
Paid-in capital
| $ 278,633,764 |
Total distributable earnings
| 56,561,043 |
Total net assets
| $335,194,807 |
| Computation of net asset value and offering price per share | |
Net assets – Class A
| $ 134,825,188 |
Shares outstanding – Class A1
| 15,135,656 |
Net asset value per share – Class A
| $8.91 |
Maximum offering price per share – Class A2
| $9.45 |
Net assets – Class C
| $ 1,758,376 |
Shares outstanding – Class C1
| 280,847 |
Net asset value per share – Class C
| $6.26 |
Net assets – Class R6
| $ 23,999,133 |
Shares outstanding – Class R61
| 2,223,522 |
Net asset value per share – Class R6
| $10.79 |
Net assets – Administrator Class
| $ 17,676,037 |
Shares outstanding – Administrator Class1
| 1,844,485 |
Net asset value per share – Administrator Class
| $9.58 |
Net assets – Institutional Class
| $ 156,936,073 |
Shares outstanding – Institutional Class1
| 14,633,045 |
Net asset value per share – Institutional Class
| $10.72 |
| 1 | The Fund has an unlimited number of authorized shares. |
| 2 | Maximum offering price is computed as 100/94.25 of net asset value. On investments of $50,000 or more, the offering price is reduced. |
The accompanying notes are an integral part of these financial statements.
12 | Allspring Emerging Growth Fund
Statement of operations—year ended May 31, 2022
| | |
| Investment income | |
Dividends allocated from affiliated Master Portfolio
| $ 595,068 |
Securities lending income allocated from affiliated Master Portfolio
| 283,904 |
Affiliated income allocated from affiliated Master Portfolio
| 8,173 |
Expenses allocated from affiliated Master Portfolio
| (4,742,754) |
Waivers allocated from affiliated Master Portfolio
| 1,690 |
Total investment income
| (3,853,919) |
| Expenses | |
Management fee
| 289,172 |
| Administration fees | |
Class A
| 418,893 |
Class C
| 4,883 |
Class R6
| 7,588 |
Administrator Class
| 34,771 |
Institutional Class
| 421,858 |
| Shareholder servicing fees | |
Class A
| 498,682 |
Class C
| 5,746 |
Administrator Class
| 66,496 |
| Distribution fee | |
Class C
| 17,236 |
Custody and accounting fees
| 16,812 |
Professional fees
| 38,377 |
Registration fees
| 57,614 |
Shareholder report expenses
| 22,326 |
Trustees’ fees and expenses
| 20,688 |
Other fees and expenses
| 8,011 |
Total expenses
| 1,929,153 |
| Less: Fee waivers and/or expense reimbursements | |
Fund-level
| (483,465) |
Class A
| (30,022) |
Class R6
| (2,529) |
Institutional Class
| (129,803) |
Net expenses
| 1,283,334 |
Net investment loss
| (5,137,253) |
| Realized and unrealized gains (losses) on investments | |
Net realized gains on securities transactions allocated from affiliated Master Portfolio
| 232,050,592 |
Net change in unrealized gains (losses) on securities transactions allocated from affiliated Master Portfolio
| (327,135,019) |
Net realized and unrealized gains (losses) on investments
| (95,084,427) |
Net decrease in net assets resulting from operations
| $(100,221,680) |
The accompanying notes are an integral part of these financial statements.
Allspring Emerging Growth Fund | 13
Statement of changes in net assets
| | | | | |
| | Year ended
May 31, 2022 | Year ended
May 31, 2021 |
| Operations | | | | |
Net investment loss
| | $ (5,137,253) | | $ (6,987,906) |
Net realized gains on investments
| | 232,050,592 | | 164,596,232 |
Net change in unrealized gains (losses) on investments
| | (327,135,019) | | 172,105,999 |
Net increase (decrease) in net assets resulting from operations
| | (100,221,680) | | 329,714,325 |
| Distributions to shareholders from | | | | |
| Net investment income and net realized gains | | | | |
Class A
| | (62,681,311) | | (40,824,693) |
Class C
| | (1,233,291) | | (488,552) |
Class R6
| | (5,898,804) | | (4,264,478) |
Administrator Class
| | (7,999,256) | | (5,278,969) |
Institutional Class
| | (61,664,834) | | (104,301,425) |
Total distributions to shareholders
| | (139,477,496) | | (155,158,117) |
| Capital share transactions | Shares | | Shares | |
| Proceeds from shares sold | | | | |
Class A
| 422,522 | 6,066,711 | 594,602 | 10,958,344 |
Class C
| 97,992 | 1,394,743 | 67,936 | 1,035,606 |
Class R6
| 1,375,088 | 22,705,246 | 203,245 | 4,206,281 |
Administrator Class
| 159,434 | 2,285,979 | 354,817 | 6,842,617 |
Institutional Class
| 5,047,859 | 87,194,049 | 8,415,847 | 166,124,291 |
| | | 119,646,728 | | 189,167,139 |
| Reinvestment of distributions | | | | |
Class A
| 4,788,131 | 60,617,734 | 2,332,324 | 38,903,166 |
Class C
| 138,107 | 1,233,291 | 36,568 | 488,552 |
Class R6
| 125,710 | 1,924,617 | 68,148 | 1,296,851 |
Administrator Class
| 585,228 | 7,964,955 | 299,668 | 5,253,185 |
Institutional Class
| 4,040,376 | 61,494,520 | 5,494,647 | 104,178,513 |
| | | 133,235,117 | | 150,120,267 |
| Payment for shares redeemed | | | | |
Class A
| (1,754,937) | (23,706,994) | (1,365,780) | (24,392,486) |
Class C
| (117,521) | (1,197,540) | (71,196) | (1,109,781) |
Class R6
| (330,224) | (6,538,508) | (409,558) | (8,565,269) |
Administrator Class
| (413,854) | (5,802,034) | (528,979) | (9,983,853) |
Institutional Class
| (26,013,236) | (552,947,062) | (11,301,966) | (220,272,610) |
| | | (590,192,138) | | (264,323,999) |
Net increase (decrease) in net assets resulting from capital share transactions
| | (337,310,293) | | 74,963,407 |
Total increase (decrease) in net assets
| | (577,009,469) | | 249,519,615 |
| Net assets | | | | |
Beginning of period
| | 912,204,276 | | 662,684,661 |
End of period
| | $ 335,194,807 | | $ 912,204,276 |
The accompanying notes are an integral part of these financial statements.
14 | Allspring Emerging Growth Fund
Financial highlights
(For a share outstanding throughout each period)
| | Year ended May 31 |
| Class A | 2022 | 2021 | 2020 | 2019 | 2018 |
Net asset value, beginning of period
| $18.05 | $14.71 | $13.51 | $17.04 | $14.57 |
Net investment loss
| (0.16) 1 | (0.20) 1 | (0.17) | (0.16) 1 | (0.15) |
Net realized and unrealized gains (losses) on investments
| (3.47) | 7.69 | 2.13 | (0.19) | 4.57 |
Total from investment operations
| (3.63) | 7.49 | 1.96 | (0.35) | 4.42 |
| Distributions to shareholders from | | | | | |
Net realized gains
| (5.51) | (4.15) | (0.76) | (3.18) | (1.95) |
Net asset value, end of period
| $8.91 | $18.05 | $14.71 | $13.51 | $17.04 |
Total return2
| (29.16)% | 53.22% | 14.97% | (0.84)% | 32.91% |
| Ratios to average net assets (annualized)* | | | | | |
Gross expenses
| 1.36% | 1.35% | 1.36% | 1.35% | 1.36% |
Net expenses
| 1.26% | 1.27% | 1.27% | 1.29% | 1.35% |
Net investment loss
| (1.10)% | (1.12)% | (1.08)% | (1.06)% | (1.01)% |
| Supplemental data | | | | | |
Portfolio turnover rate3
| 51% | 48% | 55% | 71% | 47% |
Net assets, end of period (000s omitted)
| $134,825 | $210,838 | $148,866 | $145,898 | $153,526 |
| * | Ratios include net expenses allocated from the affiliated Master Portfolio which were as follows: |
| Year ended May 31, 2022 | 0.82% |
| Year ended May 31, 2021 | 0.81% |
| Year ended May 31, 2020 | 0.81% |
| Year ended May 31, 2019 | 0.81% |
| Year ended May 31, 2018 | 0.81% |
| 1 | Calculated based upon average shares outstanding |
| 2 | Total return calculations do not include any sales charges. |
| 3 | Portfolio turnover rate is calculated by multiplying the affiliated Master Portfolio’s percentage of the Fund’s total investment in securities at the end of the period by the affiliated Master Portfolio’s portfolio turnover rate. |
The accompanying notes are an integral part of these financial statements.
Allspring Emerging Growth Fund | 15
Financial highlights
(For a share outstanding throughout each period)
| | Year ended May 31 |
| Class C | 2022 | 2021 | 2020 | 2019 | 2018 |
Net asset value, beginning of period
| $14.41 | $12.40 | $11.58 | $15.19 | $13.28 |
Net investment loss
| (0.20) 1 | (0.28) 1 | (0.21) 1 | (0.25) 1 | (0.25) 1 |
Net realized and unrealized gains (losses) on investments
| (2.44) | 6.44 | 1.79 | (0.18) | 4.11 |
Total from investment operations
| (2.64) | 6.16 | 1.58 | (0.43) | 3.86 |
| Distributions to shareholders from | | | | | |
Net realized gains
| (5.51) | (4.15) | (0.76) | (3.18) | (1.95) |
Net asset value, end of period
| $6.26 | $14.41 | $12.40 | $11.58 | $15.19 |
Total return2
| (29.71)% | 52.19% | 14.16% | (1.55)% | 31.82% |
| Ratios to average net assets (annualized)* | | | | | |
Gross expenses
| 2.10% | 2.10% | 2.11% | 2.10% | 2.11% |
Net expenses
| 2.03% | 2.03% | 2.03% | 2.04% | 2.10% |
Net investment loss
| (1.86)% | (1.89)% | (1.84)% | (1.78)% | (1.76)% |
| Supplemental data | | | | | |
Portfolio turnover rate3
| 51% | 48% | 55% | 71% | 47% |
Net assets, end of period (000s omitted)
| $1,758 | $2,338 | $1,599 | $1,761 | $4,190 |
| * | Ratios include net expenses allocated from the affiliated Master Portfolio which were as follows: |
| Year ended May 31, 2022 | 0.82% |
| Year ended May 31, 2021 | 0.81% |
| Year ended May 31, 2020 | 0.81% |
| Year ended May 31, 2019 | 0.81% |
| Year ended May 31, 2018 | 0.81% |
| 1 | Calculated based upon average shares outstanding |
| 2 | Total return calculations do not include any sales charges. |
| 3 | Portfolio turnover rate is calculated by multiplying the affiliated Master Portfolio’s percentage of the Fund’s total investment in securities at the end of the period by the affiliated Master Portfolio’s portfolio turnover rate. |
The accompanying notes are an integral part of these financial statements.
16 | Allspring Emerging Growth Fund
Financial highlights
(For a share outstanding throughout each period)
| | Year ended May 31 |
| Class R6 | 2022 | 2021 | 2020 | 2019 1 |
Net asset value, beginning of period
| $20.64 | $16.34 | $14.86 | $18.70 |
Net investment loss
| (0.10) | (0.14) | (0.10) 2 | (0.07) 2 |
Net realized and unrealized gains (losses) on investments
| (4.24) | 8.59 | 2.34 | (0.59) |
Total from investment operations
| (4.34) | 8.45 | 2.24 | (0.66) |
| Distributions to shareholders from | | | | |
Net realized gains
| (5.51) | (4.15) | (0.76) | (3.18) |
Net asset value, end of period
| $10.79 | $20.64 | $16.34 | $14.86 |
Total return3
| (28.91)% | 53.85% | 15.51% | (2.35)% |
| Ratios to average net assets (annualized)* | | | | |
Gross expenses
| 0.94% | 0.92% | 0.93% | 0.92% |
Net expenses
| 0.85% | 0.85% | 0.85% | 0.85% |
Net investment loss
| (0.68)% | (0.68)% | (0.67)% | (0.51)% |
| Supplemental data | | | | |
Portfolio turnover rate4
| 51% | 48% | 55% | 71% |
Net assets, end of period (000s omitted)
| $23,999 | $21,729 | $19,458 | $22 |
| * | Ratios include net expenses allocated from the affiliated Master Portfolio which were as follows: |
| Year ended May 31, 2022 | 0.83% |
| Year ended May 31, 2021 | 0.81% |
| Year ended May 31, 2020 | 0.81% |
| Year ended May 31, 20191 | 0.81% |
| 1 | For the period from July 31, 2018 (commencement of class operations) to May 31, 2019 |
| 2 | Calculated based upon average shares outstanding |
| 3 | Returns for periods of less than one year are not annualized. |
| 4 | Portfolio turnover rate is calculated by multiplying the affiliated Master Portfolio’s percentage of the Fund’s total investment in securities at the end of the period by the affiliated Master Portfolio’s portfolio turnover rate. |
The accompanying notes are an integral part of these financial statements.
Allspring Emerging Growth Fund | 17
Financial highlights
(For a share outstanding throughout each period)
| | Year ended May 31 |
| Administrator Class | 2022 | 2021 | 2020 | 2019 | 2018 |
Net asset value, beginning of period
| $18.98 | $15.31 | $14.02 | $17.54 | $14.93 |
Net investment loss
| (0.17) 1 | (0.20) 1 | (0.14) 1 | (0.15) 1 | (0.14) 1 |
Net realized and unrealized gains (losses) on investments
| (3.72) | 8.02 | 2.19 | (0.19) | 4.70 |
Total from investment operations
| (3.89) | 7.82 | 2.05 | (0.34) | 4.56 |
| Distributions to shareholders from | | | | | |
Net realized gains
| (5.51) | (4.15) | (0.76) | (3.18) | (1.95) |
Net asset value, end of period
| $9.58 | $18.98 | $15.31 | $14.02 | $17.54 |
Total return
| (29.09)% | 53.31% | 15.07% | (0.75)% | 33.06% |
| Ratios to average net assets (annualized)* | | | | | |
Gross expenses
| 1.28% | 1.27% | 1.28% | 1.27% | 1.28% |
Net expenses
| 1.20% | 1.20% | 1.20% | 1.20% | 1.20% |
Net investment loss
| (1.04)% | (1.05)% | (1.01)% | (0.94)% | (0.86)% |
| Supplemental data | | | | | |
Portfolio turnover rate2
| 51% | 48% | 55% | 71% | 47% |
Net assets, end of period (000s omitted)
| $17,676 | $28,730 | $21,250 | $23,549 | $52,335 |
| * | Ratios include net expenses allocated from the affiliated Master Portfolio which were as follows: |
| Year ended May 31, 2022 | 0.82% |
| Year ended May 31, 2021 | 0.81% |
| Year ended May 31, 2020 | 0.81% |
| Year ended May 31, 2019 | 0.81% |
| Year ended May 31, 2018 | 0.81% |
| 1 | Calculated based upon average shares outstanding |
| 2 | Portfolio turnover rate is calculated by multiplying the affiliated Master Portfolio’s percentage of the Fund’s total investment in securities at the end of the period by the affiliated Master Portfolio’s portfolio turnover rate. |
The accompanying notes are an integral part of these financial statements.
18 | Allspring Emerging Growth Fund
Financial highlights
(For a share outstanding throughout each period)
| | Year ended May 31 |
| Institutional Class | 2022 | 2021 | 2020 | 2019 | 2018 |
Net asset value, beginning of period
| $20.55 | $16.29 | $14.83 | $18.30 | $15.46 |
Net investment loss
| (0.14) 1 | (0.15) | (0.11) 1 | (0.13) | (0.09) |
Net realized and unrealized gains (losses) on investments
| (4.18) | 8.56 | 2.33 | (0.16) | 4.88 |
Total from investment operations
| (4.32) | 8.41 | 2.22 | (0.29) | 4.79 |
| Distributions to shareholders from | | | | | |
Net realized gains
| (5.51) | (4.15) | (0.76) | (3.18) | (1.95) |
Net asset value, end of period
| $10.72 | $20.55 | $16.29 | $14.83 | $18.30 |
Total return
| (28.95)% | 53.75% | 15.40% | (0.42)% | 33.44% |
| Ratios to average net assets (annualized)* | | | | | |
Gross expenses
| 1.02% | 1.02% | 1.03% | 1.02% | 1.03% |
Net expenses
| 0.90% | 0.90% | 0.90% | 0.90% | 0.90% |
Net investment loss
| (0.75)% | (0.75)% | (0.71)% | (0.67)% | (0.56)% |
| Supplemental data | | | | | |
Portfolio turnover rate2
| 51% | 48% | 55% | 71% | 47% |
Net assets, end of period (000s omitted)
| $156,936 | $648,569 | $471,512 | $578,073 | $606,729 |
| * | Ratios include net expenses allocated from the affiliated Master Portfolio which were as follows: |
| Year ended May 31, 2022 | 0.82% |
| Year ended May 31, 2021 | 0.81% |
| Year ended May 31, 2020 | 0.81% |
| Year ended May 31, 2019 | 0.81% |
| Year ended May 31, 2018 | 0.81% |
| 1 | Calculated based upon average shares outstanding |
| 2 | Portfolio turnover rate is calculated by multiplying the affiliated Master Portfolio’s percentage of the Fund’s total investment in securities at the end of the period by the affiliated Master Portfolio’s portfolio turnover rate. |
The accompanying notes are an integral part of these financial statements.
Allspring Emerging Growth Fund | 19
Notes to financial statements
1. ORGANIZATION
Allspring Funds Trust (the "Trust"), a Delaware statutory trust organized on March 10, 1999, is an open-end management investment company registered under the Investment Company Act of 1940, as amended (the "1940 Act"). As an investment company, the Trust follows the accounting and reporting guidance in Financial Accounting Standards Board ("FASB") Accounting Standards Codification Topic 946, Financial Services – Investment Companies. These financial statements report on the Allspring Emerging Growth Fund (the "Fund") which is a diversified series of the Trust.
The Fund is a feeder fund in a master-feeder structure that invests substantially all of its assets in a single master portfolio with a substantially identical investment objective and substantially similar investment strategies. The Fund invests in Allspring Emerging Growth Portfolio, a separate diversified portfolio (the “affiliated Master Portfolio”) of Allspring Master Trust, a registered open-end management investment company. As of May 31, 2022, the Fund owned 90.11% of Allspring Emerging Growth Portfolio. The affiliated Master Portfolio directly acquires portfolio securities and the Fund acquires an indirect interest in those securities. The Fund accounts for its investment in the affiliated Master Portfolio as a partnership investment and records on a daily basis its share of the affiliated Master Portfolio’s income, expense and realized and unrealized gains and losses. The financial statements of the affiliated Master Portfolio for the year ended May 31, 2022 are included in this report and should be read in conjunction with the Fund’s financial statements.
Effective on November 1, 2021, the sale transaction of Wells Fargo Asset Management ("WFAM") by Wells Fargo & Company to GTCR LLC and Reverence Capital Partners, L.P. was closed. In connection with the closing of the transaction, WFAM became known as Allspring Global Investments (“Allspring”) and various entities that provided services to the Fund changed their names to "Allspring", including Allspring Funds Management, LLC, the investment manager to the Fund, Allspring Global Investments, LLC and Allspring Global Investments (UK) Limited, both registered investment advisers providing subadvisory services to certain funds, and Allspring Funds Distributor, LLC, the Fund's principal underwriter. Consummation of the transaction resulted in a new investment management agreement and subadvisory agreement which became effective on November 1, 2021.
2. SIGNIFICANT ACCOUNTING POLICIES
The following significant accounting policies, which are consistently followed in the preparation of the financial statements of the Fund, are in conformity with U.S. generally accepted accounting principles which require management to make estimates and assumptions that affect the reported amounts of assets and liabilities, disclosure of contingent assets and liabilities at the date of the financial statements, and the reported amounts of income and expenses during the reporting period. Actual results could differ from those estimates.
Securities valuation
All investments are valued each business day as of the close of regular trading on the New York Stock Exchange (generally 4 p.m. Eastern Time), although the Fund may deviate from this calculation time under unusual or unexpected circumstances.
Investments in the affiliated Master Portfolio are valued daily based on the Fund’s proportionate share of the affiliated Master Portfolio’s net assets, which are also valued daily. Securities held in the affiliated Master Portfolio are valued as discussed in the Notes to Financial Statements of the affiliated Master Portfolio, which are included elsewhere in this report.
Investments which are not valued using the method discussed above are valued at their fair value, as determined in good faith by the Board of Trustees. The Board of Trustees has established a Valuation Committee comprised of the Trustees and has delegated to it the authority to take any actions regarding the valuation of portfolio securities that the Valuation Committee deems necessary or appropriate, including determining the fair value of portfolio securities, unless the determination has been delegated to the Allspring Global Investments Pricing Committee at Allspring Funds Management, LLC ("Allspring Funds Management"). The Board of Trustees retains the authority to make or ratify any valuation decisions or approve any changes to the Valuation Procedures as it deems appropriate. On a quarterly basis, the Board of Trustees receives reports on any valuation actions taken by the Valuation Committee or the Allspring Global Investments Pricing Committee which may include items for ratification.
Investment transactions, income and expenses
Investments in the affiliated Master Portfolio are recorded on a trade date basis. The Fund records daily its proportionate share of the affiliated Master Portfolio’s income, expenses and realized and unrealized gains or losses. The Fund also accrues its own expenses.
20 | Allspring Emerging Growth Fund
Notes to financial statements
Distributions to shareholders
Distributions to shareholders from net investment income and any net realized gains are recorded on the ex-dividend date and paid at least annually. Such distributions are determined in accordance with income tax regulations and may differ from U.S. generally accepted accounting principles. Dividend sources are estimated at the time of declaration. The tax character of distributions is determined as of the Fund's fiscal year end. Therefore, a portion of the Fund's distributions made prior to the Fund’s fiscal year end may be categorized as a tax return of capital at year end.
Federal and other taxes
The Fund intends to continue to qualify as a regulated investment company by distributing substantially all of its investment company taxable income and any net realized capital gains (after reduction for capital loss carryforwards) sufficient to relieve it from all, or substantially all, federal income taxes. Accordingly, no provision for federal income taxes was required.
The Fund’s income and federal excise tax returns and all financial records supporting those returns for the prior three fiscal years are subject to examination by the federal and Delaware revenue authorities. Management has analyzed the Fund's tax positions taken on federal, state, and foreign tax returns, as applicable, for all open tax years and does not believe that there are any uncertain tax positions that require recognition of a tax liability.
As of May 31, 2022, the aggregate cost of all investments for federal income tax purposes was $267,242,409 and the unrealized gains (losses) consisted of:
| Gross unrealized gains | $67,926,824 |
| Gross unrealized losses | 0 |
| Net unrealized gains | $67,926,824 |
Reclassifications are made to the Fund’s capital accounts for permanent tax differences to reflect income and gains available for distribution (or available capital loss carryforwards) under federal income tax regulations. U.S. generally accepted accounting principles require that certain components of net assets be adjusted to reflect permanent differences between financial and tax reporting. These reclassifications have no effect on net assets or net asset values per share. The primary permanent difference causing such reclassification is due to net operating losses and redemptions-in-kind. At May 31, 2022, as a result of permanent book-to-tax differences, the following reclassification adjustments were made on the Statement of Assets and Liabilities:
| Paid-in capital | Total distributable
earnings |
| $169,163,798 | $(169,163,798) |
As of May 31, 2022, the Fund had current year deferred post-October capital losses consisting of $11,365,781 in short-term capital losses which will be recognized in the first day of the following fiscal year.
Class allocations
The separate classes of shares offered by the Fund differ principally in applicable sales charges, distribution, shareholder servicing, and administration fees. Class specific expenses are charged directly to that share class. Investment income, common fund-level expenses, and realized and unrealized gains (losses) on investments are allocated daily to each class of shares based on the relative proportion of net assets of each class.
3. FAIR VALUATION MEASUREMENTS
At May 31, 2022, the Fund’s investment in the affiliated Master Portfolio was measured at fair value using the net asset value per share (or its equivalent) as a practical expedient. The investment objective and fair value of the affiliated Master Portfolio is as follows:
| Affiliated Master Portfolio | Investment objective | Fair value of affiliated
Master Portfolio |
| Allspring Emerging Growth Portfolio | Seek long-term capital appreciation | $335,169,233 |
The affiliated Master Portfolio does not have a redemption period notice, can be redeemed daily and does not have any unfunded commitments.
Allspring Emerging Growth Fund | 21
Notes to financial statements
4. TRANSACTIONS WITH AFFILIATES
Management fee
Allspring Funds Management, a wholly owned subsidiary of Allspring Global Investments Holdings, LLC, a holding company indirectly owned by certain private funds of GTCR LLC and Reverence Capital Partners, L.P., is the manager of the Fund and provides advisory and fund-level administrative services under an investment management agreement. Under the investment management agreement, Allspring Funds Management is responsible for, among other services, implementing the investment objectives and strategies of the Fund and providing fund-level administrative services in connection with the Fund’s operations. As long as the Fund continues to invest substantially all of its assets in a single affiliated Master Portfolio, the Fund pays Allspring Funds Management an investment management fee only for fund-level administrative services at the following annual rate based on the Fund’s average daily net assets:
| Average daily net assets | Management fee |
| First $5 billion | 0.050% |
| Next $5 billion | 0.040 |
| Over $10 billion | 0.030 |
For the year ended May 31, 2022, the management fee was equivalent to an annual rate of 0.05% of the Fund’s average daily net assets.
Allspring Funds Management also serves as the adviser to the affiliated Master Portfolio and is entitled to receive a fee from the affiliated Master Portfolio for those services.
Administration fees
Under a class-level administration agreement, Allspring Funds Management provides class-level administrative services to the Fund, which includes paying fees and expenses for services provided by the transfer agent, sub-transfer agents, omnibus account servicers and record-keepers. As compensation for its services under the class-level administration agreement, Allspring Funds Management receives an annual fee which is calculated based on the average daily net assets of each class as follows:
| | Class-level
administration fee |
| Class A | 0.21% |
| Class C | 0.21 |
| Class R6 | 0.03 |
| Administrator Class | 0.13 |
| Institutional Class | 0.13 |
Waivers and/or expense reimbursements
Allspring Funds Management has contractually committed to waive and/or reimburse management and administration fees to the extent necessary to maintain certain net operating expense ratios for the Fund. When each class of the Fund has exceeded its expense cap, Allspring Funds Management will waive fees and/or reimburse expenses from fund-level expenses on a proportionate basis and then from class specific expenses. When only certain classes exceed their expense caps, waivers and/or reimbursements are applied against class specific expenses before fund-level expenses. Net expenses from the affiliated Master Portfolio are included in the expense caps. Allspring Funds Management has contractually committed through September 30, 2022 to waive fees and/or reimburse expenses to the extent necessary to cap expenses. Prior to or after the commitment expiration date, the caps may be increased or the commitment to maintain the caps may be terminated only with the approval of the Board of Trustees. As of May 31, 2022, the contractual expense caps are as follows:
22 | Allspring Emerging Growth Fund
Notes to financial statements
| | Expense ratio caps |
| Class A | 1.28% |
| Class C | 2.03 |
| Class R6 | 0.85 |
| Administrator Class | 1.20 |
| Institutional Class | 0.90 |
Distribution fee
The Trust has adopted a distribution plan for Class C shares pursuant to Rule 12b-1 under the 1940 Act. A distribution fee is charged to Class C shares and paid to Allspring Funds Distributor, LLC ("Allspring Funds Distributor"), the principal underwriter, an affiliate of Allspring Funds Management, at an annual rate of 0.75% of the average daily net assets of Class C shares.
In addition, Allspring Funds Distributor is entitled to receive the front-end sales charge from the purchase of Class A shares and a contingent deferred sales charge on the redemption of certain Class A shares. Allspring Funds Distributor is also entitled to receive the contingent deferred sales charges from redemptions of Class C shares. For the year ended May 31, 2022, Allspring Funds Distributor received $2,990 from the sale of Class A shares and $16 in contingent deferred sales charges from redemptions of Class C shares. No contingent deferred sales charges were incurred by Class A shares for the year ended May 31, 2022.
Shareholder servicing fees
The Trust has entered into contracts with one or more shareholder servicing agents, whereby Class A, Class C and Administrator Class are charged a fee at an annual rate of 0.25% of the average daily net assets of each respective class. A portion of these total shareholder servicing fees were paid to affiliates, and to certain entities that were affiliates of the Fund until November 1, 2021.
5. INVESTMENT PORTFOLIO TRANSACTIONS
The Fund seeks to achieve its investment objective by investing substantially all of its assets in the affiliated Master Portfolio. Purchases and sales have been calculated by multiplying the Fund's ownership percentage of the affiliated Master Portfolio at the end of the period by the affiliated Master Portfolio's purchases and sales. Purchases and sales of investments, excluding U.S. government obligations (if any) and short-term securities, for the year ended May 31, 2022 were $281,909,209 and $394,145,862, respectively.
6. BANK BORROWINGS
The Trust (excluding the money market funds), Allspring Master Trust and Allspring Variable Trust are parties to a $350,000,000 revolving credit agreement whereby the Fund is permitted to use bank borrowings for temporary or emergency purposes, such as to fund shareholder redemption requests. Interest under the credit agreement is charged to the Fund based on a borrowing rate equal to the higher of the Federal Funds rate in effect on that day plus 1.25% or the overnight bank funding rate in effect on that day plus 1.25%. In addition, an annual commitment fee equal to 0.25% of the unused balance is allocated to each participating fund.
For the year ended May 31, 2022, there were no borrowings by the Fund under the agreement.
7. DISTRIBUTIONS TO SHAREHOLDERS
The tax character of distributions paid during the years ended May 31, 2022 and May 31, 2021 were as follows:
| | Year ended May 31 |
| | 2022 | 2021 |
| Ordinary income | $ 0 | $ 11,568,904 |
| Long-term capital gain | 139,477,496 | 143,589,213 |
Allspring Emerging Growth Fund | 23
Notes to financial statements
As of May 31, 2022, the components of distributable earnings on a tax basis were as follows:
Unrealized
gains | Post-October
capital
losses
deferred |
| $67,926,824 | $(11,365,781) |
8. CONCENTRATION RISKS
Concentration risks result from exposure to a limited number of sectors. Through its investment in the affiliated Master Portfolio which may invest a substantial portion of its assets in any sector, the Fund may in turn be more affected by changes in that sector than a fund whose investments are not heavily weighted in any sector. As of the end of the period, the affiliated Master Portfolio concentrated its portfolio in investments related to the health care and information technology sectors.
9. INDEMNIFICATION
Under the Fund's organizational documents, the officers and Trustees have been granted certain indemnification rights against certain liabilities that may arise out of performance of their duties to the Fund. The Fund has entered into a separate agreement with each Trustee that converts indemnification rights currently existing under the Fund’s organizational documents into contractual rights that cannot be changed in the future without the consent of the Trustee. Additionally, in the normal course of business, the Fund may enter into contracts with service providers that contain a variety of indemnification clauses. The Fund’s maximum exposure under these arrangements is dependent on future claims that may be made against the Fund and, therefore, cannot be estimated.
10. REDEMPTIONS IN-KIND
During the year ended May 31, 2022, the Fund redeemed assets through in-kind redemptions for a shareholder in the Institutional Class. The realized gains (losses) recognized by the Fund are reflected on the Statement of Operations and these redemption transactions are reflected on the Statement of Changes in Net Assets. The date of the redemption transaction, value of securities issued from the redemption, cash paid, realized gains (losses) and the percentage of the Fund redeemed by the shareholder was as follows:
| Date | Value of
securities issued | Cash
paid | Realized
gains (losses) | % of the
Fund |
| 8-27-2021 | $348,404,897 | $1,817,058 | $176,872,468 | 39.45% |
11. CORONAVIRUS (COVID-19) PANDEMIC
On March 11, 2020, the World Health Organization announced that it had made the assessment that coronavirus disease 2019 (“COVID-19”) is a pandemic. The impacts of COVID-19 are affecting the entire global economy, individual companies and investment products, the funds, and the market in general. There is significant uncertainty around the extent and duration of business disruptions related to COVID-19 and the impacts may last for an extended period of time. COVID-19 has led to significant uncertainty and volatility in the financial markets.
24 | Allspring Emerging Growth Fund
Report of independent registered public accounting firm
To the Shareholders of the Fund and Board of Trustees
Allspring Funds Trust:
Opinion on the Financial Statements
We have audited the accompanying statement of assets and liabilities of Allspring Emerging Growth Fund (formerly, Wells Fargo Emerging Growth Fund) (the Fund), one of the funds constituting Allspring Funds Trust (formerly, Wells Fargo Funds Trust), including the portfolio of investments, as of May 31, 2022, the related statement of operations for the year then ended, the statements of changes in net assets for each of the years in the two-year period then ended, and the related notes (collectively, the financial statements) and the financial highlights for each of the years or periods in the five-year period then ended. In our opinion, the financial statements and financial highlights present fairly, in all material respects, the financial position of the Fund as of May 31, 2022, the results of its operations for the year then ended, the changes in its net assets for each of the years in the two-year period then ended, and the financial highlights for each of the years or periods in the five-year period then ended, in conformity with U.S. generally accepted accounting principles.
Basis for Opinion
These financial statements and financial highlights are the responsibility of the Fund’s management. Our responsibility is to express an opinion on these financial statements and financial highlights based on our audits. We are a public accounting firm registered with the Public Company Accounting Oversight Board (United States) (PCAOB) and are required to be independent with respect to the Fund in accordance with the U.S. federal securities laws and the applicable rules and regulations of the Securities and Exchange Commission and the PCAOB.
We conducted our audits in accordance with the standards of the PCAOB. Those standards require that we plan and perform the audit to obtain reasonable assurance about whether the financial statements and financial highlights are free of material misstatement, whether due to error or fraud. Our audits included performing procedures to assess the risks of material misstatement of the financial statements and financial highlights, whether due to error or fraud, and performing procedures that respond to those risks. Such procedures included examining, on a test basis, evidence regarding the amounts and disclosures in the financial statements and financial highlights. Such procedures also included confirmation of securities owned as of May 31, 2022, by correspondence with the transfer agent. Our audits also included evaluating the accounting principles used and significant estimates made by management, as well as evaluating the overall presentation of the financial statements and financial highlights. We believe that our audits provide a reasonable basis for our opinion.

We have not been able to determine the specific year that we began serving as the auditor of one or more Allspring Funds investment companies; however, we are aware that we have served as the auditor of one or more Allspring Funds investment companies since at least 1955.
Boston, Massachusetts
July 27, 2022
Allspring Emerging Growth Fund | 25
Portfolio of investments—May 31, 2022
| | | | | Shares | Value |
| Common stocks: 97.13% | | | | | |
| Communication services: 1.35% | | | | | |
| Interactive media & services: 0.79% | | | | | |
| Eventbrite Incorporated Class A † | | | | 250,060 | $ 2,933,204 |
| Media: 0.56% | | | | | |
| TechTarget Incorporated † | | | | 29,100 | 2,068,719 |
| Consumer discretionary: 12.00% | | | | | |
| Auto components: 1.45% | | | | | |
| Fox Factory Holding Corporation † | | | | 65,918 | 5,406,594 |
| Hotels, restaurants & leisure: 5.03% | | | | | |
| Hilton Grand Vacations Incorporated † | | | | 164,700 | 7,535,025 |
| Papa John's International Incorporated | | | | 93,965 | 8,269,860 |
| Wingstop Incorporated | | | | 36,478 | 2,905,837 |
| | | | | | 18,710,722 |
| Leisure products: 1.03% | | | | | |
| YETI Holdings Incorporated † | | | | 83,940 | 3,840,255 |
| Specialty retail: 3.26% | | | | | |
| Boot Barn Holdings Incorporated † | | | | 32,650 | 2,634,855 |
| Leslie's Incorporated † | | | | 197,114 | 3,827,954 |
| Lithia Motors Incorporated Class A | | | | 18,642 | 5,675,930 |
| | | | | | 12,138,739 |
| Textiles, apparel & luxury goods: 1.23% | | | | | |
| Crocs Incorporated † | | | | 29,675 | 1,654,678 |
| Deckers Outdoor Corporation † | | | | 10,803 | 2,901,254 |
| | | | | | 4,555,932 |
| Consumer staples: 4.88% | | | | | |
| Beverages: 1.28% | | | | | |
| Celsius Holdings Incorporated † | | | | 34,785 | 2,333,726 |
| Duckhorn Portfolio Incorporated † | | | | 123,000 | 2,416,950 |
| | | | | | 4,750,676 |
| Food & staples retailing: 1.89% | | | | | |
| The Chef's Warehouse Incorporated † | | | | 197,195 | 7,045,777 |
| Food products: 1.71% | | | | | |
| Freshpet Incorporated † | | | | 83,218 | 5,989,199 |
| The Simply Good Foods Company † | | | | 9,300 | 371,628 |
| | | | | | 6,360,827 |
| Financials: 5.76% | | | | | |
| Capital markets: 2.18% | | | | | |
| Stifel Financial Corporation | | | | 126,366 | 8,108,906 |
| Insurance: 3.58% | | | | | |
| Kinsale Capital Group Incorporated | | | | 60,493 | 13,301,201 |
The accompanying notes are an integral part of these financial statements.
26 | Allspring Emerging Growth Portfolio
Portfolio of investments—May 31, 2022
| | | | | Shares | Value |
| Health care: 24.76% | | | | | |
| Biotechnology: 7.73% | | | | | |
| Arcutis Biotherapeutics Incorporated † | | | | 181,556 | $ 3,790,889 |
| Biohaven Pharmaceutical Holding Company † | | | | 41,516 | 5,967,095 |
| Cytokinetics Incorporated † | | | | 50,900 | 2,030,910 |
| Fate Therapeutics Incorporated † | | | | 56,667 | 1,309,008 |
| Halozyme Therapeutics Incorporated † | | | | 175,140 | 8,052,937 |
| Vericel Corporation † | | | | 279,833 | 7,597,466 |
| | | | | | 28,748,305 |
| Health care equipment & supplies: 10.84% | | | | | |
| Axonics Incorporated † | | | | 123,650 | 6,182,500 |
| Figs Incorporated Class A † | | | | 208,403 | 1,854,787 |
| iRhythm Technologies Incorporated † | | | | 50,300 | 7,084,755 |
| Nyxoah SA † | | | | 38,370 | 479,625 |
| Orthopediatrics Corporation † | | | | 103,181 | 4,763,867 |
| Outset Medical Incorporated † | | | | 78,411 | 1,709,360 |
| Pulmonx Corporation † | | | | 63,344 | 1,156,661 |
| Shockwave Medical Incorporated † | | | | 62,425 | 10,250,809 |
| SI-BONE Incorporated † | | | | 219,793 | 3,285,905 |
| Silk Road Medical Incorporated † | | | | 39,324 | 1,306,343 |
| Tandem Diabetes Care Incorporated † | | | | 33,110 | 2,257,109 |
| | | | | | 40,331,721 |
| Health care providers & services: 1.29% | | | | | |
| Castle Biosciences Incorporated † | | | | 134,156 | 2,987,654 |
| Privia Health Group Incorporated † | | | | 75,727 | 1,814,419 |
| | | | | | 4,802,073 |
| Health care technology: 1.97% | | | | | |
| Inspire Medical Systems Incorporated † | | | | 41,499 | 7,338,268 |
| Life sciences tools & services: 1.67% | | | | | |
| Akoya Biosciences Incorporated † | | | | 114,346 | 1,332,133 |
| Alpha Teknova Incorporated † | | | | 70,934 | 542,645 |
| Codexis Incorporated † | | | | 407,127 | 4,348,116 |
| | | | | | 6,222,894 |
| Pharmaceuticals: 1.26% | | | | | |
| Amylyx Pharmaceuticals Incorporated †« | | | | 121,300 | 1,078,357 |
| Pacira Biosciences Incorporated † | | | | 56,700 | 3,586,275 |
| | | | | | 4,664,632 |
| Industrials: 13.94% | | | | | |
| Building products: 2.63% | | | | | |
| Zurn Water Solutions Corporation | | | | 339,484 | 9,783,929 |
| Commercial services & supplies: 2.45% | | | | | |
| Casella Waste Systems Incorporated Class A † | | | | 127,341 | 9,115,069 |
| Construction & engineering: 0.33% | | | | | |
| Construction Partners Incorporated Class A † | | | | 53,285 | 1,225,022 |
| Electrical equipment: 2.00% | | | | | |
| Regal Rexnord Corporation | | | | 59,617 | 7,449,144 |
The accompanying notes are an integral part of these financial statements.
Allspring Emerging Growth Portfolio | 27
Portfolio of investments—May 31, 2022
| | | | | Shares | Value |
| Machinery: 1.07% | | | | | |
| Evoqua Water Technologies Company † | | | | 111,700 | $ 3,975,403 |
| Professional services: 3.43% | | | | | |
| ASGN Incorporated † | | | | 133,901 | 12,751,392 |
| Road & rail: 0.56% | | | | | |
| Saia Incorporated † | | | | 10,611 | 2,096,627 |
| Trading companies & distributors: 1.47% | | | | | |
| SiteOne Landscape Supply Incorporated † | | | | 40,627 | 5,454,987 |
| Information technology: 34.44% | | | | | |
| Communications equipment: 1.34% | | | | | |
| Calix Incorporated † | | | | 135,300 | 4,997,982 |
| Electronic equipment, instruments & components: 2.52% | | | | | |
| Novanta Incorporated † | | | | 76,105 | 9,357,871 |
| IT services: 6.48% | | | | | |
| BigCommerce Holdings Incorporated Series 1 † | | | | 219,010 | 4,058,255 |
| DigitalOcean Holdings Incorporated † | | | | 53,250 | 2,601,263 |
| Endava plc ADR † | | | | 52,514 | 5,298,137 |
| EVO Payments Incorporated Class A † | | | | 159,917 | 3,686,087 |
| Flywire Corporation † | | | | 75,300 | 1,454,043 |
| Paymentus Holdings Incorporated A †« | | | | 127,654 | 1,939,064 |
| Perficient Incorporated † | | | | 34,000 | 3,328,940 |
| Shift4 Payments Incorporated Class A † | | | | 38,200 | 1,743,830 |
| | | | | | 24,109,619 |
| Semiconductors & semiconductor equipment: 7.05% | | | | | |
| Allegro MicroSystems Incorporated † | | | | 218,612 | 5,629,259 |
| Diodes Incorporated † | | | | 91,486 | 7,045,337 |
| Semtech Corporation † | | | | 115,356 | 7,393,166 |
| Silicon Laboratories Incorporated † | | | | 25,074 | 3,740,038 |
| Sitime Corporation † | | | | 11,300 | 2,406,900 |
| | | | | | 26,214,700 |
| Software: 17.05% | | | | | |
| CyberArk Software Limited † | | | | 52,860 | 7,342,254 |
| Domo Incorporated Class B † | | | | 93,500 | 2,980,780 |
| Jamf Holding Corporation † | | | | 174,518 | 4,492,093 |
| Olo Incorporated Class A † | | | | 187,549 | 1,997,397 |
| Paycor HCM Incorporated † | | | | 201,195 | 4,933,301 |
| Q2 Holdings Incorporated † | | | | 85,605 | 4,513,952 |
| Rapid7 Incorporated † | | | | 150,875 | 10,692,511 |
| RingCentral Incorporated Class A † | | | | 29,100 | 1,837,374 |
| Sprout Social Incorporated Class A † | | | | 110,596 | 5,632,654 |
| SPS Commerce Incorporated † | | | | 111,296 | 11,913,124 |
| Verint Systems Incorporated † | | | | 21,500 | 1,097,360 |
| Workiva Incorporated † | | | | 82,020 | 5,988,280 |
| | | | | | 63,421,080 |
| Total Common stocks (Cost $288,212,313) | | | | | 361,282,270 |
The accompanying notes are an integral part of these financial statements.
28 | Allspring Emerging Growth Portfolio
Portfolio of investments—May 31, 2022
| | | | | Shares | Value |
| Investment companies: 1.51% | | | | | |
| Exchange-traded funds: 1.51% | | | | | |
| iShares Russell 2000 Growth ETF « | | | | 25,491 | $ 5,620,001 |
| Total Investment companies (Cost $5,207,481) | | | | | 5,620,001 |
| | | Yield | | | |
| Short-term investments: 2.71% | | | | | |
| Investment companies: 2.71% | | | | | |
| Allspring Government Money Market Fund Select Class ♠∞ | | 0.65% | | 6,288,467 | 6,288,467 |
| Securities Lending Cash Investments LLC ♠∩∞ | | 0.91 | | 3,803,495 | 3,803,495 |
| Total Short-term investments (Cost $10,091,962) | | | | | 10,091,962 |
| Total investments in securities (Cost $303,511,756) | 101.35% | | | | 376,994,233 |
| Other assets and liabilities, net | (1.35) | | | | (5,022,166) |
| Total net assets | 100.00% | | | | $371,972,067 |
| † | Non-income-earning security |
| « | All or a portion of this security is on loan. |
| ♠ | The issuer of the security is an affiliated person of the Portfolio as defined in the Investment Company Act of 1940. |
| ∩ | The investment is a non-registered investment company purchased with cash collateral received from securities on loan. |
| ∞ | The rate represents the 7-day annualized yield at period end. |
| Abbreviations: |
| ADR | American depositary receipt |
Investments in affiliates
An affiliated investment is an investment in which the Portfolio owns at least 5% of the outstanding voting shares of the issuer or as a result of other relationships, such as the Portfolio and the issuer having the same adviser or investment manager. Transactions with issuers that were affiliates of the Portfolio at the end of the period were as follows:
| | Value,
beginning of
period | Purchases | Sales
proceeds | Net
realized
gains
(losses) | | Net
change in
unrealized
gains
(losses) | | Value,
end of
period | Shares,
end
of period | Income
from
affiliated
securities |
| Short-term investments | | | | | | | | | |
| Allspring Government Money Market Fund Select Class | $9,477,635 | $167,213,623 | $(170,402,791) | $0 | | $0 | | $ 6,288,467 | 6,288,467 | $ 8,983 |
| Securities Lending Cash Investments LLC | 3,883,200 | 157,799,929 | (157,879,634) | 0 | | 0 | | 3,803,495 | 3,803,495 | 10,508 # |
| | | | | $0 | | $0 | | $10,091,962 | | $19,491 |
| # | Amount shown represents income before fees and rebates. |
The accompanying notes are an integral part of these financial statements.
Allspring Emerging Growth Portfolio | 29
Statement of assets and liabilities—May 31, 2022
| | |
| Assets | |
Investments in unaffiliated securities (including $3,684,297 of securities loaned), at value (cost $293,419,794)
| $ 366,902,271 |
Investments in affiliated securities, at value (cost $10,091,962)
| 10,091,962 |
Receivable for investments sold
| 381,575 |
Receivable for dividends
| 67,123 |
Receivable for securities lending income, net
| 6,189 |
Prepaid expenses and other assets
| 9,400 |
Total assets
| 377,458,520 |
| Liabilities | |
Payable upon receipt of securities loaned
| 3,803,495 |
Payable for investments purchased
| 1,406,160 |
Advisory fee payable
| 249,092 |
Accrued expenses and other liabilities
| 27,706 |
Total liabilities
| 5,486,453 |
Total net assets
| $371,972,067 |
The accompanying notes are an integral part of these financial statements.
30 | Allspring Emerging Growth Portfolio
Statement of operations—year ended May 31, 2022
| | |
| Investment income | |
Dividends
| $ 644,315 |
Securities lending income (including from affiliate), net
| 308,685 |
Income from affiliated securities
| 8,983 |
Total investment income
| 961,983 |
| Expenses | |
Advisory fee
| 4,944,352 |
Custody and accounting fees
| 68,903 |
Professional fees
| 50,725 |
Interest holder report expenses
| 10,065 |
Trustees’ fees and expenses
| 19,821 |
Other fees and expenses
| 19,191 |
Total expenses
| 5,113,057 |
Less: Fee waivers and/or expense reimbursements
| (1,873) |
Net expenses
| 5,111,184 |
Net investment loss
| (4,149,201) |
| Realized and unrealized gains (losses) on investments | |
Net realized gains on investments
| 254,745,270 |
Net change in unrealized gains (losses) on investments
| (361,893,191) |
Net realized and unrealized gains (losses) on investments
| (107,147,921) |
Net decrease in net assets resulting from operations
| $(111,297,122) |
The accompanying notes are an integral part of these financial statements.
Allspring Emerging Growth Portfolio | 31
Statement of changes in net assets
| | | |
| | Year ended
May 31, 2022 | Year ended
May 31, 2021 |
| Operations | | |
Net investment loss
| $ (4,149,201) | $ (5,761,179) |
Net realized gains on investments
| 254,745,270 | 181,278,904 |
Net change in unrealized gains (losses) on investments
| (361,893,191) | 176,777,300 |
Net increase (decrease) in net assets resulting from operations
| (111,297,122) | 352,295,025 |
| Capital transactions | | |
| Transactions in investors’ beneficial interests | | |
Contributions
| 75,769,980 | 97,803,647 |
Withdrawals
| (550,022,954) | (215,997,204) |
Net decrease in net assets resulting from capital transactions
| (474,252,974) | (118,193,557) |
Total increase (decrease) in net assets
| (585,550,096) | 234,101,468 |
| Net assets | | |
Beginning of period
| 957,522,163 | 723,420,695 |
End of period
| $ 371,972,067 | $ 957,522,163 |
The accompanying notes are an integral part of these financial statements.
32 | Allspring Emerging Growth Portfolio
| | Year ended May 31 |
| | 2022 | 2021 | 2020 | 2019 | 2018 |
Total return
| (28.85)% | 53.94% | 15.49% | (0.28)% | 33.60% |
| Ratios to average net assets (annualized) | | | | | |
Gross expenses
| 0.82% | 0.81% | 0.81% | 0.81% | 0.81% |
Net expenses1
| 0.82% | 0.81% | 0.81% | 0.81% | 0.81% |
Net investment loss
| (0.67)% | (0.66)% | (0.62)% | (0.57)% | (0.47)% |
| Supplemental data | | | | | |
Portfolio turnover rate
| 51% | 48% | 55% | 71% | 47% |
| 1 | Net expense ratios reflect voluntary waivers. |
The accompanying notes are an integral part of these financial statements.
Allspring Emerging Growth Portfolio | 33
Notes to financial statements
1. ORGANIZATION
Allspring Master Trust (the "Trust"), a Delaware statutory trust organized on March 10, 1999, is an open-end management investment company registered under the Investment Company Act of 1940, as amended (the "1940 Act"). As an investment company, the Trust follows the accounting and reporting guidance in Financial Accounting Standards Board ("FASB") Accounting Standards Codification Topic 946, Financial Services – Investment Companies. These financial statements report on the Allspring Emerging Growth Portfolio (the "Portfolio") which is a diversified series of the Trust.
Interests in the Portfolio are available solely through private placement transactions that do not involve any "public offering" within the meaning of Section 4(a)(2) of the Securities Act of 1933.
Effective on November 1, 2021, the sale transaction of Wells Fargo Asset Management ("WFAM") by Wells Fargo & Company to GTCR LLC and Reverence Capital Partners, L.P. was closed. In connection with the closing of the transaction, WFAM became known as Allspring Global Investments (“Allspring”) and various entities that provided services to the Portfolio changed their names to "Allspring", including Allspring Funds Management, LLC, the adviser to the Portfolio, Allspring Global Investments, LLC and Allspring Global Investments (UK) Limited, both registered investment advisers providing subadvisory services to certain funds, and Allspring Funds Distributor, LLC. Consummation of the transaction resulted in a new advisory agreement and subadvisory agreement which became effective on November 1, 2021.
2. SIGNIFICANT ACCOUNTING POLICIES
The following significant accounting policies, which are consistently followed in the preparation of the financial statements of the Portfolio, are in conformity with U.S. generally accepted accounting principles which require management to make estimates and assumptions that affect the reported amounts of assets and liabilities, disclosure of contingent assets and liabilities at the date of the financial statements, and the reported amounts of income and expenses during the reporting period. Actual results could differ from those estimates.
Securities valuation
All investments are valued each business day as of the close of regular trading on the New York Stock Exchange (generally 4 p.m. Eastern Time), although the Portfolio may deviate from this calculation time under unusual or unexpected circumstances.
Equity securities that are listed on a foreign or domestic exchange or market are valued at the official closing price or, if none, the last sales price.
Investments in registered open-end investment companies are valued at net asset value. Interests in non-registered investment companies that are redeemable at net asset value are fair valued normally at net asset value.
Investments which are not valued using any of the methods discussed above are valued at their fair value, as determined in good faith by the Board of Trustees. The Board of Trustees has established a Valuation Committee comprised of the Trustees and has delegated to it the authority to take any actions regarding the valuation of portfolio securities that the Valuation Committee deems necessary or appropriate, including determining the fair value of portfolio securities, unless the determination has been delegated to the Allspring Global Investments Pricing Committee at Allspring Funds Management, LLC ("Allspring Funds Management"). The Board of Trustees retains the authority to make or ratify any valuation decisions or approve any changes to the Valuation Procedures as it deems appropriate. On a quarterly basis, the Board of Trustees receives reports on any valuation actions taken by the Valuation Committee or the Allspring Global Investments Pricing Committee which may include items for ratification.
Securities lending
The Portfolio may lend its securities from time to time in order to earn additional income in the form of fees or interest on securities received as collateral or the investment of any cash received as collateral. When securities are on loan, the Portfolio receives interest or dividends on those securities. Cash collateral received in connection with its securities lending transactions is invested in Securities Lending Cash Investments, LLC (the "Securities Lending Fund"), an affiliated non-registered investment company. Investments in Securities Lending Fund are valued at the evaluated bid price provided by an independent pricing service. Income earned from investment in the Securities Lending Fund, if any, is included in securities lending income (including from affiliate) (net of fees and rebates) on the Statement of Operations.
In a securities lending transaction, the net asset value of the Portfolio is affected by an increase or decrease in the value of the securities loaned and by an increase or decrease in the value of the instrument in which collateral is invested. The amount of securities lending activity undertaken by the Portfolio fluctuates from time to time. The Portfolio has the right under the lending agreement to recover the securities from the borrower on demand. In the event of default or bankruptcy by the
34 | Allspring Emerging Growth Portfolio
Notes to financial statements
borrower, the Portfolio may be prevented from recovering the loaned securities or gaining access to the collateral or may experience delays or costs in doing so. In such an event, the terms of the agreement allow the unaffiliated securities lending agent to use the collateral to purchase replacement securities on behalf of the Portfolio or pay the Portfolio the market value of the loaned securities. The Portfolio bears the risk of loss with respect to depreciation of its investment of the cash collateral.
Security transactions and income recognition
Securities transactions are recorded on a trade date basis. Realized gains or losses are recorded on the basis of identified cost.
Dividend income is recognized on the ex-dividend date.
Federal and other taxes
The Portfolio is not required to pay federal income taxes on its net investment income and net capital gains as it is treated as a partnership for federal income tax purposes. All income, gains and losses of the Portfolio are deemed to have been “passed through” to the interest holders in proportion to their holdings of the Portfolio regardless of whether income and gains have been distributed by the Portfolio.
The Portfolio’s income tax returns and all financial records supporting those returns for the prior three fiscal years are subject to examination by the federal revenue authority. Management has analyzed the Portfolio’s tax positions taken on federal, state, and foreign tax returns, as applicable, for all open tax years and does not believe that there are any uncertain tax positions that require recognition of a tax liability.
As of May 31, 2022, the aggregate cost of all investments for federal income tax purposes was $304,753,203 and the unrealized gains (losses) consisted of:
| Gross unrealized gains | $123,095,654 |
| Gross unrealized losses | (50,854,624) |
| Net unrealized gains | $ 72,241,030 |
3. FAIR VALUATION MEASUREMENTS
Fair value measurements of investments are determined within a framework that has established a fair value hierarchy based upon the various data inputs utilized in determining the value of the Portfolio’s investments. The three-level hierarchy gives the highest priority to unadjusted quoted prices in active markets for identical assets or liabilities (Level 1) and the lowest priority to unobservable inputs (Level 3). The Portfolio’s investments are classified within the fair value hierarchy based on the lowest level of input that is significant to the fair value measurement. The inputs are summarized into three broad levels as follows:
| ■ | Level 1 – quoted prices in active markets for identical securities |
| ■ | Level 2 – other significant observable inputs (including quoted prices for similar securities, interest rates, prepayment speeds, credit risk, etc.) |
| ■ | Level 3 – significant unobservable inputs (including the Portfolio’s own assumptions in determining the fair value of investments) |
The inputs or methodologies used for valuing investments in securities are not necessarily an indication of the risk associated with investing in those securities.
Allspring Emerging Growth Portfolio | 35
Notes to financial statements
The following is a summary of the inputs used in valuing the Portfolio’s assets and liabilities as of May 31, 2022:
| | Quoted prices
(Level 1) | Other significant
observable inputs
(Level 2) | Significant
unobservable inputs
(Level 3) | Total |
| Assets | | | | |
| Investments in: | | | | |
| Common stocks | | | | |
| Communication services | $ 5,001,923 | $0 | $0 | $ 5,001,923 |
| Consumer discretionary | 44,652,242 | 0 | 0 | 44,652,242 |
| Consumer staples | 18,157,280 | 0 | 0 | 18,157,280 |
| Financials | 21,410,107 | 0 | 0 | 21,410,107 |
| Health care | 92,107,893 | 0 | 0 | 92,107,893 |
| Industrials | 51,851,573 | 0 | 0 | 51,851,573 |
| Information technology | 128,101,252 | 0 | 0 | 128,101,252 |
| Investment companies | 5,620,001 | 0 | 0 | 5,620,001 |
| Short-term investments | | | | |
| Investment companies | 10,091,962 | 0 | 0 | 10,091,962 |
| Total assets | $376,994,233 | $0 | $0 | $376,994,233 |
Additional sector, industry or geographic detail, if any, is included in the Portfolio of Investments.
For the year ended May 31, 2022, the Portfolio did not have any transfers into/out of Level 3.
4. TRANSACTIONS WITH AFFILIATES
Advisory fee
The Trust has entered into an advisory contract with Allspring Funds Management, a wholly owned subsidiary of Allspring Global Investments Holdings, LLC, a holding company indirectly owned by certain private funds of GTCR LLC and Reverence Capital Partners, L.P. The adviser is responsible for implementing investment policies and guidelines and for supervising the subadviser, who is responsible for day-to-day portfolio management of the Portfolio. Pursuant to the contract, Allspring Funds Management is entitled to receive an advisory fee at the following annual rate based on the Portfolio’s average daily net assets:
| Average daily net assets | Advisory fee |
| First $500 million | 0.800% |
| Next $500 million | 0.775 |
| Next $1 billion | 0.750 |
| Next $1 billion | 0.725 |
| Next $1 billion | 0.700 |
| Over $4 billion | 0.680 |
For the year ended May 31, 2022, the advisory fee was equivalent to an annual rate of 0.79% of the Portfolio’s average daily net assets.
Allspring Funds Management has retained the services of a subadviser to provide daily portfolio management to the Portfolio. The fee for subadvisory services is borne by Allspring Funds Management. Allspring Global Investments, LLC ("Allspring Investments"), an affiliate of Allspring Funds Management and a wholly owned subsidiary of Allspring Global Investments Holdings, LLC, is the subadviser to the Portfolio and is entitled to receive a fee from Allspring Funds Management at an annual rate starting at 0.55% and declining to 0.40% as the average daily net assets of the Portfolio increase.
Allspring Funds Management has voluntarily waived and/or reimbursed advisory fees to reduced the net operating expense ratio of the Portfolio. These voluntary waivers may be discontinued at any time.
36 | Allspring Emerging Growth Portfolio
Notes to financial statements
Interfund transactions
The Portfolio may purchase or sell portfolio investment securities to certain affiliates pursuant to Rule 17a-7 under the 1940 Act and under procedures adopted by the Board of Trustees. The procedures have been designed to ensure that these interfund transactions, which do not incur broker commissions, are effected at current market prices.
5. INVESTMENT PORTFOLIO TRANSACTIONS
Purchases and sales of investments, excluding U.S. government obligations (if any) and short-term securities, for the year ended May 31, 2022 were $312,863,893 and $437,424,550, respectively.
6. SECURITIES LENDING TRANSACTIONS
The Portfolio lends its securities through an unaffiliated securities lending agent and receives collateral in the form of cash or securities with a value at least equal to the value of the securities on loan. The value of the loaned securities is determined at the close of each business day and any increases or decreases in the required collateral are exchanged between the Portfolio and the counterparty on the next business day. Cash collateral received is invested in the Securities Lending Fund which seeks to provide a positive return compared to the daily Federal Funds Open Rate by investing in high-quality, U.S. dollar-denominated short-term money market instruments and is exempt from registration under Section 3(c)(7) of the 1940 Act. Securities Lending Fund is managed by Allspring Funds Management and is subadvised by Allspring Investments. Allspring Funds Management receives an advisory fee starting at 0.05% and declining to 0.01% as the average daily net assets of the Securities Lending Fund increase. All of the fees received by Allspring Funds Management are paid to Allspring Investments for its services as subadviser.
In the event of counterparty default or the failure of a borrower to return a loaned security, the Portfolio has the right to use the collateral to offset any losses incurred. As of May 31, 2022, the Portfolio had securities lending transactions with the following counterparties which are subject to offset:
| Counterparty | Value of
securities on
loan | Collateral
received1 | Net amount |
| Citigroup Global Markets Incorporated | $2,050,371 | $(2,050,371) | $0 |
| JPMorgan Securities LLC | 413,385 | (413,385) | 0 |
| Morgan Stanley & Company LLC | 1,220,541 | (1,220,541) | 0 |
1 Collateral received within this table is limited to the collateral for the net transaction with the counterparty.
7. BANK BORROWINGS
The Trust, along with Allspring Variable Trust and Allspring Funds Trust (excluding the money market funds), are parties to a $350,000,000 revolving credit agreement whereby the Portfolio is permitted to use bank borrowings for temporary or emergency purposes, such as to fund interest holders withdrawal requests. Interest under the credit agreement is charged to the Portfolio based on a borrowing rate equal to the higher of the Federal Funds rate in effect on that day plus 1.25% or the overnight bank funding rate in effect on that day plus 1.25%. In addition, an annual commitment fee equal to 0.25% of the unused balance is allocated to each participating fund.
For the year ended May 31, 2022, there were no borrowings by the Portfolio under the agreement.
8. CONCENTRATION RISKS
As of the end of the period, the Portfolio concentrated its portfolio of investments in the health care and information technology sectors. A fund that invests a substantial portion of its assets in any sector may be more affected by changes in that sector than would be a fund whose investments are not heavily weighted in any sector.
9. INDEMNIFICATION
Under the Portfolio's organizational documents, the officers and Trustees have been granted certain indemnification rights against certain liabilities that may arise out of performance of their duties to the Portfolio. The Portfolio has entered into a separate agreement with each Trustee that converts indemnification rights currently existing under the Portfolio’s organizational documents into contractual rights that cannot be changed in the future without the consent of the Trustee. Additionally, in the normal course of business, the Portfolio may enter into contracts with service providers that contain a
Allspring Emerging Growth Portfolio | 37
Notes to financial statements
variety of indemnification clauses. The Portfolio’s maximum exposure under these arrangements is dependent on future claims that may be made against the Portfolio and, therefore, cannot be estimated.
10. CORONAVIRUS (COVID-19) PANDEMIC
On March 11, 2020, the World Health Organization announced that it had made the assessment that coronavirus disease 2019 (“COVID-19”) is a pandemic. The impacts of COVID-19 are affecting the entire global economy, individual companies and investment products, the funds, and the market in general. There is significant uncertainty around the extent and duration of business disruptions related to COVID-19 and the impacts may last for an extended period of time. COVID-19 has led to significant uncertainty and volatility in the financial markets.
38 | Allspring Emerging Growth Portfolio
Report of independent registered public accounting firm
To the Interest Holders of the Portfolio and Board of Trustees
Allspring Master Trust:
Opinion on the Financial Statements
We have audited the accompanying statement of assets and liabilities of Allspring Emerging Growth Portfolio (formerly, Wells Fargo Emerging Growth Portfolio) (the Portfolio), one of the portfolios constituting Allspring Master Trust (formerly, Wells Fargo Master Trust), including the portfolio of investments, as of May 31, 2022, the related statement of operations for the year then ended, the statements of changes in net assets for each of the years in the two-year period then ended, and the related notes (collectively, the financial statements) and the financial highlights for each of the years in the five-year period then ended. In our opinion, the financial statements and financial highlights present fairly, in all material respects, the financial position of the Portfolio as of May 31, 2022, the results of its operations for the year then ended, the changes in its net assets for each of the years in the two-year period then ended, and the financial highlights for each of the years in the five-year period then ended, in conformity with U.S. generally accepted accounting principles.
Basis for Opinion
These financial statements and financial highlights are the responsibility of the Portfolio’s management. Our responsibility is to express an opinion on these financial statements and financial highlights based on our audits. We are a public accounting firm registered with the Public Company Accounting Oversight Board (United States) (PCAOB) and are required to be independent with respect to the Portfolio in accordance with the U.S. federal securities laws and the applicable rules and regulations of the Securities and Exchange Commission and the PCAOB.
We conducted our audits in accordance with the standards of the PCAOB. Those standards require that we plan and perform the audit to obtain reasonable assurance about whether the financial statements and financial highlights are free of material misstatement, whether due to error or fraud. Our audits included performing procedures to assess the risks of material misstatement of the financial statements and financial highlights, whether due to error or fraud, and performing procedures that respond to those risks. Such procedures included examining, on a test basis, evidence regarding the amounts and disclosures in the financial statements and financial highlights. Such procedures also included confirmation of securities owned as of May 31, 2022, by correspondence with the custodian, transfer agent and brokers, or by other appropriate auditing procedures. Our audits also included evaluating the accounting principles used and significant estimates made by management, as well as evaluating the overall presentation of the financial statements and financial highlights. We believe that our audits provide a reasonable basis for our opinion.
We have not been able to determine the specific year that we began serving as the auditor of one or more Allspring Funds investment companies; however, we are aware that we have served as the auditor of one or more Allspring Funds investment companies since at least 1955.
Boston, Massachusetts
July 27, 2022
Allspring Emerging Growth Portfolio | 39
Other information (unaudited)
TAX INFORMATION
Pursuant to Section 852 of the Internal Revenue Code, $139,477,496 was designated as a 20% rate gain distribution for the fiscal year ended May 31, 2022.
PROXY VOTING INFORMATION
A description of the policies and procedures used to determine how to vote proxies relating to portfolio securities is available without charge, upon request, by calling 1-800-222-8222, visiting our website at allspringglobal.com, or visiting the SEC website at sec.gov. Information regarding how the proxies related to portfolio securities were voted during the most recent 12-month period ended June 30 is available on the website at allspringglobal.com or by visiting the SEC website at sec.gov.
QUARTERLY PORTFOLIO HOLDINGS INFORMATION
The Fund and Portfolio file their complete schedule of portfolio holdings with the SEC for the first and third quarters of each fiscal year as an exhibit to their reports on Form N-PORT. Shareholders and Interest holders may view the filed Form N-PORT by visiting the SEC website at sec.gov.
40 | Allspring Emerging Growth Fund
Other information (unaudited)
BOARD OF TRUSTEES AND OFFICERS
Each of the Trustees and Officers listed in the table below acts in identical capacities for each fund in the Allspring family of funds, which consists of 137 mutual funds comprising the Allspring Funds Trust, Allspring Variable Trust, Allspring Master Trust and four closed-end funds (collectively the “Fund Complex”). This table should be read in conjunction with the Prospectus and the Statement of Additional Information1. The mailing address of each Trustee and Officer is 525 Market Street, 12th Floor, San Francisco, CA 94105. Each Trustee and Officer serves an indefinite term, however, each Trustee serves such term until reaching the mandatory retirement age established by the Trustees.
Independent Trustees
Name and
year of birth | Position held and
length of service* | Principal occupations during past five years or longer | Current other
public company or
investment
company
directorships |
William R. Ebsworth
(Born 1957) | Trustee,
since 2015 | Retired. From 1984 to 2013, equities analyst, portfolio manager, research director and chief investment officer at Fidelity Management and Research Company in Boston, Tokyo, and Hong Kong, and retired in 2013 as Chief Investment Officer of Fidelity Strategic Advisers, Inc. where he led a team of investment professionals managing client assets. Prior thereto, Board member of Hong Kong Securities Clearing Co., Hong Kong Options Clearing Corp., the Thailand International Fund, Ltd., Fidelity Investments Life Insurance Company, and Empire Fidelity Investments Life Insurance Company. Audit Committee Chair and Investment Committee Chair of the Vincent Memorial Hospital Endowment (non-profit organization). Mr. Ebsworth is a CFA® charterholder. | N/A |
Jane A. Freeman
(Born 1953) | Trustee,
since 2015;
Chair Liaison,
since 2018 | Retired. From 2012 to 2014 and 1999 to 2008, Chief Financial Officer of Scientific Learning Corporation. From 2008 to 2012, Ms. Freeman provided consulting services related to strategic business projects. Prior to 1999, Portfolio Manager at Rockefeller & Co. and Scudder, Stevens & Clark. Board member of the Harding Loevner Funds from 1996 to 2014, serving as both Lead Independent Director and chair of the Audit Committee. Board member of the Russell Exchange Traded Funds Trust from 2011 to 2012 and the chair of the Audit Committee. Ms. Freeman is also an inactive Chartered Financial Analyst. | N/A |
Isaiah Harris, Jr.
(Born 1952) | Trustee,
since 2009; Audit
Committee
Chair,
since 2019 | Retired. Chairman of the Board of CIGNA Corporation from 2009 to 2021, and Director from 2005 to 2008. From 2003 to 2011, Director of Deluxe Corporation. Prior thereto, President and CEO of BellSouth Advertising and Publishing Corp. from 2005 to 2007, President and CEO of BellSouth Enterprises from 2004 to 2005 and President of BellSouth Consumer Services from 2000 to 2003. Emeritus member of the Iowa State University Foundation Board of Governors. Emeritus Member of the Advisory Board of Iowa State University School of Business. Advisory Board Member, Palm Harbor Academy (private school). Advisory Board Member, Fellowship of Christian Athletes. Mr. Harris is a certified public accountant (inactive status). | N/A |
David F. Larcker
(Born 1950) | Trustee,
since 2009 | James Irvin Miller Professor of Accounting at the Graduate School of Business (Emeritus), Stanford University, Director of the Corporate Governance Research Initiative and Senior Faculty of The Rock Center for Corporate Governance since 2006. From 2005 to 2008, Professor of Accounting at the Graduate School of Business, Stanford University. Prior thereto, Ernst & Young Professor of Accounting at The Wharton School, University of Pennsylvania from 1985 to 2005. | N/A |
Allspring Emerging Growth Fund | 41
Other information (unaudited)
Name and
year of birth | Position held and
length of service* | Principal occupations during past five years or longer | Current other
public company or
investment
company
directorships |
Olivia S. Mitchell
(Born 1953) | Trustee,
since 2006;
Nominating and
Governance
Committee Chair,
since 2018 | International Foundation of Employee Benefit Plans Professor since 1993, Wharton School of the University of Pennsylvania. Director of Wharton’s Pension Research Council and Boettner Center on Pensions & Retirement Research, and Research Associate at the National Bureau of Economic Research. Previously taught at Cornell University from 1978 to 1993. | N/A |
Timothy J. Penny
(Born 1951) | Trustee,
since 1996;
Chair,
since 2018 | President and Chief Executive Officer of Southern Minnesota Initiative Foundation, a non-profit organization, since 2007. Member of the Board of Trustees of NorthStar Education Finance, Inc., a non-profit organization, since 2007. | N/A |
James G. Polisson
(Born 1959) | Trustee,
since 2018 | Retired. Chief Marketing Officer, Source (ETF) UK Services, Ltd, from 2015 to 2017. From 2012 to 2015, Principal of The Polisson Group, LLC, a management consulting, corporate advisory and principal investing company. Chief Executive Officer and Managing Director at Russell Investments, Global Exchange Traded Funds from 2010 to 2012. Managing Director of Barclays Global Investors from 1998 to 2010 and Global Chief Marketing Officer for iShares and Barclays Global Investors from 2000 to 2010. Trustee of the San Francisco Mechanics’ Institute, a non-profit organization, from 2013 to 2015. Board member of the Russell Exchange Traded Fund Trust from 2011 to 2012. Director of Barclays Global Investors Holdings Deutschland GmbH from 2006 to 2009. Mr. Polisson is an attorney and has a retired status with the Massachusetts and District of Columbia Bar Associations. | N/A |
Pamela Wheelock
(Born 1959) | Trustee,
since January
2020; previously
Trustee from
January 2018 to
July 2019 | Board member of the Destination Medical Center Economic Development Agency, Rochester, Minnesota since 2019. Interim President of the McKnight Foundation from January to September 2020. McKnight Foundation Consultant, November 2020 to February 2021. Acting Commissioner, Minnesota Department of Human Services, July 2019 through September 2019. Consultant (part-time), Minnesota Department of Human Services, October 2019 through December 2019. Chief Operating Officer, Twin Cities Habitat for Humanity from 2017 to 2019. Vice President of University Services, University of Minnesota from 2012 to 2016. Prior thereto, on the Board of Directors, Governance Committee and Finance Committee for the Minnesota Philanthropy Partners (Saint Paul Foundation) from 2012 to 2018, Interim Chief Executive Officer of Blue Cross Blue Shield of Minnesota from 2011 to 2012, Chairman of the Board from 2009 to 2012 and Board Director from 2003 to 2015. Vice President, Leadership and Community Engagement, Bush Foundation, Saint Paul, Minnesota (a private foundation) from 2009 to 2011. Executive Vice President and Chief Financial Officer, Minnesota Sports and Entertainment from 2004 to 2009 and Senior Vice President from 2002 to 2004. Executive Vice President of the Minnesota Wild Foundation from 2004 to 2008. Commissioner of Finance, State of Minnesota, from 1999 to 2002. Currently Board Chair of the Minnesota Wild Foundation since 2010. | N/A |
* Length of service dates reflect the Trustee’s commencement of service with the Trust’s predecessor entities, where applicable.
42 | Allspring Emerging Growth Fund
Other information (unaudited)
Officers2
Name and
year of birth | Position held and
length of service | Principal occupations during past five years or longer |
Andrew Owen
(Born 1960) | President,
since 2017 | President, Chief Executive Officer and Director of Allspring Funds Management, LLC since 2017 and co-president of Galliard Capital Management, LLC, an affiliate of Allspring Funds Management, LLC, since 2019. Prior thereto, Head of Affiliated Managers, Allspring Global Investments, from 2014 to 2019 and Executive Vice President responsible for marketing, investments and product development for Allspring Funds Management, LLC, from 2009 to 2014. In addition, Mr. Owen was an Executive Vice President of Wells Fargo & Company from 2014 to 2021. |
Jeremy DePalma
(Born 1974) | Treasurer,
since 2012
(for certain funds in
the Fund Complex);
since 2021 (for
the remaining funds in the
Fund Complex) | Senior Vice President of Allspring Funds Management, LLC since 2009. Senior Vice President of Evergreen Investment Management Company, LLC from 2008 to 2010 and head of the Fund Reporting and Control Team within Fund Administration from 2005 to 2010. |
Kate McKinley
(Born 1977) | Chief Legal Officer,
since 2021 | Chief Legal Officer of Allspring Global Investments since 2021. Prior thereto, held various roles at State Street Global Advisors beginning in 2010, including serving as Senior Vice President and General Counsel from 2019 to 2021, and Chief Operating Officer of the Institutional Client Group from 2016 - 2019. Prior to working at State Street Global Advisors served as Assistant General Counsel for Bank of America Corporation from 2005 to 2010 and as an Associate at WilmerHale from 2002 to 2005. |
Christopher Baker
(Born 1976) | Chief Compliance Officer, since 2022 | Global Chief Compliance Officer for Allspring Global Investments since 2022. Prior thereto, Chief Compliance Officer for State Street Global Advisors from 2018 to 2021. Senior Compliance Officer for the State Street divisions of Alternative Investment Solutions, Sector Solutions, and Global Marketing from 2015 to 2018. From 2010 to 2015 Vice President, Global Head of Investment and Marketing Compliance for State Street Global Advisors. |
Matthew Prasse
(Born 1983) | Secretary,
since 2021 | Senior Counsel of the Allspring Legal Department since 2021. Senior Counsel of the Wells Fargo Legal Department from 2018 to 2021. Previously, Counsel for Barings LLC from 2015 to 2018. Prior to joining Barings, Associate at Morgan, Lewis & Bockius LLP from 2008 to 2015. |
1 The Statement of Additional Information includes additional information about the Trustees and is available, without charge, upon request, by calling 1-800-222-8222 or by visiting the website at allspringglobal.com.
2 For those Officers with tenures at Allspring Global Investments and/or Allspring Funds Management, LLC that began prior to 2021, such tenures include years of service during which these businesses/entities were known as Wells Fargo Asset Management and Wells Fargo Funds Management, LLC, respectively.
Allspring Emerging Growth Fund | 43
Other information (unaudited)
LIQUIDITY RISK MANAGEMENT PROGRAM
In accordance with Rule 22e-4 under the Investment Company Act of 1940, as amended (the “Liquidity Rule”), Allspring Funds Trust (“Funds Trust”) has adopted and implemented a liquidity risk management program (the “Program”) on behalf of each of its series (other than the series that operate as money market funds), including the Fund, and Allspring Master Trust (“Master Trust” and together with Funds Trust, the “Trusts”) has adopted and implemented the Program on behalf of each of its series, including the Portfolio, which is reasonably designed to assess and manage the Fund's and the Portfolio’s liquidity risk. “Liquidity risk” is defined under the Liquidity Rule as the risk that the Fund or Portfolio is unable to meet redemption requests without significantly diluting remaining investors’ interests in the Fund or Portfolio. The Trusts’ Boards of Trustees (the “Boards”) previously approved the designation of Allspring Funds Management, LLC (“Allspring Funds Management”), the Fund's investment manager and the Portfolio’s investment adviser, to administer the Program, and Allspring Funds Management has established a Liquidity Risk Management Council (the "Council") composed of personnel from multiple departments within Allspring Funds Management and its affiliates to assist Allspring Funds Management in the administration of the Program.
The Program is comprised of various components designed to support the assessment and/or management of liquidity risk, including: (1) the periodic assessment (no less frequently than annually) of certain factors that influence the Fund's and the Portfolio’s liquidity risk; (2) the periodic classification (no less frequently than monthly) of the Fund's and the Portfolio’s investments into one of four liquidity categories that reflect an estimate of their liquidity under current market conditions; (3) a 15% limit on the acquisition of “illiquid investments” (as defined under the Liquidity Rule); (4) to the extent the Fund or the Portfolio does not invest primarily in “highly liquid investments” (as defined under the Liquidity Rule), the determination of a minimum percentage of the Fund's or Portfolio’s assets that generally will be invested in highly liquid investments (an “HLIM”); (5) if the Fund or the Portfolio has established an HLIM, the periodic review (no less frequently than annually) of the HLIM and the adoption of policies and procedures for responding to a shortfall of the Fund's or the Portfolio’s “highly liquid investments” below its HLIM; and (6) periodic reporting to the Boards.
At a meeting of the Boards held on May 24-25, 2022, the Boards received and reviewed a written report (the “Report”) from Allspring Funds Management that, among other things, addressed the operation of the Program and assessed its adequacy and effectiveness for the period from January 1, 2021 through December 31, 2021 (the “Reporting Period”). Other than extended foreign market holidays, no significant liquidity events impacting the Funds or the Portfolios were noted in the Report. In addition, other than corporate-related changes to the Program, there were no material changes to the Program during the Reporting Period.
Allspring Funds Management determined in the Report that the Program has been implemented and operates effectively to manage each Fund’s and Portfolio’s, including the Fund’s and the Portfolio’s, liquidity risk, and Allspring Funds Management continues to believe that the Program has been and continues to be adequately and effectively implemented to monitor and, as applicable, respond to the Fund’s and the Portfolio’s liquidity developments.
There can be no assurance that the Program will achieve its objectives under all circumstances in the future. With respect to the Fund, please refer to the Fund’s prospectus for more information regarding the Fund’s exposure to liquidity risk and other risks to which an investment in the Fund may be subject.
44 | Allspring Emerging Growth Fund
For more information
More information about Allspring Funds is available free upon request. To obtain literature, please write, visit the Fund's website, or call:
Allspring Funds
P.O. Box 219967
Kansas City, MO 64121-9967
Website: allspringglobal.com
Individual investors: 1-800-222-8222
Retail investment professionals: 1-888-877-9275
Institutional investment professionals: 1-800-260-5969
This report and the financial statements contained herein are submitted for the general information of the shareholders of the Fund. If this report is used for promotional purposes, distribution of the report must be accompanied or preceded by a current prospectus. Before investing, please consider the investment objectives, risks, charges, and expenses of the investment. For a current prospectus and, if available, a summary prospectus, containing this information, call
1-800-222-8222 or visit the Fund's website at allspringglobal.com. Read the prospectus carefully before you invest or send money.
Allspring Global InvestmentsTM is the trade name for the asset management firms of Allspring Global Investments Holdings, LLC, a holding company indirectly owned by certain private funds of GTCR LLC and Reverence Capital Partners, L.P. These firms include but are not limited to Allspring Global Investments, LLC, and Allspring Funds Management, LLC. Certain products managed by Allspring entities are distributed by Allspring Funds Distributor, LLC (a broker-dealer and Member FINRA/SIPC).
This material is for general informational and educational purposes only and is NOT intended to provide investment advice or a recommendation of any kind - including a recommendation for any specific investment, strategy, or plan.
© 2022 Allspring Global Investments Holdings, LLC. All rights reserved.
PAR-0622-00186 07-22
A282/AR282 05-22
Annual Report
May 31, 2022
Allspring
Small Company Growth Fund
The views expressed and any forward-looking statements are as of May 31, 2022, unless otherwise noted, and are those of the Fund's portfolio managers and/or Allspring Global Investments. Discussions of individual securities or the markets generally are not intended as individual recommendations. Future events or results may vary significantly from those expressed in any forward-looking statements. The views expressed are subject to change at any time in response to changing circumstances in the market. Allspring Global Investments disclaims any obligation to publicly update or revise any views expressed or forward-looking statements.
Allspring Small Company Growth Fund | 1
Letter to shareholders (unaudited)
Andrew Owen
President
Allspring Funds
Dear Shareholder:
We are pleased to offer you this annual report for the Allspring Small Company Growth Fund for the 12-month period that ended May 31, 2022. Globally, stocks experienced rising volatility through the period, but overall, U.S. stocks outperformed non-U.S. equities as the global economy faced multiple challenges. Bonds also had poor performance during a difficult period, with major fixed income indexes all down for the 12-month period.
Earlier tailwinds provided by global stimulus programs, vaccination rollouts, and recovering consumer and corporate sentiment were more than offset by the highest rate of inflation in decades, concerns about sharp central bank rate hikes, more highly contagious COVID-19 variants, and the Russian invasion of Ukraine. The impact of already-significant supply chain disruptions were made worse by China’s COVID-19 lockdowns.
For the 12-month period, U.S. large-cap stocks led both non-U.S. developed market equities and emerging market stocks. Returns by fixed-income securities were negative as rising inflation created new challenges. For the period, U.S. stocks, based on the S&P 500 Index,1 lost 0.30%. International stocks, as measured by the MSCI ACWI ex USA Index (Net),2 returned -12.41%, while the MSCI EM Index (Net) (USD)3 had weaker performance with a loss of 19.83%. Among bond indexes, the Bloomberg U.S. Aggregate Bond Index4 returned -8.22%, the Bloomberg Global Aggregate ex-USD Index (unhedged)5 returned -16.68%, the Bloomberg Municipal Bond Index6 lost 6.79%, and the ICE BofA U.S. High Yield Index7 fell 5.00%.
Rising inflation, COVID, and the Russian invasion of Ukraine in February drove market performance.
The period began with the S&P 500 Index reaching an all-time high in June 2021. In late June, the U.S. Congress reached a deal on a $1 trillion infrastructure package for road, bridge, and broadband network upgrades over the next eight years. The U.S. Federal Reserve’s (Fed) June meeting yielded no change to policy, but it forecast a possible interest rate rise in 2023. This, combined with a rebound in economic activity and investors searching for yield, led to a decline in U.S. Treasury yields. Many European and Asian countries saw vaccination momentum increase, while COVID-19 infections rose in the U.K. Meanwhile, the price of crude oil jumped over 10% in June as global economic activity picked up and the Organization of the Petroleum Exporting Countries (OPEC) slowed the pace of supply growth.
| 1 | The S&P 500 Index consists of 500 stocks chosen for market size, liquidity, and industry group representation. It is a market-value-weighted index with each stock's weight in the index proportionate to its market value. You cannot invest directly in an index. |
| 2 | The Morgan Stanley Capital International (MSCI) All Country World Index (ACWI) ex USA Index (Net) is a free-float-adjusted market-capitalization-weighted index that is designed to measure the equity market performance of developed and emerging markets, excluding the U.S. Source: MSCI. MSCI makes no express or implied warranties or representations and shall have no liability whatsoever with respect to any MSCI data contained herein. The MSCI data may not be further redistributed or used as a basis for other indexes or any securities or financial products. This report is not approved, reviewed, or produced by MSCI. You cannot invest directly in an index. |
| 3 | The MSCI Emerging Markets (EM) Index (Net) (USD) is a free-float-adjusted market-capitalization-weighted index that is designed to measure equity market performance of emerging markets. You cannot invest directly in an index. |
| 4 | The Bloomberg U.S. Aggregate Bond Index is a broad-based benchmark that measures the investment-grade, U.S.-dollar-denominated, fixed-rate taxable bond market, including Treasuries, government-related and corporate securities, mortgage-backed securities (agency fixed-rate and hybrid adjustable-rate mortgage pass-throughs), asset-backed securities, and commercial mortgage-backed securities. You cannot invest directly in an index. |
| 5 | The Bloomberg Global Aggregate ex-USD Index (unhedged) is an unmanaged index that provides a broad-based measure of the global investment-grade fixed-income markets excluding the U.S.-dollar-denominated debt market. You cannot invest directly in an index. |
| 6 | The Bloomberg Municipal Bond Index is an unmanaged index composed of long-term tax-exempt bonds with a minimum credit rating of Baa. You cannot invest directly in an index. |
| 7 | The ICE BofA U.S. High Yield Index is a market-capitalization-weighted index of domestic and Yankee high-yield bonds. The index tracks the performance of high-yield securities traded in the U.S. bond market. You cannot invest directly in an index. Copyright 2022. ICE Data Indices, LLC. All rights reserved. |
2 | Allspring Small Company Growth Fund
Letter to shareholders (unaudited)
Inflation continued to climb in July, fueled by the ongoing supply bottleneck and high demand. Monthly U.S. equity gains led those of international developed markets. In contrast, emerging markets had losses for the month, hindered by China’s plans for new regulations, particularly in education and technology. The U.S. 10-year Treasury bond yield continued to decline as strong demand swallowed up supply. After hitting a multiyear high earlier in the month, oil prices leveled off as OPEC agreed to raise oil production.
The COVID-19 Delta variant produced outbreaks globally in August, feeding market volatility and casting doubts over the ongoing economic recovery. The U.S. economy remained strong despite the Delta variant, ongoing inflationary pressures, and worries over Hurricane Ida. Emerging market equities experienced elevated volatility, largely influenced by China’s regulatory stance. Municipal debt had its first monthly loss since February. Among commodities, crude oil fell sharply as the Delta variant caused expectations to dampen. However, oil remained a leading asset-class performer for the year.
Global markets suffered their broadest retreat in a year during September, except for commodities, as concerns over inflation and the interest rate outlook depressed investor confidence. Emerging markets declined on concerns over supply chain disruptions along with rising energy and food prices. Meanwhile, the Fed indicated it would soon start to slow the pace of asset purchases. U.S. concerns included a congressional showdown over the debt ceiling, the 2022 federal government budget, and the infrastructure package. Meanwhile, commodities thrived in September, driven by sharply higher energy prices.
Elevated inflation pressures and the global supply bottleneck continued in October, but strong earnings provided a bright spot in the U.S., the eurozone, and many Asian countries. Government bond yields rose globally as central banks prepared to tighten monetary policy. Commodity prices continued to rise, driven by sharply higher energy costs.
In November, as COVID-19 hospitalizations rose, most major global asset classes declined. Two exceptions were U.S. investment-grade bonds and Treasury Inflation-Protected Securities. President Biden signed a long-awaited infrastructure bill to upgrade U.S. roads, bridges, and railways. Meanwhile, the Consumer Price Index (CPI)1, a measure of domestic inflation conditions, jumped to its highest level in 31 years. While the threat of consistently high inflation led the Fed to discuss a faster pace of tapering, the Omicron strain created uncertainty. Commodities lost ground for the month, driven by sharp declines in oil prices (and energy costs in general) as well as precious metals.
Global volatility lessened in December as data indicated a lower risk of severe disease and death from the Omicron variant. Even so, several countries introduced restrictions on travel and hospitality, among other sectors, in an effort to reduce the spread. In the U.S., data indicated a stable economy overall, with robust corporate earnings. Consumer spending potential looked strong heading into 2022 on elevated household savings and the lowest household debt ratio since 1973. U.S. corporate and high-yield bonds had monthly gains while Treasuries declined. Bonds were strongly affected by the projection of multiple rate hikes in 2022 by senior Federal Open Market Committee members.
In January 2022, the main focus was on potential U.S. interest rate hikes and the Russia-Ukraine conflict. The Fed hinted that a March interest rate hike was likely. Meanwhile, Russia threatened a potential invasion of Ukraine, which could disrupt Russia’s massive energy supplies and drive demand from non-Russian oil-producing countries. Elsewhere overseas, Europe saw food and energy prices spike, leading to rising inflation. Within fixed income, corporate bonds struggled in January, underperforming government bonds, as investors focused on continued elevated inflation and ongoing uncertainty over the U.S. monetary path.
“ Global markets suffered their broadest retreat in a year during September, except for commodities, as concerns over inflation and the interest rate outlook depressed investor confidence.”
| 1 | The Consumer Price Index (CPI) is a measure of the average change over time in the prices paid by urban consumers for a market basket of consumer goods and services. You cannot invest directly in an index. |
Allspring Small Company Growth Fund | 3
Letter to shareholders (unaudited)
“ The Russian invasion of Ukraine dominated the financial world in February and March. Equity, bond, and commodity markets were shaken by fear, uncertainty, and an upending of demand-supply dynamics.” |
The Russian invasion of Ukraine dominated the financial world in February and March. Equity, bond, and commodity markets were shaken by fear, uncertainty, and an upending of demand-supply dynamics. Major global stock indexes were down in February, along with global bonds overall, with ongoing high levels of volatility in March along with mixed results that favored U.S. large-cap stocks. Prices of commodities spiked, including crude oil, natural gas, wheat, and precious metals, on elevated concerns of supply shortages. All of this fed already-high inflation concerns and added to expectations of more aggressive central bank interest rate hikes. Sweeping sanctions against Russia and corporate pullouts contributed to market volatility. Despite the geopolitical turmoil, the U.S. economic outlook remained largely unchanged, with a healthy job market and signs of economic resilience accompanying higher prices.
In April, market volatility continued, with deepening losses across major capital markets, as both the S&P 500 and MSCI ACWI (Net)1 fell 8% or more for the month. The Chinese economy struggled through a strict lockdown as the government tried to contain a major COVID-19 outbreak, creating a global ripple effect that compounded existing supply shortages. This was exacerbated by the impact of the Russia-Ukraine war on global commodities. Meanwhile, U.S. annual inflation raged at 8.5%, its highest level since 1981, and investors braced themselves for aggressive Fed monetary tightening moves.
Market volatility continued in May, but full-month returns belied that as markets recovered ground late in the month. Value stocks continued to outperform growth stocks. The concerns that had dominated markets for months continued, including high inflation (the CPI remained above 8%) and geopolitical tensions that exacerbated high crude oil, gasoline, and food prices. In response, the Fed raised the federal funds rate by 0.50%, with broad expectations of multiple rate hikes to come. Meanwhile, highly contagious COVID-19 variants persisted. However, labor markets in the U.S., the U.K., and Europe remained strong. The U.S. recorded a 3.6% unemployment rate, although labor market participation remained low. U.S. retail sales increased for the fourth consecutive month in April, indicating continued consumer resilience.
Don’t let short-term uncertainty derail long-term investment goals.
Periods of investment uncertainty can present challenges, but experience has taught us that maintaining long-term investment goals can be an effective way to plan for the future. To help you create a sound strategy based on your personal goals and risk tolerance, Allspring Funds offers more than 100 mutual funds spanning a wide range of asset classes and investment styles. Although diversification cannot guarantee an investment profit or prevent losses, we believe it can be an effective way to manage investment risk and potentially smooth out overall portfolio performance. We encourage investors to know their investments and to understand that appropriate levels of risk-taking may unlock opportunities.
Thank you for choosing to invest with Allspring Funds. We appreciate your confidence in us and remain committed to helping you meet your financial needs.
Sincerely,
Andrew Owen
President
Allspring Funds
For further information about your fund, contact your investment professional, visit our website at allspringglobal.com, or call us directly at 1-800-222-8222.
| 1 | The MSCI ACWI (Net) is a free-float-adjusted market-capitalization-weighted index that is designed to measure the equity market performance of developed and emerging markets. You cannot invest directly in an index. |
4 | Allspring Small Company Growth Fund
Letter to shareholders (unaudited)
Notice to Shareholders
Russia launched a large-scale invasion of Ukraine on February 24, 2022. As a result of this military action, the United States and many other countries have instituted various economic sanctions against Russian and Belarus individuals and entities. The situation has led to increased financial market volatility and has had severe adverse effects on regional and global economic markets, including the markets for certain securities and commodities, such as oil and natural gas. The extent and duration of the military action, resulting sanctions imposed, other punitive action taken and the resulting market disruptions cannot be easily predicted.
Our solidarity and support goes out to our impacted employees and the people affected in Ukraine and their families. Allspring has a dedicated team of investment professionals actively monitoring the situation for any new developments and the potential impact to our clients and investment products. As the situation remains fluid, we are focused on the assessment of risks, valuation, and liquidity of impacted securities. Please visit our website at allspringglobal.com and click on “Russia-Ukraine Updates” for further information.
Allspring Small Company Growth Fund | 5
Performance highlights (unaudited)
Investment objectiveThe Fund seeks long-term capital appreciation.
| Manager | Allspring Funds Management, LLC |
Subadviser for the affiliated master portfolio*
Peregrine Capital Management, LLC
| Portfolio managers | William A. Grierson, CFA®‡, Daniel J. Hagen, CFA®‡, Paul E. von Kuster, CFA®‡, Ryan H. Smith, CFA®‡, Samuel D. Smith, CFA®‡ |
| Average annual total returns (%) as of May 31, 2022 |
| | | Including sales charge | | Excluding sales charge | | Expense ratios1 (%) |
| | Inception date | 1 year | 5 year | 10 year | | 1 year | 5 year | 10 year | | Gross | Net 2 |
| Class A (WFSAX) | 1-30-2004 | -21.39 | 8.55 | 11.07 | | -16.59 | 9.84 | 11.73 | | 1.34 | 1.29 |
| Class C (WSMCX) | 1-30-2004 | -18.25 | 9.04 | 11.06 | | -17.25 | 9.04 | 11.06 | | 2.09 | 2.04 |
| Class R6 (WSCRX)3 | 10-31-2014 | – | – | – | | -16.24 | 10.32 | 12.23 | | 0.91 | 0.86 |
| Administrator Class (NVSCX) | 11-11-1994 | – | – | – | | -16.52 | 9.96 | 11.90 | | 1.26 | 1.19 |
| Institutional Class (WSCGX) | 3-31-2008 | – | – | – | | -16.31 | 10.24 | 12.17 | | 1.01 | 0.94 |
| Russell 2000® Growth Index4 | – | – | – | – | | -25.71 | 6.87 | 10.55 | | – | – |
Figures quoted represent past performance, which is no guarantee of future results, and do not reflect taxes that a shareholder may pay on an investment in a fund. Investment return and principal value of an investment will fluctuate so that an investor’s shares, when redeemed, may be worth more or less than their original cost. Performance shown without sales charges would be lower if sales charges were reflected. Current performance may be lower or higher than the performance data quoted, which assumes the reinvestment of dividends and capital gains. Current month-end performance is available on the Fund’s website, allspringglobal.com.
Index returns do not include transaction costs associated with buying and selling securities, any mutual fund fees or expenses, or any taxes. It is not possible to invest directly in an index.
For Class A shares, the maximum front-end sales charge is 5.75%. For Class C shares, the maximum contingent deferred sales charge is 1.00%. Performance including a contingent deferred sales charge assumes the sales charge for the corresponding time period. Class R6, Administrator Class and Institutional Class shares are sold without a front-end sales charge or contingent deferred sales charge.
| 1 | Reflects the expense ratios as stated in the most recent prospectuses, which include the impact of 0.01% in acquired fund fees and expenses. The expense ratios shown are subject to change and may differ from the annualized expense ratios shown in the financial highlights of this report, which do not include acquired fund fees and expenses. |
| 2 | The manager has contractually committed through September 30, 2022, to waive fees and/or reimburse expenses to the extent necessary to cap total annual fund operating expenses after fee waivers at 1.29% for Class A, 2.04% for Class C, 0.86% for Class R6, 1.19% for Administrator Class, and 0.94% for Institutional Class. Brokerage commissions, stamp duty fees, interest, taxes, acquired fund fees and expenses (if any) from funds in which the affiliated master portfolio invests, and extraordinary expenses are excluded from the expense caps. Net expenses from the affiliated master portfolio are included in the expense caps. Prior to or after the commitment expiration date, the caps may be increased or the commitment to maintain the caps may be terminated only with the approval of the Board of Trustees. Without these caps, the Fund’s returns would have been lower. The expense ratio paid by an investor is the net expense ratio (the total annual fund operating expenses after fee waivers) as stated in the prospectuses. |
| 3 | Historical performance shown for the Class R6 shares prior to their inception reflects the performance of the Institutional Class shares, and includes the higher expenses applicable to the Institutional Class shares. If these expenses had not been included, returns for the Class R6 shares would be higher. |
| 4 | The Russell 2000® Growth Index measures the performance of those Russell 2000 companies with higher price/book ratios and higher forecasted growth values. You cannot invest directly in an index. |
Stock values fluctuate in response to the activities of individual companies and general market and economic conditions. Smaller-company stocks tend to be more volatile and less liquid than those of larger companies. Certain investment strategies tend to increase the total risk of an investment (relative to the broader market). This fund is exposed to foreign investment risk. Consult the Fund’s prospectus for additional information on these and other risks.
| * | The Fund is a feeder fund in a master-feeder structure that invests substantially all of its assets in a single affiliated master portfolio of the Allspring Master Trust with a substantially identical investment objective and substantially similar investment strategies. References to the investment activities of the Fund are intended to refer to the investment activities of the affiliated master portfolio in which it invests. |
| ‡ | CFA® and Chartered Financial Analyst® are trademarks owned by CFA Institute. |
6 | Allspring Small Company Growth Fund
Performance highlights (unaudited)
Growth of $10,000 investment as of May 31, 20221
| 1 | The chart compares the performance of Class A shares for the most recent ten years with the Russell 2000® Growth Index. The chart assumes a hypothetical investment of $10,000 in Class A shares and reflects all operating expenses and assumes the maximum initial sales charge of 5.75%. |
Allspring Small Company Growth Fund | 7
Performance highlights (unaudited)
MANAGER'S DISCUSSION
Fund highlights
| ■ | The Fund outperformed its benchmark, the Russell 2000® Growth Index, for the 12-month period that ended May 31, 2022. |
| ■ | Stock selection in the health care and information technology (IT) sectors were the largest contributors to performance in the period. |
| ■ | An underweight position to the energy sector along with adverse stock selection within the consumer discretionary sector were the largest detractors from performance. |
Early optimism subsided in a challenging period.
Investor optimism surrounding the reopening of the economy early in the fiscal year quickly subsided. Rising COVID-19 infections, a rapid increase in inflation, continued supply chain bottlenecks, and the onset of the war in Ukraine led to increased market volatility and growing fears that the economy is heading toward recession. As the global economy reopened, significant pent-up demand for goods and services put immense pressure on global supply chains, logistics networks, and labor forces to keep up. The global spike in the Delta and Omicron COVID-19 variants, coupled with the war in Ukraine, only put further stress on worldwide supply chains and commodity costs. This helped drive inflation to historically high levels and has forced the U.S. Federal Reserve (Fed) to pivot to a much more hawkish stance despite early signs of a slowing economy.
| Ten largest holdings (%) as of May 31, 20221 |
| ICON plc ADR | 2.07 |
| Syneos Health Incorporated | 1.56 |
| PTC Incorporated | 1.52 |
| Avantor Incorporated | 1.51 |
| Element Solutions Incorporated | 1.47 |
| Ciena Corporation | 1.43 |
| SS&C Technologies Holdings Incorporated | 1.38 |
| Black Knight Incorporated | 1.36 |
| KBR Incorporated | 1.33 |
| ASGN Incorporated | 1.31 |
| 1 | Each holding represents the Fund’s allocable portion of the affiliated master portfolio security. Figures represent each holding as a percentage of the Fund’s net assets. Holdings are subject to change and may have changed since the date specified. |
The Fund was overweight industrials and financials and underweight consumer discretionary and energy.
The Fund remained consistent with its long-term discipline of investing in rapidly growing companies purchased at attractive valuations. Relative to the benchmark, the Fund’s largest overweight positions were in the industrials and
financials sectors where valuations remain attractive. Conversely, the Fund was most underweight the consumer discretionary and energy sectors.
Health care and IT were leading contributors.
Health care and IT were the top-contributing sectors for the fiscal year. Strong performance in the health care sector was broad-based, with favorable stock selection across life sciences and tools, biotechnology, health care technology, and health care provider holdings. Notable stock contributors included ICON plc, a contract research organization; Evolent Health Inc., a provider of value-based care solutions; and Avantor, Inc., which provides consumables and equipment primarily to biopharma end markets. Outperformance in the IT sector was primarily driven by strong performance across the Fund’s software and semiconductor holdings. Within software, strength was driven by cybersecurity company CyberArk Software Ltd. and content management software provider Box, Inc., while Silicon Motion Technology Corp. and Onto Innovation Inc. drove the outperformance in semiconductors.
| Sector allocation as of May 31, 20221 |
| 1 | Figures represent the sector allocation of the affiliated master portfolio as a percentage of the long-term investments of the affiliated master portfolio. These amounts are subject to change and may have changed since the date specified. |
8 | Allspring Small Company Growth Fund
Performance highlights (unaudited)
An underweight to energy was the key detractor.
With the rapid rise in oil prices during the period, energy stocks within the benchmark returned more than 60%, materially outpacing the overall return of the benchmark by more than 85 percentage points. The Fund’s underweight position to this significantly outperforming sector was the largest detractor from performance during the period. In addition, consumer discretionary was a modest detractor from performance as unfavorable stock selection offset the Fund’s underweight to this underperforming sector. Supply-chain headwinds and slowing consumer consumption hurt specialty retailers American Eagle Outfitters, Inc.; Sleep Number Corp.*; and Burlington Stores, Inc.
After a rough year, small-cap growth stocks are trading at more reasonable valuations.
The ever-growing list of macroeconomic factors, geopolitical unrest, ongoing supply-chain headwinds, and uncertainties
surrounding future Fed actions weighed on small-cap growth stocks this fiscal year. While different in substance, the magnitude of these fears is similar to those experienced in many markets over the Fund’s history. Volatile markets that dislocate stock prices from underlying fundamentals has routinely acted as the catalysts for significant information gaps—the cornerstone of the Fund’s process. While forward visibility remains poor, with the sharp market drawdown, many small-cap companies with strong long-term growth profiles are now trading at more reasonable valuation levels. We have used and will continue to employ our longstanding process to invest in these types of opportunities that we find attractive. Our expectation is that the current market environment will continue to present us with many opportunities to sow the seeds that yield long-term outperformance for the Fund.
| * | This security was no longer held at the end of the reporting period. |
Allspring Small Company Growth Fund | 9
Fund expenses (unaudited)
As a shareholder of the Fund, you incur two types of costs: (1) transaction costs, including sales charges (loads) on purchase payments and contingent deferred sales charges (if any) on redemptions and (2) ongoing costs, including management fees, distribution (12b-1) and/or shareholder servicing fees, and other Fund expenses. This example is intended to help you understand your ongoing costs (in dollars) of investing in the Fund and to compare these costs with the ongoing costs of investing in other mutual funds.
The example is based on an investment of $1,000 invested at the beginning of the six-month period and held for the entire period from December 1, 2021 to May 31, 2022.
Actual expenses
The “Actual” line of the table below provides information about actual account values and actual expenses. You may use the information in this line, together with the amount you invested, to estimate the expenses that you paid over the period. Simply divide your account value by $1,000 (for example, an $8,600 account value divided by $1,000 = 8.6), then multiply the result by the number in the “Actual” line under the heading entitled “Expenses paid during period” for your applicable class of shares to estimate the expenses you paid on your account during this period.
Hypothetical example for comparison purposes
The “Hypothetical” line of the table below provides information about hypothetical account values and hypothetical expenses based on the Fund’s actual expense ratio and an assumed rate of return of 5% per year before expenses, which is not the Fund’s actual return. The hypothetical account values and expenses may not be used to estimate the actual ending account balance or expenses you paid for the period. You may use this information to compare the ongoing costs of investing in the Fund and other funds. To do so, compare this 5% hypothetical example with the 5% hypothetical examples that appear in the shareholder reports of the other funds.
Please note that the expenses shown in the table are meant to highlight your ongoing costs only and do not reflect any transactional costs, such as sales charges (loads) and contingent deferred sales charges. Therefore, the “Hypothetical” line of the table is useful in comparing ongoing costs only, and will not help you determine the relative total costs of owning different funds. In addition, if these transactional costs were included, your costs would have been higher.
| | Beginning
account value
12-1-2021 | Ending
account value
5-31-2022 | Expenses
paid during
the period1,2 | Annualized net
expense ratio2 |
| Class A | | | | |
| Actual | $1,000.00 | $ 830.97 | $ 5.89 | 1.29% |
| Hypothetical (5% return before expenses) | $1,000.00 | $1,018.50 | $ 6.49 | 1.29% |
| Class C | | | | |
| Actual | $1,000.00 | $ 827.50 | $ 9.29 | 2.04% |
| Hypothetical (5% return before expenses) | $1,000.00 | $1,014.76 | $10.25 | 2.04% |
| Class R6 | | | | |
| Actual | $1,000.00 | $ 832.72 | $ 3.93 | 0.86% |
| Hypothetical (5% return before expenses) | $1,000.00 | $1,020.64 | $ 4.33 | 0.86% |
| Administrator Class | | | | |
| Actual | $1,000.00 | $ 831.31 | $ 5.43 | 1.19% |
| Hypothetical (5% return before expenses) | $1,000.00 | $1,019.00 | $ 5.99 | 1.19% |
| Institutional Class | | | | |
| Actual | $1,000.00 | $ 832.32 | $ 4.29 | 0.94% |
| Hypothetical (5% return before expenses) | $1,000.00 | $1,020.24 | $ 4.73 | 0.94% |
1 Expenses paid is equal to the annualized net expense ratio of each class multiplied by the average account value over the period, multiplied by 182 divided by 366 (to reflect the one-half-year period).
2 Amounts reflect net expenses allocated from the affiliated Master Portfolio in which the Fund invests.
10 | Allspring Small Company Growth Fund
Portfolio of investments—May 31, 2022
| | | | | | Value |
| Investment companies: 99.80% | | | | | |
| Affiliated master portfolio: 99.80% | | | | | |
| Allspring Small Company Growth Portfolio | | | | | $ 809,122,955 |
| Total Investment companies (Cost $659,000,760) | | | | | 809,122,955 |
| Total investments in securities (Cost $659,000,760) | 99.80% | | | | 809,122,955 |
| Other assets and liabilities, net | 0.20 | | | | 1,634,685 |
| Total net assets | 100.00% | | | | $810,757,640 |
Transactions with the affiliated Master Portfolio were as follows:
| | % of
ownership,
beginning
of period | % of
ownership,
end of
period | Net realized
gains
(losses) on
securities
transactions
allocated
from
affiliated
Master
Portfolio | Net
change in
unrealized
gains
(losses) on
securities
transactions
allocated
from
affiliated
Master
Portfolio | Dividends
allocated
from
affiliated
Master
Portfolio | Affiliated
income
allocated
from
affiliated
Master
Portfolio | Value,
end of
period | |
| Allspring Small Company Growth Portfolio | 97.88% | 97.57% | $234,292,155 | $(380,610,924) | $3,852,675 | $100,297 | $809,122,955 | |
The accompanying notes are an integral part of these financial statements.
Allspring Small Company Growth Fund | 11
Statement of assets and liabilities—May 31, 2022
| | |
| Assets | |
Investments in affiliated Master Portfolio, at value (cost $659,000,760)
| $ 809,122,955 |
Receivable for Fund shares sold
| 2,620,547 |
Receivable from manager
| 22,490 |
Total assets
| 811,765,992 |
| Liabilities | |
Payable for Fund shares redeemed
| 833,453 |
Administration fees payable
| 71,415 |
Distribution fee payable
| 3,776 |
Trustees’ fees and expenses payable
| 3,198 |
Accrued expenses and other liabilities
| 96,510 |
Total liabilities
| 1,008,352 |
Total net assets
| $810,757,640 |
| Net assets consist of | |
Paid-in capital
| $ 631,296,415 |
Total distributable earnings
| 179,461,225 |
Total net assets
| $810,757,640 |
| Computation of net asset value and offering price per share | |
Net assets – Class A
| $ 41,794,594 |
Shares outstanding – Class A1
| 1,351,458 |
Net asset value per share – Class A
| $30.93 |
Maximum offering price per share – Class A2
| $32.82 |
Net assets – Class C
| $ 6,018,478 |
Shares outstanding – Class C1
| 277,690 |
Net asset value per share – Class C
| $21.67 |
Net assets – Class R6
| $ 225,464,491 |
Shares outstanding – Class R61
| 6,167,903 |
Net asset value per share – Class R6
| $36.55 |
Net assets – Administrator Class
| $ 42,317,021 |
Shares outstanding – Administrator Class1
| 1,247,592 |
Net asset value per share – Administrator Class
| $33.92 |
Net assets – Institutional Class
| $ 495,163,056 |
Shares outstanding – Institutional Class1
| 13,663,641 |
Net asset value per share – Institutional Class
| $36.24 |
| 1 | The Fund has an unlimited number of authorized shares. |
| 2 | Maximum offering price is computed as 100/94.25 of net asset value. On investments of $50,000 or more, the offering price is reduced. |
The accompanying notes are an integral part of these financial statements.
12 | Allspring Small Company Growth Fund
Statement of operations—year ended May 31, 2022
| | |
| Investment income | |
Dividends allocated from affiliated Master Portfolio (net of foreign withholding taxes of $2,515)
| $ 3,852,675 |
Affiliated income allocated from affiliated Master Portfolio
| 100,297 |
Expenses allocated from affiliated Master Portfolio
| (8,102,210) |
Total investment income
| (4,149,238) |
| Expenses | |
Management fee
| 501,349 |
| Administration fees | |
Class A
| 97,971 |
Class C
| 16,747 |
Class R6
| 88,258 |
Administrator Class
| 71,567 |
Institutional Class
| 778,475 |
| Shareholder servicing fees | |
Class A
| 116,596 |
Class C
| 19,855 |
Administrator Class
| 137,535 |
| Distribution fee | |
Class C
| 59,250 |
Custody and accounting fees
| 28,983 |
Professional fees
| 39,591 |
Registration fees
| 25,708 |
Shareholder report expenses
| 81,302 |
Trustees’ fees and expenses
| 20,686 |
Other fees and expenses
| 11,365 |
Total expenses
| 2,095,238 |
| Less: Fee waivers and/or expense reimbursements | |
Fund-level
| (488,223) |
Class A
| (724) |
Administrator Class
| (11,010) |
Institutional Class
| (119,765) |
Net expenses
| 1,475,516 |
Net investment loss
| (5,624,754) |
| Realized and unrealized gains (losses) on investments | |
Net realized gains on securities transactions allocated from affiliated Master Portfolio
| 234,292,155 |
Net change in unrealized gains (losses) on securities transactions allocated from affiliated Master Portfolio
| (380,610,924) |
Net realized and unrealized gains (losses) on investments
| (146,318,769) |
Net decrease in net assets resulting from operations
| $(151,943,523) |
The accompanying notes are an integral part of these financial statements.
Allspring Small Company Growth Fund | 13
Statement of changes in net assets
| | | | | |
| | Year ended
May 31, 2022 | Year ended
May 31, 2021 |
| Operations | | | | |
Net investment loss
| | $ (5,624,754) | | $ (6,950,209) |
Net realized gains on investments
| | 234,292,155 | | 376,204,644 |
Net change in unrealized gains (losses) on investments
| | (380,610,924) | | 243,393,279 |
Net increase (decrease) in net assets resulting from operations
| | (151,943,523) | | 612,647,714 |
| Distributions to shareholders from | | | | |
| Net investment income and net realized gains | | | | |
Class A
| | (25,935,297) | | (5,976,918) |
Class C
| | (5,561,323) | | (1,628,455) |
Class R6
| | (100,466,883) | | (56,097,914) |
Administrator Class
| | (21,521,432) | | (8,234,181) |
Institutional Class
| | (248,029,970) | | (121,915,798) |
Total distributions to shareholders
| | (401,514,905) | | (193,853,266) |
| Capital share transactions | Shares | | Shares | |
| Proceeds from shares sold | | | | |
Class A
| 600,158 | 33,843,292 | 191,250 | 10,831,002 |
Class C
| 89,397 | 4,393,866 | 11,378 | 530,387 |
Class R6
| 837,876 | 41,916,286 | 1,135,839 | 70,387,361 |
Administrator Class
| 132,770 | 6,666,051 | 140,592 | 8,368,325 |
Institutional Class
| 8,331,378 | 426,789,587 | 2,938,525 | 180,832,983 |
| | | 513,609,082 | | 270,950,058 |
| Reinvestment of distributions | | | | |
Class A
| 643,072 | 23,980,172 | 99,100 | 5,314,718 |
Class C
| 206,792 | 5,422,079 | 34,708 | 1,539,630 |
Class R6
| 2,119,772 | 93,248,751 | 860,364 | 50,924,923 |
Administrator Class
| 525,535 | 21,483,861 | 144,949 | 8,217,170 |
Institutional Class
| 3,043,545 | 132,759,448 | 1,402,732 | 82,663,012 |
| | | 276,894,311 | | 148,659,453 |
| Payment for shares redeemed | | | | |
Class A
| (611,917) | (25,389,359) | (353,897) | (19,407,294) |
Class C
| (200,817) | (6,158,661) | (98,121) | (4,589,705) |
Class R6
| (2,783,941) | (175,259,458) | (5,125,700) | (309,662,461) |
Administrator Class
| (366,235) | (17,779,520) | (474,181) | (27,971,851) |
Institutional Class
| (9,833,729) | (544,346,151) | (7,943,243) | (491,545,106) |
| | | (768,933,149) | | (853,176,417) |
Net increase (decrease) in net assets resulting from capital share transactions
| | 21,570,244 | | (433,566,906) |
Total decrease in net assets
| | (531,888,184) | | (14,772,458) |
| Net assets | | | | |
Beginning of period
| | 1,342,645,824 | | 1,357,418,282 |
End of period
| | $ 810,757,640 | | $1,342,645,824 |
The accompanying notes are an integral part of these financial statements.
14 | Allspring Small Company Growth Fund
Financial highlights
(For a share outstanding throughout each period)
| | Year ended May 31 |
| Class A | 2022 | 2021 | 2020 | 2019 | 2018 |
Net asset value, beginning of period
| $61.44 | $46.62 | $48.98 | $56.66 | $44.26 |
Net investment loss
| (0.47) 1 | (0.47) 1 | (0.34) 1 | (0.36) | (0.35) 1 |
Net realized and unrealized gains (losses) on investments
| (5.55) | 24.27 | 2.49 | (3.22) | 12.75 |
Total from investment operations
| (6.02) | 23.80 | 2.15 | (3.58) | 12.40 |
| Distributions to shareholders from | | | | | |
Net realized gains
| (24.49) | (8.98) | (4.51) | (4.10) | 0.00 |
Net asset value, end of period
| $30.93 | $61.44 | $46.62 | $48.98 | $56.66 |
Total return2
| (16.59)% | 53.84% | 3.70% | (6.13)% | 28.02% |
| Ratios to average net assets (annualized)* | | | | | |
Gross expenses
| 1.34% | 1.33% | 1.32% | 1.31% | 1.32% |
Net expenses
| 1.29% | 1.29% | 1.32% | 1.31% | 1.32% |
Net investment loss
| (1.04)% | (0.85)% | (0.69)% | (0.63)% | (0.71)% |
| Supplemental data | | | | | |
Portfolio turnover rate3
| 61% | 44% | 41% | 54% | 37% |
Net assets, end of period (000s omitted)
| $41,795 | $44,249 | $36,534 | $64,182 | $76,065 |
| * | Ratios include net expenses allocated from the affiliated Master Portfolio which were as follows: |
| Year ended May 31, 2022 | 0.81% |
| Year ended May 31, 2021 | 0.79% |
| Year ended May 31, 2020 | 0.78% |
| Year ended May 31, 2019 | 0.78% |
| Year ended May 31, 2018 | 0.78% |
| 1 | Calculated based upon average shares outstanding |
| 2 | Total return calculations do not include any sales charges. |
| 3 | Portfolio turnover rate is calculated by multiplying the affiliated Master Portfolio’s percentage of the Fund’s total investment in securities at the end of the period by the affiliated Master Portfolio’s portfolio turnover rate. |
The accompanying notes are an integral part of these financial statements.
Allspring Small Company Growth Fund | 15
Financial highlights
(For a share outstanding throughout each period)
| | Year ended May 31 |
| Class C | 2022 | 2021 | 2020 | 2019 | 2018 |
Net asset value, beginning of period
| $50.65 | $39.84 | $42.75 | $50.38 | $39.65 |
Net investment loss
| (0.60) 1 | (0.75) 1 | (0.61) 1 | (0.66) 1 | (0.64) 1 |
Net realized and unrealized gains (losses) on investments
| (3.89) | 20.54 | 2.21 | (2.87) | 11.37 |
Total from investment operations
| (4.49) | 19.79 | 1.60 | (3.53) | 10.73 |
| Distributions to shareholders from | | | | | |
Net realized gains
| (24.49) | (8.98) | (4.51) | (4.10) | 0.00 |
Net asset value, end of period
| $21.67 | $50.65 | $39.84 | $42.75 | $50.38 |
Total return2
| (17.25)% | 52.86% | 2.92% | (6.82)% | 27.06% |
| Ratios to average net assets (annualized)* | | | | | |
Gross expenses
| 2.08% | 2.08% | 2.07% | 2.06% | 2.07% |
Net expenses
| 2.04% | 2.04% | 2.07% | 2.06% | 2.07% |
Net investment loss
| (1.71)% | (1.60)% | (1.44)% | (1.38)% | (1.47)% |
| Supplemental data | | | | | |
Portfolio turnover rate3
| 61% | 44% | 41% | 54% | 37% |
Net assets, end of period (000s omitted)
| $6,018 | $9,235 | $9,336 | $13,968 | $19,979 |
| * | Ratios include net expenses allocated from the affiliated Master Portfolio which were as follows: |
| Year ended May 31, 2022 | 0.81% |
| Year ended May 31, 2021 | 0.79% |
| Year ended May 31, 2020 | 0.78% |
| Year ended May 31, 2019 | 0.78% |
| Year ended May 31, 2018 | 0.78% |
| 1 | Calculated based upon average shares outstanding |
| 2 | Total return calculations do not include any sales charges. |
| 3 | Portfolio turnover rate is calculated by multiplying the affiliated Master Portfolio’s percentage of the Fund’s total investment in securities at the end of the period by the affiliated Master Portfolio’s portfolio turnover rate. |
The accompanying notes are an integral part of these financial statements.
16 | Allspring Small Company Growth Fund
Financial highlights
(For a share outstanding throughout each period)
| | Year ended May 31 |
| Class R6 | 2022 | 2021 | 2020 | 2019 | 2018 |
Net asset value, beginning of period
| $67.95 | $50.64 | $52.65 | $60.31 | $46.91 |
Net investment loss
| (0.26) 1 | (0.17) | (0.14) 1 | (0.12) | (0.14) |
Net realized and unrealized gains (losses) on investments
| (6.65) | 26.46 | 2.64 | (3.44) | 13.54 |
Total from investment operations
| (6.91) | 26.29 | 2.50 | (3.56) | 13.40 |
| Distributions to shareholders from | | | | | |
Net realized gains
| (24.49) | (8.98) | (4.51) | (4.10) | 0.00 |
Net asset value, end of period
| $36.55 | $67.95 | $50.64 | $52.65 | $60.31 |
Total return
| (16.24)% | 54.53% | 4.12% | (5.73)% | 28.59% |
| Ratios to average net assets (annualized)* | | | | | |
Gross expenses
| 0.91% | 0.90% | 0.90% | 0.88% | 0.89% |
Net expenses
| 0.86% | 0.86% | 0.89% | 0.88% | 0.89% |
Net investment loss
| (0.48)% | (0.41)% | (0.27)% | (0.20)% | (0.29)% |
| Supplemental data | | | | | |
Portfolio turnover rate2
| 61% | 44% | 41% | 54% | 37% |
Net assets, end of period (000s omitted)
| $225,464 | $407,311 | $462,050 | $564,516 | $618,523 |
| * | Ratios include net expenses allocated from the affiliated Master Portfolio which were as follows: |
| Year ended May 31, 2022 | 0.81% |
| Year ended May 31, 2021 | 0.79% |
| Year ended May 31, 2020 | 0.78% |
| Year ended May 31, 2019 | 0.78% |
| Year ended May 31, 2018 | 0.78% |
| 1 | Calculated based upon average shares outstanding |
| 2 | Portfolio turnover rate is calculated by multiplying the affiliated Master Portfolio’s percentage of the Fund’s total investment in securities at the end of the period by the affiliated Master Portfolio’s portfolio turnover rate. |
The accompanying notes are an integral part of these financial statements.
Allspring Small Company Growth Fund | 17
Financial highlights
(For a share outstanding throughout each period)
| | Year ended May 31 |
| Administrator Class | 2022 | 2021 | 2020 | 2019 | 2018 |
Net asset value, beginning of period
| $64.98 | $48.87 | $51.10 | $58.85 | $45.91 |
Net investment loss
| (0.47) 1 | (0.44) 1 | (0.29) 1 | (0.29) 1 | (0.30) 1 |
Net realized and unrealized gains (losses) on investments
| (6.10) | 25.53 | 2.57 | (3.36) | 13.24 |
Total from investment operations
| (6.57) | 25.09 | 2.28 | (3.65) | 12.94 |
| Distributions to shareholders from | | | | | |
Net realized gains
| (24.49) | (8.98) | (4.51) | (4.10) | 0.00 |
Net asset value, end of period
| $33.92 | $64.98 | $48.87 | $51.10 | $58.85 |
Total return
| (16.52)% | 54.02% | 3.80% | (6.02)% | 28.19% |
| Ratios to average net assets (annualized)* | | | | | |
Gross expenses
| 1.26% | 1.25% | 1.24% | 1.23% | 1.24% |
Net expenses
| 1.19% | 1.19% | 1.20% | 1.20% | 1.20% |
Net investment loss
| (0.93)% | (0.74)% | (0.57)% | (0.51)% | (0.60)% |
| Supplemental data | | | | | |
Portfolio turnover rate2
| 61% | 44% | 41% | 54% | 37% |
Net assets, end of period (000s omitted)
| $42,317 | $62,092 | $55,917 | $87,850 | $114,429 |
| * | Ratios include net expenses allocated from the affiliated Master Portfolio which were as follows: |
| Year ended May 31, 2022 | 0.81% |
| Year ended May 31, 2021 | 0.79% |
| Year ended May 31, 2020 | 0.78% |
| Year ended May 31, 2019 | 0.78% |
| Year ended May 31, 2018 | 0.78% |
| 1 | Calculated based upon average shares outstanding |
| 2 | Portfolio turnover rate is calculated by multiplying the affiliated Master Portfolio’s percentage of the Fund’s total investment in securities at the end of the period by the affiliated Master Portfolio’s portfolio turnover rate. |
The accompanying notes are an integral part of these financial statements.
18 | Allspring Small Company Growth Fund
Financial highlights
(For a share outstanding throughout each period)
| | Year ended May 31 |
| Institutional Class | 2022 | 2021 | 2020 | 2019 | 2018 |
Net asset value, beginning of period
| $67.62 | $50.47 | $52.51 | $60.20 | $46.85 |
Net investment loss
| (0.27) 1 | (0.29) | (0.17) 1 | (0.15) | (0.19) |
Net realized and unrealized gains (losses) on investments
| (6.62) | 26.42 | 2.64 | (3.44) | 13.54 |
Total from investment operations
| (6.89) | 26.13 | 2.47 | (3.59) | 13.35 |
| Distributions to shareholders from | | | | | |
Net realized gains
| (24.49) | (8.98) | (4.51) | (4.10) | 0.00 |
Net asset value, end of period
| $36.24 | $67.62 | $50.47 | $52.51 | $60.20 |
Total return
| (16.31)% | 54.39% | 4.07% | (5.77)% | 28.50% |
| Ratios to average net assets (annualized)* | | | | | |
Gross expenses
| 1.01% | 1.00% | 1.00% | 0.98% | 0.99% |
Net expenses
| 0.94% | 0.94% | 0.95% | 0.95% | 0.95% |
Net investment loss
| (0.51)% | (0.49)% | (0.32)% | (0.26)% | (0.35)% |
| Supplemental data | | | | | |
Portfolio turnover rate2
| 61% | 44% | 41% | 54% | 37% |
Net assets, end of period (000s omitted)
| $495,163 | $819,760 | $793,581 | $1,047,883 | $1,169,555 |
| * | Ratios include net expenses allocated from the affiliated Master Portfolio which were as follows: |
| Year ended May 31, 2022 | 0.81% |
| Year ended May 31, 2021 | 0.79% |
| Year ended May 31, 2020 | 0.78% |
| Year ended May 31, 2019 | 0.78% |
| Year ended May 31, 2018 | 0.78% |
| 1 | Calculated based upon average shares outstanding |
| 2 | Portfolio turnover rate is calculated by multiplying the affiliated Master Portfolio’s percentage of the Fund’s total investment in securities at the end of the period by the affiliated Master Portfolio’s portfolio turnover rate. |
The accompanying notes are an integral part of these financial statements.
Allspring Small Company Growth Fund | 19
Notes to financial statements
1. ORGANIZATION
Allspring Funds Trust (the "Trust"), a Delaware statutory trust organized on March 10, 1999, is an open-end management investment company registered under the Investment Company Act of 1940, as amended (the "1940 Act"). As an investment company, the Trust follows the accounting and reporting guidance in Financial Accounting Standards Board ("FASB") Accounting Standards Codification Topic 946, Financial Services – Investment Companies. These financial statements report on the Allspring Small Company Growth Fund (the "Fund") which is a diversified series of the Trust.
The Fund is a feeder fund in a master-feeder structure that invests substantially all of its assets in a single master portfolio with a substantially identical investment objective and substantially similar investment strategies. The Fund invests in Allspring Small Company Growth Portfolio, a separate diversified portfolio (the “affiliated Master Portfolio”) of Allspring Master Trust, a registered open-end management investment company. As of May 31, 2022, the Fund owned 97.57% of Allspring Small Company Growth Portfolio. The affiliated Master Portfolio directly acquires portfolio securities and the Fund acquires an indirect interest in those securities. The Fund accounts for its investment in the affiliated Master Portfolio as a partnership investment and records on a daily basis its share of the affiliated Master Portfolio’s income, expense and realized and unrealized gains and losses. The financial statements of the affiliated Master Portfolio for the year ended May 31, 2022 are included in this report and should be read in conjunction with the Fund’s financial statements.
Effective on November 1, 2021, the sale transaction of Wells Fargo Asset Management ("WFAM") by Wells Fargo & Company to GTCR LLC and Reverence Capital Partners, L.P. was closed. In connection with the closing of the transaction, WFAM became known as Allspring Global Investments (“Allspring”) and various entities that provided services to the Fund changed their names to "Allspring", including Allspring Funds Management, LLC, the investment manager to the Fund, Allspring Global Investments, LLC and Allspring Global Investments (UK) Limited, both registered investment advisers providing subadvisory services to certain funds, and Allspring Funds Distributor, LLC, the Fund's principal underwriter. Consummation of the transaction resulted in a new investment management agreement and subadvisory agreement which became effective on November 1, 2021.
2. SIGNIFICANT ACCOUNTING POLICIES
The following significant accounting policies, which are consistently followed in the preparation of the financial statements of the Fund, are in conformity with U.S. generally accepted accounting principles which require management to make estimates and assumptions that affect the reported amounts of assets and liabilities, disclosure of contingent assets and liabilities at the date of the financial statements, and the reported amounts of income and expenses during the reporting period. Actual results could differ from those estimates.
Securities valuation
All investments are valued each business day as of the close of regular trading on the New York Stock Exchange (generally 4 p.m. Eastern Time), although the Fund may deviate from this calculation time under unusual or unexpected circumstances.
Investments in the affiliated Master Portfolio are valued daily based on the Fund’s proportionate share of the affiliated Master Portfolio’s net assets, which are also valued daily. Securities held in the affiliated Master Portfolio are valued as discussed in the Notes to Financial Statements of the affiliated Master Portfolio, which are included elsewhere in this report.
Investments which are not valued using the method discussed above are valued at their fair value, as determined in good faith by the Board of Trustees. The Board of Trustees has established a Valuation Committee comprised of the Trustees and has delegated to it the authority to take any actions regarding the valuation of portfolio securities that the Valuation Committee deems necessary or appropriate, including determining the fair value of portfolio securities, unless the determination has been delegated to the Allspring Global Investments Pricing Committee at Allspring Funds Management, LLC ("Allspring Funds Management"). The Board of Trustees retains the authority to make or ratify any valuation decisions or approve any changes to the Valuation Procedures as it deems appropriate. On a quarterly basis, the Board of Trustees receives reports on any valuation actions taken by the Valuation Committee or the Allspring Global Investments Pricing Committee which may include items for ratification.
Investment transactions, income and expenses
Investments in the affiliated Master Portfolio are recorded on a trade date basis. The Fund records daily its proportionate share of the affiliated Master Portfolio’s income, expenses and realized and unrealized gains or losses. The Fund also accrues its own expenses.
20 | Allspring Small Company Growth Fund
Notes to financial statements
Distributions to shareholders
Distributions to shareholders from net investment income and any net realized gains are recorded on the ex-dividend date and paid at least annually. Such distributions are determined in accordance with income tax regulations and may differ from U.S. generally accepted accounting principles. Dividend sources are estimated at the time of declaration. The tax character of distributions is determined as of the Fund's fiscal year end. Therefore, a portion of the Fund's distributions made prior to the Fund’s fiscal year end may be categorized as a tax return of capital at year end.
Federal and other taxes
The Fund intends to continue to qualify as a regulated investment company by distributing substantially all of its investment company taxable income and any net realized capital gains (after reduction for capital loss carryforwards) sufficient to relieve it from all, or substantially all, federal income taxes. Accordingly, no provision for federal income taxes was required.
The Fund’s income and federal excise tax returns and all financial records supporting those returns for the prior three fiscal years are subject to examination by the federal and Delaware revenue authorities. Management has analyzed the Fund's tax positions taken on federal, state, and foreign tax returns, as applicable, for all open tax years and does not believe that there are any uncertain tax positions that require recognition of a tax liability.
As of May 31, 2022, the aggregate cost of all investments for federal income tax purposes was $673,841,713 and the unrealized gains (losses) consisted of:
| Gross unrealized gains | $135,281,242 |
| Gross unrealized losses | 0 |
| Net unrealized gains | $135,281,242 |
As of May 31, 2022, the Fund had current year deferred post-October capital losses consisting of $2,440,321 in short-term losses which will be recognized in the first day of the following fiscal year.
As of May 31, 2022, Fund had a qualified late-year ordinary loss of $2,059,048 which will be recognized on the first day of the following fiscal year.
Class allocations
The separate classes of shares offered by the Fund differ principally in applicable sales charges, distribution, shareholder servicing, and administration fees. Class specific expenses are charged directly to that share class. Investment income, common fund-level expenses, and realized and unrealized gains (losses) on investments are allocated daily to each class of shares based on the relative proportion of net assets of each class.
3. FAIR VALUATION MEASUREMENTS
At May 31, 2022, the Fund’s investment in the affiliated Master Portfolio was measured at fair value using the net asset value per share (or its equivalent) as a practical expedient. The investment objective and fair value of the affiliated Master Portfolio is as follows:
| Affiliated Master Portfolio | Investment objective | Fair value of affiliated
Master Portfolio |
| Allspring Small Company Growth Portfolio | Seek long-term capital appreciation | $809,122,955 |
The affiliated Master Portfolio does not have a redemption period notice, can be redeemed daily and does not have any unfunded commitments.
4. TRANSACTIONS WITH AFFILIATES
Management fee
Allspring Funds Management, a wholly owned subsidiary of Allspring Global Investments Holdings, LLC, a holding company indirectly owned by certain private funds of GTCR LLC and Reverence Capital Partners, L.P., is the manager of the Fund and provides advisory and fund-level administrative services under an investment management agreement. Under the investment management agreement, Allspring Funds Management is responsible for, among other services, implementing the investment objectives and strategies of the Fund and providing fund-level administrative services in connection with the Fund’s operations. As long as the Fund continues to invest substantially all of its assets in a single affiliated Master Portfolio, the Fund pays
Allspring Small Company Growth Fund | 21
Notes to financial statements
Allspring Funds Management an investment management fee only for fund-level administrative services at the following annual rate based on the Fund’s average daily net assets:
| Average daily net assets | Management fee |
| First $5 billion | 0.050% |
| Next $5 billion | 0.040 |
| Over $10 billion | 0.030 |
For the year ended May 31, 2022, the management fee was equivalent to an annual rate of 0.05% of the Fund’s average daily net assets.
Allspring Funds Management also serves as the adviser to the affiliated Master Portfolio and is entitled to receive a fee from the affiliated Master Portfolio for those services.
Administration fees
Under a class-level administration agreement, Allspring Funds Management provides class-level administrative services to the Fund, which includes paying fees and expenses for services provided by the transfer agent, sub-transfer agents, omnibus account servicers and record-keepers. As compensation for its services under the class-level administration agreement, Allspring Funds Management receives an annual fee which is calculated based on the average daily net assets of each class as follows:
| | Class-level
administration fee |
| Class A | 0.21% |
| Class C | 0.21 |
| Class R6 | 0.03 |
| Administrator Class | 0.13 |
| Institutional Class | 0.13 |
Waivers and/or expense reimbursements
Allspring Funds Management has contractually committed to waive and/or reimburse management and administration fees to the extent necessary to maintain certain net operating expense ratios for the Fund. When each class of the Fund has exceeded its expense cap, Allspring Funds Management will waive fees and/or reimburse expenses from fund-level expenses on a proportionate basis and then from class specific expenses. When only certain classes exceed their expense caps, waivers and/or reimbursements are applied against class specific expenses before fund-level expenses. Net expenses from the affiliated Master Portfolio are included in the expense caps. Allspring Funds Management has contractually committed through September 30, 2022 to waive fees and/or reimburse expenses to the extent necessary to cap expenses. Prior to or after the commitment expiration date, the caps may be increased or the commitment to maintain the caps may be terminated only with the approval of the Board of Trustees. As of May 31, 2022, the contractual expense caps are as follows:
| | Expense ratio caps |
| Class A | 1.29% |
| Class C | 2.04 |
| Class R6 | 0.86 |
| Administrator Class | 1.19 |
| Institutional Class | 0.94 |
Distribution fee
The Trust has adopted a distribution plan for Class C shares pursuant to Rule 12b-1 under the 1940 Act. A distribution fee is charged to Class C shares and paid to Allspring Funds Distributor, LLC ("Allspring Funds Distributor"), the principal underwriter, an affiliate of Allspring Funds Management, at an annual rate of 0.75% of the average daily net assets of Class C shares.
22 | Allspring Small Company Growth Fund
Notes to financial statements
In addition, Allspring Funds Distributor is entitled to receive the front-end sales charge from the purchase of Class A shares and a contingent deferred sales charge on the redemption of certain Class A shares. Allspring Funds Distributor is also entitled to receive the contingent deferred sales charges from redemptions of Class C shares. For the year ended May 31, 2022, Allspring Funds Distributor received $3,265 from the sale of Class A shares. No contingent deferred sales charges were incurred by Class A and Class C shares for the year ended May 31, 2022.
Shareholder servicing fees
The Trust has entered into contracts with one or more shareholder servicing agents, whereby Class A, Class C and Administrator Class are charged a fee at an annual rate of 0.25% of the average daily net assets of each respective class. A portion of these total shareholder servicing fees were paid to affiliates, and to certain entities that were affiliates of the Fund until November 1, 2021.
5. INVESTMENT PORTFOLIO TRANSACTIONS
The Fund seeks to achieve its investment objective by investing substantially all of its assets in the affiliated Master Portfolio. Purchases and sales have been calculated by multiplying the Fund's ownership percentage of the affiliated Master Portfolio at the end of the period by the affiliated Master Portfolio's purchases and sales. Purchases and sales of investments, excluding U.S. government obligations (if any) and short-term securities, for the year ended May 31, 2022 were $592,969,874 and $963,276,716, respectively.
6. BANK BORROWINGS
The Trust (excluding the money market funds), Allspring Master Trust and Allspring Variable Trust are parties to a $350,000,000 revolving credit agreement whereby the Fund is permitted to use bank borrowings for temporary or emergency purposes, such as to fund shareholder redemption requests. Interest under the credit agreement is charged to the Fund based on a borrowing rate equal to the higher of the Federal Funds rate in effect on that day plus 1.25% or the overnight bank funding rate in effect on that day plus 1.25%. In addition, an annual commitment fee equal to 0.25% of the unused balance is allocated to each participating fund.
For the year ended May 31, 2022, there were no borrowings by the Fund under the agreement.
7. DISTRIBUTIONS TO SHAREHOLDERS
The tax character of distributions paid during the years ended May 31, 2022 and May 31, 2021 were as follows:
| | Year ended May 31 |
| | 2022 | 2021 |
| Ordinary income | $ 41,089,472 | $ 46,221,198 |
| Long-term capital gain | 360,425,433 | 147,632,068 |
As of May 31, 2022, the components of distributable earnings on a tax basis were as follows:
Undistributed
long-term
gain | Unrealized
gains | Late-year
ordinary
losses
deferred | Post-October
capital
losses
deferred |
| $48,679,352 | $135,281,242 | $(2,059,048) | $(2,440,321) |
8. CONCENTRATION RISKS
Concentration risks result from exposure to a limited number of sectors. Through its investment in the affiliated Master Portfolio which may invest a substantial portion of its assets in any sector, the Fund may in turn be more affected by changes in that sector than a fund whose investments are not heavily weighted in any sector. As of the end of the period, the affiliated Master Portfolio concentrated its portfolio in investments related to the health care sector.
9. INDEMNIFICATION
Under the Fund's organizational documents, the officers and Trustees have been granted certain indemnification rights against certain liabilities that may arise out of performance of their duties to the Fund. The Fund has entered into a separate
Allspring Small Company Growth Fund | 23
Notes to financial statements
agreement with each Trustee that converts indemnification rights currently existing under the Fund’s organizational documents into contractual rights that cannot be changed in the future without the consent of the Trustee. Additionally, in the normal course of business, the Fund may enter into contracts with service providers that contain a variety of indemnification clauses. The Fund’s maximum exposure under these arrangements is dependent on future claims that may be made against the Fund and, therefore, cannot be estimated.
10. CORONAVIRUS (COVID-19) PANDEMIC
On March 11, 2020, the World Health Organization announced that it had made the assessment that coronavirus disease 2019 (“COVID-19”) is a pandemic. The impacts of COVID-19 are affecting the entire global economy, individual companies and investment products, the funds, and the market in general. There is significant uncertainty around the extent and duration of business disruptions related to COVID-19 and the impacts may last for an extended period of time. COVID-19 has led to significant uncertainty and volatility in the financial markets.
24 | Allspring Small Company Growth Fund
Report of independent registered public accounting firm
To the Shareholders of the Fund and Board of Trustees
Allspring Funds Trust:
Opinion on the Financial Statements
We have audited the accompanying statement of assets and liabilities of Allspring Small Company Growth Fund (formerly, Wells Fargo Small Company Growth Fund) (the Fund), one of the funds constituting Allspring Funds Trust (formerly, Wells Fargo Funds Trust), including the portfolio of investments, as of May 31, 2022, the related statement of operations for the year then ended, the statements of changes in net assets for each of the years in the two-year period then ended, and the related notes (collectively, the financial statements) and the financial highlights for each of the years in the five-year period then ended. In our opinion, the financial statements and financial highlights present fairly, in all material respects, the financial position of the Fund as of May 31, 2022, the results of its operations for the year then ended, the changes in its net assets for each of the years in the two-year period then ended, and the financial highlights for each of the years in the five-year period then ended, in conformity with U.S. generally accepted accounting principles.
Basis for Opinion
These financial statements and financial highlights are the responsibility of the Fund’s management. Our responsibility is to express an opinion on these financial statements and financial highlights based on our audits. We are a public accounting firm registered with the Public Company Accounting Oversight Board (United States) (PCAOB) and are required to be independent with respect to the Fund in accordance with the U.S. federal securities laws and the applicable rules and regulations of the Securities and Exchange Commission and the PCAOB.
We conducted our audits in accordance with the standards of the PCAOB. Those standards require that we plan and perform the audit to obtain reasonable assurance about whether the financial statements and financial highlights are free of material misstatement, whether due to error or fraud. Our audits included performing procedures to assess the risks of material misstatement of the financial statements and financial highlights, whether due to error or fraud, and performing procedures that respond to those risks. Such procedures included examining, on a test basis, evidence regarding the amounts and disclosures in the financial statements and financial highlights. Such procedures also included confirmation of securities owned as of May 31, 2022, by correspondence with the transfer agent. Our audits also included evaluating the accounting principles used and significant estimates made by management, as well as evaluating the overall presentation of the financial statements and financial highlights. We believe that our audits provide a reasonable basis for our opinion.

We have not been able to determine the specific year that we began serving as the auditor of one or more Allspring Funds investment companies; however, we are aware that we have served as the auditor of one or more Allspring Funds investment companies since at least 1955.
Boston, Massachusetts
July 27, 2022
Allspring Small Company Growth Fund | 25
Portfolio of investments—May 31, 2022
| | | | | Shares | Value |
| Common stocks: 95.89% | | | | | |
| Communication services: 0.38% | | | | | |
| Entertainment: 0.38% | | | | | |
| Lions Gate Entertainment Class B † | | | | 341,003 | $ 3,202,018 |
| Consumer discretionary: 8.78% | | | | | |
| Auto components: 0.66% | | | | | |
| Fox Factory Holding Corporation † | | | | 66,953 | 5,491,485 |
| Hotels, restaurants & leisure: 2.08% | | | | | |
| International Game Technology plc | | | | 480,152 | 10,284,856 |
| Papa John's International Incorporated | | | | 78,805 | 6,935,628 |
| | | | | | 17,220,484 |
| Household durables: 0.88% | | | | | |
| Skyline Champion Corporation † | | | | 137,385 | 7,299,265 |
| Leisure products: 1.57% | | | | | |
| Callaway Golf Company † | | | | 294,181 | 6,386,670 |
| Hayward Holdings Incorporated † | | | | 434,447 | 6,647,039 |
| | | | | | 13,033,709 |
| Multiline retail: 0.73% | | | | | |
| Ollie's Bargain Outlet Holdings Incorporated † | | | | 128,704 | 6,045,227 |
| Specialty retail: 2.86% | | | | | |
| Academy Sports & Outdoors Corporation | | | | 171,392 | 5,743,346 |
| American Eagle Outfitters Incorporated | | | | 395,929 | 4,794,700 |
| Burlington Stores Incorporated † | | | | 31,100 | 5,234,130 |
| Five Below Incorporated † | | | | 33,410 | 4,363,012 |
| Monro Muffler Brake Incorporated | | | | 75,053 | 3,559,013 |
| | | | | | 23,694,201 |
| Consumer staples: 3.17% | | | | | |
| Food & staples retailing: 1.04% | | | | | |
| Performance Food Group Company † | | | | 199,871 | 8,662,409 |
| Food products: 1.02% | | | | | |
| Lamb Weston Holdings Incorporated | | | | 124,619 | 8,421,752 |
| Personal products: 1.11% | | | | | |
| e.l.f. Beauty Incorporated † | | | | 344,850 | 9,179,907 |
| Energy: 0.95% | | | | | |
| Oil, gas & consumable fuels: 0.95% | | | | | |
| Callon Petroleum Company † | | | | 135,239 | 7,906,072 |
| Financials: 9.85% | | | | | |
| Banks: 1.10% | | | | | |
| Triumph Bancorp Incorporated † | | | | 125,661 | 9,140,581 |
| Capital markets: 3.67% | | | | | |
| Evercore Partners Incorporated Class A | | | | 61,519 | 7,025,470 |
| Focus Financial Partners Class A † | | | | 142,139 | 5,358,640 |
The accompanying notes are an integral part of these financial statements.
26 | Allspring Small Company Growth Portfolio
Portfolio of investments—May 31, 2022
| | | | | Shares | Value |
| Capital markets (continued) | | | | | |
| Open Lending Corporation Class A † | | | | 150,851 | $ 1,985,199 |
| Stifel Financial Corporation | | | | 158,238 | 10,154,132 |
| VIRTU Financial Incorporated Class A | | | | 226,541 | 5,919,516 |
| | | | | | 30,442,957 |
| Insurance: 4.13% | | | | | |
| BRP Group Incorporated Class A † | | | | 426,892 | 10,766,216 |
| Goosehead Insurance Incorporated Class A | | | | 118,660 | 6,144,215 |
| Palomar Holdings Incorporated † | | | | 129,875 | 8,071,731 |
| Ryan Specialty Group Holdings Incorporated † | | | | 246,522 | 9,261,832 |
| | | | | | 34,243,994 |
| Thrifts & mortgage finance: 0.95% | | | | | |
| Essent Group Limited | | | | 183,598 | 7,856,158 |
| Health care: 24.60% | | | | | |
| Biotechnology: 4.55% | | | | | |
| Amicus Therapeutics Incorporated † | | | | 553,823 | 4,220,131 |
| Avid Bioservices Incorporated † | | | | 260,460 | 3,482,350 |
| Blueprint Medicines Corporation † | | | | 77,799 | 4,278,945 |
| Cytokinetics Incorporated † | | | | 120,986 | 4,827,341 |
| Insmed Incorporated † | | | | 202,861 | 3,817,844 |
| Ionis Pharmaceuticals Incorporated † | | | | 79,912 | 2,918,386 |
| Iovance Biotherapeutics Incorporated † | | | | 158,703 | 1,071,245 |
| Neurocrine Biosciences Incorporated † | | | | 55,992 | 5,234,692 |
| Sarepta Therapeutics Incorporated † | | | | 58,958 | 4,293,322 |
| Ultragenyx Pharmaceutical Incorporated † | | | | 76,945 | 3,608,721 |
| | | | | | 37,752,977 |
| Health care equipment & supplies: 6.05% | | | | | |
| Atricure Incorporated † | | | | 178,486 | 7,251,886 |
| Axonics Incorporated † | | | | 146,646 | 7,332,300 |
| BioLife Solutions Incorporated † | | | | 190,569 | 2,614,607 |
| Cerus Corporation † | | | | 1,002,104 | 4,960,415 |
| Conmed Corporation | | | | 75,728 | 8,806,409 |
| Haemonetics Corporation † | | | | 102,869 | 6,507,493 |
| Novocure Limited † | | | | 26,536 | 2,132,964 |
| Silk Road Medical Incorporated † | | | | 250,877 | 8,334,134 |
| ViewRay Incorporated † | | | | 776,593 | 2,244,354 |
| | | | | | 50,184,562 |
| Health care providers & services: 3.51% | | | | | |
| AMN Healthcare Services Incorporated † | | | | 81,403 | 7,887,953 |
| HealthEquity Incorporated † | | | | 118,883 | 7,439,698 |
| Oak Street Health Incorporated † | | | | 164,990 | 3,115,011 |
| Privia Health Group Incorporated † | | | | 180,531 | 4,325,523 |
| U.S. Physical Therapy Incorporated | | | | 55,908 | 6,294,682 |
| | | | | | 29,062,867 |
| Health care technology: 3.54% | | | | | |
| Allscripts Healthcare Solutions Incorporated † | | | | 408,687 | 6,984,461 |
| Evolent Health Incorporated Class A † | | | | 255,804 | 7,195,767 |
The accompanying notes are an integral part of these financial statements.
Allspring Small Company Growth Portfolio | 27
Portfolio of investments—May 31, 2022
| | | | | Shares | Value |
| Health care technology (continued) | | | | | |
| Omnicell Incorporated † | | | | 92,408 | $ 10,272,073 |
| Phreesia Incorporated † | | | | 271,911 | 4,932,466 |
| | | | | | 29,384,767 |
| Life sciences tools & services: 6.03% | | | | | |
| Adaptive Biotechnologies Corporation † | | | | 175,707 | 1,374,029 |
| Avantor Incorporated † | | | | 392,631 | 12,579,897 |
| Azenta Incorporated | | | | 77,545 | 5,943,049 |
| ICON plc ADR † | | | | 76,805 | 17,188,191 |
| Syneos Health Incorporated † | | | | 174,925 | 12,925,208 |
| | | | | | 50,010,374 |
| Pharmaceuticals: 0.92% | | | | | |
| Axsome Therapeutics Incorporated † | | | | 101,799 | 2,544,975 |
| Pacira Biosciences Incorporated † | | | | 80,149 | 5,069,424 |
| | | | | | 7,614,399 |
| Industrials: 22.01% | | | | | |
| Aerospace & defense: 1.45% | | | | | |
| Kratos Defense & Security Solutions Incorporated † | | | | 297,166 | 4,285,134 |
| Mercury Systems Incorporated † | | | | 129,495 | 7,745,096 |
| | | | | | 12,030,230 |
| Air freight & logistics: 0.67% | | | | | |
| GXO Logistics Incorporated † | | | | 102,798 | 5,578,847 |
| Airlines: 0.70% | | | | | |
| Sun Country Airlines Holding † | | | | 246,445 | 5,828,424 |
| Building products: 3.68% | | | | | |
| A.O. Smith Corporation | | | | 53,170 | 3,196,580 |
| Advanced Drainage Systems Incorporated | | | | 80,101 | 8,771,861 |
| Masonite International Corporation † | | | | 95,814 | 8,798,600 |
| PGT Incorporated † | | | | 251,469 | 5,054,527 |
| The AZEK Company Incorporated † | | | | 221,268 | 4,662,117 |
| | | | | | 30,483,685 |
| Commercial services & supplies: 1.05% | | | | | |
| IAA Incorporated † | | | | 107,767 | 4,206,146 |
| KAR Auction Services Incorporated † | | | | 283,388 | 4,525,706 |
| | | | | | 8,731,852 |
| Construction & engineering: 0.83% | | | | | |
| Dycom Industries Incorporated † | | | | 73,319 | 6,826,732 |
| Electrical equipment: 1.46% | | | | | |
| Atkore Incorporated † | | | | 65,940 | 7,182,185 |
| Vicor Corporation † | | | | 73,183 | 4,925,216 |
| | | | | | 12,107,401 |
| Machinery: 2.73% | | | | | |
| Chart Industries Incorporated † | | | | 51,972 | 9,140,835 |
The accompanying notes are an integral part of these financial statements.
28 | Allspring Small Company Growth Portfolio
Portfolio of investments—May 31, 2022
| | | | | Shares | Value |
| Machinery (continued) | | | | | |
| SPX Corporation † | | | | 168,053 | $ 8,458,107 |
| Wabash National Corporation | | | | 326,057 | 5,004,975 |
| | | | | | 22,603,917 |
| Professional services: 6.19% | | | | | |
| ASGN Incorporated † | | | | 114,496 | 10,903,454 |
| Clarivate plc † | | | | 318,835 | 4,709,193 |
| FTI Consulting Incorporated † | | | | 51,882 | 8,716,176 |
| ICF International Incorporated | | | | 98,630 | 10,080,972 |
| KBR Incorporated | | | | 221,337 | 11,013,729 |
| Sterling Check Corporation † | | | | 317,441 | 5,898,054 |
| | | | | | 51,321,578 |
| Road & rail: 1.58% | | | | | |
| Knight-Swift Transportation Holdings Incorporated | | | | 138,626 | 6,742,769 |
| Schneider National Incorporated Class B | | | | 264,554 | 6,386,334 |
| | | | | | 13,129,103 |
| Trading companies & distributors: 1.67% | | | | | |
| Boise Cascade Company | | | | 81,744 | 6,320,446 |
| Core & Main Incorporated † | | | | 318,980 | 7,527,928 |
| | | | | | 13,848,374 |
| Information technology: 21.70% | | | | | |
| Communications equipment: 2.55% | | | | | |
| Ciena Corporation † | | | | 233,711 | 11,877,193 |
| Lumentum Holdings Incorporated † | | | | 107,978 | 9,294,746 |
| | | | | | 21,171,939 |
| Electronic equipment, instruments & components: 1.08% | | | | | |
| Itron Incorporated † | | | | 83,745 | 4,322,079 |
| Par Technology Corporation †« | | | | 123,037 | 4,623,730 |
| | | | | | 8,945,809 |
| IT services: 3.02% | | | | | |
| EVO Payments Incorporated Class A † | | | | 279,161 | 6,434,661 |
| LiveRamp Holdings Incorporated † | | | | 181,107 | 4,636,339 |
| Verra Mobility Corporation † | | | | 475,333 | 7,581,561 |
| WEX Incorporated † | | | | 37,706 | 6,420,578 |
| | | | | | 25,073,139 |
| Semiconductors & semiconductor equipment: 3.94% | | | | | |
| FormFactor Incorporated † | | | | 104,456 | 4,288,963 |
| Onto Innovation Incorporated † | | | | 88,929 | 7,148,113 |
| Silicon Motion Technology Corporation ADR | | | | 81,509 | 7,361,078 |
| Synaptics Incorporated † | | | | 48,014 | 7,111,834 |
| Teradyne Incorporated | | | | 61,493 | 6,718,725 |
| | | | | | 32,628,713 |
| Software: 11.11% | | | | | |
| Black Knight Incorporated † | | | | 166,431 | 11,302,329 |
| Box Incorporated Class A † | | | | 361,566 | 9,440,488 |
| CyberArk Software Limited † | | | | 56,304 | 7,820,626 |
| Doubleverify Holdings Incorporated † | | | | 213,575 | 4,752,044 |
The accompanying notes are an integral part of these financial statements.
Allspring Small Company Growth Portfolio | 29
Portfolio of investments—May 31, 2022
| | | | | Shares | Value |
| Software (continued) | | | | | |
| Jamf Holding Corporation † | | | | 266,499 | $ 6,859,684 |
| Nutanix Incorporated Class A † | | | | 259,718 | 4,207,432 |
| Pagerduty Incorporated † | | | | 329,703 | 8,127,179 |
| PTC Incorporated † | | | | 108,381 | ��12,629,638 |
| Sprout Social Incorporated Class A † | | | | 104,827 | 5,338,839 |
| SS&C Technologies Holdings Incorporated | | | | 179,494 | 11,485,821 |
| Zendesk Incorporated † | | | | 59,110 | 5,405,610 |
| Zuora Incorporated † | | | | 467,192 | 4,737,327 |
| | | | | | 92,107,017 |
| Materials: 3.41% | | | | | |
| Chemicals: 2.53% | | | | | |
| Aspen Aerogels Incorporated † | | | | 75,892 | 1,329,628 |
| Element Solutions Incorporated | | | | 572,146 | 12,180,988 |
| Orion Engineered Carbons SA | | | | 387,554 | 7,483,668 |
| | | | | | 20,994,284 |
| Metals & mining: 0.88% | | | | | |
| Steel Dynamics Incorporated | | | | 85,614 | 7,309,723 |
| Real estate: 1.04% | | | | | |
| Equity REITs: 0.72% | | | | | |
| Ryman Hospitality Properties Incorporated † | | | | 67,086 | 5,990,109 |
| Real estate management & development: 0.32% | | | | | |
| Compass Incorporated Class A †« | | | | 447,108 | 2,620,053 |
| Total Common stocks (Cost $593,924,176) | | | | | 795,181,094 |
| | | Yield | | | |
| Short-term investments: 4.25% | | | | | |
| Investment companies: 4.25% | | | | | |
| Allspring Government Money Market Fund Select Class ♠∞ | | 0.65% | | 32,660,804 | 32,660,804 |
| Securities Lending Cash Investments LLC ♠∩∞ | | 0.91 | | 2,594,900 | 2,594,900 |
| Total Short-term investments (Cost $35,255,704) | | | | | 35,255,704 |
| Total investments in securities (Cost $629,179,880) | 100.14% | | | | 830,436,798 |
| Other assets and liabilities, net | (0.14) | | | | (1,176,700) |
| Total net assets | 100.00% | | | | $829,260,098 |
| † | Non-income-earning security |
| « | All or a portion of this security is on loan. |
| ♠ | The issuer of the security is an affiliated person of the Portfolio as defined in the Investment Company Act of 1940. |
| ∩ | The investment is a non-registered investment company purchased with cash collateral received from securities on loan. |
| ∞ | The rate represents the 7-day annualized yield at period end. |
| Abbreviations: |
| ADR | American depositary receipt |
| REIT | Real estate investment trust |
The accompanying notes are an integral part of these financial statements.
30 | Allspring Small Company Growth Portfolio
Portfolio of investments—May 31, 2022
Investments in affiliates
An affiliated investment is an investment in which the Portfolio owns at least 5% of the outstanding voting shares of the issuer or as a result of other relationships, such as the Portfolio and the issuer having the same adviser or investment manager. Transactions with issuers that were affiliates of the Portfolio at the end of the period were as follows:
| | Value,
beginning of
period | Purchases | Sales
proceeds | Net
realized
gains
(losses) | | Net
change in
unrealized
gains
(losses) | | Value,
end of
period | Shares,
end
of period | Income
from
affiliated
securities |
| Short-term investments | | | | | | | | | |
| Allspring Government Money Market Fund Select Class | $40,275,255 | $452,951,336 | $(460,565,787) | $0 | | $0 | | $ 32,660,804 | 32,660,804 | $ 25,419 |
| Securities Lending Cash Investments LLC | 21,935,055 | 183,367,355 | (202,707,510) | 0 | | 0 | | 2,594,900 | 2,594,900 | 15,248 # |
| | | | | $0 | | $0 | | $35,255,704 | | $40,667 |
| # | Amount shown represents income before fees and rebates. |
The accompanying notes are an integral part of these financial statements.
Allspring Small Company Growth Portfolio | 31
Statement of assets and liabilities—May 31, 2022
| | |
| Assets | |
Investments in unaffiliated securities (including $2,436,672 of securities loaned), at value (cost $593,924,176)
| $ 795,181,094 |
Investments in affiliated securities, at value (cost $35,255,704)
| 35,255,704 |
Receivable for investments sold
| 1,306,141 |
Receivable for dividends
| 657,698 |
Receivable for securities lending income, net
| 2,135 |
Prepaid expenses and other assets
| 27,795 |
Total assets
| 832,430,567 |
| Liabilities | |
Payable upon receipt of securities loaned
| 2,594,900 |
Advisory fee payable
| 541,992 |
Trustees’ fees and expenses payable
| 1,415 |
Accrued expenses and other liabilities
| 32,162 |
Total liabilities
| 3,170,469 |
Total net assets
| $829,260,098 |
The accompanying notes are an integral part of these financial statements.
32 | Allspring Small Company Growth Portfolio
Statement of operations—year ended May 31, 2022
| | |
| Investment income | |
Dividends (net of foreign withholdings taxes of $2,578)
| $ 3,933,324 |
Income from affiliated securities
| 102,724 |
Total investment income
| 4,036,048 |
| Expenses | |
Advisory fee
| 8,060,083 |
Custody and accounting fees
| 78,776 |
Professional fees
| 68,905 |
Interest holder report expenses
| 24,751 |
Trustees’ fees and expenses
| 19,821 |
Other fees and expenses
| 47,025 |
Total expenses
| 8,299,361 |
Net investment loss
| (4,263,313) |
| Realized and unrealized gains (losses) on investments | |
Net realized gains on investments
| 238,329,906 |
Net change in unrealized gains (losses) on investments
| (388,267,734) |
Net realized and unrealized gains (losses) on investments
| (149,937,828) |
Net decrease in net assets resulting from operations
| $(154,201,141) |
The accompanying notes are an integral part of these financial statements.
Allspring Small Company Growth Portfolio | 33
Statement of changes in net assets
| | | |
| | Year ended
May 31, 2022 | Year ended
May 31, 2021 |
| Operations | | |
Net investment loss
| $ (4,263,313) | $ (4,920,462) |
Net realized gains on investments
| 238,329,906 | 383,642,418 |
Net change in unrealized gains (losses) on investments
| (388,267,734) | 248,333,561 |
Net increase (decrease) in net assets resulting from operations
| (154,201,141) | 627,055,517 |
| Capital transactions | | |
| Transactions in investors’ beneficial interests | | |
Contributions
| 222,703,095 | 27,183,074 |
Withdrawals
| (617,532,776) | (661,328,291) |
Net decrease in net assets resulting from capital transactions
| (394,829,681) | (634,145,217) |
Total decrease in net assets
| (549,030,822) | (7,089,700) |
| Net assets | | |
Beginning of period
| 1,378,290,920 | 1,385,380,620 |
End of period
| $ 829,260,098 | $1,378,290,920 |
The accompanying notes are an integral part of these financial statements.
34 | Allspring Small Company Growth Portfolio
| | Year ended May 31 |
| | 2022 | 2021 | 2020 | 2019 | 2018 |
Total return
| (16.28)% | 54.64% | 4.08% | (5.64)% | 28.74% |
| Ratios to average net assets (annualized) | | | | | |
Gross expenses
| 0.81% | 0.79% | 0.78% | 0.78% | 0.78% |
Net expenses
| 0.81% | 0.79% | 0.78% | 0.78% | 0.78% |
Net investment loss
| (0.42)% | (0.34)% | (0.16)% | (0.09)% | (0.18)% |
| Supplemental data | | | | | |
Portfolio turnover rate
| 61% | 44% | 41% | 54% | 37% |
The accompanying notes are an integral part of these financial statements.
Allspring Small Company Growth Portfolio | 35
Notes to financial statements
1. ORGANIZATION
Allspring Master Trust (the "Trust"), a Delaware statutory trust organized on March 10, 1999, is an open-end management investment company registered under the Investment Company Act of 1940, as amended (the "1940 Act"). As an investment company, the Trust follows the accounting and reporting guidance in Financial Accounting Standards Board ("FASB") Accounting Standards Codification Topic 946, Financial Services – Investment Companies. These financial statements report on the Allspring Small Company Growth Portfolio (the "Portfolio") which is a diversified series of the Trust.
Interests in the Portfolio are available solely through private placement transactions that do not involve any "public offering" within the meaning of Section 4(a)(2) of the Securities Act of 1933.
Effective on November 1, 2021, the sale transaction of Wells Fargo Asset Management ("WFAM") by Wells Fargo & Company to GTCR LLC and Reverence Capital Partners, L.P. was closed. In connection with the closing of the transaction, WFAM became known as Allspring Global Investments (“Allspring”) and various entities that provided services to the Portfolio changed their names to "Allspring", including Allspring Funds Management, LLC, the adviser to the Portfolio, Allspring Global Investments, LLC and Allspring Global Investments (UK) Limited, both registered investment advisers providing subadvisory services to certain funds, and Allspring Funds Distributor, LLC. Consummation of the transaction resulted in a new advisory agreement and subadvisory agreement which became effective on November 1, 2021.
2. SIGNIFICANT ACCOUNTING POLICIES
The following significant accounting policies, which are consistently followed in the preparation of the financial statements of the Portfolio, are in conformity with U.S. generally accepted accounting principles which require management to make estimates and assumptions that affect the reported amounts of assets and liabilities, disclosure of contingent assets and liabilities at the date of the financial statements, and the reported amounts of income and expenses during the reporting period. Actual results could differ from those estimates.
Securities valuation
All investments are valued each business day as of the close of regular trading on the New York Stock Exchange (generally 4 p.m. Eastern Time), although the Portfolio may deviate from this calculation time under unusual or unexpected circumstances.
Equity securities that are listed on a foreign or domestic exchange or market are valued at the official closing price or, if none, the last sales price.
Investments in registered open-end investment companies are valued at net asset value. Interests in non-registered investment companies that are redeemable at net asset value are fair valued normally at net asset value.
Investments which are not valued using any of the methods discussed above are valued at their fair value, as determined in good faith by the Board of Trustees. The Board of Trustees has established a Valuation Committee comprised of the Trustees and has delegated to it the authority to take any actions regarding the valuation of portfolio securities that the Valuation Committee deems necessary or appropriate, including determining the fair value of portfolio securities, unless the determination has been delegated to the Allspring Global Investments Pricing Committee at Allspring Funds Management, LLC ("Allspring Funds Management"). The Board of Trustees retains the authority to make or ratify any valuation decisions or approve any changes to the Valuation Procedures as it deems appropriate. On a quarterly basis, the Board of Trustees receives reports on any valuation actions taken by the Valuation Committee or the Allspring Global Investments Pricing Committee which may include items for ratification.
Securities lending
The Portfolio may lend its securities from time to time in order to earn additional income in the form of fees or interest on securities received as collateral or the investment of any cash received as collateral. When securities are on loan, the Portfolio receives interest or dividends on those securities. Cash collateral received in connection with its securities lending transactions is invested in Securities Lending Cash Investments, LLC (the "Securities Lending Fund"), an affiliated non-registered investment company. Investments in Securities Lending Fund are valued at the evaluated bid price provided by an independent pricing service. Income earned from investment in the Securities Lending Fund (net of fees and rebates), if any, is included in income from affiliated securities on the Statement of Operations.
In a securities lending transaction, the net asset value of the Portfolio is affected by an increase or decrease in the value of the securities loaned and by an increase or decrease in the value of the instrument in which collateral is invested. The amount of securities lending activity undertaken by the Portfolio fluctuates from time to time. The Portfolio has the right under the lending agreement to recover the securities from the borrower on demand. In the event of default or bankruptcy by the
36 | Allspring Small Company Growth Portfolio
Notes to financial statements
borrower, the Portfolio may be prevented from recovering the loaned securities or gaining access to the collateral or may experience delays or costs in doing so. In such an event, the terms of the agreement allow the unaffiliated securities lending agent to use the collateral to purchase replacement securities on behalf of the Portfolio or pay the Portfolio the market value of the loaned securities. The Portfolio bears the risk of loss with respect to depreciation of its investment of the cash collateral.
Security transactions and income recognition
Securities transactions are recorded on a trade date basis. Realized gains or losses are recorded on the basis of identified cost.
Dividend income is recognized on the ex-dividend date. Dividend income is recorded net of foreign taxes withheld where recovery of such taxes is not assured.
Federal and other taxes
The Portfolio is not required to pay federal income taxes on its net investment income and net capital gains as it is treated as a partnership for federal income tax purposes. All income, gains and losses of the Portfolio are deemed to have been “passed through” to the interest holders in proportion to their holdings of the Portfolio regardless of whether income and gains have been distributed by the Portfolio.
The Portfolio’s income tax returns and all financial records supporting those returns for the prior three fiscal years are subject to examination by the federal revenue authority. Management has analyzed the Portfolio’s tax positions taken on federal, state, and foreign tax returns, as applicable, for all open tax years and does not believe that there are any uncertain tax positions that require recognition of a tax liability.
As of May 31, 2022, the aggregate cost of all investments for federal income tax purposes was $651,449,383 and the unrealized gains (losses) consisted of:
| Gross unrealized gains | $268,219,898 |
| Gross unrealized losses | (89,232,483) |
| Net unrealized gains | $178,987,415 |
3. FAIR VALUATION MEASUREMENTS
Fair value measurements of investments are determined within a framework that has established a fair value hierarchy based upon the various data inputs utilized in determining the value of the Portfolio’s investments. The three-level hierarchy gives the highest priority to unadjusted quoted prices in active markets for identical assets or liabilities (Level 1) and the lowest priority to unobservable inputs (Level 3). The Portfolio’s investments are classified within the fair value hierarchy based on the lowest level of input that is significant to the fair value measurement. The inputs are summarized into three broad levels as follows:
| ■ | Level 1 – quoted prices in active markets for identical securities |
| ■ | Level 2 – other significant observable inputs (including quoted prices for similar securities, interest rates, prepayment speeds, credit risk, etc.) |
| ■ | Level 3 – significant unobservable inputs (including the Portfolio’s own assumptions in determining the fair value of investments) |
The inputs or methodologies used for valuing investments in securities are not necessarily an indication of the risk associated with investing in those securities.
Allspring Small Company Growth Portfolio | 37
Notes to financial statements
The following is a summary of the inputs used in valuing the Portfolio’s assets and liabilities as of May 31, 2022:
| | Quoted prices
(Level 1) | Other significant
observable inputs
(Level 2) | Significant
unobservable inputs
(Level 3) | Total |
| Assets | | | | |
| Investments in: | | | | |
| Common stocks | | | | |
| Communication services | $ 3,202,018 | $0 | $0 | $ 3,202,018 |
| Consumer discretionary | 72,784,371 | 0 | 0 | 72,784,371 |
| Consumer staples | 26,264,068 | 0 | 0 | 26,264,068 |
| Energy | 7,906,072 | 0 | 0 | 7,906,072 |
| Financials | 81,683,690 | 0 | 0 | 81,683,690 |
| Health care | 204,009,946 | 0 | 0 | 204,009,946 |
| Industrials | 182,490,143 | 0 | 0 | 182,490,143 |
| Information technology | 179,926,617 | 0 | 0 | 179,926,617 |
| Materials | 28,304,007 | 0 | 0 | 28,304,007 |
| Real estate | 8,610,162 | 0 | 0 | 8,610,162 |
| Short-term investments | | | | |
| Investment companies | 35,255,704 | 0 | 0 | 35,255,704 |
| Total assets | $830,436,798 | $0 | $0 | $830,436,798 |
Additional sector, industry or geographic detail, if any, is included in the Portfolio of Investments.
For the year ended May 31, 2022, the Portfolio did not have any transfers into/out of Level 3.
4. TRANSACTIONS WITH AFFILIATES AND OTHER EXPENSES
Advisory fee
The Trust has entered into an advisory contract with Allspring Funds Management, a wholly owned subsidiary of Allspring Global Investments Holdings, LLC, a holding company indirectly owned by certain private funds of GTCR LLC and Reverence Capital Partners, L.P. The adviser is responsible for implementing investment policies and guidelines and for supervising the subadviser, who is responsible for day-to-day portfolio management of the Portfolio. Pursuant to the contract, Allspring Funds Management is entitled to receive an advisory fee at the following annual rate based on the Portfolio’s average daily net assets:
| Average daily net assets | Advisory fee |
| First $500 million | 0.800% |
| Next $500 million | 0.775 |
| Next $1 billion | 0.750 |
| Next $1 billion | 0.725 |
| Next $1 billion | 0.700 |
| Over $4 billion | 0.680 |
For the year ended May 31, 2022, the advisory fee was equivalent to an annual rate of 0.79% of the Portfolio's average daily net assets.
Allspring Funds Management has retained the services of a subadviser to provide daily portfolio management to the Portfolio. The fee for subadvisory services is borne by Allspring Funds Management. Peregrine Capital Management, LLC, which is not an affiliate of Allspring Funds Management, is the subadviser to the Portfolio and is entitled to receive a fee from Allspring Funds Management at an annual rate of 0.38% of the Portfolio's average daily net assets.
Interfund transactions
The Portfolio may purchase or sell portfolio investment securities to certain affiliates pursuant to Rule 17a-7 under the 1940 Act and under procedures adopted by the Board of Trustees. The procedures have been designed to ensure that these interfund transactions, which do not incur broker commissions, are effected at current market prices.
38 | Allspring Small Company Growth Portfolio
Notes to financial statements
5. INVESTMENT PORTFOLIO TRANSACTIONS
Purchases and sales of investments, excluding U.S. government obligations (if any) and short-term securities, for the year ended May 31, 2022 were $607,727,482 and $987,250,379, respectively.
6. SECURITIES LENDING TRANSACTIONS
The Portfolio lends its securities through an unaffiliated securities lending agent and receives collateral in the form of cash or securities with a value at least equal to the value of the securities on loan. The value of the loaned securities is determined at the close of each business day and any increases or decreases in the required collateral are exchanged between the Portfolio and the counterparty on the next business day. Cash collateral received is invested in the Securities Lending Fund which seeks to provide a positive return compared to the daily Federal Funds Open Rate by investing in high-quality, U.S. dollar-denominated short-term money market instruments and is exempt from registration under Section 3(c)(7) of the 1940 Act. Securities Lending Fund is managed by Allspring Funds Management and is subadvised by Allspring Global Investments, LLC ("Allspring Investments"), an affiliate of Allspring Funds Management and a wholly owned subsidiary of Allspring Global Investments Holdings, LLC. Allspring Funds Management receives an advisory fee starting at 0.05% and declining to 0.01% as the average daily net assets of the Securities Lending Fund increase. All of the fees received by Allspring Funds Management are paid to Allspring Investments for its services as subadviser.
In the event of counterparty default or the failure of a borrower to return a loaned security, the Portfolio has the right to use the collateral to offset any losses incurred. As of May 31, 2022, the Portfolio had securities lending transactions with the following counterparties which are subject to offset:
| Counterparty | Value of
securities on
loan | Collateral
received1 | Net amount |
| JPMorgan Securities LLC | $1,866,494 | $(1,866,494) | $0 |
| Morgan Stanley & Company LLC | 570,178 | (570,178) | 0 |
1 Collateral received within this table is limited to the collateral for the net transaction with the counterparty.
7. BANK BORROWINGS
The Trust, along with Allspring Variable Trust and Allspring Funds Trust (excluding the money market funds), are parties to a $350,000,000 revolving credit agreement whereby the Portfolio is permitted to use bank borrowings for temporary or emergency purposes, such as to fund interest holders withdrawal requests. Interest under the credit agreement is charged to the Portfolio based on a borrowing rate equal to the higher of the Federal Funds rate in effect on that day plus 1.25% or the overnight bank funding rate in effect on that day plus 1.25%. In addition, an annual commitment fee equal to 0.25% of the unused balance is allocated to each participating fund.
For the year ended May 31, 2022, there were no borrowings by the Portfolio under the agreement.
8. CONCENTRATION RISKS
As of the end of the period, the Portfolio concentrated its portfolio of investments in the health care sector. A fund that invests a substantial portion of its assets in any sector may be more affected by changes in that sector than would be a fund whose investments are not heavily weighted in any sector.
9. INDEMNIFICATION
Under the Portfolio's organizational documents, the officers and Trustees have been granted certain indemnification rights against certain liabilities that may arise out of performance of their duties to the Portfolio. The Portfolio has entered into a separate agreement with each Trustee that converts indemnification rights currently existing under the Portfolio’s organizational documents into contractual rights that cannot be changed in the future without the consent of the Trustee. Additionally, in the normal course of business, the Portfolio may enter into contracts with service providers that contain a variety of indemnification clauses. The Portfolio’s maximum exposure under these arrangements is dependent on future claims that may be made against the Portfolio and, therefore, cannot be estimated.
10. CORONAVIRUS (COVID-19) PANDEMIC
On March 11, 2020, the World Health Organization announced that it had made the assessment that coronavirus disease 2019 (“COVID-19”) is a pandemic. The impacts of COVID-19 are affecting the entire global economy, individual companies and
Allspring Small Company Growth Portfolio | 39
Notes to financial statements
investment products, the funds, and the market in general. There is significant uncertainty around the extent and duration of business disruptions related to COVID-19 and the impacts may last for an extended period of time. COVID-19 has led to significant uncertainty and volatility in the financial markets.
40 | Allspring Small Company Growth Portfolio
Report of independent registered public accounting firm
To the Interest Holders of the Portfolio and Board of Trustees
Allspring Master Trust:
Opinion on the Financial Statements
We have audited the accompanying statement of assets and liabilities of Allspring Small Company Growth Portfolio (formerly, Wells Fargo Small Company Growth Portfolio) (the Portfolio), one of the portfolios constituting Allspring Master Trust (formerly, Wells Fargo Master Trust), including the portfolio of investments, as of May 31, 2022, the related statement of operations for the year then ended, the statements of changes in net assets for each of the years in the two-year period then ended, and the related notes (collectively, the financial statements) and the financial highlights for each of the years in the five-year period then ended. In our opinion, the financial statements and financial highlights present fairly, in all material respects, the financial position of the Portfolio as of May 31, 2022, the results of its operations for the year then ended, the changes in its net assets for each of the years in the two-year period then ended, and the financial highlights for each of the years in the five-year period then ended, in conformity with U.S. generally accepted accounting principles.
Basis for Opinion
These financial statements and financial highlights are the responsibility of the Portfolio’s management. Our responsibility is to express an opinion on these financial statements and financial highlights based on our audits. We are a public accounting firm registered with the Public Company Accounting Oversight Board (United States) (PCAOB) and are required to be independent with respect to the Portfolio in accordance with the U.S. federal securities laws and the applicable rules and regulations of the Securities and Exchange Commission and the PCAOB.
We conducted our audits in accordance with the standards of the PCAOB. Those standards require that we plan and perform the audit to obtain reasonable assurance about whether the financial statements and financial highlights are free of material misstatement, whether due to error or fraud. Our audits included performing procedures to assess the risks of material misstatement of the financial statements and financial highlights, whether due to error or fraud, and performing procedures that respond to those risks. Such procedures included examining, on a test basis, evidence regarding the amounts and disclosures in the financial statements and financial highlights. Such procedures also included confirmation of securities owned as of May 31, 2022, by correspondence with the custodian and transfer agent. Our audits also included evaluating the accounting principles used and significant estimates made by management, as well as evaluating the overall presentation of the financial statements and financial highlights. We believe that our audits provide a reasonable basis for our opinion.
We have not been able to determine the specific year that we began serving as the auditor of one or more Allspring Funds investment companies; however, we are aware that we have served as the auditor of one or more Allspring Funds investment companies since at least 1955.
Boston, Massachusetts
July 27, 2022
Allspring Small Company Growth Portfolio | 41
Other information (unaudited)
TAX INFORMATION
For corporate shareholders, pursuant to Section 854 of the Internal Revenue Code, 13% of ordinary income dividends qualify for the corporate dividends-received deduction for the fiscal year ended May 31, 2022.
Pursuant to Section 852 of the Internal Revenue Code, $360,425,433 was designated as a 20% rate gain distribution for the fiscal year ended May 31, 2022.
Pursuant to Section 854 of the Internal Revenue Code, $6,096,315 of income dividends paid during the fiscal year ended May 31, 2022 has been designated as qualified dividend income (QDI).
For the fiscal year ended May 31, 2022, $41,089,472 has been designated as short-term capital gain dividends for nonresident alien shareholders pursuant to Section 871 of the Internal Revenue Code.
PROXY VOTING INFORMATION
A description of the policies and procedures used to determine how to vote proxies relating to portfolio securities is available without charge, upon request, by calling 1-800-222-8222, visiting our website at allspringglobal.com, or visiting the SEC website at sec.gov. Information regarding how the proxies related to portfolio securities were voted during the most recent 12-month period ended June 30 is available on the website at allspringglobal.com or by visiting the SEC website at sec.gov.
QUARTERLY PORTFOLIO HOLDINGS INFORMATION
The Fund and Portfolio file their complete schedule of portfolio holdings with the SEC for the first and third quarters of each fiscal year as an exhibit to their reports on Form N-PORT. Shareholders and Interest holders may view the filed Form N-PORT by visiting the SEC website at sec.gov.
42 | Allspring Small Company Growth Fund
Other information (unaudited)
BOARD OF TRUSTEES AND OFFICERS
Each of the Trustees and Officers listed in the table below acts in identical capacities for each fund in the Allspring family of funds, which consists of 137 mutual funds comprising the Allspring Funds Trust, Allspring Variable Trust, Allspring Master Trust and four closed-end funds (collectively the “Fund Complex”). This table should be read in conjunction with the Prospectus and the Statement of Additional Information1. The mailing address of each Trustee and Officer is 525 Market Street, 12th Floor, San Francisco, CA 94105. Each Trustee and Officer serves an indefinite term, however, each Trustee serves such term until reaching the mandatory retirement age established by the Trustees.
Independent Trustees
Name and
year of birth | Position held and
length of service* | Principal occupations during past five years or longer | Current other
public company or
investment
company
directorships |
William R. Ebsworth
(Born 1957) | Trustee,
since 2015 | Retired. From 1984 to 2013, equities analyst, portfolio manager, research director and chief investment officer at Fidelity Management and Research Company in Boston, Tokyo, and Hong Kong, and retired in 2013 as Chief Investment Officer of Fidelity Strategic Advisers, Inc. where he led a team of investment professionals managing client assets. Prior thereto, Board member of Hong Kong Securities Clearing Co., Hong Kong Options Clearing Corp., the Thailand International Fund, Ltd., Fidelity Investments Life Insurance Company, and Empire Fidelity Investments Life Insurance Company. Audit Committee Chair and Investment Committee Chair of the Vincent Memorial Hospital Endowment (non-profit organization). Mr. Ebsworth is a CFA® charterholder. | N/A |
Jane A. Freeman
(Born 1953) | Trustee,
since 2015;
Chair Liaison,
since 2018 | Retired. From 2012 to 2014 and 1999 to 2008, Chief Financial Officer of Scientific Learning Corporation. From 2008 to 2012, Ms. Freeman provided consulting services related to strategic business projects. Prior to 1999, Portfolio Manager at Rockefeller & Co. and Scudder, Stevens & Clark. Board member of the Harding Loevner Funds from 1996 to 2014, serving as both Lead Independent Director and chair of the Audit Committee. Board member of the Russell Exchange Traded Funds Trust from 2011 to 2012 and the chair of the Audit Committee. Ms. Freeman is also an inactive Chartered Financial Analyst. | N/A |
Isaiah Harris, Jr.
(Born 1952) | Trustee,
since 2009; Audit
Committee
Chair,
since 2019 | Retired. Chairman of the Board of CIGNA Corporation from 2009 to 2021, and Director from 2005 to 2008. From 2003 to 2011, Director of Deluxe Corporation. Prior thereto, President and CEO of BellSouth Advertising and Publishing Corp. from 2005 to 2007, President and CEO of BellSouth Enterprises from 2004 to 2005 and President of BellSouth Consumer Services from 2000 to 2003. Emeritus member of the Iowa State University Foundation Board of Governors. Emeritus Member of the Advisory Board of Iowa State University School of Business. Advisory Board Member, Palm Harbor Academy (private school). Advisory Board Member, Fellowship of Christian Athletes. Mr. Harris is a certified public accountant (inactive status). | N/A |
David F. Larcker
(Born 1950) | Trustee,
since 2009 | James Irvin Miller Professor of Accounting at the Graduate School of Business (Emeritus), Stanford University, Director of the Corporate Governance Research Initiative and Senior Faculty of The Rock Center for Corporate Governance since 2006. From 2005 to 2008, Professor of Accounting at the Graduate School of Business, Stanford University. Prior thereto, Ernst & Young Professor of Accounting at The Wharton School, University of Pennsylvania from 1985 to 2005. | N/A |
Allspring Small Company Growth Fund | 43
Other information (unaudited)
Name and
year of birth | Position held and
length of service* | Principal occupations during past five years or longer | Current other
public company or
investment
company
directorships |
Olivia S. Mitchell
(Born 1953) | Trustee,
since 2006;
Nominating and
Governance
Committee Chair,
since 2018 | International Foundation of Employee Benefit Plans Professor since 1993, Wharton School of the University of Pennsylvania. Director of Wharton’s Pension Research Council and Boettner Center on Pensions & Retirement Research, and Research Associate at the National Bureau of Economic Research. Previously taught at Cornell University from 1978 to 1993. | N/A |
Timothy J. Penny
(Born 1951) | Trustee,
since 1996;
Chair,
since 2018 | President and Chief Executive Officer of Southern Minnesota Initiative Foundation, a non-profit organization, since 2007. Member of the Board of Trustees of NorthStar Education Finance, Inc., a non-profit organization, since 2007. | N/A |
James G. Polisson
(Born 1959) | Trustee,
since 2018 | Retired. Chief Marketing Officer, Source (ETF) UK Services, Ltd, from 2015 to 2017. From 2012 to 2015, Principal of The Polisson Group, LLC, a management consulting, corporate advisory and principal investing company. Chief Executive Officer and Managing Director at Russell Investments, Global Exchange Traded Funds from 2010 to 2012. Managing Director of Barclays Global Investors from 1998 to 2010 and Global Chief Marketing Officer for iShares and Barclays Global Investors from 2000 to 2010. Trustee of the San Francisco Mechanics’ Institute, a non-profit organization, from 2013 to 2015. Board member of the Russell Exchange Traded Fund Trust from 2011 to 2012. Director of Barclays Global Investors Holdings Deutschland GmbH from 2006 to 2009. Mr. Polisson is an attorney and has a retired status with the Massachusetts and District of Columbia Bar Associations. | N/A |
Pamela Wheelock
(Born 1959) | Trustee,
since January
2020; previously
Trustee from
January 2018 to
July 2019 | Board member of the Destination Medical Center Economic Development Agency, Rochester, Minnesota since 2019. Interim President of the McKnight Foundation from January to September 2020. McKnight Foundation Consultant, November 2020 to February 2021. Acting Commissioner, Minnesota Department of Human Services, July 2019 through September 2019. Consultant (part-time), Minnesota Department of Human Services, October 2019 through December 2019. Chief Operating Officer, Twin Cities Habitat for Humanity from 2017 to 2019. Vice President of University Services, University of Minnesota from 2012 to 2016. Prior thereto, on the Board of Directors, Governance Committee and Finance Committee for the Minnesota Philanthropy Partners (Saint Paul Foundation) from 2012 to 2018, Interim Chief Executive Officer of Blue Cross Blue Shield of Minnesota from 2011 to 2012, Chairman of the Board from 2009 to 2012 and Board Director from 2003 to 2015. Vice President, Leadership and Community Engagement, Bush Foundation, Saint Paul, Minnesota (a private foundation) from 2009 to 2011. Executive Vice President and Chief Financial Officer, Minnesota Sports and Entertainment from 2004 to 2009 and Senior Vice President from 2002 to 2004. Executive Vice President of the Minnesota Wild Foundation from 2004 to 2008. Commissioner of Finance, State of Minnesota, from 1999 to 2002. Currently Board Chair of the Minnesota Wild Foundation since 2010. | N/A |
* Length of service dates reflect the Trustee’s commencement of service with the Trust’s predecessor entities, where applicable.
44 | Allspring Small Company Growth Fund
Other information (unaudited)
Officers2
Name and
year of birth | Position held and
length of service | Principal occupations during past five years or longer |
Andrew Owen
(Born 1960) | President,
since 2017 | President, Chief Executive Officer and Director of Allspring Funds Management, LLC since 2017 and co-president of Galliard Capital Management, LLC, an affiliate of Allspring Funds Management, LLC, since 2019. Prior thereto, Head of Affiliated Managers, Allspring Global Investments, from 2014 to 2019 and Executive Vice President responsible for marketing, investments and product development for Allspring Funds Management, LLC, from 2009 to 2014. In addition, Mr. Owen was an Executive Vice President of Wells Fargo & Company from 2014 to 2021. |
Jeremy DePalma
(Born 1974) | Treasurer,
since 2012
(for certain funds in
the Fund Complex);
since 2021 (for
the remaining funds in the
Fund Complex) | Senior Vice President of Allspring Funds Management, LLC since 2009. Senior Vice President of Evergreen Investment Management Company, LLC from 2008 to 2010 and head of the Fund Reporting and Control Team within Fund Administration from 2005 to 2010. |
Kate McKinley
(Born 1977) | Chief Legal Officer,
since 2021 | Chief Legal Officer of Allspring Global Investments since 2021. Prior thereto, held various roles at State Street Global Advisors beginning in 2010, including serving as Senior Vice President and General Counsel from 2019 to 2021, and Chief Operating Officer of the Institutional Client Group from 2016 - 2019. Prior to working at State Street Global Advisors served as Assistant General Counsel for Bank of America Corporation from 2005 to 2010 and as an Associate at WilmerHale from 2002 to 2005. |
Christopher Baker
(Born 1976) | Chief Compliance Officer, since 2022 | Global Chief Compliance Officer for Allspring Global Investments since 2022. Prior thereto, Chief Compliance Officer for State Street Global Advisors from 2018 to 2021. Senior Compliance Officer for the State Street divisions of Alternative Investment Solutions, Sector Solutions, and Global Marketing from 2015 to 2018. From 2010 to 2015 Vice President, Global Head of Investment and Marketing Compliance for State Street Global Advisors. |
Matthew Prasse
(Born 1983) | Secretary,
since 2021 | Senior Counsel of the Allspring Legal Department since 2021. Senior Counsel of the Wells Fargo Legal Department from 2018 to 2021. Previously, Counsel for Barings LLC from 2015 to 2018. Prior to joining Barings, Associate at Morgan, Lewis & Bockius LLP from 2008 to 2015. |
1 The Statement of Additional Information includes additional information about the Trustees and is available, without charge, upon request, by calling 1-800-222-8222 or by visiting the website at allspringglobal.com.
2 For those Officers with tenures at Allspring Global Investments and/or Allspring Funds Management, LLC that began prior to 2021, such tenures include years of service during which these businesses/entities were known as Wells Fargo Asset Management and Wells Fargo Funds Management, LLC, respectively.
Allspring Small Company Growth Fund | 45
Other information (unaudited)
LIQUIDITY RISK MANAGEMENT PROGRAM
In accordance with Rule 22e-4 under the Investment Company Act of 1940, as amended (the “Liquidity Rule”), Allspring Funds Trust (“Funds Trust”) has adopted and implemented a liquidity risk management program (the “Program”) on behalf of each of its series (other than the series that operate as money market funds), including the Fund, and Allspring Master Trust (“Master Trust” and together with Funds Trust, the “Trusts”) has adopted and implemented the Program on behalf of each of its series, including the Portfolio, which is reasonably designed to assess and manage the Fund's and the Portfolio’s liquidity risk. “Liquidity risk” is defined under the Liquidity Rule as the risk that the Fund or Portfolio is unable to meet redemption requests without significantly diluting remaining investors’ interests in the Fund or Portfolio. The Trusts’ Boards of Trustees (the “Boards”) previously approved the designation of Allspring Funds Management, LLC (“Allspring Funds Management”), the Fund's investment manager and the Portfolio’s investment adviser, to administer the Program, and Allspring Funds Management has established a Liquidity Risk Management Council (the "Council") composed of personnel from multiple departments within Allspring Funds Management and its affiliates to assist Allspring Funds Management in the administration of the Program.
The Program is comprised of various components designed to support the assessment and/or management of liquidity risk, including: (1) the periodic assessment (no less frequently than annually) of certain factors that influence the Fund's and the Portfolio’s liquidity risk; (2) the periodic classification (no less frequently than monthly) of the Fund's and the Portfolio’s investments into one of four liquidity categories that reflect an estimate of their liquidity under current market conditions; (3) a 15% limit on the acquisition of “illiquid investments” (as defined under the Liquidity Rule); (4) to the extent the Fund or the Portfolio does not invest primarily in “highly liquid investments” (as defined under the Liquidity Rule), the determination of a minimum percentage of the Fund's or Portfolio’s assets that generally will be invested in highly liquid investments (an “HLIM”); (5) if the Fund or the Portfolio has established an HLIM, the periodic review (no less frequently than annually) of the HLIM and the adoption of policies and procedures for responding to a shortfall of the Fund's or the Portfolio’s “highly liquid investments” below its HLIM; and (6) periodic reporting to the Boards.
At a meeting of the Boards held on May 24-25, 2022, the Boards received and reviewed a written report (the “Report”) from Allspring Funds Management that, among other things, addressed the operation of the Program and assessed its adequacy and effectiveness for the period from January 1, 2021 through December 31, 2021 (the “Reporting Period”). Other than extended foreign market holidays, no significant liquidity events impacting the Funds or the Portfolios were noted in the Report. In addition, other than corporate-related changes to the Program, there were no material changes to the Program during the Reporting Period.
Allspring Funds Management determined in the Report that the Program has been implemented and operates effectively to manage each Fund’s and Portfolio’s, including the Fund’s and the Portfolio’s, liquidity risk, and Allspring Funds Management continues to believe that the Program has been and continues to be adequately and effectively implemented to monitor and, as applicable, respond to the Fund’s and the Portfolio’s liquidity developments.
There can be no assurance that the Program will achieve its objectives under all circumstances in the future. With respect to the Fund, please refer to the Fund’s prospectus for more information regarding the Fund’s exposure to liquidity risk and other risks to which an investment in the Fund may be subject.
46 | Allspring Small Company Growth Fund
For more information
More information about Allspring Funds is available free upon request. To obtain literature, please write, visit the Fund's website, or call:
Allspring Funds
P.O. Box 219967
Kansas City, MO 64121-9967
Website: allspringglobal.com
Individual investors: 1-800-222-8222
Retail investment professionals: 1-888-877-9275
Institutional investment professionals: 1-800-260-5969
This report and the financial statements contained herein are submitted for the general information of the shareholders of the Fund. If this report is used for promotional purposes, distribution of the report must be accompanied or preceded by a current prospectus. Before investing, please consider the investment objectives, risks, charges, and expenses of the investment. For a current prospectus and, if available, a summary prospectus, containing this information, call
1-800-222-8222 or visit the Fund's website at allspringglobal.com. Read the prospectus carefully before you invest or send money.
Allspring Global InvestmentsTM is the trade name for the asset management firms of Allspring Global Investments Holdings, LLC, a holding company indirectly owned by certain private funds of GTCR LLC and Reverence Capital Partners, L.P. These firms include but are not limited to Allspring Global Investments, LLC, and Allspring Funds Management, LLC. Certain products managed by Allspring entities are distributed by Allspring Funds Distributor, LLC (a broker-dealer and Member FINRA/SIPC).
This material is for general informational and educational purposes only and is NOT intended to provide investment advice or a recommendation of any kind - including a recommendation for any specific investment, strategy, or plan.
© 2022 Allspring Global Investments Holdings, LLC. All rights reserved.
PAR-0622-00233 07-22
A285/AR285 05-22
Annual Report
May 31, 2022
Allspring
Small Company Value Fund
The views expressed and any forward-looking statements are as of May 31, 2022, unless otherwise noted, and are those of the Fund's portfolio managers and/or Allspring Global Investments. Discussions of individual securities or the markets generally are not intended as individual recommendations. Future events or results may vary significantly from those expressed in any forward-looking statements. The views expressed are subject to change at any time in response to changing circumstances in the market. Allspring Global Investments disclaims any obligation to publicly update or revise any views expressed or forward-looking statements.
Allspring Small Company Value Fund | 1
Letter to shareholders (unaudited)
Andrew Owen
President
Allspring Funds
Dear Shareholder:
We are pleased to offer you this annual report for the Allspring Small Company Value Fund for the 12-month period that ended May 31, 2022. Globally, stocks experienced rising volatility through the period, but overall, U.S. stocks outperformed non-U.S. equities as the global economy faced multiple challenges. Bonds also had poor performance during a difficult period, with major fixed income indexes all down for the 12-month period.
Earlier tailwinds provided by global stimulus programs, vaccination rollouts, and recovering consumer and corporate sentiment were more than offset by the highest rate of inflation in decades, concerns about sharp central bank rate hikes, more highly contagious COVID-19 variants, and the Russian invasion of Ukraine. The impact of already-significant supply chain disruptions were made worse by China’s COVID-19 lockdowns.
For the 12-month period, U.S. large-cap stocks led both non-U.S. developed market equities and emerging market stocks. Returns by fixed-income securities were negative as rising inflation created new challenges. For the period, U.S. stocks, based on the S&P 500 Index,1 lost 0.30%. International stocks, as measured by the MSCI ACWI ex USA Index (Net),2 returned -12.41%, while the MSCI EM Index (Net) (USD)3 had weaker performance with a loss of 19.83%. Among bond indexes, the Bloomberg U.S. Aggregate Bond Index4 returned -8.22%, the Bloomberg Global Aggregate ex-USD Index (unhedged)5 returned -16.68%, the Bloomberg Municipal Bond Index6 lost 6.79%, and the ICE BofA U.S. High Yield Index7 fell 5.00%.
Rising inflation, COVID, and the Russian invasion of Ukraine in February drove market performance.
The period began with the S&P 500 Index reaching an all-time high in June 2021. In late June, the U.S. Congress reached a deal on a $1 trillion infrastructure package for road, bridge, and broadband network upgrades over the next eight years. The U.S. Federal Reserve’s (Fed) June meeting yielded no change to policy, but it forecast a possible interest rate rise in 2023. This, combined with a rebound in economic activity and investors searching for yield, led to a decline in U.S. Treasury yields. Many European and Asian countries saw vaccination momentum increase, while COVID-19 infections rose in the U.K. Meanwhile, the price of crude oil jumped over 10% in Jun,.e as global economic activity picked up and the Organization of the Petroleum Exporting Countries (OPEC) slowed the pace of supply growth.
| 1 | The S&P 500 Index consists of 500 stocks chosen for market size, liquidity, and industry group representation. It is a market-value-weighted index with each stock's weight in the index proportionate to its market value. You cannot invest directly in an index. |
| 2 | The Morgan Stanley Capital International (MSCI) All Country World Index (ACWI) ex USA Index (Net) is a free-float-adjusted market-capitalization-weighted index that is designed to measure the equity market performance of developed and emerging markets, excluding the U.S. Source: MSCI. MSCI makes no express or implied warranties or representations and shall have no liability whatsoever with respect to any MSCI data contained herein. The MSCI data may not be further redistributed or used as a basis for other indexes or any securities or financial products. This report is not approved, reviewed, or produced by MSCI. You cannot invest directly in an index. |
| 3 | The MSCI Emerging Markets (EM) Index (Net) (USD) is a free-float-adjusted market-capitalization-weighted index that is designed to measure equity market performance of emerging markets. You cannot invest directly in an index. |
| 4 | The Bloomberg U.S. Aggregate Bond Index is a broad-based benchmark that measures the investment-grade, U.S.-dollar-denominated, fixed-rate taxable bond market, including Treasuries, government-related and corporate securities, mortgage-backed securities (agency fixed-rate and hybrid adjustable-rate mortgage pass-throughs), asset-backed securities, and commercial mortgage-backed securities. You cannot invest directly in an index. |
| 5 | The Bloomberg Global Aggregate ex-USD Index (unhedged) is an unmanaged index that provides a broad-based measure of the global investment-grade fixed-income markets excluding the U.S.-dollar-denominated debt market. You cannot invest directly in an index. |
| 6 | The Bloomberg Municipal Bond Index is an unmanaged index composed of long-term tax-exempt bonds with a minimum credit rating of Baa. You cannot invest directly in an index. |
| 7 | The ICE BofA U.S. High Yield Index is a market-capitalization-weighted index of domestic and Yankee high-yield bonds. The index tracks the performance of high-yield securities traded in the U.S. bond market. You cannot invest directly in an index. Copyright 2022. ICE Data Indices, LLC. All rights reserved. |
2 | Allspring Small Company Value Fund
Letter to shareholders (unaudited)
Inflation continued to climb in July, fueled by the ongoing supply bottleneck and high demand. Monthly U.S. equity gains led those of international developed markets. In contrast, emerging markets had losses for the month, hindered by China’s plans for new regulations, particularly in education and technology. The U.S. 10-year Treasury bond yield continued to decline as strong demand swallowed up supply. After hitting a multiyear high earlier in the month, oil prices leveled off as OPEC agreed to raise oil production.
The COVID-19 Delta variant produced outbreaks globally in August, feeding market volatility and casting doubts over the ongoing economic recovery. The U.S. economy remained strong despite the Delta variant, ongoing inflationary pressures, and worries over Hurricane Ida. Emerging market equities experienced elevated volatility, largely influenced by China’s regulatory stance. Municipal debt had its first monthly loss since February. Among commodities, crude oil fell sharply as the Delta variant caused expectations to dampen. However, oil remained a leading asset-class performer for the year.
Global markets suffered their broadest retreat in a year during September, except for commodities, as concerns over inflation and the interest rate outlook depressed investor confidence. Emerging markets declined on concerns over supply chain disruptions along with rising energy and food prices. Meanwhile, the Fed indicated it would soon start to slow the pace of asset purchases. U.S. concerns included a congressional showdown over the debt ceiling, the 2022 federal government budget, and the infrastructure package. Meanwhile, commodities thrived in September, driven by sharply higher energy prices.
Elevated inflation pressures and the global supply bottleneck continued in October, but strong earnings provided a bright spot in the U.S., the eurozone, and many Asian countries. Government bond yields rose globally as central banks prepared to tighten monetary policy. Commodity prices continued to rise, driven by sharply higher energy costs.
In November, as COVID-19 hospitalizations rose, most major global asset classes declined. Two exceptions were U.S. investment-grade bonds and Treasury Inflation-Protected Securities. President Biden signed a long-awaited infrastructure bill to upgrade U.S. roads, bridges, and railways. Meanwhile, the Consumer Price Index (CPI)1, a measure of domestic inflation conditions, jumped to its highest level in 31 years. While the threat of consistently high inflation led the Fed to discuss a faster pace of tapering, the Omicron strain created uncertainty. Commodities lost ground for the month, driven by sharp declines in oil prices (and energy costs in general) as well as precious metals.
Global volatility lessened in December as data indicated a lower risk of severe disease and death from the Omicron variant. Even so, several countries introduced restrictions on travel and hospitality, among other sectors, in an effort to reduce the spread. In the U.S., data indicated a stable economy overall, with robust corporate earnings. Consumer spending potential looked strong heading into 2022 on elevated household savings and the lowest household debt ratio since 1973. U.S. corporate and high-yield bonds had monthly gains while Treasuries declined. Bonds were strongly affected by the projection of multiple rate hikes in 2022 by senior Federal Open Market Committee members.
In January 2022, the main focus was on potential U.S. interest rate hikes and the Russia-Ukraine conflict. The Fed hinted that a March interest rate hike was likely. Meanwhile, Russia threatened a potential invasion of Ukraine, which could disrupt Russia’s massive energy supplies and drive demand from non-Russian oil-producing countries. Elsewhere overseas, Europe saw food and energy prices spike, leading to rising inflation. Within fixed income, corporate bonds struggled in January, underperforming government bonds, as investors focused on continued elevated inflation and ongoing uncertainty over the U.S. monetary path.
“ Global markets suffered their broadest retreat in a year during September, except for commodities, as concerns over inflation and the interest rate outlook depressed investor confidence.”
| 1 | The Consumer Price Index (CPI) is a measure of the average change over time in the prices paid by urban consumers for a market basket of consumer goods and services. You cannot invest directly in an index. |
Allspring Small Company Value Fund | 3
Letter to shareholders (unaudited)
“ The Russian invasion of Ukraine dominated the financial world in February and March. Equity, bond, and commodity markets were shaken by fear, uncertainty, and an upending of demand-supply dynamics.” |
The Russian invasion of Ukraine dominated the financial world in February and March. Equity, bond, and commodity markets were shaken by fear, uncertainty, and an upending of demand-supply dynamics. Major global stock indexes were down in February, along with global bonds overall, with ongoing high levels of volatility in March along with mixed results that favored U.S. large-cap stocks. Prices of commodities spiked, including crude oil, natural gas, wheat, and precious metals, on elevated concerns of supply shortages. All of this fed already-high inflation concerns and added to expectations of more aggressive central bank interest rate hikes. Sweeping sanctions against Russia and corporate pullouts contributed to market volatility. Despite the geopolitical turmoil, the U.S. economic outlook remained largely unchanged, with a healthy job market and signs of economic resilience accompanying higher prices.
In April, market volatility continued, with deepening losses across major capital markets, as both the S&P 500 and MSCI ACWI (Net)1 fell 8% or more for the month. The Chinese economy struggled through a strict lockdown as the government tried to contain a major COVID-19 outbreak, creating a global ripple effect that compounded existing supply shortages. This was exacerbated by the impact of the Russia-Ukraine war on global commodities. Meanwhile, U.S. annual inflation raged at 8.5%, its highest level since 1981, and investors braced themselves for aggressive Fed monetary tightening moves.
Market volatility continued in May, but full-month returns belied that as markets recovered ground late in the month. Value stocks continued to outperform growth stocks. The concerns that had dominated markets for months continued, including high inflation (the CPI remained above 8%) and geopolitical tensions that exacerbated high crude oil, gasoline, and food prices. In response, the Fed raised the federal funds rate by 0.50%, with broad expectations of multiple rate hikes to come. Meanwhile, highly contagious COVID-19 variants persisted. However, labor markets in the U.S., the U.K., and Europe remained strong. The U.S. recorded a 3.6% unemployment rate, although labor market participation remained low. U.S. retail sales increased for the fourth consecutive month in April, indicating continued consumer resilience.
Don’t let short-term uncertainty derail long-term investment goals.
Periods of investment uncertainty can present challenges, but experience has taught us that maintaining long-term investment goals can be an effective way to plan for the future. To help you create a sound strategy based on your personal goals and risk tolerance, Allspring Funds offers more than 100 mutual funds spanning a wide range of asset classes and investment styles. Although diversification cannot guarantee an investment profit or prevent losses, we believe it can be an effective way to manage investment risk and potentially smooth out overall portfolio performance. We encourage investors to know their investments and to understand that appropriate levels of risk-taking may unlock opportunities.
Thank you for choosing to invest with Allspring Funds. We appreciate your confidence in us and remain committed to helping you meet your financial needs.
Sincerely,
Andrew Owen
President
Allspring Funds
For further information about your fund, contact your investment professional, visit our website at allspringglobal.com, or call us directly at 1-800-222-8222.
| 1 | The MSCI ACWI (Net) is a free-float-adjusted market-capitalization-weighted index that is designed to measure the equity market performance of developed and emerging markets. You cannot invest directly in an index. |
4 | Allspring Small Company Value Fund
Letter to shareholders (unaudited)
Notice to Shareholders
Russia launched a large-scale invasion of Ukraine on February 24, 2022. As a result of this military action, the United States and many other countries have instituted various economic sanctions against Russian and Belarus individuals and entities. The situation has led to increased financial market volatility and has had severe adverse effects on regional and global economic markets, including the markets for certain securities and commodities, such as oil and natural gas. The extent and duration of the military action, resulting sanctions imposed, other punitive action taken and the resulting market disruptions cannot be easily predicted.
Our solidarity and support goes out to our impacted employees and the people affected in Ukraine and their families. Allspring has a dedicated team of investment professionals actively monitoring the situation for any new developments and the potential impact to our clients and investment products. As the situation remains fluid, we are focused on the assessment of risks, valuation, and liquidity of impacted securities. Please visit our website at allspringglobal.com and click on “Russia-Ukraine Updates” for further information.
Allspring Small Company Value Fund | 5
Performance highlights (unaudited)
Investment objectiveThe Fund seeks long-term capital appreciation.
| Manager | Allspring Funds Management, LLC |
Subadviser for the affiliated master portfolio*
Allspring Global Investments, LLC
| Portfolio managers | Gustaf Little#, Jeff Goverman, Garth R. Nisbet, CFA®‡, Craig Pieringer, CFA®‡ |
| Average annual total returns (%) as of May 31, 2022 |
| | | Including sales charge | | Excluding sales charge | | Expense ratios1 (%) |
| | Inception date | 1 year | 5 year | 10 year | | 1 year | 5 year | 10 year | | Gross | Net 2 |
| Class A (SCVAX) | 1-31-2002 | -7.45 | 7.83 | 10.29 | | -1.80 ♠ | 9.12 | 10.94 | | 1.35 | 1.15 |
| Class C (SCVFX) | 8-30-2002 | -3.56 | 8.34 | 10.28 | | -2.56 | 8.34 | 10.28 | | 2.10 | 1.90 |
| Class R6 (SCVJX)3 | 10-31-2016 | – | – | – | | -1.41 | 9.56 | 11.31 | | 0.92 | 0.75 |
| Administrator Class (SCVIX) | 1-31-2002 | – | – | – | | -1.71 | 9.23 | 11.11 | | 1.27 | 1.05 |
| Institutional Class (SCVNX) | 7-30-2010 | – | – | – | | -1.53 | 9.45 | 11.34 | | 1.02 | 0.85 |
| Russell 2000® Value Index4 | – | – | – | – | | -7.67 | 7.83 | 10.71 | | – | – |
Figures quoted represent past performance, which is no guarantee of future results, and do not reflect taxes that a shareholder may pay on an investment in a fund. Investment return and principal value of an investment will fluctuate so that an investor’s shares, when redeemed, may be worth more or less than their original cost. Performance shown without sales charges would be lower if sales charges were reflected. Current performance may be lower or higher than the performance data quoted, which assumes the reinvestment of dividends and capital gains. Current month-end performance is available on the Fund’s website, allspringglobal.com.
Index returns do not include transaction costs associated with buying and selling securities, any mutual fund fees or expenses, or any taxes. It is not possible to invest directly in an index.
For Class A shares, the maximum front-end sales charge is 5.75%. For Class C shares, the maximum contingent deferred sales charge is 1.00%. Performance including a contingent deferred sales charge assumes the sales charge for the corresponding time period. Class R6, Administrator Class and Institutional Class shares are sold without a front-end sales charge or contingent deferred sales charge.
| ♠ | Total return differs from the return in the Financial Highlights in this report. The total return presented is calculated based on the Net Asset Value (NAV) at which the shareholder transactions were processed. The NAV and total return presented in the Financial Highlights reflects certain adjustments made to the net assets of the Fund that are necessary under U.S. generally accepted accounting principles. |
| 1 | Reflects the expense ratios as stated in the most recent prospectuses, which include the impact of 0.03% in acquired fund fees and expenses. The expense ratios shown are subject to change and may differ from the annualized expense ratios shown in the financial highlights of this report, which do not include acquired fund fees and expenses. |
| 2 | The manager has contractually committed through September 30, 2022, to waive fees and/or reimburse expenses to the extent necessary to cap total annual fund operating expenses after fee waivers at 1.15% for Class A, 1.90% for Class C, 0.75% for Class R6, 1.05% for Administrator Class, and 0.85% for Institutional Class. Brokerage commissions, stamp duty fees, interest, taxes, acquired fund fees and expenses (if any) from funds in which the affiliated master portfolio invests, and extraordinary expenses are excluded from the expense caps. Net expenses from the affiliated master portfolio are included in the expense caps. Prior to or after the commitment expiration date, the caps may be increased or the commitment to maintain the caps may be terminated only with the approval of the Board of Trustees. Without these caps, the Fund’s returns would have been lower. The expense ratio paid by an investor is the net expense ratio (the total annual fund operating expenses after fee waivers) as stated in the prospectuses. |
| 3 | Historical performance shown for the Class R6 shares prior to their inception reflects the performance of the Institutional Class shares, and includes the higher expenses applicable to the Institutional Class shares. If these expenses had not been included, returns for the Class R6 shares would be higher. |
| 4 | The Russell 2000® Value Index measures the performance of those Russell 2000 companies with lower price/book ratios and lower forecasted growth values. You cannot invest directly in an index. |
Stock values fluctuate in response to the activities of individual companies and general market and economic conditions. Smaller-company stocks tend to be more volatile and less liquid than those of larger companies. Certain investment strategies tend to increase the total risk of an investment (relative to the broader market). Consult the Fund’s prospectus for additional information on these and other risks.
| * | The Fund is a feeder fund in a master-feeder structure that invests substantially all of its assets in a single affiliated master portfolio of the Allspring Master Trust with a substantially identical investment objective and substantially similar investment strategies. References to the investment activities of the Fund are intended to refer to the investment activities of the affiliated master portfolio in which it invests. |
| ‡ | CFA® and Chartered Financial Analyst® are trademarks owned by CFA Institute. |
| # | Mr. Little became a portfolio manager of the Fund on May 2, 2022. |
6 | Allspring Small Company Value Fund
Performance highlights (unaudited)
Growth of $10,000 investment as of May 31, 20221
| 1 | The chart compares the performance of Class A shares for the most recent ten years with the Russell 2000® Value Index. The chart assumes a hypothetical investment of $10,000 in Class A shares and reflects all operating expenses and assumes the maximum initial sales charge of 5.75%. |
Allspring Small Company Value Fund | 7
Performance highlights (unaudited)
MANAGER'S DISCUSSION
Fund highlights
| ■ | The Fund outperformed its benchmark, the Russell 2000® Value Index, for the 12-month period that ended May 31, 2022. |
| ■ | The health care and financials sectors were the primary contributors to relative performance. Within the health care sector, stock selection and allocation effect within biotechnology contributed to relative performance, while insurance stocks were the main contributor to performance within financials. |
| ■ | The consumer discretionary and utilities sectors detracted from relative performance. Within consumer discretionary, underperformance in hotels, restaurants, and specialty retail stocks were the main detractors from performance, while an underweight position in the outperforming utilities sector also detracted from performance. |
During the period, investor sentiment shifted from optimism related to the reopening of the economy to concerns over prolonged inflationary and supply chain challenges.
The major U.S. stock indexes reached all-time highs during the first week of January on the prospect of a rebounding economy following the COVID-19 pandemic. Then, almost on cue, a chorus of market challenges emerged: the Omicron variant spike in new COVID-19 cases, worsening supply chain and staffing shortages, rising inflation, a more hawkish U.S. Federal Reserve (Fed), and the outbreak of the Russia-Ukraine war. As the weight of the pandemic began to fade, the rise in inflation became a countervailing threat weighing on equity markets. Over the 12-month period, the S&P 500 Index* fell 0.30% while the Russell 2000® Value Index decreased 7.67%.
We increased exposure to defensive sectors that are more insulated from inflationary challenges.
Defensive sectors—such as utilities, consumer staples, and health care—provided opportunities in attractively valued companies where pricing power might augment future earnings through underappreciated top-line growth. Additionally, we invested in the stocks of semiconductor, technology, infrastructure, and auto parts companies supplying the electric vehicle market due to its favorable long-term growth prospects. Given the rising rate environment, we maintained healthy positions in our asset-sensitive banks, which should benefit from increasing net interest income. Conversely, we reduced positions in bond-proxy real estate investment trusts that we expect will be challenged in a rising rate environment.
| Ten largest holdings (%) as of May 31, 20221 |
| Marathon Oil Corporation | 2.33 |
| Patterson-UTI Energy Incorporated | 2.28 |
| Helmerich & Payne Incorporated | 1.99 |
| Diamondback Energy Incorporated | 1.98 |
| W&T Offshore Incorporated | 1.51 |
| Grocery Outlet Holding Corporation | 1.26 |
| Comfort Systems Incorporated | 1.25 |
| Pilgrim's Pride Corporation | 1.25 |
| Sanderson Farms Incorporated | 1.21 |
| American Equity Investment Life Holding Company | 1.20 |
| 1 | Each holding represents the Fund’s allocable portion of the affiliated master portfolio security. Figures represent each holding as a percentage of the Fund’s net assets. Holdings are subject to change and may have changed since the date specified. |
The health care and financials sectors were the primary contributors to relative performance.
Stock selection and an underweight position in the underperforming biotechnology industry contributed to performance within the health care sector. From a stock selection perspective, the shares of Chemocentryx, Inc., outperformed after receiving FDA approval of its drug avacopan, which is sold under the brand name TAVNEOS. TAVNEOS has the potential to become the standard of care in treating ANCA (anti-neutrophil cytoplasmic autoantibody)-associated vasculitis. Favorable stock selection in the portfolio's insurance and bank holdings were the primary drivers of the outperformance within financials. State Auto Financial Corp.**, a property and casualty insurance company headquartered in Columbus, Ohio, outperformed during the third quarter after Liberty Mutual Insurance offered to acquire the company for $52.00 per share in cash.
| * | The S&P 500 Index consists of 500 stocks chosen for market size, liquidity, and industry group representation. It is a market-value-weighted index with each stock's weight in the index proportionate to its market value. You cannot invest directly in an index. |
| ** | This security was no longer held at the end of the reporting period. |
8 | Allspring Small Company Value Fund
Performance highlights (unaudited)
The consumer discretionary and utilities sectors detracted from relative performance.
The consumer discretionary sector detracted from performance due to pressure on leisure products, specialty retail, and homebuilding-related stocks. Additionally, an overweight position in the underperforming consumer discretionary sector hurt performance. During the period, the consumer discretionary stocks in the Russell 2000® Value Index fell by more than 26%. Underperformance from the shares of American Eagle Outfitters, Inc., weighed on the sector's returns due to fears of slowing demand in the face of rising input costs. Additionally, the utilities sector detracted from the Fund's performance due to the Fund's underweight position in the outperforming sector.
| Sector allocation as of May 31, 20221 |
| 1 | Figures represent the sector allocation of the affiliated master portfolio as a percentage of the long-term investments of the affiliated master portfolio. These amounts are subject to change and may have changed since the date specified. |
The rotation to small-cap value continues.
The increase in rates is a double-edged sword. Higher interest rates from the Fed should allow banks to charge higher rates for loans, leading to higher spreads and improved profitability. Increased profitability for the financials sector, the largest in the Russell 2000® Value Index, should boost small-cap value stocks. How effectively the Fed can execute the tricky task of tightening without forcing the economy into a recession remains. Through recent economic developments and geopolitical uncertainty, small-cap value has continued to shine. There is a reason why small-cap value has been outperforming growth: The three conditions conducive to small-cap value outperformance—economic growth, rising inflation, and increasing rates—have all continued. We also believe that high uncertainty and volatility combine for a compelling case to stay with quality, as is our practice. In summary, we are optimistic about the prospects for our corner of small-cap value.
Allspring Small Company Value Fund | 9
Fund expenses (unaudited)
As a shareholder of the Fund, you incur two types of costs: (1) transaction costs, including sales charges (loads) on purchase payments and contingent deferred sales charges (if any) on redemptions and (2) ongoing costs, including management fees, distribution (12b-1) and/or shareholder servicing fees, and other Fund expenses. This example is intended to help you understand your ongoing costs (in dollars) of investing in the Fund and to compare these costs with the ongoing costs of investing in other mutual funds.
The example is based on an investment of $1,000 invested at the beginning of the six-month period and held for the entire period from December 1, 2021 to May 31, 2022.
Actual expenses
The “Actual” line of the table below provides information about actual account values and actual expenses. You may use the information in this line, together with the amount you invested, to estimate the expenses that you paid over the period. Simply divide your account value by $1,000 (for example, an $8,600 account value divided by $1,000 = 8.6), then multiply the result by the number in the “Actual” line under the heading entitled “Expenses paid during period” for your applicable class of shares to estimate the expenses you paid on your account during this period.
Hypothetical example for comparison purposes
The “Hypothetical” line of the table below provides information about hypothetical account values and hypothetical expenses based on the Fund’s actual expense ratio and an assumed rate of return of 5% per year before expenses, which is not the Fund’s actual return. The hypothetical account values and expenses may not be used to estimate the actual ending account balance or expenses you paid for the period. You may use this information to compare the ongoing costs of investing in the Fund and other funds. To do so, compare this 5% hypothetical example with the 5% hypothetical examples that appear in the shareholder reports of the other funds.
Please note that the expenses shown in the table are meant to highlight your ongoing costs only and do not reflect any transactional costs, such as sales charges (loads) and contingent deferred sales charges. Therefore, the “Hypothetical” line of the table is useful in comparing ongoing costs only, and will not help you determine the relative total costs of owning different funds. In addition, if these transactional costs were included, your costs would have been higher.
| | Beginning
account value
12-1-2021 | Ending
account value
5-31-2022 | Expenses
paid during
the period1,2 | Annualized net
expense ratio2 |
| Class A | | | | |
| Actual | $1,000.00 | $ 979.10 | $5.58 | 1.13% |
| Hypothetical (5% return before expenses) | $1,000.00 | $1,019.30 | $5.69 | 1.13% |
| Class C | | | | |
| Actual | $1,000.00 | $ 975.00 | $9.36 | 1.90% |
| Hypothetical (5% return before expenses) | $1,000.00 | $1,015.46 | $9.55 | 1.90% |
| Class R6 | | | | |
| Actual | $1,000.00 | $ 981.02 | $3.70 | 0.75% |
| Hypothetical (5% return before expenses) | $1,000.00 | $1,021.19 | $3.78 | 0.75% |
| Administrator Class | | | | |
| Actual | $1,000.00 | $ 979.32 | $5.18 | 1.05% |
| Hypothetical (5% return before expenses) | $1,000.00 | $1,019.70 | $5.29 | 1.05% |
| Institutional Class | | | | |
| Actual | $1,000.00 | $ 980.32 | $4.20 | 0.85% |
| Hypothetical (5% return before expenses) | $1,000.00 | $1,020.69 | $4.28 | 0.85% |
1 Expenses paid is equal to the annualized net expense ratio of each class multiplied by the average account value over the period, multiplied by 182 divided by 366 (to reflect the one-half-year period).
2 Amounts reflect net expenses allocated from the affiliated Master Portfolio in which the Fund invests.
10 | Allspring Small Company Value Fund
Portfolio of investments—May 31, 2022
| | | | | | Value |
| Investment companies: 99.91% | | | | | |
| Affiliated master portfolio: 99.91% | | | | | |
| Allspring Small Company Value Portfolio | | | | | $ 525,166,582 |
| Total Investment companies (Cost $421,028,133) | | | | | 525,166,582 |
| Total investments in securities (Cost $421,028,133) | 99.91% | | | | 525,166,582 |
| Other assets and liabilities, net | 0.09 | | | | 496,260 |
| Total net assets | 100.00% | | | | $525,662,842 |
Transactions with the affiliated Master Portfolio were as follows:
| | % of
ownership,
beginning
of period | % of
ownership,
end of
period | Net realized
gains
(losses) on
securities
transactions
allocated
from
affiliated
Master
Portfolio | Net
change in
unrealized
gains
(losses) on
securities
transactions
allocated
from
affiliated
Master
Portfolio | Dividends
allocated
from
affiliated
Master
Portfolio | Affiliated
income
allocated
from
affiliated
Master
Portfolio | Value,
end of
period | |
| Allspring Small Company Value Portfolio | 85.41% | 88.09% | $54,078,544 | $(68,307,228) | $7,691,503 | $30,435 | $525,166,582 | |
The accompanying notes are an integral part of these financial statements.
Allspring Small Company Value Fund | 11
Statement of assets and liabilities—May 31, 2022
| | |
| Assets | |
Investments in affiliated Master Portfolio, at value (cost $421,028,133)
| $ 525,166,582 |
Cash
| 24,659 |
Receivable for Fund shares sold
| 682,541 |
Receivable from manager
| 49,418 |
Prepaid expenses and other assets
| 124,247 |
Total assets
| 526,047,447 |
| Liabilities | |
Payable for Fund shares redeemed
| 182,540 |
Shareholder servicing fees payable
| 82,976 |
Administration fees payable
| 80,552 |
Trustees’ fees and expenses payable
| 3,529 |
Distribution fee payable
| 1,399 |
Accrued expenses and other liabilities
| 33,609 |
Total liabilities
| 384,605 |
Total net assets
| $525,662,842 |
| Net assets consist of | |
Paid-in capital
| $ 414,615,019 |
Total distributable earnings
| 111,047,823 |
Total net assets
| $525,662,842 |
| Computation of net asset value and offering price per share | |
Net assets – Class A
| $ 376,071,836 |
Shares outstanding – Class A1
| 10,965,333 |
Net asset value per share – Class A
| $34.30 |
Maximum offering price per share – Class A2
| $36.39 |
Net assets – Class C
| $ 2,278,190 |
Shares outstanding – Class C1
| 76,473 |
Net asset value per share – Class C
| $29.79 |
Net assets – Class R6
| $ 8,020,811 |
Shares outstanding – Class R61
| 226,225 |
Net asset value per share – Class R6
| $35.46 |
Net assets – Administrator Class
| $ 23,812,842 |
Shares outstanding – Administrator Class1
| 677,467 |
Net asset value per share – Administrator Class
| $35.15 |
Net assets – Institutional Class
| $ 115,479,163 |
Shares outstanding – Institutional Class1
| 3,271,225 |
Net asset value per share – Institutional Class
| $35.30 |
| 1 | The Fund has an unlimited number of authorized shares. |
| 2 | Maximum offering price is computed as 100/94.25 of net asset value. On investments of $50,000 or more, the offering price is reduced. |
The accompanying notes are an integral part of these financial statements.
12 | Allspring Small Company Value Fund
Statement of operations—year ended May 31, 2022
| | |
| Investment income | |
Dividends allocated from affiliated Master Portfolio (net of foreign withholding taxes of $12,036)
| $ 7,691,503 |
Affiliated income allocated from affiliated Master Portfolio
| 30,435 |
Expenses allocated from affiliated Master Portfolio
| (4,381,960) |
Waivers allocated from affiliated Master Portfolio
| 468,526 |
Total investment income
| 3,808,504 |
| Expenses | |
Management fee
| 264,623 |
| Administration fees | |
Class A
| 839,906 |
Class C
| 6,140 |
Class R6
| 2,367 |
Administrator Class
| 37,985 |
Institutional Class
| 116,036 |
| Shareholder servicing fees | |
Class A
| 999,889 |
Class C
| 7,296 |
Administrator Class
| 73,038 |
| Distribution fee | |
Class C
| 21,886 |
Custody and accounting fees
| 13,922 |
Professional fees
| 49,829 |
Registration fees
| 63,119 |
Shareholder report expenses
| 85,902 |
Trustees’ fees and expenses
| 20,687 |
Other fees and expenses
| 136,483 |
Total expenses
| 2,739,108 |
| Less: Fee waivers and/or expense reimbursements | |
Fund-level
| (752,385) |
Class A
| (159,982) |
Class C
| (877) |
Administrator Class
| (14,610) |
Net expenses
| 1,811,254 |
Net investment income
| 1,997,250 |
| Realized and unrealized gains (losses) on investments | |
| Net realized gains on | |
Securities transactions allocated from affiliated Master Portfolio
| 54,078,544 |
Litigation payments
| 1,728,343 |
Net realized gains on investments
| 55,806,887 |
Net change in unrealized gains (losses) on securities transactions allocated from affiliated Master Portfolio
| (68,307,228) |
Net realized and unrealized gains (losses) on investments
| (12,500,341) |
Net decrease in net assets resulting from operations
| $(10,503,091) |
The accompanying notes are an integral part of these financial statements.
Allspring Small Company Value Fund | 13
Statement of changes in net assets
| | | | | |
| | Year ended
May 31, 2022 | Year ended
May 31, 2021 |
| Operations | | | | |
Net investment income
| | $ 1,997,250 | | $ 1,435,966 |
Net realized gains on investments
| | 55,806,887 | | 29,216,420 |
Net change in unrealized gains (losses) on investments
| | (68,307,228) | | 204,433,580 |
Net increase (decrease) in net assets resulting from operations
| | (10,503,091) | | 235,085,966 |
| Distributions to shareholders from | | | | |
| Net investment income and net realized gains | | | | |
Class A
| | (23,780,784) | | (1,293,657) |
Class C
| | (208,181) | | 0 |
Class R6
| | (352,499) | | (57,563) |
Administrator Class
| | (1,952,485) | | (111,552) |
Institutional Class
| | (4,608,431) | | (291,793) |
Total distributions to shareholders
| | (30,902,380) | | (1,754,565) |
| Capital share transactions | Shares | | Shares | |
| Proceeds from shares sold | | | | |
Class A
| 656,676 | 24,000,526 | 941,668 | 26,856,731 |
Class C
| 19,681 | 658,109 | 13,195 | 384,992 |
Class R6
| 189,729 | 7,081,211 | 191,063 | 5,140,970 |
Administrator Class
| 415,003 | 15,666,878 | 324,601 | 9,607,503 |
Institutional Class
| 2,016,490 | 74,654,109 | 788,867 | 24,838,642 |
| | | 122,060,833 | | 66,828,838 |
| Reinvestment of distributions | | | | |
Class A
| 658,773 | 23,358,988 | 44,468 | 1,263,434 |
Class C
| 6,753 | 208,181 | 0 | 0 |
Class R6
| 9,588 | 352,499 | 1,957 | 57,318 |
Administrator Class
| 52,212 | 1,898,392 | 3,678 | 106,887 |
Institutional Class
| 124,652 | 4,555,015 | 9,851 | 287,148 |
| | | 30,373,075 | | 1,714,787 |
| Payment for shares redeemed | | | | |
Class A
| (1,505,117) | (54,479,971) | (2,387,672) | (63,689,654) |
Class C
| (53,609) | (1,691,679) | (149,932) | (3,213,714) |
Class R6
| (208,117) | (7,991,882) | (258,998) | (7,165,322) |
Administrator Class
| (651,213) | (24,288,201) | (194,898) | (5,830,131) |
Institutional Class
| (761,649) | (28,166,610) | (472,719) | (13,399,558) |
| | | (116,618,343) | | (93,298,379) |
Net increase (decrease) in net assets resulting from capital share transactions
| | 35,815,565 | | (24,754,754) |
Total increase (decrease) in net assets
| | (5,589,906) | | 208,576,647 |
| Net assets | | | | |
Beginning of period
| | 531,252,748 | | 322,676,101 |
End of period
| | $ 525,662,842 | | $531,252,748 |
The accompanying notes are an integral part of these financial statements.
14 | Allspring Small Company Value Fund
Financial highlights
(For a share outstanding throughout each period)
| | Year ended May 31 |
| Class A | 2022 | 2021 | 2020 | 2019 | 2018 |
Net asset value, beginning of period
| $37.11 | $20.91 | $24.22 | $28.60 | $24.01 |
Net investment income
| 0.12 1 | 0.09 | 0.18 1 | 0.09 | 0.09 |
Net realized and unrealized gains (losses) on investments
| (0.71) | 16.22 | (3.35) | (4.31) | 4.58 |
Total from investment operations
| (0.59) | 16.31 | (3.17) | (4.22) | 4.67 |
| Distributions to shareholders from | | | | | |
Net investment income
| (0.08) | (0.11) | (0.14) | (0.16) | (0.08) |
Net realized gains
| (2.14) | 0.00 | 0.00 | 0.00 | 0.00 |
Total distributions to shareholders
| (2.22) | (0.11) | (0.14) | (0.16) | (0.08) |
Net asset value, end of period
| $34.30 | $37.11 | $20.91 | $24.22 | $28.60 |
Total return2
| (1.77)% | 77.80% | (13.25)% | (14.72)% | 19.48% |
| Ratios to average net assets (annualized)* | | | | | |
Gross expenses
| 1.32% | 1.32% | 1.32% | 1.49% | 1.47% |
Net expenses
| 1.14% | 1.14% | 1.13% | 1.15% | 1.33% |
Net investment income
| 0.33% | 0.33% | 0.74% | 0.38% | 0.46% |
| Supplemental data | | | | | |
Portfolio turnover rate3
| 70% | 62% | 78% | 168% | 144% |
Net assets, end of period (000s omitted)
| $376,072 | $414,013 | $262,574 | $11,902 | $15,665 |
| * | Ratios include net expenses allocated from the affiliated Master Portfolio which were as follows: |
| Year ended May 31, 2022 | 0.74% |
| Year ended May 31, 2021 | 0.74% |
| Year ended May 31, 2020 | 0.74% |
| Year ended May 31, 2019 | 0.75% |
| Year ended May 31, 2018 | 0.84% |
| 1 | Calculated based upon average shares outstanding |
| 2 | Total return calculations do not include any sales charges. |
| 3 | Portfolio turnover rate is calculated by multiplying the affiliated Master Portfolio’s percentage of the Fund’s total investment in securities at the end of the period by the affiliated Master Portfolio’s portfolio turnover rate. |
The accompanying notes are an integral part of these financial statements.
Allspring Small Company Value Fund | 15
Financial highlights
(For a share outstanding throughout each period)
| | Year ended May 31 |
| Class C | 2022 | 2021 | 2020 | 2019 | 2018 |
Net asset value, beginning of period
| $32.69 | $18.43 | $21.48 | $25.38 | $21.40 |
Net investment income (loss)
| (0.12) 1 | (0.07) 1 | 0.01 1 | (0.08) 1 | (0.07) 1 |
Net realized and unrealized gains (losses) on investments
| (0.64) | 14.33 | (3.00) | (3.82) | 4.05 |
Total from investment operations
| (0.76) | 14.26 | (2.99) | (3.90) | 3.98 |
| Distributions to shareholders from | | | | | |
Net investment income
| 0.00 | 0.00 | (0.06) | 0.00 | 0.00 |
Net realized gains
| (2.14) | 0.00 | 0.00 | 0.00 | 0.00 |
Total distributions to shareholders
| (2.14) | 0.00 | (0.06) | 0.00 | 0.00 |
Net asset value, end of period
| $29.79 | $32.69 | $18.43 | $21.48 | $25.38 |
Total return2
| (2.56)% | 76.80% | (13.98)% | (15.37)% | 18.60% |
| Ratios to average net assets (annualized)* | | | | | |
Gross expenses
| 2.07% | 2.06% | 2.08% | 2.22% | 2.21% |
Net expenses
| 1.90% | 1.90% | 1.90% | 1.90% | 2.08% |
Net investment income (loss)
| (0.39)% | (0.29)% | 0.02% | (0.35)% | (0.29)% |
| Supplemental data | | | | | |
Portfolio turnover rate3
| 70% | 62% | 78% | 168% | 144% |
Net assets, end of period (000s omitted)
| $2,278 | $3,388 | $4,431 | $1,099 | $1,980 |
| * | Ratios include net expenses allocated from the affiliated Master Portfolio which were as follows: |
| Year ended May 31, 2022 | 0.74% |
| Year ended May 31, 2021 | 0.74% |
| Year ended May 31, 2020 | 0.74% |
| Year ended May 31, 2019 | 0.75% |
| Year ended May 31, 2018 | 0.84% |
| 1 | Calculated based upon average shares outstanding |
| 2 | Total return calculations do not include any sales charges. |
| 3 | Portfolio turnover rate is calculated by multiplying the affiliated Master Portfolio’s percentage of the Fund’s total investment in securities at the end of the period by the affiliated Master Portfolio’s portfolio turnover rate. |
The accompanying notes are an integral part of these financial statements.
16 | Allspring Small Company Value Fund
Financial highlights
(For a share outstanding throughout each period)
| | Year ended May 31 |
| Class R6 | 2022 | 2021 | 2020 | 2019 | 2018 |
Net asset value, beginning of period
| $38.33 | $21.56 | $24.92 | $29.44 | $24.69 |
Net investment income
| 0.33 | 0.20 | 0.31 | 0.21 1 | 0.29 1 |
Net realized and unrealized gains (losses) on investments
| (0.80) | 16.78 | (3.50) | (4.45) | 4.65 |
Total from investment operations
| (0.47) | 16.98 | (3.19) | (4.24) | 4.94 |
| Distributions to shareholders from | | | | | |
Net investment income
| (0.26) | (0.21) | (0.17) | (0.28) | (0.19) |
Net realized gains
| (2.14) | 0.00 | 0.00 | 0.00 | 0.00 |
Total distributions to shareholders
| (2.40) | (0.21) | (0.17) | (0.28) | (0.19) |
Net asset value, end of period
| $35.46 | $38.33 | $21.56 | $24.92 | $29.44 |
Total return
| (1.41)% | 78.63% | (12.97)% | (14.38)% | 20.03% |
| Ratios to average net assets (annualized)* | | | | | |
Gross expenses
| 0.89% | 0.89% | 0.90% | 1.09% | 1.03% |
Net expenses
| 0.75% | 0.75% | 0.75% | 0.75% | 0.88% |
Net investment income
| 0.71% | 0.73% | 1.22% | 0.77% | 1.04% |
| Supplemental data | | | | | |
Portfolio turnover rate2
| 70% | 62% | 78% | 168% | 144% |
Net assets, end of period (000s omitted)
| $8,021 | $9,007 | $6,491 | $731 | $322 |
| * | Ratios include net expenses allocated from the affiliated Master Portfolio which were as follows: |
| Year ended May 31, 2022 | 0.74% |
| Year ended May 31, 2021 | 0.74% |
| Year ended May 31, 2020 | 0.74% |
| Year ended May 31, 2019 | 0.75% |
| Year ended May 31, 2018 | 0.84% |
| 1 | Calculated based upon average shares outstanding |
| 2 | Portfolio turnover rate is calculated by multiplying the affiliated Master Portfolio’s percentage of the Fund’s total investment in securities at the end of the period by the affiliated Master Portfolio’s portfolio turnover rate. |
The accompanying notes are an integral part of these financial statements.
Allspring Small Company Value Fund | 17
Financial highlights
(For a share outstanding throughout each period)
| | Year ended May 31 |
| Administrator Class | 2022 | 2021 | 2020 | 2019 | 2018 |
Net asset value, beginning of period
| $37.98 | $21.40 | $24.80 | $29.23 | $24.53 |
Net investment income
| 0.17 1 | 0.10 1 | 0.21 1 | 0.14 1 | 0.20 |
Net realized and unrealized gains (losses) on investments
| (0.75) | 16.62 | (3.43) | (4.43) | 4.63 |
Total from investment operations
| (0.58) | 16.72 | (3.22) | (4.29) | 4.83 |
| Distributions to shareholders from | | | | | |
Net investment income
| (0.11) | (0.14) | (0.18) | (0.14) | (0.13) |
Net realized gains
| (2.14) | 0.00 | 0.00 | 0.00 | 0.00 |
Total distributions to shareholders
| (2.25) | (0.14) | (0.18) | (0.14) | (0.13) |
Net asset value, end of period
| $35.15 | $37.98 | $21.40 | $24.80 | $29.23 |
Total return
| (1.71)% | 77.91% | (13.18)% | (14.65)% | 19.71% |
| Ratios to average net assets (annualized)* | | | | | |
Gross expenses
| 1.24% | 1.24% | 1.32% | 1.35% | 1.38% |
Net expenses
| 1.05% | 1.05% | 1.05% | 1.05% | 1.19% |
Net investment income
| 0.45% | 0.35% | 0.82% | 0.49% | 0.59% |
| Supplemental data | | | | | |
Portfolio turnover rate2
| 70% | 62% | 78% | 168% | 144% |
Net assets, end of period (000s omitted)
| $23,813 | $32,721 | $15,581 | $13,905 | $60,379 |
| * | Ratios include net expenses allocated from the affiliated Master Portfolio which were as follows: |
| Year ended May 31, 2022 | 0.74% |
| Year ended May 31, 2021 | 0.74% |
| Year ended May 31, 2020 | 0.74% |
| Year ended May 31, 2019 | 0.75% |
| Year ended May 31, 2018 | 0.84% |
| 1 | Calculated based upon average shares outstanding |
| 2 | Portfolio turnover rate is calculated by multiplying the affiliated Master Portfolio’s percentage of the Fund’s total investment in securities at the end of the period by the affiliated Master Portfolio’s portfolio turnover rate. |
The accompanying notes are an integral part of these financial statements.
18 | Allspring Small Company Value Fund
Financial highlights
(For a share outstanding throughout each period)
| | Year ended May 31 |
| Institutional Class | 2022 | 2021 | 2020 | 2019 | 2018 |
Net asset value, beginning of period
| $38.13 | $21.46 | $24.86 | $29.40 | $24.68 |
Net investment income
| 0.20 1 | 0.15 1 | 0.25 | 0.19 1 | 0.21 |
Net realized and unrealized gains (losses) on investments
| (0.71) | 16.70 | (3.43) | (4.45) | 4.69 |
Total from investment operations
| (0.51) | 16.85 | (3.18) | (4.26) | 4.90 |
| Distributions to shareholders from | | | | | |
Net investment income
| (0.18) | (0.18) | (0.22) | (0.28) | (0.18) |
Net realized gains
| (2.14) | 0.00 | 0.00 | 0.00 | 0.00 |
Total distributions to shareholders
| (2.32) | (0.18) | (0.22) | (0.28) | (0.18) |
Net asset value, end of period
| $35.30 | $38.13 | $21.46 | $24.86 | $29.40 |
Total return
| (1.53)% | 78.39% | (13.03)% | (14.46)% | 19.90% |
| Ratios to average net assets (annualized)* | | | | | |
Gross expenses
| 0.99% | 0.99% | 1.07% | 1.14% | 1.14% |
Net expenses
| 0.85% | 0.85% | 0.85% | 0.85% | 0.99% |
Net investment income
| 0.54% | 0.52% | 1.04% | 0.68% | 0.78% |
| Supplemental data | | | | | |
Portfolio turnover rate2
| 70% | 62% | 78% | 168% | 144% |
Net assets, end of period (000s omitted)
| $115,479 | $72,123 | $33,600 | $33,116 | $60,973 |
| * | Ratios include net expenses allocated from the affiliated Master Portfolio which were as follows: |
| Year ended May 31, 2022 | 0.74% |
| Year ended May 31, 2021 | 0.74% |
| Year ended May 31, 2020 | 0.74% |
| Year ended May 31, 2019 | 0.75% |
| Year ended May 31, 2018 | 0.84% |
| 1 | Calculated based upon average shares outstanding |
| 2 | Portfolio turnover rate is calculated by multiplying the affiliated Master Portfolio’s percentage of the Fund’s total investment in securities at the end of the period by the affiliated Master Portfolio’s portfolio turnover rate. |
The accompanying notes are an integral part of these financial statements.
Allspring Small Company Value Fund | 19
Notes to financial statements
1. ORGANIZATION
Allspring Funds Trust (the "Trust"), a Delaware statutory trust organized on March 10, 1999, is an open-end management investment company registered under the Investment Company Act of 1940, as amended (the "1940 Act"). As an investment company, the Trust follows the accounting and reporting guidance in Financial Accounting Standards Board ("FASB") Accounting Standards Codification Topic 946, Financial Services – Investment Companies. These financial statements report on the Allspring Small Company Value Fund (the "Fund") which is a diversified series of the Trust.
The Fund is a feeder fund in a master-feeder structure that invests substantially all of its assets in a single master portfolio with a substantially identical investment objective and substantially similar investment strategies. The Fund invests in Allspring Small Company Value Portfolio, a separate diversified portfolio (the “affiliated Master Portfolio”) of Allspring Master Trust, a registered open-end management investment company. As of May 31, 2022, the Fund owned 88.09% of Allspring Small Company Value Portfolio. The affiliated Master Portfolio directly acquires portfolio securities and the Fund acquires an indirect interest in those securities. The Fund accounts for its investment in the affiliated Master Portfolio as a partnership investment and records on a daily basis its share of the affiliated Master Portfolio’s income, expense and realized and unrealized gains and losses. The financial statements of the affiliated Master Portfolio for the year ended May 31, 2022 are included in this report and should be read in conjunction with the Fund’s financial statements.
Effective on November 1, 2021, the sale transaction of Wells Fargo Asset Management ("WFAM") by Wells Fargo & Company to GTCR LLC and Reverence Capital Partners, L.P. was closed. In connection with the closing of the transaction, WFAM became known as Allspring Global Investments (“Allspring”) and various entities that provided services to the Fund changed their names to "Allspring", including Allspring Funds Management, LLC, the investment manager to the Fund, Allspring Global Investments, LLC and Allspring Global Investments (UK) Limited, both registered investment advisers providing subadvisory services to certain funds, and Allspring Funds Distributor, LLC, the Fund's principal underwriter. Consummation of the transaction resulted in a new investment management agreement and subadvisory agreement which became effective on November 1, 2021.
2. SIGNIFICANT ACCOUNTING POLICIES
The following significant accounting policies, which are consistently followed in the preparation of the financial statements of the Fund, are in conformity with U.S. generally accepted accounting principles which require management to make estimates and assumptions that affect the reported amounts of assets and liabilities, disclosure of contingent assets and liabilities at the date of the financial statements, and the reported amounts of income and expenses during the reporting period. Actual results could differ from those estimates.
Securities valuation
All investments are valued each business day as of the close of regular trading on the New York Stock Exchange (generally 4 p.m. Eastern Time), although the Fund may deviate from this calculation time under unusual or unexpected circumstances.
Investments in the affiliated Master Portfolio are valued daily based on the Fund’s proportionate share of the affiliated Master Portfolio’s net assets, which are also valued daily. Securities held in the affiliated Master Portfolio are valued as discussed in the Notes to Financial Statements of the affiliated Master Portfolio, which are included elsewhere in this report.
Investments which are not valued using the method discussed above are valued at their fair value, as determined in good faith by the Board of Trustees. The Board of Trustees has established a Valuation Committee comprised of the Trustees and has delegated to it the authority to take any actions regarding the valuation of portfolio securities that the Valuation Committee deems necessary or appropriate, including determining the fair value of portfolio securities, unless the determination has been delegated to the Allspring Global Investments Pricing Committee at Allspring Funds Management, LLC ("Allspring Funds Management"). The Board of Trustees retains the authority to make or ratify any valuation decisions or approve any changes to the Valuation Procedures as it deems appropriate. On a quarterly basis, the Board of Trustees receives reports on any valuation actions taken by the Valuation Committee or the Allspring Global Investments Pricing Committee which may include items for ratification.
Investment transactions, income and expenses
Investments in the affiliated Master Portfolio are recorded on a trade date basis. The Fund records daily its proportionate share of the affiliated Master Portfolio’s income, expenses and realized and unrealized gains or losses. The Fund also accrues its own expenses.
20 | Allspring Small Company Value Fund
Notes to financial statements
Distributions to shareholders
Distributions to shareholders from net investment income and any net realized gains are recorded on the ex-dividend date and paid at least annually. Such distributions are determined in accordance with income tax regulations and may differ from U.S. generally accepted accounting principles. Dividend sources are estimated at the time of declaration. The tax character of distributions is determined as of the Fund's fiscal year end. Therefore, a portion of the Fund's distributions made prior to the Fund’s fiscal year end may be categorized as a tax return of capital at year end.
Federal and other taxes
The Fund intends to continue to qualify as a regulated investment company by distributing substantially all of its investment company taxable income and any net realized capital gains (after reduction for capital loss carryforwards) sufficient to relieve it from all, or substantially all, federal income taxes. Accordingly, no provision for federal income taxes was required.
The Fund’s income and federal excise tax returns and all financial records supporting those returns for the prior three fiscal years are subject to examination by the federal and Delaware revenue authorities. Management has analyzed the Fund's tax positions taken on federal, state, and foreign tax returns, as applicable, for all open tax years and does not believe that there are any uncertain tax positions that require recognition of a tax liability.
As of May 31, 2022, the aggregate cost of all investments for federal income tax purposes was $434,427,355 and the unrealized gains (losses) consisted of:
| Gross unrealized gains | $90,739,227 |
| Gross unrealized losses | 0 |
| Net unrealized gains | $90,739,227 |
As of May 31, 2022, the Fund had current year deferred post-October capital losses consisting of $651,024 in short-term losses which will be recognized in the first day of the following fiscal year.
Class allocations
The separate classes of shares offered by the Fund differ principally in applicable sales charges, distribution, shareholder servicing, and administration fees. Class specific expenses are charged directly to that share class. Investment income, common fund-level expenses, and realized and unrealized gains (losses) on investments are allocated daily to each class of shares based on the relative proportion of net assets of each class.
3. FAIR VALUATION MEASUREMENTS
At May 31, 2022, the Fund’s investment in the affiliated Master Portfolio was measured at fair value using the net asset value per share (or its equivalent) as a practical expedient. The investment objective and fair value of the affiliated Master Portfolio is as follows:
| Affiliated Master Portfolio | Investment objective | Fair value of affiliated
Master Portfolio |
| Allspring Small Company Value Portfolio | Seek long-term capital appreciation | $525,166,582 |
The affiliated Master Portfolio does not have a redemption period notice, can be redeemed daily and does not have any unfunded commitments.
4. TRANSACTIONS WITH AFFILIATES
Management fee
Allspring Funds Management, a wholly owned subsidiary of Allspring Global Investments Holdings, LLC, a holding company indirectly owned by certain private funds of GTCR LLC and Reverence Capital Partners, L.P., is the manager of the Fund and provides advisory and fund-level administrative services under an investment management agreement. Under the investment management agreement, Allspring Funds Management is responsible for, among other services, implementing the investment objectives and strategies of the Fund and providing fund-level administrative services in connection with the Fund’s operations. As long as the Fund continues to invest substantially all of its assets in a single affiliated Master Portfolio, the Fund pays Allspring Funds Management an investment management fee only for fund-level administrative services at the following annual rate based on the Fund’s average daily net assets:
Allspring Small Company Value Fund | 21
Notes to financial statements
| Average daily net assets | Management fee |
| First $5 billion | 0.050% |
| Next $5 billion | 0.040 |
| Over $10 billion | 0.030 |
For the year ended May 31, 2022, the management fee was equivalent to an annual rate of 0.05% of the Fund’s average daily net assets.
Allspring Funds Management also serves as the adviser to the affiliated Master Portfolio and is entitled to receive a fee from the affiliated Master Portfolio for those services.
Administration fees
Under a class-level administration agreement, Allspring Funds Management provides class-level administrative services to the Fund, which includes paying fees and expenses for services provided by the transfer agent, sub-transfer agents, omnibus account servicers and record-keepers. As compensation for its services under the class-level administration agreement, Allspring Funds Management receives an annual fee which is calculated based on the average daily net assets of each class as follows:
| | Class-level
administration fee |
| Class A | 0.21% |
| Class C | 0.21 |
| Class R6 | 0.03 |
| Administrator Class | 0.13 |
| Institutional Class | 0.13 |
Waivers and/or expense reimbursements
Allspring Funds Management has contractually committed to waive and/or reimburse management and administration fees to the extent necessary to maintain certain net operating expense ratios for the Fund. When each class of the Fund has exceeded its expense cap, Allspring Funds Management will waive fees and/or reimburse expenses from fund-level expenses on a proportionate basis and then from class specific expenses. When only certain classes exceed their expense caps, waivers and/or reimbursements are applied against class specific expenses before fund-level expenses. Net expenses from the affiliated Master Portfolio are included in the expense caps. Allspring Funds Management has contractually committed through September 30, 2022 to waive fees and/or reimburse expenses to the extent necessary to cap expenses. Prior to or after the commitment expiration date, the caps may be increased or the commitment to maintain the caps may be terminated only with the approval of the Board of Trustees. As of May 31, 2022, the contractual expense caps are as follows:
| | Expense ratio caps |
| Class A | 1.15% |
| Class C | 1.90 |
| Class R6 | 0.75 |
| Administrator Class | 1.05 |
| Institutional Class | 0.85 |
Distribution fee
The Trust has adopted a distribution plan for Class C shares pursuant to Rule 12b-1 under the 1940 Act. A distribution fee is charged to Class C shares and paid to Allspring Funds Distributor, LLC ("Allspring Funds Distributor"), the principal underwriter, an affiliate of Allspring Funds Management, at an annual rate of 0.75% of the average daily net assets of Class C shares.
In addition, Allspring Funds Distributor is entitled to receive the front-end sales charge from the purchase of Class A shares and a contingent deferred sales charge on the redemption of certain Class A shares. Allspring Funds Distributor is also entitled to receive the contingent deferred sales charges from redemptions of Class C shares. For the year ended May 31, 2022, Allspring
22 | Allspring Small Company Value Fund
Notes to financial statements
Funds Distributor received $2,173 from the sale of Class A shares. No contingent deferred sales charges were incurred by Class A and Class C shares for the year ended May 31, 2022.
Shareholder servicing fees
The Trust has entered into contracts with one or more shareholder servicing agents, whereby Class A, Class C and Administrator Class are charged a fee at an annual rate of 0.25% of the average daily net assets of each respective class. A portion of these total shareholder servicing fees were paid to affiliates, and to certain entities that were affiliates of the Fund until November 1, 2021.
5. INVESTMENT PORTFOLIO TRANSACTIONS
The Fund seeks to achieve its investment objective by investing substantially all of its assets in the affiliated Master Portfolio. Purchases and sales have been calculated by multiplying the Fund's ownership percentage of the affiliated Master Portfolio at the end of the period by the affiliated Master Portfolio's purchases and sales. Purchases and sales of investments, excluding U.S. government obligations (if any) and short-term securities, for the year ended May 31, 2022 were $370,336,291 and $375,792,864, respectively.
6. BANK BORROWINGS
The Trust (excluding the money market funds), Allspring Master Trust and Allspring Variable Trust are parties to a $350,000,000 revolving credit agreement whereby the Fund is permitted to use bank borrowings for temporary or emergency purposes, such as to fund shareholder redemption requests. Interest under the credit agreement is charged to the Fund based on a borrowing rate equal to the higher of the Federal Funds rate in effect on that day plus 1.25% or the overnight bank funding rate in effect on that day plus 1.25%. In addition, an annual commitment fee equal to 0.25% of the unused balance is allocated to each participating fund.
For the year ended May 31, 2022, there were no borrowings by the Fund under the agreement.
7. DISTRIBUTIONS TO SHAREHOLDERS
The tax character of distributions paid during the years ended May 31, 2022 and May 31, 2021 were as follows:
| | Year ended May 31 |
| | 2022 | 2021 |
| Ordinary income | $11,642,015 | $1,754,565 |
| Long-term capital gain | 19,260,365 | 0 |
As of May 31, 2022, the components of distributable earnings on a tax basis were as follows:
Undistributed
ordinary
income | Undistributed
long-term
gain | Unrealized
gains | Post-October
capital
losses
deferred |
| $62,138 | $20,897,482 | $90,739,227 | $(651,024) |
8. INDEMNIFICATION
Under the Fund's organizational documents, the officers and Trustees have been granted certain indemnification rights against certain liabilities that may arise out of performance of their duties to the Fund. The Fund has entered into a separate agreement with each Trustee that converts indemnification rights currently existing under the Fund’s organizational documents into contractual rights that cannot be changed in the future without the consent of the Trustee. Additionally, in the normal course of business, the Fund may enter into contracts with service providers that contain a variety of indemnification clauses. The Fund’s maximum exposure under these arrangements is dependent on future claims that may be made against the Fund and, therefore, cannot be estimated.
9. CORONAVIRUS (COVID-19) PANDEMIC
On March 11, 2020, the World Health Organization announced that it had made the assessment that coronavirus disease 2019 (“COVID-19”) is a pandemic. The impacts of COVID-19 are affecting the entire global economy, individual companies and
Allspring Small Company Value Fund | 23
Notes to financial statements
investment products, the funds, and the market in general. There is significant uncertainty around the extent and duration of business disruptions related to COVID-19 and the impacts may last for an extended period of time. COVID-19 has led to significant uncertainty and volatility in the financial markets.
24 | Allspring Small Company Value Fund
Report of independent registered public accounting firm
To the Shareholders of the Fund and Board of Trustees
Allspring Funds Trust:
Opinion on the Financial Statements
We have audited the accompanying statement of assets and liabilities of Allspring Small Company Value Fund (formerly, Wells Fargo Small Company Value Fund) (the Fund), one of the funds constituting Allspring Funds Trust (formerly, Wells Fargo Funds Trust), including the portfolio of investments, as of May 31, 2022, the related statement of operations for the year then ended, the statements of changes in net assets for each of the years in the two-year period then ended, and the related notes (collectively, the financial statements) and the financial highlights for each of the years in the five-year period then ended. In our opinion, the financial statements and financial highlights present fairly, in all material respects, the financial position of the Fund as of May 31, 2022, the results of its operations for the year then ended, the changes in its net assets for each of the years in the two-year period then ended, and the financial highlights for each of the years in the five-year period then ended, in conformity with U.S. generally accepted accounting principles.
Basis for Opinion
These financial statements and financial highlights are the responsibility of the Fund’s management. Our responsibility is to express an opinion on these financial statements and financial highlights based on our audits. We are a public accounting firm registered with the Public Company Accounting Oversight Board (United States) (PCAOB) and are required to be independent with respect to the Fund in accordance with the U.S. federal securities laws and the applicable rules and regulations of the Securities and Exchange Commission and the PCAOB.
We conducted our audits in accordance with the standards of the PCAOB. Those standards require that we plan and perform the audit to obtain reasonable assurance about whether the financial statements and financial highlights are free of material misstatement, whether due to error or fraud. Our audits included performing procedures to assess the risks of material misstatement of the financial statements and financial highlights, whether due to error or fraud, and performing procedures that respond to those risks. Such procedures included examining, on a test basis, evidence regarding the amounts and disclosures in the financial statements and financial highlights. Such procedures also included confirmation of securities owned as of May 31, 2022, by correspondence with the transfer agent. Our audits also included evaluating the accounting principles used and significant estimates made by management, as well as evaluating the overall presentation of the financial statements and financial highlights. We believe that our audits provide a reasonable basis for our opinion.

We have not been able to determine the specific year that we began serving as the auditor of one or more Allspring Funds investment companies; however, we are aware that we have served as the auditor of one or more Allspring Funds investment companies since at least 1955.
Boston, Massachusetts
July 27, 2022
Allspring Small Company Value Fund | 25
Portfolio of investments—May 31, 2022
| | | | | Shares | Value |
| Common stocks: 98.98% | | | | | |
| Consumer discretionary: 8.49% | | | | | |
| Auto components: 1.03% | | | | | |
| Patrick Industries Incorporated | | | | 71,578 | $ 4,302,554 |
| Standard Motor Products Incorporated | | | | 46,580 | 1,860,871 |
| | | | | | 6,163,425 |
| Hotels, restaurants & leisure: 1.66% | | | | | |
| Dine Brands Global Incorporated | | | | 79,185 | 5,819,306 |
| Wyndham Hotels & Resorts Incorporated | | | | 51,034 | 4,089,354 |
| | | | | | 9,908,660 |
| Household durables: 0.48% | | | | | |
| GoPro Incorporated Class A † | | | | 417,461 | 2,884,656 |
| Internet & direct marketing retail: 0.18% | | | | | |
| Overstock.com Incorporated † | | | | 34,609 | 1,072,533 |
| Leisure products: 1.65% | | | | | |
| Johnson Outdoors Incorporated Class A | | | | 63,317 | 4,126,369 |
| Malibu Boats Incorporated Class A † | | | | 97,944 | 5,739,518 |
| | | | | | 9,865,887 |
| Specialty retail: 2.43% | | | | | |
| American Eagle Outfitters Incorporated « | | | | 202,860 | 2,456,635 |
| Bed Bath & Beyond Incorporated †« | | | | 87,011 | 752,645 |
| Destination XL Group Incorporated † | | | | 304,397 | 1,424,578 |
| Dick's Sporting Goods Incorporated « | | | | 60,549 | 4,918,395 |
| Shoe Carnival Incorporated | | | | 180,244 | 4,913,451 |
| | | | | | 14,465,704 |
| Textiles, apparel & luxury goods: 1.06% | | | | | |
| Lakeland Industries Incorporated † | | | | 138,005 | 2,456,489 |
| Rocky Brands Incorporated | | | | 102,368 | 3,833,682 |
| | | | | | 6,290,171 |
| Consumer staples: 6.46% | | | | | |
| Food & staples retailing: 1.92% | | | | | |
| Grocery Outlet Holding Corporation † | | | | 196,732 | 7,524,999 |
| Sprouts Farmers Market Incorporated † | | | | 144,727 | 3,920,654 |
| | | | | | 11,445,653 |
| Food products: 4.54% | | | | | |
| Cal-Maine Foods Incorporated | | | | 124,689 | 5,951,406 |
| Flowers Foods Incorporated | | | | 233,212 | 6,436,651 |
| Pilgrim's Pride Corporation † | | | | 223,618 | 7,450,952 |
| Sanderson Farms Incorporated | | | | 36,327 | 7,247,237 |
| | | | | | 27,086,246 |
The accompanying notes are an integral part of these financial statements.
26 | Allspring Small Company Value Portfolio
Portfolio of investments—May 31, 2022
| | | | | Shares | Value |
| Energy: 10.10% | | | | | |
| Energy equipment & services: 4.28% | | | | | |
| Helmerich & Payne Incorporated | | | | 235,741 | $ 11,869,559 |
| Patterson-UTI Energy Incorporated | | | | 713,904 | 13,621,288 |
| | | | | | 25,490,847 |
| Oil, gas & consumable fuels: 5.82% | | | | | |
| Diamondback Energy Incorporated | | | | 77,660 | 11,805,873 |
| Marathon Oil Corporation | | | | 442,168 | 13,897,340 |
| W&T Offshore Incorporated † | | | | 1,339,680 | 9,016,046 |
| | | | | | 34,719,259 |
| Financials: 22.67% | | | | | |
| Banks: 14.98% | | | | | |
| Ameris Bancorp | | | | 138,912 | 6,332,998 |
| Atlantic Union Bankshares Corporation | | | | 171,046 | 6,031,082 |
| Banc of California Incorporated | | | | 264,468 | 5,088,364 |
| Banner Corporation | | | | 108,268 | 6,291,453 |
| FB Financial Corporation | | | | 132,233 | 5,556,431 |
| First Foundation Incorporated | | | | 252,215 | 5,687,448 |
| First Interstate BancSystem Class A | | | | 115,025 | 4,379,002 |
| Great Southern Bancorp Incorporated | | | | 84,423 | 5,010,505 |
| Heritage Financial Corporation | | | | 196,286 | 5,123,065 |
| Homestreet Incorporated | | | | 95,770 | 3,860,489 |
| Independent Bank Corporation | | | | 186,700 | 3,698,527 |
| OceanFirst Financial Corporation | | | | 211,336 | 4,262,647 |
| OFG Bancorp | | | | 200,048 | 5,669,360 |
| Synovus Financial Corporation | | | | 133,262 | 5,683,624 |
| Umpqua Holdings Corporation | | | | 324,469 | 5,726,878 |
| Univest Financial Corporation | | | | 188,307 | 4,990,136 |
| Western Alliance Bancorp | | | | 72,737 | 5,918,610 |
| | | | | | 89,310,619 |
| Capital markets: 1.10% | | | | | |
| Piper Sandler Companies | | | | 49,726 | 6,553,390 |
| Diversified financial services: 1.08% | | | | | |
| A-Mark Precious Metals Incorporated | | | | 51,438 | 3,910,831 |
| Jackson Financial Incorporation Class A | | | | 69,300 | 2,523,213 |
| | | | | | 6,434,044 |
| Insurance: 2.89% | | | | | |
| American Equity Investment Life Holding Company | | | | 177,335 | 7,139,507 |
| Horace Mann Educators Corporation | | | | 118,027 | 4,775,372 |
| United Fire Group Incorporated | | | | 163,287 | 5,292,132 |
| | | | | | 17,207,011 |
| Mortgage REITs: 1.38% | | | | | |
| AGNC Investment Corporation | | | | 338,522 | 4,140,124 |
| Annaly Capital Management Incorporated | | | | 620,953 | 4,104,499 |
| | | | | | 8,244,623 |
The accompanying notes are an integral part of these financial statements.
Allspring Small Company Value Portfolio | 27
Portfolio of investments—May 31, 2022
| | | | | Shares | Value |
| Thrifts & mortgage finance: 1.24% | | | | | |
| Axos Financial Incorporated † | | | | 68,798 | $ 2,659,043 |
| Walker & Dunlop Incorporated | | | | 44,712 | 4,753,333 |
| | | | | | 7,412,376 |
| Health care: 7.77% | | | | | |
| Biotechnology: 0.51% | | | | | |
| Chemocentryx Incorporated † | | | | 40,559 | 903,249 |
| Eagle Pharmaceuticals Incorporated † | | | | 45,520 | 2,125,784 |
| | | | | | 3,029,033 |
| Health care equipment & supplies: 2.30% | | | | | |
| AngioDynamics Incorporated † | | | | 63,632 | 1,249,096 |
| EDAP TMS SA ADR †« | | | | 127,295 | 938,164 |
| ICU Medical Incorporated † | | | | 15,598 | 2,833,221 |
| Masimo Corporation † | | | | 33,134 | 4,653,008 |
| Merit Medical Systems Incorporated † | | | | 65,817 | 4,040,506 |
| | | | | | 13,713,995 |
| Health care providers & services: 4.33% | | | | | |
| Addus Homecare Corporation † | | | | 29,396 | 2,454,566 |
| AMN Healthcare Services Incorporated † | | | | 39,383 | 3,816,213 |
| Brookdale Senior Living Incorporated † | | | | 617,085 | 3,517,385 |
| Option Care Health Incorporated † | | | | 155,231 | 4,712,813 |
| Premier Incorporated Class A | | | | 86,190 | 3,224,368 |
| The Ensign Group Incorporated | | | | 48,804 | 3,961,421 |
| U.S. Physical Therapy Incorporated | | | | 36,762 | 4,139,034 |
| | | | | | 25,825,800 |
| Health care technology: 0.63% | | | | | |
| Computer Programs & Systems Incorporated † | | | | 83,805 | 2,672,541 |
| Teladoc Incorporated †« | | | | 31,544 | 1,075,335 |
| | | | | | 3,747,876 |
| Industrials: 16.12% | | | | | |
| Air freight & logistics: 0.37% | | | | | |
| Radiant Logistics Incorporated † | | | | 335,266 | 2,222,814 |
| Airlines: 0.69% | | | | | |
| Alaska Air Group Incorporated † | | | | 84,823 | 4,093,558 |
| Building products: 1.38% | | | | | |
| CSW Industrials Incorporated | | | | 43,113 | 4,575,152 |
| Zurn Water Solutions Corporation | | | | 127,475 | 3,673,830 |
| | | | | | 8,248,982 |
| Commercial services & supplies: 1.12% | | | | | |
| ABM Industries Incorporated | | | | 138,698 | 6,706,046 |
| Construction & engineering: 4.25% | | | | | |
| Comfort Systems Incorporated | | | | 83,255 | 7,469,639 |
| Great Lakes Dredge & Dock Company † | | | | 366,333 | 5,385,095 |
The accompanying notes are an integral part of these financial statements.
28 | Allspring Small Company Value Portfolio
Portfolio of investments—May 31, 2022
| | | | | Shares | Value |
| Construction & engineering (continued) | | | | | |
| MYR Group Incorporated † | | | | 74,309 | $ 6,807,447 |
| Sterling Construction Company Incorporated † | | | | 230,407 | 5,670,316 |
| | | | | | 25,332,497 |
| Electrical equipment: 1.71% | | | | | |
| Atkore Incorporated † | | | | 42,968 | 4,680,075 |
| Regal Rexnord Corporation | | | | 43,973 | 5,494,426 |
| | | | | | 10,174,501 |
| Machinery: 4.29% | | | | | |
| Columbus McKinnon Corporation | | | | 91,398 | 3,084,683 |
| Federal Signal Corporation | | | | 136,616 | 4,795,222 |
| Hillenbrand Incorporated | | | | 134,957 | 5,646,601 |
| Kadant Incorporated | | | | 29,983 | 5,549,853 |
| Miller Industries Incorporated | | | | 91,135 | 2,249,212 |
| The Shyft Group Incorporated | | | | 190,426 | 4,225,553 |
| | | | | | 25,551,124 |
| Professional services: 1.39% | | | | | |
| CBIZ Incorporated † | | | | 169,317 | 6,935,224 |
| Mastech Digital Incorporated † | | | | 76,686 | 1,378,431 |
| | | | | | 8,313,655 |
| Road & rail: 0.92% | | | | | |
| Arcbest Corporation | | | | 72,233 | 5,462,982 |
| Information technology: 8.67% | | | | | |
| Electronic equipment, instruments & components: 3.78% | | | | | |
| ePlus Incorporated † | | | | 82,831 | 4,699,831 |
| Insight Enterprises Incorporated † | | | | 53,337 | 5,270,762 |
| Methode Electronics Incorporated | | | | 115,075 | 5,184,129 |
| PC Connection Incorporated | | | | 62,531 | 2,795,761 |
| Sanmina Corporation † | | | | 104,271 | 4,576,454 |
| | | | | | 22,526,937 |
| IT services: 1.44% | | | | | |
| EPAM Systems Incorporated † | | | | 18,587 | 6,292,071 |
| TTEC Holdings Incorporated | | | | 34,337 | 2,315,687 |
| | | | | | 8,607,758 |
| Semiconductors & semiconductor equipment: 2.89% | | | | | |
| Cirrus Logic Incorporated † | | | | 40,118 | 3,271,222 |
| Diodes Incorporated † | | | | 36,380 | 2,801,624 |
| FormFactor Incorporated † | | | | 76,285 | 3,132,262 |
| Ichor Holdings Limited † | | | | 75,692 | 2,288,926 |
| MKS Instruments Incorporated | | | | 22,176 | 2,738,736 |
| Onto Innovation Incorporated † | | | | 37,067 | 2,979,445 |
| | | | | | 17,212,215 |
| Software: 0.56% | | | | | |
| Cerence Incorporated † | | | | 57,624 | 1,830,138 |
| NCR Corporation † | | | | 43,492 | 1,508,737 |
| | | | | | 3,338,875 |
The accompanying notes are an integral part of these financial statements.
Allspring Small Company Value Portfolio | 29
Portfolio of investments—May 31, 2022
| | | | | Shares | Value |
| Materials: 6.48% | | | | | |
| Chemicals: 3.06% | | | | | |
| Advansix Incorporated | | | | 85,916 | $ 3,980,488 |
| Hawkins Incorporated | | | | 147,238 | 5,324,126 |
| Ingevity Corporation † | | | | 19,821 | 1,381,127 |
| Intrepid Potash Incorporated † | | | | 18,064 | 1,189,876 |
| Minerals Technologies Incorporated | | | | 48,009 | 3,181,076 |
| Stepan Company | | | | 28,269 | 3,169,238 |
| | | | | | 18,225,931 |
| Construction materials: 1.02% | | | | | |
| Eagle Materials Incorporated | | | | 46,667 | 6,092,844 |
| Containers & packaging: 0.86% | | | | | |
| UFP Technologies Incorporated † | | | | 67,331 | 5,147,455 |
| Metals & mining: 1.54% | | | | | |
| Royal Gold Incorporated | | | | 30,146 | 3,408,910 |
| Schnitzer Steel Industries Incorporated Class A | | | | 60,684 | 2,464,984 |
| SSR Mining Incorporated | | | | 168,528 | 3,274,499 |
| | | | | | 9,148,393 |
| Real estate: 7.83% | | | | | |
| Equity REITs: 7.83% | | | | | |
| Agree Realty Corporation | | | | 54,851 | 3,815,984 |
| Armada Hoffler Properties Incorporated | | | | 270,135 | 3,722,460 |
| Centerspace REIT | | | | 44,672 | 3,706,883 |
| Global Medical REIT Incorporated | | | | 280,954 | 3,652,402 |
| Independence Realty Trust Incorporated | | | | 96,184 | 2,261,286 |
| Lexington Corporate Properties Trust | | | | 327,017 | 3,780,317 |
| One Liberty Properties Incorporated | | | | 136,640 | 3,748,035 |
| Outfront Media Incorporated | | | | 169,397 | 3,494,660 |
| PotlatchDeltic Corporation | | | | 62,619 | 3,284,993 |
| Retail Opportunity Investment Corporation | | | | 219,167 | 3,960,348 |
| RLJ Lodging Trust | | | | 269,089 | 3,613,865 |
| STAG Industrial Incorporated | | | | 115,360 | 3,841,488 |
| Summit Hotel Properties Incorporated † | | | | 432,887 | 3,783,432 |
| | | | | | 46,666,153 |
| Utilities: 4.39% | | | | | |
| Electric utilities: 4.39% | | | | | |
| Hawaiian Electric Industries Incorporated | | | | 150,384 | 6,492,077 |
| IDACORP Incorporated | | | | 59,399 | 6,475,679 |
| Pinnacle West Capital Corporation | | | | 86,552 | 6,720,763 |
| Portland General Electric Company | | | | 131,774 | 6,489,870 |
| | | | | | 26,178,389 |
| Total Common stocks (Cost $450,637,565) | | | | | 590,122,917 |
The accompanying notes are an integral part of these financial statements.
30 | Allspring Small Company Value Portfolio
Portfolio of investments—May 31, 2022
| | | | Expiration
date | Shares | Value |
| Warrants: 0.00% | | | | | |
| Energy: 0.00% | | | | | |
| Energy equipment & services: 0.00% | | | | | |
| Parker Drilling Company ♦† | | | 9-16-2024 | 8,457 | $ 338 |
| Total Warrants (Cost $0) | | | | | 338 |
| | | Yield | | | |
| Short-term investments: 2.21% | | | | | |
| Investment companies: 2.21% | | | | | |
| Allspring Government Money Market Fund Select Class ♠∞ | | 0.65% | | 5,144,446 | 5,144,446 |
| Securities Lending Cash Investments LLC ♠∩∞ | | 0.91 | | 8,022,300 | 8,022,300 |
| Total Short-term investments (Cost $13,166,746) | | | | | 13,166,746 |
| Total investments in securities (Cost $463,804,311) | 101.19% | | | | 603,290,001 |
| Other assets and liabilities, net | (1.19) | | | | (7,097,363) |
| Total net assets | 100.00% | | | | $596,192,638 |
| † | Non-income-earning security |
| ♦ | The security is fair valued in accordance with procedures approved by the Board of Trustees. |
| « | All or a portion of this security is on loan. |
| ♠ | The issuer of the security is an affiliated person of the Portfolio as defined in the Investment Company Act of 1940. |
| ∩ | The investment is a non-registered investment company purchased with cash collateral received from securities on loan. |
| ∞ | The rate represents the 7-day annualized yield at period end. |
| Abbreviations: |
| ADR | American depositary receipt |
| REIT | Real estate investment trust |
Investments in affiliates
An affiliated investment is an investment in which the Portfolio owns at least 5% of the outstanding voting shares of the issuer or as a result of other relationships, such as the Portfolio and the issuer having the same adviser or investment manager. Transactions with issuers that were affiliates of the Portfolio at the end of the period were as follows:
| | Value,
beginning of
period | Purchases | Sales
proceeds | Net
realized
gains
(losses) | | Net
change in
unrealized
gains
(losses) | | Value,
end of
period | Shares,
end
of period | Income
from
affiliated
securities |
| Short-term investments | | | | | | | | | |
| Allspring Government Money Market Fund Select Class | $5,823,369 | $112,362,300 | $(113,041,223) | $0 | | $0 | | $ 5,144,446 | 5,144,446 | $ 5,909 |
| Securities Lending Cash Investments LLC | 1,657,815 | 127,360,639 | (120,996,154) | 0 | | 0 | | 8,022,300 | 8,022,300 | 6,859 # |
| | | | | $0 | | $0 | | $13,166,746 | | $12,768 |
| # | Amount shown represents income before fees and rebates. |
The accompanying notes are an integral part of these financial statements.
Allspring Small Company Value Portfolio | 31
Statement of assets and liabilities—May 31, 2022
| | |
| Assets | |
Investments in unaffiliated securities (including $7,438,651 of securities loaned), at value (cost $450,637,565)
| $ 590,123,255 |
Investments in affiliated securities, at value (cost $13,166,746)
| 13,166,746 |
Receivable for investments sold
| 777,535 |
Receivable for dividends
| 460,727 |
Receivable for securities lending income, net
| 1,327 |
Prepaid expenses and other assets
| 34,809 |
Total assets
| 604,564,399 |
| Liabilities | |
Payable upon receipt of securities loaned
| 8,022,300 |
Advisory fee payable
| 343,245 |
Accrued expenses and other liabilities
| 6,216 |
Total liabilities
| 8,371,761 |
Total net assets
| $596,192,638 |
The accompanying notes are an integral part of these financial statements.
32 | Allspring Small Company Value Portfolio
Statement of operations—year ended May 31, 2022
| | |
| Investment income | |
Dividends (net of foreign withholdings taxes of $13,865)
| $ 8,913,830 |
Income from affiliated securities
| 35,192 |
Total investment income
| 8,949,022 |
| Expenses | |
Advisory fee
| 4,866,056 |
Custody and accounting fees
| 56,942 |
Professional fees
| 73,087 |
Interest holder report expenses
| 32,987 |
Trustees’ fees and expenses
| 19,821 |
Other fees and expenses
| 19,801 |
Total expenses
| 5,068,694 |
Less: Fee waivers and/or expense reimbursements
| (541,751) |
Net expenses
| 4,526,943 |
Net investment income
| 4,422,079 |
| Realized and unrealized gains (losses) on investments | |
Net realized gains on investments
| 64,991,534 |
Net change in unrealized gains (losses) on investments
| (80,777,394) |
Net realized and unrealized gains (losses) on investments
| (15,785,860) |
Net decrease in net assets resulting from operations
| $(11,363,781) |
The accompanying notes are an integral part of these financial statements.
Allspring Small Company Value Portfolio | 33
Statement of changes in net assets
| | | |
| | Year ended
May 31, 2022 | Year ended
May 31, 2021 |
| Operations | | |
Net investment income
| $ 4,422,079 | $ 3,476,701 |
Net realized gains on investments
| 64,991,534 | 37,164,709 |
Net change in unrealized gains (losses) on investments
| (80,777,394) | 242,793,164 |
Net increase (decrease) in net assets resulting from operations
| (11,363,781) | 283,434,574 |
| Capital transactions | | |
| Transactions in investors’ beneficial interests | | |
Contributions
| 74,799,145 | 44,706,834 |
Withdrawals
| (87,265,392) | (109,788,132) |
Net decrease in net assets resulting from capital transactions
| (12,466,247) | (65,081,298) |
Total increase (decrease) in net assets
| (23,830,028) | 218,353,276 |
| Net assets | | |
Beginning of period
| 620,022,666 | 401,669,390 |
End of period
| $596,192,638 | $ 620,022,666 |
The accompanying notes are an integral part of these financial statements.
34 | Allspring Small Company Value Portfolio
| | Year ended May 31 |
| | 2022 | 2021 | 2020 | 2019 | 2018 |
Total return
| (1.78)% | 78.76% | (13.74)% | (14.51)% | 20.10% |
| Ratios to average net assets (annualized) | | | | | |
Gross expenses
| 0.83% | 0.83% | 0.82% | 0.86% | 0.85% |
Net expenses1
| 0.74% | 0.74% | 0.74% | 0.75% | 0.84% |
Net investment income
| 0.72% | 0.71% | 1.15% | 0.80% | 0.87% |
| Supplemental data | | | | | |
Portfolio turnover rate
| 70% | 62% | 78% | 168% | 144% |
| 1 | Net expense ratios reflect voluntary waivers. |
The accompanying notes are an integral part of these financial statements.
Allspring Small Company Value Portfolio | 35
Notes to financial statements
1. ORGANIZATION
Allspring Master Trust (the "Trust"), a Delaware statutory trust organized on March 10, 1999, is an open-end management investment company registered under the Investment Company Act of 1940, as amended (the "1940 Act"). As an investment company, the Trust follows the accounting and reporting guidance in Financial Accounting Standards Board ("FASB") Accounting Standards Codification Topic 946, Financial Services – Investment Companies. These financial statements report on the Allspring Small Company Value Portfolio (the "Portfolio") which is a diversified series of the Trust.
Interests in the Portfolio are available solely through private placement transactions that do not involve any "public offering" within the meaning of Section 4(a)(2) of the Securities Act of 1933.
Effective on November 1, 2021, the sale transaction of Wells Fargo Asset Management ("WFAM") by Wells Fargo & Company to GTCR LLC and Reverence Capital Partners, L.P. was closed. In connection with the closing of the transaction, WFAM became known as Allspring Global Investments (“Allspring”) and various entities that provided services to the Portfolio changed their names to "Allspring", including Allspring Funds Management, LLC, the adviser to the Portfolio, Allspring Global Investments, LLC and Allspring Global Investments (UK) Limited, both registered investment advisers providing subadvisory services to certain funds, and Allspring Funds Distributor, LLC. Consummation of the transaction resulted in a new advisory agreement and subadvisory agreement which became effective on November 1, 2021.
2. SIGNIFICANT ACCOUNTING POLICIES
The following significant accounting policies, which are consistently followed in the preparation of the financial statements of the Portfolio, are in conformity with U.S. generally accepted accounting principles which require management to make estimates and assumptions that affect the reported amounts of assets and liabilities, disclosure of contingent assets and liabilities at the date of the financial statements, and the reported amounts of income and expenses during the reporting period. Actual results could differ from those estimates.
Securities valuation
All investments are valued each business day as of the close of regular trading on the New York Stock Exchange (generally 4 p.m. Eastern Time), although the Portfolio may deviate from this calculation time under unusual or unexpected circumstances.
Equity securities that are listed on a foreign or domestic exchange or market are valued at the official closing price or, if none, the last sales price.
Investments in registered open-end investment companies are valued at net asset value. Interests in non-registered investment companies that are redeemable at net asset value are fair valued normally at net asset value.
Investments which are not valued using any of the methods discussed above are valued at their fair value, as determined in good faith by the Board of Trustees. The Board of Trustees has established a Valuation Committee comprised of the Trustees and has delegated to it the authority to take any actions regarding the valuation of portfolio securities that the Valuation Committee deems necessary or appropriate, including determining the fair value of portfolio securities, unless the determination has been delegated to the Allspring Global Investments Pricing Committee at Allspring Funds Management, LLC ("Allspring Funds Management"). The Board of Trustees retains the authority to make or ratify any valuation decisions or approve any changes to the Valuation Procedures as it deems appropriate. On a quarterly basis, the Board of Trustees receives reports on any valuation actions taken by the Valuation Committee or the Allspring Global Investments Pricing Committee which may include items for ratification.
Securities lending
The Portfolio may lend its securities from time to time in order to earn additional income in the form of fees or interest on securities received as collateral or the investment of any cash received as collateral. When securities are on loan, the Portfolio receives interest or dividends on those securities. Cash collateral received in connection with its securities lending transactions is invested in Securities Lending Cash Investments, LLC (the "Securities Lending Fund"), an affiliated non-registered investment company. Investments in Securities Lending Fund are valued at the evaluated bid price provided by an independent pricing service. Income earned from investment in the Securities Lending Fund (net of fees and rebates), if any, is included in income from affiliated securities on the Statement of Operations.
In a securities lending transaction, the net asset value of the Portfolio is affected by an increase or decrease in the value of the securities loaned and by an increase or decrease in the value of the instrument in which collateral is invested. The amount of securities lending activity undertaken by the Portfolio fluctuates from time to time. The Portfolio has the right under the lending agreement to recover the securities from the borrower on demand. In the event of default or bankruptcy by the
36 | Allspring Small Company Value Portfolio
Notes to financial statements
borrower, the Portfolio may be prevented from recovering the loaned securities or gaining access to the collateral or may experience delays or costs in doing so. In such an event, the terms of the agreement allow the unaffiliated securities lending agent to use the collateral to purchase replacement securities on behalf of the Portfolio or pay the Portfolio the market value of the loaned securities. The Portfolio bears the risk of loss with respect to depreciation of its investment of the cash collateral.
Security transactions and income recognition
Securities transactions are recorded on a trade date basis. Realized gains or losses are recorded on the basis of identified cost.
Dividend income is recognized on the ex-dividend date. Dividend income is recorded net of foreign taxes withheld where recovery of such taxes is not assured.
Federal and other taxes
The Portfolio is not required to pay federal income taxes on its net investment income and net capital gains as it is treated as a partnership for federal income tax purposes. All income, gains and losses of the Portfolio are deemed to have been “passed through” to the interest holders in proportion to their holdings of the Portfolio regardless of whether income and gains have been distributed by the Portfolio.
The Portfolio’s income tax returns and all financial records supporting those returns for the prior three fiscal years are subject to examination by the federal revenue authority. Management has analyzed the Portfolio’s tax positions taken on federal, state, and foreign tax returns, as applicable, for all open tax years and does not believe that there are any uncertain tax positions that require recognition of a tax liability.
As of May 31, 2022, the aggregate cost of all investments for federal income tax purposes was $475,248,837 and the unrealized gains (losses) consisted of:
| Gross unrealized gains | $150,278,109 |
| Gross unrealized losses | (22,236,945) |
| Net unrealized gains | $128,041,164 |
3. FAIR VALUATION MEASUREMENTS
Fair value measurements of investments are determined within a framework that has established a fair value hierarchy based upon the various data inputs utilized in determining the value of the Portfolio’s investments. The three-level hierarchy gives the highest priority to unadjusted quoted prices in active markets for identical assets or liabilities (Level 1) and the lowest priority to unobservable inputs (Level 3). The Portfolio’s investments are classified within the fair value hierarchy based on the lowest level of input that is significant to the fair value measurement. The inputs are summarized into three broad levels as follows:
| ■ | Level 1 – quoted prices in active markets for identical securities |
| ■ | Level 2 – other significant observable inputs (including quoted prices for similar securities, interest rates, prepayment speeds, credit risk, etc.) |
| ■ | Level 3 – significant unobservable inputs (including the Portfolio’s own assumptions in determining the fair value of investments) |
The inputs or methodologies used for valuing investments in securities are not necessarily an indication of the risk associated with investing in those securities.
Allspring Small Company Value Portfolio | 37
Notes to financial statements
The following is a summary of the inputs used in valuing the Portfolio’s assets and liabilities as of May 31, 2022:
| | Quoted prices
(Level 1) | Other significant
observable inputs
(Level 2) | Significant
unobservable inputs
(Level 3) | Total |
| Assets | | | | |
| Investments in: | | | | |
| Common stocks | | | | |
| Consumer discretionary | $ 50,651,036 | $ 0 | $0 | $ 50,651,036 |
| Consumer staples | 38,531,899 | 0 | 0 | 38,531,899 |
| Energy | 60,210,106 | 0 | 0 | 60,210,106 |
| Financials | 135,162,063 | 0 | 0 | 135,162,063 |
| Health care | 46,316,704 | 0 | 0 | 46,316,704 |
| Industrials | 96,106,159 | 0 | 0 | 96,106,159 |
| Information technology | 51,685,785 | 0 | 0 | 51,685,785 |
| Materials | 38,614,623 | 0 | 0 | 38,614,623 |
| Real estate | 46,666,153 | 0 | 0 | 46,666,153 |
| Utilities | 26,178,389 | 0 | 0 | 26,178,389 |
| Warrants | | | | |
| Energy | 0 | 338 | 0 | 338 |
| Short-term investments | | | | |
| Investment companies | 13,166,746 | 0 | 0 | 13,166,746 |
| Total assets | $603,289,663 | $338 | $0 | $603,290,001 |
Additional sector, industry or geographic detail, if any, is included in the Portfolio of Investments.
For the year ended May 31, 2022, the Portfolio did not have any transfers into/out of Level 3.
4. TRANSACTIONS WITH AFFILIATES
Advisory fee
The Trust has entered into an advisory contract with Allspring Funds Management, a wholly owned subsidiary of Allspring Global Investments Holdings, LLC, a holding company indirectly owned by certain private funds of GTCR LLC and Reverence Capital Partners, L.P. The adviser is responsible for implementing investment policies and guidelines and for supervising the subadviser, who is responsible for day-to-day portfolio management of the Portfolio. Pursuant to the contract, Allspring Funds Management is entitled to receive an advisory fee at the following annual rate based on the Portfolio’s average daily net assets:
| Average daily net assets | Advisory fee |
| First $500 million | 0.800% |
| Next $500 million | 0.775 |
| Next $1 billion | 0.750 |
| Next $1 billion | 0.725 |
| Next $1 billion | 0.700 |
| Over $4 billion | 0.680 |
For the year ended May 31, 2022, the advisory fee was equivalent to an annual rate of 0.80% of the Portfolio’s average daily net assets.
Allspring Funds Management has retained the services of a subadviser to provide daily portfolio management to the Portfolio. The fee for subadvisory services is borne by Allspring Funds Management. Allspring Global Investments, LLC ("Allspring Investments"), an affiliate of Allspring Funds Management and a wholly owned subsidiary of Allspring Global Investments Holdings, LLC, is the subadviser to the Portfolio and is entitled to receive a fee from Allspring Funds Management at an annual rate starting at 0.55% and declining to 0.40% as the average daily net assets of the Portfolio increase.
38 | Allspring Small Company Value Portfolio
Notes to financial statements
Allspring Funds Management has voluntarily waived and/or reimbursed advisory fees to reduce the net operating expense ratio of the Portfolio. These voluntary waivers may be discontinued at any time.
Interfund transactions
The Portfolio may purchase or sell portfolio investment securities to certain affiliates pursuant to Rule 17a-7 under the 1940 Act and under procedures adopted by the Board of Trustees. The procedures have been designed to ensure that these interfund transactions, which do not incur broker commissions, are effected at current market prices.
5. INVESTMENT PORTFOLIO TRANSACTIONS
Purchases and sales of investments, excluding U.S. government obligations (if any) and short-term securities, for the year ended May 31, 2022 were $420,422,353 and $426,616,900, respectively.
6. SECURITIES LENDING TRANSACTIONS
The Portfolio lends its securities through an unaffiliated securities lending agent and receives collateral in the form of cash or securities with a value at least equal to the value of the securities on loan. The value of the loaned securities is determined at the close of each business day and any increases or decreases in the required collateral are exchanged between the Portfolio and the counterparty on the next business day. Cash collateral received is invested in the Securities Lending Fund which seeks to provide a positive return compared to the daily Federal Funds Open Rate by investing in high-quality, U.S. dollar-denominated short-term money market instruments and is exempt from registration under Section 3(c)(7) of the 1940 Act. Securities Lending Fund is managed by Allspring Funds Management and is subadvised by Allspring Investments. Allspring Funds Management receives an advisory fee starting at 0.05% and declining to 0.01% as the average daily net assets of the Securities Lending Fund increase. All of the fees received by Allspring Funds Management are paid to Allspring Investments for its services as subadviser.
In the event of counterparty default or the failure of a borrower to return a loaned security, the Portfolio has the right to use the collateral to offset any losses incurred. As of May 31, 2022, the Portfolio had securities lending transactions with the following counterparties which are subject to offset:
| Counterparty | Value of
securities on
loan | Collateral
received1 | Net amount |
| BNP Paribas Securities Corporation | $4,631,575 | $(4,631,575) | $0 |
| Citigroup Global Markets Incorporated | 110,550 | (110,550) | 0 |
| JPMorgan Securities LLC | 1,019,291 | (1,019,291) | 0 |
| Morgan Stanley & Company LLC | 1,677,235 | (1,677,235) | 0 |
1 Collateral received within this table is limited to the collateral for the net transaction with the counterparty.
7. BANK BORROWINGS
The Trust, along with Allspring Variable Trust and Allspring Funds Trust (excluding the money market funds), are parties to a $350,000,000 revolving credit agreement whereby the Portfolio is permitted to use bank borrowings for temporary or emergency purposes, such as to fund interest holders withdrawal requests. Interest under the credit agreement is charged to the Portfolio based on a borrowing rate equal to the higher of the Federal Funds rate in effect on that day plus 1.25% or the overnight bank funding rate in effect on that day plus 1.25%. In addition, an annual commitment fee equal to 0.25% of the unused balance is allocated to each participating fund.
For the year ended May 31, 2022, there were no borrowings by the Portfolio under the agreement.
8. INDEMNIFICATION
Under the Portfolio's organizational documents, the officers and Trustees have been granted certain indemnification rights against certain liabilities that may arise out of performance of their duties to the Portfolio. The Portfolio has entered into a separate agreement with each Trustee that converts indemnification rights currently existing under the Portfolio’s organizational documents into contractual rights that cannot be changed in the future without the consent of the Trustee. Additionally, in the normal course of business, the Portfolio may enter into contracts with service providers that contain a variety of indemnification clauses. The Portfolio’s maximum exposure under these arrangements is dependent on future claims that may be made against the Portfolio and, therefore, cannot be estimated.
Allspring Small Company Value Portfolio | 39
Notes to financial statements
9. CORONAVIRUS (COVID-19) PANDEMIC
On March 11, 2020, the World Health Organization announced that it had made the assessment that coronavirus disease 2019 (“COVID-19”) is a pandemic. The impacts of COVID-19 are affecting the entire global economy, individual companies and investment products, the funds, and the market in general. There is significant uncertainty around the extent and duration of business disruptions related to COVID-19 and the impacts may last for an extended period of time. COVID-19 has led to significant uncertainty and volatility in the financial markets.
40 | Allspring Small Company Value Portfolio
Report of independent registered public accounting firm
To the Interest Holders of the Portfolio and Board of Trustees
Allspring Master Trust:
Opinion on the Financial Statements
We have audited the accompanying statement of assets and liabilities of Allspring Small Company Value Portfolio (formerly, Wells Fargo Small Company Value Portfolio) (the Portfolio), one of the portfolios constituting Allspring Master Trust (formerly, Wells Fargo Master Trust), including the portfolio of investments, as of May 31, 2022, the related statement of operations for the year then ended, the statements of changes in net assets for each of the years in the two-year period then ended, and the related notes (collectively, the financial statements) and the financial highlights for each of the years in the five-year period then ended. In our opinion, the financial statements and financial highlights present fairly, in all material respects, the financial position of the Portfolio as of May 31, 2022, the results of its operations for the year then ended, the changes in its net assets for each of the years in the two-year period then ended, and the financial highlights for each of the years in the five-year period then ended, in conformity with U.S. generally accepted accounting principles.
Basis for Opinion
These financial statements and financial highlights are the responsibility of the Portfolio’s management. Our responsibility is to express an opinion on these financial statements and financial highlights based on our audits. We are a public accounting firm registered with the Public Company Accounting Oversight Board (United States) (PCAOB) and are required to be independent with respect to the Portfolio in accordance with the U.S. federal securities laws and the applicable rules and regulations of the Securities and Exchange Commission and the PCAOB.
We conducted our audits in accordance with the standards of the PCAOB. Those standards require that we plan and perform the audit to obtain reasonable assurance about whether the financial statements and financial highlights are free of material misstatement, whether due to error or fraud. Our audits included performing procedures to assess the risks of material misstatement of the financial statements and financial highlights, whether due to error or fraud, and performing procedures that respond to those risks. Such procedures included examining, on a test basis, evidence regarding the amounts and disclosures in the financial statements and financial highlights. Such procedures also included confirmation of securities owned as of May 31, 2022, by correspondence with the custodian and transfer agent. Our audits also included evaluating the accounting principles used and significant estimates made by management, as well as evaluating the overall presentation of the financial statements and financial highlights. We believe that our audits provide a reasonable basis for our opinion.
We have not been able to determine the specific year that we began serving as the auditor of one or more Allspring Funds investment companies; however, we are aware that we have served as the auditor of one or more Allspring Funds investment companies since at least 1955.
Boston, Massachusetts
July 27, 2022
Allspring Small Company Value Portfolio | 41
Other information (unaudited)
TAX INFORMATION
For corporate shareholders, pursuant to Section 854 of the Internal Revenue Code, 50% of ordinary income dividends qualify for the corporate dividends-received deduction for the fiscal year ended May 31, 2022.
Pursuant to Section 852 of the Internal Revenue Code, $19,260,365 was designated as a 20% rate gain distribution for the fiscal year ended May 31, 2022.
Pursuant to Section 854 of the Internal Revenue Code, $5,862,958 of income dividends paid during the fiscal year ended May 31, 2022 has been designated as qualified dividend income (QDI).
For the fiscal year ended May 31, 2022, $3,358 has been designated as interest-related dividends for nonresident alien shareholders pursuant to Section 871 of the Internal Revenue Code.
For the fiscal year ended May 31, 2022, $10,181,981 has been designated as short-term capital gain dividends for nonresident alien shareholders pursuant to Section 871 of the Internal Revenue Code.
QUARTERLY PORTFOLIO HOLDINGS INFORMATION
The Fund and Portfolio file their complete schedule of portfolio holdings with the SEC for the first and third quarters of each fiscal year as an exhibit to their reports on Form N-PORT. Shareholders and Interest holders may view the filed Form N-PORT by visiting the SEC website at sec.gov.
42 | Allspring Small Company Value Fund
Other information (unaudited)
BOARD OF TRUSTEES AND OFFICERS
Each of the Trustees and Officers listed in the table below acts in identical capacities for each fund in the Allspring family of funds, which consists of 137 mutual funds comprising the Allspring Funds Trust, Allspring Variable Trust, Allspring Master Trust and four closed-end funds (collectively the “Fund Complex”). This table should be read in conjunction with the Prospectus and the Statement of Additional Information1. The mailing address of each Trustee and Officer is 525 Market Street, 12th Floor, San Francisco, CA 94105. Each Trustee and Officer serves an indefinite term, however, each Trustee serves such term until reaching the mandatory retirement age established by the Trustees.
Independent Trustees
Name and
year of birth | Position held and
length of service* | Principal occupations during past five years or longer | Current other
public company or
investment
company
directorships |
William R. Ebsworth
(Born 1957) | Trustee,
since 2015 | Retired. From 1984 to 2013, equities analyst, portfolio manager, research director and chief investment officer at Fidelity Management and Research Company in Boston, Tokyo, and Hong Kong, and retired in 2013 as Chief Investment Officer of Fidelity Strategic Advisers, Inc. where he led a team of investment professionals managing client assets. Prior thereto, Board member of Hong Kong Securities Clearing Co., Hong Kong Options Clearing Corp., the Thailand International Fund, Ltd., Fidelity Investments Life Insurance Company, and Empire Fidelity Investments Life Insurance Company. Audit Committee Chair and Investment Committee Chair of the Vincent Memorial Hospital Endowment (non-profit organization). Mr. Ebsworth is a CFA® charterholder. | N/A |
Jane A. Freeman
(Born 1953) | Trustee,
since 2015;
Chair Liaison,
since 2018 | Retired. From 2012 to 2014 and 1999 to 2008, Chief Financial Officer of Scientific Learning Corporation. From 2008 to 2012, Ms. Freeman provided consulting services related to strategic business projects. Prior to 1999, Portfolio Manager at Rockefeller & Co. and Scudder, Stevens & Clark. Board member of the Harding Loevner Funds from 1996 to 2014, serving as both Lead Independent Director and chair of the Audit Committee. Board member of the Russell Exchange Traded Funds Trust from 2011 to 2012 and the chair of the Audit Committee. Ms. Freeman is also an inactive Chartered Financial Analyst. | N/A |
Isaiah Harris, Jr.
(Born 1952) | Trustee,
since 2009; Audit
Committee
Chair,
since 2019 | Retired. Chairman of the Board of CIGNA Corporation from 2009 to 2021, and Director from 2005 to 2008. From 2003 to 2011, Director of Deluxe Corporation. Prior thereto, President and CEO of BellSouth Advertising and Publishing Corp. from 2005 to 2007, President and CEO of BellSouth Enterprises from 2004 to 2005 and President of BellSouth Consumer Services from 2000 to 2003. Emeritus member of the Iowa State University Foundation Board of Governors. Emeritus Member of the Advisory Board of Iowa State University School of Business. Advisory Board Member, Palm Harbor Academy (private school). Advisory Board Member, Fellowship of Christian Athletes. Mr. Harris is a certified public accountant (inactive status). | N/A |
David F. Larcker
(Born 1950) | Trustee,
since 2009 | James Irvin Miller Professor of Accounting at the Graduate School of Business (Emeritus), Stanford University, Director of the Corporate Governance Research Initiative and Senior Faculty of The Rock Center for Corporate Governance since 2006. From 2005 to 2008, Professor of Accounting at the Graduate School of Business, Stanford University. Prior thereto, Ernst & Young Professor of Accounting at The Wharton School, University of Pennsylvania from 1985 to 2005. | N/A |
Allspring Small Company Value Fund | 43
Other information (unaudited)
Name and
year of birth | Position held and
length of service* | Principal occupations during past five years or longer | Current other
public company or
investment
company
directorships |
Olivia S. Mitchell
(Born 1953) | Trustee,
since 2006;
Nominating and
Governance
Committee Chair,
since 2018 | International Foundation of Employee Benefit Plans Professor since 1993, Wharton School of the University of Pennsylvania. Director of Wharton’s Pension Research Council and Boettner Center on Pensions & Retirement Research, and Research Associate at the National Bureau of Economic Research. Previously taught at Cornell University from 1978 to 1993. | N/A |
Timothy J. Penny
(Born 1951) | Trustee,
since 1996;
Chair,
since 2018 | President and Chief Executive Officer of Southern Minnesota Initiative Foundation, a non-profit organization, since 2007. Member of the Board of Trustees of NorthStar Education Finance, Inc., a non-profit organization, since 2007. | N/A |
James G. Polisson
(Born 1959) | Trustee,
since 2018 | Retired. Chief Marketing Officer, Source (ETF) UK Services, Ltd, from 2015 to 2017. From 2012 to 2015, Principal of The Polisson Group, LLC, a management consulting, corporate advisory and principal investing company. Chief Executive Officer and Managing Director at Russell Investments, Global Exchange Traded Funds from 2010 to 2012. Managing Director of Barclays Global Investors from 1998 to 2010 and Global Chief Marketing Officer for iShares and Barclays Global Investors from 2000 to 2010. Trustee of the San Francisco Mechanics’ Institute, a non-profit organization, from 2013 to 2015. Board member of the Russell Exchange Traded Fund Trust from 2011 to 2012. Director of Barclays Global Investors Holdings Deutschland GmbH from 2006 to 2009. Mr. Polisson is an attorney and has a retired status with the Massachusetts and District of Columbia Bar Associations. | N/A |
Pamela Wheelock
(Born 1959) | Trustee,
since January
2020; previously
Trustee from
January 2018 to
July 2019 | Board member of the Destination Medical Center Economic Development Agency, Rochester, Minnesota since 2019. Interim President of the McKnight Foundation from January to September 2020. McKnight Foundation Consultant, November 2020 to February 2021. Acting Commissioner, Minnesota Department of Human Services, July 2019 through September 2019. Consultant (part-time), Minnesota Department of Human Services, October 2019 through December 2019. Chief Operating Officer, Twin Cities Habitat for Humanity from 2017 to 2019. Vice President of University Services, University of Minnesota from 2012 to 2016. Prior thereto, on the Board of Directors, Governance Committee and Finance Committee for the Minnesota Philanthropy Partners (Saint Paul Foundation) from 2012 to 2018, Interim Chief Executive Officer of Blue Cross Blue Shield of Minnesota from 2011 to 2012, Chairman of the Board from 2009 to 2012 and Board Director from 2003 to 2015. Vice President, Leadership and Community Engagement, Bush Foundation, Saint Paul, Minnesota (a private foundation) from 2009 to 2011. Executive Vice President and Chief Financial Officer, Minnesota Sports and Entertainment from 2004 to 2009 and Senior Vice President from 2002 to 2004. Executive Vice President of the Minnesota Wild Foundation from 2004 to 2008. Commissioner of Finance, State of Minnesota, from 1999 to 2002. Currently Board Chair of the Minnesota Wild Foundation since 2010. | N/A |
* Length of service dates reflect the Trustee’s commencement of service with the Trust’s predecessor entities, where applicable.
44 | Allspring Small Company Value Fund
Other information (unaudited)
Officers2
Name and
year of birth | Position held and
length of service | Principal occupations during past five years or longer |
Andrew Owen
(Born 1960) | President,
since 2017 | President, Chief Executive Officer and Director of Allspring Funds Management, LLC since 2017 and co-president of Galliard Capital Management, LLC, an affiliate of Allspring Funds Management, LLC, since 2019. Prior thereto, Head of Affiliated Managers, Allspring Global Investments, from 2014 to 2019 and Executive Vice President responsible for marketing, investments and product development for Allspring Funds Management, LLC, from 2009 to 2014. In addition, Mr. Owen was an Executive Vice President of Wells Fargo & Company from 2014 to 2021. |
Jeremy DePalma
(Born 1974) | Treasurer,
since 2012
(for certain funds in
the Fund Complex);
since 2021 (for
the remaining funds in the
Fund Complex) | Senior Vice President of Allspring Funds Management, LLC since 2009. Senior Vice President of Evergreen Investment Management Company, LLC from 2008 to 2010 and head of the Fund Reporting and Control Team within Fund Administration from 2005 to 2010. |
Kate McKinley
(Born 1977) | Chief Legal Officer,
since 2021 | Chief Legal Officer of Allspring Global Investments since 2021. Prior thereto, held various roles at State Street Global Advisors beginning in 2010, including serving as Senior Vice President and General Counsel from 2019 to 2021, and Chief Operating Officer of the Institutional Client Group from 2016 - 2019. Prior to working at State Street Global Advisors served as Assistant General Counsel for Bank of America Corporation from 2005 to 2010 and as an Associate at WilmerHale from 2002 to 2005. |
Christopher Baker
(Born 1976) | Chief Compliance Officer, since 2022 | Global Chief Compliance Officer for Allspring Global Investments since 2022. Prior thereto, Chief Compliance Officer for State Street Global Advisors from 2018 to 2021. Senior Compliance Officer for the State Street divisions of Alternative Investment Solutions, Sector Solutions, and Global Marketing from 2015 to 2018. From 2010 to 2015 Vice President, Global Head of Investment and Marketing Compliance for State Street Global Advisors. |
Matthew Prasse
(Born 1983) | Secretary,
since 2021 | Senior Counsel of the Allspring Legal Department since 2021. Senior Counsel of the Wells Fargo Legal Department from 2018 to 2021. Previously, Counsel for Barings LLC from 2015 to 2018. Prior to joining Barings, Associate at Morgan, Lewis & Bockius LLP from 2008 to 2015. |
1 The Statement of Additional Information includes additional information about the Trustees and is available, without charge, upon request, by calling 1-800-222-8222 or by visiting the website at allspringglobal.com.
2 For those Officers with tenures at Allspring Global Investments and/or Allspring Funds Management, LLC that began prior to 2021, such tenures include years of service during which these businesses/entities were known as Wells Fargo Asset Management and Wells Fargo Funds Management, LLC, respectively.
Allspring Small Company Value Fund | 45
Other information (unaudited)
LIQUIDITY RISK MANAGEMENT PROGRAM
In accordance with Rule 22e-4 under the Investment Company Act of 1940, as amended (the “Liquidity Rule”), Allspring Funds Trust (“Funds Trust”) has adopted and implemented a liquidity risk management program (the “Program”) on behalf of each of its series (other than the series that operate as money market funds), including the Fund, and Allspring Master Trust (“Master Trust” and together with Funds Trust, the “Trusts”) has adopted and implemented the Program on behalf of each of its series, including the Portfolio, which is reasonably designed to assess and manage the Fund's and the Portfolio’s liquidity risk. “Liquidity risk” is defined under the Liquidity Rule as the risk that the Fund or Portfolio is unable to meet redemption requests without significantly diluting remaining investors’ interests in the Fund or Portfolio. The Trusts’ Boards of Trustees (the “Boards”) previously approved the designation of Allspring Funds Management, LLC (“Allspring Funds Management”), the Fund's investment manager and the Portfolio’s investment adviser, to administer the Program, and Allspring Funds Management has established a Liquidity Risk Management Council (the "Council") composed of personnel from multiple departments within Allspring Funds Management and its affiliates to assist Allspring Funds Management in the administration of the Program.
The Program is comprised of various components designed to support the assessment and/or management of liquidity risk, including: (1) the periodic assessment (no less frequently than annually) of certain factors that influence the Fund's and the Portfolio’s liquidity risk; (2) the periodic classification (no less frequently than monthly) of the Fund's and the Portfolio’s investments into one of four liquidity categories that reflect an estimate of their liquidity under current market conditions; (3) a 15% limit on the acquisition of “illiquid investments” (as defined under the Liquidity Rule); (4) to the extent the Fund or the Portfolio does not invest primarily in “highly liquid investments” (as defined under the Liquidity Rule), the determination of a minimum percentage of the Fund's or Portfolio’s assets that generally will be invested in highly liquid investments (an “HLIM”); (5) if the Fund or the Portfolio has established an HLIM, the periodic review (no less frequently than annually) of the HLIM and the adoption of policies and procedures for responding to a shortfall of the Fund's or the Portfolio’s “highly liquid investments” below its HLIM; and (6) periodic reporting to the Boards.
At a meeting of the Boards held on May 24-25, 2022, the Boards received and reviewed a written report (the “Report”) from Allspring Funds Management that, among other things, addressed the operation of the Program and assessed its adequacy and effectiveness for the period from January 1, 2021 through December 31, 2021 (the “Reporting Period”). Other than extended foreign market holidays, no significant liquidity events impacting the Funds or the Portfolios were noted in the Report. In addition, other than corporate-related changes to the Program, there were no material changes to the Program during the Reporting Period.
Allspring Funds Management determined in the Report that the Program has been implemented and operates effectively to manage each Fund’s and Portfolio’s, including the Fund’s and the Portfolio’s, liquidity risk, and Allspring Funds Management continues to believe that the Program has been and continues to be adequately and effectively implemented to monitor and, as applicable, respond to the Fund’s and the Portfolio’s liquidity developments.
There can be no assurance that the Program will achieve its objectives under all circumstances in the future. With respect to the Fund, please refer to the Fund’s prospectus for more information regarding the Fund’s exposure to liquidity risk and other risks to which an investment in the Fund may be subject.
46 | Allspring Small Company Value Fund
For more information
More information about Allspring Funds is available free upon request. To obtain literature, please write, visit the Fund's website, or call:
Allspring Funds
P.O. Box 219967
Kansas City, MO 64121-9967
Website: allspringglobal.com
Individual investors: 1-800-222-8222
Retail investment professionals: 1-888-877-9275
Institutional investment professionals: 1-800-260-5969
This report and the financial statements contained herein are submitted for the general information of the shareholders of the Fund. If this report is used for promotional purposes, distribution of the report must be accompanied or preceded by a current prospectus. Before investing, please consider the investment objectives, risks, charges, and expenses of the investment. For a current prospectus and, if available, a summary prospectus, containing this information, call
1-800-222-8222 or visit the Fund's website at allspringglobal.com. Read the prospectus carefully before you invest or send money.
Allspring Global InvestmentsTM is the trade name for the asset management firms of Allspring Global Investments Holdings, LLC, a holding company indirectly owned by certain private funds of GTCR LLC and Reverence Capital Partners, L.P. These firms include but are not limited to Allspring Global Investments, LLC, and Allspring Funds Management, LLC. Certain products managed by Allspring entities are distributed by Allspring Funds Distributor, LLC (a broker-dealer and Member FINRA/SIPC).
This material is for general informational and educational purposes only and is NOT intended to provide investment advice or a recommendation of any kind - including a recommendation for any specific investment, strategy, or plan.
© 2022 Allspring Global Investments Holdings, LLC. All rights reserved.
PAR-0622-00234 07-22
A286/AR286 05-22
Annual Report
May 31, 2022
The views expressed and any forward-looking statements are as of May 31, 2022, unless otherwise noted, and are those of the Fund's portfolio managers and/or Allspring Global Investments. Discussions of individual securities or the markets generally are not intended as individual recommendations. Future events or results may vary significantly from those expressed in any forward-looking statements. The views expressed are subject to change at any time in response to changing circumstances in the market. Allspring Global Investments disclaims any obligation to publicly update or revise any views expressed or forward-looking statements.
Allspring Core Bond Fund | 1
Letter to shareholders (unaudited)
Andrew Owen
President
Allspring Funds
Dear Shareholder:
We are pleased to offer you this annual report for the Allspring Core Bond Fund for the 12-month period that ended May 31, 2022. Globally, stocks experienced rising volatility through the period, but overall, U.S. stocks outperformed non-U.S. equities as the global economy faced multiple challenges. Bonds also had poor performance during a difficult period, with major fixed income indexes all down for the 12-month period.
Earlier tailwinds provided by global stimulus programs, vaccination rollouts, and recovering consumer and corporate sentiment were more than offset by the highest rate of inflation in decades, concerns about sharp central bank rate hikes, more highly contagious COVID-19 variants, and the Russian invasion of Ukraine. The impact of already-significant supply chain disruptions were made worse by China’s COVID-19 lockdowns.
For the 12-month period, U.S. large-cap stocks led both non-U.S. developed market equities and emerging market stocks. Returns by fixed-income securities were negative as rising inflation created new challenges. For the period, U.S. stocks, based on the S&P 500 Index,1 lost 0.30%. International stocks, as measured by the MSCI ACWI ex USA Index (Net),2 returned -12.41%, while the MSCI EM Index (Net) (USD)3 had weaker performance with a loss of 19.83%. Among bond indexes, the Bloomberg U.S. Aggregate Bond Index4 returned -8.22%, the Bloomberg Global Aggregate ex-USD Index (unhedged)5 returned -16.68%, the Bloomberg Municipal Bond Index6 lost 6.79%, and the ICE BofA U.S. High Yield Index7 fell 5.00%.
Rising inflation, COVID, and the Russian invasion of Ukraine in February drove market performance.
The period began with the S&P 500 Index reaching an all-time high in June 2021. In late June, the U.S. Congress reached a deal on a $1 trillion infrastructure package for road, bridge, and broadband network upgrades over the next eight years. The U.S. Federal Reserve’s (Fed) June meeting yielded no change to policy, but it forecast a possible interest rate rise in 2023. This, combined with a rebound in economic activity and investors searching for yield, led to a decline in U.S. Treasury yields. Many European and Asian countries saw vaccination momentum increase, while COVID-19 infections rose in the U.K. Meanwhile, the price of crude oil jumped over 10% in June as global economic activity picked up and the Organization of the Petroleum Exporting Countries (OPEC) slowed the pace of supply growth.
| 1 | The S&P 500 Index consists of 500 stocks chosen for market size, liquidity, and industry group representation. It is a market-value-weighted index with each stock's weight in the index proportionate to its market value. You cannot invest directly in an index. |
| 2 | The Morgan Stanley Capital International (MSCI) All Country World Index (ACWI) ex USA Index (Net) is a free-float-adjusted market-capitalization-weighted index that is designed to measure the equity market performance of developed and emerging markets, excluding the U.S. Source: MSCI. MSCI makes no express or implied warranties or representations and shall have no liability whatsoever with respect to any MSCI data contained herein. The MSCI data may not be further redistributed or used as a basis for other indexes or any securities or financial products. This report is not approved, reviewed, or produced by MSCI. You cannot invest directly in an index. |
| 3 | The MSCI Emerging Markets (EM) Index (Net) (USD) is a free-float-adjusted market-capitalization-weighted index that is designed to measure equity market performance of emerging markets. You cannot invest directly in an index. |
| 4 | The Bloomberg U.S. Aggregate Bond Index is a broad-based benchmark that measures the investment-grade, U.S.-dollar-denominated, fixed-rate taxable bond market, including Treasuries, government-related and corporate securities, mortgage-backed securities (agency fixed-rate and hybrid adjustable-rate mortgage pass-throughs), asset-backed securities, and commercial mortgage-backed securities. You cannot invest directly in an index. |
| 5 | The Bloomberg Global Aggregate ex-USD Index (unhedged) is an unmanaged index that provides a broad-based measure of the global investment-grade fixed-income markets excluding the U.S.-dollar-denominated debt market. You cannot invest directly in an index. |
| 6 | The Bloomberg Municipal Bond Index is an unmanaged index composed of long-term tax-exempt bonds with a minimum credit rating of Baa. You cannot invest directly in an index. |
| 7 | The ICE BofA U.S. High Yield Index is a market-capitalization-weighted index of domestic and Yankee high-yield bonds. The index tracks the performance of high-yield securities traded in the U.S. bond market. You cannot invest directly in an index. Copyright 2022. ICE Data Indices, LLC. All rights reserved. |
2 | Allspring Core Bond Fund
Letter to shareholders (unaudited)
Inflation continued to climb in July, fueled by the ongoing supply bottleneck and high demand. Monthly U.S. equity gains led those of international developed markets. In contrast, emerging markets had losses for the month, hindered by China’s plans for new regulations, particularly in education and technology. The U.S. 10-year Treasury bond yield continued to decline as strong demand swallowed up supply. After hitting a multiyear high earlier in the month, oil prices leveled off as OPEC agreed to raise oil production.
The COVID-19 Delta variant produced outbreaks globally in August, feeding market volatility and casting doubts over the ongoing economic recovery. The U.S. economy remained strong despite the Delta variant, ongoing inflationary pressures, and worries over Hurricane Ida. Emerging market equities experienced elevated volatility, largely influenced by China’s regulatory stance. Municipal debt had its first monthly loss since February. Among commodities, crude oil fell sharply as the Delta variant caused expectations to dampen. However, oil remained a leading asset-class performer for the year.
Global markets suffered their broadest retreat in a year during September, except for commodities, as concerns over inflation and the interest rate outlook depressed investor confidence. Emerging markets declined on concerns over supply chain disruptions along with rising energy and food prices. Meanwhile, the Fed indicated it would soon start to slow the pace of asset purchases. U.S. concerns included a congressional showdown over the debt ceiling, the 2022 federal government budget, and the infrastructure package. Meanwhile, commodities thrived in September, driven by sharply higher energy prices.
Elevated inflation pressures and the global supply bottleneck continued in October, but strong earnings provided a bright spot in the U.S., the eurozone, and many Asian countries. Government bond yields rose globally as central banks prepared to tighten monetary policy. Commodity prices continued to rise, driven by sharply higher energy costs.
In November, as COVID-19 hospitalizations rose, most major global asset classes declined. Two exceptions were U.S. investment-grade bonds and Treasury Inflation-Protected Securities. President Biden signed a long-awaited infrastructure bill to upgrade U.S. roads, bridges, and railways. Meanwhile, the Consumer Price Index (CPI)1, a measure of domestic inflation conditions, jumped to its highest level in 31 years. While the threat of consistently high inflation led the Fed to discuss a faster pace of tapering, the Omicron strain created uncertainty. Commodities lost ground for the month, driven by sharp declines in oil prices (and energy costs in general) as well as precious metals.
Global volatility lessened in December as data indicated a lower risk of severe disease and death from the Omicron variant. Even so, several countries introduced restrictions on travel and hospitality, among other sectors, in an effort to reduce the spread. In the U.S., data indicated a stable economy overall, with robust corporate earnings. Consumer spending potential looked strong heading into 2022 on elevated household savings and the lowest household debt ratio since 1973. U.S. corporate and high-yield bonds had monthly gains while Treasuries declined. Bonds were strongly affected by the projection of multiple rate hikes in 2022 by senior Federal Open Market Committee members.
In January 2022, the main focus was on potential U.S. interest rate hikes and the Russia-Ukraine conflict. The Fed hinted that a March interest rate hike was likely. Meanwhile, Russia threatened a potential invasion of Ukraine, which could disrupt Russia’s massive energy supplies and drive demand from non-Russian oil-producing countries. Elsewhere overseas, Europe saw food and energy prices spike, leading to rising inflation. Within fixed income, corporate bonds struggled in January, underperforming government bonds, as investors focused on continued elevated inflation and ongoing uncertainty over the U.S. monetary path.
“ Global markets suffered their broadest retreat in a year during September, except for commodities, as concerns over inflation and the interest rate outlook depressed investor confidence.”
| 1 | The Consumer Price Index (CPI) is a measure of the average change over time in the prices paid by urban consumers for a market basket of consumer goods and services. You cannot invest directly in an index. |
Allspring Core Bond Fund | 3
Letter to shareholders (unaudited)
“ The Russian invasion of Ukraine dominated the financial world in February and March. Equity, bond, and commodity markets were shaken by fear, uncertainty, and an upending of demand-supply dynamics.” |
The Russian invasion of Ukraine dominated the financial world in February and March. Equity, bond, and commodity markets were shaken by fear, uncertainty, and an upending of demand-supply dynamics. Major global stock indexes were down in February, along with global bonds overall, with ongoing high levels of volatility in March along with mixed results that favored U.S. large-cap stocks. Prices of commodities spiked, including crude oil, natural gas, wheat, and precious metals, on elevated concerns of supply shortages. All of this fed already-high inflation concerns and added to expectations of more aggressive central bank interest rate hikes. Sweeping sanctions against Russia and corporate pullouts contributed to market volatility. Despite the geopolitical turmoil, the U.S. economic outlook remained largely unchanged, with a healthy job market and signs of economic resilience accompanying higher prices.
In April, market volatility continued, with deepening losses across major capital markets, as both the S&P 500 and MSCI ACWI (Net)1 fell 8% or more for the month. The Chinese economy struggled through a strict lockdown as the government tried to contain a major COVID-19 outbreak, creating a global ripple effect that compounded existing supply shortages. This was exacerbated by the impact of the Russia-Ukraine war on global commodities. Meanwhile, U.S. annual inflation raged at 8.5%, its highest level since 1981, and investors braced themselves for aggressive Fed monetary tightening moves.
Market volatility continued in May, but full-month returns belied that as markets recovered ground late in the month. Value stocks continued to outperform growth stocks. The concerns that had dominated markets for months continued, including high inflation (the CPI remained above 8%) and geopolitical tensions that exacerbated high crude oil, gasoline, and food prices. In response, the Fed raised the federal funds rate by 0.50%, with broad expectations of multiple rate hikes to come. Meanwhile, highly contagious COVID-19 variants persisted. However, labor markets in the U.S., the U.K., and Europe remained strong. The U.S. recorded a 3.6% unemployment rate, although labor market participation remained low. U.S. retail sales increased for the fourth consecutive month in April, indicating continued consumer resilience.
Don’t let short-term uncertainty derail long-term investment goals.
Periods of investment uncertainty can present challenges, but experience has taught us that maintaining long-term investment goals can be an effective way to plan for the future. To help you create a sound strategy based on your personal goals and risk tolerance, Allspring Funds offers more than 100 mutual funds spanning a wide range of asset classes and investment styles. Although diversification cannot guarantee an investment profit or prevent losses, we believe it can be an effective way to manage investment risk and potentially smooth out overall portfolio performance. We encourage investors to know their investments and to understand that appropriate levels of risk-taking may unlock opportunities.
Thank you for choosing to invest with Allspring Funds. We appreciate your confidence in us and remain committed to helping you meet your financial needs.
Sincerely,
Andrew Owen
President
Allspring Funds
For further information about your fund, contact your investment professional, visit our website at allspringglobal.com, or call us directly at 1-800-222-8222.
| 1 | The MSCI ACWI (Net) is a free-float-adjusted market-capitalization-weighted index that is designed to measure the equity market performance of developed and emerging markets. You cannot invest directly in an index. |
4 | Allspring Core Bond Fund
Letter to shareholders (unaudited)
Notice to Shareholders
Russia launched a large-scale invasion of Ukraine on February 24, 2022. As a result of this military action, the United States and many other countries have instituted various economic sanctions against Russian and Belarus individuals and entities. The situation has led to increased financial market volatility and has had severe adverse effects on regional and global economic markets, including the markets for certain securities and commodities, such as oil and natural gas. The extent and duration of the military action, resulting sanctions imposed, other punitive action taken and the resulting market disruptions cannot be easily predicted.
Our solidarity and support goes out to our impacted employees and the people affected in Ukraine and their families. Allspring has a dedicated team of investment professionals actively monitoring the situation for any new developments and the potential impact to our clients and investment products. As the situation remains fluid, we are focused on the assessment of risks, valuation, and liquidity of impacted securities. Please visit our website at allspringglobal.com and click on “Russia-Ukraine Updates” for further information.
Allspring Core Bond Fund | 5
Performance highlights (unaudited)
Investment objectiveThe Fund seeks total return, consisting of income and capital appreciation.
| Manager | Allspring Funds Management, LLC |
Subadviser for the affiliated master portfolio*
Allspring Global Investments, LLC
| Portfolio managers | Maulik Bhansali, CFA®‡, Jarad Vasquez |
| Average annual total returns (%) as of May 31, 2022 |
| | | Including sales charge | | Excluding sales charge | | Expense ratios1 (%) |
| | Inception date | 1 year | 5 year | 10 year | | 1 year | 5 year | 10 year | | Gross | Net 2 |
| Class A (MBFAX) | 10-31-2001 | -13.03 | -0.07 | 1.09 | | -8.95 | 0.85 | 1.55 | | 0.83 | 0.78 |
| Class C (MBFCX) | 10-31-2001 | -10.65 | 0.10 | 0.94 | | -9.65 | 0.10 | 0.94 | | 1.58 | 1.53 |
| Class R (WTRRX) | 7-9-2010 | – | – | – | | -9.09 | 0.66 | 1.33 | | 1.08 | 1.03 |
| Class R4 (MBFRX)3 | 11-30-2012 | – | – | – | | -8.74 | 1.13 | 1.83 | | 0.60 | 0.52 |
| Class R6 (WTRIX)4 | 11-30-2012 | – | – | – | | -8.61 | 1.26 | 1.97 | | 0.45 | 0.37 |
| Administrator Class (MNTRX) | 6-30-1997 | – | – | – | | -8.90 | 0.93 | 1.63 | | 0.77 | 0.70 |
| Institutional Class (MBFIX) | 10-31-2001 | – | – | – | | -8.59 | 1.23 | 1.92 | | 0.50 | 0.42 |
| Bloomberg U.S. Aggregate Bond Index5 | – | – | – | – | | -8.22 | 1.18 | 1.71 | | – | – |
Figures quoted represent past performance, which is no guarantee of future results, and do not reflect taxes that a shareholder may pay on an investment in a fund. Investment return and principal value of an investment will fluctuate so that an investor’s shares, when redeemed, may be worth more or less than their original cost. Performance shown without sales charges would be lower if sales charges were reflected. Current performance may be lower or higher than the performance data quoted, which assumes the reinvestment of dividends and capital gains. Current month-end performance is available on the Fund’s website, allspringglobal.com.
Index returns do not include transaction costs associated with buying and selling securities, any mutual fund fees or expenses, or any taxes. It is not possible to invest directly in an index.
For Class A shares, the maximum front-end sales charge is 4.50%. For Class C shares, the maximum contingent deferred sales charge is 1.00%. Performance including a contingent deferred sales charge assumes the sales charge for the corresponding time period. Class R, Class R4, Class R6, Administrator Class and Institutional Class shares are sold without a front-end sales charge or contingent deferred sales charge.
| 1 | Reflects the expense ratios as stated in the most recent prospectuses, which include the impact of 0.01% in acquired fund fees and expenses. The expense ratios shown are subject to change and may differ from the annualized expense ratios shown in the financial highlights of this report, which do not include acquired fund fees and expenses. |
| 2 | The manager has contractually committed through September 30, 2022, to waive fees and/or reimburse expenses to the extent necessary to cap total annual fund operating expenses after fee waivers at 0.78% for Class A, 1.53% for Class C, 1.03% for Class R, 0.52% for Class R4, 0.37% for Class R6, 0.70% for Administrator Class, and 0.42% for Institutional Class. Brokerage commissions, stamp duty fees, interest, taxes, acquired fund fees and expenses (if any) from funds in which the affiliated master portfolio invests, and extraordinary expenses are excluded from the expense caps. Net expenses from the affiliated master portfolio are included in the expense caps. Prior to or after the commitment expiration date, the caps may be increased or the commitment to maintain the caps may be terminated only with the approval of the Board of Trustees. Without these caps, the Fund’s returns would have been lower. The expense ratio paid by an investor is the net expense ratio (the total annual fund operating expenses after fee waivers) as stated in the prospectuses. |
| 3 | Historical performance shown for the Class R4 shares prior to their inception reflects the performance of the Institutional Class shares, and includes the higher expenses applicable to Institutional Class shares. If these expenses had not been included, returns for Class R4 shares would be higher. |
| 4 | Historical performance shown for the Class R6 shares prior to their inception reflects the performance of the Institutional Class shares, and includes the higher expenses applicable to the Institutional Class shares. If these expenses had not been included, returns for the Class R6 shares would be higher. |
| 5 | The Bloomberg U.S. Aggregate Bond Index is a broad-based benchmark that measures the investment-grade, U.S. dollar–denominated, fixed-rate taxable bond market, including Treasuries, government-related and corporate securities, mortgage-backed securities (agency fixed-rate and hybrid adjustable-rate mortgage pass-throughs), asset-backed securities, and commercial mortgage-backed securities. You cannot invest directly in an index. |
| * | The Fund is a feeder fund in a master-feeder structure that invests substantially all of its assets in a single affiliated master portfolio of the Allspring Master Trust with a substantially identical investment objective and substantially similar investment strategies. References to the investment activities of the Fund are intended to refer to the investment activities of the affiliated master portfolio in which it invests. |
| ‡ | CFA® and Chartered Financial Analyst® are trademarks owned by CFA Institute. |
6 | Allspring Core Bond Fund
Performance highlights (unaudited)
Growth of $10,000 investment as of May 31, 20221
| 1 | The chart compares the performance of Class A shares for the most recent ten years with the Bloomberg U.S. Aggregate Bond Index. The chart assumes a hypothetical investment of $10,000 in Class A shares and reflects all operating expenses and assumes the maximum initial sales charge of 4.50%. |
Bond values fluctuate in response to the financial condition of individual issuers, general market and economic conditions, and changes in interest rates. Changes in market conditions and government policies may lead to periods of heightened volatility in the bond market and reduced liquidity for certain bonds held by the Fund. In general, when interest rates rise, bond values fall and investors may lose principal value. Interest rate changes and their impact on the Fund and its share price can be sudden and unpredictable. The use of derivatives may reduce returns and/or increase volatility. Certain investment strategies tend to increase the total risk of an investment (relative to the broader market). Securities issued by U.S. government agencies or government sponsored entities may not be guaranteed by the U.S. Treasury. This fund is exposed to foreign investment risk and mortgage- and asset-backed securities risk. Consult the Fund’s prospectus for additional information on these and other risks.
Allspring Core Bond Fund | ��7
Performance highlights (unaudited)
MANAGER'S DISCUSSION
Fund highlights
| ■ | The Fund underperformed its benchmark, the Bloomberg U.S. Aggregate Bond Index, for the 12-month period that ended May 31, 2022. |
| ■ | Security selection in mortgage-backed securities (MBS) and asset-backed securities (ABS) drove the negative attribution for this 12-month period, while the positive effects of security selection in credit provided a solid offset. |
| ■ | Sector allocation was neutral to performance, as the negative impacts of being overweight credit and ABS were mostly offset by an underweight to MBS and, to a lesser extent, commercial mortgage-backed securities (CMBS) versus the benchmark. |
U.S. economic growth appears to have stabilized, yet downside risks seem likely to persist.
Manufacturing surveys have steadied at expansionary levels but services surveys, on the other hand, have continued to slow as a broad range of categories that benefited from the economy’s reopening are showing normalization of activity, even if pent-up demand for segments like travel should remain, substituting from merchandise goods. Consumer confidence remains on the weak side as inflation pinches budgets, well exceeding wage gains, though retail sales appeared to demonstrate overall resilience. Housing is showing early signs of a slowdown, particularly for new and existing home sales, especially as rising mortgage rates could be tempering affordability in a tight market. Corporate capital expenditures and research and development could also be at risk of a slowdown, given caution in earnings guidance. Employment growth has also slowed as some employers focus on improving productivity in the face of rising unit labor costs.
| Ten largest holdings (%) as of May 31, 20221 |
| U.S. Treasury Note, 2.75%, 4-30-2027 | 2.51 |
| U.S. Treasury Note, 2.75%, 5-15-2025 | 2.27 |
| U.S. Treasury Bond, 1.75%, 8-15-2041 | 1.66 |
| FNMA, 5.00%, 8-11-2052 | 1.58 |
| U.S. Treasury Bond, 1.38%, 11-15-2040 | 1.56 |
| U.S. Treasury Note, 0.25%, 9-30-2025 | 1.56 |
| U.S. Treasury Note, 2.88%, 5-15-2032 | 1.48 |
| U.S. Treasury Note, 1.50%, 8-15-2026 | 1.42 |
| U.S. Treasury Note, 0.25%, 8-31-2025 | 1.38 |
| FNMA, 4.00%, 7-14-2052 | 1.32 |
| 1 | Each holding represents the Fund’s allocable portion of the affiliated master portfolio security. Figures represent each holding as a percentage of the Fund’s net assets. Holdings are subject to change and may have changed since the date specified. |
International growth could potentially contribute going forward, especially amid signs of improvement in foreign exchange markets and a potential rethinking around China’s zero-COVID-19 strategy, while Europe remains a risk. A
historically wide U.S. trade deficit, which has spiked on commodity import costs, suggests an overreliance on imports of merchandise, industrial supplies, and commodities, with an ongoing national security need to find new sources for some aspects of production. On balance, a reversal of seasonal and technical factors that weighed on first-quarter growth, such as a drawdown of inventories, coupled with relatively steady, yet slowing, demand factors, should suggest a low positive growth rate for gross domestic product for the second quarter, with risks to estimates being downside-biased.
Given recent market volatility amid rapidly shifting expectations on monetary policy, investors now seem more comfortable with clarity provided by the U.S. Federal Reserve’s (Fed) forward guidance on the path of rate hikes and commitment to an orderly and predictable run-down of securities holdings and data on growth and inflation has improved somewhat. Nonetheless, investors will need to be vigilant around risks that are present in persistent inflation, slowing growth, Russia’s invasion of Ukraine, and a Fed that is anticipating that financial conditions would need to tighten further to address inflationary risks.
| Portfolio composition as of May 31, 20221 |
| 1 | Figures represent the portfolio allocation of the affiliated master portfolio as a percentage of the long-term investments of the affiliated master portfolio. These amounts are subject to change and may have changed since the date specified. |
Yields have risen as central banks have moved to address inflation risks, and the forward curve now seems to be pricing in a fairly aggressive path of rate hikes, including the risk of
8 | Allspring Core Bond Fund
Performance highlights (unaudited)
above-neutral rates by year-end. As a result, some value has emerged in front-end Treasuries, especially if there’s downside risk to growth or if inflation comes down more rapidly in future periods. Still, the minutes from the recent Fed meetings and comments from policy officials highlight that some further tightening of financial conditions could need to occur to align economic demand to constrained supply, whether in the form of additional rate hikes beyond those currently expected or retraction of liquidity that affects costs of credit and equity. Economic and financial market impacts from recent moves in yield curves, particularly on housing finance and more leveraged credit products, might not be fully understood at this time and could play out over the summer months, highlighting potential pain ahead. Business leaders seem to be pivoting toward preparing for an economic downturn. Notably, a pullback in business investment as opposed to consumer spending would highlight ongoing economic imbalances. Elevated volatility seems likely to persist, as economic cycles become shorter and more prone to shocks.
Consistent with our bottom-up process, we maintain a neutral duration. We have increased our overweight to ABS, seeing value in the higher-quality segments of the market following recent spread widening. Similarly, we have decreased our underweight to agency MBS as we found a few opportunities to add in front of the Fed’s reduction of its balance sheet at more attractive spreads. We have reduced our overweight to credit, especially as new issue supply slowed during May and as spreads performed into month-end, and within credit, we have positioned for somewhat higher overall quality. We remain lightly positioned in CMBS, favoring other spread sectors and anticipating some dislocations in commercial real estate valuations on a property-level basis as we move forward. We remain nimble and agile, and we stand ready to take advantage of security selection opportunities where they arise.
Allspring Core Bond Fund | 9
Fund expenses (unaudited)
As a shareholder of the Fund, you incur two types of costs: (1) transaction costs, including sales charges (loads) on purchase payments and contingent deferred sales charges (if any) on redemptions and (2) ongoing costs, including management fees, distribution (12b-1) and/or shareholder servicing fees, and other Fund expenses. This example is intended to help you understand your ongoing costs (in dollars) of investing in the Fund and to compare these costs with the ongoing costs of investing in other mutual funds.
The example is based on an investment of $1,000 invested at the beginning of the six-month period and held for the entire period from December 1, 2021 to May 31, 2022.
Actual expenses
The “Actual” line of the table below provides information about actual account values and actual expenses. You may use the information in this line, together with the amount you invested, to estimate the expenses that you paid over the period. Simply divide your account value by $1,000 (for example, an $8,600 account value divided by $1,000 = 8.6), then multiply the result by the number in the “Actual” line under the heading entitled “Expenses paid during period” for your applicable class of shares to estimate the expenses you paid on your account during this period.
Hypothetical example for comparison purposes
The “Hypothetical” line of the table below provides information about hypothetical account values and hypothetical expenses based on the Fund’s actual expense ratio and an assumed rate of return of 5% per year before expenses, which is not the Fund’s actual return. The hypothetical account values and expenses may not be used to estimate the actual ending account balance or expenses you paid for the period. You may use this information to compare the ongoing costs of investing in the Fund and other funds. To do so, compare this 5% hypothetical example with the 5% hypothetical examples that appear in the shareholder reports of the other funds.
Please note that the expenses shown in the table are meant to highlight your ongoing costs only and do not reflect any transactional costs, such as sales charges (loads) and contingent deferred sales charges. Therefore, the “Hypothetical” line of the table is useful in comparing ongoing costs only, and will not help you determine the relative total costs of owning different funds. In addition, if these transactional costs were included, your costs would have been higher.
| | Beginning
account value
12-1-2021 | Ending
account value
5-31-2022 | Expenses
paid during
the period1,2 | Annualized net
expense ratio2 |
| Class A | | | | |
| Actual | $1,000.00 | $ 904.23 | $3.70 | 0.78% |
| Hypothetical (5% return before expenses) | $1,000.00 | $1,021.04 | $3.93 | 0.78% |
| Class C | | | | |
| Actual | $1,000.00 | $ 900.58 | $7.25 | 1.53% |
| Hypothetical (5% return before expenses) | $1,000.00 | $1,017.30 | $7.70 | 1.53% |
| Class R | | | | |
| Actual | $1,000.00 | $ 903.45 | $4.13 | 0.87% |
| Hypothetical (5% return before expenses) | $1,000.00 | $1,020.59 | $4.38 | 0.87% |
| Class R4 | | | | |
| Actual | $1,000.00 | $ 905.08 | $2.47 | 0.52% |
| Hypothetical (5% return before expenses) | $1,000.00 | $1,022.34 | $2.62 | 0.52% |
| Class R6 | | | | |
| Actual | $1,000.00 | $ 905.68 | $1.76 | 0.37% |
| Hypothetical (5% return before expenses) | $1,000.00 | $1,023.09 | $1.87 | 0.37% |
| Administrator Class | | | | |
| Actual | $1,000.00 | $ 904.31 | $3.28 | 0.69% |
| Hypothetical (5% return before expenses) | $1,000.00 | $1,021.49 | $3.48 | 0.69% |
| Institutional Class | | | | |
| Actual | $1,000.00 | $ 905.45 | $2.00 | 0.42% |
| Hypothetical (5% return before expenses) | $1,000.00 | $1,022.84 | $2.12 | 0.42% |
1 Expenses paid is equal to the annualized net expense ratio of each class multiplied by the average account value over the period, multiplied by 182 divided by 366 (to reflect the one-half-year period).
2 Amounts reflect net expenses allocated from the affiliated Master Portfolio in which the Fund invests.
10 | Allspring Core Bond Fund
Fund expenses (unaudited)
Allspring Core Bond Fund | 11
Portfolio of investments—May 31, 2022
| | | | | | Value |
| Investment companies: 100.08% | | | | | |
| Affiliated master portfolio: 100.08% | | | | | |
| Allspring Core Bond Portfolio | | | | | $ 4,605,920,600 |
| Total Investment companies (Cost $4,931,895,745) | | | | | 4,605,920,600 |
| Total investments in securities (Cost $4,931,895,745) | 100.08% | | | | 4,605,920,600 |
| Other assets and liabilities, net | (0.08) | | | | (3,749,925) |
| Total net assets | 100.00% | | | | $4,602,170,675 |
Transactions with the affiliated Master Portfolio were as follows:
| | % of
ownership,
beginning
of period | % of
ownership,
end of
period | Net realized
gains
(losses) on
securities
transactions
allocated
from
affiliated
Master
Portfolio | Net
change in
unrealized
gains
(losses) on
securities
transactions
allocated
from
affiliated
Master
Portfolio | Interest
allocated
from
affiliated
Master
Portfolio | Affiliated
income
allocated
from
affiliated
Master
Portfolio | Value,
end of
period | |
| Allspring Core Bond Portfolio | 94.49% | 94.49% | $(160,127,410) | $(336,112,120) | $84,935,574 | $189,256 | $4,605,920,600 | |
The accompanying notes are an integral part of these financial statements.
12 | Allspring Core Bond Fund
Statement of assets and liabilities—May 31, 2022
| | |
| Assets | |
Investments in affiliated Master Portfolio, at value (cost $4,931,895,745)
| $ 4,605,920,600 |
Receivable for Fund shares sold
| 4,319,379 |
Receivable from manager
| 100,531 |
Prepaid expenses and other assets
| 116,662 |
Total assets
| 4,610,457,172 |
| Liabilities | |
Payable for Fund shares redeemed
| 6,970,511 |
Dividends payable
| 862,656 |
Administration fees payable
| 268,389 |
Distribution fees payable
| 5,282 |
Trustees’ fees and expenses payable
| 895 |
Accrued expenses and other liabilities
| 178,764 |
Total liabilities
| 8,286,497 |
Total net assets
| $4,602,170,675 |
| Net assets consist of | |
Paid-in capital
| $ 5,125,148,836 |
Total distributable loss
| (522,978,161) |
Total net assets
| $4,602,170,675 |
| Computation of net asset value and offering price per share | |
Net assets – Class A
| $ 324,431,219 |
Shares outstanding – Class A1
| 27,018,137 |
Net asset value per share – Class A
| $12.01 |
Maximum offering price per share – Class A2
| $12.58 |
Net assets – Class C
| $ 7,805,540 |
Shares outstanding – Class C1
| 656,979 |
Net asset value per share – Class C
| $11.88 |
Net assets – Class R
| $ 1,449,082 |
Shares outstanding – Class R1
| 123,809 |
Net asset value per share – Class R
| $11.70 |
Net assets – Class R4
| $ 1,567,322 |
Shares outstanding – Class R41
| 133,936 |
Net asset value per share – Class R4
| $11.70 |
Net assets – Class R6
| $ 1,643,352,758 |
Shares outstanding – Class R61
| 140,547,560 |
Net asset value per share – Class R6
| $11.69 |
Net assets – Administrator Class
| $ 177,304,540 |
Shares outstanding – Administrator Class1
| 15,148,270 |
Net asset value per share – Administrator Class
| $11.70 |
Net assets – Institutional Class
| $ 2,446,260,214 |
Shares outstanding – Institutional Class1
| 209,294,240 |
Net asset value per share – Institutional Class
| $11.69 |
| 1 | The Fund has an unlimited number of authorized shares. |
| 2 | Maximum offering price is computed as 100/95.50 of net asset value. On investments of $50,000 or more, the offering price is reduced. |
The accompanying notes are an integral part of these financial statements.
Allspring Core Bond Fund | 13
Statement of operations—year ended May 31, 2022
| | |
| Investment income | |
Interest allocated from affiliated Master Portfolio (net of foreign withholding taxes of $219)
| $ 84,935,574 |
Affiliated income allocated from affiliated Master Portfolio
| 189,256 |
Expenses allocated from affiliated Master Portfolio
| (17,983,414) |
Waivers allocated from affiliated Master Portfolio
| 23,171 |
Total investment income
| 67,164,587 |
| Expenses | |
Management fee
| 2,507,030 |
| Administration fees | |
Class A
| 573,417 |
Class C
| 16,996 |
Class R
| 2,573 |
Class R4
| 1,403 |
Class R6
| 535,802 |
Administrator Class
| 210,631 |
Institutional Class
| 2,136,247 |
| Shareholder servicing fees | |
Class A
| 895,964 |
Class C
| 26,469 |
Class R
| 2,801 |
Class R4
| 1,749 |
Administrator Class
| 483,181 |
| Distribution fees | |
Class C
| 79,385 |
Class R
| 2,801 |
Custody and accounting fees
| 145,074 |
Professional fees
| 40,164 |
Registration fees
| 59,888 |
Shareholder report expenses
| 38,522 |
Trustees’ fees and expenses
| 20,687 |
Other fees and expenses
| 43,848 |
Total expenses
| 7,824,632 |
| Less: Fee waivers and/or expense reimbursements | |
Fund-level
| (2,060,004) |
Class A
| (33,070) |
Class C
| (4) |
Class R4
| (573) |
Class R6
| (535,802) |
Administrator Class
| (18,894) |
Institutional Class
| (880,933) |
Net expenses
| 4,295,352 |
Net investment income
| 62,869,235 |
| Realized and unrealized gains (losses) on investments | |
Net realized losses on securities transactions allocated from affiliated Master Portfolio
| (160,127,410) |
Net change in unrealized gains (losses) on securities transactions allocated from affiliated Master Portfolio
| (336,112,120) |
Net realized and unrealized gains (losses) on investments
| (496,239,530) |
Net decrease in net assets resulting from operations
| $(433,370,295) |
The accompanying notes are an integral part of these financial statements.
14 | Allspring Core Bond Fund
Statement of changes in net assets
| | | | | |
| | Year ended
May 31, 2022 | Year ended
May 31, 2021 |
| Operations | | | | |
Net investment income
| | $ 62,869,235 | | $ 68,755,092 |
Net realized gains (losses) on investments
| | (160,127,410) | | 124,275,417 |
Net change in unrealized gains (losses) on investments
| | (336,112,120) | | (163,776,116) |
Net increase (decrease) in net assets resulting from operations
| | (433,370,295) | | 29,254,393 |
| Distributions to shareholders from | | | | |
| Net investment income and net realized gains | | | | |
Class A
| | (6,433,689) | | (18,390,567) |
Class C
| | (110,382) | | (826,028) |
Class R
| | (26,649) | | (109,006) |
Class R4
| | (36,787) | | (255,450) |
Class R6
| | (39,431,641) | | (147,643,160) |
Administrator Class
| | (4,031,398) | | (13,932,917) |
Institutional Class
| | (58,058,159) | | (162,044,711) |
Total distributions to shareholders
| | (108,128,705) | | (343,201,839) |
| Capital share transactions | Shares | | Shares | |
| Proceeds from shares sold | | | | |
Class A
| 3,702,453 | 48,486,367 | 12,273,258 | 169,431,477 |
Class C
| 108,019 | 1,407,245 | 429,511 | 6,062,121 |
Class R
| 34,646 | 423,424 | 42,683 | 585,880 |
Class R4
| 28,978 | 375,499 | 73,596 | 1,019,265 |
Class R6
| 35,298,112 | 443,259,488 | 41,373,976 | 564,946,588 |
Administrator Class
| 2,796,248 | 36,167,197 | 7,772,437 | 107,461,106 |
Institutional Class
| 81,429,382 | 1,025,963,187 | 91,169,096 | 1,242,662,922 |
| | | 1,556,082,407 | | 2,092,169,359 |
| Reinvestment of distributions | | | | |
Class A
| 459,521 | 6,030,239 | 1,173,633 | 16,238,069 |
Class C
| 8,369 | 109,235 | 58,078 | 794,241 |
Class R
| 1,429 | 18,254 | 5,020 | 67,665 |
Class R4
| 2,874 | 36,727 | 18,865 | 254,704 |
Class R6
| 2,565,625 | 32,770,856 | 8,211,303 | 110,794,663 |
Administrator Class
| 297,680 | 3,811,913 | 991,907 | 13,386,686 |
Institutional Class
| 4,290,277 | 54,802,544 | 11,300,587 | 152,228,735 |
| | | 97,579,768 | | 293,764,763 |
| Payment for shares redeemed | | | | |
Class A
| (4,763,948) | (62,340,443) | (6,969,911) | (96,545,555) |
Class C
| (467,425) | (6,084,370) | (1,472,599) | (20,765,992) |
Class R
| (43,328) | (536,185) | (150,925) | (2,094,716) |
Class R4
| (33,896) | (428,263) | (285,459) | (3,858,168) |
Class R6
| (48,563,677) | (619,916,699) | (82,522,155) | (1,114,913,998) |
Administrator Class
| (4,352,230) | (55,087,181) | (8,154,991) | (111,662,175) |
Institutional Class
| (86,745,436) | (1,095,982,497) | (63,368,919) | (856,440,756) |
| | | (1,840,375,638) | | (2,206,281,360) |
Net increase (decrease) in net assets resulting from capital share transactions
| | (186,713,463) | | 179,652,762 |
Total decrease in net assets
| | (728,212,463) | | (134,294,684) |
| Net assets | | | | |
Beginning of period
| | 5,330,383,138 | | 5,464,677,822 |
End of period
| | $ 4,602,170,675 | | $ 5,330,383,138 |
The accompanying notes are an integral part of these financial statements.
Allspring Core Bond Fund | 15
Financial highlights
(For a share outstanding throughout each period)
| | Year ended May 31 |
| Class A | 2022 | 2021 | 2020 | 2019 | 2018 |
Net asset value, beginning of period
| $13.43 | $14.17 | $13.28 | $12.86 | $13.22 |
Net investment income
| 0.12 | 0.12 1 | 0.25 | 0.32 | 0.24 |
Net realized and unrealized gains (losses) on investments
| (1.30) | (0.06) | 0.93 | 0.42 | (0.36) |
Total from investment operations
| (1.18) | 0.06 | 1.18 | 0.74 | (0.12) |
| Distributions to shareholders from | | | | | |
Net investment income
| (0.12) | (0.15) | (0.26) | (0.32) | (0.24) |
Net realized gains
| (0.12) | (0.65) | (0.03) | 0.00 | 0.00 |
Total distributions to shareholders
| (0.24) | (0.80) | (0.29) | (0.32) | (0.24) |
Net asset value, end of period
| $12.01 | $13.43 | $14.17 | $13.28 | $12.86 |
Total return2
| (8.95)% | 0.31% | 9.03% | 5.87% | (0.96)% |
| Ratios to average net assets (annualized)* | | | | | |
Gross expenses
| 0.82% | 0.82% | 0.82% | 0.83% | 0.83% |
Net expenses
| 0.78% | 0.78% | 0.78% | 0.78% | 0.78% |
Net investment income
| 0.91% | 0.87% | 1.85% | 2.50% | 1.79% |
| Supplemental data | | | | | |
Portfolio turnover rate3
| 432% | 457% | 603% | 577% | 542% |
Net assets, end of period (000s omitted)
| $324,431 | $370,882 | $299,642 | $302,246 | $320,208 |
| * | Ratios include net expenses allocated from the affiliated Master Portfolio which were as follows: |
| Year ended May 31, 2022 | 0.36% |
| Year ended May 31, 2021 | 0.35% |
| Year ended May 31, 2020 | 0.35% |
| Year ended May 31, 2019 | 0.35% |
| Year ended May 31, 2018 | 0.35% |
| 1 | Calculated based upon average shares outstanding |
| 2 | Total return calculations do not include any sales charges. |
| 3 | Portfolio turnover rate is calculated by multiplying the affiliated Master Portfolio’s percentage of the Fund’s total investment in securities at the end of the period by the affiliated Master Portfolio’s portfolio turnover rate. |
The accompanying notes are an integral part of these financial statements.
16 | Allspring Core Bond Fund
Financial highlights
(For a share outstanding throughout each period)
| | Year ended May 31 |
| Class C | 2022 | 2021 | 2020 | 2019 | 2018 |
Net asset value, beginning of period
| $13.29 | $14.03 | $13.15 | $12.74 | $13.09 |
Net investment income
| 0.05 | 0.03 | 0.15 | 0.23 | 0.14 |
Net realized and unrealized gains (losses) on investments
| (1.32) | (0.07) | 0.92 | 0.40 | (0.35) |
Total from investment operations
| (1.27) | (0.04) | 1.07 | 0.63 | (0.21) |
| Distributions to shareholders from | | | | | |
Net investment income
| (0.02) | (0.05) | (0.16) | (0.22) | (0.14) |
Net realized gains
| (0.12) | (0.65) | (0.03) | 0.00 | 0.00 |
Total distributions to shareholders
| (0.14) | (0.70) | (0.19) | (0.22) | (0.14) |
Net asset value, end of period
| $11.88 | $13.29 | $14.03 | $13.15 | $12.74 |
Total return1
| (9.65)% | (0.45)% | 8.22% | 5.04% | (1.65)% |
| Ratios to average net assets (annualized)* | | | | | |
Gross expenses
| 1.57% | 1.57% | 1.57% | 1.58% | 1.58% |
Net expenses
| 1.53% | 1.53% | 1.53% | 1.53% | 1.53% |
Net investment income
| 0.13% | 0.16% | 1.11% | 1.75% | 1.04% |
| Supplemental data | | | | | |
Portfolio turnover rate2
| 432% | 457% | 603% | 577% | 542% |
Net assets, end of period (000s omitted)
| $7,806 | $13,399 | $27,971 | $34,494 | $47,843 |
| * | Ratios include net expenses allocated from the affiliated Master Portfolio which were as follows: |
| Year ended May 31, 2022 | 0.36% |
| Year ended May 31, 2021 | 0.35% |
| Year ended May 31, 2020 | 0.35% |
| Year ended May 31, 2019 | 0.35% |
| Year ended May 31, 2018 | 0.35% |
| 1 | Total return calculations do not include any sales charges. |
| 2 | Portfolio turnover rate is calculated by multiplying the affiliated Master Portfolio’s percentage of the Fund’s total investment in securities at the end of the period by the affiliated Master Portfolio’s portfolio turnover rate. |
The accompanying notes are an integral part of these financial statements.
Allspring Core Bond Fund | 17
Financial highlights
(For a share outstanding throughout each period)
| | Year ended May 31 |
| Class R | 2022 | 2021 | 2020 | 2019 | 2018 |
Net asset value, beginning of period
| $13.09 | $13.83 | $12.96 | $12.55 | $12.90 |
Net investment income
| 0.10 1 | 0.11 1 | 0.22 1 | 0.28 1 | 0.20 1 |
Net realized and unrealized gains (losses) on investments
| (1.27) | (0.06) | 0.90 | 0.41 | (0.35) |
Total from investment operations
| (1.17) | 0.05 | 1.12 | 0.69 | (0.15) |
| Distributions to shareholders from | | | | | |
Net investment income
| (0.10) | (0.14) | (0.22) | (0.28) | (0.20) |
Net realized gains
| (0.12) | (0.65) | (0.03) | 0.00 | 0.00 |
Total distributions to shareholders
| (0.22) | (0.79) | (0.25) | (0.28) | (0.20) |
Net asset value, end of period
| $11.70 | $13.09 | $13.83 | $12.96 | $12.55 |
Total return
| (9.09)% | 0.22% | 8.80% | 5.61% | (1.19)% |
| Ratios to average net assets (annualized)* | | | | | |
Gross expenses
| 0.92% | 0.87% | 1.05% | 1.07% | 1.08% |
Net expenses
| 0.90% | 0.86% | 1.02% | 1.03% | 1.03% |
Net investment income
| 0.79% | 0.81% | 1.66% | 2.25% | 1.54% |
| Supplemental data | | | | | |
Portfolio turnover rate2
| 432% | 457% | 603% | 577% | 542% |
Net assets, end of period (000s omitted)
| $1,449 | $1,716 | $3,241 | $8,565 | $12,230 |
| * | Ratios include net expenses allocated from the affiliated Master Portfolio which were as follows: |
| Year ended May 31, 2022 | 0.36% |
| Year ended May 31, 2021 | 0.35% |
| Year ended May 31, 2020 | 0.35% |
| Year ended May 31, 2019 | 0.35% |
| Year ended May 31, 2018 | 0.35% |
| 1 | Calculated based upon average shares outstanding |
| 2 | Portfolio turnover rate is calculated by multiplying the affiliated Master Portfolio’s percentage of the Fund’s total investment in securities at the end of the period by the affiliated Master Portfolio’s portfolio turnover rate. |
The accompanying notes are an integral part of these financial statements.
18 | Allspring Core Bond Fund
Financial highlights
(For a share outstanding throughout each period)
| | Year ended May 31 |
| Class R4 | 2022 | 2021 | 2020 | 2019 | 2018 |
Net asset value, beginning of period
| $13.09 | $13.83 | $12.95 | $12.55 | $12.89 |
Net investment income
| 0.15 | 0.16 1 | 0.29 1 | 0.35 | 0.26 1 |
Net realized and unrealized gains (losses) on investments
| (1.27) | (0.06) | 0.91 | 0.40 | (0.34) |
Total from investment operations
| (1.12) | 0.10 | 1.20 | 0.75 | (0.08) |
| Distributions to shareholders from | | | | | |
Net investment income
| (0.15) | (0.19) | (0.29) | (0.35) | (0.26) |
Net realized gains
| (0.12) | (0.65) | (0.03) | 0.00 | 0.00 |
Total distributions to shareholders
| (0.27) | (0.84) | (0.32) | (0.35) | (0.26) |
Net asset value, end of period
| $11.70 | $13.09 | $13.83 | $12.95 | $12.55 |
Total return
| (8.74)% | 0.55% | 9.34% | 6.07% | (0.61)% |
| Ratios to average net assets (annualized)* | | | | | |
Gross expenses
| 0.59% | 0.59% | 0.59% | 0.60% | 0.60% |
Net expenses
| 0.52% | 0.52% | 0.52% | 0.52% | 0.52% |
Net investment income
| 1.17% | 1.16% | 2.19% | 2.76% | 2.01% |
| Supplemental data | | | | | |
Portfolio turnover rate2
| 432% | 457% | 603% | 577% | 542% |
Net assets, end of period (000s omitted)
| $1,567 | $1,780 | $4,549 | $10,805 | $11,680 |
| * | Ratios include net expenses allocated from the affiliated Master Portfolio which were as follows: |
| Year ended May 31, 2022 | 0.36% |
| Year ended May 31, 2021 | 0.35% |
| Year ended May 31, 2020 | 0.35% |
| Year ended May 31, 2019 | 0.35% |
| Year ended May 31, 2018 | 0.35% |
| 1 | Calculated based upon average shares outstanding |
| 2 | Portfolio turnover rate is calculated by multiplying the affiliated Master Portfolio’s percentage of the Fund’s total investment in securities at the end of the period by the affiliated Master Portfolio’s portfolio turnover rate. |
The accompanying notes are an integral part of these financial statements.
Allspring Core Bond Fund | 19
Financial highlights
(For a share outstanding throughout each period)
| | Year ended May 31 |
| Class R6 | 2022 | 2021 | 2020 | 2019 | 2018 |
Net asset value, beginning of period
| $13.08 | $13.82 | $12.95 | $12.54 | $12.89 |
Net investment income
| 0.17 | 0.18 1 | 0.30 | 0.37 | 0.28 |
Net realized and unrealized gains (losses) on investments
| (1.27) | (0.06) | 0.91 | 0.41 | (0.35) |
Total from investment operations
| (1.10) | 0.12 | 1.21 | 0.78 | (0.07) |
| Distributions to shareholders from | | | | | |
Net investment income
| (0.17) | (0.21) | (0.31) | (0.37) | (0.28) |
Net realized gains
| (0.12) | (0.65) | (0.03) | 0.00 | 0.00 |
Total distributions to shareholders
| (0.29) | (0.86) | (0.34) | (0.37) | (0.28) |
Net asset value, end of period
| $11.69 | $13.08 | $13.82 | $12.95 | $12.54 |
Total return
| (8.61)% | 0.70% | 9.42% | 6.31% | (0.54)% |
| Ratios to average net assets (annualized)* | | | | | |
Gross expenses
| 0.44% | 0.44% | 0.44% | 0.45% | 0.45% |
Net expenses
| 0.37% | 0.37% | 0.37% | 0.37% | 0.37% |
Net investment income
| 1.32% | 1.29% | 2.26% | 2.92% | 2.24% |
| Supplemental data | | | | | |
Portfolio turnover rate2
| 432% | 457% | 603% | 577% | 542% |
Net assets, end of period (000s omitted)
| $1,643,353 | $1,978,164 | $2,545,332 | $2,513,644 | $1,360,847 |
| * | Ratios include net expenses allocated from the affiliated Master Portfolio which were as follows: |
| Year ended May 31, 2022 | 0.36% |
| Year ended May 31, 2021 | 0.35% |
| Year ended May 31, 2020 | 0.35% |
| Year ended May 31, 2019 | 0.35% |
| Year ended May 31, 2018 | 0.35% |
| 1 | Calculated based upon average shares outstanding |
| 2 | Portfolio turnover rate is calculated by multiplying the affiliated Master Portfolio’s percentage of the Fund’s total investment in securities at the end of the period by the affiliated Master Portfolio’s portfolio turnover rate. |
The accompanying notes are an integral part of these financial statements.
20 | Allspring Core Bond Fund
Financial highlights
(For a share outstanding throughout each period)
| | Year ended May 31 |
| Administrator Class | 2022 | 2021 | 2020 | 2019 | 2018 |
Net asset value, beginning of period
| $13.09 | $13.83 | $12.96 | $12.56 | $12.90 |
Net investment income
| 0.13 | 0.13 | 0.26 | 0.33 1 | 0.24 1 |
Net realized and unrealized gains (losses) on investments
| (1.27) | (0.06) | 0.90 | 0.40 | (0.34) |
Total from investment operations
| (1.14) | 0.07 | 1.16 | 0.73 | (0.10) |
| Distributions to shareholders from | | | | | |
Net investment income
| (0.13) | (0.16) | (0.26) | (0.33) | (0.24) |
Net realized gains
| (0.12) | (0.65) | (0.03) | 0.00 | 0.00 |
Total distributions to shareholders
| (0.25) | (0.81) | (0.29) | (0.33) | (0.24) |
Net asset value, end of period
| $11.70 | $13.09 | $13.83 | $12.96 | $12.56 |
Total return
| (8.90)% | 0.37% | 9.14% | 5.87% | (0.79)% |
| Ratios to average net assets (annualized)* | | | | | |
Gross expenses
| 0.74% | 0.76% | 0.76% | 0.76% | 0.77% |
Net expenses
| 0.69% | 0.70% | 0.70% | 0.70% | 0.70% |
Net investment income
| 0.99% | 0.95% | 1.92% | 2.58% | 1.86% |
| Supplemental data | | | | | |
Portfolio turnover rate2
| 432% | 457% | 603% | 577% | 542% |
Net assets, end of period (000s omitted)
| $177,305 | $214,796 | $218,522 | $205,825 | $269,057 |
| * | Ratios include net expenses allocated from the affiliated Master Portfolio which were as follows: |
| Year ended May 31, 2022 | 0.36% |
| Year ended May 31, 2021 | 0.35% |
| Year ended May 31, 2020 | 0.35% |
| Year ended May 31, 2019 | 0.35% |
| Year ended May 31, 2018 | 0.35% |
| 1 | Calculated based upon average shares outstanding |
| 2 | Portfolio turnover rate is calculated by multiplying the affiliated Master Portfolio’s percentage of the Fund’s total investment in securities at the end of the period by the affiliated Master Portfolio’s portfolio turnover rate. |
The accompanying notes are an integral part of these financial statements.
Allspring Core Bond Fund | 21
Financial highlights
(For a share outstanding throughout each period)
| | Year ended May 31 |
| Institutional Class | 2022 | 2021 | 2020 | 2019 | 2018 |
Net asset value, beginning of period
| $13.07 | $13.82 | $12.94 | $12.54 | $12.88 |
Net investment income
| 0.16 | 0.17 | 0.29 | 0.36 | 0.28 |
Net realized and unrealized gains (losses) on investments
| (1.26) | (0.07) | 0.92 | 0.40 | (0.34) |
Total from investment operations
| (1.10) | 0.10 | 1.21 | 0.76 | (0.06) |
| Distributions to shareholders from | | | | | |
Net investment income
| (0.16) | (0.20) | (0.30) | (0.36) | (0.28) |
Net realized gains
| (0.12) | (0.65) | (0.03) | 0.00 | 0.00 |
Total distributions to shareholders
| (0.28) | (0.85) | (0.33) | (0.36) | (0.28) |
Net asset value, end of period
| $11.69 | $13.07 | $13.82 | $12.94 | $12.54 |
Total return
| (8.59)% | 0.58% | 9.45% | 6.18% | (0.51)% |
| Ratios to average net assets (annualized)* | | | | | |
Gross expenses
| 0.49% | 0.49% | 0.49% | 0.50% | 0.50% |
Net expenses
| 0.42% | 0.42% | 0.42% | 0.42% | 0.42% |
Net investment income
| 1.27% | 1.22% | 2.21% | 2.86% | 2.16% |
| Supplemental data | | | | | |
Portfolio turnover rate1
| 432% | 457% | 603% | 577% | 542% |
Net assets, end of period (000s omitted)
| $2,446,260 | $2,749,647 | $2,365,421 | $2,343,238 | $3,318,290 |
| * | Ratios include net expenses allocated from the affiliated Master Portfolio which were as follows: |
| Year ended May 31, 2022 | 0.36% |
| Year ended May 31, 2021 | 0.35% |
| Year ended May 31, 2020 | 0.35% |
| Year ended May 31, 2019 | 0.35% |
| Year ended May 31, 2018 | 0.35% |
| 1 | Portfolio turnover rate is calculated by multiplying the affiliated Master Portfolio’s percentage of the Fund’s total investment in securities at the end of the period by the affiliated Master Portfolio’s portfolio turnover rate. |
The accompanying notes are an integral part of these financial statements.
22 | Allspring Core Bond Fund
Notes to financial statements
1. ORGANIZATION
Allspring Funds Trust (the "Trust"), a Delaware statutory trust organized on March 10, 1999, is an open-end management investment company registered under the Investment Company Act of 1940, as amended (the "1940 Act"). As an investment company, the Trust follows the accounting and reporting guidance in Financial Accounting Standards Board ("FASB") Accounting Standards Codification Topic 946, Financial Services – Investment Companies. These financial statements report on the Allspring Core Bond Fund (the "Fund") which is a diversified series of the Trust.
The Fund is a feeder fund in a master-feeder structure that invests substantially all of its assets in a single master portfolio with a substantially identical investment objective and substantially similar investment strategies. The Fund invests in Allspring Core Bond Portfolio, a separate diversified portfolio (the “affiliated Master Portfolio”) of Allspring Master Trust, a registered open-end management investment company. As of May 31, 2022, the Fund owned 94.49% of Allspring Core Bond Portfolio. The affiliated Master Portfolio directly acquires portfolio securities and the Fund acquires an indirect interest in those securities. The Fund accounts for its investment in the affiliated Master Portfolio as a partnership investment and records on a daily basis its share of the affiliated Master Portfolio’s income, expense and realized and unrealized gains and losses. The financial statements of the affiliated Master Portfolio for the year ended May 31, 2022 are included in this report and should be read in conjunction with the Fund’s financial statements.
Effective on November 1, 2021, the sale transaction of Wells Fargo Asset Management ("WFAM") by Wells Fargo & Company to GTCR LLC and Reverence Capital Partners, L.P. was closed. In connection with the closing of the transaction, WFAM became known as Allspring Global Investments (“Allspring”) and various entities that provided services to the Fund changed their names to "Allspring", including Allspring Funds Management, LLC, the investment manager to the Fund, Allspring Global Investments, LLC and Allspring Global Investments (UK) Limited, both registered investment advisers providing subadvisory services to certain funds, and Allspring Funds Distributor, LLC, the Fund's principal underwriter. Consummation of the transaction resulted in a new investment management agreement and subadvisory agreement which became effective on November 1, 2021.
2. SIGNIFICANT ACCOUNTING POLICIES
The following significant accounting policies, which are consistently followed in the preparation of the financial statements of the Fund, are in conformity with U.S. generally accepted accounting principles which require management to make estimates and assumptions that affect the reported amounts of assets and liabilities, disclosure of contingent assets and liabilities at the date of the financial statements, and the reported amounts of income and expenses during the reporting period. Actual results could differ from those estimates.
Securities valuation
All investments are valued each business day as of the close of regular trading on the New York Stock Exchange (generally 4 p.m. Eastern Time), although the Fund may deviate from this calculation time under unusual or unexpected circumstances.
Investments in the affiliated Master Portfolio are valued daily based on the Fund’s proportionate share of the affiliated Master Portfolio’s net assets, which are also valued daily. Securities held in the affiliated Master Portfolio are valued as discussed in the Notes to Financial Statements of the affiliated Master Portfolio, which are included elsewhere in this report.
Investments which are not valued using the method discussed above are valued at their fair value, as determined in good faith by the Board of Trustees. The Board of Trustees has established a Valuation Committee comprised of the Trustees and has delegated to it the authority to take any actions regarding the valuation of portfolio securities that the Valuation Committee deems necessary or appropriate, including determining the fair value of portfolio securities, unless the determination has been delegated to the Allspring Global Investments Pricing Committee at Allspring Funds Management, LLC ("Allspring Funds Management"). The Board of Trustees retains the authority to make or ratify any valuation decisions or approve any changes to the Valuation Procedures as it deems appropriate. On a quarterly basis, the Board of Trustees receives reports on any valuation actions taken by the Valuation Committee or the Allspring Global Investments Pricing Committee which may include items for ratification.
Investment transactions, income and expenses
Investments in the affiliated Master Portfolio are recorded on a trade date basis. The Fund records daily its proportionate share of the affiliated Master Portfolio’s income, expenses and realized and unrealized gains or losses. The Fund also accrues its own expenses.
Allspring Core Bond Fund | 23
Notes to financial statements
Distributions to shareholders
Distributions to shareholders from net investment income are declared daily and paid monthly. Distributions from net realized gains, if any, are recorded on the ex-dividend date and paid at least annually. Such distributions are determined in accordance with income tax regulations and may differ from U.S. generally accepted accounting principles. Dividend sources are estimated at the time of declaration. The tax character of distributions is determined as of the Fund's fiscal year end. Therefore, a portion of the Fund's distributions made prior to the Fund’s fiscal year end may be categorized as a tax return of capital at year end.
Federal and other taxes
The Fund intends to continue to qualify as a regulated investment company by distributing substantially all of its investment company taxable income and any net realized capital gains (after reduction for capital loss carryforwards) sufficient to relieve it from all, or substantially all, federal income taxes. Accordingly, no provision for federal income taxes was required.
The Fund’s income and federal excise tax returns and all financial records supporting those returns for the prior three fiscal years are subject to examination by the federal and Delaware revenue authorities. Management has analyzed the Fund's tax positions taken on federal, state, and foreign tax returns, as applicable, for all open tax years and does not believe that there are any uncertain tax positions that require recognition of a tax liability.
As of May 31, 2022, the aggregate cost of all investments for federal income tax purposes was $4,957,666,104 and the unrealized gains (losses) consisted of:
| Gross unrealized gains | $ 0 |
| Gross unrealized losses | (351,745,504) |
| Net unrealized losses | $(351,745,504) |
As of May 31, 2022, the Fund had current year deferred post-October capital losses consisting of $141,946,847 in short-term capital losses and $29,094,231 in long-term capital losses.
Class allocations
The separate classes of shares offered by the Fund differ principally in applicable sales charges, distribution, shareholder servicing, and administration fees. Class specific expenses are charged directly to that share class. Investment income, common fund-level expenses, and realized and unrealized gains (losses) on investments are allocated daily to each class of shares based on the relative proportion of net assets of each class.
3. FAIR VALUATION MEASUREMENTS
At May 31, 2022, the Fund’s investment in the affiliated Master Portfolio was measured at fair value using the net asset value per share (or its equivalent) as a practical expedient. The investment objective and fair value of the affiliated Master Portfolio is as follows:
| Affiliated Master Portfolio | Investment objective | Fair value of affiliated
Master Portfolio |
| Allspring Core Bond Portfolio | Seeks total return, consisting of income and capital appreciation | $4,605,920,600 |
The affiliated Master Portfolio does not have a redemption period notice, can be redeemed daily and does not have any unfunded commitments.
4. TRANSACTIONS WITH AFFILIATES
Management fee
Allspring Funds Management, a wholly owned subsidiary of Allspring Global Investments Holdings, LLC, a holding company indirectly owned by certain private funds of GTCR LLC and Reverence Capital Partners, L.P., is the manager of the Fund and provides advisory and fund-level administrative services under an investment management agreement. Under the investment management agreement, Allspring Funds Management is responsible for, among other services, implementing the investment objectives and strategies of the Fund and providing fund-level administrative services in connection with the Fund’s operations. As long as the Fund continues to invest substantially all of its assets in a single affiliated Master Portfolio, the Fund pays Allspring Funds Management an investment management fee only for fund-level administrative services at the following annual rate based on the Fund’s average daily net assets:
24 | Allspring Core Bond Fund
Notes to financial statements
| Average daily net assets | Management fee |
| First $5 billion | 0.050% |
| Next $5 billion | 0.040 |
| Over $10 billion | 0.030 |
For the year ended May 31, 2022, the management fee was equivalent to an annual rate of 0.05% of the Fund’s average daily net assets.
Allspring Funds Management also serves as the adviser to the affiliated Master Portfolio and is entitled to receive a fee from the affiliated Master Portfolio for those services.
Administration fees
Under a class-level administration agreement, Allspring Funds Management provides class-level administrative services to the Fund, which includes paying fees and expenses for services provided by the transfer agent, sub-transfer agents, omnibus account servicers and record-keepers. As compensation for its services under the class-level administration agreement, Allspring Funds Management receives an annual fee which is calculated based on the average daily net assets of each class as follows:
| | Class-level
administration fee |
| Class A | 0.16% |
| Class C | 0.16 |
| Class R | 0.16 |
| Class R4 | 0.08 |
| Class R6 | 0.03 |
| Administrator Class | 0.10 |
| Institutional Class | 0.08 |
Waivers and/or expense reimbursements
Allspring Funds Management has contractually committed to waive and/or reimburse management and administration fees to the extent necessary to maintain certain net operating expense ratios for the Fund. When each class of the Fund has exceeded its expense cap, Allspring Funds Management will waive fees and/or reimburse expenses from fund-level expenses on a proportionate basis and then from class specific expenses. When only certain classes exceed their expense caps, waivers and/or reimbursements are applied against class specific expenses before fund-level expenses. Net expenses from the affiliated Master Portfolio are included in the expense caps. Allspring Funds Management has contractually committed through September 30, 2022 to waive fees and/or reimburse expenses to the extent necessary to cap expenses. Prior to or after the commitment expiration date, the caps may be increased or the commitment to maintain the caps may be terminated only with the approval of the Board of Trustees. As of May 31, 2022, the contractual expense caps are as follows:
| | Expense ratio caps |
| Class A | 0.78% |
| Class C | 1.53 |
| Class R | 1.03 |
| Class R4 | 0.52 |
| Class R6 | 0.37 |
| Administrator Class | 0.70 |
| Institutional Class | 0.42 |
Allspring Core Bond Fund | 25
Notes to financial statements
Distribution fees
The Trust has adopted a distribution plan for Class C and Class R shares pursuant to Rule 12b-1 under the 1940 Act. Distribution fees are charged to Class C and Class R shares and paid to Allspring Funds Distributor, LLC ("Allspring Funds Distributor"), the principal underwriter, an affiliate of Allspring Funds Management, at an annual rate of 0.75% of the average daily net assets of Class C shares and 0.25% of the average daily net assets of Class R shares.
In addition, Allspring Funds Distributor is entitled to receive the front-end sales charge from the purchase of Class A shares and a contingent deferred sales charge on the redemption of certain Class A shares. Allspring Funds Distributor is also entitled to receive the contingent deferred sales charges from redemptions of Class C shares. For the year ended May 31, 2022, Allspring Funds Distributor received $1,215 from the sale of Class A shares. No contingent deferred sales charges were incurred by Class A and Class C shares for the year ended May 31, 2022.
Shareholder servicing fees
The Trust has entered into contracts with one or more shareholder servicing agents, whereby Class A, Class C, Class R, and Administrator Class are charged a fee at an annual rate of 0.25% of the average daily net assets of each respective class. Class R4 is charged a fee at an annual rate of 0.10% of its average daily net assets. A portion of these total shareholder servicing fees were paid to affiliates, and to certain entities that were affiliates of the Fund until November 1, 2021.
5. INVESTMENT PORTFOLIO TRANSACTIONS
The Fund seeks to achieve its investment objective by investing substantially all of its assets in the affiliated Master Portfolio. Purchases and sales have been calculated by multiplying the Fund's ownership percentage of the affiliated Master Portfolio at the end of the period by the affiliated Master Portfolio's purchases and sales. Purchases and sales of investments, excluding U.S. government obligations (if any) and short-term securities, for the year ended May 31, 2022 were as follows:
| Purchases at cost | | Sales proceeds |
U.S.
government | Non-U.S.
government | | U.S.
government | Non-U.S.
government |
| $19,079,692,971 | $4,258,423,945 | | $19,537,746,801 | $3,722,769,013 |
6. BANK BORROWINGS
The Trust (excluding the money market funds), Allspring Master Trust and Allspring Variable Trust are parties to a $350,000,000 revolving credit agreement whereby the Fund is permitted to use bank borrowings for temporary or emergency purposes, such as to fund shareholder redemption requests. Interest under the credit agreement is charged to the Fund based on a borrowing rate equal to the higher of the Federal Funds rate in effect on that day plus 1.25% or the overnight bank funding rate in effect on that day plus 1.25%. In addition, an annual commitment fee equal to 0.25% of the unused balance is allocated to each participating fund.
For the year ended May 31, 2022, there were no borrowings by the Fund under the agreement.
7. DISTRIBUTIONS TO SHAREHOLDERS
The tax character of distributions paid during the years ended May 31, 2022 and May 31, 2021 were as follows:
| | Year ended May 31 |
| | 2022 | 2021 |
| Ordinary income | $80,688,093 | $291,084,924 |
| Long-term capital gain | 27,440,612 | 52,116,915 |
As of May 31, 2022, the components of distributable earnings on a tax basis were as follows:
Undistributed
ordinary
income | Unrealized
losses | Post-October
capital
losses
deferred |
| $695,033 | $(351,745,504) | $(171,041,078) |
26 | Allspring Core Bond Fund
Notes to financial statements
8. INDEMNIFICATION
Under the Fund's organizational documents, the officers and Trustees have been granted certain indemnification rights against certain liabilities that may arise out of performance of their duties to the Fund. The Fund has entered into a separate agreement with each Trustee that converts indemnification rights currently existing under the Fund’s organizational documents into contractual rights that cannot be changed in the future without the consent of the Trustee. Additionally, in the normal course of business, the Fund may enter into contracts with service providers that contain a variety of indemnification clauses. The Fund’s maximum exposure under these arrangements is dependent on future claims that may be made against the Fund and, therefore, cannot be estimated.
9. CORONAVIRUS (COVID-19) PANDEMIC
On March 11, 2020, the World Health Organization announced that it had made the assessment that coronavirus disease 2019 (“COVID-19”) is a pandemic. The impacts of COVID-19 are affecting the entire global economy, individual companies and investment products, the funds, and the market in general. There is significant uncertainty around the extent and duration of business disruptions related to COVID-19 and the impacts may last for an extended period of time. COVID-19 has led to significant uncertainty and volatility in the financial markets.
Allspring Core Bond Fund | 27
Report of independent registered public accounting firm
To the Shareholders of the Fund and Board of Trustees
Allspring Funds Trust:
Opinion on the Financial Statements
We have audited the accompanying statement of assets and liabilities of Allspring Core Bond Fund (formerly, Wells Fargo Core Bond Fund) (the Fund), one of the funds constituting Allspring Funds Trust (formerly, Wells Fargo Funds Trust), including the portfolio of investments, as of May 31, 2022, the related statement of operations for the year then ended, the statements of changes in net assets for each of the years in the two-year period then ended, and the related notes (collectively, the financial statements) and the financial highlights for each of the years in the five-year period then ended. In our opinion, the financial statements and financial highlights present fairly, in all material respects, the financial position of the Fund as of May 31, 2022, the results of its operations for the year then ended, the changes in its net assets for each of the years in the two-year period then ended, and the financial highlights for each of the years in the five-year period then ended, in conformity with U.S. generally accepted accounting principles.
Basis for Opinion
These financial statements and financial highlights are the responsibility of the Fund’s management. Our responsibility is to express an opinion on these financial statements and financial highlights based on our audits. We are a public accounting firm registered with the Public Company Accounting Oversight Board (United States) (PCAOB) and are required to be independent with respect to the Fund in accordance with the U.S. federal securities laws and the applicable rules and regulations of the Securities and Exchange Commission and the PCAOB.
We conducted our audits in accordance with the standards of the PCAOB. Those standards require that we plan and perform the audit to obtain reasonable assurance about whether the financial statements and financial highlights are free of material misstatement, whether due to error or fraud. Our audits included performing procedures to assess the risks of material misstatement of the financial statements and financial highlights, whether due to error or fraud, and performing procedures that respond to those risks. Such procedures included examining, on a test basis, evidence regarding the amounts and disclosures in the financial statements and financial highlights. Such procedures also included confirmation of securities owned as of May 31, 2022, by correspondence with the transfer agent. Our audits also included evaluating the accounting principles used and significant estimates made by management, as well as evaluating the overall presentation of the financial statements and financial highlights. We believe that our audits provide a reasonable basis for our opinion.

We have not been able to determine the specific year that we began serving as the auditor of one or more Allspring Funds investment companies; however, we are aware that we have served as the auditor of one or more Allspring Funds investment companies since at least 1955.
Boston, Massachusetts
July 27, 2022
28 | Allspring Core Bond Fund
Portfolio of investments—May 31, 2022
| | | Interest
rate | Maturity
date | Principal | Value |
| Agency securities: 29.89% | | | | | | |
| FHLMC ¤ | | 0.00% | 12-14-2029 | $ | 6,390,000 | $ 5,027,451 |
| FHLMC (1 Month LIBOR +0.35%) ± | | 1.22 | 12-15-2048 | | 480,166 | 477,191 |
| FHLMC | | 1.75 | 5-15-2043 | | 1,847,354 | 1,709,681 |
| FHLMC | | 2.00 | 11-1-2041 | | 2,186,535 | 1,980,236 |
| FHLMC | | 2.00 | 11-1-2041 | | 2,898,420 | 2,624,956 |
| FHLMC | | 2.00 | 12-1-2041 | | 12,390,629 | 11,221,553 |
| FHLMC | | 2.00 | 1-1-2042 | | 2,170,096 | 1,965,338 |
| FHLMC | | 2.00 | 2-1-2042 | | 4,591,553 | 4,138,408 |
| FHLMC | | 2.00 | 3-1-2042 | | 4,046,369 | 3,664,668 |
| FHLMC | | 2.00 | 5-1-2042 | | 4,412,663 | 3,996,388 |
| FHLMC (12 Month LIBOR +1.64%) ± | | 2.42 | 9-1-2045 | | 7,354,857 | 7,437,896 |
| FHLMC | | 2.50 | 1-1-2036 | | 13,552,570 | 13,243,097 |
| FHLMC | | 2.50 | 5-1-2042 | | 6,631,634 | 6,194,745 |
| FHLMC | | 2.50 | 8-1-2051 | | 1,807,186 | 1,668,020 |
| FHLMC | | 2.50 | 9-1-2051 | | 11,739,172 | 10,913,578 |
| FHLMC | | 2.50 | 1-1-2052 | | 11,632,641 | 10,734,726 |
| FHLMC | | 2.50 | 2-1-2052 | | 1,228,740 | 1,134,423 |
| FHLMC | | 2.50 | 3-1-2052 | | 4,067,578 | 3,753,459 |
| FHLMC (12 Month LIBOR +1.68%) ± | | 2.62 | 9-1-2047 | | 7,003,360 | 7,141,809 |
| FHLMC (12 Month LIBOR +1.64%) ± | | 2.81 | 5-1-2049 | | 2,133,722 | 2,146,337 |
| FHLMC (12 Month LIBOR +1.64%) ± | | 2.84 | 4-1-2048 | | 8,328,949 | 8,525,451 |
| FHLMC | | 3.00 | 10-15-2047 | | 4,646,219 | 4,501,354 |
| FHLMC | | 3.00 | 5-15-2050 | | 3,697,838 | 3,599,197 |
| FHLMC | | 3.00 | 8-1-2051 | | 782,258 | 746,986 |
| FHLMC | | 3.00 | 9-1-2051 | | 1,858,476 | 1,774,349 |
| FHLMC | | 3.00 | 11-1-2051 | | 1,104,007 | 1,054,211 |
| FHLMC | | 3.00 | 12-1-2051 | | 14,795,482 | 14,288,582 |
| FHLMC | | 3.00 | 3-1-2052 | | 1,543,546 | 1,483,012 |
| FHLMC | | 3.00 | 3-1-2052 | | 918,270 | 886,807 |
| FHLMC (12 Month LIBOR +1.64%) ± | | 3.44 | 3-1-2049 | | 3,275,464 | 3,321,637 |
| FHLMC | | 4.00 | 1-1-2035 | | 100,889 | 102,496 |
| FHLMC | | 4.00 | 1-1-2036 | | 209,975 | 217,472 |
| FHLMC | | 4.00 | 10-1-2036 | | 1,037,076 | 1,058,888 |
| FHLMC | | 4.00 | 3-1-2037 | | 173,117 | 180,157 |
| FHLMC | | 4.00 | 3-1-2037 | | 197,421 | 206,910 |
| FHLMC | | 4.00 | 3-1-2037 | | 177,980 | 184,338 |
| FHLMC | | 4.00 | 4-1-2037 | | 1,528,649 | 1,574,001 |
| FHLMC | | 4.00 | 4-1-2037 | | 1,264,513 | 1,309,727 |
| FHLMC | | 4.00 | 8-1-2038 | | 5,888,880 | 5,972,424 |
| FHLMC | | 4.00 | 7-1-2049 | | 8,715,338 | 8,920,263 |
| FHLMC | | 4.50 | 6-1-2039 | | 193,165 | 199,241 |
| FHLMC | | 4.50 | 7-1-2039 | | 249,953 | 259,959 |
| FHLMC | | 5.00 | 5-1-2048 | | 4,151,140 | 4,366,458 |
| FHLMC | | 5.00 | 3-1-2049 | | 6,597,249 | 6,932,200 |
| FHLMC Series 1897 Class K | | 7.00 | 9-15-2026 | | 146 | 154 |
| FHLMC Series 264 Class 30 | | 3.00 | 7-15-2042 | | 6,192,466 | 5,944,463 |
| FHLMC Series 4426 Class QC | | 1.75 | 7-15-2037 | | 3,127,280 | 2,976,661 |
| FHLMC Series 4705 Class A | | 4.50 | 9-15-2042 | | 90,798 | 90,867 |
| FHLMC Series 4763 Class CA | | 3.00 | 9-15-2038 | | 919,728 | 894,962 |
| FHLMC Series 4767 Class KA | | 3.00 | 3-15-2048 | | 2,531,116 | 2,462,746 |
| FHLMC Series 5091 Class AB | | 1.50 | 3-25-2051 | | 7,099,984 | 6,391,730 |
| FHLMC Series 5119 Class AB | | 1.50 | 8-25-2049 | | 3,611,605 | 3,207,201 |
| FHLMC Series 5201 Class CA | | 2.50 | 7-25-2048 | | 4,679,187 | 4,417,073 |
| FHLMC Series 5217 Class CD | | 2.50 | 7-25-2049 | | 4,114,064 | 3,983,962 |
The accompanying notes are an integral part of these financial statements.
Allspring Core Bond Portfolio | 29
Portfolio of investments—May 31, 2022
| | | Interest
rate | Maturity
date | Principal | Value |
| Agency securities (continued) | | | | | | |
| FNMA ¤ | | 0.00% | 11-15-2030 | $ | 18,777,000 | $ 14,539,669 |
| FNMA | | 1.50 | 10-1-2041 | | 14,979,913 | 13,066,764 |
| FNMA | | 1.50 | 11-1-2041 | | 30,106,270 | 26,260,423 |
| FNMA | | 1.50 | 1-25-2043 | | 2,270,827 | 2,080,896 |
| FNMA | | 1.50 | 1-25-2043 | | 7,726,584 | 7,226,308 |
| FNMA | | 1.70 | 8-25-2033 | | 8,953,699 | 8,529,244 |
| FNMA | | 1.75 | 5-25-2043 | | 2,562,362 | 2,371,965 |
| FNMA | | 1.75 | 6-25-2046 | | 16,821,692 | 15,229,056 |
| FNMA | | 2.00 | 6-25-2038 | | 8,798,460 | 8,354,674 |
| FNMA | | 2.00 | 2-1-2042 | | 18,557,372 | 16,806,825 |
| FNMA | | 2.00 | 3-1-2042 | | 12,389,311 | 11,220,584 |
| FNMA | | 2.00 | 10-1-2051 | | 26,488,847 | 23,569,577 |
| FNMA | | 2.00 | 3-1-2052 | | 7,432,240 | 6,642,545 |
| FNMA (12 Month LIBOR +1.58%) ± | | 2.06 | 6-1-2045 | | 1,694,948 | 1,736,564 |
| FNMA (12 Month LIBOR +1.58%) ± | | 2.38 | 1-1-2046 | | 5,111,275 | 5,231,279 |
| FNMA | | 2.50 | 12-1-2035 | | 14,158,829 | 13,835,369 |
| FNMA | | 2.50 | 3-1-2036 | | 8,059,753 | 7,875,633 |
| FNMA | | 2.50 | 4-1-2036 | | 2,849,824 | 2,784,668 |
| FNMA | | 2.50 | 5-1-2036 | | 9,575,796 | 9,350,814 |
| FNMA | | 2.50 | 5-1-2036 | | 7,398,563 | 7,217,343 |
| FNMA | | 2.50 | 6-1-2036 | | 8,776,673 | 8,576,125 |
| FNMA | | 2.50 | 8-1-2041 | | 4,340,289 | 4,072,149 |
| FNMA | | 2.50 | 2-1-2042 | | 4,558,735 | 4,280,139 |
| FNMA | | 2.50 | 4-1-2042 | | 3,859,093 | 3,608,681 |
| FNMA | | 2.50 | 5-1-2042 | | 5,568,216 | 5,206,908 |
| FNMA | | 2.50 | 11-25-2044 | | 1,556,096 | 1,480,188 |
| FNMA | | 2.50 | 8-1-2050 | | 26,838,260 | 24,913,447 |
| FNMA | | 2.50 | 10-1-2050 | | 6,897,489 | 6,423,896 |
| FNMA | | 2.50 | 6-1-2051 | | 4,788,699 | 4,427,029 |
| FNMA | | 2.50 | 9-1-2051 | | 5,471,674 | 5,056,635 |
| FNMA | | 2.50 | 12-1-2051 | | 9,963,997 | 9,221,265 |
| FNMA | | 2.50 | 12-1-2051 | | 4,798,976 | 4,451,985 |
| FNMA | | 2.50 | 12-1-2051 | | 14,629,515 | 13,542,443 |
| FNMA | | 2.50 | 3-1-2052 | | 1,950,929 | 1,807,223 |
| FNMA | | 2.50 | 3-1-2052 | | 3,049,369 | 2,813,880 |
| FNMA | | 3.00 | 1-1-2043 | | 5,082,367 | 4,962,081 |
| FNMA | | 3.00 | 5-25-2048 | | 6,580,335 | 6,463,840 |
| FNMA | | 3.00 | 7-25-2049 | | 2,231,590 | 2,142,336 |
| FNMA | | 3.00 | 11-1-2050 | | 12,759,182 | 12,353,539 |
| FNMA | | 3.00 | 6-1-2051 | | 9,151,283 | 8,905,797 |
| FNMA | | 3.00 | 6-1-2051 | | 2,335,505 | 2,259,544 |
| FNMA | | 3.00 | 8-1-2051 | | 11,140,590 | 10,799,392 |
| FNMA | | 3.00 | 9-1-2051 | | 1,627,301 | 1,553,637 |
| FNMA | | 3.00 | 1-1-2052 | | 17,134,567 | 16,351,820 |
| FNMA | | 3.00 | 4-1-2052 | | 4,752,215 | 4,561,499 |
| FNMA | | 3.00 | 4-1-2052 | | 7,445,426 | 7,148,825 |
| FNMA %% | | 3.00 | 6-13-2052 | | 2,700,000 | 2,571,012 |
| FNMA | | 3.00 | 12-1-2054 | | 22,452,763 | 21,639,497 |
| FNMA | | 3.00 | 2-1-2055 | | 2,226,085 | 2,159,595 |
| FNMA | | 3.00 | 7-1-2060 | | 28,375,139 | 27,540,001 |
| FNMA | | 3.00 | 7-1-2060 | | 21,827,643 | 21,006,952 |
| FNMA | | 3.50 | 4-1-2050 | | 5,984,731 | 5,987,971 |
| FNMA | | 3.50 | 7-1-2050 | | 8,067,460 | 8,071,839 |
| FNMA | | 3.50 | 1-1-2052 | | 7,040,214 | 7,044,027 |
| FNMA | | 3.50 | 2-1-2052 | | 7,086,682 | 7,090,520 |
The accompanying notes are an integral part of these financial statements.
30 | Allspring Core Bond Portfolio
Portfolio of investments—May 31, 2022
| | | Interest
rate | Maturity
date | Principal | Value |
| Agency securities (continued) | | | | | | |
| FNMA | | 3.50% | 3-1-2052 | $ | 18,013,139 | $ 17,967,167 |
| FNMA | | 3.50 | 3-1-2052 | | 14,622,426 | 14,521,774 |
| FNMA | | 3.50 | 3-1-2052 | | 8,389,086 | 8,393,630 |
| FNMA | | 3.50 | 5-1-2052 | | 19,390,595 | 19,161,186 |
| FNMA | | 3.50 | 5-1-2052 | | 9,783,566 | 9,747,295 |
| FNMA %% | | 3.50 | 7-14-2052 | | 6,700,000 | 6,548,487 |
| FNMA | | 4.00 | 9-1-2033 | | 1,644,783 | 1,686,301 |
| FNMA | | 4.00 | 12-1-2036 | | 189,288 | 194,814 |
| FNMA | | 4.00 | 10-1-2037 | | 1,209,436 | 1,233,556 |
| FNMA | | 4.00 | 6-1-2038 | | 2,280,176 | 2,322,096 |
| FNMA | | 4.00 | 9-1-2045 | | 694,423 | 716,333 |
| FNMA | | 4.00 | 1-1-2046 | | 4,971,649 | 5,128,507 |
| FNMA | | 4.00 | 2-1-2047 | | 2,433,792 | 2,484,570 |
| FNMA | | 4.00 | 4-1-2047 | | 622,552 | 633,590 |
| FNMA | | 4.00 | 4-1-2047 | | 468,621 | 481,888 |
| FNMA | | 4.00 | 4-1-2047 | | 164,435 | 166,046 |
| FNMA | | 4.00 | 10-1-2047 | | 564,022 | 579,977 |
| FNMA | | 4.00 | 10-1-2047 | | 451,652 | 462,900 |
| FNMA | | 4.00 | 7-1-2048 | | 15,404,540 | 15,715,161 |
| FNMA | | 4.00 | 12-1-2048 | | 2,475,860 | 2,545,980 |
| FNMA | | 4.00 | 2-1-2049 | | 2,745,847 | 2,797,616 |
| FNMA | | 4.00 | 5-1-2049 | | 306,847 | 309,845 |
| FNMA | | 4.00 | 5-1-2049 | | 2,207,806 | 2,259,126 |
| FNMA | | 4.00 | 12-1-2049 | | 2,344,684 | 2,391,450 |
| FNMA %% | | 4.00 | 6-13-2052 | | 40,700,000 | 40,674,563 |
| FNMA %% | | 4.00 | 7-14-2052 | | 64,700,000 | 64,493,747 |
| FNMA | | 4.00 | 8-1-2059 | | 2,964,976 | 3,068,897 |
| FNMA | | 4.50 | 5-1-2034 | | 783,266 | 818,564 |
| FNMA | | 4.50 | 6-1-2041 | | 181,370 | 189,185 |
| FNMA | | 4.50 | 3-1-2043 | | 2,482,902 | 2,589,697 |
| FNMA | | 4.50 | 10-1-2045 | | 3,784,109 | 3,942,703 |
| FNMA | | 4.50 | 2-1-2046 | | 92,415 | 96,257 |
| FNMA | | 4.50 | 7-1-2048 | | 4,038,819 | 4,224,801 |
| FNMA | | 4.50 | 8-1-2048 | | 5,073,513 | 5,316,069 |
| FNMA | | 4.50 | 10-1-2048 | | 4,409,880 | 4,620,797 |
| FNMA | | 4.50 | 11-1-2048 | | 1,759,929 | 1,849,794 |
| FNMA | | 4.50 | 1-1-2049 | | 8,200,096 | 8,592,208 |
| FNMA | | 4.50 | 2-1-2049 | | 4,379,994 | 4,589,335 |
| FNMA | | 4.50 | 6-1-2049 | | 3,294,791 | 3,452,374 |
| FNMA | | 4.50 | 7-1-2049 | | 3,612,504 | 3,785,176 |
| FNMA | | 4.50 | 8-1-2049 | | 3,235,880 | 3,390,545 |
| FNMA %% | | 4.50 | 8-11-2052 | | 58,200,000 | 58,888,852 |
| FNMA | | 5.00 | 7-1-2044 | | 261,385 | 276,100 |
| FNMA | | 5.00 | 10-1-2048 | | 57,959 | 60,895 |
| FNMA | | 5.00 | 12-1-2048 | | 2,289,660 | 2,397,074 |
| FNMA | | 5.00 | 8-1-2049 | | 24,004,160 | 25,353,031 |
| FNMA | | 5.00 | 8-1-2049 | | 11,273,820 | 11,869,674 |
| FNMA | | 5.00 | 11-1-2049 | | 3,420,067 | 3,580,467 |
| FNMA %% | | 5.00 | 8-11-2052 | | 75,200,000 | 77,125,531 |
| FNMA | | 5.50 | 12-1-2048 | | 3,012,185 | 3,212,225 |
| FNMA | | 5.50 | 6-1-2049 | | 8,019,283 | 8,579,002 |
| FNMA | | 6.00 | 2-1-2029 | | 1,454 | 1,533 |
| FNMA | | 6.00 | 3-1-2033 | | 18,609 | 20,101 |
| FNMA | | 6.00 | 11-1-2033 | | 6,185 | 6,756 |
| FNMA Series 2017-13 Class PA | | 3.00 | 8-25-2046 | | 2,772,523 | 2,709,239 |
The accompanying notes are an integral part of these financial statements.
Allspring Core Bond Portfolio | 31
Portfolio of investments—May 31, 2022
| | | Interest
rate | Maturity
date | Principal | Value |
| Agency securities (continued) | | | | | | |
| FNMA Series 2017-M7 Class A2 ±± | | 2.96% | 2-25-2027 | $ | 1,709,701 | $ 1,677,243 |
| FNMA Series 2018-14 Class KC | | 3.00 | 3-25-2048 | | 3,018,840 | 2,934,764 |
| FNMA Series 2018-15 Class AB | | 3.00 | 3-25-2048 | | 1,133,755 | 1,110,914 |
| FNMA Series 2018-8 Class KL | | 2.50 | 3-25-2047 | | 2,943,385 | 2,759,804 |
| FNMA Series 2019-15 Class AB | | 3.50 | 5-25-2053 | | 6,673,124 | 6,702,590 |
| FNMA Series 2020-48 Class AB | | 2.00 | 7-25-2050 | | 3,996,536 | 3,683,604 |
| FNMA Series 2020-48 Class DA | | 2.00 | 7-25-2050 | | 8,848,036 | 8,103,168 |
| FNMA Series 2021-27 Class EC | | 1.50 | 5-25-2051 | | 11,421,611 | 10,087,270 |
| FNMA Series 2021-78 Class ND | | 1.50 | 11-25-2051 | | 6,325,157 | 5,765,438 |
| FNMA Series 2022-11 Class A | | 2.50 | 7-25-2047 | | 10,461,238 | 9,978,790 |
| FNMA Series 2022-M3 Class A2 ±± | | 1.71 | 11-25-2031 | | 3,911,000 | 3,370,483 |
| FNMA Series 414 Class A35 | | 3.50 | 10-25-2042 | | 5,459,160 | 5,474,002 |
| GNMA | | 2.50 | 12-20-2051 | | 34,979,127 | 32,912,645 |
| GNMA %% | | 2.50 | 6-1-2052 | | 12,635,200 | 11,500,500 |
| GNMA | | 3.00 | 10-20-2046 | | 746,614 | 724,176 |
| GNMA | | 3.00 | 12-20-2046 | | 976,536 | 947,186 |
| GNMA | | 3.00 | 1-20-2047 | | 710,705 | 689,344 |
| GNMA | | 3.00 | 3-20-2047 | | 2,282,542 | 2,210,559 |
| GNMA | | 3.00 | 3-20-2047 | | 288,995 | 280,310 |
| GNMA | | 3.00 | 4-20-2047 | | 1,865,705 | 1,806,869 |
| GNMA | | 3.00 | 7-20-2047 | | 1,386,835 | 1,345,157 |
| GNMA | | 3.00 | 9-20-2047 | | 1,264,431 | 1,224,553 |
| GNMA | | 3.00 | 9-20-2047 | | 703,373 | 682,231 |
| GNMA | | 3.00 | 11-20-2047 | | 263,439 | 255,521 |
| GNMA | | 3.00 | 3-20-2048 | | 399,008 | 387,016 |
| GNMA | | 3.00 | 10-20-2050 | | 11,131,509 | 10,692,810 |
| GNMA | | 3.00 | 12-20-2051 | | 22,926,860 | 22,155,335 |
| GNMA | | 3.50 | 1-20-2048 | | 2,695,787 | 2,707,212 |
| GNMA | | 3.50 | 3-20-2049 | | 1,749,158 | 1,742,571 |
| GNMA | | 4.00 | 6-20-2047 | | 18,671,465 | 19,068,598 |
| GNMA | | 4.00 | 3-20-2048 | | 687,482 | 699,449 |
| GNMA | | 4.00 | 4-20-2048 | | 1,070,867 | 1,089,522 |
| GNMA | | 4.00 | 4-20-2048 | | 819,437 | 833,709 |
| GNMA | | 4.00 | 4-20-2048 | | 787,990 | 802,759 |
| GNMA | | 4.00 | 5-20-2049 | | 1,009,514 | 1,031,436 |
| GNMA | | 4.00 | 6-20-2049 | | 2,472,887 | 2,524,764 |
| GNMA | | 4.00 | 7-20-2049 | | 2,173,031 | 2,249,259 |
| GNMA | | 4.50 | 8-15-2047 | | 412,875 | 432,988 |
| GNMA | | 4.50 | 6-20-2048 | | 3,015,014 | 3,106,887 |
| GNMA | | 4.50 | 2-20-2049 | | 3,485,949 | 3,676,617 |
| GNMA | | 4.50 | 3-20-2049 | | 297,250 | 307,505 |
| GNMA | | 4.50 | 4-20-2049 | | 329,046 | 336,705 |
| GNMA | | 4.50 | 5-20-2049 | | 585,556 | 599,189 |
| GNMA | | 4.50 | 5-20-2049 | | 513,135 | 525,161 |
| GNMA %% | | 4.50 | 7-21-2052 | | 16,400,000 | 16,697,250 |
| GNMA %% | | 4.50 | 8-18-2052 | | 38,900,000 | 39,474,383 |
| GNMA | | 5.00 | 12-20-2039 | | 123,891 | 131,418 |
| GNMA | | 5.00 | 3-20-2048 | | 5,411,192 | 5,657,967 |
| GNMA | | 5.00 | 5-20-2048 | | 2,500,806 | 2,599,748 |
| GNMA | | 5.00 | 6-20-2048 | | 9,337,028 | 9,693,431 |
| GNMA | | 5.00 | 7-20-2048 | | 1,619,447 | 1,683,693 |
| GNMA | | 5.00 | 8-20-2048 | | 2,585,233 | 2,678,369 |
| GNMA | | 5.00 | 12-20-2048 | | 2,514,487 | 2,607,284 |
| GNMA | | 5.00 | 1-20-2049 | | 474,095 | 490,810 |
| GNMA | | 5.00 | 1-20-2049 | | 2,615,728 | 2,734,331 |
The accompanying notes are an integral part of these financial statements.
32 | Allspring Core Bond Portfolio
Portfolio of investments—May 31, 2022
| | | Interest
rate | Maturity
date | Principal | Value |
| Agency securities (continued) | | | | | | |
| GNMA | | 5.00% | 2-20-2049 | $ | 164,602 | $ 174,384 |
| GNMA | | 5.00 | 3-20-2049 | | 757,348 | 804,032 |
| GNMA Series 2012-141 Class WA ±± | | 4.53 | 11-16-2041 | | 929,358 | 951,404 |
| GNMA Series 2017-167 Class BQ | | 2.50 | 8-20-2044 | | 2,990,127 | 2,902,705 |
| GNMA Series 2018-11 Class PC | | 2.75 | 12-20-2047 | | 3,205,437 | 3,096,358 |
| GNMA Series 2019-132 Class NA | | 3.50 | 9-20-2049 | | 2,480,267 | 2,477,139 |
| GNMA Series 2021-23 Class MG | | 1.50 | 2-20-2051 | | 8,306,191 | 7,470,441 |
| GNMA Series 2022-84 Class A | | 2.50 | 1-20-2052 | | 3,034,996 | 2,693,363 |
| Total Agency securities (Cost $1,501,157,388) | | | | | | 1,452,075,426 |
| Asset-backed securities: 8.90% | | | | | | |
| Ally Auto Receivables Trust Series 2022-1 Class A3 | | 3.31 | 11-15-2026 | | 4,276,000 | 4,268,647 |
| American Express Credit Account Master Trust Series 2022-2 Class A | | 3.39 | 5-17-2027 | | 24,676,000 | 24,798,297 |
| AmeriCredit Automobile Receivables Series 2022-1 Class A3 | | 2.45 | 11-18-2026 | | 1,432,000 | 1,401,593 |
| Avis Budget Rental Car Funding LLC Series 2019-3A Class A1 144A | | 2.36 | 3-20-2026 | | 3,825,000 | 3,665,883 |
| Avis Budget Rental Car Funding LLC Series 2021-2A Class A 144A | | 1.66 | 2-20-2028 | | 7,680,000 | 6,903,243 |
| Barclays Dryrock Issuance Trust Series 2022-1 Class A | | 3.07 | 2-15-2028 | | 11,172,000 | 11,027,240 |
| Capital One Multi-Asset Execution Trust Series 2021-A2 Class A2 | | 1.39 | 7-15-2030 | | 5,392,000 | 4,692,527 |
| College Avenue Student Loan Trust Series 2017-A Class A1 (1 Month LIBOR +1.65%) 144A± | | 2.66 | 11-26-2046 | | 1,807,975 | 1,806,671 |
| College Avenue Student Loan Trust Series 2018-A Class A2 144A | | 4.13 | 12-26-2047 | | 1,458,838 | 1,417,103 |
| College Avenue Student Loan Trust Series 2019-A Class A2 144A | | 3.28 | 12-28-2048 | | 2,403,798 | 2,333,659 |
| College Avenue Student Loan Trust Series 2021-A Class A2 144A | | 1.60 | 7-25-2051 | | 3,172,930 | 2,849,620 |
| Ford Credit Auto Owner Trust Series 144A | | 1.06 | 4-15-2033 | | 2,467,000 | 2,270,220 |
| Ford Credit Auto Owner Trust Series 144A | | 3.88 | 11-15-2034 | | 11,752,000 | 11,773,953 |
| Ford Credit Auto Owner Trust Series 2022-A Class A3 | | 1.29 | 6-15-2026 | | 2,308,000 | 2,231,072 |
| Ford Credit Auto Owner Trust Series 2022-A Class A3 | | 3.23 | 5-15-2025 | | 8,751,000 | 8,731,844 |
| Ford Credit Auto Owner Trust Series 2022-A Class A4 | | 3.37 | 7-15-2025 | | 3,364,000 | 3,350,700 |
| Glencore Finance Canada Company 144A | | 6.00 | 11-15-2041 | | 200,000 | 207,602 |
| GM Financial Automobile Leasing Trust Series 2022-2 Class A3 | | 3.42 | 6-20-2025 | | 3,512,000 | 3,509,248 |
| GM Financial Automobile Leasing Trust Series 2022-2 Class A4 | | 3.54 | 5-20-2026 | | 3,844,000 | 3,839,696 |
| GM Financial Securitized Term Series 2022-2 Class A3 | | 3.10 | 2-16-2027 | | 9,921,000 | 9,883,527 |
| GM Financial Securitized Term Series 2022-2 Class A4 | | 3.25 | 4-17-2028 | | 5,291,000 | 5,233,098 |
| Hertz Vehicle Financing LLC Series 2021-2A Class A 144A | | 1.68 | 12-27-2027 | | 6,693,000 | 6,031,544 |
| Hertz Vehicle Financing LLC Series 2022-1A Class A 144A | | 1.99 | 6-25-2026 | | 9,104,000 | 8,608,952 |
| Hertz Vehicle Financing LLC Series 2022-2A Class A 144A | | 2.33 | 6-26-2028 | | 8,078,000 | 7,341,159 |
| Hertz Vehicle Financing LLC Series 2022-4A Class A 144A | | 3.73 | 9-25-2026 | | 1,924,000 | 1,900,543 |
| Hertz Vehicle Financing LLC Series 2022-5A Class A 144A | | 3.89 | 9-25-2028 | | 8,274,000 | 8,090,678 |
| Hyundai Auto Receivables Trust Series 2021-C Class A4 | | 1.03 | 12-15-2027 | | 2,976,000 | 2,759,456 |
| Hyundai Auto Receivables Trust Series 2022-A Class A3 | | 2.22 | 10-15-2026 | | 5,544,000 | 5,418,611 |
The accompanying notes are an integral part of these financial statements.
Allspring Core Bond Portfolio | 33
Portfolio of investments—May 31, 2022
| | | Interest
rate | Maturity
date | Principal | Value |
| Asset-backed securities (continued) | | | | | | |
| Hyundai Auto Receivables Trust Series 2022-A Class A4 | | 2.35% | 4-17-2028 | $ | 1,893,000 | $ 1,822,290 |
| Morgan Stanley Direct Lending Fund 144A | | 4.50 | 2-11-2027 | | 3,011,000 | 2,804,785 |
| Navient Student Loan Trust Series 2014-AA Class A3 (1 Month LIBOR +1.60%) 144A± | | 2.47 | 10-15-2031 | | 2,622,000 | 2,590,736 |
| Navient Student Loan Trust Series 2016-AA Class A2B (1 Month LIBOR +2.15%) 144A± | | 3.02 | 12-15-2045 | | 1,285,589 | 1,304,401 |
| Navient Student Loan Trust Series 2018-CA Class A2 144A | | 3.52 | 6-16-2042 | | 360,884 | 361,645 |
| Navient Student Loan Trust Series 2018-DA Class A2A 144A | | 4.00 | 12-15-2059 | | 3,741,942 | 3,770,974 |
| Navient Student Loan Trust Series 2019-A Class A2A 144A | | 3.42 | 1-15-2043 | | 4,043,706 | 4,027,619 |
| Navient Student Loan Trust Series 2019-BA Class A2A 144A | | 3.39 | 12-15-2059 | | 5,849,824 | 5,716,304 |
| Navient Student Loan Trust Series 2019-CA Class A2 144A | | 3.13 | 2-15-2068 | | 3,318,918 | 3,268,082 |
| Navient Student Loan Trust Series 2019-D Class A2A 144A | | 3.01 | 12-15-2059 | | 7,372,106 | 7,149,502 |
| Navient Student Loan Trust Series 2019-FA Class A2 144A | | 2.60 | 8-15-2068 | | 4,018,503 | 3,909,112 |
| Navient Student Loan Trust Series 2020-BA ClassA2 144A | | 2.12 | 1-15-2069 | | 2,626,112 | 2,555,117 |
| Navient Student Loan Trust Series 2020-GA Class A 144A | | 1.17 | 9-16-2069 | | 3,290,876 | 3,137,592 |
| Navient Student Loan Trust Series 2020-HA Class A 144A | | 1.31 | 1-15-2069 | | 2,361,223 | 2,268,557 |
| Navient Student Loan Trust Series 2020-IA Class A1A 144A | | 1.33 | 4-15-2069 | | 1,870,814 | 1,711,396 |
| Navient Student Loan Trust Series 2021-3A Class A1A 144A | | 1.77 | 8-25-2070 | | 6,341,274 | 5,730,770 |
| Navient Student Loan Trust Series 2021-A Class A 144A | | 0.84 | 5-15-2069 | | 1,062,873 | 983,471 |
| Navient Student Loan Trust Series 2021-BA Class A 144A | | 0.94 | 7-15-2069 | | 1,588,489 | 1,483,431 |
| Navient Student Loan Trust Series 2021-CA Class A 144A | | 1.06 | 10-15-2069 | | 6,471,034 | 6,052,324 |
| Navient Student Loan Trust Series 2021-EA Class A 144A | | 0.97 | 12-16-2069 | | 11,006,662 | 10,072,333 |
| Navient Student Loan Trust Series 2021-FA Class A 144A | | 1.11 | 2-18-2070 | | 5,541,246 | 5,112,970 |
| Navient Student Loan Trust Series 2022-A Class A 144A | | 2.23 | 7-15-2070 | | 3,926,522 | 3,746,382 |
| Nelnet Student Loan Trust Series 2004-4 Class A5 (3 Month LIBOR +0.16%) ± | | 1.34 | 1-25-2037 | | 3,438,986 | 3,341,883 |
| Nelnet Student Loan Trust Series 2004-5 Class A5 (3 Month LIBOR +0.18%) ± | | 1.36 | 10-27-2036 | | 1,731,229 | 1,675,733 |
| Nelnet Student Loan Trust Series 2005-1 Class A5 (3 Month LIBOR +0.11%) ± | | 1.29 | 10-25-2033 | | 14,014,036 | 13,906,599 |
| Nelnet Student Loan Trust Series 2005-2 Class A5 (3 Month LIBOR +0.10%) ± | | 1.03 | 3-23-2037 | | 14,079,563 | 13,623,394 |
| Nelnet Student Loan Trust Series 2005-3 Class A5 (3 Month LIBOR +0.12%) ± | | 1.05 | 12-24-2035 | | 10,543,504 | 10,488,563 |
| Nelnet Student Loan Trust Series 2005-4 Class A4 (3 Month LIBOR +0.18%) ± | | 1.11 | 3-22-2032 | | 2,646,326 | 2,518,463 |
| Santander Drive Auto Receivable Series 2022-2 Class A3 | | 2.98 | 10-15-2026 | | 10,521,000 | 10,452,991 |
| Santander Drive Auto Receivable Series 2022-3 Class A3 | | 3.40 | 12-15-2026 | | 4,051,000 | 4,047,138 |
The accompanying notes are an integral part of these financial statements.
34 | Allspring Core Bond Portfolio
Portfolio of investments—May 31, 2022
| | | Interest
rate | Maturity
date | Principal | Value |
| Asset-backed securities (continued) | | | | | | |
| SLM Student Loan Trust Series 2007-2 Class A4 (3 Month LIBOR +0.06%) ± | | 1.24% | 7-25-2022 | $ | 13,544,631 | $ 13,220,230 |
| SMB Private Education Loan Trust Series 2016-B Class A2A 144A | | 2.43 | 2-17-2032 | | 1,728,237 | 1,684,850 |
| SMB Private Education Loan Trust Series 2016-B Class A2B (1 Month LIBOR +1.45%) 144A± | | 2.32 | 2-17-2032 | | 1,347,229 | 1,344,121 |
| SMB Private Education Loan Trust Series 2016-C Class A2B (1 Month LIBOR +1.10%) 144A± | | 1.97 | 9-15-2034 | | 1,540,248 | 1,539,642 |
| SMB Private Education Loan Trust Series 2018-C Class A2A 144A | | 3.63 | 11-15-2035 | | 2,352,451 | 2,339,373 |
| SMB Private Education Loan Trust Series 2019-A Class A2A 144A | | 3.44 | 7-15-2036 | | 8,751,356 | 8,639,499 |
| SMB Private Education Loan Trust Series 2020-BA Class A1A 144A | | 1.29 | 7-15-2053 | | 5,475,470 | 5,125,292 |
| SMB Private Education Loan Trust Series 2020-PTA Class A2A 144A | | 1.60 | 9-15-2054 | | 5,151,656 | 4,748,703 |
| SMB Private Education Loan Trust Series 2020-PTB Class A2A 144A | | 1.60 | 9-15-2054 | | 15,460,795 | 14,242,509 |
| SMB Private Education Loan Trust Series 2021-A Class APT1 144A | | 1.07 | 1-15-2053 | | 12,539,014 | 11,288,199 |
| SMB Private Education Loan Trust Series 2021-B Class A 144A | | 1.31 | 7-17-2051 | | 3,364,565 | 3,173,691 |
| SMB Private Education Loan Trust Series 2021-C Class A2 (1 Month LIBOR +0.80%) 144A± | | 1.67 | 1-15-2053 | | 6,986,000 | 6,755,831 |
| SMB Private Education Loan Trust Series 2021-D Class A1A 144A | | 1.34 | 3-17-2053 | | 10,424,896 | 9,787,901 |
| SMB Private Education Loan Trust Series 2021-E Class A1A 144A | | 1.68 | 2-15-2051 | | 7,238,860 | 6,807,196 |
| SoFi Professional Loan Program LLC Series 2017-D Class A2 144A | | 2.65 | 9-25-2040 | | 151,540 | 149,577 |
| SoFi Professional Loan Program LLC Series 2017-E Class A2B 144A | | 2.72 | 11-26-2040 | | 394,050 | 393,627 |
| SoFi Professional Loan Program LLC Series 2020-C Class AFX 144A | | 1.95 | 2-15-2046 | | 566,511 | 547,264 |
| SoFi Professional Loan Program LLC Series 2021-A Class AFX 144A | | 1.03 | 8-17-2043 | | 1,944,450 | 1,777,825 |
| SoFi Professional Loan Program LLC Series 2021-B Class AFX 144A | | 1.14 | 2-15-2047 | | 4,409,829 | 4,026,492 |
| Synchrony Card Issuance Trust Series 2022-A1 Class A | | 3.37 | 4-15-2028 | | 6,013,000 | 5,997,057 |
| Toyota Auto Loan Extended Note Series 2022-1A Class A 144A | | 3.82 | 4-25-2035 | | 16,295,000 | 16,319,302 |
| Toyota Auto Receivables Owner Trust Series 2021-D Class A3 | | 0.71 | 4-15-2026 | | 1,635,000 | 1,567,434 |
| Toyota Auto Receivables Owner Trust Series 2022-B Class A4 | | 3.11 | 8-16-2027 | | 3,985,000 | 3,914,503 |
| Triton Container Finance LLC Series 2020-1A Class A 144A | | 2.11 | 9-20-2045 | | 2,158,708 | 1,952,378 |
| Verizon Master Trust Series 2022-2 Class A | | 1.53 | 7-20-2028 | | 3,146,000 | 2,988,026 |
| World Omni Automobile Lease Series 2022-A Class A3 | | 3.21 | 2-18-2025 | | 3,723,000 | 3,738,845 |
| World Omni Automobile Lease Series 2022-A Class A4 | | 3.34 | 6-15-2027 | | 2,190,000 | 2,198,379 |
| Total Asset-backed securities (Cost $447,944,095) | | | | | | 432,248,689 |
The accompanying notes are an integral part of these financial statements.
Allspring Core Bond Portfolio | 35
Portfolio of investments—May 31, 2022
| | | Interest
rate | Maturity
date | Principal | Value |
| Corporate bonds and notes: 22.73% | | | | | | |
| Communication services: 2.22% | | | | | | |
| Diversified telecommunication services: 1.30% | | | | | | |
| AT&T Incorporated | | 1.70% | 3-25-2026 | $ | 8,309,000 | $ 7,737,568 |
| AT&T Incorporated | | 3.50 | 6-1-2041 | | 1,779,000 | 1,500,651 |
| AT&T Incorporated | | 3.55 | 9-15-2055 | | 1,745,000 | 1,397,182 |
| AT&T Incorporated | | 3.65 | 6-1-2051 | | 1,336,000 | 1,111,289 |
| AT&T Incorporated | | 3.65 | 9-15-2059 | | 3,506,000 | 2,806,732 |
| AT&T Incorporated | | 3.80 | 12-1-2057 | | 3,191,000 | 2,631,610 |
| T-Mobile USA Incorporated | | 2.25 | 2-15-2026 | | 133,000 | 124,642 |
| T-Mobile USA Incorporated 144A | | 2.25 | 2-15-2026 | | 14,748,000 | 13,821,236 |
| T-Mobile USA Incorporated | | 2.88 | 2-15-2031 | | 1,132,000 | 993,353 |
| T-Mobile USA Incorporated | | 3.38 | 4-15-2029 | | 6,365,000 | 5,896,377 |
| T-Mobile USA Incorporated 144A | | 3.38 | 4-15-2029 | | 8,331,000 | 7,717,630 |
| T-Mobile USA Incorporated 144A | | 3.50 | 4-15-2031 | | 4,884,000 | 4,458,042 |
| Verizon Communications Incorporated | | 2.36 | 3-15-2032 | | 2,510,000 | 2,161,756 |
| Verizon Communications Incorporated | | 2.55 | 3-21-2031 | | 2,425,000 | 2,146,631 |
| Verizon Communications Incorporated | | 2.65 | 11-20-2040 | | 6,995,000 | 5,397,204 |
| Verizon Communications Incorporated | | 2.88 | 11-20-2050 | | 1,345,000 | 1,007,145 |
| Verizon Communications Incorporated | | 3.70 | 3-22-2061 | | 2,442,000 | 2,028,442 |
| | | | | | | 62,937,490 |
| Entertainment: 0.15% | | | | | | |
| Netflix Incorporated 144A | | 3.63 | 6-15-2025 | | 190,000 | 186,413 |
| Netflix Incorporated 144A | | 5.38 | 11-15-2029 | | 2,323,000 | 2,340,423 |
| Netflix Incorporated | | 5.88 | 11-15-2028 | | 3,191,000 | 3,304,856 |
| The Walt Disney Company | | 2.75 | 9-1-2049 | | 833,000 | 629,878 |
| VICI Properties LP | | 5.63 | 5-15-2052 | | 877,000 | 857,820 |
| | | | | | | 7,319,390 |
| Media: 0.77% | | | | | | |
| Charter Communications Operating LLC | | 3.50 | 6-1-2041 | | 2,204,000 | 1,652,853 |
| Charter Communications Operating LLC | | 3.90 | 6-1-2052 | | 4,595,000 | 3,427,724 |
| Charter Communications Operating LLC | | 4.40 | 12-1-2061 | | 1,438,000 | 1,114,766 |
| Charter Communications Operating LLC | | 3.50 | 3-1-2042 | | 4,119,000 | 3,075,244 |
| Comcast Corporation | | 2.45 | 8-15-2052 | | 833,000 | 588,529 |
| Comcast Corporation | | 2.65 | 8-15-2062 | | 4,150,000 | 2,840,382 |
| Magallanes Incorporated 144A | | 3.64 | 3-15-2025 | | 3,334,000 | 3,291,800 |
| Magallanes Incorporated 144A | | 3.76 | 3-15-2027 | | 5,076,000 | 4,926,767 |
| Magallanes Incorporated 144A | | 4.05 | 3-15-2029 | | 1,667,000 | 1,597,042 |
| Magallanes Incorporated 144A | | 4.28 | 3-15-2032 | | 2,751,000 | 2,571,210 |
| Magallanes Incorporated 144A | | 5.05 | 3-15-2042 | | 3,666,000 | 3,313,593 |
| Magallanes Incorporated 144A | | 5.14 | 3-15-2052 | | 6,061,000 | 5,423,031 |
| Magallanes Incorporated 144A | | 5.39 | 3-15-2062 | | 4,159,000 | 3,726,027 |
| | | | | | | 37,548,968 |
| Consumer discretionary: 1.70% | | | | | | |
| Automobiles: 0.08% | | | | | | |
| Ford Motor Company | | 3.63 | 6-17-2031 | | 3,257,000 | 2,816,002 |
| Ford Motor Company | | 4.75 | 1-15-2043 | | 1,362,000 | 1,123,650 |
| | | | | | | 3,939,652 |
The accompanying notes are an integral part of these financial statements.
36 | Allspring Core Bond Portfolio
Portfolio of investments—May 31, 2022
| | | Interest
rate | Maturity
date | Principal | Value |
| Hotels, restaurants & leisure: 0.36% | | | | | | |
| GLP Capital LP | | 5.30% | 1-15-2029 | $ | 1,685,000 | $ 1,674,924 |
| Marriott International Incorporated | | 2.85 | 4-15-2031 | | 2,220,000 | 1,923,219 |
| Marriott International Incorporated | | 3.50 | 10-15-2032 | | 2,510,000 | 2,254,620 |
| Marriott International Incorporated | | 4.63 | 6-15-2030 | | 6,935,000 | 6,866,871 |
| McDonald's Corporation | | 3.63 | 9-1-2049 | | 1,165,000 | 990,480 |
| McDonald's Corporation | | 4.20 | 4-1-2050 | | 3,993,000 | 3,725,470 |
| | | | | | | 17,435,584 |
| Internet & direct marketing retail: 0.70% | | | | | | |
| Amazon.com Incorporated | | 1.00 | 5-12-2026 | | 11,369,000 | 10,485,482 |
| Amazon.com Incorporated | | 1.65 | 5-12-2028 | | 5,123,000 | 4,624,546 |
| Amazon.com Incorporated | | 2.10 | 5-12-2031 | | 6,379,000 | 5,615,242 |
| Amazon.com Incorporated | | 2.50 | 6-3-2050 | | 3,339,000 | 2,485,827 |
| Amazon.com Incorporated | | 2.70 | 6-3-2060 | | 1,641,000 | 1,185,088 |
| Amazon.com Incorporated | | 2.88 | 5-12-2041 | | 1,167,000 | 972,307 |
| Amazon.com Incorporated | | 3.10 | 5-12-2051 | | 732,000 | 610,633 |
| Amazon.com Incorporated | | 3.45 | 4-13-2029 | | 2,504,000 | 2,488,556 |
| Amazon.com Incorporated | | 3.60 | 4-13-2032 | | 3,266,000 | 3,233,134 |
| Amazon.com Incorporated | | 3.95 | 4-13-2052 | | 2,504,000 | 2,412,517 |
| | | | | | | 34,113,332 |
| Multiline retail: 0.08% | | | | | | |
| Target Corporation | | 2.95 | 1-15-2052 | | 4,585,000 | 3,671,819 |
| Specialty retail: 0.41% | | | | | | |
| AutoNation Incorporated | | 4.75 | 6-1-2030 | | 8,431,000 | 8,227,566 |
| Dick's Sporting Goods Incorporated | | 4.10 | 1-15-2052 | | 1,224,000 | 868,144 |
| Home Depot Incorporated | | 2.38 | 3-15-2051 | | 2,664,000 | 1,905,266 |
| Home Depot Incorporated | | 3.13 | 12-15-2049 | | 3,234,000 | 2,620,780 |
| Home Depot Incorporated | | 3.25 | 4-15-2032 | | 4,173,000 | 3,994,142 |
| Home Depot Incorporated | | 3.30 | 4-15-2040 | | 689,000 | 608,487 |
| Home Depot Incorporated | | 3.63 | 4-15-2052 | | 1,656,000 | 1,471,086 |
| | | | | | | 19,695,471 |
| Textiles, apparel & luxury goods: 0.07% | | | | | | |
| Tapestry Incorporated | | 3.05 | 3-15-2032 | | 4,273,000 | 3,619,790 |
| Consumer staples: 0.44% | | | | | | |
| Beverages: 0.42% | | | | | | |
| Anheuser-Busch InBev Worldwide Incorporated | | 3.75 | 7-15-2042 | | 1,523,000 | 1,305,887 |
| Anheuser-Busch InBev Worldwide Incorporated | | 4.38 | 4-15-2038 | | 4,953,000 | 4,748,403 |
| Anheuser-Busch InBev Worldwide Incorporated | | 4.70 | 2-1-2036 | | 4,714,000 | 4,771,474 |
| Anheuser-Busch InBev Worldwide Incorporated | | 4.90 | 2-1-2046 | | 8,916,000 | 8,890,984 |
| Keurig Dr. Pepper Incorporated | | 4.05 | 4-15-2032 | | 840,000 | 805,606 |
| | | | | | | 20,522,354 |
| Tobacco: 0.02% | | | | | | |
| Altria Group Incorporated | | 2.35 | 5-6-2025 | | 358,000 | 343,566 |
| BAT Capital Corporation | | 4.39 | 8-15-2037 | | 885,000 | 755,794 |
| | | | | | | 1,099,360 |
The accompanying notes are an integral part of these financial statements.
Allspring Core Bond Portfolio | 37
Portfolio of investments—May 31, 2022
| | | Interest
rate | Maturity
date | Principal | Value |
| Energy: 0.63% | | | | | | |
| Oil, gas & consumable fuels: 0.63% | | | | | | |
| BP Capital Markets America Incorporated | | 2.94% | 6-4-2051 | $ | 1,658,000 | $ 1,254,164 |
| Diamondback Energy Incorporated | | 4.40 | 3-24-2051 | | 3,365,000 | 3,038,607 |
| Enable Midstream Partners | | 4.40 | 3-15-2027 | | 826,000 | 820,443 |
| Enable Midstream Partners | | 4.95 | 5-15-2028 | | 6,140,000 | 6,168,545 |
| Energy Transfer Operating Partners LP | | 5.30 | 4-15-2047 | | 3,032,000 | 2,772,449 |
| Energy Transfer Operating Partners LP | | 6.10 | 2-15-2042 | | 868,000 | 852,565 |
| Energy Transfer Operating Partners LP | | 6.13 | 12-15-2045 | | 1,489,000 | 1,488,615 |
| Exxon Mobil Corporation | | 3.45 | 4-15-2051 | | 4,675,000 | 4,046,119 |
| Kinder Morgan Incorporated | | 3.25 | 8-1-2050 | | 2,412,000 | 1,776,435 |
| Kinder Morgan Incorporated | | 3.60 | 2-15-2051 | | 1,999,000 | 1,554,876 |
| MPLX LP | | 4.95 | 3-14-2052 | | 2,662,000 | 2,451,848 |
| Pioneer Natural Resource | | 1.90 | 8-15-2030 | | 2,827,000 | 2,372,322 |
| Pioneer Natural Resource | | 2.15 | 1-15-2031 | | 2,522,000 | 2,150,623 |
| | | | | | | 30,747,611 |
| Financials: 8.60% | | | | | | |
| Banks: 4.17% | | | | | | |
| Bank of America Corporation (U.S. SOFR +1.15%) ± | | 1.32 | 6-19-2026 | | 2,230,000 | 2,057,619 |
| Bank of America Corporation (U.S. SOFR +0.65%) ± | | 1.53 | 12-6-2025 | | 11,854,000 | 11,207,347 |
| Bank of America Corporation (U.S. SOFR +0.91%) ± | | 1.66 | 3-11-2027 | | 13,251,000 | 12,132,126 |
| Bank of America Corporation (U.S. SOFR +0.96%) ± | | 1.73 | 7-22-2027 | | 10,050,000 | 9,150,507 |
| Bank of America Corporation (U.S. SOFR +1.37%) ± | | 1.92 | 10-24-2031 | | 2,791,000 | 2,304,268 |
| Bank of America Corporation (3 Month LIBOR +0.99%) ± | | 2.50 | 2-13-2031 | | 4,689,000 | 4,131,273 |
| Bank of America Corporation (U.S. SOFR +2.15%) ± | | 2.59 | 4-29-2031 | | 1,276,000 | 1,120,753 |
| Bank of America Corporation (U.S. SOFR +1.32%) ± | | 2.69 | 4-22-2032 | | 12,773,000 | 11,131,691 |
| Bank of America Corporation (U.S. SOFR +1.33%) ± | | 2.97 | 2-4-2033 | | 2,674,000 | 2,372,939 |
| Bank of America Corporation (3 Month LIBOR +0.79%) ± | | 3.00 | 12-20-2023 | | 6,629,000 | 6,627,300 |
| Bank of America Corporation (U.S. SOFR +1.33%) ± | | 3.38 | 4-2-2026 | | 18,374,000 | 18,102,947 |
| Bank of America Corporation (3 Month LIBOR +1.04%) ± | | 3.42 | 12-20-2028 | | 9,245,000 | 8,836,087 |
| Bank of America Corporation | | 3.50 | 4-19-2026 | | 851,000 | 844,619 |
| Citigroup Incorporated (U.S. SOFR +0.69%) ± | | 2.01 | 1-25-2026 | | 3,364,000 | 3,201,481 |
| Citigroup Incorporated (U.S. SOFR +1.53%) ± | | 3.29 | 3-17-2026 | | 839,000 | 823,146 |
| Citigroup Incorporated (U.S. SOFR +1.89%) ± | | 4.66 | 5-24-2028 | | 5,903,000 | 6,019,829 |
| Citigroup Incorporated (U.S. SOFR +2.09%) ± | | 4.91 | 5-24-2033 | | 5,903,000 | 6,061,930 |
| JPMorgan Chase & Company (U.S. SOFR 3 Month +0.70%) ± | | 1.04 | 2-4-2027 | | 16,696,000 | 15,020,338 |
| JPMorgan Chase & Company (U.S. SOFR +0.80%) ± | | 1.05 | 11-19-2026 | | 9,310,000 | 8,445,184 |
| JPMorgan Chase & Company (U.S. SOFR +0.77%) ± | | 1.47 | 9-22-2027 | | 4,150,000 | 3,737,861 |
| JPMorgan Chase & Company (U.S. SOFR +0.61%) ± | | 1.56 | 12-10-2025 | | 26,100,000 | 24,762,887 |
| JPMorgan Chase & Company (U.S. SOFR +1.85%) ± | | 2.08 | 4-22-2026 | | 7,301,000 | 6,941,678 |
| JPMorgan Chase & Company (U.S. SOFR +1.89%) ± | | 2.18 | 6-1-2028 | | 5,114,000 | 4,654,322 |
| JPMorgan Chase & Company (U.S. SOFR +1.16%) ± | | 2.30 | 10-15-2025 | | 1,048,000 | 1,013,778 |
| JPMorgan Chase & Company (U.S. SOFR +1.56%) ± | | 4.32 | 4-26-2028 | | 8,397,000 | 8,471,817 |
| Wells Fargo & Company (U.S. SOFR +1.51%) ± | | 3.53 | 3-24-2028 | | 17,418,000 | 16,933,707 |
| Wells Fargo & Company (U.S. SOFR +1.32%) ± | | 3.91 | 4-25-2026 | | 6,634,000 | 6,631,502 |
| | | | | | | 202,738,936 |
| Capital markets: 3.69% | | | | | | |
| Antares Holdings LP 144A | | 3.75 | 7-15-2027 | | 4,239,000 | 3,790,286 |
The accompanying notes are an integral part of these financial statements.
38 | Allspring Core Bond Portfolio
Portfolio of investments—May 31, 2022
| | | Interest
rate | Maturity
date | Principal | Value |
| Capital markets (continued) | | | | | | |
| Ares Capital Corporation | | 3.20% | 11-15-2031 | $ | 2,946,000 | $ 2,292,949 |
| Athene Global Funding 144A | | 1.73 | 10-2-2026 | | 7,538,000 | 6,672,200 |
| Athene Global Funding 144A | | 1.99 | 8-19-2028 | | 4,170,000 | 3,529,858 |
| Athene Global Funding 144A | | 2.50 | 3-24-2028 | | 5,838,000 | 5,194,192 |
| Athene Global Funding 144A | | 2.51 | 3-8-2024 | | 6,821,000 | 6,665,259 |
| Athene Global Funding 144A | | 2.65 | 10-4-2031 | | 5,506,000 | 4,606,521 |
| Athene Global Funding 144A | | 3.21 | 3-8-2027 | | 8,318,000 | 7,789,516 |
| Bain Capital Specialty Finance | | 2.55 | 10-13-2026 | | 2,740,000 | 2,424,910 |
| Berkshire Hathaway Finance Company | | 3.85 | 3-15-2052 | | 2,500,000 | 2,279,608 |
| Blackstone Private Equity Funds 144A | | 2.35 | 11-22-2024 | | 3,100,000 | 2,907,045 |
| Blackstone Private Equity Funds 144A | | 2.63 | 12-15-2026 | | 2,368,000 | 2,056,539 |
| Blackstone Private Equity Funds 144A | | 3.25 | 3-15-2027 | | 3,429,000 | 3,032,115 |
| Blackstone Private Equity Funds 144A | | 4.00 | 1-15-2029 | | 5,308,000 | 4,688,879 |
| F&G Global Funding 144A | | 2.00 | 9-20-2028 | | 4,176,000 | 3,612,459 |
| FS KKR Capital Corporation | | 3.25 | 7-15-2027 | | 358,000 | 322,446 |
| GA Global Funding Trust 144A | | 0.80 | 9-13-2024 | | 5,923,000 | 5,512,242 |
| Goldman Sachs Group Incorporated (U.S. SOFR +0.51%) ± | | 0.66 | 9-10-2024 | | 8,357,000 | 8,064,600 |
| Goldman Sachs Group Incorporated (U.S. SOFR +0.49%) ± | | 0.93 | 10-21-2024 | | 16,722,000 | 16,149,794 |
| Goldman Sachs Group Incorporated (U.S. SOFR +0.73%) ± | | 1.76 | 1-24-2025 | | 9,074,000 | 8,824,205 |
| Goldman Sachs Group Incorporated (U.S. SOFR +0.91%) ± | | 1.95 | 10-21-2027 | | 4,136,000 | 3,770,597 |
| Goldman Sachs Group Incorporated | | 2.60 | 2-7-2030 | | 2,163,000 | 1,907,533 |
| Goldman Sachs Group Incorporated (U.S. SOFR +1.26%) ± | | 2.65 | 10-21-2032 | | 2,885,000 | 2,473,008 |
| Goldman Sachs Group Incorporated (U.S. SOFR +1.41%) ± | | 3.10 | 2-24-2033 | | 2,257,000 | 2,005,556 |
| KKR Group Finance Company XII 144A | | 4.85 | 5-17-2032 | | 6,227,000 | 6,295,621 |
| Morgan Stanley (U.S. SOFR +0.51%) ± | | 0.79 | 1-22-2025 | | 12,375,000 | 11,838,224 |
| Morgan Stanley (U.S. SOFR +0.53%) ± | | 0.79 | 5-30-2025 | | 10,781,000 | 10,174,882 |
| Morgan Stanley (U.S. SOFR +0.75%) ± | | 0.86 | 10-21-2025 | | 3,319,000 | 3,107,588 |
| Morgan Stanley (U.S. SOFR +0.72%) ± | | 0.99 | 12-10-2026 | | 8,493,000 | 7,644,955 |
| Morgan Stanley (U.S. SOFR +1.18%) ± | | 2.24 | 7-21-2032 | | 4,953,000 | 4,181,277 |
| Morgan Stanley (U.S. SOFR +1.00%) ± | | 2.48 | 1-21-2028 | | 1,658,000 | 1,544,082 |
| Morgan Stanley (U.S. SOFR +1.61%) ± | | 4.21 | 4-20-2028 | | 2,470,000 | 2,474,104 |
| Morgan Stanley (U.S. SOFR +0.56%) ± | | 1.16 | 10-21-2025 | | 4,289,000 | 4,036,574 |
| Morgan Stanley (U.S. SOFR +0.86%) ± | | 1.51 | 7-20-2027 | | 6,493,000 | 5,870,252 |
| Owl Rock Capital Corporation 144A | | 3.13 | 4-13-2027 | | 5,307,000 | 4,652,117 |
| Owl Rock Capital Corporation | | 3.40 | 7-15-2026 | | 4,757,000 | 4,385,321 |
| Owl Rock Capital Corporation 144A | | 4.70 | 2-8-2027 | | 2,521,000 | 2,367,200 |
| | | | | | | 179,144,514 |
| Consumer finance: 0.57% | | | | | | |
| Bunge Limited Finance Corporation | | 1.63 | 8-17-2025 | | 2,902,000 | 2,706,638 |
| Ford Motor Credit Company LLC | | 2.70 | 8-10-2026 | | 5,970,000 | 5,393,053 |
| Ford Motor Credit Company LLC | | 2.90 | 2-10-2029 | | 4,291,000 | 3,669,792 |
| Ford Motor Credit Company LLC | | 5.11 | 5-3-2029 | | 509,000 | 496,082 |
| General Motors Financial Company Incorporated | | 3.10 | 1-12-2032 | | 1,799,000 | 1,520,975 |
| Hyundai Capital America Company 144A | | 0.80 | 1-8-2024 | | 3,211,000 | 3,070,595 |
| Hyundai Capital America Company 144A | | 1.30 | 1-8-2026 | | 3,512,000 | 3,163,088 |
| Hyundai Capital America Company 144A | | 2.00 | 6-15-2028 | | 1,659,000 | 1,425,743 |
The accompanying notes are an integral part of these financial statements.
Allspring Core Bond Portfolio | 39
Portfolio of investments—May 31, 2022
| | | Interest
rate | Maturity
date | Principal | Value |
| Consumer finance (continued) | | | | | | |
| John Deere Capital Corporation | | 2.13% | 3-7-2025 | $ | 2,500,000 | $ 2,441,380 |
| John Deere Capital Corporation | | 2.35 | 3-8-2027 | | 4,159,000 | 3,959,391 |
| | | | | | | 27,846,737 |
| Insurance: 0.17% | | | | | | |
| Brighthouse Financial Incorporated | | 3.85 | 12-22-2051 | | 1,651,000 | 1,197,424 |
| SBL Holdings Incorporated 144A | | 5.00 | 2-18-2031 | | 5,778,000 | 5,077,140 |
| Stewart Information Services Corporation | | 3.60 | 11-15-2031 | | 2,247,000 | 1,919,021 |
| | | | | | | 8,193,585 |
| Health care: 2.03% | | | | | | |
| Biotechnology: 0.56% | | | | | | |
| AbbVie Incorporated | | 2.30 | 11-21-2022 | | 5,199,000 | 5,196,111 |
| AbbVie Incorporated | | 3.20 | 11-21-2029 | | 4,961,000 | 4,663,526 |
| AbbVie Incorporated | | 4.05 | 11-21-2039 | | 1,973,000 | 1,835,940 |
| AbbVie Incorporated | | 4.25 | 11-21-2049 | | 6,609,000 | 6,186,549 |
| AbbVie Incorporated | | 4.30 | 5-14-2036 | | 1,208,000 | 1,182,225 |
| AbbVie Incorporated | | 4.45 | 5-14-2046 | | 1,225,000 | 1,168,855 |
| Amgen Incorporated | | 3.00 | 1-15-2052 | | 1,847,000 | 1,373,941 |
| Gilead Sciences Incorporated | | 2.60 | 10-1-2040 | | 2,885,000 | 2,204,313 |
| Gilead Sciences Incorporated | | 2.80 | 10-1-2050 | | 2,687,000 | 1,962,851 |
| Gilead Sciences Incorporated | | 4.00 | 9-1-2036 | | 1,489,000 | 1,446,482 |
| | | | | | | 27,220,793 |
| Health care providers & services: 0.94% | | | | | | |
| Centene Corporation | | 2.45 | 7-15-2028 | | 8,695,000 | 7,809,979 |
| Centene Corporation | | 3.00 | 10-15-2030 | | 1,822,000 | 1,620,742 |
| Cigna Corporation | | 3.40 | 3-15-2050 | | 842,000 | 670,958 |
| CVS Health Corporation | | 3.00 | 8-15-2026 | | 1,796,000 | 1,753,202 |
| CVS Health Corporation | | 4.30 | 3-25-2028 | | 3,793,000 | 3,840,266 |
| CVS Health Corporation | | 5.05 | 3-25-2048 | | 1,345,000 | 1,370,010 |
| GSK Consumer Healthcare Company 144A | | 3.38 | 3-24-2027 | | 3,908,000 | 3,827,223 |
| GSK Consumer Healthcare Company 144A | | 3.38 | 3-24-2029 | | 3,422,000 | 3,266,707 |
| GSK Consumer Healthcare Company 144A | | 3.63 | 3-24-2032 | | 5,903,000 | 5,648,383 |
| GSK Consumer Healthcare Company 144A | | 4.00 | 3-24-2052 | | 2,672,000 | 2,416,081 |
| HCA Incorporated | | 3.50 | 9-1-2030 | | 899,000 | 819,774 |
| HCA Incorporated | | 3.50 | 7-15-2051 | | 842,000 | 629,048 |
| UnitedHealth Group Incorporated | | 2.75 | 5-15-2040 | | 1,276,000 | 1,040,910 |
| UnitedHealth Group Incorporated | | 2.90 | 5-15-2050 | | 2,961,000 | 2,306,237 |
| UnitedHealth Group Incorporated | | 3.05 | 5-15-2041 | | 868,000 | 725,517 |
| UnitedHealth Group Incorporated | | 3.25 | 5-15-2051 | | 2,800,000 | 2,335,312 |
| UnitedHealth Group Incorporated | | 4.00 | 5-15-2029 | | 2,563,000 | 2,602,891 |
| UnitedHealth Group Incorporated | | 4.20 | 5-15-2032 | | 1,705,000 | 1,745,849 |
| UnitedHealth Group Incorporated | | 4.63 | 7-15-2035 | | 1,156,000 | 1,209,623 |
| UnitedHealth Group Incorporated | | 4.75 | 5-15-2052 | | 171,000 | 180,554 |
| | | | | | | 45,819,266 |
| Life sciences tools & services: 0.18% | | | | | | |
| Danaher Corporation | | 2.60 | 10-1-2050 | | 1,983,000 | 1,434,150 |
| Danaher Corporation | | 2.80 | 12-10-2051 | | 1,328,000 | 998,723 |
| Thermo Fisher Scientific Incorporated | | 1.75 | 10-15-2028 | | 1,678,000 | 1,487,655 |
The accompanying notes are an integral part of these financial statements.
40 | Allspring Core Bond Portfolio
Portfolio of investments—May 31, 2022
| | | Interest
rate | Maturity
date | Principal | Value |
| Life sciences tools & services (continued) | | | | | | |
| Thermo Fisher Scientific Incorporated | | 2.00% | 10-15-2031 | $ | 2,817,000 | $ 2,400,375 |
| Thermo Fisher Scientific Incorporated | | 2.80 | 10-15-2041 | | 2,670,000 | 2,146,000 |
| | | | | | | 8,466,903 |
| Pharmaceuticals: 0.35% | | | | | | |
| Astrazeneca Finance LLC | | 1.75 | 5-28-2028 | | 5,880,000 | 5,313,179 |
| Pfizer Incorporated | | 2.55 | 5-28-2040 | | 5,795,000 | 4,727,908 |
| Roche Holdings Incorporated 144A | | 2.08 | 12-13-2031 | | 6,059,000 | 5,295,000 |
| Roche Holdings Incorporated 144A | | 2.61 | 12-13-2051 | | 2,354,000 | 1,785,070 |
| | | | | | | 17,121,157 |
| Industrials: 0.89% | | | | | | |
| Aerospace & defense: 0.21% | | | | | | |
| The Boeing Company | | 2.20 | 2-4-2026 | | 6,314,000 | 5,782,335 |
| The Boeing Company | | 3.25 | 2-1-2035 | | 2,042,000 | 1,619,152 |
| The Boeing Company | | 3.75 | 2-1-2050 | | 3,651,000 | 2,700,957 |
| | | | | | | 10,102,444 |
| Airlines: 0.34% | | | | | | |
| Delta Air Lines Incorporated 144A | | 4.50 | 10-20-2025 | | 6,765,000 | 6,748,795 |
| Delta Air Lines Incorporated 144A | | 4.75 | 10-20-2028 | | 9,820,000 | 9,806,758 |
| | | | | | | 16,555,553 |
| Construction & engineering: 0.06% | | | | | | |
| Quanta Services Incorporated | | 0.95 | 10-1-2024 | | 3,319,000 | 3,125,836 |
| Road & rail: 0.23% | | | | | | |
| Union Pacific Corporation | | 2.40 | 2-5-2030 | | 3,268,000 | 2,948,380 |
| Union Pacific Corporation | | 2.80 | 2-14-2032 | | 4,159,000 | 3,794,513 |
| Union Pacific Corporation | | 3.38 | 2-14-2042 | | 1,999,000 | 1,736,614 |
| Union Pacific Corporation | | 3.50 | 2-14-2053 | | 2,824,000 | 2,440,508 |
| | | | | | | 10,920,015 |
| Transportation infrastructure: 0.05% | | | | | | |
| Crowley Conro LLC | | 4.18 | 8-15-2043 | | 2,493,096 | 2,587,543 |
| Information technology: 2.25% | | | | | | |
| Electronic equipment, instruments & components: 0.19% | | | | | | |
| Dell International LLC 144A | | 3.38 | 12-15-2041 | | 4,136,000 | 3,099,668 |
| Dell International LLC 144A | | 3.45 | 12-15-2051 | | 4,961,000 | 3,595,980 |
| Dell International LLC | | 4.90 | 10-1-2026 | | 851,000 | 868,451 |
| Dell International LLC | | 6.10 | 7-15-2027 | | 1,693,000 | 1,806,680 |
| | | | | | | 9,370,779 |
| IT services: 0.14% | | | | | | |
| Global Payments Incorporated | | 1.50 | 11-15-2024 | | 2,476,000 | 2,350,218 |
| Global Payments Incorporated | | 2.15 | 1-15-2027 | | 4,953,000 | 4,501,216 |
| | | | | | | 6,851,434 |
| Semiconductors & semiconductor equipment: 0.78% | | | | | | |
| Broadcom Incorporated 144A | | 2.45 | 2-15-2031 | | 2,910,000 | 2,412,007 |
| Broadcom Incorporated | | 3.15 | 11-15-2025 | | 2,179,000 | 2,115,487 |
The accompanying notes are an integral part of these financial statements.
Allspring Core Bond Portfolio | 41
Portfolio of investments—May 31, 2022
| | | Interest
rate | Maturity
date | Principal | Value |
| Semiconductors & semiconductor equipment (continued) | | | | | | |
| Broadcom Incorporated 144A | | 3.42% | 4-15-2033 | $ | 7,923,000 | $ 6,821,129 |
| Broadcom Incorporated 144A | | 3.47 | 4-15-2034 | | 3,719,000 | 3,167,967 |
| Broadcom Incorporated 144A | | 4.00 | 4-15-2029 | | 3,338,000 | 3,184,003 |
| Broadcom Incorporated | | 4.15 | 11-15-2030 | | 1,963,000 | 1,862,850 |
| Broadcom Incorporated 144A | | 4.93 | 5-15-2037 | | 2,660,000 | 2,514,952 |
| Broadcom Incorporated 144A | | 4.15 | 4-15-2032 | | 2,504,000 | 2,345,114 |
| Intel Corporation | | 2.45 | 11-15-2029 | | 1,667,000 | 1,525,363 |
| Intel Corporation | | 2.80 | 8-12-2041 | | 4,349,000 | 3,464,498 |
| Intel Corporation | | 3.05 | 8-12-2051 | | 665,000 | 525,311 |
| Intel Corporation | | 3.20 | 8-12-2061 | | 1,353,000 | 1,040,625 |
| KLA Corporation | | 3.30 | 3-1-2050 | | 3,972,000 | 3,276,759 |
| Qualcomm Incorporated | | 4.25 | 5-20-2032 | | 2,547,000 | 2,634,390 |
| Qualcomm Incorporated | | 4.50 | 5-20-2052 | | 852,000 | 862,899 |
| | | | | | | 37,753,354 |
| Software: 0.47% | | | | | | |
| VMware Incorporated | | 0.60 | 8-15-2023 | | 8,139,000 | 7,894,804 |
| VMware Incorporated | | 1.00 | 8-15-2024 | | 5,787,000 | 5,471,362 |
| VMware Incorporated | | 1.40 | 8-15-2026 | | 5,796,000 | 5,195,621 |
| VMware Incorporated | | 1.80 | 8-15-2028 | | 1,005,000 | 855,020 |
| VMware Incorporated | | 4.70 | 5-15-2030 | | 3,344,000 | 3,313,351 |
| | | | | | | 22,730,158 |
| Technology hardware, storage & peripherals: 0.67% | | | | | | |
| Apple Incorporated | | 1.25 | 8-20-2030 | | 1,678,000 | 1,407,758 |
| Apple Incorporated | | 1.40 | 8-5-2028 | | 6,663,000 | 5,935,475 |
| Apple Incorporated | | 2.38 | 2-8-2041 | | 1,353,000 | 1,070,273 |
| Apple Incorporated | | 2.55 | 8-20-2060 | | 1,412,000 | 1,019,119 |
| Apple Incorporated | | 2.65 | 5-11-2050 | | 4,110,000 | 3,203,292 |
| Apple Incorporated | | 2.65 | 2-8-2051 | | 2,858,000 | 2,210,581 |
| Apple Incorporated | | 2.70 | 8-5-2051 | | 1,658,000 | 1,297,214 |
| Extra Space Storage LP | | 3.90 | 4-1-2029 | | 1,667,000 | 1,599,685 |
| HP Incorporated | | 4.00 | 4-15-2029 | | 5,834,000 | 5,580,484 |
| HP Incorporated | | 4.20 | 4-15-2032 | | 5,835,000 | 5,437,917 |
| HP Incorporated | | 2.20 | 6-17-2025 | | 3,887,000 | 3,711,314 |
| | | | | | | 32,473,112 |
| Materials: 0.23% | | | | | | |
| Chemicals: 0.20% | | | | | | |
| Dow Chemical Corporation | | 3.60 | 11-15-2050 | | 1,695,000 | 1,388,971 |
| Dow Chemical Corporation | | 7.38 | 11-1-2029 | | 1,952,000 | 2,319,021 |
| Rohm & Haas Company | | 7.85 | 7-15-2029 | | 2,046,000 | 2,473,532 |
| Westlake Chemical Corporation | | 3.13 | 8-15-2051 | | 818,000 | 602,791 |
| Westlake Chemical Corporation | | 3.38 | 8-15-2061 | | 1,566,000 | 1,125,015 |
| Westlake Chemical Corporation | | 3.60 | 8-15-2026 | | 1,821,000 | 1,804,419 |
| | | | | | | 9,713,749 |
| Metals & mining: 0.03% | | | | | | |
| Freeport-McMoRan Incorporated | | 5.25 | 9-1-2029 | | 1,334,000 | 1,332,902 |
| Real estate: 1.64% | | | | | | |
| Equity REITs: 1.22% | | | | | | |
| Agree LP | | 2.00 | 6-15-2028 | | 3,634,000 | 3,205,292 |
The accompanying notes are an integral part of these financial statements.
42 | Allspring Core Bond Portfolio
Portfolio of investments—May 31, 2022
| | | Interest
rate | Maturity
date | Principal | Value |
| Equity REITs (continued) | | | | | | |
| Agree LP | | 2.60% | 6-15-2033 | $ | 825,000 | $ 680,244 |
| American Tower Corporation | | 2.70 | 4-15-2031 | | 1,330,000 | 1,128,324 |
| American Tower Corporation | | 3.65 | 3-15-2027 | | 4,168,000 | 4,053,393 |
| Brixmor Operating Partnership | | 2.25 | 4-1-2028 | | 1,166,000 | 1,027,743 |
| Brixmor Operating Partnership | | 2.50 | 8-16-2031 | | 2,017,000 | 1,658,161 |
| Crown Castle International Corporation | | 1.05 | 7-15-2026 | | 4,995,000 | 4,444,806 |
| Crown Castle International Corporation | | 2.10 | 4-1-2031 | | 3,436,000 | 2,823,506 |
| Crown Castle International Corporation | | 2.90 | 3-15-2027 | | 5,451,000 | 5,140,125 |
| Crown Castle International Corporation | | 2.90 | 4-1-2041 | | 843,000 | 635,529 |
| Crown Castle International Corporation | | 3.30 | 7-1-2030 | | 2,878,000 | 2,623,272 |
| Crown Castle International Corporation | | 4.00 | 3-1-2027 | | 834,000 | 828,807 |
| Federal Realty Investment Trust | | 3.95 | 1-15-2024 | | 2,306,000 | 2,324,188 |
| Mid-America Apartments LP | | 3.95 | 3-15-2029 | | 1,676,000 | 1,638,789 |
| Mid-America Apartments LP | | 4.00 | 11-15-2025 | | 2,042,000 | 2,056,149 |
| Mid-America Apartments LP | | 4.30 | 10-15-2023 | | 1,710,000 | 1,733,877 |
| Realty Income Corporation | | 2.20 | 6-15-2028 | | 1,787,000 | 1,606,852 |
| Realty Income Corporation | | 2.85 | 12-15-2032 | | 2,417,000 | 2,157,315 |
| Realty Income Corporation | | 3.40 | 1-15-2028 | | 1,770,000 | 1,711,304 |
| Regency Centers LP | | 2.95 | 9-15-2029 | | 3,625,000 | 3,257,374 |
| Rexford Industrial Realty Trust Company | | 2.15 | 9-1-2031 | | 1,847,000 | 1,515,652 |
| Spirit Realty LP | | 3.40 | 1-15-2030 | | 1,181,000 | 1,063,944 |
| Store Capital Corporation | | 2.70 | 12-1-2031 | | 1,157,000 | 958,616 |
| Store Capital Corporation | | 2.75 | 11-18-2030 | | 2,953,000 | 2,511,064 |
| Store Capital Corporation | | 4.50 | 3-15-2028 | | 6,297,000 | 6,302,298 |
| Store Capital Corporation | | 4.63 | 3-15-2029 | | 2,127,000 | 2,114,872 |
| | | | | | | 59,201,496 |
| Real estate management & development: 0.42% | | | | | | |
| American Campus Communities Company | | 2.25 | 1-15-2029 | | 2,197,000 | 2,059,772 |
| American Homes 4 Rent | | 3.63 | 4-15-2032 | | 3,335,000 | 3,042,476 |
| American Homes 4 Rent | | 4.30 | 4-15-2052 | | 1,499,000 | 1,280,379 |
| Essex Portfolio LP | | 1.70 | 3-1-2028 | | 4,366,000 | 3,828,203 |
| Essex Portfolio LP | | 2.55 | 6-15-2031 | | 1,719,000 | 1,478,177 |
| Extra Space Storage LP | | 2.35 | 3-15-2032 | | 1,498,000 | 1,230,341 |
| Inviation Homes Operation | | 4.15 | 4-15-2032 | | 3,339,000 | 3,186,287 |
| Sun Communities Operating LP | | 2.30 | 11-1-2028 | | 1,668,000 | 1,461,612 |
| Sun Communities Operating LP | | 4.20 | 4-15-2032 | | 3,338,000 | 3,141,622 |
| | | | | | | 20,708,869 |
| Utilities: 2.10% | | | | | | |
| Electric utilities: 1.65% | | | | | | |
| American Transmission System Incorporated 144A | | 2.65 | 1-15-2032 | | 1,157,000 | 1,007,244 |
| Duke Energy Carolinas LLC | | 2.55 | 4-15-2031 | | 1,685,000 | 1,503,414 |
| Duke Energy Carolinas LLC | | 3.55 | 3-15-2052 | | 2,577,000 | 2,240,138 |
| Duke Energy Corporation | | 3.75 | 9-1-2046 | | 511,000 | 423,105 |
| Duke Energy Florida LLC | | 2.40 | 12-15-2031 | | 2,476,000 | 2,158,657 |
| Duke Energy Progress LLC | | 2.50 | 8-15-2050 | | 2,502,000 | 1,803,742 |
| Duke Energy Progress LLC | | 2.55 | 6-15-2031 | | 1,993,000 | 1,706,388 |
| Duke Energy Progress LLC | | 3.50 | 6-15-2051 | | 502,000 | 393,302 |
| Entergy Arkansas LLC | | 2.65 | 6-15-2051 | | 2,230,000 | 1,622,341 |
| Eversource Energy | | 1.40 | 8-15-2026 | | 1,404,000 | 1,278,596 |
| Eversource Energy | | 3.38 | 3-1-2032 | | 3,349,000 | 3,088,807 |
| Exelon Corporation 144A | | 4.10 | 3-15-2052 | | 1,165,000 | 1,038,419 |
| FirstEnergy Corporation 144A | | 2.75 | 3-1-2032 | | 2,723,000 | 2,375,051 |
The accompanying notes are an integral part of these financial statements.
Allspring Core Bond Portfolio | 43
Portfolio of investments—May 31, 2022
| | | Interest
rate | Maturity
date | Principal | Value |
| Electric utilities (continued) | | | | | | |
| Florida Power & Light Company | | 2.45% | 2-3-2032 | $ | 5,970,000 | $ 5,329,326 |
| ITC Holdings Corporation | | 2.70 | 11-15-2022 | | 3,370,000 | 3,372,414 |
| Metropolitan Edison Company 144A | | 4.30 | 1-15-2029 | | 2,917,000 | 2,922,326 |
| Mid-American Energy Company | | 2.70 | 8-1-2052 | | 2,153,000 | 1,610,668 |
| Mississippi Power Company | | 3.10 | 7-30-2051 | | 2,978,000 | 2,212,283 |
| Mississippi Power Company | | 3.95 | 3-30-2028 | | 2,970,000 | 2,944,406 |
| Mississippi Power Company | | 4.25 | 3-15-2042 | | 1,140,000 | 1,026,455 |
| Northern States Power Company | | 3.20 | 4-1-2052 | | 1,676,000 | 1,382,208 |
| NSTAR Electric Company | | 3.10 | 6-1-2051 | | 1,532,000 | 1,214,082 |
| NSTAR Electric Company | | 4.55 | 6-1-2052 | | 2,019,000 | 2,044,596 |
| Pacific Gas & Electric Company | | 2.10 | 8-1-2027 | | 1,327,000 | 1,153,913 |
| Pacific Gas & Electric Company | | 3.95 | 12-1-2047 | | 3,781,000 | 2,746,621 |
| Pacific Gas & Electric Company | | 4.20 | 6-1-2041 | | 1,438,000 | 1,111,637 |
| Pacific Gas & Electric Company | | 4.50 | 7-1-2040 | | 851,000 | 693,111 |
| Pacific Gas & Electric Company | | 4.75 | 2-15-2044 | | 834,000 | 676,022 |
| Pacific Gas & Electric Company | | 4.95 | 7-1-2050 | | 3,353,000 | 2,797,516 |
| PacifiCorp 1st Mortgage | | 3.30 | 3-15-2051 | | 1,295,000 | 1,061,731 |
| Pennsylvania Electric Company 144A | | 3.25 | 3-15-2028 | | 2,417,000 | 2,276,305 |
| Public Service Company of Oklahoma | | 2.20 | 8-15-2031 | | 2,519,000 | 2,155,034 |
| Public Service Company of Oklahoma | | 3.15 | 8-15-2051 | | 1,676,000 | 1,290,359 |
| Public Service Electric and Gas Company | | 1.90 | 8-15-2031 | | 3,327,000 | 2,815,771 |
| Public Service Electric and Gas Company | | 2.05 | 8-1-2050 | | 689,000 | 448,696 |
| Public Service Electric and Gas Company | | 2.70 | 5-1-2050 | | 1,353,000 | 1,014,467 |
| Southern California Edison Company | | 4.13 | 3-1-2048 | | 1,864,000 | 1,600,971 |
| Targa Resources Partners Company | | 4.00 | 1-15-2032 | | 1,127,000 | 1,028,388 |
| Targa Resources Partners Company | | 4.88 | 2-1-2031 | | 3,911,000 | 3,749,399 |
| Targa Resources Partners Company | | 5.50 | 3-1-2030 | | 988,000 | 984,957 |
| Trans-Allegheny Interstate Line Company 144A | | 3.85 | 6-1-2025 | | 1,174,000 | 1,169,658 |
| Virginia Electric & Power Company | | 2.45 | 12-15-2050 | | 962,000 | 673,870 |
| Virginia Electric & Power Company | | 2.95 | 11-15-2051 | | 2,485,000 | 1,916,668 |
| Virginia Electric & Power Company | | 4.63 | 5-15-2052 | | 1,687,000 | 1,745,040 |
| Xcel Energy Incorporated | | 4.60 | 6-1-2032 | | 2,526,000 | 2,591,541 |
| | | | | | | 80,399,643 |
| Gas utilities: 0.09% | | | | | | |
| Baltimore Gas & Electric Gas Company | | 2.25 | 6-15-2031 | | 2,485,000 | 2,166,738 |
| Southern Company Gas Capital Corporation | | 1.75 | 1-15-2031 | | 2,621,000 | 2,124,609 |
| | | | | | | 4,291,347 |
Independent power & renewable electricity
producers: 0.07% | | | | | | |
| AES Corporation | | 1.38 | 1-15-2026 | | 3,591,000 | 3,244,304 |
| Multi-utilities: 0.29% | | | | | | |
| Cargill Incorporated 144A | | 4.00 | 6-22-2032 | | 1,678,000 | 1,683,448 |
| CenterPoint Energy Incorporated | | 3.60 | 3-1-2052 | | 1,829,000 | 1,611,752 |
| Consumers Energy Company | | 2.50 | 5-1-2060 | | 1,413,000 | 940,850 |
| Consumers Energy Company | | 2.65 | 8-15-2052 | | 1,830,000 | 1,327,929 |
| DTE Energy Company | | 1.05 | 6-1-2025 | | 1,745,000 | 1,619,301 |
| DTE Energy Company | | 2.95 | 3-1-2050 | | 2,902,000 | 2,284,209 |
| DTE Energy Company | | 3.65 | 3-1-2052 | | 1,320,000 | 1,177,386 |
The accompanying notes are an integral part of these financial statements.
44 | Allspring Core Bond Portfolio
Portfolio of investments—May 31, 2022
| | | Interest
rate | Maturity
date | Principal | Value |
| Multi-utilities (continued) | | | | | | |
| Public Service Enterprise Group | | 1.60% | 8-15-2030 | $ | 1,915,000 | $ 1,554,439 |
| Public Service Enterprise Group | | 2.45 | 11-15-2031 | | 2,143,000 | 1,824,275 |
| | | | | | | 14,023,589 |
| Total Corporate bonds and notes (Cost $1,218,966,278) | | | | | | 1,104,588,839 |
| Municipal obligations: 0.37% | | | | | | |
| Nevada: 0.09% | | | | | | |
| Airport revenue: 0.09% | | | | | | |
| Clark County NV Airport Authority Build America Bonds Series C | | 6.82 | 7-1-2045 | | 3,365,000 | 4,414,423 |
| New York: 0.11% | | | | | | |
| Airport revenue: 0.11% | | | | | | |
| Port Authority of New York & New Jersey Consolidated Bonds Series 174 | | 4.46 | 10-1-2062 | | 5,505,000 | 5,477,267 |
| Ohio: 0.04% | | | | | | |
| Education revenue: 0.04% | | | | | | |
| Ohio State University General Receipts Taxable Bonds Series A | | 4.80 | 6-1-2111 | | 1,957,000 | 1,938,651 |
| Texas: 0.13% | | | | | | |
| Education revenue: 0.03% | | | | | | |
| University of Texas Financing System Bond Series B | | 2.44 | 8-15-2049 | | 1,695,000 | 1,237,021 |
| Transportation revenue: 0.10% | | | | | | |
| North Texas Tollway Authority | | 6.72 | 1-1-2049 | | 3,609,000 | 4,841,398 |
| Total Municipal obligations (Cost $17,156,136) | | | | | | 17,908,760 |
| Non-agency mortgage-backed securities: 4.77% | | | | | | |
| 3650R Commercial Mortgage Trust Series 2021-PF1 Class A5 | | 2.52 | 11-15-2054 | | 2,521,000 | 2,226,544 |
| Angel Oak Mortgage Trust Series 2019-2 Class A1 144A±± | | 3.63 | 3-25-2049 | | 183,167 | 182,786 |
| Angel Oak Mortgage Trust Series 2020-2 Class A1 144A±± | | 2.53 | 1-26-2065 | | 1,569,173 | 1,521,593 |
| Angel Oak Mortgage Trust Series 2020-5 Class A1 144A±± | | 1.37 | 5-25-2065 | | 709,533 | 679,933 |
| Angel Oak Mortgage Trust Series 2021-6 Class A1 144A±± | | 1.46 | 9-25-2066 | | 2,977,751 | 2,714,732 |
| Bank Series 2022-BNK41 ±± | | 3.92 | 4-15-2065 | | 1,603,000 | 1,569,131 |
| Barclays Commercial Mortgage Series 2018-C2 Class ASB | | 4.24 | 12-15-2051 | | 1,159,000 | 1,182,405 |
| Barclays Commercial Mortgage Series 2019-C3 Class A3 | | 3.32 | 5-15-2052 | | 585,000 | 555,240 |
| Benchmark Mortgage Trust Series 2021-B31 Class A5 | | 2.67 | 12-15-2054 | | 797,000 | 707,222 |
| Benchmark Mortgage Trust Series 2022-B34 Class A5 ±± | | 3.79 | 4-15-2055 | | 2,469,000 | 2,403,930 |
| Benchmark Mortgage Trust Series 2022-B35 Class A5 ±± | | 4.59 | 5-15-2055 | | 3,980,000 | 4,112,218 |
| Bunker Hill Loan Depositary Trust Series 2019-2 Class A1 144Aøø | | 2.88 | 7-25-2049 | | 2,325,151 | 2,282,984 |
The accompanying notes are an integral part of these financial statements.
Allspring Core Bond Portfolio | 45
Portfolio of investments—May 31, 2022
| | | Interest
rate | Maturity
date | Principal | Value |
| Non-agency mortgage-backed securities (continued) | | | | | | |
| Bunker Hill Loan Depositary Trust Series 2019-3 Class A1 144Aøø | | 2.72% | 11-25-2059 | $ | 1,651,874 | $ 1,640,252 |
| BX Trust Series 2021-VOLT Class A (1 Month LIBOR +0.70%) 144A± | | 1.57 | 9-15-2036 | | 10,912,000 | 10,389,743 |
| BX Trust Series 2021-XL2 Class A (1 Month LIBOR +0.69%) 144A± | | 1.56 | 10-15-2038 | | 5,078,034 | 4,877,708 |
| CFCRE Commercial Mortgage Trust Series 2017-C8 Class ASB | | 3.37 | 6-15-2050 | | 1,605,662 | 1,596,492 |
| Colt Funding LLC Series 2021-2 Class A1 144A±± | | 0.92 | 8-25-2066 | | 3,950,635 | 3,502,325 |
| Colt Funding LLC Series 2021-4 Class A1 144A±± | | 1.40 | 10-25-2066 | | 4,201,446 | 3,679,834 |
| Commercial Mortgage Trust Pass-Through Certificate Series 2012-CR3 Class A3 | | 2.82 | 10-15-2045 | | 1,584,336 | 1,582,368 |
| Commercial Mortgage Trust Series 2013-CR10 Class A4 ±± | | 4.21 | 8-10-2046 | | 89,000 | 89,552 |
| Commercial Mortgage Trust Series 2013-CR11 Class A4 | | 4.26 | 8-10-2050 | | 10,048,000 | 10,106,141 |
| Commercial Mortgage Trust Series 2013-CR6 Class A4 | | 3.10 | 3-10-2046 | | 8,286,000 | 8,270,806 |
| Commercial Mortgage Trust Series 2014-UBS4 Class A4 | | 3.42 | 8-10-2047 | | 3,937,000 | 3,902,004 |
| Commercial Mortgage Trust Series 2015-LC19 Class A3 | | 2.92 | 2-10-2048 | | 4,933,590 | 4,827,596 |
| Commercial Mortgage Trust Series 2015-LC23 Class A3 | | 3.52 | 10-10-2048 | | 1,982,000 | 1,957,435 |
| CSAIL Commercial Mortgage Trust Series 2019-C16 Class A2 | | 3.07 | 6-15-2052 | | 1,924,000 | 1,783,342 |
| CSAIL Commercial Mortgage Trust Series 2021-C20 Class A3 | | 2.80 | 3-15-2054 | | 1,257,000 | 1,118,751 |
| Duke Energy Carolinas 1st Mortgage | | 2.85 | 3-15-2032 | | 3,079,000 | 2,814,873 |
| EQUS Mortgage Trust Series 2021-EQAZ (1 Month LIBOR +0.75%) 144A± | | 1.63 | 10-15-2038 | | 4,123,000 | 3,960,334 |
| Goldman Sachs Mortgage Securities Trust Series 2013-GC14 Class A5 | | 4.24 | 8-10-2046 | | 2,275,000 | 2,286,008 |
| Goldman Sachs Mortgage Securities Trust Series 2014-GC18 Class A4 | | 4.07 | 1-10-2047 | | 5,471,323 | 5,507,523 |
| Goldman Sachs Mortgage Securities Trust Series 2020-GC47 Class A5 | | 2.38 | 5-12-2053 | | 1,589,000 | 1,405,470 |
| Goldman Sachs Mortgage Securities Trust Series 2020-GSA2 Class A4 | | 1.72 | 12-12-2053 | | 5,595,000 | 4,728,152 |
| Impact Funding LLC Series 2010-1 Class A1 144A | | 5.31 | 1-25-2051 | | 4,496,992 | 4,440,849 |
| JPMDB Commercial Mortgage Securities Series 2013-C12 Class A5 | | 3.66 | 7-15-2045 | | 3,316,000 | 3,319,257 |
| JPMDB Commercial Mortgage Securities Series 2013-C17 Class A4 | | 4.20 | 1-15-2047 | | 1,095,000 | 1,102,061 |
| JPMDB Commercial Mortgage Securities Series 2014-C23 Class A4 | | 3.67 | 9-15-2047 | | 1,659,938 | 1,654,208 |
| JPMorgan Chase Commercial Mortgage Securities Trust Series 2013-C16 Class A4 | | 4.17 | 12-15-2046 | | 4,973,000 | 4,991,952 |
| JPMorgan Chase Commercial Mortgage Securities Trust Series 2015-C28 Class A3 | | 2.91 | 10-15-2048 | | 9,127,238 | 8,914,056 |
| JPMorgan Chase Commercial Mortgage Securities Trust Series 2015-C30 Class A5 | | 3.82 | 7-15-2048 | | 3,008,000 | 2,992,807 |
| JPMorgan Chase Commercial Mortgage Securities Trust Series 2016-JP3 Class A3 | | 3.39 | 12-15-2049 | | 1,080,000 | 1,042,343 |
| Med Trust Series 2021-MDLN (1 Month LIBOR +0.95%) 144A± | | 1.83 | 11-15-2038 | | 6,662,000 | 6,403,223 |
The accompanying notes are an integral part of these financial statements.
46 | Allspring Core Bond Portfolio
Portfolio of investments—May 31, 2022
| | | Interest
rate | Maturity
date | Principal | Value |
| Non-agency mortgage-backed securities (continued) | | | | | | |
| Mello Warehouse Securitization Trust Series 2021-1 Class A (1 Month LIBOR +0.70%) 144A± | | 1.37% | 2-25-2055 | $ | 1,606,000 | $ 1,590,242 |
| Mello Warehouse Securitization Trust Series 2021-2 Class A (1 Month LIBOR +0.75%) 144A± | | 1.76 | 4-25-2055 | | 4,340,000 | 4,280,418 |
| MFRA Trust Series 2021-NQM2 Class A1 144A±± | | 1.03 | 11-25-2064 | | 1,847,715 | 1,688,057 |
| Morgan Stanley Capital 1 Trust Series 2022-L8 Class A5 ±± | | 3.80 | 4-15-2055 | | 1,648,000 | 1,598,267 |
| Morgan Stanley Capital International Trust Series 2020-HR8 Class A3 | | 1.79 | 7-15-2053 | | 3,030,000 | 2,563,943 |
| New Residential Mortgage Loan Trust Series 2019-NQM4 Class A1 144A±± | | 2.49 | 9-25-2059 | | 936,764 | 904,327 |
| NewRez WareHouse Securitization Series 2021-1 Class A (1 Month LIBOR +0.75%) 144A± | | 1.76 | 5-25-2055 | | 10,288,000 | 10,181,978 |
| Oncor Electric Delivery 1st Mortgage | | 2.70 | 11-15-2051 | | 1,595,000 | 1,208,831 |
| Peco Energy Company 1st Mortgage | | 2.85 | 9-15-2051 | | 2,995,000 | 2,277,300 |
| Peco Energy Company 1st Mortgage | | 4.60 | 5-15-2052 | | 2,531,000 | 2,640,565 |
| SMB Private Education Loan Trust Series 2022-A Class APT 144A | | 2.85 | 11-16-2054 | | 4,843,104 | 4,542,364 |
| Starwood Mortgage Residential Trust Series 2020-1 Class A1 144A±± | | 2.28 | 2-25-2050 | | 627,242 | 625,487 |
| Starwood Mortgage Residential Trust Series 2020-INV1 Class A1 144A±± | | 1.03 | 11-25-2055 | | 1,489,129 | 1,449,973 |
| Starwood Mortgage Residential Trust Series 2020-INV3 Class A1 144A±± | | 1.49 | 4-25-2065 | | 1,712,614 | 1,680,751 |
| Starwood Mortgage Residential Trust Series 2021-1 Class A1 144A±± | | 1.22 | 5-25-2065 | | 1,752,463 | 1,654,183 |
| Starwood Mortgage Residential Trust Series 2021-4 Class A1 144A±± | | 1.16 | 8-25-2056 | | 4,027,901 | 3,669,907 |
| UBS-Barclays Commercial Mortgage Trust Series 2012-C4 Class A4 | | 2.79 | 12-10-2045 | | 3,293,000 | 3,290,399 |
| Verizon Master Trust Series 2022-4 Class A øø | | 3.40 | 11-20-2028 | | 6,886,000 | 6,886,341 |
| Verus Securitization Trust Series 2019-2 Class A1 144A±± | | 2.91 | 7-25-2059 | | 1,079,833 | 1,078,596 |
| Verus Securitization Trust Series 2019-3 Class A1 144A±± | | 2.69 | 11-25-2059 | | 889,639 | 877,593 |
| Verus Securitization Trust Series 2019-4 Class A1 144Aøø | | 2.64 | 11-25-2059 | | 1,810,645 | 1,805,567 |
| Verus Securitization Trust Series 2020-1 Class A1 144Aøø | | 2.42 | 1-25-2060 | | 383,034 | 377,195 |
| Verus Securitization Trust Series 2020-2 Class A1 144A±± | | 2.23 | 5-25-2060 | | 1,523,308 | 1,500,911 |
| Verus Securitization Trust Series 2020-5 Class A1 144Aøø | | 1.22 | 5-25-2065 | | 745,562 | 712,397 |
| Verus Securitization Trust Series 2021-1 Class A1 144A±± | | 0.82 | 1-25-2066 | | 2,365,397 | 2,254,250 |
| Verus Securitization Trust Series 2021-2 Class A1 144A±± | | 1.03 | 2-25-2066 | | 4,243,127 | 3,966,452 |
| Verus Securitization Trust Series 2021-3 Class A1 144A±± | | 1.05 | 6-25-2066 | | 3,006,954 | 2,787,856 |
| Verus Securitization Trust Series 2021-4 Class A1 144A±± | | 0.94 | 7-25-2066 | | 3,636,886 | 3,210,980 |
| Verus Securitization Trust Series 2021-5 Class A1 144A±± | | 1.01 | 9-25-2066 | | 12,865,558 | 11,500,266 |
| Verus Securitization Trust Series 2021-7 Class A1 144A±± | | 1.83 | 10-25-2066 | | 5,254,923 | 4,818,123 |
The accompanying notes are an integral part of these financial statements.
Allspring Core Bond Portfolio | 47
Portfolio of investments—May 31, 2022
| | | Interest
rate | Maturity
date | Principal | Value |
| Non-agency mortgage-backed securities (continued) | | | | | | |
| Verus Securitization Trust Series 2021-8 Class A1 144A±± | | 1.82% | 11-25-2066 | $ | 3,775,670 | $ 3,404,551 |
| Verus Securitization Trust Series 2021-R1 Class A1 144A±± | | 0.82 | 10-25-2063 | | 2,329,083 | 2,277,646 |
| Verus Securitization Trust Series 2021-R3 Class A1 144A±± | | 1.02 | 4-25-2064 | | 2,070,060 | 1,991,705 |
| Visio Trust Series 2020-1R Class A1 144A | | 1.31 | 11-25-2055 | | 1,697,839 | 1,652,607 |
| Total Non-agency mortgage-backed securities (Cost $244,872,725) | | | | | | 231,976,211 |
| U.S. Treasury securities: 31.74% | | | | | | |
| U.S. Treasury Bond | | 1.13 | 5-15-2040 | | 87,097,000 | 61,760,619 |
| U.S. Treasury Bond | | 1.13 | 8-15-2040 | | 56,396,000 | 39,739,353 |
| U.S. Treasury Bond | | 1.38 | 11-15-2040 | | 103,384,000 | 75,991,278 |
| U.S. Treasury Bond | | 1.38 | 8-15-2050 | | 30,117,000 | 20,111,333 |
| U.S. Treasury Bond | | 1.63 | 11-15-2050 | | 31,350,000 | 22,394,432 |
| U.S. Treasury Bond ## | | 1.75 | 8-15-2041 | | 104,218,000 | 81,021,354 |
| U.S. Treasury Bond | | 1.88 | 2-15-2041 | | 12,155,000 | 9,740,143 |
| U.S. Treasury Bond | | 2.50 | 2-15-2045 | | 15,047,000 | 12,996,259 |
| U.S. Treasury Note | | 0.13 | 9-30-2022 | | 29,297,000 | 29,177,981 |
| U.S. Treasury Note | | 0.13 | 4-30-2023 | | 2,432,000 | 2,388,680 |
| U.S. Treasury Note | | 0.13 | 8-31-2023 | | 1,796,000 | 1,749,346 |
| U.S. Treasury Note | | 0.25 | 8-31-2025 | | 72,965,000 | 67,261,759 |
| U.S. Treasury Note | | 0.25 | 9-30-2025 | | 82,493,000 | 75,887,116 |
| U.S. Treasury Note | | 0.38 | 11-30-2025 | | 19,233,000 | 17,687,598 |
| U.S. Treasury Note | | 0.38 | 1-31-2026 | | 47,290,000 | 43,303,601 |
| U.S. Treasury Note | | 0.50 | 8-31-2027 | | 46,306,000 | 41,018,795 |
| U.S. Treasury Note | | 0.50 | 10-31-2027 | | 38,612,000 | 34,038,891 |
| U.S. Treasury Note | | 0.63 | 11-30-2027 | | 9,979,000 | 8,842,330 |
| U.S. Treasury Note | | 0.75 | 3-31-2026 | | 16,160,000 | 14,955,575 |
| U.S. Treasury Note | | 0.75 | 5-31-2026 | | 52,745,000 | 48,630,478 |
| U.S. Treasury Note | | 0.88 | 6-30-2026 | | 14,949,000 | 13,832,497 |
| U.S. Treasury Note | | 1.00 | 7-31-2028 | | 25,631,000 | 22,894,691 |
| U.S. Treasury Note | | 1.25 | 6-30-2028 | | 20,663,000 | 18,774,273 |
| U.S. Treasury Note | | 1.38 | 10-31-2028 | | 53,423,000 | 48,671,275 |
| U.S. Treasury Note | | 1.50 | 2-15-2025 | | 35,621,000 | 34,498,104 |
| U.S. Treasury Note | | 1.50 | 8-15-2026 | | 73,243,000 | 69,369,132 |
| U.S. Treasury Note | | 1.75 | 3-15-2025 | | 21,600,000 | 21,041,437 |
| U.S. Treasury Note | | 1.75 | 1-31-2029 | | 4,483,000 | 4,177,421 |
| U.S. Treasury Note | | 1.88 | 11-15-2051 | | 7,074,000 | 5,389,504 |
| U.S. Treasury Note | | 2.00 | 11-15-2041 | | 40,493,000 | 32,881,581 |
| U.S. Treasury Note | | 2.00 | 8-15-2051 | | 31,558,000 | 24,761,935 |
| U.S. Treasury Note | | 2.25 | 5-15-2041 | | 45,300,000 | 38,538,621 |
| U.S. Treasury Note | | 2.25 | 2-15-2052 | | 34,584,000 | 28,926,274 |
| U.S. Treasury Note | | 2.38 | 2-15-2042 | | 7,118,000 | 6,162,631 |
| U.S. Treasury Note « | | 2.50 | 4-30-2024 | | 4,544,000 | 4,542,580 |
| U.S. Treasury Note | | 2.50 | 5-31-2024 | | 7,782,000 | 7,782,000 |
| U.S. Treasury Note | | 2.50 | 2-28-2026 | | 12,116,000 | 11,991,527 |
| U.S. Treasury Note | | 2.63 | 4-15-2025 | | 13,608,000 | 13,570,791 |
| U.S. Treasury Note | | 2.63 | 5-31-2027 | | 30,586,000 | 30,295,372 |
| U.S. Treasury Note ## | | 2.75 | 5-15-2025 | | 110,571,000 | 110,666,023 |
| U.S. Treasury Note ## | | 2.75 | 4-30-2027 | | 122,653,000 | 122,202,619 |
| U.S. Treasury Note | | 2.75 | 2-15-2028 | | 41,997,000 | 41,724,675 |
| U.S. Treasury Note | | 2.75 | 5-31-2029 | | 19,273,000 | 19,129,089 |
The accompanying notes are an integral part of these financial statements.
48 | Allspring Core Bond Portfolio
Portfolio of investments—May 31, 2022
| | | Interest
rate | Maturity
date | Principal | Value |
| U.S. Treasury securities (continued) | | | | | | |
| U.S. Treasury Note | | 2.88% | 4-30-2029 | $ | 10,312,000 | $ 10,307,166 |
| U.S. Treasury Note | | 2.88 | 5-15-2032 | | 71,985,000 | 72,074,981 |
| U.S. Treasury Note | | 2.88 | 5-15-2052 | | 16,304,000 | 15,727,067 |
| U.S. Treasury Note | | 3.25 | 5-15-2042 | | 3,338,000 | 3,327,047 |
| Total U.S. Treasury securities (Cost $1,666,517,849) | | | | | | 1,541,957,234 |
| Yankee corporate bonds and notes: 4.71% | | | | | | |
| Communication services: 0.07% | | | | | | |
| Wireless telecommunication services: 0.07% | | | | | | |
| Rogers Communications Incorporated 144A | | 4.55 | 3-15-2052 | | 2,072,000 | 1,924,663 |
| Vodafone Group plc | | 4.25 | 9-17-2050 | | 663,000 | 584,300 |
| Vodafone Group plc | | 5.00 | 5-30-2038 | | 833,000 | 835,135 |
| | | | | | | 3,344,098 |
| Consumer staples: 0.20% | | | | | | |
| Food products: 0.20% | | | | | | |
| Viterra Finance BV 144A | | 3.20 | 4-21-2031 | | 766,000 | 655,744 |
| Viterra Finance BV 144A | | 4.90 | 4-21-2027 | | 4,273,000 | 4,233,533 |
| Viterra Finance BV 144A | | 5.25 | 4-21-2032 | | 5,247,000 | 5,051,497 |
| | | | | | | 9,940,774 |
| Energy: 0.37% | | | | | | |
| Oil, gas & consumable fuels: 0.37% | | | | | | |
| Aker BP ASA 144A | | 3.75 | 1-15-2030 | | 1,157,000 | 1,078,223 |
| Galaxy Pipeline Assets Company 144A | | 1.75 | 9-30-2027 | | 4,493,105 | 4,243,465 |
| Galaxy Pipeline Assets Company 144A | | 2.16 | 3-31-2034 | | 3,673,368 | 3,216,681 |
| Galaxy Pipeline Assets Company 144A | | 2.63 | 3-31-2036 | | 2,354,000 | 1,968,467 |
| Galaxy Pipeline Assets Company 144A | | 2.94 | 9-30-2040 | | 1,518,132 | 1,283,078 |
| Oleoducto Central SA 144A | | 4.00 | 7-14-2027 | | 1,879,000 | 1,691,100 |
| Petroleos Mexicanos Company | | 2.38 | 4-15-2025 | | 1,088,700 | 1,080,641 |
| Petroleos Mexicanos Company | | 2.46 | 12-15-2025 | | 3,226,000 | 3,204,187 |
| | | | | | | 17,765,842 |
| Financials: 2.94% | | | | | | |
| Banks: 1.85% | | | | | | |
| Banco Santander SA (1 Year Treasury Constant Maturity +0.90%) ± | | 1.72 | 9-14-2027 | | 4,200,000 | 3,737,918 |
| Banco Santander SA (1 Year Treasury Constant Maturity +1.60%) ± | | 3.23 | 11-22-2032 | | 2,600,000 | 2,152,657 |
| Canadian Imperial Bank | | 3.60 | 4-7-2032 | | 1,648,000 | 1,536,661 |
| Cooperative Rabobank UA (1 Year Treasury Constant Maturity +1.22%) 144A± | | 3.65 | 4-6-2028 | | 12,539,000 | 12,168,603 |
| Cooperative Rabobank UA (1 Year Treasury Constant Maturity +1.42%) 144A± | | 3.76 | 4-6-2033 | | 5,944,000 | 5,557,566 |
| HSBC Holdings plc (U.S. SOFR +2.11%) ±%% | | 4.76 | 6-9-2028 | | 8,419,000 | 8,419,000 |
| Mitsubishi UFJ Financial Group (1 Year Treasury Constant Maturity +0.55%) ± | | 0.95 | 7-19-2025 | | 9,876,000 | 9,311,684 |
| Mitsubishi UFJ Financial Group (1 Year Treasury Constant Maturity +0.75%) ± | | 1.54 | 7-20-2027 | | 9,752,000 | 8,756,048 |
| Mitsubishi UFJ Financial Group (1 Year Treasury Constant Maturity +0.67%) ± | | 1.64 | 10-13-2027 | | 8,377,000 | 7,504,070 |
The accompanying notes are an integral part of these financial statements.
Allspring Core Bond Portfolio | 49
Portfolio of investments—May 31, 2022
| | | Interest
rate | Maturity
date | Principal | Value |
| Banks (continued) | | | | | | |
| Mitsubishi UFJ Financial Group (1 Year Treasury Constant Maturity +0.95%) ± | | 2.31% | 7-20-2032 | $ | 5,205,000 | $ 4,354,284 |
| Mitsubishi UFJ Financial Group (1 Year Treasury Constant Maturity +0.83%) ± | | 2.34 | 1-19-2028 | | 4,765,000 | 4,379,102 |
| Mitsubishi UFJ Financial Group (1 Year Treasury Constant Maturity +0.97%) ± | | 2.49 | 10-13-2032 | | 3,505,000 | 2,962,964 |
| Mitsubishi UFJ Financial Group (1 Year Treasury Constant Maturity +1.30%) ± | | 4.08 | 4-19-2028 | | 4,746,000 | 4,704,406 |
| Sumitomo Mitsui Financial Group Incorporated | | 1.40 | 9-17-2026 | | 5,659,000 | 5,071,848 |
| Sumitomo Mitsui Financial Group Incorporated | | 1.90 | 9-17-2028 | | 10,399,000 | 9,030,913 |
| | | | | | | 89,647,724 |
| Capital markets: 0.31% | | | | | | |
| Deutsche Bank AG (U.S. SOFR +2.26%) ± | | 3.74 | 1-7-2033 | | 8,720,000 | 7,128,446 |
| UBS Group AG (1 Year Treasury Constant Maturity +1.55%) 144A± | | 4.49 | 5-12-2026 | | 4,276,000 | 4,318,481 |
| UBS Group AG (1 Year Treasury Constant Maturity +1.75%) 144A± | | 4.75 | 5-12-2028 | | 3,505,000 | 3,553,195 |
| | | | | | | 15,000,122 |
| Diversified financial services: 0.71% | | | | | | |
| AerCap Ireland Capital Designated Activity Company / AerCap Global Aviation Trust | | 1.15 | 10-29-2023 | | 10,241,000 | 9,835,577 |
| DH Europe Finance II | | 2.05 | 11-15-2022 | | 2,655,000 | 2,653,699 |
| DH Europe Finance II | | 2.20 | 11-15-2024 | | 4,570,000 | 4,454,010 |
| GE Capital International Funding Company | | 4.42 | 11-15-2035 | | 1,122,000 | 1,106,277 |
| Lundin Energy Finance Company 144A | | 2.00 | 7-15-2026 | | 11,401,000 | 10,371,439 |
| Lundin Energy Finance Company 144A | | 3.10 | 7-15-2031 | | 4,952,000 | 4,359,930 |
| Trust Fibrauno 144A | | 6.39 | 1-15-2050 | | 2,091,000 | 1,829,625 |
| | | | | | | 34,610,557 |
| Insurance: 0.07% | | | | | | |
| Enstar Group Limited | | 3.10 | 9-1-2031 | | 4,195,000 | 3,527,430 |
| Health care: 0.42% | | | | | | |
| Biotechnology: 0.09% | | | | | | |
| CSL Finance plc 144A | | 3.85 | 4-27-2027 | | 835,000 | 836,380 |
| CSL Finance plc 144A | | 4.05 | 4-27-2029 | | 1,678,000 | 1,680,770 |
| CSL Finance plc 144A | | 4.75 | 4-27-2052 | | 1,759,000 | 1,744,031 |
| | | | | | | 4,261,181 |
| Health care equipment & supplies: 0.08% | | | | | | |
| Steris plc | | 3.75 | 3-15-2051 | | 4,790,000 | 3,844,434 |
| Pharmaceuticals: 0.25% | | | | | | |
| Astrazeneca plc | | 1.38 | 8-6-2030 | | 1,681,000 | 1,403,656 |
| Shire Acquisitions Investments Ireland Designated Activity Company | | 2.88 | 9-23-2023 | | 1,371,000 | 1,366,359 |
| Takeda Pharmaceutical | | 2.05 | 3-31-2030 | | 4,582,000 | 3,926,093 |
| Takeda Pharmaceutical | | 3.03 | 7-9-2040 | | 1,927,000 | 1,554,949 |
| Takeda Pharmaceutical | | 3.18 | 7-9-2050 | | 1,323,000 | 1,021,189 |
| Takeda Pharmaceutical | | 4.40 | 11-26-2023 | | 2,956,000 | 3,007,717 |
| | | | | | | 12,279,963 |
The accompanying notes are an integral part of these financial statements.
50 | Allspring Core Bond Portfolio
Portfolio of investments—May 31, 2022
| | | Interest
rate | Maturity
date | Principal | Value |
| Industrials: 0.14% | | | | | | |
| Road & rail: 0.12% | | | | | | |
| Canadian Pacific Railway Company | | 1.35% | 12-2-2024 | $ | 4,133,000 | $ 3,928,880 |
| Canadian Pacific Railway Company | | 1.75 | 12-2-2026 | | 799,000 | 735,834 |
| Canadian Pacific Railway Company | | 3.00 | 12-2-2041 | | 1,319,000 | 1,088,187 |
| | | | | | | 5,752,901 |
| Transportation infrastructure: 0.02% | | | | | | |
| Adani Ports & Special Company 144A | | 3.00 | 2-16-2031 | | 1,374,720 | 1,187,318 |
| Information technology: 0.28% | | | | | | |
| Semiconductors & semiconductor equipment: 0.28% | | | | | | |
| NXP BV | | 2.65 | 2-15-2032 | | 3,436,000 | 2,857,580 |
| NXP BV | | 3.25 | 5-11-2041 | | 1,821,000 | 1,431,767 |
| NXP BV | | 3.40 | 5-1-2030 | | 2,318,000 | 2,144,236 |
| NXP BV | | 4.40 | 6-1-2027 | | 2,019,000 | 2,026,133 |
| NXP BV | | 5.00 | 1-15-2033 | | 5,046,000 | 5,046,138 |
| | | | | | | 13,505,854 |
| Materials: 0.26% | | | | | | |
| Metals & mining: 0.26% | | | | | | |
| Anglo American Capital Company 144A | | 3.88 | 3-16-2029 | | 4,568,000 | 4,343,903 |
| Anglo American Capital Company 144A | | 4.75 | 3-16-2052 | | 3,634,000 | 3,311,498 |
| Teck Resources Limited | | 5.20 | 3-1-2042 | | 1,125,000 | 1,074,957 |
| Teck Resources Limited | | 6.13 | 10-1-2035 | | 1,702,000 | 1,873,390 |
| Teck Resources Limited | | 6.25 | 7-15-2041 | | 1,915,000 | 2,066,763 |
| | | | | | | 12,670,511 |
| Utilities: 0.03% | | | | | | |
| Electric utilities: 0.03% | | | | | | |
| Israel Electric Corporation Limited 144A | | 3.75 | 2-22-2032 | | 1,561,000 | 1,431,325 |
| Total Yankee corporate bonds and notes (Cost $247,581,170) | | | | | | 228,770,034 |
| Yankee government bonds: 0.85% | | | | | | |
| Republic of Chile | | 3.50 | 1-31-2034 | | 1,038,000 | 959,397 |
| Republic of Chile | | 4.34 | 3-7-2042 | | 5,124,000 | 4,779,398 |
| Republic of Indonesia | | 4.30 | 3-31-2052 | | 2,145,000 | 1,981,037 |
| Republic of Paraguay 144A | | 3.85 | 6-28-2033 | | 1,840,000 | 1,617,617 |
| Republic of Paraguay 144A | | 4.95 | 4-28-2031 | | 762,000 | 741,575 |
| Republic of Paraguay 144A | | 5.40 | 3-30-2050 | | 2,946,000 | 2,512,212 |
| Republic of Peru | | 1.86 | 12-1-2032 | | 3,029,000 | 2,406,722 |
| Republic of Peru | | 2.39 | 1-23-2026 | | 2,342,000 | 2,213,678 |
| Republic of Peru | | 3.60 | 1-15-2072 | | 2,003,000 | 1,486,700 |
| Republic of Philippines | | 4.20 | 3-29-2047 | | 599,000 | 566,980 |
| United Mexican States | | 3.50 | 2-12-2034 | | 7,175,000 | 6,297,399 |
| United Mexican States | | 3.75 | 4-19-2071 | | 3,865,000 | 2,722,804 |
| United Mexican States | | 4.28 | 8-14-2041 | | 7,045,000 | 6,001,697 |
| United Mexican States | | 4.40 | 2-12-2052 | | 1,056,000 | 867,894 |
| United Mexican States | | 4.50 | 4-22-2029 | | 5,207,000 | 5,237,800 |
| United Mexican States | | 4.60 | 2-10-2048 | | 883,000 | 758,846 |
| Total Yankee government bonds (Cost $45,635,218) | | | | | | 41,151,756 |
The accompanying notes are an integral part of these financial statements.
Allspring Core Bond Portfolio | 51
Portfolio of investments—May 31, 2022
| | | Yield | | Shares | Value |
| Short-term investments: 2.57% | | | | | | |
| Investment companies: 2.57% | | | | | | |
| Allspring Government Money Market Fund Select Class ♠∞## | | 0.65% | | | 114,848,590 | $ 114,848,590 |
| Securities Lending Cash Investments LLC ♠∩∞ | | 0.91 | | | 10,235,000 | 10,235,000 |
| Total Short-term investments (Cost $125,083,590) | | | | | | 125,083,590 |
| Total investments in securities (Cost $5,514,914,449) | 106.53% | | | | | 5,175,760,539 |
| Other assets and liabilities, net | (6.53) | | | | | (317,214,208) |
| Total net assets | 100.00% | | | | | $4,858,546,331 |
| ¤ | The security is issued in zero coupon form with no periodic interest payments. |
| ± | Variable rate investment. The rate shown is the rate in effect at period end. |
| ±± | The coupon of the security is adjusted based on the principal and/or interest payments received from the underlying pool of mortgages as well as the credit quality and the actual prepayment speed of the underlying mortgages. The rate shown is the rate in effect at period end. |
| 144A | The security may be resold in transactions exempt from registration, normally to qualified institutional buyers, pursuant to Rule 144A under the Securities Act of 1933. |
| øø | The interest rate is determined and reset by the issuer periodically depending upon the terms of the security. The rate shown is the rate in effect at period end. |
| ## | All or a portion of this security is segregated for when-issued securities. |
| « | All or a portion of this security is on loan. |
| ♠ | The issuer of the security is an affiliated person of the Portfolio as defined in the Investment Company Act of 1940. |
| ∩ | The investment is a non-registered investment company purchased with cash collateral received from securities on loan. |
| ∞ | The rate represents the 7-day annualized yield at period end. |
| %% | The security is purchased on a when-issued basis. |
| Abbreviations: |
| FHLMC | Federal Home Loan Mortgage Corporation |
| FNMA | Federal National Mortgage Association |
| GNMA | Government National Mortgage Association |
| LIBOR | London Interbank Offered Rate |
| REIT | Real estate investment trust |
| SOFR | Secured Overnight Financing Rate |
Investments in affiliates
An affiliated investment is an investment in which the Portfolio owns at least 5% of the outstanding voting shares of the issuer or as a result of other relationships, such as the Portfolio and the issuer having the same adviser or investment manager. Transactions with issuers that were affiliates of the Portfolio at the end of the period were as follows:
| | Value,
beginning of
period | Purchases | Sales
proceeds | Net
realized
gains
(losses) | | Net
change in
unrealized
gains
(losses) | | Value,
end of
period | Shares,
end
of period | Income
from
affiliated
securities |
| Short-term investments | | | | | | | | | |
| Allspring Government Money Market Fund Select Class | $270,350,377 | $5,014,964,519 | $(5,170,466,306) | $0 | | $0 | | $ 114,848,590 | 114,848,590 | $ 157,224 |
| Securities Lending Cash Investments LLC | 0 | 740,723,398 | (730,488,398) | 0 | | 0 | | 10,235,000 | 10,235,000 | 9,136 # |
| | | | | $0 | | $0 | | $125,083,590 | | $166,360 |
| # | Amount shown represents income before fees and rebates. |
The accompanying notes are an integral part of these financial statements.
52 | Allspring Core Bond Portfolio
Statement of assets and liabilities—May 31, 2022
| | |
| Assets | |
Investments in unaffiliated securities (including $4,542,580 of securities loaned), at value (cost $5,389,830,859)
| $ 5,050,676,949 |
Investments in affiliated securities, at value (cost $125,083,590)
| 125,083,590 |
Cash
| 1,826,769 |
Foreign currency, at value (cost $89)
| 90 |
Receivable for investments sold
| 454,723,992 |
Receivable for interest
| 18,981,253 |
Principal paydown receivable
| 1,418,637 |
Receivable for securities lending income, net
| 141 |
Prepaid expenses and other assets
| 157,892 |
Total assets
| 5,652,869,313 |
| Liabilities | |
Payable for when-issued transactions
| 423,390,113 |
Payable for investments purchased
| 358,795,127 |
Payable upon receipt of securities loaned
| 10,235,000 |
Advisory fee payable
| 1,423,315 |
Cash collateral due to broker
| 450,000 |
Accrued expenses and other liabilities
| 29,427 |
Total liabilities
| 794,322,982 |
Total net assets
| $4,858,546,331 |
The accompanying notes are an integral part of these financial statements.
Allspring Core Bond Portfolio | 53
Statement of operations—year ended May 31, 2022
| | |
| Investment income | |
Interest (net of foreign withholding taxes of $220)
| $ 89,936,115 |
Income from affiliated securities
| 200,079 |
Total investment income
| 90,136,194 |
| Expenses | |
Advisory fee
| 18,393,298 |
Custody and accounting fees
| 334,627 |
Professional fees
| 138,886 |
Interest holder report expenses
| 27,196 |
Trustees’ fees and expenses
| 19,821 |
Other fees and expenses
| 133,507 |
Total expenses
| 19,047,335 |
Less: Fee waivers and/or expense reimbursements
| (24,466) |
Net expenses
| 19,022,869 |
Net investment income
| 71,113,325 |
| Realized and unrealized gains (losses) on investments | |
Net realized losses on investments
| (167,999,743) |
Net change in unrealized gains (losses) on investments
| (357,074,109) |
Net realized and unrealized gains (losses) on investments
| (525,073,852) |
Net decrease in net assets resulting from operations
| $(453,960,527) |
The accompanying notes are an integral part of these financial statements.
54 | Allspring Core Bond Portfolio
Statement of changes in net assets
| | | |
| | Year ended
May 31, 2022 | Year ended
May 31, 2021 |
| Operations | | |
Net investment income
| $ 71,113,325 | $ 77,723,644 |
Net realized gains (losses) on investments
| (167,999,743) | 129,629,293 |
Net change in unrealized gains (losses) on investments
| (357,074,109) | (171,533,989) |
Net increase (decrease) in net assets resulting from operations
| (453,960,527) | 35,818,948 |
| Capital transactions | | |
| Transactions in investors’ beneficial interests | | |
Contributions
| 733,615,538 | 1,103,776,459 |
Withdrawals
| (1,063,241,380) | (1,259,318,551) |
Net decrease in net assets resulting from capital transactions
| (329,625,842) | (155,542,092) |
Total decrease in net assets
| (783,586,369) | (119,723,144) |
| Net assets | | |
Beginning of period
| 5,642,132,700 | 5,761,855,844 |
End of period
| $ 4,858,546,331 | $ 5,642,132,700 |
The accompanying notes are an integral part of these financial statements.
Allspring Core Bond Portfolio | 55
| | Year ended May 31 |
| | 2022 | 2021 | 2020 | 2019 | 2018 |
Total return
| (8.55)% | 0.65% | 9.49% | 6.30% | (0.53)% |
| Ratios to average net assets (annualized) | | | | | |
Gross expenses
| 0.36% | 0.35% | 0.35% | 0.35% | 0.35% |
Net expenses1
| 0.36% | 0.35% | 0.35% | 0.35% | 0.35% |
Net investment income
| 1.33% | 1.30% | 2.28% | 2.93% | 2.23% |
| Supplemental data | | | | | |
Portfolio turnover rate
| 432% | 457% | 603% | 577% | 542% |
| 1 | Net expense ratios reflect voluntary waivers. |
The accompanying notes are an integral part of these financial statements.
56 | Allspring Core Bond Portfolio
Notes to financial statements
1. ORGANIZATION
Allspring Master Trust (the "Trust"), a Delaware statutory trust organized on March 10, 1999, is an open-end management investment company registered under the Investment Company Act of 1940, as amended (the "1940 Act"). As an investment company, the Trust follows the accounting and reporting guidance in Financial Accounting Standards Board ("FASB") Accounting Standards Codification Topic 946, Financial Services – Investment Companies. These financial statements report on the Allspring Core Bond Portfolio (the "Portfolio") which is a diversified series of the Trust.
Interests in the Portfolio are available solely through private placement transactions that do not involve any "public offering" within the meaning of Section 4(a)(2) of the Securities Act of 1933.
Effective on November 1, 2021, the sale transaction of Wells Fargo Asset Management ("WFAM") by Wells Fargo & Company to GTCR LLC and Reverence Capital Partners, L.P. was closed. In connection with the closing of the transaction, WFAM became known as Allspring Global Investments (“Allspring”) and various entities that provided services to the Portfolio changed their names to "Allspring", including Allspring Funds Management, LLC, the adviser to the Portfolio, Allspring Global Investments, LLC and Allspring Global Investments (UK) Limited, both registered investment advisers providing subadvisory services to certain funds, and Allspring Funds Distributor, LLC. Consummation of the transaction resulted in a new advisory agreement and subadvisory agreement which became effective on November 1, 2021.
2. SIGNIFICANT ACCOUNTING POLICIES
The following significant accounting policies, which are consistently followed in the preparation of the financial statements of the Portfolio, are in conformity with U.S. generally accepted accounting principles which require management to make estimates and assumptions that affect the reported amounts of assets and liabilities, disclosure of contingent assets and liabilities at the date of the financial statements, and the reported amounts of income and expenses during the reporting period. Actual results could differ from those estimates.
Securities valuation
All investments are valued each business day as of the close of regular trading on the New York Stock Exchange (generally 4 p.m. Eastern Time), although the Portfolio may deviate from this calculation time under unusual or unexpected circumstances.
Debt securities are valued at the evaluated bid price provided by an independent pricing service (e.g. taking into account various factors, including yields, maturities, or credit ratings) or, if a reliable price is not available, the quoted bid price from an independent broker-dealer.
The values of securities denominated in foreign currencies are translated into U.S. dollars at rates provided by an independent foreign currency pricing source at a time each business day specified by the Allspring Global Investments Pricing Committee at Allspring Funds Management, LLC ("Allspring Funds Management").
Investments in registered open-end investment companies are valued at net asset value. Interests in non-registered investment companies that are redeemable at net asset value are fair valued normally at net asset value.
Investments which are not valued using any of the methods discussed above are valued at their fair value, as determined in good faith by the Board of Trustees. The Board of Trustees has established a Valuation Committee comprised of the Trustees and has delegated to it the authority to take any actions regarding the valuation of portfolio securities that the Valuation Committee deems necessary or appropriate, including determining the fair value of portfolio securities, unless the determination has been delegated to the Allspring Global Investments Pricing Committee. The Board of Trustees retains the authority to make or ratify any valuation decisions or approve any changes to the Valuation Procedures as it deems appropriate. On a quarterly basis, the Board of Trustees receives reports on any valuation actions taken by the Valuation Committee or the Allspring Global Investments Pricing Committee which may include items for ratification.
Foreign currency translation
The accounting records of the Portfolio are maintained in U.S. dollars. The values of other assets and liabilities denominated in foreign currencies are translated into U.S. dollars at rates provided by an independent foreign currency pricing source at a time each business day specified by the Allspring Global Investments Pricing Committee. Purchases and sales of securities, and income and expenses are converted at the rate of exchange on the respective dates of such transactions. Net realized foreign exchange gains or losses arise from sales of foreign currencies, currency gains or losses realized between the trade and settlement dates on securities transactions, and the difference between the amounts of dividends, interest and foreign withholding taxes recorded and the U.S. dollar equivalent of the amounts actually paid or received. Net unrealized foreign exchange gains and losses arise from changes in the fair value of assets and liabilities other than investments in securities
Allspring Core Bond Portfolio | 57
Notes to financial statements
resulting from changes in exchange rates. The changes in net assets arising from changes in exchange rates of securities and the changes in net assets resulting from changes in market prices of securities are not separately presented. Such changes are included in net realized and unrealized gains or losses from investments.
Securities lending
The Portfolio may lend its securities from time to time in order to earn additional income in the form of fees or interest on securities received as collateral or the investment of any cash received as collateral. When securities are on loan, the Portfolio receives interest or dividends on those securities. Cash collateral received in connection with its securities lending transactions is invested in Securities Lending Cash Investments, LLC (the "Securities Lending Fund"), an affiliated non-registered investment company. Investments in Securities Lending Fund are valued at the evaluated bid price provided by an independent pricing service. Income earned from investment in the Securities Lending Fund (net of fees and rebates), if any, is included in income from affiliated securities on the Statement of Operations.
In a securities lending transaction, the net asset value of the Portfolio is affected by an increase or decrease in the value of the securities loaned and by an increase or decrease in the value of the instrument in which collateral is invested. The amount of securities lending activity undertaken by the Portfolio fluctuates from time to time. The Portfolio has the right under the lending agreement to recover the securities from the borrower on demand. In the event of default or bankruptcy by the borrower, the Portfolio may be prevented from recovering the loaned securities or gaining access to the collateral or may experience delays or costs in doing so. In such an event, the terms of the agreement allow the unaffiliated securities lending agent to use the collateral to purchase replacement securities on behalf of the Portfolio or pay the Portfolio the market value of the loaned securities. The Portfolio bears the risk of loss with respect to depreciation of its investment of the cash collateral.
When-issued transactions
The Portfolio may purchase securities on a forward commitment or when-issued basis. The Portfolio records a when-issued transaction on the trade date and will segregate assets in an amount at least equal in value to the Portfolio's commitment to purchase when-issued securities. Securities purchased on a when-issued basis are marked-to-market daily and the Portfolio begins earning interest on the settlement date. Losses may arise due to changes in the market value of the underlying securities or if the counterparty does not perform under the contract.
Security transactions and income recognition
Securities transactions are recorded on a trade date basis. Realized gains or losses are recorded on the basis of identified cost.
Interest income is accrued daily and bond discounts are accreted and premiums are amortized daily. To the extent debt obligations are placed on non-accrual status, any related interest income may be reduced by writing off interest receivables when the collection of all or a portion of interest has been determined to be doubtful based on consistently applied procedures and the fair value has decreased. If the issuer subsequently resumes interest payments or when the collectability of interest is reasonably assured, the debt obligation is removed from non-accrual status. Interest income is recorded net of foreign taxes withheld where recovery of such taxes is not assured. Paydown gains and losses are included in interest income.
Federal and other taxes
The Portfolio is not required to pay federal income taxes on its net investment income and net capital gains as it is treated as a partnership for federal income tax purposes. All income, gains and losses of the Portfolio are deemed to have been “passed through” to the interest holders in proportion to their holdings of the Portfolio regardless of whether income and gains have been distributed by the Portfolio.
The Portfolio’s income tax returns and all financial records supporting those returns for the prior three fiscal years are subject to examination by the federal revenue authority. Management has analyzed the Portfolio’s tax positions taken on federal, state, and foreign tax returns, as applicable, for all open tax years and does not believe that there are any uncertain tax positions that require recognition of a tax liability.
As of May 31, 2022, the aggregate cost of all investments for federal income tax purposes was $5,547,063,321 and the unrealized gains (losses) consisted of:
| Gross unrealized gains | $ 8,861,747 |
| Gross unrealized losses | (380,164,529) |
| Net unrealized losses | $(371,302,782) |
58 | Allspring Core Bond Portfolio
Notes to financial statements
3. FAIR VALUATION MEASUREMENTS
Fair value measurements of investments are determined within a framework that has established a fair value hierarchy based upon the various data inputs utilized in determining the value of the Portfolio’s investments. The three-level hierarchy gives the highest priority to unadjusted quoted prices in active markets for identical assets or liabilities (Level 1) and the lowest priority to unobservable inputs (Level 3). The Portfolio’s investments are classified within the fair value hierarchy based on the lowest level of input that is significant to the fair value measurement. The inputs are summarized into three broad levels as follows:
| ■ | Level 1 – quoted prices in active markets for identical securities |
| ■ | Level 2 – other significant observable inputs (including quoted prices for similar securities, interest rates, prepayment speeds, credit risk, etc.) |
| ■ | Level 3 – significant unobservable inputs (including the Portfolio’s own assumptions in determining the fair value of investments) |
The inputs or methodologies used for valuing investments in securities are not necessarily an indication of the risk associated with investing in those securities.
The following is a summary of the inputs used in valuing the Portfolio’s assets and liabilities as of May 31, 2022:
| | Quoted prices
(Level 1) | Other significant
observable inputs
(Level 2) | Significant
unobservable inputs
(Level 3) | Total |
| Assets | | | | |
| Investments in: | | | | |
| Agency securities | $ 0 | $ 1,452,075,426 | $0 | $ 1,452,075,426 |
| Asset-backed securities | 0 | 432,248,689 | 0 | 432,248,689 |
| Corporate bonds and notes | 0 | 1,104,588,839 | 0 | 1,104,588,839 |
| Municipal obligations | 0 | 17,908,760 | 0 | 17,908,760 |
| Non-agency mortgage-backed securities | 0 | 231,976,211 | 0 | 231,976,211 |
| U.S. Treasury securities | 1,541,957,234 | 0 | 0 | 1,541,957,234 |
| Yankee corporate bonds and notes | 0 | 228,770,034 | 0 | 228,770,034 |
| Yankee government bonds | 0 | 41,151,756 | 0 | 41,151,756 |
| Short-term investments | | | | |
| Investment companies | 125,083,590 | 0 | 0 | 125,083,590 |
| Total assets | $1,667,040,824 | $3,508,719,715 | $0 | $5,175,760,539 |
Additional sector, industry or geographic detail, if any, is included in the Portfolio of Investments.
For the year ended May 31, 2022, the Portfolio did not have any transfers into/out of Level 3.
4. TRANSACTIONS WITH AFFILIATES
Advisory fee
The Trust has entered into an advisory contract with Allspring Funds Management, a wholly owned subsidiary of Allspring Global Investments Holdings, LLC, a holding company indirectly owned by certain private funds of GTCR LLC and Reverence Capital Partners, L.P. The adviser is responsible for implementing investment policies and guidelines and for supervising the subadviser, who is responsible for day-to-day portfolio management of the Portfolio. Pursuant to the contract, Allspring Funds Management is entitled to receive an advisory fee at the following annual rate based on the Portfolio’s average daily net assets:
Allspring Core Bond Portfolio | 59
Notes to financial statements
| Average daily net assets | Advisory fee |
| First $500 million | 0.400% |
| Next $500 million | 0.375 |
| Next $2 billion | 0.350 |
| Next $2 billion | 0.325 |
| Next $5 billion | 0.300 |
| Over $10 billion | 0.290 |
For the year ended May 31, 2022, the advisory fee was equivalent to an annual rate of 0.34% of the Portfolio’s average daily net assets.
Allspring Funds Management has retained the services of a subadviser to provide daily portfolio management to the Portfolio. The fee for subadvisory services is borne by Allspring Funds Management. Allspring Global Investments, LLC ("Allspring Investments"), an affiliate of Allspring Funds Management and a wholly owned subsidiary of Allspring Global Investments Holdings, LLC, is the subadviser to the Portfolio and is entitled to receive a fee from Allspring Funds Management at an annual rate starting at 0.20% and declining to 0.10% as the average daily net assets of the Portfolio increase.
Interfund transactions
The Portfolio may purchase or sell portfolio investment securities to certain affiliates pursuant to Rule 17a-7 under the 1940 Act and under procedures adopted by the Board of Trustees. The procedures have been designed to ensure that these interfund transactions, which do not incur broker commissions, are effected at current market prices.
5. INVESTMENT PORTFOLIO TRANSACTIONS
Purchases and sales of investments, excluding short-term securities, for the year ended May 31, 2022 were as follows:
| Purchases at cost | | Sales proceeds |
U.S.
government | Non-U.S.
government | | U.S.
government | Non-U.S.
government |
| $20,192,288,042 | $4,506,745,629 | | $20,677,052,388 | $3,939,855,025 |
6. SECURITIES LENDING TRANSACTIONS
The Portfolio lends its securities through an unaffiliated securities lending agent and receives collateral in the form of cash or securities with a value at least equal to the value of the securities on loan. The value of the loaned securities is determined at the close of each business day and any increases or decreases in the required collateral are exchanged between the Portfolio and the counterparty on the next business day. Cash collateral received is invested in the Securities Lending Fund which seeks to provide a positive return compared to the daily Federal Funds Open Rate by investing in high-quality, U.S. dollar-denominated short-term money market instruments and is exempt from registration under Section 3(c)(7) of the 1940 Act. Securities Lending Fund is managed by Allspring Funds Management and is subadvised by Allspring Investments. Allspring Funds Management receives an advisory fee starting at 0.05% and declining to 0.01% as the average daily net assets of the Securities Lending Fund increase. All of the fees received by Allspring Funds Management are paid to Allspring Investments for its services as subadviser.
In the event of counterparty default or the failure of a borrower to return a loaned security, the Portfolio has the right to use the collateral to offset any losses incurred. As of May 31, 2022, the Portfolio had securities lending transactions with the following counterparties which are subject to offset:
| Counterparty | Value of
securities on
loan | Collateral
received1 | Net amount |
| Nomura Securities International Incorporated | $10,033,647 | $(10,033,647) | $0 |
1 Collateral received within this table is limited to the collateral for the net transaction with the counterparty.
60 | Allspring Core Bond Portfolio
Notes to financial statements
7. BANK BORROWINGS
The Trust, along with Allspring Variable Trust and Allspring Funds Trust (excluding the money market funds), are parties to a $350,000,000 revolving credit agreement whereby the Portfolio is permitted to use bank borrowings for temporary or emergency purposes, such as to fund interest holders withdrawal requests. Interest under the credit agreement is charged to the Portfolio based on a borrowing rate equal to the higher of the Federal Funds rate in effect on that day plus 1.25% or the overnight bank funding rate in effect on that day plus 1.25%. In addition, an annual commitment fee equal to 0.25% of the unused balance is allocated to each participating fund.
For the year ended May 31, 2022, there were no borrowings by the Portfolio under the agreement.
8. INDEMNIFICATION
Under the Portfolio's organizational documents, the officers and Trustees have been granted certain indemnification rights against certain liabilities that may arise out of performance of their duties to the Portfolio. The Portfolio has entered into a separate agreement with each Trustee that converts indemnification rights currently existing under the Portfolio’s organizational documents into contractual rights that cannot be changed in the future without the consent of the Trustee. Additionally, in the normal course of business, the Portfolio may enter into contracts with service providers that contain a variety of indemnification clauses. The Portfolio’s maximum exposure under these arrangements is dependent on future claims that may be made against the Portfolio and, therefore, cannot be estimated.
9. CORONAVIRUS (COVID-19) PANDEMIC
On March 11, 2020, the World Health Organization announced that it had made the assessment that coronavirus disease 2019 (“COVID-19”) is a pandemic. The impacts of COVID-19 are affecting the entire global economy, individual companies and investment products, the funds, and the market in general. There is significant uncertainty around the extent and duration of business disruptions related to COVID-19 and the impacts may last for an extended period of time. COVID-19 has led to significant uncertainty and volatility in the financial markets.
Allspring Core Bond Portfolio | 61
Report of independent registered public accounting firm
To the Interest Holders of the Portfolio and Board of Trustees
Allspring Master Trust:
Opinion on the Financial Statements
We have audited the accompanying statement of assets and liabilities of Allspring Core Bond Portfolio (formerly, Wells Fargo Core Bond Portfolio) (the Portfolio), one of the portfolios constituting Allspring Master Trust (formerly, Wells Fargo Master Trust), including the portfolio of investments, as of May 31, 2022, the related statement of operations for the year then ended, the statements of changes in net assets for each of the years in the two-year period then ended, and the related notes (collectively, the financial statements) and the financial highlights for each of the years in the five-year period then ended. In our opinion, the financial statements and financial highlights present fairly, in all material respects, the financial position of the Portfolio as of May 31, 2022, the results of its operations for the year then ended, the changes in its net assets for each of the years in the two-year period then ended, and the financial highlights for each of the years in the five-year period then ended, in conformity with U.S. generally accepted accounting principles.
Basis for Opinion
These financial statements and financial highlights are the responsibility of the Portfolio’s management. Our responsibility is to express an opinion on these financial statements and financial highlights based on our audits. We are a public accounting firm registered with the Public Company Accounting Oversight Board (United States) (PCAOB) and are required to be independent with respect to the Portfolio in accordance with the U.S. federal securities laws and the applicable rules and regulations of the Securities and Exchange Commission and the PCAOB.
We conducted our audits in accordance with the standards of the PCAOB. Those standards require that we plan and perform the audit to obtain reasonable assurance about whether the financial statements and financial highlights are free of material misstatement, whether due to error or fraud. Our audits included performing procedures to assess the risks of material misstatement of the financial statements and financial highlights, whether due to error or fraud, and performing procedures that respond to those risks. Such procedures included examining, on a test basis, evidence regarding the amounts and disclosures in the financial statements and financial highlights. Such procedures also included confirmation of securities owned as of May 31, 2022, by correspondence with the custodian, transfer agent and brokers, or by other appropriate auditing procedures. Our audits also included evaluating the accounting principles used and significant estimates made by management, as well as evaluating the overall presentation of the financial statements and financial highlights. We believe that our audits provide a reasonable basis for our opinion.
We have not been able to determine the specific year that we began serving as the auditor of one or more Allspring Funds investment companies; however, we are aware that we have served as the auditor of one or more Allspring Funds investment companies since at least 1955.
Boston, Massachusetts
July 27, 2022
62 | Allspring Core Bond Portfolio
Other information (unaudited)
TAX INFORMATION
Pursuant to Section 852 of the Internal Revenue Code, $27,440,612 was designated as a 20% rate gain distribution for the fiscal year ended May 31, 2022.
For the fiscal year ended May 31, 2022, $57,755,373 has been designated as interest-related dividends for nonresident alien shareholders pursuant to Section 871 of the Internal Revenue Code.
For the fiscal year ended May 31, 2022, $18,218,719 has been designated as short-term capital gain dividends for nonresident alien shareholders pursuant to Section 871 of the Internal Revenue Code.
For the fiscal year ended May 31, 2022, 18% of the ordinary income distributed was derived from interest on U.S. government securities.
PROXY VOTING INFORMATION
A description of the policies and procedures used to determine how to vote proxies relating to portfolio securities is available without charge, upon request, by calling 1-800-222-8222, visiting our website at allspringglobal.com, or visiting the SEC website at sec.gov. Information regarding how the proxies related to portfolio securities were voted during the most recent 12-month period ended June 30 is available on the website at allspringglobal.com or by visiting the SEC website at sec.gov.
QUARTERLY PORTFOLIO HOLDINGS INFORMATION
The Fund and Portfolio file their complete schedule of portfolio holdings with the SEC for the first and third quarters of each fiscal year as an exhibit to their reports on Form N-PORT. Shareholders and Interest holders may view the filed Form N-PORT by visiting the SEC website at sec.gov.
Allspring Core Bond Fund | 63
Other information (unaudited)
BOARD OF TRUSTEES AND OFFICERS
Each of the Trustees and Officers listed in the table below acts in identical capacities for each fund in the Allspring family of funds, which consists of 137 mutual funds comprising the Allspring Funds Trust, Allspring Variable Trust, Allspring Master Trust and four closed-end funds (collectively the “Fund Complex”). This table should be read in conjunction with the Prospectus and the Statement of Additional Information1. The mailing address of each Trustee and Officer is 525 Market Street, 12th Floor, San Francisco, CA 94105. Each Trustee and Officer serves an indefinite term, however, each Trustee serves such term until reaching the mandatory retirement age established by the Trustees.
Independent Trustees
Name and
year of birth | Position held and
length of service* | Principal occupations during past five years or longer | Current other
public company or
investment
company
directorships |
William R. Ebsworth
(Born 1957) | Trustee,
since 2015 | Retired. From 1984 to 2013, equities analyst, portfolio manager, research director and chief investment officer at Fidelity Management and Research Company in Boston, Tokyo, and Hong Kong, and retired in 2013 as Chief Investment Officer of Fidelity Strategic Advisers, Inc. where he led a team of investment professionals managing client assets. Prior thereto, Board member of Hong Kong Securities Clearing Co., Hong Kong Options Clearing Corp., the Thailand International Fund, Ltd., Fidelity Investments Life Insurance Company, and Empire Fidelity Investments Life Insurance Company. Audit Committee Chair and Investment Committee Chair of the Vincent Memorial Hospital Endowment (non-profit organization). Mr. Ebsworth is a CFA® charterholder. | N/A |
Jane A. Freeman
(Born 1953) | Trustee,
since 2015;
Chair Liaison,
since 2018 | Retired. From 2012 to 2014 and 1999 to 2008, Chief Financial Officer of Scientific Learning Corporation. From 2008 to 2012, Ms. Freeman provided consulting services related to strategic business projects. Prior to 1999, Portfolio Manager at Rockefeller & Co. and Scudder, Stevens & Clark. Board member of the Harding Loevner Funds from 1996 to 2014, serving as both Lead Independent Director and chair of the Audit Committee. Board member of the Russell Exchange Traded Funds Trust from 2011 to 2012 and the chair of the Audit Committee. Ms. Freeman is also an inactive Chartered Financial Analyst. | N/A |
Isaiah Harris, Jr.
(Born 1952) | Trustee,
since 2009; Audit
Committee
Chair,
since 2019 | Retired. Chairman of the Board of CIGNA Corporation from 2009 to 2021, and Director from 2005 to 2008. From 2003 to 2011, Director of Deluxe Corporation. Prior thereto, President and CEO of BellSouth Advertising and Publishing Corp. from 2005 to 2007, President and CEO of BellSouth Enterprises from 2004 to 2005 and President of BellSouth Consumer Services from 2000 to 2003. Emeritus member of the Iowa State University Foundation Board of Governors. Emeritus Member of the Advisory Board of Iowa State University School of Business. Advisory Board Member, Palm Harbor Academy (private school). Advisory Board Member, Fellowship of Christian Athletes. Mr. Harris is a certified public accountant (inactive status). | N/A |
David F. Larcker
(Born 1950) | Trustee,
since 2009 | James Irvin Miller Professor of Accounting at the Graduate School of Business (Emeritus), Stanford University, Director of the Corporate Governance Research Initiative and Senior Faculty of The Rock Center for Corporate Governance since 2006. From 2005 to 2008, Professor of Accounting at the Graduate School of Business, Stanford University. Prior thereto, Ernst & Young Professor of Accounting at The Wharton School, University of Pennsylvania from 1985 to 2005. | N/A |
64 | Allspring Core Bond Fund
Other information (unaudited)
Name and
year of birth | Position held and
length of service* | Principal occupations during past five years or longer | Current other
public company or
investment
company
directorships |
Olivia S. Mitchell
(Born 1953) | Trustee,
since 2006;
Nominating and
Governance
Committee Chair,
since 2018 | International Foundation of Employee Benefit Plans Professor since 1993, Wharton School of the University of Pennsylvania. Director of Wharton’s Pension Research Council and Boettner Center on Pensions & Retirement Research, and Research Associate at the National Bureau of Economic Research. Previously taught at Cornell University from 1978 to 1993. | N/A |
Timothy J. Penny
(Born 1951) | Trustee,
since 1996;
Chair,
since 2018 | President and Chief Executive Officer of Southern Minnesota Initiative Foundation, a non-profit organization, since 2007. Member of the Board of Trustees of NorthStar Education Finance, Inc., a non-profit organization, since 2007. | N/A |
James G. Polisson
(Born 1959) | Trustee,
since 2018 | Retired. Chief Marketing Officer, Source (ETF) UK Services, Ltd, from 2015 to 2017. From 2012 to 2015, Principal of The Polisson Group, LLC, a management consulting, corporate advisory and principal investing company. Chief Executive Officer and Managing Director at Russell Investments, Global Exchange Traded Funds from 2010 to 2012. Managing Director of Barclays Global Investors from 1998 to 2010 and Global Chief Marketing Officer for iShares and Barclays Global Investors from 2000 to 2010. Trustee of the San Francisco Mechanics’ Institute, a non-profit organization, from 2013 to 2015. Board member of the Russell Exchange Traded Fund Trust from 2011 to 2012. Director of Barclays Global Investors Holdings Deutschland GmbH from 2006 to 2009. Mr. Polisson is an attorney and has a retired status with the Massachusetts and District of Columbia Bar Associations. | N/A |
Pamela Wheelock
(Born 1959) | Trustee,
since January
2020; previously
Trustee from
January 2018 to
July 2019 | Board member of the Destination Medical Center Economic Development Agency, Rochester, Minnesota since 2019. Interim President of the McKnight Foundation from January to September 2020. McKnight Foundation Consultant, November 2020 to February 2021. Acting Commissioner, Minnesota Department of Human Services, July 2019 through September 2019. Consultant (part-time), Minnesota Department of Human Services, October 2019 through December 2019. Chief Operating Officer, Twin Cities Habitat for Humanity from 2017 to 2019. Vice President of University Services, University of Minnesota from 2012 to 2016. Prior thereto, on the Board of Directors, Governance Committee and Finance Committee for the Minnesota Philanthropy Partners (Saint Paul Foundation) from 2012 to 2018, Interim Chief Executive Officer of Blue Cross Blue Shield of Minnesota from 2011 to 2012, Chairman of the Board from 2009 to 2012 and Board Director from 2003 to 2015. Vice President, Leadership and Community Engagement, Bush Foundation, Saint Paul, Minnesota (a private foundation) from 2009 to 2011. Executive Vice President and Chief Financial Officer, Minnesota Sports and Entertainment from 2004 to 2009 and Senior Vice President from 2002 to 2004. Executive Vice President of the Minnesota Wild Foundation from 2004 to 2008. Commissioner of Finance, State of Minnesota, from 1999 to 2002. Currently Board Chair of the Minnesota Wild Foundation since 2010. | N/A |
* Length of service dates reflect the Trustee’s commencement of service with the Trust’s predecessor entities, where applicable.
Allspring Core Bond Fund | 65
Other information (unaudited)
Officers2
Name and
year of birth | Position held and
length of service | Principal occupations during past five years or longer |
Andrew Owen
(Born 1960) | President,
since 2017 | President, Chief Executive Officer and Director of Allspring Funds Management, LLC since 2017 and co-president of Galliard Capital Management, LLC, an affiliate of Allspring Funds Management, LLC, since 2019. Prior thereto, Head of Affiliated Managers, Allspring Global Investments, from 2014 to 2019 and Executive Vice President responsible for marketing, investments and product development for Allspring Funds Management, LLC, from 2009 to 2014. In addition, Mr. Owen was an Executive Vice President of Wells Fargo & Company from 2014 to 2021. |
Jeremy DePalma
(Born 1974) | Treasurer,
since 2012
(for certain funds in
the Fund Complex);
since 2021 (for
the remaining funds in the
Fund Complex) | Senior Vice President of Allspring Funds Management, LLC since 2009. Senior Vice President of Evergreen Investment Management Company, LLC from 2008 to 2010 and head of the Fund Reporting and Control Team within Fund Administration from 2005 to 2010. |
Kate McKinley
(Born 1977) | Chief Legal Officer,
since 2021 | Chief Legal Officer of Allspring Global Investments since 2021. Prior thereto, held various roles at State Street Global Advisors beginning in 2010, including serving as Senior Vice President and General Counsel from 2019 to 2021, and Chief Operating Officer of the Institutional Client Group from 2016 - 2019. Prior to working at State Street Global Advisors served as Assistant General Counsel for Bank of America Corporation from 2005 to 2010 and as an Associate at WilmerHale from 2002 to 2005. |
Christopher Baker
(Born 1976) | Chief Compliance Officer, since 2022 | Global Chief Compliance Officer for Allspring Global Investments since 2022. Prior thereto, Chief Compliance Officer for State Street Global Advisors from 2018 to 2021. Senior Compliance Officer for the State Street divisions of Alternative Investment Solutions, Sector Solutions, and Global Marketing from 2015 to 2018. From 2010 to 2015 Vice President, Global Head of Investment and Marketing Compliance for State Street Global Advisors. |
Matthew Prasse
(Born 1983) | Secretary,
since 2021 | Senior Counsel of the Allspring Legal Department since 2021. Senior Counsel of the Wells Fargo Legal Department from 2018 to 2021. Previously, Counsel for Barings LLC from 2015 to 2018. Prior to joining Barings, Associate at Morgan, Lewis & Bockius LLP from 2008 to 2015. |
1 The Statement of Additional Information includes additional information about the Trustees and is available, without charge, upon request, by calling 1-800-222-8222 or by visiting the website at allspringglobal.com.
2 For those Officers with tenures at Allspring Global Investments and/or Allspring Funds Management, LLC that began prior to 2021, such tenures include years of service during which these businesses/entities were known as Wells Fargo Asset Management and Wells Fargo Funds Management, LLC, respectively.
66 | Allspring Core Bond Fund
Other information (unaudited)
LIQUIDITY RISK MANAGEMENT PROGRAM
In accordance with Rule 22e-4 under the Investment Company Act of 1940, as amended (the “Liquidity Rule”), Allspring Funds Trust (“Funds Trust”) has adopted and implemented a liquidity risk management program (the “Program”) on behalf of each of its series (other than the series that operate as money market funds), including the Fund, and Allspring Master Trust (“Master Trust” and together with Funds Trust, the “Trusts”) has adopted and implemented the Program on behalf of each of its series, including the Portfolio, which is reasonably designed to assess and manage the Fund's and the Portfolio’s liquidity risk. “Liquidity risk” is defined under the Liquidity Rule as the risk that the Fund or Portfolio is unable to meet redemption requests without significantly diluting remaining investors’ interests in the Fund or Portfolio. The Trusts’ Boards of Trustees (the “Boards”) previously approved the designation of Allspring Funds Management, LLC (“Allspring Funds Management”), the Fund's investment manager and the Portfolio’s investment adviser, to administer the Program, and Allspring Funds Management has established a Liquidity Risk Management Council (the "Council") composed of personnel from multiple departments within Allspring Funds Management and its affiliates to assist Allspring Funds Management in the administration of the Program.
The Program is comprised of various components designed to support the assessment and/or management of liquidity risk, including: (1) the periodic assessment (no less frequently than annually) of certain factors that influence the Fund's and the Portfolio’s liquidity risk; (2) the periodic classification (no less frequently than monthly) of the Fund's and the Portfolio’s investments into one of four liquidity categories that reflect an estimate of their liquidity under current market conditions; (3) a 15% limit on the acquisition of “illiquid investments” (as defined under the Liquidity Rule); (4) to the extent the Fund or the Portfolio does not invest primarily in “highly liquid investments” (as defined under the Liquidity Rule), the determination of a minimum percentage of the Fund's or Portfolio’s assets that generally will be invested in highly liquid investments (an “HLIM”); (5) if the Fund or the Portfolio has established an HLIM, the periodic review (no less frequently than annually) of the HLIM and the adoption of policies and procedures for responding to a shortfall of the Fund's or the Portfolio’s “highly liquid investments” below its HLIM; and (6) periodic reporting to the Boards.
At a meeting of the Boards held on May 24-25, 2022, the Boards received and reviewed a written report (the “Report”) from Allspring Funds Management that, among other things, addressed the operation of the Program and assessed its adequacy and effectiveness for the period from January 1, 2021 through December 31, 2021 (the “Reporting Period”). Other than extended foreign market holidays, no significant liquidity events impacting the Funds or the Portfolios were noted in the Report. In addition, other than corporate-related changes to the Program, there were no material changes to the Program during the Reporting Period.
Allspring Funds Management determined in the Report that the Program has been implemented and operates effectively to manage each Fund’s and Portfolio’s, including the Fund’s and the Portfolio’s, liquidity risk, and Allspring Funds Management continues to believe that the Program has been and continues to be adequately and effectively implemented to monitor and, as applicable, respond to the Fund’s and the Portfolio’s liquidity developments.
There can be no assurance that the Program will achieve its objectives under all circumstances in the future. With respect to the Fund, please refer to the Fund’s prospectus for more information regarding the Fund’s exposure to liquidity risk and other risks to which an investment in the Fund may be subject.
Allspring Core Bond Fund | 67
For more information
More information about Allspring Funds is available free upon request. To obtain literature, please write, visit the Fund's website, or call:
Allspring Funds
P.O. Box 219967
Kansas City, MO 64121-9967
Website: allspringglobal.com
Individual investors: 1-800-222-8222
Retail investment professionals: 1-888-877-9275
Institutional investment professionals: 1-800-260-5969
This report and the financial statements contained herein are submitted for the general information of the shareholders of the Fund. If this report is used for promotional purposes, distribution of the report must be accompanied or preceded by a current prospectus. Before investing, please consider the investment objectives, risks, charges, and expenses of the investment. For a current prospectus and, if available, a summary prospectus, containing this information, call
1-800-222-8222 or visit the Fund's website at allspringglobal.com. Read the prospectus carefully before you invest or send money.
Allspring Global InvestmentsTM is the trade name for the asset management firms of Allspring Global Investments Holdings, LLC, a holding company indirectly owned by certain private funds of GTCR LLC and Reverence Capital Partners, L.P. These firms include but are not limited to Allspring Global Investments, LLC, and Allspring Funds Management, LLC. Certain products managed by Allspring entities are distributed by Allspring Funds Distributor, LLC (a broker-dealer and Member FINRA/SIPC).
This material is for general informational and educational purposes only and is NOT intended to provide investment advice or a recommendation of any kind - including a recommendation for any specific investment, strategy, or plan.
© 2022 Allspring Global Investments Holdings, LLC. All rights reserved.
PAR-0622-00235 07-22
A287/AR287 05-22
(a) As of the end of the period covered by the report, Allspring Master Trust has adopted a code of ethics that applies to its President and Treasurer. A copy of the code of ethics is filed as an exhibit to this Form N-CSR.
(c) During the period covered by this report, there were no amendments to the provisions of the code of ethics adopted in Item 2(a) above.
(d) During the period covered by this report, there were no implicit or explicit waivers to the provisions of the code of ethics adopted in Item 2(a) above.
| ITEM 3. | AUDIT COMMITTEE FINANCIAL EXPERT |
The Board of Trustees of Allspring Master Trust has determined that Isaiah Harris is an audit committee financial expert, as defined in Item 3 of Form N-CSR. Mr. Harris is independent for purposes of Item 3 of Form N-CSR.
| ITEM 4. | PRINCIPAL ACCOUNTANT FEES AND SERVICES |
(a), (b), (c), (d) The following table presents aggregate fees billed in each of the last two fiscal years for services rendered to the Registrant by the Registrant’s principal accountant. These fees were billed to the registrant and were approved by the Registrant’s audit committee.
| | | | | | | | |
| | | Fiscal | | | Fiscal | |
| | | year
ended | | | year
ended | |
| | | May 31,
2022 | | | May 31,
2021 | |
Audit fees | | $ | 476,740 | | | $ | 470,020 | |
Audit-related fees | | | — | | | | — | |
Tax fees (1) | | | 88,590 | | | | 87,490 | |
All other fees | | | — | | | | — | |
| | | | | | | | |
| | $ | 565,330 | | | $ | 557,510 | |
| | | | | | | | |
(1) Tax fees consist of fees for tax compliance, tax advice, tax planning and excise tax.
(e) The Chair of the Audit Committees is authorized to pre-approve: (1) audit services for the mutual funds of Allspring Master Trust; (2) non-audit tax or compliance consulting or training services provided to the Funds by the independent auditors (“Auditors”) if the fees for any particular engagement are not anticipated to exceed $50,000; and (3) non-audit tax or compliance consulting or training services provided by the Auditors to a Fund’s investment adviser and its controlling entities (where pre-approval is required because the engagement relates directly to the operations and financial reporting of the Fund) if the fee to the Auditors for any particular engagement is not anticipated to exceed $50,000. For any such pre-approval sought from the Chair, Management shall prepare a brief description of the proposed services. If the Chair approves of such service, he or she shall sign the statement prepared by Management. Such written statement shall be presented to the full Committees at their next regularly scheduled meetings.
(f) Not applicable
(g) Not applicable
(h) Not applicable
| ITEM 5. | AUDIT COMMITTEE OF LISTED REGISTRANTS |
Not applicable.
A Portfolio of Investments for each series of Allspring Master Trust is included as part of the report to shareholders filed under Item 1 of this Form.
| ITEM 7. | DISCLOSURE OF PROXY VOTING POLICIES AND PROCEDURES FOR CLOSED-END MANAGEMENT INVESTMENT COMPANIES |
Not applicable.
| ITEM 8. | PORTFOLIO MANAGERS OF CLOSED-END MANAGEMENT INVESTMENT COMPANIES |
Not applicable.
| ITEM 9. | PURCHASES OF EQUITY SECURITIES BY CLOSED-END MANAGEMENT INVESTMENT COMPANY AND AFFILIATED PURCHASERS |
Not applicable.
| ITEM 10. | SUBMISSION OF MATTERS TO A VOTE OF SECURITY HOLDERS |
There have been no material changes to the procedures by which shareholders may recommend nominees to the registrant’s Board of Trustees that have been implemented since the registrant’s last provided disclosure in response to the requirements of this Item.
| ITEM 11. | CONTROLS AND PROCEDURES |
(a) The President and Treasurer have concluded that the Allspring Master Trust disclosure controls and procedures (as defined in Rule 30a-3(c) under the Investment Company Act of 1940) provide reasonable assurances that material information relating to the registrant is made known to them by the appropriate persons based on their evaluation of these controls and procedures as of a date within 90 days of the filing of this report.
(b) There were no significant changes in the registrant’s internal controls over financial reporting (as defined in Rule 30a-3(d) under the Investment Company Act of 1940) that occurred during the most recent fiscal half-year of the period covered by this report that materially affected, or is reasonably likely to materially affect, the registrant’s internal control over financial reporting.
| ITEM 12. | DISCLOSURES OF SECURITIES LENDING ACTIVITES FOR CLOSED-END MANAGEMENT INVESTMENT COMPANIES |
Not applicable.
(a)(1) Code of Ethics.
(a)(2) Certifications pursuant to Section 302 of the Sarbanes-Oxley Act of 2002.
(b) Certifications pursuant to Section 906 of the Sarbanes-Oxley Act of 2002.
SIGNATURES
Pursuant to the requirements of the Securities Exchange Act of 1934 and the Investment Company Act of 1940, the registrant has duly caused this report to be signed on its behalf by the undersigned, thereunto duly authorized.
| | |
Allspring Master Trust |
| |
By: | | /s/ Andrew Owen |
| | Andrew Owen |
| | President |
|
Date: July 27, 2022 |
Pursuant to the requirements of the Securities Exchange Act of 1934 and the Investment Company Act of 1940, this report has been signed below by the following persons on behalf of the registrant and in the capacities and on the date indicated.
| | |
Allspring Master Trust |
| |
By: | | /s/ Andrew Owen |
| | Andrew Owen |
| | President |
|
Date: July 27, 2022 |
| |
By: | | /s/ Jeremy DePalma |
| | Jeremy DePalma |
| | Treasurer |
|
Date: July 27, 2022 |