
UNITED STATES
SECURITIES AND EXCHANGE COMMISSION
Washington, D.C. 20549
FORM N-CSR
CERTIFIED SHAREHOLDER REPORT OF REGISTERED
MANAGEMENT INVESTMENT COMPANIES
Investment Company Act file number: 811-09689
Allspring Master Trust
(Exact name of registrant as specified in charter)
1415 Vantage Park Drive, 3rd Floor, Charlotte, NC 28203
(Address of principal executive offices) (Zip code)
Matthew Prasse
Allspring Funds Management, LLC
1415 Vantage Park Drive, 3rd Floor, Charlotte, NC 28203
(Name and address of agent for service)
Registrant’s telephone number, including area code: 800-222-8222
Date of fiscal year end: May 31
Registrant is making a filing for 11 of its series: Allspring C&B Large Cap Value Portfolio, Allspring Core Bond Portfolio, Allspring Disciplined International Developed Markets Portfolio, Allspring Diversified Large Cap Growth Portfolio, Allspring Disciplined Large Cap Portfolio, Allspring Emerging Growth Portfolio, Allspring Large Company Value Portfolio, Allspring Managed Fixed Income Portfolio, Allspring Real Return Portfolio, Allspring Small Company Growth Portfolio, and Allspring Small Company Value Portfolio.
Date of reporting period: May 31, 2023
ITEM 1. REPORT TO STOCKHOLDERS
2 | |
6 | |
10 | |
11 | |
12 | |
13 | |
14 | |
15 | |
20 | |
24 | |
25 | |
29 | |
30 | |
31 | |
32 | |
33 | |
36 | |
37 |

Allspring Funds

President
Allspring Funds
Notice to Shareholders |
Beginning in July 2024, the Fund will be required by the Securities and Exchange Commission to send shareholders a paper copy of a new tailored shareholder report in place of the full shareholder report that you are now receiving. The tailored shareholder report will contain concise information about the Fund, including certain expense and performance information and fund statistics. If you wish to receive this new tailored shareholder report electronically, please follow the instructions on the back cover of this report. |
Other information that is currently included in the shareholder report, such as the Fund’s financial statements, will be available online and upon request, free of charge, in paper or electronic format. |
Investment objective | The Fund seeks maximum long-term total return (current income and capital appreciation), consistent with minimizing risk to principal. |
Manager | Allspring Funds Management, LLC |
Subadviser for the affiliated master portfolio* | Cooke & Bieler, L.P. |
Portfolio managers | Andrew B. Armstrong, CFA, Wesley Lim, CFA, Steve Lyons, CFA, Michael M. Meyer, CFA, Edward W. O’ Connor, CFA, R.James O’Neil, CFA, Mehul Trivedi, CFA, William Weber, CFA |
Average annual total returns (%) as of May 31, 2023 | |||||||||
Including sales charge | Excluding sales charge | Expense ratios1 (%) | |||||||
Inception date | 1 year | 5 year | 10 year | 1 year | 5 year | 10 year | Gross | Net2 | |
Class A (CBEAX) | 7-26-2004 | -9.67 | 6.43 | 8.27 | -4.19 | 7.70 | 8.92 | 1.18 | 1.07 |
Class C (CBECX) | 7-26-2004 | -5.85 | 6.89 | 8.27 | -4.85 | 6.89 | 8.27 | 1.93 | 1.82 |
Class R6 (CBEJX)3 | 10-31-2016 | – | – | – | -3.75 | 8.16 | 9.34 | 0.76 | 0.65 |
Administrator Class (CBLLX) | 7-26-2004 | – | – | – | -4.18 | 7.77 | 9.04 | 1.11 | 1.00 |
Institutional Class (CBLSX) | 7-26-2004 | – | – | – | -3.92 | 8.03 | 9.30 | 0.86 | 0.75 |
Russell 1000® Value Index4 | – | – | – | – | -4.55 | 6.78 | 8.42 | – | – |
1 | Reflects the expense ratios as stated in the most recent prospectuses. The expense ratios shown are subject to change and may differ from the annualized expense ratios shown in the financial highlights of this report. |
2 | The manager has contractually committed through September 30, 2023 (September 30, 2024 for Class A and Class C), to waive fees and/or reimburse expenses to the extent necessary to cap total annual fund operating expenses after fee waivers at 1.07% for Class A, 1.82% for Class C, 0.65% for Class R6, 1.00% for Administrator Class and 0.75% for Institutional Class. Brokerage commissions, stamp duty fees, interest, taxes, acquired fund fees and expenses (if any) from funds in which the affiliated master portfolio invests, and extraordinary expenses are excluded from the expense caps. Net expenses from the affiliated master portfolio are included in the expense caps. Prior to or after the commitment expiration date, the caps may be increased or the commitment to maintain the caps may be terminated only with the approval of the Board of Trustees. Without these caps, the Fund’s returns would have been lower. The expense ratio paid by an investor is the net expense ratio (the total annual fund operating expenses after fee waivers) as stated in the prospectuses. |
3 | Historical performance shown for the Class R6 shares prior to their inception reflects the performance of the Institutional Class shares, and includes the higher expenses applicable to the Institutional Class shares. If these expenses had not been included, returns for the Class R6 shares would be higher. |
4 | The Russell 1000® Value Index measures the performance of those Russell 1000 companies with lower price/book ratios and lower forecasted growth values. You cannot invest directly in an index. |
* | The Fund is a feeder fund in a master-feeder structure that invests substantially all of its assets in a single affiliated master portfolio of the Allspring Master Trust with a substantially identical investment objective and substantially similar investment strategies. References to the investment activities of the Fund are intended to refer to the investment activities of the affiliated master portfolio in which it invests. |
CFA® and Chartered Financial Analyst® are trademarks owned by CFA Institute. | |
Growth of $10,000 investment as of May 31, 20231 |

1 | The chart compares the performance of Class A shares for the most recent ten years with the Russell 1000® Value Index. The chart assumes a hypothetical investment of $10,000 in Class A shares and reflects all operating expenses and assumes the maximum initial sales charge of 5.75%. |
Ten largest holdings (%) as of May 31, 20231 | |
Brookfield Corp. Class A | 3.35 |
Arrow Electronics, Inc. | 3.21 |
AerCap Holdings NV | 3.17 |
Open Text Corp. | 3.12 |
TE Connectivity Ltd. | 2.86 |
State Street Corp. | 2.77 |
Medtronic PLC | 2.72 |
Omnicom Group, Inc. | 2.69 |
London Stock Exchange Group PLC | 2.68 |
Johnson & Johnson | 2.60 |
1 | Each holding represents the Fund’s allocable portion of the affiliated master portfolio security. Figures represent each holding as a percentage of the Fund’s net assets. Holdings are subject to change and may have changed since the date specified. |
Sector allocation as of May 31, 20231 |

1 | Figures represent the sector allocation of the affiliated master portfolio as a percentage of the long-term investments of the affiliated master portfolio. These amounts are subject to change and may have changed since the date specified. |
Beginning account value 12-1-2022 | Ending account value 5-31-2023 | Expenses paid during the period1, 2 | Annualized net expense ratio2 | |
Class A | ||||
Actual | $1,000.00 | $999.62 | $5.38 | 1.08 % |
Hypothetical (5% return before expenses) | $1,000.00 | $1,019.55 | $5.44 | 1.08 % |
Class C | ||||
Actual | $1,000.00 | $999.59 | $9.12 | 1.83 % |
Hypothetical (5% return before expenses) | $1,000.00 | $1,015.81 | $9.20 | 1.83 % |
Class R6 | ||||
Actual | $1,000.00 | $999.64 | $3.24 | 0.65 % |
Hypothetical (5% return before expenses) | $1,000.00 | $1,021.69 | $3.28 | 0.65 % |
Administrator Class | ||||
Actual | $1,000.00 | $999.62 | $4.99 | 1.00 % |
Hypothetical (5% return before expenses) | $1,000.00 | $1,019.95 | $5.04 | 1.00 % |
Institutional Class | ||||
Actual | $1,000.00 | $999.63 | $3.74 | 0.75 % |
Hypothetical (5% return before expenses) | $1,000.00 | $1,021.19 | $3.78 | 0.75 % |
Value | ||||||
Investment companies: 99.94% | ||||||
Affiliated master portfolio: 99.94% | ||||||
Allspring C&B Large Cap Value Portfolio | $199,030,307 | |||||
Total investment companies (Cost $173,821,522) | 199,030,307 | |||||
Total investments in securities (Cost $173,821,522) | 99.94 % | 199,030,307 | ||||
Other assets and liabilities, net | 0.06 | 119,203 | ||||
Total net assets | 100.00 % | $199,149,510 | ||||
% of ownership, beginning of period | % of ownership, end of period | Net realized gains (losses) on investments allocated from affiliated Master Portfolio | Net change in unrealized gains (losses) on investments allocated from affiliated Master Portfolio | Dividends allocated from affiliated Master Portfolio | Interest allocated from affiliated Master Portfolio | Affiliated Income Allocated from affiliated Master Portfolio | Value, end of period | |
Allspring C&B Large Cap Value Portfolio | 79.89 % | 78.60 % | $19,848,834 | $(33,458,109 ) | $4,755,544 | $201 | $148,872 | $199,030,307 |
Assets | |
Investments in affiliated Master Portfolio, at value (cost $173,821,522) | $199,030,307 |
Receivable for Fund shares sold | 182,695 |
Receivable from manager | 25,062 |
Prepaid expenses and other assets | 81,799 |
Total assets | 199,319,863 |
Liabilities | |
Payable for Fund shares redeemed | 102,030 |
Administration fees payable | 26,895 |
Shareholder servicing fees payable | 18,575 |
Distribution fee payable | 2,359 |
Trustees’ fees and expenses payable | 504 |
Accrued expenses and other liabilities | 19,990 |
Total liabilities | 170,353 |
Total net assets | $199,149,510 |
Net assets consist of | |
Paid-in capital | $164,340,365 |
Total distributable earnings | 34,809,145 |
Total net assets | $199,149,510 |
Computation of net asset value and offering price per share | |
Net assets–Class A | $77,198,227 |
Shares outstanding–Class A1 | 6,703,862 |
Net asset value per share–Class A | $11.52 |
Maximum offering price per share – Class A2 | $12.22 |
Net assets–Class C | $3,471,192 |
Shares outstanding–Class C1 | 306,763 |
Net asset value per share–Class C | $11.32 |
Net assets–Class R6 | $15,504,522 |
Shares outstanding–Class R61 | 1,338,256 |
Net asset value per share–Class R6 | $11.59 |
Net assets–Administrator Class | $4,292,230 |
Shares outstanding–Administrator Class1 | 371,511 |
Net asset value per share–Administrator Class | $11.55 |
Net assets–Institutional Class | $98,683,339 |
Shares outstanding–Institutional Class1 | 8,513,433 |
Net asset value per share–Institutional Class | $11.59 |
1 | The Fund has an unlimited number of authorized shares. |
2 | Maximum offering price is computed as 100/94.25 of net asset value. On investments of $50,000 or more, the offering price is reduced. |
Investment income | |
Dividends allocated from affiliated Master Portfolio (net of foreign withholding taxes of $107,495) | $4,755,544 |
Affiliated income allocated from affiliated Master Portfolio | 148,872 |
Interest allocated from affiliated Master Portfolio | 201 |
Expenses allocated from affiliated Master Portfolio | (1,571,119 ) |
Waivers allocated from affiliated Master Portfolio | 145,978 |
Total investment income | 3,479,476 |
Expenses | |
Management fee | 111,328 |
Administration fees | |
Class A | 178,189 |
Class C | 8,343 |
Class R6 | 5,862 |
Administrator Class | 6,606 |
Institutional Class | 141,971 |
Shareholder servicing fees | |
Class A | 212,130 |
Class C | 9,930 |
Administrator Class | 12,703 |
Distribution fee | |
Class C | 29,772 |
Custody and accounting fees | 7,535 |
Professional fees | 45,318 |
Registration fees | 36,664 |
Shareholder report expenses | 30,584 |
Trustees’ fees and expenses | 21,908 |
Other fees and expenses | 4,517 |
Total expenses | 863,360 |
Less: Fee waivers and/or expense reimbursements | |
Fund-level | (290,386 ) |
Class A | (8,079 ) |
Class C | (226 ) |
Administrator Class | (484 ) |
Institutional Class | (6,438 ) |
Net expenses | 557,747 |
Net investment income | 2,921,729 |
Realized and unrealized gains (losses) on investments | |
Net realized gains on investments allocated from affiliated Master Portfolio | 19,848,834 |
Net change in unrealized gains (losses) on investments allocated from affiliated Master Portfolio | (33,458,109 ) |
Net realized and unrealized gains (losses) on investments | (13,609,275 ) |
Net decrease in net assets resulting from operations | $(10,687,546 ) |
Year ended May 31, 2023 | Year ended May 31, 2022 | |||
Operations | ||||
Net investment income | $2,921,729 | $2,669,791 | ||
Net realized gains on investments | 19,848,834 | 47,346,569 | ||
Net change in unrealized gains (losses) on investments | (33,458,109 ) | (53,785,190 ) | ||
Net decrease in net assets resulting from operations | (10,687,546 ) | (3,768,830 ) | ||
Distributions to shareholders from | ||||
Net investment income and net realized gains | ||||
Class A | (16,304,617 ) | (12,919,436 ) | ||
Class C | (740,826 ) | (535,250 ) | ||
Class R6 | (3,797,016 ) | (6,057,662 ) | ||
Administrator Class | (1,047,406 ) | (841,849 ) | ||
Institutional Class | (21,328,025 ) | (17,599,026 ) | ||
Total distributions to shareholders | (43,217,890 ) | (37,953,223 ) | ||
Capital share transactions | Shares | Shares | ||
Proceeds from shares sold | ||||
Class A | 415,820 | 5,265,311 | 989,891 | 15,969,277 |
Class C | 96,897 | 1,168,445 | 43,159 | 682,181 |
Class R6 | 123,974 | 1,716,518 | 349,706 | 5,728,171 |
Administrator Class | 3,961 | 50,313 | 55,766 | 954,376 |
Institutional Class | 1,322,276 | 17,070,664 | 1,764,097 | 28,100,206 |
25,271,251 | 51,434,211 | |||
Reinvestment of distributions | ||||
Class A | 1,348,065 | 16,067,784 | 845,770 | 12,689,368 |
Class C | 63,426 | 740,826 | 36,313 | 535,250 |
Class R6 | 148,681 | 1,785,702 | 80,021 | 1,208,696 |
Administrator Class | 53,517 | 639,939 | 34,924 | 525,330 |
Institutional Class | 1,765,170 | 21,195,384 | 1,158,450 | 17,489,868 |
40,429,635 | 32,448,512 | |||
Payment for shares redeemed | ||||
Class A | (1,910,541 ) | (24,861,078 ) | (946,956 ) | (15,053,324 ) |
Class C | (134,315 ) | (1,653,300 ) | (76,840 ) | (1,207,888 ) |
Class R6 | (510,778 ) | (6,892,525 ) | (1,596,640 ) | (24,419,329 ) |
Administrator Class | (89,944 ) | (1,125,103 ) | (34,305 ) | (524,769 ) |
Institutional Class | (3,362,511 ) | (44,116,398 ) | (3,201,272 ) | (51,615,218 ) |
(78,648,404 ) | (92,820,528 ) | |||
Net decrease in net assets resulting from capital share transactions | (12,947,518 ) | (8,937,805 ) | ||
Total decrease in net assets | (66,852,954 ) | (50,659,858 ) | ||
Net assets | ||||
Beginning of period | 266,002,464 | 316,662,322 | ||
End of period | $199,149,510 | $266,002,464 | ||
(For a share outstanding throughout each period)
Year ended May 31 | |||||
Class A | 2023 | 2022 | 2021 | 2020 | 2019 |
Net asset value, beginning of period | $14.82 | $17.16 | $11.49 | $13.01 | $13.91 |
Net investment income | 0.15 1 | 0.11 | 0.10 | 0.12 | 0.11 |
Net realized and unrealized gains (losses) on investments | (0.71 ) | (0.34 ) | 6.29 | (0.33 ) | 0.02 |
Total from investment operations | (0.56 ) | (0.23 ) | 6.39 | (0.21 ) | 0.13 |
Distributions to shareholders from | |||||
Net investment income | (0.14 ) | (0.11 ) | (0.11 ) | (0.13 ) | (0.12 ) |
Net realized gains | (2.60 ) | (2.00 ) | (0.61 ) | (1.18 ) | (0.91 ) |
Total distributions to shareholders | (2.74 ) | (2.11 ) | (0.72 ) | (1.31 ) | (1.03 ) |
Net asset value, end of period | $11.52 | $14.82 | $17.16 | $11.49 | $13.01 |
Total return2 | (4.19 )% | (1.37 )% | 56.98 % | (3.61 )% | 1.33 % |
Ratios to average net assets (annualized)* | |||||
Gross expenses | 1.22 % | 1.19 % | 1.24 % | 1.27 % | 1.23 % |
Net expenses | 1.08 % | 1.07 % | 1.07 % | 1.07 % | 1.08 % |
Net investment income | 1.13 % | 0.69 % | 0.73 % | 0.92 % | 0.83 % |
Supplemental data | |||||
Portfolio turnover rate3 | 29 % | 32 % | 38 % | 33 % | 47 % |
Net assets, end of period (000s omitted) | $77,198 | $101,496 | $102,332 | $70,680 | $79,172 |
* | Ratios include net expenses allocated from the affiliated Master Portfolio which were as follows: |
Year ended May 31, 2023 | 0.64% |
Year ended May 31, 2022 | 0.64% |
Year ended May 31, 2021 | 0.64% |
Year ended May 31, 2020 | 0.64% |
Year ended May 31, 2019 | 0.65% |
1 | Calculated based upon average shares outstanding |
2 | Total return calculations do not include any sales charges. |
3 | Portfolio turnover rate is calculated by multiplying the affiliated Master Portfolio’s percentage of the Fund’s total investment in securities at the end of the period by the affiliated Master Portfolio’s portfolio turnover rate. |
(For a share outstanding throughout each period)
Year ended May 31 | |||||
Class C | 2023 | 2022 | 2021 | 2020 | 2019 |
Net asset value, beginning of period | $14.61 | $16.97 | $11.36 | $12.87 | $13.75 |
Net investment income (loss) | 0.05 1 | (0.01 ) | (0.03 ) | 0.02 1 | 0.01 1 |
Net realized and unrealized gains (losses) on investments | (0.69 ) | (0.35 ) | 6.25 | (0.35 ) | 0.03 |
Total from investment operations | (0.64 ) | (0.36 ) | 6.22 | (0.33 ) | 0.04 |
Distributions to shareholders from | |||||
Net investment income | (0.05 ) | 0.00 | 0.00 | 0.00 | (0.01 ) |
Net realized gains | (2.60 ) | (2.00 ) | (0.61 ) | (1.18 ) | (0.91 ) |
Total distributions to shareholders | (2.65 ) | (2.00 ) | (0.61 ) | (1.18 ) | (0.92 ) |
Net asset value, end of period | $11.32 | $14.61 | $16.97 | $11.36 | $12.87 |
Total return2 | (4.85 )% | (2.22 )% | 55.94 % | (4.41 )% | 0.61 % |
Ratios to average net assets (annualized)* | |||||
Gross expenses | 1.97 % | 1.94 % | 1.99 % | 2.02 % | 1.97 % |
Net expenses | 1.83 % | 1.83 % | 1.83 % | 1.83 % | 1.83 % |
Net investment income (loss) | 0.36 % | (0.08 )% | (0.04 )% | 0.16 % | 0.07 % |
Supplemental data | |||||
Portfolio turnover rate3 | 29 % | 32 % | 38 % | 33 % | 47 % |
Net assets, end of period (000s omitted) | $3,471 | $4,103 | $4,719 | $3,576 | $5,098 |
* | Ratios include net expenses allocated from the affiliated Master Portfolio which were as follows: |
Year ended May 31, 2023 | 0.64% |
Year ended May 31, 2022 | 0.64% |
Year ended May 31, 2021 | 0.64% |
Year ended May 31, 2020 | 0.64% |
Year ended May 31, 2019 | 0.65% |
1 | Calculated based upon average shares outstanding |
2 | Total return calculations do not include any sales charges. |
3 | Portfolio turnover rate is calculated by multiplying the affiliated Master Portfolio’s percentage of the Fund’s total investment in securities at the end of the period by the affiliated Master Portfolio’s portfolio turnover rate. |
(For a share outstanding throughout each period)
Year ended May 31 | |||||
Class R6 | 2023 | 2022 | 2021 | 2020 | 2019 |
Net asset value, beginning of period | $14.90 | $17.24 | $11.53 | $13.06 | $13.97 |
Net investment income | 0.20 1 | 0.18 1 | 0.16 1 | 0.18 1 | 0.18 1 |
Net realized and unrealized gains (losses) on investments | (0.70 ) | (0.34 ) | 6.32 | (0.33 ) | 0.00 2 |
Total from investment operations | (0.50 ) | (0.16 ) | 6.48 | (0.15 ) | 0.18 |
Distributions to shareholders from | |||||
Net investment income | (0.21 ) | (0.18 ) | (0.16 ) | (0.20 ) | (0.18 ) |
Net realized gains | (2.60 ) | (2.00 ) | (0.61 ) | (1.18 ) | (0.91 ) |
Total distributions to shareholders | (2.81 ) | (2.18 ) | (0.77 ) | (1.38 ) | (1.09 ) |
Net asset value, end of period | $11.59 | $14.90 | $17.24 | $11.53 | $13.06 |
Total return | (3.75 )% | (0.98 )% | 57.75 % | (3.25 )% | 1.74 % |
Ratios to average net assets (annualized)* | |||||
Gross expenses | 0.78 % | 0.76 % | 0.82 % | 0.84 % | 0.79 % |
Net expenses | 0.65 % | 0.65 % | 0.65 % | 0.65 % | 0.65 % |
Net investment income | 1.55 % | 1.11 % | 1.14 % | 1.33 % | 1.27 % |
Supplemental data | |||||
Portfolio turnover rate3 | 29 % | 32 % | 38 % | 33 % | 47 % |
Net assets, end of period (000s omitted) | $15,505 | $23,487 | $47,301 | $37,859 | $68,366 |
* | Ratios include net expenses allocated from the affiliated Master Portfolio which were as follows: |
Year ended May 31, 2023 | 0.64% |
Year ended May 31, 2022 | 0.64% |
Year ended May 31, 2021 | 0.64% |
Year ended May 31, 2020 | 0.64% |
Year ended May 31, 2019 | 0.65% |
1 | Calculated based upon average shares outstanding |
2 | Amount is less than $0.005. |
3 | Portfolio turnover rate is calculated by multiplying the affiliated Master Portfolio’s percentage of the Fund’s total investment in securities at the end of the period by the affiliated Master Portfolio’s portfolio turnover rate. |
(For a share outstanding throughout each period)
Year ended May 31 | |||||
Administrator Class | 2023 | 2022 | 2021 | 2020 | 2019 |
Net asset value, beginning of period | $14.86 | $17.20 | $11.51 | $13.03 | $13.92 |
Net investment income | 0.16 1 | 0.12 1 | 0.11 1 | 0.13 1 | 0.12 1 |
Net realized and unrealized gains (losses) on investments | (0.72 ) | (0.33 ) | 6.30 | (0.33 ) | 0.02 |
Total from investment operations | (0.56 ) | (0.21 ) | 6.41 | (0.20 ) | 0.14 |
Distributions to shareholders from | |||||
Net investment income | (0.15 ) | (0.13 ) | (0.11 ) | (0.14 ) | (0.12 ) |
Net realized gains | (2.60 ) | (2.00 ) | (0.61 ) | (1.18 ) | (0.91 ) |
Total distributions to shareholders | (2.75 ) | (2.13 ) | (0.72 ) | (1.32 ) | (1.03 ) |
Net asset value, end of period | $11.55 | $14.86 | $17.20 | $11.51 | $13.03 |
Total return | (4.18 )% | (1.29 )% | 57.12 % | (3.56 )% | 1.44 % |
Ratios to average net assets (annualized)* | |||||
Gross expenses | 1.14 % | 1.11 % | 1.17 % | 1.19 % | 1.15 % |
Net expenses | 1.00 % | 0.99 % | 0.99 % | 0.99 % | 1.00 % |
Net investment income | 1.21 % | 0.76 % | 0.81 % | 1.00 % | 0.90 % |
Supplemental data | |||||
Portfolio turnover rate2 | 29 % | 32 % | 38 % | 33 % | 47 % |
Net assets, end of period (000s omitted) | $4,292 | $6,001 | $5,980 | $6,167 | $9,274 |
* | Ratios include net expenses allocated from the affiliated Master Portfolio which were as follows: |
Year ended May 31, 2023 | 0.64% |
Year ended May 31, 2022 | 0.64% |
Year ended May 31, 2021 | 0.64% |
Year ended May 31, 2020 | 0.64% |
Year ended May 31, 2019 | 0.65% |
1 | Calculated based upon average shares outstanding |
2 | Portfolio turnover rate is calculated by multiplying the affiliated Master Portfolio’s percentage of the Fund’s total investment in securities at the end of the period by the affiliated Master Portfolio’s portfolio turnover rate. |
(For a share outstanding throughout each period)
Year ended May 31 | |||||
Institutional Class | 2023 | 2022 | 2021 | 2020 | 2019 |
Net asset value, beginning of period | $14.90 | $17.24 | $11.53 | $13.05 | $13.96 |
Net investment income | 0.19 1 | 0.16 | 0.15 | 0.16 | 0.14 |
Net realized and unrealized gains (losses) on investments | (0.71 ) | (0.34 ) | 6.32 | (0.33 ) | 0.02 |
Total from investment operations | (0.52 ) | (0.18 ) | 6.47 | (0.17 ) | 0.16 |
Distributions to shareholders from | |||||
Net investment income | (0.19 ) | (0.16 ) | (0.15 ) | (0.17 ) | (0.16 ) |
Net realized gains | (2.60 ) | (2.00 ) | (0.61 ) | (1.18 ) | (0.91 ) |
Total distributions to shareholders | (2.79 ) | (2.16 ) | (0.76 ) | (1.35 ) | (1.07 ) |
Net asset value, end of period | $11.59 | $14.90 | $17.24 | $11.53 | $13.05 |
Total return | (3.92 )% | (1.08 )% | 57.58 % | (3.33 )% | 1.64 % |
Ratios to average net assets (annualized)* | |||||
Gross expenses | 0.89 % | 0.86 % | 0.91 % | 0.94 % | 0.90 % |
Net expenses | 0.75 % | 0.75 % | 0.75 % | 0.75 % | 0.75 % |
Net investment income | 1.45 % | 1.01 % | 1.05 % | 1.25 % | 1.17 % |
Supplemental data | |||||
Portfolio turnover rate2 | 29 % | 32 % | 38 % | 33 % | 47 % |
Net assets, end of period (000s omitted) | $98,683 | $130,915 | $156,330 | $96,838 | $108,613 |
* | Ratios include net expenses allocated from the affiliated Master Portfolio which were as follows: |
Year ended May 31, 2023 | 0.64% |
Year ended May 31, 2022 | 0.64% |
Year ended May 31, 2021 | 0.64% |
Year ended May 31, 2020 | 0.64% |
Year ended May 31, 2019 | 0.65% |
1 | Calculated based upon average shares outstanding |
2 | Portfolio turnover rate is calculated by multiplying the affiliated Master Portfolio’s percentage of the Fund’s total investment in securities at the end of the period by the affiliated Master Portfolio’s portfolio turnover rate. |
Gross unrealized gains | $22,350,963 |
Gross unrealized losses | 0 |
Net unrealized gains | $22,350,963 |
Affiliated Master Portfolio | Investment objective | Fair value of affiliated Master Portfolio |
Allspring C&B Large Cap Value Portfolio | Seeks maximum long-term total return (current income and capital appreciation), consistent with minimizing risk to principal | $199,030,307 |
Average daily net assets | Management fee |
First $5 billion | 0.050 % |
Next $5 billion | 0.040 |
Over $10 billion | 0.030 |
Class-level administration fee | |
Class A | 0.21 % |
Class C | 0.21 |
Class R6 | 0.03 |
Administrator Class | 0.13 |
Institutional Class | 0.13 |
EXPENSE RATIO CAPS | |
Class A | 1.08 % |
Class C | 1.83 |
Class R6 | 0.65 |
Administrator Class | 1.00 |
Institutional Class | 0.75 |
Year ended May 31 | ||
2023 | 2022 | |
Ordinary income | $4,141,234 | $4,587,798 |
Long-term capital gain | 39,076,656 | 33,365,425 |
Undistributed ordinary income | Undistributed long-term gain | Unrealized gains |
$917,292 | $11,540,890 | $22,350,963 |
Allspring Funds Trust:

Shares | Value | |||||
Common stocks: 97.86% | ||||||
Communication services: 9.58% | ||||||
Diversified telecommunication services: 1.89% | ||||||
Verizon Communications, Inc. | 134,000 | $4,774,420 | ||||
Entertainment: 3.54% | ||||||
Activision Blizzard, Inc. | 50,530 | 4,052,506 | ||||
Warner Music Group Corp. Class A | 200,700 | 4,907,115 | ||||
8,959,621 | ||||||
Interactive media & services: 1.46% | ||||||
Alphabet, Inc. Class A† | 30,180 | 3,708,217 | ||||
Media: 2.69% | ||||||
Omnicom Group, Inc. | 77,350 | 6,821,496 | ||||
Consumer discretionary: 9.77% | ||||||
Distributors: 0.98% | ||||||
LKQ Corp. | 46,940 | 2,476,085 | ||||
Household durables: 1.32% | ||||||
Whirlpool Corp. | 25,800 | 3,335,682 | ||||
Leisure products: 2.39% | ||||||
Hasbro, Inc. | 102,120 | 6,060,822 | ||||
Specialty retail: 2.21% | ||||||
CarMax, Inc.† | 77,420 | 5,590,498 | ||||
Textiles, apparel & luxury goods: 2.87% | ||||||
Gildan Activewear, Inc. | 199,900 | 5,451,273 | ||||
Hanesbrands, Inc.† | 442,800 | 1,819,908 | ||||
7,271,181 | ||||||
Consumer staples: 6.83% | ||||||
Food products: 2.83% | ||||||
Ingredion, Inc. | 28,760 | 3,008,296 | ||||
Kraft Heinz Co. | 108,580 | 4,149,928 | ||||
7,158,224 | ||||||
Personal care products: 2.21% | ||||||
Unilever PLC ADR | 112,050 | 5,595,777 | ||||
Tobacco: 1.79% | ||||||
Philip Morris International, Inc. | 50,500 | 4,545,505 | ||||
Energy: 5.28% | ||||||
Oil, gas & consumable fuels: 5.28% | ||||||
ConocoPhillips | 43,530 | 4,322,529 | ||||
EOG Resources, Inc. | 43,310 | 4,646,730 | ||||
Williams Cos., Inc. | 153,750 | 4,406,475 | ||||
13,375,734 | ||||||
Shares | Value | |||||
Financials: 29.84% | ||||||
Banks: 6.72% | ||||||
Bank of America Corp. | 94,700 | $2,631,713 | ||||
JPMorgan Chase & Co. | 44,650 | 6,059,452 | ||||
PNC Financial Services Group, Inc. | 35,980 | 4,167,563 | ||||
U.S. Bancorp | 139,230 | 4,162,977 | ||||
17,021,705 | ||||||
Capital markets: 10.80% | ||||||
Brookfield Corp. Class A | 282,260 | 8,479,090 | ||||
Charles Schwab Corp. | 96,250 | 5,071,413 | ||||
London Stock Exchange Group PLC ADR | 251,700 | 6,785,832 | ||||
State Street Corp. | 102,920 | 7,000,618 | ||||
27,336,953 | ||||||
Consumer finance: 1.48% | ||||||
Discover Financial Services | 36,520 | 3,752,065 | ||||
Financial services: 2.06% | ||||||
Berkshire Hathaway, Inc. Class B† | 16,220 | 5,207,918 | ||||
Insurance: 8.78% | ||||||
Allstate Corp. | 35,410 | 3,840,214 | ||||
Arch Capital Group Ltd.† | 54,330 | 3,786,801 | ||||
Chubb Ltd. | 25,690 | 4,773,202 | ||||
Fidelity National Financial, Inc. | 155,400 | 5,305,356 | ||||
Globe Life, Inc. | 43,900 | 4,529,602 | ||||
22,235,175 | ||||||
Health care: 13.21% | ||||||
Health care equipment & supplies: 6.67% | ||||||
Becton Dickinson & Co. | 19,720 | 4,767,507 | ||||
Dentsply Sirona, Inc. | 144,690 | 5,226,203 | ||||
Medtronic PLC | 83,200 | 6,885,632 | ||||
16,879,342 | ||||||
Health care providers & services: 3.94% | ||||||
HCA Healthcare, Inc. | 18,630 | 4,921,860 | ||||
Laboratory Corp. of America Holdings | 23,830 | 5,064,590 | ||||
9,986,450 | ||||||
Pharmaceuticals: 2.60% | ||||||
Johnson & Johnson | 42,400 | 6,574,544 | ||||
Industrials: 10.59% | ||||||
Aerospace & defense: 1.31% | ||||||
Woodward, Inc. | 31,519 | 3,322,418 | ||||
Commercial services & supplies: 1.50% | ||||||
RB Global, Inc. | 72,729 | 3,787,726 | ||||
Shares | Value | |||||
Electrical equipment: 2.05% | ||||||
AMETEK, Inc. | 35,840 | $5,199,309 | ||||
Machinery: 2.56% | ||||||
Esab Corp. | 36,993 | 2,172,229 | ||||
Stanley Black & Decker, Inc. | 57,510 | 4,311,524 | ||||
6,483,753 | ||||||
Trading companies & distributors: 3.17% | ||||||
AerCap Holdings NV† | 140,500 | 8,019,740 | ||||
Information technology: 9.19% | ||||||
Electronic equipment, instruments & components: 6.07% | ||||||
Arrow Electronics, Inc.† | 64,130 | 8,121,423 | ||||
TE Connectivity Ltd. | 59,185 | 7,248,979 | ||||
15,370,402 | ||||||
Software: 3.12% | ||||||
Open Text Corp. | 189,660 | 7,893,649 | ||||
Real estate: 1.99% | ||||||
Real estate management & development: 1.99% | ||||||
CBRE Group, Inc. Class A† | 67,190 | 5,033,875 | ||||
Utilities: 1.58% | ||||||
Gas utilities: 1.58% | ||||||
Atmos Energy Corp. | 34,800 | 4,011,744 | ||||
Total common stocks (Cost $207,997,734) | 247,790,030 | |||||
Yield | ||||||
Short-term investments: 2.00% | ||||||
Investment companies: 2.00% | ||||||
Allspring Government Money Market Fund Select Class♠∞ | 5.01 % | 5,079,661 | 5,079,661 | |||
Total short-term investments (Cost $5,079,661) | 5,079,661 | |||||
Total investments in securities (Cost $213,077,395) | 99.86 % | 252,869,691 | ||||
Other assets and liabilities, net | 0.14 | 345,457 | ||||
Total net assets | 100.00 % | $253,215,148 | ||||
† | Non-income-earning security |
♠ | The issuer of the security is an affiliated person of the Portfolio as defined in the Investment Company Act of 1940. |
∞ | The rate represents the 7-day annualized yield at period end. |
Abbreviations: | |
ADR | American depositary receipt |
Value, beginning of period | Purchases | Sales proceeds | Net realized gains (losses) | Net change in unrealized gains (losses) | Value, end of period | Shares, end of period | Income from affiliated securities | |
Short-term investments | ||||||||
Allspring Government Money Market Fund Select Class | $12,217,232 | $89,436,532 | $(96,574,103 ) | $0 | $0 | $5,079,661 | 5,079,661 | $185,997 |
Investments in affiliates no longer held at end of period | ||||||||
Securities Lending Cash Investments LLC | 0 | 7,758,270 | (7,758,254 ) | (16 ) | 0 | 0 | 0 | 5,117 1 |
$(16 ) | $0 | $5,079,661 | $191,114 |
1 | Amount shown represents income before fees and rebates. |
Assets | |
Investments in unaffiliated securities, at value (cost $207,997,734) | $247,790,030 |
Investments in affiliated securities, at value (cost $5,079,661) | 5,079,661 |
Receivable for dividends | 486,925 |
Prepaid expenses and other assets | 1,026 |
Total assets | 253,357,642 |
Liabilities | |
Advisory fee payable | 122,787 |
Custody and accounting fees payable | 13,067 |
Trustees’ fees and expenses payable | 504 |
Accrued expenses and other liabilities | 6,136 |
Total liabilities | 142,494 |
Total net assets | $253,215,148 |
Investment income | |
Dividends (net of foreign withholdings taxes of $135,740) | $6,000,256 |
Income from affiliated securities | 188,085 |
Interest | 254 |
Total investment income | 6,188,595 |
Expenses | |
Advisory fee | 1,827,068 |
Custody and accounting fees | 29,694 |
Professional fees | 62,168 |
Interest holder report expenses | 19,945 |
Trustees’ fees and expenses | 25,708 |
Other fees and expenses | 18,697 |
Total expenses | 1,983,280 |
Less: Fee waivers and/or expense reimbursements | (184,321 ) |
Net expenses | 1,798,959 |
Net investment income | 4,389,636 |
Realized and unrealized gains (losses) on investments | |
Net realized gains (losses) on | |
Unaffiliated securities | 24,842,175 |
Affiliated securities | (16 ) |
Net realized gains on investments | 24,842,159 |
Net change in unrealized gains (losses) on investments | (41,838,078 ) |
Net realized and unrealized gains (losses) on investments | (16,995,919 ) |
Net decrease in net assets resulting from operations | $(12,606,283 ) |
Year ended May 31, 2023 | Year ended May 31, 2022 | |||
Operations | ||||
Net investment income | $4,389,636 | $4,228,372 | ||
Net realized gains on investments | 24,842,159 | 59,295,012 | ||
Net change in unrealized gains (losses) on investments | (41,838,078 ) | (67,362,442 ) | ||
Net decrease in net assets resulting from operations | (12,606,283 ) | (3,839,058 ) | ||
Capital transactions | ||||
Transactions in investors’ beneficial interests | ||||
Contributions | 9,137,304 | 20,407,586 | ||
Withdrawals | (76,376,645 ) | (94,906,626 ) | ||
Net decrease in net assets resulting from capital transactions | (67,239,341 ) | (74,499,040 ) | ||
Total decrease in net assets | (79,845,624 ) | (78,338,098 ) | ||
Net assets | ||||
Beginning of period | 333,060,772 | 411,398,870 | ||
End of period | $253,215,148 | $333,060,772 | ||
Year ended May 31 | |||||
2023 | 2022 | 2021 | 2020 | 2019 | |
Total return | (3.77 )% | (1.05 )% | 57.96 % | (3.40 )% | 1.80 % |
Ratios to average net assets (annualized) | |||||
Gross expenses | 0.71 % | 0.69 % | 0.68 % | 0.68 % | 0.67 % |
Net expenses1 | 0.64 % | 0.64 % | 0.64 % | 0.64 % | 0.67 % |
Net investment income | 1.56 % | 1.12 % | 1.16 % | 1.36 % | 1.27 % |
Supplemental data | |||||
Portfolio turnover rate | 29 % | 32 % | 38 % | 33 % | 47 % |
1 | Net expense ratios reflect voluntary waivers, if any. |
Gross unrealized gains | $60,390,773 |
Gross unrealized losses | (26,180,274 ) |
Net unrealized gains | $34,210,499 |
Quoted prices (Level 1) | Other significant observable inputs (Level 2) | Significant unobservable inputs (Level 3) | Total | |
Assets | ||||
Investments in: | ||||
Common stocks | ||||
Communication services | $24,263,754 | $0 | $0 | $24,263,754 |
Consumer discretionary | 24,734,268 | 0 | 0 | 24,734,268 |
Consumer staples | 17,299,506 | 0 | 0 | 17,299,506 |
Energy | 13,375,734 | 0 | 0 | 13,375,734 |
Financials | 75,553,816 | 0 | 0 | 75,553,816 |
Health care | 33,440,336 | 0 | 0 | 33,440,336 |
Industrials | 26,812,946 | 0 | 0 | 26,812,946 |
Information technology | 23,264,051 | 0 | 0 | 23,264,051 |
Real estate | 5,033,875 | 0 | 0 | 5,033,875 |
Utilities | 4,011,744 | 0 | 0 | 4,011,744 |
Short-term investments | ||||
Investment companies | 5,079,661 | 0 | 0 | 5,079,661 |
Total assets | $252,869,691 | $0 | $0 | $252,869,691 |
Average daily net assets | Advisory fee |
First $500 million | 0.650 % |
Next $500 million | 0.625 |
Next $1 billion | 0.600 |
Next $2 billion | 0.575 |
Next $4 billion | 0.550 |
Next $4 billion | 0.525 |
Next $4 billion | 0.500 |
Over $16 billion | 0.475 |
Allspring Master Trust:
Name and year of birth | Position held and length of service* | Principal occupations during past five years or longer | Current other public company or investment company directorships |
William R. Ebsworth (Born 1957) | Trustee, since 2015 | Retired. From 1984 to 2013, equities analyst, portfolio manager, research director and chief investment officer at Fidelity Management and Research Company in Boston, Tokyo, and Hong Kong, and retired in 2013 as Chief Investment Officer of Fidelity Strategic Advisers, Inc. where he led a team of investment professionals managing client assets. Prior thereto, Board member of Hong Kong Securities Clearing Co., Hong Kong Options Clearing Corp., the Thailand International Fund, Ltd., Fidelity Investments Life Insurance Company, and Empire Fidelity Investments Life Insurance Company. Audit Committee Chair and Investment Committee Chair of the Vincent Memorial Hospital Foundation (non-profit organization). Mr. Ebsworth is a CFA charterholder. | N/A |
Jane A. Freeman (Born 1953) | Trustee, since 2015; Chair Liaison, since 2018 | Retired. From 2012 to 2014 and 1999 to 2008, Chief Financial Officer of Scientific Learning Corporation. From 2008 to 2012, Ms. Freeman provided consulting services related to strategic business projects. Prior to 1999, Portfolio Manager at Rockefeller & Co. and Scudder, Stevens & Clark. Board member of the Harding Loevner Funds from 1996 to 2014, serving as both Lead Independent Director and chair of the Audit Committee. Board member of the Russell Exchange Traded Funds Trust from 2011 to 2012 and the chair of the Audit Committee. Ms. Freeman is also an inactive Chartered Financial Analyst. | N/A |
Isaiah Harris, Jr. (Born 1952) | Trustee, since 2009; Audit Committee Chair, since 2019 | Retired. Member of the Advisory Board of CEF of East Central Florida. Chairman of the Board of CIGNA Corporation from 2009 to 2021, and Director from 2005 to 2008. From 2003 to 2011, Director of Deluxe Corporation. Prior thereto, President and CEO of BellSouth Advertising and Publishing Corp. from 2005 to 2007, President and CEO of BellSouth Enterprises from 2004 to 2005 and President of BellSouth Consumer Services from 2000 to 2003. Emeritus member of the Iowa State University Foundation Board of Governors. Emeritus Member of the Advisory board of Iowa State University School of Business. Advisory Board Member, Palm Harbor Academy (private school). Advisory Board Member, Fellowship of Christian Athletes. Mr. Harris is a certified public accountant (inactive status). | N/A |
David F. Larcker (Born 1950) | Trustee, since 2009 | Distinguished Visiting Fellow at the Hoover Institution since 2022. James Irvin Miller Professor of Accounting at the Graduate School of Business (Emeritus), Stanford University, Director of the Corporate Governance Research Initiative and Senior Faculty of The Rock Center for Corporate Governance since 2006. From 2005 to 2008, Professor of Accounting at the Graduate School of Business, Stanford University. Prior thereto, Ernst & Young Professor of Accounting at The Wharton School, University of Pennsylvania from 1985 to 2005. | N/A |
Olivia S. Mitchell (Born 1953) | Trustee, since 2006; Nominating and Governance Committee Chair, since 2018 | International Foundation of Employee Benefit Plans Professor since 1993, Wharton School of the University of Pennsylvania. Director of Wharton’s Pension Research Council and Boettner Center on Pensions & Retirement Research, and Research Associate at the National Bureau of Economic Research. Previously taught at Cornell University from 1978 to 1993. | N/A |
Timothy J. Penny (Born 1951) | Trustee, since 1996; Chair, since 2018 | President and Chief Executive Officer of Southern Minnesota Initiative Foundation, a non-profit organization, since 2007. Vice Chair of the Economic Club of Minnesota, since 2007. Co-Chair of the Committee for a Responsible Federal Budget, since 1995. Member of the Board of Trustees of NorthStar Education Finance, Inc., a non-profit organization, from 2007-2022. Senior Fellow of the University of Minnesota Humphrey Institute from 1995 to 2017. | N/A |
Name and year of birth | Position held and length of service* | Principal occupations during past five years or longer | Current other public company or investment company directorships |
James G. Polisson (Born 1959) | Trustee, since 2018 | Retired. Chief Marketing Officer, Source (ETF) UK Services, Ltd, from 2015 to 2017. From 2012 to 2015, Principal of The Polisson Group, LLC, a management consulting, corporate advisory and principal investing company. Chief Executive Officer and Managing Director at Russell Investments, Global Exchange Traded Funds from 2010 to 2012. Managing Director of Barclays Global Investors from 1998 to 2010 and Global Chief Marketing Officer for iShares and Barclays Global Investors from 2000 to 2010. Trustee of the San Francisco Mechanics’ Institute, a non- profit organization, from 2013 to 2015. Board member of the Russell Exchange Traded Fund Trust from 2011 to 2012. Director of Barclays Global Investors Holdings Deutschland GmbH from 2006 to 2009. Mr. Polisson is an attorney and has a retired status with the Massachusetts and District of Columbia Bar Associations. | N/A |
Pamela Wheelock (Born 1959) | Trustee, since January 2020; previously Trustee from January 2018 to July 2019 | Retired. Executive and Senior Financial leadership positions in the public, private and nonprofit sectors. Interim President and CEO, McKnight Foundation, 2020. Interim Commissioner, Minnesota Department of Human Services, 2019. Chief Operating Officer, Twin Cities Habitat for Humanity, 2017-2019. Vice President for University Services, University of Minnesota, 2012- 2016. Interim President and CEO, Blue Cross and Blue Shield of Minnesota, 2011-2012. Executive Vice-President and Chief Financial Officer, Minnesota Wild, 2002-2008. Commissioner, Minnesota Department of Finance, 1999-2002. Chair of the Board of Directors of Destination Medical Center Corporation. Board member of the Minnesota Wild Foundation. | N/A |
* | Length of service dates reflect the Trustee’s commencement of service with the Trust’s predecessor entities, where applicable. |
Name and year of birth | Position held and length of service | Principal occupations during past five years or longer |
Andrew Owen (Born 1960) | President, since 2017 | President and Chief Executive Officer of Allspring Funds Management, LLC since 2017 and Head of Global Fund Governance of Allspring Global Investments since 2022. Prior thereto, co-president of Galliard Capital Management, LLC, an affiliate of Allspring Funds Management, LLC, from 2019 to 2022 and Head of Affiliated Managers, Allspring Global Investments, from 2014 to 2019 and Executive Vice President responsible for marketing, investments and product development for Allspring Funds Management, LLC, from 2009 to 2014. |
Jeremy DePalma (Born 1974) | Treasurer, since 2012 (for certain funds in the Fund Complex); since 2021 (for the remaining funds in the Complex) | Senior Vice President of Allspring Funds Management, LLC since 2009. Senior Vice President of Evergreen Investment Management Company, LLC from 2008 to 2010 and head of the Fund Reporting and Control Team within Fund Administration from 2005 to 2010. |
Christopher Baker (Born 1976) | Chief Compliance Officer, since 2022 | Global Chief Compliance Officer for Allspring Global Investments since 2022. Prior thereto, Chief Compliance Officer for State Street Global Advisors from 2018 to 2021. Senior Compliance Officer for the State Street divisions of Alternative Investment Solutions, Sector Solutions, and Global Marketing from 2015 to 2018. From 2010 to 2015 Vice President, Global Head of Investment and Marketing Compliance for State Street Global Advisors. |
Matthew Prasse (Born 1983) | Chief Legal Officer, since 2022; Secretary, since 2021 | Senior Counsel of the Allspring Legal Department since 2021. Senior Counsel of the Wells Fargo Legal Department from 2018 to 2021. Previously, Counsel for Barings LLC from 2015 to 2018. Prior to joining Barings, Associate at Morgan, Lewis & Bockius LLP from 2008 to 2015. |

P.O. Box 219967
Kansas City, MO 64121-9967

AR1863 05-23
2 | |
6 | |
10 | |
11 | |
12 | |
14 | |
15 | |
16 | |
23 | |
27 | |
28 | |
53 | |
54 | |
55 | |
56 | |
57 | |
61 | |
62 |

Allspring Funds

President
Allspring Funds
Notice to Shareholders |
Beginning in July 2024, the Fund will be required by the Securities and Exchange Commission to send shareholders a paper copy of a new tailored shareholder report in place of the full shareholder report that you are now receiving. The tailored shareholder report will contain concise information about the Fund, including certain expense and performance information and fund statistics. If you wish to receive this new tailored shareholder report electronically, please follow the instructions on the back cover of this report. |
Other information that is currently included in the shareholder report, such as the Fund’s financial statements, will be available online and upon request, free of charge, in paper or electronic format. |
Investment objective | The Fund seeks total return, consisting of income and capital appreciation. |
Manager | Allspring Funds Management, LLC |
Subadviser for the affiliated master portfolio* | Allspring Global Investments, LLC |
Portfolio managers | Maulik Bhansali, CFA, Jarad Vasquez |
Average annual total returns (%) as of May 31, 2023 | |||||||||
Including sales charge | Excluding sales charge | Expense ratios1 (%) | |||||||
Inception date | 1 year | 5 year | 10 year | 1 year | 5 year | 10 year | Gross | Net2 | |
Class A (MBFAX) | 10-31-2001 | -6.76 | -0.35 | 0.64 | -2.33 | 0.57 | 1.10 | 0.81 | 0.70 |
Class C (MBFCX) | 10-31-2001 | -4.03 | -0.19 | 0.49 | -3.03 | -0.19 | 0.49 | 1.56 | 1.45 |
Class R (WTRRX) | 7-9-2010 | – | – | – | -2.35 | 0.43 | 0.90 | 1.07 | 0.96 |
Class R4 (MBFRX) | 11-30-2012 | – | – | – | -1.95 | 0.85 | 1.38 | 0.59 | 0.48 |
Class R6 (WTRIX) | 11-30-2012 | – | – | – | -1.90 | 0.98 | 1.52 | 0.44 | 0.33 |
Administrator Class (MNTRX) | 6-30-1997 | – | – | – | -2.22 | 0.64 | 1.18 | 0.76 | 0.65 |
Institutional Class (MBFIX) | 10-31-2001 | – | – | – | -1.95 | 0.94 | 1.47 | 0.49 | 0.38 |
Bloomberg U.S. Aggregate Bond Index3 | – | – | – | – | -2.14 | 0.81 | 1.39 | – | – |
1 | Reflects the expense ratios as stated in the most recent prospectuses. The expense ratios shown are subject to change and may differ from the annualized expense ratios shown in the financial highlights of this report. |
2 | The manager has contractually committed through September 30, 2024, to waive fees and/or reimburse expenses to the extent necessary to cap total annual fund operating expenses after fee waivers at 0.70% for Class A, 1.45% for Class C, 0.96% for Class R, 0.48% for Class R4, 0.33% for Class R6, 0.65% for Administrator Class and 0.38% for Institutional Class. Brokerage commissions, stamp duty fees, interest, taxes, acquired fund fees and expenses (if any) from funds in which the affiliated master portfolio invests, and extraordinary expenses are excluded from the expense caps. Net expenses from the affiliated master portfolio are included in the expense caps. Prior to or after the commitment expiration date, the caps may be increased or the commitment to maintain the caps may be terminated only with the approval of the Board of Trustees. Without these caps, the Fund’s returns would have been lower. The expense ratio paid by an investor is the net expense ratio (the total annual fund operating expenses after fee waivers) as stated in the prospectuses. |
3 | The Bloomberg U.S. Aggregate Bond Index is a broad-based benchmark that measures the investment-grade, U.S. dollar–denominated, fixed-rate taxable bond market, including Treasuries, government-related and corporate securities, mortgage-backed securities (agency fixed-rate and hybrid adjustable-rate mortgage pass-throughs), asset-backed securities, and commercial mortgage-backed securities. You cannot invest directly in an index. |
* | The Fund is a feeder fund in a master-feeder structure that invests substantially all of its assets in a single affiliated master portfolio of the Allspring Master Trust with a substantially identical investment objective and substantially similar investment strategies. References to the investment activities of the Fund are intended to refer to the investment activities of the affiliated master portfolio in which it invests. |
CFA® and Chartered Financial Analyst® are trademarks owned by CFA Institute. | |
Growth of $10,000 investment as of May 31, 20231 |
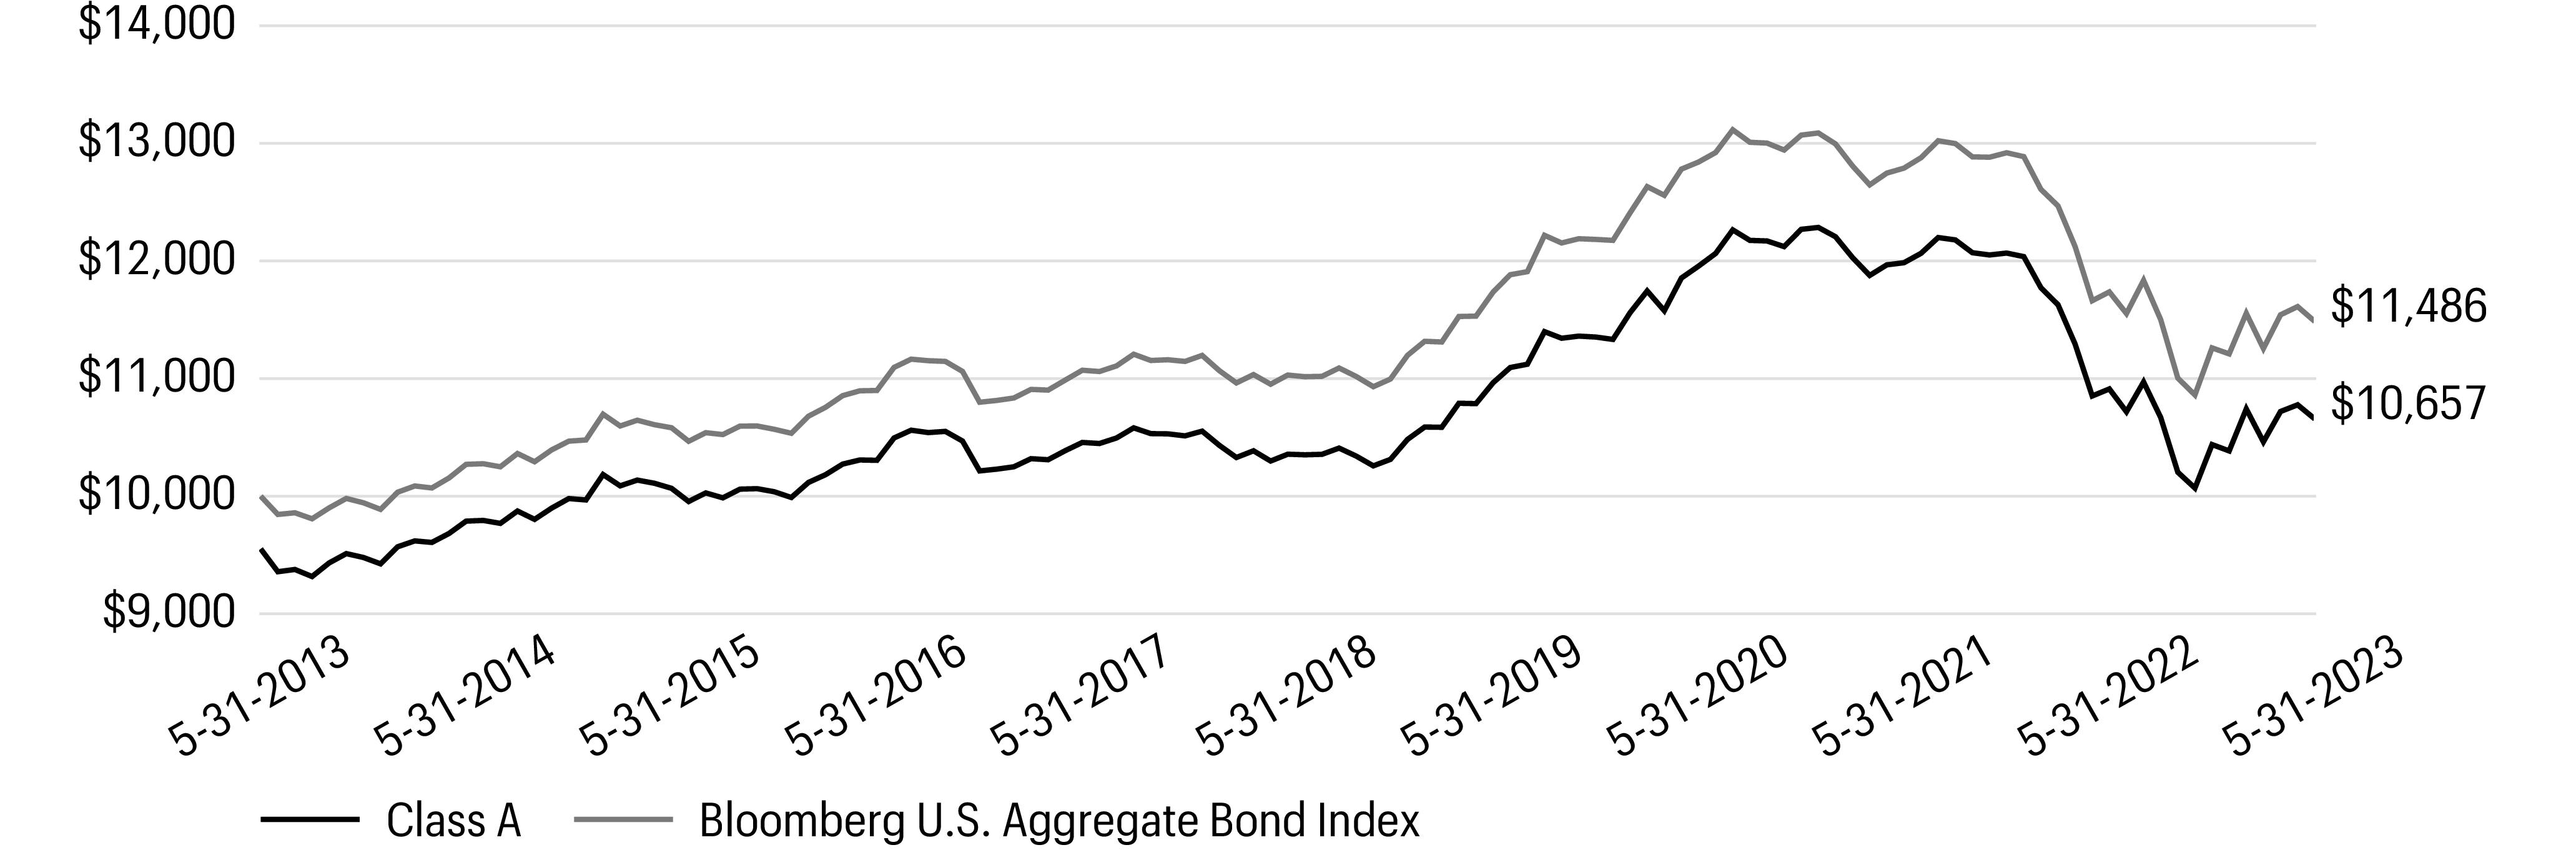
1 | The chart compares the performance of Class A shares for the most recent ten years with the Bloomberg U.S. Aggregate Bond Index. The chart assumes a hypothetical investment of $10,000 in Class A shares and reflects all operating expenses and assumes the maximum initial sales charge of 4.50%. |
Ten largest holdings (%) as of May 31, 20231 | |
U.S. Treasury Bonds, 1.38%, 11-15-2040 | 2.22 |
U.S. Treasury Notes, 3.50%, 4-30-2028 | 2.19 |
U.S. Treasury Notes, 1.50%, 8-15-2026 | 2.01 |
U.S. Treasury Bonds, 1.75%, 8-15-2041 | 1.91 |
U.S. Treasury Bonds, 3.63%, 2-15-2053 | 1.55 |
FNMA, 6.00%, 8-14-2053 | 1.48 |
U.S. Treasury Notes, 3.63%, 5-31-2028 | 1.36 |
U.S. Treasury Bonds, 1.13%, 5-15-2040 | 1.21 |
U.S. Treasury Bonds, 1.13%, 8-15-2040 | 1.18 |
U.S. Treasury Notes, 3.63%, 5-15-2026 | 1.13 |
1 | Each holding represents the Fund’s allocable portion of the affiliated master portfolio security. Figures represent each holding as a percentage of the Fund’s net assets. Holdings are subject to change and may have changed since the date specified. |
Portfolio allocation as of May 31, 20231 |

1 | Figures represent the portfolio allocation of the affiliated master portfolio as a percentage of the long-term investments of the affiliated master portfolio. Allocations are subject to change and may have changed since the date specified. |
Beginning account value 12-1-2022 | Ending account value 5-31-2023 | Expenses paid during the period1, 2 | Annualized net expense ratio2 | |
Class A | ||||
Actual | $1,000.00 | $1,000.21 | $3.79 | 0.76 % |
Hypothetical (5% return before expenses) | $1,000.00 | $1,021.14 | $3.83 | 0.76 % |
Class C | ||||
Actual | $1,000.00 | $1,000.17 | $7.53 | 1.51 % |
Hypothetical (5% return before expenses) | $1,000.00 | $1,017.40 | $7.59 | 1.51 % |
Class R | ||||
Actual | $1,000.00 | $1,000.21 | $4.64 | 0.93 % |
Hypothetical (5% return before expenses) | $1,000.00 | $1,020.29 | $4.68 | 0.93 % |
Class R4 | ||||
Actual | $1,000.00 | $1,000.23 | $2.54 | 0.51 % |
Hypothetical (5% return before expenses) | $1,000.00 | $1,022.39 | $2.57 | 0.51 % |
Class R6 | ||||
Actual | $1,000.00 | $1,000.23 | $1.80 | 0.36 % |
Hypothetical (5% return before expenses) | $1,000.00 | $1,023.14 | $1.82 | 0.36 % |
Administrator Class | ||||
Actual | $1,000.00 | $1,000.21 | $3.44 | 0.69 % |
Hypothetical (5% return before expenses) | $1,000.00 | $1,021.49 | $3.48 | 0.69 % |
Institutional Class | ||||
Actual | $1,000.00 | $1,000.23 | $2.04 | 0.41 % |
Hypothetical (5% return before expenses) | $1,000.00 | $1,022.89 | $2.07 | 0.41 % |
Value | ||||||
Investment companies: 100.00% | ||||||
Affiliated master portfolio: 100.00% | ||||||
Allspring Core Bond Portfolio | $4,465,317,904 | |||||
Total investment companies (Cost $4,706,276,613) | 4,465,317,904 | |||||
Total investments in securities (Cost $4,706,276,613) | 100.00 % | 4,465,317,904 | ||||
Other assets and liabilities, net | 0.00 | 92,978 | ||||
Total net assets | 100.00 % | $4,465,410,882 | ||||
% of ownership, beginning of period | % of ownership, end of period | Net realized gains (losses) on investments allocated from affiliated Master Portfolio | Net change in unrealized gains (losses) on investments allocated from affiliated Master Portfolio | Affiliated Income Allocated from affiliated Master Portfolio | Interest allocated from affiliated Master Portfolio | Value, end of period | |
Allspring Core Bond Portfolio | 94.49 % | 95.76 % | $(312,035,594 ) | $85,016,436 | $3,703,917 | $144,333,199 | $4,465,317,904 |
Assets | |
Investments in affiliated Master Portfolio, at value (cost $4,706,276,613) | $4,465,317,904 |
Receivable for Fund shares sold | 5,883,260 |
Receivable from manager | 310,352 |
Prepaid expenses and other assets | 179,449 |
Total assets | 4,471,690,965 |
Liabilities | |
Payable for Fund shares redeemed | 4,734,681 |
Dividends payable | 977,360 |
Administration fees payable | 255,598 |
Distribution fees payable | 4,550 |
Trustees’ fees and expenses payable | 504 |
Accrued expenses and other liabilities | 307,390 |
Total liabilities | 6,280,083 |
Total net assets | $4,465,410,882 |
Net assets consist of | |
Paid-in capital | $5,214,802,062 |
Total distributable loss | (749,391,180 ) |
Total net assets | $4,465,410,882 |
Computation of net asset value and offering price per share | |
Net assets–Class A | $273,980,036 |
Shares outstanding–Class A1 | 23,982,754 |
Net asset value per share–Class A | $11.42 |
Maximum offering price per share – Class A2 | $11.96 |
Net assets–Class C | $6,863,390 |
Shares outstanding–Class C1 | 607,190 |
Net asset value per share–Class C | $11.30 |
Net assets–Class R | $1,314,195 |
Shares outstanding–Class R1 | 118,021 |
Net asset value per share–Class R | $11.14 |
Net assets–Class R4 | $829,420 |
Shares outstanding–Class R41 | 74,480 |
Net asset value per share–Class R4 | $11.14 |
Net assets–Class R6 | $1,476,551,029 |
Shares outstanding–Class R61 | 132,745,577 |
Net asset value per share–Class R6 | $11.12 |
Net assets–Administrator Class | $70,352,385 |
Shares outstanding–Administrator Class1 | 6,318,209 |
Net asset value per share–Administrator Class | $11.13 |
Net assets–Institutional Class | $2,635,520,427 |
Shares outstanding–Institutional Class1 | 237,003,930 |
Net asset value per share–Institutional Class | $11.12 |
1 | The Fund has an unlimited number of authorized shares. |
2 | Maximum offering price is computed as 100/95.50 of net asset value. On investments of $50,000 or more, the offering price is reduced. |
Investment income | |
Interest allocated from affiliated Master Portfolio (net of foreign withholding taxes of $5,742) | $144,333,199 |
Affiliated income allocated from affiliated Master Portfolio | 3,703,917 |
Expenses allocated from affiliated Master Portfolio | (15,654,739 ) |
Waivers allocated from affiliated Master Portfolio | 314,456 |
Total investment income | 132,696,833 |
Expenses | |
Management fee | 2,150,423 |
Administration fees | |
Class A | 464,295 |
Class C | 11,044 |
Class R | 2,175 |
Class R4 | 1,322 |
Class R6 | 435,096 |
Administrator Class | 100,773 |
Institutional Class | 1,959,724 |
Shareholder servicing fees | |
Class A | 725,461 |
Class C | 17,256 |
Class R | 2,398 |
Class R4 | 1,650 |
Administrator Class | 237,099 |
Distribution fees | |
Class C | 51,767 |
Class R | 2,406 |
Custody and accounting fees | 140,021 |
Professional fees | 45,094 |
Registration fees | 135,647 |
Shareholder report expenses | 283,230 |
Trustees’ fees and expenses | 23,208 |
Other fees and expenses | 42,453 |
Total expenses | 6,832,542 |
Less: Fee waivers and/or expense reimbursements | |
Fund-level | (2,586,221 ) |
Class R4 | (412 ) |
Class R6 | (385,379 ) |
Institutional Class | (676,805 ) |
Net expenses | 3,183,725 |
Net investment income | 129,513,108 |
Realized and unrealized gains (losses) on investments | |
Net realized losses on investments allocated from affiliated Master Portfolio | (312,035,594 ) |
Net change in unrealized gains (losses) on investments allocated from affiliated Master Portfolio | 85,016,436 |
Net realized and unrealized gains (losses) on investments | (227,019,158 ) |
Net decrease in net assets resulting from operations | $(97,506,050 ) |
Year ended May 31, 2023 | Year ended May 31, 2022 | |||
Operations | ||||
Net investment income | $129,513,108 | $62,869,235 | ||
Net realized losses on investments | (312,035,594 ) | (160,127,410 ) | ||
Net change in unrealized gains (losses) on investments | 85,016,436 | (336,112,120 ) | ||
Net decrease in net assets resulting from operations | (97,506,050 ) | (433,370,295 ) | ||
Distributions to shareholders from | ||||
Net investment income and net realized gains | ||||
Class A | (7,675,142 ) | (6,433,689 ) | ||
Class C | (131,223 ) | (110,382 ) | ||
Class R | (34,090 ) | (26,649 ) | ||
Class R4 | (48,723 ) | (36,787 ) | ||
Class R6 | (44,157,011 ) | (39,431,641 ) | ||
Administrator Class | (2,554,745 ) | (4,031,398 ) | ||
Institutional Class | (74,306,035 ) | (58,058,159 ) | ||
Total distributions to shareholders | (128,906,969 ) | (108,128,705 ) | ||
Capital share transactions | Shares | Shares | ||
Proceeds from shares sold | ||||
Class A | 3,547,996 | 40,597,860 | 3,702,453 | 48,486,367 |
Class C | 203,641 | 2,319,261 | 108,019 | 1,407,245 |
Class R | 9,751 | 109,924 | 34,646 | 423,424 |
Class R4 | 81,024 | 891,840 | 28,978 | 375,499 |
Class R6 | 48,253,518 | 536,236,583 | 35,298,112 | 443,259,488 |
Administrator Class | 1,484,991 | 16,856,217 | 2,796,248 | 36,167,197 |
Institutional Class | 95,825,733 | 1,072,136,843 | 81,429,382 | 1,025,963,187 |
1,669,148,528 | 1,556,082,407 | |||
Reinvestment of distributions | ||||
Class A | 629,058 | 7,205,833 | 459,521 | 6,030,239 |
Class C | 11,516 | 130,427 | 8,369 | 109,235 |
Class R | 2,140 | 23,904 | 1,429 | 18,254 |
Class R4 | 4,370 | 48,723 | 2,874 | 36,727 |
Class R6 | 3,183,589 | 35,516,927 | 2,565,625 | 32,770,856 |
Administrator Class | 207,042 | 2,323,885 | 297,680 | 3,811,913 |
Institutional Class | 6,456,679 | 72,012,292 | 4,290,277 | 54,802,544 |
117,261,991 | 97,579,768 | |||
Payment for shares redeemed | ||||
Class A | (7,212,437 ) | (82,273,020 ) | (4,763,948 ) | (62,340,443 ) |
Class C | (264,946 ) | (3,003,853 ) | (467,425 ) | (6,084,370 ) |
Class R | (17,679 ) | (198,692 ) | (43,328 ) | (536,185 ) |
Class R4 | (144,850 ) | (1,619,238 ) | (33,896 ) | (428,263 ) |
Class R6 | (59,239,090 ) | (658,796,705 ) | (48,563,677 ) | (619,916,699 ) |
Administrator Class | (10,522,094 ) | (119,107,953 ) | (4,352,230 ) | (55,087,181 ) |
Institutional Class | (74,572,722 ) | (831,757,832 ) | (86,745,436 ) | (1,095,982,497 ) |
(1,696,757,293 ) | (1,840,375,638 ) | |||
Net increase (decrease) in net assets resulting from capital share transactions | 89,653,226 | (186,713,463 ) | ||
Total decrease in net assets | (136,759,793 ) | (728,212,463 ) | ||
Net assets | ||||
Beginning of period | 4,602,170,675 | 5,330,383,138 | ||
End of period | $4,465,410,882 | $4,602,170,675 | ||
(For a share outstanding throughout each period)
Year ended May 31 | |||||
Class A | 2023 | 2022 | 2021 | 2020 | 2019 |
Net asset value, beginning of period | $12.01 | $13.43 | $14.17 | $13.28 | $12.86 |
Net investment income | 0.31 1 | 0.12 | 0.12 1 | 0.25 | 0.32 |
Net realized and unrealized gains (losses) on investments | (0.59 ) | (1.30 ) | (0.06 ) | 0.93 | 0.42 |
Total from investment operations | (0.28 ) | (1.18 ) | 0.06 | 1.18 | 0.74 |
Distributions to shareholders from | |||||
Net investment income | (0.30 ) | (0.12 ) | (0.15 ) | (0.26 ) | (0.32 ) |
Net realized gains | (0.01 ) | (0.12 ) | (0.65 ) | (0.03 ) | 0.00 |
Total distributions to shareholders | (0.31 ) | (0.24 ) | (0.80 ) | (0.29 ) | (0.32 ) |
Net asset value, end of period | $11.42 | $12.01 | $13.43 | $14.17 | $13.28 |
Total return2 | (2.33 )% | (8.95 )% | 0.31 % | 9.03 % | 5.87 % |
Ratios to average net assets (annualized)* | |||||
Gross expenses | 0.83 % | 0.82 % | 0.82 % | 0.82 % | 0.83 % |
Net expenses | 0.77 % | 0.78 % | 0.78 % | 0.78 % | 0.78 % |
Net investment income | 2.66 % | 0.91 % | 0.87 % | 1.85 % | 2.50 % |
Supplemental data | |||||
Portfolio turnover rate3 | 384 % | 432 % | 457 % | 603 % | 577 % |
Net assets, end of period (000s omitted) | $273,980 | $324,431 | $370,882 | $299,642 | $302,246 |
* | Ratios include net expenses allocated from the affiliated Master Portfolio which were as follows: |
Year ended May 31, 2023 | 0.36% |
Year ended May 31, 2022 | 0.36% |
Year ended May 31, 2021 | 0.35% |
Year ended May 31, 2020 | 0.35% |
Year ended May 31, 2019 | 0.35% |
1 | Calculated based upon average shares outstanding |
2 | Total return calculations do not include any sales charges. |
3 | Portfolio turnover rate is calculated by multiplying the affiliated Master Portfolio’s percentage of the Fund’s total investment in securities at the end of the period by the affiliated Master Portfolio’s portfolio turnover rate. |
(For a share outstanding throughout each period)
Year ended May 31 | |||||
Class C | 2023 | 2022 | 2021 | 2020 | 2019 |
Net asset value, beginning of period | $11.88 | $13.29 | $14.03 | $13.15 | $12.74 |
Net investment income | 0.22 1 | 0.05 | 0.03 | 0.15 | 0.23 |
Net realized and unrealized gains (losses) on investments | (0.58 ) | (1.32 ) | (0.07 ) | 0.92 | 0.40 |
Total from investment operations | (0.36 ) | (1.27 ) | (0.04 ) | 1.07 | 0.63 |
Distributions to shareholders from | |||||
Net investment income | (0.21 ) | (0.02 ) | (0.05 ) | (0.16 ) | (0.22 ) |
Net realized gains | (0.01 ) | (0.12 ) | (0.65 ) | (0.03 ) | 0.00 |
Total distributions to shareholders | (0.22 ) | (0.14 ) | (0.70 ) | (0.19 ) | (0.22 ) |
Net asset value, end of period | $11.30 | $11.88 | $13.29 | $14.03 | $13.15 |
Total return2 | (3.03 )% | (9.65 )% | (0.45 )% | 8.22 % | 5.04 % |
Ratios to average net assets (annualized)* | |||||
Gross expenses | 1.58 % | 1.57 % | 1.57 % | 1.57 % | 1.58 % |
Net expenses | 1.52 % | 1.53 % | 1.53 % | 1.53 % | 1.53 % |
Net investment income | 1.92 % | 0.13 % | 0.16 % | 1.11 % | 1.75 % |
Supplemental data | |||||
Portfolio turnover rate3 | 384 % | 432 % | 457 % | 603 % | 577 % |
Net assets, end of period (000s omitted) | $6,863 | $7,806 | $13,399 | $27,971 | $34,494 |
* | Ratios include net expenses allocated from the affiliated Master Portfolio which were as follows: |
Year ended May 31, 2023 | 0.36% |
Year ended May 31, 2022 | 0.36% |
Year ended May 31, 2021 | 0.35% |
Year ended May 31, 2020 | 0.35% |
Year ended May 31, 2019 | 0.35% |
1 | Calculated based upon average shares outstanding |
2 | Total return calculations do not include any sales charges. |
3 | Portfolio turnover rate is calculated by multiplying the affiliated Master Portfolio’s percentage of the Fund’s total investment in securities at the end of the period by the affiliated Master Portfolio’s portfolio turnover rate. |
(For a share outstanding throughout each period)
Year ended May 31 | |||||
Class R | 2023 | 2022 | 2021 | 2020 | 2019 |
Net asset value, beginning of period | $11.70 | $13.09 | $13.83 | $12.96 | $12.55 |
Net investment income | 0.28 1 | 0.10 1 | 0.11 1 | 0.22 1 | 0.28 1 |
Net realized and unrealized gains (losses) on investments | (0.55 ) | (1.27 ) | (0.06 ) | 0.90 | 0.41 |
Total from investment operations | (0.27 ) | (1.17 ) | 0.05 | 1.12 | 0.69 |
Distributions to shareholders from | |||||
Net investment income | (0.28 ) | (0.10 ) | (0.14 ) | (0.22 ) | (0.28 ) |
Net realized gains | (0.01 ) | (0.12 ) | (0.65 ) | (0.03 ) | 0.00 |
Total distributions to shareholders | (0.29 ) | (0.22 ) | (0.79 ) | (0.25 ) | (0.28 ) |
Net asset value, end of period | $11.14 | $11.70 | $13.09 | $13.83 | $12.96 |
Total return | (2.35 )% | (9.09 )% | 0.22 % | 8.80 % | 5.61 % |
Ratios to average net assets (annualized)* | |||||
Gross expenses | 0.94 % | 0.92 % | 0.87 % | 1.05 % | 1.07 % |
Net expenses | 0.92 % | 0.90 % | 0.86 % | 1.02 % | 1.03 % |
Net investment income | 2.52 % | 0.79 % | 0.81 % | 1.66 % | 2.25 % |
Supplemental data | |||||
Portfolio turnover rate2 | 384 % | 432 % | 457 % | 603 % | 577 % |
Net assets, end of period (000s omitted) | $1,314 | $1,449 | $1,716 | $3,241 | $8,565 |
* | Ratios include net expenses allocated from the affiliated Master Portfolio which were as follows: |
Year ended May 31, 2023 | 0.36% |
Year ended May 31, 2022 | 0.36% |
Year ended May 31, 2021 | 0.35% |
Year ended May 31, 2020 | 0.35% |
Year ended May 31, 2019 | 0.35% |
1 | Calculated based upon average shares outstanding |
2 | Portfolio turnover rate is calculated by multiplying the affiliated Master Portfolio’s percentage of the Fund’s total investment in securities at the end of the period by the affiliated Master Portfolio’s portfolio turnover rate. |
(For a share outstanding throughout each period)
Year ended May 31 | |||||
Class R4 | 2023 | 2022 | 2021 | 2020 | 2019 |
Net asset value, beginning of period | $11.70 | $13.09 | $13.83 | $12.95 | $12.55 |
Net investment income | 0.33 1 | 0.15 | 0.16 1 | 0.29 1 | 0.35 |
Net realized and unrealized gains (losses) on investments | (0.56 ) | (1.27 ) | (0.06 ) | 0.91 | 0.40 |
Total from investment operations | (0.23 ) | (1.12 ) | 0.10 | 1.20 | 0.75 |
Distributions to shareholders from | |||||
Net investment income | (0.32 ) | (0.15 ) | (0.19 ) | (0.29 ) | (0.35 ) |
Net realized gains | (0.01 ) | (0.12 ) | (0.65 ) | (0.03 ) | 0.00 |
Total distributions to shareholders | (0.33 ) | (0.27 ) | (0.84 ) | (0.32 ) | (0.35 ) |
Net asset value, end of period | $11.14 | $11.70 | $13.09 | $13.83 | $12.95 |
Total return | (1.95 )% | (8.74 )% | 0.55 % | 9.34 % | 6.07 % |
Ratios to average net assets (annualized)* | |||||
Gross expenses | 0.60 % | 0.59 % | 0.59 % | 0.59 % | 0.60 % |
Net expenses | 0.52 % | 0.52 % | 0.52 % | 0.52 % | 0.52 % |
Net investment income | 2.94 % | 1.17 % | 1.16 % | 2.19 % | 2.76 % |
Supplemental data | |||||
Portfolio turnover rate2 | 384 % | 432 % | 457 % | 603 % | 577 % |
Net assets, end of period (000s omitted) | $829 | $1,567 | $1,780 | $4,549 | $10,805 |
* | Ratios include net expenses allocated from the affiliated Master Portfolio which were as follows: |
Year ended May 31, 2023 | 0.36% |
Year ended May 31, 2022 | 0.36% |
Year ended May 31, 2021 | 0.35% |
Year ended May 31, 2020 | 0.35% |
Year ended May 31, 2019 | 0.35% |
1 | Calculated based upon average shares outstanding |
2 | Portfolio turnover rate is calculated by multiplying the affiliated Master Portfolio’s percentage of the Fund’s total investment in securities at the end of the period by the affiliated Master Portfolio’s portfolio turnover rate. |
(For a share outstanding throughout each period)
Year ended May 31 | |||||
Class R6 | 2023 | 2022 | 2021 | 2020 | 2019 |
Net asset value, beginning of period | $11.69 | $13.08 | $13.82 | $12.95 | $12.54 |
Net investment income | 0.34 1 | 0.17 | 0.18 1 | 0.30 | 0.37 |
Net realized and unrealized gains (losses) on investments | (0.56 ) | (1.27 ) | (0.06 ) | 0.91 | 0.41 |
Total from investment operations | (0.22 ) | (1.10 ) | 0.12 | 1.21 | 0.78 |
Distributions to shareholders from | |||||
Net investment income | (0.34 ) | (0.17 ) | (0.21 ) | (0.31 ) | (0.37 ) |
Net realized gains | (0.01 ) | (0.12 ) | (0.65 ) | (0.03 ) | 0.00 |
Total distributions to shareholders | (0.35 ) | (0.29 ) | (0.86 ) | (0.34 ) | (0.37 ) |
Net asset value, end of period | $11.12 | $11.69 | $13.08 | $13.82 | $12.95 |
Total return | (1.90 )% | (8.61 )% | 0.70 % | 9.42 % | 6.31 % |
Ratios to average net assets (annualized)* | |||||
Gross expenses | 0.45 % | 0.44 % | 0.44 % | 0.44 % | 0.45 % |
Net expenses | 0.37 % | 0.37 % | 0.37 % | 0.37 % | 0.37 % |
Net investment income | 3.06 % | 1.32 % | 1.29 % | 2.26 % | 2.92 % |
Supplemental data | |||||
Portfolio turnover rate2 | 384 % | 432 % | 457 % | 603 % | 577 % |
Net assets, end of period (000s omitted) | $1,476,551 | $1,643,353 | $1,978,164 | $2,545,332 | $2,513,644 |
* | Ratios include net expenses allocated from the affiliated Master Portfolio which were as follows: |
Year ended May 31, 2023 | 0.36% |
Year ended May 31, 2022 | 0.36% |
Year ended May 31, 2021 | 0.35% |
Year ended May 31, 2020 | 0.35% |
Year ended May 31, 2019 | 0.35% |
1 | Calculated based upon average shares outstanding |
2 | Portfolio turnover rate is calculated by multiplying the affiliated Master Portfolio’s percentage of the Fund’s total investment in securities at the end of the period by the affiliated Master Portfolio’s portfolio turnover rate. |
(For a share outstanding throughout each period)
Year ended May 31 | |||||
Administrator Class | 2023 | 2022 | 2021 | 2020 | 2019 |
Net asset value, beginning of period | $11.70 | $13.09 | $13.83 | $12.96 | $12.56 |
Net investment income | 0.29 1 | 0.13 | 0.13 | 0.26 | 0.33 1 |
Net realized and unrealized gains (losses) on investments | (0.55 ) | (1.27 ) | (0.06 ) | 0.90 | 0.40 |
Total from investment operations | (0.26 ) | (1.14 ) | 0.07 | 1.16 | 0.73 |
Distributions to shareholders from | |||||
Net investment income | (0.30 ) | (0.13 ) | (0.16 ) | (0.26 ) | (0.33 ) |
Net realized gains | (0.01 ) | (0.12 ) | (0.65 ) | (0.03 ) | 0.00 |
Total distributions to shareholders | (0.31 ) | (0.25 ) | (0.81 ) | (0.29 ) | (0.33 ) |
Net asset value, end of period | $11.13 | $11.70 | $13.09 | $13.83 | $12.96 |
Total return | (2.22 )% | (8.90 )% | 0.37 % | 9.14 % | 5.87 % |
Ratios to average net assets (annualized)* | |||||
Gross expenses | 0.76 % | 0.74 % | 0.76 % | 0.76 % | 0.76 % |
Net expenses | 0.70 % | 0.69 % | 0.70 % | 0.70 % | 0.70 % |
Net investment income | 2.60 % | 0.99 % | 0.95 % | 1.92 % | 2.58 % |
Supplemental data | |||||
Portfolio turnover rate2 | 384 % | 432 % | 457 % | 603 % | 577 % |
Net assets, end of period (000s omitted) | $70,352 | $177,305 | $214,796 | $218,522 | $205,825 |
* | Ratios include net expenses allocated from the affiliated Master Portfolio which were as follows: |
Year ended May 31, 2023 | 0.36% |
Year ended May 31, 2022 | 0.36% |
Year ended May 31, 2021 | 0.35% |
Year ended May 31, 2020 | 0.35% |
Year ended May 31, 2019 | 0.35% |
1 | Calculated based upon average shares outstanding |
2 | Portfolio turnover rate is calculated by multiplying the affiliated Master Portfolio’s percentage of the Fund’s total investment in securities at the end of the period by the affiliated Master Portfolio’s portfolio turnover rate. |
(For a share outstanding throughout each period)
Year ended May 31 | |||||
Institutional Class | 2023 | 2022 | 2021 | 2020 | 2019 |
Net asset value, beginning of period | $11.69 | $13.07 | $13.82 | $12.94 | $12.54 |
Net investment income | 0.34 1 | 0.16 | 0.17 | 0.29 | 0.36 |
Net realized and unrealized gains (losses) on investments | (0.57 ) | (1.26 ) | (0.07 ) | 0.92 | 0.40 |
Total from investment operations | (0.23 ) | (1.10 ) | 0.10 | 1.21 | 0.76 |
Distributions to shareholders from | |||||
Net investment income | (0.33 ) | (0.16 ) | (0.20 ) | (0.30 ) | (0.36 ) |
Net realized gains | (0.01 ) | (0.12 ) | (0.65 ) | (0.03 ) | 0.00 |
Total distributions to shareholders | (0.34 ) | (0.28 ) | (0.85 ) | (0.33 ) | (0.36 ) |
Net asset value, end of period | $11.12 | $11.69 | $13.07 | $13.82 | $12.94 |
Total return | (1.95 )% | (8.59 )% | 0.58 % | 9.45 % | 6.18 % |
Ratios to average net assets (annualized)* | |||||
Gross expenses | 0.50 % | 0.49 % | 0.49 % | 0.49 % | 0.50 % |
Net expenses | 0.41 % | 0.42 % | 0.42 % | 0.42 % | 0.42 % |
Net investment income | 3.05 % | 1.27 % | 1.22 % | 2.21 % | 2.86 % |
Supplemental data | |||||
Portfolio turnover rate2 | 384 % | 432 % | 457 % | 603 % | 577 % |
Net assets, end of period (000s omitted) | $2,635,520 | $2,446,260 | $2,749,647 | $2,365,421 | $2,343,238 |
* | Ratios include net expenses allocated from the affiliated Master Portfolio which were as follows: |
Year ended May 31, 2023 | 0.36% |
Year ended May 31, 2022 | 0.36% |
Year ended May 31, 2021 | 0.35% |
Year ended May 31, 2020 | 0.35% |
Year ended May 31, 2019 | 0.35% |
1 | Calculated based upon average shares outstanding |
2 | Portfolio turnover rate is calculated by multiplying the affiliated Master Portfolio’s percentage of the Fund’s total investment in securities at the end of the period by the affiliated Master Portfolio’s portfolio turnover rate. |
Gross unrealized gains | $0 |
Gross unrealized losses | (259,326,596 ) |
Net unrealized losses | $(259,326,596 ) |
Affiliated Master Portfolio | Investment objective | Fair value of affiliated Master Portfolio |
Allspring Core Bond Portfolio | Seeks total return, consisting of income and capital appreciation | $4,465,317,904 |
Average daily net assets | Management fee |
First $5 billion | 0.050 % |
Next $5 billion | 0.040 |
Over $10 billion | 0.030 |
Class-level administration fee | |
Class A | 0.16 % |
Class C | 0.16 |
Class R | 0.16 |
Class R4 | 0.08 |
Class R6 | 0.03 |
Administrator Class | 0.10 |
Institutional Class | 0.08 |
EXPENSE RATIO CAPS | ||
Current | Prior to April 17, 2023 | |
Class A | 0.71 % | 0.78 % |
Class C | 1.46 | 1.53 |
Class R | 0.96 | 1.03 |
Class R4 | 0.48 | 0.52 |
Class R6 | 0.33 | 0.37 |
Administrator Class | 0.65 | 0.70 |
Institutional Class | 0.38 | 0.42 |
Purchases at cost | Sales proceeds | ||
U.S. government | Non-U.S. government | U.S. government | Non-U.S. government |
$10,190,491,365 | $7,095,020,558 | $10,258,158,874 | $6,737,323,863 |
Year ended May 31 | ||
2023 | 2022 | |
Ordinary income | $128,906,969 | $80,688,093 |
Long-term capital gain | 0 | 27,440,612 |
Undistributed ordinary income | Unrealized losses | Capital loss carryforward |
$3,615,041 | $(259,326,596 ) | $(492,632,223 ) |
Allspring Funds Trust:

Interest rate | Maturity date | Principal | Value | |||
Agency securities: 37.26% | ||||||
FHLB | 1.00 % | 9-30-2031 | $ | 8,020,000 | $6,648,135 | |
FHLMC¤ | 0.00 | 12-14-2029 | 6,390,000 | 4,948,872 | ||
FHLMC Series 5119 Class AB | 1.50 | 8-25-2049 | 3,261,933 | 2,598,114 | ||
FHLMC Series 5091 Class AB | 1.50 | 3-25-2051 | 6,177,784 | 4,989,288 | ||
FHLMC Series 4205 Class PA | 1.75 | 5-15-2043 | 1,680,108 | 1,443,663 | ||
FHLMC | 2.00 | 6-1-2040 | 9,290,954 | 8,058,700 | ||
FHLMC | 2.00 | 7-1-2040 | 9,549,503 | 8,282,915 | ||
FHLMC | 2.00 | 8-1-2040 | 9,898,696 | 8,578,132 | ||
FHLMC | 2.00 | 11-1-2040 | 13,123,313 | 11,342,077 | ||
FHLMC | 2.00 | 12-1-2040 | 3,238,471 | 2,786,549 | ||
FHLMC | 2.00 | 1-1-2041 | 2,509,931 | 2,166,140 | ||
FHLMC | 2.00 | 2-1-2041 | 2,570,218 | 2,216,417 | ||
FHLMC | 2.00 | 4-1-2041 | 2,832,652 | 2,437,448 | ||
FHLMC | 2.00 | 7-1-2041 | 4,313,195 | 3,703,384 | ||
FHLMC | 2.00 | 11-1-2041 | 4,969,707 | 4,249,559 | ||
FHLMC | 2.00 | 12-1-2041 | 12,511,274 | 10,695,817 | ||
FHLMC | 2.00 | 1-1-2042 | 3,282,865 | 2,806,489 | ||
FHLMC | 2.00 | 2-1-2042 | 18,198,456 | 15,551,698 | ||
FHLMC | 2.00 | 4-1-2042 | 9,635,448 | 8,241,994 | ||
FHLMC Series 2015-8 Class AP | 2.00 | 3-25-2045 | 4,783,635 | 4,191,123 | ||
FHLMC | 2.00 | 2-1-2047 | 2,138,080 | 1,768,309 | ||
FHLMC Series 5300 Class C | 2.00 | 9-25-2047 | 5,582,908 | 5,118,412 | ||
FHLMC Series 5143 Class GA | 2.00 | 6-25-2049 | 1,957,631 | 1,624,565 | ||
FHLMC | 2.00 | 12-1-2051 | 1,509,421 | 1,248,115 | ||
FHLMC Series 4446 Class CP | 2.25 | 3-15-2045 | 2,250,263 | 1,989,308 | ||
FHLMC (12 Month LIBOR +1.64%)± | 2.30 | 8-1-2043 | 459,988 | 467,259 | ||
FHLMC (12 Month LIBOR +1.64%)± | 2.38 | 7-1-2043 | 254,795 | 258,428 | ||
FHLMC | 2.50 | 4-1-2042 | 1,432,148 | 1,253,170 | ||
FHLMC | 2.50 | 5-1-2042 | 6,298,424 | 5,468,749 | ||
FHLMC | 2.50 | 6-1-2042 | 2,219,081 | 1,941,306 | ||
FHLMC Series 5201 Class CA | 2.50 | 7-25-2048 | 4,064,577 | 3,623,599 | ||
FHLMC Series 5203 Class G | 2.50 | 11-25-2048 | 1,842,361 | 1,618,344 | ||
FHLMC Series 5178 Class TP | 2.50 | 4-25-2049 | 4,607,542 | 4,006,186 | ||
FHLMC Series 5182 Class M | 2.50 | 5-25-2049 | 2,817,810 | 2,470,077 | ||
FHLMC Series 5202 Class LA | 2.50 | 5-25-2049 | 4,160,404 | 3,636,947 | ||
FHLMC Series 5217 Class CD | 2.50 | 7-25-2049 | 3,489,917 | 3,150,364 | ||
FHLMC | 2.50 | 9-1-2051 | 10,791,855 | 9,349,852 | ||
FHLMC | 2.50 | 2-1-2052 | 1,163,732 | 1,001,755 | ||
FHLMC | 2.50 | 3-1-2052 | 3,717,548 | 3,192,846 | ||
FHLMC (12 Month LIBOR +1.63%)± | 2.51 | 11-1-2043 | 511,293 | 515,596 | ||
FHLMC (12 Month LIBOR +1.61%)± | 2.56 | 9-1-2043 | 243,972 | 246,817 | ||
FHLMC (12 Month LIBOR +1.61%)± | 2.69 | 10-1-2043 | 532,360 | 537,187 | ||
FHLMC (12 Month LIBOR +1.65%)± | 2.81 | 10-1-2043 | 853,816 | 868,632 | ||
FHLMC (12 Month LIBOR +1.64%)± | 2.82 | 5-1-2049 | 1,811,480 | 1,759,489 | ||
FHLMC | 3.00 | 4-1-2040 | 2,862,545 | 2,633,770 | ||
FHLMC | 3.00 | 4-1-2043 | 3,384,636 | 3,080,753 | ||
FHLMC | 3.00 | 8-1-2043 | 5,108,270 | 4,649,623 | ||
FHLMC | 3.00 | 9-1-2046 | 5,244,853 | 4,761,977 | ||
Interest rate | Maturity date | Principal | Value | |||
Agency securities (continued) | ||||||
FHLMC | 3.00 % | 1-1-2047 | $ | 4,195,270 | $3,802,965 | |
FHLMC | 3.00 | 2-1-2047 | 3,864,453 | 3,501,592 | ||
FHLMC Series 4719 Class LM | 3.00 | 9-15-2047 | 1,900,505 | 1,732,033 | ||
FHLMC Series 4742 Class PA | 3.00 | 10-15-2047 | 3,945,941 | 3,608,502 | ||
FHLMC Series 4880 Class DA | 3.00 | 5-15-2050 | 3,236,893 | 2,972,423 | ||
FHLMC (12 Month LIBOR +1.72%)± | 3.16 | 1-1-2044 | 1,005,697 | 1,020,678 | ||
FHLMC | 3.50 | 6-1-2046 | 2,303,237 | 2,147,624 | ||
FHLMC | 3.50 | 10-1-2046 | 1,888,498 | 1,765,334 | ||
FHLMC (12 Month LIBOR +1.64%)± | 3.83 | 3-1-2049 | 2,409,026 | 2,394,149 | ||
FHLMC (30 Day Average U.S. SOFR +2.13%)± | 3.91 | 7-1-2052 | 2,201,349 | 2,107,217 | ||
FHLMC (30 Day Average U.S. SOFR +2.14%)± | 3.99 | 8-1-2052 | 3,078,802 | 2,921,408 | ||
FHLMC | 4.00 | 4-1-2037 | 1,190,314 | 1,161,256 | ||
FHLMC | 4.00 | 7-1-2049 | 7,585,780 | 7,340,827 | ||
FHLMC (30 Day Average U.S. SOFR +2.38%)± | 4.12 | 9-1-2052 | 1,747,991 | 1,680,771 | ||
FHLMC | 4.20 | 5-1-2053 | 9,241,076 | 8,965,070 | ||
FHLMC (30 Day Average U.S. SOFR +2.13%)± | 4.30 | 7-1-2052 | 2,603,268 | 2,517,093 | ||
FHLMC (12 Month LIBOR +1.64%)± | 4.35 | 9-1-2045 | 4,640,108 | 4,729,998 | ||
FHLMC (12 Month LIBOR +1.64%)± | 4.47 | 4-1-2048 | 5,522,535 | 5,521,132 | ||
FHLMC | 4.50 | 6-1-2039 | 185,646 | 183,952 | ||
FHLMC | 4.50 | 7-1-2039 | 223,126 | 222,321 | ||
FHLMC (12 Month LIBOR +1.69%)± | 4.80 | 9-1-2047 | 4,853,873 | 4,927,924 | ||
FHLMC Series 5119 Class QF (30 Day Average U.S. SOFR +0.20%)± | 5.02 | 6-25-2051 | 3,924,699 | 3,728,361 | ||
FHLMC Series 4793 Class FD (1 Month LIBOR +0.30%)± | 5.41 | 6-15-2048 | 697,968 | 669,173 | ||
FHLMC Series 4826 Class KF (1 Month LIBOR +0.30%)± | 5.41 | 9-15-2048 | 1,450,792 | 1,391,689 | ||
FHLMC Series 2017-78 Class FC | 5.49 | 10-25-2047 | 2,847,403 | 2,748,823 | ||
FHLMC Series 5004 Class FM (1 Month LIBOR +0.35%)± | 5.49 | 8-25-2050 | 2,780,183 | 2,655,232 | ||
FHLMC (12 Month LIBOR +1.77%)± | 5.50 | 9-1-2042 | 415,619 | 424,953 | ||
FHLMC Series 4122 Class FP | 5.51 | 10-15-2042 | 3,546,737 | 3,462,460 | ||
FHLMC Series 4993 Class KF (1 Month LIBOR +0.45%)± | 5.59 | 7-25-2050 | 12,992,454 | 12,418,733 | ||
FHLMC Series 4240 Class FA (1 Month LIBOR +0.50%)± | 5.61 | 8-15-2043 | 4,739,133 | 4,637,109 | ||
FHLMC Series 4248 Class FT | 5.61 | 9-15-2043 | 1,764,220 | 1,719,474 | ||
FHLMC Series 4631 Class FA | 5.61 | 11-15-2046 | 3,356,019 | 3,251,131 | ||
FHLMC (12 Month LIBOR +1.69%)± | 6.28 | 2-1-2043 | 674,773 | 684,589 | ||
FHLMC Series 1897 Class K | 7.00 | 9-15-2026 | 92 | 92 | ||
FHLMC (12 Month LIBOR +1.65%)± | 7.04 | 3-1-2043 | 408,974 | 415,000 | ||
FHLMC STRIPS Series 264 Class 30 | 3.00 | 7-15-2042 | 5,333,221 | 4,895,832 | ||
FHLMC STRIPS Series 271 Class F5 (1 Month LIBOR +0.50%)± | 5.61 | 8-15-2042 | 1,642,440 | 1,601,329 | ||
FHLMC STRIPS Series 272 Class F1 (1 Month LIBOR +0.50%)± | 5.61 | 8-15-2042 | 2,529,025 | 2,473,896 | ||
FHLMC STRIPS Series 280 Class F1 (1 Month LIBOR +0.50%)± | 5.61 | 9-15-2042 | 2,604,757 | 2,548,135 | ||
FNMA | 1.50 | 10-1-2041 | 14,102,057 | 11,506,409 | ||
FNMA | 1.50 | 11-1-2041 | 39,487,949 | 32,203,376 | ||
FNMA Series 2012-151 Class NX | 1.50 | 1-25-2043 | 1,968,567 | 1,672,016 | ||
FNMA Series 2013-11 Class AP | 1.50 | 1-25-2043 | 6,317,527 | 5,614,527 | ||
FNMA Series 2021-27 Class EC | 1.50 | 5-25-2051 | 9,971,519 | 7,971,203 | ||
FNMA | 1.50 | 7-1-2051 | 16,947,921 | 13,207,877 | ||
FNMA Series 2021-78 Class ND | 1.50 | 11-25-2051 | 5,673,560 | 4,694,934 | ||
FNMA | 1.52 | 8-21-2035 | 8,018,000 | 5,731,867 | ||
Interest rate | Maturity date | Principal | Value | |||
Agency securities (continued) | ||||||
FNMA (30 Day Average U.S. SOFR +2.21%)± | 1.60 % | 12-1-2051 | $ | 1,367,952 | $1,226,117 | |
FNMA Series 2015-84 Class PA | 1.70 | 8-25-2033 | 7,244,834 | 6,545,803 | ||
FNMA Series 2013-43 Class BP | 1.75 | 5-25-2043 | 2,319,805 | 1,995,890 | ||
FNMA Series 2016-57 Class PC | 1.75 | 6-25-2046 | 14,800,419 | 12,436,546 | ||
FNMA | 1.90 | 1-25-2036 | 7,437,000 | 5,512,703 | ||
FNMA Series 2016-48 Class MA | 2.00 | 6-25-2038 | 7,276,445 | 6,575,139 | ||
FNMA | 2.00 | 6-1-2040 | 3,122,071 | 2,708,016 | ||
FNMA | 2.00 | 7-1-2040 | 9,435,615 | 8,184,243 | ||
FNMA | 2.00 | 9-1-2040 | 10,569,730 | 9,151,604 | ||
FNMA | 2.00 | 10-1-2040 | 11,606,090 | 9,987,934 | ||
FNMA | 2.00 | 11-1-2040 | 10,278,449 | 8,882,951 | ||
FNMA | 2.00 | 12-1-2040 | 57,809,526 | 49,919,402 | ||
FNMA | 2.00 | 1-1-2041 | 19,796,730 | 17,085,380 | ||
FNMA | 2.00 | 2-1-2041 | 11,154,183 | 9,589,842 | ||
FNMA | 2.00 | 4-1-2041 | 1,820,274 | 1,569,946 | ||
FNMA | 2.00 | 5-1-2041 | 21,077,451 | 18,133,790 | ||
FNMA | 2.00 | 6-1-2041 | 1,265,840 | 1,087,757 | ||
FNMA | 2.00 | 7-1-2041 | 19,976,730 | 17,153,465 | ||
FNMA | 2.00 | 8-1-2041 | 1,440,108 | 1,235,606 | ||
FNMA | 2.00 | 10-1-2041 | 7,350,869 | 6,316,151 | ||
FNMA | 2.00 | 11-1-2041 | 3,648,001 | 3,120,351 | ||
FNMA | 2.00 | 1-1-2042 | 7,911,025 | 6,762,055 | ||
FNMA | 2.00 | 2-1-2042 | 59,925,135 | 51,262,317 | ||
FNMA | 2.00 | 3-1-2042 | 20,428,849 | 17,448,139 | ||
FNMA | 2.00 | 4-1-2042 | 3,783,074 | 3,238,175 | ||
FNMA | 2.00 | 5-1-2042 | 2,287,910 | 1,959,426 | ||
FNMA | 2.00 | 8-1-2042 | 4,243,799 | 3,626,597 | ||
FNMA | 2.00 | 4-1-2046 | 10,912,591 | 9,061,955 | ||
FNMA | 2.00 | 1-1-2047 | 1,988,089 | 1,646,716 | ||
FNMA | 2.00 | 3-1-2047 | 14,435,281 | 11,952,869 | ||
FNMA Series 2022-28 Class CA | 2.00 | 1-25-2048 | 3,364,826 | 2,987,525 | ||
FNMA Series 2020-48 Class AB | 2.00 | 7-25-2050 | 3,425,106 | 2,851,785 | ||
FNMA Series 2020-48 Class DA | 2.00 | 7-25-2050 | 7,648,837 | 6,432,398 | ||
FNMA | 2.50 | 12-1-2035 | 12,158,044 | 11,255,727 | ||
FNMA | 2.50 | 5-1-2036 | 6,362,879 | 5,882,826 | ||
FNMA | 2.50 | 6-1-2036 | 7,571,080 | 7,000,023 | ||
FNMA | 2.50 | 12-1-2040 | 6,692,380 | 5,947,340 | ||
FNMA | 2.50 | 5-1-2041 | 7,071,057 | 6,249,557 | ||
FNMA | 2.50 | 8-1-2041 | 3,943,812 | 3,442,938 | ||
FNMA | 2.50 | 2-1-2042 | 4,073,812 | 3,616,065 | ||
FNMA | 2.50 | 4-1-2042 | 8,127,868 | 7,112,104 | ||
FNMA | 2.50 | 5-1-2042 | 5,166,221 | 4,520,606 | ||
FNMA | 2.50 | 6-1-2042 | 4,778,874 | 4,180,673 | ||
FNMA | 2.50 | 5-1-2046 | 1,980,284 | 1,723,109 | ||
FNMA Series 2018-8 Class KL | 2.50 | 3-25-2047 | 2,551,358 | 2,250,178 | ||
FNMA Series 2022-11 Class A | 2.50 | 7-25-2047 | 9,349,742 | 8,437,202 | ||
FNMA | 2.50 | 12-1-2047 | 9,692,070 | 8,650,572 | ||
FNMA | 2.50 | 10-1-2050 | 6,344,188 | 5,496,731 | ||
Interest rate | Maturity date | Principal | Value | |||
Agency securities (continued) | ||||||
FNMA Series 2021-78 Class PA | 2.50 % | 11-25-2051 | $ | 3,632,361 | $3,164,934 | |
FNMA | 2.50 | 3-1-2052 | 4,644,147 | 3,994,277 | ||
FNMA%% | 2.50 | 6-13-2053 | 47,800,000 | 40,862,465 | ||
FNMA (12 Month LIBOR +1.56%)± | 2.80 | 6-1-2043 | 328,008 | 335,393 | ||
FNMA (12 Month LIBOR +1.60%)± | 2.98 | 3-1-2050 | 5,551,758 | 5,391,894 | ||
FNMA | 3.00 | 5-1-2040 | 6,630,866 | 6,083,890 | ||
FNMA Series 2020-45 Class JL | 3.00 | 7-25-2040 | 4,204,686 | 3,829,593 | ||
FNMA | 3.00 | 11-1-2042 | 3,569,883 | 3,249,053 | ||
FNMA | 3.00 | 1-1-2043 | 4,302,045 | 3,919,103 | ||
FNMA | 3.00 | 2-1-2043 | 17,435,563 | 15,716,706 | ||
FNMA | 3.00 | 7-1-2043 | 2,767,069 | 2,518,343 | ||
FNMA | 3.00 | 8-1-2043 | 3,844,921 | 3,499,314 | ||
FNMA | 3.00 | 9-1-2043 | 3,016,050 | 2,745,284 | ||
FNMA | 3.00 | 12-1-2043 | 3,617,891 | 3,293,031 | ||
FNMA | 3.00 | 2-1-2044 | 3,700,618 | 3,368,357 | ||
FNMA Series 2014-25 Class EL | 3.00 | 5-25-2044 | 2,387,682 | 2,176,289 | ||
FNMA | 3.00 | 10-1-2044 | 18,722,653 | 16,884,761 | ||
FNMA | 3.00 | 2-1-2045 | 5,953,142 | 5,412,824 | ||
FNMA Series 2017-13 Class PA | 3.00 | 8-25-2046 | 2,076,105 | 1,919,645 | ||
FNMA | 3.00 | 10-1-2046 | 10,781,393 | 9,793,878 | ||
FNMA | 3.00 | 11-1-2046 | 10,877,359 | 9,876,981 | ||
FNMA | 3.00 | 12-1-2046 | 15,023,059 | 13,659,667 | ||
FNMA | 3.00 | 1-1-2047 | 10,716,475 | 9,702,603 | ||
FNMA | 3.00 | 2-1-2047 | 15,216,050 | 13,803,920 | ||
FNMA | 3.00 | 3-1-2047 | 2,165,963 | 1,960,456 | ||
FNMA | 3.00 | 2-1-2048 | 2,612,085 | 2,369,989 | ||
FNMA Series 2018-14 Class KC | 3.00 | 3-25-2048 | 2,541,381 | 2,370,907 | ||
FNMA | 3.00 | 4-1-2048 | 11,867,373 | 10,801,924 | ||
FNMA Series 2019-25 Class PA | 3.00 | 5-25-2048 | 5,421,082 | 4,967,332 | ||
FNMA | 3.00 | 2-1-2049 | 6,396,940 | 5,797,095 | ||
FNMA | 3.00 | 10-1-2049 | 45,406,064 | 41,329,105 | ||
FNMA | 3.00 | 2-1-2050 | 36,016,606 | 32,693,216 | ||
FNMA | 3.00 | 5-1-2050 | 11,039,427 | 10,067,272 | ||
FNMA | 3.00 | 2-1-2055 | 2,023,291 | 1,821,421 | ||
FNMA | 3.00 | 7-1-2060 | 25,755,588 | 22,163,570 | ||
FNMA (12 Month LIBOR +1.58%)± | 3.29 | 10-1-2043 | 1,168,359 | 1,185,912 | ||
FNMA | 3.50 | 3-1-2042 | 2,333,860 | 2,202,302 | ||
FNMA | 3.50 | 4-1-2042 | 4,883,122 | 4,607,850 | ||
FNMA | 3.50 | 11-1-2042 | 1,941,162 | 1,831,721 | ||
FNMA | 3.50 | 12-1-2043 | 9,337,676 | 8,767,595 | ||
FNMA | 3.50 | 2-1-2046 | 5,072,345 | 4,757,096 | ||
FNMA | 3.50 | 7-1-2047 | 23,866,102 | 22,521,712 | ||
FNMA | 3.50 | 7-1-2048 | 1,648,435 | 1,531,413 | ||
FNMA Series 2018-85 Class EA | 3.50 | 12-25-2048 | 2,042,034 | 1,943,271 | ||
FNMA | 3.50 | 4-1-2050 | 13,350,907 | 12,463,477 | ||
FNMA (30 Day Average U.S. SOFR +2.37%)± | 3.68 | 8-1-2052 | 3,389,796 | 3,235,082 | ||
FNMA (30 Day Average U.S. SOFR +2.12%)± | 3.97 | 8-1-2052 | 2,239,051 | 2,129,713 | ||
FNMA | 4.00 | 1-1-2027 | 9,208,935 | 9,044,781 | ||
Interest rate | Maturity date | Principal | Value | |||
Agency securities (continued) | ||||||
FNMA | 4.00 % | 9-1-2033 | $ | 1,354,190 | $1,326,191 | |
FNMA | 4.00 | 3-1-2035 | 22,344,366 | 21,945,215 | ||
FNMA | 4.00 | 10-1-2037 | 982,374 | 964,631 | ||
FNMA | 4.00 | 6-1-2038 | 1,843,617 | 1,810,367 | ||
FNMA | 4.00 | 9-1-2045 | 586,593 | 570,714 | ||
FNMA | 4.00 | 1-1-2046 | 4,204,784 | 4,090,964 | ||
FNMA | 4.00 | 4-1-2047 | 1,072,082 | 1,032,527 | ||
FNMA | 4.00 | 10-1-2047 | 895,670 | 870,728 | ||
FNMA | 4.00 | 7-1-2048 | 13,238,239 | 12,768,835 | ||
FNMA | 4.00 | 12-1-2048 | 2,119,854 | 2,065,623 | ||
FNMA | 4.00 | 5-1-2049 | 2,210,777 | 2,137,966 | ||
FNMA (12 Month LIBOR +1.58%)± | 4.04 | 6-1-2045 | 1,516,698 | 1,523,293 | ||
FNMA (30 Day Average U.S. SOFR +2.12%)± | 4.14 | 9-1-2052 | 4,581,338 | 4,462,492 | ||
FNMA (30 Day Average U.S. SOFR +2.13%)± | 4.15 | 10-1-2052 | 11,446,063 | 11,130,632 | ||
FNMA (30 Day Average U.S. SOFR +2.12%)± | 4.17 | 7-1-2052 | 5,457,918 | 5,230,235 | ||
FNMA (12 Month LIBOR +1.58%)± | 4.18 | 1-1-2046 | 3,760,890 | 3,779,126 | ||
FNMA (30 Day Average U.S. SOFR +2.37%)± | 4.23 | 9-1-2052 | 1,673,583 | 1,618,371 | ||
FNMA (30 Day Average U.S. SOFR +2.13%)± | 4.25 | 11-1-2052 | 3,871,798 | 3,776,422 | ||
FNMA (30 Day Average U.S. SOFR +2.13%)± | 4.31 | 8-1-2052 | 6,195,463 | 6,017,794 | ||
FNMA (30 Day Average U.S. SOFR +2.12%)± | 4.36 | 7-1-2052 | 5,799,334 | 5,639,898 | ||
FNMA | 4.50 | 6-1-2041 | 173,703 | 172,750 | ||
FNMA | 4.50 | 3-1-2043 | 2,242,280 | 2,229,982 | ||
FNMA | 4.50 | 10-1-2045 | 3,499,348 | 3,458,512 | ||
FNMA | 4.50 | 2-1-2046 | 90,265 | 89,107 | ||
FNMA | 4.50 | 7-1-2048 | 3,459,304 | 3,416,971 | ||
FNMA | 4.50 | 11-1-2048 | 1,517,127 | 1,512,466 | ||
FNMA (30 Day Average U.S. SOFR +2.13%)± | 4.62 | 8-1-2052 | 6,683,648 | 6,548,371 | ||
FNMA (30 Day Average U.S. SOFR +2.12%)± | 4.64 | 8-1-2052 | 5,157,796 | 5,034,630 | ||
FNMA (30 Day Average U.S. SOFR +2.13%)± | 4.66 | 8-1-2052 | 5,058,711 | 4,962,563 | ||
FNMA Series 2015-32 Class FA (1 Month LIBOR +0.30%)± | 5.44 | 5-25-2045 | 2,283,043 | 2,208,097 | ||
FNMA Series 2015-26 Class GF (1 Month LIBOR +0.30%)± | 5.44 | 5-25-2045 | 3,775,534 | 3,667,879 | ||
FNMA Series 2015-48 Class FB (1 Month LIBOR +0.30%)± | 5.44 | 7-25-2045 | 2,830,482 | 2,741,851 | ||
FNMA Series 2018-85 Class FE (1 Month LIBOR +0.30%)± | 5.44 | 12-25-2048 | 6,350,690 | 6,152,985 | ||
FNMA Series 2012-133 Class JF (1 Month LIBOR +0.35%)± | 5.49 | 12-25-2042 | 2,167,937 | 2,107,256 | ||
FNMA Series 2013-15 Class FA (1 Month LIBOR +0.35%)± | 5.49 | 3-25-2043 | 2,632,441 | 2,561,487 | ||
FNMA Series 2015-20 Class EF (1 Month LIBOR +0.35%)± | 5.49 | 4-25-2045 | 6,060,111 | 5,879,177 | ||
FNMA | 5.50 | 9-1-2052 | 4,321,643 | 4,457,115 | ||
FNMA%% | 5.50 | 6-13-2053 | 16,000,000 | 15,990,000 | ||
FNMA Series 2019-43 Class FC (1 Month LIBOR +0.40%)± | 5.54 | 8-25-2049 | 2,896,330 | 2,794,550 | ||
FNMA Series 2019-67 Class FB (1 Month LIBOR +0.45%)± | 5.59 | 11-25-2049 | 1,427,804 | 1,380,990 | ||
FNMA Series 2020-34 Class F (1 Month LIBOR +0.45%)± | 5.59 | 6-25-2050 | 1,989,081 | 1,917,876 | ||
FNMA Series 2019-15 Class FA (1 Month LIBOR +0.50%)± | 5.64 | 4-25-2049 | 1,439,267 | 1,396,060 | ||
FNMA | 6.00 | 2-1-2029 | 1,125 | 1,139 | ||
FNMA | 6.00 | 3-1-2033 | 15,156 | 15,637 | ||
FNMA | 6.00 | 11-1-2033 | 5,231 | 5,406 | ||
FNMA%% | 6.00 | 6-13-2053 | 36,900,000 | 37,332,422 | ||
FNMA%% | 6.00 | 7-13-2053 | 50,300,000 | 50,881,594 | ||
FNMA%% | 6.00 | 8-14-2053 | 68,100,000 | 68,834,203 | ||
Interest rate | Maturity date | Principal | Value | |||
Agency securities (continued) | ||||||
FNMA (12 Month LIBOR +1.64%)± | 6.13 % | 1-1-2043 | $ | 247,831 | $251,640 | |
FNMA | 6.50 | 11-1-2052 | 1,850,900 | 1,960,146 | ||
FNMA | 6.50 | 12-1-2052 | 1,337,452 | 1,419,809 | ||
FNMA | 6.50 | 2-1-2053 | 981,567 | 1,042,011 | ||
FNMA (12 Month LIBOR +1.56%)± | 6.95 | 3-1-2043 | 57,068 | 56,598 | ||
FNMA | 7.00 | 2-1-2053 | 3,745,930 | 3,871,638 | ||
FNMA Interest STRIPS Series 414 Class A35 | 3.50 | 10-25-2042 | 4,856,395 | 4,582,533 | ||
FNMA Principal STRIPS¤ | 0.00 | 11-15-2030 | 18,777,000 | 13,840,124 | ||
GNMA Series 2021-23 Class MG | 1.50 | 2-20-2051 | 7,521,143 | 6,214,892 | ||
GNMA Series 2022-205 Class A | 2.00 | 9-20-2051 | 4,350,884 | 3,546,300 | ||
GNMA Series 2017-167 Class BQ | 2.50 | 8-20-2044 | 2,516,847 | 2,303,486 | ||
GNMA Series 2022-31 Class GH | 2.50 | 12-20-2049 | 7,909,274 | 7,025,070 | ||
GNMA Series 2022-107 Class C | 2.50 | 6-20-2051 | 11,846,710 | 10,106,939 | ||
GNMA Series 2022-50 Class DC | 2.50 | 8-20-2051 | 3,606,518 | 3,108,751 | ||
GNMA Series 2022-84 Class A | 2.50 | 1-20-2052 | 4,187,758 | 3,595,282 | ||
GNMA | 3.00 | 6-20-2043 | 4,233,969 | 3,832,267 | ||
GNMA | 3.00 | 8-20-2043 | 1,332,693 | 1,206,249 | ||
GNMA | 3.00 | 10-20-2046 | 608,149 | 544,198 | ||
GNMA | 3.00 | 12-20-2046 | 2,149,652 | 1,923,784 | ||
GNMA | 3.00 | 1-20-2047 | 2,445,552 | 2,187,735 | ||
GNMA | 3.00 | 3-20-2047 | 2,376,967 | 2,126,404 | ||
GNMA | 3.00 | 4-20-2047 | 3,297,581 | 2,949,974 | ||
GNMA | 3.00 | 5-20-2047 | 575,078 | 514,455 | ||
GNMA | 3.00 | 7-20-2047 | 2,397,176 | 2,144,475 | ||
GNMA | 3.00 | 9-20-2047 | 1,823,430 | 1,631,197 | ||
GNMA | 3.00 | 11-15-2047 | 11,042,226 | 10,207,911 | ||
GNMA | 3.00 | 11-20-2047 | 871,520 | 779,641 | ||
GNMA | 3.00 | 12-20-2047 | 236,318 | 211,404 | ||
GNMA | 3.00 | 1-20-2048 | 1,402,836 | 1,254,944 | ||
GNMA | 3.00 | 2-20-2048 | 1,059,784 | 948,809 | ||
GNMA | 3.00 | 3-20-2048 | 362,557 | 324,336 | ||
GNMA | 3.00 | 10-20-2050 | 9,557,438 | 8,625,093 | ||
GNMA | 3.50 | 1-20-2048 | 2,315,603 | 2,176,792 | ||
GNMA | 4.00 | 3-20-2048 | 633,079 | 604,330 | ||
GNMA | 4.00 | 4-20-2048 | 2,312,800 | 2,207,878 | ||
GNMA | 4.50 | 8-15-2047 | 401,327 | 401,596 | ||
GNMA | 4.50 | 6-20-2048 | 2,485,462 | 2,447,085 | ||
GNMA | 4.50 | 2-20-2049 | 2,849,868 | 2,734,088 | ||
GNMA Series 2012-141 Class WA±± | 4.52 | 11-16-2041 | 797,704 | 783,362 | ||
GNMA Series 2021-8 Class CY | 5.00 | 1-20-2051 | 931,452 | 929,861 | ||
GNMA Series 2021-27 Class CW±± | 5.00 | 2-20-2051 | 1,410,482 | 1,407,895 | ||
GNMA Series 2021-27 Class BD | 5.00 | 2-20-2051 | 2,370,876 | 2,401,432 | ||
GNMA Series 2021-27 Class Q | 5.00 | 2-20-2051 | 2,498,704 | 2,456,912 | ||
GNMA Series 2021-27 Class NT | 5.00 | 2-20-2051 | 2,877,815 | 2,821,535 | ||
GNMA Series 2022-197 Class LF (30 Day Average U.S. SOFR +0.70%)± | 5.63 | 11-20-2052 | 10,270,943 | 10,216,231 | ||
GNMA | 6.00 | 1-20-2053 | 4,902,916 | 5,026,090 | ||
Interest rate | Maturity date | Principal | Value | |||
Agency securities (continued) | ||||||
GNMA%% | 6.00 % | 6-20-2053 | $ | 39,400,000 | $39,775,531 | |
GNMA%% | 6.00 | 7-20-2053 | 39,000,000 | 39,353,437 | ||
Total agency securities (Cost $1,790,403,880) | 1,737,506,349 | |||||
Asset-backed securities: 10.93% | ||||||
Ally Auto Receivables Trust Series 2022-3 Class A4 | 5.07 | 6-15-2031 | 1,860,000 | 1,868,092 | ||
American Express Credit Account Master Trust Series 2022-3 Class A | 3.75 | 8-15-2027 | 2,972,000 | 2,903,055 | ||
Americredit Automobile Receivables Trust Series 2023-1 Class A3 | 5.62 | 11-18-2027 | 4,948,000 | 4,961,911 | ||
AmeriCredit Automobile Receivables Trust Series 2022-1 Class A3 | 2.45 | 11-18-2026 | 1,432,000 | 1,381,058 | ||
AmeriCredit Automobile Receivables Trust Series 2022-2 Class A3 | 4.38 | 4-18-2028 | 3,567,000 | 3,506,537 | ||
Avis Budget Rental Car Funding AESOP LLC Series 2021-2A Class A144A | 1.66 | 2-20-2028 | 3,391,000 | 2,985,654 | ||
Avis Budget Rental Car Funding AESOP LLC Series 2019-3A Class A144A | 2.36 | 3-20-2026 | 3,825,000 | 3,613,401 | ||
Avis Budget Rental Car Funding AESOP LLC Series 2022-4A Class A144A | 4.77 | 2-20-2029 | 1,924,000 | 1,878,219 | ||
Avis Budget Rental Car Funding AESOP LLC Series 2023-2A Class A144A | 5.20 | 10-20-2027 | 4,141,000 | 4,110,009 | ||
Avis Budget Rental Car Funding AESOP LLC Series 2023-1A Class A144A | 5.25 | 4-20-2029 | 7,384,000 | 7,324,448 | ||
Avis Budget Rental Car Funding AESOP LLC Series 2023-4A Class A144A | 5.49 | 6-20-2029 | 8,703,000 | 8,681,048 | ||
Avis Budget Rental Car Funding AESOP LLC Series 2023-6A Class A144A%% | 5.81 | 12-20-2029 | 7,132,000 | 7,102,469 | ||
Barclays Dryrock Issuance Trust Series 2023-1 Class A | 4.72 | 2-15-2029 | 4,148,000 | 4,130,034 | ||
BMW Vehicle Lease Trust Series 2023-1 Class A4 | 5.07 | 6-25-2026 | 2,481,000 | 2,470,502 | ||
Capital One Multi-Asset Execution Trust Series 2022-A2 Class A | 3.49 | 5-15-2027 | 5,110,000 | 4,973,109 | ||
Capital One Multi-Asset Execution Trust Series 2023-A1 Class A | 4.42 | 5-15-2028 | 8,407,000 | 8,356,298 | ||
Capital One Prime Auto Receivables Trust Series 2023-1 Class A4 | 4.76 | 8-15-2028 | 3,423,000 | 3,414,336 | ||
Capital One Prime Auto Receivables Trust Series 2023-1 Class A3 | 4.87 | 2-15-2028 | 10,269,000 | 10,241,672 | ||
Chase Auto Owner Trust Series 2022-AA Class A4144A | 3.99 | 3-27-2028 | 2,419,000 | 2,365,830 | ||
College Avenue Student Loans LLC Series 2019-A Class A2144A | 3.28 | 12-28-2048 | 2,005,001 | 1,845,553 | ||
College Avenue Student Loans LLC Series 2018-A Class A2144A | 4.13 | 12-26-2047 | 1,193,743 | 1,129,613 | ||
College Avenue Student Loans LLC Series 2017-A Class A1 (1 Month LIBOR +1.65%)144A± | 6.79 | 11-26-2046 | 1,425,501 | 1,421,563 | ||
Discover Card Execution Note Trust Series 2022-A3 Class A3 | 3.56 | 7-15-2027 | 10,261,000 | 9,988,904 | ||
Discover Card Execution Note Trust Series 2023-A1 Class A | 4.31 | 3-15-2028 | 8,282,000 | 8,187,360 | ||
Discover Card Execution Note Trust Series 2022-A4 Class A | 5.03 | 10-15-2027 | 1,476,000 | 1,482,542 | ||
Enterprise Fleet Financing LLC Series 2023-1 Class A3144A | 5.42 | 10-22-2029 | 3,036,000 | 3,056,367 | ||
Enterprise Fleet Financing LLC Series 2023-1 Class A2144A | 5.51 | 1-22-2029 | 4,926,000 | 4,910,959 | ||
Ford Credit Auto Lease Trust Series 2023-A Class A4 | 4.83 | 5-15-2026 | 2,649,000 | 2,628,038 | ||
Ford Credit Auto Owner Trust Series 2022-1 Class A144A | 3.88 | 11-15-2034 | 11,752,000 | 11,329,486 | ||
Ford Credit Auto Owner Trust Series 2022-C Class A4 | 4.59 | 12-15-2027 | 4,273,000 | 4,237,645 | ||
Ford Credit Auto Owner Trust Series 2023-A Class A3 | 4.65 | 2-15-2028 | 7,598,000 | 7,564,317 | ||
Ford Credit Auto Owner Trust Series 2023-1 Class A144A | 4.85 | 8-15-2035 | 12,829,000 | 12,782,816 | ||
Ford Credit Auto Owner Trust Series 2022-D Class A4 | 5.30 | 3-15-2028 | 1,673,000 | 1,688,278 | ||
Interest rate | Maturity date | Principal | Value | |||
Asset-backed securities (continued) | ||||||
Ford Credit Floorplan Master Owner Trust A Series 2023-1 Class A1144A | 4.92 % | 5-15-2028 | $ | 10,176,000 | $10,115,669 | |
GM Financial Automobile Leasing Trust Series 2023-2 Class A3 | 5.05 | 7-20-2026 | 4,944,000 | 4,928,570 | ||
GM Financial Automobile Leasing Trust Series 2023-2 Class A4 | 5.09 | 5-20-2027 | 2,343,000 | 2,339,856 | ||
GM Financial Automobile Leasing Trust Series 2023-1 Class A4 | 5.16 | 1-20-2027 | 3,702,000 | 3,698,882 | ||
GM Financial Consumer Automobile Receivables Trust Series 2022-2 Class A3 | 3.10 | 2-16-2027 | 8,146,000 | 7,888,691 | ||
GM Financial Consumer Automobile Receivables Trust Series 2022-2 Class A4 | 3.25 | 4-17-2028 | 5,291,000 | 5,078,288 | ||
GM Financial Consumer Automobile Receivables Trust Series 2022-4 Class A3 | 4.82 | 8-16-2027 | 3,022,000 | 3,004,644 | ||
GM Financial Revolving Receivables Trust Series 2023-1 Class A144A | 5.12 | 4-11-2035 | 6,953,000 | 6,988,334 | ||
GM Financial Revolving Receivables Trust Series 2022-1 Class A144A | 5.91 | 10-11-2035 | 4,422,000 | 4,601,009 | ||
Hertz Vehicle Financing III LLC Series 2022-1A Class A144A | 1.99 | 6-25-2026 | 8,169,000 | 7,612,127 | ||
Hertz Vehicle Financing III LLC Series 2023-2A Class A144A | 5.57 | 9-25-2029 | 8,139,000 | 8,250,454 | ||
Hertz Vehicle Financing III LP Series 2021-2A Class A144A | 1.68 | 12-27-2027 | 4,377,000 | 3,851,517 | ||
Hertz Vehicle Financing LLC Series 2022-4A Class A144A | 3.73 | 9-25-2026 | 1,924,000 | 1,846,475 | ||
Honda Auto Receivables Owner Trust Series 2022-2 Class A4 | 3.76 | 12-18-2028 | 2,317,000 | 2,252,220 | ||
Honda Auto Receivables Owner Trust Series 2023-2 Class A4 | 4.91 | 9-17-2029 | 1,358,000 | 1,360,739 | ||
Honda Auto Receivables Owner Trust Series 2023-1 Class A4 | 4.97 | 6-21-2029 | 4,278,000 | 4,304,429 | ||
Honda Auto Receivables Owner Trust Series 2023-1 Class A3 | 5.04 | 4-21-2027 | 8,900,000 | 8,905,207 | ||
Hyundai Auto Lease Securitization Trust Series 2022-C Class A4144A | 4.48 | 8-17-2026 | 4,938,000 | 4,863,839 | ||
Hyundai Auto Lease Securitization Trust Series 2023-B Class A4144A | 5.17 | 4-15-2027 | 3,749,000 | 3,727,943 | ||
Hyundai Auto Receivables Trust Series 2021-C Class A4 | 1.03 | 12-15-2027 | 2,976,000 | 2,732,863 | ||
Hyundai Auto Receivables Trust Series 2022-A Class A3 | 2.22 | 10-15-2026 | 5,544,000 | 5,320,583 | ||
Hyundai Auto Receivables Trust Series 2022-A Class A4 | 2.35 | 4-17-2028 | 1,708,000 | 1,605,217 | ||
Hyundai Auto Receivables Trust Series 2023-A Class A4 | 4.48 | 7-17-2028 | 3,320,000 | 3,291,650 | ||
Mercedes-Benz Auto Lease Trust Series 2023-A Class A3 | 4.74 | 1-15-2027 | 5,034,000 | 4,980,925 | ||
Mercedes-Benz Auto Receivables Trust Series 2023-1 Class A4 | 4.31 | 4-16-2029 | 2,935,000 | 2,897,323 | ||
Mercedes-Benz Auto Receivables Trust Series 2022-1 Class A4 | 5.25 | 2-15-2029 | 3,874,000 | 3,922,603 | ||
Navient Private Education Loan Trust Series 2014-AA Class A3 (1 Month LIBOR +1.60%)144A± | 6.71 | 10-15-2031 | 2,117,175 | 2,114,065 | ||
Navient Private Education Loan Trust Series 2016-AA Class A2B (1 Month LIBOR +2.15%)144A± | 7.26 | 12-15-2045 | 954,007 | 958,138 | ||
Navient Private Education Refinance Loan Trust Series 2021-A Class A144A | 0.84 | 5-15-2069 | 855,847 | 750,216 | ||
Navient Private Education Refinance Loan Trust Series 2021-BA Class A144A | 0.94 | 7-15-2069 | 1,309,506 | 1,141,554 | ||
Navient Private Education Refinance Loan Trust Series 2021-EA Class A144A | 0.97 | 12-16-2069 | 7,397,512 | 6,313,037 | ||
Navient Private Education Refinance Loan Trust Series 2021-CA Class A144A | 1.06 | 10-15-2069 | 5,416,248 | 4,718,790 | ||
Navient Private Education Refinance Loan Trust Series 2021-FA Class A144A | 1.11 | 2-18-2070 | 4,763,832 | 4,049,568 | ||
Interest rate | Maturity date | Principal | Value | |||
Asset-backed securities (continued) | ||||||
Navient Private Education Refinance Loan Trust Series 2020-GA Class A144A | 1.17 % | 9-16-2069 | $ | 2,596,547 | $2,316,283 | |
Navient Private Education Refinance Loan Trust Series 2020-IA Class A1A144A | 1.33 | 4-15-2069 | 1,509,410 | 1,341,938 | ||
Navient Private Education Refinance Loan Trust Series 2020-BA Class A2144A | 2.12 | 1-15-2069 | 2,103,706 | 1,924,294 | ||
Navient Private Education Refinance Loan Trust Series 2022-A Class A144A | 2.23 | 7-15-2070 | 3,417,366 | 3,001,850 | ||
Navient Private Education Refinance Loan Trust Series 2019-FA Class A2144A | 2.60 | 8-15-2068 | 3,179,636 | 2,946,372 | ||
Navient Private Education Refinance Loan Trust Series 2019-D Class A2A144A | 3.01 | 12-15-2059 | 5,877,094 | 5,486,769 | ||
Navient Private Education Refinance Loan Trust Series 2019-CA Class A2144A | 3.13 | 2-15-2068 | 2,416,863 | 2,294,850 | ||
Navient Private Education Refinance Loan Trust Series 2019-A Class A2A144A | 3.42 | 1-15-2043 | 2,764,127 | 2,663,800 | ||
Navient Private Education Refinance Loan Trust Series 2018-CA Class A2144A | 3.52 | 6-16-2042 | 162,709 | 159,539 | ||
Navient Private Education Refinance Loan Trust Series 2018-DA Class A2A144A | 4.00 | 12-15-2059 | 2,866,334 | 2,748,821 | ||
Navient Student Loan Trust Series 2021-3A Class A1A144A | 1.77 | 8-25-2070 | 5,090,727 | 4,472,064 | ||
Navient Student Loan Trust Series 2019-BA Class A2A144A | 3.39 | 12-15-2059 | 4,478,159 | 4,255,449 | ||
Nelnet Student Loan Trust Series 2005-2 Class A5 (3 Month LIBOR +0.10%)± | 5.05 | 3-23-2037 | 9,695,221 | 9,470,098 | ||
Nelnet Student Loan Trust Series 2005-3 Class A5 (3 Month LIBOR +0.12%)± | 5.07 | 12-24-2035 | 7,334,224 | 7,176,363 | ||
Nelnet Student Loan Trust Series 2005-4 Class A4 (3 Month LIBOR +0.18%)± | 5.13 | 3-22-2032 | 1,872,848 | 1,806,450 | ||
Nelnet Student Loan Trust Series 2005-1 Class A5 (3 Month LIBOR +0.11%)± | 5.37 | 10-25-2033 | 9,841,267 | 9,507,574 | ||
Nelnet Student Loan Trust Series 2004-4 Class A5 (3 Month LIBOR +0.16%)± | 5.42 | 1-25-2037 | 3,461,912 | 3,401,873 | ||
Nelnet Student Loan Trust Series 2004-3 Class A5 (3 Month LIBOR +0.18%)± | 5.44 | 10-27-2036 | 1,184,399 | 1,153,972 | ||
Nissan Auto Receivables Owner Trust Series 2022-B Class A4 | 4.45 | 11-15-2029 | 2,437,000 | 2,410,392 | ||
Nissan Auto Receivables Owner Trust Series 2023-A Class A4 | 4.85 | 6-17-2030 | 1,724,000 | 1,749,306 | ||
PenFed Auto Receivables Owner Trust Series 2022-A Class A3144A | 3.96 | 4-15-2026 | 3,548,000 | 3,483,534 | ||
PenFed Auto Receivables Owner Trust Series 2022-A Class A4144A | 4.18 | 12-15-2028 | 1,743,000 | 1,707,687 | ||
Santander Drive Auto Receivables Trust Series 2022-2 Class A3 | 2.98 | 10-15-2026 | 8,571,108 | 8,459,130 | ||
Santander Drive Auto Receivables Trust Series 2022-3 Class A3 | 3.40 | 12-15-2026 | 3,524,000 | 3,469,847 | ||
Santander Drive Auto Receivables Trust Series 2022-5 Class A3 | 4.11 | 8-17-2026 | 4,588,000 | 4,533,007 | ||
Santander Drive Auto Receivables Trust Series 2022-4 Class A3 | 4.14 | 2-16-2027 | 5,140,000 | 5,065,039 | ||
Santander Drive Auto Receivables Trust Series 2022-6 Class A3 | 4.49 | 11-16-2026 | 8,785,000 | 8,671,475 | ||
Santander Drive Auto Receivables Trust Series 2022-7 Class A3 | 5.75 | 4-15-2027 | 1,964,000 | 1,965,591 | ||
SMB Private Education Loan Trust Series 2021-A Class APT1144A | 1.07 | 1-15-2053 | 6,801,045 | 5,965,292 | ||
SMB Private Education Loan Trust Series 2020-B Class A1A144A | 1.29 | 7-15-2053 | 2,573,697 | 2,301,060 | ||
SMB Private Education Loan Trust Series 2021-B Class A144A | 1.31 | 7-17-2051 | 2,488,094 | 2,208,053 | ||
Interest rate | Maturity date | Principal | Value | |||
Asset-backed securities (continued) | ||||||
SMB Private Education Loan Trust Series 2021-D Class A1A144A | 1.34 % | 3-17-2053 | $ | 6,837,204 | $6,080,052 | |
SMB Private Education Loan Trust Series 2020-PTA Class A2A144A | 1.60 | 9-15-2054 | 4,005,688 | 3,588,966 | ||
SMB Private Education Loan Trust Series 2020-PTB Class A2A144A | 1.60 | 9-15-2054 | 11,530,624 | 10,309,320 | ||
SMB Private Education Loan Trust Series 2021-E Class A1A144A | 1.68 | 2-15-2051 | 5,479,444 | 4,927,125 | ||
SMB Private Education Loan Trust Series 2016-B Class A2A144A | 2.43 | 2-17-2032 | 943,673 | 906,918 | ||
SMB Private Education Loan Trust Series 2019-A Class A2A144A | 3.44 | 7-15-2036 | 2,492,027 | 2,387,323 | ||
SMB Private Education Loan Trust Series 2018-C Class A2A144A | 3.63 | 11-15-2035 | 1,773,585 | 1,695,158 | ||
SMB Private Education Loan Trust Series 2016-C Class A2B (1 Month LIBOR +1.10%)144A± | 6.21 | 9-15-2034 | 823,605 | 820,569 | ||
SMB Private Education Loan Trust Series 2016-B Class A2B (1 Month LIBOR +1.45%)144A± | 6.56 | 2-17-2032 | 735,631 | 735,196 | ||
SMB Private Education Loan Trust Series 2023-B Class A1B144A | 6.79 | 10-16-2056 | 4,329,000 | 4,332,896 | ||
SoFi Professional Loan Program LLC Series 2021-A Class AFX144A | 1.03 | 8-17-2043 | 1,615,306 | 1,371,296 | ||
SoFi Professional Loan Program LLC Series 2021-B Class AFX144A | 1.14 | 2-15-2047 | 3,750,291 | 3,158,869 | ||
SoFi Professional Loan Program LLC Series 2020-C Class AFX144A | 1.95 | 2-15-2046 | 444,451 | 401,032 | ||
SoFi Professional Loan Program LLC Series 2017-D Class A2FX144A | 2.65 | 9-25-2040 | 99,713 | 95,100 | ||
SoFi Professional Loan Program LLC Series 2017-E Class A2B144A | 2.72 | 11-26-2040 | 16,892 | 16,844 | ||
Synchrony Card Funding LLC Series 2022-A2 Class A | 3.86 | 7-15-2028 | 2,737,000 | 2,677,227 | ||
T-Mobile U.S. Trust Series 2022-1A Class A144A | 4.91 | 5-22-2028 | 3,719,000 | 3,703,101 | ||
Toyota Auto Receivables Owner Trust Series 2022-B Class A4 | 3.11 | 8-16-2027 | 3,985,000 | 3,806,220 | ||
Toyota Auto Receivables Owner Trust Series 2022-C Class A4 | 3.77 | 2-15-2028 | 3,857,000 | 3,742,803 | ||
Toyota Auto Receivables Owner Trust Series 2023-A Class A4 | 4.42 | 8-15-2028 | 2,768,000 | 2,741,876 | ||
Toyota Auto Receivables Owner Trust Series 2023-B Class A3 | 4.71 | 2-15-2028 | 4,376,000 | 4,363,904 | ||
Toyota Auto Receivables Owner Trust Series 2022-D Class A4 | 5.43 | 4-17-2028 | 2,132,000 | 2,168,987 | ||
Verizon Master Trust Series 2022-2 Class A | 1.53 | 7-20-2028 | 3,146,000 | 2,961,435 | ||
Verizon Master Trust Series 2022-4 Class A | 3.40 | 11-20-2028 | 6,886,000 | 6,678,041 | ||
Verizon Master Trust Series 2022-6 Class A | 3.67 | 1-22-2029 | 6,257,000 | 6,088,608 | ||
Verizon Master Trust Series 2023-1 Class A | 4.49 | 1-22-2029 | 6,417,000 | 6,355,352 | ||
Verizon Master Trust Series 2023-2 Class A | 4.89 | 4-13-2028 | 2,391,000 | 2,382,218 | ||
World Omni Select Auto Trust Series 2023-A Class A2A | 5.92 | 3-15-2027 | 4,126,000 | 4,125,898 | ||
Total asset-backed securities (Cost $527,432,912) | 509,676,654 | |||||
Corporate bonds and notes: 18.87% | ||||||
Basic materials: 0.17% | ||||||
Chemicals: 0.10% | ||||||
Dow Chemical Co. | 6.90 | 5-15-2053 | 1,654,000 | 1,843,252 | ||
Rohm & Haas Co. | 7.85 | 7-15-2029 | 2,735,000 | 3,091,520 | ||
4,934,772 | ||||||
Interest rate | Maturity date | Principal | Value | |||
Mining: 0.07% | ||||||
Glencore Funding LLC144A | 2.63 % | 9-23-2031 | $ | 764,000 | $615,145 | |
Glencore Funding LLC144A | 5.70 | 5-8-2033 | 2,532,000 | 2,507,257 | ||
3,122,402 | ||||||
Communications: 1.63% | ||||||
Internet: 0.14% | ||||||
Meta Platforms, Inc. | 5.60 | 5-15-2053 | 3,340,000 | 3,337,861 | ||
Meta Platforms, Inc. | 5.75 | 5-15-2063 | 3,340,000 | 3,325,060 | ||
6,662,921 | ||||||
Media: 0.31% | ||||||
Charter Communications Operating LLC/Charter Communications Operating Capital | 3.50 | 6-1-2041 | 910,000 | 600,491 | ||
Charter Communications Operating LLC/Charter Communications Operating Capital | 3.50 | 3-1-2042 | 5,744,000 | 3,751,057 | ||
Comcast Corp. | 2.99 | 11-1-2063 | 1,982,000 | 1,228,563 | ||
Comcast Corp. | 4.05 | 11-1-2052 | 1,708,000 | 1,398,812 | ||
Comcast Corp. | 5.35 | 11-15-2027 | 3,481,000 | 3,580,402 | ||
Comcast Corp. | 5.50 | 11-15-2032 | 876,000 | 918,460 | ||
Discovery Communications LLC | 4.00 | 9-15-2055 | 1,852,000 | 1,176,104 | ||
Paramount Global | 4.95 | 5-19-2050 | 2,139,000 | 1,591,739 | ||
14,245,628 | ||||||
Telecommunications: 1.18% | ||||||
AT&T, Inc. | 3.50 | 6-1-2041 | 1,693,000 | 1,291,983 | ||
AT&T, Inc. | 3.65 | 9-15-2059 | 1,658,000 | 1,135,549 | ||
AT&T, Inc. | 3.80 | 12-1-2057 | 4,769,000 | 3,393,156 | ||
AT&T, Inc.%% | 5.40 | 2-15-2034 | 9,976,000 | 9,993,806 | ||
T-Mobile USA, Inc. | 1.50 | 2-15-2026 | 1,186,000 | 1,077,098 | ||
T-Mobile USA, Inc. | 2.25 | 2-15-2026 | 3,699,000 | 3,428,666 | ||
T-Mobile USA, Inc. | 2.55 | 2-15-2031 | 2,648,000 | 2,215,038 | ||
T-Mobile USA, Inc. | 2.88 | 2-15-2031 | 45,000 | 38,450 | ||
T-Mobile USA, Inc. | 3.50 | 4-15-2031 | 27,000 | 24,050 | ||
T-Mobile USA, Inc. | 3.75 | 4-15-2027 | 5,635,000 | 5,353,240 | ||
T-Mobile USA, Inc. | 4.80 | 7-15-2028 | 3,518,000 | 3,471,821 | ||
T-Mobile USA, Inc. | 4.95 | 3-15-2028 | 3,514,000 | 3,500,944 | ||
T-Mobile USA, Inc. | 5.05 | 7-15-2033 | 4,397,000 | 4,335,614 | ||
T-Mobile USA, Inc. | 5.65 | 1-15-2053 | 5,383,000 | 5,375,558 | ||
Verizon Communications, Inc. | 2.36 | 3-15-2032 | 4,399,000 | 3,547,649 | ||
Verizon Communications, Inc. | 2.65 | 11-20-2040 | 2,219,000 | 1,523,245 | ||
Verizon Communications, Inc. | 5.05 | 5-9-2033 | 5,278,000 | 5,223,825 | ||
54,929,692 | ||||||
Consumer, cyclical: 1.32% | ||||||
Auto manufacturers: 0.61% | ||||||
Ford Motor Credit Co. LLC | 2.90 | 2-10-2029 | 2,838,000 | 2,307,085 | ||
Ford Motor Credit Co. LLC | 6.80 | 5-12-2028 | 2,066,000 | 2,044,573 | ||
General Motors Co. | 5.20 | 4-1-2045 | 1,414,000 | 1,176,140 | ||
Interest rate | Maturity date | Principal | Value | |||
Auto manufacturers (continued) | ||||||
General Motors Financial Co., Inc. | 3.10 % | 1-12-2032 | $ | 1,183,000 | $953,561 | |
General Motors Financial Co., Inc. | 5.85 | 4-6-2030 | 2,645,000 | 2,618,881 | ||
Hyundai Capital America144A | 0.80 | 1-8-2024 | 1,393,000 | 1,351,062 | ||
Hyundai Capital America144A | 1.30 | 1-8-2026 | 3,340,000 | 2,995,210 | ||
Hyundai Capital America144A | 5.50 | 3-30-2026 | 4,412,000 | 4,412,514 | ||
Hyundai Capital America144A | 5.60 | 3-30-2028 | 5,511,000 | 5,530,055 | ||
Toyota Motor Credit Corp. | 4.55 | 5-17-2030 | 5,282,000 | 5,211,629 | ||
28,600,710 | ||||||
Entertainment: 0.20% | ||||||
Warnermedia Holdings, Inc. | 5.05 | 3-15-2042 | 3,477,000 | 2,813,143 | ||
Warnermedia Holdings, Inc. | 5.14 | 3-15-2052 | 6,185,000 | 4,827,015 | ||
Warnermedia Holdings, Inc. | 5.39 | 3-15-2062 | 2,193,000 | 1,705,872 | ||
9,346,030 | ||||||
Leisure time: 0.06% | ||||||
Harley-Davidson Financial Services, Inc. Series CO144A | 6.50 | 3-10-2028 | 2,645,000 | 2,652,871 | ||
Retail: 0.45% | ||||||
Lowe’s Cos., Inc. | 4.25 | 4-1-2052 | 3,322,000 | 2,657,617 | ||
Lowe’s Cos., Inc. | 5.15 | 7-1-2033 | 4,858,000 | 4,846,803 | ||
Lowe’s Cos., Inc. | 5.63 | 4-15-2053 | 4,303,000 | 4,201,330 | ||
Lowe’s Cos., Inc. | 5.75 | 7-1-2053 | 1,767,000 | 1,751,067 | ||
Lowe’s Cos., Inc. | 5.85 | 4-1-2063 | 883,000 | 859,239 | ||
Walmart, Inc. | 4.10 | 4-15-2033 | 4,419,000 | 4,325,244 | ||
Walmart, Inc. | 4.50 | 4-15-2053 | 2,652,000 | 2,541,742 | ||
21,183,042 | ||||||
Consumer, non-cyclical: 3.82% | ||||||
Agriculture: 0.71% | ||||||
Bunge Ltd. Finance Corp. | 1.63 | 8-17-2025 | 1,817,000 | 1,677,192 | ||
Philip Morris International, Inc. | 4.88 | 2-13-2026 | 2,855,000 | 2,849,299 | ||
Philip Morris International, Inc. | 4.88 | 2-15-2028 | 7,637,000 | 7,609,977 | ||
Philip Morris International, Inc. | 5.00 | 11-17-2025 | 3,740,000 | 3,745,880 | ||
Philip Morris International, Inc. | 5.13 | 11-17-2027 | 5,609,000 | 5,666,747 | ||
Philip Morris International, Inc. | 5.13 | 2-15-2030 | 5,741,000 | 5,681,738 | ||
Philip Morris International, Inc. | 5.38 | 2-15-2033 | 4,775,000 | 4,743,252 | ||
Philip Morris International, Inc. | 5.75 | 11-17-2032 | 898,000 | 920,328 | ||
32,894,413 | ||||||
Beverages: 0.40% | ||||||
Anheuser-Busch Cos. LLC/Anheuser-Busch InBev Worldwide, Inc. | 4.70 | 2-1-2036 | 9,769,000 | 9,569,427 | ||
Anheuser-Busch Cos. LLC/Anheuser-Busch InBev Worldwide, Inc. | 4.90 | 2-1-2046 | 2,552,000 | 2,423,621 | ||
Anheuser-Busch InBev Worldwide, Inc. | 4.38 | 4-15-2038 | 4,697,000 | 4,402,513 | ||
Constellation Brands, Inc. | 4.90 | 5-1-2033 | 2,550,000 | 2,505,197 | ||
18,900,758 | ||||||
Interest rate | Maturity date | Principal | Value | |||
Biotechnology: 0.67% | ||||||
Amgen, Inc. | 5.15 % | 3-2-2028 | $ | 5,283,000 | $5,326,695 | |
Amgen, Inc. | 5.25 | 3-2-2025 | 8,796,000 | 8,820,470 | ||
Amgen, Inc. | 5.25 | 3-2-2033 | 881,000 | 884,112 | ||
Amgen, Inc. | 5.65 | 3-2-2053 | 9,986,000 | 9,989,743 | ||
Gilead Sciences, Inc. | 1.65 | 10-1-2030 | 1,584,000 | 1,293,254 | ||
Gilead Sciences, Inc. | 2.60 | 10-1-2040 | 2,741,000 | 1,958,834 | ||
Gilead Sciences, Inc. | 4.00 | 9-1-2036 | 1,410,000 | 1,281,970 | ||
Gilead Sciences, Inc. | 4.60 | 9-1-2035 | 2,002,000 | 1,931,913 | ||
31,486,991 | ||||||
Commercial services: 0.06% | ||||||
Quanta Services, Inc. | 0.95 | 10-1-2024 | 3,148,000 | 2,946,809 | ||
Cosmetics/Personal Care: 0.30% | ||||||
Kenvue, Inc.144A | 4.90 | 3-22-2033 | 7,049,000 | 7,177,915 | ||
Kenvue, Inc.144A | 5.05 | 3-22-2028 | 3,524,000 | 3,599,420 | ||
Kenvue, Inc.144A | 5.05 | 3-22-2053 | 2,202,000 | 2,216,560 | ||
Kenvue, Inc.144A | 5.20 | 3-22-2063 | 881,000 | 884,829 | ||
13,878,724 | ||||||
Healthcare-products: 0.13% | ||||||
Abbott Laboratories | 1.40 | 6-30-2030 | 3,964,000 | 3,257,550 | ||
Abbott Laboratories | 4.75 | 11-30-2036 | 2,646,000 | 2,663,435 | ||
5,920,985 | ||||||
Healthcare-services: 0.72% | ||||||
HCA, Inc.144A | 4.63 | 3-15-2052 | 1,688,000 | 1,359,448 | ||
HCA, Inc. | 5.20 | 6-1-2028 | 8,161,000 | 8,110,538 | ||
HCA, Inc. | 5.90 | 6-1-2053 | 3,992,000 | 3,847,687 | ||
Roche Holdings, Inc.144A | 2.08 | 12-13-2031 | 4,610,000 | 3,846,444 | ||
UnitedHealth Group, Inc. | 3.05 | 5-15-2041 | 829,000 | 636,106 | ||
UnitedHealth Group, Inc. | 3.25 | 5-15-2051 | 2,617,000 | 1,909,209 | ||
UnitedHealth Group, Inc. | 4.00 | 5-15-2029 | 3,351,000 | 3,240,191 | ||
UnitedHealth Group, Inc. | 4.50 | 4-15-2033 | 2,737,000 | 2,685,374 | ||
UnitedHealth Group, Inc. | 5.05 | 4-15-2053 | 1,641,000 | 1,611,152 | ||
UnitedHealth Group, Inc. | 5.20 | 4-15-2063 | 1,821,000 | 1,782,714 | ||
UnitedHealth Group, Inc. | 5.88 | 2-15-2053 | 4,208,000 | 4,601,044 | ||
33,629,907 | ||||||
Pharmaceuticals: 0.83% | ||||||
AbbVie, Inc. | 4.05 | 11-21-2039 | 1,871,000 | 1,604,647 | ||
AbbVie, Inc. | 4.25 | 11-21-2049 | 8,986,000 | 7,611,212 | ||
AbbVie, Inc. | 4.30 | 5-14-2036 | 1,146,000 | 1,056,146 | ||
AbbVie, Inc. | 4.45 | 5-14-2046 | 1,166,000 | 1,005,016 | ||
AbbVie, Inc. | 4.55 | 3-15-2035 | 2,641,000 | 2,517,419 | ||
Astrazeneca Finance LLC | 4.88 | 3-3-2028 | 3,862,000 | 3,911,132 | ||
Astrazeneca Finance LLC | 4.90 | 3-3-2030 | 5,278,000 | 5,357,346 | ||
Cigna Group | 5.40 | 3-15-2033 | 2,197,000 | 2,240,638 | ||
Interest rate | Maturity date | Principal | Value | |||
Pharmaceuticals (continued) | ||||||
CVS Health Corp. | 4.88 % | 7-20-2035 | $ | 518,000 | $493,512 | |
CVS Health Corp.%% | 5.88 | 6-1-2053 | 2,098,000 | 2,107,147 | ||
Eli Lilly & Co. | 4.70 | 2-27-2033 | 1,762,000 | 1,794,223 | ||
Eli Lilly & Co. | 4.88 | 2-27-2053 | 2,641,000 | 2,660,595 | ||
Eli Lilly & Co. | 4.95 | 2-27-2063 | 1,232,000 | 1,223,334 | ||
Merck & Co., Inc. | 4.50 | 5-17-2033 | 1,784,000 | 1,780,106 | ||
Merck & Co., Inc. | 5.00 | 5-17-2053 | 1,784,000 | 1,795,539 | ||
Merck & Co., Inc. | 5.15 | 5-17-2063 | 1,338,000 | 1,349,950 | ||
38,507,962 | ||||||
Energy: 0.97% | ||||||
Oil & gas: 0.39% | ||||||
BP Capital Markets America, Inc. | 4.81 | 2-13-2033 | 9,666,000 | 9,557,661 | ||
Exxon Mobil Corp. | 3.45 | 4-15-2051 | 4,432,000 | 3,400,770 | ||
Exxon Mobil Corp. | 4.33 | 3-19-2050 | 5,833,000 | 5,214,132 | ||
18,172,563 | ||||||
Pipelines: 0.58% | ||||||
Energy Transfer LP | 4.40 | 3-15-2027 | 781,000 | 753,849 | ||
Energy Transfer LP | 4.95 | 5-15-2028 | 5,833,000 | 5,695,001 | ||
Energy Transfer LP | 5.30 | 4-15-2047 | 4,562,000 | 3,864,070 | ||
Energy Transfer LP | 5.40 | 10-1-2047 | 1,340,000 | 1,151,985 | ||
Energy Transfer LP | 5.75 | 2-15-2033 | 6,414,000 | 6,431,453 | ||
Energy Transfer LP | 6.13 | 12-15-2045 | 1,410,000 | 1,313,935 | ||
MPLX LP | 4.95 | 3-14-2052 | 3,270,000 | 2,691,860 | ||
MPLX LP | 5.00 | 3-1-2033 | 5,302,000 | 5,101,120 | ||
27,003,273 | ||||||
Financial: 5.45% | ||||||
Banks: 3.25% | ||||||
Bank of America Corp. (U.S. SOFR +0.96%)± | 1.73 | 7-22-2027 | 8,776,000 | 7,826,458 | ||
Bank of America Corp. (3 Month LIBOR +1.04%)± | 3.42 | 12-20-2028 | 15,869,000 | 14,593,009 | ||
Bank of America Corp. (U.S. SOFR +1.29%)± | 5.08 | 1-20-2027 | 7,776,000 | 7,717,527 | ||
Bank of America Corp. (U.S. SOFR +1.63%)± | 5.20 | 4-25-2029 | 7,763,000 | 7,735,782 | ||
Bank of America Corp. (U.S. SOFR +1.91%)± | 5.29 | 4-25-2034 | 16,110,000 | 16,007,762 | ||
Bank of New York Mellon Corp. (U.S. SOFR +1.03%)± | 4.95 | 4-26-2027 | 10,565,000 | 10,530,227 | ||
Bank of New York Mellon Corp. Series J (U.S. SOFR +1.61%)± | 4.97 | 4-26-2034 | 9,684,000 | 9,628,328 | ||
Citigroup, Inc. | 6.17 | 5-25-2034 | 10,498,000 | 10,646,525 | ||
Goldman Sachs Group, Inc. (U.S. SOFR +0.91%)± | 1.95 | 10-21-2027 | 3,923,000 | 3,493,836 | ||
KeyBank NA | 5.00 | 1-26-2033 | 5,524,000 | 4,854,680 | ||
M&T Bank Corp. (U.S. SOFR +1.85%)± | 5.05 | 1-27-2034 | 3,251,000 | 2,999,997 | ||
Manufacturers & Traders Trust Co. | 4.70 | 1-27-2028 | 2,346,000 | 2,195,309 | ||
Morgan Stanley (U.S. SOFR +1.73%)± | 5.12 | 2-1-2029 | 1,749,000 | 1,740,257 | ||
Morgan Stanley (U.S. SOFR +1.59%)± | 5.16 | 4-20-2029 | 1,749,000 | 1,743,289 | ||
Morgan Stanley (U.S. SOFR +1.87%)± | 5.25 | 4-21-2034 | 5,282,000 | 5,245,303 | ||
Morgan Stanley (U.S. SOFR +2.56%)± | 6.34 | 10-18-2033 | 6,020,000 | 6,446,819 | ||
National Securities Clearing Corp. | 5.00 | 5-30-2028 | 2,746,000 | 2,756,713 | ||
Santander Holdings USA, Inc. (U.S. SOFR +2.36%)± | 6.50 | 3-9-2029 | 7,197,000 | 7,296,294 | ||
Interest rate | Maturity date | Principal | Value | |||
Banks (continued) | ||||||
Wells Fargo & Co. (U.S. SOFR +2.10%)± | 4.90 % | 7-25-2033 | $ | 14,664,000 | $14,145,522 | |
Wells Fargo & Co. (U.S. SOFR +2.02%)± | 5.39 | 4-24-2034 | 13,973,000 | 13,991,419 | ||
151,595,056 | ||||||
Diversified financial services: 0.46% | ||||||
American Express Co. (U.S. SOFR +1.84%)± | 5.04 | 5-1-2034 | 7,917,000 | 7,815,727 | ||
Antares Holdings LP144A | 3.75 | 7-15-2027 | 4,042,000 | 3,389,434 | ||
Charles Schwab Corp. | 5.64 | 5-19-2029 | 7,132,000 | 7,139,661 | ||
Charles Schwab Corp. | 5.85 | 5-19-2034 | 3,170,000 | 3,213,255 | ||
21,558,077 | ||||||
Insurance: 0.25% | ||||||
American International Group, Inc. | 5.13 | 3-27-2033 | 1,636,000 | 1,603,042 | ||
Brighthouse Financial, Inc. | 3.85 | 12-22-2051 | 1,564,000 | 959,347 | ||
Progressive Corp. | 4.95 | 6-15-2033 | 4,403,000 | 4,393,770 | ||
SBL Holdings, Inc.144A | 5.00 | 2-18-2031 | 5,480,000 | 4,454,810 | ||
11,410,969 | ||||||
REITS: 1.49% | ||||||
Agree LP | 2.00 | 6-15-2028 | 3,303,000 | 2,779,600 | ||
Agree LP | 2.60 | 6-15-2033 | 751,000 | 580,846 | ||
Agree LP | 4.80 | 10-1-2032 | 1,656,000 | 1,546,580 | ||
American Homes 4 Rent LP | 3.63 | 4-15-2032 | 3,041,000 | 2,628,809 | ||
American Homes 4 Rent LP | 4.30 | 4-15-2052 | 1,362,000 | 1,028,507 | ||
American Tower Corp. | 2.95 | 1-15-2051 | 881,000 | 543,900 | ||
American Tower Corp. | 3.13 | 1-15-2027 | 1,490,000 | 1,383,130 | ||
American Tower Corp. | 5.50 | 3-15-2028 | 3,518,000 | 3,554,686 | ||
American Tower Corp. | 5.55 | 7-15-2033 | 4,373,000 | 4,401,627 | ||
Boston Properties LP | 6.50 | 1-15-2034 | 703,000 | 685,116 | ||
Brixmor Operating Partnership LP | 2.50 | 8-16-2031 | 2,907,000 | 2,263,004 | ||
Crown Castle, Inc. | 1.05 | 7-15-2026 | 4,738,000 | 4,170,359 | ||
Crown Castle, Inc. | 2.90 | 3-15-2027 | 2,545,000 | 2,350,502 | ||
Crown Castle, Inc. | 2.90 | 4-1-2041 | 1,760,000 | 1,217,137 | ||
Crown Castle, Inc. | 5.00 | 1-11-2028 | 7,040,000 | 6,982,844 | ||
Essex Portfolio LP | 2.55 | 6-15-2031 | 1,567,000 | 1,278,529 | ||
Federal Realty Investment Trust | 3.95 | 1-15-2024 | 2,102,000 | 2,078,961 | ||
Invitation Homes Operating Partnership LP | 2.00 | 8-15-2031 | 524,000 | 399,303 | ||
Invitation Homes Operating Partnership LP | 4.15 | 4-15-2032 | 3,026,000 | 2,715,992 | ||
Mid-America Apartments LP | 4.30 | 10-15-2023 | 1,558,000 | 1,548,944 | ||
Realty Income Corp. | 2.20 | 6-15-2028 | 1,629,000 | 1,424,167 | ||
Realty Income Corp. | 2.85 | 12-15-2032 | 2,200,000 | 1,803,344 | ||
Realty Income Corp. | 4.85 | 3-15-2030 | 2,112,000 | 2,066,087 | ||
Realty Income Corp. | 4.90 | 7-15-2033 | 2,935,000 | 2,820,952 | ||
Realty Income Corp. | 5.63 | 10-13-2032 | 3,076,000 | 3,130,801 | ||
Regency Centers LP | 2.95 | 9-15-2029 | 4,164,000 | 3,621,227 | ||
STORE Capital Corp. | 2.70 | 12-1-2031 | 1,057,000 | 726,600 | ||
STORE Capital Corp. | 2.75 | 11-18-2030 | 2,689,000 | 1,948,675 | ||
STORE Capital Corp. | 4.50 | 3-15-2028 | 4,064,000 | 3,506,625 | ||
Interest rate | Maturity date | Principal | Value | |||
REITS (continued) | ||||||
STORE Capital Corp. | 4.63 % | 3-15-2029 | $ | 1,939,000 | $1,670,908 | |
Sun Communities Operating LP | 4.20 | 4-15-2032 | 3,041,000 | 2,653,975 | ||
69,511,737 | ||||||
Industrial: 1.27% | ||||||
Aerospace/defense: 0.60% | ||||||
Boeing Co. | 2.20 | 2-4-2026 | 5,990,000 | 5,574,174 | ||
Boeing Co. | 3.25 | 2-1-2035 | 1,939,000 | 1,561,128 | ||
Boeing Co. | 3.75 | 2-1-2050 | 3,461,000 | 2,549,822 | ||
Boeing Co. | 5.93 | 5-1-2060 | 2,676,000 | 2,608,350 | ||
Lockheed Martin Corp. | 4.75 | 2-15-2034 | 6,314,000 | 6,313,854 | ||
Northrop Grumman Corp. | 4.40 | 5-1-2030 | 2,026,000 | 1,988,705 | ||
Raytheon Technologies Corp. | 5.15 | 2-27-2033 | 4,578,000 | 4,655,863 | ||
Raytheon Technologies Corp. | 5.38 | 2-27-2053 | 2,839,000 | 2,873,207 | ||
28,125,103 | ||||||
Environmental control: 0.12% | ||||||
Republic Services, Inc. | 4.88 | 4-1-2029 | 2,648,000 | 2,654,068 | ||
Republic Services, Inc. | 5.00 | 4-1-2034 | 2,648,000 | 2,651,343 | ||
5,305,411 | ||||||
Machinery-construction & mining: 0.11% | ||||||
Caterpillar Financial Services Corp. | 4.35 | 5-15-2026 | 5,278,000 | 5,252,095 | ||
Machinery-diversified: 0.27% | ||||||
John Deere Capital Corp. | 4.15 | 9-15-2027 | 8,315,000 | 8,203,529 | ||
John Deere Capital Corp. | 4.90 | 3-3-2028 | 4,397,000 | 4,468,481 | ||
12,672,010 | ||||||
Transportation: 0.17% | ||||||
Burlington Northern Santa Fe LLC | 4.45 | 1-15-2053 | 705,000 | 639,584 | ||
Crowley Conro LLC | 4.18 | 8-15-2043 | 2,377,138 | 2,267,699 | ||
Union Pacific Corp. | 2.38 | 5-20-2031 | 1,678,000 | 1,426,125 | ||
Union Pacific Corp. | 2.80 | 2-14-2032 | 2,278,000 | 1,974,393 | ||
Union Pacific Corp. | 3.38 | 2-14-2042 | 1,895,000 | 1,509,293 | ||
7,817,094 | ||||||
Technology: 2.33% | ||||||
Computers: 0.44% | ||||||
Apple, Inc. | 2.38 | 2-8-2041 | 1,284,000 | 942,608 | ||
Apple, Inc. | 2.40 | 8-20-2050 | 11,000 | 7,238 | ||
Apple, Inc. | 2.65 | 5-11-2050 | 2,432,000 | 1,673,069 | ||
Apple, Inc. | 2.65 | 2-8-2051 | 1,081,000 | 739,124 | ||
Apple, Inc. | 3.95 | 8-8-2052 | 2,478,000 | 2,161,018 | ||
Apple, Inc. | 4.00 | 5-10-2028 | 5,278,000 | 5,255,621 | ||
Apple, Inc. | 4.10 | 8-8-2062 | 1,257,000 | 1,090,390 | ||
Apple, Inc. | 4.15 | 5-10-2030 | 2,639,000 | 2,637,252 | ||
Interest rate | Maturity date | Principal | Value | |||
Computers (continued) | ||||||
Apple, Inc. | 4.30 % | 5-10-2033 | $ | 3,518,000 | $3,525,997 | |
Apple, Inc. | 4.85 | 5-10-2053 | 2,287,000 | 2,300,984 | ||
20,333,301 | ||||||
Semiconductors: 1.08% | ||||||
Broadcom, Inc.144A | 2.45 | 2-15-2031 | 2,761,000 | 2,229,399 | ||
Broadcom, Inc. | 3.15 | 11-15-2025 | 2,069,000 | 1,974,657 | ||
Broadcom, Inc.144A | 3.42 | 4-15-2033 | 2,269,000 | 1,884,481 | ||
Broadcom, Inc.144A | 3.47 | 4-15-2034 | 1,771,000 | 1,445,060 | ||
Broadcom, Inc.144A | 4.93 | 5-15-2037 | 2,522,000 | 2,268,196 | ||
Intel Corp. | 2.80 | 8-12-2041 | 4,129,000 | 2,901,689 | ||
Intel Corp. | 5.63 | 2-10-2043 | 1,012,000 | 1,011,806 | ||
Intel Corp. | 5.70 | 2-10-2053 | 1,754,000 | 1,732,686 | ||
Intel Corp. | 5.90 | 2-10-2063 | 2,461,000 | 2,449,526 | ||
KLA Corp. | 3.30 | 3-1-2050 | 1,445,000 | 1,070,404 | ||
KLA Corp. | 4.95 | 7-15-2052 | 1,469,000 | 1,417,836 | ||
Micron Technology, Inc. | 3.48 | 11-1-2051 | 864,000 | 554,229 | ||
Micron Technology, Inc. | 5.38 | 4-15-2028 | 8,840,000 | 8,721,505 | ||
Micron Technology, Inc. | 5.88 | 2-9-2033 | 1,038,000 | 1,033,342 | ||
QUALCOMM, Inc. | 6.00 | 5-20-2053 | 3,977,000 | 4,304,332 | ||
Texas Instruments, Inc. | 4.90 | 3-14-2033 | 7,049,000 | 7,227,278 | ||
Texas Instruments, Inc. | 5.00 | 3-14-2053 | 4,406,000 | 4,396,515 | ||
Texas Instruments, Inc. | 5.05 | 5-18-2063 | 2,641,000 | 2,582,653 | ||
Xilinx, Inc. | 2.38 | 6-1-2030 | 1,351,000 | 1,168,916 | ||
50,374,510 | ||||||
Software: 0.81% | ||||||
Fiserv, Inc. | 5.45 | 3-2-2028 | 4,238,000 | 4,303,244 | ||
Fiserv, Inc. | 5.60 | 3-2-2033 | 901,000 | 922,995 | ||
Oracle Corp. | 4.00 | 7-15-2046 | 3,065,000 | 2,296,609 | ||
Oracle Corp. | 4.38 | 5-15-2055 | 1,064,000 | 822,484 | ||
Oracle Corp. | 4.90 | 2-6-2033 | 897,000 | 866,444 | ||
Oracle Corp. | 5.55 | 2-6-2053 | 2,348,000 | 2,192,654 | ||
Oracle Corp. | 6.90 | 11-9-2052 | 5,729,000 | 6,235,263 | ||
VMware, Inc. | 0.60 | 8-15-2023 | 7,728,000 | 7,648,868 | ||
VMware, Inc. | 1.00 | 8-15-2024 | 5,487,000 | 5,181,447 | ||
VMware, Inc. | 1.40 | 8-15-2026 | 5,134,000 | 4,546,216 | ||
VMware, Inc. | 4.70 | 5-15-2030 | 3,172,000 | 3,015,799 | ||
38,032,023 | ||||||
Utilities: 1.91% | ||||||
Electric: 1.91% | ||||||
American Transmission Systems, Inc.144A | 2.65 | 1-15-2032 | 1,097,000 | 910,068 | ||
Baltimore Gas & Electric Co. | 2.25 | 6-15-2031 | 2,356,000 | 1,968,398 | ||
Baltimore Gas & Electric Co. | 5.40 | 6-1-2053 | 2,639,000 | 2,643,689 | ||
CenterPoint Energy Houston Electric LLC Series AH | 3.60 | 3-1-2052 | 1,740,000 | 1,338,840 | ||
Commonwealth Edison Co. | 5.30 | 2-1-2053 | 707,000 | 709,110 | ||
Consolidated Edison Co. of New York, Inc. | 5.20 | 3-1-2033 | 4,930,000 | 5,005,602 | ||
Interest rate | Maturity date | Principal | Value | |||
Electric (continued) | ||||||
Consumers Energy Co. | 2.50 % | 5-1-2060 | $ | 1,432,000 | $817,125 | |
DTE Electric Co. | 2.95 | 3-1-2050 | 2,750,000 | 1,868,490 | ||
DTE Electric Co. Series B | 3.65 | 3-1-2052 | 1,258,000 | 967,941 | ||
Duke Energy Carolinas LLC | 2.55 | 4-15-2031 | 1,603,000 | 1,375,394 | ||
Duke Energy Carolinas LLC | 2.85 | 3-15-2032 | 2,926,000 | 2,505,574 | ||
Duke Energy Carolinas LLC | 3.55 | 3-15-2052 | 2,130,000 | 1,613,730 | ||
Duke Energy Carolinas LLC | 5.35 | 1-15-2053 | 3,531,000 | 3,531,871 | ||
Duke Energy Corp. | 2.55 | 6-15-2031 | 1,725,000 | 1,427,406 | ||
Duke Energy Corp. | 3.50 | 6-15-2051 | 487,000 | 344,457 | ||
Duke Energy Florida LLC | 2.40 | 12-15-2031 | 2,348,000 | 1,934,280 | ||
Duke Energy Progress LLC | 2.50 | 8-15-2050 | 2,376,000 | 1,453,628 | ||
Duke Energy Progress LLC | 5.25 | 3-15-2033 | 2,465,000 | 2,516,143 | ||
Entergy Arkansas LLC | 2.65 | 6-15-2051 | 2,121,000 | 1,312,623 | ||
Entergy Arkansas LLC | 5.15 | 1-15-2033 | 3,533,000 | 3,570,807 | ||
Eversource Energy Series R | 1.65 | 8-15-2030 | 2,676,000 | 2,137,661 | ||
Exelon Corp. | 5.30 | 3-15-2033 | 2,659,000 | 2,677,908 | ||
Exelon Corp. | 5.60 | 3-15-2053 | 2,115,000 | 2,089,893 | ||
Jersey Central Power & Light Co.144A | 2.75 | 3-1-2032 | 2,587,000 | 2,150,619 | ||
Metropolitan Edison Co.144A | 4.30 | 1-15-2029 | 2,768,000 | 2,647,571 | ||
Metropolitan Edison Co.144A | 5.20 | 4-1-2028 | 2,650,000 | 2,670,121 | ||
MidAmerican Energy Co. | 2.70 | 8-1-2052 | 2,041,000 | 1,312,942 | ||
Mississippi Power Co. Series B | 3.10 | 7-30-2051 | 2,824,000 | 1,875,531 | ||
Mississippi Power Co. Series 12-A | 4.25 | 3-15-2042 | 1,083,000 | 900,765 | ||
NSTAR Electric Co. | 3.10 | 6-1-2051 | 1,453,000 | 999,278 | ||
NSTAR Electric Co. | 4.55 | 6-1-2052 | 1,914,000 | 1,717,730 | ||
Pacific Gas & Electric Co. | 2.10 | 8-1-2027 | 1,260,000 | 1,090,454 | ||
Pacific Gas & Electric Co. | 3.95 | 12-1-2047 | 5,363,000 | 3,632,679 | ||
Pacific Gas & Electric Co. | 4.20 | 6-1-2041 | 1,368,000 | 1,017,155 | ||
Pacific Gas & Electric Co. | 4.50 | 7-1-2040 | 811,000 | 628,667 | ||
Pacific Gas & Electric Co. | 4.75 | 2-15-2044 | 792,000 | 604,740 | ||
Pacific Gas & Electric Co. | 4.95 | 7-1-2050 | 7,530,000 | 5,863,162 | ||
PacifiCorp. | 5.50 | 5-15-2054 | 2,817,000 | 2,846,082 | ||
PECO Energy Co. | 2.85 | 9-15-2051 | 2,841,000 | 1,864,965 | ||
Pennsylvania Electric Co.144A | 3.25 | 3-15-2028 | 2,295,000 | 2,107,728 | ||
Pennsylvania Electric Co.144A | 5.15 | 3-30-2026 | 1,767,000 | 1,755,947 | ||
Public Service Co. of Oklahoma Series K | 3.15 | 8-15-2051 | 1,593,000 | 1,063,439 | ||
Public Service Electric & Gas Co. | 1.90 | 8-15-2031 | 3,159,000 | 2,563,811 | ||
Public Service Electric & Gas Co. | 2.05 | 8-1-2050 | 653,000 | 370,807 | ||
Public Service Electric & Gas Co. | 2.70 | 5-1-2050 | 1,286,000 | 845,877 | ||
Southern California Edison Co. Series C | 4.13 | 3-1-2048 | 1,775,000 | 1,428,322 | ||
Virginia Electric & Power Co. | 2.95 | 11-15-2051 | 2,356,000 | 1,542,143 | ||
Virginia Electric & Power Co. | 5.45 | 4-1-2053 | 796,000 | 780,664 | ||
89,001,837 | ||||||
Total corporate bonds and notes (Cost $925,671,931) | 880,009,676 | |||||
Interest rate | Maturity date | Principal | Value | |||
Municipal obligations: 0.35% | ||||||
Nevada: 0.09% | ||||||
Airport revenue: 0.09% | ||||||
County of Clark Department of Aviation Series C | 6.82 % | 7-1-2045 | $ | 3,365,000 | $4,097,847 | |
New York: 0.10% | ||||||
Airport revenue: 0.10% | ||||||
Port Authority of New York & New Jersey | 4.46 | 10-1-2062 | 5,505,000 | 4,978,819 | ||
Ohio: 0.04% | ||||||
Education revenue: 0.04% | ||||||
Ohio State University Series A | 4.80 | 6-1-2111 | 1,957,000 | 1,776,585 | ||
Texas: 0.12% | ||||||
Education revenue: 0.02% | ||||||
Board of Regents of the University of Texas System Series B | 2.44 | 8-15-2049 | 1,695,000 | 1,114,570 | ||
Transportation revenue: 0.10% | ||||||
North Texas Tollway Authority Series B | 6.72 | 1-1-2049 | 3,609,000 | 4,462,153 | ||
5,576,723 | ||||||
Total municipal obligations (Cost $17,137,602) | 16,429,974 | |||||
Non-agency mortgage-backed securities: 3.19% | ||||||
Angel Oak Mortgage Trust Series 2020-5 Class A1144A±± | 1.37 | 5-25-2065 | 495,046 | 454,120 | ||
Angel Oak Mortgage Trust Series 2020-2 Class A1A144A±± | 2.53 | 1-26-2065 | 1,270,133 | 1,166,037 | ||
Angel Oak Mortgage Trust Series 2021-6 Class A1144A±± | 1.46 | 9-25-2066 | 2,630,971 | 2,108,405 | ||
BANK5 Series 2023-5YR1 Class A3±± | 6.26 | 4-15-2056 | 2,182,000 | 2,259,066 | ||
BBCMS Mortgage Trust Series 2018-C2 Class ASB | 4.24 | 12-15-2051 | 1,158,926 | 1,127,218 | ||
Bunker Hill Loan Depositary Trust Series 2019-2 Class A1144A | 2.88 | 7-25-2049 | 1,835,867 | 1,710,713 | ||
Bunker Hill Loan Depositary Trust Series 2019-3 Class A1144A | 2.72 | 11-25-2059 | 1,122,037 | 1,074,336 | ||
BX Commercial Mortgage Trust Series 2021-XL2 Class A (1 Month LIBOR +0.69%)144A± | 5.80 | 10-15-2038 | 4,496,421 | 4,344,222 | ||
BX Commercial Mortgage Trust Series 2021-VOLT Class A (1 Month LIBOR +0.70%)144A± | 5.81 | 9-15-2036 | 10,912,000 | 10,544,811 | ||
CFCRE Commercial Mortgage Trust Series 2017-C8 Class ASB | 3.37 | 6-15-2050 | 1,266,455 | 1,213,826 | ||
COLT Mortgage Loan Trust Series 2021-2 Class A1144A±± | 0.92 | 8-25-2066 | 3,602,827 | 2,790,127 | ||
COLT Mortgage Loan Trust Series 2021-4 Class A1144A±± | 1.40 | 10-25-2066 | 3,749,363 | 2,953,933 | ||
COMM Mortgage Trust Series 2014-UBS4 Class A4 | 3.42 | 8-10-2047 | 3,937,000 | 3,811,495 | ||
COMM Mortgage Trust Series 2013-CR11 Class A4 | 4.26 | 8-10-2050 | 12,086,257 | 12,043,167 | ||
COMM Mortgage Trust Series 2015-LC23 Class A3 | 3.52 | 10-10-2048 | 1,982,000 | 1,915,309 | ||
COMM Mortgage Trust Series 2013-CR13 Class A4±± | 4.19 | 11-10-2046 | 1,746,000 | 1,719,918 | ||
CSAIL Commercial Mortgage Trust Series 2019-C16 Class A2 | 3.07 | 6-15-2052 | 1,924,000 | 1,704,777 | ||
EQUS Mortgage Trust Series 2021-EQAZ Class A (1 Month LIBOR +0.75%)144A± | 5.86 | 10-15-2038 | 4,122,917 | 3,988,144 | ||
GS Mortgage Securities Trust Series 2013-GC14 Class A5 | 4.24 | 8-10-2046 | 1,899,566 | 1,895,344 | ||
GS Mortgage Securities Trust Series 2014-GC18 Class A4 | 4.07 | 1-10-2047 | 5,471,323 | 5,375,883 | ||
GS Mortgage Securities Trust Series 2020-GSA2 Class A4 | 1.72 | 12-12-2053 | 5,595,000 | 4,443,571 | ||
GS Mortgage Securities Trust Series 2015-GC32 Class A3 | 3.50 | 7-10-2048 | 1,889,446 | 1,806,661 | ||
Interest rate | Maturity date | Principal | Value | |||
Non-agency mortgage-backed securities (continued) | ||||||
Impact Funding Affordable Multifamily Housing Mortgage Loan Trust Series 2010-1 Class A1144A | 5.31 % | 1-25-2051 | $ | 2,954,105 | $2,872,960 | |
JP Morgan Chase Commercial Mortgage Securities Trust Series 2013-C16 Class A4 | 4.17 | 12-15-2046 | 4,973,000 | 4,932,572 | ||
JP Morgan Chase Commercial Mortgage Securities Trust Series 2016-JP4 Class A3 | 3.39 | 12-15-2049 | 1,080,000 | 1,007,368 | ||
JPMBB Commercial Mortgage Securities Trust Series 2013-C17 Class A4 | 4.20 | 1-15-2047 | 1,095,000 | 1,079,447 | ||
JPMBB Commercial Mortgage Securities Trust Series 2014-C23 Class A4 | 3.67 | 9-15-2047 | 1,623,137 | 1,575,219 | ||
JPMBB Commercial Mortgage Securities Trust Series 2015-C28 Class A3 | 2.91 | 10-15-2048 | 6,279,918 | 5,984,181 | ||
JPMBB Commercial Mortgage Securities Trust Series 2015-C30 Class A5 | 3.82 | 7-15-2048 | 3,008,000 | 2,855,149 | ||
Med Trust Series 2021-MDLN Class A (1 Month LIBOR +0.95%)144A± | 6.06 | 11-15-2038 | 6,630,180 | 6,426,013 | ||
MFA Trust Series 2021-NQM2 Class A1144A±± | 1.03 | 11-25-2064 | 1,492,607 | 1,236,566 | ||
Morgan Stanley Capital I Trust Series 2020-HR8 Class A3 | 1.79 | 7-15-2053 | 3,030,000 | 2,427,271 | ||
New Residential Mortgage Loan Trust Series 2019-NQM4 Class A1144A±± | 2.49 | 9-25-2059 | 783,096 | 714,450 | ||
NewRez Warehouse Securitization Trust Series 2021-1 Class A (1 Month LIBOR +0.75%)144A± | 5.89 | 5-25-2055 | 8,916,267 | 8,836,534 | ||
STAR Trust Series 2021-1 Class A1144A±± | 1.22 | 5-25-2065 | 1,335,195 | 1,149,569 | ||
Starwood Mortgage Residential Trust Series 2020-1 Class A1144A±± | 2.28 | 2-25-2050 | 265,389 | 250,751 | ||
Starwood Mortgage Residential Trust Series 2020-INV1 Class A1144A±± | 1.03 | 11-25-2055 | 1,081,461 | 949,930 | ||
Starwood Mortgage Residential Trust Series 2020-3 Class A1144A±± | 1.49 | 4-25-2065 | 1,249,433 | 1,151,308 | ||
Starwood Mortgage Residential Trust Series 2021-4 Class A1144A±± | 1.16 | 8-25-2056 | 3,398,574 | 2,856,739 | ||
Verus Securitization Trust Series 2020-1 Class A1144A | 2.42 | 1-25-2060 | 279,440 | 261,766 | ||
Verus Securitization Trust Series 2019-INV2 Class A1144A±± | 2.91 | 7-25-2059 | 632,409 | 609,512 | ||
Verus Securitization Trust Series 2019-4 Class A1144A | 2.64 | 11-25-2059 | 1,281,698 | 1,228,767 | ||
Verus Securitization Trust Series 2019-INV3 Class A1144A±± | 2.69 | 11-25-2059 | 538,436 | 516,576 | ||
Verus Securitization Trust Series 2021-1 Class A1144A±± | 0.82 | 1-25-2066 | 1,844,090 | 1,570,337 | ||
Verus Securitization Trust Series 2020-2 Class A1144A±± | 2.23 | 5-25-2060 | 826,989 | 795,628 | ||
Verus Securitization Trust Series 2021-R1 Class A1144A±± | 0.82 | 10-25-2063 | 1,578,392 | 1,411,188 | ||
Verus Securitization Trust Series 2020-5 Class A1144A | 1.22 | 5-25-2065 | 561,861 | 508,513 | ||
Verus Securitization Trust Series 2021-R3 Class A1144A±± | 1.02 | 4-25-2064 | 1,556,192 | 1,377,979 | ||
Verus Securitization Trust Series 2021-2 Class A1144A±± | 1.03 | 2-25-2066 | 3,350,658 | 2,861,426 | ||
Verus Securitization Trust Series 2021-8 Class A1144A±± | 1.82 | 11-25-2066 | 3,321,449 | 2,826,401 | ||
Verus Securitization Trust Series 2021-4 Class A1144A±± | 0.94 | 7-25-2066 | 3,146,220 | 2,501,882 | ||
Verus Securitization Trust Series 2021-5 Class A1144A±± | 1.01 | 9-25-2066 | 9,974,738 | 8,076,155 | ||
Verus Securitization Trust Series 2021-7 Class A1144A±± | 1.83 | 10-25-2066 | 4,687,400 | 3,967,769 | ||
Verus Securitization Trust Series 2021-3 Class A1144A±± | 1.05 | 6-25-2066 | 2,502,074 | 2,084,124 | ||
Visio Trust Series 2020-1R Class A1144A | 1.31 | 11-25-2055 | 1,229,026 | 1,105,822 | ||
Total non-agency mortgage-backed securities (Cost $162,276,444) | 148,460,955 | |||||
Interest rate | Maturity date | Principal | Value | |||
U.S. Treasury securities: 28.49% | ||||||
U.S. Treasury Bonds | 1.13 % | 5-15-2040 | $ | 87,097,000 | $56,602,843 | |
U.S. Treasury Bonds | 1.13 | 8-15-2040 | 85,421,000 | 55,026,473 | ||
U.S. Treasury Bonds## | 1.38 | 11-15-2040 | 154,317,000 | 103,458,699 | ||
U.S. Treasury Bonds## | 1.75 | 8-15-2041 | 126,129,000 | 88,965,287 | ||
U.S. Treasury Bonds | 1.88 | 2-15-2041 | 6,755,000 | 4,922,442 | ||
U.S. Treasury Bonds | 1.88 | 11-15-2051 | 7,074,000 | 4,654,471 | ||
U.S. Treasury Bonds | 2.00 | 8-15-2051 | 22,967,000 | 15,620,252 | ||
U.S. Treasury Bonds | 2.25 | 2-15-2052 | 11,829,000 | 8,531,666 | ||
U.S. Treasury Bonds | 2.88 | 5-15-2052 | 13,255,000 | 10,975,761 | ||
U.S. Treasury Bonds | 3.00 | 8-15-2052 | 40,262,000 | 34,217,982 | ||
U.S. Treasury Bonds | 3.38 | 8-15-2042 | 2,564,000 | 2,342,755 | ||
U.S. Treasury Bonds | 3.63 | 2-15-2053 | 75,155,000 | 72,184,029 | ||
U.S. Treasury Bonds | 3.88 | 2-15-2043 | 4,976,000 | 4,884,255 | ||
U.S. Treasury Bonds | 3.88 | 5-15-2043 | 45,892,000 | 45,060,208 | ||
U.S. Treasury Bonds | 5.25 | 11-15-2028 | 2,064,000 | 2,206,868 | ||
U.S. Treasury Notes | 0.38 | 7-31-2027 | 43,509,000 | 37,681,174 | ||
U.S. Treasury Notes | 1.13 | 2-29-2028 | 12,507,000 | 11,054,038 | ||
U.S. Treasury Notes | 1.13 | 8-31-2028 | 8,274,000 | 7,231,993 | ||
U.S. Treasury Notes | 1.25 | 9-30-2028 | 1,117,000 | 980,822 | ||
U.S. Treasury Notes | 1.38 | 10-31-2028 | 17,559,000 | 15,497,875 | ||
U.S. Treasury Notes## | 1.50 | 8-15-2026 | 101,332,000 | 93,712,309 | ||
U.S. Treasury Notes | 1.50 | 11-30-2028 | 11,372,000 | 10,092,206 | ||
U.S. Treasury Notes | 1.63 | 5-15-2026 | 35,760,000 | 33,350,391 | ||
U.S. Treasury Notes | 1.75 | 12-31-2026 | 8,357,000 | 7,750,465 | ||
U.S. Treasury Notes | 1.88 | 2-28-2029 | 10,985,000 | 9,913,963 | ||
U.S. Treasury Notes | 2.00 | 11-15-2026 | 32,604,000 | 30,536,957 | ||
U.S. Treasury Notes | 2.13 | 5-15-2025 | 10,160,000 | 9,720,263 | ||
U.S. Treasury Notes | 2.63 | 2-15-2029 | 50,196,000 | 47,225,416 | ||
U.S. Treasury Notes | 2.63 | 7-31-2029 | 8,779,000 | 8,237,514 | ||
U.S. Treasury Notes | 2.75 | 5-31-2029 | 15,424,000 | 14,588,333 | ||
U.S. Treasury Notes | 2.88 | 4-30-2025 | 16,500,000 | 16,014,668 | ||
U.S. Treasury Notes | 2.88 | 6-15-2025 | 705,000 | 684,153 | ||
U.S. Treasury Notes | 2.88 | 8-15-2028 | 8,219,000 | 7,860,703 | ||
U.S. Treasury Notes | 2.88 | 4-30-2029 | 14,700,000 | 14,005,195 | ||
U.S. Treasury Notes | 3.00 | 7-15-2025 | 9,339,000 | 9,082,907 | ||
U.S. Treasury Notes | 3.25 | 6-30-2029 | 28,783,000 | 27,980,224 | ||
U.S. Treasury Notes | 3.38 | 5-15-2033 | 26,881,000 | 26,305,579 | ||
U.S. Treasury Notes## | 3.50 | 4-30-2028 | 103,337,000 | 102,021,067 | ||
U.S. Treasury Notes | 3.63 | 5-15-2026 | 53,493,000 | 52,870,308 | ||
U.S. Treasury Notes | 3.63 | 3-31-2028 | 15,721,000 | 15,600,636 | ||
U.S. Treasury Notes | 3.63 | 5-31-2028 | 64,000,000 | 63,635,000 | ||
U.S. Treasury Notes | 3.88 | 3-31-2025 | 25,751,000 | 25,453,254 | ||
U.S. Treasury Notes | 3.88 | 4-30-2025 | 49,527,000 | 48,987,233 | ||
U.S. Treasury Notes | 4.00 | 12-15-2025 | 10,348,000 | 10,306,365 | ||
U.S. Treasury Notes | 4.00 | 2-15-2026 | 270,000 | 269,114 | ||
U.S. Treasury Notes | 4.13 | 1-31-2025 | 2,792,000 | 2,768,224 | ||
U.S. Treasury Notes | 4.25 | 5-31-2025 | 47,314,000 | 47,180,929 | ||
U.S. Treasury Notes | 4.25 | 10-15-2025 | 9,006,000 | 9,004,593 | ||
Interest rate | Maturity date | Principal | Value | |||
U.S. Treasury securities (continued) | ||||||
U.S. Treasury Notes | 4.38 % | 10-31-2024 | $ | 1,068,000 | $1,061,158 | |
U.S. Treasury Notes | 4.50 | 11-30-2024 | 224,000 | 223,055 | ||
Total U.S. Treasury securities (Cost $1,440,198,202) | 1,328,542,075 | |||||
Yankee corporate bonds and notes: 4.34% | ||||||
Basic materials: 0.37% | ||||||
Mining: 0.37% | ||||||
Anglo American Capital PLC144A | 4.75 | 3-16-2052 | 3,474,000 | 2,824,201 | ||
Anglo American Capital PLC144A | 5.50 | 5-2-2033 | 2,483,000 | 2,424,129 | ||
BHP Billiton Finance USA Ltd. | 4.88 | 2-27-2026 | 8,803,000 | 8,839,735 | ||
Glencore Finance Canada Ltd.144A | 5.55 | 10-25-2042 | 792,000 | 732,654 | ||
Glencore Finance Canada Ltd.144A | 6.00 | 11-15-2041 | 644,000 | 639,165 | ||
Glencore Finance Canada Ltd.144A | 6.90 | 11-15-2037 | 1,821,000 | 1,969,716 | ||
17,429,600 | ||||||
Consumer, cyclical: 0.19% | ||||||
Airlines: 0.19% | ||||||
Delta Air Lines, Inc./SkyMiles IP Ltd.144A | 4.75 | 10-20-2028 | 9,320,000 | 9,003,335 | ||
Consumer, non-cyclical: 0.89% | ||||||
Commercial services: 0.02% | ||||||
Adani International Container Terminal Pvt Ltd.144A | 3.00 | 2-16-2031 | 1,310,280 | 1,038,972 | ||
Healthcare-products: 0.09% | ||||||
DH Europe Finance II Sarl | 2.20 | 11-15-2024 | 4,334,000 | 4,153,008 | ||
Pharmaceuticals: 0.78% | ||||||
Pfizer Investment Enterprises Pte. Ltd. | 4.45 | 5-19-2026 | 8,809,000 | 8,763,644 | ||
Pfizer Investment Enterprises Pte. Ltd. | 4.45 | 5-19-2028 | 4,404,000 | 4,387,698 | ||
Pfizer Investment Enterprises Pte. Ltd. | 4.75 | 5-19-2033 | 12,245,000 | 12,294,108 | ||
Pfizer Investment Enterprises Pte. Ltd. | 5.30 | 5-19-2053 | 5,774,000 | 5,944,182 | ||
Pfizer Investment Enterprises Pte. Ltd. | 5.34 | 5-19-2063 | 2,643,000 | 2,646,499 | ||
Shire Acquisitions Investments Ireland DAC | 2.88 | 9-23-2023 | 1,299,000 | 1,287,447 | ||
Takeda Pharmaceutical Co. Ltd. | 4.40 | 11-26-2023 | 986,000 | 979,445 | ||
36,303,023 | ||||||
Energy: 0.26% | ||||||
Oil & gas: 0.08% | ||||||
Aker BP ASA144A | 3.10 | 7-15-2031 | 504,000 | 419,626 | ||
Aker BP ASA144A | 4.00 | 1-15-2031 | 647,000 | 579,983 | ||
Petroleos Mexicanos | 2.38 | 4-15-2025 | 725,800 | 700,650 | ||
Petroleos Mexicanos | 2.46 | 12-15-2025 | 2,419,500 | 2,333,809 | ||
4,034,068 | ||||||
Pipelines: 0.18% | ||||||
Galaxy Pipeline Assets Bidco Ltd.144A | 1.75 | 9-30-2027 | 2,590,720 | 2,397,462 | ||
Galaxy Pipeline Assets Bidco Ltd.144A | 2.16 | 3-31-2034 | 3,232,593 | 2,751,265 | ||
Interest rate | Maturity date | Principal | Value | |||
Pipelines (continued) | ||||||
Galaxy Pipeline Assets Bidco Ltd.144A | 2.63 % | 3-31-2036 | $ | 2,354,000 | $1,909,069 | |
Galaxy Pipeline Assets Bidco Ltd.144A | 2.94 | 9-30-2040 | 1,467,518 | 1,182,399 | ||
8,240,195 | ||||||
Financial: 2.40% | ||||||
Banks: 1.99% | ||||||
Barclays PLC (U.S. SOFR +2.21%)± | 5.83 | 5-9-2027 | 10,458,000 | 10,434,845 | ||
Barclays PLC (U.S. SOFR +2.98%)± | 6.22 | 5-9-2034 | 5,396,000 | 5,447,776 | ||
Barclays PLC (1 Year Treasury Constant Maturity +3.50%)± | 7.44 | 11-2-2033 | 6,947,000 | 7,572,987 | ||
Cooperatieve Rabobank UA (1 Year Treasury Constant Maturity +1.40%)144A± | 5.56 | 2-28-2029 | 12,323,000 | 12,350,978 | ||
Credit Suisse Group AG (U.S. SOFR +1.73%)144A± | 3.09 | 5-14-2032 | 1,185,000 | 952,580 | ||
Credit Suisse Group AG (U.S. SOFR +3.73%)144A± | 4.19 | 4-1-2031 | 4,092,000 | 3,596,418 | ||
Credit Suisse Group AG144A | 4.28 | 1-9-2028 | 2,665,000 | 2,436,210 | ||
Credit Suisse Group AG (U.S. SOFR +3.70%)144A± | 6.44 | 8-11-2028 | 5,102,000 | 5,083,072 | ||
Credit Suisse Group AG144A | 6.54 | 8-12-2033 | 1,101,000 | 1,123,648 | ||
Deutsche Bank AG (U.S. SOFR +2.26%)± | 3.74 | 1-7-2033 | 6,840,000 | 4,952,715 | ||
Deutsche Bank AG | 7.08 | 2-10-2034 | 611,000 | 558,883 | ||
HSBC Holdings PLC (U.S. SOFR +1.97%)± | 6.16 | 3-9-2029 | 7,036,000 | 7,174,065 | ||
HSBC Holdings PLC (U.S. SOFR +2.39%)± | 6.25 | 3-9-2034 | 8,130,000 | 8,363,036 | ||
HSBC Holdings PLC (U.S. SOFR +2.65%)± | 6.33 | 3-9-2044 | 2,940,000 | 3,043,532 | ||
Mitsubishi UFJ Financial Group, Inc. (1 Year Treasury Constant Maturity +1.97%)± | 5.41 | 4-19-2034 | 3,629,000 | 3,645,386 | ||
Mitsubishi UFJ Financial Group, Inc. (1 Year Treasury Constant Maturity +1.38%)± | 5.42 | 2-22-2029 | 3,612,000 | 3,618,720 | ||
Mitsubishi UFJ Financial Group, Inc. (1 Year Treasury Constant Maturity +1.63%)± | 5.44 | 2-22-2034 | 3,958,000 | 3,986,786 | ||
Mitsubishi UFJ Financial Group, Inc. (1 Year Treasury Constant Maturity +1.53%)± | 5.48 | 2-22-2031 | 2,079,000 | 2,098,570 | ||
Mizuho Financial Group, Inc. (1 Year Treasury Constant Maturity +1.65%)± | 5.74 | 5-27-2031 | 3,614,000 | 3,673,217 | ||
UBS Group AG (1 Year Treasury Constant Maturity +2.20%)144A± | 5.96 | 1-12-2034 | 2,711,000 | 2,719,092 | ||
92,832,516 | ||||||
Diversified financial services: 0.38% | ||||||
AerCap Ireland Capital DAC/AerCap Global Aviation Trust | 1.15 | 10-29-2023 | 17,877,000 | 17,527,486 | ||
REITS: 0.03% | ||||||
Trust Fibra Uno144A | 6.39 | 1-15-2050 | 1,883,000 | 1,388,806 | ||
Industrial: 0.10% | ||||||
Transportation: 0.10% | ||||||
Canadian Pacific Railway Co. | 1.35 | 12-2-2024 | 3,923,000 | 3,693,661 | ||
Canadian Pacific Railway Co. | 1.75 | 12-2-2026 | 759,000 | 688,603 | ||
4,382,264 | ||||||
Technology: 0.10% | ||||||
Semiconductors: 0.10% | ||||||
NXP BV/NXP Funding LLC/NXP USA, Inc. | 2.50 | 5-11-2031 | 1,758,000 | 1,433,155 | ||
Interest rate | Maturity date | Principal | Value | |||
Semiconductors (continued) | ||||||
NXP BV/NXP Funding LLC/NXP USA, Inc. | 3.25 % | 5-11-2041 | $ | 1,730,000 | $1,236,842 | |
NXP BV/NXP Funding LLC/NXP USA, Inc. | 4.40 | 6-1-2027 | 1,912,000 | 1,860,460 | ||
4,530,457 | ||||||
Utilities: 0.03% | ||||||
Electric: 0.03% | ||||||
Israel Electric Corp. Ltd.144A | 3.75 | 2-22-2032 | 1,561,000 | 1,343,977 | ||
Total yankee corporate bonds and notes (Cost $207,421,223) | 202,207,707 | |||||
Yankee government bonds: 0.83% | ||||||
Bank Gospodarstwa Krajowego144A | 5.38 | 5-22-2033 | 2,424,000 | 2,422,381 | ||
Bermuda144A | 5.00 | 7-15-2032 | 2,063,000 | 2,027,071 | ||
Canada | 3.25 | 6-8-2027 | 2,400,000 | 2,309,605 | ||
Export Finance & Insurance Corp.144A | 4.63 | 10-26-2027 | 5,920,000 | 6,014,719 | ||
Israel | 4.50 | 1-17-2033 | 6,209,000 | 6,096,766 | ||
Mexico | 3.50 | 2-12-2034 | 7,367,000 | 6,188,198 | ||
Mexico | 3.75 | 4-19-2071 | 3,462,000 | 2,262,844 | ||
Mexico | 3.77 | 5-24-2061 | 1,217,000 | 808,737 | ||
Mexico | 6.34 | 5-4-2053 | 5,117,000 | 5,131,250 | ||
Panama | 6.85 | 3-28-2054 | 1,655,000 | 1,696,249 | ||
Paraguay 144A | 5.40 | 3-30-2050 | 821,000 | 687,423 | ||
Peru | 3.60 | 1-15-2072 | 931,000 | 606,284 | ||
Poland | 5.50 | 4-4-2053 | 2,541,000 | 2,552,435 | ||
Total yankee government bonds (Cost $40,288,713) | 38,803,962 | |||||
Yield | Shares | |||||
Short-term investments: 2.52% | ||||||
Investment companies: 2.52% | ||||||
Allspring Government Money Market Fund Select Class♠∞## | 5.01 | 117,290,523 | 117,290,523 | |||
Total short-term investments (Cost $117,290,523) | 117,290,523 | |||||
Total investments in securities (Cost $5,228,121,430) | 106.78 % | 4,978,927,875 | ||||
Interest rate | Maturity date | Shares | Value | |||
Securities sold short: (0.26)% | ||||||
Agency securities: (0.26)% | ||||||
FNMA | 3.50 % | 6-13-2053 | (13,100,000 ) | $(12,035,113 ) | ||
Total agency securities (Cost $(12,239,801)) | (12,035,113 ) | |||||
Total securities sold short (Proceeds $(12,239,801)) | (0.26 )% | (12,035,113 ) | ||||
Other assets and liabilities, net | (6.52 ) | (303,909,521 ) | ||||
Total net assets | 100.00 % | $4,662,983,241 | ||||
¤ | The security is issued in zero coupon form with no periodic interest payments. |
± | Variable rate investment. The rate shown is the rate in effect at period end. |
%% | The security is purchased on a when-issued basis. |
±± | The coupon of the security is adjusted based on the principal and/or interest payments received from the underlying pool of mortgages as well as the credit quality and the actual prepayment speed of the underlying mortgages. The rate shown is the rate in effect at period end. |
144A | The security may be resold in transactions exempt from registration, normally to qualified institutional buyers, pursuant to Rule 144A under the Securities Act of 1933. |
## | All or a portion of this security is segregated for when-issued securities. |
♠ | The issuer of the security is an affiliated person of the Portfolio as defined in the Investment Company Act of 1940. |
∞ | The rate represents the 7-day annualized yield at period end. |
Abbreviations: | |
FHLB | Federal Home Loan Bank |
FHLMC | Federal Home Loan Mortgage Corporation |
FNMA | Federal National Mortgage Association |
GNMA | Government National Mortgage Association |
LIBOR | London Interbank Offered Rate |
REIT | Real estate investment trust |
SOFR | Secured Overnight Financing Rate |
STRIPS | Separate trading of registered interest and principal securities |
Value, beginning of period | Purchases | Sales proceeds | Net realized gains (losses) | Net change in unrealized gains (losses) | Value, end of period | Shares, end of period | Income from affiliated securities | |
Short-term investments | ||||||||
Allspring Government Money Market Fund Select Class | $114,848,590 | $2,617,686,181 | $(2,615,244,248 ) | $0 | $0 | $117,290,523 | 117,290,523 | $3,850,778 |
Investments in affiliates no longer held at end of period | ||||||||
Securities Lending Cash Investments LLC | 10,235,000 | 224,349,956 | (234,584,875 ) | (81 ) | 0 | 0 | 0 | 188,630 1 |
$(81 ) | $0 | $117,290,523 | $4,039,408 |
1 | Amount shown represents income before fees and rebates. |
Assets | |
Investments in unaffiliated securities, at value (cost $5,110,830,907) | $4,861,637,352 |
Investments in affiliated securities, at value (cost $117,290,523) | 117,290,523 |
Cash | 2,267,865 |
Cash due from broker | 270,000 |
Segregated cash for when-issued securities | 1,438,202 |
Receivable for investments sold | 268,769,159 |
Receivable for interest | 22,690,600 |
Principal paydown receivable | 1,316,371 |
Prepaid expenses and other assets | 71,840 |
Total assets | 5,275,751,912 |
Liabilities | |
Payable for when-issued transactions | 456,739,540 |
Payable for investments purchased | 141,993,969 |
Securities sold short, at value (proceeds $12,239,801) | 12,035,113 |
Advisory fee payable | 1,202,087 |
Cash collateral due to broker | 670,396 |
Trustees’ fees and expenses payable | 504 |
Accrued expenses and other liabilities | 127,062 |
Total liabilities | 612,768,671 |
Total net assets | $4,662,983,241 |
Investment income | |
Interest (net of foreign withholding taxes of $5,992) | $151,508,682 |
Income from affiliated securities | 3,887,580 |
Total investment income | 155,396,262 |
Expenses | |
Advisory fee | 15,815,926 |
Custody and accounting fees | 288,524 |
Professional fees | 134,101 |
Interest holder report expenses | 33,891 |
Trustees’ fees and expenses | 27,688 |
Other fees and expenses | 137,594 |
Total expenses | 16,437,724 |
Less: Fee waivers and/or expense reimbursements | (329,616 ) |
Net expenses | 16,108,108 |
Net investment income | 139,288,154 |
Realized and unrealized gains (losses) on investments | |
Net realized losses on | |
Unaffiliated securities | (329,727,799 ) |
Affiliated securities | (81 ) |
Net realized losses on investments | (329,727,880 ) |
Net change in unrealized gains (losses) on | |
Unaffiliated securities | 89,960,355 |
Securities sold short | 204,688 |
Net change in unrealized gains (losses) on investments | 90,165,043 |
Net realized and unrealized gains (losses) on investments | (239,562,837 ) |
Net decrease in net assets resulting from operations | $(100,274,683 ) |
Year ended May 31, 2023 | Year ended May 31, 2022 | |||
Operations | ||||
Net investment income | $139,288,154 | $71,113,325 | ||
Net realized losses on investments | (329,727,880 ) | (167,999,743 ) | ||
Net change in unrealized gains (losses) on investments | 90,165,043 | (357,074,109 ) | ||
Net decrease in net assets resulting from operations | (100,274,683 ) | (453,960,527 ) | ||
Capital transactions | ||||
Transactions in investors��� beneficial interests | ||||
Contributions | 747,955,348 | 733,615,538 | ||
Withdrawals | (843,243,755 ) | (1,063,241,380 ) | ||
Net decrease in net assets resulting from capital transactions | (95,288,407 ) | (329,625,842 ) | ||
Total decrease in net assets | (195,563,090 ) | (783,586,369 ) | ||
Net assets | ||||
Beginning of period | 4,858,546,331 | 5,642,132,700 | ||
End of period | $4,662,983,241 | $4,858,546,331 | ||
Year ended May 31 | |||||
2023 | 2022 | 2021 | 2020 | 2019 | |
Total return | (1.88 )% | (8.55 )% | 0.65 % | 9.49 % | 6.30 % |
Ratios to average net assets (annualized) | |||||
Gross expenses | 0.36 % | 0.36 % | 0.35 % | 0.35 % | 0.35 % |
Net expenses1 | 0.36 % | 0.36 % | 0.35 % | 0.35 % | 0.35 % |
Net investment income | 3.08 % | 1.33 % | 1.30 % | 2.28 % | 2.93 % |
Supplemental data | |||||
Portfolio turnover rate | 384 % | 432 % | 457 % | 603 % | 577 % |
1 | Net expense ratios reflect voluntary waivers, if any. |
Gross unrealized gains | $18,981,173 |
Gross unrealized losses | (292,470,108 ) |
Net unrealized losses | $(273,488,935 ) |
Quoted prices (Level 1) | Other significant observable inputs (Level 2) | Significant unobservable inputs (Level 3) | Total | |
Assets | ||||
Investments in: | ||||
Agency securities | $0 | $1,737,506,349 | $0 | $1,737,506,349 |
Asset-backed securities | 0 | 509,676,654 | 0 | 509,676,654 |
Corporate bonds and notes | 0 | 880,009,676 | 0 | 880,009,676 |
Municipal obligations | 0 | 16,429,974 | 0 | 16,429,974 |
Non-agency mortgage-backed securities | 0 | 148,460,955 | 0 | 148,460,955 |
U.S. Treasury securities | 1,328,542,075 | 0 | 0 | 1,328,542,075 |
Yankee corporate bonds and notes | 0 | 202,207,707 | 0 | 202,207,707 |
Yankee government bonds | 0 | 38,803,962 | 0 | 38,803,962 |
Short-term investments | ||||
Investment companies | 117,290,523 | 0 | 0 | 117,290,523 |
Total assets | $1,445,832,598 | $3,533,095,277 | $0 | $4,978,927,875 |
Liabilities | ||||
Securities sold short | ||||
Agency securities | $0 | $12,035,113 | $0 | $12,035,113 |
Total liabilities | $0 | $12,035,113 | $0 | $12,035,113 |
Average daily net assets | Advisory fee |
First $500 million | 0.400 % |
Next $500 million | 0.375 |
Next $2 billion | 0.350 |
Next $2 billion | 0.325 |
Next $5 billion | 0.300 |
Over $10 billion | 0.290 |
Purchases at cost | Sales proceeds | ||
U.S. government | Non-U.S. government | U.S. government | Non-U.S. government |
$10,700,380,474 | $7,437,782,992 | $10,771,433,780 | $7,064,558,280 |
Allspring Master Trust:
Name and year of birth | Position held and length of service* | Principal occupations during past five years or longer | Current other public company or investment company directorships |
William R. Ebsworth (Born 1957) | Trustee, since 2015 | Retired. From 1984 to 2013, equities analyst, portfolio manager, research director and chief investment officer at Fidelity Management and Research Company in Boston, Tokyo, and Hong Kong, and retired in 2013 as Chief Investment Officer of Fidelity Strategic Advisers, Inc. where he led a team of investment professionals managing client assets. Prior thereto, Board member of Hong Kong Securities Clearing Co., Hong Kong Options Clearing Corp., the Thailand International Fund, Ltd., Fidelity Investments Life Insurance Company, and Empire Fidelity Investments Life Insurance Company. Audit Committee Chair and Investment Committee Chair of the Vincent Memorial Hospital Foundation (non-profit organization). Mr. Ebsworth is a CFA charterholder. | N/A |
Jane A. Freeman (Born 1953) | Trustee, since 2015; Chair Liaison, since 2018 | Retired. From 2012 to 2014 and 1999 to 2008, Chief Financial Officer of Scientific Learning Corporation. From 2008 to 2012, Ms. Freeman provided consulting services related to strategic business projects. Prior to 1999, Portfolio Manager at Rockefeller & Co. and Scudder, Stevens & Clark. Board member of the Harding Loevner Funds from 1996 to 2014, serving as both Lead Independent Director and chair of the Audit Committee. Board member of the Russell Exchange Traded Funds Trust from 2011 to 2012 and the chair of the Audit Committee. Ms. Freeman is also an inactive Chartered Financial Analyst. | N/A |
Isaiah Harris, Jr. (Born 1952) | Trustee, since 2009; Audit Committee Chair, since 2019 | Retired. Member of the Advisory Board of CEF of East Central Florida. Chairman of the Board of CIGNA Corporation from 2009 to 2021, and Director from 2005 to 2008. From 2003 to 2011, Director of Deluxe Corporation. Prior thereto, President and CEO of BellSouth Advertising and Publishing Corp. from 2005 to 2007, President and CEO of BellSouth Enterprises from 2004 to 2005 and President of BellSouth Consumer Services from 2000 to 2003. Emeritus member of the Iowa State University Foundation Board of Governors. Emeritus Member of the Advisory board of Iowa State University School of Business. Advisory Board Member, Palm Harbor Academy (private school). Advisory Board Member, Fellowship of Christian Athletes. Mr. Harris is a certified public accountant (inactive status). | N/A |
David F. Larcker (Born 1950) | Trustee, since 2009 | Distinguished Visiting Fellow at the Hoover Institution since 2022. James Irvin Miller Professor of Accounting at the Graduate School of Business (Emeritus), Stanford University, Director of the Corporate Governance Research Initiative and Senior Faculty of The Rock Center for Corporate Governance since 2006. From 2005 to 2008, Professor of Accounting at the Graduate School of Business, Stanford University. Prior thereto, Ernst & Young Professor of Accounting at The Wharton School, University of Pennsylvania from 1985 to 2005. | N/A |
Olivia S. Mitchell (Born 1953) | Trustee, since 2006; Nominating and Governance Committee Chair, since 2018 | International Foundation of Employee Benefit Plans Professor since 1993, Wharton School of the University of Pennsylvania. Director of Wharton’s Pension Research Council and Boettner Center on Pensions & Retirement Research, and Research Associate at the National Bureau of Economic Research. Previously taught at Cornell University from 1978 to 1993. | N/A |
Timothy J. Penny (Born 1951) | Trustee, since 1996; Chair, since 2018 | President and Chief Executive Officer of Southern Minnesota Initiative Foundation, a non-profit organization, since 2007. Vice Chair of the Economic Club of Minnesota, since 2007. Co-Chair of the Committee for a Responsible Federal Budget, since 1995. Member of the Board of Trustees of NorthStar Education Finance, Inc., a non-profit organization, from 2007-2022. Senior Fellow of the University of Minnesota Humphrey Institute from 1995 to 2017. | N/A |
Name and year of birth | Position held and length of service* | Principal occupations during past five years or longer | Current other public company or investment company directorships |
James G. Polisson (Born 1959) | Trustee, since 2018 | Retired. Chief Marketing Officer, Source (ETF) UK Services, Ltd, from 2015 to 2017. From 2012 to 2015, Principal of The Polisson Group, LLC, a management consulting, corporate advisory and principal investing company. Chief Executive Officer and Managing Director at Russell Investments, Global Exchange Traded Funds from 2010 to 2012. Managing Director of Barclays Global Investors from 1998 to 2010 and Global Chief Marketing Officer for iShares and Barclays Global Investors from 2000 to 2010. Trustee of the San Francisco Mechanics’ Institute, a non- profit organization, from 2013 to 2015. Board member of the Russell Exchange Traded Fund Trust from 2011 to 2012. Director of Barclays Global Investors Holdings Deutschland GmbH from 2006 to 2009. Mr. Polisson is an attorney and has a retired status with the Massachusetts and District of Columbia Bar Associations. | N/A |
Pamela Wheelock (Born 1959) | Trustee, since January 2020; previously Trustee from January 2018 to July 2019 | Retired. Executive and Senior Financial leadership positions in the public, private and nonprofit sectors. Interim President and CEO, McKnight Foundation, 2020. Interim Commissioner, Minnesota Department of Human Services, 2019. Chief Operating Officer, Twin Cities Habitat for Humanity, 2017-2019. Vice President for University Services, University of Minnesota, 2012- 2016. Interim President and CEO, Blue Cross and Blue Shield of Minnesota, 2011-2012. Executive Vice-President and Chief Financial Officer, Minnesota Wild, 2002-2008. Commissioner, Minnesota Department of Finance, 1999-2002. Chair of the Board of Directors of Destination Medical Center Corporation. Board member of the Minnesota Wild Foundation. | N/A |
* | Length of service dates reflect the Trustee’s commencement of service with the Trust’s predecessor entities, where applicable. |
Name and year of birth | Position held and length of service | Principal occupations during past five years or longer |
Andrew Owen (Born 1960) | President, since 2017 | President and Chief Executive Officer of Allspring Funds Management, LLC since 2017 and Head of Global Fund Governance of Allspring Global Investments since 2022. Prior thereto, co-president of Galliard Capital Management, LLC, an affiliate of Allspring Funds Management, LLC, from 2019 to 2022 and Head of Affiliated Managers, Allspring Global Investments, from 2014 to 2019 and Executive Vice President responsible for marketing, investments and product development for Allspring Funds Management, LLC, from 2009 to 2014. |
Jeremy DePalma (Born 1974) | Treasurer, since 2012 (for certain funds in the Fund Complex); since 2021 (for the remaining funds in the Complex) | Senior Vice President of Allspring Funds Management, LLC since 2009. Senior Vice President of Evergreen Investment Management Company, LLC from 2008 to 2010 and head of the Fund Reporting and Control Team within Fund Administration from 2005 to 2010. |
Christopher Baker (Born 1976) | Chief Compliance Officer, since 2022 | Global Chief Compliance Officer for Allspring Global Investments since 2022. Prior thereto, Chief Compliance Officer for State Street Global Advisors from 2018 to 2021. Senior Compliance Officer for the State Street divisions of Alternative Investment Solutions, Sector Solutions, and Global Marketing from 2015 to 2018. From 2010 to 2015 Vice President, Global Head of Investment and Marketing Compliance for State Street Global Advisors. |
Matthew Prasse (Born 1983) | Chief Legal Officer, since 2022; Secretary, since 2021 | Senior Counsel of the Allspring Legal Department since 2021. Senior Counsel of the Wells Fargo Legal Department from 2018 to 2021. Previously, Counsel for Barings LLC from 2015 to 2018. Prior to joining Barings, Associate at Morgan, Lewis & Bockius LLP from 2008 to 2015. |

P.O. Box 219967
Kansas City, MO 64121-9967

AR0940 05-23
Investment objective | The Portfolio seeks long-term capital appreciation. |
Manager | Allspring Funds Management, LLC |
Subadviser | Allspring Global Investments, LLC |
Portfolio managers | Justin P. Carr, CFA, Vince Fioramonti, CFA |
Ten largest holdings (%) as of May 31, 20231 | |
Nestle SA | 2.07 |
ASML Holding NV | 1.99 |
Novo Nordisk AS Class B | 1.88 |
LVMH Moet Hennessy Louis Vuitton SE | 1.61 |
Roche Holding AG | 1.54 |
AstraZeneca PLC | 1.54 |
Shell PLC | 1.38 |
Novartis AG | 1.18 |
HSBC Holdings PLC | 0.96 |
SAP SE | 0.87 |
1 | Figures represent the percentage of the Portfolio’s net assets. Holdings are subject to change and may have changed since the date specified. |
Sector allocation as of May 31, 20231 |
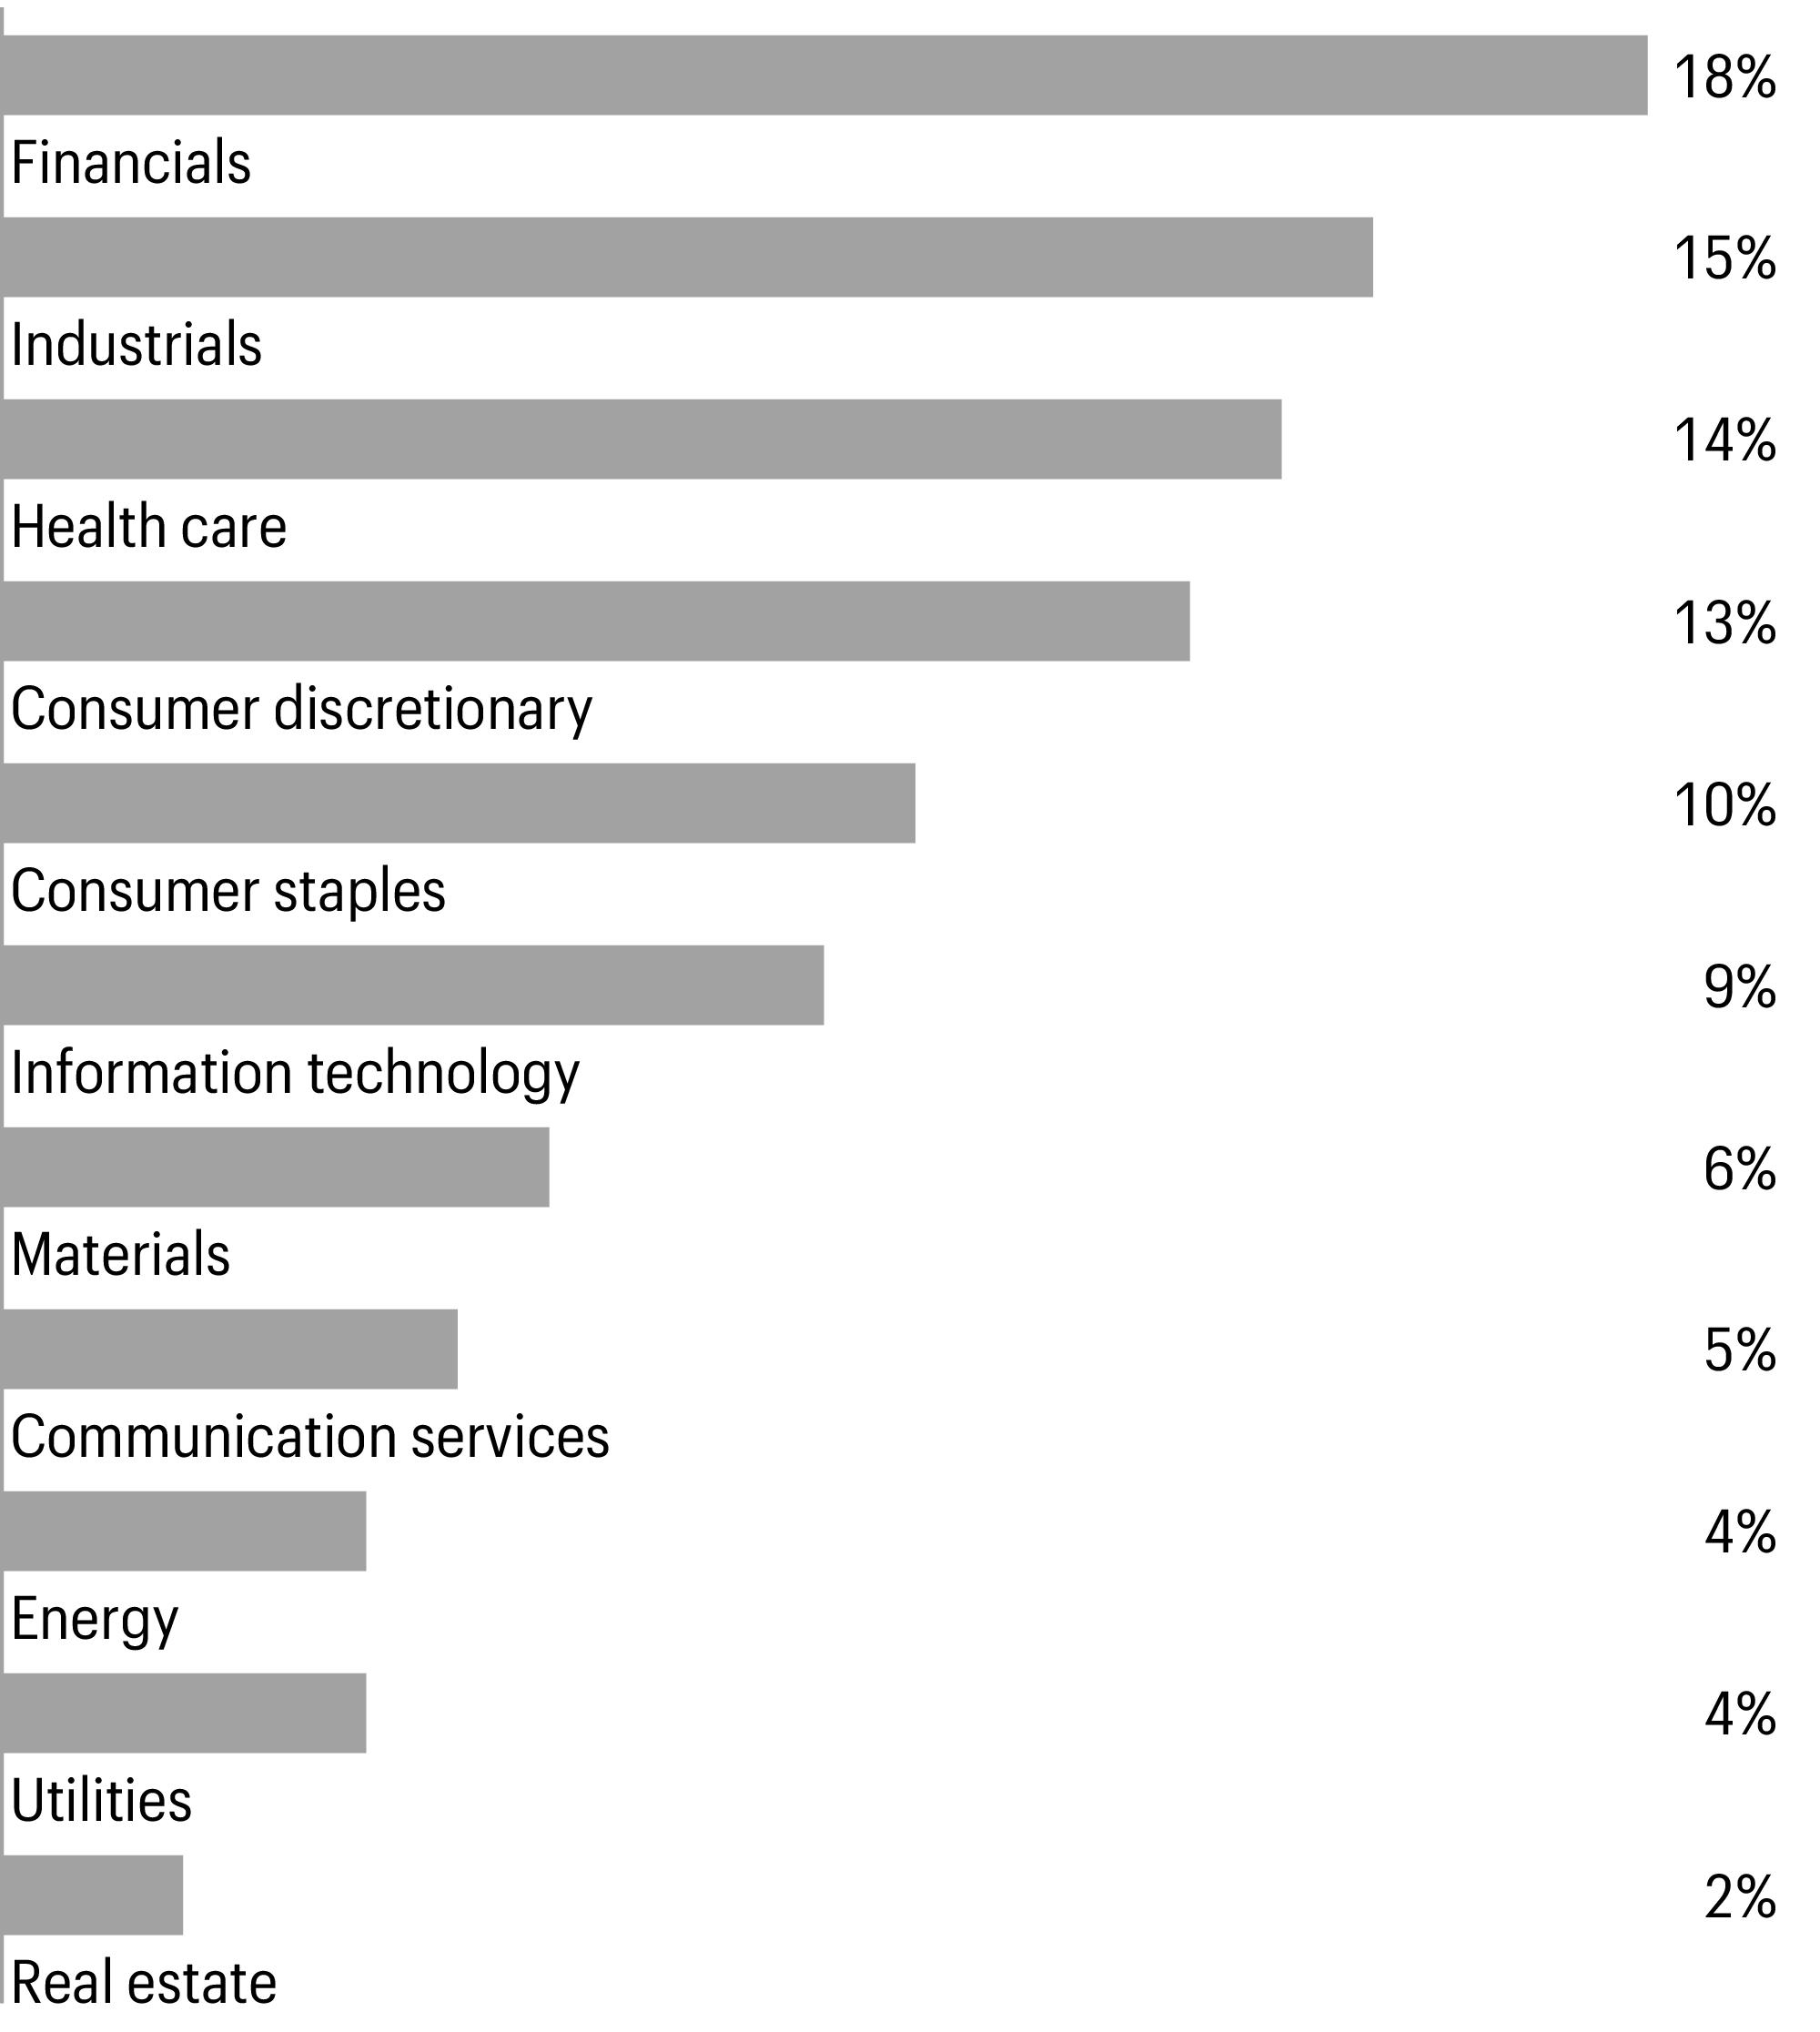
1 | Figures represent the percentage of the Portfolio’s long-term investments. Allocations are subject to change and may have changed since the date specified. |
Geographic allocation as of May 31, 20231 |
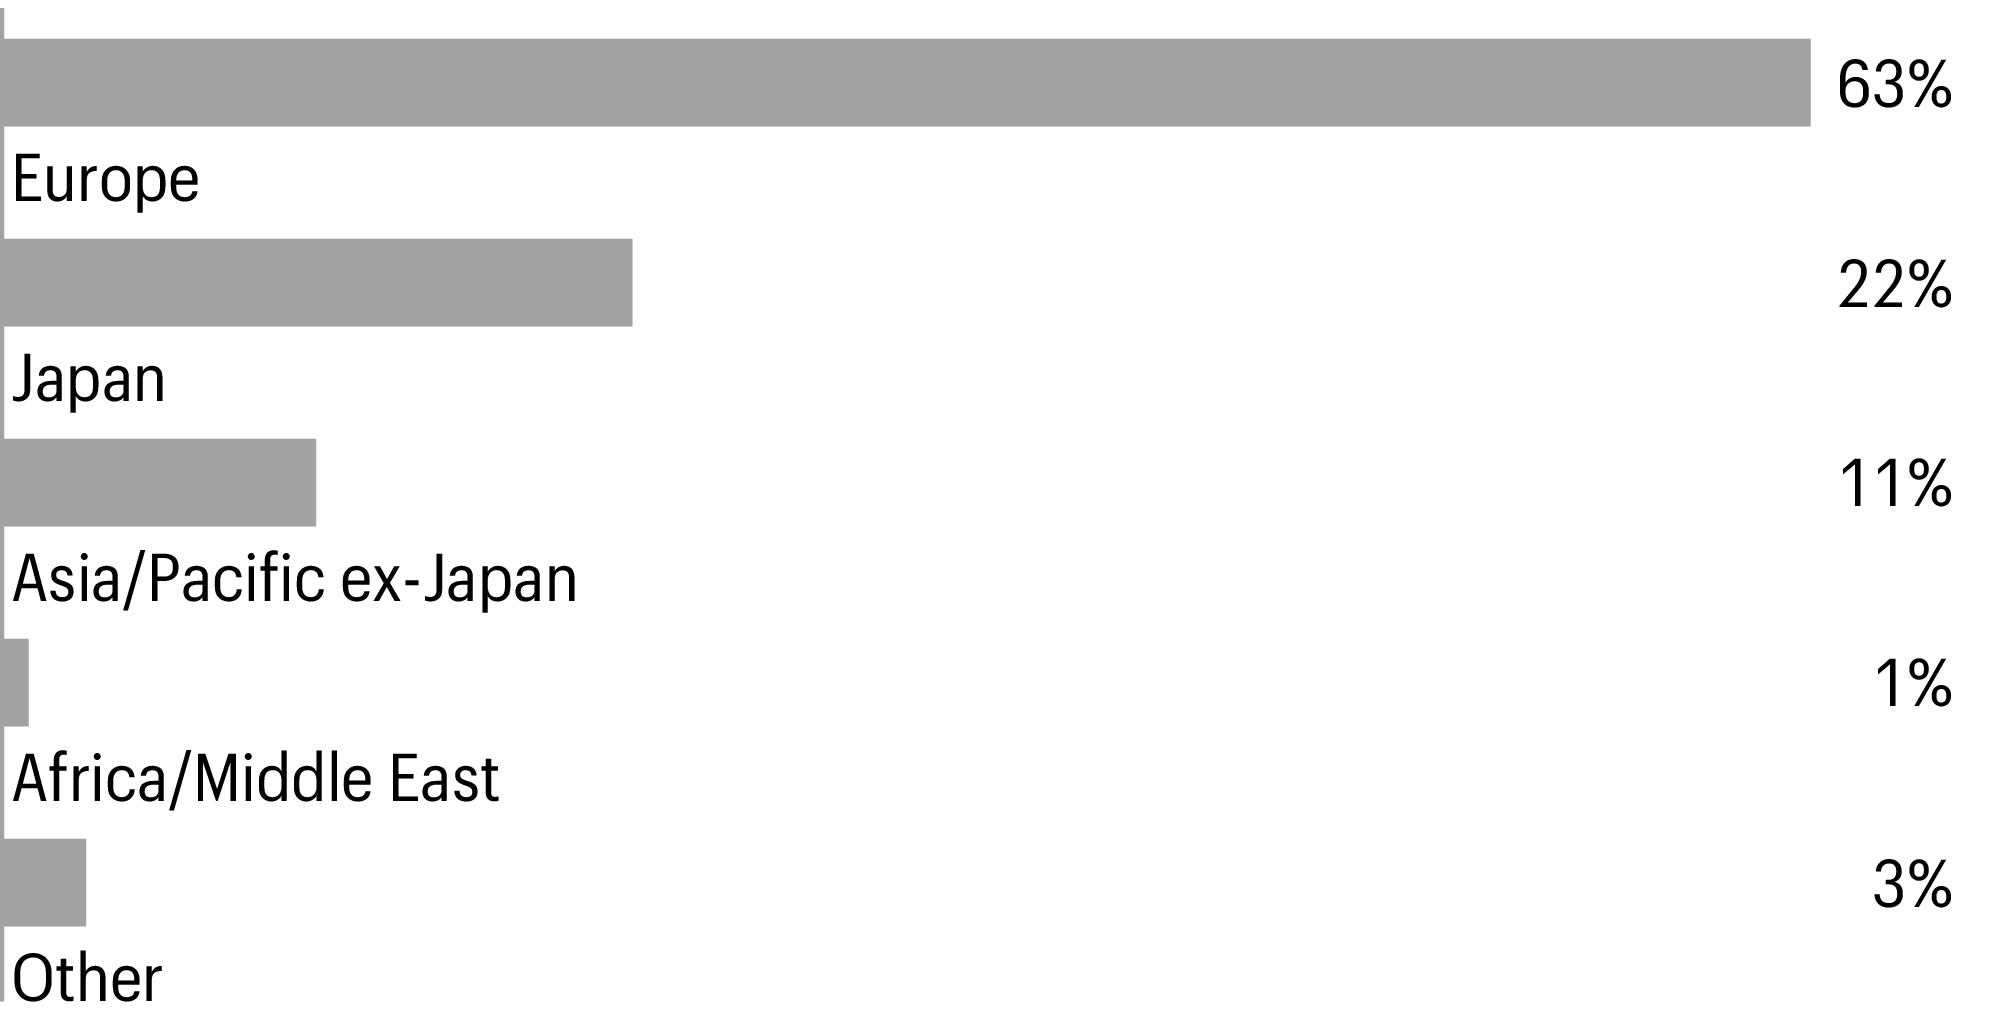
1 | Figures represent the percentage of the Portfolio’s long-term investments. Allocations are subject to change and may have changed since the date specified. |
CFA® and Chartered Financial Analyst® are trademarks owned by CFA Institute. |
Shares | Value | |||||
Common stocks: 95.80% | ||||||
Australia: 7.04% | ||||||
ANZ Group Holdings Ltd. (Financials, Banks) | 34,889 | $520,136 | ||||
Aristocrat Leisure Ltd. (Consumer discretionary, Hotels, restaurants & leisure) | 7,484 | 180,845 | ||||
BHP Group Ltd. Class DI (Materials, Metals & mining) | 16,822 | 462,563 | ||||
BHP Group Ltd. (Materials, Metals & mining) | 24,761 | 676,766 | ||||
BlueScope Steel Ltd. (Materials, Metals & mining) | 14,748 | 177,659 | ||||
Brambles Ltd. (Industrials, Commercial services & supplies) | 15,197 | 135,818 | ||||
Coles Group Ltd. (Consumer staples, Consumer staples distribution & retail) | 15,293 | 178,853 | ||||
Commonwealth Bank of Australia (Financials, Banks) | 15,302 | 963,270 | ||||
CSL Ltd. (Health care, Biotechnology) | 4,074 | 811,913 | ||||
Dexus (Real estate, Office REITs) | 11,665 | 62,293 | ||||
Fortescue Metals Group Ltd. (Materials, Metals & mining) | 10,852 | 135,668 | ||||
Glencore PLC (Materials, Metals & mining)† | 105,483 | 539,886 | ||||
Goodman Group (Real estate, Industrial REITs) | 8,609 | 109,923 | ||||
Macquarie Group Ltd. (Financials, Capital markets) | 4,171 | 463,222 | ||||
National Australia Bank Ltd. (Financials, Banks) | 33,647 | 568,372 | ||||
Origin Energy Ltd. (Utilities, Electric utilities) | 23,240 | 125,920 | ||||
Pilbara Minerals Ltd. (Materials, Metals & mining) | 59,028 | 169,321 | ||||
Qantas Airways Ltd. (Industrials, Passenger airlines)† | 49,436 | 213,835 | ||||
Rio Tinto Ltd. (Materials, Metals & mining) | 3,193 | 222,227 | ||||
Scentre Group (Real estate, Retail REITs) | 91,324 | 160,979 | ||||
South32 Ltd. (Materials, Metals & mining) | 59,291 | 149,636 | ||||
Stockland (Real estate, Diversified REITs) | 71,363 | 197,741 | ||||
Transurban Group (Industrials, Transportation infrastructure) | 34,353 | 331,599 | ||||
Washington H Soul Pattinson & Co. Ltd. (Energy, Oil, gas & consumable fuels) | 6,366 | 133,001 | ||||
Wesfarmers Ltd. (Consumer discretionary, Broadline retail) | 9,362 | 290,287 | ||||
Westpac Banking Corp. (Financials, Banks) | 44,766 | 602,161 | ||||
Woodside Energy Group Ltd. (Energy, Oil, gas & consumable fuels) | 12,666 | 282,584 | ||||
Woolworths Group Ltd. (Consumer staples, Consumer staples distribution & retail) | 7,132 | 174,148 | ||||
9,040,626 | ||||||
Austria: 0.11% | ||||||
Erste Group Bank AG (Financials, Banks) | 4,399 | 142,332 | ||||
Belgium: 0.47% | ||||||
Anheuser-Busch InBev SA (Consumer staples, Beverages) | 2,396 | 127,824 | ||||
KBC Group NV (Financials, Banks)† | 5,684 | 371,707 | ||||
Umicore SA (Materials, Chemicals) | 3,916 | 108,831 | ||||
608,362 | ||||||
China: 0.08% | ||||||
SITC International Holdings Co. Ltd. (Industrials, Marine transportation) | 56,000 | 97,261 | ||||
Denmark: 3.10% | ||||||
AP Moller - Maersk AS Class A (Industrials, Marine transportation) | 52 | 87,256 | ||||
Carlsberg AS Class B (Consumer staples, Beverages) | 1,024 | 154,262 | ||||
Demant AS (Health care, Health care equipment & supplies)† | 5,014 | 190,580 | ||||
DSV AS (Industrials, Air freight & logistics) | 3,290 | 633,996 | ||||
Genmab AS (Health care, Biotechnology)† | 940 | 367,680 | ||||
Shares | Value | |||||
Denmark (continued) | ||||||
Novo Nordisk AS Class B (Health care, Pharmaceuticals) | 15,063 | $2,413,401 | ||||
Vestas Wind Systems AS (Industrials, Electrical equipment)† | 4,880 | 138,933 | ||||
3,986,108 | ||||||
Finland: 0.92% | ||||||
Elisa Oyj (Communication services, Diversified telecommunication services) | 3,174 | 177,777 | ||||
Kesko Oyj Class B (Consumer staples, Consumer staples distribution & retail) | 8,198 | 154,971 | ||||
Nokia Oyj (Information technology, Communications equipment) | 35,572 | 144,297 | ||||
Nordea Bank Abp (Financials, Banks) | 39,673 | 390,010 | ||||
Sampo Oyj Class A (Financials, Insurance) | 2,828 | 130,043 | ||||
Stora Enso Oyj Class R (Materials, Paper & forest products) | 14,693 | 186,030 | ||||
1,183,128 | ||||||
France: 11.77% | ||||||
Air Liquide SA (Materials, Chemicals) | 3,204 | 536,454 | ||||
Amundi SA (Financials, Capital markets)144A | 2,617 | 147,139 | ||||
Arkema SA (Materials, Chemicals) | 1,286 | 112,030 | ||||
AXA SA (Financials, Insurance) | 16,409 | 463,308 | ||||
BioMerieux (Health care, Health care equipment & supplies) | 1,134 | 113,504 | ||||
BNP Paribas SA (Financials, Banks) | 11,960 | 690,466 | ||||
Capgemini SE (Information technology, IT services) | 1,637 | 284,866 | ||||
Carrefour SA (Consumer staples, Consumer staples distribution & retail) | 9,485 | 174,230 | ||||
CIE de Saint-Gobain (Industrials, Building products) | 6,418 | 355,358 | ||||
Cie Generale des Etablissements Michelin SCA (Consumer discretionary, Automobile components) | 5,166 | 146,663 | ||||
Credit Agricole SA (Financials, Banks) | 18,164 | 207,591 | ||||
Dassault Aviation SA (Industrials, Aerospace & defense) | 800 | 135,280 | ||||
Dassault Systemes SE (Information technology, Software) | 4,324 | 190,007 | ||||
Edenred (Financials, Financial services) | 4,122 | 264,713 | ||||
Eiffage SA (Industrials, Construction & engineering) | 3,239 | 344,901 | ||||
Engie SA (Utilities, Multi-utilities) | 32,620 | 489,610 | ||||
EssilorLuxottica SA (Health care, Health care equipment & supplies) | 2,898 | 521,772 | ||||
Hermes International (Consumer discretionary, Textiles, apparel & luxury goods) | 273 | 554,964 | ||||
Kering SA (Consumer discretionary, Textiles, apparel & luxury goods) | 577 | 307,360 | ||||
La Francaise des Jeux SAEM (Consumer discretionary, Hotels, restaurants & leisure)144A | 3,320 | 127,968 | ||||
Legrand SA (Industrials, Electrical equipment) | 3,486 | 329,618 | ||||
L’Oreal SA (Consumer staples, Personal care products) | 1,832 | 781,332 | ||||
LVMH Moet Hennessy Louis Vuitton SE (Consumer discretionary, Textiles, apparel & luxury goods) | 2,379 | 2,069,677 | ||||
Orange SA (Communication services, Diversified telecommunication services) | 20,269 | 242,047 | ||||
Pernod Ricard SA (Consumer staples, Beverages) | 2,329 | 503,122 | ||||
Publicis Groupe SA (Communication services, Media) | 4,390 | 325,282 | ||||
Safran SA (Industrials, Aerospace & defense) | 3,074 | 445,029 | ||||
Sanofi (Health care, Pharmaceuticals) | 9,317 | 944,905 | ||||
Schneider Electric SE (Industrials, Electrical equipment) | 4,439 | 765,534 | ||||
Societe Generale SA (Financials, Banks) | 6,554 | 151,531 | ||||
Teleperformance (Industrials, Professional services) | 1,024 | 153,128 | ||||
Thales SA (Industrials, Aerospace & defense) | 1,660 | 231,201 | ||||
Shares | Value | |||||
France (continued) | ||||||
TotalEnergies SE (Energy, Oil, gas & consumable fuels) | 19,395 | $1,100,419 | ||||
Veolia Environnement SA (Utilities, Multi-utilities) | 4,521 | 133,087 | ||||
Vinci SA (Industrials, Construction & engineering) | 5,714 | 649,370 | ||||
Worldline SA (Financials, Financial services)144A† | 2,919 | 113,416 | ||||
15,106,882 | ||||||
Germany: 7.56% | ||||||
adidas AG (Consumer discretionary, Textiles, apparel & luxury goods) | 1,386 | 224,447 | ||||
Allianz SE (Financials, Insurance) | 3,513 | 750,934 | ||||
BASF SE (Materials, Chemicals) | 8,718 | 413,889 | ||||
Bayer AG (Health care, Pharmaceuticals) | 8,083 | 450,485 | ||||
Bayerische Motoren Werke AG (Consumer discretionary, Automobiles) | 4,186 | 456,032 | ||||
Beiersdorf AG (Consumer staples, Personal care products) | 1,132 | 144,171 | ||||
Daimler Truck Holding AG (Industrials, Machinery)† | 4,397 | 133,009 | ||||
Deutsche Bank AG (Financials, Capital markets) | 15,764 | 159,672 | ||||
Deutsche Boerse AG (Financials, Capital markets) | 2,695 | 465,231 | ||||
Deutsche Lufthansa AG (Industrials, Passenger airlines)† | 15,175 | 148,580 | ||||
Deutsche Post AG (Industrials, Air freight & logistics) | 10,533 | 473,429 | ||||
Deutsche Telekom AG (Communication services, Diversified telecommunication services) | 30,853 | 684,145 | ||||
E.ON SE (Utilities, Multi-utilities) | 32,226 | 389,589 | ||||
HelloFresh SE (Consumer staples, Consumer staples distribution & retail)† | 4,067 | 96,639 | ||||
Infineon Technologies AG (Information technology, Semiconductors & semiconductor equipment) | 10,219 | 379,359 | ||||
ING Groep NV (Financials, Banks) | 30,971 | 380,971 | ||||
Mercedes-Benz Group AG (Consumer discretionary, Automobiles) | 7,860 | 586,176 | ||||
Merck KGaA (Health care, Pharmaceuticals) | 984 | 171,180 | ||||
Muenchener Rueckversicherungs-Gesellschaft AG in Muenchen (Financials, Insurance) | 1,116 | 398,426 | ||||
Puma SE (Consumer discretionary, Textiles, apparel & luxury goods) | 2,141 | 101,885 | ||||
RWE AG (Utilities, Independent power and renewable electricity producers) | 6,063 | 253,527 | ||||
SAP SE (Information technology, Software) | 8,600 | 1,123,145 | ||||
Siemens AG (Industrials, Industrial conglomerates) | 5,808 | 951,961 | ||||
Siemens Healthineers AG (Health care, Health care equipment & supplies)144A | 2,794 | 157,986 | ||||
United Internet AG (Communication services, Diversified telecommunication services) | 8,619 | 123,821 | ||||
Zalando SE (Consumer discretionary, Specialty retail)144A† | 3,226 | 93,241 | ||||
9,711,930 | ||||||
Hong Kong: 2.30% | ||||||
AIA Group Ltd. (Financials, Insurance) | 90,000 | 863,169 | ||||
BOC Hong Kong Holdings Ltd. (Financials, Banks) | 83,500 | 247,926 | ||||
CK Asset Holdings Ltd. (Real estate, Real estate management & development) | 32,500 | 175,149 | ||||
Henderson Land Development Co. Ltd. (Real estate, Real estate management & development) | 51,000 | 161,849 | ||||
Hong Kong Exchanges & Clearing Ltd. (Financials, Capital markets) | 9,700 | 355,027 | ||||
Hongkong Land Holdings Ltd. (Real estate, Real estate management & development) | 37,740 | 161,904 | ||||
Jardine Matheson Holdings Ltd. (Industrials, Industrial conglomerates) | 3,100 | 148,831 | ||||
New World Development Co. Ltd. (Real estate, Real estate management & development) | 71,000 | 169,556 | ||||
Shares | Value | |||||
Hong Kong (continued) | ||||||
Sino Land Co. Ltd. (Real estate, Real estate management & development) | 92,000 | $119,605 | ||||
Sun Hung Kai Properties Ltd. (Real estate, Real estate management & development) | 13,500 | 171,887 | ||||
Swire Pacific Ltd. Class A (Real estate, Real estate management & development) | 22,500 | 150,279 | ||||
Techtronic Industries Co. Ltd. (Industrials, Machinery) | 10,500 | 97,418 | ||||
WH Group Ltd. (Consumer staples, Food products)144A | 252,500 | 131,886 | ||||
2,954,486 | ||||||
Ireland: 0.45% | ||||||
CRH PLC (Materials, Construction materials) | 6,731 | 317,289 | ||||
DCC plc (Industrials, Industrial conglomerates) | 4,502 | 257,444 | ||||
574,733 | ||||||
Isle of Man (U.K.): 0.10% | ||||||
Entain PLC (Consumer discretionary, Hotels, restaurants & leisure) | 7,617 | 124,978 | ||||
Israel: 0.77% | ||||||
Azrieli Group Ltd. (Real estate, Real estate management & development) | 2,460 | 129,344 | ||||
Bank Hapoalim BM (Financials, Banks) | 20,055 | 161,341 | ||||
Bank Leumi Le-Israel BM (Financials, Banks) | 29,180 | 204,488 | ||||
Check Point Software Technologies Ltd. (Information technology, Software)† | 1,806 | 225,407 | ||||
Mizrahi Tefahot Bank Ltd. (Financials, Banks) | 3,640 | 116,763 | ||||
Nice Ltd. (Information technology, Software)† | 725 | 145,833 | ||||
983,176 | ||||||
Italy: 1.91% | ||||||
Assicurazioni Generali SpA (Financials, Insurance) | 17,683 | 334,838 | ||||
DiaSorin SpA (Health care, Health care equipment & supplies) | 1,152 | 118,458 | ||||
ENEL SpA (Utilities, Electric utilities) | 66,166 | 414,306 | ||||
ENI SpA (Energy, Oil, gas & consumable fuels)† | 8,456 | 112,531 | ||||
Intesa Sanpaolo SpA (Financials, Banks) | 78,353 | 180,526 | ||||
Moncler SpA (Consumer discretionary, Textiles, apparel & luxury goods) | 3,693 | 249,953 | ||||
Poste Italiane SpA (Financials, Insurance)144A | 19,814 | 205,353 | ||||
Prysmian SpA (Industrials, Electrical equipment) | 5,339 | 197,857 | ||||
Snam SpA (Utilities, Gas utilities) | 56,715 | 296,445 | ||||
UniCredit SpA (Financials, Banks) | 17,574 | 336,512 | ||||
2,446,779 | ||||||
Japan: 21.70% | ||||||
Advantest Corp. (Information technology, Semiconductors & semiconductor equipment) | 1,900 | 244,242 | ||||
Astellas Pharma, Inc. (Health care, Pharmaceuticals) | 18,000 | 285,196 | ||||
Bandai Namco Holdings, Inc. (Consumer discretionary, Leisure products) | 13,700 | 321,642 | ||||
Bridgestone Corp. (Consumer discretionary, Automobile components) | 6,500 | 264,899 | ||||
Brother Industries Ltd. (Information technology, Technology hardware, storage & peripherals) | 8,900 | 129,292 | ||||
Canon, Inc. (Information technology, Technology hardware, storage & peripherals) | 12,600 | 312,999 | ||||
Chugai Pharmaceutical Co. Ltd. (Health care, Pharmaceuticals) | 5,000 | 134,757 | ||||
Dai-ichi Life Holdings, Inc. (Financials, Insurance) | 13,800 | 237,173 | ||||
Daiichi Sankyo Co. Ltd. (Health care, Pharmaceuticals) | 13,400 | 436,648 | ||||
Shares | Value | |||||
Japan (continued) | ||||||
Daikin Industries Ltd. (Industrials, Building products) | 1,600 | $305,013 | ||||
Daiwa House Industry Co. Ltd. (Real estate, Real estate management & development) | 5,400 | 141,158 | ||||
FANUC Corp. (Industrials, Machinery) | 7,100 | 244,506 | ||||
Fast Retailing Co. Ltd. (Consumer discretionary, Specialty retail) | 1,200 | 281,471 | ||||
FUJIFILM Holdings Corp. (Information technology, Technology hardware, storage & peripherals) | 3,800 | 232,732 | ||||
Fujitsu Ltd. (Information technology, IT services) | 1,300 | 165,340 | ||||
Hitachi Ltd. (Industrials, Industrial conglomerates) | 8,200 | 473,549 | ||||
Honda Motor Co. Ltd. (Consumer discretionary, Automobiles) | 24,900 | 715,769 | ||||
Hoshizaki Corp. (Industrials, Machinery) | 3,500 | 126,108 | ||||
Hoya Corp. (Health care, Health care equipment & supplies) | 3,300 | 416,038 | ||||
INPEX Corp. (Energy, Oil, gas & consumable fuels) | 11,800 | 125,347 | ||||
Isuzu Motors Ltd. (Consumer discretionary, Automobiles) | 10,500 | 122,390 | ||||
ITOCHU Corp. (Industrials, Trading companies & distributors) | 14,100 | 477,776 | ||||
Itochu Techno-Solutions Corp. (Information technology, IT services) | 7,600 | 198,012 | ||||
Japan Post Holdings Co. Ltd. (Financials, Insurance) | 20,600 | 145,564 | ||||
Japan Post Insurance Co. Ltd. (Financials, Insurance) | 9,200 | 138,470 | ||||
Japan Tobacco, Inc. (Consumer staples, Tobacco) | 9,000 | 196,375 | ||||
Kao Corp. (Consumer staples, Personal care products) | 3,700 | 129,517 | ||||
KDDI Corp. (Communication services, Wireless telecommunication services) | 13,100 | 403,460 | ||||
Keyence Corp. (Information technology, Electronic equipment, instruments & components) | 1,700 | 827,274 | ||||
Kintetsu Group Holdings Co. Ltd. (Industrials, Ground transportation) | 5,300 | 175,557 | ||||
Kirin Holdings Co. Ltd. (Consumer staples, Beverages) | 12,100 | 180,599 | ||||
Komatsu Ltd. (Industrials, Machinery) | 5,400 | 127,592 | ||||
M3, Inc. (Health care, Health care technology) | 7,000 | 156,153 | ||||
Marubeni Corp. (Industrials, Trading companies & distributors) | 20,400 | 291,669 | ||||
MatsukiyoCocokara & Co. (Consumer staples, Consumer staples distribution & retail) | 2,400 | 128,678 | ||||
Mitsubishi Corp. (Industrials, Trading companies & distributors) | 19,500 | 781,820 | ||||
Mitsubishi Estate Co. Ltd. (Real estate, Real estate management & development) | 19,900 | 228,959 | ||||
Mitsubishi HC Capital, Inc. (Financials, Financial services) | 25,900 | 140,723 | ||||
Mitsubishi Heavy Industries Ltd. (Industrials, Machinery) | 4,900 | 207,711 | ||||
Mitsubishi UFJ Financial Group, Inc. (Financials, Banks) | 57,900 | 387,524 | ||||
Mitsui & Co. Ltd. (Industrials, Trading companies & distributors) | 19,900 | 629,030 | ||||
Mitsui Fudosan Co. Ltd. (Real estate, Real estate management & development) | 6,200 | 118,482 | ||||
MS&AD Insurance Group Holdings, Inc. (Financials, Insurance) | 5,200 | 179,075 | ||||
NEC Corp. (Information technology, IT services) | 7,400 | 347,892 | ||||
Nexon Co. Ltd. (Communication services, Entertainment) | 10,300 | 210,399 | ||||
Nidec Corp. (Industrials, Electrical equipment) | 2,400 | 119,548 | ||||
Nintendo Co. Ltd. (Communication services, Entertainment) | 13,700 | 583,694 | ||||
NIPPON EXPRESS HOLDINGS, Inc. (Industrials, Air freight & logistics) | 2,700 | 151,739 | ||||
Nippon Shinyaku Co. Ltd. (Health care, Pharmaceuticals) | 2,700 | 123,639 | ||||
Nippon Steel Corp. (Materials, Metals & mining) | 5,400 | 105,248 | ||||
Nippon Telegraph & Telephone Corp. (Communication services, Diversified telecommunication services) | 8,800 | 249,804 | ||||
Nissan Motor Co. Ltd. (Consumer discretionary, Automobiles) | 34,500 | 129,482 | ||||
Nisshin Seifun Group, Inc. (Consumer staples, Food products) | 5,200 | 65,278 | ||||
Nitto Denko Corp. (Materials, Chemicals) | 3,700 | 263,707 | ||||
Nomura Research Institute Ltd. (Information technology, IT services) | 6,500 | 163,754 | ||||
Shares | Value | |||||
Japan (continued) | ||||||
NTT Data Corp. (Information technology, IT services) | 7,700 | $110,367 | ||||
Obic Co. Ltd. (Information technology, IT services) | 1,500 | 243,208 | ||||
Olympus Corp. (Health care, Health care equipment & supplies) | 13,200 | 200,617 | ||||
Ono Pharmaceutical Co. Ltd. (Health care, Pharmaceuticals) | 13,300 | 249,008 | ||||
ORIX Corp. (Financials, Financial services) | 9,300 | 158,566 | ||||
Otsuka Corp. (Information technology, IT services) | 4,600 | 173,666 | ||||
Otsuka Holdings Co. Ltd. (Health care, Pharmaceuticals) | 15,300 | 568,074 | ||||
Pan Pacific International Holdings Corp. (Consumer discretionary, Broadline retail) | 6,500 | 110,989 | ||||
Panasonic Holdings Corp. (Consumer discretionary, Household durables) | 26,000 | 272,550 | ||||
Persol Holdings Co. Ltd. (Industrials, Professional services) | 8,600 | 162,710 | ||||
Recruit Holdings Co. Ltd. (Industrials, Professional services) | 14,900 | 458,791 | ||||
Renesas Electronics Corp. (Information technology, Semiconductors & semiconductor equipment)† | 10,400 | 170,938 | ||||
Rohm Co. Ltd. (Information technology, Semiconductors & semiconductor equipment) | 2,300 | 194,961 | ||||
Secom Co. Ltd. (Industrials, Commercial services & supplies) | 2,400 | 157,376 | ||||
Seiko Epson Corp. (Information technology, Technology hardware, storage & peripherals) | 8,700 | 132,319 | ||||
Sekisui Chemical Co. Ltd. (Consumer discretionary, Household durables) | 4,300 | 59,411 | ||||
Sekisui House Ltd. (Consumer discretionary, Household durables) | 26,500 | 518,017 | ||||
Seven & i Holdings Co. Ltd. (Consumer staples, Consumer staples distribution & retail) | 6,900 | 289,471 | ||||
Shimano, Inc. (Consumer discretionary, Leisure products) | 1,300 | 204,436 | ||||
Shin-Etsu Chemical Co. Ltd. (Materials, Chemicals) | 27,000 | 832,722 | ||||
Shionogi & Co. Ltd. (Health care, Pharmaceuticals) | 4,200 | 189,192 | ||||
SMC Corp. (Industrials, Machinery) | 300 | 161,665 | ||||
SoftBank Group Corp. (Communication services, Wireless telecommunication services) | 10,800 | 424,403 | ||||
Sompo Holdings, Inc. (Financials, Insurance) | 3,100 | 126,603 | ||||
Sony Group Corp. (Consumer discretionary, Household durables) | 10,800 | 1,020,118 | ||||
Square Enix Holdings Co. Ltd. (Communication services, Entertainment) | 2,600 | 116,634 | ||||
Subaru Corp. (Consumer discretionary, Automobiles) | 9,800 | 168,744 | ||||
SUMCO Corp. (Information technology, Semiconductors & semiconductor equipment) | 12,100 | 172,913 | ||||
Sumitomo Corp. (Industrials, Trading companies & distributors) | 23,400 | 442,807 | ||||
Sumitomo Metal Mining Co. Ltd. (Materials, Metals & mining) | 5,700 | 173,056 | ||||
Sumitomo Mitsui Financial Group, Inc. (Financials, Banks) | 3,400 | 138,562 | ||||
Suzuki Motor Corp. (Consumer discretionary, Automobiles) | 3,800 | 125,517 | ||||
Sysmex Corp. (Health care, Health care equipment & supplies) | 2,100 | 137,598 | ||||
Taisei Corp. (Industrials, Construction & engineering) | 4,200 | 133,695 | ||||
Takeda Pharmaceutical Co. Ltd. (Health care, Pharmaceuticals) | 14,600 | 463,281 | ||||
TDK Corp. (Information technology, Electronic equipment, instruments & components) | 7,000 | 268,294 | ||||
Terumo Corp. (Health care, Health care equipment & supplies) | 5,200 | 158,473 | ||||
TIS, Inc. (Information technology, IT services) | 6,600 | 185,222 | ||||
Tokio Marine Holdings, Inc. (Financials, Insurance) | 25,900 | 584,458 | ||||
Tokyo Electron Ltd. (Information technology, Semiconductors & semiconductor equipment) | 4,300 | 596,121 | ||||
Tokyo Gas Co. Ltd. (Utilities, Gas utilities) | 15,900 | 338,827 | ||||
Toyota Motor Corp. (Consumer discretionary, Automobiles) | 79,500 | 1,089,006 | ||||
Shares | Value | |||||
Japan (continued) | ||||||
Toyota Tsusho Corp. (Industrials, Trading companies & distributors) | 4,200 | $185,092 | ||||
Trend Micro, Inc. (Information technology, Software) | 2,800 | 133,443 | ||||
USS Co. Ltd. (Consumer discretionary, Specialty retail) | 10,800 | 175,885 | ||||
Yakult Honsha Co. Ltd. (Consumer staples, Food products) | 1,700 | 110,425 | ||||
Yokogawa Electric Corp. (Information technology, Electronic equipment, instruments & components) | 7,800 | 147,350 | ||||
Z Holdings Corp. (Communication services, Interactive media & services) | 58,300 | 145,243 | ||||
27,861,297 | ||||||
Luxembourg: 0.41% | ||||||
ArcelorMittal SA (Materials, Metals & mining) | 10,321 | 256,276 | ||||
Eurofins Scientific SE (Health care, Life sciences tools & services) | 2,246 | 147,982 | ||||
Tenaris SA (Energy, Energy equipment & services) | 10,084 | 125,789 | ||||
530,047 | ||||||
Netherlands: 5.31% | ||||||
Adyen NV (Financials, Financial services)144A† | 151 | 246,432 | ||||
Airbus SE (Industrials, Aerospace & defense) | 2,585 | 338,591 | ||||
Argenx SE (Health care, Biotechnology)† | 450 | 175,374 | ||||
ASML Holding NV (Information technology, Semiconductors & semiconductor equipment) | 3,551 | 2,548,789 | ||||
CNH Industrial NV (Industrials, Machinery) | 8,744 | 111,690 | ||||
Ferrari NV (Consumer discretionary, Automobiles) | 596 | 169,841 | ||||
Heineken Holding NV (Consumer staples, Beverages) | 1,596 | 135,710 | ||||
Heineken NV (Consumer staples, Beverages) | 1,396 | 140,982 | ||||
IMCD NV (Industrials, Trading companies & distributors) | 777 | 116,732 | ||||
Koninklijke Ahold Delhaize NV (Consumer staples, Consumer staples distribution & retail) | 15,205 | 482,053 | ||||
Koninklijke Philips NV (Health care, Health care equipment & supplies) | 10,610 | 200,124 | ||||
NN Group NV (Financials, Insurance) | 2,629 | 94,758 | ||||
OCI NV (Materials, Chemicals)† | 5,218 | 115,957 | ||||
Prosus NV (Consumer discretionary, Broadline retail)† | 6,900 | 454,104 | ||||
QIAGEN NV (Health care, Life sciences tools & services)† | 4,403 | 198,656 | ||||
Randstad NV (Industrials, Professional services) | 2,547 | 124,853 | ||||
Stellantis NV (Consumer discretionary, Automobiles) | 29,333 | 444,663 | ||||
STMicroelectronics NV (Information technology, Semiconductors & semiconductor equipment) | 7,817 | 339,195 | ||||
Universal Music Group NV (Communication services, Entertainment) | 6,108 | 120,784 | ||||
Wolters Kluwer NV (Industrials, Professional services) | 2,291 | 261,537 | ||||
6,820,825 | ||||||
New Zealand: 0.15% | ||||||
Spark New Zealand Ltd. (Communication services, Diversified telecommunication services) | 60,631 | 188,433 | ||||
Norway: 0.81% | ||||||
DNB Bank ASA (Financials, Banks) | 14,480 | 242,373 | ||||
Equinor ASA (Energy, Oil, gas & consumable fuels) | 9,546 | 244,021 | ||||
Mowi ASA (Consumer staples, Food products) | 8,859 | 152,037 | ||||
Shares | Value | |||||
Norway (continued) | ||||||
Norsk Hydro ASA (Materials, Metals & mining) | 16,840 | $101,766 | ||||
Orkla ASA (Consumer staples, Food products) | 21,832 | 157,069 | ||||
Salmar ASA (Consumer staples, Food products) | 3,382 | 148,988 | ||||
1,046,254 | ||||||
Portugal: 0.18% | ||||||
Jeronimo Martins SGPS SA (Consumer staples, Consumer staples distribution & retail) | 9,413 | 227,190 | ||||
Singapore: 1.73% | ||||||
DBS Group Holdings Ltd. (Financials, Banks) | 21,300 | 477,254 | ||||
Genting Singapore Ltd. (Consumer discretionary, Hotels, restaurants & leisure) | 634,900 | 474,191 | ||||
Grab Holdings Ltd. Class A (Industrials, Ground transportation)† | 50,370 | 150,103 | ||||
Jardine Cycle & Carriage Ltd. (Industrials, Industrial conglomerates) | 5,700 | 136,272 | ||||
Oversea-Chinese Banking Corp. Ltd. (Financials, Banks) | 38,700 | 351,142 | ||||
Sea Ltd. ADR (Communication services, Entertainment)† | 3,566 | 204,724 | ||||
Singapore Airlines Ltd. (Industrials, Passenger airlines)† | 30,000 | 142,202 | ||||
United Overseas Bank Ltd. (Financials, Banks) | 5,900 | 121,944 | ||||
Wilmar International Ltd. (Consumer staples, Food products) | 58,400 | 168,856 | ||||
2,226,688 | ||||||
Spain: 2.81% | ||||||
Amadeus IT Group SA (Consumer discretionary, Hotels, restaurants & leisure)† | 2,074 | 148,310 | ||||
Banco Bilbao Vizcaya Argentaria SA (Financials, Banks) | 76,447 | 500,091 | ||||
Banco Santander SA (Financials, Banks) | 135,679 | 441,608 | ||||
CaixaBank SA (Financials, Banks) | 58,802 | 215,399 | ||||
Enagas SA (Utilities, Gas utilities) | 9,914 | 189,211 | ||||
Endesa SA (Utilities, Electric utilities) | 8,595 | 185,857 | ||||
Iberdrola SA (Utilities, Electric utilities) | 52,103 | 634,899 | ||||
Industria de Diseno Textil SA (Consumer discretionary, Specialty retail) | 16,044 | 536,606 | ||||
Naturgy Energy Group SA (Utilities, Gas utilities) | 4,206 | 119,678 | ||||
Red Electrica Corp. SA (Utilities, Electric utilities) | 12,358 | 209,304 | ||||
Repsol SA (Energy, Oil, gas & consumable fuels) | 10,552 | 143,131 | ||||
Telefonica SA (Communication services, Diversified telecommunication services) | 65,291 | 277,065 | ||||
3,601,159 | ||||||
Sweden: 2.89% | ||||||
Assa Abloy AB Class B (Industrials, Building products) | 9,567 | 212,290 | ||||
Atlas Copco AB Class A (Industrials, Machinery) | 37,092 | 540,223 | ||||
Boliden AB (Materials, Metals & mining)† | 3,839 | 116,902 | ||||
Epiroc AB Class A (Industrials, Machinery) | 7,575 | 132,628 | ||||
EQT AB (Financials, Capital markets) | 4,951 | 93,574 | ||||
Evolution AB (Consumer discretionary, Hotels, restaurants & leisure)144A | 1,891 | 248,420 | ||||
Fastighets AB Balder Class B (Real estate, Real estate management & development)† | 24,290 | 81,565 | ||||
Getinge AB Class B (Health care, Health care equipment & supplies) | 6,440 | 148,066 | ||||
H & M Hennes & Mauritz AB Class B (Consumer discretionary, Specialty retail) | 9,220 | 115,074 | ||||
Hexagon AB Class B (Information technology, Electronic equipment, instruments & components) | 6,851 | 79,421 | ||||
Holmen AB Class B (Materials, Paper & forest products) | 4,535 | 171,507 | ||||
Industrivarden AB Class A (Financials, Financial services) | 5,174 | 139,222 | ||||
Shares | Value | |||||
Sweden (continued) | ||||||
Indutrade AB (Industrials, Machinery) | 8,579 | $201,751 | ||||
Investor AB Class B (Financials, Financial services) | 9,613 | 195,461 | ||||
Lifco AB Class B (Industrials, Industrial conglomerates) | 7,017 | 148,141 | ||||
Nibe Industrier AB Class B (Industrials, Building products) | 12,628 | 120,499 | ||||
Skandinaviska Enskilda Banken AB Class A (Financials, Banks) | 31,464 | 328,940 | ||||
Skanska AB Class B (Industrials, Construction & engineering) | 7,733 | 101,902 | ||||
Swedbank AB Class A (Financials, Banks) | 18,425 | 281,932 | ||||
Telefonaktiebolaget LM Ericsson Class B (Information technology, Communications equipment) | 15,625 | 80,805 | ||||
Volvo AB Class B (Industrials, Machinery) | 9,364 | 172,795 | ||||
3,711,118 | ||||||
Switzerland: 9.32% | ||||||
ABB Ltd. (Industrials, Electrical equipment) | 9,193 | 335,723 | ||||
Alcon, Inc. (Health care, Health care equipment & supplies) | 3,888 | 301,648 | ||||
Chocoladefabriken Lindt & Spruengli AG (Consumer staples, Food products) | 24 | 286,972 | ||||
CIE Financiere Richemont SA Class A (Consumer discretionary, Textiles, apparel & luxury goods) | 4,642 | 736,757 | ||||
Givaudan SA (Materials, Chemicals) | 59 | 194,086 | ||||
Holcim AG (Materials, Construction materials) | 6,349 | 391,362 | ||||
Julius Baer Group Ltd. (Financials, Capital markets) | 4,350 | 265,752 | ||||
Kuehne & Nagel International AG (Industrials, Marine transportation) | 1,090 | 310,095 | ||||
Logitech International SA (Information technology, Technology hardware, storage & peripherals)† | 2,484 | 159,172 | ||||
Lonza Group AG (Health care, Life sciences tools & services) | 204 | 127,541 | ||||
Nestle SA (Consumer staples, Food products) | 22,479 | 2,663,172 | ||||
Novartis AG (Health care, Pharmaceuticals) | 15,763 | 1,508,540 | ||||
Partners Group Holding AG (Financials, Capital markets) | 110 | 99,136 | ||||
Roche Holding AG (Health care, Pharmaceuticals) | 6,262 | 1,981,563 | ||||
Schindler Holding AG (Industrials, Machinery) | 570 | 118,037 | ||||
Sika AG (Materials, Chemicals) | 940 | 256,378 | ||||
Sonova Holding AG (Health care, Health care equipment & supplies) | 962 | 246,534 | ||||
Straumann Holding AG (Health care, Health care equipment & supplies) | 1,788 | 261,304 | ||||
Swatch Group AG (Consumer discretionary, Textiles, apparel & luxury goods) | 798 | 237,100 | ||||
Swiss Life Holding AG (Financials, Insurance) | 215 | 124,172 | ||||
Swisscom AG (Communication services, Diversified telecommunication services) | 406 | 257,130 | ||||
UBS Group AG (Financials, Capital markets) | 27,879 | 527,734 | ||||
VAT Group AG (Industrials, Machinery)144A | 444 | 182,963 | ||||
Zurich Insurance Group AG (Financials, Insurance) | 843 | 394,310 | ||||
11,967,181 | ||||||
United Kingdom: 13.77% | ||||||
3i Group PLC (Financials, Capital markets) | 11,323 | 275,437 | ||||
Anglo American PLC (Materials, Metals & mining) | 10,821 | 299,300 | ||||
Ashtead Group PLC (Industrials, Trading companies & distributors) | 4,867 | 296,661 | ||||
Associated British Foods PLC (Consumer staples, Food products) | 5,953 | 135,182 | ||||
AstraZeneca PLC (Health care, Pharmaceuticals) | 13,587 | 1,970,720 | ||||
Auto Trader Group plc (Communication services, Interactive media & services)144A | 22,897 | 179,441 | ||||
BAE Systems PLC (Industrials, Aerospace & defense) | 30,244 | 349,208 | ||||
Shares | Value | |||||
United Kingdom (continued) | ||||||
Barclays PLC (Financials, Banks) | 99,753 | $187,794 | ||||
BP PLC (Energy, Oil, gas & consumable fuels) | 171,976 | 969,742 | ||||
British American Tobacco PLC (Consumer staples, Tobacco) | 25,553 | 811,990 | ||||
Bunzl PLC (Industrials, Trading companies & distributors) | 7,205 | 281,786 | ||||
Burberry Group PLC (Consumer discretionary, Textiles, apparel & luxury goods) | 3,591 | 96,220 | ||||
Coca-Cola Europacific Partners PLC (Consumer staples, Beverages) | 3,351 | 209,069 | ||||
Compass Group PLC (Consumer discretionary, Hotels, restaurants & leisure) | 13,202 | 361,626 | ||||
Diageo PLC (Consumer staples, Beverages) | 16,328 | 679,816 | ||||
GSK PLC (Health care, Pharmaceuticals) | 25,156 | 421,326 | ||||
Haleon PLC (Consumer staples, Personal care products) | 35,370 | 140,003 | ||||
Hargreaves Lansdown PLC (Financials, Capital markets) | 18,698 | 186,587 | ||||
HSBC Holdings PLC (Financials, Banks)† | 167,805 | 1,232,615 | ||||
Imperial Brands PLC (Consumer staples, Tobacco) | 21,150 | 445,947 | ||||
Informa PLC (Communication services, Media) | 43,466 | 376,865 | ||||
JD Sports Fashion PLC (Consumer discretionary, Specialty retail) | 81,028 | 153,208 | ||||
Lloyds Banking Group PLC (Financials, Banks) | 482,008 | 264,841 | ||||
London Stock Exchange Group PLC (Financials, Capital markets) | 2,328 | 247,601 | ||||
Mondi PLC (Materials, Paper & forest products) | 7,715 | 119,484 | ||||
National Grid PLC (Utilities, Multi-utilities) | 30,776 | 423,419 | ||||
NatWest Group PLC (Financials, Banks) | 117,626 | 379,849 | ||||
Prudential PLC (Financials, Insurance) | 22,181 | 291,372 | ||||
Reckitt Benckiser Group PLC (Consumer staples, Household products) | 4,360 | 338,759 | ||||
RELX PLC (Industrials, Professional services) | 15,000 | 468,347 | ||||
Rio Tinto PLC (Materials, Metals & mining) | 8,735 | 519,607 | ||||
Rolls-Royce Holdings PLC (Industrials, Aerospace & defense)† | 76,623 | 136,587 | ||||
Schroders PLC (Financials, Capital markets) | 17,169 | 97,304 | ||||
Shell PLC (Energy, Oil, gas & consumable fuels) | 63,991 | 1,767,553 | ||||
SSE PLC (Utilities, Electric utilities) | 18,383 | 430,253 | ||||
Standard Chartered PLC (Financials, Banks) | 12,121 | 95,534 | ||||
Tesco PLC (Consumer staples, Consumer staples distribution & retail) | 57,237 | 185,689 | ||||
Unilever PLC (Consumer staples, Personal care products) | 15,991 | 801,449 | ||||
Unilever PLC (Consumer staples, Personal care products) | 7,138 | 357,037 | ||||
Vodafone Group PLC (Communication services, Wireless telecommunication services) | 311,010 | 295,461 | ||||
Whitbread PLC (Consumer discretionary, Hotels, restaurants & leisure) | 5,767 | 235,733 | ||||
WPP PLC (Communication services, Media) | 14,616 | 155,234 | ||||
17,671,656 | ||||||
United States: 0.14% | ||||||
Experian PLC (Industrials, Professional services) | 5,127 | 180,617 | ||||
Total common stocks (Cost $102,743,031) | 122,993,246 | |||||
Dividend rate | ||||||
Preferred stocks: 0.23% | ||||||
Germany: 0.23% | ||||||
Volkswagen AG (Consumer discretionary, Automobiles) | 8.76 % | 2,335 | 290,970 | |||
Total preferred stocks (Cost $364,535) | 290,970 | |||||
Yield | Shares | Value | ||||
Short-term investments: 2.65% | ||||||
Investment companies: 2.65% | ||||||
Allspring Government Money Market Fund Select Class♠∞ | 5.01 % | 3,401,432 | $3,401,432 | |||
Total short-term investments (Cost $3,401,432) | 3,401,432 | |||||
Total investments in securities (Cost $106,508,998) | 98.68 % | 126,685,648 | ||||
Other assets and liabilities, net | 1.32 | 1,693,396 | ||||
Total net assets | 100.00 % | $128,379,044 | ||||
† | Non-income-earning security |
144A | The security may be resold in transactions exempt from registration, normally to qualified institutional buyers, pursuant to Rule 144A under the Securities Act of 1933. |
♠ | The issuer of the security is an affiliated person of the Portfolio as defined in the Investment Company Act of 1940. |
∞ | The rate represents the 7-day annualized yield at period end. |
Abbreviations: | |
ADR | American depositary receipt |
REIT | Real estate investment trust |
Value, beginning of period | Purchases | Sales proceeds | Net realized gains (losses) | Net change in unrealized gains (losses) | Value, end of period | Shares, end of period | Income from affiliated securities | |
Short-term investments | ||||||||
Allspring Government Money Market Fund Select Class | $1,578,533 | $32,349,664 | $(30,526,765 ) | $0 | $0 | $3,401,432 | 3,401,432 | $77,278 |
Investments in affiliates no longer held at end of period | ||||||||
Securities Lending Cash Investments LLC | 4,760,248 | 6,643,494 | (11,403,652 ) | (90 ) | 0 | 0 | 0 | 21,404 1 |
$(90 ) | $0 | $3,401,432 | $98,682 |
1 | Amount shown represents income before fees and rebates. |
Description | Number of contracts | Expiration date | Notional cost | Notional value | Unrealized gains | Unrealized losses |
Long | ||||||
MSCI EAFE Index | 37 | 6-16-2023 | $3,948,323 | $3,798,790 | $0 | $(149,533 ) |
Assets | |
Investments in unaffiliated securities, at value (cost $103,107,566) | $123,284,216 |
Investments in affiliated securities, at value (cost $3,401,432) | 3,401,432 |
Cash at broker segregated for futures contracts | 182,609 |
Foreign currency, at value (cost $371,764) | 368,722 |
Receivable for dividends | 1,280,859 |
Prepaid expenses and other assets | 667 |
Total assets | 128,518,505 |
Liabilities | |
Payable for daily variation margin on open futures contracts | 40,688 |
Custody and accounting fees payable | 31,906 |
Advisory fee payable | 28,308 |
Contingent tax liability | 6,000 |
Trustees’ fees and expenses payable | 504 |
Accrued expenses and other liabilities | 32,055 |
Total liabilities | 139,461 |
Total net assets | $128,379,044 |
Investment income | |
Dividends (net of foreign withholdings taxes of $536,372) | $4,318,940 |
Income from affiliated securities | 86,123 |
Interest | 3,889 |
Total investment income | 4,408,952 |
Expenses | |
Advisory fee | 349,070 |
Custody and accounting fees | 125,356 |
Professional fees | 75,000 |
Interest holder report expenses | 14,862 |
Trustees’ fees and expenses | 27,071 |
Other fees and expenses | 101,015 |
Total expenses | 692,374 |
Net investment income | 3,716,578 |
Realized and unrealized gains (losses) on investments | |
Net realized gains (losses) on | |
Unaffiliated securities | (3,750,281 ) |
Affiliated securities | (90 ) |
Foreign currency and foreign currency translations | (43,144 ) |
Futures contracts | 31,972 |
Net realized losses on investments | (3,761,543 ) |
Net change in unrealized gains (losses) on | |
Unaffiliated securities | 3,651,070 |
Foreign currency and foreign currency translations | 4,779 |
Futures contracts | (159,092 ) |
Net change in unrealized gains (losses) on investments | 3,496,757 |
Net realized and unrealized gains (losses) on investments | (264,786 ) |
Net increase in net assets resulting from operations | $3,451,792 |
Year ended May 31, 2023 | Year ended May 31, 2022 | |||
Operations | ||||
Net investment income | $3,716,578 | $4,763,503 | ||
Net realized gains (losses) on investments | (3,761,543 ) | 6,847,953 | ||
Net change in unrealized gains (losses) on investments | 3,496,757 | (28,734,281 ) | ||
Net increase (decrease) in net assets resulting from operations | 3,451,792 | (17,122,825 ) | ||
Capital share transactions | ||||
Transactions in investors’ beneficial interests | ||||
Contributions | 7,947,810 | 922,417 | ||
Withdrawals | (42,935,013 ) | (28,522,295 ) | ||
Net decrease in net assets resulting from capital share transactions | (34,987,203 ) | (27,599,878 ) | ||
Total decrease in net assets | (31,535,411 ) | (44,722,703 ) | ||
Net assets | ||||
Beginning of period | 159,914,455 | 204,637,158 | ||
End of period | $128,379,044 | $159,914,455 | ||
Year ended May 31 | |||||
2023 | 2022 | 2021 | 2020 | 2019 | |
Total return | 3.07 % | (9.56 )% | 39.97 % | 1.76 % | (0.14 )% |
Ratios to average net assets (annualized) | |||||
Gross expenses | 0.50 % | 0.43 % | 0.43 % | 0.91 % | 0.89 % |
Net expenses1 | 0.50 % | 0.43 % | 0.43 % | 0.91 % | 0.89 % |
Net investment income | 2.66 % | 2.62 % | 2.23 % | 0.34 % | 1.24 % |
Supplemental data | |||||
Portfolio turnover rate | 27 % | 17 % | 127 % | 53 % | 100 % |
1 | Net expense ratios reflect voluntary waivers, if any. |
Gross unrealized gains | $24,885,176 |
Gross unrealized losses | (5,569,955 ) |
Net unrealized gains | $19,315,221 |
Quoted prices (Level 1) | Other significant observable inputs (Level 2) | Significant unobservable inputs (Level 3) | Total | |
Assets | ||||
Investments in: | ||||
Common stocks | ||||
Australia | $9,040,626 | $0 | $0 | $9,040,626 |
Austria | 142,332 | 0 | 0 | 142,332 |
Belgium | 608,362 | 0 | 0 | 608,362 |
China | 97,261 | 0 | 0 | 97,261 |
Denmark | 3,986,108 | 0 | 0 | 3,986,108 |
Finland | 1,183,128 | 0 | 0 | 1,183,128 |
France | 15,106,882 | 0 | 0 | 15,106,882 |
Germany | 9,711,930 | 0 | 0 | 9,711,930 |
Hong Kong | 2,954,486 | 0 | 0 | 2,954,486 |
Ireland | 574,733 | 0 | 0 | 574,733 |
Isle of Man (U.K.) | 124,978 | 0 | 0 | 124,978 |
Israel | 983,176 | 0 | 0 | 983,176 |
Italy | 2,446,779 | 0 | 0 | 2,446,779 |
Japan | 27,861,297 | 0 | 0 | 27,861,297 |
Luxembourg | 530,047 | 0 | 0 | 530,047 |
Netherlands | 6,820,825 | 0 | 0 | 6,820,825 |
New Zealand | 188,433 | 0 | 0 | 188,433 |
Norway | 1,046,254 | 0 | 0 | 1,046,254 |
Portugal | 227,190 | 0 | 0 | 227,190 |
Singapore | 2,226,688 | 0 | 0 | 2,226,688 |
Spain | 3,601,159 | 0 | 0 | 3,601,159 |
Sweden | 3,711,118 | 0 | 0 | 3,711,118 |
Switzerland | 11,967,181 | 0 | 0 | 11,967,181 |
United Kingdom | 17,671,656 | 0 | 0 | 17,671,656 |
United States | 180,617 | 0 | 0 | 180,617 |
Preferred stocks | ||||
Germany | 290,970 | 0 | 0 | 290,970 |
Short-term investments | ||||
Investment companies | 3,401,432 | 0 | 0 | 3,401,432 |
Total assets | $126,685,648 | $0 | $0 | $126,685,648 |
Liabilities | ||||
Futures contracts | $149,533 | $0 | $0 | $149,533 |
Total liabilities | $149,533 | $0 | $0 | $149,533 |
Average daily net assets | Advisory fee |
First $1 billion | 0.250 % |
Next $4 billion | 0.225 |
Over $5 billion | 0.200 |
Allspring Master Trust:

Name and year of birth | Position held and length of service* | Principal occupations during past five years or longer | Current other public company or investment company directorships |
William R. Ebsworth (Born 1957) | Trustee, since 2015 | Retired. From 1984 to 2013, equities analyst, portfolio manager, research director and chief investment officer at Fidelity Management and Research Company in Boston, Tokyo, and Hong Kong, and retired in 2013 as Chief Investment Officer of Fidelity Strategic Advisers, Inc. where he led a team of investment professionals managing client assets. Prior thereto, Board member of Hong Kong Securities Clearing Co., Hong Kong Options Clearing Corp., the Thailand International Fund, Ltd., Fidelity Investments Life Insurance Company, and Empire Fidelity Investments Life Insurance Company. Audit Committee Chair and Investment Committee Chair of the Vincent Memorial Hospital Foundation (non-profit organization). Mr. Ebsworth is a CFA charterholder. | N/A |
Jane A. Freeman (Born 1953) | Trustee, since 2015; Chair Liaison, since 2018 | Retired. From 2012 to 2014 and 1999 to 2008, Chief Financial Officer of Scientific Learning Corporation. From 2008 to 2012, Ms. Freeman provided consulting services related to strategic business projects. Prior to 1999, Portfolio Manager at Rockefeller & Co. and Scudder, Stevens & Clark. Board member of the Harding Loevner Funds from 1996 to 2014, serving as both Lead Independent Director and chair of the Audit Committee. Board member of the Russell Exchange Traded Funds Trust from 2011 to 2012 and the chair of the Audit Committee. Ms. Freeman is also an inactive Chartered Financial Analyst. | N/A |
Isaiah Harris, Jr. (Born 1952) | Trustee, since 2009; Audit Committee Chair, since 2019 | Retired. Member of the Advisory Board of CEF of East Central Florida. Chairman of the Board of CIGNA Corporation from 2009 to 2021, and Director from 2005 to 2008. From 2003 to 2011, Director of Deluxe Corporation. Prior thereto, President and CEO of BellSouth Advertising and Publishing Corp. from 2005 to 2007, President and CEO of BellSouth Enterprises from 2004 to 2005 and President of BellSouth Consumer Services from 2000 to 2003. Emeritus member of the Iowa State University Foundation Board of Governors. Emeritus Member of the Advisory board of Iowa State University School of Business. Advisory Board Member, Palm Harbor Academy (private school). Advisory Board Member, Fellowship of Christian Athletes. Mr. Harris is a certified public accountant (inactive status). | N/A |
David F. Larcker (Born 1950) | Trustee, since 2009 | Distinguished Visiting Fellow at the Hoover Institution since 2022. James Irvin Miller Professor of Accounting at the Graduate School of Business (Emeritus), Stanford University, Director of the Corporate Governance Research Initiative and Senior Faculty of The Rock Center for Corporate Governance since 2006. From 2005 to 2008, Professor of Accounting at the Graduate School of Business, Stanford University. Prior thereto, Ernst & Young Professor of Accounting at The Wharton School, University of Pennsylvania from 1985 to 2005. | N/A |
Olivia S. Mitchell (Born 1953) | Trustee, since 2006; Nominating and Governance Committee Chair, since 2018 | International Foundation of Employee Benefit Plans Professor since 1993, Wharton School of the University of Pennsylvania. Director of Wharton’s Pension Research Council and Boettner Center on Pensions & Retirement Research, and Research Associate at the National Bureau of Economic Research. Previously taught at Cornell University from 1978 to 1993. | N/A |
Timothy J. Penny (Born 1951) | Trustee, since 1996; Chair, since 2018 | President and Chief Executive Officer of Southern Minnesota Initiative Foundation, a non-profit organization, since 2007. Vice Chair of the Economic Club of Minnesota, since 2007. Co-Chair of the Committee for a Responsible Federal Budget, since 1995. Member of the Board of Trustees of NorthStar Education Finance, Inc., a non-profit organization, from 2007-2022. Senior Fellow of the University of Minnesota Humphrey Institute from 1995 to 2017. | N/A |
Name and year of birth | Position held and length of service* | Principal occupations during past five years or longer | Current other public company or investment company directorships |
James G. Polisson (Born 1959) | Trustee, since 2018 | Retired. Chief Marketing Officer, Source (ETF) UK Services, Ltd, from 2015 to 2017. From 2012 to 2015, Principal of The Polisson Group, LLC, a management consulting, corporate advisory and principal investing company. Chief Executive Officer and Managing Director at Russell Investments, Global Exchange Traded Funds from 2010 to 2012. Managing Director of Barclays Global Investors from 1998 to 2010 and Global Chief Marketing Officer for iShares and Barclays Global Investors from 2000 to 2010. Trustee of the San Francisco Mechanics’ Institute, a non- profit organization, from 2013 to 2015. Board member of the Russell Exchange Traded Fund Trust from 2011 to 2012. Director of Barclays Global Investors Holdings Deutschland GmbH from 2006 to 2009. Mr. Polisson is an attorney and has a retired status with the Massachusetts and District of Columbia Bar Associations. | N/A |
Pamela Wheelock (Born 1959) | Trustee, since January 2020; previously Trustee from January 2018 to July 2019 | Retired. Executive and Senior Financial leadership positions in the public, private and nonprofit sectors. Interim President and CEO, McKnight Foundation, 2020. Interim Commissioner, Minnesota Department of Human Services, 2019. Chief Operating Officer, Twin Cities Habitat for Humanity, 2017-2019. Vice President for University Services, University of Minnesota, 2012- 2016. Interim President and CEO, Blue Cross and Blue Shield of Minnesota, 2011-2012. Executive Vice-President and Chief Financial Officer, Minnesota Wild, 2002-2008. Commissioner, Minnesota Department of Finance, 1999-2002. Chair of the Board of Directors of Destination Medical Center Corporation. Board member of the Minnesota Wild Foundation. | N/A |
* | Length of service dates reflect the Trustee’s commencement of service with the Trust’s predecessor entities, where applicable. |
Name and year of birth | Position held and length of service | Principal occupations during past five years or longer |
Andrew Owen (Born 1960) | President, since 2017 | President and Chief Executive Officer of Allspring Funds Management, LLC since 2017 and Head of Global Fund Governance of Allspring Global Investments since 2022. Prior thereto, co-president of Galliard Capital Management, LLC, an affiliate of Allspring Funds Management, LLC, from 2019 to 2022 and Head of Affiliated Managers, Allspring Global Investments, from 2014 to 2019 and Executive Vice President responsible for marketing, investments and product development for Allspring Funds Management, LLC, from 2009 to 2014. |
Jeremy DePalma (Born 1974) | Treasurer, since 2012 (for certain funds in the Fund Complex); since 2021 (for the remaining funds in the Complex) | Senior Vice President of Allspring Funds Management, LLC since 2009. Senior Vice President of Evergreen Investment Management Company, LLC from 2008 to 2010 and head of the Fund Reporting and Control Team within Fund Administration from 2005 to 2010. |
Christopher Baker (Born 1976) | Chief Compliance Officer, since 2022 | Global Chief Compliance Officer for Allspring Global Investments since 2022. Prior thereto, Chief Compliance Officer for State Street Global Advisors from 2018 to 2021. Senior Compliance Officer for the State Street divisions of Alternative Investment Solutions, Sector Solutions, and Global Marketing from 2015 to 2018. From 2010 to 2015 Vice President, Global Head of Investment and Marketing Compliance for State Street Global Advisors. |
Matthew Prasse (Born 1983) | Chief Legal Officer, since 2022; Secretary, since 2021 | Senior Counsel of the Allspring Legal Department since 2021. Senior Counsel of the Wells Fargo Legal Department from 2018 to 2021. Previously, Counsel for Barings LLC from 2015 to 2018. Prior to joining Barings, Associate at Morgan, Lewis & Bockius LLP from 2008 to 2015. |

P.O. Box 219967
Kansas City, MO 64121-9967
Investment objective | The Portfolio seeks long-term capital appreciation. |
Manager | Allspring Funds Management, LLC |
Subadviser | Allspring Global Investments, LLC |
Portfolio managers | Justin P. Carr, CFA, Robert M. Wicentowski, CFA |
Ten largest holdings (%) as of May 31, 20231 | |
Apple, Inc. | 6.79 |
Microsoft Corp. | 6.43 |
Amazon.com, Inc. | 2.51 |
NVIDIA Corp. | 2.29 |
Alphabet, Inc. Class C | 2.08 |
Alphabet, Inc. Class A | 2.06 |
Meta Platforms, Inc. Class A | 1.88 |
Berkshire Hathaway, Inc. Class B | 1.61 |
Broadcom, Inc. | 1.41 |
Visa, Inc. Class A | 1.39 |
1 | Figures represent the percentage of the Portfolio’s net assets. Holdings are subject to change and may have changed since the date specified. |
Sector allocation as of May 31, 20231 |

1 | Figures represent the percentage of the Portfolio’s long-term investments. Allocations are subject to change and may have changed since the date specified. |
CFA® and Chartered Financial Analyst® are trademarks owned by CFA Institute. |
Shares | Value | |||||
Common stocks: 98.82% | ||||||
Communication services: 8.91% | ||||||
Diversified telecommunication services: 0.35% | ||||||
AT&T, Inc. | 25,448 | $400,297 | ||||
Verizon Communications, Inc. | 10,257 | 365,457 | ||||
765,754 | ||||||
Entertainment: 1.41% | ||||||
Activision Blizzard, Inc. | 8,284 | 664,377 | ||||
Live Nation Entertainment, Inc.† | 2,728 | 218,076 | ||||
Netflix, Inc.† | 4,767 | 1,884,062 | ||||
Walt Disney Co.† | 3,222 | 283,407 | ||||
3,049,922 | ||||||
Interactive media & services: 6.13% | ||||||
Alphabet, Inc. Class A† | 36,225 | 4,450,966 | ||||
Alphabet, Inc. Class C† | 36,456 | 4,497,576 | ||||
Meta Platforms, Inc. Class A† | 15,351 | 4,063,717 | ||||
TripAdvisor, Inc.† | 16,100 | 250,516 | ||||
13,262,775 | ||||||
Media: 1.02% | ||||||
Comcast Corp. Class A | 26,343 | 1,036,597 | ||||
Interpublic Group of Cos., Inc. | 8,904 | 331,140 | ||||
Omnicom Group, Inc. | 5,523 | 487,073 | ||||
Trade Desk, Inc. Class A† | 4,855 | 340,238 | ||||
2,195,048 | ||||||
Consumer discretionary: 10.10% | ||||||
Automobile components: 0.23% | ||||||
BorgWarner, Inc. | 11,131 | 493,437 | ||||
Automobiles: 1.85% | ||||||
Ford Motor Co. | 65,612 | 787,344 | ||||
General Motors Co. | 11,477 | 371,969 | ||||
Tesla, Inc.† | 13,991 | 2,853,185 | ||||
4,012,498 | ||||||
Broadline retail: 2.63% | ||||||
Amazon.com, Inc.† | 44,952 | 5,420,312 | ||||
eBay, Inc. | 6,279 | 267,109 | ||||
5,687,421 | ||||||
Hotels, restaurants & leisure: 1.81% | ||||||
Airbnb, Inc. Class A† | 7,283 | 799,455 | ||||
Booking Holdings, Inc.† | 158 | 396,386 | ||||
Boyd Gaming Corp. | 7,885 | 502,511 | ||||
Chipotle Mexican Grill, Inc.† | 127 | 263,714 | ||||
Darden Restaurants, Inc. | 1,676 | 265,679 | ||||
Expedia Group, Inc.† | 2,228 | 213,242 | ||||
Shares | Value | |||||
Hotels, restaurants & leisure (continued) | ||||||
McDonald’s Corp. | 4,737 | $1,350,566 | ||||
Penn Entertainment, Inc.† | 5,098 | 127,654 | ||||
3,919,207 | ||||||
Household durables: 1.23% | ||||||
Lennar Corp. Class A | 8,854 | 948,440 | ||||
NVR, Inc.† | 180 | 999,760 | ||||
PulteGroup, Inc. | 10,872 | 718,422 | ||||
2,666,622 | ||||||
Specialty retail: 1.69% | ||||||
AutoNation, Inc.† | 1,495 | 195,726 | ||||
Dick’s Sporting Goods, Inc. | 1,750 | 223,143 | ||||
Home Depot, Inc. | 6,374 | 1,806,710 | ||||
O’Reilly Automotive, Inc.† | 814 | 735,294 | ||||
Ulta Beauty, Inc.† | 1,681 | 688,924 | ||||
3,649,797 | ||||||
Textiles, apparel & luxury goods: 0.66% | ||||||
Deckers Outdoor Corp.† | 669 | 317,775 | ||||
Lululemon Athletica, Inc.† | 893 | 296,414 | ||||
NIKE, Inc. Class B | 7,724 | 813,028 | ||||
1,427,217 | ||||||
Consumer staples: 5.88% | ||||||
Beverages: 0.64% | ||||||
Coca-Cola Co. | 14,628 | 872,706 | ||||
PepsiCo, Inc. | 2,794 | 509,486 | ||||
1,382,192 | ||||||
Consumer staples distribution & retail: 2.43% | ||||||
BJ’s Wholesale Club Holdings, Inc.† | 2,809 | 175,984 | ||||
Costco Wholesale Corp. | 3,550 | 1,816,038 | ||||
Kroger Co. | 22,256 | 1,008,864 | ||||
Performance Food Group Co.† | 10,270 | 567,828 | ||||
Target Corp. | 2,606 | 341,204 | ||||
Walmart, Inc. | 9,221 | 1,354,288 | ||||
5,264,206 | ||||||
Food products: 1.18% | ||||||
Archer-Daniels-Midland Co. | 13,035 | 920,923 | ||||
Bunge Ltd. | 3,773 | 349,531 | ||||
Darling Ingredients, Inc.† | 5,402 | 342,379 | ||||
Hershey Co. | 1,967 | 510,830 | ||||
Lamb Weston Holdings, Inc. | 1,072 | 119,206 | ||||
Tyson Foods, Inc. Class A | 5,964 | 302,017 | ||||
2,544,886 | ||||||
Shares | Value | |||||
Household products: 0.69% | ||||||
Procter & Gamble Co. | 10,494 | $1,495,395 | ||||
Tobacco: 0.94% | ||||||
Altria Group, Inc. | 16,529 | 734,218 | ||||
Philip Morris International, Inc. | 14,379 | 1,294,254 | ||||
2,028,472 | ||||||
Energy: 3.99% | ||||||
Energy equipment & services: 0.14% | ||||||
Halliburton Co. | 10,349 | 296,499 | ||||
Oil, gas & consumable fuels: 3.85% | ||||||
Chevron Corp. | 14,402 | 2,169,229 | ||||
ConocoPhillips | 8,032 | 797,578 | ||||
EOG Resources, Inc. | 2,686 | 288,181 | ||||
EQT Corp. | 7,125 | 247,736 | ||||
Exxon Mobil Corp. | 27,920 | 2,852,866 | ||||
Marathon Petroleum Corp. | 8,817 | 924,991 | ||||
Phillips 66 | 2,690 | 246,431 | ||||
Valero Energy Corp. | 7,509 | 803,763 | ||||
8,330,775 | ||||||
Financials: 12.37% | ||||||
Banks: 2.81% | ||||||
Bank of America Corp. | 49,239 | 1,368,352 | ||||
Bank OZK | 12,177 | 421,080 | ||||
Citigroup, Inc. | 24,871 | 1,102,283 | ||||
JPMorgan Chase & Co. | 18,859 | 2,559,355 | ||||
Popular, Inc. | 3,508 | 200,587 | ||||
U.S. Bancorp | 14,212 | 424,939 | ||||
6,076,596 | ||||||
Capital markets: 1.78% | ||||||
Ameriprise Financial, Inc. | 1,008 | 300,858 | ||||
Bank of New York Mellon Corp. | 15,973 | 642,115 | ||||
Charles Schwab Corp. | 10,211 | 538,017 | ||||
CME Group, Inc. | 3,576 | 639,210 | ||||
Coinbase Global, Inc. Class A† | 1,724 | 107,233 | ||||
Interactive Brokers Group, Inc. Class A | 12,615 | 974,256 | ||||
Jefferies Financial Group, Inc. | 11,270 | 338,889 | ||||
LPL Financial Holdings, Inc. | 1,595 | 310,674 | ||||
3,851,252 | ||||||
Consumer finance: 0.51% | ||||||
American Express Co. | 1,882 | 298,410 | ||||
Capital One Financial Corp. | 3,766 | 392,455 | ||||
Synchrony Financial | 13,344 | 413,130 | ||||
1,103,995 | ||||||
Shares | Value | |||||
Financial services: 5.03% | ||||||
Berkshire Hathaway, Inc. Class B† | 10,827 | $3,476,333 | ||||
Euronet Worldwide, Inc.† | 3,153 | 351,244 | ||||
FleetCor Technologies, Inc.† | 1,503 | 340,505 | ||||
Mastercard, Inc. Class A | 5,092 | 1,858,682 | ||||
MGIC Investment Corp. | 36,781 | 556,129 | ||||
PayPal Holdings, Inc.† | 13,446 | 833,518 | ||||
Visa, Inc. Class A | 13,583 | 3,002,250 | ||||
WEX, Inc.† | 2,791 | 462,887 | ||||
10,881,548 | ||||||
Insurance: 2.24% | ||||||
Arch Capital Group Ltd.† | 9,633 | 671,420 | ||||
Axis Capital Holdings Ltd. | 4,336 | 225,039 | ||||
Everest Re Group Ltd. | 1,808 | 614,756 | ||||
F&G Annuities & Life, Inc. | 6,530 | 135,040 | ||||
Hartford Financial Services Group, Inc. | 10,806 | 740,427 | ||||
MetLife, Inc. | 17,169 | 850,724 | ||||
Reinsurance Group of America, Inc. | 2,156 | 301,840 | ||||
Travelers Cos., Inc. | 2,278 | 385,529 | ||||
Unum Group† | 11,280 | 490,116 | ||||
W R Berkley Corp. | 7,545 | 420,106 | ||||
4,834,997 | ||||||
Health care: 13.90% | ||||||
Biotechnology: 2.66% | ||||||
AbbVie, Inc. | 8,313 | 1,146,861 | ||||
Biogen, Inc.† | 1,761 | 521,978 | ||||
Exelixis, Inc.† | 36,510 | 703,913 | ||||
Gilead Sciences, Inc. | 7,660 | 589,360 | ||||
Moderna, Inc.† | 3,749 | 478,785 | ||||
United Therapeutics Corp.† | 4,026 | 844,413 | ||||
Vertex Pharmaceuticals, Inc.† | 4,552 | 1,472,891 | ||||
5,758,201 | ||||||
Health care equipment & supplies: 2.56% | ||||||
Abbott Laboratories | 18,963 | 1,934,226 | ||||
Align Technology, Inc.† | 528 | 149,244 | ||||
Edwards Lifesciences Corp.† | 12,858 | 1,083,029 | ||||
Hologic, Inc.† | 12,721 | 1,003,560 | ||||
Intuitive Surgical, Inc.† | 2,262 | 696,334 | ||||
Zimmer Biomet Holdings, Inc. | 5,308 | 675,921 | ||||
5,542,314 | ||||||
Health care providers & services: 3.74% | ||||||
AmerisourceBergen Corp. | 6,246 | 1,062,757 | ||||
Centene Corp.† | 14,740 | 919,924 | ||||
CVS Health Corp. | 18,579 | 1,263,929 | ||||
Elevance Health, Inc. | 1,253 | 561,119 | ||||
McKesson Corp. | 3,502 | 1,368,722 | ||||
Shares | Value | |||||
Health care providers & services (continued) | ||||||
Molina Healthcare, Inc.† | 3,086 | $845,255 | ||||
UnitedHealth Group, Inc. | 4,247 | 2,069,308 | ||||
8,091,014 | ||||||
Health care technology: 0.19% | ||||||
Doximity, Inc. Class A† | 3,357 | 102,959 | ||||
Veeva Systems, Inc. Class A† | 1,772 | 293,621 | ||||
396,580 | ||||||
Life sciences tools & services: 0.85% | ||||||
Danaher Corp. | 3,370 | 773,820 | ||||
Thermo Fisher Scientific, Inc. | 2,092 | 1,063,698 | ||||
1,837,518 | ||||||
Pharmaceuticals: 3.90% | ||||||
Bristol-Myers Squibb Co. | 20,109 | 1,295,824 | ||||
Eli Lilly & Co. | 2,387 | 1,025,121 | ||||
Johnson & Johnson | 16,742 | 2,596,014 | ||||
Merck & Co., Inc. | 15,791 | 1,743,484 | ||||
Organon & Co. | 10,779 | 209,005 | ||||
Pfizer, Inc. | 41,242 | 1,568,021 | ||||
8,437,469 | ||||||
Industrials: 9.06% | ||||||
Aerospace & defense: 1.38% | ||||||
General Dynamics Corp. | 2,547 | 520,046 | ||||
Lockheed Martin Corp. | 2,493 | 1,106,917 | ||||
Northrop Grumman Corp. | 1,222 | 532,169 | ||||
Textron, Inc. | 13,449 | 832,090 | ||||
2,991,222 | ||||||
Air freight & logistics: 0.90% | ||||||
Expeditors International of Washington, Inc. | 7,434 | 820,045 | ||||
United Parcel Service, Inc. Class B | 6,781 | 1,132,427 | ||||
1,952,472 | ||||||
Building products: 1.28% | ||||||
Builders FirstSource, Inc.† | 8,047 | 933,050 | ||||
Carrier Global Corp. | 16,331 | 667,938 | ||||
Masco Corp. | 5,083 | 245,610 | ||||
Owens Corning | 8,743 | 929,643 | ||||
2,776,241 | ||||||
Commercial services & supplies: 0.74% | ||||||
Copart, Inc.† | 8,747 | 766,150 | ||||
Waste Management, Inc. | 5,107 | 826,925 | ||||
1,593,075 | ||||||
Shares | Value | |||||
Electrical equipment: 0.41% | ||||||
Acuity Brands, Inc. | 2,234 | $336,641 | ||||
AMETEK, Inc. | 2,326 | 337,433 | ||||
Rockwell Automation, Inc. | 743 | 207,000 | ||||
881,074 | ||||||
Ground transportation: 0.65% | ||||||
CSX Corp. | 19,932 | 611,314 | ||||
Ryder System, Inc. | 2,705 | 213,235 | ||||
Schneider National, Inc. Class B | 8,662 | 224,519 | ||||
Union Pacific Corp. | 1,874 | 360,783 | ||||
1,409,851 | ||||||
Industrial conglomerates: 0.19% | ||||||
3M Co. | 1,882 | 175,609 | ||||
Honeywell International, Inc. | 1,236 | 236,818 | ||||
412,427 | ||||||
Machinery: 2.20% | ||||||
AGCO Corp. | 4,049 | 446,524 | ||||
Allison Transmission Holdings, Inc. | 17,589 | 831,960 | ||||
Caterpillar, Inc. | 1,958 | 402,859 | ||||
Cummins, Inc. | 877 | 179,268 | ||||
Fortive Corp. | 10,768 | 701,104 | ||||
Otis Worldwide Corp. | 4,746 | 377,354 | ||||
PACCAR, Inc. | 9,088 | 625,073 | ||||
Parker-Hannifin Corp. | 1,810 | 579,996 | ||||
Snap-on, Inc. | 1,631 | 405,891 | ||||
Timken Co. | 2,986 | 213,648 | ||||
4,763,677 | ||||||
Passenger airlines: 0.37% | ||||||
Copa Holdings SA Class A | 2,274 | 238,907 | ||||
United Airlines Holdings, Inc.† | 11,745 | 557,476 | ||||
796,383 | ||||||
Professional services: 0.19% | ||||||
Paycom Software, Inc. | 1,456 | 407,869 | ||||
Trading companies & distributors: 0.75% | ||||||
MSC Industrial Direct Co., Inc. Class A | 4,641 | 417,319 | ||||
United Rentals, Inc. | 1,468 | 490,003 | ||||
Univar Solutions, Inc.† | 5,432 | 193,488 | ||||
WW Grainger, Inc. | 799 | 518,567 | ||||
1,619,377 | ||||||
Information technology: 27.33% | ||||||
Communications equipment: 1.28% | ||||||
Arista Networks, Inc.† | 2,901 | 482,552 | ||||
Shares | Value | |||||
Communications equipment (continued) | ||||||
Cisco Systems, Inc. | 41,896 | $2,080,974 | ||||
F5, Inc.† | 1,392 | 205,432 | ||||
2,768,958 | ||||||
Electronic equipment, instruments & components: 0.52% | ||||||
Jabil, Inc. | 8,763 | 784,464 | ||||
Keysight Technologies, Inc.† | 2,170 | 351,106 | ||||
1,135,570 | ||||||
IT services: 1.29% | ||||||
Accenture PLC Class A | 5,015 | 1,534,189 | ||||
Amdocs Ltd. | 3,618 | 340,707 | ||||
Cognizant Technology Solutions Corp. Class A | 3,929 | 245,523 | ||||
EPAM Systems, Inc.† | 1,056 | 270,991 | ||||
Snowflake, Inc. Class A† | 2,400 | 396,864 | ||||
2,788,274 | ||||||
Semiconductors & semiconductor equipment: 6.45% | ||||||
Advanced Micro Devices, Inc.† | 5,102 | 603,107 | ||||
Analog Devices, Inc. | 4,525 | 804,047 | ||||
Applied Materials, Inc. | 5,509 | 734,350 | ||||
Broadcom, Inc. | 3,776 | 3,050,857 | ||||
Cirrus Logic, Inc.† | 2,740 | 212,843 | ||||
Enphase Energy, Inc.† | 1,059 | 184,139 | ||||
KLA Corp. | 2,675 | 1,184,998 | ||||
Lam Research Corp. | 821 | 506,311 | ||||
Microchip Technology, Inc. | 14,629 | 1,100,978 | ||||
NVIDIA Corp. | 13,094 | 4,953,984 | ||||
QUALCOMM, Inc. | 5,460 | 619,219 | ||||
13,954,833 | ||||||
Software: 11.00% | ||||||
Adobe, Inc.† | 4,170 | 1,742,184 | ||||
Atlassian Corp. Class A† | 1,361 | 246,055 | ||||
Cadence Design Systems, Inc.† | 2,826 | 652,552 | ||||
Crowdstrike Holdings, Inc. Class A† | 1,644 | 263,254 | ||||
Datadog, Inc. Class A† | 3,350 | 317,949 | ||||
Dropbox, Inc. Class A† | 41,038 | 944,695 | ||||
Fortinet, Inc.† | 15,304 | 1,045,722 | ||||
Intuit, Inc. | 858 | 359,605 | ||||
Manhattan Associates, Inc.† | 1,289 | 233,850 | ||||
Microsoft Corp. | 42,352 | 13,907,973 | ||||
Oracle Corp. | 3,276 | 347,060 | ||||
Salesforce, Inc.† | 6,202 | 1,385,403 | ||||
ServiceNow, Inc.† | 684 | 372,630 | ||||
Synopsys, Inc.† | 2,141 | 974,069 | ||||
VMware, Inc. Class A† | 4,532 | 617,666 | ||||
Zoom Video Communications, Inc. Class A† | 5,534 | 371,497 | ||||
23,782,164 | ||||||
Shares | Value | |||||
Technology hardware, storage & peripherals: 6.79% | ||||||
Apple, Inc. | 82,819 | $14,679,668 | ||||
Materials: 1.91% | ||||||
Chemicals: 1.05% | ||||||
Albemarle Corp. | 1,693 | 327,646 | ||||
CF Industries Holdings, Inc. | 11,883 | 730,924 | ||||
Dow, Inc. | 4,967 | 242,290 | ||||
LyondellBasell Industries NV Class A | 6,182 | 528,808 | ||||
Mosaic Co. | 5,383 | 172,041 | ||||
Westlake Corp. | 2,567 | 266,840 | ||||
2,268,549 | ||||||
Containers & packaging: 0.09% | ||||||
Graphic Packaging Holding Co. | 8,191 | 195,765 | ||||
Metals & mining: 0.77% | ||||||
Newmont Corp. | 6,786 | 275,172 | ||||
Nucor Corp. | 3,068 | 405,160 | ||||
Reliance Steel & Aluminum Co. | 2,883 | 676,582 | ||||
Steel Dynamics, Inc. | 3,414 | 313,747 | ||||
1,670,661 | ||||||
Real estate: 2.77% | ||||||
Hotel & resort REITs: 0.09% | ||||||
Host Hotels & Resorts, Inc. | 11,525 | 191,315 | ||||
Industrial REITs : 0.41% | ||||||
Prologis, Inc. | 7,076 | 881,316 | ||||
Office REITs : 0.13% | ||||||
Alexandria Real Estate Equities, Inc. | 2,488 | 282,288 | ||||
Residential REITs : 0.42% | ||||||
AvalonBay Communities, Inc. | 2,328 | 405,025 | ||||
Equity Residential | 8,226 | 500,141 | ||||
905,166 | ||||||
Retail REITs : 0.59% | ||||||
Brixmor Property Group, Inc. | 10,068 | 201,662 | ||||
NNN REIT, Inc. | 6,814 | 289,868 | ||||
Simon Property Group, Inc. | 7,455 | 783,893 | ||||
1,275,423 | ||||||
Specialized REITs : 1.13% | ||||||
CubeSmart | 9,491 | 421,780 | ||||
Extra Space Storage, Inc. | 6,072 | 876,007 | ||||
Gaming & Leisure Properties, Inc. | 7,714 | 371,352 | ||||
Public Storage | 2,120 | 600,596 | ||||
SBA Communications Corp. | 847 | 187,848 | ||||
2,457,583 | ||||||
Shares | Value | |||||
Utilities: 2.60% | ||||||
Electric utilities: 1.45% | ||||||
American Electric Power Co., Inc. | 11,083 | $921,219 | ||||
Avangrid, Inc. | 9,768 | 366,593 | ||||
Evergy, Inc. | 5,255 | 304,002 | ||||
Hawaiian Electric Industries, Inc. | 5,483 | 196,895 | ||||
NextEra Energy, Inc. | 5,390 | 395,949 | ||||
PPL Corp. | 14,645 | 383,699 | ||||
Southern Co. | 8,232 | 574,182 | ||||
3,142,539 | ||||||
Gas utilities: 0.65% | ||||||
National Fuel Gas Co. | 15,867 | 807,789 | ||||
UGI Corp. | 21,148 | 591,509 | ||||
1,399,298 | ||||||
Independent power and renewable electricity producers: 0.23% | ||||||
Brookfield Renewable Corp. Class A | 8,624 | 289,594 | ||||
Vistra Corp. | 8,839 | 211,871 | ||||
501,465 | ||||||
Multi-utilities: 0.27% | ||||||
Consolidated Edison, Inc. | 1,851 | 172,698 | ||||
DTE Energy Co. | 3,695 | 397,582 | ||||
570,280 | ||||||
Total common stocks (Cost $149,067,541) | 213,738,390 | |||||
Yield | ||||||
Short-term investments: 0.89% | ||||||
Investment companies: 0.89% | ||||||
Allspring Government Money Market Fund Select Class♠∞ | 5.01 % | 1,921,909 | 1,921,909 | |||
Total short-term investments (Cost $1,921,909) | 1,921,909 | |||||
Total investments in securities (Cost $150,989,450) | 99.71 % | 215,660,299 | ||||
Other assets and liabilities, net | 0.29 | 637,202 | ||||
Total net assets | 100.00 % | $216,297,501 | ||||
† | Non-income-earning security |
♠ | The issuer of the security is an affiliated person of the Portfolio as defined in the Investment Company Act of 1940. |
∞ | The rate represents the 7-day annualized yield at period end. |
Abbreviations: | |
REIT | Real estate investment trust |
Value, beginning of period | Purchases | Sales proceeds | Net realized gains (losses) | Net change in unrealized gains (losses) | Value, end of period | Shares, end of period | Income from affiliated securities | |
Short-term investments | ||||||||
Allspring Government Money Market Fund Select Class | $6,635,991 | $52,612,842 | $(57,326,924 ) | $0 | $0 | $1,921,909 | 1,921,909 | $129,211 |
Investments in affiliates no longer held at end of period | ||||||||
Securities Lending Cash Investments LLC | 380,600 | 766,450 | (1,147,050 ) | 0 | 0 | 0 | 0 | 2,216 1 |
$0 | $0 | $1,921,909 | $131,427 |
1 | Amount shown represents income before fees and rebates. |
Description | Number of contracts | Expiration date | Notional cost | Notional value | Unrealized gains | Unrealized losses |
Long | ||||||
E-Mini S&P 500 Index | 9 | 6-16-2023 | $1,861,537 | $1,885,725 | $24,188 | $0 |
Assets | |
Investments in unaffiliated securities, at value (cost $149,067,541) | $213,738,390 |
Investments in affiliated securities, at value (cost $1,921,909) | 1,921,909 |
Cash | 88 |
Cash at broker segregated for futures contracts | 349,800 |
Receivable for dividends | 374,289 |
Prepaid expenses and other assets | 904 |
Total assets | 216,385,380 |
Liabilities | |
Advisory fee payable | 45,923 |
Custody and accounting fees payable | 13,739 |
Payable for daily variation margin on open futures contracts | 11,025 |
Interest holder report expenses payable | 10,999 |
Trustees’ fees and expenses payable | 504 |
Accrued expenses and other liabilities | 5,689 |
Total liabilities | 87,879 |
Total net assets | $216,297,501 |
Investment income | |
Dividends (net of foreign withholdings taxes of $17,526) | $3,942,306 |
Income from affiliated securities | 129,607 |
Interest | 11,085 |
Total investment income | 4,082,998 |
Expenses | |
Advisory fee | 570,131 |
Custody and accounting fees | 38,249 |
Professional fees | 65,081 |
Interest holder report expenses | 19,468 |
Trustees’ fees and expenses | 27,055 |
Other fees and expenses | 8,767 |
Total expenses | 728,751 |
Net investment income | 3,354,247 |
Realized and unrealized gains (losses) on investments | |
Net realized gains (losses) on | |
Unaffiliated securities | 12,658,863 |
Futures contracts | (319,248 ) |
Net realized gains on investments | 12,339,615 |
Net change in unrealized gains (losses) on | |
Unaffiliated securities | (14,419,515 ) |
Futures contracts | 126,583 |
Net change in unrealized gains (losses) on investments | (14,292,932 ) |
Net realized and unrealized gains (losses) on investments | (1,953,317 ) |
Net increase in net assets resulting from operations | $1,400,930 |
Year ended May 31, 2023 | Year ended May 31, 2022 | |||
Operations | ||||
Net investment income | $3,354,247 | $3,803,635 | ||
Net realized gains on investments | 12,339,615 | 44,875,190 | ||
Net change in unrealized gains (losses) on investments | (14,292,932 ) | (38,600,592 ) | ||
Net increase in net assets resulting from operations | 1,400,930 | 10,078,233 | ||
Capital share transactions | ||||
Transactions in investors’ beneficial interests | ||||
Contributions | 19,605,714 | 116,619,198 | ||
Withdrawals | (73,106,530 ) | (187,709,657 ) | ||
Net decrease in net assets resulting from capital share transactions | (53,500,816 ) | (71,090,459 ) | ||
Total decrease in net assets | (52,099,886 ) | (61,012,226 ) | ||
Net assets | ||||
Beginning of period | 268,397,387 | 329,409,613 | ||
End of period | $216,297,501 | $268,397,387 | ||
Year ended May 31 | |||||
2023 | 2022 | 2021 | 2020 | 20191 | |
Total return2 | 1.90 % | 0.87 % | 41.79 % | 11.56 % | (2.40 )% |
Ratios to average net assets (annualized) | |||||
Expenses | 0.32 % | 0.30 % | 0.29 % | 0.29 % | 0.28 % |
Net investment income | 1.47 % | 1.12 % | 1.36 % | 1.82 % | 1.84 % |
Supplemental data | |||||
Portfolio turnover rate | 38 % | 48 % | 53 % | 81 % | 92 % |
1 | For the period from June 12, 2018 (commencement of operations) to May 31, 2019 |
2 | Returns for periods of less than one year are not annualized. |
Gross unrealized gains | $70,372,845 |
Gross unrealized losses | (9,337,949 ) |
Net unrealized gains | $61,034,896 |
Quoted prices (Level 1) | Other significant observable inputs (Level 2) | Significant unobservable inputs (Level 3) | Total | |
Assets | ||||
Investments in: | ||||
Common stocks | ||||
Communication services | $19,273,499 | $0 | $0 | $19,273,499 |
Consumer discretionary | 21,856,199 | 0 | 0 | 21,856,199 |
Consumer staples | 12,715,151 | 0 | 0 | 12,715,151 |
Energy | 8,627,274 | 0 | 0 | 8,627,274 |
Financials | 26,748,388 | 0 | 0 | 26,748,388 |
Health care | 30,063,096 | 0 | 0 | 30,063,096 |
Industrials | 19,603,668 | 0 | 0 | 19,603,668 |
Information technology | 59,109,467 | 0 | 0 | 59,109,467 |
Materials | 4,134,975 | 0 | 0 | 4,134,975 |
Real estate | 5,993,091 | 0 | 0 | 5,993,091 |
Utilities | 5,613,582 | 0 | 0 | 5,613,582 |
Short-term investments | ||||
Investment companies | 1,921,909 | 0 | 0 | 1,921,909 |
215,660,299 | 0 | 0 | 215,660,299 | |
Futures contracts | 24,188 | 0 | 0 | 24,188 |
Total assets | $215,684,487 | $0 | $0 | $215,684,487 |
Average daily net assets | Advisory fee |
First $1 billion | 0.250 % |
Next $4 billion | 0.225 |
Over $5 billion | 0.200 |
Allspring Master Trust:

Name and year of birth | Position held and length of service* | Principal occupations during past five years or longer | Current other public company or investment company directorships |
William R. Ebsworth (Born 1957) | Trustee, since 2015 | Retired. From 1984 to 2013, equities analyst, portfolio manager, research director and chief investment officer at Fidelity Management and Research Company in Boston, Tokyo, and Hong Kong, and retired in 2013 as Chief Investment Officer of Fidelity Strategic Advisers, Inc. where he led a team of investment professionals managing client assets. Prior thereto, Board member of Hong Kong Securities Clearing Co., Hong Kong Options Clearing Corp., the Thailand International Fund, Ltd., Fidelity Investments Life Insurance Company, and Empire Fidelity Investments Life Insurance Company. Audit Committee Chair and Investment Committee Chair of the Vincent Memorial Hospital Foundation (non-profit organization). Mr. Ebsworth is a CFA charterholder. | N/A |
Jane A. Freeman (Born 1953) | Trustee, since 2015; Chair Liaison, since 2018 | Retired. From 2012 to 2014 and 1999 to 2008, Chief Financial Officer of Scientific Learning Corporation. From 2008 to 2012, Ms. Freeman provided consulting services related to strategic business projects. Prior to 1999, Portfolio Manager at Rockefeller & Co. and Scudder, Stevens & Clark. Board member of the Harding Loevner Funds from 1996 to 2014, serving as both Lead Independent Director and chair of the Audit Committee. Board member of the Russell Exchange Traded Funds Trust from 2011 to 2012 and the chair of the Audit Committee. Ms. Freeman is also an inactive Chartered Financial Analyst. | N/A |
Isaiah Harris, Jr. (Born 1952) | Trustee, since 2009; Audit Committee Chair, since 2019 | Retired. Member of the Advisory Board of CEF of East Central Florida. Chairman of the Board of CIGNA Corporation from 2009 to 2021, and Director from 2005 to 2008. From 2003 to 2011, Director of Deluxe Corporation. Prior thereto, President and CEO of BellSouth Advertising and Publishing Corp. from 2005 to 2007, President and CEO of BellSouth Enterprises from 2004 to 2005 and President of BellSouth Consumer Services from 2000 to 2003. Emeritus member of the Iowa State University Foundation Board of Governors. Emeritus Member of the Advisory board of Iowa State University School of Business. Advisory Board Member, Palm Harbor Academy (private school). Advisory Board Member, Fellowship of Christian Athletes. Mr. Harris is a certified public accountant (inactive status). | N/A |
David F. Larcker (Born 1950) | Trustee, since 2009 | Distinguished Visiting Fellow at the Hoover Institution since 2022. James Irvin Miller Professor of Accounting at the Graduate School of Business (Emeritus), Stanford University, Director of the Corporate Governance Research Initiative and Senior Faculty of The Rock Center for Corporate Governance since 2006. From 2005 to 2008, Professor of Accounting at the Graduate School of Business, Stanford University. Prior thereto, Ernst & Young Professor of Accounting at The Wharton School, University of Pennsylvania from 1985 to 2005. | N/A |
Olivia S. Mitchell (Born 1953) | Trustee, since 2006; Nominating and Governance Committee Chair, since 2018 | International Foundation of Employee Benefit Plans Professor since 1993, Wharton School of the University of Pennsylvania. Director of Wharton’s Pension Research Council and Boettner Center on Pensions & Retirement Research, and Research Associate at the National Bureau of Economic Research. Previously taught at Cornell University from 1978 to 1993. | N/A |
Timothy J. Penny (Born 1951) | Trustee, since 1996; Chair, since 2018 | President and Chief Executive Officer of Southern Minnesota Initiative Foundation, a non-profit organization, since 2007. Vice Chair of the Economic Club of Minnesota, since 2007. Co-Chair of the Committee for a Responsible Federal Budget, since 1995. Member of the Board of Trustees of NorthStar Education Finance, Inc., a non-profit organization, from 2007-2022. Senior Fellow of the University of Minnesota Humphrey Institute from 1995 to 2017. | N/A |
Name and year of birth | Position held and length of service* | Principal occupations during past five years or longer | Current other public company or investment company directorships |
James G. Polisson (Born 1959) | Trustee, since 2018 | Retired. Chief Marketing Officer, Source (ETF) UK Services, Ltd, from 2015 to 2017. From 2012 to 2015, Principal of The Polisson Group, LLC, a management consulting, corporate advisory and principal investing company. Chief Executive Officer and Managing Director at Russell Investments, Global Exchange Traded Funds from 2010 to 2012. Managing Director of Barclays Global Investors from 1998 to 2010 and Global Chief Marketing Officer for iShares and Barclays Global Investors from 2000 to 2010. Trustee of the San Francisco Mechanics’ Institute, a non- profit organization, from 2013 to 2015. Board member of the Russell Exchange Traded Fund Trust from 2011 to 2012. Director of Barclays Global Investors Holdings Deutschland GmbH from 2006 to 2009. Mr. Polisson is an attorney and has a retired status with the Massachusetts and District of Columbia Bar Associations. | N/A |
Pamela Wheelock (Born 1959) | Trustee, since January 2020; previously Trustee from January 2018 to July 2019 | Retired. Executive and Senior Financial leadership positions in the public, private and nonprofit sectors. Interim President and CEO, McKnight Foundation, 2020. Interim Commissioner, Minnesota Department of Human Services, 2019. Chief Operating Officer, Twin Cities Habitat for Humanity, 2017-2019. Vice President for University Services, University of Minnesota, 2012- 2016. Interim President and CEO, Blue Cross and Blue Shield of Minnesota, 2011-2012. Executive Vice-President and Chief Financial Officer, Minnesota Wild, 2002-2008. Commissioner, Minnesota Department of Finance, 1999-2002. Chair of the Board of Directors of Destination Medical Center Corporation. Board member of the Minnesota Wild Foundation. | N/A |
* | Length of service dates reflect the Trustee’s commencement of service with the Trust’s predecessor entities, where applicable. |
Name and year of birth | Position held and length of service | Principal occupations during past five years or longer |
Andrew Owen (Born 1960) | President, since 2017 | President and Chief Executive Officer of Allspring Funds Management, LLC since 2017 and Head of Global Fund Governance of Allspring Global Investments since 2022. Prior thereto, co-president of Galliard Capital Management, LLC, an affiliate of Allspring Funds Management, LLC, from 2019 to 2022 and Head of Affiliated Managers, Allspring Global Investments, from 2014 to 2019 and Executive Vice President responsible for marketing, investments and product development for Allspring Funds Management, LLC, from 2009 to 2014. |
Jeremy DePalma (Born 1974) | Treasurer, since 2012 (for certain funds in the Fund Complex); since 2021 (for the remaining funds in the Complex) | Senior Vice President of Allspring Funds Management, LLC since 2009. Senior Vice President of Evergreen Investment Management Company, LLC from 2008 to 2010 and head of the Fund Reporting and Control Team within Fund Administration from 2005 to 2010. |
Christopher Baker (Born 1976) | Chief Compliance Officer, since 2022 | Global Chief Compliance Officer for Allspring Global Investments since 2022. Prior thereto, Chief Compliance Officer for State Street Global Advisors from 2018 to 2021. Senior Compliance Officer for the State Street divisions of Alternative Investment Solutions, Sector Solutions, and Global Marketing from 2015 to 2018. From 2010 to 2015 Vice President, Global Head of Investment and Marketing Compliance for State Street Global Advisors. |
Matthew Prasse (Born 1983) | Chief Legal Officer, since 2022; Secretary, since 2021 | Senior Counsel of the Allspring Legal Department since 2021. Senior Counsel of the Wells Fargo Legal Department from 2018 to 2021. Previously, Counsel for Barings LLC from 2015 to 2018. Prior to joining Barings, Associate at Morgan, Lewis & Bockius LLP from 2008 to 2015. |

P.O. Box 219967
Kansas City, MO 64121-9967
Investment objective | The Portfolio seeks long-term capital appreciation. |
Manager | Allspring Funds Management, LLC |
Subadviser | Allspring Global Investments, LLC |
Portfolio managers | John R. Campbell, CFA, Vince Fioramonti, CFA, Robert Gruendyke, CFA, Thomas C. Ognar, CFA |
Ten largest holdings (%) as of May 31, 20231 | |
Microsoft Corp. | 8.76 |
Apple, Inc. | 6.00 |
Amazon.com, Inc. | 3.54 |
Mastercard, Inc. Class A | 3.37 |
NVIDIA Corp. | 3.30 |
Alphabet, Inc. Class C | 2.33 |
Oracle Corp. | 1.87 |
Alphabet, Inc. Class A | 1.86 |
Microchip Technology, Inc. | 1.81 |
Copart, Inc. | 1.57 |
1 | Figures represent the percentage of the Portfolio’s net assets. Holdings are subject to change and may have changed since the date specified. |
Sector allocation as of May 31, 20231 |
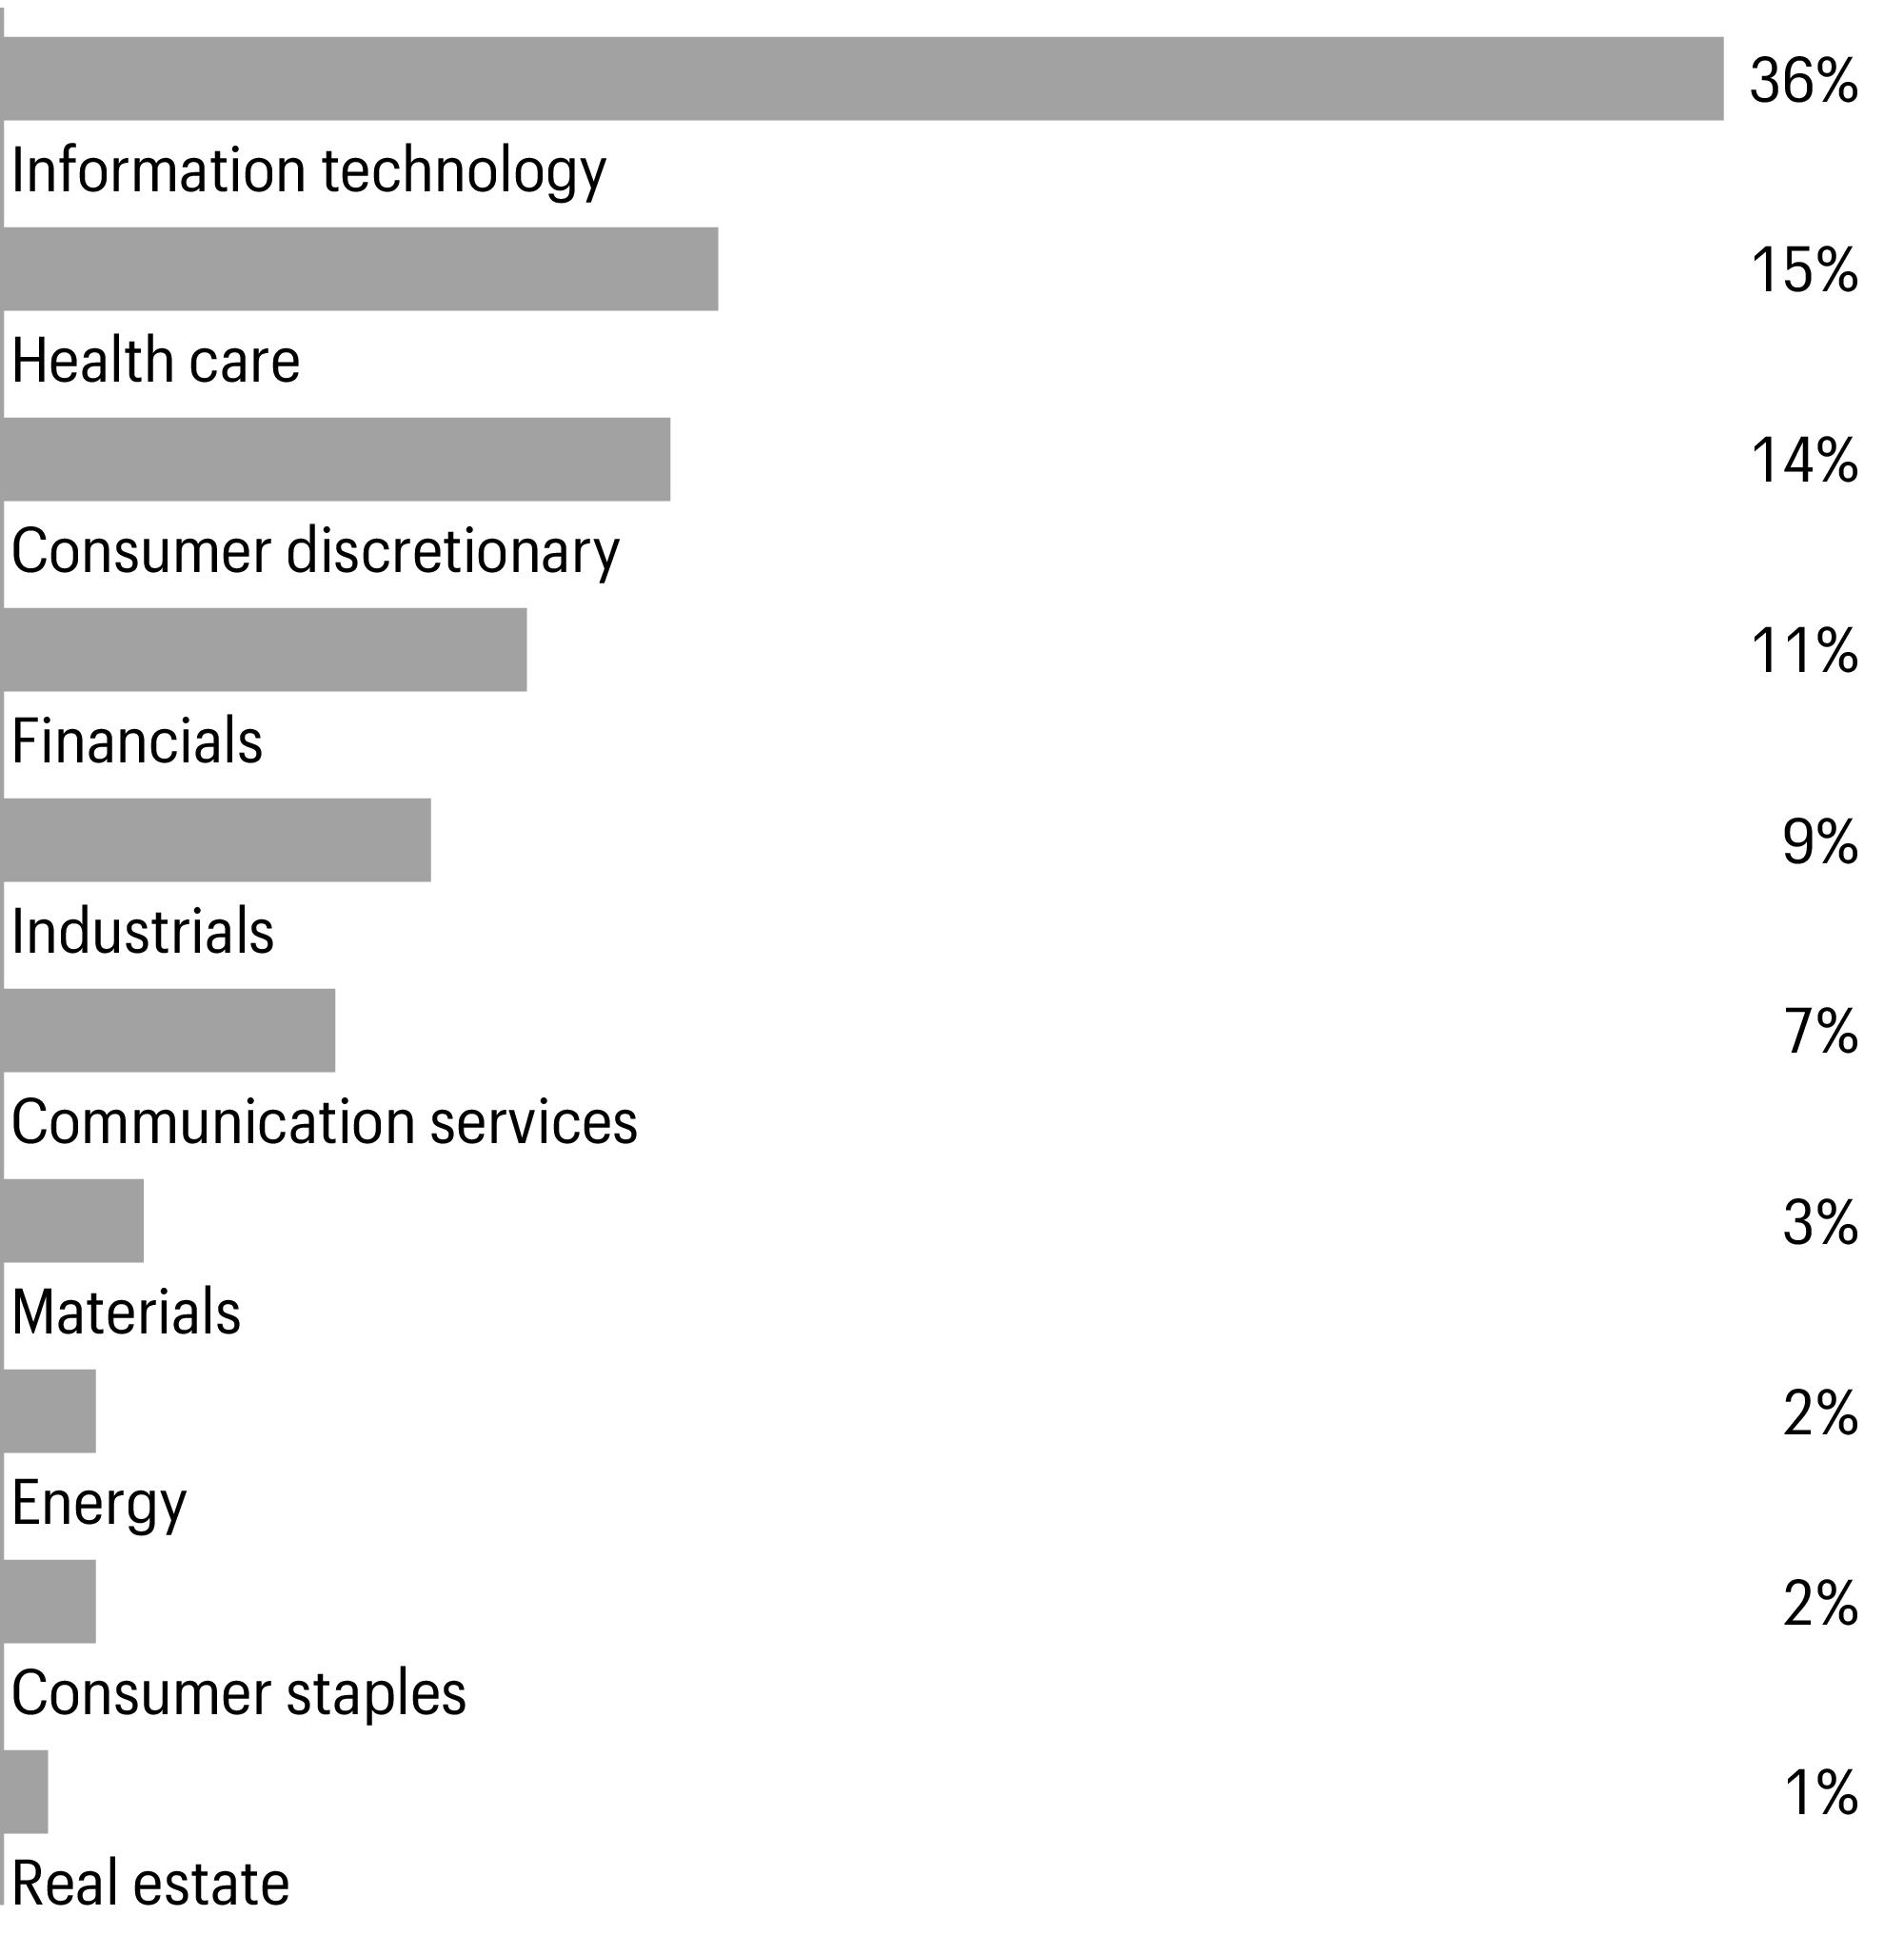
1 | Figures represent the percentage of the Portfolio’s long-term investments. Allocations are subject to change and may have changed since the date specified. |
CFA® and Chartered Financial Analyst® are trademarks owned by CFA Institute. |
Shares | Value | |||||
Common stocks: 99.10% | ||||||
Communication services: 7.27% | ||||||
Entertainment: 1.62% | ||||||
Activision Blizzard, Inc. | 13,511 | $1,083,582 | ||||
Liberty Media Corp.-Liberty Formula One Class C† | 7,066 | 497,446 | ||||
Live Nation Entertainment, Inc.† | 4,169 | 333,270 | ||||
Netflix, Inc.† | 1,304 | 515,380 | ||||
World Wrestling Entertainment, Inc. Class A | 3,887 | 393,831 | ||||
2,823,509 | ||||||
Interactive media & services: 5.49% | ||||||
Alphabet, Inc. Class A† | 26,317 | 3,233,570 | ||||
Alphabet, Inc. Class C† | 32,744 | 4,039,627 | ||||
Meta Platforms, Inc. Class A† | 8,554 | 2,264,415 | ||||
9,537,612 | ||||||
Wireless telecommunication services: 0.16% | ||||||
T-Mobile U.S., Inc.† | 1,993 | 273,539 | ||||
Consumer discretionary: 13.69% | ||||||
Automobile components: 0.26% | ||||||
Mobileye Global, Inc. Class A† | 10,173 | 453,411 | ||||
Broadline retail: 4.02% | ||||||
Amazon.com, Inc.† | 51,042 | 6,154,644 | ||||
MercadoLibre, Inc.† | 673 | 833,847 | ||||
6,988,491 | ||||||
Hotels, restaurants & leisure: 1.82% | ||||||
Airbnb, Inc. Class A† | 1,720 | 188,804 | ||||
Chipotle Mexican Grill, Inc.† | 702 | 1,457,696 | ||||
Hilton Worldwide Holdings, Inc. | 4,598 | 625,880 | ||||
Starbucks Corp. | 9,078 | 886,376 | ||||
3,158,756 | ||||||
Household durables: 1.41% | ||||||
Lennar Corp. Class A | 11,619 | 1,244,627 | ||||
PulteGroup, Inc. | 18,196 | 1,202,392 | ||||
2,447,019 | ||||||
Specialty retail: 4.77% | ||||||
AutoZone, Inc.† | 787 | 1,878,443 | ||||
Five Below, Inc.† | 575 | 99,199 | ||||
Home Depot, Inc. | 874 | 247,735 | ||||
O’Reilly Automotive, Inc.† | 2,048 | 1,849,979 | ||||
TJX Cos., Inc. | 16,313 | 1,252,675 | ||||
Tractor Supply Co. | 3,425 | 717,846 | ||||
Ulta Beauty, Inc.† | 5,495 | 2,252,016 | ||||
8,297,893 | ||||||
Shares | Value | |||||
Textiles, apparel & luxury goods: 1.41% | ||||||
Crocs, Inc.† | 2,641 | $296,532 | ||||
Deckers Outdoor Corp.† | 1,871 | 888,725 | ||||
Lululemon Athletica, Inc.† | 2,266 | 752,153 | ||||
NIKE, Inc. Class B | 4,888 | 514,511 | ||||
2,451,921 | ||||||
Consumer staples: 2.00% | ||||||
Beverages: 0.47% | ||||||
Constellation Brands, Inc. Class A | 1,136 | 276,014 | ||||
Monster Beverage Corp.† | 9,197 | 539,128 | ||||
815,142 | ||||||
Consumer staples distribution & retail: 0.91% | ||||||
Costco Wholesale Corp. | 2,838 | 1,451,807 | ||||
Sysco Corp. | 1,995 | 139,550 | ||||
1,591,357 | ||||||
Food products: 0.53% | ||||||
Archer-Daniels-Midland Co. | 13,106 | 925,939 | ||||
Personal care products: 0.09% | ||||||
Estee Lauder Cos., Inc. Class A | 820 | 150,905 | ||||
Energy: 2.40% | ||||||
Energy equipment & services: 0.53% | ||||||
Halliburton Co. | 31,852 | 912,560 | ||||
Oil, gas & consumable fuels: 1.87% | ||||||
Chevron Corp. | 7,498 | 1,129,349 | ||||
ConocoPhillips | 10,472 | 1,039,870 | ||||
Devon Energy Corp. | 18,914 | 871,935 | ||||
Hess Corp. | 1,685 | 213,439 | ||||
3,254,593 | ||||||
Financials: 10.35% | ||||||
Banks: 1.47% | ||||||
Citigroup, Inc. | 16,854 | 746,969 | ||||
Citizens Financial Group, Inc. | 23,779 | 613,023 | ||||
JPMorgan Chase & Co. | 8,781 | 1,191,670 | ||||
2,551,662 | ||||||
Capital markets: 3.80% | ||||||
BlackRock, Inc. | 1,199 | 788,402 | ||||
CME Group, Inc. | 2,585 | 462,069 | ||||
Goldman Sachs Group, Inc. | 3,275 | 1,060,773 | ||||
Intercontinental Exchange, Inc. | 1,613 | 170,897 | ||||
MarketAxess Holdings, Inc. | 1,560 | 424,960 | ||||
MSCI, Inc. | 1,327 | 624,393 | ||||
S&P Global, Inc. | 4,316 | 1,585,828 | ||||
Shares | Value | |||||
Capital markets (continued) | ||||||
Tradeweb Markets, Inc. Class A | 12,672 | $848,390 | ||||
Virtu Financial, Inc. Class A | 36,005 | 633,328 | ||||
6,599,040 | ||||||
Financial services: 4.68% | ||||||
Mastercard, Inc. Class A | 16,081 | 5,869,886 | ||||
Visa, Inc. Class A | 10,291 | 2,274,620 | ||||
8,144,506 | ||||||
Insurance: 0.40% | ||||||
Kinsale Capital Group, Inc. | 1,458 | 441,745 | ||||
Progressive Corp. | 1,983 | 253,645 | ||||
695,390 | ||||||
Health care: 14.63% | ||||||
Biotechnology: 4.35% | ||||||
AbbVie, Inc. | 6,789 | 936,611 | ||||
Alnylam Pharmaceuticals, Inc.† | 2,309 | 427,188 | ||||
Argenx SE ADR† | 1,132 | 440,008 | ||||
BioMarin Pharmaceutical, Inc.† | 5,935 | 515,989 | ||||
Exact Sciences Corp.† | 8,161 | 665,774 | ||||
Karuna Therapeutics, Inc.† | 938 | 212,504 | ||||
Regeneron Pharmaceuticals, Inc.† | 1,519 | 1,117,316 | ||||
Sarepta Therapeutics, Inc.† | 3,664 | 452,870 | ||||
Seagen, Inc.† | 1,457 | 285,135 | ||||
United Therapeutics Corp.† | 4,322 | 906,496 | ||||
Vertex Pharmaceuticals, Inc.† | 4,949 | 1,601,348 | ||||
7,561,239 | ||||||
Health care equipment & supplies: 5.16% | ||||||
Abbott Laboratories | 554 | 56,508 | ||||
Boston Scientific Corp.† | 34,246 | 1,762,984 | ||||
Dexcom, Inc.† | 4,106 | 481,470 | ||||
Edwards Lifesciences Corp.† | 15,007 | 1,264,040 | ||||
Hologic, Inc.† | 23,689 | 1,868,825 | ||||
Inspire Medical Systems, Inc.† | 1,272 | 372,047 | ||||
Insulet Corp.† | 3,326 | 912,156 | ||||
Intuitive Surgical, Inc.† | 1,552 | 477,768 | ||||
Penumbra, Inc.† | 1,703 | 523,400 | ||||
Shockwave Medical, Inc.† | 1,915 | 526,797 | ||||
Stryker Corp. | 2,628 | 724,224 | ||||
8,970,219 | ||||||
Health care providers & services: 2.56% | ||||||
AmerisourceBergen Corp. | 7,870 | 1,339,081 | ||||
Cardinal Health, Inc. | 5,586 | 459,728 | ||||
Humana, Inc. | 997 | 500,364 | ||||
UnitedHealth Group, Inc. | 4,430 | 2,158,473 | ||||
4,457,646 | ||||||
Shares | Value | |||||
Health care technology: 0.63% | ||||||
Veeva Systems, Inc. Class A† | 6,550 | $1,085,335 | ||||
Life sciences tools & services: 0.51% | ||||||
Agilent Technologies, Inc. | 4,481 | 518,317 | ||||
Thermo Fisher Scientific, Inc. | 713 | 362,532 | ||||
880,849 | ||||||
Pharmaceuticals: 1.42% | ||||||
Bristol-Myers Squibb Co. | 12,802 | 824,961 | ||||
Eli Lilly & Co. | 1,152 | 494,738 | ||||
Pfizer, Inc. | 25,401 | 965,746 | ||||
Zoetis, Inc. | 1,162 | 189,417 | ||||
2,474,862 | ||||||
Industrials: 8.54% | ||||||
Aerospace & defense: 0.75% | ||||||
HEICO Corp. | 6,301 | 974,008 | ||||
TransDigm Group, Inc. | 435 | 336,538 | ||||
1,310,546 | ||||||
Air freight & logistics: 0.31% | ||||||
United Parcel Service, Inc. Class B | 3,244 | 541,748 | ||||
Building products: 1.05% | ||||||
Carrier Global Corp. | 30,098 | 1,231,008 | ||||
Johnson Controls International PLC | 3,133 | 187,040 | ||||
Trex Co., Inc.† | 7,802 | 400,633 | ||||
1,818,681 | ||||||
Commercial services & supplies: 1.57% | ||||||
Copart, Inc.† | 31,229 | 2,735,348 | ||||
Construction & engineering: 1.37% | ||||||
EMCOR Group, Inc. | 7,333 | 1,208,771 | ||||
Quanta Services, Inc. | 3,636 | 645,681 | ||||
WillScot Mobile Mini Holdings Corp.† | 12,122 | 522,216 | ||||
2,376,668 | ||||||
Electrical equipment: 0.72% | ||||||
nVent Electric PLC | 28,779 | 1,248,433 | ||||
Ground transportation: 0.95% | ||||||
Uber Technologies, Inc.† | 43,378 | 1,645,328 | ||||
Machinery: 1.11% | ||||||
AGCO Corp. | 8,950 | 987,006 | ||||
Fortive Corp. | 14,599 | 950,541 | ||||
1,937,547 | ||||||
Shares | Value | |||||
Professional services: 0.71% | ||||||
CoStar Group, Inc.† | 7,882 | $625,831 | ||||
Paycom Software, Inc. | 1,081 | 302,820 | ||||
Verisk Analytics, Inc. | 1,414 | 309,822 | ||||
1,238,473 | ||||||
Information technology: 35.86% | ||||||
Communications equipment: 1.48% | ||||||
Arista Networks, Inc.† | 15,449 | 2,569,787 | ||||
Electronic equipment, instruments & components: 0.42% | ||||||
Keysight Technologies, Inc.† | 2,134 | 345,281 | ||||
Teledyne Technologies, Inc.† | 982 | 381,654 | ||||
726,935 | ||||||
IT services: 0.96% | ||||||
Accenture PLC Class A | 3,937 | 1,204,407 | ||||
MongoDB, Inc.† | 1,607 | 472,121 | ||||
1,676,528 | ||||||
Semiconductors & semiconductor equipment: 9.41% | ||||||
Advanced Micro Devices, Inc.† | 14,981 | 1,770,904 | ||||
Allegro MicroSystems, Inc.† | 6,310 | 248,172 | ||||
Applied Materials, Inc. | 8,781 | 1,170,507 | ||||
Broadcom, Inc. | 2,096 | 1,693,484 | ||||
Marvell Technology, Inc. | 4,980 | 291,280 | ||||
Microchip Technology, Inc. | 41,781 | 3,144,438 | ||||
Monolithic Power Systems, Inc. | 1,771 | 867,631 | ||||
NVIDIA Corp. | 15,164 | 5,737,148 | ||||
ON Semiconductor Corp.† | 14,208 | 1,187,789 | ||||
QUALCOMM, Inc. | 2,255 | 255,740 | ||||
16,367,093 | ||||||
Software: 17.59% | ||||||
Adobe, Inc.† | 2,025 | 846,025 | ||||
Cadence Design Systems, Inc.† | 5,390 | 1,244,605 | ||||
Crowdstrike Holdings, Inc. Class A† | 4,686 | 750,369 | ||||
Datadog, Inc. Class A† | 3,600 | 341,676 | ||||
Dynatrace, Inc.† | 17,265 | 880,342 | ||||
Fair Isaac Corp.† | 802 | 631,711 | ||||
Fortinet, Inc.† | 30,104 | 2,057,006 | ||||
Intuit, Inc. | 2,774 | 1,162,639 | ||||
Microsoft Corp. | 46,368 | 15,226,788 | ||||
Oracle Corp. | 30,781 | 3,260,939 | ||||
Palo Alto Networks, Inc.† | 7,916 | 1,689,195 | ||||
Salesforce, Inc.† | 848 | 189,426 | ||||
ServiceNow, Inc.† | 3,073 | 1,674,109 | ||||
Workday, Inc. Class A† | 2,933 | 621,767 | ||||
30,576,597 | ||||||
Shares | Value | |||||
Technology hardware, storage & peripherals: 6.00% | ||||||
Apple, Inc. | 58,840 | $10,429,390 | ||||
Materials: 2.95% | ||||||
Chemicals: 1.69% | ||||||
CF Industries Holdings, Inc. | 11,317 | 696,109 | ||||
Linde PLC | 6,355 | 2,247,509 | ||||
2,943,618 | ||||||
Metals & mining: 1.26% | ||||||
Nucor Corp. | 7,634 | 1,008,146 | ||||
Reliance Steel & Aluminum Co. | 4,999 | 1,173,165 | ||||
2,181,311 | ||||||
Real estate: 1.41% | ||||||
Retail REITs : 0.67% | ||||||
Simon Property Group, Inc. | 11,038 | 1,160,646 | ||||
Specialized REITs : 0.74% | ||||||
Equinix, Inc. | 443 | 330,279 | ||||
Weyerhaeuser Co. | 33,676 | 965,154 | ||||
1,295,433 | ||||||
Total common stocks (Cost $110,226,666) | 172,283,505 | |||||
Yield | ||||||
Short-term investments: 0.62% | ||||||
Investment companies: 0.62% | ||||||
Allspring Government Money Market Fund Select Class♠∞ | 5.01 % | 1,071,110 | 1,071,110 | |||
Total short-term investments (Cost $1,071,110) | 1,071,110 | |||||
Total investments in securities (Cost $111,297,776) | 99.72 % | 173,354,615 | ||||
Other assets and liabilities, net | 0.28 | 483,567 | ||||
Total net assets | 100.00 % | $173,838,182 | ||||
† | Non-income-earning security |
♠ | The issuer of the security is an affiliated person of the Portfolio as defined in the Investment Company Act of 1940. |
∞ | The rate represents the 7-day annualized yield at period end. |
Abbreviations: | |
ADR | American depositary receipt |
REIT | Real estate investment trust |
Value, beginning of period | Purchases | Sales proceeds | Net realized gains (losses) | Net change in unrealized gains (losses) | Value, end of period | Shares, end of period | Income from affiliated securities | |
Short-term investments | ||||||||
Allspring Government Money Market Fund Select Class | $6,825,985 | $39,665,047 | $(45,419,922 ) | $0 | $0 | $1,071,110 | 1,071,110 | $80,873 |
Investments in affiliates no longer held at end of period | ||||||||
Securities Lending Cash Investments LLC | 100,300 | 894,025 | (994,356 ) | 31 | 0 | 0 | 0 | 2,216 1 |
$31 | $0 | $1,071,110 | $83,089 |
1 | Amount shown represents income before fees and rebates. |
Description | Number of contracts | Expiration date | Notional cost | Notional value | Unrealized gains | Unrealized losses |
Long | ||||||
Micro E-Mini S&P 500 | 20 | 6-16-2023 | $421,227 | $419,050 | $0 | $(2,177 ) |
Assets | |
Investments in unaffiliated securities, at value (cost $110,226,666) | $172,283,505 |
Investments in affiliated securities, at value (cost $1,071,110) | 1,071,110 |
Cash | 12 |
Cash at broker segregated for futures contracts | 50,400 |
Receivable for investments sold | 5,543,691 |
Receivable for dividends | 213,083 |
Total assets | 179,161,801 |
Liabilities | |
Payable for investments purchased | 5,234,633 |
Advisory fee payable | 55,101 |
Payable for daily variation margin on open futures contracts | 2,450 |
Trustees’ fees and expenses payable | 504 |
Accrued expenses and other liabilities | 30,931 |
Total liabilities | 5,323,619 |
Total net assets | $173,838,182 |
Investment income | |
Dividends (net of foreign withholdings taxes of $13,440) | $1,850,245 |
Income from affiliated securities | 81,330 |
Interest | 63 |
Total investment income | 1,931,638 |
Expenses | |
Advisory fee | 1,173,961 |
Custody and accounting fees | 38,639 |
Professional fees | 78,309 |
Interest holder report expenses | 5,115 |
Trustees’ fees and expenses | 21,861 |
Other fees and expenses | 3,246 |
Total expenses | 1,321,131 |
Less: Fee waivers and/or expense reimbursements | (237,475 ) |
Net expenses | 1,083,656 |
Net investment income | 847,982 |
Realized and unrealized gains (losses) on investments | |
Net realized gains (losses) on | |
Unaffiliated securities | 10,647,293 |
Affiliated securities | 31 |
Futures contracts | (3,370 ) |
Net realized gains on investments | 10,643,954 |
Net change in unrealized gains (losses) on | |
Unaffiliated securities | (2,002,446 ) |
Foreign currency and foreign currency translations | (304 ) |
Futures contracts | (2,177 ) |
Net change in unrealized gains (losses) on investments | (2,004,927 ) |
Net realized and unrealized gains (losses) on investments | 8,639,027 |
Net increase in net assets resulting from operations | $9,487,009 |
Year ended May 31, 2023 | Year ended May 31, 2022 | |||
Operations | ||||
Net investment income | $847,982 | $308,158 | ||
Net realized gains on investments | 10,643,954 | 35,246,286 | ||
Net change in unrealized gains (losses) on investments | (2,004,927 ) | (57,276,470 ) | ||
Net increase (decrease) in net assets resulting from operations | 9,487,009 | (21,722,026 ) | ||
Capital share transactions | ||||
Transactions in investors’ beneficial interests | ||||
Contributions | 7,312,030 | 4,492,383 | ||
Withdrawals | (38,650,437 ) | (72,417,721 ) | ||
Net decrease in net assets resulting from capital share transactions | (31,338,407 ) | (67,925,338 ) | ||
Total decrease in net assets | (21,851,398 ) | (89,647,364 ) | ||
Net assets | ||||
Beginning of period | 195,689,580 | 285,336,944 | ||
End of period | $173,838,182 | $195,689,580 | ||
Year ended May 31 | |||||
2023 | 2022 | 2021 | 2020 | 2019 | |
Total return | 5.37 % | (11.89 )% | 35.78 % | 16.10 % | 3.79 % |
Ratios to average net assets (annualized) | |||||
Gross expenses | 0.73 % | 0.70 % | 0.70 % | 0.71 % | 0.70 % |
Net expenses1 | 0.60 % | 0.60 % | 0.60 % | 0.62 % | 0.62 % |
Net investment income | 0.47 % | 0.13 % | 0.14 % | 0.46 % | 0.68 % |
Supplemental data | |||||
Portfolio turnover rate | 51 % | 45 % | 58 % | 43 % | 100 % |
1 | Net expense ratios reflect voluntary waivers, if any. |
Gross unrealized gains | $65,860,183 |
Gross unrealized losses | (4,667,604 ) |
Net unrealized gains | $61,192,579 |
Quoted prices (Level 1) | Other significant observable inputs (Level 2) | Significant unobservable inputs (Level 3) | Total | |
Assets | ||||
Investments in: | ||||
Common stocks | ||||
Communication services | $12,634,660 | $0 | $0 | $12,634,660 |
Consumer discretionary | 23,797,491 | 0 | 0 | 23,797,491 |
Consumer staples | 3,483,343 | 0 | 0 | 3,483,343 |
Energy | 4,167,153 | 0 | 0 | 4,167,153 |
Financials | 17,990,598 | 0 | 0 | 17,990,598 |
Health care | 25,430,150 | 0 | 0 | 25,430,150 |
Industrials | 14,852,772 | 0 | 0 | 14,852,772 |
Information technology | 62,346,330 | 0 | 0 | 62,346,330 |
Materials | 5,124,929 | 0 | 0 | 5,124,929 |
Real estate | 2,456,079 | 0 | 0 | 2,456,079 |
Short-term investments | ||||
Investment companies | 1,071,110 | 0 | 0 | 1,071,110 |
Total assets | $173,354,615 | $0 | $0 | $173,354,615 |
Liabilities | ||||
Futures contracts | $2,177 | $0 | $0 | $2,177 |
Total liabilities | $2,177 | $0 | $0 | $2,177 |
Average daily net assets | Advisory fee |
First $500 million | 0.650 % |
Next $500 million | 0.625 |
Next $1 billion | 0.600 |
Next $2 billion | 0.575 |
Next $4 billion | 0.550 |
Next $4 billion | 0.525 |
Next $4 billion | 0.500 |
Over $16 billion | 0.475 |
Allspring Master Trust:

Name and year of birth | Position held and length of service* | Principal occupations during past five years or longer | Current other public company or investment company directorships |
William R. Ebsworth (Born 1957) | Trustee, since 2015 | Retired. From 1984 to 2013, equities analyst, portfolio manager, research director and chief investment officer at Fidelity Management and Research Company in Boston, Tokyo, and Hong Kong, and retired in 2013 as Chief Investment Officer of Fidelity Strategic Advisers, Inc. where he led a team of investment professionals managing client assets. Prior thereto, Board member of Hong Kong Securities Clearing Co., Hong Kong Options Clearing Corp., the Thailand International Fund, Ltd., Fidelity Investments Life Insurance Company, and Empire Fidelity Investments Life Insurance Company. Audit Committee Chair and Investment Committee Chair of the Vincent Memorial Hospital Foundation (non-profit organization). Mr. Ebsworth is a CFA charterholder. | N/A |
Jane A. Freeman (Born 1953) | Trustee, since 2015; Chair Liaison, since 2018 | Retired. From 2012 to 2014 and 1999 to 2008, Chief Financial Officer of Scientific Learning Corporation. From 2008 to 2012, Ms. Freeman provided consulting services related to strategic business projects. Prior to 1999, Portfolio Manager at Rockefeller & Co. and Scudder, Stevens & Clark. Board member of the Harding Loevner Funds from 1996 to 2014, serving as both Lead Independent Director and chair of the Audit Committee. Board member of the Russell Exchange Traded Funds Trust from 2011 to 2012 and the chair of the Audit Committee. Ms. Freeman is also an inactive Chartered Financial Analyst. | N/A |
Isaiah Harris, Jr. (Born 1952) | Trustee, since 2009; Audit Committee Chair, since 2019 | Retired. Member of the Advisory Board of CEF of East Central Florida. Chairman of the Board of CIGNA Corporation from 2009 to 2021, and Director from 2005 to 2008. From 2003 to 2011, Director of Deluxe Corporation. Prior thereto, President and CEO of BellSouth Advertising and Publishing Corp. from 2005 to 2007, President and CEO of BellSouth Enterprises from 2004 to 2005 and President of BellSouth Consumer Services from 2000 to 2003. Emeritus member of the Iowa State University Foundation Board of Governors. Emeritus Member of the Advisory board of Iowa State University School of Business. Advisory Board Member, Palm Harbor Academy (private school). Advisory Board Member, Fellowship of Christian Athletes. Mr. Harris is a certified public accountant (inactive status). | N/A |
David F. Larcker (Born 1950) | Trustee, since 2009 | Distinguished Visiting Fellow at the Hoover Institution since 2022. James Irvin Miller Professor of Accounting at the Graduate School of Business (Emeritus), Stanford University, Director of the Corporate Governance Research Initiative and Senior Faculty of The Rock Center for Corporate Governance since 2006. From 2005 to 2008, Professor of Accounting at the Graduate School of Business, Stanford University. Prior thereto, Ernst & Young Professor of Accounting at The Wharton School, University of Pennsylvania from 1985 to 2005. | N/A |
Olivia S. Mitchell (Born 1953) | Trustee, since 2006; Nominating and Governance Committee Chair, since 2018 | International Foundation of Employee Benefit Plans Professor since 1993, Wharton School of the University of Pennsylvania. Director of Wharton’s Pension Research Council and Boettner Center on Pensions & Retirement Research, and Research Associate at the National Bureau of Economic Research. Previously taught at Cornell University from 1978 to 1993. | N/A |
Timothy J. Penny (Born 1951) | Trustee, since 1996; Chair, since 2018 | President and Chief Executive Officer of Southern Minnesota Initiative Foundation, a non-profit organization, since 2007. Vice Chair of the Economic Club of Minnesota, since 2007. Co-Chair of the Committee for a Responsible Federal Budget, since 1995. Member of the Board of Trustees of NorthStar Education Finance, Inc., a non-profit organization, from 2007-2022. Senior Fellow of the University of Minnesota Humphrey Institute from 1995 to 2017. | N/A |
Name and year of birth | Position held and length of service* | Principal occupations during past five years or longer | Current other public company or investment company directorships |
James G. Polisson (Born 1959) | Trustee, since 2018 | Retired. Chief Marketing Officer, Source (ETF) UK Services, Ltd, from 2015 to 2017. From 2012 to 2015, Principal of The Polisson Group, LLC, a management consulting, corporate advisory and principal investing company. Chief Executive Officer and Managing Director at Russell Investments, Global Exchange Traded Funds from 2010 to 2012. Managing Director of Barclays Global Investors from 1998 to 2010 and Global Chief Marketing Officer for iShares and Barclays Global Investors from 2000 to 2010. Trustee of the San Francisco Mechanics’ Institute, a non- profit organization, from 2013 to 2015. Board member of the Russell Exchange Traded Fund Trust from 2011 to 2012. Director of Barclays Global Investors Holdings Deutschland GmbH from 2006 to 2009. Mr. Polisson is an attorney and has a retired status with the Massachusetts and District of Columbia Bar Associations. | N/A |
Pamela Wheelock (Born 1959) | Trustee, since January 2020; previously Trustee from January 2018 to July 2019 | Retired. Executive and Senior Financial leadership positions in the public, private and nonprofit sectors. Interim President and CEO, McKnight Foundation, 2020. Interim Commissioner, Minnesota Department of Human Services, 2019. Chief Operating Officer, Twin Cities Habitat for Humanity, 2017-2019. Vice President for University Services, University of Minnesota, 2012- 2016. Interim President and CEO, Blue Cross and Blue Shield of Minnesota, 2011-2012. Executive Vice-President and Chief Financial Officer, Minnesota Wild, 2002-2008. Commissioner, Minnesota Department of Finance, 1999-2002. Chair of the Board of Directors of Destination Medical Center Corporation. Board member of the Minnesota Wild Foundation. | N/A |
* | Length of service dates reflect the Trustee’s commencement of service with the Trust’s predecessor entities, where applicable. |
Name and year of birth | Position held and length of service | Principal occupations during past five years or longer |
Andrew Owen (Born 1960) | President, since 2017 | President and Chief Executive Officer of Allspring Funds Management, LLC since 2017 and Head of Global Fund Governance of Allspring Global Investments since 2022. Prior thereto, co-president of Galliard Capital Management, LLC, an affiliate of Allspring Funds Management, LLC, from 2019 to 2022 and Head of Affiliated Managers, Allspring Global Investments, from 2014 to 2019 and Executive Vice President responsible for marketing, investments and product development for Allspring Funds Management, LLC, from 2009 to 2014. |
Jeremy DePalma (Born 1974) | Treasurer, since 2012 (for certain funds in the Fund Complex); since 2021 (for the remaining funds in the Complex) | Senior Vice President of Allspring Funds Management, LLC since 2009. Senior Vice President of Evergreen Investment Management Company, LLC from 2008 to 2010 and head of the Fund Reporting and Control Team within Fund Administration from 2005 to 2010. |
Christopher Baker (Born 1976) | Chief Compliance Officer, since 2022 | Global Chief Compliance Officer for Allspring Global Investments since 2022. Prior thereto, Chief Compliance Officer for State Street Global Advisors from 2018 to 2021. Senior Compliance Officer for the State Street divisions of Alternative Investment Solutions, Sector Solutions, and Global Marketing from 2015 to 2018. From 2010 to 2015 Vice President, Global Head of Investment and Marketing Compliance for State Street Global Advisors. |
Matthew Prasse (Born 1983) | Chief Legal Officer, since 2022; Secretary, since 2021 | Senior Counsel of the Allspring Legal Department since 2021. Senior Counsel of the Wells Fargo Legal Department from 2018 to 2021. Previously, Counsel for Barings LLC from 2015 to 2018. Prior to joining Barings, Associate at Morgan, Lewis & Bockius LLP from 2008 to 2015. |
The Board also received and considered information regarding the fee rates that are payable to Allspring Funds Management for investment advisory services (as discussed below), which are the only fees charged at the Portfolio level, relative to corresponding class-specific expense groups that were determined by Broadridge to be similar to the Portfolio (the “Groups”). The Board received a description of the methodology used by Broadridge to select the mutual funds in the expense Groups and an explanation of how funds comprising expense groups and their expense ratios may vary from year-to-year.

P.O. Box 219967
Kansas City, MO 64121-9967
2 | |
6 | |
10 | |
11 | |
12 | |
13 | |
14 | |
15 | |
20 | |
24 | |
25 | |
30 | |
31 | |
32 | |
33 | |
34 | |
37 | |
38 |

Allspring Funds

President
Allspring Funds
Notice to Shareholders |
Beginning in July 2024, the Fund will be required by the Securities and Exchange Commission to send shareholders a paper copy of a new tailored shareholder report in place of the full shareholder report that you are now receiving. The tailored shareholder report will contain concise information about the Fund, including certain expense and performance information and fund statistics. If you wish to receive this new tailored shareholder report electronically, please follow the instructions on the back cover of this report. |
Other information that is currently included in the shareholder report, such as the Fund’s financial statements, will be available online and upon request, free of charge, in paper or electronic format. |
Investment objective | The Fund seeks long-term capital appreciation. |
Manager | Allspring Funds Management, LLC |
Subadviser for the affiliated master portfolio* | Allspring Global Investments, LLC |
Portfolio managers | Robert Gruendyke, CFA, David Nazaret, CFA, Thomas C. Ognar, CFA |
Average annual total returns (%) as of May 31, 2023 | |||||||||
Including sales charge | Excluding sales charge | Expense ratios1 (%) | |||||||
Inception date | 1 year | 5 year | 10 year | 1 year | 5 year | 10 year | Gross | Net2 | |
Class A (WEMAX) | 3-31-2008 | -7.76 | 2.68 | 8.13 | -2.13 | 3.90 | 8.77 | 1.35 | 1.27 |
Class C (WEMCX) | 3-31-2008 | -3.88 | 3.15 | 8.13 | -2.88 | 3.15 | 8.13 | 2.10 | 2.02 |
Class R6 (WEGRX)3 | 7-31-2018 | – | – | – | -1.67 | 4.39 | 9.27 | 0.93 | 0.85 |
Administrator Class (WFGDX) | 1-31-2007 | – | – | – | -1.98 | 4.00 | 8.90 | 1.28 | 1.20 |
Institutional Class (WEMIX) | 3-31-2008 | – | – | – | -1.68 | 4.30 | 9.22 | 1.03 | 0.90 |
Russell 2000® Growth Index4 | – | – | – | – | 2.68 | 2.74 | 7.90 | – | – |
1 | Reflects the expense ratios as stated in the most recent prospectuses. The expense ratios shown are subject to change and may differ from the annualized expense ratios shown in the financial highlights of this report. |
2 | The manager has contractually committed through September 30, 2023 (September 30, 2024 for Class A and Class C), to waive fees and/or reimburse expenses to the extent necessary to cap total annual fund operating expenses after fee waivers at 1.27% for Class A, 2.02% for Class C, 0.85% for Class R6, 1.20% for Administrator Class and 0.90% for Institutional Class. Brokerage commissions, stamp duty fees, interest, taxes, acquired fund fees and expenses (if any) from funds in which the affiliated master portfolio invests, and extraordinary expenses are excluded from the expense caps. Net expenses from the affiliated master portfolio are included in the expense caps. Prior to or after the commitment expiration date, the caps may be increased or the commitment to maintain the caps may be terminated only with the approval of the Board of Trustees. Without these caps, the Fund’s returns would have been lower. The expense ratio paid by an investor is the net expense ratio (the total annual fund operating expenses after fee waivers) as stated in the prospectuses. |
3 | Historical performance shown for the Class R6 shares prior to their inception reflects the performance of the Institutional Class shares, and includes the higher expenses applicable to the Institutional Class shares. If these expenses had not been included, returns for the Class R6 shares would be higher. |
4 | The Russell 2000® Growth Index measures the performance of those Russell 2000 companies with higher price/book ratios and higher forecasted growth values. You cannot invest directly in an index. |
* | The Fund is a feeder fund in a master-feeder structure that invests substantially all of its assets in a single affiliated master portfolio of the Allspring Master Trust with a substantially identical investment objective and substantially similar investment strategies. References to the investment activities of the Fund are intended to refer to the investment activities of the affiliated master portfolio in which it invests. |
CFA® and Chartered Financial Analyst® are trademarks owned by CFA Institute. | |
Growth of $10,000 investment as of May 31, 20231 |

1 | The chart compares the performance of Class A shares for the most recent ten years with the Russell 2000® Growth Index. The chart assumes a hypothetical investment of $10,000 in Class A shares and reflects all operating expenses and assumes the maximum initial sales charge of 5.75%. |
Ten largest holdings (%) as of May 31, 20231 | |
SPS Commerce, Inc. | 3.95 |
TransMedics Group, Inc. | 3.68 |
elf Beauty, Inc. | 3.10 |
Novanta, Inc. | 3.04 |
Kinsale Capital Group, Inc. | 2.76 |
Casella Waste Systems, Inc. Class A | 2.49 |
Inspire Medical Systems, Inc. | 2.22 |
SPX Technologies, Inc. | 2.08 |
Shoals Technologies Group, Inc. Class A | 1.99 |
DigitalOcean Holdings, Inc. | 1.93 |
1 | Each holding represents the Fund’s allocable portion of the affiliated master portfolio security. Figures represent each holding as a percentage of the Fund’s net assets. Holdings are subject to change and may have changed since the date specified. |
Sector allocation as of May 31, 20231 |

1 | Figures represent the sector allocation of the affiliated master portfolio as a percentage of the long-term investments of the affiliated master portfolio. Allocations are subject to change and may have changed since the date specified. |
Beginning account value 12-1-2022 | Ending account value 5-31-2023 | Expenses paid during the period1, 2 | Annualized net expense ratio2 | |
Class A | ||||
Actual | $1,000.00 | $999.39 | $6.38 | 1.28 % |
Hypothetical (5% return before expenses) | $1,000.00 | $1,018.55 | $6.44 | 1.28 % |
Class C | ||||
Actual | $1,000.00 | $999.35 | $10.12 | 2.03 % |
Hypothetical (5% return before expenses) | $1,000.00 | $1,014.81 | $10.20 | 2.03 % |
Class R6 | ||||
Actual | $1,000.00 | $999.41 | $4.24 | 0.85 % |
Hypothetical (5% return before expenses) | $1,000.00 | $1,020.69 | $4.28 | 0.85 % |
Administrator Class | ||||
Actual | $1,000.00 | $999.40 | $5.98 | 1.20 % |
Hypothetical (5% return before expenses) | $1,000.00 | $1,018.95 | $6.04 | 1.20 % |
Institutional Class | ||||
Actual | $1,000.00 | $999.41 | $4.49 | 0.90 % |
Hypothetical (5% return before expenses) | $1,000.00 | $1,020.44 | $4.53 | 0.90 % |
Value | ||||||
Investment companies: 100.26% | ||||||
Affiliated master portfolio: 100.26% | ||||||
Allspring Emerging Growth Portfolio | $290,401,028 | |||||
Total investment companies (Cost $221,959,366) | 290,401,028 | |||||
Total investments in securities (Cost $221,959,366) | 100.26 % | 290,401,028 | ||||
Other assets and liabilities, net | (0.26 ) | (741,598 ) | ||||
Total net assets | 100.00 % | $289,659,430 | ||||
% of ownership, beginning of period | % of ownership, end of period | Net realized gains (losses) on investments allocated from affiliated Master Portfolio | Net change in unrealized gains (losses) on investments allocated from affiliated Master Portfolio | Dividends allocated from affiliated Master Portfolio | Securities lending income allocated from affiliated Master Portfolio | Affiliated income allocated from affiliated Master Portfolio | Value, end of period | |
Allspring Emerging Growth Portfolio | 90.11 % | 89.59 % | $(5,001,838 ) | $1,055,644 | $725,681 | $94,322 | $205,658 | $290,401,028 |
Assets | |
Investments in affiliated Master Portfolio, at value (cost $221,959,366) | $290,401,028 |
Receivable for Fund shares sold | 146,901 |
Receivable from manager | 28,672 |
Prepaid expenses and other assets | 90,287 |
Total assets | 290,666,888 |
Liabilities | |
Payable for Fund shares redeemed | 871,125 |
Administration fees payable | 38,360 |
Trustees’ fees and expenses payable | 666 |
Distribution fee payable | 608 |
Accrued expenses and other liabilities | 96,699 |
Total liabilities | 1,007,458 |
Total net assets | $289,659,430 |
Net assets consist of | |
Paid-in capital | $237,996,038 |
Total distributable earnings | 51,663,392 |
Total net assets | $289,659,430 |
Computation of net asset value and offering price per share | |
Net assets–Class A | $121,018,891 |
Shares outstanding–Class A1 | 13,875,779 |
Net asset value per share–Class A | $8.72 |
Maximum offering price per share – Class A2 | $9.25 |
Net assets–Class C | $955,889 |
Shares outstanding–Class C1 | 157,145 |
Net asset value per share–Class C | $6.08 |
Net assets–Class R6 | $28,457,644 |
Shares outstanding–Class R61 | 2,681,664 |
Net asset value per share–Class R6 | $10.61 |
Net assets–Administrator Class | $15,417,877 |
Shares outstanding–Administrator Class1 | 1,641,961 |
Net asset value per share–Administrator Class | $9.39 |
Net assets–Institutional Class | $123,809,129 |
Shares outstanding–Institutional Class1 | 11,746,668 |
Net asset value per share–Institutional Class | $10.54 |
1 | The Fund has an unlimited number of authorized shares. |
2 | Maximum offering price is computed as 100/94.25 of net asset value. On investments of $50,000 or more, the offering price is reduced. |
Investment income | |
Dividends allocated from affiliated Master Portfolio | $725,681 |
Affiliated income allocated from affiliated Master Portfolio | 205,658 |
Securities lending income allocated from affiliated Master Portfolio | 94,322 |
Expenses allocated from affiliated Master Portfolio | (2,655,116 ) |
Waivers allocated from affiliated Master Portfolio | 10,637 |
Total investment income | (1,618,818 ) |
Expenses | |
Management fee | 157,446 |
Administration fees | |
Class A | 271,091 |
Class C | 2,885 |
Class R6 | 8,036 |
Administrator Class | 22,046 |
Institutional Class | 182,888 |
Shareholder servicing fees | |
Class A | 322,288 |
Class C | 3,412 |
Administrator Class | 42,191 |
Distribution fee | |
Class C | 10,235 |
Custody and accounting fees | 18,500 |
Professional fees | 39,056 |
Registration fees | 48,327 |
Shareholder report expenses | 27,128 |
Trustees’ fees and expenses | 21,093 |
Other fees and expenses | 6,519 |
Total expenses | 1,183,141 |
Less: Fee waivers and/or expense reimbursements | |
Fund-level | (346,428 ) |
Class A | (20,861 ) |
Class R6 | (3,152 ) |
Administrator Class | (1,664 ) |
Institutional Class | (84,913 ) |
Net expenses | 726,123 |
Net investment loss | (2,344,941 ) |
Realized and unrealized gains (losses) on investments | |
Net realized losses on investments allocated from affiliated Master Portfolio | (5,001,838 ) |
Net change in unrealized gains (losses) on investments allocated from affiliated Master Portfolio | 1,055,644 |
Net realized and unrealized gains (losses) on investments | (3,946,194 ) |
Net decrease in net assets resulting from operations | $(6,291,135 ) |
Year ended May 31, 2023 | Year ended May 31, 2022 | |||
Operations | ||||
Net investment loss | $(2,344,941 ) | $(5,137,253 ) | ||
Net realized gains (losses) on investments | (5,001,838 ) | 232,050,592 | ||
Net change in unrealized gains (losses) on investments | 1,055,644 | (327,135,019 ) | ||
Net decrease in net assets resulting from operations | (6,291,135 ) | (100,221,680 ) | ||
Distributions to shareholders from | ||||
Net investment income and net realized gains | ||||
Class A | 0 | (62,681,311 ) | ||
Class C | 0 | (1,233,291 ) | ||
Class R6 | 0 | (5,898,804 ) | ||
Administrator Class | 0 | (7,999,256 ) | ||
Institutional Class | 0 | (61,664,834 ) | ||
Total distributions to shareholders | 0 | (139,477,496 ) | ||
Capital share transactions | Shares | Shares | ||
Proceeds from shares sold | ||||
Class A | 411,868 | 3,634,624 | 422,522 | 6,066,711 |
Class C | 4,232 | 26,812 | 97,992 | 1,394,743 |
Class R6 | 728,487 | 8,110,513 | 1,375,088 | 22,705,246 |
Administrator Class | 169,603 | 1,635,469 | 159,434 | 2,285,979 |
Institutional Class | 1,811,034 | 19,525,541 | 5,047,859 | 87,194,049 |
32,932,959 | 119,646,728 | |||
Reinvestment of distributions | ||||
Class A | 0 | 0 | 4,788,131 | 60,617,734 |
Class C | 0 | 0 | 138,107 | 1,233,291 |
Class R6 | 0 | 0 | 125,710 | 1,924,617 |
Administrator Class | 0 | 0 | 585,228 | 7,964,955 |
Institutional Class | 0 | 0 | 4,040,376 | 61,494,520 |
0 | 133,235,117 | |||
Payment for shares redeemed | ||||
Class A | (1,671,745 ) | (14,944,143 ) | (1,754,937 ) | (23,706,994 ) |
Class C | (127,934 ) | (770,829 ) | (117,521 ) | (1,197,540 ) |
Class R6 | (270,345 ) | (2,758,578 ) | (330,224 ) | (6,538,508 ) |
Administrator Class | (372,127 ) | (3,604,407 ) | (413,854 ) | (5,802,034 ) |
Institutional Class | (4,697,411 ) | (50,099,244 ) | (26,013,236 ) | (552,947,062 ) |
(72,177,201 ) | (590,192,138 ) | |||
Net decrease in net assets resulting from capital share transactions | (39,244,242 ) | (337,310,293 ) | ||
Total decrease in net assets | (45,535,377 ) | (577,009,469 ) | ||
Net assets | ||||
Beginning of period | 335,194,807 | 912,204,276 | ||
End of period | $289,659,430 | $335,194,807 | ||
(For a share outstanding throughout each period)
Year ended May 31 | |||||
Class A | 2023 | 2022 | 2021 | 2020 | 2019 |
Net asset value, beginning of period | $8.91 | $18.05 | $14.71 | $13.51 | $17.04 |
Net investment loss | (0.08 )1 | (0.16 )1 | (0.20 )1 | (0.17 ) | (0.16 )1 |
Net realized and unrealized gains (losses) on investments | (0.11 ) | (3.47 ) | 7.69 | 2.13 | (0.19 ) |
Total from investment operations | (0.19 ) | (3.63 ) | 7.49 | 1.96 | (0.35 ) |
Distributions to shareholders from | |||||
Net realized gains | 0.00 | (5.51 ) | (4.15 ) | (0.76 ) | (3.18 ) |
Net asset value, end of period | $8.72 | $8.91 | $18.05 | $14.71 | $13.51 |
Total return2 | (2.13 )% | (29.16 )% | 53.22 % | 14.97 % | (0.84 )% |
Ratios to average net assets (annualized)* | |||||
Gross expenses | 1.40 % | 1.36 % | 1.35 % | 1.36 % | 1.35 % |
Net expenses | 1.27 % | 1.26 % | 1.27 % | 1.27 % | 1.29 % |
Net investment loss | (0.95 )% | (1.10 )% | (1.12 )% | (1.08 )% | (1.06 )% |
Supplemental data | |||||
Portfolio turnover rate3 | 70 % | 51 % | 48 % | 55 % | 71 % |
Net assets, end of period (000s omitted) | $121,019 | $134,825 | $210,838 | $148,866 | $145,898 |
* | Ratios include net expenses allocated from the affiliated Master Portfolio which were as follows: |
Year ended May 31, 2023 | 0.84% |
Year ended May 31, 2022 | 0.82% |
Year ended May 31, 2021 | 0.81% |
Year ended May 31, 2020 | 0.81% |
Year ended May 31, 2019 | 0.81% |
1 | Calculated based upon average shares outstanding |
2 | Total return calculations do not include any sales charges. |
3 | Portfolio turnover rate is calculated by multiplying the affiliated Master Portfolio’s percentage of the Fund’s total investment in securities at the end of the period by the affiliated Master Portfolio’s portfolio turnover rate. |
(For a share outstanding throughout each period)
Year ended May 31 | |||||
Class C | 2023 | 2022 | 2021 | 2020 | 2019 |
Net asset value, beginning of period | $6.26 | $14.41 | $12.40 | $11.58 | $15.19 |
Net investment loss | (0.11 )1 | (0.20 )1 | (0.28 )1 | (0.21 )1 | (0.25 )1 |
Net realized and unrealized gains (losses) on investments | (0.07 ) | (2.44 ) | 6.44 | 1.79 | (0.18 ) |
Total from investment operations | (0.18 ) | (2.64 ) | 6.16 | 1.58 | (0.43 ) |
Distributions to shareholders from | |||||
Net realized gains | 0.00 | (5.51 ) | (4.15 ) | (0.76 ) | (3.18 ) |
Net asset value, end of period | $6.08 | $6.26 | $14.41 | $12.40 | $11.58 |
Total return2 | (2.88 )% | (29.71 )% | 52.19 % | 14.16 % | (1.55 )% |
Ratios to average net assets (annualized)* | |||||
Gross expenses | 2.14 % | 2.10 % | 2.10 % | 2.11 % | 2.10 % |
Net expenses | 2.03 % | 2.03 % | 2.03 % | 2.03 % | 2.04 % |
Net investment loss | (1.70 )% | (1.86 )% | (1.89 )% | (1.84 )% | (1.78 )% |
Supplemental data | |||||
Portfolio turnover rate3 | 70 % | 51 % | 48 % | 55 % | 71 % |
Net assets, end of period (000s omitted) | $956 | $1,758 | $2,338 | $1,599 | $1,761 |
* | Ratios include net expenses allocated from the affiliated Master Portfolio which were as follows: |
Year ended May 31, 2023 | 0.84% |
Year ended May 31, 2022 | 0.82% |
Year ended May 31, 2021 | 0.81% |
Year ended May 31, 2020 | 0.81% |
Year ended May 31, 2019 | 0.81% |
1 | Calculated based upon average shares outstanding |
2 | Total return calculations do not include any sales charges. |
3 | Portfolio turnover rate is calculated by multiplying the affiliated Master Portfolio’s percentage of the Fund’s total investment in securities at the end of the period by the affiliated Master Portfolio’s portfolio turnover rate. |
(For a share outstanding throughout each period)
Year ended May 31 | |||||
Class R6 | 2023 | 2022 | 2021 | 2020 | 20191 |
Net asset value, beginning of period | $10.79 | $20.64 | $16.34 | $14.86 | $18.70 |
Net investment loss | (0.06 )2 | (0.10 ) | (0.14 ) | (0.10 )2 | (0.07 )2 |
Net realized and unrealized gains (losses) on investments | (0.12 ) | (4.24 ) | 8.59 | 2.34 | (0.59 ) |
Total from investment operations | (0.18 ) | (4.34 ) | 8.45 | 2.24 | (0.66 ) |
Distributions to shareholders from | |||||
Net realized gains | 0.00 | (5.51 ) | (4.15 ) | (0.76 ) | (3.18 ) |
Net asset value, end of period | $10.61 | $10.79 | $20.64 | $16.34 | $14.86 |
Total return3 | (1.67 )% | (28.91 )% | 53.85 % | 15.51 % | (2.35 )% |
Ratios to average net assets (annualized)* | |||||
Gross expenses | 0.97 % | 0.94 % | 0.92 % | 0.93 % | 0.92 % |
Net expenses | 0.85 % | 0.85 % | 0.85 % | 0.85 % | 0.85 % |
Net investment loss | (0.52 )% | (0.68 )% | (0.68 )% | (0.67 )% | (0.51 )% |
Supplemental data | |||||
Portfolio turnover rate4 | 70 % | 51 % | 48 % | 55 % | 71 % |
Net assets, end of period (000s omitted) | $28,458 | $23,999 | $21,729 | $19,458 | $22 |
* | Ratios include net expenses allocated from the affiliated Master Portfolio which were as follows: |
Year ended May 31, 2023 | 0.84% |
Year ended May 31, 2022 | 0.83% |
Year ended May 31, 2021 | 0.81% |
Year ended May 31, 2020 | 0.81% |
Year ended May 31, 20191 | 0.81% |
1 | For the period from July 31, 2018 (commencement of class operations) to May 31, 2019 |
2 | Calculated based upon average shares outstanding |
3 | Returns for periods of less than one year are not annualized. |
4 | Portfolio turnover rate is calculated by multiplying the affiliated Master Portfolio’s percentage of the Fund’s total investment in securities at the end of the period by the affiliated Master Portfolio’s portfolio turnover rate. |
(For a share outstanding throughout each period)
Year ended May 31 | |||||
Administrator Class | 2023 | 2022 | 2021 | 2020 | 2019 |
Net asset value, beginning of period | $9.58 | $18.98 | $15.31 | $14.02 | $17.54 |
Net investment loss | (0.08 )1 | (0.17 )1 | (0.20 )1 | (0.14 )1 | (0.15 )1 |
Net realized and unrealized gains (losses) on investments | (0.11 ) | (3.72 ) | 8.02 | 2.19 | (0.19 ) |
Total from investment operations | (0.19 ) | (3.89 ) | 7.82 | 2.05 | (0.34 ) |
Distributions to shareholders from | |||||
Net realized gains | 0.00 | (5.51 ) | (4.15 ) | (0.76 ) | (3.18 ) |
Net asset value, end of period | $9.39 | $9.58 | $18.98 | $15.31 | $14.02 |
Total return | (1.98 )% | (29.09 )% | 53.31 % | 15.07 % | (0.75 )% |
Ratios to average net assets (annualized)* | |||||
Gross expenses | 1.32 % | 1.28 % | 1.27 % | 1.28 % | 1.27 % |
Net expenses | 1.20 % | 1.20 % | 1.20 % | 1.20 % | 1.20 % |
Net investment loss | (0.87 )% | (1.04 )% | (1.05 )% | (1.01 )% | (0.94 )% |
Supplemental data | |||||
Portfolio turnover rate2 | 70 % | 51 % | 48 % | 55 % | 71 % |
Net assets, end of period (000s omitted) | $15,418 | $17,676 | $28,730 | $21,250 | $23,549 |
* | Ratios include net expenses allocated from the affiliated Master Portfolio which were as follows: |
Year ended May 31, 2023 | 0.84% |
Year ended May 31, 2022 | 0.82% |
Year ended May 31, 2021 | 0.81% |
Year ended May 31, 2020 | 0.81% |
Year ended May 31, 2019 | 0.81% |
1 | Calculated based upon average shares outstanding |
2 | Portfolio turnover rate is calculated by multiplying the affiliated Master Portfolio’s percentage of the Fund’s total investment in securities at the end of the period by the affiliated Master Portfolio’s portfolio turnover rate. |
(For a share outstanding throughout each period)
Year ended May 31 | |||||
Institutional Class | 2023 | 2022 | 2021 | 2020 | 2019 |
Net asset value, beginning of period | $10.72 | $20.55 | $16.29 | $14.83 | $18.30 |
Net investment loss | (0.06 )1 | (0.14 )1 | (0.15 ) | (0.11 )1 | (0.13 ) |
Net realized and unrealized gains (losses) on investments | (0.12 ) | (4.18 ) | 8.56 | 2.33 | (0.16 ) |
Total from investment operations | (0.18 ) | (4.32 ) | 8.41 | 2.22 | (0.29 ) |
Distributions to shareholders from | |||||
Net realized gains | 0.00 | (5.51 ) | (4.15 ) | (0.76 ) | (3.18 ) |
Net asset value, end of period | $10.54 | $10.72 | $20.55 | $16.29 | $14.83 |
Total return | (1.68 )% | (28.95 )% | 53.75 % | 15.40 % | (0.42 )% |
Ratios to average net assets (annualized)* | |||||
Gross expenses | 1.07 % | 1.02 % | 1.02 % | 1.03 % | 1.02 % |
Net expenses | 0.90 % | 0.90 % | 0.90 % | 0.90 % | 0.90 % |
Net investment loss | (0.57 )% | (0.75 )% | (0.75 )% | (0.71 )% | (0.67 )% |
Supplemental data | |||||
Portfolio turnover rate2 | 70 % | 51 % | 48 % | 55 % | 71 % |
Net assets, end of period (000s omitted) | $123,809 | $156,936 | $648,569 | $471,512 | $578,073 |
* | Ratios include net expenses allocated from the affiliated Master Portfolio which were as follows: |
Year ended May 31, 2023 | 0.84% |
Year ended May 31, 2022 | 0.82% |
Year ended May 31, 2021 | 0.81% |
Year ended May 31, 2020 | 0.81% |
Year ended May 31, 2019 | 0.81% |
1 | Calculated based upon average shares outstanding |
2 | Portfolio turnover rate is calculated by multiplying the affiliated Master Portfolio’s percentage of the Fund’s total investment in securities at the end of the period by the affiliated Master Portfolio’s portfolio turnover rate. |
Gross unrealized gains | $69,238,000 |
Gross unrealized losses | 0 |
Net unrealized gains | $69,238,000 |
Paid-in capital | Total distributable earnings |
$(1,393,484 ) | $1,393,484 |
Affiliated Master Portfolio | Investment objective | Fair value of affiliated Master Portfolio |
Allspring Emerging Growth Portfolio | Seek long-term capital appreciation | $290,401,028 |
Average daily net assets | Management fee |
First $5 billion | 0.050 % |
Next $5 billion | 0.040 |
Over $10 billion | 0.030 |
Class-level administration fee | |
Class A | 0.21 % |
Class C | 0.21 |
Class R6 | 0.03 |
Administrator Class | 0.13 |
Institutional Class | 0.13 |
EXPENSE RATIO CAPS | |
Class A | 1.28 % |
Class C | 2.03 |
Class R6 | 0.85 |
Administrator Class | 1.20 |
Institutional Class | 0.90 |
Unrealized gains | Late-year ordinary losses deferred | Capital loss carryforward |
$69,238,000 | $(951,457 ) | $(16,623,151 ) |
Date | Value of securities issued | Cash | Realized gains (losses) | % of the Fund |
08-27-2021 | $348,404,897 | $1,817,058 | $176,872,468 | 39.45 % |
Allspring Funds Trust:

Shares | Value | |||||
Common stocks: 95.23% | ||||||
Consumer discretionary: 8.78% | ||||||
Automobile components: 0.76% | ||||||
Fox Factory Holding Corp.† | 27,718 | $2,464,684 | ||||
Diversified consumer services: 0.70% | ||||||
Bright Horizons Family Solutions, Inc.† | 26,600 | 2,276,960 | ||||
Hotels, restaurants & leisure: 4.36% | ||||||
First Watch Restaurant Group, Inc.† | 152,563 | 2,692,737 | ||||
Hilton Grand Vacations, Inc.† | 136,300 | 5,826,825 | ||||
Papa John’s International, Inc. | 21,665 | 1,518,933 | ||||
Wingstop, Inc. | 20,447 | 4,076,314 | ||||
14,114,809 | ||||||
Specialty retail: 1.90% | ||||||
Boot Barn Holdings, Inc.† | 74,450 | 5,034,309 | ||||
Leslie’s, Inc.† | 117,714 | 1,115,929 | ||||
6,150,238 | ||||||
Textiles, apparel & luxury goods: 1.06% | ||||||
Crocs, Inc.† | 30,675 | 3,444,189 | ||||
Consumer staples: 8.36% | ||||||
Beverages: 2.38% | ||||||
Celsius Holdings, Inc.† | 29,285 | 3,676,146 | ||||
Duckhorn Portfolio, Inc.† | 192,971 | 2,514,412 | ||||
MGP Ingredients, Inc. | 16,000 | 1,520,960 | ||||
7,711,518 | ||||||
Consumer staples distribution & retail : 1.69% | ||||||
Chefs’ Warehouse, Inc.† | 176,143 | 5,479,809 | ||||
Food products: 1.19% | ||||||
Simply Good Foods Co.† | 106,420 | 3,851,340 | ||||
Personal care products: 3.10% | ||||||
elf Beauty, Inc.† | 96,831 | 10,072,360 | ||||
Energy: 2.96% | ||||||
Energy equipment & services: 1.12% | ||||||
Helmerich & Payne, Inc. | 117,500 | 3,628,400 | ||||
Oil, gas & consumable fuels: 1.84% | ||||||
Matador Resources Co. | 68,700 | 3,020,739 | ||||
Viper Energy Partners LP | 113,700 | 2,931,186 | ||||
5,951,925 | ||||||
Financials: 7.87% | ||||||
Financial services: 4.02% | ||||||
Flywire Corp.† | 182,906 | 5,494,497 | ||||
Shares | Value | |||||
Financial services (continued) | ||||||
I3 Verticals, Inc. Class A† | 62,900 | $1,437,265 | ||||
Shift4 Payments, Inc. Class A† | 97,100 | 6,090,112 | ||||
13,021,874 | ||||||
Insurance: 3.85% | ||||||
Goosehead Insurance, Inc. Class A† | 64,100 | 3,537,038 | ||||
Kinsale Capital Group, Inc. | 29,593 | 8,966,087 | ||||
12,503,125 | ||||||
Health care: 22.97% | ||||||
Biotechnology: 3.68% | ||||||
Apellis Pharmaceuticals, Inc.† | 28,200 | 2,420,970 | ||||
Arcutis Biotherapeutics, Inc.† | 108,256 | 813,003 | ||||
Cytokinetics, Inc.† | 52,600 | 1,982,494 | ||||
Immunocore Holdings PLC ADR† | 27,100 | 1,495,378 | ||||
Madrigal Pharmaceuticals, Inc.† | 11,700 | 3,257,397 | ||||
Vericel Corp.† | 60,913 | 1,956,525 | ||||
11,925,767 | ||||||
Health care equipment & supplies: 13.40% | ||||||
Axonics, Inc.† | 45,750 | 2,213,842 | ||||
Establishment Labs Holdings, Inc.† | 34,100 | 2,200,132 | ||||
Inari Medical, Inc.† | 31,900 | 1,926,760 | ||||
Inspire Medical Systems, Inc.† | 24,565 | 7,185,017 | ||||
iRhythm Technologies, Inc.† | 31,300 | 3,576,651 | ||||
Outset Medical, Inc.† | 95,611 | 1,991,577 | ||||
PROCEPT BioRobotics Corp.† | 31,900 | 1,067,055 | ||||
Shockwave Medical, Inc.† | 11,301 | 3,108,792 | ||||
SI-BONE, Inc.† | 162,093 | 4,081,502 | ||||
Silk Road Medical, Inc.† | 10,577 | 319,320 | ||||
TransMedics Group, Inc.† | 163,942 | 11,912,026 | ||||
Treace Medical Concepts, Inc.† | 144,700 | 3,849,020 | ||||
43,431,694 | ||||||
Health care providers & services: 2.40% | ||||||
Castle Biosciences, Inc.† | 100,056 | 2,444,368 | ||||
HealthEquity, Inc.† | 25,200 | 1,380,960 | ||||
Hims & Hers Health, Inc.† | 333,200 | 2,978,808 | ||||
RadNet, Inc.† | 33,429 | 967,435 | ||||
7,771,571 | ||||||
Health care technology: 1.77% | ||||||
Certara, Inc.† | 67,700 | 1,406,806 | ||||
Evolent Health, Inc. Class A† | 102,515 | 2,987,287 | ||||
Phreesia, Inc.† | 45,300 | 1,359,906 | ||||
5,753,999 | ||||||
Shares | Value | |||||
Pharmaceuticals: 1.72% | ||||||
Amylyx Pharmaceuticals, Inc.† | 52,600 | $1,298,694 | ||||
Revance Therapeutics, Inc.† | 139,519 | 4,263,701 | ||||
5,562,395 | ||||||
Industrials: 18.21% | ||||||
Aerospace & defense: 1.40% | ||||||
Hexcel Corp. | 65,700 | 4,532,643 | ||||
Building products: 1.82% | ||||||
AZEK Co., Inc.† | 146,269 | 3,400,754 | ||||
Zurn Elkay Water Solutions Corp. Class C | 111,484 | 2,509,505 | ||||
5,910,259 | ||||||
Commercial services & supplies: 2.49% | ||||||
Casella Waste Systems, Inc. Class A† | 89,641 | 8,082,033 | ||||
Construction & engineering: 0.50% | ||||||
Construction Partners, Inc. Class A† | 58,285 | 1,612,746 | ||||
Electrical equipment: 2.31% | ||||||
Array Technologies, Inc.† | 16,100 | 356,937 | ||||
NEXTracker, Inc. Class A† | 18,056 | 690,642 | ||||
Shoals Technologies Group, Inc. Class A† | 274,662 | 6,451,810 | ||||
7,499,389 | ||||||
Ground transportation: 1.72% | ||||||
Marten Transport Ltd. | 118,000 | 2,495,700 | ||||
Saia, Inc.† | 10,911 | 3,100,470 | ||||
5,596,170 | ||||||
Machinery: 2.39% | ||||||
SPX Technologies, Inc.† | 88,208 | 6,735,563 | ||||
Xylem, Inc. | 10,012 | 1,003,202 | ||||
7,738,765 | ||||||
Professional services: 2.32% | ||||||
ASGN, Inc.† | 39,801 | 2,604,180 | ||||
Paycor HCM, Inc.† | 223,295 | 4,910,257 | ||||
7,514,437 | ||||||
Trading companies & distributors: 3.26% | ||||||
Applied Industrial Technologies, Inc. | 50,500 | 6,209,480 | ||||
SiteOne Landscape Supply, Inc.† | 31,527 | 4,347,258 | ||||
10,556,738 | ||||||
Information technology: 26.08% | ||||||
Communications equipment: 2.40% | ||||||
Calix, Inc.† | 117,000 | 5,453,370 | ||||
Harmonic, Inc.† | 132,900 | 2,340,369 | ||||
7,793,739 | ||||||
Shares | Value | |||||
Electronic equipment, instruments & components: 3.04% | ||||||
Novanta, Inc.† | 59,405 | $9,837,468 | ||||
IT services: 2.79% | ||||||
DigitalOcean Holdings, Inc.† | 159,971 | 6,262,865 | ||||
Endava PLC ADR† | 57,214 | 2,792,043 | ||||
9,054,908 | ||||||
Semiconductors & semiconductor equipment: 7.41% | ||||||
Allegro MicroSystems, Inc.† | 103,012 | 4,051,462 | ||||
Diodes, Inc.† | 57,886 | 5,200,478 | ||||
Impinj, Inc.† | 53,700 | 5,495,658 | ||||
Semtech Corp.† | 78,056 | 1,696,937 | ||||
Silicon Laboratories, Inc.† | 25,874 | 3,639,696 | ||||
SiTime Corp.† | 39,700 | 3,937,049 | ||||
24,021,280 | ||||||
Software: 10.44% | ||||||
Clearwater Analytics Holdings, Inc. Class A† | 153,293 | 2,471,083 | ||||
CyberArk Software Ltd.† | 11,615 | 1,797,189 | ||||
EngageSmart, Inc.† | 242,281 | 4,598,493 | ||||
Five9, Inc.† | 80,400 | 5,315,244 | ||||
Jamf Holding Corp.† | 50,490 | 928,006 | ||||
PowerSchool Holdings, Inc. Class A† | 87,582 | 1,658,803 | ||||
Sprout Social, Inc. Class A† | 98,428 | 4,262,917 | ||||
SPS Commerce, Inc.† | 82,096 | 12,790,557 | ||||
33,822,292 | ||||||
Total common stocks (Cost $244,350,208) | 308,689,524 | |||||
Investment companies: 1.25% | ||||||
Exchange-traded funds: 1.25% | ||||||
iShares Russell 2000 Growth ETF | 18,011 | 4,044,911 | ||||
Total investment companies (Cost $4,059,866) | 4,044,911 | |||||
Yield | ||||||
Short-term investments: 3.02% | ||||||
Investment companies: 3.02% | ||||||
Allspring Government Money Market Fund Select Class♠∞ | 5.01 % | 9,781,514 | 9,781,514 | |||
Total short-term investments (Cost $9,781,514) | 9,781,514 | |||||
Total investments in securities (Cost $258,191,588) | 99.50 % | 322,515,949 | ||||
Other assets and liabilities, net | 0.50 | 1,623,886 | ||||
Total net assets | 100.00 % | $324,139,835 | ||||
† | Non-income-earning security |
♠ | The issuer of the security is an affiliated person of the Portfolio as defined in the Investment Company Act of 1940. |
∞ | The rate represents the 7-day annualized yield at period end. |
Abbreviations: | |
ADR | American depositary receipt |
Value, beginning of period | Purchases | Sales proceeds | Net realized gains (losses) | Net change in unrealized gains (losses) | Value, end of period | Shares, end of period | Income from affiliated securities | |
Short-term investments | ||||||||
Allspring Government Money Market Fund Select Class | $6,288,467 | $116,992,429 | $(113,499,382 ) | $0 | $0 | $9,781,514 | 9,781,514 | $228,871 |
Investments in affiliates no longer held at end of period | ||||||||
Securities Lending Cash Investments LLC | 3,803,495 | 57,536,680 | (61,340,357 ) | 182 | 0 | 0 | 0 | 89,402 1 |
$182 | $0 | $9,781,514 | $318,273 |
1 | Amount shown represents income before fees and rebates. |
Assets | |
Investments in unaffiliated securities, at value (cost $248,410,074) | $312,734,435 |
Investments in affiliated securities, at value (cost $9,781,514) | 9,781,514 |
Receivable for investments sold | 4,081,943 |
Receivable for dividends | 119,692 |
Prepaid expenses and other assets | 9,425 |
Total assets | 326,727,009 |
Liabilities | |
Payable for investments purchased | 2,325,715 |
Advisory fee payable | 221,403 |
Trustees’ fees and expenses payable | 505 |
Accrued expenses and other liabilities | 39,551 |
Total liabilities | 2,587,174 |
Total net assets | $324,139,835 |
Investment income | |
Dividends | $807,272 |
Income from affiliated securities | 228,871 |
Securities lending income (including from affiliate), net | 104,981 |
Interest | 38 |
Total investment income | 1,141,162 |
Expenses | |
Advisory fee | 2,803,445 |
Custody and accounting fees | 57,825 |
Professional fees | 50,291 |
Interest holder report expenses | 10,561 |
Trustees’ fees and expenses | 24,280 |
Other fees and expenses | 8,846 |
Total expenses | 2,955,248 |
Less: Fee waivers and/or expense reimbursements | (11,837 ) |
Net expenses | 2,943,411 |
Net investment loss | (1,802,249 ) |
Realized and unrealized gains (losses) on investments | |
Net realized gains on | |
Unaffiliated securities | 5,257,703 |
Affiliated securities | 182 |
Net realized gains on investments | 5,257,885 |
Net change in unrealized gains (losses) on investments | (9,158,116 ) |
Net realized and unrealized gains (losses) on investments | (3,900,231 ) |
Net decrease in net assets resulting from operations | $(5,702,480 ) |
Year ended May 31, 2023 | Year ended May 31, 2022 | |||
Operations | ||||
Net investment loss | $(1,802,249 ) | $(4,149,201 ) | ||
Net realized gains on investments | 5,257,885 | 254,745,270 | ||
Net change in unrealized gains (losses) on investments | (9,158,116 ) | (361,893,191 ) | ||
Net decrease in net assets resulting from operations | (5,702,480 ) | (111,297,122 ) | ||
Capital transactions | ||||
Transactions in investors’ beneficial interests | ||||
Contributions | 16,642,379 | 75,769,980 | ||
Withdrawals | (58,772,131 ) | (550,022,954 ) | ||
Net decrease in net assets resulting from capital transactions | (42,129,752 ) | (474,252,974 ) | ||
Total decrease in net assets | (47,832,232 ) | (585,550,096 ) | ||
Net assets | ||||
Beginning of period | 371,972,067 | 957,522,163 | ||
End of period | $324,139,835 | $371,972,067 | ||
Year ended May 31 | |||||
2023 | 2022 | 2021 | 2020 | 2019 | |
Total return | (1.62 )% | (28.85 )% | 53.94 % | 15.49 % | (0.28 )% |
Ratios to average net assets (annualized) | |||||
Gross expenses | 0.84 % | 0.82 % | 0.81 % | 0.81 % | 0.81 % |
Net expenses1 | 0.84 % | 0.82 % | 0.81 % | 0.81 % | 0.81 % |
Net investment loss | (0.51 )% | (0.67 )% | (0.66 )% | (0.62 )% | (0.57 )% |
Supplemental data | |||||
Portfolio turnover rate | 70 % | 51 % | 48 % | 55 % | 71 % |
1 | Net expense ratios reflect voluntary waivers, if any. |
Gross unrealized gains | $84,812,884 |
Gross unrealized losses | (21,296,175 ) |
Net unrealized gains | $63,516,709 |
Quoted prices (Level 1) | Other significant observable inputs (Level 2) | Significant unobservable inputs (Level 3) | Total | |
Assets | ||||
Investments in: | ||||
Common stocks | ||||
Consumer discretionary | $28,450,880 | $0 | $0 | $28,450,880 |
Consumer staples | 27,115,027 | 0 | 0 | 27,115,027 |
Energy | 9,580,325 | 0 | 0 | 9,580,325 |
Financials | 25,524,999 | 0 | 0 | 25,524,999 |
Health care | 74,445,426 | 0 | 0 | 74,445,426 |
Industrials | 59,043,180 | 0 | 0 | 59,043,180 |
Information technology | 84,529,687 | 0 | 0 | 84,529,687 |
Investment companies | 4,044,911 | 0 | 0 | 4,044,911 |
Short-term investments | ||||
Investment companies | 9,781,514 | 0 | 0 | 9,781,514 |
Total assets | $322,515,949 | $0 | $0 | $322,515,949 |
Average daily net assets | Advisory fee |
First $500 million | 0.800 % |
Next $500 million | 0.775 |
Next $1 billion | 0.750 |
Next $1 billion | 0.725 |
Next $1 billion | 0.700 |
Over $4 billion | 0.680 |
Allspring Master Trust:
Name and year of birth | Position held and length of service* | Principal occupations during past five years or longer | Current other public company or investment company directorships |
William R. Ebsworth (Born 1957) | Trustee, since 2015 | Retired. From 1984 to 2013, equities analyst, portfolio manager, research director and chief investment officer at Fidelity Management and Research Company in Boston, Tokyo, and Hong Kong, and retired in 2013 as Chief Investment Officer of Fidelity Strategic Advisers, Inc. where he led a team of investment professionals managing client assets. Prior thereto, Board member of Hong Kong Securities Clearing Co., Hong Kong Options Clearing Corp., the Thailand International Fund, Ltd., Fidelity Investments Life Insurance Company, and Empire Fidelity Investments Life Insurance Company. Audit Committee Chair and Investment Committee Chair of the Vincent Memorial Hospital Foundation (non-profit organization). Mr. Ebsworth is a CFA charterholder. | N/A |
Jane A. Freeman (Born 1953) | Trustee, since 2015; Chair Liaison, since 2018 | Retired. From 2012 to 2014 and 1999 to 2008, Chief Financial Officer of Scientific Learning Corporation. From 2008 to 2012, Ms. Freeman provided consulting services related to strategic business projects. Prior to 1999, Portfolio Manager at Rockefeller & Co. and Scudder, Stevens & Clark. Board member of the Harding Loevner Funds from 1996 to 2014, serving as both Lead Independent Director and chair of the Audit Committee. Board member of the Russell Exchange Traded Funds Trust from 2011 to 2012 and the chair of the Audit Committee. Ms. Freeman is also an inactive Chartered Financial Analyst. | N/A |
Isaiah Harris, Jr. (Born 1952) | Trustee, since 2009; Audit Committee Chair, since 2019 | Retired. Member of the Advisory Board of CEF of East Central Florida. Chairman of the Board of CIGNA Corporation from 2009 to 2021, and Director from 2005 to 2008. From 2003 to 2011, Director of Deluxe Corporation. Prior thereto, President and CEO of BellSouth Advertising and Publishing Corp. from 2005 to 2007, President and CEO of BellSouth Enterprises from 2004 to 2005 and President of BellSouth Consumer Services from 2000 to 2003. Emeritus member of the Iowa State University Foundation Board of Governors. Emeritus Member of the Advisory board of Iowa State University School of Business. Advisory Board Member, Palm Harbor Academy (private school). Advisory Board Member, Fellowship of Christian Athletes. Mr. Harris is a certified public accountant (inactive status). | N/A |
David F. Larcker (Born 1950) | Trustee, since 2009 | Distinguished Visiting Fellow at the Hoover Institution since 2022. James Irvin Miller Professor of Accounting at the Graduate School of Business (Emeritus), Stanford University, Director of the Corporate Governance Research Initiative and Senior Faculty of The Rock Center for Corporate Governance since 2006. From 2005 to 2008, Professor of Accounting at the Graduate School of Business, Stanford University. Prior thereto, Ernst & Young Professor of Accounting at The Wharton School, University of Pennsylvania from 1985 to 2005. | N/A |
Olivia S. Mitchell (Born 1953) | Trustee, since 2006; Nominating and Governance Committee Chair, since 2018 | International Foundation of Employee Benefit Plans Professor since 1993, Wharton School of the University of Pennsylvania. Director of Wharton’s Pension Research Council and Boettner Center on Pensions & Retirement Research, and Research Associate at the National Bureau of Economic Research. Previously taught at Cornell University from 1978 to 1993. | N/A |
Timothy J. Penny (Born 1951) | Trustee, since 1996; Chair, since 2018 | President and Chief Executive Officer of Southern Minnesota Initiative Foundation, a non-profit organization, since 2007. Vice Chair of the Economic Club of Minnesota, since 2007. Co-Chair of the Committee for a Responsible Federal Budget, since 1995. Member of the Board of Trustees of NorthStar Education Finance, Inc., a non-profit organization, from 2007-2022. Senior Fellow of the University of Minnesota Humphrey Institute from 1995 to 2017. | N/A |
Name and year of birth | Position held and length of service* | Principal occupations during past five years or longer | Current other public company or investment company directorships |
James G. Polisson (Born 1959) | Trustee, since 2018 | Retired. Chief Marketing Officer, Source (ETF) UK Services, Ltd, from 2015 to 2017. From 2012 to 2015, Principal of The Polisson Group, LLC, a management consulting, corporate advisory and principal investing company. Chief Executive Officer and Managing Director at Russell Investments, Global Exchange Traded Funds from 2010 to 2012. Managing Director of Barclays Global Investors from 1998 to 2010 and Global Chief Marketing Officer for iShares and Barclays Global Investors from 2000 to 2010. Trustee of the San Francisco Mechanics’ Institute, a non- profit organization, from 2013 to 2015. Board member of the Russell Exchange Traded Fund Trust from 2011 to 2012. Director of Barclays Global Investors Holdings Deutschland GmbH from 2006 to 2009. Mr. Polisson is an attorney and has a retired status with the Massachusetts and District of Columbia Bar Associations. | N/A |
Pamela Wheelock (Born 1959) | Trustee, since January 2020; previously Trustee from January 2018 to July 2019 | Retired. Executive and Senior Financial leadership positions in the public, private and nonprofit sectors. Interim President and CEO, McKnight Foundation, 2020. Interim Commissioner, Minnesota Department of Human Services, 2019. Chief Operating Officer, Twin Cities Habitat for Humanity, 2017-2019. Vice President for University Services, University of Minnesota, 2012- 2016. Interim President and CEO, Blue Cross and Blue Shield of Minnesota, 2011-2012. Executive Vice-President and Chief Financial Officer, Minnesota Wild, 2002-2008. Commissioner, Minnesota Department of Finance, 1999-2002. Chair of the Board of Directors of Destination Medical Center Corporation. Board member of the Minnesota Wild Foundation. | N/A |
* | Length of service dates reflect the Trustee’s commencement of service with the Trust’s predecessor entities, where applicable. |
Name and year of birth | Position held and length of service | Principal occupations during past five years or longer |
Andrew Owen (Born 1960) | President, since 2017 | President and Chief Executive Officer of Allspring Funds Management, LLC since 2017 and Head of Global Fund Governance of Allspring Global Investments since 2022. Prior thereto, co-president of Galliard Capital Management, LLC, an affiliate of Allspring Funds Management, LLC, from 2019 to 2022 and Head of Affiliated Managers, Allspring Global Investments, from 2014 to 2019 and Executive Vice President responsible for marketing, investments and product development for Allspring Funds Management, LLC, from 2009 to 2014. |
Jeremy DePalma (Born 1974) | Treasurer, since 2012 (for certain funds in the Fund Complex); since 2021 (for the remaining funds in the Complex) | Senior Vice President of Allspring Funds Management, LLC since 2009. Senior Vice President of Evergreen Investment Management Company, LLC from 2008 to 2010 and head of the Fund Reporting and Control Team within Fund Administration from 2005 to 2010. |
Christopher Baker (Born 1976) | Chief Compliance Officer, since 2022 | Global Chief Compliance Officer for Allspring Global Investments since 2022. Prior thereto, Chief Compliance Officer for State Street Global Advisors from 2018 to 2021. Senior Compliance Officer for the State Street divisions of Alternative Investment Solutions, Sector Solutions, and Global Marketing from 2015 to 2018. From 2010 to 2015 Vice President, Global Head of Investment and Marketing Compliance for State Street Global Advisors. |
Matthew Prasse (Born 1983) | Chief Legal Officer, since 2022; Secretary, since 2021 | Senior Counsel of the Allspring Legal Department since 2021. Senior Counsel of the Wells Fargo Legal Department from 2018 to 2021. Previously, Counsel for Barings LLC from 2015 to 2018. Prior to joining Barings, Associate at Morgan, Lewis & Bockius LLP from 2008 to 2015. |

P.O. Box 219967
Kansas City, MO 64121-9967

AR3326 05-23
Investment objective | The Portfolio seeks long-term capital appreciation. |
Manager | Allspring Funds Management, LLC |
Subadviser | Allspring Global Investments, LLC |
Portfolio managers | Ryan Brown, CFA, Harindra de Silva, Ph.D., CFA |
Ten largest holdings (%) as of May 31, 20231 | |
Berkshire Hathaway, Inc. Class B | 4.90 |
Bank of America Corp. | 3.04 |
JPMorgan Chase & Co. | 2.80 |
Linde PLC | 2.70 |
Prologis, Inc. | 2.64 |
Southern Co. | 2.33 |
Arthur J Gallagher & Co. | 2.13 |
Realty Income Corp. | 2.08 |
Regeneron Pharmaceuticals, Inc. | 2.04 |
T-Mobile U.S., Inc. | 2.03 |
1 | Figures represent the percentage of the Portfolio’s net assets. Holdings are subject to change and may have changed since the date specified. |
Sector allocation as of May 31, 20231 |

1 | Figures represent the percentage of the Portfolio’s long-term investments. Allocations are subject to change and may have changed since the date specified. |
CFA® and Chartered Financial Analyst® are trademarks owned by CFA Institute. |
Shares | Value | |||||
Common stocks: 96.42% | ||||||
Communication services: 7.74% | ||||||
Diversified telecommunication services: 0.85% | ||||||
AT&T, Inc. | 47,622 | $749,094 | ||||
Verizon Communications, Inc. | 21,350 | 760,701 | ||||
1,509,795 | ||||||
Entertainment: 3.38% | ||||||
Netflix, Inc.† | 6,712 | 2,652,784 | ||||
Spotify Technology SA† | 2,848 | 424,067 | ||||
Walt Disney Co.† | 32,963 | 2,899,425 | ||||
5,976,276 | ||||||
Interactive media & services: 1.48% | ||||||
Meta Platforms, Inc. Class A† | 9,861 | 2,610,404 | ||||
Wireless telecommunication services: 2.03% | ||||||
T-Mobile U.S., Inc.† | 26,171 | 3,591,970 | ||||
Consumer discretionary: 4.42% | ||||||
Automobile components: 1.22% | ||||||
Adient PLC† | 54,042 | 1,820,675 | ||||
Visteon Corp.† | 2,518 | 336,354 | ||||
2,157,029 | ||||||
Hotels, restaurants & leisure: 1.71% | ||||||
McDonald’s Corp. | 10,621 | 3,028,153 | ||||
Household durables: 0.55% | ||||||
M/I Homes, Inc.† | 13,792 | 974,681 | ||||
Specialty retail: 0.94% | ||||||
Best Buy Co., Inc. | 6,373 | 463,126 | ||||
Home Depot, Inc. | 2,092 | 592,977 | ||||
O’Reilly Automotive, Inc.† | 666 | 601,605 | ||||
1,657,708 | ||||||
Consumer staples: 6.25% | ||||||
Beverages: 2.57% | ||||||
Coca-Cola Co. | 8,565 | 510,988 | ||||
Constellation Brands, Inc. Class A | 9,449 | 2,295,824 | ||||
PepsiCo, Inc. | 9,495 | 1,731,413 | ||||
4,538,225 | ||||||
Consumer staples distribution & retail: 0.42% | ||||||
Dollar General Corp. | 2,153 | 432,947 | ||||
Kroger Co. | 2,622 | 118,855 | ||||
Target Corp. | 1,408 | 184,349 | ||||
736,151 | ||||||
Shares | Value | |||||
Food products: 2.85% | ||||||
Cal-Maine Foods, Inc. | 21,467 | $1,020,756 | ||||
Kraft Heinz Co. | 82,021 | 3,134,843 | ||||
Tyson Foods, Inc. Class A | 17,575 | 889,998 | ||||
5,045,597 | ||||||
Household products: 0.19% | ||||||
Procter & Gamble Co. | 2,391 | 340,718 | ||||
Personal care products: 0.01% | ||||||
Herbalife Ltd.† | 1,610 | 19,062 | ||||
Tobacco: 0.21% | ||||||
Philip Morris International, Inc. | 4,142 | 372,821 | ||||
Energy: 6.83% | ||||||
Oil, gas & consumable fuels: 6.83% | ||||||
Chevron Corp. | 21,071 | 3,173,714 | ||||
ConocoPhillips | 4,438 | 440,693 | ||||
Exxon Mobil Corp. | 17,108 | 1,748,095 | ||||
Kinder Morgan, Inc. | 18,841 | 303,529 | ||||
Kosmos Energy Ltd.† | 11,254 | 67,074 | ||||
Occidental Petroleum Corp. | 5,984 | 345,037 | ||||
PBF Energy, Inc. Class A | 55,931 | 2,058,820 | ||||
Phillips 66 | 2,642 | 242,034 | ||||
Pioneer Natural Resources Co. | 2,564 | 511,364 | ||||
Valero Energy Corp. | 29,771 | 3,186,688 | ||||
12,077,048 | ||||||
Financials: 19.40% | ||||||
Banks: 8.06% | ||||||
Bank of America Corp. | 193,535 | 5,378,338 | ||||
Bank of NT Butterfield & Son Ltd. | 12,114 | 303,698 | ||||
Citigroup, Inc. | 17,623 | 781,051 | ||||
JPMorgan Chase & Co. | 36,485 | 4,951,379 | ||||
PNC Financial Services Group, Inc. | 6,957 | 805,829 | ||||
SouthState Corp. | 595 | 37,200 | ||||
U.S. Bancorp | 66,753 | 1,995,915 | ||||
14,253,410 | ||||||
Capital markets: 2.88% | ||||||
BlackRock, Inc. | 1,979 | 1,301,292 | ||||
CME Group, Inc. | 13,823 | 2,470,861 | ||||
Goldman Sachs Group, Inc. | 661 | 214,098 | ||||
Intercontinental Exchange, Inc. | 4,540 | 481,013 | ||||
Morgan Stanley | 7,762 | 634,621 | ||||
5,101,885 | ||||||
Financial services: 6.19% | ||||||
Berkshire Hathaway, Inc. Class B† | 26,976 | 8,661,454 | ||||
Shares | Value | |||||
Financial services (continued) | ||||||
Block, Inc.† | 1,880 | $113,533 | ||||
PayPal Holdings, Inc.† | 35,049 | 2,172,688 | ||||
10,947,675 | ||||||
Insurance: 2.27% | ||||||
Aflac, Inc. | 2,509 | 161,103 | ||||
Arthur J Gallagher & Co. | 18,759 | 3,757,990 | ||||
Brown & Brown, Inc. | 1,163 | 72,490 | ||||
Willis Towers Watson PLC | 84 | 18,383 | ||||
4,009,966 | ||||||
Health care: 15.47% | ||||||
Biotechnology: 3.46% | ||||||
Amicus Therapeutics, Inc.† | 12,800 | 144,128 | ||||
Catalyst Pharmaceuticals, Inc.† | 16,093 | 185,874 | ||||
Moderna, Inc.† | 15,562 | 1,987,423 | ||||
Regeneron Pharmaceuticals, Inc.† | 4,904 | 3,607,186 | ||||
TG Therapeutics, Inc.† | 7,311 | 194,692 | ||||
6,119,303 | ||||||
Health care equipment & supplies: 2.03% | ||||||
Boston Scientific Corp.† | 10,035 | 516,602 | ||||
Hologic, Inc.† | 546 | 43,074 | ||||
Intuitive Surgical, Inc.† | 7,093 | 2,183,509 | ||||
Medtronic PLC | 4,180 | 345,937 | ||||
Stryker Corp. | 909 | 250,502 | ||||
TransMedics Group, Inc.† | 3,496 | 254,019 | ||||
3,593,643 | ||||||
Health care providers & services: 4.13% | ||||||
Cigna Group | 3,345 | 827,586 | ||||
CVS Health Corp. | 15,390 | 1,046,982 | ||||
Elevance Health, Inc. | 2,950 | 1,321,069 | ||||
Humana, Inc. | 6,299 | 3,161,279 | ||||
Progyny, Inc.† | 16,787 | 625,316 | ||||
Surgery Partners, Inc.† | 2,526 | 94,674 | ||||
UnitedHealth Group, Inc. | 473 | 230,465 | ||||
7,307,371 | ||||||
Life sciences tools & services: 2.29% | ||||||
Bruker Corp. | 4,129 | 285,314 | ||||
Danaher Corp. | 1,699 | 390,124 | ||||
Medpace Holdings, Inc.† | 3,676 | 760,822 | ||||
Syneos Health, Inc.† | 62,777 | 2,611,523 | ||||
4,047,783 | ||||||
Pharmaceuticals: 3.56% | ||||||
Bristol-Myers Squibb Co. | 16,352 | 1,053,723 | ||||
Elanco Animal Health, Inc.† | 45,514 | 370,939 | ||||
Shares | Value | |||||
Pharmaceuticals (continued) | ||||||
Johnson & Johnson | 18,172 | $2,817,750 | ||||
Pfizer, Inc. | 34,473 | 1,310,664 | ||||
Revance Therapeutics, Inc.† | 12,977 | 396,577 | ||||
Supernus Pharmaceuticals, Inc.† | 10,697 | 354,499 | ||||
6,304,152 | ||||||
Industrials: 9.54% | ||||||
Aerospace & defense: 1.49% | ||||||
General Dynamics Corp. | 3,221 | 657,664 | ||||
Northrop Grumman Corp. | 2,067 | 900,158 | ||||
Raytheon Technologies Corp. | 11,726 | 1,080,433 | ||||
2,638,255 | ||||||
Air freight & logistics: 2.25% | ||||||
FedEx Corp. | 2,066 | 450,347 | ||||
United Parcel Service, Inc. Class B | 21,084 | 3,521,028 | ||||
3,971,375 | ||||||
Building products: 0.08% | ||||||
Carrier Global Corp. | 3,599 | 147,199 | ||||
Commercial services & supplies: 0.51% | ||||||
Waste Management, Inc. | 5,602 | 907,076 | ||||
Construction & engineering: 0.44% | ||||||
Quanta Services, Inc. | 4,380 | 777,800 | ||||
Ground transportation: 2.19% | ||||||
CSX Corp. | 42,242 | 1,295,562 | ||||
Union Pacific Corp. | 6,636 | 1,277,563 | ||||
XPO, Inc.† | 27,699 | 1,299,914 | ||||
3,873,039 | ||||||
Industrial conglomerates: 0.07% | ||||||
General Electric Co. | 1,209 | 122,750 | ||||
Machinery: 0.81% | ||||||
Deere & Co. | 4,000 | 1,383,920 | ||||
Kennametal, Inc. | 2,082 | 51,883 | ||||
1,435,803 | ||||||
Professional services: 1.70% | ||||||
Automatic Data Processing, Inc. | 14,342 | 2,997,335 | ||||
Information technology: 9.84% | ||||||
Communications equipment: 0.14% | ||||||
Motorola Solutions, Inc. | 863 | 243,297 | ||||
IT services: 2.79% | ||||||
DXC Technology Co.† | 59,796 | 1,496,694 | ||||
Shares | Value | |||||
IT services (continued) | ||||||
EPAM Systems, Inc.† | 9,242 | $2,371,682 | ||||
International Business Machines Corp. | 8,316 | 1,069,354 | ||||
4,937,730 | ||||||
Semiconductors & semiconductor equipment: 2.91% | ||||||
Amkor Technology, Inc. | 61,560 | 1,525,457 | ||||
Analog Devices, Inc. | 3,131 | 556,347 | ||||
Diodes, Inc.† | 5,131 | 460,969 | ||||
Micron Technology, Inc. | 24,317 | 1,658,420 | ||||
QUALCOMM, Inc. | 4,545 | 515,449 | ||||
Skyworks Solutions, Inc. | 4,138 | 428,324 | ||||
5,144,966 | ||||||
Software: 3.71% | ||||||
Fair Isaac Corp.† | 510 | 401,712 | ||||
InterDigital, Inc. | 4,323 | 358,982 | ||||
LiveRamp Holdings, Inc.† | 24,526 | 596,963 | ||||
Manhattan Associates, Inc.† | 3,596 | 652,386 | ||||
NCR Corp.† | 15,183 | 359,837 | ||||
Roper Technologies, Inc. | 5,071 | 2,303,349 | ||||
Synopsys, Inc.† | 4,178 | 1,900,823 | ||||
6,574,052 | ||||||
Technology hardware, storage & peripherals: 0.29% | ||||||
Western Digital Corp.† | 13,181 | 510,500 | ||||
Materials: 5.27% | ||||||
Chemicals: 3.59% | ||||||
Air Products & Chemicals, Inc. | 5,379 | 1,447,704 | ||||
Balchem Corp. | 968 | 119,674 | ||||
Linde PLC | 13,514 | 4,779,361 | ||||
6,346,739 | ||||||
Containers & packaging: 0.29% | ||||||
Berry Global Group, Inc. | 9,026 | 516,377 | ||||
Metals & mining: 1.39% | ||||||
Freeport-McMoRan, Inc. | 71,719 | 2,462,831 | ||||
Real estate: 5.57% | ||||||
Health care REITs: 0.10% | ||||||
Healthcare Realty Trust, Inc. | 9,530 | 177,353 | ||||
Industrial REITs : 2.64% | ||||||
Prologis, Inc. | 37,517 | 4,672,742 | ||||
Residential REITs : 0.52% | ||||||
Apartment Income REIT Corp. | 26,547 | 920,916 | ||||
Shares | Value | |||||
Retail REITs : 2.20% | ||||||
Agree Realty Corp. | 3,136 | $202,241 | ||||
Realty Income Corp. | 61,924 | 3,680,762 | ||||
3,883,003 | ||||||
Specialized REITs : 0.11% | ||||||
Weyerhaeuser Co. | 6,737 | 193,083 | ||||
Utilities: 6.09% | ||||||
Electric utilities: 5.27% | ||||||
Duke Energy Corp. | 26,241 | 2,343,059 | ||||
Exelon Corp. | 12,283 | 487,021 | ||||
NextEra Energy, Inc. | 31,281 | 2,297,902 | ||||
NRG Energy, Inc. | 2,107 | 71,196 | ||||
Southern Co. | 59,050 | 4,118,737 | ||||
9,317,915 | ||||||
Gas utilities: 0.57% | ||||||
Atmos Energy Corp. | 8,805 | 1,015,041 | ||||
Multi-utilities: 0.25% | ||||||
Public Service Enterprise Group, Inc. | 7,507 | 448,543 | ||||
Total common stocks (Cost $172,505,266) | 170,556,546 | |||||
Yield | ||||||
Short-term investments: 3.13% | ||||||
Investment companies: 3.13% | ||||||
Allspring Government Money Market Fund Select Class♠∞ | 5.01 % | 5,543,508 | 5,543,508 | |||
Total short-term investments (Cost $5,543,508) | 5,543,508 | |||||
Total investments in securities (Cost $178,048,774) | 99.55 % | 176,100,054 | ||||
Other assets and liabilities, net | 0.45 | 789,475 | ||||
Total net assets | 100.00 % | $176,889,529 | ||||
† | Non-income-earning security |
♠ | The issuer of the security is an affiliated person of the Portfolio as defined in the Investment Company Act of 1940. |
∞ | The rate represents the 7-day annualized yield at period end. |
Abbreviations: | |
REIT | Real estate investment trust |
Value, beginning of period | Purchases | Sales proceeds | Net realized gains (losses) | Net change in unrealized gains (losses) | Value, end of period | Shares, end of period | Income from affiliated securities | |
Short-term investments | ||||||||
Allspring Government Money Market Fund Select Class | $4,485,592 | $35,175,984 | $(34,118,068 ) | $0 | $0 | $5,543,508 | 5,543,508 | $135,393 |
Investments in affiliates no longer held at end of period | ||||||||
Securities Lending Cash Investments LLC | 0 | 1,089,725 | (1,089,725 ) | 0 | 0 | 0 | 0 | 860 1 |
$0 | $0 | $5,543,508 | $136,253 |
1 | Amount shown represents income before fees and rebates. |
Description | Number of contracts | Expiration date | Notional cost | Notional value | Unrealized gains | Unrealized losses |
Long | ||||||
E-Mini S&P 500 Index | 28 | 6-16-2023 | $5,670,584 | $5,866,700 | $196,116 | $0 |
Assets | |
Investments in unaffiliated securities, at value (cost $172,505,266) | $170,556,546 |
Investments in affiliated securities, at value (cost $5,543,508) | 5,543,508 |
Cash at broker segregated for futures contracts | 535,000 |
Receivable for dividends | 361,609 |
Prepaid expenses and other assets | 3,109 |
Total assets | 176,999,772 |
Liabilities | |
Advisory fee payable | 49,371 |
Payable for daily variation margin on open futures contracts | 34,300 |
Custody and accounting fees payable | 11,800 |
Interest holder report expenses payable | 7,444 |
Professional fees payable | 6,792 |
Trustees’ fees and expenses payable | 504 |
Accrued expenses and other liabilities | 32 |
Total liabilities | 110,243 |
Total net assets | $176,889,529 |
Investment income | |
Dividends (net of foreign withholdings taxes of $10,113) | $4,395,731 |
Income from affiliated securities | 135,899 |
Interest | 16,145 |
Total investment income | 4,547,775 |
Expenses | |
Advisory fee | 663,020 |
Custody and accounting fees | 22,337 |
Professional fees | 70,018 |
Interest holder report expenses | 14,937 |
Trustees’ fees and expenses | 27,295 |
Other fees and expenses | 7,607 |
Total expenses | 805,214 |
Less: Fee waivers and/or expense reimbursements | (47,477 ) |
Net expenses | 757,737 |
Net investment income | 3,790,038 |
Realized and unrealized gains (losses) on investments | |
Net realized losses on | |
Unaffiliated securities | (10,220,441 ) |
Futures contracts | (122,391 ) |
Net realized losses on investments | (10,342,832 ) |
Net change in unrealized gains (losses) on | |
Unaffiliated securities | (7,455,102 ) |
Futures contracts | 279,613 |
Net change in unrealized gains (losses) on investments | (7,175,489 ) |
Net realized and unrealized gains (losses) on investments | (17,518,321 ) |
Net decrease in net assets resulting from operations | $(13,728,283 ) |
Year ended May 31, 2023 | Year ended May 31, 2022 | |||
Operations | ||||
Net investment income | $3,790,038 | $4,064,788 | ||
Net realized gains (losses) on investments | (10,342,832 ) | 19,263,042 | ||
Net change in unrealized gains (losses) on investments | (7,175,489 ) | (16,094,863 ) | ||
Net increase (decrease) in net assets resulting from operations | (13,728,283 ) | 7,232,967 | ||
Capital transactions | ||||
Transactions in investors’ beneficial interests | ||||
Contributions | 4,277,012 | 876,482 | ||
Withdrawals | (30,334,525 ) | (81,048,833 ) | ||
Net decrease in net assets resulting from capital transactions | (26,057,513 ) | (80,172,351 ) | ||
Total decrease in net assets | (39,785,796 ) | (72,939,384 ) | ||
Net assets | ||||
Beginning of period | 216,675,325 | 289,614,709 | ||
End of period | $176,889,529 | $216,675,325 | ||
Year ended May 31 | |||||
2023 | 2022 | 2021 | 2020 | 2019 | |
Total return | (6.63 )% | 2.39 % | 51.44 % | (0.09 )% | (0.94 )% |
Ratios to average net assets (annualized) | |||||
Gross expenses | 0.43 % | 0.41 % | 0.40 % | 0.39 % | 0.39 % |
Net expenses1 | 0.40 % | 0.40 % | 0.40 % | 0.39 % | 0.39 % |
Net investment income | 2.00 % | 1.61 % | 1.55 % | 2.05 % | 2.29 % |
Supplemental data | |||||
Portfolio turnover rate | 443 % | 399 % | 482 % | 335 % | 246 % |
1 | Net expense ratios reflect voluntary waivers, if any. |
Gross unrealized gains | $6,029,796 |
Gross unrealized losses | (10,123,191 ) |
Net unrealized losses | $(4,093,395 ) |
Quoted prices (Level 1) | Other significant observable inputs (Level 2) | Significant unobservable inputs (Level 3) | Total | |
Assets | ||||
Investments in: | ||||
Common stocks | ||||
Communication services | $13,688,445 | $0 | $0 | $13,688,445 |
Consumer discretionary | 7,817,571 | 0 | 0 | 7,817,571 |
Consumer staples | 11,052,574 | 0 | 0 | 11,052,574 |
Energy | 12,077,048 | 0 | 0 | 12,077,048 |
Financials | 34,312,936 | 0 | 0 | 34,312,936 |
Health care | 27,372,252 | 0 | 0 | 27,372,252 |
Industrials | 16,870,632 | 0 | 0 | 16,870,632 |
Information technology | 17,410,545 | 0 | 0 | 17,410,545 |
Materials | 9,325,947 | 0 | 0 | 9,325,947 |
Real estate | 9,847,097 | 0 | 0 | 9,847,097 |
Utilities | 10,781,499 | 0 | 0 | 10,781,499 |
Short-term investments | ||||
Investment companies | 5,543,508 | 0 | 0 | 5,543,508 |
176,100,054 | 0 | 0 | 176,100,054 | |
Futures contracts | 196,116 | 0 | 0 | 196,116 |
Total assets | $176,296,170 | $0 | $0 | $176,296,170 |
Average daily net assets | Advisory fee |
First $1 billion | 0.350 % |
Next $4 billion | 0.325 |
Over $5 billion | 0.300 |
Allspring Master Trust:

Name and year of birth | Position held and length of service* | Principal occupations during past five years or longer | Current other public company or investment company directorships |
William R. Ebsworth (Born 1957) | Trustee, since 2015 | Retired. From 1984 to 2013, equities analyst, portfolio manager, research director and chief investment officer at Fidelity Management and Research Company in Boston, Tokyo, and Hong Kong, and retired in 2013 as Chief Investment Officer of Fidelity Strategic Advisers, Inc. where he led a team of investment professionals managing client assets. Prior thereto, Board member of Hong Kong Securities Clearing Co., Hong Kong Options Clearing Corp., the Thailand International Fund, Ltd., Fidelity Investments Life Insurance Company, and Empire Fidelity Investments Life Insurance Company. Audit Committee Chair and Investment Committee Chair of the Vincent Memorial Hospital Foundation (non-profit organization). Mr. Ebsworth is a CFA charterholder. | N/A |
Jane A. Freeman (Born 1953) | Trustee, since 2015; Chair Liaison, since 2018 | Retired. From 2012 to 2014 and 1999 to 2008, Chief Financial Officer of Scientific Learning Corporation. From 2008 to 2012, Ms. Freeman provided consulting services related to strategic business projects. Prior to 1999, Portfolio Manager at Rockefeller & Co. and Scudder, Stevens & Clark. Board member of the Harding Loevner Funds from 1996 to 2014, serving as both Lead Independent Director and chair of the Audit Committee. Board member of the Russell Exchange Traded Funds Trust from 2011 to 2012 and the chair of the Audit Committee. Ms. Freeman is also an inactive Chartered Financial Analyst. | N/A |
Isaiah Harris, Jr. (Born 1952) | Trustee, since 2009; Audit Committee Chair, since 2019 | Retired. Member of the Advisory Board of CEF of East Central Florida. Chairman of the Board of CIGNA Corporation from 2009 to 2021, and Director from 2005 to 2008. From 2003 to 2011, Director of Deluxe Corporation. Prior thereto, President and CEO of BellSouth Advertising and Publishing Corp. from 2005 to 2007, President and CEO of BellSouth Enterprises from 2004 to 2005 and President of BellSouth Consumer Services from 2000 to 2003. Emeritus member of the Iowa State University Foundation Board of Governors. Emeritus Member of the Advisory board of Iowa State University School of Business. Advisory Board Member, Palm Harbor Academy (private school). Advisory Board Member, Fellowship of Christian Athletes. Mr. Harris is a certified public accountant (inactive status). | N/A |
David F. Larcker (Born 1950) | Trustee, since 2009 | Distinguished Visiting Fellow at the Hoover Institution since 2022. James Irvin Miller Professor of Accounting at the Graduate School of Business (Emeritus), Stanford University, Director of the Corporate Governance Research Initiative and Senior Faculty of The Rock Center for Corporate Governance since 2006. From 2005 to 2008, Professor of Accounting at the Graduate School of Business, Stanford University. Prior thereto, Ernst & Young Professor of Accounting at The Wharton School, University of Pennsylvania from 1985 to 2005. | N/A |
Olivia S. Mitchell (Born 1953) | Trustee, since 2006; Nominating and Governance Committee Chair, since 2018 | International Foundation of Employee Benefit Plans Professor since 1993, Wharton School of the University of Pennsylvania. Director of Wharton’s Pension Research Council and Boettner Center on Pensions & Retirement Research, and Research Associate at the National Bureau of Economic Research. Previously taught at Cornell University from 1978 to 1993. | N/A |
Timothy J. Penny (Born 1951) | Trustee, since 1996; Chair, since 2018 | President and Chief Executive Officer of Southern Minnesota Initiative Foundation, a non-profit organization, since 2007. Vice Chair of the Economic Club of Minnesota, since 2007. Co-Chair of the Committee for a Responsible Federal Budget, since 1995. Member of the Board of Trustees of NorthStar Education Finance, Inc., a non-profit organization, from 2007-2022. Senior Fellow of the University of Minnesota Humphrey Institute from 1995 to 2017. | N/A |
Name and year of birth | Position held and length of service* | Principal occupations during past five years or longer | Current other public company or investment company directorships |
James G. Polisson (Born 1959) | Trustee, since 2018 | Retired. Chief Marketing Officer, Source (ETF) UK Services, Ltd, from 2015 to 2017. From 2012 to 2015, Principal of The Polisson Group, LLC, a management consulting, corporate advisory and principal investing company. Chief Executive Officer and Managing Director at Russell Investments, Global Exchange Traded Funds from 2010 to 2012. Managing Director of Barclays Global Investors from 1998 to 2010 and Global Chief Marketing Officer for iShares and Barclays Global Investors from 2000 to 2010. Trustee of the San Francisco Mechanics’ Institute, a non- profit organization, from 2013 to 2015. Board member of the Russell Exchange Traded Fund Trust from 2011 to 2012. Director of Barclays Global Investors Holdings Deutschland GmbH from 2006 to 2009. Mr. Polisson is an attorney and has a retired status with the Massachusetts and District of Columbia Bar Associations. | N/A |
Pamela Wheelock (Born 1959) | Trustee, since January 2020; previously Trustee from January 2018 to July 2019 | Retired. Executive and Senior Financial leadership positions in the public, private and nonprofit sectors. Interim President and CEO, McKnight Foundation, 2020. Interim Commissioner, Minnesota Department of Human Services, 2019. Chief Operating Officer, Twin Cities Habitat for Humanity, 2017-2019. Vice President for University Services, University of Minnesota, 2012- 2016. Interim President and CEO, Blue Cross and Blue Shield of Minnesota, 2011-2012. Executive Vice-President and Chief Financial Officer, Minnesota Wild, 2002-2008. Commissioner, Minnesota Department of Finance, 1999-2002. Chair of the Board of Directors of Destination Medical Center Corporation. Board member of the Minnesota Wild Foundation. | N/A |
* | Length of service dates reflect the Trustee’s commencement of service with the Trust’s predecessor entities, where applicable. |
Name and year of birth | Position held and length of service | Principal occupations during past five years or longer |
Andrew Owen (Born 1960) | President, since 2017 | President and Chief Executive Officer of Allspring Funds Management, LLC since 2017 and Head of Global Fund Governance of Allspring Global Investments since 2022. Prior thereto, co-president of Galliard Capital Management, LLC, an affiliate of Allspring Funds Management, LLC, from 2019 to 2022 and Head of Affiliated Managers, Allspring Global Investments, from 2014 to 2019 and Executive Vice President responsible for marketing, investments and product development for Allspring Funds Management, LLC, from 2009 to 2014. |
Jeremy DePalma (Born 1974) | Treasurer, since 2012 (for certain funds in the Fund Complex); since 2021 (for the remaining funds in the Complex) | Senior Vice President of Allspring Funds Management, LLC since 2009. Senior Vice President of Evergreen Investment Management Company, LLC from 2008 to 2010 and head of the Fund Reporting and Control Team within Fund Administration from 2005 to 2010. |
Christopher Baker (Born 1976) | Chief Compliance Officer, since 2022 | Global Chief Compliance Officer for Allspring Global Investments since 2022. Prior thereto, Chief Compliance Officer for State Street Global Advisors from 2018 to 2021. Senior Compliance Officer for the State Street divisions of Alternative Investment Solutions, Sector Solutions, and Global Marketing from 2015 to 2018. From 2010 to 2015 Vice President, Global Head of Investment and Marketing Compliance for State Street Global Advisors. |
Matthew Prasse (Born 1983) | Chief Legal Officer, since 2022; Secretary, since 2021 | Senior Counsel of the Allspring Legal Department since 2021. Senior Counsel of the Wells Fargo Legal Department from 2018 to 2021. Previously, Counsel for Barings LLC from 2015 to 2018. Prior to joining Barings, Associate at Morgan, Lewis & Bockius LLP from 2008 to 2015. |

P.O. Box 219967
Kansas City, MO 64121-9967
Investment objective | The Portfolio seeks consistent fixed-income returns. |
Manager | Allspring Funds Management, LLC |
Subadviser | Galliard Capital Management, LLC |
Portfolio managers | Andrea Johnson, CFA, Brandon Kanz, CFA |
Ten largest holdings (%) as of May 31, 20231 | |
U.S. Treasury Bonds, 2.38%, 11-15-2049 | 2.10 |
FNMA, 4.50%, 1-1-2051 | 1.85 |
FNMA, 4.00%, 8-1-2051 | 1.62 |
FNMA, 3.50%, 6-1-2052 | 1.51 |
U.S. Treasury Bonds, 1.38%, 11-15-2040 | 1.29 |
WFRBS Commercial Mortgage Trust, 4.02%, 12-15-2046 | 1.21 |
FNMA, 2.50%, 1-1-2052 | 1.16 |
JP Morgan Chase Commercial Mortgage Securities Trust, 3.80%, 7-15-2047 | 1.11 |
FNMA, 2.50%, 1-1-2052 | 1.10 |
SBA Small Business Investment Cos., 2.94%, 3-10-2032 | 0.88 |
1 | Figures represent the percentage of the Portfolio’s net assets. Holdings are subject to change and may have changed since the date specified. |
Portfolio allocation as of May 31, 20231 |

1 | Figures represent the percentage of the Portfolio’s long-term investments. Allocations are subject to change and may have changed since the date specified. |
CFA® and Chartered Financial Analyst® are trademarks owned by CFA Institute. |
Interest rate | Maturity date | Principal | Value | |||
Agency securities: 20.63% | ||||||
FHLMC | 2.00 % | 12-1-2051 | $ | 2,388,566 | $1,974,851 | |
FHLMC | 2.50 | 12-1-2051 | 2,885,551 | 2,479,486 | ||
FHLMC | 2.50 | 1-1-2052 | 3,534,526 | 3,043,677 | ||
FHLMC | 3.00 | 7-1-2046 | 600,988 | 546,612 | ||
FHLMC | 3.00 | 11-1-2049 | 1,267,318 | 1,136,025 | ||
FHLMC | 3.00 | 12-1-2049 | 1,230,473 | 1,102,632 | ||
FHLMC | 3.50 | 4-1-2043 | 353,192 | 333,659 | ||
FHLMC | 3.50 | 5-1-2044 | 222,822 | 210,430 | ||
FHLMC | 3.50 | 6-1-2046 | 147,231 | 137,625 | ||
FHLMC | 3.50 | 2-1-2047 | 865,661 | 808,511 | ||
FHLMC | 3.50 | 4-1-2047 | 172,562 | 161,732 | ||
FHLMC | 3.50 | 12-1-2047 | 659,623 | 618,219 | ||
FHLMC | 3.50 | 3-1-2048 | 692,485 | 642,227 | ||
FHLMC | 3.50 | 8-1-2049 | 176,227 | 163,588 | ||
FHLMC | 4.00 | 4-1-2044 | 277,265 | 268,763 | ||
FHLMC | 4.00 | 8-1-2044 | 145,184 | 140,373 | ||
FHLMC | 4.00 | 6-1-2048 | 740,448 | 713,380 | ||
FHLMC | 4.50 | 8-1-2048 | 1,022,680 | 1,008,401 | ||
FHLMC | 4.50 | 11-1-2048 | 2,477,974 | 2,444,678 | ||
FHLMC Structured Pass-Through Certificates Series T-58 Class 4A | 7.50 | 9-25-2043 | 484,686 | 498,231 | ||
FHLMC Structured Pass-Through Certificates Series T-20 Class A6øø | 7.99 | 9-25-2029 | 4,969 | 4,875 | ||
FNMA | 1.47 | 11-1-2029 | 2,020,000 | 1,689,230 | ||
FNMA | 2.00 | 12-1-2051 | 2,091,430 | 1,736,947 | ||
FNMA | 2.27 | 4-1-2029 | 710,000 | 629,287 | ||
FNMA | 2.50 | 8-1-2031 | 131,895 | 123,354 | ||
FNMA | 2.50 | 2-1-2035 | 1,278,964 | 1,180,734 | ||
FNMA | 2.50 | 12-1-2051 | 2,370,175 | 2,036,377 | ||
FNMA | 2.50 | 1-1-2052 | 12,974,834 | 11,171,596 | ||
FNMA | 3.00 | 12-1-2032 | 19,012 | 17,749 | ||
FNMA | 3.00 | 7-1-2046 | 207,931 | 188,855 | ||
FNMA | 3.00 | 4-1-2047 | 860,112 | 777,341 | ||
FNMA | 3.00 | 12-1-2049 | 1,047,762 | 938,975 | ||
FNMA | 3.07 | 2-1-2026 | 344,916 | 330,024 | ||
FNMA±± | 3.28 | 11-1-2026 | 1,092,475 | 1,052,608 | ||
FNMA±± | 3.33 | 12-1-2027 | 771,776 | 738,888 | ||
FNMA | 3.35 | 1-1-2028 | 260,919 | 249,436 | ||
FNMA | 3.50 | 10-1-2032 | 263,513 | 253,318 | ||
FNMA | 3.50 | 11-1-2042 | 251,503 | 237,301 | ||
FNMA | 3.50 | 2-1-2043 | 53,558 | 50,538 | ||
FNMA | 3.50 | 11-1-2045 | 560,507 | 523,347 | ||
FNMA | 3.50 | 4-1-2046 | 69,691 | 65,069 | ||
FNMA | 3.50 | 7-1-2046 | 181,966 | 169,899 | ||
FNMA | 3.50 | 11-1-2046 | 250,535 | 233,767 | ||
FNMA | 3.50 | 8-1-2047 | 1,221,776 | 1,139,817 | ||
FNMA | 3.50 | 6-1-2052 | 5,810,277 | 5,385,405 | ||
FNMA | 4.00 | 11-1-2040 | 104,130 | 99,672 | ||
FNMA | 4.00 | 4-1-2041 | 148,597 | 142,237 | ||
FNMA | 4.00 | 8-1-2046 | 165,183 | 160,558 | ||
Interest rate | Maturity date | Principal | Value | |||
Agency securities (continued) | ||||||
FNMA | 4.00 % | 3-1-2049 | $ | 438,070 | $418,844 | |
FNMA | 4.00 | 8-1-2051 | 6,085,934 | 5,794,324 | ||
FNMA | 4.00 | 7-1-2052 | 1,385,549 | 1,314,899 | ||
FNMA | 4.00 | 7-1-2056 | 274,598 | 260,256 | ||
FNMA | 4.50 | 8-1-2048 | 672,921 | 662,572 | ||
FNMA | 4.50 | 1-1-2051 | 6,720,008 | 6,625,470 | ||
FNMA | 4.50 | 10-1-2052 | 549,639 | 537,108 | ||
FNMA | 4.50 | 11-1-2052 | 2,361,126 | 2,307,292 | ||
FNMA | 4.50 | 6-1-2056 | 688,025 | 674,202 | ||
FNMA | 5.00 | 9-1-2033 | 52,497 | 52,972 | ||
FNMA | 5.00 | 10-1-2052 | 2,066,926 | 2,051,467 | ||
FNMA Series 2003-W4 Class 3A±± | 5.04 | 10-25-2042 | 113,015 | 114,775 | ||
FNMA | 5.50 | 2-1-2036 | 21,496 | 21,152 | ||
FNMA | 5.50 | 10-1-2052 | 967,993 | 979,283 | ||
FNMA Series 2004-T2 Class 1A1 | 6.00 | 11-25-2043 | 241,468 | 243,806 | ||
FNMA Series 2004-T3 Class 1A1 | 6.00 | 2-25-2044 | 396,878 | 398,120 | ||
FNMA Series 2002-W4 Class A4 | 6.25 | 5-25-2042 | 670,305 | 681,753 | ||
FNMA Series 2002-90 Class A2 | 6.50 | 11-25-2042 | 222,048 | 229,950 | ||
FNMA Series 2004-W1 Class 2A2 | 7.00 | 12-25-2033 | 61,433 | 64,372 | ||
FNMA Series 2002-T4 Class A2 | 7.00 | 12-25-2041 | 71,093 | 73,964 | ||
FNMA Series 2004-W11 Class 1A3 | 7.00 | 5-25-2044 | 417,423 | 420,206 | ||
FNMA Series 2004-W8 Class 3A | 7.50 | 6-25-2044 | 77,833 | 80,004 | ||
GNMA | 6.50 | 10-15-2023 | 238 | 243 | ||
GNMA | 6.50 | 11-15-2023 | 230 | 236 | ||
GNMA | 6.50 | 12-15-2023 | 358 | 367 | ||
GNMA | 6.50 | 1-15-2024 | 195 | 199 | ||
GNMA | 7.00 | 8-15-2027 | 14,841 | 15,053 | ||
Total agency securities (Cost $80,657,827) | 73,783,193 | |||||
Asset-backed securities: 7.82% | ||||||
ECMC Group Student Loan Trust Series 2018-2A Class A (1 Month LIBOR +0.80%)144A± | 5.94 | 9-25-2068 | 1,749,493 | 1,694,772 | ||
ECMC Group Student Loan Trust Series 2016-1A Class A (1 Month LIBOR +1.35%)144A± | 6.49 | 7-26-2066 | 249,211 | 245,787 | ||
Ford Credit Auto Owner Trust Series 2021-1 Class A144A | 1.37 | 10-17-2033 | 1,225,000 | 1,108,534 | ||
Louisiana Local Government Environmental Facilities & Community Development Auth Series 2022-ELL Class A3 | 4.28 | 2-1-2036 | 1,365,000 | 1,305,172 | ||
Mississippi Higher Education Assistance Corp. Series 2014-1 Class A1 (1 Month LIBOR +0.68%)± | 5.82 | 10-25-2035 | 190,729 | 187,581 | ||
PHEAA Student Loan Trust Series 2016-1A Class A (1 Month LIBOR +1.15%)144A± | 6.29 | 9-25-2065 | 516,973 | 510,549 | ||
Rhode Island Student Loan Authority Series 2012-1 Class A1 (1 Month LIBOR +0.90%)± | 6.07 | 7-1-2031 | 1,073,112 | 1,075,760 | ||
SBA Small Business Investment Cos. Series 2021-10B Class 1 | 1.30 | 9-10-2031 | 1,662,124 | 1,399,126 | ||
SBA Small Business Investment Cos. Series 2021-10A Class 1 | 1.67 | 3-10-2031 | 572,939 | 504,403 | ||
SBA Small Business Investment Cos. Series 2015-10B Class 1 | 2.83 | 9-10-2025 | 60,050 | 57,524 | ||
SBA Small Business Investment Cos. Series 2017-10A Class 1 | 2.85 | 3-10-2027 | 131,109 | 124,078 | ||
SBA Small Business Investment Cos. Series 2022-10A Class 1 | 2.94 | 3-10-2032 | 3,473,490 | 3,145,306 | ||
Interest rate | Maturity date | Principal | Value | |||
Asset-backed securities (continued) | ||||||
SBA Small Business Investment Cos. Series 2014-10B Class 1 | 3.02 % | 9-10-2024 | $ | 28,002 | $27,220 | |
SBA Small Business Investment Cos. Series 2014-10A Class 1 | 3.19 | 3-10-2024 | 57,121 | 56,065 | ||
SBA Small Business Investment Cos. Series 2018-10B Class 1 | 3.55 | 9-10-2028 | 1,977,107 | 1,871,840 | ||
SLM Student Loan Trust Series 2003-10A Class A4 (3 Month LIBOR +0.67%)144A± | 5.54 | 12-17-2068 | 1,051,101 | 1,017,131 | ||
South Carolina Student Loan Corp. Series 2014-1 Class B (1 Month LIBOR +1.50%)± | 6.53 | 8-1-2035 | 500,000 | 489,752 | ||
U.S. Small Business Administration Series 2013-20A Class 1 | 2.13 | 1-1-2033 | 127,672 | 116,498 | ||
U.S. Small Business Administration Series 2015-20C Class 1 | 2.72 | 3-1-2035 | 161,183 | 149,392 | ||
U.S. Small Business Administration Series 2015-20E Class 1 | 2.77 | 5-1-2035 | 255,448 | 238,546 | ||
U.S. Small Business Administration Series 2017-20F Class 1 | 2.81 | 6-1-2037 | 151,089 | 139,504 | ||
U.S. Small Business Administration Series 2015-20F Class 1 | 2.98 | 6-1-2035 | 195,227 | 182,299 | ||
U.S. Small Business Administration Series 2013-20J Class 1 | 3.37 | 10-1-2033 | 113,416 | 106,838 | ||
U.S. Small Business Administration Series 2014-20A Class 1 | 3.46 | 1-1-2034 | 129,626 | 123,248 | ||
U.S. Small Business Administration Series 2018-20E Class 1 | 3.50 | 5-1-2038 | 1,297,259 | 1,222,360 | ||
U.S. Small Business Administration Series 2018-20G Class 1 | 3.54 | 7-1-2038 | 1,660,757 | 1,569,277 | ||
U.S. Small Business Administration Series 2018-20H Class 1 | 3.58 | 8-1-2038 | 2,256,034 | 2,132,860 | ||
U.S. Small Business Administration Series 2018-20K Class 1 | 3.87 | 11-1-2038 | 1,428,584 | 1,364,043 | ||
U.S. Small Business Administration Series 2022-25G Class 1 | 3.93 | 7-1-2047 | 1,890,194 | 1,804,334 | ||
U.S. Small Business Administration Series 2023-25D Class 1 | 4.48 | 4-1-2048 | 1,480,000 | 1,457,154 | ||
U.S. Small Business Administration Series 2022-25L Class 1 | 4.71 | 12-1-2047 | 1,475,000 | 1,475,617 | ||
U.S. Small Business Administration Series 2023-25A Class 1 | 4.91 | 1-1-2048 | 900,000 | 907,638 | ||
U.S. Small Business Administration Series 2006-20B Class 1 | 5.35 | 2-1-2026 | 46,234 | 45,412 | ||
U.S. Small Business Administration Series 2007-20J Class 1 | 5.57 | 10-1-2027 | 88,483 | 87,558 | ||
U.S. Small Business Administration Series 2006-20H Class 1 | 5.70 | 8-1-2026 | 27,180 | 26,936 | ||
Total asset-backed securities (Cost $29,541,030) | 27,970,114 | |||||
Corporate bonds and notes: 39.05% | ||||||
Basic materials: 2.11% | ||||||
Chemicals: 1.66% | ||||||
Albemarle Corp. | 5.05 | 6-1-2032 | 190,000 | 183,663 | ||
Ashland LLC144A | 3.38 | 9-1-2031 | 875,000 | 700,280 | ||
Celanese U.S. Holdings LLC | 6.17 | 7-15-2027 | 840,000 | 845,740 | ||
FMC Corp. | 3.20 | 10-1-2026 | 1,120,000 | 1,044,972 | ||
Ingevity Corp.144A | 3.88 | 11-1-2028 | 200,000 | 165,060 | ||
Mosaic Co. | 4.05 | 11-15-2027 | 1,090,000 | 1,043,228 | ||
PPG Industries, Inc. | 2.55 | 6-15-2030 | 770,000 | 660,291 | ||
RPM International, Inc. | 4.55 | 3-1-2029 | 420,000 | 396,801 | ||
Sherwin-Williams Co. | 2.95 | 8-15-2029 | 450,000 | 399,202 | ||
Sherwin-Williams Co. | 3.30 | 2-1-2025 | 100,000 | 96,952 | ||
Valvoline, Inc.144A | 4.25 | 2-15-2030 | 420,000 | 412,074 | ||
5,948,263 | ||||||
Iron/steel: 0.06% | ||||||
Nucor Corp. | 4.30 | 5-23-2027 | 210,000 | 205,909 | ||
Interest rate | Maturity date | Principal | Value | |||
Mining: 0.39% | ||||||
Freeport-McMoRan, Inc. | 4.13 % | 3-1-2028 | $ | 840,000 | $787,979 | |
Newmont Corp. | 2.60 | 7-15-2032 | 725,000 | 595,342 | ||
1,383,321 | ||||||
Communications: 2.16% | ||||||
Advertising: 0.14% | ||||||
Lamar Media Corp. | 4.88 | 1-15-2029 | 550,000 | 508,574 | ||
Internet: 0.08% | ||||||
VeriSign, Inc. | 4.75 | 7-15-2027 | 300,000 | 295,306 | ||
Media: 0.59% | ||||||
CCO Holdings LLC/CCO Holdings Capital Corp.144A | 4.50 | 8-15-2030 | 381,000 | 313,621 | ||
CCO Holdings LLC/CCO Holdings Capital Corp.144A | 5.13 | 5-1-2027 | 925,000 | 856,848 | ||
Charter Communications Operating LLC/Charter Communications Operating Capital | 4.40 | 4-1-2033 | 340,000 | 295,527 | ||
Comcast Corp. | 1.95 | 1-15-2031 | 550,000 | 451,788 | ||
Comcast Corp. | 4.80 | 5-15-2033 | 170,000 | 169,538 | ||
2,087,322 | ||||||
Telecommunications: 1.35% | ||||||
AT&T, Inc. | 2.25 | 2-1-2032 | 460,000 | 368,337 | ||
AT&T, Inc. | 2.75 | 6-1-2031 | 535,000 | 452,512 | ||
AT&T, Inc. | 4.75 | 5-15-2046 | 1,280,000 | 1,111,218 | ||
T-Mobile USA, Inc. | 2.40 | 3-15-2029 | 150,000 | 130,106 | ||
T-Mobile USA, Inc. | 3.38 | 4-15-2029 | 875,000 | 791,926 | ||
Verizon Communications, Inc. | 2.10 | 3-22-2028 | 500,000 | 441,285 | ||
Verizon Communications, Inc. | 2.36 | 3-15-2032 | 470,000 | 379,040 | ||
Verizon Communications, Inc. | 4.81 | 3-15-2039 | 1,228,000 | 1,141,714 | ||
4,816,138 | ||||||
Consumer, cyclical: 2.72% | ||||||
Apparel: 0.53% | ||||||
Hanesbrands, Inc.144A | 4.88 | 5-15-2026 | 1,250,000 | 1,164,219 | ||
William Carter Co.144A | 5.63 | 3-15-2027 | 185,000 | 180,634 | ||
Wolverine World Wide, Inc.144A | 4.00 | 8-15-2029 | 700,000 | 558,390 | ||
1,903,243 | ||||||
Auto manufacturers: 1.34% | ||||||
Allison Transmission, Inc.144A | 4.75 | 10-1-2027 | 1,075,000 | 1,018,514 | ||
American Honda Finance Corp. | 2.25 | 1-12-2029 | 440,000 | 386,685 | ||
Daimler Truck Finance North America LLC144A | 2.00 | 12-14-2026 | 270,000 | 242,794 | ||
Daimler Truck Finance North America LLC144A | 2.38 | 12-14-2028 | 450,000 | 391,481 | ||
Ford Motor Credit Co. LLC | 4.95 | 5-28-2027 | 1,200,000 | 1,123,196 | ||
General Motors Co. | 5.60 | 10-15-2032 | 500,000 | 481,565 | ||
General Motors Financial Co., Inc. | 2.40 | 10-15-2028 | 380,000 | 322,770 | ||
General Motors Financial Co., Inc. | 4.30 | 4-6-2029 | 180,000 | 166,475 | ||
Interest rate | Maturity date | Principal | Value | |||
Auto manufacturers (continued) | ||||||
Volkswagen Group of America Finance LLC144A | 2.85 % | 9-26-2024 | $ | 300,000 | $290,089 | |
Volkswagen Group of America Finance LLC144A | 4.60 | 6-8-2029 | 370,000 | 357,496 | ||
4,781,065 | ||||||
Entertainment: 0.22% | ||||||
Warnermedia Holdings, Inc. | 4.28 | 3-15-2032 | 900,000 | 786,277 | ||
Housewares: 0.24% | ||||||
Scotts Miracle-Gro Co. | 4.50 | 10-15-2029 | 120,000 | 102,310 | ||
Scotts Miracle-Gro Co. | 5.25 | 12-15-2026 | 800,000 | 759,859 | ||
862,169 | ||||||
Retail: 0.39% | ||||||
7-Eleven, Inc.144A | 0.95 | 2-10-2026 | 220,000 | 198,085 | ||
Foot Locker, Inc.144A | 4.00 | 10-1-2029 | 400,000 | 300,048 | ||
Lowe’s Cos., Inc. | 1.70 | 9-15-2028 | 420,000 | 360,137 | ||
Lowe’s Cos., Inc. | 3.75 | 4-1-2032 | 170,000 | 154,233 | ||
Lowe’s Cos., Inc. | 5.00 | 4-15-2033 | 280,000 | 277,372 | ||
Starbucks Corp. | 2.25 | 3-12-2030 | 140,000 | 119,395 | ||
1,409,270 | ||||||
Consumer, non-cyclical: 6.93% | ||||||
Agriculture: 0.16% | ||||||
Darling Ingredients, Inc.144A | 5.25 | 4-15-2027 | 600,000 | 583,262 | ||
Commercial services: 2.96% | ||||||
Duke University | 3.20 | 10-1-2038 | 1,000,000 | 816,968 | ||
Equifax, Inc. | 2.35 | 9-15-2031 | 180,000 | 143,493 | ||
Equifax, Inc. | 5.10 | 12-15-2027 | 140,000 | 139,737 | ||
Gartner, Inc.144A | 4.50 | 7-1-2028 | 390,000 | 367,157 | ||
Johns Hopkins University Series A | 2.81 | 1-1-2060 | 180,000 | 119,850 | ||
Massachusetts Institute of Technology | 3.96 | 7-1-2038 | 500,000 | 464,655 | ||
Massachusetts Institute of Technology | 4.68 | 7-1-2114 | 120,000 | 110,951 | ||
Massachusetts Institute of Technology | 7.25 | 11-2-2096 | 500,000 | 687,340 | ||
Northwestern University | 3.69 | 12-1-2038 | 1,915,000 | 1,719,110 | ||
President & Fellows of Harvard College | 3.62 | 10-1-2037 | 275,000 | 240,718 | ||
President & Fellows of Harvard College | 4.88 | 10-15-2040 | 183,000 | 186,974 | ||
President & Fellows of Harvard College | 5.63 | 10-1-2038 | 525,000 | 574,389 | ||
RELX Capital, Inc. | 3.00 | 5-22-2030 | 70,000 | 62,081 | ||
RELX Capital, Inc. | 4.00 | 3-18-2029 | 240,000 | 230,437 | ||
Service Corp. International | 4.63 | 12-15-2027 | 450,000 | 426,168 | ||
Service Corp. International | 7.50 | 4-1-2027 | 345,000 | 357,763 | ||
Trustees of Princeton University | 5.70 | 3-1-2039 | 1,640,000 | 1,807,758 | ||
University of Notre Dame du Lac Series 2010 | 4.90 | 3-1-2041 | 400,000 | 394,623 | ||
University of Southern California | 3.03 | 10-1-2039 | 1,250,000 | 1,024,298 | ||
Washington University | 4.35 | 4-15-2122 | 850,000 | 697,108 | ||
10,571,578 | ||||||
Interest rate | Maturity date | Principal | Value | |||
Food: 0.21% | ||||||
Ingredion, Inc. | 2.90 % | 6-1-2030 | $ | 880,000 | $761,307 | |
Healthcare-products: 1.08% | ||||||
Baxter International, Inc. | 1.92 | 2-1-2027 | 260,000 | 231,725 | ||
Baxter International, Inc. | 2.27 | 12-1-2028 | 1,130,000 | 973,394 | ||
GE HealthCare Technologies, Inc.144A | 5.86 | 3-15-2030 | 380,000 | 391,484 | ||
GE HealthCare Technologies, Inc.144A | 5.91 | 11-22-2032 | 240,000 | 250,701 | ||
Hologic, Inc.144A | 3.25 | 2-15-2029 | 505,000 | 441,034 | ||
Hologic, Inc.144A | 4.63 | 2-1-2028 | 575,000 | 544,751 | ||
Revvity, Inc. | 1.90 | 9-15-2028 | 490,000 | 416,387 | ||
Teleflex, Inc.144A | 4.25 | 6-1-2028 | 500,000 | 459,807 | ||
Teleflex, Inc. | 4.63 | 11-15-2027 | 150,000 | 141,884 | ||
3,851,167 | ||||||
Healthcare-services: 1.47% | ||||||
Advocate Health & Hospitals Corp. | 4.27 | 8-15-2048 | 110,000 | 96,298 | ||
BayCare Health System, Inc. Series 2020 | 3.83 | 11-15-2050 | 145,000 | 118,782 | ||
Charles River Laboratories International, Inc.144A | 4.25 | 5-1-2028 | 745,000 | 676,877 | ||
Cleveland Clinic Foundation | 4.86 | 1-1-2114 | 347,000 | 312,650 | ||
Inova Health System Foundation | 4.07 | 5-15-2052 | 355,000 | 300,878 | ||
IQVIA, Inc.144A | 5.00 | 10-15-2026 | 445,000 | 432,797 | ||
Kaiser Foundation Hospitals Series 2019 | 3.27 | 11-1-2049 | 160,000 | 117,630 | ||
Mayo Clinic Series 2021 | 3.20 | 11-15-2061 | 500,000 | 340,059 | ||
Memorial Sloan-Kettering Cancer Center Series 2015 | 4.20 | 7-1-2055 | 185,000 | 155,239 | ||
Nationwide Children’s Hospital, Inc. | 4.56 | 11-1-2052 | 295,000 | 267,889 | ||
Northwestern Memorial Healthcare Obligated Group Series 2021 | 2.63 | 7-15-2051 | 355,000 | 226,268 | ||
NYU Langone Hospitals Series 2020 | 3.38 | 7-1-2055 | 550,000 | 382,832 | ||
OhioHealth Corp. | 2.83 | 11-15-2041 | 150,000 | 109,412 | ||
OhioHealth Corp. Series 2020 | 3.04 | 11-15-2050 | 100,000 | 70,683 | ||
Pediatrix Medical Group, Inc.144A | 5.38 | 2-15-2030 | 550,000 | 506,000 | ||
Presbyterian Healthcare Services | 4.88 | 8-1-2052 | 600,000 | 591,565 | ||
Providence St Joseph Health Obligated Group | 5.40 | 10-1-2033 | 365,000 | 361,355 | ||
WakeMed Series A | 3.29 | 10-1-2052 | 280,000 | 194,281 | ||
5,261,495 | ||||||
Household products/wares: 0.12% | ||||||
Central Garden & Pet Co. | 5.13 | 2-1-2028 | 460,000 | 432,414 | ||
Pharmaceuticals: 0.93% | ||||||
AbbVie, Inc. | 4.55 | 3-15-2035 | 1,200,000 | 1,143,848 | ||
Bayer U.S. Finance II LLC144A | 4.38 | 12-15-2028 | 1,170,000 | 1,126,126 | ||
Bayer U.S. Finance LLC144A | 3.38 | 10-8-2024 | 240,000 | 233,334 | ||
Becton Dickinson & Co. | 4.30 | 8-22-2032 | 260,000 | 247,188 | ||
CVS Health Corp. | 1.75 | 8-21-2030 | 200,000 | 160,745 | ||
CVS Health Corp. | 4.30 | 3-25-2028 | 285,000 | 277,743 | ||
CVS Health Corp. | 5.05 | 3-25-2048 | 130,000 | 117,427 | ||
3,306,411 | ||||||
Interest rate | Maturity date | Principal | Value | |||
Energy: 5.21% | ||||||
Oil & gas: 1.52% | ||||||
Antero Resources Corp.144A | 5.38 % | 3-1-2030 | $ | 565,000 | $519,419 | |
Apache Corp. | 4.25 | 1-15-2030 | 100,000 | 89,750 | ||
Apache Corp. | 4.38 | 10-15-2028 | 100,000 | 91,500 | ||
BP Capital Markets America, Inc. | 2.72 | 1-12-2032 | 540,000 | 460,365 | ||
BP Capital Markets America, Inc. | 4.89 | 9-11-2033 | 140,000 | 139,085 | ||
Coterra Energy, Inc. | 3.90 | 5-15-2027 | 500,000 | 474,623 | ||
HF Sinclair Corp. | 4.50 | 10-1-2030 | 910,000 | 809,337 | ||
Marathon Petroleum Corp. | 5.13 | 12-15-2026 | 800,000 | 798,632 | ||
Ovintiv, Inc. | 6.25 | 7-15-2033 | 775,000 | 768,385 | ||
Permian Resources Operating LLC144A | 5.88 | 7-1-2029 | 400,000 | 374,483 | ||
Range Resources Corp. | 4.88 | 5-15-2025 | 625,000 | 612,678 | ||
Southwestern Energy Co. | 5.38 | 3-15-2030 | 320,000 | 294,128 | ||
5,432,385 | ||||||
Oil & gas services: 0.20% | ||||||
Halliburton Co. | 2.92 | 3-1-2030 | 820,000 | 725,461 | ||
Pipelines: 3.49% | ||||||
Boardwalk Pipelines LP | 3.60 | 9-1-2032 | 625,000 | 532,192 | ||
Buckeye Partners LP | 3.95 | 12-1-2026 | 247,000 | 220,178 | ||
Cheniere Energy Partners LP | 4.50 | 10-1-2029 | 875,000 | 801,210 | ||
Energy Transfer LP | 4.95 | 5-15-2028 | 790,000 | 771,310 | ||
EnLink Midstream Partners LP | 4.85 | 7-15-2026 | 430,000 | 416,008 | ||
Enterprise Products Operating LLC | 4.15 | 10-16-2028 | 420,000 | 405,557 | ||
Enterprise Products Operating LLC | 5.35 | 1-31-2033 | 540,000 | 550,418 | ||
Florida Gas Transmission Co. LLC144A | 4.35 | 7-15-2025 | 1,521,000 | 1,484,650 | ||
Gray Oak Pipeline LLC144A | 2.60 | 10-15-2025 | 860,000 | 792,885 | ||
Gulfstream Natural Gas System LLC144A | 6.19 | 11-1-2025 | 210,000 | 210,160 | ||
Magellan Midstream Partners LP | 5.00 | 3-1-2026 | 170,000 | 168,463 | ||
MPLX LP | 4.13 | 3-1-2027 | 1,500,000 | 1,453,285 | ||
NuStar Logistics LP | 6.00 | 6-1-2026 | 600,000 | 582,228 | ||
Plains All American Pipeline LP/PAA Finance Corp. | 4.70 | 6-15-2044 | 600,000 | 462,241 | ||
Plains All American Pipeline LP/PAA Finance Corp. | 4.90 | 2-15-2045 | 80,000 | 63,199 | ||
Sabine Pass Liquefaction LLC | 4.50 | 5-15-2030 | 300,000 | 283,659 | ||
Transcontinental Gas Pipe Line Co. LLC | 3.25 | 5-15-2030 | 790,000 | 703,921 | ||
Transcontinental Gas Pipe Line Co. LLC | 7.85 | 2-1-2026 | 1,200,000 | 1,271,241 | ||
Western Midstream Operating LP | 4.30 | 2-1-2030 | 1,100,000 | 977,983 | ||
Williams Cos., Inc. | 4.65 | 8-15-2032 | 220,000 | 208,130 | ||
Williams Cos., Inc. | 5.65 | 3-15-2033 | 130,000 | 131,433 | ||
12,490,351 | ||||||
Financial: 9.12% | ||||||
Banks: 6.04% | ||||||
Bank of America Corp. (U.S. SOFR +0.96%)± | 1.73 | 7-22-2027 | 1,400,000 | 1,248,523 | ||
Bank of America Corp. (U.S. SOFR +1.37%)± | 1.92 | 10-24-2031 | 540,000 | 426,455 | ||
Bank of America Corp. (U.S. SOFR +1.21%)± | 2.57 | 10-20-2032 | 170,000 | 138,045 | ||
Bank of America Corp. (3 Month LIBOR +1.51%)± | 3.71 | 4-24-2028 | 1,440,000 | 1,353,581 | ||
Interest rate | Maturity date | Principal | Value | |||
Banks (continued) | ||||||
Bank of America Corp. (U.S. SOFR +2.16%)± | 5.02 % | 7-22-2033 | $ | 200,000 | $195,492 | |
Bank of New York Mellon Corp. (U.S. SOFR +1.42%)± | 4.29 | 6-13-2033 | 260,000 | 245,353 | ||
Bank of New York Mellon Corp. (U.S. SOFR +1.76%)± | 4.60 | 7-26-2030 | 360,000 | 350,351 | ||
Bank of New York Mellon Corp. (U.S. SOFR +1.80%)± | 5.80 | 10-25-2028 | 50,000 | 51,530 | ||
Citigroup, Inc. (U.S. SOFR +0.77%)± | 1.12 | 1-28-2027 | 330,000 | 295,039 | ||
Citigroup, Inc. (U.S. SOFR +1.18%)± | 2.52 | 11-3-2032 | 450,000 | 363,193 | ||
Citigroup, Inc. (U.S. SOFR +2.11%)± | 2.57 | 6-3-2031 | 370,000 | 309,773 | ||
Citigroup, Inc. (U.S. SOFR +1.35%)± | 3.06 | 1-25-2033 | 240,000 | 201,863 | ||
Citigroup, Inc. (U.S. SOFR +1.28%)± | 3.07 | 2-24-2028 | 340,000 | 314,972 | ||
Citigroup, Inc. (U.S. SOFR 3 Month +1.65%)± | 3.67 | 7-24-2028 | 900,000 | 845,990 | ||
Citigroup, Inc. (U.S. SOFR +2.09%)± | 4.91 | 5-24-2033 | 160,000 | 155,552 | ||
Fifth Third Bancorp (U.S. SOFR +1.66%)± | 4.34 | 4-25-2033 | 260,000 | 232,054 | ||
Fifth Third Bancorp (U.S. SOFR +2.13%)± | 4.77 | 7-28-2030 | 490,000 | 453,869 | ||
Fifth Third Bancorp (U.S. SOFR +2.19%)± | 6.36 | 10-27-2028 | 180,000 | 180,698 | ||
Goldman Sachs Group, Inc. (U.S. SOFR +0.91%)± | 1.95 | 10-21-2027 | 210,000 | 187,027 | ||
Goldman Sachs Group, Inc. (U.S. SOFR +1.11%)± | 2.64 | 2-24-2028 | 390,000 | 353,580 | ||
Goldman Sachs Group, Inc. (U.S. SOFR +1.85%)± | 3.62 | 3-15-2028 | 720,000 | 679,522 | ||
Goldman Sachs Group, Inc. (U.S. SOFR 3 Month +1.30%)± | 4.22 | 5-1-2029 | 570,000 | 540,251 | ||
Huntington Bancshares, Inc. (U.S. SOFR +2.05%)± | 5.02 | 5-17-2033 | 210,000 | 192,671 | ||
Huntington National Bank | 5.65 | 1-10-2030 | 250,000 | 240,214 | ||
JPMorgan Chase & Co. (U.S. SOFR +1.89%)± | 2.18 | 6-1-2028 | 310,000 | 276,712 | ||
JPMorgan Chase & Co. (U.S. SOFR 3 Month +1.25%)± | 2.58 | 4-22-2032 | 110,000 | 91,579 | ||
JPMorgan Chase & Co. (U.S. SOFR +1.26%)± | 2.96 | 1-25-2033 | 390,000 | 330,087 | ||
JPMorgan Chase & Co. (3 Month LIBOR +1.34%)± | 3.78 | 2-1-2028 | 1,100,000 | 1,046,089 | ||
JPMorgan Chase & Co. (3 Month LIBOR +1.26%)± | 4.20 | 7-23-2029 | 600,000 | 574,376 | ||
JPMorgan Chase & Co. (3 Month LIBOR +1.33%)± | 4.45 | 12-5-2029 | 470,000 | 453,562 | ||
KeyBank NA | 3.90 | 4-13-2029 | 420,000 | 324,883 | ||
KeyCorp | 2.25 | 4-6-2027 | 690,000 | 568,855 | ||
KeyCorp (U.S. SOFR +2.06%)± | 4.79 | 6-1-2033 | 410,000 | 354,188 | ||
Morgan Stanley (U.S. SOFR +0.86%)± | 1.51 | 7-20-2027 | 300,000 | 267,155 | ||
Morgan Stanley (U.S. SOFR +1.00%)± | 2.48 | 1-21-2028 | 740,000 | 671,768 | ||
Morgan Stanley (U.S. SOFR +2.08%)± | 4.89 | 7-20-2033 | 360,000 | 347,503 | ||
Morgan Stanley (U.S. SOFR +1.59%)± | 5.16 | 4-20-2029 | 480,000 | 478,433 | ||
National Securities Clearing Corp. | 5.00 | 5-30-2028 | 280,000 | 281,092 | ||
PNC Bank NA | 4.05 | 7-26-2028 | 1,000,000 | 928,727 | ||
PNC Financial Services Group, Inc. (U.S. SOFR +2.14%)± | 6.04 | 10-28-2033 | 260,000 | 268,152 | ||
Regions Financial Corp. | 1.80 | 8-12-2028 | 540,000 | 436,604 | ||
State Street Corp. (U.S. SOFR +1.00%)± | 2.62 | 2-7-2033 | 770,000 | 638,622 | ||
State Street Corp. (U.S. SOFR +1.73%)± | 4.16 | 8-4-2033 | 400,000 | 371,916 | ||
State Street Corp. (U.S. SOFR +1.61%)± | 4.42 | 5-13-2033 | 90,000 | 85,940 | ||
Truist Financial Corp. (U.S. SOFR +1.37%)± | 4.12 | 6-6-2028 | 200,000 | 189,173 | ||
Truist Financial Corp. (U.S. SOFR +2.30%)± | 6.12 | 10-28-2033 | 180,000 | 184,112 | ||
Truist Financial Corp. (3 Month LIBOR +0.98%)± | 6.16 | 4-1-2027 | 400,000 | 367,175 | ||
U.S. Bancorp (U.S. SOFR +1.66%)± | 4.55 | 7-22-2028 | 320,000 | 307,534 | ||
U.S. Bancorp (U.S. SOFR +2.09%)± | 5.85 | 10-21-2033 | 160,000 | 161,411 | ||
Wells Fargo & Co. (U.S. SOFR +1.50%)± | 3.35 | 3-2-2033 | 680,000 | 584,104 | ||
Wells Fargo & Co. (U.S. SOFR +1.51%)± | 3.53 | 3-24-2028 | 720,000 | 674,834 | ||
Interest rate | Maturity date | Principal | Value | |||
Banks (continued) | ||||||
Wells Fargo & Co. (U.S. SOFR +2.10%)± | 4.90 % | 7-25-2033 | $ | 590,000 | $569,139 | |
Wells Fargo & Co. (U.S. SOFR +2.02%)± | 5.39 | 4-24-2034 | 210,000 | 210,277 | ||
21,599,600 | ||||||
Diversified financial services: 0.39% | ||||||
American Express Co. (U.S. SOFR +1.76%)± | 4.42 | 8-3-2033 | 630,000 | 595,783 | ||
Capital One Financial Corp. (U.S. SOFR +1.79%)± | 3.27 | 3-1-2030 | 450,000 | 385,616 | ||
Capital One Financial Corp. (U.S. SOFR +2.37%)± | 5.27 | 5-10-2033 | 290,000 | 276,659 | ||
Charles Schwab Corp. | 5.64 | 5-19-2029 | 160,000 | 160,172 | ||
1,418,230 | ||||||
Insurance: 0.90% | ||||||
Aon Corp./Aon Global Holdings PLC | 2.85 | 5-28-2027 | 180,000 | 166,667 | ||
Guardian Life Global Funding144A | 5.55 | 10-28-2027 | 580,000 | 591,399 | ||
Marsh & McLennan Cos., Inc. | 2.38 | 12-15-2031 | 510,000 | 419,870 | ||
Metropolitan Life Global Funding I144A | 5.15 | 3-28-2033 | 200,000 | 199,531 | ||
New York Life Global Funding144A | 4.85 | 1-9-2028 | 420,000 | 421,714 | ||
NLV Financial Corp.144A | 7.50 | 8-15-2033 | 565,000 | 622,393 | ||
Northwestern Mutual Life Insurance Co.144A | 3.45 | 3-30-2051 | 470,000 | 334,405 | ||
Pricoa Global Funding I144A | 5.10 | 5-30-2028 | 470,000 | 470,379 | ||
3,226,358 | ||||||
REITS: 1.79% | ||||||
Alexandria Real Estate Equities, Inc. | 3.95 | 1-15-2027 | 240,000 | 230,064 | ||
Alexandria Real Estate Equities, Inc. | 3.95 | 1-15-2028 | 380,000 | 357,619 | ||
Boston Properties LP | 2.75 | 10-1-2026 | 780,000 | 685,138 | ||
CubeSmart LP | 2.25 | 12-15-2028 | 160,000 | 136,605 | ||
Digital Realty Trust LP | 4.45 | 7-15-2028 | 510,000 | 474,451 | ||
Extra Space Storage LP | 3.90 | 4-1-2029 | 400,000 | 368,550 | ||
Healthpeak OP LLC | 2.13 | 12-1-2028 | 40,000 | 33,870 | ||
Healthpeak OP LLC | 2.88 | 1-15-2031 | 190,000 | 161,287 | ||
Healthpeak OP LLC | 3.50 | 7-15-2029 | 560,000 | 508,841 | ||
Host Hotels & Resorts LP | 3.88 | 4-1-2024 | 265,000 | 261,037 | ||
Kimco Realty OP LLC | 4.60 | 2-1-2033 | 130,000 | 120,325 | ||
Mid-America Apartments LP | 4.20 | 6-15-2028 | 160,000 | 154,750 | ||
NNN REIT, Inc. | 4.30 | 10-15-2028 | 370,000 | 346,724 | ||
Prologis LP | 4.75 | 6-15-2033 | 270,000 | 264,036 | ||
UDR, Inc. | 3.20 | 1-15-2030 | 350,000 | 308,414 | ||
Ventas Realty LP | 3.50 | 2-1-2025 | 150,000 | 143,895 | ||
Ventas Realty LP | 3.85 | 4-1-2027 | 1,500,000 | 1,417,004 | ||
Welltower OP LLC | 2.05 | 1-15-2029 | 190,000 | 159,189 | ||
Welltower OP LLC | 2.75 | 1-15-2032 | 320,000 | 258,813 | ||
6,390,612 | ||||||
Industrial: 4.80% | ||||||
Aerospace/defense: 0.78% | ||||||
Boeing Co. | 2.70 | 2-1-2027 | 840,000 | 771,357 | ||
Boeing Co. | 5.15 | 5-1-2030 | 155,000 | 153,728 | ||
Interest rate | Maturity date | Principal | Value | |||
Aerospace/defense (continued) | ||||||
Boeing Co. | 5.71 % | 5-1-2040 | $ | 110,000 | $108,369 | |
Hexcel Corp. | 4.20 | 2-15-2027 | 602,000 | 570,644 | ||
Moog, Inc.144A | 4.25 | 12-15-2027 | 700,000 | 652,719 | ||
Raytheon Technologies Corp. | 2.25 | 7-1-2030 | 360,000 | 304,739 | ||
Raytheon Technologies Corp. | 2.38 | 3-15-2032 | 250,000 | 206,796 | ||
2,768,352 | ||||||
Building materials: 0.61% | ||||||
Carrier Global Corp. | 2.49 | 2-15-2027 | 780,000 | 715,179 | ||
CRH America Finance, Inc.144A | 3.95 | 4-4-2028 | 210,000 | 199,776 | ||
Fortune Brands Innovations, Inc. | 3.25 | 9-15-2029 | 460,000 | 401,332 | ||
Lennox International, Inc. | 1.70 | 8-1-2027 | 530,000 | 465,767 | ||
Martin Marietta Materials, Inc. Series CB | 2.50 | 3-15-2030 | 280,000 | 236,232 | ||
Masco Corp. | 6.50 | 8-15-2032 | 150,000 | 155,527 | ||
2,173,813 | ||||||
Electronics: 0.63% | ||||||
Agilent Technologies, Inc. | 2.75 | 9-15-2029 | 600,000 | 529,928 | ||
Allegion U.S. Holding Co., Inc. | 5.41 | 7-1-2032 | 500,000 | 494,641 | ||
Amphenol Corp. | 2.20 | 9-15-2031 | 480,000 | 392,506 | ||
Jabil, Inc. | 3.95 | 1-12-2028 | 900,000 | 843,406 | ||
2,260,481 | ||||||
Environmental control: 0.39% | ||||||
Clean Harbors, Inc.144A | 4.88 | 7-15-2027 | 325,000 | 310,775 | ||
Clean Harbors, Inc.144A | 6.38 | 2-1-2031 | 180,000 | 180,351 | ||
Stericycle, Inc.144A | 3.88 | 1-15-2029 | 1,010,000 | 890,759 | ||
1,381,885 | ||||||
Hand/machine tools: 0.09% | ||||||
Stanley Black & Decker, Inc. | 3.00 | 5-15-2032 | 180,000 | 150,503 | ||
Stanley Black & Decker, Inc. | 4.25 | 11-15-2028 | 190,000 | 180,986 | ||
331,489 | ||||||
Machinery-construction & mining: 0.18% | ||||||
Oshkosh Corp. | 3.10 | 3-1-2030 | 490,000 | 430,204 | ||
Oshkosh Corp. | 4.60 | 5-15-2028 | 200,000 | 194,892 | ||
625,096 | ||||||
Machinery-diversified: 0.32% | ||||||
GrafTech Finance, Inc.144A | 4.63 | 12-15-2028 | 640,000 | 510,424 | ||
Mueller Water Products, Inc.144A | 4.00 | 6-15-2029 | 700,000 | 628,600 | ||
1,139,024 | ||||||
Miscellaneous manufacturing: 0.13% | ||||||
Parker-Hannifin Corp. | 4.50 | 9-15-2029 | 490,000 | 478,854 | ||
Interest rate | Maturity date | Principal | Value | |||
Packaging & containers: 1.17% | ||||||
Ball Corp. | 3.13 % | 9-15-2031 | $ | 550,000 | $453,213 | |
Clearwater Paper Corp.144A | 4.75 | 8-15-2028 | 775,000 | 687,649 | ||
Graphic Packaging International LLC144A | 3.50 | 3-15-2028 | 275,000 | 249,626 | ||
Graphic Packaging International LLC144A | 3.50 | 3-1-2029 | 420,000 | 372,114 | ||
Packaging Corp. of America | 3.00 | 12-15-2029 | 480,000 | 424,931 | ||
Sealed Air Corp.144A | 5.50 | 9-15-2025 | 62,000 | 61,549 | ||
Sealed Air Corp./Sealed Air Corp. U.S.144A | 6.13 | 2-1-2028 | 400,000 | 396,331 | ||
Silgan Holdings, Inc. | 4.13 | 2-1-2028 | 400,000 | 366,000 | ||
WRKCo, Inc. | 3.00 | 9-15-2024 | 680,000 | 656,420 | ||
WRKCo, Inc. | 3.90 | 6-1-2028 | 560,000 | 529,999 | ||
4,197,832 | ||||||
Transportation: 0.50% | ||||||
FedEx Corp. | 3.90 | 2-1-2035 | 280,000 | 245,540 | ||
FedEx Corp. | 4.25 | 5-15-2030 | 660,000 | 635,326 | ||
Norfolk Southern Corp. | 5.10 | 8-1-2118 | 760,000 | 646,096 | ||
Ryder System, Inc. | 2.85 | 3-1-2027 | 300,000 | 275,586 | ||
1,802,548 | ||||||
Technology: 1.55% | ||||||
Computers: 0.26% | ||||||
Hewlett Packard Enterprise Co. | 4.90 | 10-15-2025 | 375,000 | 372,539 | ||
HP, Inc. | 1.45 | 6-17-2026 | 350,000 | 314,858 | ||
HP, Inc. | 4.00 | 4-15-2029 | 270,000 | 253,596 | ||
940,993 | ||||||
Semiconductors: 0.51% | ||||||
Intel Corp. | 4.00 | 8-5-2029 | 770,000 | 735,589 | ||
Microchip Technology, Inc. | 4.25 | 9-1-2025 | 375,000 | 365,508 | ||
Micron Technology, Inc. | 6.75 | 11-1-2029 | 285,000 | 297,908 | ||
ON Semiconductor Corp.144A | 3.88 | 9-1-2028 | 175,000 | 158,030 | ||
TSMC Arizona Corp. | 1.75 | 10-25-2026 | 300,000 | 270,915 | ||
1,827,950 | ||||||
Software: 0.78% | ||||||
Fair Isaac Corp.144A | 4.00 | 6-15-2028 | 430,000 | 395,578 | ||
Fidelity National Information Services, Inc. | 4.70 | 7-15-2027 | 185,000 | 182,029 | ||
Fiserv, Inc. | 5.45 | 3-2-2028 | 110,000 | 111,694 | ||
MSCI, Inc.144A | 4.00 | 11-15-2029 | 515,000 | 462,278 | ||
Oracle Corp. | 2.30 | 3-25-2028 | 970,000 | 858,217 | ||
Oracle Corp. | 6.15 | 11-9-2029 | 160,000 | 168,742 | ||
Roper Technologies, Inc. | 2.95 | 9-15-2029 | 470,000 | 418,187 | ||
Take-Two Interactive Software, Inc. | 3.70 | 4-14-2027 | 180,000 | 171,921 | ||
2,768,646 | ||||||
Utilities: 4.45% | ||||||
Electric: 3.94% | ||||||
American Transmission Systems, Inc.144A | 2.65 | 1-15-2032 | 380,000 | 315,247 | ||
Interest rate | Maturity date | Principal | Value | |||
Electric (continued) | ||||||
Black Hills Corp. | 4.35 % | 5-1-2033 | $ | 710,000 | $638,054 | |
Commonwealth Edison Co. Series 133 | 3.85 | 3-15-2052 | 450,000 | 357,726 | ||
Connecticut Light & Power Co. | 5.25 | 1-15-2053 | 130,000 | 130,387 | ||
Dominion Energy South Carolina, Inc. Series A | 2.30 | 12-1-2031 | 450,000 | 368,283 | ||
DTE Electric Co. | 5.40 | 4-1-2053 | 200,000 | 203,214 | ||
Duke Energy Carolinas LLC | 3.55 | 3-15-2052 | 230,000 | 174,252 | ||
Duke Energy Carolinas LLC | 6.05 | 4-15-2038 | 830,000 | 888,368 | ||
Duke Energy Progress LLC | 2.00 | 8-15-2031 | 620,000 | 503,499 | ||
Evergy Kansas Central, Inc. | 5.70 | 3-15-2053 | 180,000 | 181,920 | ||
Evergy Metro, Inc. Series 2020 | 2.25 | 6-1-2030 | 350,000 | 293,202 | ||
Evergy Missouri West, Inc.144A | 3.75 | 3-15-2032 | 330,000 | 283,241 | ||
Florida Power & Light Co. | 4.63 | 5-15-2030 | 70,000 | 69,364 | ||
Florida Power & Light Co. | 5.30 | 4-1-2053 | 200,000 | 204,175 | ||
Indianapolis Power & Light Co.144A | 5.65 | 12-1-2032 | 360,000 | 371,099 | ||
ITC Holdings Corp. | 3.65 | 6-15-2024 | 120,000 | 117,076 | ||
Kentucky Utilities Co. Series KENT | 5.45 | 4-15-2033 | 310,000 | 317,358 | ||
Louisville Gas & Electric Co. Series LOU | 5.45 | 4-15-2033 | 310,000 | 316,697 | ||
MidAmerican Energy Co. | 5.80 | 10-15-2036 | 900,000 | 965,729 | ||
NextEra Energy Capital Holdings, Inc. | 1.88 | 1-15-2027 | 420,000 | 377,268 | ||
NextEra Energy Operating Partners LP144A | 4.25 | 9-15-2024 | 6,000 | 5,752 | ||
NextEra Energy Operating Partners LP144A | 4.50 | 9-15-2027 | 275,000 | 256,094 | ||
Northern States Power Co. | 4.50 | 6-1-2052 | 210,000 | 188,767 | ||
Northern States Power Co. | 5.35 | 11-1-2039 | 1,580,000 | 1,603,157 | ||
PPL Electric Utilities Corp. | 5.25 | 5-15-2053 | 220,000 | 220,496 | ||
Public Service Electric & Gas Co. | 5.13 | 3-15-2053 | 380,000 | 376,724 | ||
Public Service Electric & Gas Co. Series D | 5.70 | 12-1-2036 | 590,000 | 594,643 | ||
Puget Sound Energy, Inc. | 5.45 | 6-1-2053 | 300,000 | 300,115 | ||
Rochester Gas & Electric Corp.144A | 3.10 | 6-1-2027 | 1,000,000 | 935,556 | ||
San Diego Gas & Electric Co. | 3.00 | 3-15-2032 | 490,000 | 422,899 | ||
Southern California Edison Co. Series 2004B | 6.00 | 1-15-2034 | 188,000 | 197,294 | ||
Trans-Allegheny Interstate Line Co.144A | 3.85 | 6-1-2025 | 200,000 | 194,050 | ||
Tucson Electric Power Co. | 3.25 | 5-15-2032 | 420,000 | 369,970 | ||
Union Electric Co. | 5.45 | 3-15-2053 | 330,000 | 331,514 | ||
WEC Energy Group, Inc. | 2.20 | 12-15-2028 | 790,000 | 686,227 | ||
Wisconsin Power & Light Co. | 3.95 | 9-1-2032 | 370,000 | 342,775 | ||
14,102,192 | ||||||
Gas: 0.51% | ||||||
AmeriGas Partners LP/AmeriGas Finance Corp. | 5.50 | 5-20-2025 | 450,000 | 433,157 | ||
AmeriGas Partners LP/AmeriGas Finance Corp. | 5.88 | 8-20-2026 | 500,000 | 464,892 | ||
CenterPoint Energy Resources Corp. | 1.75 | 10-1-2030 | 330,000 | 265,613 | ||
Sempra Global144A | 3.25 | 1-15-2032 | 825,000 | 665,641 | ||
1,829,303 | ||||||
Total corporate bonds and notes (Cost $153,458,697) | 139,665,946 | |||||
Interest rate | Maturity date | Principal | Value | |||
Municipal obligations: 8.19% | ||||||
Alabama: 0.24% | ||||||
Miscellaneous revenue: 0.24% | ||||||
Alabama Federal Aid Highway Finance Authority Series B | 1.86 % | 9-1-2029 | $ | 1,000,000 | $856,525 | |
Arizona: 0.10% | ||||||
Miscellaneous revenue: 0.10% | ||||||
City of Yuma AZ Excise Tax Revenue | 2.10 | 7-15-2030 | 430,000 | 361,037 | ||
California: 1.34% | ||||||
GO revenue: 1.23% | ||||||
Campbell Union High School District | 2.31 | 8-1-2035 | 660,000 | 518,780 | ||
County of Alameda Series A | 3.70 | 8-1-2031 | 275,000 | 261,303 | ||
Desert Community College District | 2.78 | 8-1-2035 | 450,000 | 370,086 | ||
Oxnard Union High School District | 1.87 | 8-1-2030 | 800,000 | 667,304 | ||
Palomar Community College District | 2.32 | 8-1-2034 | 500,000 | 395,966 | ||
San Ramon Valley Unified School District | 1.91 | 8-1-2030 | 740,000 | 631,391 | ||
Solano County Community College District Series B | 1.76 | 8-1-2030 | 950,000 | 788,121 | ||
State of California | 5.13 | 3-1-2038 | 750,000 | 754,228 | ||
4,387,179 | ||||||
Tax revenue: 0.11% | ||||||
San Jose Redevelopment Agency Successor Agency Series T | 3.38 | 8-1-2034 | 455,000 | 413,130 | ||
4,800,309 | ||||||
Florida: 0.25% | ||||||
Water & sewer revenue: 0.25% | ||||||
Florida Water Pollution Control Financing Corp. Clean Water State Revolving Fund Series A | 2.60 | 1-15-2030 | 1,000,000 | 905,612 | ||
Georgia: 0.14% | ||||||
GO revenue: 0.14% | ||||||
Cherokee County Board of Education | 5.87 | 8-1-2028 | 500,000 | 512,561 | ||
Hawaii: 0.42% | ||||||
GO revenue: 0.42% | ||||||
State of Hawaii Series FZ | 1.60 | 8-1-2031 | 770,000 | 618,277 | ||
State of Hawaii Series GD | 2.52 | 10-1-2035 | 1,110,000 | 884,488 | ||
1,502,765 | ||||||
Idaho: 0.05% | ||||||
Housing revenue: 0.05% | ||||||
Idaho State Building Authority State Office Campus Project Series B | 3.28 | 9-1-2028 | 170,000 | 163,405 | ||
Indiana: 0.36% | ||||||
Health revenue: 0.29% | ||||||
Indiana Finance Authority Community Foundation of Northwest Indiana Obligated Group | 3.63 | 3-1-2039 | 1,235,000 | 1,043,791 | ||
Interest rate | Maturity date | Principal | Value | |||
Miscellaneous revenue: 0.07% | ||||||
Indianapolis Local Public Improvement Bond Bank Series A-2 | 6.00 % | 1-15-2040 | $ | 235,000 | $248,466 | |
1,292,257 | ||||||
Louisiana: 0.12% | ||||||
Tax revenue: 0.12% | ||||||
State of Louisiana Gasoline & Fuels Tax Revenue Series A | 2.80 | 5-1-2035 | 500,000 | 411,451 | ||
Massachusetts: 0.57% | ||||||
GO revenue: 0.27% | ||||||
Commonwealth of Massachusetts Series E | 5.46 | 12-1-2039 | 500,000 | 533,800 | ||
Town of Andover | 2.52 | 11-1-2035 | 575,000 | 452,308 | ||
986,108 | ||||||
Miscellaneous revenue: 0.23% | ||||||
Commonwealth of Massachusetts COVID-19 Recovery Assessment Revenue Series A | 3.77 | 7-15-2029 | 850,000 | 814,048 | ||
Water & sewer revenue: 0.07% | ||||||
Massachusetts Water Resources Authority Series C | 2.49 | 8-1-2034 | 300,000 | 246,247 | ||
2,046,403 | ||||||
Michigan: 0.44% | ||||||
Education revenue: 0.21% | ||||||
University of Michigan Series A | 4.45 | 4-1-2122 | 885,000 | 759,809 | ||
Health revenue: 0.23% | ||||||
Michigan Finance Authority Trinity Health Corp. Obligated Group Series T | 3.08 | 12-1-2034 | 930,000 | 814,895 | ||
1,574,704 | ||||||
Minnesota: 0.11% | ||||||
GO revenue: 0.11% | ||||||
State of Minnesota Series F | 1.32 | 8-1-2031 | 500,000 | 398,134 | ||
Mississippi: 0.30% | ||||||
GO revenue: 0.30% | ||||||
State of Mississippi Series E | 2.49 | 10-1-2035 | 1,350,000 | 1,073,537 | ||
Nebraska: 0.17% | ||||||
Education revenue: 0.17% | ||||||
University of Nebraska Facilities Corp. Series A | 3.19 | 10-1-2039 | 750,000 | 620,598 | ||
New Jersey: 0.12% | ||||||
Miscellaneous revenue: 0.12% | ||||||
Hudson County Improvement Authority | 7.40 | 12-1-2025 | 420,000 | 435,469 | ||
Interest rate | Maturity date | Principal | Value | |||
New York: 0.20% | ||||||
GO revenue: 0.20% | ||||||
State of New York Series B | 2.65 % | 2-15-2030 | $ | 500,000 | $443,253 | |
State of New York Series C | 5.62 | 3-1-2040 | 250,000 | 259,827 | ||
703,080 | ||||||
North Dakota: 0.17% | ||||||
Housing revenue: 0.17% | ||||||
North Dakota Public Finance Authority | 2.68 | 12-1-2035 | 750,000 | 606,575 | ||
Ohio: 0.23% | ||||||
GO revenue: 0.07% | ||||||
State of Ohio Series A | 1.88 | 9-15-2034 | 300,000 | 231,631 | ||
Health revenue: 0.16% | ||||||
State of Ohio Cleveland Clinic Health System Obligated Group Series G | 3.28 | 1-1-2042 | 725,000 | 585,649 | ||
817,280 | ||||||
Oklahoma: 0.62% | ||||||
Utilities revenue: 0.43% | ||||||
Oklahoma Development Finance Authority Public Service Co. of Oklahoma Series A-2 | 4.62 | 6-1-2044 | 1,085,000 | 1,054,130 | ||
Oklahoma Development Finance Authority | 4.71 | 5-1-2052 | 125,000 | 120,344 | ||
Oklahoma Development Finance Authority Oklahoma Gas and Electric Co. Series A-2 | 4.85 | 2-1-2045 | 355,000 | 352,215 | ||
1,526,689 | ||||||
Water & sewer revenue: 0.19% | ||||||
Oklahoma Water Resources Board (Credit Enhancement Reserve Fund Insured) | 2.56 | 4-1-2031 | 770,000 | 679,332 | ||
2,206,021 | ||||||
Oregon: 0.32% | ||||||
GO revenue: 0.15% | ||||||
State of Oregon Series A | 5.90 | 8-1-2038 | 500,000 | 543,626 | ||
Tax revenue: 0.17% | ||||||
State of Oregon Department of Transportation Series B | 3.17 | 11-15-2038 | 750,000 | 617,470 | ||
1,161,096 | ||||||
Pennsylvania: 0.18% | ||||||
Education revenue: 0.18% | ||||||
University of Pittsburgh-of the Commonwealth System of Higher Education Series A | 3.65 | 9-15-2036 | 715,000 | 648,523 | ||
Interest rate | Maturity date | Principal | Value | |||
Texas: 0.83% | ||||||
Education revenue: 0.20% | ||||||
Board of Regents of the University of Texas System Series D | 5.13 % | 8-15-2042 | $ | 150,000 | $157,935 | |
Permanent University Fund - University of Texas System | 5.26 | 7-1-2039 | 550,000 | 565,424 | ||
723,359 | ||||||
GO revenue: 0.52% | ||||||
County of Hidalgo Series C | 4.04 | 8-15-2030 | 1,270,000 | 1,240,886 | ||
Stafford Municipal School District Series B | 3.08 | 8-15-2041 | 750,000 | 592,847 | ||
1,833,733 | ||||||
Utilities revenue: 0.11% | ||||||
Texas Natural Gas Securitization Finance Corp. | 5.17 | 4-1-2041 | 375,000 | 393,606 | ||
2,950,698 | ||||||
Vermont: 0.03% | ||||||
Housing revenue: 0.03% | ||||||
Vermont Housing Finance Agency | 3.80 | 11-1-2037 | 110,000 | 98,003 | ||
Virginia: 0.15% | ||||||
Education revenue: 0.13% | ||||||
University of Virginia Series C | 4.18 | 9-1-2117 | 265,000 | 215,729 | ||
University of Virginia | 6.20 | 9-1-2039 | 215,000 | 249,500 | ||
465,229 | ||||||
Housing revenue: 0.02% | ||||||
Virginia Housing Development Authority Series A | 3.10 | 6-25-2041 | 72,514 | 66,009 | ||
531,238 | ||||||
Washington: 0.41% | ||||||
GO revenue: 0.31% | ||||||
County of King Series B | 6.05 | 12-1-2030 | 350,000 | 374,744 | ||
King County Public Hospital District No. 2 | 2.70 | 12-1-2035 | 915,000 | 719,525 | ||
1,094,269 | ||||||
Water & sewer revenue: 0.10% | ||||||
County of King Sewer Revenue Series B | 1.86 | 1-1-2033 | 450,000 | 366,541 | ||
1,460,810 | ||||||
West Virginia: 0.11% | ||||||
Tax revenue: 0.11% | ||||||
County of Ohio Special District Excise Tax Revenue | 8.25 | 3-1-2035 | 385,000 | 403,757 | ||
Interest rate | Maturity date | Principal | Value | |||
Wisconsin: 0.21% | ||||||
GO revenue: 0.21% | ||||||
State of Wisconsin Series 4 | 2.10 % | 5-1-2035 | $ | 690,000 | $535,076 | |
State of Wisconsin Series 2 | 2.61 | 5-1-2032 | 240,000 | 208,445 | ||
743,521 | ||||||
Total municipal obligations (Cost $33,277,875) | 29,285,369 | |||||
Non-agency mortgage-backed securities: 7.87% | ||||||
COMM Mortgage Trust Series 2013-CR12 Class ASB | 3.62 | 10-10-2046 | 21,226 | 21,152 | ||
COMM Mortgage Trust Series 2014-UBS5 Class ASB | 3.55 | 9-10-2047 | 123,862 | 122,404 | ||
COMM Mortgage Trust Series 2014-UBS5 Class A4 | 3.84 | 9-10-2047 | 620,000 | 597,619 | ||
COMM Mortgage Trust Series 2014-CR21 Class A3 | 3.53 | 12-10-2047 | 2,476,211 | 2,378,623 | ||
COMM Mortgage Trust Series 2013-CR13 Class A4±± | 4.19 | 11-10-2046 | 600,000 | 591,037 | ||
COMM Mortgage Trust Series 2014-CR17 Class A5 | 3.98 | 5-10-2047 | 1,795,000 | 1,752,227 | ||
GS Mortgage Securities Trust Series 2013-GC14 Class A5 | 4.24 | 8-10-2046 | 513,509 | 512,368 | ||
GS Mortgage Securities Trust Series 2013-GC16 Class A4 | 4.27 | 11-10-2046 | 350,000 | 348,361 | ||
GS Mortgage Securities Trust Series 2014-GC26 Class A5 | 3.63 | 11-10-2047 | 2,565,000 | 2,455,647 | ||
JP Morgan Chase Commercial Mortgage Securities Trust Series 2014- C20 Class A5 | 3.80 | 7-15-2047 | 4,065,000 | 3,972,758 | ||
JPMBB Commercial Mortgage Securities Trust Series 2014-C19 Class A4 | 4.00 | 4-15-2047 | 341,296 | 334,739 | ||
JPMBB Commercial Mortgage Securities Trust Series 2014-C26 Class A4 | 3.49 | 1-15-2048 | 1,338,000 | 1,280,004 | ||
Morgan Stanley Bank of America Merrill Lynch Trust Series 2014-C15 Class ASB | 3.65 | 4-15-2047 | 65,512 | 64,846 | ||
Morgan Stanley Bank of America Merrill Lynch Trust Series 2014-C19 Class A4 | 3.53 | 12-15-2047 | 1,790,000 | 1,716,341 | ||
Seasoned Credit Risk Transfer Trust Series 2018-3 Class MA±± | 3.50 | 8-25-2057 | 2,657,417 | 2,519,260 | ||
Seasoned Credit Risk Transfer Trust Series 2019-3 Class M55D | 4.00 | 10-25-2058 | 539,791 | 513,465 | ||
Seasoned Credit Risk Transfer Trust Series 2020-2 Class MT | 2.00 | 11-25-2059 | 902,467 | 747,489 | ||
Towd Point Mortgage Trust Series 2018-3 Class A1144A±± | 3.75 | 5-25-2058 | 979,116 | 932,667 | ||
Towd Point Mortgage Trust Series 2019-4 Class A1144A±± | 2.90 | 10-25-2059 | 1,202,884 | 1,120,006 | ||
WFRBS Commercial Mortgage Trust Series 2014-C20 Class A5 | 4.00 | 5-15-2047 | 1,876,047 | 1,823,538 | ||
WFRBS Commercial Mortgage Trust Series 2013-C17 Class A4 | 4.02 | 12-15-2046 | 4,370,000 | 4,335,056 | ||
Total non-agency mortgage-backed securities (Cost $29,316,788) | 28,139,607 | |||||
U.S. Treasury securities: 7.90% | ||||||
U.S. Treasury Bonds | 1.38 | 11-15-2040 | 6,905,000 | 4,629,317 | ||
U.S. Treasury Bonds | 1.88 | 2-15-2041 | 1,460,000 | 1,063,918 | ||
U.S. Treasury Bonds | 1.88 | 2-15-2051 | 944,000 | 623,556 | ||
U.S. Treasury Bonds | 2.00 | 8-15-2051 | 2,140,000 | 1,455,451 | ||
U.S. Treasury Bonds | 2.25 | 2-15-2052 | 1,785,000 | 1,287,431 | ||
U.S. Treasury Bonds | 2.38 | 2-15-2042 | 2,855,000 | 2,232,922 | ||
U.S. Treasury Bonds | 2.38 | 11-15-2049 | 10,063,000 | 7,513,051 | ||
U.S. Treasury Bonds | 2.38 | 5-15-2051 | 1,185,000 | 880,557 | ||
U.S. Treasury Bonds | 2.88 | 5-15-2052 | 2,968,000 | 2,457,643 | ||
U.S. Treasury Bonds | 3.00 | 8-15-2052 | 789,000 | 670,558 | ||
U.S. Treasury Bonds | 3.63 | 2-15-2053 | 655,000 | 629,107 | ||
U.S. Treasury Bonds | 3.88 | 2-15-2043 | 1,892,000 | 1,857,116 | ||
Interest rate | Maturity date | Principal | Value | |||
U.S. Treasury securities (continued) | ||||||
U.S. Treasury Bonds | 3.88 % | 5-15-2043 | $ | 930,000 | $913,144 | |
U.S. Treasury Bonds | 4.00 | 11-15-2042 | 2,062,000 | 2,063,289 | ||
Total U.S. Treasury securities (Cost $37,659,556) | 28,277,060 | |||||
Yankee corporate bonds and notes: 6.99% | ||||||
Basic materials: 0.77% | ||||||
Chemicals: 0.27% | ||||||
Axalta Coating Systems LLC/Axalta Coating Systems Dutch Holding B BV144A | 4.75 | 6-15-2027 | 670,000 | 633,131 | ||
Nutrien Ltd. | 2.95 | 5-13-2030 | 180,000 | 157,518 | ||
Nutrien Ltd. | 4.90 | 3-27-2028 | 190,000 | 188,343 | ||
978,992 | ||||||
Mining: 0.50% | ||||||
Anglo American Capital PLC144A | 4.75 | 4-10-2027 | 1,000,000 | 975,514 | ||
South32 Treasury Ltd.144A | 4.35 | 4-14-2032 | 900,000 | 790,987 | ||
1,766,501 | ||||||
Consumer, non-cyclical: 0.52% | ||||||
Commercial services: 0.14% | ||||||
Experian Finance PLC144A | 4.25 | 2-1-2029 | 510,000 | 488,291 | ||
Pharmaceuticals: 0.38% | ||||||
Pfizer Investment Enterprises Pte. Ltd. | 4.65 | 5-19-2030 | 390,000 | 390,436 | ||
Pfizer Investment Enterprises Pte. Ltd. | 5.30 | 5-19-2053 | 110,000 | 113,242 | ||
Teva Pharmaceutical Finance Netherlands III BV | 3.15 | 10-1-2026 | 975,000 | 870,465 | ||
1,374,143 | ||||||
Energy: 0.20% | ||||||
Oil & gas: 0.20% | ||||||
Petroleos Mexicanos | 2.29 | 2-15-2024 | 27,500 | 27,051 | ||
Petroleos Mexicanos | 2.83 | 2-15-2024 | 57,500 | 56,700 | ||
Petroleos Mexicanos | 6.38 | 1-23-2045 | 1,080,000 | 632,120 | ||
715,871 | ||||||
Financial: 3.95% | ||||||
Banks: 3.95% | ||||||
Bank of Montreal Series H | 4.70 | 9-14-2027 | 110,000 | 108,681 | ||
Bank of Montreal | 5.20 | 2-1-2028 | 460,000 | 462,065 | ||
Bank of Nova Scotia | 1.30 | 9-15-2026 | 1,040,000 | 918,344 | ||
BNP Paribas SA (3 Month LIBOR +1.11%)144A± | 2.82 | 11-19-2025 | 820,000 | 781,307 | ||
BNP Paribas SA144A | 4.40 | 8-14-2028 | 520,000 | 498,085 | ||
BPCE SA144A | 4.75 | 7-19-2027 | 420,000 | 409,220 | ||
Cooperatieve Rabobank UA (1 Year Treasury Constant Maturity +1.00%)144A± | 1.34 | 6-24-2026 | 530,000 | 487,758 | ||
Cooperatieve Rabobank UA (1 Year Treasury Constant Maturity +0.73%)144A± | 1.98 | 12-15-2027 | 1,060,000 | 934,179 | ||
Credit Suisse Group AG (3 Month LIBOR +1.41%)144A± | 3.87 | 1-12-2029 | 1,500,000 | 1,339,158 | ||
Interest rate | Maturity date | Principal | Value | |||
Banks (continued) | ||||||
HSBC Holdings PLC (U.S. SOFR +1.41%)± | 2.87 % | 11-22-2032 | $ | 270,000 | $217,510 | |
HSBC Holdings PLC (3 Month LIBOR +1.53%)± | 4.58 | 6-19-2029 | 1,500,000 | 1,422,614 | ||
Mitsubishi UFJ Financial Group, Inc. (1 Year Treasury Constant Maturity +0.75%)± | 1.54 | 7-20-2027 | 1,050,000 | 929,413 | ||
Mitsubishi UFJ Financial Group, Inc. (1 Year Treasury Constant Maturity +0.83%)± | 2.34 | 1-19-2028 | 300,000 | 269,230 | ||
Mitsubishi UFJ Financial Group, Inc. (1 Year Treasury Constant Maturity +0.97%)± | 2.49 | 10-13-2032 | 260,000 | 210,047 | ||
Mitsubishi UFJ Financial Group, Inc. (1 Year Treasury Constant Maturity +2.13%)± | 5.13 | 7-20-2033 | 250,000 | 246,972 | ||
Royal Bank of Canada | 1.40 | 11-2-2026 | 830,000 | 736,217 | ||
Royal Bank of Canada | 4.24 | 8-3-2027 | 200,000 | 194,374 | ||
Sumitomo Mitsui Financial Group, Inc. | 1.47 | 7-8-2025 | 430,000 | 395,767 | ||
Sumitomo Mitsui Financial Group, Inc. | 1.90 | 9-17-2028 | 660,000 | 559,414 | ||
Sumitomo Mitsui Financial Group, Inc. | 2.17 | 1-14-2027 | 200,000 | 179,610 | ||
Toronto-Dominion Bank | 1.25 | 9-10-2026 | 1,130,000 | 998,906 | ||
Toronto-Dominion Bank | 2.45 | 1-12-2032 | 230,000 | 188,086 | ||
Toronto-Dominion Bank | 3.20 | 3-10-2032 | 410,000 | 354,281 | ||
Toronto-Dominion Bank | 4.46 | 6-8-2032 | 230,000 | 217,443 | ||
UBS Group AG (1 Year Treasury Constant Maturity +1.10%)144A± | 2.75 | 2-11-2033 | 200,000 | 158,096 | ||
UBS Group AG144A | 4.25 | 3-23-2028 | 750,000 | 700,664 | ||
UBS Group AG (1 Year Treasury Constant Maturity +2.40%)144A± | 4.99 | 8-5-2033 | 250,000 | 235,370 | ||
14,152,811 | ||||||
Industrial: 0.91% | ||||||
Aerospace/defense: 0.13% | ||||||
Embraer Netherlands Finance BV | 5.05 | 6-15-2025 | 475,000 | 464,638 | ||
Building materials: 0.38% | ||||||
Masonite International Corp.144A | 5.38 | 2-1-2028 | 510,000 | 483,455 | ||
Trane Technologies Luxembourg Finance SA | 3.80 | 3-21-2029 | 930,000 | 874,620 | ||
1,358,075 | ||||||
Electronics: 0.23% | ||||||
Sensata Technologies BV144A | 4.00 | 4-15-2029 | 935,000 | 832,914 | ||
Machinery-diversified: 0.17% | ||||||
CNH Industrial NV | 4.50 | 8-15-2023 | 600,000 | 597,873 | ||
Technology: 0.64% | ||||||
Computers: 0.08% | ||||||
Seagate HDD Cayman | 3.13 | 7-15-2029 | 375,000 | 287,112 | ||
Semiconductors: 0.40% | ||||||
NXP BV/NXP Funding LLC/NXP USA, Inc. | 2.65 | 2-15-2032 | 870,000 | 702,170 | ||
NXP BV/NXP Funding LLC/NXP USA, Inc. | 5.00 | 1-15-2033 | 110,000 | 105,982 | ||
TSMC Global Ltd.144A | 1.25 | 4-23-2026 | 700,000 | 630,886 | ||
1,439,038 | ||||||
Interest rate | Maturity date | Principal | Value | |||
Software: 0.16% | ||||||
Open Text Corp.144A | 6.90 % | 12-1-2027 | $ | 550,000 | $562,344 | |
Total yankee corporate bonds and notes (Cost $27,673,040) | 25,018,603 | |||||
Yield | Shares | |||||
Short-term investments: 0.92% | ||||||
Investment companies: 0.92% | ||||||
Allspring Government Money Market Fund Select Class♠∞ | 5.01 | 3,306,168 | 3,306,168 | |||
Total short-term investments (Cost $3,306,168) | 3,306,168 | |||||
Total investments in securities (Cost $394,890,981) | 99.37 % | 355,446,060 | ||||
Other assets and liabilities, net | 0.63 | 2,257,182 | ||||
Total net assets | 100.00 % | $357,703,242 | ||||
øø | The interest rate is determined and reset by the issuer periodically depending upon the terms of the security. The rate shown is the rate in effect at period end. |
±± | The coupon of the security is adjusted based on the principal and/or interest payments received from the underlying pool of mortgages as well as the credit quality and the actual prepayment speed of the underlying mortgages. The rate shown is the rate in effect at period end. |
144A | The security may be resold in transactions exempt from registration, normally to qualified institutional buyers, pursuant to Rule 144A under the Securities Act of 1933. |
± | Variable rate investment. The rate shown is the rate in effect at period end. |
♠ | The issuer of the security is an affiliated person of the Portfolio as defined in the Investment Company Act of 1940. |
∞ | The rate represents the 7-day annualized yield at period end. |
Abbreviations: | |
AGM | Assured Guaranty Municipal |
FHLMC | Federal Home Loan Mortgage Corporation |
FNMA | Federal National Mortgage Association |
GNMA | Government National Mortgage Association |
GO | General obligation |
LIBOR | London Interbank Offered Rate |
REIT | Real estate investment trust |
SBA | Small Business Authority |
SOFR | Secured Overnight Financing Rate |
Value, beginning of period | Purchases | Sales proceeds | Net realized gains (losses) | Net change in unrealized gains (losses) | Value, end of period | Shares, end of period | Income from affiliated securities | |
Short-term investments | ||||||||
Allspring Government Money Market Fund Select Class | $3,324,978 | $97,804,075 | $(97,822,885 ) | $0 | $0 | $3,306,168 | 3,306,168 | $134,628 |
Investments in affiliates no longer held at end of period | ||||||||
Securities Lending Cash Investments LLC | 479,633 | 12,059,095 | (12,538,693 ) | (35 ) | 0 | 0 | 0 | 39,166 1 |
$(35 ) | $0 | $3,306,168 | $173,794 |
1 | Amount shown represents income before fees and rebates. |
Assets | |
Investments in unaffiliated securities, at value (cost $391,584,813) | $352,139,892 |
Investments in affiliated securities, at value (cost $3,306,168) | 3,306,168 |
Cash | 273 |
Receivable for interest | 2,892,142 |
Receivable for investments sold | 119,944 |
Prepaid expenses and other assets | 711 |
Total assets | 358,459,130 |
Liabilities | |
Payable for investments purchased | 631,743 |
Advisory fee payable | 102,189 |
Trustees’ fees and expenses payable | 504 |
Accrued expenses and other liabilities | 21,452 |
Total liabilities | 755,888 |
Total net assets | $357,703,242 |
Investment income | |
Interest (net of foreign withholding taxes of $391) | $13,720,307 |
Income from affiliated securities | 152,555 |
Total investment income | 13,872,862 |
Expenses | |
Advisory fee | 1,505,843 |
Custody and accounting fees | 40,641 |
Professional fees | 87,859 |
Interest holder report expenses | 22,674 |
Trustees’ fees and expenses | 25,324 |
Other fees and expenses | 23,191 |
Total expenses | 1,705,532 |
Less: Fee waivers and/or expense reimbursements | (241,853 ) |
Net expenses | 1,463,679 |
Net investment income | 12,409,183 |
Realized and unrealized gains (losses) on investments | |
Net realized losses on | |
Unaffiliated securities | (7,265,089 ) |
Affiliated securities | (35 ) |
Net realized losses on investments | (7,265,124 ) |
Net change in unrealized gains (losses) on investments | (12,064,983 ) |
Net realized and unrealized gains (losses) on investments | (19,330,107 ) |
Net decrease in net assets resulting from operations | $(6,920,924 ) |
Year ended May 31, 2023 | Year ended May 31, 2022 | |||
Operations | ||||
Net investment income | $12,409,183 | $12,188,105 | ||
Net realized losses on investments | (7,265,124 ) | (1,161,647 ) | ||
Net change in unrealized gains (losses) on investments | (12,064,983 ) | (48,938,887 ) | ||
Net decrease in net assets resulting from operations | (6,920,924 ) | (37,912,429 ) | ||
Capital transactions | ||||
Transactions in investors’ beneficial interests | ||||
Contributions | 15,013,309 | 43,182,233 | ||
Withdrawals | (68,274,062 ) | (83,560,206 ) | ||
Net decrease in net assets resulting from capital transactions | (53,260,753 ) | (40,377,973 ) | ||
Total decrease in net assets | (60,181,677 ) | (78,290,402 ) | ||
Net assets | ||||
Beginning of period | 417,884,919 | 496,175,321 | ||
End of period | $357,703,242 | $417,884,919 | ||
Year ended May 31 | |||||
2023 | 2022 | 2021 | 2020 | 2019 | |
Total return | (1.46 )% | (8.13 )% | 2.52 % | 7.51 % | 7.22 % |
Ratios to average net assets (annualized) | |||||
Gross expenses | 0.45 % | 0.44 % | 0.44 % | 0.42 % | 0.41 % |
Net expenses1 | 0.39 % | 0.39 % | 0.39 % | 0.39 % | 0.39 % |
Net investment income | 3.30 % | 2.52 % | 2.49 % | 3.10 % | 3.24 % |
Supplemental data | |||||
Portfolio turnover rate | 37 % | 74 % | 31 % | 40 % | 232 % |
1 | Net expense ratios reflect voluntary waivers, if any. |
Gross unrealized gains | $627,728 |
Gross unrealized losses | (40,397,784 ) |
Net unrealized losses | $(39,770,056 ) |
Quoted prices (Level 1) | Other significant observable inputs (Level 2) | Significant unobservable inputs (Level 3) | Total | |
Assets | ||||
Investments in: | ||||
Agency securities | $0 | $73,783,193 | $0 | $73,783,193 |
Asset-backed securities | 0 | 27,970,114 | 0 | 27,970,114 |
Corporate bonds and notes | 0 | 139,665,946 | 0 | 139,665,946 |
Municipal obligations | 0 | 29,285,369 | 0 | 29,285,369 |
Non-agency mortgage-backed securities | 0 | 28,139,607 | 0 | 28,139,607 |
U.S. Treasury securities | 28,277,060 | 0 | 0 | 28,277,060 |
Yankee corporate bonds and notes | 0 | 25,018,603 | 0 | 25,018,603 |
Short-term investments | ||||
Investment companies | 3,306,168 | 0 | 0 | 3,306,168 |
Total assets | $31,583,228 | $323,862,832 | $0 | $355,446,060 |
Average daily net assets | Advisory fee |
First $500 million | 0.400 % |
Next $500 million | 0.375 |
Next $2 billion | 0.350 |
Next $2 billion | 0.325 |
Next $5 billion | 0.300 |
Over $10 billion | 0.290 |
Purchases at cost | Sales proceeds | ||
U.S. government | Non-U.S. government | U.S. government | Non-U.S. government |
$59,785,859 | $79,262,869 | $63,361,680 | $98,957,519 |
Allspring Master Trust:

Name and year of birth | Position held and length of service* | Principal occupations during past five years or longer | Current other public company or investment company directorships |
William R. Ebsworth (Born 1957) | Trustee, since 2015 | Retired. From 1984 to 2013, equities analyst, portfolio manager, research director and chief investment officer at Fidelity Management and Research Company in Boston, Tokyo, and Hong Kong, and retired in 2013 as Chief Investment Officer of Fidelity Strategic Advisers, Inc. where he led a team of investment professionals managing client assets. Prior thereto, Board member of Hong Kong Securities Clearing Co., Hong Kong Options Clearing Corp., the Thailand International Fund, Ltd., Fidelity Investments Life Insurance Company, and Empire Fidelity Investments Life Insurance Company. Audit Committee Chair and Investment Committee Chair of the Vincent Memorial Hospital Foundation (non-profit organization). Mr. Ebsworth is a CFA charterholder. | N/A |
Jane A. Freeman (Born 1953) | Trustee, since 2015; Chair Liaison, since 2018 | Retired. From 2012 to 2014 and 1999 to 2008, Chief Financial Officer of Scientific Learning Corporation. From 2008 to 2012, Ms. Freeman provided consulting services related to strategic business projects. Prior to 1999, Portfolio Manager at Rockefeller & Co. and Scudder, Stevens & Clark. Board member of the Harding Loevner Funds from 1996 to 2014, serving as both Lead Independent Director and chair of the Audit Committee. Board member of the Russell Exchange Traded Funds Trust from 2011 to 2012 and the chair of the Audit Committee. Ms. Freeman is also an inactive Chartered Financial Analyst. | N/A |
Isaiah Harris, Jr. (Born 1952) | Trustee, since 2009; Audit Committee Chair, since 2019 | Retired. Member of the Advisory Board of CEF of East Central Florida. Chairman of the Board of CIGNA Corporation from 2009 to 2021, and Director from 2005 to 2008. From 2003 to 2011, Director of Deluxe Corporation. Prior thereto, President and CEO of BellSouth Advertising and Publishing Corp. from 2005 to 2007, President and CEO of BellSouth Enterprises from 2004 to 2005 and President of BellSouth Consumer Services from 2000 to 2003. Emeritus member of the Iowa State University Foundation Board of Governors. Emeritus Member of the Advisory board of Iowa State University School of Business. Advisory Board Member, Palm Harbor Academy (private school). Advisory Board Member, Fellowship of Christian Athletes. Mr. Harris is a certified public accountant (inactive status). | N/A |
David F. Larcker (Born 1950) | Trustee, since 2009 | Distinguished Visiting Fellow at the Hoover Institution since 2022. James Irvin Miller Professor of Accounting at the Graduate School of Business (Emeritus), Stanford University, Director of the Corporate Governance Research Initiative and Senior Faculty of The Rock Center for Corporate Governance since 2006. From 2005 to 2008, Professor of Accounting at the Graduate School of Business, Stanford University. Prior thereto, Ernst & Young Professor of Accounting at The Wharton School, University of Pennsylvania from 1985 to 2005. | N/A |
Olivia S. Mitchell (Born 1953) | Trustee, since 2006; Nominating and Governance Committee Chair, since 2018 | International Foundation of Employee Benefit Plans Professor since 1993, Wharton School of the University of Pennsylvania. Director of Wharton’s Pension Research Council and Boettner Center on Pensions & Retirement Research, and Research Associate at the National Bureau of Economic Research. Previously taught at Cornell University from 1978 to 1993. | N/A |
Timothy J. Penny (Born 1951) | Trustee, since 1996; Chair, since 2018 | President and Chief Executive Officer of Southern Minnesota Initiative Foundation, a non-profit organization, since 2007. Vice Chair of the Economic Club of Minnesota, since 2007. Co-Chair of the Committee for a Responsible Federal Budget, since 1995. Member of the Board of Trustees of NorthStar Education Finance, Inc., a non-profit organization, from 2007-2022. Senior Fellow of the University of Minnesota Humphrey Institute from 1995 to 2017. | N/A |
Name and year of birth | Position held and length of service* | Principal occupations during past five years or longer | Current other public company or investment company directorships |
James G. Polisson (Born 1959) | Trustee, since 2018 | Retired. Chief Marketing Officer, Source (ETF) UK Services, Ltd, from 2015 to 2017. From 2012 to 2015, Principal of The Polisson Group, LLC, a management consulting, corporate advisory and principal investing company. Chief Executive Officer and Managing Director at Russell Investments, Global Exchange Traded Funds from 2010 to 2012. Managing Director of Barclays Global Investors from 1998 to 2010 and Global Chief Marketing Officer for iShares and Barclays Global Investors from 2000 to 2010. Trustee of the San Francisco Mechanics’ Institute, a non- profit organization, from 2013 to 2015. Board member of the Russell Exchange Traded Fund Trust from 2011 to 2012. Director of Barclays Global Investors Holdings Deutschland GmbH from 2006 to 2009. Mr. Polisson is an attorney and has a retired status with the Massachusetts and District of Columbia Bar Associations. | N/A |
Pamela Wheelock (Born 1959) | Trustee, since January 2020; previously Trustee from January 2018 to July 2019 | Retired. Executive and Senior Financial leadership positions in the public, private and nonprofit sectors. Interim President and CEO, McKnight Foundation, 2020. Interim Commissioner, Minnesota Department of Human Services, 2019. Chief Operating Officer, Twin Cities Habitat for Humanity, 2017-2019. Vice President for University Services, University of Minnesota, 2012- 2016. Interim President and CEO, Blue Cross and Blue Shield of Minnesota, 2011-2012. Executive Vice-President and Chief Financial Officer, Minnesota Wild, 2002-2008. Commissioner, Minnesota Department of Finance, 1999-2002. Chair of the Board of Directors of Destination Medical Center Corporation. Board member of the Minnesota Wild Foundation. | N/A |
* | Length of service dates reflect the Trustee’s commencement of service with the Trust’s predecessor entities, where applicable. |
Name and year of birth | Position held and length of service | Principal occupations during past five years or longer |
Andrew Owen (Born 1960) | President, since 2017 | President and Chief Executive Officer of Allspring Funds Management, LLC since 2017 and Head of Global Fund Governance of Allspring Global Investments since 2022. Prior thereto, co-president of Galliard Capital Management, LLC, an affiliate of Allspring Funds Management, LLC, from 2019 to 2022 and Head of Affiliated Managers, Allspring Global Investments, from 2014 to 2019 and Executive Vice President responsible for marketing, investments and product development for Allspring Funds Management, LLC, from 2009 to 2014. |
Jeremy DePalma (Born 1974) | Treasurer, since 2012 (for certain funds in the Fund Complex); since 2021 (for the remaining funds in the Complex) | Senior Vice President of Allspring Funds Management, LLC since 2009. Senior Vice President of Evergreen Investment Management Company, LLC from 2008 to 2010 and head of the Fund Reporting and Control Team within Fund Administration from 2005 to 2010. |
Christopher Baker (Born 1976) | Chief Compliance Officer, since 2022 | Global Chief Compliance Officer for Allspring Global Investments since 2022. Prior thereto, Chief Compliance Officer for State Street Global Advisors from 2018 to 2021. Senior Compliance Officer for the State Street divisions of Alternative Investment Solutions, Sector Solutions, and Global Marketing from 2015 to 2018. From 2010 to 2015 Vice President, Global Head of Investment and Marketing Compliance for State Street Global Advisors. |
Matthew Prasse (Born 1983) | Chief Legal Officer, since 2022; Secretary, since 2021 | Senior Counsel of the Allspring Legal Department since 2021. Senior Counsel of the Wells Fargo Legal Department from 2018 to 2021. Previously, Counsel for Barings LLC from 2015 to 2018. Prior to joining Barings, Associate at Morgan, Lewis & Bockius LLP from 2008 to 2015. |

P.O. Box 219967
Kansas City, MO 64121-9967
2 | |
6 | |
10 | |
11 | |
12 | |
13 | |
14 | |
15 | |
20 | |
24 | |
25 | |
36 | |
37 | |
38 | |
39 | |
40 | |
45 | |
46 |

Allspring Funds

President
Allspring Funds
Notice to Shareholders |
At a meeting held on May 16-17, 2023, the Board of Trustees approved a number of changes to the principal investment strategy of the Real Return Portfolio, the master portfolio in which the Fund invests substantially all of its assets. These changes include: |
• A reduction in the amount the Real Return Portfolio invests in fixed income securities, from a minimum of 80% to a maximum of 70%; |
• An increase in the amount the Real Return Portfolio may invest in equity securities, from a maximum of 20% to a maximum of 70%; |
• The introduction of a Cayman subsidiary, in which the Portfolio may invest up to 25% of its assets in order to gain exposure to commodity investments; |
• The incorporation of certain derivatives overlay strategies to attempt to manage short-term volatility, mitigate risk and/or improve returns under certain market conditions; |
• The addition of Allspring Global Investments (UK) Limited as an additional sub-adviser to the Real Return Portfolio. |
These changes are expected to become effective on or about December 1, 2023. |
Notice to Shareholders |
Beginning in July 2024, the Fund will be required by the Securities and Exchange Commission to send shareholders a paper copy of a new tailored shareholder report in place of the full shareholder report that you are now receiving. The tailored shareholder report will contain concise information about the Fund, including certain expense and performance information and fund statistics. If you wish to receive this new tailored shareholder report electronically, please follow the instructions on the back cover of this report. |
Other information that is currently included in the shareholder report, such as the Fund’s financial statements, will be available online and upon request, free of charge, in paper or electronic format. |
Investment objective | The Fund seeks returns that exceed the rate of inflation over the long-term. |
Manager | Allspring Funds Management, LLC |
Subadviser for the affiliated master portfolio* | Allspring Global Investments, LLC |
Portfolio managers | Kandarp R. Acharya, CFA, FRM, Petros N. Bocray, CFA, FRM, Michael Bradshaw, CFA, Travis L. Keshemberg, CFA, CIPM, FRM, Garth B. Newport, CFA, Michael Schueller, CFA, Michal Stanczy |
Average annual total returns (%) as of May 31, 2023 | |||||||||
Including sales charge | Excluding sales charge | Expense ratios1 (%) | |||||||
Inception date | 1 year | 5 year | 10 year | 1 year | 5 year | 10 year | Gross | Net2 | |
Class A (IPBAX) | 2-28-2003 | -7.46 | 1.68 | 1.33 | -3.10 | 2.62 | 1.80 | 1.36 | 0.77 |
Class C (IPBCX) | 2-28-2003 | -4.89 | 1.85 | 1.19 | -3.89 | 1.85 | 1.19 | 2.11 | 1.52 |
Class R6 (IPBJX)3 | 10-31-2016 | – | – | – | -2.68 | 3.03 | 2.16 | 0.69 | 0.40 |
Administrator Class (IPBIX) | 2-28-2003 | – | – | – | -2.87 | 2.82 | 2.02 | 1.01 | 0.60 |
Institutional Class (IPBNX)4 | 10-31-2016 | – | – | – | -2.83 | 2.94 | 2.11 | 0.74 | 0.45 |
Bloomberg U.S. TIPS Index5 | – | – | – | – | -4.20 | 2.64 | 1.75 | – | – |
CPI6 | – | – | – | – | 4.05 | 3.87 | 2.70 | – | – |
1 | Reflects the expense ratios as stated in the most recent prospectuses. The expense ratios shown are subject to change and may differ from the annualized expense ratios shown in the financial highlights of this report. |
2 | The manager has contractually committed through September 30, 2023 (September 30, 2024 for Class A and Class C), to waive fees and/or reimburse expenses to the extent necessary to cap total annual fund operating expenses after fee waivers at 0.77% for Class A, 1.52% for Class C, 0.40% for Class R6, 0.60% for Administrator Class and 0.45% for Institutional Class. Brokerage commissions, stamp duty fees, interest, taxes, acquired fund fees and expenses (if any) from funds in which the affiliated master portfolio invests, and extraordinary expenses are excluded from the expense caps. Net expenses from the affiliated master portfolio are included in the expense caps. Prior to or after the commitment expiration date, the caps may be increased or the commitment to maintain the caps may be terminated only with the approval of the Board of Trustees. Without these caps, the Fund’s returns would have been lower. The expense ratio paid by an investor is the net expense ratio (the total annual fund operating expenses after fee waivers) as stated in the prospectuses. |
3 | Historical performance shown for the Class R6 shares prior to their inception reflects the performance of the Administrator Class shares, and is not adjusted to reflect the Class R6 expenses. If these expenses had been included, returns for the Class R6 shares would be higher. |
4 | Historical performance shown for the Institutional Class shares prior to their inception reflects the performance of the Administrator Class shares, and includes the higher expenses applicable to the Administrator Class shares. If these expenses had not been included, returns for the Institutional Class shares would be higher. |
5 | The Bloomberg U.S. Treasury Inflation-Protected Securities (TIPS) Index is an index of inflation-indexed-linked U.S. Treasury securities. You cannot invest directly in an index. |
6 | The U.S. Consumer Price Index (CPI) is a measure of the average change over time in the prices paid by urban consumers for a market basket of consumer goods and services. You cannot invest directly in an index. |
* | The Fund is a feeder fund in a master-feeder structure that invests substantially all of its assets in a single affiliated master portfolio of the Allspring Master Trust with a substantially identical investment objective and substantially similar investment strategies. References to the investment activities of the Fund are intended to refer to the investment activities of the affiliated master portfolio in which it invests. |
CFA® and Chartered Financial Analyst® are trademarks owned by CFA Institute. | |
Growth of $10,000 investment as of May 31, 20231 |
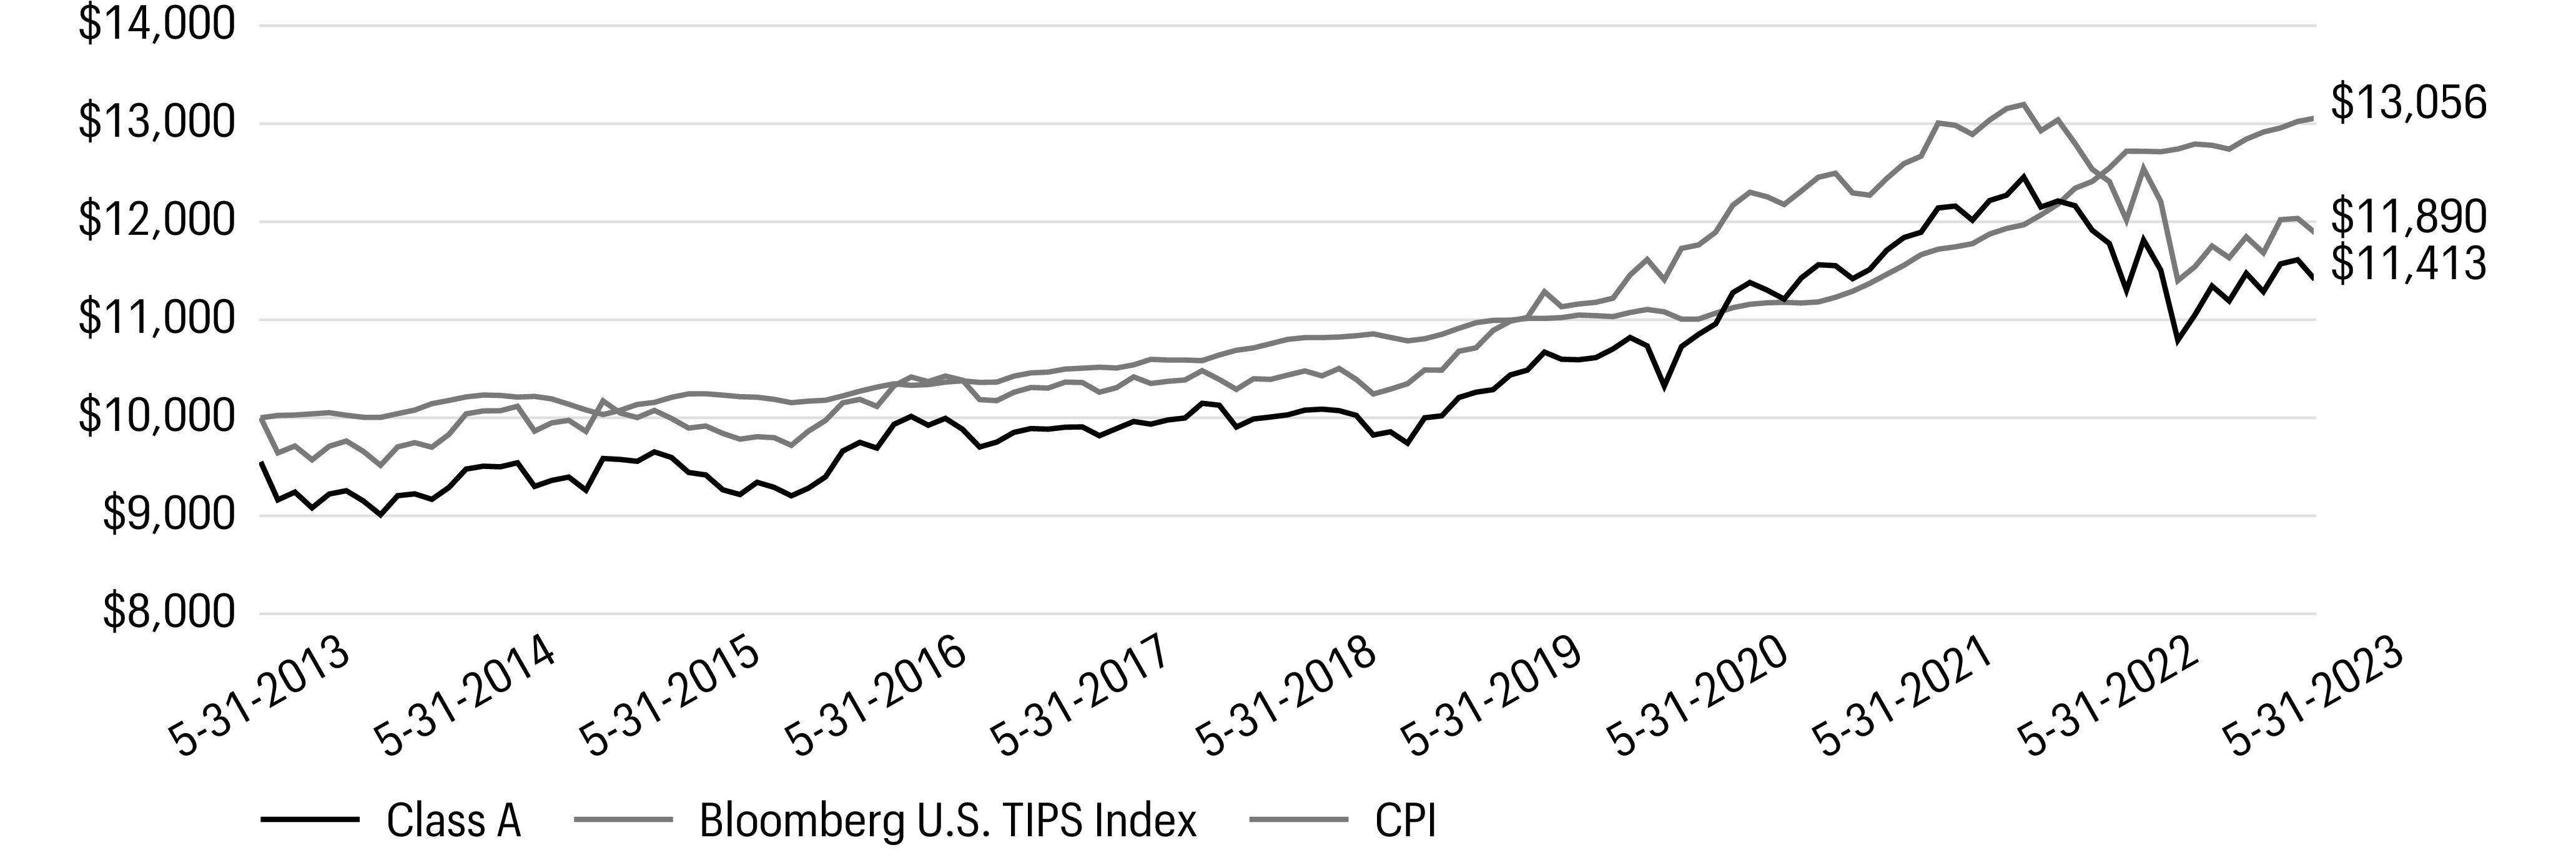
1 | The chart compares the performance of Class A shares for the most recent ten years with the Bloomberg U.S. TIPS Index and CPI. The chart assumes a hypothetical investment of $10,000 in Class A shares and reflects all operating expenses and assumes the maximum initial sales charge of 4.50%. |
Ten largest holdings (%) as of May 31, 20231 | |
TIPS, 0.13%, 4-15-2025 | 4.09 |
TIPS, 0.13%, 4-15-2026 | 2.85 |
TIPS, 0.13%, 1-15-2032 | 2.43 |
TIPS, 0.13%, 4-15-2027 | 2.36 |
TIPS, 0.63%, 7-15-2032 | 2.34 |
TIPS, 0.63%, 1-15-2026 | 2.28 |
TIPS, 0.13%, 1-15-2031 | 2.14 |
TIPS, 0.13%, 1-15-2030 | 2.12 |
TIPS, 0.13%, 10-15-2024 | 1.99 |
TIPS, 1.63%, 10-15-2027 | 1.97 |
1 | Each holding represents the Fund’s allocable portion of the affiliated master portfolio security. Figures represent each holding as a percentage of the Fund’s net assets. Holdings are subject to change and may have changed since the date specified. |
Portfolio allocation as of May 31, 20231 |

1 | Figures represent the portfolio allocation of the affiliated master portfolio as a percentage of the long-term investments of the affiliated master portfolio. Allocations are subject to change and may have changed since the date specified. |
Beginning account value 12-1-2022 | Ending account value 5-31-2023 | Expenses paid during the period1, 2 | Annualized net expense ratio2 | |
Class A | ||||
Actual | $1,000.00 | $1,000.06 | $3.89 | 0.78 % |
Hypothetical (5% return before expenses) | $1,000.00 | $1,021.04 | $3.93 | 0.78 % |
Class C | ||||
Actual | $1,000.00 | $1,000.01 | $7.63 | 1.53 % |
Hypothetical (5% return before expenses) | $1,000.00 | $1,017.30 | $7.70 | 1.53 % |
Class R6 | ||||
Actual | $1,000.00 | $1,000.08 | $1.99 | 0.40 % |
Hypothetical (5% return before expenses) | $1,000.00 | $1,022.94 | $2.02 | 0.40 % |
Administrator Class | ||||
Actual | $1,000.00 | $1,000.07 | $2.99 | 0.60 % |
Hypothetical (5% return before expenses) | $1,000.00 | $1,021.94 | $3.02 | 0.60 % |
Institutional Class | ||||
Actual | $1,000.00 | $1,000.07 | $2.24 | 0.45 % |
Hypothetical (5% return before expenses) | $1,000.00 | $1,022.69 | $2.27 | 0.45 % |
Value | ||||||
Investment companies: 99.96% | ||||||
Affiliated master portfolio: 99.96% | ||||||
Allspring Real Return Portfolio | $79,762,485 | |||||
Total investment companies (Cost $83,976,426) | 79,762,485 | |||||
Total investments in securities (Cost $83,976,426) | 99.96 % | 79,762,485 | ||||
Other assets and liabilities, net | 0.04 | 27,933 | ||||
Total net assets | 100.00 % | $79,790,418 | ||||
% of ownership, beginning of period | % of ownership, end of period | Net realized gains (losses) on investments allocated from affiliated Master Portfolio | Net change in unrealized gains (losses) on investments allocated from affiliated Master Portfolio | Interest allocated from affiliated Master Portfolio | Dividends allocated from affiliated Master Portfolio | Affiliated Income Allocated from affiliated Master Portfolio | Value, end of period | |
Allspring Real Return Portfolio | 40.08 % | 37.67 % | $(569,850 ) | $(5,808,663 ) | $3,684,700 | $284,403 | $26,614 | $79,762,485 |
Assets | |
Investments in affiliated Master Portfolio, at value (cost $83,976,426) | $79,762,485 |
Receivable for Fund shares sold | 79,829 |
Receivable from manager | 26,479 |
Prepaid expenses and other assets | 50,627 |
Total assets | 79,919,420 |
Liabilities | |
Payable for Fund shares redeemed | 97,348 |
Shareholder report expenses payable | 13,595 |
Administration fees payable | 6,034 |
Distribution fee payable | 893 |
Trustees’ fees and expenses payable | 504 |
Accrued expenses and other liabilities | 10,628 |
Total liabilities | 129,002 |
Total net assets | $79,790,418 |
Net assets consist of | |
Paid-in capital | $85,158,434 |
Total distributable loss | (5,368,016 ) |
Total net assets | $79,790,418 |
Computation of net asset value and offering price per share | |
Net assets–Class A | $12,861,489 |
Shares outstanding–Class A1 | 1,339,678 |
Net asset value per share–Class A | $9.60 |
Maximum offering price per share – Class A2 | $10.05 |
Net assets–Class C | $1,380,346 |
Shares outstanding–Class C1 | 146,632 |
Net asset value per share–Class C | $9.41 |
Net assets–Class R6 | $15,796,423 |
Shares outstanding–Class R61 | 1,625,707 |
Net asset value per share–Class R6 | $9.72 |
Net assets–Administrator Class | $13,226,891 |
Shares outstanding–Administrator Class1 | 1,348,813 |
Net asset value per share–Administrator Class | $9.81 |
Net assets–Institutional Class | $36,525,269 |
Shares outstanding–Institutional Class1 | 3,760,416 |
Net asset value per share–Institutional Class | $9.71 |
1 | The Fund has an unlimited number of authorized shares. |
2 | Maximum offering price is computed as 100/95.50 of net asset value. On investments of $50,000 or more, the offering price is reduced. |
Investment income | |
Interest allocated from affiliated Master Portfolio | $3,684,700 |
Dividends allocated from affiliated Master Portfolio (net of foreign withholding taxes of $4,059) | 284,403 |
Affiliated income allocated from affiliated Master Portfolio | 26,614 |
Expenses allocated from affiliated Master Portfolio | (400,943 ) |
Waivers allocated from affiliated Master Portfolio | 83,606 |
Total investment income | 3,678,380 |
Expenses | |
Management fee | 40,736 |
Administration fees | |
Class A | 24,441 |
Class C | 2,525 |
Class R6 | 3,739 |
Administrator Class | 14,170 |
Institutional Class | 30,386 |
Shareholder servicing fees | |
Class A | 38,189 |
Class C | 3,945 |
Administrator Class | 34,344 |
Distribution fee | |
Class C | 11,834 |
Custody and accounting fees | 3,858 |
Professional fees | 51,170 |
Registration fees | 74,500 |
Shareholder report expenses | 35,425 |
Trustees’ fees and expenses | 22,896 |
Other fees and expenses | 6,558 |
Total expenses | 398,716 |
Less: Fee waivers and/or expense reimbursements | |
Fund-level | (251,381 ) |
Class A | (174 ) |
Administrator Class | (15,591 ) |
Net expenses | 131,570 |
Net investment income | 3,546,810 |
Realized and unrealized gains (losses) on investments | |
Net realized losses on investments allocated from affiliated Master Portfolio | (569,850 ) |
Net change in unrealized gains (losses) on investments allocated from affiliated Master Portfolio | (5,808,663 ) |
Net realized and unrealized gains (losses) on investments | (6,378,513 ) |
Net decrease in net assets resulting from operations | $(2,831,703 ) |
Year ended May 31, 2023 | Year ended May 31, 2022 | |||
Operations | ||||
Net investment income | $3,546,810 | $4,090,448 | ||
Net realized gains (losses) on investments | (569,850 ) | 935,582 | ||
Net change in unrealized gains (losses) on investments | (5,808,663 ) | (6,398,528 ) | ||
Net decrease in net assets resulting from operations | (2,831,703 ) | (1,372,498 ) | ||
Distributions to shareholders from | ||||
Net investment income and net realized gains | ||||
Class A | (686,543 ) | (836,596 ) | ||
Class C | (58,742 ) | (65,210 ) | ||
Class R6 | (631,554 ) | (755,640 ) | ||
Administrator Class | (629,068 ) | (640,606 ) | ||
Institutional Class | (1,775,616 ) | (1,520,901 ) | ||
Total distributions to shareholders | (3,781,523 ) | (3,818,953 ) | ||
Capital share transactions | Shares | Shares | ||
Proceeds from shares sold | ||||
Class A | 216,818 | 2,123,638 | 791,258 | 8,668,328 |
Class C | 20,544 | 198,706 | 91,579 | 986,457 |
Class R6 | 737,592 | 7,332,284 | 486,424 | 5,304,807 |
Administrator Class | 314,479 | 3,161,931 | 894,909 | 9,920,837 |
Institutional Class | 1,603,544 | 15,812,126 | 4,023,778 | 44,177,808 |
28,628,685 | 69,058,237 | |||
Reinvestment of distributions | ||||
Class A | 58,661 | 574,829 | 63,937 | 691,464 |
Class C | 6,058 | 58,298 | 6,087 | 64,531 |
Class R6 | 63,670 | 631,451 | 60,586 | 663,004 |
Administrator Class | 60,525 | 604,578 | 55,532 | 610,960 |
Institutional Class | 179,364 | 1,775,461 | 139,813 | 1,520,105 |
3,644,617 | 3,550,064 | |||
Payment for shares redeemed | ||||
Class A | (646,932 ) | (6,291,558 ) | (408,579 ) | (4,414,389 ) |
Class C | (48,172 ) | (457,734 ) | (40,714 ) | (429,356 ) |
Class R6 | (539,506 ) | (5,392,372 ) | (2,460,305 ) | (27,125,717 ) |
Administrator Class | (472,903 ) | (4,663,703 ) | (691,012 ) | (7,672,910 ) |
Institutional Class | (2,205,751 ) | (21,830,616 ) | (956,389 ) | (10,220,364 ) |
(38,635,983 ) | (49,862,736 ) | |||
Net increase (decrease) in net assets resulting from capital share transactions | (6,362,681 ) | 22,745,565 | ||
Total increase (decrease) in net assets | (12,975,907 ) | 17,554,114 | ||
Net assets | ||||
Beginning of period | 92,766,325 | 75,212,211 | ||
End of period | $79,790,418 | $92,766,325 | ||
(For a share outstanding throughout each period)
Year ended May 31 | |||||
Class A | 2023 | 2022 | 2021 | 2020 | 2019 |
Net asset value, beginning of period | $10.35 | $10.93 | $10.22 | $9.89 | $9.87 |
Net investment income | 0.40 1 | 0.56 1 | 0.22 | 0.12 | 0.15 |
Net realized and unrealized gains (losses) on investments | (0.72 ) | (0.60 ) | 0.70 | 0.42 | 0.09 |
Total from investment operations | (0.32 ) | (0.04 ) | 0.92 | 0.54 | 0.24 |
Distributions to shareholders from | |||||
Net investment income | (0.43 ) | (0.54 ) | (0.21 ) | (0.21 ) | (0.19 ) |
Net realized gains | 0.00 | 0.00 | 0.00 | 0.00 | (0.03 ) |
Total distributions to shareholders | (0.43 ) | (0.54 ) | (0.21 ) | (0.21 ) | (0.22 ) |
Net asset value, end of period | $9.60 | $10.35 | $10.93 | $10.22 | $9.89 |
Total return2 | (3.10 )% | (0.52 )% | 9.10 % | 5.48 % | 2.56 % |
Ratios to average net assets (annualized)* | |||||
Gross expenses | 1.09 % | 1.07 % | 1.29 % | 1.43 % | 1.16 % |
Net expenses | 0.78 % | 0.78 % | 0.78 % | 0.78 % | 0.77 % |
Net investment income | 4.12 % | 5.13 % | 2.09 % | 1.79 % | 1.95 % |
Supplemental data | |||||
Portfolio turnover rate3 | 22 % | 31 % | 20 % | 24 % | 39 % |
Net assets, end of period (000s omitted) | $12,861 | $17,713 | $13,825 | $13,196 | $17,716 |
* | Ratios include net expenses allocated from the affiliated Master Portfolio which were as follows: |
Year ended May 31, 2023 | 0.39% |
Year ended May 31, 2022 | 0.39% |
Year ended May 31, 2021 | 0.39% |
Year ended May 31, 2020 | 0.39% |
Year ended May 31, 2019 | 0.39% |
1 | Calculated based upon average shares outstanding |
2 | Total return calculations do not include any sales charges. |
3 | Portfolio turnover rate is calculated by multiplying the affiliated Master Portfolio’s percentage of the Fund’s total investment in securities at the end of the period by the affiliated Master Portfolio’s portfolio turnover rate. |
(For a share outstanding throughout each period)
Year ended May 31 | |||||
Class C | 2023 | 2022 | 2021 | 2020 | 2019 |
Net asset value, beginning of period | $10.16 | $10.74 | $10.06 | $9.73 | $9.73 |
Net investment income | 0.32 1 | 0.47 1 | 0.12 1 | 0.11 1 | 0.10 1 |
Net realized and unrealized gains (losses) on investments | (0.71 ) | (0.59 ) | 0.71 | 0.35 | 0.07 |
Total from investment operations | (0.39 ) | (0.12 ) | 0.83 | 0.46 | 0.17 |
Distributions to shareholders from | |||||
Net investment income | (0.36 ) | (0.46 ) | (0.15 ) | (0.13 ) | (0.14 ) |
Net realized gains | 0.00 | 0.00 | 0.00 | 0.00 | (0.03 ) |
Total distributions to shareholders | (0.36 ) | (0.46 ) | (0.15 ) | (0.13 ) | (0.17 ) |
Net asset value, end of period | $9.41 | $10.16 | $10.74 | $10.06 | $9.73 |
Total return2 | (3.89 )% | (1.26 )% | 8.27 % | 4.77 % | 1.79 % |
Ratios to average net assets (annualized)* | |||||
Gross expenses | 1.84 % | 1.81 % | 2.06 % | 2.18 % | 1.91 % |
Net expenses | 1.53 % | 1.53 % | 1.53 % | 1.53 % | 1.52 % |
Net investment income | 3.32 % | 4.42 % | 1.17 % | 1.09 % | 1.08 % |
Supplemental data | |||||
Portfolio turnover rate3 | 22 % | 31 % | 20 % | 24 % | 39 % |
Net assets, end of period (000s omitted) | $1,380 | $1,709 | $1,195 | $1,714 | $2,553 |
* | Ratios include net expenses allocated from the affiliated Master Portfolio which were as follows: |
Year ended May 31, 2023 | 0.39% |
Year ended May 31, 2022 | 0.39% |
Year ended May 31, 2021 | 0.39% |
Year ended May 31, 2020 | 0.39% |
Year ended May 31, 2019 | 0.39% |
1 | Calculated based upon average shares outstanding |
2 | Total return calculations do not include any sales charges. |
3 | Portfolio turnover rate is calculated by multiplying the affiliated Master Portfolio’s percentage of the Fund’s total investment in securities at the end of the period by the affiliated Master Portfolio’s portfolio turnover rate. |
(For a share outstanding throughout each period)
Year ended May 31 | |||||
Class R6 | 2023 | 2022 | 2021 | 2020 | 2019 |
Net asset value, beginning of period | $10.47 | $11.05 | $10.33 | $9.99 | $9.96 |
Net investment income | 0.46 1 | 0.63 1 | 0.29 | 0.22 | 0.23 1 |
Net realized and unrealized gains (losses) on investments | (0.74 ) | (0.63 ) | 0.69 | 0.37 | 0.06 |
Total from investment operations | (0.28 ) | 0.00 | 0.98 | 0.59 | 0.29 |
Distributions to shareholders from | |||||
Net investment income | (0.47 ) | (0.58 ) | (0.26 ) | (0.25 ) | (0.23 ) |
Net realized gains | 0.00 | 0.00 | 0.00 | 0.00 | (0.03 ) |
Total distributions to shareholders | (0.47 ) | (0.58 ) | (0.26 ) | (0.25 ) | (0.26 ) |
Net asset value, end of period | $9.72 | $10.47 | $11.05 | $10.33 | $9.99 |
Total return | (2.68 )% | (0.15 )% | 9.52 % | 5.94 % | 2.99 % |
Ratios to average net assets (annualized)* | |||||
Gross expenses | 0.71 % | 0.68 % | 0.85 % | 1.05 % | 0.82 % |
Net expenses | 0.40 % | 0.40 % | 0.40 % | 0.40 % | 0.39 % |
Net investment income | 4.68 % | 5.68 % | 2.70 % | 2.08 % | 2.34 % |
Supplemental data | |||||
Portfolio turnover rate2 | 22 % | 31 % | 20 % | 24 % | 39 % |
Net assets, end of period (000s omitted) | $15,796 | $14,282 | $36,202 | $18,224 | $14,358 |
* | Ratios include net expenses allocated from the affiliated Master Portfolio which were as follows: |
Year ended May 31, 2023 | 0.39% |
Year ended May 31, 2022 | 0.39% |
Year ended May 31, 2021 | 0.39% |
Year ended May 31, 2020 | 0.39% |
Year ended May 31, 2019 | 0.39% |
1 | Calculated based upon average shares outstanding |
2 | Portfolio turnover rate is calculated by multiplying the affiliated Master Portfolio’s percentage of the Fund’s total investment in securities at the end of the period by the affiliated Master Portfolio’s portfolio turnover rate. |
(For a share outstanding throughout each period)
Year ended May 31 | |||||
Administrator Class | 2023 | 2022 | 2021 | 2020 | 2019 |
Net asset value, beginning of period | $10.55 | $11.12 | $10.38 | $10.03 | $9.99 |
Net investment income | 0.42 1 | 0.60 1 | 0.25 1 | 0.20 1 | 0.21 1 |
Net realized and unrealized gains (losses) on investments | (0.72 ) | (0.63 ) | 0.71 | 0.36 | 0.06 |
Total from investment operations | (0.30 ) | (0.03 ) | 0.96 | 0.56 | 0.27 |
Distributions to shareholders from | |||||
Net investment income | (0.44 ) | (0.54 ) | (0.22 ) | (0.21 ) | (0.20 ) |
Net realized gains | 0.00 | 0.00 | 0.00 | 0.00 | (0.03 ) |
Total distributions to shareholders | (0.44 ) | (0.54 ) | (0.22 ) | (0.21 ) | (0.23 ) |
Net asset value, end of period | $9.81 | $10.55 | $11.12 | $10.38 | $10.03 |
Total return | (2.87 )% | (0.36 )% | 9.31 % | 5.67 % | 2.78 % |
Ratios to average net assets (annualized)* | |||||
Gross expenses | 1.02 % | 0.99 % | 1.23 % | 1.37 % | 1.10 % |
Net expenses | 0.60 % | 0.60 % | 0.60 % | 0.60 % | 0.59 % |
Net investment income | 4.24 % | 5.42 % | 2.26 % | 1.92 % | 2.15 % |
Supplemental data | |||||
Portfolio turnover rate2 | 22 % | 31 % | 20 % | 24 % | 39 % |
Net assets, end of period (000s omitted) | $13,227 | $15,267 | $13,203 | $13,544 | $13,562 |
* | Ratios include net expenses allocated from the affiliated Master Portfolio which were as follows: |
Year ended May 31, 2023 | 0.39% |
Year ended May 31, 2022 | 0.39% |
Year ended May 31, 2021 | 0.39% |
Year ended May 31, 2020 | 0.39% |
Year ended May 31, 2019 | 0.39% |
1 | Calculated based upon average shares outstanding |
2 | Portfolio turnover rate is calculated by multiplying the affiliated Master Portfolio’s percentage of the Fund’s total investment in securities at the end of the period by the affiliated Master Portfolio’s portfolio turnover rate. |
(For a share outstanding throughout each period)
Year ended May 31 | |||||
Institutional Class | 2023 | 2022 | 2021 | 2020 | 2019 |
Net asset value, beginning of period | $10.47 | $11.05 | $10.33 | $9.99 | $9.97 |
Net investment income | 0.44 1 | 0.63 1 | 0.26 | 0.21 | 0.22 |
Net realized and unrealized gains (losses) on investments | (0.74 ) | (0.64 ) | 0.71 | 0.37 | 0.05 |
Total from investment operations | (0.30 ) | (0.01 ) | 0.97 | 0.58 | 0.27 |
Distributions to shareholders from | |||||
Net investment income | (0.46 ) | (0.57 ) | (0.25 ) | (0.24 ) | (0.22 ) |
Net realized gains | 0.00 | 0.00 | 0.00 | 0.00 | (0.03 ) |
Total distributions to shareholders | (0.46 ) | (0.57 ) | (0.25 ) | (0.24 ) | (0.25 ) |
Net asset value, end of period | $9.71 | $10.47 | $11.05 | $10.33 | $9.99 |
Total return | (2.83 )% | (0.19 )% | 9.46 % | 5.88 % | 2.84 % |
Ratios to average net assets (annualized)* | |||||
Gross expenses | 0.76 % | 0.74 % | 0.95 % | 1.10 % | 0.84 % |
Net expenses | 0.45 % | 0.45 % | 0.45 % | 0.45 % | 0.44 % |
Net investment income | 4.42 % | 5.76 % | 2.37 % | 2.09 % | 2.20 % |
Supplemental data | |||||
Portfolio turnover rate2 | 22 % | 31 % | 20 % | 24 % | 39 % |
Net assets, end of period (000s omitted) | $36,525 | $43,796 | $10,787 | $10,587 | $11,094 |
* | Ratios include net expenses allocated from the affiliated Master Portfolio which were as follows: |
Year ended May 31, 2023 | 0.39% |
Year ended May 31, 2022 | 0.39% |
Year ended May 31, 2021 | 0.39% |
Year ended May 31, 2020 | 0.39% |
Year ended May 31, 2019 | 0.39% |
1 | Calculated based upon average shares outstanding |
2 | Portfolio turnover rate is calculated by multiplying the affiliated Master Portfolio’s percentage of the Fund’s total investment in securities at the end of the period by the affiliated Master Portfolio’s portfolio turnover rate. |
Gross unrealized gains | $0 |
Gross unrealized losses | (4,259,064 ) |
Net unrealized losses | $(4,259,064 ) |
Affiliated Master Portfolio | Investment objective | Fair value of affiliated Master Portfolio |
Allspring Real Return Portfolio | Seeks returns that exceed the rate inflation over the long-term | $79,762,485 |
Average daily net assets | Management fee |
First $5 billion | 0.050 % |
Next $5 billion | 0.040 |
Over $10 billion | 0.030 |
Class-level administration fee | |
Class A | 0.16 % |
Class C | 0.16 |
Class R6 | 0.03 |
Administrator Class | 0.10 |
Institutional Class | 0.08 |
EXPENSE RATIO CAPS | |
Class A | 0.78 % |
Class C | 1.53 |
Class R6 | 0.40 |
Administrator Class | 0.60 |
Institutional Class | 0.45 |
Purchases at cost | Sales proceeds | ||
U.S. government | Non-U.S. government | U.S. government | Non-U.S. government |
$10,575,401 | $6,686,365 | $10,805,388 | $8,588,668 |
Undistributed ordinary income | Unrealized losses | Capital loss carryforward |
$282,183 | $(4,259,064 ) | $(1,391,135 ) |
Allspring Funds Trust:

Shares | Value | |||||
Common stocks: 12.87% | ||||||
Consumer staples: 3.09% | ||||||
Beverages: 0.56% | ||||||
PepsiCo, Inc. | 6,473 | $1,180,352 | ||||
Consumer staples distribution & retail: 1.03% | ||||||
Costco Wholesale Corp. | 1,803 | 922,343 | ||||
Sysco Corp. | 4,908 | 343,314 | ||||
Walmart, Inc. | 6,275 | 921,609 | ||||
2,187,266 | ||||||
Food products: 0.37% | ||||||
Mondelez International, Inc. Class A | 7,377 | 541,546 | ||||
Nomad Foods Ltd.† | 13,986 | 238,461 | ||||
780,007 | ||||||
Household products: 1.02% | ||||||
Church & Dwight Co., Inc. | 6,192 | 572,451 | ||||
Clorox Co. | 1,163 | 183,963 | ||||
Procter & Gamble Co. | 9,846 | 1,403,055 | ||||
2,159,469 | ||||||
Personal care products: 0.06% | ||||||
Estee Lauder Cos., Inc. Class A | 672 | 123,668 | ||||
Tobacco: 0.05% | ||||||
Philip Morris International, Inc. | 1,302 | 117,193 | ||||
Energy: 1.63% | ||||||
Oil, gas & consumable fuels: 1.63% | ||||||
Chevron Corp. | 11,635 | 1,752,464 | ||||
EOG Resources, Inc. | 6,573 | 705,217 | ||||
Phillips 66 | 10,918 | 1,000,198 | ||||
3,457,879 | ||||||
Materials: 3.08% | ||||||
Chemicals: 1.19% | ||||||
Ashland, Inc. | 3,172 | 269,239 | ||||
Ecolab, Inc. | 1,947 | 321,352 | ||||
Linde PLC | 3,073 | 1,086,797 | ||||
Olin Corp. | 4,644 | 219,708 | ||||
Sherwin-Williams Co. | 1,161 | 264,453 | ||||
Westlake Corp. | 3,525 | 366,424 | ||||
2,527,973 | ||||||
Construction materials: 0.15% | ||||||
Martin Marietta Materials, Inc. | 766 | 304,899 | ||||
Containers & packaging: 0.11% | ||||||
Crown Holdings, Inc. | 3,113 | 237,304 | ||||
Shares | Value | |||||
Metals & mining: 1.63% | ||||||
Agnico Eagle Mines Ltd. | 2,700 | $137,106 | ||||
Agnico Eagle Mines Ltd. | 2,401 | 122,181 | ||||
Alamos Gold, Inc. Class A | 11,000 | 135,808 | ||||
AngloGold Ashanti Ltd. ADR | 2,900 | 70,180 | ||||
Artemis Gold, Inc.† | 8,000 | 26,578 | ||||
B2Gold Corp. | 32,500 | 120,424 | ||||
Barrick Gold Corp. | 10,356 | 174,809 | ||||
Centerra Gold, Inc. | 3,000 | 18,077 | ||||
Dundee Precious Metals, Inc. | 7,800 | 53,724 | ||||
Endeavour Mining plc | 7,480 | 197,152 | ||||
Evolution Mining Ltd. | 5,000 | 11,188 | ||||
Franco-Nevada Corp. | 1,300 | 188,924 | ||||
Gold Fields Ltd. ADR | 10,500 | 158,760 | ||||
Kinross Gold Corp. | 25,500 | 120,221 | ||||
Lundin Gold, Inc. | 12,000 | 152,044 | ||||
MAG Silver Corp.† | 4,800 | 58,307 | ||||
Newcrest Mining Ltd. | 7,500 | 125,325 | ||||
Newmont Corp. | 3,490 | 141,519 | ||||
Northern Star Resources Ltd. | 14,000 | 117,562 | ||||
OceanaGold Corp. | 7,000 | 15,212 | ||||
Osisko Gold Royalties Ltd. | 1,000 | 15,875 | ||||
Osisko Mining, Inc.† | 4,000 | 9,547 | ||||
Pan American Silver Corp. | 3,000 | 45,690 | ||||
Pan American Silver Corp. | 479 | 7,301 | ||||
Royal Gold, Inc. | 2,534 | 313,811 | ||||
SilverCrest Metals, Inc.† | 11,000 | 72,361 | ||||
SSR Mining, Inc. | 4,950 | 73,112 | ||||
SSR Mining, Inc. | 1,572 | 23,230 | ||||
Steel Dynamics, Inc. | 4,596 | 422,372 | ||||
Torex Gold Resources, Inc.† | 6,000 | 93,790 | ||||
Triple Flag Precious Metals Corp. | 2,000 | 28,435 | ||||
Wheaton Precious Metals Corp. | 4,200 | 190,338 | ||||
3,440,963 | ||||||
Real estate: 5.07% | ||||||
Health care REITs: 0.27% | ||||||
Welltower, Inc. | 7,714 | 575,541 | ||||
Industrial REITs : 0.84% | ||||||
Prologis, Inc. | 10,361 | 1,290,463 | ||||
Terreno Realty Corp. | 7,867 | 482,483 | ||||
1,772,946 | ||||||
Office REITs : 0.15% | ||||||
Alexandria Real Estate Equities, Inc. | 2,791 | 316,667 | ||||
Residential REITs : 1.21% | ||||||
American Homes 4 Rent Class A | 12,659 | 433,951 | ||||
Apartment Income REIT Corp. | 8,799 | 305,237 | ||||
Camden Property Trust | 3,121 | 326,051 | ||||
Shares | Value | |||||
Residential REITs (continued) | ||||||
Invitation Homes, Inc. | 13,872 | $469,983 | ||||
Mid-America Apartment Communities, Inc. | 2,418 | 355,591 | ||||
Sun Communities, Inc. | 5,338 | 675,951 | ||||
2,566,764 | ||||||
Retail REITs : 0.23% | ||||||
Federal Realty Investment Trust | 2,644 | 233,201 | ||||
Simon Property Group, Inc. | 2,376 | 249,836 | ||||
483,037 | ||||||
Specialized REITs : 2.37% | ||||||
American Tower Corp. | 5,467 | 1,008,333 | ||||
Equinix, Inc. | 1,845 | 1,375,540 | ||||
Four Corners Property Trust, Inc. | 17,464 | 448,825 | ||||
Gaming & Leisure Properties, Inc. | 6,985 | 336,258 | ||||
Life Storage, Inc. | 5,149 | 655,931 | ||||
SBA Communications Corp. | 2,968 | 658,243 | ||||
VICI Properties, Inc. | 17,071 | 528,006 | ||||
5,011,136 | ||||||
Total common stocks (Cost $19,065,430) | 27,243,064 | |||||
Interest rate | Maturity date | Principal | ||||
Corporate bonds and notes: 13.69% | ||||||
Basic materials: 0.41% | ||||||
Chemicals: 0.32% | ||||||
Avient Corp.144A | 5.75 % | 5-15-2025 | $ | 50,000 | 49,755 | |
Celanese U.S. Holdings LLC | 6.05 | 3-15-2025 | 615,000 | 617,487 | ||
667,242 | ||||||
Iron/steel: 0.09% | ||||||
Cleveland-Cliffs, Inc.144A | 6.75 | 3-15-2026 | 195,000 | 197,230 | ||
Communications: 0.82% | ||||||
Internet: 0.38% | ||||||
Gen Digital, Inc.144A | 5.00 | 4-15-2025 | 285,000 | 278,370 | ||
Uber Technologies, Inc.144A | 7.50 | 5-15-2025 | 525,000 | 531,114 | ||
809,484 | ||||||
Media: 0.44% | ||||||
Gray Television, Inc.144A | 5.88 | 7-15-2026 | 460,000 | 395,384 | ||
Sirius XM Radio, Inc.144A | 5.00 | 8-1-2027 | 375,000 | 339,999 | ||
Townsquare Media, Inc.144A | 6.88 | 2-1-2026 | 215,000 | 199,348 | ||
934,731 | ||||||
Consumer, cyclical: 3.41% | ||||||
Airlines: 0.58% | ||||||
Hawaiian Airlines Pass-Through Certificates Series 2013-1 Class 1A | 3.90 | 7-15-2027 | 170,031 | 150,685 | ||
Interest rate | Maturity date | Principal | Value | |||
Airlines (continued) | ||||||
Hawaiian Brand Intellectual Property Ltd./HawaiianMiles Loyalty Ltd.144A | 5.75 % | 1-20-2026 | $ | 390,000 | $362,535 | |
Mileage Plus Holdings LLC/Mileage Plus Intellectual Property Assets Ltd.144A | 6.50 | 6-20-2027 | 161,500 | 161,223 | ||
Spirit Loyalty Cayman Ltd./Spirit IP Cayman Ltd.144A | 8.00 | 9-20-2025 | 545,000 | 550,186 | ||
1,224,629 | ||||||
Apparel: 0.05% | ||||||
Michael Kors USA, Inc.144A | 4.25 | 11-1-2024 | 110,000 | 106,288 | ||
Auto manufacturers: 0.19% | ||||||
Ford Motor Credit Co. LLC | 5.58 | 3-18-2024 | 400,000 | 398,190 | ||
Auto parts & equipment: 0.10% | ||||||
Adient Global Holdings Ltd.144A | 4.88 | 8-15-2026 | 220,000 | 208,250 | ||
Distribution/wholesale: 0.16% | ||||||
G-III Apparel Group Ltd.144A | 7.88 | 8-15-2025 | 365,000 | 344,925 | ||
Entertainment: 0.91% | ||||||
CCM Merger, Inc.144A | 6.38 | 5-1-2026 | 145,000 | 140,052 | ||
Cedar Fair LP/Canada’s Wonderland Co./Magnum Management Corp./Millennium Op144A | 5.50 | 5-1-2025 | 375,000 | 372,171 | ||
Cinemark USA, Inc.144A | 8.75 | 5-1-2025 | 252,000 | 256,410 | ||
Live Nation Entertainment, Inc.144A | 4.88 | 11-1-2024 | 190,000 | 186,612 | ||
Live Nation Entertainment, Inc.144A | 6.50 | 5-15-2027 | 335,000 | 335,569 | ||
SeaWorld Parks & Entertainment, Inc.144A | 8.75 | 5-1-2025 | 250,000 | 254,453 | ||
Six Flags Theme Parks, Inc.144A | 7.00 | 7-1-2025 | 380,000 | 382,859 | ||
1,928,126 | ||||||
Food service: 0.28% | ||||||
Aramark Services, Inc.144A | 6.38 | 5-1-2025 | 590,000 | 585,575 | ||
Home builders: 0.25% | ||||||
Tri Pointe Group, Inc./Tri Pointe Homes, Inc. | 5.88 | 6-15-2024 | 535,000 | 529,254 | ||
Housewares: 0.13% | ||||||
Newell Brands, Inc. | 4.70 | 4-1-2026 | 300,000 | 278,253 | ||
Leisure time: 0.08% | ||||||
NCL Corp. Ltd.144A | 8.38 | 2-1-2028 | 165,000 | 170,654 | ||
Lodging: 0.47% | ||||||
Hilton Domestic Operating Co., Inc.144A | 5.38 | 5-1-2025 | 280,000 | 278,220 | ||
Las Vegas Sands Corp. | 3.20 | 8-8-2024 | 550,000 | 530,439 | ||
MGM Resorts International | 6.75 | 5-1-2025 | 195,000 | 195,743 | ||
1,004,402 | ||||||
Interest rate | Maturity date | Principal | Value | |||
Retail: 0.21% | ||||||
Bath & Body Works, Inc.144A | 9.38 % | 7-1-2025 | $ | 294,000 | $312,329 | |
Penske Automotive Group, Inc. | 3.50 | 9-1-2025 | 140,000 | 133,083 | ||
445,412 | ||||||
Consumer, non-cyclical: 1.44% | ||||||
Commercial services: 0.70% | ||||||
Allied Universal Holdco LLC/Allied Universal Finance Corp.144A | 6.63 | 7-15-2026 | 310,000 | 291,173 | ||
Block, Inc. | 2.75 | 6-1-2026 | 85,000 | 76,491 | ||
CoreCivic, Inc. | 8.25 | 4-15-2026 | 335,000 | 335,086 | ||
Prime Security Services Borrower LLC/Prime Finance, Inc.144A | 5.75 | 4-15-2026 | 245,000 | 239,689 | ||
Sabre Global, Inc.144A | 9.25 | 4-15-2025 | 350,000 | 334,250 | ||
Sabre Global, Inc.144A | 11.25 | 12-15-2027 | 265,000 | 203,705 | ||
1,480,394 | ||||||
Food: 0.34% | ||||||
Performance Food Group, Inc.144A | 6.88 | 5-1-2025 | 355,000 | 355,788 | ||
U.S. Foods, Inc.144A | 6.25 | 4-15-2025 | 370,000 | 369,228 | ||
725,016 | ||||||
Healthcare-services: 0.40% | ||||||
IQVIA, Inc.144A | 5.00 | 10-15-2026 | 250,000 | 243,144 | ||
Tenet Healthcare Corp. | 4.88 | 1-1-2026 | 610,000 | 590,066 | ||
833,210 | ||||||
Energy: 2.77% | ||||||
Energy-alternate sources: 0.27% | ||||||
Enviva Partners LP/Enviva Partners Finance Corp.144A | 6.50 | 1-15-2026 | 720,000 | 570,182 | ||
Oil & gas: 0.70% | ||||||
Aethon United BR LP/Aethon United Finance Corp.144A | 8.25 | 2-15-2026 | 145,000 | 140,313 | ||
Antero Resources Corp.144A | 8.38 | 7-15-2026 | 390,000 | 404,480 | ||
EQT Corp. | 6.13 | 2-1-2025 | 405,000 | 405,308 | ||
Murphy Oil Corp. | 5.75 | 8-15-2025 | 200,000 | 196,772 | ||
Range Resources Corp. | 4.88 | 5-15-2025 | 225,000 | 220,564 | ||
Range Resources Corp. | 8.25 | 1-15-2029 | 90,000 | 93,733 | ||
Southwestern Energy Co. | 5.70 | 1-23-2025 | 32,000 | 31,797 | ||
1,492,967 | ||||||
Oil & gas services: 0.35% | ||||||
Oceaneering International, Inc. | 4.65 | 11-15-2024 | 650,000 | 632,560 | ||
USA Compression Partners LP/USA Compression Finance Corp. | 6.88 | 4-1-2026 | 115,000 | 109,370 | ||
741,930 | ||||||
Pipelines: 1.45% | ||||||
Antero Midstream Partners LP/Antero Midstream Finance Corp.144A | 7.88 | 5-15-2026 | 105,000 | 106,427 | ||
Buckeye Partners LP144A | 4.13 | 3-1-2025 | 35,000 | 33,258 | ||
Crestwood Midstream Partners LP/Crestwood Midstream Finance Corp. | 5.75 | 4-1-2025 | 605,000 | 593,396 | ||
Interest rate | Maturity date | Principal | Value | |||
Pipelines (continued) | ||||||
DCP Midstream Operating LP | 5.38 % | 7-15-2025 | $ | 455,000 | $449,982 | |
EnLink Midstream Partners LP | 4.15 | 6-1-2025 | 232,000 | 223,880 | ||
EQM Midstream Partners LP | 4.00 | 8-1-2024 | 65,000 | 63,284 | ||
Rockies Express Pipeline LLC144A | 3.60 | 5-15-2025 | 529,000 | 501,222 | ||
Tallgrass Energy Partners LP/Tallgrass Energy Finance Corp.144A | 6.00 | 3-1-2027 | 360,000 | 336,612 | ||
Venture Global LNG, Inc.144A | 8.13 | 6-1-2028 | 380,000 | 381,900 | ||
Western Midstream Operating LP | 4.65 | 7-1-2026 | 385,000 | 371,346 | ||
3,061,307 | ||||||
Financial: 2.41% | ||||||
Diversified financial services: 1.49% | ||||||
Enact Holdings, Inc.144A | 6.50 | 8-15-2025 | 810,000 | 795,763 | ||
LFS TopCo LLC144A | 5.88 | 10-15-2026 | 120,000 | 104,610 | ||
Navient Corp. | 5.88 | 10-25-2024 | 590,000 | 576,765 | ||
Navient Corp. | 7.25 | 9-25-2023 | 87,000 | 86,806 | ||
OneMain Finance Corp. | 3.50 | 1-15-2027 | 120,000 | 99,911 | ||
OneMain Finance Corp. | 6.13 | 3-15-2024 | 475,000 | 464,029 | ||
PRA Group, Inc.144A | 7.38 | 9-1-2025 | 290,000 | 270,425 | ||
Rocket Mortgage LLC/Rocket Mortgage Co.-Issuer, Inc.144A | 2.88 | 10-15-2026 | 165,000 | 144,174 | ||
United Wholesale Mortgage LLC144A | 5.50 | 11-15-2025 | 650,000 | 608,595 | ||
3,151,078 | ||||||
REITS: 0.92% | ||||||
HAT Holdings I LLC/HAT Holdings II LLC144A | 3.38 | 6-15-2026 | 245,000 | 214,375 | ||
HAT Holdings I LLC/HAT Holdings II LLC144A | 6.00 | 4-15-2025 | 270,000 | 261,218 | ||
Ladder Capital Finance Holdings LLLP/Ladder Capital Finance Corp.144A | 5.25 | 10-1-2025 | 475,000 | 444,752 | ||
Service Properties Trust | 4.35 | 10-1-2024 | 95,000 | 91,113 | ||
Service Properties Trust | 7.50 | 9-15-2025 | 210,000 | 205,928 | ||
Starwood Property Trust, Inc.144A | 3.75 | 12-31-2024 | 110,000 | 103,209 | ||
Starwood Property Trust, Inc. | 4.75 | 3-15-2025 | 495,000 | 464,427 | ||
Starwood Property Trust, Inc.144A | 5.50 | 11-1-2023 | 150,000 | 148,515 | ||
Vornado Realty LP | 2.15 | 6-1-2026 | 20,000 | 16,420 | ||
1,949,957 | ||||||
Industrial: 1.48% | ||||||
Aerospace/defense: 0.40% | ||||||
Spirit AeroSystems, Inc.144A | 7.50 | 4-15-2025 | 185,000 | 182,689 | ||
TransDigm, Inc.144A | 6.25 | 3-15-2026 | 670,000 | 665,413 | ||
848,102 | ||||||
Electrical components & equipment: 0.27% | ||||||
WESCO Distribution, Inc.144A | 7.13 | 6-15-2025 | 575,000 | 579,210 | ||
Environmental control: 0.10% | ||||||
Stericycle, Inc.144A | 5.38 | 7-15-2024 | 215,000 | 212,565 | ||
Packaging & containers: 0.31% | ||||||
Clearwater Paper Corp.144A | 5.38 | 2-1-2025 | 315,000 | 306,337 | ||
Interest rate | Maturity date | Principal | Value | |||
Packaging & containers (continued) | ||||||
Sealed Air Corp.144A | 5.13 % | 12-1-2024 | $ | 50,000 | $49,553 | |
Sealed Air Corp.144A | 5.50 | 9-15-2025 | 300,000 | 297,817 | ||
653,707 | ||||||
Trucking & leasing: 0.40% | ||||||
DAE Funding LLC144A | 2.63 | 3-20-2025 | 370,000 | 349,511 | ||
Fortress Transportation & Infrastructure Investors LLC144A | 6.50 | 10-1-2025 | 505,000 | 490,462 | ||
839,973 | ||||||
Technology: 0.05% | ||||||
Computers: 0.05% | ||||||
NCR Corp.144A | 5.75 | 9-1-2027 | 98,000 | 97,468 | ||
Utilities: 0.90% | ||||||
Electric: 0.90% | ||||||
NextEra Energy Operating Partners LP144A | 4.25 | 7-15-2024 | 755,000 | 740,768 | ||
NSG Holdings LLC/NSG Holdings, Inc.144A | 7.75 | 12-15-2025 | 380,291 | 376,488 | ||
Vistra Operations Co. LLC144A | 5.63 | 2-15-2027 | 825,000 | 793,493 | ||
1,910,749 | ||||||
Total corporate bonds and notes (Cost $30,203,839) | 28,980,460 | |||||
Loans: 0.93% | ||||||
Communications: 0.04% | ||||||
Media: 0.04% | ||||||
Gray Television, Inc. (U.S. SOFR 1 Month +2.50%)± | 7.61 | 1-2-2026 | $ | 100,000 | 95,813 | |
Consumer, cyclical: 0.54% | ||||||
Airlines: 0.27% | ||||||
Mileage Plus Holdings LLC (3 Month LIBOR +5.25%)± | 10.21 | 6-21-2027 | 361,250 | 373,630 | ||
SkyMiles IP Ltd. (U.S. SOFR 3 Month +3.75%)± | 8.80 | 10-20-2027 | 193,500 | 200,139 | ||
573,769 | ||||||
Entertainment: 0.23% | ||||||
Live Nation Entertainment, Inc. (U.S. SOFR 1 Month +1.75%)± | 6.93 | 10-17-2026 | 121,496 | 118,914 | ||
SeaWorld Parks & Entertainment, Inc. (1 Month LIBOR +3.00%)± | 8.19 | 8-25-2028 | 368,413 | 364,040 | ||
482,954 | ||||||
Leisure time: 0.04% | ||||||
Carnival Corp. (1 Month LIBOR +3.00%)± | 8.15 | 6-30-2025 | 78,020 | 77,264 | ||
Energy: 0.07% | ||||||
Pipelines: 0.07% | ||||||
GIP II Blue Holding LP (3 Month LIBOR +4.50%)± | 9.66 | 9-29-2028 | 139,710 | 139,186 | ||
Interest rate | Maturity date | Principal | Value | |||
Financial: 0.10% | ||||||
Diversified financial services: 0.10% | ||||||
Resolute Investment Managers, Inc. (3 Month LIBOR +4.25%)± | 9.41 % | 4-30-2024 | 92,635 | $67,624 | ||
Russell Investments U.S. Institutional Holdco, Inc. (U.S. SOFR 1 Month +3.50%)± | 8.75 | 5-30-2025 | 148,277 | 140,269 | ||
207,893 | ||||||
Industrial: 0.00% | ||||||
Machinery-diversified: 0.00% | ||||||
Vertical U.S. Newco, Inc. (6 Month LIBOR +3.50%)± | 8.60 | 7-30-2027 | 851 | 820 | ||
Technology: 0.05% | ||||||
Software: 0.05% | ||||||
SS&C European Holdings Sarl (1 Month LIBOR +1.75%)± | 6.90 | 4-16-2025 | 54,363 | 54,009 | ||
SS&C Technologies, Inc. (1 Month LIBOR +1.75%)± | 6.90 | 4-16-2025 | 61,303 | 60,905 | ||
114,914 | ||||||
Utilities: 0.13% | ||||||
Electric: 0.13% | ||||||
ExGen Renewables IV LLC (U.S. SOFR 3 Month +2.50%)± | 7.76 | 12-15-2027 | 289,241 | 286,665 | ||
Total loans (Cost $2,025,555) | 1,979,278 | |||||
U.S. Treasury securities: 68.26% | ||||||
TIPS | 0.13 | 7-15-2024 | $ | 2,897,971 | 2,812,843 | |
TIPS | 0.13 | 10-15-2024 | 4,352,384 | 4,207,956 | ||
TIPS | 0.13 | 4-15-2025 | 9,043,571 | 8,659,484 | ||
TIPS | 0.13 | 10-15-2025 | 2,303,057 | 2,200,994 | ||
TIPS | 0.13 | 4-15-2026 | 6,387,051 | 6,044,495 | ||
TIPS | 0.13 | 7-15-2026 | 4,274,577 | 4,052,708 | ||
TIPS | 0.13 | 10-15-2026 | 3,313,410 | 3,131,140 | ||
TIPS | 0.13 | 4-15-2027 | 5,345,149 | 5,004,395 | ||
TIPS | 0.13 | 1-15-2030 | 4,926,768 | 4,481,691 | ||
TIPS | 0.13 | 7-15-2030 | 4,449,514 | 4,041,294 | ||
TIPS | 0.13 | 1-15-2031 | 5,020,072 | 4,522,248 | ||
TIPS | 0.13 | 7-15-2031 | 3,068,486 | 2,754,955 | ||
TIPS | 0.13 | 1-15-2032 | 5,770,375 | 5,145,101 | ||
TIPS | 0.13 | 2-15-2051 | 3,106,710 | 2,059,439 | ||
TIPS | 0.13 | 2-15-2052 | 1,891,859 | 1,248,775 | ||
TIPS | 0.25 | 7-15-2029 | 2,424,633 | 2,244,135 | ||
TIPS | 0.25 | 2-15-2050 | 4,296,474 | 2,991,672 | ||
TIPS | 0.38 | 7-15-2025 | 2,965,298 | 2,858,559 | ||
TIPS | 0.38 | 1-15-2027 | 3,329,651 | 3,157,706 | ||
TIPS | 0.38 | 7-15-2027 | 4,071,441 | 3,860,593 | ||
TIPS | 0.50 | 4-15-2024 | 1,453,918 | 1,417,929 | ||
TIPS | 0.50 | 1-15-2028 | 3,132,237 | 2,963,420 | ||
TIPS | 0.63 | 1-15-2026 | 5,010,781 | 4,826,743 | ||
TIPS | 0.63 | 7-15-2032 | 5,323,542 | 4,954,170 | ||
TIPS | 0.63 | 2-15-2043 | 2,408,804 | 1,974,373 | ||
TIPS | 0.75 | 7-15-2028 | 4,099,945 | 3,933,332 | ||
Interest rate | Maturity date | Principal | Value | |||
U.S. Treasury securities (continued) | ||||||
TIPS | 0.75 % | 2-15-2042 | $ | 3,252,308 | $2,761,031 | |
TIPS | 0.75 | 2-15-2045 | 1,864,801 | 1,539,080 | ||
TIPS | 0.88 | 1-15-2029 | 3,370,605 | 3,234,793 | ||
TIPS | 0.88 | 2-15-2047 | 1,844,133 | 1,544,966 | ||
TIPS | 1.00 | 2-15-2046 | 1,821,434 | 1,579,614 | ||
TIPS | 1.00 | 2-15-2048 | 1,401,343 | 1,203,444 | ||
TIPS | 1.00 | 2-15-2049 | 1,601,159 | 1,372,446 | ||
TIPS | 1.13 | 1-15-2033 | 3,343,527 | 3,241,948 | ||
TIPS | 1.38 | 2-15-2044 | 2,628,789 | 2,475,246 | ||
TIPS | 1.63 | 10-15-2027 | 4,192,444 | 4,182,905 | ||
TIPS | 1.75 | 1-15-2028 | 2,758,787 | 2,761,535 | ||
TIPS | 2.00 | 1-15-2026 | 3,421,350 | 3,413,198 | ||
TIPS | 2.13 | 2-15-2040 | 1,452,194 | 1,562,271 | ||
TIPS | 2.13 | 2-15-2041 | 1,853,625 | 1,995,495 | ||
TIPS | 2.38 | 1-15-2025 | 3,522,442 | 3,510,013 | ||
TIPS | 2.38 | 1-15-2027 | 2,536,669 | 2,580,144 | ||
TIPS | 2.50 | 1-15-2029 | 2,656,773 | 2,775,498 | ||
TIPS | 3.38 | 4-15-2032 | 1,071,189 | 1,235,605 | ||
TIPS | 3.63 | 4-15-2028 | 2,155,207 | 2,344,545 | ||
TIPS | 3.88 | 4-15-2029 | 2,827,224 | 3,172,041 | ||
U.S. Treasury Notes | 3.38 | 5-15-2033 | 530,000 | 518,655 | ||
Total U.S. Treasury securities (Cost $158,460,886) | 144,554,623 | |||||
Yankee corporate bonds and notes: 2.31% | ||||||
Basic materials: 0.28% | ||||||
Mining: 0.28% | ||||||
Constellium SE144A | 5.88 | 2-15-2026 | 300,000 | 295,552 | ||
FMG Resources August 2006 Pty. Ltd.144A | 5.13 | 5-15-2024 | 300,000 | 299,797 | ||
595,349 | ||||||
Communications: 0.17% | ||||||
Media: 0.17% | ||||||
Videotron Ltd.144A | 5.38 | 6-15-2024 | 360,000 | 356,278 | ||
Consumer, cyclical: 1.04% | ||||||
Airlines: 0.26% | ||||||
Air Canada Pass-Through Trust Series 2020-1 Class C144A | 10.50 | 7-15-2026 | 370,000 | 398,120 | ||
American Airlines, Inc./AAdvantage Loyalty IP Ltd.144A | 5.50 | 4-20-2026 | 170,000 | 166,838 | ||
564,958 | ||||||
Auto parts & equipment: 0.23% | ||||||
Clarios Global LP144A | 6.75 | 5-15-2025 | 282,000 | 282,586 | ||
Clarios Global LP/Clarios U.S. Finance Co.144A | 6.25 | 5-15-2026 | 201,000 | 198,868 | ||
481,454 | ||||||
Leisure time: 0.39% | ||||||
Carnival Corp.144A | 10.50 | 2-1-2026 | 285,000 | 296,151 | ||
Interest rate | Maturity date | Principal | Value | |||
Leisure time (continued) | ||||||
Royal Caribbean Cruises Ltd.144A | 5.38 % | 7-15-2027 | $ | 320,000 | $294,867 | |
Royal Caribbean Cruises Ltd.144A | 11.50 | 6-1-2025 | 221,000 | 233,586 | ||
824,604 | ||||||
Retail: 0.16% | ||||||
1011778 BC ULC/New Red Finance, Inc.144A | 5.75 | 4-15-2025 | 335,000 | 334,013 | ||
Consumer, non-cyclical: 0.18% | ||||||
Pharmaceuticals: 0.18% | ||||||
Teva Pharmaceutical Finance Netherlands III BV | 6.00 | 4-15-2024 | 379,000 | 376,135 | ||
Energy: 0.25% | ||||||
Pipelines: 0.25% | ||||||
Northriver Midstream Finance LP144A | 5.63 | 2-15-2026 | 580,000 | 540,734 | ||
Financial: 0.30% | ||||||
Diversified financial services: 0.30% | ||||||
Macquarie Airfinance Holdings Ltd. | 8.38 | 5-1-2028 | 225,000 | 221,654 | ||
Park Aerospace Holdings Ltd.144A | 5.50 | 2-15-2024 | 415,000 | 410,505 | ||
632,159 | ||||||
Industrial: 0.09% | ||||||
Packaging & containers: 0.09% | ||||||
Ardagh Packaging Finance PLC/Ardagh Holdings USA, Inc.144A | 5.25 | 4-30-2025 | 200,000 | 195,981 | ||
Total yankee corporate bonds and notes (Cost $5,021,310) | 4,901,665 | |||||
Yield | Shares | |||||
Short-term investments: 1.20% | ||||||
Investment companies: 1.20% | ||||||
Allspring Government Money Market Fund Select Class♠∞ | 5.01 | 2,535,840 | 2,535,840 | |||
Total short-term investments (Cost $2,535,840) | 2,535,840 | |||||
Total investments in securities (Cost $217,312,860) | 99.26 % | 210,194,930 | ||||
Other assets and liabilities, net | 0.74 | 1,565,598 | ||||
Total net assets | 100.00 % | $211,760,528 | ||||
† | Non-income-earning security |
144A | The security may be resold in transactions exempt from registration, normally to qualified institutional buyers, pursuant to Rule 144A under the Securities Act of 1933. |
± | Variable rate investment. The rate shown is the rate in effect at period end. |
♠ | The issuer of the security is an affiliated person of the Portfolio as defined in the Investment Company Act of 1940. |
∞ | The rate represents the 7-day annualized yield at period end. |
Abbreviations: | |
ADR | American depositary receipt |
LIBOR | London Interbank Offered Rate |
REIT | Real estate investment trust |
SOFR | Secured Overnight Financing Rate |
TIPS | Treasury Inflation-Protected Securities |
Value, beginning of period | Purchases | Sales proceeds | Net realized gains (losses) | Net change in unrealized gains (losses) | Value, end of period | Shares, end of period | Income from affiliated securities | |
Short-term investments | ||||||||
Allspring Government Money Market Fund Select Class | $2,766,670 | $58,678,262 | $(58,909,092 ) | $0 | $0 | $2,535,840 | 2,535,840 | $69,210 |
Investments in affiliates no longer held at end of period | ||||||||
Securities Lending Cash Investments LLC | 0 | 3,611,368 | (3,611,332 ) | (36 ) | 0 | 0 | 0 | 9,311 1 |
$(36 ) | $0 | $2,535,840 | $78,521 |
1 | Amount shown represents income before fees and rebates. |
Description | Number of contracts | Expiration date | Notional cost | Notional value | Unrealized gains | Unrealized losses |
Long | ||||||
Ultra 10-Year U.S. Treasury Notes | 4 | 9-20-2023 | $478,724 | $481,812 | $3,088 | $0 |
2-Year U.S. Treasury Notes | 36 | 9-29-2023 | 7,420,839 | 7,409,813 | 0 | (11,026 ) |
Short | ||||||
Ultra Long Term U.S. Treasury Bond | (12 ) | 9-20-2023 | (1,615,665 ) | (1,642,500 ) | 0 | (26,835 ) |
5-Year U.S. Treasury Notes | (13 ) | 9-29-2023 | (1,417,205 ) | (1,418,016 ) | 0 | (811 ) |
$3,088 | $(38,672 ) |
Assets | |
Investments in unaffiliated securities, at value (cost $214,777,020) | $207,659,090 |
Investments in affiliated securities, at value (cost $2,535,840) | 2,535,840 |
Cash at broker segregated for futures contracts | 336,000 |
Foreign currency, at value (cost $17,665) | 17,455 |
Receivable for dividends and interest | 929,828 |
Receivable for investments sold | 372,365 |
Receivable for daily variation margin on open futures contracts | 13,969 |
Prepaid expenses and other assets | 1,413 |
Total assets | 211,865,960 |
Liabilities | |
Advisory fee payable | 56,127 |
Payable for daily variation margin on open futures contracts | 17,969 |
Custody and accounting fees payable | 14,840 |
Interest holder report expenses payable | 13,613 |
Trustees’ fees and expenses payable | 505 |
Accrued expenses and other liabilities | 2,378 |
Total liabilities | 105,432 |
Total net assets | $211,760,528 |
Investment income | |
Interest | $9,622,312 |
Dividends (net of foreign withholdings taxes of $10,736) | 753,157 |
Income from affiliated securities | 71,486 |
Total investment income | 10,446,955 |
Expenses | |
Advisory fee | 864,264 |
Custody and accounting fees | 31,990 |
Professional fees | 101,129 |
Interest holder report expenses | 25,112 |
Trustees’ fees and expenses | 27,209 |
Other fees and expenses | 13,684 |
Total expenses | 1,063,388 |
Less: Fee waivers and/or expense reimbursements | (220,731 ) |
Net expenses | 842,657 |
Net investment income | 9,604,298 |
Realized and unrealized gains (losses) on investments | |
Net realized gains (losses) on | |
Unaffiliated securities | 219,406 |
Affiliated securities | (36 ) |
Foreign currency and foreign currency translations | (727 ) |
Futures contracts | 311,107 |
Net realized gains on investments | 529,750 |
Net change in unrealized gains (losses) on | |
Unaffiliated securities | (15,915,117 ) |
Foreign currency and foreign currency translations | (287 ) |
Futures contracts | (90,057 ) |
Net change in unrealized gains (losses) on investments | (16,005,461 ) |
Net realized and unrealized gains (losses) on investments | (15,475,711 ) |
Net decrease in net assets resulting from operations | $(5,871,413 ) |
Year ended May 31, 2023 | Year ended May 31, 2022 | |||
Operations | ||||
Net investment income | $9,604,298 | $12,910,301 | ||
Net realized gains on investments | 529,750 | 2,843,667 | ||
Net change in unrealized gains (losses) on investments | (16,005,461 ) | (16,501,133 ) | ||
Net decrease in net assets resulting from operations | (5,871,413 ) | (747,165 ) | ||
Capital transactions | ||||
Transactions in investors’ beneficial interests | ||||
Contributions | 41,232,899 | 73,678,375 | ||
Withdrawals | (55,196,249 ) | (80,677,859 ) | ||
Net decrease in net assets resulting from capital transactions | (13,963,350 ) | (6,999,484 ) | ||
Total decrease in net assets | (19,834,763 ) | (7,746,649 ) | ||
Net assets | ||||
Beginning of period | 231,595,291 | 239,341,940 | ||
End of period | $211,760,528 | $231,595,291 | ||
Year ended May 31 | |||||
2023 | 2022 | 2021 | 2020 | 2019 | |
Total return | (2.73 )% | (0.14 )% | 9.58 % | 5.92 % | 2.99 % |
Ratios to average net assets (annualized) | |||||
Gross expenses | 0.49 % | 0.48 % | 0.47 % | 0.45 % | 0.45 % |
Net expenses1 | 0.39 % | 0.39 % | 0.39 % | 0.39 % | 0.40 % |
Net investment income | 4.45 % | 5.54 % | 2.57 % | 2.16 % | 2.29 % |
Supplemental data | |||||
Portfolio turnover rate | 22 % | 31 % | 20 % | 24 % | 39 % |
1 | Net expense ratios reflect voluntary waivers, if any. |
Gross unrealized gains | $8,813,215 |
Gross unrealized losses | (16,224,106 ) |
Net unrealized losses | $(7,410,891 ) |
Quoted prices (Level 1) | Other significant observable inputs (Level 2) | Significant unobservable inputs (Level 3) | Total | |
Assets | ||||
Investments in: | ||||
Common stocks | ||||
Consumer staples | $6,547,955 | $0 | $0 | $6,547,955 |
Energy | 3,457,879 | 0 | 0 | 3,457,879 |
Materials | 6,511,139 | 0 | 0 | 6,511,139 |
Real estate | 10,726,091 | 0 | 0 | 10,726,091 |
Corporate bonds and notes | 0 | 28,980,460 | 0 | 28,980,460 |
Loans | 0 | 1,979,278 | 0 | 1,979,278 |
U.S. Treasury securities | 144,554,623 | 0 | 0 | 144,554,623 |
Yankee corporate bonds and notes | 0 | 4,901,665 | 0 | 4,901,665 |
Short-term investments | ||||
Investment companies | 2,535,840 | 0 | 0 | 2,535,840 |
174,333,527 | 35,861,403 | 0 | 210,194,930 | |
Futures contracts | 3,088 | 0 | 0 | 3,088 |
Total assets | $174,336,615 | $35,861,403 | $0 | $210,198,018 |
Liabilities | ||||
Futures contracts | $38,672 | $0 | $0 | $38,672 |
Total liabilities | $38,672 | $0 | $0 | $38,672 |
Average daily net assets | Advisory fee |
First $500 million | 0.400 % |
Next $500 million | 0.375 |
Next $2 billion | 0.350 |
Next $2 billion | 0.325 |
Next $5 billion | 0.300 |
Over $10 billion | 0.290 |
Purchases at cost | Sales proceeds | ||
U.S. government | Non-U.S. government | U.S. government | Non-U.S. government |
$28,075,861 | $18,535,675 | $28,686,438 | $23,052,071 |
Allspring Master Trust:
Name and year of birth | Position held and length of service* | Principal occupations during past five years or longer | Current other public company or investment company directorships |
William R. Ebsworth (Born 1957) | Trustee, since 2015 | Retired. From 1984 to 2013, equities analyst, portfolio manager, research director and chief investment officer at Fidelity Management and Research Company in Boston, Tokyo, and Hong Kong, and retired in 2013 as Chief Investment Officer of Fidelity Strategic Advisers, Inc. where he led a team of investment professionals managing client assets. Prior thereto, Board member of Hong Kong Securities Clearing Co., Hong Kong Options Clearing Corp., the Thailand International Fund, Ltd., Fidelity Investments Life Insurance Company, and Empire Fidelity Investments Life Insurance Company. Audit Committee Chair and Investment Committee Chair of the Vincent Memorial Hospital Foundation (non-profit organization). Mr. Ebsworth is a CFA charterholder. | N/A |
Jane A. Freeman (Born 1953) | Trustee, since 2015; Chair Liaison, since 2018 | Retired. From 2012 to 2014 and 1999 to 2008, Chief Financial Officer of Scientific Learning Corporation. From 2008 to 2012, Ms. Freeman provided consulting services related to strategic business projects. Prior to 1999, Portfolio Manager at Rockefeller & Co. and Scudder, Stevens & Clark. Board member of the Harding Loevner Funds from 1996 to 2014, serving as both Lead Independent Director and chair of the Audit Committee. Board member of the Russell Exchange Traded Funds Trust from 2011 to 2012 and the chair of the Audit Committee. Ms. Freeman is also an inactive Chartered Financial Analyst. | N/A |
Isaiah Harris, Jr. (Born 1952) | Trustee, since 2009; Audit Committee Chair, since 2019 | Retired. Member of the Advisory Board of CEF of East Central Florida. Chairman of the Board of CIGNA Corporation from 2009 to 2021, and Director from 2005 to 2008. From 2003 to 2011, Director of Deluxe Corporation. Prior thereto, President and CEO of BellSouth Advertising and Publishing Corp. from 2005 to 2007, President and CEO of BellSouth Enterprises from 2004 to 2005 and President of BellSouth Consumer Services from 2000 to 2003. Emeritus member of the Iowa State University Foundation Board of Governors. Emeritus Member of the Advisory board of Iowa State University School of Business. Advisory Board Member, Palm Harbor Academy (private school). Advisory Board Member, Fellowship of Christian Athletes. Mr. Harris is a certified public accountant (inactive status). | N/A |
David F. Larcker (Born 1950) | Trustee, since 2009 | Distinguished Visiting Fellow at the Hoover Institution since 2022. James Irvin Miller Professor of Accounting at the Graduate School of Business (Emeritus), Stanford University, Director of the Corporate Governance Research Initiative and Senior Faculty of The Rock Center for Corporate Governance since 2006. From 2005 to 2008, Professor of Accounting at the Graduate School of Business, Stanford University. Prior thereto, Ernst & Young Professor of Accounting at The Wharton School, University of Pennsylvania from 1985 to 2005. | N/A |
Olivia S. Mitchell (Born 1953) | Trustee, since 2006; Nominating and Governance Committee Chair, since 2018 | International Foundation of Employee Benefit Plans Professor since 1993, Wharton School of the University of Pennsylvania. Director of Wharton’s Pension Research Council and Boettner Center on Pensions & Retirement Research, and Research Associate at the National Bureau of Economic Research. Previously taught at Cornell University from 1978 to 1993. | N/A |
Timothy J. Penny (Born 1951) | Trustee, since 1996; Chair, since 2018 | President and Chief Executive Officer of Southern Minnesota Initiative Foundation, a non-profit organization, since 2007. Vice Chair of the Economic Club of Minnesota, since 2007. Co-Chair of the Committee for a Responsible Federal Budget, since 1995. Member of the Board of Trustees of NorthStar Education Finance, Inc., a non-profit organization, from 2007-2022. Senior Fellow of the University of Minnesota Humphrey Institute from 1995 to 2017. | N/A |
Name and year of birth | Position held and length of service* | Principal occupations during past five years or longer | Current other public company or investment company directorships |
James G. Polisson (Born 1959) | Trustee, since 2018 | Retired. Chief Marketing Officer, Source (ETF) UK Services, Ltd, from 2015 to 2017. From 2012 to 2015, Principal of The Polisson Group, LLC, a management consulting, corporate advisory and principal investing company. Chief Executive Officer and Managing Director at Russell Investments, Global Exchange Traded Funds from 2010 to 2012. Managing Director of Barclays Global Investors from 1998 to 2010 and Global Chief Marketing Officer for iShares and Barclays Global Investors from 2000 to 2010. Trustee of the San Francisco Mechanics’ Institute, a non- profit organization, from 2013 to 2015. Board member of the Russell Exchange Traded Fund Trust from 2011 to 2012. Director of Barclays Global Investors Holdings Deutschland GmbH from 2006 to 2009. Mr. Polisson is an attorney and has a retired status with the Massachusetts and District of Columbia Bar Associations. | N/A |
Pamela Wheelock (Born 1959) | Trustee, since January 2020; previously Trustee from January 2018 to July 2019 | Retired. Executive and Senior Financial leadership positions in the public, private and nonprofit sectors. Interim President and CEO, McKnight Foundation, 2020. Interim Commissioner, Minnesota Department of Human Services, 2019. Chief Operating Officer, Twin Cities Habitat for Humanity, 2017-2019. Vice President for University Services, University of Minnesota, 2012- 2016. Interim President and CEO, Blue Cross and Blue Shield of Minnesota, 2011-2012. Executive Vice-President and Chief Financial Officer, Minnesota Wild, 2002-2008. Commissioner, Minnesota Department of Finance, 1999-2002. Chair of the Board of Directors of Destination Medical Center Corporation. Board member of the Minnesota Wild Foundation. | N/A |
* | Length of service dates reflect the Trustee’s commencement of service with the Trust’s predecessor entities, where applicable. |
Name and year of birth | Position held and length of service | Principal occupations during past five years or longer |
Andrew Owen (Born 1960) | President, since 2017 | President and Chief Executive Officer of Allspring Funds Management, LLC since 2017 and Head of Global Fund Governance of Allspring Global Investments since 2022. Prior thereto, co-president of Galliard Capital Management, LLC, an affiliate of Allspring Funds Management, LLC, from 2019 to 2022 and Head of Affiliated Managers, Allspring Global Investments, from 2014 to 2019 and Executive Vice President responsible for marketing, investments and product development for Allspring Funds Management, LLC, from 2009 to 2014. |
Jeremy DePalma (Born 1974) | Treasurer, since 2012 (for certain funds in the Fund Complex); since 2021 (for the remaining funds in the Complex) | Senior Vice President of Allspring Funds Management, LLC since 2009. Senior Vice President of Evergreen Investment Management Company, LLC from 2008 to 2010 and head of the Fund Reporting and Control Team within Fund Administration from 2005 to 2010. |
Christopher Baker (Born 1976) | Chief Compliance Officer, since 2022 | Global Chief Compliance Officer for Allspring Global Investments since 2022. Prior thereto, Chief Compliance Officer for State Street Global Advisors from 2018 to 2021. Senior Compliance Officer for the State Street divisions of Alternative Investment Solutions, Sector Solutions, and Global Marketing from 2015 to 2018. From 2010 to 2015 Vice President, Global Head of Investment and Marketing Compliance for State Street Global Advisors. |
Matthew Prasse (Born 1983) | Chief Legal Officer, since 2022; Secretary, since 2021 | Senior Counsel of the Allspring Legal Department since 2021. Senior Counsel of the Wells Fargo Legal Department from 2018 to 2021. Previously, Counsel for Barings LLC from 2015 to 2018. Prior to joining Barings, Associate at Morgan, Lewis & Bockius LLP from 2008 to 2015. |
Based on their review, the Boards did not deem the profits reported by Allspring Funds Management or Allspring Global Investments from services provided to the Funds to be at a level that would prevent the Boards from approving the continuation of the Advisory Agreements.

P.O. Box 219967
Kansas City, MO 64121-9967

AR1753 05-23
2 | |
6 | |
10 | |
11 | |
12 | |
13 | |
14 | |
15 | |
20 | |
24 | |
25 | |
31 | |
32 | |
33 | |
34 | |
35 | |
38 | |
39 |

Allspring Funds

President
Allspring Funds
Notice to Shareholders |
Beginning in July 2024, the Fund will be required by the Securities and Exchange Commission to send shareholders a paper copy of a new tailored shareholder report in place of the full shareholder report that you are now receiving. The tailored shareholder report will contain concise information about the Fund, including certain expense and performance information and fund statistics. If you wish to receive this new tailored shareholder report electronically, please follow the instructions on the back cover of this report. |
Other information that is currently included in the shareholder report, such as the Fund’s financial statements, will be available online and upon request, free of charge, in paper or electronic format. |
Investment objective | The Fund seeks long-term capital appreciation. |
Manager | Allspring Funds Management, LLC |
Subadviser for the affiliated master portfolio* | Peregrine Capital Management, LLC |
Portfolio managers | William A. Grierson, CFA, Paul E. von Kuster, CFA, Allison Lewis, CFA†, Ryan H. Smith, CFA, Samuel D. Smith, CFA |
Average annual total returns (%) as of May 31, 2023 | |||||||||
Including sales charge | Excluding sales charge | Expense ratios1 (%) | |||||||
Inception date | 1 year | 5 year | 10 year | 1 year | 5 year | 10 year | Gross | Net2 | |
Class A (WFSAX) | 1-30-2004 | -5.96 | 3.27 | 8.12 | -0.22 | 4.50 | 8.76 | 1.33 | 1.28 |
Class C (WSMCX) | 1-30-2004 | -1.92 | 3.75 | 8.13 | -0.92 | 3.75 | 8.13 | 2.08 | 2.03 |
Class R6 (WSCRX)3 | 10-31-2014 | – | – | – | 0.21 ♠ | 4.95 | 9.24 | 0.91 | 0.86 |
Administrator Class (NVSCX) | 11-11-1994 | – | – | – | -0.11 | 4.61 | 8.91 | 1.26 | 1.19 |
Institutional Class (WSCGX) | 3-31-2008 | – | – | – | 0.16 | 4.88 | 9.18 | 1.01 | 0.94 |
Russell 2000® Growth Index4 | – | – | – | – | 2.68 | 2.74 | 7.90 | – | – |
♠ | Total return differs from the return in the Financial Highlights in this report. The total return presented is calculated based on the NAV at which the shareholder transactions were processed. The NAV and total return presented in the Financial Highlights reflects certain adjustments made to the net assets of the Fund that are necessary under U.S. generally accepted accounting principles. |
1 | Reflects the expense ratios as stated in the most recent prospectuses. The expense ratios shown are subject to change and may differ from the annualized expense ratios shown in the financial highlights of this report. |
2 | The manager has contractually committed through September 30, 2023 (September 30, 2024 for Class A and Class C), to waive fees and/or reimburse expenses to the extent necessary to cap total annual fund operating expenses after fee waivers at 1.28% for Class A, 2.03% for Class C, 0.86% for Class R6, 1.19% for Administrator Class and 0.94% for Institutional Class. Brokerage commissions, stamp duty fees, interest, taxes, acquired fund fees and expenses (if any) from funds in which the affiliated master portfolio invests, and extraordinary expenses are excluded from the expense caps. Net expenses from the affiliated master portfolio are included in the expense caps. Prior to or after the commitment expiration date, the caps may be increased or the commitment to maintain the caps may be terminated only with the approval of the Board of Trustees. Without these caps, the Fund’s returns would have been lower. The expense ratio paid by an investor is the net expense ratio (the total annual fund operating expenses after fee waivers) as stated in the prospectuses. |
3 | Historical performance shown for the Class R6 shares prior to their inception reflects the performance of the Institutional Class shares, and includes the higher expenses applicable to the Institutional Class shares. If these expenses had not been included, returns for the Class R6 shares would be higher. |
4 | The Russell 2000® Growth Index measures the performance of those Russell 2000 companies with higher price/book ratios and higher forecasted growth values. You cannot invest directly in an index. |
* | The Fund is a feeder fund in a master-feeder structure that invests substantially all of its assets in a single affiliated master portfolio of the Allspring Master Trust with a substantially identical investment objective and substantially similar investment strategies. References to the investment activities of the Fund are intended to refer to the investment activities of the affiliated master portfolio in which it invests. |
† | Ms. Lewis became a portfolio manager of the Fund on June 30, 2023. |
CFA® and Chartered Financial Analyst® are trademarks owned by CFA Institute. | |
Growth of $10,000 investment as of May 31, 20231 |
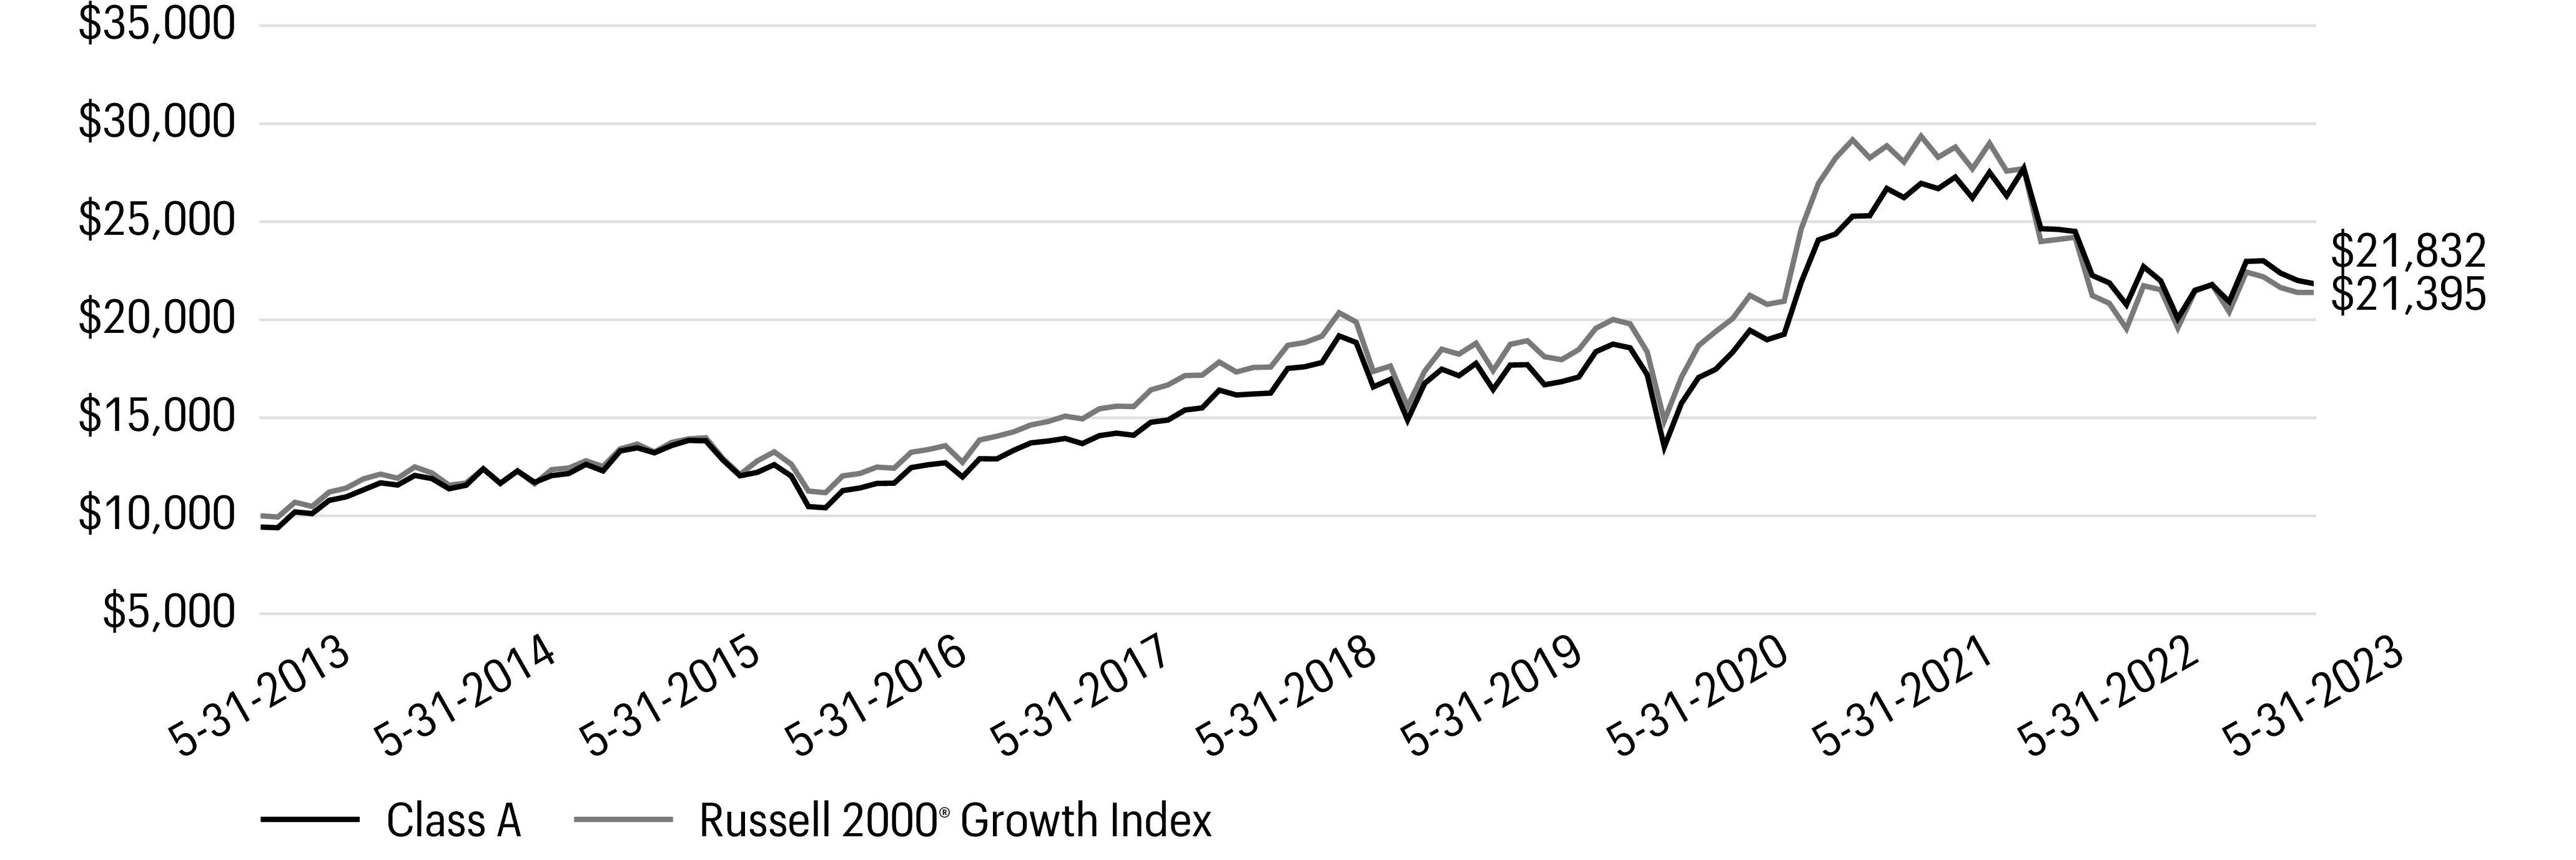
1 | The chart compares the performance of Class A shares for the most recent ten years with the Russell 2000® Growth Index. The chart assumes a hypothetical investment of $10,000 in Class A shares and reflects all operating expenses and assumes the maximum initial sales charge of 5.75%. |
Ten largest holdings (%) as of May 31, 20231 | |
PTC, Inc. | 1.81 |
ICON PLC | 1.64 |
elf Beauty, Inc. | 1.61 |
KBR, Inc. | 1.46 |
International Game Technology PLC | 1.45 |
Box, Inc. Class A | 1.38 |
Element Solutions, Inc. | 1.37 |
Ciena Corp. | 1.36 |
SS&C Technologies Holdings, Inc. | 1.35 |
FTI Consulting, Inc. | 1.31 |
1 | Each holding represents the Fund’s allocable portion of the affiliated master portfolio security. Figures represent each holding as a percentage of the Fund’s net assets. Holdings are subject to change and may have changed since the date specified. |
Sector allocation as of May 31, 20231 |

1 | Figures represent the sector allocation of the affiliated master portfolio as a percentage of the long-term investments of the affiliated master portfolio. Allocations are subject to change and may have changed since the date specified. |
Beginning account value 12-1-2022 | Ending account value 5-31-2023 | Expenses paid during the period1, 2 | Annualized net expense ratio2 | |
Class A | ||||
Actual | $1,000.00 | $1,000.02 | $6.43 | 1.29 % |
Hypothetical (5% return before expenses) | $1,000.00 | $1,018.50 | $6.49 | 1.29 % |
Class C | ||||
Actual | $1,000.00 | $999.99 | $10.17 | 2.04 % |
Hypothetical (5% return before expenses) | $1,000.00 | $1,014.76 | $10.25 | 2.04 % |
Class R6 | ||||
Actual | $1,000.00 | $1,000.04 | $4.29 | 0.86 % |
Hypothetical (5% return before expenses) | $1,000.00 | $1,020.64 | $4.33 | 0.86 % |
Administrator Class | ||||
Actual | $1,000.00 | $1,000.03 | $5.93 | 1.19 % |
Hypothetical (5% return before expenses) | $1,000.00 | $1,019.00 | $5.99 | 1.19 % |
Institutional Class | ||||
Actual | $1,000.00 | $1,000.04 | $4.69 | 0.94 % |
Hypothetical (5% return before expenses) | $1,000.00 | $1,020.24 | $4.73 | 0.94 % |
Value | ||||||
Investment companies: 99.84% | ||||||
Affiliated master portfolio: 99.84% | ||||||
Allspring Small Company Growth Portfolio | $700,121,306 | |||||
Total investment companies (Cost $581,049,760) | 700,121,306 | |||||
Total investments in securities (Cost $581,049,760) | 99.84 % | 700,121,306 | ||||
Other assets and liabilities, net | 0.16 | 1,154,003 | ||||
Total net assets | 100.00 % | $701,275,309 | ||||
% of ownership, beginning of period | % of ownership, end of period | Net realized gains (losses) on investments allocated from affiliated Master Portfolio | Net change in unrealized gains (losses) on investments allocated from affiliated Master Portfolio | Dividends allocated from affiliated Master Portfolio | Interest allocated from affiliated Master Portfolio | Affiliated Income Allocated from affiliated Master Portfolio | Value, end of period | |
Allspring Small Company Growth Portfolio | 97.57 % | 97.57 % | $29,634,010 | $(31,050,649 ) | $2,933,185 | $398 | $707,998 | $700,121,306 |
Assets | |
Investments in affiliated Master Portfolio, at value (cost $581,049,760) | $700,121,306 |
Receivable for Fund shares sold | 1,826,686 |
Receivable from manager | 17,412 |
Prepaid expenses and other assets | 39,307 |
Total assets | 702,004,711 |
Liabilities | |
Payable for Fund shares redeemed | 576,992 |
Administration fees payable | 61,034 |
Distribution fee payable | 1,464 |
Trustees’ fees and expenses payable | 693 |
Accrued expenses and other liabilities | 89,219 |
Total liabilities | 729,402 |
Total net assets | $701,275,309 |
Net assets consist of | |
Paid-in capital | $579,540,596 |
Total distributable earnings | 121,734,713 |
Total net assets | $701,275,309 |
Computation of net asset value and offering price per share | |
Net assets–Class A | $28,813,262 |
Shares outstanding–Class A1 | 1,035,172 |
Net asset value per share–Class A | $27.83 |
Maximum offering price per share – Class A2 | $29.53 |
Net assets–Class C | $2,304,628 |
Shares outstanding–Class C1 | 124,933 |
Net asset value per share–Class C | $18.45 |
Net assets–Class R6 | $218,784,751 |
Shares outstanding–Class R61 | 6,511,205 |
Net asset value per share–Class R6 | $33.60 |
Net assets–Administrator Class | $40,292,544 |
Shares outstanding–Administrator Class1 | 1,305,982 |
Net asset value per share–Administrator Class | $30.85 |
Net assets–Institutional Class | $411,080,124 |
Shares outstanding–Institutional Class1 | 12,360,491 |
Net asset value per share–Institutional Class | $33.26 |
1 | The Fund has an unlimited number of authorized shares. |
2 | Maximum offering price is computed as 100/94.25 of net asset value. On investments of $50,000 or more, the offering price is reduced. |
Investment income | |
Dividends allocated from affiliated Master Portfolio (net of foreign withholding taxes of $6,617) | $2,933,185 |
Affiliated income allocated from affiliated Master Portfolio | 707,998 |
Interest allocated from affiliated Master Portfolio | 398 |
Expenses allocated from affiliated Master Portfolio | (5,827,191 ) |
Total investment income | (2,185,610 ) |
Expenses | |
Management fee | 356,726 |
Administration fees | |
Class A | 64,801 |
Class C | 7,587 |
Class R6 | 66,248 |
Administrator Class | 54,011 |
Institutional Class | 541,590 |
Shareholder servicing fees | |
Class A | 77,145 |
Class C | 8,958 |
Administrator Class | 103,719 |
Distribution fee | |
Class C | 26,648 |
Custody and accounting fees | 24,275 |
Professional fees | 42,482 |
Registration fees | 40,234 |
Shareholder report expenses | 65,109 |
Trustees’ fees and expenses | 21,093 |
Other fees and expenses | 8,608 |
Total expenses | 1,509,234 |
Less: Fee waivers and/or expense reimbursements | |
Fund-level | (356,704 ) |
Class A | (4,859 ) |
Class R6 | (33,037 ) |
Administrator Class | (14,446 ) |
Institutional Class | (146,183 ) |
Net expenses | 954,005 |
Net investment loss | (3,139,615 ) |
Realized and unrealized gains (losses) on investments | |
Net realized gains on investments allocated from affiliated Master Portfolio | 29,634,010 |
Net change in unrealized gains (losses) on investments allocated from affiliated Master Portfolio | (31,050,649 ) |
Net realized and unrealized gains (losses) on investments | (1,416,639 ) |
Net decrease in net assets resulting from operations | $(4,556,254 ) |
Year ended May 31, 2023 | Year ended May 31, 2022 | |||
Operations | ||||
Net investment loss | $(3,139,615 ) | $(5,624,754 ) | ||
Net realized gains on investments | 29,634,010 | 234,292,155 | ||
Net change in unrealized gains (losses) on investments | (31,050,649 ) | (380,610,924 ) | ||
Net decrease in net assets resulting from operations | (4,556,254 ) | (151,943,523 ) | ||
Distributions to shareholders from | ||||
Net investment income and net realized gains | ||||
Class A | (2,956,608 ) | (25,935,297 ) | ||
Class C | (524,720 ) | (5,561,323 ) | ||
Class R6 | (18,290,276 ) | (100,466,883 ) | ||
Administrator Class | (3,736,177 ) | (21,521,432 ) | ||
Institutional Class | (31,910,643 ) | (248,029,970 ) | ||
Total distributions to shareholders | (57,418,424 ) | (401,514,905 ) | ||
Capital share transactions | Shares | Shares | ||
Proceeds from shares sold | ||||
Class A | 226,653 | 6,618,593 | 600,158 | 33,843,292 |
Class C | 8,202 | 151,573 | 89,397 | 4,393,866 |
Class R6 | 939,968 | 32,682,134 | 837,876 | 41,916,286 |
Administrator Class | 179,672 | 5,855,715 | 132,770 | 6,666,051 |
Institutional Class | 5,808,569 | 199,389,086 | 8,331,378 | 426,789,587 |
244,697,101 | 513,609,082 | |||
Reinvestment of distributions | ||||
Class A | 94,538 | 2,624,367 | 643,072 | 23,980,172 |
Class C | 27,185 | 501,841 | 206,792 | 5,422,079 |
Class R6 | 535,212 | 17,897,479 | 2,119,772 | 93,248,751 |
Administrator Class | 121,376 | 3,732,301 | 525,535 | 21,483,861 |
Institutional Class | 460,271 | 15,239,567 | 3,043,545 | 132,759,448 |
39,995,555 | 276,894,311 | |||
Payment for shares redeemed | ||||
Class A | (637,477 ) | (18,452,346 ) | (611,917 ) | (25,389,359 ) |
Class C | (188,144 ) | (3,694,553 ) | (200,817 ) | (6,158,661 ) |
Class R6 | (1,131,878 ) | (39,699,243 ) | (2,783,941 ) | (175,259,458 ) |
Administrator Class | (242,658 ) | (7,818,670 ) | (366,235 ) | (17,779,520 ) |
Institutional Class | (7,571,990 ) | (262,535,497 ) | (9,833,729 ) | (544,346,151 ) |
(332,200,309 ) | (768,933,149 ) | |||
Net increase (decrease) in net assets resulting from capital share transactions | (47,507,653 ) | 21,570,244 | ||
Total decrease in net assets | (109,482,331 ) | (531,888,184 ) | ||
Net assets | ||||
Beginning of period | 810,757,640 | 1,342,645,824 | ||
End of period | $701,275,309 | $810,757,640 | ||
(For a share outstanding throughout each period)
Year ended May 31 | |||||
Class A | 2023 | 2022 | 2021 | 2020 | 2019 |
Net asset value, beginning of period | $30.93 | $61.44 | $46.62 | $48.98 | $56.66 |
Net investment loss | (0.23 )1 | (0.47 )1 | (0.47 )1 | (0.34 )1 | (0.36 ) |
Net realized and unrealized gains (losses) on investments | 0.15 | (5.55 ) | 24.27 | 2.49 | (3.22 ) |
Total from investment operations | (0.08 ) | (6.02 ) | 23.80 | 2.15 | (3.58 ) |
Distributions to shareholders from | |||||
Net realized gains | (3.02 ) | (24.49 ) | (8.98 ) | (4.51 ) | (4.10 ) |
Net asset value, end of period | $27.83 | $30.93 | $61.44 | $46.62 | $48.98 |
Total return2 | (0.22 )% | (16.59 )% | 53.84 % | 3.70 % | (6.13 )% |
Ratios to average net assets (annualized)* | |||||
Gross expenses | 1.36 % | 1.34 % | 1.33 % | 1.32 % | 1.31 % |
Net expenses | 1.29 % | 1.29 % | 1.29 % | 1.32 % | 1.31 % |
Net investment loss | (0.78 )% | (1.04 )% | (0.85 )% | (0.69 )% | (0.63 )% |
Supplemental data | |||||
Portfolio turnover rate3 | 37 % | 61 % | 44 % | 41 % | 54 % |
Net assets, end of period (000s omitted) | $28,813 | $41,795 | $44,249 | $36,534 | $64,182 |
* | Ratios include net expenses allocated from the affiliated Master Portfolio which were as follows: |
Year ended May 31, 2023 | 0.82% |
Year ended May 31, 2022 | 0.81% |
Year ended May 31, 2021 | 0.79% |
Year ended May 31, 2020 | 0.78% |
Year ended May 31, 2019 | 0.78% |
1 | Calculated based upon average shares outstanding |
2 | Total return calculations do not include any sales charges. |
3 | Portfolio turnover rate is calculated by multiplying the affiliated Master Portfolio’s percentage of the Fund’s total investment in securities at the end of the period by the affiliated Master Portfolio’s portfolio turnover rate. |
(For a share outstanding throughout each period)
Year ended May 31 | |||||
Class C | 2023 | 2022 | 2021 | 2020 | 2019 |
Net asset value, beginning of period | $21.67 | $50.65 | $39.84 | $42.75 | $50.38 |
Net investment loss | (0.32 )1 | (0.60 )1 | (0.75 )1 | (0.61 )1 | (0.66 )1 |
Net realized and unrealized gains (losses) on investments | 0.12 | (3.89 ) | 20.54 | 2.21 | (2.87 ) |
Total from investment operations | (0.20 ) | (4.49 ) | 19.79 | 1.60 | (3.53 ) |
Distributions to shareholders from | |||||
Net realized gains | (3.02 ) | (24.49 ) | (8.98 ) | (4.51 ) | (4.10 ) |
Net asset value, end of period | $18.45 | $21.67 | $50.65 | $39.84 | $42.75 |
Total return2 | (0.92 )% | (17.25 )% | 52.86 % | 2.92 % | (6.82 )% |
Ratios to average net assets (annualized)* | |||||
Gross expenses | 2.09 % | 2.08 % | 2.08 % | 2.07 % | 2.06 % |
Net expenses | 2.04 % | 2.04 % | 2.04 % | 2.07 % | 2.06 % |
Net investment loss | (1.56 )% | (1.71 )% | (1.60 )% | (1.44 )% | (1.38 )% |
Supplemental data | |||||
Portfolio turnover rate3 | 37 % | 61 % | 44 % | 41 % | 54 % |
Net assets, end of period (000s omitted) | $2,305 | $6,018 | $9,235 | $9,336 | $13,968 |
* | Ratios include net expenses allocated from the affiliated Master Portfolio which were as follows: |
Year ended May 31, 2023 | 0.82% |
Year ended May 31, 2022 | 0.81% |
Year ended May 31, 2021 | 0.79% |
Year ended May 31, 2020 | 0.78% |
Year ended May 31, 2019 | 0.78% |
1 | Calculated based upon average shares outstanding |
2 | Total return calculations do not include any sales charges. |
3 | Portfolio turnover rate is calculated by multiplying the affiliated Master Portfolio’s percentage of the Fund’s total investment in securities at the end of the period by the affiliated Master Portfolio’s portfolio turnover rate. |
(For a share outstanding throughout each period)
Year ended May 31 | |||||
Class R6 | 2023 | 2022 | 2021 | 2020 | 2019 |
Net asset value, beginning of period | $36.55 | $67.95 | $50.64 | $52.65 | $60.31 |
Net investment loss | (0.12 )1 | (0.26 )1 | (0.17 ) | (0.14 )1 | (0.12 ) |
Net realized and unrealized gains (losses) on investments | 0.19 | (6.65 ) | 26.46 | 2.64 | (3.44 ) |
Total from investment operations | 0.07 | (6.91 ) | 26.29 | 2.50 | (3.56 ) |
Distributions to shareholders from | |||||
Net realized gains | (3.02 ) | (24.49 ) | (8.98 ) | (4.51 ) | (4.10 ) |
Net asset value, end of period | $33.60 | $36.55 | $67.95 | $50.64 | $52.65 |
Total return | 0.24 % | (16.24 )% | 54.53 % | 4.12 % | (5.73 )% |
Ratios to average net assets (annualized)* | |||||
Gross expenses | 0.92 % | 0.91 % | 0.90 % | 0.90 % | 0.88 % |
Net expenses | 0.86 % | 0.86 % | 0.86 % | 0.89 % | 0.88 % |
Net investment loss | (0.35 )% | (0.48 )% | (0.41 )% | (0.27 )% | (0.20 )% |
Supplemental data | |||||
Portfolio turnover rate2 | 37 % | 61 % | 44 % | 41 % | 54 % |
Net assets, end of period (000s omitted) | $218,785 | $225,464 | $407,311 | $462,050 | $564,516 |
* | Ratios include net expenses allocated from the affiliated Master Portfolio which were as follows: |
Year ended May 31, 2023 | 0.82% |
Year ended May 31, 2022 | 0.81% |
Year ended May 31, 2021 | 0.79% |
Year ended May 31, 2020 | 0.78% |
Year ended May 31, 2019 | 0.78% |
1 | Calculated based upon average shares outstanding |
2 | Portfolio turnover rate is calculated by multiplying the affiliated Master Portfolio’s percentage of the Fund’s total investment in securities at the end of the period by the affiliated Master Portfolio’s portfolio turnover rate. |
(For a share outstanding throughout each period)
Year ended May 31 | |||||
Administrator Class | 2023 | 2022 | 2021 | 2020 | 2019 |
Net asset value, beginning of period | $33.92 | $64.98 | $48.87 | $51.10 | $58.85 |
Net investment loss | (0.22 )1 | (0.47 )1 | (0.44 )1 | (0.29 )1 | (0.29 )1 |
Net realized and unrealized gains (losses) on investments | 0.17 | (6.10 ) | 25.53 | 2.57 | (3.36 ) |
Total from investment operations | (0.05 ) | (6.57 ) | 25.09 | 2.28 | (3.65 ) |
Distributions to shareholders from | |||||
Net realized gains | (3.02 ) | (24.49 ) | (8.98 ) | (4.51 ) | (4.10 ) |
Net asset value, end of period | $30.85 | $33.92 | $64.98 | $48.87 | $51.10 |
Total return | (0.11 )% | (16.52 )% | 54.02 % | 3.80 % | (6.02 )% |
Ratios to average net assets (annualized)* | |||||
Gross expenses | 1.27 % | 1.26 % | 1.25 % | 1.24 % | 1.23 % |
Net expenses | 1.19 % | 1.19 % | 1.19 % | 1.20 % | 1.20 % |
Net investment loss | (0.68 )% | (0.93 )% | (0.74 )% | (0.57 )% | (0.51 )% |
Supplemental data | |||||
Portfolio turnover rate2 | 37 % | 61 % | 44 % | 41 % | 54 % |
Net assets, end of period (000s omitted) | $40,293 | $42,317 | $62,092 | $55,917 | $87,850 |
* | Ratios include net expenses allocated from the affiliated Master Portfolio which were as follows: |
Year ended May 31, 2023 | 0.82% |
Year ended May 31, 2022 | 0.81% |
Year ended May 31, 2021 | 0.79% |
Year ended May 31, 2020 | 0.78% |
Year ended May 31, 2019 | 0.78% |
1 | Calculated based upon average shares outstanding |
2 | Portfolio turnover rate is calculated by multiplying the affiliated Master Portfolio’s percentage of the Fund’s total investment in securities at the end of the period by the affiliated Master Portfolio’s portfolio turnover rate. |
(For a share outstanding throughout each period)
Year ended May 31 | |||||
Institutional Class | 2023 | 2022 | 2021 | 2020 | 2019 |
Net asset value, beginning of period | $36.24 | $67.62 | $50.47 | $52.51 | $60.20 |
Net investment loss | (0.15 )1 | (0.27 )1 | (0.29 ) | (0.17 )1 | (0.15 ) |
Net realized and unrealized gains (losses) on investments | 0.19 | (6.62 ) | 26.42 | 2.64 | (3.44 ) |
Total from investment operations | 0.04 | (6.89 ) | 26.13 | 2.47 | (3.59 ) |
Distributions to shareholders from | |||||
Net realized gains | (3.02 ) | (24.49 ) | (8.98 ) | (4.51 ) | (4.10 ) |
Net asset value, end of period | $33.26 | $36.24 | $67.62 | $50.47 | $52.51 |
Total return | 0.16 % | (16.31 )% | 54.39 % | 4.07 % | (5.77 )% |
Ratios to average net assets (annualized)* | |||||
Gross expenses | 1.03 % | 1.01 % | 1.00 % | 1.00 % | 0.98 % |
Net expenses | 0.94 % | 0.94 % | 0.94 % | 0.95 % | 0.95 % |
Net investment loss | (0.43 )% | (0.51 )% | (0.49 )% | (0.32 )% | (0.26 )% |
Supplemental data | |||||
Portfolio turnover rate2 | 37 % | 61 % | 44 % | 41 % | 54 % |
Net assets, end of period (000s omitted) | $411,080 | $495,163 | $819,760 | $793,581 | $1,047,883 |
* | Ratios include net expenses allocated from the affiliated Master Portfolio which were as follows: |
Year ended May 31, 2023 | 0.82% |
Year ended May 31, 2022 | 0.81% |
Year ended May 31, 2021 | 0.79% |
Year ended May 31, 2020 | 0.78% |
Year ended May 31, 2019 | 0.78% |
1 | Calculated based upon average shares outstanding |
2 | Portfolio turnover rate is calculated by multiplying the affiliated Master Portfolio’s percentage of the Fund’s total investment in securities at the end of the period by the affiliated Master Portfolio’s portfolio turnover rate. |
Gross unrealized gains | $103,664,674 |
Gross unrealized losses | 0 |
Net unrealized gains | $103,664,674 |
Paid-in capital | Total distributable earnings |
$(4,248,166 ) | $4,248,166 |
Affiliated Master Portfolio | Investment objective | Fair value of affiliated Master Portfolio |
Allspring Small Company Growth Portfolio | Seek long-term capital appreciation | $700,121,306 |
Average daily net assets | Management fee |
First $5 billion | 0.050 % |
Next $5 billion | 0.040 |
Over $10 billion | 0.030 |
Class-level administration fee | |
Class A | 0.21 % |
Class C | 0.21 |
Class R6 | 0.03 |
Administrator Class | 0.13 |
Institutional Class | 0.13 |
EXPENSE RATIO CAPS | |
Class A | 1.29 % |
Class C | 2.04 |
Class R6 | 0.86 |
Administrator Class | 1.19 |
Institutional Class | 0.94 |
Year ended May 31 | ||
2023 | 2022 | |
Ordinary income | $0 | $41,089,472 |
Long-term capital gain | 57,418,424 | 360,425,433 |
Undistributed long-term gain | Unrealized gains | Late-year ordinary losses deferred |
$19,020,536 | $103,664,674 | $(950,497 ) |
Allspring Funds Trust:

Shares | Value | |||||
Common stocks: 96.66% | ||||||
Communication services: 0.41% | ||||||
Entertainment: 0.41% | ||||||
Lions Gate Entertainment Corp. Class B† | 303,834 | $2,944,151 | ||||
Consumer discretionary: 8.66% | ||||||
Automobile components: 0.54% | ||||||
Fox Factory Holding Corp.† | 43,818 | 3,896,296 | ||||
Broadline retail: 0.79% | ||||||
Ollie’s Bargain Outlet Holdings, Inc.† | 103,239 | 5,690,534 | ||||
Hotels, restaurants & leisure: 2.51% | ||||||
Bowlero Corp.† | 194,783 | 2,232,213 | ||||
International Game Technology PLC | 423,538 | 10,389,387 | ||||
Papa John’s International, Inc. | 76,582 | 5,369,164 | ||||
17,990,764 | ||||||
Household durables: 1.08% | ||||||
Skyline Champion Corp.† | 103,362 | 6,008,433 | ||||
Sonos, Inc.† | 119,588 | 1,737,614 | ||||
7,746,047 | ||||||
Leisure products: 0.63% | ||||||
Topgolf Callaway Brands Corp.† | 262,116 | 4,474,320 | ||||
Specialty retail: 3.11% | ||||||
Academy Sports & Outdoors, Inc. | 116,120 | 5,685,235 | ||||
Boot Barn Holdings, Inc.† | 58,228 | 3,937,377 | ||||
Burlington Stores, Inc.† | 24,980 | 3,758,491 | ||||
Five Below, Inc.† | 35,822 | 6,180,012 | ||||
Monro, Inc. | 66,873 | 2,766,536 | ||||
22,327,651 | ||||||
Consumer staples: 4.69% | ||||||
Consumer staples distribution & retail : 1.11% | ||||||
Performance Food Group Co.† | 144,391 | 7,983,378 | ||||
Food products: 1.97% | ||||||
Lamb Weston Holdings, Inc. | 73,337 | 8,155,075 | ||||
TreeHouse Foods, Inc.† | 125,881 | 5,960,465 | ||||
14,115,540 | ||||||
Personal care products: 1.61% | ||||||
elf Beauty, Inc.† | 111,207 | 11,567,752 | ||||
Energy: 1.92% | ||||||
Energy equipment & services: 0.77% | ||||||
ChampionX Corp. | 219,102 | 5,534,517 | ||||
Shares | Value | |||||
Oil, gas & consumable fuels: 1.15% | ||||||
Callon Petroleum Co.† | 120,498 | $3,690,853 | ||||
Ranger Oil Corp. Class A | 124,265 | 4,566,739 | ||||
8,257,592 | ||||||
Financials: 9.19% | ||||||
Banks: 0.81% | ||||||
Triumph Financial, Inc.† | 111,966 | 5,813,274 | ||||
Capital markets: 3.03% | ||||||
Evercore, Inc. Class A | 54,811 | 5,916,848 | ||||
Focus Financial Partners, Inc. Class A† | 84,435 | 4,398,219 | ||||
Stifel Financial Corp. | 140,992 | 7,834,925 | ||||
Virtu Financial, Inc. Class A | 201,849 | 3,550,524 | ||||
21,700,516 | ||||||
Financial services: 1.78% | ||||||
Essent Group Ltd. | 163,586 | 7,225,594 | ||||
WEX, Inc.† | 33,597 | 5,572,062 | ||||
12,797,656 | ||||||
Insurance: 3.57% | ||||||
BRP Group, Inc. Class A† | 376,410 | 7,550,785 | ||||
Palomar Holdings, Inc.† | 92,949 | 5,080,592 | ||||
Ryan Specialty Holdings, Inc.† | 211,219 | 8,615,623 | ||||
Skyward Specialty Insurance Group, Inc.† | 186,103 | 4,393,892 | ||||
25,640,892 | ||||||
Health care: 23.31% | ||||||
Biotechnology: 5.87% | ||||||
Amicus Therapeutics, Inc.† | 453,926 | 5,111,207 | ||||
Avid Bioservices, Inc.† | 232,070 | 3,585,482 | ||||
Blueprint Medicines Corp.† | 82,757 | 4,677,426 | ||||
Cytokinetics, Inc.† | 105,274 | 3,967,777 | ||||
Insmed, Inc.† | 208,850 | 3,974,415 | ||||
Ionis Pharmaceuticals, Inc.† | 86,081 | 3,520,713 | ||||
Myriad Genetics, Inc.† | 12,773 | 281,772 | ||||
Neurocrine Biosciences, Inc.† | 53,861 | 4,822,175 | ||||
Sarepta Therapeutics, Inc.† | 20,825 | 2,573,970 | ||||
SpringWorks Therapeutics, Inc.† | 97,790 | 2,677,490 | ||||
Syndax Pharmaceuticals, Inc.† | 134,602 | 2,688,002 | ||||
Ultragenyx Pharmaceutical, Inc.† | 85,710 | 4,230,646 | ||||
42,111,075 | ||||||
Health care equipment & supplies: 8.05% | ||||||
Axonics, Inc.† | 135,828 | 6,572,717 | ||||
CONMED Corp. | 67,474 | 8,184,596 | ||||
Glaukos Corp.† | 97,114 | 5,537,440 | ||||
Haemonetics Corp.† | 74,297 | 6,285,526 | ||||
iRhythm Technologies, Inc.† | 38,136 | 4,357,801 | ||||
Shares | Value | |||||
Health care equipment & supplies (continued) | ||||||
Novocure Ltd.† | 23,174 | $1,664,125 | ||||
Omnicell, Inc.† | 89,583 | 6,577,184 | ||||
Silk Road Medical, Inc.† | 207,698 | 6,270,403 | ||||
Tandem Diabetes Care, Inc.† | 109,905 | 2,856,431 | ||||
TransMedics Group, Inc.† | 70,601 | 5,129,869 | ||||
Treace Medical Concepts, Inc.† | 161,262 | 4,289,569 | ||||
57,725,661 | ||||||
Health care providers & services: 2.22% | ||||||
HealthEquity, Inc.† | 99,179 | 5,435,009 | ||||
Privia Health Group, Inc.† | 142,343 | 3,551,458 | ||||
U.S. Physical Therapy, Inc. | 68,190 | 6,965,609 | ||||
15,952,076 | ||||||
Health care technology: 2.08% | ||||||
Evolent Health, Inc. Class A† | 180,942 | 5,272,650 | ||||
Phreesia, Inc.† | 181,505 | 5,448,780 | ||||
Veradigm, Inc.† | 357,475 | 4,211,055 | ||||
14,932,485 | ||||||
Life sciences tools & services: 4.18% | ||||||
Adaptive Biotechnologies Corp.† | 267,808 | 1,863,944 | ||||
Avantor, Inc.† | 422,077 | 8,416,215 | ||||
Azenta, Inc.† | 69,092 | 2,988,229 | ||||
BioLife Solutions, Inc.† | 210,988 | 4,926,570 | ||||
ICON PLC† | 55,431 | 11,808,466 | ||||
30,003,424 | ||||||
Pharmaceuticals: 0.91% | ||||||
Axsome Therapeutics, Inc.† | 61,632 | 4,547,209 | ||||
Ventyx Biosciences, Inc.† | 57,884 | 1,995,261 | ||||
6,542,470 | ||||||
Industrials: 23.05% | ||||||
Aerospace & defense: 1.24% | ||||||
Kratos Defense & Security Solutions, Inc.† | 321,075 | 4,218,926 | ||||
Mercury Systems, Inc.† | 115,380 | 4,683,274 | ||||
8,902,200 | ||||||
Air freight & logistics: 0.71% | ||||||
GXO Logistics, Inc.† | 91,593 | 5,121,881 | ||||
Building products: 3.26% | ||||||
Advanced Drainage Systems, Inc. | 68,825 | 6,660,195 | ||||
AZEK Co., Inc.† | 197,151 | 4,583,761 | ||||
Masonite International Corp.† | 85,370 | 7,518,536 | ||||
Zurn Elkay Water Solutions Corp. Class C | 205,910 | 4,635,034 | ||||
23,397,526 | ||||||
Shares | Value | |||||
Commercial services & supplies: 0.90% | ||||||
Openlane, Inc.† | 252,499 | $3,792,535 | ||||
RB Global, Inc. | 50,430 | 2,626,394 | ||||
6,418,929 | ||||||
Construction & engineering: 1.73% | ||||||
Dycom Industries, Inc.† | 64,675 | 6,559,985 | ||||
MYR Group, Inc.† | 45,745 | 5,832,488 | ||||
12,392,473 | ||||||
Electrical equipment: 1.46% | ||||||
Atkore, Inc.† | 51,262 | 5,985,863 | ||||
Vicor Corp.† | 81,528 | 4,512,575 | ||||
10,498,438 | ||||||
Ground transportation: 1.65% | ||||||
Knight-Swift Transportation Holdings, Inc. | 110,599 | 6,081,839 | ||||
Schneider National, Inc. Class B | 221,279 | 5,735,552 | ||||
11,817,391 | ||||||
Machinery: 2.71% | ||||||
Chart Industries, Inc.† | 51,161 | 5,613,897 | ||||
SPX Technologies, Inc.† | 109,442 | 8,356,991 | ||||
Wabash National Corp. | 234,222 | 5,492,506 | ||||
19,463,394 | ||||||
Professional services: 7.82% | ||||||
ASGN, Inc.† | 108,792 | 7,118,260 | ||||
Clarivate PLC† | 421,304 | 3,286,171 | ||||
FTI Consulting, Inc.† | 50,262 | 9,449,759 | ||||
ICF International, Inc. | 78,083 | 8,744,515 | ||||
KBR, Inc. | 177,491 | 10,475,519 | ||||
SS&C Technologies Holdings, Inc. | 175,924 | 9,668,783 | ||||
Verra Mobility Corp.† | 419,227 | 7,390,972 | ||||
56,133,979 | ||||||
Trading companies & distributors: 1.57% | ||||||
Boise Cascade Co. | 72,833 | 5,230,866 | ||||
Core & Main, Inc. Class A† | 225,050 | 6,017,837 | ||||
11,248,703 | ||||||
Information technology: 21.89% | ||||||
Communications equipment: 2.14% | ||||||
Ciena Corp.† | 208,236 | 9,732,951 | ||||
Lumentum Holdings, Inc.† | 105,830 | 5,598,407 | ||||
15,331,358 | ||||||
Electronic equipment, instruments & components: 2.06% | ||||||
Itron, Inc.† | 80,466 | 5,449,962 | ||||
Shares | Value | |||||
Electronic equipment, instruments & components (continued) | ||||||
PAR Technology Corp.† | 109,625 | $3,789,736 | ||||
Rogers Corp.† | 35,134 | 5,532,551 | ||||
14,772,249 | ||||||
Semiconductors & semiconductor equipment: 2.56% | ||||||
Onto Innovation, Inc.† | 51,386 | 5,516,287 | ||||
Silicon Motion Technology Corp. ADR | 72,626 | 4,447,616 | ||||
Synaptics, Inc.† | 34,224 | 2,944,633 | ||||
Teradyne, Inc. | 54,791 | 5,489,511 | ||||
18,398,047 | ||||||
Software: 14.51% | ||||||
Bills Holdings, Inc.† | 38,509 | 3,988,762 | ||||
Black Knight, Inc.† | 132,341 | 7,646,663 | ||||
Box, Inc. Class A† | 350,827 | 9,882,797 | ||||
Confluent, Inc. Class A† | 194,260 | 6,165,812 | ||||
CyberArk Software Ltd.† | 55,130 | 8,530,265 | ||||
DoubleVerify Holdings, Inc.† | 171,265 | 5,972,011 | ||||
HashiCorp, Inc. Class A† | 155,825 | 5,351,030 | ||||
Jamf Holding Corp.† | 296,031 | 5,441,050 | ||||
JFrog Ltd.† | 261,369 | 6,366,949 | ||||
LiveRamp Holdings, Inc.† | 161,368 | 3,927,697 | ||||
Nutanix, Inc. Class A† | 231,409 | 6,854,335 | ||||
PagerDuty, Inc.† | 248,154 | 6,752,270 | ||||
PTC, Inc.† | 96,568 | 12,978,739 | ||||
Sprout Social, Inc. Class A† | 114,844 | 4,973,894 | ||||
Varonis Systems, Inc.† | 182,122 | 4,786,166 | ||||
Zuora, Inc. Class A† | 416,271 | 4,491,564 | ||||
104,110,004 | ||||||
Technology hardware, storage & peripherals: 0.62% | ||||||
Pure Storage, Inc. Class A† | 156,108 | 4,494,349 | ||||
Materials: 2.76% | ||||||
Chemicals: 2.16% | ||||||
Element Solutions, Inc. | 547,875 | 9,823,399 | ||||
Orion Engineered Carbons SA | 245,908 | 5,702,606 | ||||
15,526,005 | ||||||
Metals & mining: 0.60% | ||||||
Steel Dynamics, Inc. | 46,685 | 4,290,352 | ||||
Real estate: 0.78% | ||||||
Hotel & resort REITs: 0.78% | ||||||
Ryman Hospitality Properties, Inc. | 60,761 | 5,573,607 | ||||
Total common stocks (Cost $523,369,035) | 693,638,956 | |||||
Yield | Shares | Value | ||||
Short-term investments: 3.18% | ||||||
Investment companies: 3.18% | ||||||
Allspring Government Money Market Fund Select Class♠∞ | 5.01 % | 22,796,664 | $22,796,664 | |||
Total short-term investments (Cost $22,796,664) | 22,796,664 | |||||
Total investments in securities (Cost $546,165,699) | 99.84 % | 716,435,620 | ||||
Other assets and liabilities, net | 0.16 | 1,120,926 | ||||
Total net assets | 100.00 % | $717,556,546 | ||||
† | Non-income-earning security |
♠ | The issuer of the security is an affiliated person of the Portfolio as defined in the Investment Company Act of 1940. |
∞ | The rate represents the 7-day annualized yield at period end. |
Abbreviations: | |
ADR | American depositary receipt |
REIT | Real estate investment trust |
Value, beginning of period | Purchases | Sales proceeds | Net realized gains (losses) | Net change in unrealized gains (losses) | Value, end of period | Shares, end of period | Income from affiliated securities | |
Short-term investments | ||||||||
Allspring Government Money Market Fund Select Class | $32,660,804 | $232,852,801 | $(242,716,941 ) | $0 | $0 | $22,796,664 | 22,796,664 | $706,851 |
Investments in affiliates no longer held at end of period | ||||||||
Securities Lending Cash Investments LLC | 2,594,900 | 81,499,530 | (84,094,991 ) | 561 | 0 | 0 | 0 | 115,044 1 |
$561 | $0 | $22,796,664 | $821,895 |
1 | Amount shown represents income before fees and rebates. |
Assets | |
Investments in unaffiliated securities, at value (cost $523,369,035) | $693,638,956 |
Investments in affiliated securities, at value (cost $22,796,664) | 22,796,664 |
Receivable for investments sold | 2,771,892 |
Receivable for dividends | 759,243 |
Prepaid expenses and other assets | 17,346 |
Total assets | 719,984,101 |
Liabilities | |
Payable for investments purchased | 1,895,032 |
Advisory fee payable | 483,645 |
Trustees’ fees and expenses payable | 504 |
Accrued expenses and other liabilities | 48,374 |
Total liabilities | 2,427,555 |
Total net assets | $717,556,546 |
Investment income | |
Dividends (net of foreign withholdings taxes of $6,787) | $3,008,361 |
Income from affiliated securities | 726,054 |
Interest | 408 |
Total investment income | 3,734,823 |
Expenses | |
Advisory fee | 5,792,866 |
Custody and accounting fees | 45,908 |
Professional fees | 61,872 |
Interest holder report expenses | 16,477 |
Trustees’ fees and expenses | 22,389 |
Other fees and expenses | 38,269 |
Total expenses | 5,977,781 |
Net investment loss | (2,242,958 ) |
Realized and unrealized gains (losses) on investments | |
Net realized gains on | |
Unaffiliated securities | 29,813,537 |
Affiliated securities | 561 |
Net realized gains on investments | 29,814,098 |
Net change in unrealized gains (losses) on investments | (30,986,997 ) |
Net realized and unrealized gains (losses) on investments | (1,172,899 ) |
Net decrease in net assets resulting from operations | $(3,415,857 ) |
Year ended May 31, 2023 | Year ended May 31, 2022 | |||
Operations | ||||
Net investment loss | $(2,242,958 ) | $(4,263,313 ) | ||
Net realized gains on investments | 29,814,098 | 238,329,906 | ||
Net change in unrealized gains (losses) on investments | (30,986,997 ) | (388,267,734 ) | ||
Net decrease in net assets resulting from operations | (3,415,857 ) | (154,201,141 ) | ||
Capital transactions | ||||
Transactions in investors’ beneficial interests | ||||
Contributions | 99,599,958 | 222,703,095 | ||
Withdrawals | (207,887,653 ) | (617,532,776 ) | ||
Net decrease in net assets resulting from capital transactions | (108,287,695 ) | (394,829,681 ) | ||
Total decrease in net assets | (111,703,552 ) | (549,030,822 ) | ||
Net assets | ||||
Beginning of period | 829,260,098 | 1,378,290,920 | ||
End of period | $717,556,546 | $829,260,098 | ||
Year ended May 31 | |||||
2023 | 2022 | 2021 | 2020 | 2019 | |
Total return | 0.24 % | (16.28 )% | 54.64 % | 4.08 % | (5.64 )% |
Ratios to average net assets (annualized) | |||||
Gross expenses | 0.82 % | 0.81 % | 0.79 % | 0.78 % | 0.78 % |
Net expenses1 | 0.82 % | 0.81 % | 0.79 % | 0.78 % | 0.78 % |
Net investment loss | (0.31 )% | (0.42 )% | (0.34 )% | (0.16 )% | (0.09 )% |
Supplemental data | |||||
Portfolio turnover rate | 37 % | 61 % | 44 % | 41 % | 54 % |
1 | Net expense ratios reflect voluntary waivers, if any. |
Gross unrealized gains | $217,313,843 |
Gross unrealized losses | (69,808,056 ) |
Net unrealized gains | $147,505,787 |
Quoted prices (Level 1) | Other significant observable inputs (Level 2) | Significant unobservable inputs (Level 3) | Total | |
Assets | ||||
Investments in: | ||||
Common stocks | ||||
Communication services | $2,944,151 | $0 | $0 | $2,944,151 |
Consumer discretionary | 62,125,612 | 0 | 0 | 62,125,612 |
Consumer staples | 33,666,670 | 0 | 0 | 33,666,670 |
Energy | 13,792,109 | 0 | 0 | 13,792,109 |
Financials | 65,952,338 | 0 | 0 | 65,952,338 |
Health care | 167,267,191 | 0 | 0 | 167,267,191 |
Industrials | 165,394,914 | 0 | 0 | 165,394,914 |
Information technology | 157,106,007 | 0 | 0 | 157,106,007 |
Materials | 19,816,357 | 0 | 0 | 19,816,357 |
Real estate | 5,573,607 | 0 | 0 | 5,573,607 |
Short-term investments | ||||
Investment companies | 22,796,664 | 0 | 0 | 22,796,664 |
Total assets | $716,435,620 | $0 | $0 | $716,435,620 |
Average daily net assets | Advisory fee |
First $500 million | 0.800 % |
Next $500 million | 0.775 |
Next $1 billion | 0.750 |
Next $1 billion | 0.725 |
Next $1 billion | 0.700 |
Over $4 billion | 0.680 |
Allspring Master Trust:
Name and year of birth | Position held and length of service* | Principal occupations during past five years or longer | Current other public company or investment company directorships |
William R. Ebsworth (Born 1957) | Trustee, since 2015 | Retired. From 1984 to 2013, equities analyst, portfolio manager, research director and chief investment officer at Fidelity Management and Research Company in Boston, Tokyo, and Hong Kong, and retired in 2013 as Chief Investment Officer of Fidelity Strategic Advisers, Inc. where he led a team of investment professionals managing client assets. Prior thereto, Board member of Hong Kong Securities Clearing Co., Hong Kong Options Clearing Corp., the Thailand International Fund, Ltd., Fidelity Investments Life Insurance Company, and Empire Fidelity Investments Life Insurance Company. Audit Committee Chair and Investment Committee Chair of the Vincent Memorial Hospital Foundation (non-profit organization). Mr. Ebsworth is a CFA charterholder. | N/A |
Jane A. Freeman (Born 1953) | Trustee, since 2015; Chair Liaison, since 2018 | Retired. From 2012 to 2014 and 1999 to 2008, Chief Financial Officer of Scientific Learning Corporation. From 2008 to 2012, Ms. Freeman provided consulting services related to strategic business projects. Prior to 1999, Portfolio Manager at Rockefeller & Co. and Scudder, Stevens & Clark. Board member of the Harding Loevner Funds from 1996 to 2014, serving as both Lead Independent Director and chair of the Audit Committee. Board member of the Russell Exchange Traded Funds Trust from 2011 to 2012 and the chair of the Audit Committee. Ms. Freeman is also an inactive Chartered Financial Analyst. | N/A |
Isaiah Harris, Jr. (Born 1952) | Trustee, since 2009; Audit Committee Chair, since 2019 | Retired. Member of the Advisory Board of CEF of East Central Florida. Chairman of the Board of CIGNA Corporation from 2009 to 2021, and Director from 2005 to 2008. From 2003 to 2011, Director of Deluxe Corporation. Prior thereto, President and CEO of BellSouth Advertising and Publishing Corp. from 2005 to 2007, President and CEO of BellSouth Enterprises from 2004 to 2005 and President of BellSouth Consumer Services from 2000 to 2003. Emeritus member of the Iowa State University Foundation Board of Governors. Emeritus Member of the Advisory board of Iowa State University School of Business. Advisory Board Member, Palm Harbor Academy (private school). Advisory Board Member, Fellowship of Christian Athletes. Mr. Harris is a certified public accountant (inactive status). | N/A |
David F. Larcker (Born 1950) | Trustee, since 2009 | Distinguished Visiting Fellow at the Hoover Institution since 2022. James Irvin Miller Professor of Accounting at the Graduate School of Business (Emeritus), Stanford University, Director of the Corporate Governance Research Initiative and Senior Faculty of The Rock Center for Corporate Governance since 2006. From 2005 to 2008, Professor of Accounting at the Graduate School of Business, Stanford University. Prior thereto, Ernst & Young Professor of Accounting at The Wharton School, University of Pennsylvania from 1985 to 2005. | N/A |
Olivia S. Mitchell (Born 1953) | Trustee, since 2006; Nominating and Governance Committee Chair, since 2018 | International Foundation of Employee Benefit Plans Professor since 1993, Wharton School of the University of Pennsylvania. Director of Wharton’s Pension Research Council and Boettner Center on Pensions & Retirement Research, and Research Associate at the National Bureau of Economic Research. Previously taught at Cornell University from 1978 to 1993. | N/A |
Timothy J. Penny (Born 1951) | Trustee, since 1996; Chair, since 2018 | President and Chief Executive Officer of Southern Minnesota Initiative Foundation, a non-profit organization, since 2007. Vice Chair of the Economic Club of Minnesota, since 2007. Co-Chair of the Committee for a Responsible Federal Budget, since 1995. Member of the Board of Trustees of NorthStar Education Finance, Inc., a non-profit organization, from 2007-2022. Senior Fellow of the University of Minnesota Humphrey Institute from 1995 to 2017. | N/A |
Name and year of birth | Position held and length of service* | Principal occupations during past five years or longer | Current other public company or investment company directorships |
James G. Polisson (Born 1959) | Trustee, since 2018 | Retired. Chief Marketing Officer, Source (ETF) UK Services, Ltd, from 2015 to 2017. From 2012 to 2015, Principal of The Polisson Group, LLC, a management consulting, corporate advisory and principal investing company. Chief Executive Officer and Managing Director at Russell Investments, Global Exchange Traded Funds from 2010 to 2012. Managing Director of Barclays Global Investors from 1998 to 2010 and Global Chief Marketing Officer for iShares and Barclays Global Investors from 2000 to 2010. Trustee of the San Francisco Mechanics’ Institute, a non- profit organization, from 2013 to 2015. Board member of the Russell Exchange Traded Fund Trust from 2011 to 2012. Director of Barclays Global Investors Holdings Deutschland GmbH from 2006 to 2009. Mr. Polisson is an attorney and has a retired status with the Massachusetts and District of Columbia Bar Associations. | N/A |
Pamela Wheelock (Born 1959) | Trustee, since January 2020; previously Trustee from January 2018 to July 2019 | Retired. Executive and Senior Financial leadership positions in the public, private and nonprofit sectors. Interim President and CEO, McKnight Foundation, 2020. Interim Commissioner, Minnesota Department of Human Services, 2019. Chief Operating Officer, Twin Cities Habitat for Humanity, 2017-2019. Vice President for University Services, University of Minnesota, 2012- 2016. Interim President and CEO, Blue Cross and Blue Shield of Minnesota, 2011-2012. Executive Vice-President and Chief Financial Officer, Minnesota Wild, 2002-2008. Commissioner, Minnesota Department of Finance, 1999-2002. Chair of the Board of Directors of Destination Medical Center Corporation. Board member of the Minnesota Wild Foundation. | N/A |
* | Length of service dates reflect the Trustee’s commencement of service with the Trust’s predecessor entities, where applicable. |
Name and year of birth | Position held and length of service | Principal occupations during past five years or longer |
Andrew Owen (Born 1960) | President, since 2017 | President and Chief Executive Officer of Allspring Funds Management, LLC since 2017 and Head of Global Fund Governance of Allspring Global Investments since 2022. Prior thereto, co-president of Galliard Capital Management, LLC, an affiliate of Allspring Funds Management, LLC, from 2019 to 2022 and Head of Affiliated Managers, Allspring Global Investments, from 2014 to 2019 and Executive Vice President responsible for marketing, investments and product development for Allspring Funds Management, LLC, from 2009 to 2014. |
Jeremy DePalma (Born 1974) | Treasurer, since 2012 (for certain funds in the Fund Complex); since 2021 (for the remaining funds in the Complex) | Senior Vice President of Allspring Funds Management, LLC since 2009. Senior Vice President of Evergreen Investment Management Company, LLC from 2008 to 2010 and head of the Fund Reporting and Control Team within Fund Administration from 2005 to 2010. |
Christopher Baker (Born 1976) | Chief Compliance Officer, since 2022 | Global Chief Compliance Officer for Allspring Global Investments since 2022. Prior thereto, Chief Compliance Officer for State Street Global Advisors from 2018 to 2021. Senior Compliance Officer for the State Street divisions of Alternative Investment Solutions, Sector Solutions, and Global Marketing from 2015 to 2018. From 2010 to 2015 Vice President, Global Head of Investment and Marketing Compliance for State Street Global Advisors. |
Matthew Prasse (Born 1983) | Chief Legal Officer, since 2022; Secretary, since 2021 | Senior Counsel of the Allspring Legal Department since 2021. Senior Counsel of the Wells Fargo Legal Department from 2018 to 2021. Previously, Counsel for Barings LLC from 2015 to 2018. Prior to joining Barings, Associate at Morgan, Lewis & Bockius LLP from 2008 to 2015. |

P.O. Box 219967
Kansas City, MO 64121-9967

AR1848 05-23
2 | |
6 | |
10 | |
11 | |
12 | |
13 | |
14 | |
15 | |
20 | |
24 | |
25 | |
32 | |
33 | |
34 | |
35 | |
36 | |
39 | |
40 |

Allspring Funds

President
Allspring Funds
Notice to Shareholders |
Beginning in July 2024, the Fund will be required by the Securities and Exchange Commission to send shareholders a paper copy of a new tailored shareholder report in place of the full shareholder report that you are now receiving. The tailored shareholder report will contain concise information about the Fund, including certain expense and performance information and fund statistics. If you wish to receive this new tailored shareholder report electronically, please follow the instructions on the back cover of this report. |
Other information that is currently included in the shareholder report, such as the Fund’s financial statements, will be available online and upon request, free of charge, in paper or electronic format. |
Investment objective | The Fund seeks long-term capital appreciation. |
Manager | Allspring Funds Management, LLC |
Subadviser for the affiliated master portfolio* | Allspring Global Investments, LLC |
Portfolio managers | Jeff Goverman, Gustaf Little, Garth R. Nisbet, CFA, Craig Pieringer, CFA |
Average annual total returns (%) as of May 31, 2023 | |||||||||
Including sales charge | Excluding sales charge | Expense ratios1 (%) | |||||||
Inception date | 1 year | 5 year | 10 year | 1 year | 5 year | 10 year | Gross | Net2 | |
Class A (SCVAX) | 1-31-2002 | -15.46 | 1.82 | 6.28 | -10.31 | 3.04 | 6.92 | 1.32 | 1.15 |
Class C (SCVFX) | 8-30-2002 | -11.94 | 2.30 | 6.29 | -10.94 | 2.30 | 6.29 | 2.07 | 1.90 |
Class R6 (SCVJX)3 | 10-31-2016 | – | – | – | -9.95 | 3.44 | 7.25 | 0.89 | 0.75 |
Administrator Class (SCVIX) | 1-31-2002 | – | – | – | -10.20 | 3.13 | 7.05 | 1.24 | 1.05 |
Institutional Class (SCVNX) | 7-30-2010 | – | – | – | -10.03 | 3.34 | 7.27 | 0.99 | 0.85 |
Russell 2000® Value Index4 | – | – | – | – | -11.50 | 2.09 | 6.43 | – | – |
1 | Reflects the expense ratios as stated in the most recent prospectuses. The expense ratios shown are subject to change and may differ from the annualized expense ratios shown in the financial highlights of this report. |
2 | The manager has contractually committed through September 30, 2023, to waive fees and/or reimburse expenses to the extent necessary to cap total annual fund operating expenses after fee waivers at 1.15% for Class A, 1.90% for Class C, 0.75% for Class R6, 1.05% for Administrator Class and 0.85% for Institutional Class. Brokerage commissions, stamp duty fees, interest, taxes, acquired fund fees and expenses (if any) from funds in which the affiliated master portfolio invests, and extraordinary expenses are excluded from the expense caps. Net expenses from the affiliated master portfolio are included in the expense caps. Prior to or after the commitment expiration date, the caps may be increased or the commitment to maintain the caps may be terminated only with the approval of the Board of Trustees. Without these caps, the Fund’s returns would have been lower. The expense ratio paid by an investor is the net expense ratio (the total annual fund operating expenses after fee waivers) as stated in the prospectuses. |
3 | Historical performance shown for the Class R6 shares prior to their inception reflects the performance of the Institutional Class shares, and includes the higher expenses applicable to the Institutional Class shares. If these expenses had not been included, returns for the Class R6 shares would be higher. |
4 | The Russell 2000® Value Index measures the performance of those Russell 2000 companies with lower price/book ratios and lower forecasted growth values. You cannot invest directly in an index. |
* | The Fund is a feeder fund in a master-feeder structure that invests substantially all of its assets in a single affiliated master portfolio of the Allspring Master Trust with a substantially identical investment objective and substantially similar investment strategies. References to the investment activities of the Fund are intended to refer to the investment activities of the affiliated master portfolio in which it invests. |
CFA® and Chartered Financial Analyst® are trademarks owned by CFA Institute. | |
Growth of $10,000 investment as of May 31, 20231 |
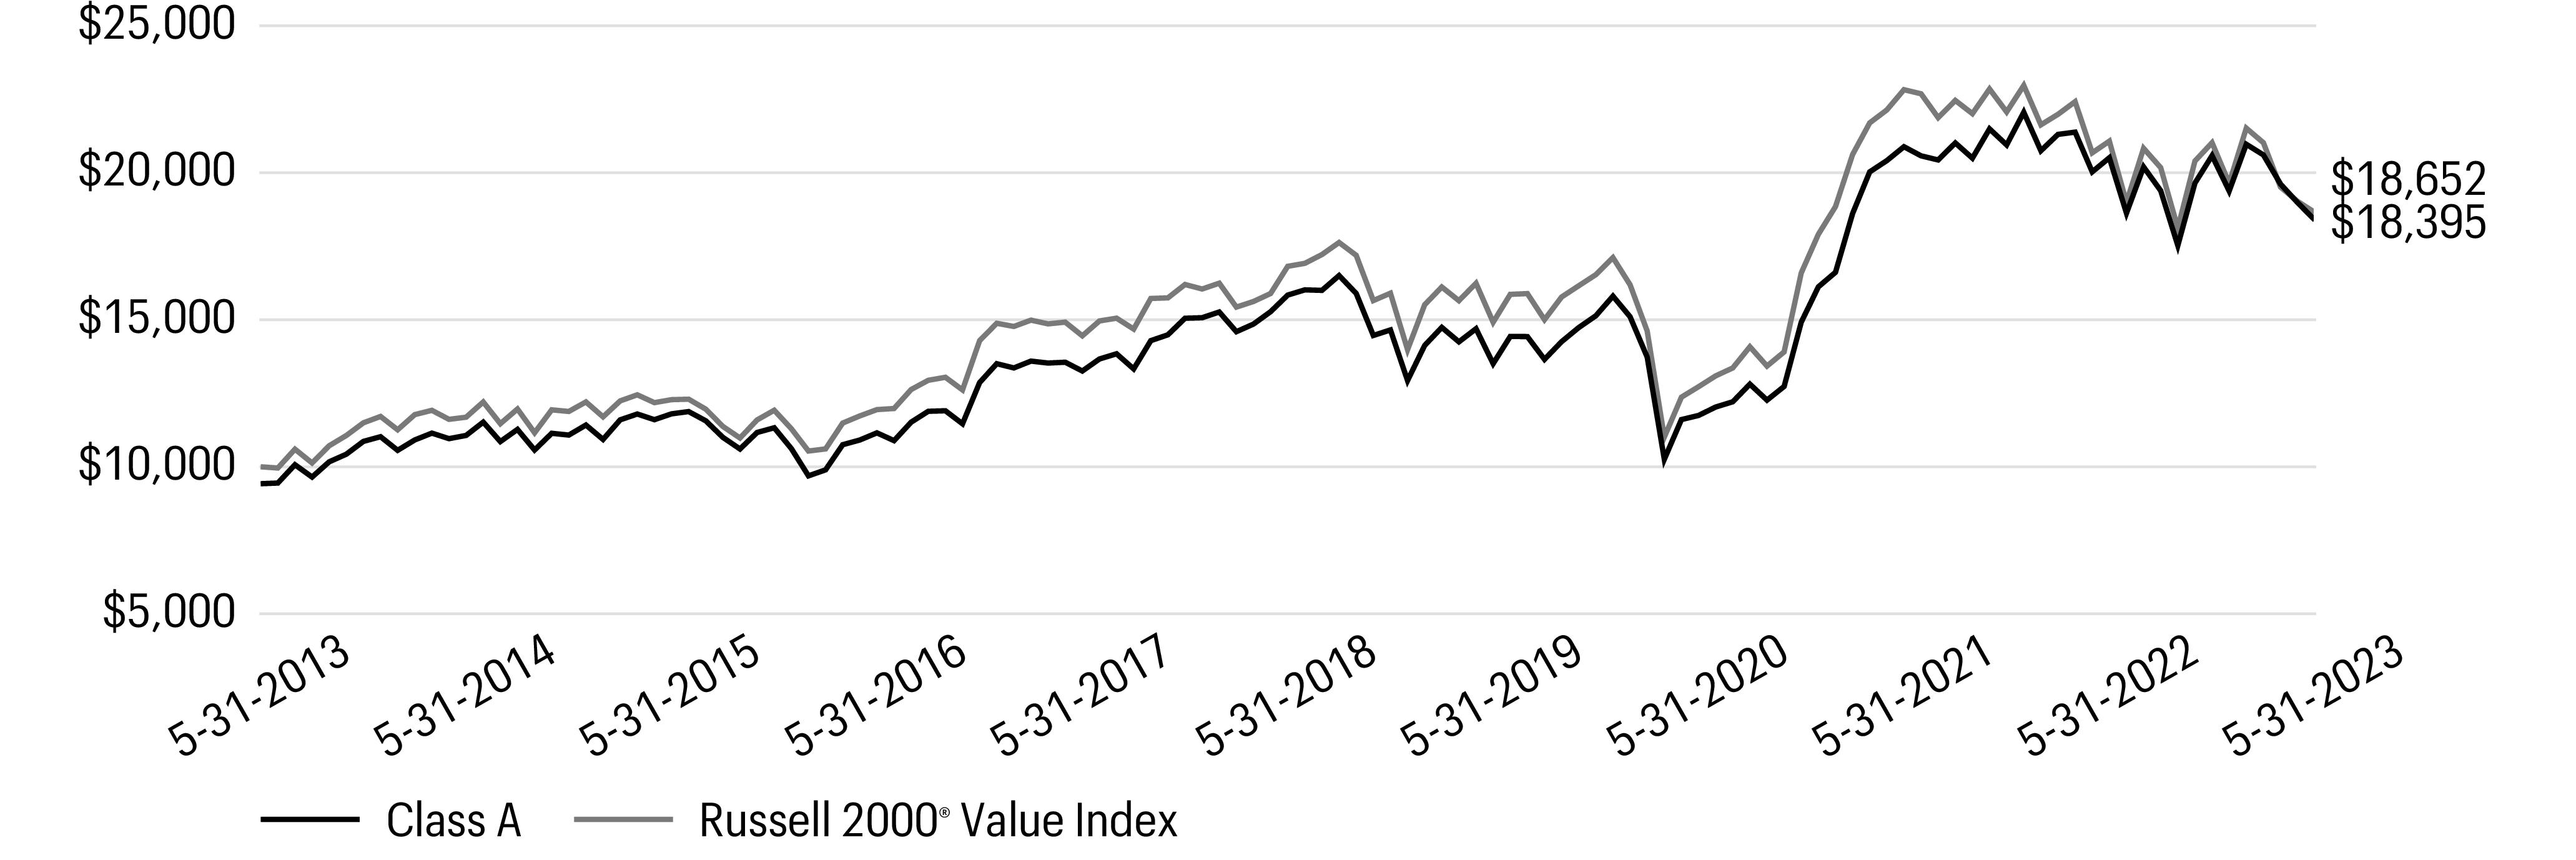
1 | The chart compares the performance of Class A shares for the most recent ten years with the Russell 2000® Value Index. The chart assumes a hypothetical investment of $10,000 in Class A shares and reflects all operating expenses and assumes the maximum initial sales charge of 5.75%. |
Ten largest holdings (%) as of May 31, 20231 | |
Sterling Infrastructure, Inc. | 1.49 |
Eagle Materials, Inc. | 1.49 |
Diamondback Energy, Inc. | 1.48 |
STAG Industrial, Inc. | 1.47 |
Unum Group | 1.44 |
American Equity Investment Life Holding Co. | 1.43 |
Standex International Corp. | 1.33 |
Annaly Capital Management, Inc. | 1.29 |
AGNC Investment Corp. | 1.26 |
Hawkins, Inc. | 1.20 |
1 | Each holding represents the Fund’s allocable portion of the affiliated master portfolio security. Figures represent each holding as a percentage of the Fund’s net assets. Holdings are subject to change and may have changed since the date specified. |
Sector allocation as of May 31, 20231 |

1 | Figures represent the sector allocation of the affiliated master portfolio as a percentage of the long-term investments of the affiliated master portfolio. These amounts are subject to change and may have changed since the date specified. |
Beginning account value 12-1-2022 | Ending account value 5-31-2023 | Expenses paid during the period1, 2 | Annualized net expense ratio2 | |
Class A | ||||
Actual | $1,000.00 | $998.94 | $5.73 | 1.15 % |
Hypothetical (5% return before expenses) | $1,000.00 | $1,019.20 | $5.79 | 1.15 % |
Class C | ||||
Actual | $1,000.00 | $998.91 | $9.47 | 1.90 % |
Hypothetical (5% return before expenses) | $1,000.00 | $1,015.46 | $9.55 | 1.90 % |
Class R6 | ||||
Actual | $1,000.00 | $998.96 | $3.74 | 0.75 % |
Hypothetical (5% return before expenses) | $1,000.00 | $1,021.19 | $3.78 | 0.75 % |
Administrator Class | ||||
Actual | $1,000.00 | $998.94 | $5.23 | 1.05 % |
Hypothetical (5% return before expenses) | $1,000.00 | $1,019.70 | $5.29 | 1.05 % |
Institutional Class | ||||
Actual | $1,000.00 | $998.95 | $4.24 | 0.85 % |
Hypothetical (5% return before expenses) | $1,000.00 | $1,020.69 | $4.28 | 0.85 % |
Value | ||||||
Investment companies: 99.99% | ||||||
Affiliated master portfolio: 99.99% | ||||||
Allspring Small Company Value Portfolio | $448,713,630 | |||||
Total investment companies (Cost $388,845,602) | 448,713,630 | |||||
Total investments in securities (Cost $388,845,602) | 99.99 % | 448,713,630 | ||||
Other assets and liabilities, net | 0.01 | 45,766 | ||||
Total net assets | 100.00 % | $448,759,396 | ||||
% of ownership, beginning of period | % of ownership, end of period | Net realized gains (losses) on investments allocated from affiliated Master Portfolio | Net change in unrealized gains (losses) on investments allocated from affiliated Master Portfolio | Dividends allocated from affiliated Master Portfolio | Interest allocated from affiliated Master Portfolio | Affiliated Income Allocated from affiliated Master Portfolio | Value, end of period | |
Allspring Small Company Value Portfolio | 88.09 % | 88.78 % | $(12,161,642 ) | $(44,270,421 ) | $9,127,734 | $133 | $485,764 | $448,713,630 |
Assets | |
Investments in affiliated Master Portfolio, at value (cost $388,845,602) | $448,713,630 |
Receivable for Fund shares sold | 436,433 |
Receivable from manager | 84,850 |
Prepaid expenses and other assets | 53,520 |
Total assets | 449,288,433 |
Liabilities | |
Payable for Fund shares redeemed | 268,146 |
Administration fees payable | 71,633 |
Shareholder servicing fees payable | 71,415 |
Trustees’ fees and expenses payable | 1,024 |
Distribution fee payable | 914 |
Accrued expenses and other liabilities | 115,905 |
Total liabilities | 529,037 |
Total net assets | $448,759,396 |
Net assets consist of | |
Paid-in capital | $410,844,177 |
Total distributable earnings | 37,915,219 |
Total net assets | $448,759,396 |
Computation of net asset value and offering price per share | |
Net assets–Class A | $304,600,572 |
Shares outstanding–Class A1 | 10,313,491 |
Net asset value per share–Class A | $29.53 |
Maximum offering price per share – Class A2 | $31.33 |
Net assets–Class C | $1,307,060 |
Shares outstanding–Class C1 | 51,673 |
Net asset value per share–Class C | $25.30 |
Net assets–Class R6 | $14,572,862 |
Shares outstanding–Class R61 | 474,928 |
Net asset value per share–Class R6 | $30.68 |
Net assets–Administrator Class | $17,742,771 |
Shares outstanding–Administrator Class1 | 585,028 |
Net asset value per share–Administrator Class | $30.33 |
Net assets–Institutional Class | $110,536,131 |
Shares outstanding–Institutional Class1 | 3,622,421 |
Net asset value per share–Institutional Class | $30.51 |
1 | The Fund has an unlimited number of authorized shares. |
2 | Maximum offering price is computed as 100/94.25 of net asset value. On investments of $50,000 or more, the offering price is reduced. |
Investment income | |
Dividends allocated from affiliated Master Portfolio (net of foreign withholding taxes of $15,292) | $9,127,734 |
Affiliated income allocated from affiliated Master Portfolio | 485,764 |
Interest allocated from affiliated Master Portfolio | 133 |
Interest | 14 |
Expenses allocated from affiliated Master Portfolio | (4,192,386 ) |
Waivers allocated from affiliated Master Portfolio | 465,726 |
Total investment income | 5,886,985 |
Expenses | |
Management fee | 251,887 |
Administration fees | |
Class A | 728,667 |
Class C | 4,101 |
Class R6 | 3,652 |
Administrator Class | 26,461 |
Institutional Class | 159,002 |
Shareholder servicing fees | |
Class A | 867,460 |
Class C | 4,882 |
Administrator Class | 50,692 |
Distribution fee | |
Class C | 14,647 |
Custody and accounting fees | 14,329 |
Professional fees | 52,398 |
Registration fees | 72,113 |
Shareholder report expenses | 106,566 |
Trustees’ fees and expenses | 21,093 |
Other fees and expenses | 83,933 |
Total expenses | 2,461,883 |
Less: Fee waivers and/or expense reimbursements | |
Fund-level | (705,463 ) |
Class A | (118,237 ) |
Class C | (525 ) |
Administrator Class | (9,829 ) |
Net expenses | 1,627,829 |
Net investment income | 4,259,156 |
Realized and unrealized gains (losses) on investments | |
Net realized losses on investments allocated from affiliated Master Portfolio | (12,161,642 ) |
Net change in unrealized gains (losses) on investments allocated from affiliated Master Portfolio | (44,270,421 ) |
Net realized and unrealized gains (losses) on investments | (56,432,063 ) |
Net decrease in net assets resulting from operations | $(52,172,907 ) |
Year ended May 31, 2023 | Year ended May 31, 2022 | |||
Operations | ||||
Net investment income | $4,259,156 | $1,997,250 | ||
Net realized gains (losses) on investments | (12,161,642 ) | 55,806,887 | ||
Net change in unrealized gains (losses) on investments | (44,270,421 ) | (68,307,228 ) | ||
Net decrease in net assets resulting from operations | (52,172,907 ) | (10,503,091 ) | ||
Distributions to shareholders from | ||||
Net investment income and net realized gains | ||||
Class A | (14,333,053 ) | (23,780,784 ) | ||
Class C | (93,570 ) | (208,181 ) | ||
Class R6 | (506,589 ) | (352,499 ) | ||
Administrator Class | (798,183 ) | (1,952,485 ) | ||
Institutional Class | (5,228,302 ) | (4,608,431 ) | ||
Total distributions to shareholders | (20,959,697 ) | (30,902,380 ) | ||
Capital share transactions | Shares | Shares | ||
Proceeds from shares sold | ||||
Class A | 398,977 | 12,672,302 | 656,676 | 24,000,526 |
Class C | 6,555 | 180,325 | 19,681 | 658,109 |
Class R6 | 357,751 | 11,911,540 | 189,729 | 7,081,211 |
Administrator Class | 196,183 | 6,527,787 | 415,003 | 15,666,878 |
Institutional Class | 1,630,016 | 54,246,836 | 2,016,490 | 74,654,109 |
85,538,790 | 122,060,833 | |||
Reinvestment of distributions | ||||
Class A | 437,444 | 14,076,915 | 658,773 | 23,358,988 |
Class C | 3,383 | 93,570 | 6,753 | 208,181 |
Class R6 | 15,179 | 506,589 | 9,588 | 352,499 |
Administrator Class | 23,252 | 768,015 | 52,212 | 1,898,392 |
Institutional Class | 156,571 | 5,199,039 | 124,652 | 4,555,015 |
20,644,128 | 30,373,075 | |||
Payment for shares redeemed | ||||
Class A | (1,488,263 ) | (47,166,763 ) | (1,505,117 ) | (54,479,971 ) |
Class C | (34,738 ) | (926,078 ) | (53,609 ) | (1,691,679 ) |
Class R6 | (124,227 ) | (4,060,442 ) | (208,117 ) | (7,991,882 ) |
Administrator Class | (311,874 ) | (10,266,220 ) | (651,213 ) | (24,288,201 ) |
Institutional Class | (1,435,391 ) | (47,534,257 ) | (761,649 ) | (28,166,610 ) |
(109,953,760 ) | (116,618,343 ) | |||
Net increase (decrease) in net assets resulting from capital share transactions | (3,770,842 ) | 35,815,565 | ||
Total decrease in net assets | (76,903,446 ) | (5,589,906 ) | ||
Net assets | ||||
Beginning of period | 525,662,842 | 531,252,748 | ||
End of period | $448,759,396 | $525,662,842 | ||
(For a share outstanding throughout each period)
Year ended May 31 | |||||
Class A | 2023 | 2022 | 2021 | 2020 | 2019 |
Net asset value, beginning of period | $34.30 | $37.11 | $20.91 | $24.22 | $28.60 |
Net investment income | 0.24 1 | 0.12 1 | 0.09 | 0.18 1 | 0.09 |
Net realized and unrealized gains (losses) on investments | (3.66 ) | (0.71 ) | 16.22 | (3.35 ) | (4.31 ) |
Total from investment operations | (3.42 ) | (0.59 ) | 16.31 | (3.17 ) | (4.22 ) |
Distributions to shareholders from | |||||
Net investment income | 0.00 | (0.08 ) | (0.11 ) | (0.14 ) | (0.16 ) |
Net realized gains | (1.35 ) | (2.14 ) | 0.00 | 0.00 | 0.00 |
Total distributions to shareholders | (1.35 ) | (2.22 ) | (0.11 ) | (0.14 ) | (0.16 ) |
Net asset value, end of period | $29.53 | $34.30 | $37.11 | $20.91 | $24.22 |
Total return2 | (10.31 )% | (1.77 )% | 77.80 % | (13.25 )% | (14.72 )% |
Ratios to average net assets (annualized)* | |||||
Gross expenses | 1.32 % | 1.32 % | 1.32 % | 1.32 % | 1.49 % |
Net expenses | 1.14 % | 1.14 % | 1.14 % | 1.13 % | 1.15 % |
Net investment income | 0.76 % | 0.33 % | 0.33 % | 0.74 % | 0.38 % |
Supplemental data | |||||
Portfolio turnover rate3 | 87 % | 70 % | 62 % | 78 % | 168 % |
Net assets, end of period (000s omitted) | $304,601 | $376,072 | $414,013 | $262,574 | $11,902 |
* | Ratios include net expenses allocated from the affiliated Master Portfolio which were as follows: |
Year ended May 31, 2023 | 0.74% |
Year ended May 31, 2022 | 0.74% |
Year ended May 31, 2021 | 0.74% |
Year ended May 31, 2020 | 0.74% |
Year ended May 31, 2019 | 0.75% |
1 | Calculated based upon average shares outstanding |
2 | Total return calculations do not include any sales charges. |
3 | Portfolio turnover rate is calculated by multiplying the affiliated Master Portfolio’s percentage of the Fund’s total investment in securities at the end of the period by the affiliated Master Portfolio’s portfolio turnover rate. |
(For a share outstanding throughout each period)
Year ended May 31 | |||||
Class C | 2023 | 2022 | 2021 | 2020 | 2019 |
Net asset value, beginning of period | $29.79 | $32.69 | $18.43 | $21.48 | $25.38 |
Net investment income (loss) | 0.00 1,2 | (0.12 )2 | (0.07 )2 | 0.01 2 | (0.08 )2 |
Net realized and unrealized gains (losses) on investments | (3.14 ) | (0.64 ) | 14.33 | (3.00 ) | (3.82 ) |
Total from investment operations | (3.14 ) | (0.76 ) | 14.26 | (2.99 ) | (3.90 ) |
Distributions to shareholders from | |||||
Net investment income | 0.00 | 0.00 | 0.00 | (0.06 ) | 0.00 |
Net realized gains | (1.35 ) | (2.14 ) | 0.00 | 0.00 | 0.00 |
Total distributions to shareholders | (1.35 ) | (2.14 ) | 0.00 | (0.06 ) | 0.00 |
Net asset value, end of period | $25.30 | $29.79 | $32.69 | $18.43 | $21.48 |
Total return3 | (10.94 )% | (2.56 )% | 76.80 % | (13.98 )% | (15.37 )% |
Ratios to average net assets (annualized)* | |||||
Gross expenses | 2.07 % | 2.07 % | 2.06 % | 2.08 % | 2.22 % |
Net expenses | 1.90 % | 1.90 % | 1.90 % | 1.90 % | 1.90 % |
Net investment income (loss) | 0.00 % | (0.39 )% | (0.29 )% | 0.02 % | (0.35 )% |
Supplemental data | |||||
Portfolio turnover rate4 | 87 % | 70 % | 62 % | 78 % | 168 % |
Net assets, end of period (000s omitted) | $1,307 | $2,278 | $3,388 | $4,431 | $1,099 |
* | Ratios include net expenses allocated from the affiliated Master Portfolio which were as follows: |
Year ended May 31, 2023 | 0.74% |
Year ended May 31, 2022 | 0.74% |
Year ended May 31, 2021 | 0.74% |
Year ended May 31, 2020 | 0.74% |
Year ended May 31, 2019 | 0.75% |
1 | Amount is less than $0.005. |
2 | Calculated based upon average shares outstanding |
3 | Total return calculations do not include any sales charges. |
4 | Portfolio turnover rate is calculated by multiplying the affiliated Master Portfolio’s percentage of the Fund’s total investment in securities at the end of the period by the affiliated Master Portfolio’s portfolio turnover rate. |
(For a share outstanding throughout each period)
Year ended May 31 | |||||
Class R6 | 2023 | 2022 | 2021 | 2020 | 2019 |
Net asset value, beginning of period | $35.46 | $38.33 | $21.56 | $24.92 | $29.44 |
Net investment income | 0.37 1 | 0.33 | 0.20 | 0.31 | 0.21 1 |
Net realized and unrealized gains (losses) on investments | (3.79 ) | (0.80 ) | 16.78 | (3.50 ) | (4.45 ) |
Total from investment operations | (3.42 ) | (0.47 ) | 16.98 | (3.19 ) | (4.24 ) |
Distributions to shareholders from | |||||
Net investment income | (0.01 ) | (0.26 ) | (0.21 ) | (0.17 ) | (0.28 ) |
Net realized gains | (1.35 ) | (2.14 ) | 0.00 | 0.00 | 0.00 |
Total distributions to shareholders | (1.36 ) | (2.40 ) | (0.21 ) | (0.17 ) | (0.28 ) |
Net asset value, end of period | $30.68 | $35.46 | $38.33 | $21.56 | $24.92 |
Total return | (9.95 )% | (1.41 )% | 78.63 % | (12.97 )% | (14.38 )% |
Ratios to average net assets (annualized)* | |||||
Gross expenses | 0.89 % | 0.89 % | 0.89 % | 0.90 % | 1.09 % |
Net expenses | 0.75 % | 0.75 % | 0.75 % | 0.75 % | 0.75 % |
Net investment income | 1.11 % | 0.71 % | 0.73 % | 1.22 % | 0.77 % |
Supplemental data | |||||
Portfolio turnover rate2 | 87 % | 70 % | 62 % | 78 % | 168 % |
Net assets, end of period (000s omitted) | $14,573 | $8,021 | $9,007 | $6,491 | $731 |
* | Ratios include net expenses allocated from the affiliated Master Portfolio which were as follows: |
Year ended May 31, 2023 | 0.74% |
Year ended May 31, 2022 | 0.74% |
Year ended May 31, 2021 | 0.74% |
Year ended May 31, 2020 | 0.74% |
Year ended May 31, 2019 | 0.75% |
1 | Calculated based upon average shares outstanding |
2 | Portfolio turnover rate is calculated by multiplying the affiliated Master Portfolio’s percentage of the Fund’s total investment in securities at the end of the period by the affiliated Master Portfolio’s portfolio turnover rate. |
(For a share outstanding throughout each period)
Year ended May 31 | |||||
Administrator Class | 2023 | 2022 | 2021 | 2020 | 2019 |
Net asset value, beginning of period | $35.15 | $37.98 | $21.40 | $24.80 | $29.23 |
Net investment income | 0.28 1 | 0.17 1 | 0.10 1 | 0.21 1 | 0.14 1 |
Net realized and unrealized gains (losses) on investments | (3.75 ) | (0.75 ) | 16.62 | (3.43 ) | (4.43 ) |
Total from investment operations | (3.47 ) | (0.58 ) | 16.72 | (3.22 ) | (4.29 ) |
Distributions to shareholders from | |||||
Net investment income | 0.00 | (0.11 ) | (0.14 ) | (0.18 ) | (0.14 ) |
Net realized gains | (1.35 ) | (2.14 ) | 0.00 | 0.00 | 0.00 |
Total distributions to shareholders | (1.35 ) | (2.25 ) | (0.14 ) | (0.18 ) | (0.14 ) |
Net asset value, end of period | $30.33 | $35.15 | $37.98 | $21.40 | $24.80 |
Total return | (10.20 )% | (1.71 )% | 77.91 % | (13.18 )% | (14.65 )% |
Ratios to average net assets (annualized)* | |||||
Gross expenses | 1.24 % | 1.24 % | 1.24 % | 1.32 % | 1.35 % |
Net expenses | 1.05 % | 1.05 % | 1.05 % | 1.05 % | 1.05 % |
Net investment income | 0.86 % | 0.45 % | 0.35 % | 0.82 % | 0.49 % |
Supplemental data | |||||
Portfolio turnover rate2 | 87 % | 70 % | 62 % | 78 % | 168 % |
Net assets, end of period (000s omitted) | $17,743 | $23,813 | $32,721 | $15,581 | $13,905 |
* | Ratios include net expenses allocated from the affiliated Master Portfolio which were as follows: |
Year ended May 31, 2023 | 0.74% |
Year ended May 31, 2022 | 0.74% |
Year ended May 31, 2021 | 0.74% |
Year ended May 31, 2020 | 0.74% |
Year ended May 31, 2019 | 0.75% |
1 | Calculated based upon average shares outstanding |
2 | Portfolio turnover rate is calculated by multiplying the affiliated Master Portfolio’s percentage of the Fund’s total investment in securities at the end of the period by the affiliated Master Portfolio’s portfolio turnover rate. |
(For a share outstanding throughout each period)
Year ended May 31 | |||||
Institutional Class | 2023 | 2022 | 2021 | 2020 | 2019 |
Net asset value, beginning of period | $35.30 | $38.13 | $21.46 | $24.86 | $29.40 |
Net investment income | 0.35 1 | 0.20 1 | 0.15 1 | 0.25 | 0.19 1 |
Net realized and unrealized gains (losses) on investments | (3.78 ) | (0.71 ) | 16.70 | (3.43 ) | (4.45 ) |
Total from investment operations | (3.43 ) | (0.51 ) | 16.85 | (3.18 ) | (4.26 ) |
Distributions to shareholders from | |||||
Net investment income | (0.01 ) | (0.18 ) | (0.18 ) | (0.22 ) | (0.28 ) |
Net realized gains | (1.35 ) | (2.14 ) | 0.00 | 0.00 | 0.00 |
Total distributions to shareholders | (1.36 ) | (2.32 ) | (0.18 ) | (0.22 ) | (0.28 ) |
Net asset value, end of period | $30.51 | $35.30 | $38.13 | $21.46 | $24.86 |
Total return | (10.03 )% | (1.53 )% | 78.39 % | (13.03 )% | (14.46 )% |
Ratios to average net assets (annualized)* | |||||
Gross expenses | 0.99 % | 0.99 % | 0.99 % | 1.07 % | 1.14 % |
Net expenses | 0.85 % | 0.85 % | 0.85 % | 0.85 % | 0.85 % |
Net investment income | 1.06 % | 0.54 % | 0.52 % | 1.04 % | 0.68 % |
Supplemental data | |||||
Portfolio turnover rate2 | 87 % | 70 % | 62 % | 78 % | 168 % |
Net assets, end of period (000s omitted) | $110,536 | $115,479 | $72,123 | $33,600 | $33,116 |
* | Ratios include net expenses allocated from the affiliated Master Portfolio which were as follows: |
Year ended May 31, 2023 | 0.74% |
Year ended May 31, 2022 | 0.74% |
Year ended May 31, 2021 | 0.74% |
Year ended May 31, 2020 | 0.74% |
Year ended May 31, 2019 | 0.75% |
1 | Calculated based upon average shares outstanding |
2 | Portfolio turnover rate is calculated by multiplying the affiliated Master Portfolio’s percentage of the Fund’s total investment in securities at the end of the period by the affiliated Master Portfolio’s portfolio turnover rate. |
Gross unrealized gains | $45,861,136 |
Gross unrealized losses | 0 |
Net unrealized gains | $45,861,136 |
Affiliated Master Portfolio | Investment objective | Fair value of affiliated Master Portfolio |
Allspring Small Company Value Portfolio | Seeks long-term capital appreciation | $448,713,630 |
Average daily net assets | Management fee |
First $5 billion | 0.050 % |
Next $5 billion | 0.040 |
Over $10 billion | 0.030 |
Class-level administration fee | |
Class A | 0.21 % |
Class C | 0.21 |
Class R6 | 0.03 |
Administrator Class | 0.13 |
Institutional Class | 0.13 |
EXPENSE RATIO CAPS | |
Class A | 1.15 % |
Class C | 1.90 |
Class R6 | 0.75 |
Administrator Class | 1.05 |
Institutional Class | 0.85 |
Year ended May 31 | ||
2023 | 2022 | |
Ordinary income | $62,215 | $11,642,015 |
Long-term capital gain | 20,897,482 | 19,260,365 |
Undistributed ordinary income | Unrealized gains | Capital loss carryforward |
$4,259,079 | $45,861,136 | $(12,204,996 ) |
Allspring Funds Trust:

Shares | Value | |||||
Common stocks: 98.96% | ||||||
Communication services: 0.24% | ||||||
Interactive media & services: 0.24% | ||||||
Cargurus, Inc.† | 65,313 | $1,227,231 | ||||
Consumer discretionary: 11.09% | ||||||
Automobile components: 0.80% | ||||||
Patrick Industries, Inc. | 61,343 | 4,019,807 | ||||
Diversified consumer services: 0.75% | ||||||
Carriage Services, Inc. | 145,137 | 3,796,784 | ||||
Hotels, restaurants & leisure: 1.55% | ||||||
Dine Brands Global, Inc. | 49,400 | 2,955,602 | ||||
Wyndham Hotels & Resorts, Inc. | 71,675 | 4,891,819 | ||||
7,847,421 | ||||||
Household durables: 3.16% | ||||||
Cavco Industries, Inc.† | 9,156 | 2,279,661 | ||||
Century Communities, Inc. | 63,674 | 4,051,576 | ||||
Ethan Allen Interiors, Inc. | 86,628 | 2,168,299 | ||||
GoPro, Inc. Class A† | 117,475 | 493,395 | ||||
Helen of Troy Ltd.† | 31,094 | 2,993,730 | ||||
Meritage Homes Corp. | 34,787 | 4,011,985 | ||||
15,998,646 | ||||||
Leisure products: 1.87% | ||||||
Johnson Outdoors, Inc. Class A | 80,316 | 4,558,736 | ||||
Malibu Boats, Inc. Class A† | 93,399 | 4,898,778 | ||||
9,457,514 | ||||||
Specialty retail: 2.60% | ||||||
1-800-Flowers.com, Inc. Class A† | 339,566 | 2,757,276 | ||||
American Eagle Outfitters, Inc. | 129,717 | 1,319,222 | ||||
Dick’s Sporting Goods, Inc. | 33,997 | 4,334,957 | ||||
Shoe Carnival, Inc. | 171,325 | 3,352,830 | ||||
Williams-Sonoma, Inc. | 12,141 | 1,378,125 | ||||
13,142,410 | ||||||
Textiles, apparel & luxury goods: 0.36% | ||||||
Rocky Brands, Inc. | 94,640 | 1,808,570 | ||||
Consumer staples: 4.06% | ||||||
Beverages: 0.82% | ||||||
Coca-Cola Consolidated, Inc. | 6,274 | 4,151,757 | ||||
Consumer staples distribution & retail: 1.62% | ||||||
Grocery Outlet Holding Corp.† | 146,397 | 4,204,522 | ||||
Sprouts Farmers Market, Inc.† | 114,553 | 3,958,951 | ||||
8,163,473 | ||||||
Shares | Value | |||||
Food products: 1.62% | ||||||
Flowers Foods, Inc. | 84,046 | $2,099,469 | ||||
Hostess Brands, Inc.† | 112,479 | 2,798,478 | ||||
Post Holdings, Inc.† | 38,592 | 3,278,776 | ||||
8,176,723 | ||||||
Energy: 4.13% | ||||||
Energy equipment & services: 1.92% | ||||||
Helmerich & Payne, Inc. | 160,027 | 4,941,634 | ||||
Patterson-UTI Energy, Inc. | 487,887 | 4,752,019 | ||||
9,693,653 | ||||||
Oil, gas & consumable fuels: 2.21% | ||||||
Diamondback Energy, Inc. | 58,775 | 7,473,242 | ||||
W&T Offshore, Inc.† | 954,152 | 3,692,568 | ||||
11,165,810 | ||||||
Financials: 22.33% | ||||||
Banks: 10.93% | ||||||
Ameris Bancorp | 171,577 | 5,414,970 | ||||
Atlantic Union Bankshares Corp. | 203,316 | 5,196,757 | ||||
Axos Financial, Inc.† | 157,464 | 5,955,288 | ||||
Banner Corp. | 111,333 | 4,817,379 | ||||
Customers Bancorp, Inc.† | 136,122 | 3,133,528 | ||||
FB Financial Corp. | 117,424 | 3,130,524 | ||||
Great Southern Bancorp, Inc. | 106,528 | 5,180,457 | ||||
Heritage Financial Corp. | 169,166 | 2,765,864 | ||||
Independent Bank Corp. | 293,144 | 4,792,904 | ||||
OceanFirst Financial Corp. | 87,541 | 1,243,082 | ||||
OFG Bancorp | 229,304 | 5,562,915 | ||||
Synovus Financial Corp. | 196,962 | 5,335,701 | ||||
Univest Financial Corp. | 153,950 | 2,729,534 | ||||
55,258,903 | ||||||
Capital markets: 2.79% | ||||||
Donnelley Financial Solutions, Inc.† | 96,906 | 4,297,781 | ||||
Piper Sandler Cos., | 44,692 | 5,692,420 | ||||
Stifel Financial Corp. | 73,835 | 4,103,011 | ||||
14,093,212 | ||||||
Financial services: 2.06% | ||||||
Cass Information Systems, Inc. | 43,947 | 1,697,233 | ||||
Euronet Worldwide, Inc.† | 23,769 | 2,647,867 | ||||
Jackson Financial, Inc. Class A | 40,588 | 1,124,288 | ||||
WEX, Inc.† | 29,985 | 4,973,012 | ||||
10,442,400 | ||||||
Insurance: 4.00% | ||||||
American Equity Investment Life Holding Co. | 182,757 | 7,209,763 | ||||
Brighthouse Financial, Inc.† | 30,303 | 1,219,999 | ||||
Shares | Value | |||||
Insurance (continued) | ||||||
Genworth Financial, Inc. Class A† | 844,677 | $4,519,022 | ||||
Unum Group† | 166,846 | 7,249,459 | ||||
20,198,243 | ||||||
Mortgage real estate investment trusts (REITs): 2.55% | ||||||
AGNC Investment Corp. | 691,638 | 6,356,153 | ||||
Annaly Capital Management, Inc. | 345,500 | 6,523,040 | ||||
12,879,193 | ||||||
Health care: 12.11% | ||||||
Biotechnology: 1.41% | ||||||
CRISPR Therapeutics AG† | 59,604 | 3,817,040 | ||||
Protagonist Therapeutics, Inc.† | 126,017 | 3,285,263 | ||||
7,102,303 | ||||||
Health care equipment & supplies: 4.83% | ||||||
Dentsply Sirona, Inc. | 96,419 | 3,482,654 | ||||
EDAP TMS SA ADR† | 324,801 | 3,231,770 | ||||
Figs, Inc. Class A† | 209,344 | 1,724,995 | ||||
Masimo Corp.† | 13,806 | 2,234,363 | ||||
Merit Medical Systems, Inc.† | 55,148 | 4,544,195 | ||||
QuidelOrtho Corp.† | 64,046 | 5,452,877 | ||||
UFP Technologies, Inc.† | 24,145 | 3,733,541 | ||||
24,404,395 | ||||||
Health care providers & services: 5.21% | ||||||
Addus HomeCare Corp.† | 56,872 | 5,127,011 | ||||
AMN Healthcare Services, Inc.† | 57,362 | 5,447,095 | ||||
Ensign Group, Inc. | 38,564 | 3,417,156 | ||||
Fulgent Genetics, Inc.† | 112,069 | 4,456,984 | ||||
Joint Corp.† | 34,081 | 483,269 | ||||
Option Care Health, Inc.† | 79,323 | 2,185,349 | ||||
Pediatrix Medical Group, Inc.† | 72,468 | 963,824 | ||||
U.S. Physical Therapy, Inc. | 41,638 | 4,253,322 | ||||
26,334,010 | ||||||
Pharmaceuticals: 0.66% | ||||||
Prestige Consumer Healthcare, Inc.† | 50,192 | 2,872,488 | ||||
Supernus Pharmaceuticals, Inc.† | 14,738 | 488,418 | ||||
3,360,906 | ||||||
Industrials: 21.31% | ||||||
Building products: 2.50% | ||||||
CSW Industrials, Inc. | 27,083 | 3,838,203 | ||||
UFP Industries, Inc. | 57,234 | 4,469,975 | ||||
Zurn Elkay Water Solutions Corp. Class C | 191,068 | 4,300,941 | ||||
12,609,119 | ||||||
Shares | Value | |||||
Commercial services & supplies: 1.47% | ||||||
ABM Industries, Inc. | 95,031 | $4,196,569 | ||||
ACCO Brands Corp. | 287,348 | 1,390,764 | ||||
Healthcare Services Group, Inc.† | 134,882 | 1,822,256 | ||||
7,409,589 | ||||||
Construction & engineering: 3.52% | ||||||
Comfort Systems USA, Inc. | 29,027 | 4,295,415 | ||||
MYR Group, Inc.† | 46,861 | 5,974,778 | ||||
Sterling Infrastructure, Inc.† | 163,694 | 7,541,383 | ||||
17,811,576 | ||||||
Electrical equipment: 2.09% | ||||||
Atkore, Inc.† | 20,812 | 2,430,217 | ||||
Generac Holdings, Inc.† | 36,565 | 3,982,660 | ||||
Regal Rexnord Corp. | 31,832 | 4,134,659 | ||||
10,547,536 | ||||||
Ground transportation: 0.82% | ||||||
ArcBest Corp. | 49,704 | 4,164,201 | ||||
Machinery: 7.01% | ||||||
Federal Signal Corp. | 107,760 | 5,710,202 | ||||
Hillenbrand, Inc. | 125,552 | 6,022,730 | ||||
Hillman Solutions Corp.† | 59,020 | 478,062 | ||||
Kadant, Inc. | 25,994 | 4,931,582 | ||||
Miller Industries, Inc. | 101,669 | 3,340,843 | ||||
Shyft Group, Inc. | 183,737 | 4,319,657 | ||||
Standex International Corp. | 49,198 | 6,700,276 | ||||
Timken Co. | 55,208 | 3,950,132 | ||||
35,453,484 | ||||||
Passenger airlines: 0.66% | ||||||
Alaska Air Group, Inc.† | 74,486 | 3,346,656 | ||||
Professional services: 1.71% | ||||||
CBIZ, Inc.† | 93,816 | 4,730,203 | ||||
First Advantage Corp.† | 141,999 | 1,918,406 | ||||
TTEC Holdings, Inc. | 62,574 | 1,984,847 | ||||
8,633,456 | ||||||
Trading companies & distributors: 1.53% | ||||||
Air Lease Corp. | 39,487 | 1,501,295 | ||||
Boise Cascade Co. | 78,818 | 5,660,709 | ||||
Hudson Technologies, Inc.† | 65,789 | 574,996 | ||||
7,737,000 | ||||||
Shares | Value | |||||
Information technology: 10.92% | ||||||
Communications equipment: 1.20% | ||||||
Aviat Networks, Inc.† | 61,517 | $1,883,651 | ||||
Harmonic, Inc.† | 238,933 | 4,207,610 | ||||
6,091,261 | ||||||
Electronic equipment, instruments & components: 4.77% | ||||||
Belden, Inc. | 23,636 | 2,067,914 | ||||
ePlus, Inc.† | 82,103 | 4,055,067 | ||||
Insight Enterprises, Inc.† | 28,325 | 3,830,107 | ||||
Methode Electronics, Inc. | 107,868 | 4,643,717 | ||||
PC Connection, Inc. | 79,597 | 3,579,477 | ||||
Richardson Electronics Ltd. | 89,763 | 1,489,168 | ||||
Sanmina Corp.† | 84,203 | 4,466,127 | ||||
24,131,577 | ||||||
IT services: 1.42% | ||||||
EPAM Systems, Inc.† | 15,552 | 3,990,954 | ||||
Hackett Group, Inc. | 40,885 | 792,760 | ||||
Kyndryl Holdings, Inc.† | 190,442 | 2,391,952 | ||||
7,175,666 | ||||||
Semiconductors & semiconductor equipment: 2.73% | ||||||
Cirrus Logic, Inc.† | 29,787 | 2,313,854 | ||||
Diodes, Inc.† | 26,999 | 2,425,590 | ||||
FormFactor, Inc.† | 101,768 | 3,184,321 | ||||
Ichor Holdings Ltd.† | 75,486 | 2,287,226 | ||||
Onto Innovation, Inc.† | 33,244 | 3,568,743 | ||||
13,779,734 | ||||||
Software: 0.80% | ||||||
Mitek Systems, Inc.† | 73,524 | 766,120 | ||||
Verint Systems, Inc.† | 90,995 | 3,264,901 | ||||
4,031,021 | ||||||
Materials: 5.86% | ||||||
Chemicals: 3.24% | ||||||
AdvanSix, Inc. | 149,312 | 4,912,365 | ||||
Hawkins, Inc. | 128,923 | 6,051,645 | ||||
Ingevity Corp.† | 14,635 | 690,626 | ||||
Minerals Technologies, Inc. | 58,129 | 3,232,554 | ||||
Stepan Co. | 15,938 | 1,465,499 | ||||
16,352,689 | ||||||
Construction materials: 1.49% | ||||||
Eagle Materials, Inc. | 46,192 | 7,526,062 | ||||
Containers & packaging: 0.19% | ||||||
Greif, Inc. Class A | 15,839 | 951,924 | ||||
Shares | Value | |||||
Metals & mining: 0.94% | ||||||
Schnitzer Steel Industries, Inc. Class A | 173,055 | $4,760,743 | ||||
Real estate: 6.36% | ||||||
Diversified REITs: 0.90% | ||||||
Armada Hoffler Properties, Inc. | 294,336 | 3,249,469 | ||||
One Liberty Properties, Inc. | 65,967 | 1,320,000 | ||||
4,569,469 | ||||||
Health care REITs: 0.30% | ||||||
Global Medical REIT, Inc. | 174,513 | 1,521,753 | ||||
Industrial REITs : 2.71% | ||||||
LXP Industrial Trust | 236,095 | 2,441,222 | ||||
Plymouth Industrial REIT, Inc. | 175,303 | 3,840,889 | ||||
STAG Industrial, Inc. | 212,648 | 7,400,150 | ||||
13,682,261 | ||||||
Office REITs : 0.22% | ||||||
Vornado Realty Trust | 81,364 | 1,103,296 | ||||
Retail REITs : 1.16% | ||||||
Agree Realty Corp. | 63,659 | 4,105,369 | ||||
Retail Opportunity Investments Corp. | 145,291 | 1,772,550 | ||||
5,877,919 | ||||||
Specialized REITs : 1.07% | ||||||
Outfront Media, Inc. | 131,722 | 1,886,259 | ||||
PotlatchDeltic Corp. | 75,767 | 3,525,439 | ||||
5,411,698 | ||||||
Utilities: 0.55% | ||||||
Electric utilities: 0.37% | ||||||
IDACORP, Inc. | 5,914 | 615,470 | ||||
Pinnacle West Capital Corp. | 8,639 | 667,622 | ||||
Portland General Electric Co. | 11,559 | 563,270 | ||||
1,846,362 | ||||||
Water utilities: 0.18% | ||||||
California Water Service Group | 10,864 | 618,270 | ||||
Middlesex Water Co. | 3,800 | 309,168 | ||||
927,438 | ||||||
Total common stocks (Cost $412,203,683) | 500,176,854 | |||||
Expiration date | Shares | Value | ||||
Warrants: 0.00% | ||||||
Energy: 0.00% | ||||||
Energy equipment & services: 0.00% | ||||||
Parker Drilling Co.† | 9-16-2024 | 8,457 | $211 | |||
Total warrants (Cost $0) | 211 | |||||
Yield | ||||||
Short-term investments: 0.94% | ||||||
Investment companies: 0.94% | ||||||
Allspring Government Money Market Fund Select Class♠∞ | 5.01 % | 4,743,595 | 4,743,595 | |||
Total short-term investments (Cost $4,743,595) | 4,743,595 | |||||
Total investments in securities (Cost $416,947,278) | 99.90 % | 504,920,660 | ||||
Other assets and liabilities, net | 0.10 | 528,144 | ||||
Total net assets | 100.00 % | $505,448,804 | ||||
† | Non-income-earning security |
♠ | The issuer of the security is an affiliated person of the Portfolio as defined in the Investment Company Act of 1940. |
∞ | The rate represents the 7-day annualized yield at period end. |
Abbreviations: | |
ADR | American depositary receipt |
REIT | Real estate investment trust |
Value, beginning of period | Purchases | Sales proceeds | Net realized gains (losses) | Net change in unrealized gains (losses) | Value, end of period | Shares, end of period | Income from affiliated securities | |
Short-term investments | ||||||||
Allspring Government Money Market Fund Select Class | $5,144,446 | $86,990,939 | $(87,391,790 ) | $0 | $0 | $4,743,595 | 4,743,595 | $176,646 |
Investments in affiliates no longer held at end of period | ||||||||
Securities Lending Cash Investments LLC | 8,022,300 | 73,268,132 | (81,290,232 ) | (200 ) | 0 | 0 | 0 | 107,340 1 |
$(200 ) | $0 | $4,743,595 | $283,986 |
1 | Amount shown represents income before fees and rebates. |
Assets | |
Investments in unaffiliated securities, at value (cost $412,203,683) | $500,177,065 |
Investments in affiliated securities, at value (cost $4,743,595) | 4,743,595 |
Cash | 156,255 |
Receivable for investments sold | 5,012,357 |
Receivable for dividends | 784,246 |
Prepaid expenses and other assets | 6,610 |
Total assets | 510,880,128 |
Liabilities | |
Payable for investments purchased | 5,098,711 |
Advisory fee payable | 303,338 |
Trustees’ fees and expenses payable | 504 |
Accrued expenses and other liabilities | 28,771 |
Total liabilities | 5,431,324 |
Total net assets | $505,448,804 |
Investment income | |
Dividends (net of foreign withholdings taxes of $17,167) | $10,250,490 |
Income from affiliated securities | 545,814 |
Interest | 150 |
Total investment income | 10,796,454 |
Expenses | |
Advisory fee | 4,507,550 |
Custody and accounting fees | 61,434 |
Professional fees | 67,178 |
Interest holder report expenses | 18,862 |
Trustees’ fees and expenses | 27,365 |
Other fees and expenses | 25,377 |
Total expenses | 4,707,766 |
Less: Fee waivers and/or expense reimbursements | (523,137 ) |
Net expenses | 4,184,629 |
Net investment income | 6,611,825 |
Realized and unrealized gains (losses) on investments | |
Net realized losses on | |
Unaffiliated securities | (12,010,256 ) |
Affiliated securities | (200 ) |
Net realized losses on investments | (12,010,456 ) |
Net change in unrealized gains (losses) on investments | (51,512,308 ) |
Net realized and unrealized gains (losses) on investments | (63,522,764 ) |
Net decrease in net assets resulting from operations | $(56,910,939 ) |
Year ended May 31, 2023 | Year ended May 31, 2022 | |||
Operations | ||||
Net investment income | $6,611,825 | $4,422,079 | ||
Net realized gains (losses) on investments | (12,010,456 ) | 64,991,534 | ||
Net change in unrealized gains (losses) on investments | (51,512,308 ) | (80,777,394 ) | ||
Net decrease in net assets resulting from operations | (56,910,939 ) | (11,363,781 ) | ||
Capital transactions | ||||
Transactions in investors’ beneficial interests | ||||
Contributions | 41,481,218 | 74,799,145 | ||
Withdrawals | (75,314,113 ) | (87,265,392 ) | ||
Net decrease in net assets resulting from capital transactions | (33,832,895 ) | (12,466,247 ) | ||
Total decrease in net assets | (90,743,834 ) | (23,830,028 ) | ||
Net assets | ||||
Beginning of period | 596,192,638 | 620,022,666 | ||
End of period | $505,448,804 | $596,192,638 | ||
Year ended May 31 | |||||
2023 | 2022 | 2021 | 2020 | 2019 | |
Total return | (9.95 )% | (1.78 )% | 78.76 % | (13.74 )% | (14.51 )% |
Ratios to average net assets (annualized) | |||||
Gross expenses | 0.83 % | 0.83 % | 0.83 % | 0.82 % | 0.86 % |
Net expenses1 | 0.74 % | 0.74 % | 0.74 % | 0.74 % | 0.75 % |
Net investment income | 1.17 % | 0.72 % | 0.71 % | 1.15 % | 0.80 % |
Supplemental data | |||||
Portfolio turnover rate | 87 % | 70 % | 62 % | 78 % | 168 % |
1 | Net expense ratios reflect voluntary waivers, if any. |
Gross unrealized gains | $105,377,395 |
Gross unrealized losses | (29,745,489 ) |
Net unrealized gains | $75,631,906 |
Quoted prices (Level 1) | Other significant observable inputs (Level 2) | Significant unobservable inputs (Level 3) | Total | |
Assets | ||||
Investments in: | ||||
Common stocks | ||||
Communication services | $1,227,231 | $0 | $0 | $1,227,231 |
Consumer discretionary | 56,071,152 | 0 | 0 | 56,071,152 |
Consumer staples | 20,491,953 | 0 | 0 | 20,491,953 |
Energy | 20,859,463 | 0 | 0 | 20,859,463 |
Financials | 112,871,951 | 0 | 0 | 112,871,951 |
Health care | 61,201,614 | 0 | 0 | 61,201,614 |
Industrials | 107,712,617 | 0 | 0 | 107,712,617 |
Information technology | 55,209,259 | 0 | 0 | 55,209,259 |
Materials | 29,591,418 | 0 | 0 | 29,591,418 |
Real estate | 32,166,396 | 0 | 0 | 32,166,396 |
Utilities | 2,773,800 | 0 | 0 | 2,773,800 |
Warrants | ||||
Energy | 0 | 211 | 0 | 211 |
Short-term investments | ||||
Investment companies | 4,743,595 | 0 | 0 | 4,743,595 |
Total assets | $504,920,449 | $211 | $0 | $504,920,660 |
Average daily net assets | Advisory fee |
First $500 million | 0.800 % |
Next $500 million | 0.775 |
Next $1 billion | 0.750 |
Next $1 billion | 0.725 |
Next $1 billion | 0.700 |
Over $4 billion | 0.680 |
Allspring Master Trust:
Name and year of birth | Position held and length of service* | Principal occupations during past five years or longer | Current other public company or investment company directorships |
William R. Ebsworth (Born 1957) | Trustee, since 2015 | Retired. From 1984 to 2013, equities analyst, portfolio manager, research director and chief investment officer at Fidelity Management and Research Company in Boston, Tokyo, and Hong Kong, and retired in 2013 as Chief Investment Officer of Fidelity Strategic Advisers, Inc. where he led a team of investment professionals managing client assets. Prior thereto, Board member of Hong Kong Securities Clearing Co., Hong Kong Options Clearing Corp., the Thailand International Fund, Ltd., Fidelity Investments Life Insurance Company, and Empire Fidelity Investments Life Insurance Company. Audit Committee Chair and Investment Committee Chair of the Vincent Memorial Hospital Foundation (non-profit organization). Mr. Ebsworth is a CFA charterholder. | N/A |
Jane A. Freeman (Born 1953) | Trustee, since 2015; Chair Liaison, since 2018 | Retired. From 2012 to 2014 and 1999 to 2008, Chief Financial Officer of Scientific Learning Corporation. From 2008 to 2012, Ms. Freeman provided consulting services related to strategic business projects. Prior to 1999, Portfolio Manager at Rockefeller & Co. and Scudder, Stevens & Clark. Board member of the Harding Loevner Funds from 1996 to 2014, serving as both Lead Independent Director and chair of the Audit Committee. Board member of the Russell Exchange Traded Funds Trust from 2011 to 2012 and the chair of the Audit Committee. Ms. Freeman is also an inactive Chartered Financial Analyst. | N/A |
Isaiah Harris, Jr. (Born 1952) | Trustee, since 2009; Audit Committee Chair, since 2019 | Retired. Member of the Advisory Board of CEF of East Central Florida. Chairman of the Board of CIGNA Corporation from 2009 to 2021, and Director from 2005 to 2008. From 2003 to 2011, Director of Deluxe Corporation. Prior thereto, President and CEO of BellSouth Advertising and Publishing Corp. from 2005 to 2007, President and CEO of BellSouth Enterprises from 2004 to 2005 and President of BellSouth Consumer Services from 2000 to 2003. Emeritus member of the Iowa State University Foundation Board of Governors. Emeritus Member of the Advisory board of Iowa State University School of Business. Advisory Board Member, Palm Harbor Academy (private school). Advisory Board Member, Fellowship of Christian Athletes. Mr. Harris is a certified public accountant (inactive status). | N/A |
David F. Larcker (Born 1950) | Trustee, since 2009 | Distinguished Visiting Fellow at the Hoover Institution since 2022. James Irvin Miller Professor of Accounting at the Graduate School of Business (Emeritus), Stanford University, Director of the Corporate Governance Research Initiative and Senior Faculty of The Rock Center for Corporate Governance since 2006. From 2005 to 2008, Professor of Accounting at the Graduate School of Business, Stanford University. Prior thereto, Ernst & Young Professor of Accounting at The Wharton School, University of Pennsylvania from 1985 to 2005. | N/A |
Olivia S. Mitchell (Born 1953) | Trustee, since 2006; Nominating and Governance Committee Chair, since 2018 | International Foundation of Employee Benefit Plans Professor since 1993, Wharton School of the University of Pennsylvania. Director of Wharton’s Pension Research Council and Boettner Center on Pensions & Retirement Research, and Research Associate at the National Bureau of Economic Research. Previously taught at Cornell University from 1978 to 1993. | N/A |
Timothy J. Penny (Born 1951) | Trustee, since 1996; Chair, since 2018 | President and Chief Executive Officer of Southern Minnesota Initiative Foundation, a non-profit organization, since 2007. Vice Chair of the Economic Club of Minnesota, since 2007. Co-Chair of the Committee for a Responsible Federal Budget, since 1995. Member of the Board of Trustees of NorthStar Education Finance, Inc., a non-profit organization, from 2007-2022. Senior Fellow of the University of Minnesota Humphrey Institute from 1995 to 2017. | N/A |
Name and year of birth | Position held and length of service* | Principal occupations during past five years or longer | Current other public company or investment company directorships |
James G. Polisson (Born 1959) | Trustee, since 2018 | Retired. Chief Marketing Officer, Source (ETF) UK Services, Ltd, from 2015 to 2017. From 2012 to 2015, Principal of The Polisson Group, LLC, a management consulting, corporate advisory and principal investing company. Chief Executive Officer and Managing Director at Russell Investments, Global Exchange Traded Funds from 2010 to 2012. Managing Director of Barclays Global Investors from 1998 to 2010 and Global Chief Marketing Officer for iShares and Barclays Global Investors from 2000 to 2010. Trustee of the San Francisco Mechanics’ Institute, a non- profit organization, from 2013 to 2015. Board member of the Russell Exchange Traded Fund Trust from 2011 to 2012. Director of Barclays Global Investors Holdings Deutschland GmbH from 2006 to 2009. Mr. Polisson is an attorney and has a retired status with the Massachusetts and District of Columbia Bar Associations. | N/A |
Pamela Wheelock (Born 1959) | Trustee, since January 2020; previously Trustee from January 2018 to July 2019 | Retired. Executive and Senior Financial leadership positions in the public, private and nonprofit sectors. Interim President and CEO, McKnight Foundation, 2020. Interim Commissioner, Minnesota Department of Human Services, 2019. Chief Operating Officer, Twin Cities Habitat for Humanity, 2017-2019. Vice President for University Services, University of Minnesota, 2012- 2016. Interim President and CEO, Blue Cross and Blue Shield of Minnesota, 2011-2012. Executive Vice-President and Chief Financial Officer, Minnesota Wild, 2002-2008. Commissioner, Minnesota Department of Finance, 1999-2002. Chair of the Board of Directors of Destination Medical Center Corporation. Board member of the Minnesota Wild Foundation. | N/A |
* | Length of service dates reflect the Trustee’s commencement of service with the Trust’s predecessor entities, where applicable. |
Name and year of birth | Position held and length of service | Principal occupations during past five years or longer |
Andrew Owen (Born 1960) | President, since 2017 | President and Chief Executive Officer of Allspring Funds Management, LLC since 2017 and Head of Global Fund Governance of Allspring Global Investments since 2022. Prior thereto, co-president of Galliard Capital Management, LLC, an affiliate of Allspring Funds Management, LLC, from 2019 to 2022 and Head of Affiliated Managers, Allspring Global Investments, from 2014 to 2019 and Executive Vice President responsible for marketing, investments and product development for Allspring Funds Management, LLC, from 2009 to 2014. |
Jeremy DePalma (Born 1974) | Treasurer, since 2012 (for certain funds in the Fund Complex); since 2021 (for the remaining funds in the Complex) | Senior Vice President of Allspring Funds Management, LLC since 2009. Senior Vice President of Evergreen Investment Management Company, LLC from 2008 to 2010 and head of the Fund Reporting and Control Team within Fund Administration from 2005 to 2010. |
Christopher Baker (Born 1976) | Chief Compliance Officer, since 2022 | Global Chief Compliance Officer for Allspring Global Investments since 2022. Prior thereto, Chief Compliance Officer for State Street Global Advisors from 2018 to 2021. Senior Compliance Officer for the State Street divisions of Alternative Investment Solutions, Sector Solutions, and Global Marketing from 2015 to 2018. From 2010 to 2015 Vice President, Global Head of Investment and Marketing Compliance for State Street Global Advisors. |
Matthew Prasse (Born 1983) | Chief Legal Officer, since 2022; Secretary, since 2021 | Senior Counsel of the Allspring Legal Department since 2021. Senior Counsel of the Wells Fargo Legal Department from 2018 to 2021. Previously, Counsel for Barings LLC from 2015 to 2018. Prior to joining Barings, Associate at Morgan, Lewis & Bockius LLP from 2008 to 2015. |

P.O. Box 219967
Kansas City, MO 64121-9967

AR1815 05-23
ITEM 2. CODE OF ETHICS
(a) As of the end of the period covered by the report, Allspring Master Trust has adopted a code of ethics that applies to its President and Treasurer. A copy of the code of ethics is filed as an exhibit to this Form N-CSR.
(c) During the period covered by this report, there were no amendments to the provisions of the code of ethics adopted in Item 2(a) above.
(d) During the period covered by this report, there were no implicit or explicit waivers to the provisions of the code of ethics adopted in Item 2(a) above.
ITEM 3. AUDIT COMMITTEE FINANCIAL EXPERT
The Board of Trustees of Allspring Master Trust has determined that Isaiah Harris is an audit committee financial expert, as defined in Item 3 of Form N-CSR. Mr. Harris is independent for purposes of Item 3 of Form N-CSR.
ITEM 4. PRINCIPAL ACCOUNTANT FEES AND SERVICES
(a), (b), (c), (d) The following table presents aggregate fees billed in each of the last two fiscal years for services rendered to the Registrant by the Registrant’s principal accountant. These fees were billed to the registrant and were approved by the Registrant’s audit committee.
| Fiscal year ended May 31, 2023 | Fiscal year ended May 31, 2022 | |||||||
Audit fees | $ | 451,300 | $ | 403,220 | ||||
Audit-related fees | — | |||||||
Tax fees (1) | 83,520 | 82,570 | ||||||
All other fees | — | |||||||
| $ | 534,820 | $ | 485,790 | |||||
| (1) | Tax fees consist of fees for tax compliance, tax advice, tax planning and excise tax. |
(e) The Chair of the Audit Committees is authorized to pre-approve: (1) audit services for the mutual funds of Allspring Master Trust; (2) non-audit tax or compliance consulting or training services provided to the Funds by the independent auditors (“Auditors”) if the fees for any particular engagement are not anticipated to exceed $50,000; and (3) non-audit tax or compliance consulting or training services provided by the Auditors to a Fund’s investment adviser and its controlling entities (where pre-approval is required because the engagement relates directly to the operations and financial reporting of the Fund) if the fee to the Auditors for any particular engagement is not anticipated to exceed $50,000. For any such pre-approval sought from the Chair, Management shall prepare a brief description of the proposed services. If the Chair approves of such service, he or she shall sign the statement prepared by Management. Such written statement shall be presented to the full Committees at their next regularly scheduled meetings.
(f) Not applicable.
(g) Not applicable.
(h) Not applicable.
(i) Not applicable.
(j) Not applicable.
ITEM 5. AUDIT COMMITTEE OF LISTED REGISTRANTS
Not applicable.
ITEM 6. INVESTMENTS
A Portfolio of Investments for the series of Allspring Master Trust is included as part of the report to shareholders filed under Item 1 of this Form.
ITEM 7. DISCLOSURE OF PROXY VOTING POLICIES AND PROCEDURES FOR CLOSED-END MANAGEMENT INVESTMENT COMPANIES
Not applicable.
ITEM 8. PORTFOLIO MANAGERS OF CLOSED-END MANAGEMENT INVESTMENT COMPANIES
Not applicable.
ITEM 9. PURCHASES OF EQUITY SECURITIES BY CLOSED-END MANAGEMENT INVESTMENT COMPANY AND AFFILIATED PURCHASERS
Not applicable.
ITEM 10. SUBMISSION OF MATTERS TO A VOTE OF SECURITY HOLDERS
There have been no material changes to the procedures by which shareholders may recommend nominees to the registrant’s Board of Trustees that have been implemented since the registrant’s last provided disclosure in response to the requirements of this Item.
ITEM 11. CONTROLS AND PROCEDURES
(a) The President and Treasurer have concluded that the Allspring Master Trust disclosure controls and procedures (as defined in Rule 30a-3(c) under the Investment Company Act of 1940) provide reasonable assurances that material information relating to the registrant is made known to them by the appropriate persons based on their evaluation of these controls and procedures as of a date within 90 days of the filing of this report.
(b) There were no significant changes in the registrant’s internal controls over financial reporting (as defined in Rule 30a-3(d) under the Investment Company Act of 1940) that occurred during the most recent fiscal half-year of the period covered by this report that materially affected, or is reasonably likely to materially affect, the registrant’s internal control over financial reporting.
ITEM 12. DISCLOSURES OF SECURITIES LENDING ACTIVITES FOR CLOSED-END MANAGEMENT INVESTMENT COMPANIES
Not applicable.
ITEM 13. EXHIBITS
| (a)(1) | Code of Ethics. | |
| (a)(2) | Certifications pursuant to Section 302 of the Sarbanes-Oxley Act of 2002. | |
| (a)(3) | Not applicable. | |
| (a)(4) | Not applicable. | |
| (b) | Certifications pursuant to Section 906 of the Sarbanes-Oxley Act of 2002. | |
SIGNATURES
Pursuant to the requirements of the Securities Exchange Act of 1934 and the Investment Company Act of 1940, the registrant has duly caused this report to be signed on its behalf by the undersigned, thereunto duly authorized.
| Allspring Master Trust | ||
| By: | /s/ Andrew Owen | |
| Andrew Owen | ||
| President | ||
| Date: July 27, 2023 | ||
Pursuant to the requirements of the Securities Exchange Act of 1934 and the Investment Company Act of 1940, this report has been signed below by the following persons on behalf of the registrant and in the capacities and on the date indicated.
| Allspring Master Trust | ||
| By: | /s/ Andrew Owen | |
| Andrew Owen | ||
| President | ||
| Date: July 27, 2023 | ||
| By: | /s/ Jeremy DePalma | |
| Jeremy DePalma | ||
| Treasurer | ||
| Date: July 27, 2023 | ||