January 31, 2009 INOVA TECHNOLOGY RESTATEMENTS
A summary of the adjustments is in the spreadsheet below:
| Cumulative | ||||||||||||||||||||||||||||
| Cum | Cum | Cumulative | effect to | |||||||||||||||||||||||||
| Amortization | Management fee | Total | amort | Mgt fee | earnings effect | restate | ||||||||||||||||||||||
| 7/05 | 20,036 | 30,000 | 50,036 | 20,036 | 30,000 | 50,036 | 50,036 | |||||||||||||||||||||
| 10/05 | 30,054 | 45,000 | 75,054 | 50,089 | 75,000 | 125,089 | 125,089 | |||||||||||||||||||||
| 1/06 | 30,054 | 45,000 | 75,054 | 80,143 | 120,000 | 200,143 | 200,143 | |||||||||||||||||||||
| 4/06 | 30,054 | 45,000 | 75,054 | 110,196 | 165,000 | 275,196 | 275,196 | |||||||||||||||||||||
| 7/06 | 30,054 | 45,000 | 75,054 | 140,250 | 210,000 | 350,250 | 350,250 | |||||||||||||||||||||
| 10/06 | 30,054 | 45,000 | 75,054 | 170,303 | 255,000 | 425,303 | 425,303 | |||||||||||||||||||||
| 1/07 | 30,054 | 15,000 | 45,054 | 200,357 | 270,000 | 470,357 | 470,357 | |||||||||||||||||||||
| 4/07 | 30,054 | 30,054 | 230,410 | 270,000 | 500,410 | 500,410 | ||||||||||||||||||||||
| 7/07 | 30,054 | 30,054 | 260,464 | 270,000 | 530,464 | 530,464 | ||||||||||||||||||||||
| 10/07 | 30,054 | 30,054 | 290,517 | 270,000 | 560,517 | 560,517 | ||||||||||||||||||||||
| 1/08 | 30,054 | 30,054 | 320,571 | 270,000 | 590,571 | 590,571 | ||||||||||||||||||||||
| 4/08 | 30,054 | 30,054 | 350,624 | 270,000 | 620,624 | 90,000 | ||||||||||||||||||||||
| 7/08 | 10,018 | 10,018 | 360,642 | 270,000 | 630,642 | 90,000 | ||||||||||||||||||||||
| 10/08 | 0 | - | 360,642 | 270,000 | 630,642 | 90,000 | ||||||||||||||||||||||
| 360,642 | 270,000 | 630,642 | ||||||||||||||||||||||||||
The following wording will appear in each filing, after the history of the organization:
Restatement of Previously Issued Financial Statements
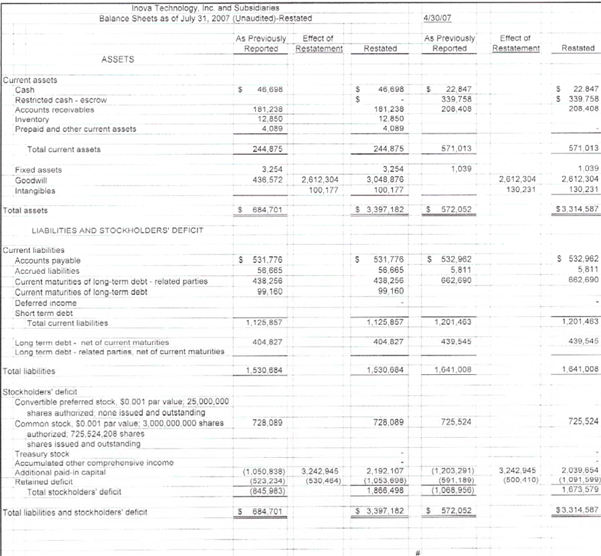
The Company restated its consolidated financial statements, as more fully discussed in Item 9. The Company restated its consolidated balance sheet, its consolidated statements of income, of changes in shareholders' equity and of cash flows as of July 31, 2005. The restatement corrects for errors made in the financial statements related to management fees and goodwill from the Web’s Biggest transaction.
Basic and diluted net income (loss) per share
Basic loss per share is computed using the weighted average number of shares of common stock outstanding during each period. Diluted loss per share includes the dilutive effects of common stock equivalents on an “as if converted” basis. For the years ended 2008 and 2007, potential dilutive securities had an anti-dilutive effect and were not included in the calculation of diluted net loss per common share.
July 31, 2005 filing:
Restatements
The company determined that the original accounting for the merger with Web’s Biggest was incorrect. The company should have accounted for the merger as a reverse acquisition whereby the shares retained by the registrant’s shareholders would be fair valued using the closing price of the registrant’s shares (purchase price) and compared to the fair value of the net assets at the time of merger. The company determined the purchase price was (70,425,950 shares x 6/1/05 closing price of $.035 = $2,464,908). The fair value of the net assets was ($508,037) resulting in goodwill of $2,972,945. Therefore the net assets and equity will be increased by this amount.
Also, there were management fees of $15,000 per month from June, 2005 through July, 2005 which were not paid but which are now being realized as an increase in expense and in paid in capital. This is a total of $30,000, which is a reduction of net income and increase to equity.
Inova Technology, Inc. and Subsidiaries
Balance Sheets as of July 31, 2005 (Unaudited)-Restated
| As Previously | Effect of | |||||||||||||||
| Reported | Restatement | Restated | 4/30/2005 | |||||||||||||
| ASSETS | ||||||||||||||||
| Current assets | ||||||||||||||||
| Cash | 466,614 | 466,614 | 15,367 | |||||||||||||
| Accounts receivables | 488,426 | 488,426 | 405,886 | |||||||||||||
| Intangibles | 340,606 | 340,606 | ||||||||||||||
| Inventory | 2,868 | 3,775 | ||||||||||||||
| Prepaid and other current assets | 18,015 | 18,015 | 7,796 | |||||||||||||
| Total current assets | 975,923 | 1,313,661 | 432,824 | |||||||||||||
| Fixed assets | 28,260 | 28,260 | 15,135 | |||||||||||||
| Goodwill | 2,612,304 | 2,612,304 | ||||||||||||||
| Other assets | 202 | 517 | ||||||||||||||
| Total assets | 1,004,385 | 3,954,225 | 448,476 | |||||||||||||
| LIABILITIES AND STOCKHOLDERS' DEFICIT | ||||||||||||||||
| Current liabilities | ||||||||||||||||
| Accounts payable | 513,869 | 513,869 | 542,701 | |||||||||||||
| Current maturities of long-term debt - related parties | 70,460 | 70,460 | 49,614 | |||||||||||||
| Deferred income | 106,655 | 106,655 | ||||||||||||||
| Payroll liabilities | 1,743 | 1,743 | ||||||||||||||
| Short term debt | 133,412 | 133,412 | 305,398 | |||||||||||||
| Other current liabilities | 11,887 | 11,887 | ||||||||||||||
| Total current liabilities | 838,026 | 838,026 | 897,713 | |||||||||||||
| Long term debt - net of current maturities | 0 | |||||||||||||||
| Long term debt - related parties, net of current maturities | 441,517 | 441,517 | 58,800 | |||||||||||||
| Total liabilities | 1,279,543 | 1,279,543 | 956,513 | |||||||||||||
| Stockholders' deficit | ||||||||||||||||
| Convertible preferred stock, $0.001 par value; 25,000,000 | ||||||||||||||||
shares authorized; 25,000,00 issued and outstanding | 25,000 | 25,000 | ||||||||||||||
| Common stock, $0.001 par value;150,000,000 shares | ||||||||||||||||
| authorized; 69,994,000 shares | ||||||||||||||||
| shares issued and outstanding | 69,994 | 69,994 | 69,994 | |||||||||||||
| Accumulated other comprehensive income | (8,514 | ) | (8,514 | ) | (629 | ) | ||||||||||
| Additional paid-in capital | 2,691,689 | 2,999,876 | 5,691,565 | 2,776,659 | ||||||||||||
| Retained deficit | (3,053,327 | ) | (50,036 | ) | (3,103,363 | ) | (3,354,061 | ) | ||||||||
| Total stockholders' deficit | (275,158 | ) | 2,674,682 | (508,037 | ) | |||||||||||
| Total liabilities and stockholders' deficit | 1,004,385 | 3,954,225 | 448,476 | |||||||||||||
Consolidated Statements of Operations
For the 3 months ended July 31, 2005
(Unaudited)-Restated
| 7/31/2005 | Restatements | Restated | 7/31/2004 | |||||||||||||
| Revenues | 789,710 | 789,710 | 458,268 | |||||||||||||
| Refunds | (39,324 | ) | ||||||||||||||
| Cost of revenues | (197,188 | ) | (197,188 | ) | (20,000 | ) | ||||||||||
| Operating expenses | (220,314 | ) | (50,036 | ) | (270,350 | ) | (11,071 | ) | ||||||||
| Operating loss | 372,208 | (50,036 | ) | 322,172 | 387,873 | |||||||||||
| Other income (expense): | ||||||||||||||||
| Loss on exchange of business assets | ||||||||||||||||
| Interest income | 4,113 | 1,082 | ||||||||||||||
| Interest expense | ||||||||||||||||
| Income (loss) from continuing operations | 376,321 | (50,036 | ) | 326,285 | 383,955 | |||||||||||
| Loss from discontinuing operations | ||||||||||||||||
| Net income (loss) | ||||||||||||||||
| Basic income (loss) per share: | 69,993,450 | 69,993,450 | ||||||||||||||
| Diluted income (loss) per share: | 476,472,988 | 69,993,450 | ||||||||||||||
| From continuing operations | 0 | |||||||||||||||
| From discontinued operations | 0 | |||||||||||||||
| Total | 0 | |||||||||||||||
| Weighted average common shares | 0 | |||||||||||||||
| Consolidated Statements of Cash Flows |
| For the 3 months ended July 31, 2005 |
| (Unaudited)-Restated |
| 7/31/2005 | Restatements | Restated | 7/31/2004 | |||||||||||||
| CASH FLOWS OPERATING ACTIVITIES | ||||||||||||||||
| Net income/loss | 376,320 | 376,320 | 383,955 | |||||||||||||
| Add: income (loss) from discontinued operations | ||||||||||||||||
| Loss from continuing operations | ||||||||||||||||
| Additional shares issued for conversion of debt | - | |||||||||||||||
| Depreciation and amortization expense | (389 | ) | (389 | ) | 589 | |||||||||||
| Changes in operating assets and liabilities: | ||||||||||||||||
| Increase (decrease) in A/P and accrued expenses | - | |||||||||||||||
| Decrease (increase) in accounts receivable | (34,696 | ) | (34,696 | ) | 30,049 | |||||||||||
| Increase (decrease) in deferred income | (5,631 | ) | (5,631 | ) | 145,162 | |||||||||||
| Increase (decrease) in accrued expense | - | |||||||||||||||
| Increase (decrease) in inventory | - | |||||||||||||||
| Decrease (increase) in current assets | (3,376 | ) | (3,376 | ) | ||||||||||||
| Net cash provided by (used in) operating activities | (44,092 | ) | (50,036 | ) | (94,128 | ) | 209,333 | |||||||||
| CASH FLOW INVESTING ACTIVITIES | ||||||||||||||||
| Increase (decrease) in loans receivable | ||||||||||||||||
| Purchase of Desert | - | |||||||||||||||
| Purchase of treasury stock | ||||||||||||||||
| Purchase of Right-Tag | - | |||||||||||||||
| Purchase of fixed assets | (7,018 | ) | (7,018 | ) | (1,948 | ) | ||||||||||
| Net cash provided by (used in) investing activities | (7,018 | ) | (7,018 | ) | (1,948 | ) | ||||||||||
| CASH FLOW FINANCING ACTIVITIES | ||||||||||||||||
| Proceeds from notes payable - related parties | (301,305 | ) | (301,305 | ) | 1,373 | |||||||||||
| Proceeds from APIC | 50,036 | 50,036 | ||||||||||||||
| Translation adjustment | ||||||||||||||||
| Borrowings RE Distributions | (1,943 | ) | ||||||||||||||
| Net cash provided by (used in) financing activities | (301,305 | ) | (301,305 | ) | (570 | ) | ||||||||||
| NET CASH PROVIDED BY (USED IN) CONTINUING OPERATIONS | (352,415 | ) | (352,415 | ) | 206,815 | |||||||||||
| NET CASH PROVIDED BY DISCONTINUED OPERATIONS | ||||||||||||||||
| NET CHANGE IN CASH | (352,415 | ) | (352,415 | ) | 206,815 | |||||||||||
| CASH AT BEGINNING OF PERIOD | (819,229 | ) | (819,229 | ) | 1,797,160 | |||||||||||
| CASH AT END OF PERIOD | 466,814 | 466,814 | 2,003,975 | |||||||||||||
Also, for each filing the signatures will be updated to have current dates, as indicated in the manner below:
Item 6. Exhibits
(A) Exhibits
SIGNATURES
In accordance with the requirements of the Exchange Act, the registrant caused this report to be signed on its behalf by the undersigned, thereunto duly authorized.
EDGETECH SERVICES INC.
By: /s/ Adam Radly
Adam Radly, President & CEO
Date: November 14, 2008
By: /s/ Bob Bates
Bob Bates, CFO
Date: November 14, 2008
Exhibit 31.1
CERTIFICATION OF THE CHIEF EXECUTIVE OFFICER REQUIRED BY RULE 13A - 14(A) OR RULE 15D - 14(A)
I, Adam Radly, certify that:
1. I have reviewed this quarterly report on Form 10-QSB of Edgetech Services Inc.
2. Based on my knowledge, this report does not contain any untrue statement of a material fact or omit to state a material fact necessary to make the statements made, in light of the circumstances under which such statements were made, not misleading with respect to the period covered by this report;
3. Based on my knowledge, the financial statements, and other financial information included in this report, fairly present in all material respects the financial condition, results of operations and cash flows of the small business issuer as of, and for, the periods presented in this report;
4. The small business issuer's other certifying officer(s) and I are responsible for establishing and maintaining disclosure controls and procedures (as defined in Exchange Act Rules 13a-15(e) and 15d-15(e)) for the small business issuer and have
(a) Designed such disclosure controls and procedures, or caused such disclosure controls and procedures to be designed under our supervision, to ensure that material information relating to the small business issuer, including its consolidated subsidiaries, is made known to us by others within those entities, particularly during the period in which this report is being prepared;
(b) Evaluated the effectiveness of the small business issuer's disclosure controls and procedures and presented in this report our conclusions about the effectiveness of the disclosure controls and procedures, as of the end of the period covered by this report based on such evaluation; and
(c) Disclosed in this report any change in the small business issuer's internal control over financial reporting that occurred during the small business issuer's most recent fiscal quarter (the small business issuer's fourth fiscal quarter in the case of an annual report) that has materially affected, or is reasonably likely to materially affect, the small business issuer's internal control over financial reporting; and
5.The small business issuer's other certifying officer(s) and I have disclosed, based on our most recent evaluation of internal control over financial reporting, to the small business issuer's auditors and the audit committee of the small business issuer's board of directors (or persons performing the equivalent functions):
(a)All significant deficiencies and material weaknesses in the design or operation of internal control over financial reporting which are reasonably likely to adversely affect the small business issuer's ability to record, process, summarize and report financial information; and
(b) Any fraud, whether or not material, that involves management or other employees who have a significant role in the small business issuer's internal control over financial reporting.
Date: November 14, 2008/s/ Adam Radly
Chief Executive Officer
Exhibit 31.2
CERTIFICATION OF THE CHIEF FINANCIAL OFFICER REQUIRED BY RULE 13A - 14(A) OR RULE 15D - 14(A)
I, Bob Bates, certify that:
1. I have reviewed this quarterly report on Form 10-QSB of Edgetech Services Inc.
2. Based on my knowledge, this report does not contain any untrue statement of a material fact or omit to state a material fact necessary to make the statements made, in light of the circumstances under which such statements were made, not misleading with respect to the period covered by this report;
3. Based on my knowledge, the financial statements, and other financial information included in this report, fairly present in all material respects the financial condition, results of operations and cash flows of the small business issuer as of, and for, the periods presented in this report;
4. The small business issuer's other certifying officer(s) and I are responsible for establishing and maintaining disclosure controls and procedures (as defined in Exchange Act Rules 13a-15(e) and 15d-15(e)) for the small business issuer and have
(a) Designed such disclosure controls and procedures, or caused such disclosure controls and procedures to be designed under our supervision, to ensure that material information relating to the small business issuer, including its consolidated subsidiaries, is made known to us by others within those entities, particularly during the period in which this report is being prepared;
(b) Evaluated the effectiveness of the small business issuer's disclosure controls and procedures and presented in this report our conclusions about the effectiveness of the disclosure controls and procedures, as of the end of the period covered by this report based on such evaluation; and
(c) Disclosed in this report any change in the small business issuer's internal control over financial reporting that occurred during the small business issuer's most recent fiscal quarter (the small business issuer's fourth fiscal quarter in the case of an annual report) that has materially affected, or is reasonably likely to materially affect, the small business issuer's internal control over financial reporting; and
5.The small business issuer's other certifying officer(s) and I have disclosed, based on our most recent evaluation of internal control over financial reporting, to the small business issuer's auditors and the audit committee of the small business issuer's board of directors (or persons performing the equivalent functions):
(a)All significant deficiencies and material weaknesses in the design or operation of internal control over financial reporting which are reasonably likely to adversely affect the small business issuer's ability to record, process, summarize and report financial information; and
(b) Any fraud, whether or not material, that involves management or other employees who have a significant role in the small business issuer's internal control over financial reporting.
Date: November 14, 2008/s/ Bob Bates, CFO
Exhibit 32.1
CERTIFICATION OF THE CHIEF EXECUTIVE OFFICER REQUIRED BY RULE 13A - 14(B) OR RULE 15D - 14(B) AND 18 U.S.C. 1350
In connection with the Quarterly Report of Edgetech Services Inc.
On Form 10-QSB for the period ended July 31, 2005, as filed with the Securities and Exchange Commission on the date hereof (the "Report" ), I, Adam Radly, Chief Executive Officer of the Company, certify, pursuant to 18 U.S.C. Sec. 1350, that:
(1) The Report fully complies with the requirements of section 13(a) or 15(d) of the Securities Exchange Act of 1934; and
(2) The information contained in the Report fairly presents, in all material respects, the financial condition and results of operations of the Company.
By: /s/ Adam Radly
Adam Radly
Chief Executive Officer
November 14, 2008
Exhibit 32.2
CERTIFICATION OF THE CHIEF FINANCIAL OFFICER REQUIRED BY RULE 13A - 14(B) OR RULE 15D - 14(B) AND 18 U.S.C. 1350
In connection with the Quarterly Report of Edgetech Services Inc.
On Form 10-QSB for the period ended July 31, 2005, as filed with the Securities and Exchange Commission on the date hereof (the "Report" ), I, Bob Bates, certify, pursuant to 18 U.S.C. Sec. 1350, that:
(1) The Report fully complies with the requirements of section 13(a) or 15(d) of the Securities Exchange Act of 1934; and
(2) The information contained in the Report fairly presents, in all material respects, the financial condition and results of operations of the Company.
By: /s/ Bob Bates
Bob Bates, CFO
November 14, 2008
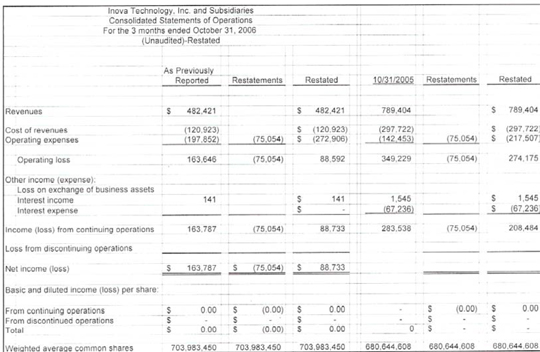
October 31, 2005 filing:
Restatements
There were management fees of $15,000 per month from August, 2005 through October, 2005 which were not paid but which are now being realized as an increase in expense and in paid in capital. This is a total of $45,000, which is a reduction of net income and increase to equity.
| Inova Technology, Inc. and Subsidiaries |
| Balance Sheets as of Oct 31, 2005 (Unaudited)-Restated |
| As Previously | Effect of | |||||||||||||||
| Reported | Restatement | Restated | 4/30/2005 | |||||||||||||
| ASSETS | ||||||||||||||||
| Current assets | ||||||||||||||||
| Cash | 459,859 | 459,859 | 15,367 | |||||||||||||
| Accounts receivables | 595,291 | 595,291 | 405,886 | |||||||||||||
| Inventory | 2,949 | 3,775 | ||||||||||||||
| Prepaid and other current assets | 0 | 7,796 | ||||||||||||||
| Total current assets | 1,058,099 | 1,055,150 | 432,824 | |||||||||||||
| Fixed assets | 13,514 | 13,514 | 15,135 | |||||||||||||
| Goodwill | 2,612,304 | 2,612,304 | ||||||||||||||
| Intangibles | 310,552 | 310,552 | ||||||||||||||
| Loan to Related Party | 73,259 | |||||||||||||||
| Other assets | 517 | |||||||||||||||
| Total assets | 1,144,872 | 3,991,520 | 448,476 | |||||||||||||
| LIABILITIES AND STOCKHOLDERS' DEFICIT | ||||||||||||||||
| Current liabilities | ||||||||||||||||
| Accounts payable | 356,824 | 356,824 | 542,701 | |||||||||||||
| Accrued liabilities | 50,051 | 50,051 | ||||||||||||||
| Current maturities of long-term debt - related parties | 166,320 | 166,320 | 49,614 | |||||||||||||
| Deferred income | 160,076 | 160,076 | ||||||||||||||
| Short term debt | 0 | 305,398 | ||||||||||||||
| Other current liabilities | 0 | |||||||||||||||
| Total current liabilities | 733,271 | 733,271 | 897,713 | |||||||||||||
| Long term debt - net of current maturities | 0 | |||||||||||||||
| Long term debt - related parties, net of current maturities | 184,323 | 184,323 | 58,800 | |||||||||||||
| Other Loans | 104,767 | 104,767 | ||||||||||||||
| Total liabilities | 1,022,361 | 1,022,361 | 956,513 | |||||||||||||
| Stockholders' deficit | ||||||||||||||||
| Convertible preferred stock, $0.001 par value; 25,000,000 shares authorized; 25,000,00 issued and outstanding | 25,000 | 25,000 | ||||||||||||||
Common stock, $0.001 par value;150,000,000 shares authorized; 70,288,450 shares shares issued and outstanding | 70,426 | 0 70,426 | 69,994 | |||||||||||||
| 137,500 common shares treasury stock | (4,715 | ) | (4,715 | ) | ||||||||||||
| Accumulated other comprehensive income | 0 | (629 | ) | |||||||||||||
| Additional paid-in capital | 2,691,689 | 2,971,737 | 5,663,426 | 2,776,659 | ||||||||||||
| Retained deficit | (2,659,889 | ) | (125,089 | ) | (2,784,978 | ) | (3,354,061 | ) | ||||||||
| Total stockholders' deficit | 122,511 | 2,969,159 | (508,037 | ) | ||||||||||||
| Total liabilities and stockholders' deficit | 1,144,872 | 3,991,520 | 448,476 | |||||||||||||
Inova Technology, Inc. and Subsidiaries
Consolidated Statements of Operations
For the 3 months ended Oct 31 2005
(Unaudited)-Restated
| Three Month period ended | Three Month period ended | |||||||||||||||
| 10/31/2005 | Restatements | Restated | 10/31/2004 | |||||||||||||
| Revenues | 841,876 | 841,876 | 458,268 | |||||||||||||
| Refunds | (52,472 | ) | (39,324 | ) | ||||||||||||
| Cost of revenues | (297,722 | ) | (297,722 | ) | (20,000 | ) | ||||||||||
| Operating expenses | (142,453 | ) | (75,054 | ) | (217,507 | ) | (11,071 | ) | ||||||||
| Operating profit/ loss | 349,229 | (75,054 | ) | 274,175 | 383,955 | |||||||||||
| Other income (expense): | ||||||||||||||||
| Loss on exchange of business assets | ||||||||||||||||
| Interest income | 1,545 | 1,545 | ||||||||||||||
| Interest expense | (19,320 | ) | (19,320 | ) | ||||||||||||
| Other Adjustment | (47,916 | ) | (47,916 | ) | ||||||||||||
| Income (loss) from continuing operations | 283,538 | (75,054 | ) | 208,484 | 383,955 | |||||||||||
| Loss from discontinuing operations | ||||||||||||||||
| Net income (loss) | ||||||||||||||||
| Basic income (loss) per share: | 70,425,950 | 70,425,950 | ||||||||||||||
| Diluted income (loss) per share: | 704,258,450 | 704,258,450 | ||||||||||||||
| From continuing operations | 0 | |||||||||||||||
| From discontinued operations | 0 | |||||||||||||||
| Total | 0 | |||||||||||||||
| Weighted average common shares | 0 | |||||||||||||||
Inova Technology, Inc. and Subsidiaries
Consolidated Statements of Operations
For the 6 months ended Oct 31 2005
(Unaudited)-Restated
| Six Month period ended | 6 Month period ended | |||||||||||||||
| 10/31/2005 | Restatements | Restated | 10/31/2004 | |||||||||||||
| Revenues | 1,631,586 | 1,631,586 | 916,536 | |||||||||||||
| Refunds | (52,472 | ) | (52,472 | ) | (78,648 | ) | ||||||||||
| Cost of revenues | (494,910 | ) | (125,089 | ) | (619,999 | ) | (40,000 | ) | ||||||||
| Operating expenses | (424,344 | ) | (424,344 | ) | (22,142 | ) | ||||||||||
| Operating profit/ loss | 659,860 | (125,089 | ) | 534,771 | 775,746 | |||||||||||
| Other income (expense): | ||||||||||||||||
| Loss on exchange of business assets | ||||||||||||||||
| Interest income | ||||||||||||||||
| Interest expense | ||||||||||||||||
| Income (loss) from continuing operations | 659,860 | (125,089 | ) | 534,771 | 775,746 | |||||||||||
| Loss from discontinuing operations | ||||||||||||||||
| Net income (loss) | ||||||||||||||||
| Basic income (loss) per share: | 70,425,950 | 70,425,950 | ||||||||||||||
| Diluted income (loss) per share: | 704,258,450 | 704,258,450 | ||||||||||||||
| From continuing operations | 0 | |||||||||||||||
| From discontinued operations | 0 | |||||||||||||||
| Total | 0 | |||||||||||||||
| Weighted average common shares | 0 | |||||||||||||||
Consolidated Statements of Cash Flows
For the 6 months ended October 31 2005
(Unaudited)-Restated
| Six Month period ended | Six Month period ended | |||||||||||||||
| 10/31/2005 | Restatements | Restated | 10/31/2004 | |||||||||||||
| CASH FLOWS OPERATING ACTIVITIES | ||||||||||||||||
| Net income/loss | 659,860 | (125,089 | ) | 534,771 | 775,746 | |||||||||||
| Add: income (loss) from discontinued operations | ||||||||||||||||
| Loss from continuing operations | ||||||||||||||||
| Additional shares issued for conversion of debt | - | |||||||||||||||
| Depreciation and amortization expense | - | |||||||||||||||
| Changes in operating assets and liabilities: | ||||||||||||||||
| Increase (decrease) in A/P and accrued expenses | (249,580 | ) | (249,580 | ) | ||||||||||||
| Decrease (increase) in accounts receivable | (311,853 | ) | (311,853 | ) | (60,098 | ) | ||||||||||
| Increase (decrease) in deferred income | 47,790 | 47,790 | (290,324 | ) | ||||||||||||
| Increase (decrease) in tax liabilities | 47,121 | 47,121 | ||||||||||||||
| Increase (decrease) in line of credit | (85,542 | ) | (85,542 | ) | ||||||||||||
| Decrease (increase) in current assets | 10,000 | 10,000 | ||||||||||||||
| Increase (decrease) in Other Liabilities | 11,887 | 11,887 | ||||||||||||||
| Other changes from Operating Activities | 14,522 | 14,522 | ||||||||||||||
| Net cash provided by (used in) operating activities | 156,902 | (125,089 | ) | 31,813 | 425,324 | |||||||||||
| CASH FLOW INVESTING ACTIVITIES | ||||||||||||||||
| Increase (decrease) in loans receivable | ||||||||||||||||
| Purchase of Desert | - | |||||||||||||||
| Purchase of treasury stock | ||||||||||||||||
| Purchase of Right-Tag | - | |||||||||||||||
| Purchase of fixed assets | 7,920 | 7,920 | ||||||||||||||
| Net cash provided by (used in) investing activities | 7,920 | 7,920 | - | |||||||||||||
| CASH FLOW FINANCING ACTIVITIES | ||||||||||||||||
| Proceeds from notes payable - related parties | (501,087 | ) | (501,087 | ) | ||||||||||||
| Change in Notes to Investors | (23,105 | ) | ||||||||||||||
| Proceeds from APIC | 125,089 | 125,089 | ||||||||||||||
| Translation adjustment | ||||||||||||||||
| Borrowings RE Distributions | ||||||||||||||||
| Net cash provided by (used in) financing activities | (524,192 | ) | (524,192 | ) | ||||||||||||
| NET CASH PROVIDED BY (USED IN) CONTINUING OPERATIONS | (359,370 | ) | (359,370 | ) | 425,324 | |||||||||||
| NET CASH PROVIDED BY DISCONTINUED OPERATIONS | ||||||||||||||||
| NET CHANGE IN CASH | (359,370 | ) | (359,370 | ) | 425,324 | |||||||||||
| CASH AT BEGINNING OF PERIOD | (819,228 | ) | (819,228 | ) | 1,797,160 | |||||||||||
| CASH AT END OF PERIOD | 459,858 | 459,858 | 2,222,484 | |||||||||||||
January 31, 2006 filing:
Restatements
There were management fees of $15,000 per month from November, 2005 through January, 2006 which were not paid but which are now being realized as an increase in expense and in paid in capital. This is a total of $45,000, which is a reduction of net income and increase to equity.
Inova Technology, Inc. and Subsidiaries
Balance Sheets as of Jan 31, 2006 (Unaudited)-Restated
| As Previously | Effect of | |||||||||||||||
| Reported | Restatement | Restated | 4/30/2005 | |||||||||||||
| ASSETS | ||||||||||||||||
| Current assets | ||||||||||||||||
| Cash | 518,798 | 518,798 | 15,367 | |||||||||||||
| Accounts receivables | 480,888 | 480,888 | 405,886 | |||||||||||||
| Intangibles | 280,499 | 280,499 | ||||||||||||||
| Inventory | 3,510 | 3,775 | ||||||||||||||
| Prepaid and other current assets | 0 | 7,796 | ||||||||||||||
| Total current assets | 1,003,196 | 1,280,185 | 432,824 | |||||||||||||
| Fixed assets | 17,311 | 17,311 | 15,135 | |||||||||||||
| Goodwill | 2,612,304 | 2,612,304 | ||||||||||||||
| Encumbered Cash (Lock Box) | 385,208 | |||||||||||||||
| Loan to Related Party | 73,259 | |||||||||||||||
| Other assets | 517 | |||||||||||||||
| Total assets | 1,478,974 | 3,909,800 | 448,476 | |||||||||||||
| LIABILITIES AND STOCKHOLDERS' DEFICIT | ||||||||||||||||
| Current liabilities | ||||||||||||||||
| Accounts payable | 434,033 | 434,033 | 542,701 | |||||||||||||
| Accrued liabilities | 263,142 | 263,142 | ||||||||||||||
| Current maturities of long-term debt - related parties | 0 | 49,614 | ||||||||||||||
| Short term debt | 0 | 305,398 | ||||||||||||||
| Total current liabilities | 697,175 | 697,175 | 897,713 | |||||||||||||
| Long term debt - related parties, net of current maturities | 382,323 | 382,323 | 58,800 | |||||||||||||
| Other Loans | 92,186 | 92,186 | ||||||||||||||
| Total liabilities | �� | 1,171,684 | 1,171,684 | 956,513 | ||||||||||||
| Stockholders' deficit | ||||||||||||||||
| Convertible preferred stock, $0.001 par value; 25,000,000 shares authorized; 25,000,00 issued and outstanding | 25,000 | 25,000 | ||||||||||||||
| Common stock, $0.001 par value;150,000,000 shares authorized; 70,288,450 shares shares issued and outstanding | 70,426 | 0 | 69,994 | |||||||||||||
| 137500 common shares treasury stock | (4,715 | ) | (4,715 | ) | ||||||||||||
| Accumulated other comprehensive income | 0 | (629 | ) | |||||||||||||
| Additional paid-in capital | 2,691,689 | 2,701,495 | 5,393,184 | 2,776,659 | ||||||||||||
| Retained deficit | (2,475,210 | ) | (200,143 | ) | (2,675,353 | ) | (3,354,061 | ) | ||||||||
| Total stockholders' deficit | 307,190 | 2,738,116 | (508,037 | ) | ||||||||||||
| Total liabilities and stockholders' deficit | 1,478,874 | 3,909,800 | 448,476 | |||||||||||||
Inova Technology, Inc. and Subsidiaries
Consolidated Statements of Operations
For the 3 months ended Jan 31 2006
(Unaudited)-Restated
| Three Month period ended | Three Month period ended | |||||||||||||||
| 1/31/2006 | Restatements | Restated | 1/31/2005 | |||||||||||||
| Revenues | 660,664 | 660,664 | 730,806 | |||||||||||||
| Refunds | (55,681 | ) | ||||||||||||||
| Cost of revenues | (238,543 | ) | (238,543 | ) | (312,116 | ) | ||||||||||
| Operating expenses | (182,408 | ) | (75,054 | ) | (257,462 | ) | (563,408 | ) | ||||||||
| Operating profit/ loss | 184,032 | (75,054 | ) | 108,978 | (144,718 | ) | ||||||||||
| Other income (expense): | ||||||||||||||||
| Loss on exchange of business assets | ||||||||||||||||
| Interest income | 1,270 | |||||||||||||||
| Interest expense | (622 | ) | (6,112 | ) | ||||||||||||
| Income (loss) from continuing operations | 184,680 | (75,054 | ) | 109,626 | (150,830 | ) | ||||||||||
| Loss from discontinuing operations | ||||||||||||||||
| Net income (loss) | ||||||||||||||||
| Basic income (loss) per share: | 70,288,450 | 41,802,894 | ||||||||||||||
| Diluted income (loss) per share: | 704,259,950 | 41,802,894 | ||||||||||||||
| From continuing operations | - | |||||||||||||||
| From discontinued operations | - | |||||||||||||||
| Total | - | |||||||||||||||
| Weighted average common shares | - | |||||||||||||||
Inova Technology, Inc. and Subsidiaries
Consolidated Statements of Operations
For the 9 months ended Jan 31 2006
(Unaudited)-Restated
| Nine Month period ended | Nine Month period ended | |||||||||||||||
| 1/31/2006 | Restatements | Restated | 1/31/2005 | |||||||||||||
| Revenues | 2,292,250 | 2,292,250 | 1,575,261 | |||||||||||||
| Refunds | (108,153 | ) | ||||||||||||||
| Cost of revenues | (733,453 | ) | (733,453 | ) | (419,320 | ) | ||||||||||
| Operating expenses | (626,104 | ) | (200,143 | ) | (826,247 | ) | (1,903,574 | ) | ||||||||
| Operating profit/ loss | 824,540 | (200,143 | ) | 624,397 | (747,633 | ) | ||||||||||
| Other income (expense): | ||||||||||||||||
| Loss on exchange of business assets | ||||||||||||||||
| Interest income | ||||||||||||||||
| Interest expense | ||||||||||||||||
| Income (loss) from continuing operations | 824,540 | (200,143 | ) | 624,397 | (747,633 | ) | ||||||||||
| Loss from discontinuing operations | ||||||||||||||||
| Net income (loss) | ||||||||||||||||
| Basic income (loss) per share: | 70,288,450 | 40,718,948 | ||||||||||||||
| Diluted income (loss) per share: | 704,259,950 | 40,718,948 | ||||||||||||||
| From continuing operations | 0 | |||||||||||||||
| From discontinued operations | 0 | |||||||||||||||
| Total | 0 | |||||||||||||||
| Weighted average common shares | 0 | |||||||||||||||
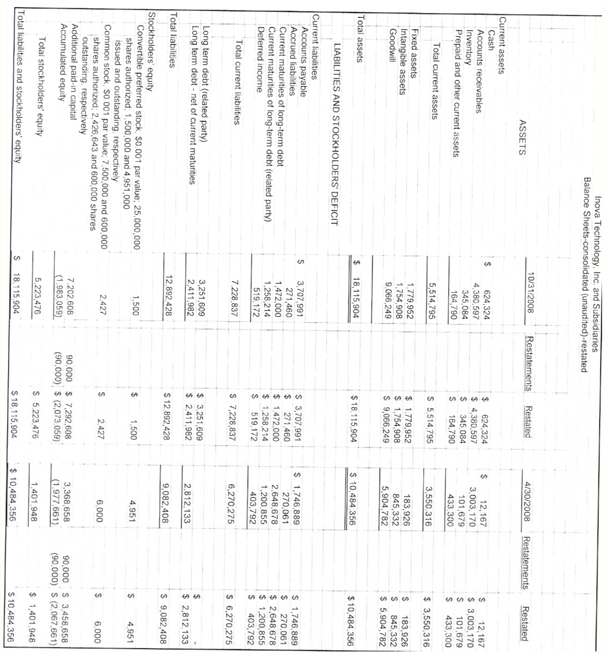
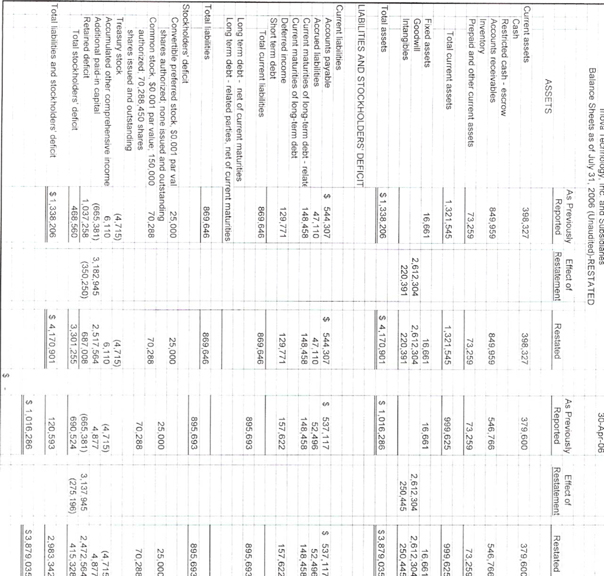
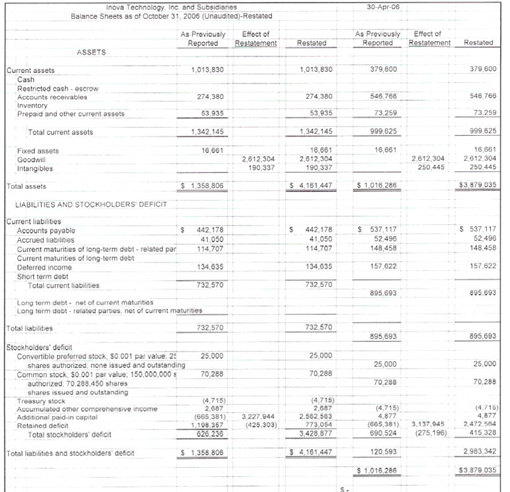
April 30, 2006 filing:
Restatements
There were management fees of $15,000 per month from February, 2006 through April, 2006 which were not paid but which are now being realized as an increase in expense and in paid in capital. This is a total of $45,000, which is a reduction of net income and increase to equity.
Inova Technology, Inc. and Subsidiaries
Balance Sheets as of April 30, 2006
(Unaudited)-Restated
| As Previously | Effect of | |||||||||||||||
| Reported | Restatement | Restated | 4/30/2005 | |||||||||||||
| ASSETS | ||||||||||||||||
| Current assets | ||||||||||||||||
| Cash | 379,600 | 379,600 | 15,367 | |||||||||||||
| Accounts receivables | 546,766 | 546,766 | 405,886 | |||||||||||||
| Inventory | 3,775 | |||||||||||||||
| Prepaid and other current assets | 73,259 | 73,259 | 8,313 | |||||||||||||
| Total current assets | 999,625 | 999,625 | 433,341 | |||||||||||||
| Fixed assets | 16,661 | 16,661 | 15,135 | |||||||||||||
| Goodwill | 2,612,304 | 2,612,304 | ||||||||||||||
| Intangibles | 250,445 | 250,445 | ||||||||||||||
| Total assets | $ | 1,016,286 | $ | 3,879,035 | $ | 448,476 | ||||||||||
| LIABILITIES AND STOCKHOLDERS' DEFICIT | ||||||||||||||||
| Current liabilities | ||||||||||||||||
| Accounts payable | $ | 537,117 | $ | 537,117 | 542,701 | |||||||||||
| Accrued liabilities | 52,496 | 52,496 | ||||||||||||||
| Current maturities of long-term debt - related parties | 148,458 | 148,458 | 49,614 | |||||||||||||
| Deferred income | 157,622 | 157,622 | ||||||||||||||
| Short term debt | 305,398 | |||||||||||||||
| Total current liabilities | 895,693 | 895,693 | 897,713 | |||||||||||||
| Long term debt - net of current maturities | ||||||||||||||||
| Long term debt - related parties, net of current maturities | 58,800 | |||||||||||||||
| Total liabilities | 895,693 | 895,693 | 956,513 | |||||||||||||
| Stockholders' deficit | ||||||||||||||||
| Convertible preferred stock, $0.001 par value; 25,000,000 shares authorized; none issued and outstanding | 25,000 | 25,000 | ||||||||||||||
| Common stock, $0.001 par value; 150,000,000 shares authorized; 70,288,450 shares shares issued and outstanding | 70,288 | 70,288 | 69,994 | |||||||||||||
| Treasury stock | (4,715 | ) | (4,715 | ) | ||||||||||||
| Accumulated other comprehensive income | 4,877 | 4,877 | (629 | ) | ||||||||||||
| Additional paid-in capital | (665,381 | ) | 3,137,945 | 2,472,564 | 2,776,659 | |||||||||||
| Retained deficit | 690,524 | (275,196 | ) | 415,328 | (3,354,061 | ) | ||||||||||
| Total stockholders' deficit | 120,593 | 2,983,342 | (508,037 | ) | ||||||||||||
| Total liabilities and stockholders' deficit | $ | 1,016,286 | $ | 3,879,035 | $ | 448,476 | ||||||||||
Inova Technology, Inc. and Subsidiaries
Consolidated Statements of Operations
For the year ended April 30, 2006
(Unaudited)-Restated
| As Previously | ||||||||||||
| Reported | Restatements | Restated | ||||||||||
| Revenues | $ | 2,652,942 | $ | 2,652,942 | ||||||||
| Cost of revenues | (954,397 | ) | (954,397 | ) | ||||||||
| Operating expenses | (995,976 | ) | (275,196 | ) | (1,271,172 | ) | ||||||
| Operating loss | 702,569 | (275,196 | ) | 427,373 | ||||||||
| Other income (expense): | ||||||||||||
| Loss on exchange of business assets | ||||||||||||
| Interest income | 21,522 | 21,522 | ||||||||||
| Interest expense | (26,282 | ) | (26,282 | ) | ||||||||
| Income (loss) from continuing operations | 697,809 | (275,196 | ) | 422,613 | ||||||||
| Loss from discontinuing operations | ||||||||||||
| Net income (loss) | $ | 697,809 | $ | (275,196 | ) | $ | 422,613 | |||||
| Basic and diluted income (loss) per share: | ||||||||||||
| From continuing operations | $ | 0.00 | $ | (0.00 | ) | $ | 0.00 | |||||
| From discontinued operations | $ | - | $ | - | $ | - | ||||||
| Total | $ | 0.00 | $ | (0.00 | ) | $ | 0.00 | |||||
| Weighted average common shares | 698,142,579 | 698,142,579 | 698,142,579 | |||||||||
Consolidated Statements of Cash Flows
For the year ended April 30, 2006
(Unaudited)
| As Previously | ||||||||
| Reported | Restated | |||||||
| CASH FLOWS OPERATING ACTIVITIES | ||||||||
| Net loss | 697,809 | $ | 422,613 | |||||
| Add: income (loss) from discontinued operations | ||||||||
| Loss from continuing operations | 697,809 | 422,613 | ||||||
| Additional shares issued for conversion of debt | ||||||||
| Depreciation and amortization expense | 110,197 | |||||||
| Changes in operating assets and liabilities: | ||||||||
| Increase (decrease) in A/P and accrued expenses | 29,518 | 29,518 | ||||||
| Decrease (increase) in accounts receivable | (366,114 | ) | (366,114 | ) | ||||
| Increase (decrease) in deferred income | 45,336 | 45,336 | ||||||
| Increase (decrease) in accrued expense | 58,616 | 58,616 | ||||||
| Increase (decrease) in inventory | ||||||||
| Decrease (increase) in prepaid expense and other current assets | ||||||||
| Net cash provided by (used in) operating activities - continuing operations | 465,165 | 300,166 | ||||||
| CASH FLOW INVESTING ACTIVITIES | ||||||||
| Increase (decrease) in loans receivable | (73,259 | ) | (73,259 | ) | ||||
| Purchase of treasury stock | (4,715 | ) | (4,715 | ) | ||||
| Purchase of Right-Tag | ||||||||
| Purchase of fixed assets | (10,477 | ) | (10,477 | ) | ||||
| Net cash provided by (used in) investing activities - continuing operations | (88,451 | ) | (88,451 | ) | ||||
| CASH FLOW FINANCING ACTIVITIES | ||||||||
| Proceeds from notes payable - related parties | (534,535 | ) | (534,535 | ) | ||||
| Proceeds from APIC | 165,000 | |||||||
| Translation adjustment | (4,876 | ) | (4,877 | ) | ||||
| Net cash provided by (used in) financing activities - continuing operations | (539,411 | ) | (374,412 | ) | ||||
| NET CASH PROVIDED BY (USED IN) CONTINUING OPERATIONS | (162,697 | ) | (162,697 | ) | ||||
| NET CASH PROVIDED BY DISCONTINUED OPERATIONS | ||||||||
| NET CHANGE IN CASH | (162,697 | ) | (162,697 | ) | ||||
| CASH AT BEGINNING OF PERIOD | 542,297 | 542,297 | ||||||
| CASH AT END OF PERIOD | $ | 379,600 | $ | 379,600 | ||||
July 31, 2006 filing:
Restatements
There were management fees of $15,000 per month from May, 2006 through July, 2006 which were not paid but which are now being realized as an increase in expense and in paid in capital. This is a total of $45,000, which is a reduction of net income and increase to equity.
Inova Technology, Inc. and Subsidiaries
Consolidated Statements of Operations
For the 3 months ended July 31, 2006
(Unaudited)- RESTATED
| As Previously | ||||||||||||||||||||||||
| Reported | Restatements | Restated | 31-Jul-05 | Restatements | Restated | |||||||||||||||||||
| Revenues | $ | 599,960 | $ | 599,960 | 674,275 | $ | 674,275 | |||||||||||||||||
| Cost of revenues | (83,875 | ) | $ | (83,875 | ) | (3,150 | ) | $ | (3,150 | ) | ||||||||||||||
| Operating expenses | (169,427 | ) | (75,054 | ) | $ | (244,481 | ) | (225,455 | ) | (50,036 | ) | $ | (275,491 | ) | ||||||||||
| Operating loss | 346,658 | (75,054 | ) | 271,604 | 445,670 | (50,036 | ) | 395,634 | ||||||||||||||||
| Other income (expense): | ||||||||||||||||||||||||
| Loss on exchange of business assets | ||||||||||||||||||||||||
| Interest income | 76 | $ | 76 | 4,113 | $ | 4,113 | ||||||||||||||||||
| Interest expense | $ | - | $ | - | ||||||||||||||||||||
| Income (loss) from continuing operations | 346,734 | (75,054 | ) | 271,680 | 449,783 | (50,036 | ) | 399,747 | ||||||||||||||||
| Loss from discontinuing operations | ||||||||||||||||||||||||
| Net income (loss) | $ | 346,734 | $ | (75,054 | ) | $ | 271,680 | 449,783 | $ | (50,036 | ) | $ | 399,747 | |||||||||||
| Basic and diluted income (loss) per share: | ||||||||||||||||||||||||
| From continuing operations | $ | 0.00 | $ | - | $ | 0.00 | - | $ | - | $ | - | |||||||||||||
| From discontinued operations | $ | - | $ | - | $ | - | - | $ | - | $ | - | |||||||||||||
| Total | $ | 0.00 | $ | - | $ | 0.00 | 0 | $ | - | $ | - | |||||||||||||
| Weighted average common shares | 703,983,450 | 703,983,450 | 680,644,608 | 680,644,608 | ||||||||||||||||||||
Consolidated Statements of Cash Flows
For the 3 months ended July 31, 2006
(Unaudited)
| As Previously | Restated | |||||||||||
| Reported | Restated | 7/05 | ||||||||||
| CASH FLOWS OPERATING ACTIVITIES | ||||||||||||
| Net loss | 346,734 | $ | 271,680 | 399,747 | ||||||||
| Add: income (loss) from discontinued operations | ||||||||||||
| Loss from continuing operations | 346,734 | 271,680 | ||||||||||
| Additional shares issued for conversion of debt | ||||||||||||
| Depreciation and amortization expense | 389 | |||||||||||
| Changes in operating assets and liabilities: | ||||||||||||
| Increase (decrease) in A/P and accrued expenses | - | |||||||||||
| Decrease (increase) in accounts receivable | (303,193 | ) | (303,193 | ) | (498,955 | ) | ||||||
| Increase (decrease) in deferred income | (27,851 | ) | (27,851 | ) | (5,631 | ) | ||||||
| Increase (decrease) in accrued expense | 1,804 | 1,804 | 984,943 | |||||||||
| Increase (decrease) in inventory | - | |||||||||||
| Decrease (increase) in other current assets | - | (7,621 | ) | |||||||||
| Net cash provided by (used in) operating activities | 17,494 | (57,560 | ) | |||||||||
| CASH FLOW INVESTING ACTIVITIES | ||||||||||||
| Increase (decrease) in loans receivable | - | |||||||||||
| Purchase of treasury stock | - | |||||||||||
| Purchase of Right-Tag | - | |||||||||||
| Purchase of fixed assets | - | (24,801 | ) | |||||||||
| Net cash provided by (used in) investing activities - continuing operations | - | - | ||||||||||
| CASH FLOW FINANCING ACTIVITIES | ||||||||||||
| Proceeds from notes payable - related parties | - | |||||||||||
| Proceeds from APIC | 75,054 | 50,036 | ||||||||||
| Translation adjustment | 1,233 | 1,233 | ||||||||||
| Net cash provided by (used in) financing activities - continuing operations | 1,233 | 76,287 | (1,256,822 | ) | ||||||||
| NET CASH PROVIDED BY (USED IN) CONTINUING OPERATIONS | 18,727 | 18,727 | ||||||||||
| NET CASH PROVIDED BY DISCONTINUED OPERATIONS | ||||||||||||
| NET CHANGE IN CASH | 18,727 | 18,727 | (358,715 | ) | ||||||||
| CASH AT BEGINNING OF PERIOD | 379,600 | 379,600 | 819,229 | |||||||||
| CASH AT END OF PERIOD | $ | 398,327 | $ | 398,327 | 460,514 | |||||||
10/31/06 Financials:
Restatements
There were management fees of $15,000 per month from August, 2006 through October, 2006 which were not paid but which are now being realized as an increase in expense and in paid in capital. This is a total of $45,000, which is a reduction of net income and increase to equity.

Consolidated Statements of Cash Flows
For the 6 months ended October 31, 2006
(Unaudited)-Restated
| As Previously | ||||||||||||||||
| Reported | Restated | 10/31/2005 | Restated | |||||||||||||
| CASH FLOWS OPERATING ACTIVITIES | ||||||||||||||||
| Net loss | 510,520 | $ | 360,413 | 733,321 | $ | 614,532 | ||||||||||
| Add: income (loss) from discontinued operations | ||||||||||||||||
| Loss from continuing operations | 510,520 | 360,413 | 614,532 | |||||||||||||
| Additional shares issued for conversion of debt | ||||||||||||||||
| Depreciation and amortization expense | 826 | |||||||||||||||
| Changes in operating assets and liabilities: | ||||||||||||||||
| Increase (decrease) in A/P and accrued expenses | - | (204,386 | ) | (204,386 | ) | |||||||||||
| Decrease (increase) in accounts receivable | 272,386 | 272,386 | (189,405 | ) | (189,405 | ) | ||||||||||
| Increase (decrease) in deferred income | (22,987 | ) | (22,987 | ) | 160,076 | 160,076 | ||||||||||
| Increase (decrease) in accrued expense | (132,499 | ) | (132,499 | ) | - | |||||||||||
| Increase (decrease) in inventory | - | - | ||||||||||||||
| Decrease (increase) in prepaid expense and other current assets | 9,000 | 9,000 | 8,313 | 8,313 | ||||||||||||
| Net cash provided by (used in) operating activities - continuing operations | 636,420 | 486,313 | 389,130 | |||||||||||||
| CASH FLOW INVESTING ACTIVITIES | ||||||||||||||||
| Increase (decrease) in loans receivable | - | - | ||||||||||||||
| Purchase of treasury stock | - | - | ||||||||||||||
| Purchase of Right-Tag | - | - | ||||||||||||||
| Purchase of fixed assets | - | - | ||||||||||||||
| Net cash provided by (used in) investing activities - continuing operations | - | - | - | |||||||||||||
| CASH FLOW FINANCING ACTIVITIES | ||||||||||||||||
| Proceeds from notes payable - related parties | - | (64,253 | ) | (64,253 | ) | |||||||||||
| Proceeds from APIC | 150,107 | 119,615 | ||||||||||||||
| Translation adjustment | (2,190 | ) | (2,190 | ) | - | |||||||||||
| Net cash provided by (used in) financing activities - continuing operations | (2,190 | ) | 147,917 | 55,362 | ||||||||||||
| NET CASH PROVIDED BY (USED IN) CONTINUING OPERATIONS | 634,230 | 634,230 | 444,492 | 444,492 | ||||||||||||
| NET CASH PROVIDED BY DISCONTINUED OPERATIONS | ||||||||||||||||
| NET CHANGE IN CASH | 634,230 | 634,230 | 444,492 | |||||||||||||
| CASH AT BEGINNING OF PERIOD | 379,600 | 379,600 | 15,367 | 15,367 | ||||||||||||
| CASH AT END OF PERIOD | $ | 1,013,830 | $ | 1,013,830 | 459,859 | $ | 459,859 | |||||||||
| $ | - | $ | - | |||||||||||||
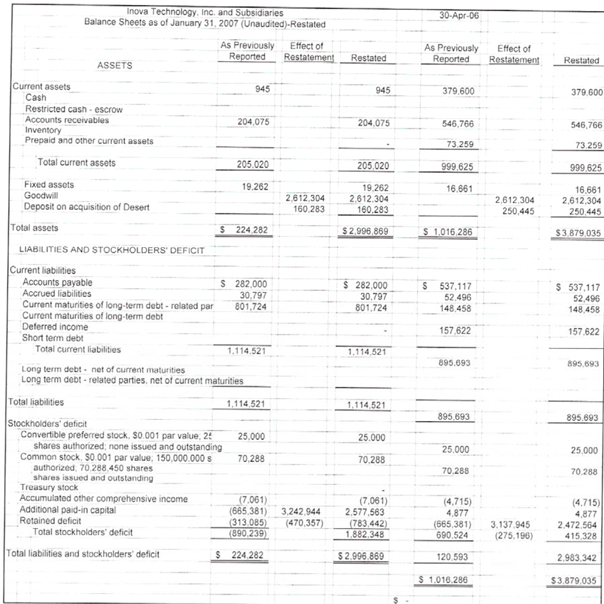
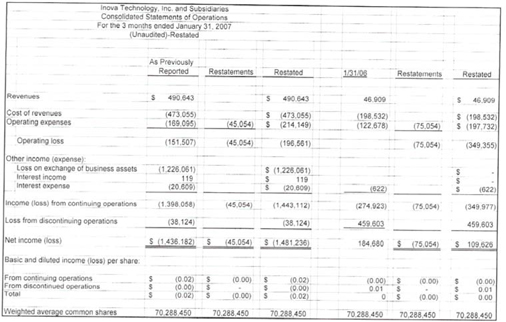
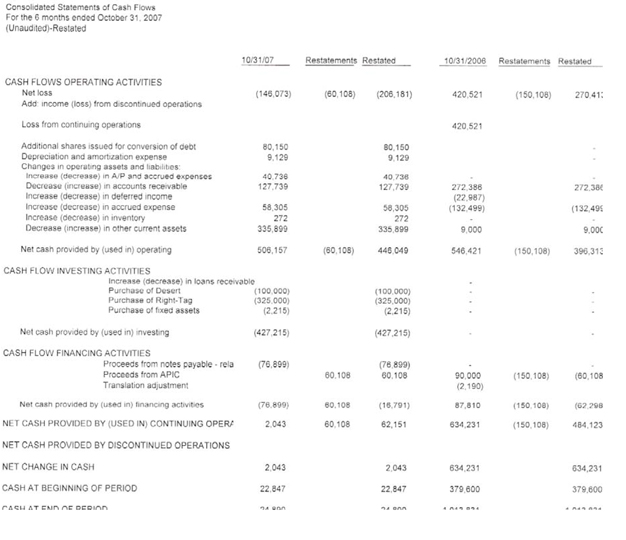
Financials for January 31, 2007:
Restatements
There were management fees of $15,000 per month from prior years which were not paid but which are now being realized as an increase in paid in capital and reduction of retained earnings for a total of $270,000

Consolidated Statements of Cash Flows
For the 9 months ended January 31, 2007
(Unaudited)-Restated
| As Previously | ||||||||||||||||
| Reported | Restated | 1/31/06 | Restated | |||||||||||||
| CASH FLOWS OPERATING ACTIVITIES | ||||||||||||||||
| Net loss | (1,003,609 | ) | $ | (1,198,772 | ) | 824,540 | $ | 624,397 | ||||||||
| Add: income (loss) from discontinued operations | (84,888 | ) | (84,888 | ) | 1,300,728 | 1,300,728 | ||||||||||
| Loss from continuing operations | (1,088,497 | ) | (1,283,660 | ) | 2,125,268 | 1,925,125 | ||||||||||
| Additional shares issued for conversion of debt | ||||||||||||||||
| Depreciation and amortization expense | ||||||||||||||||
| Changes in operating assets and liabilities: | ||||||||||||||||
| Increase (decrease) in A/P and accrued expenses | (212,201 | ) | (212,201 | ) | (25,607 | ) | (25,607 | ) | ||||||||
| Decrease (increase) in accounts receivable | 343,145 | 343,145 | - | |||||||||||||
| Increase (decrease) in deferred income | (157,622 | ) | (157,622 | ) | - | |||||||||||
| Increase (decrease) in accrued expense | - | - | ||||||||||||||
| Increase (decrease) in inventory | - | - | ||||||||||||||
| Decrease (increase) in prepaid expense and other current assets | - | - | ||||||||||||||
| Net cash provided by (used in) operating activities - continuing operations | (1,115,175 | ) | (1,310,338 | ) | 2,099,661 | 1,899,518 | ||||||||||
| CASH FLOW INVESTING ACTIVITIES | ||||||||||||||||
| Increase (decrease) in loans receivable | 73,259 | 73,259 | - | |||||||||||||
| Purchase of treasury stock | - | - | ||||||||||||||
| Purchase of Right-Tag | - | - | ||||||||||||||
| Purchase of fixed assets | (3,055 | ) | (3,055 | ) | - | |||||||||||
| Net cash provided by (used in) investing activities - continuing operations | 70,204 | 70,204 | - | |||||||||||||
| CASH FLOW FINANCING ACTIVITIES | ||||||||||||||||
| Proceeds from notes payable - related parties | 678,254 | 678,254 | 65,186 | 65,186 | ||||||||||||
| Proceeds from APIC | 195,163 | (500,515 | ) | (300,372 | ) | |||||||||||
| Translation adjustment | (11,938 | ) | (11,938 | ) | 629 | 629 | ||||||||||
| Net cash provided by (used in) financing activities - continuing operations | 666,316 | 861,479 | (234,557 | ) | ||||||||||||
| NET CASH PROVIDED BY (USED IN) CONTINUING OPERATIONS | (378,655 | ) | (378,655 | ) | 1,664,961 | 1,664,961 | ||||||||||
| NET CASH PROVIDED BY DISCONTINUED OPERATIONS | (1,300,728 | ) | (1,300,728 | ) | ||||||||||||
| NET CHANGE IN CASH | (378,655 | ) | (378,655 | ) | 364,233 | 364,233 | ||||||||||
| CASH AT BEGINNING OF PERIOD | 379,600 | 379,600 | 15,367 | 15,367 | ||||||||||||
| CASH AT END OF PERIOD | $ | 945 | $ | 945 | 379,600 | $ | 379,600 | |||||||||
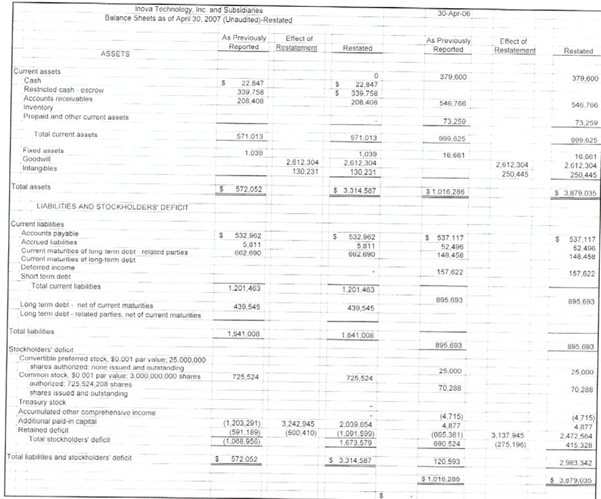
April 30, 2007
Inova Technology, Inc. and Subsidiaries
Consolidated Statements of Operations
For the Year ended April 30, 2007
(Unaudited)
| As Previously | Restated | |||||||||||||||
| Reported | Adjustments | Restated | 4/30/06 | |||||||||||||
| Revenues | $ | 1,615,187 | $ | 1,615,187 | 1,391,923 | |||||||||||
| Cost of revenues | (578,336 | ) | (120,214 | ) | $ | (698,550 | ) | (823,487 | ) | |||||||
| Operating expenses | (1,136,141 | ) | (105,000 | ) | $ | (1,241,141 | ) | (1,178,561 | ) | |||||||
| Operating loss | (99,290 | ) | (225,214 | ) | (324,504 | ) | (610,125 | ) | ||||||||
| Other income (expense): | ||||||||||||||||
| Loss on exchange of business assets | (1,236,362 | ) | $ | (1,236,362 | ) | |||||||||||
| Interest income | 5,790 | $ | 5,790 | 16,645 | ||||||||||||
| Interest expense | (41,616 | ) | $ | (41,616 | ) | (35,182 | ) | |||||||||
| Income (loss) from continuing operations | (1,371,478 | ) | (225,214 | ) | (1,596,692 | ) | (628,662 | ) | ||||||||
| Loss from discontinuing operations | 84,888 | 84,888 | 1,136,399 | |||||||||||||
| Net income (loss) | $ | (1,286,590 | ) | $ | (225,214 | ) | $ | (1,511,804 | ) | $ | 507,737 | |||||
| Basic and diluted income (loss) per share: | ||||||||||||||||
| From continuing operations | $ | (0.02 | ) | $ | (0.00 | ) | $ | (0.02 | ) | (0 | ) | |||||
| From discontinued operations | $ | 0.00 | $ | - | $ | 0.00 | - | |||||||||
| Total | $ | (0.02 | ) | $ | (0.00 | ) | $ | (0.02 | ) | - | ||||||
| Weighted average common shares | 70,288,450 | 70,288,450 | 70,288,450 | 680,644,608 | ||||||||||||
For the year ended April 30, 2007
(Unaudited)
| As Previously | Restated | |||||||||||
| Reported | Restated | 4/30/06 | ||||||||||
| CASH FLOWS OPERATING ACTIVITIES | ||||||||||||
| Net loss | (1,286,590 | ) | $ | (1,511,804 | ) | 422,614 | ||||||
| Add: income (loss) from discontinued operations | 1,151,474 | 1,151,474 | (1,136,399 | ) | ||||||||
| Loss from continuing operations | (135,116 | ) | (360,330 | ) | (713,785 | ) | ||||||
| Additional shares issued for conversion of debt | ||||||||||||
| Depreciation and amortization expense | ||||||||||||
| Changes in operating assets and liabilities: | ||||||||||||
| Increase (decrease) in A/P and accrued expenses | 28,475 | 28,475 | ||||||||||
| Decrease (increase) in accounts receivable | 427,311 | 427,311 | (366,114 | ) | ||||||||
| Increase (decrease) in deferred income | - | 45,336 | ||||||||||
| Increase (decrease) in accrued expense | - | 88,134 | ||||||||||
| Net cash provided by (used in) operating activities | 320,670 | 95,456 | ||||||||||
| CASH FLOW INVESTING ACTIVITIES | ||||||||||||
| Increase (decrease) in loans receivable | - | (73,259 | ) | |||||||||
| Purchase of Right-Tag | (339,758 | ) | (339,758 | ) | ||||||||
| Purchase of fixed assets | - | (10,477 | ) | |||||||||
| Net cash provided by (used in) investing activities | (339,758 | ) | (339,758 | ) | ||||||||
| CASH FLOW FINANCING ACTIVITIES | ||||||||||||
| Proceeds from notes payable - related parties | 863,304 | 863,304 | (534,535 | ) | ||||||||
| Proceeds from APIC | 9,715 | 234,929 | 1,397,126 | |||||||||
| Translation adjustment | (5,000 | ) | (5,000 | ) | 4,877 | |||||||
| Net cash provided by (used in) financing activities | 868,019 | 1,093,233 | ||||||||||
| NET CASH PROVIDED BY (USED IN) CONTINUING OPERATIONS | 848,931 | 848,931 | ||||||||||
| NET CASH PROVIDED BY DISCONTINUED OPERATIONS | (1,205,684 | ) | (1,205,684 | ) | (162,697 | ) | ||||||
| NET CHANGE IN CASH | (356,753 | ) | (356,753 | ) | (162,697 | ) | ||||||
| CASH AT BEGINNING OF PERIOD | 379,600 | 379,600 | 542,297 | |||||||||
| CASH AT END OF PERIOD | $ | 22,847 | $ | 22,847 | 379,600 | |||||||

Restatements
There were management fees of $15,000 per month from May, 2006 through November, 2006 which were not paid but which are now being realized as an increase in expense and in paid in capital. This is a total of $105,000, which is a reduction of net income and increase to equity. There was an additional $165,000 from the prior year which is a reduction of retained earnings and increase of paid in capital.
July 31, 2007
Restatements
There were management fees of $15,000 per month from prior years which were not paid but which are now being realized as an increase in paid in capital and reduction of retained earnings for a total of $270,000.
Inova Technology, Inc. and Subsidiaries
Consolidated Statements of Operations
For the 3 months ended July 31, 2007
(Unaudited)- RESTATED
7/31/07 | Restatements | Restated | 7/31/06 | Restatements | Restated | |||||||||||||||||||
| Revenues | 385,112 | 385,112 | 486,957 | 486,957 | ||||||||||||||||||||
| Cost of revenues | (145,263 | ) | (145,263 | ) | (75,776 | ) | (75,776 | ) | ||||||||||||||||
| Operating expenses | (140,197 | ) | (30,054 | ) | (170,251 | ) | (33,598 | ) | (75,054 | ) | (108,652 | ) | ||||||||||||
| Operating loss | 377,583 | |||||||||||||||||||||||
| Other income (expense): | ||||||||||||||||||||||||
| Loss on exchange of business assets | ||||||||||||||||||||||||
| Interest income | ||||||||||||||||||||||||
| Interest expense | (31,695 | ) | (31,695 | ) | - | - | ||||||||||||||||||
| Income (loss) from continuing operations | 67,957 | 37,903 | 377,583 | (75,054 | ) | 302,529 | ||||||||||||||||||
| Loss from discontinuing operations | (30,849 | ) | (30,849 | ) | ||||||||||||||||||||
| Net income (loss) | 67,957 | 37,903 | 346,734 | (75,054 | ) | 271,680 | ||||||||||||||||||
| Basic and diluted income (loss) per share: | ||||||||||||||||||||||||
| From continuing operations | - | 0 | ||||||||||||||||||||||
| From discontinued operations | - | - | ||||||||||||||||||||||
| Total | - | 0 | ||||||||||||||||||||||
| Weighted average common shares | 725,524,208 | 725,524,208 | 703,983,450 | 703,983,450 | ||||||||||||||||||||

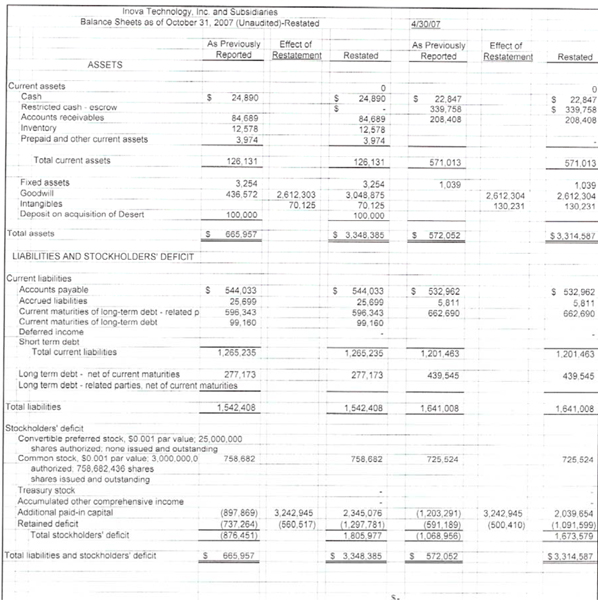
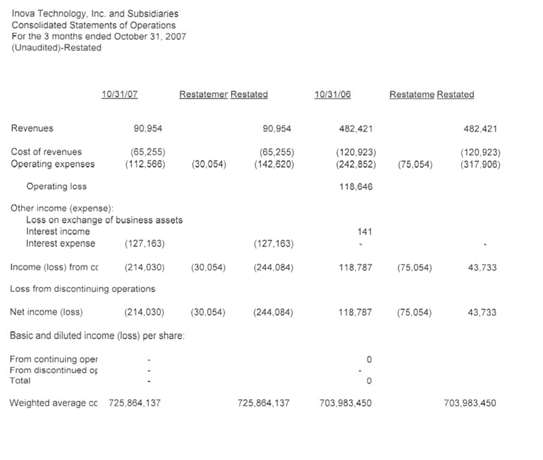
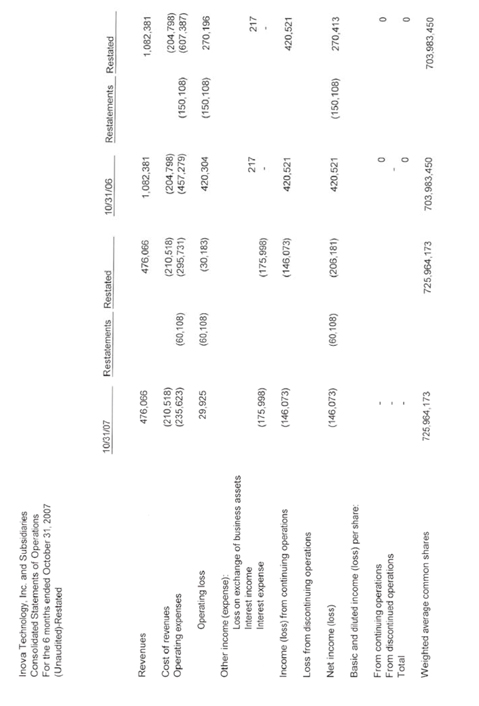
October 31, 2007
Restatements
There were management fees of $15,000 per month from prior years which were not paid but which are now being realized as an increase in paid in capital and reduction of retained earnings for a total of $270,000.
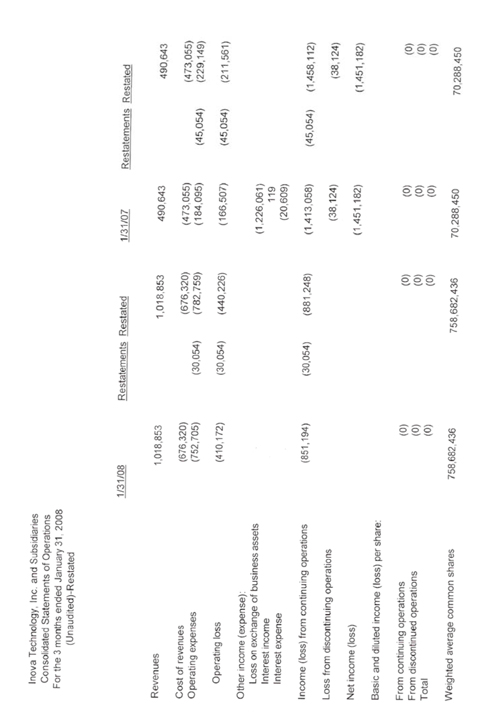
January 31, 2008
Restatements
There were management fees of $15,000 per month from prior years which were not paid but which are now being realized as an increase in paid in capital and reduction of retained earnings for a total of $270,000

April 30, 2008
The following wording is being added regarding controls:
Due to the small size of the company and the amount of time required to set up proper controls we have not yet reviewed/approved all control activities, such as policies and procedures, so this is considered a weakness at this time.
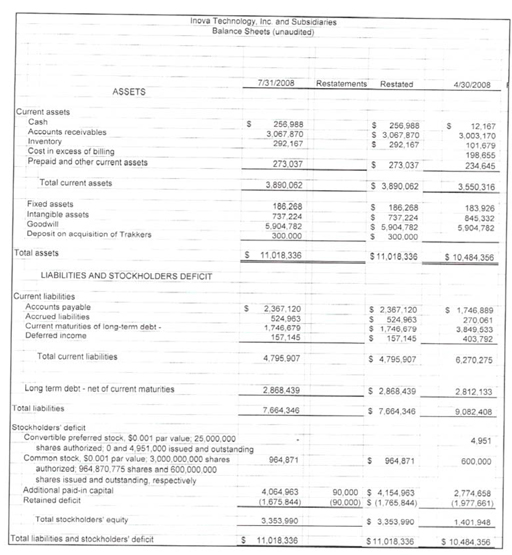
During the year ended April 30, 2008, Inova restated its prior year financial statements for the following transactions:
Inova’s acquisition of Web’s Biggest:
During 2008, Inova determined that the original accounting for the merger with Web’s Biggest in 2005 was incorrect. Both companies were operating companies and the intent of the combined entity was to continue on with both operations. Inova should have accounted for the transaction as a reverse acquisition whereby Web’s Biggest purchased Inova and fair value and purchase accounting would apply. The purchase price was $2,464,908 (70,425,950 shares issued at their market value of $0.035 per share on June 1, 2005) and the fair value of the net liabilities assumed was $508,037, resulting in goodwill and intangible assets totaling $2,972,945. Inova recorded goodwill of $2,612,304 and intangible asset of $360,641 through additional paid in capital. Inova also recorded $230,410 amortization of intangible asset through reduction of retained earnings. An impairment analysis at April 30, 2008 has been undertaken and a reduction to goodwill of $324,310 has been booked.
Table of Contents
Unrecorded management fees:
During 2008, Inova identified that there were management fees of $15,000 per month for prior periods which were not recognized but which are now being realized as an increase in expense and in paid in capital. This totaled $270,000, which increases net loss for fiscal 2007.
| See summary of accounting policies and notes to consolidated financial statements. |
Table of Contents
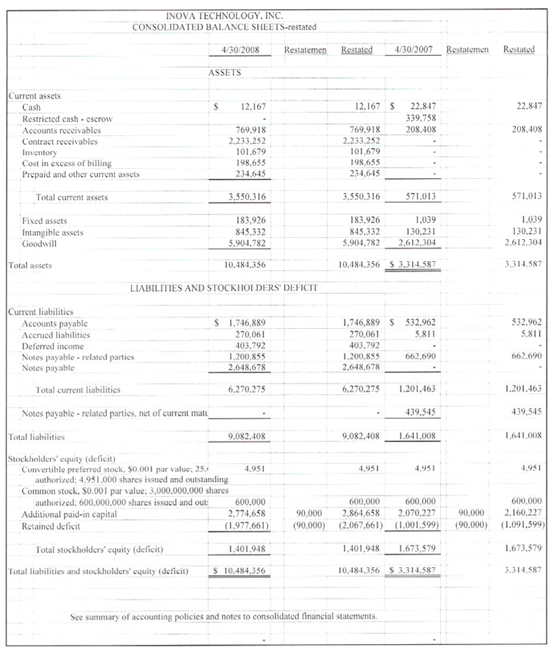
Table of Contents
| INOVA TECHNOLOGY, INC. |
| CONSOLIDATED STATEMENT OF STOCKHOLDERS EQUITY |
| Years ended April 30, 2007 (Restated) and 2008 |
| Common Stock | Preferred Stock | Treasury Stock | Accumulated | |||||||||||||||||||||||||||||||||||||
Shares | Par (0.001) | Shares | Par (0.001) | Shares | Amount | APIC | OCI | Deficit | Total | |||||||||||||||||||||||||||||||
| Balances at April 30, 2006 | 70,288,450 | $ | 70,288 | 25,000,000 | $ | 25,000 | 137,500 | $ | (4,715 | ) | $ | 2,307,564 | $ | 4,877 | $ | 580,328 | $ | 2,983,342 | ||||||||||||||||||||||
Shares issued to pay notes payable | 21,264,758 | 21,264 | 71,061 | 92,325 | ||||||||||||||||||||||||||||||||||||
Shares issued to acquire Data Management | 25,000,000 | 25,000 | (25,000 | ) | — | |||||||||||||||||||||||||||||||||||
Shares received for sale of Web's Biggest, LTD | (25,000,000 | ) | (25,000 | ) | 25,000 | — | ||||||||||||||||||||||||||||||||||
| Reversal of treasury stock purchase | 137,500 | 138 | (137,500 | ) | 4,715 | (138 | ) | 4,715 | ||||||||||||||||||||||||||||||||
Preferred shares converted to common shares (restated) | 508,309,292 | 508,310 | (20,049,000 | ) | (20,049 | ) | (488,261 | ) | — | |||||||||||||||||||||||||||||||
Management fees (restated) | 180,000 | 180,000 | ||||||||||||||||||||||||||||||||||||||
| Translation adjustment | (4,877 | ) | (4,877 | ) | ||||||||||||||||||||||||||||||||||||
| Net loss (restated) | (1,581,927 | ) | (1,581,927 | ) | ||||||||||||||||||||||||||||||||||||
| Balances at April 30, 2007 (Restated) | 600,000,000 | 600,000 | 4,951,000 | 4,951 | — | — | 2,070,226 | — | (1,001,599 | ) | 1,673,578 | |||||||||||||||||||||||||||||
Capital contributions from related party | 15,520 | 15,520 | ||||||||||||||||||||||||||||||||||||||
Beneficial conversion feature | 75,856 | 75,856 | ||||||||||||||||||||||||||||||||||||||
| Warrant discount | 613,056 | 613,056 | ||||||||||||||||||||||||||||||||||||||
| Net loss | (976,062 | ) | (976,062 | ) | ||||||||||||||||||||||||||||||||||||
| Balances at April 30, 2008 | 600,000,000 | $ | 600,000 | 4,951,000 | $ | 4,951 | — | $ | — | $ | 2,774,658 | $ | — | $ | (1,977,661 | ) | $ | 1,401,948 | ||||||||||||||||||||||
See summary of accounting policies and notes to consolidated financial statements.
July 31, 2008
October 31, 2008