0001089113ifrs-full:FinancialAssetsAtAmortisedCostCategoryMemberhsbc:LoansAndAdvancesToCustomersMemberifrs-full:CurrentMemberifrs-full:LifetimeExpectedCreditLossesMemberifrs-full:FinancialInstrumentsNotCreditimpairedMember2021-12-310001089113hsbc:WholesaleLendingSectorMemberhsbc:DownsideScenarioWorstOutcomeMembercountry:GBifrs-full:AccumulatedImpairmentMember2020-12-310001089113ifrs-full:FinancialAssetsAtAmortisedCostCategoryMemberhsbc:IFRS9Memberhsbc:SatisfactoryMemberhsbc:LoansAndAdvancesToBanksMemberifrs-full:GrossCarryingAmountMember2020-12-310001089113ifrs-full:FinancialInstrumentsCreditimpairedAfterPurchaseOrOriginationMemberhsbc:IFRS9Memberhsbc:SatisfactoryMemberhsbc:LoanAndOtherCreditRelatedCommitmentsMemberifrs-full:GrossCarryingAmountMemberifrs-full:LifetimeExpectedCreditLossesMember2020-12-310001089113hsbc:CRRPD9to10Memberhsbc:CommercialRealEstateLoansAndAdvancesIncludingLoanCommitmentsMemberhsbc:LoansAndAdvancesToCustomersAndBanksMembercountry:HKhsbc:WholesaleLendingSectorMemberhsbc:LTV91To100PercentMember2020-12-310001089113ifrs-full:FinancialInstrumentsCreditimpairedAfterPurchaseOrOriginationMemberhsbc:LoansAndAdvancesToCustomersMemberhsbc:FullyCollateralisedMemberifrs-full:LifetimeExpectedCreditLossesMemberhsbc:LTV51To60PercentMemberhsbc:PersonalLendingSectorMember2021-12-310001089113hsbc:TemporaryDifferencesFromInvestmentsInSubsidiariesAndBranchesMember2020-12-310001089113hsbc:HSBCHoldingsMemberifrs-full:LaterThanOneYearAndNotLaterThanTwoYearsMemberifrs-full:DebtSecuritiesMember2020-12-31
As filed with the Securities and Exchange Commission on February 23, 2022.
UNITED STATES
SECURITIES AND EXCHANGE COMMISSION
WASHINGTON, D.C. 20549
FORM 20-F
| | | | | |
| REGISTRATION STATEMENT PURSUANT TO SECTION 12(b) OR 12(g) OF THE SECURITIES EXCHANGE ACT OF 1934 |
Or
| | | | | |
| þ | ANNUAL REPORT PURSUANT TO SECTION 13 OR 15(d) OF THE SECURITIES EXCHANGE ACT OF 1934 |
For the fiscal year ended December 31, 2021
Or
| | | | | |
| TRANSITION REPORT PURSUANT TO SECTION 13 OR 15(d) OF THE SECURITIES EXCHANGE ACT OF 1934 |
Or
| | | | | |
| SHELL COMPANY REPORT PURSUANT TO SECTION 13 OR 15(d) OF THE SECURITIES EXCHANGE ACT OF 1934 |
Date of event requiring this shell company report ____________
For the transition period from N/A to N/A
Commission file number: 001-14930
HSBC Holdings plc
(Exact name of Registrant as specified in its charter)
| | | | | | | | |
| N/A | | United Kingdom |
| (Translation of Registrant’s name into English) | | (Jurisdiction of incorporation or organisation) |
8 Canada Square
London E14 5HQ
United Kingdom
(Address of principal executive offices)
Jonathan Bingham
8 Canada Square
London E14 5HQ
United Kingdom
Tel +44 (0) 20 3268 4840
Email jonathan.bingham@hsbc.com
(Name, Telephone, Email and/or Facsimile number and Address of Company Contact Person)
Securities registered or to be registered pursuant to Section 12(b) of the Act:
| | | | | | | | | | | |
| Title of each class | Trading Symbol(s) | Name of each exchange on which registered | |
| Ordinary Shares, nominal value US$0.50 each (GB0005405286) | HSBA | London Stock Exchange | |
| 5 | Hong Kong Stock Exchange | |
| HSBC.BH | Bermuda Stock Exchange | |
| HSBC | New York Stock Exchange | * |
| American Depository Shares, each representing 5 Ordinary Shares of nominal value US$0.50 each (US4042804066) | HSBC | New York Stock Exchange | |
| | | | | | | | | | | |
| 7.625% Subordinated Notes due 2032 (US404280AF65) | HSBC/32A | New York Stock Exchange | |
| 7.35% Subordinated Notes due 2032 (US404280AE90) | HSBC/32B | New York Stock Exchange | |
| 6.5% Subordinated Notes 2036 (US404280AG49) | HSBC36 | New York Stock Exchange | |
| 6.5% Subordinated Notes 2037 (US404280AH22) | HSBC37 | New York Stock Exchange | |
| 6.8% Subordinated Notes Due 2038 (US404280AJ87) | HSBC38 | New York Stock Exchange | |
| 4.875% Senior Unsecured Notes Due 2022 (US404280AL34) | HSBC22 | New York Stock Exchange | |
| 6.100% Senior Unsecured Notes due 2042 (US404280AM17) | HSBC42 | New York Stock Exchange | |
| 4.00% Senior Unsecured Notes Due 2022 (US404280AN99) | HSBC22A | New York Stock Exchange | |
| 4.250% Subordinated Notes due 2024 (US404280AP48) | HSBC24 | New York Stock Exchange | |
| 5.250% Subordinated Notes due 2044 (US404280AQ21) | HSBC44 | New York Stock Exchange | |
| 4.250% Subordinated Notes due 2025 (US404280AU33) | HSBC25 | New York Stock Exchange | |
| 4.300% Senior Unsecured Notes due 2026 (US404280AW98) | HSBC26 | New York Stock Exchange | |
| 3.600% Senior Unsecured Notes due 2023 (US404280BA69) | HSBC23 | New York Stock Exchange | |
| 3.900% Senior Unsecured Notes due 2026 (US404280BB43) | HSBC26A | New York Stock Exchange | |
| 2.650% Senior Unsecured Notes due 2022 (US404280BF56) | HSBC22B | New York Stock Exchange | |
| Floating Rate Senior Unsecured Notes due 2022 (US404280BG30) | HSBC22C | New York Stock Exchange | |
| 4.375% Subordinated Notes due 2026 (US404280BH13) | HSBC26B | New York Stock Exchange | |
| 3.262% Fixed Rate/Floating Rate Senior Unsecured Notes due 2023 (US404280BJ78) | HSBC23A | New York Stock Exchange | |
| 4.041% Fixed Rate/Floating Rate Senior Unsecured Notes due 2028 (US404280BK42) | HSBC28 | New York Stock Exchange | |
| 3.033% Fixed Rate/Floating Rate Senior Unsecured Notes due 2023 (US404280BM08) | HSBC23B | New York Stock Exchange | |
| Floating Rate Senior Unsecured Notes due 2024 (US404280BR94) | HSBC24A | New York Stock Exchange | |
| 3.950% Fixed Rate/Floating Rate Senior Unsecured Notes due 2024 (US404280BS77) | HSBC24B | New York Stock Exchange | |
| 4.583% Fixed Rate/Floating Rate Senior Unsecured Notes due 2029 (US404280BT50) | HSBC29 | New York Stock Exchange | |
| 2.175% Resettable Senior Unsecured Notes due 2023 (XS1823595647) | N/A | New York Stock Exchange | |
| Floating Rate Senior Unsecured Notes due 2026 (US404280BW89) | HSBC26D | New York Stock Exchange | |
| 4.292% Fixed Rate/Floating Rate Senior Unsecured Notes due 2026 (US404280BX62) | HSBC26C | New York Stock Exchange | |
| 3.803% Fixed Rate/Floating Rate Senior Unsecured Notes due 2025 (US404280BZ11) | HSBC25A | New York Stock Exchange | |
| Floating Rate Senior Unsecured Notes due 2025 (US404280CA50) | HSBC25B | New York Stock Exchange | |
| 3.000% Resettable Senior Unsecured Notes due 2028 (XS1961843171) | HSBC28A | New York Stock Exchange | |
| 3.973% Fixed Rate/Floating Rate Senior Unsecured Notes due 2030 (US404280CC17) | HSBC30 | New York Stock Exchange | |
| 3.00% Resettable Senior Unsecured Notes due 2030 (XS2003500142) | HSBC30A | New York Stock Exchange | |
| | | | | | | | | | | |
| 2.633% Fixed Rate/Floating Rate Senior Unsecured Notes due 2025 (US404280CE72) | HSBC25C | New York Stock Exchange | |
4.950% Fixed Rate Senior Unsecured Notes due 2030
(US404280CF48) | HSBC30B | New York Stock Exchange | |
2.099% Fixed Rate/Floating Rate Senior Unsecured Notes due 2026
(US404280CG21) | HSBC26E | New York Stock Exchange | |
2.848% Fixed Rate/Floating Rate Senior Unsecured Notes due 2031
(US404280CH04) | HSBC31 | New York Stock Exchange | |
1.645% Fixed Rate/Floating Rate Senior Unsecured Notes due 2026
(US404280CJ69) | HSBC26F | New York Stock Exchange | |
2.357% Fixed Rate/Floating Rate Senior Unsecured Notes due 2031
(US404280CK33) | HSBC31A | New York Stock Exchange | |
2.013% Fixed Rate/Floating Rate Senior Unsecured Notes due 2028
(US404280CL16) | HSBC28B | New York Stock Exchange | |
1.589% Fixed Rate/Floating Rate Senior Unsecured Notes due 2027
(US404280CM98) | HSBC27 | New York Stock Exchange | |
1.750% Fixed Rate/Floating Rate Senior Unsecured Notes due 2027
(XS2322315727) | HSBC27A | New York Stock Exchange | |
0.976% Fixed Rate/Floating Rate Senior Unsecured Notes due 2025
(US404280CS68) | HSBC25 | New York Stock Exchange | |
2.804% Fixed Rate/Floating Rate Senior Unsecured Notes due 2032
(US404280CT42) | HSBC32 | New York Stock Exchange | |
0.732% Fixed Rate/Floating Rate Senior Unsecured Notes due 2024
(US404280CU15) | HSBC24C | New York Stock Exchange | |
2.206% Fixed Rate/Floating Rate Senior Unsecured Notes due 2029
(US404280CV97) | HSBC29A | New York Stock Exchange | |
1.162% Fixed Rate/Floating Rate Senior Unsecured Notes due 2024
(US404280CW70) | HSBC24D | New York Stock Exchange | |
2.251% Fixed Rate/Floating Rate Senior Unsecured Notes due 2027
(US404280CX53) | HSBC27B | New York Stock Exchange | |
2.871% Fixed Rate/Floating Rate Senior Unsecured Notes due 2032
(US404280CY37) | HSBC32A | New York Stock Exchange | |
Floating Rate Senior Unsecured Notes due 2024
(US404280CZ02) | HSBC24E | New York Stock Exchange | |
* Not for trading, but only in connection with the registration of American Depositary Shares.
Securities registered or to be registered pursuant to Section 12(g) of the Securities Exchange Act of 1934: None
Securities for which there is a reporting obligation pursuant to Section 15(d) of the Securities Exchange Act of 1934: None
Indicate the number of outstanding shares of each of the issuer’s classes of capital or common stock as of the close of the period covered by the annual report:
Ordinary Shares, nominal value US$0.50 each 20,631,520,439
Indicate by check mark if the registrant is a well-known seasoned issuer, as defined in Rule 405 of the Securities Act. þ Yes ¨ No
If this report is an annual or transition report, indicate by check mark if the registrant is not required to file reports pursuant to Section 13 or 15(d) of the Securities Exchange Act of 1934. ¨ Yes þ No
Indicate by check mark whether the registrant (1) has filed all reports required to be filed by Section 13 or 15(d) of the Securities Exchange Act of 1934 during the preceding 12 months (or for such shorter period that the registrant was required to file such reports), and (2) has been subject to such filing requirements for the past 90 days. þ Yes ¨ No
Indicate by check mark whether the registrant has submitted electronically every Interactive Data File required to be submitted and posted pursuant to Rule 405 of Regulation S-T (§232.405 of this chapter) during the preceding 12 months (or for such shorter period that the registrant was required to submit such files). þ Yes ¨ No
Indicate by check mark whether the registrant is a large accelerated filer, an accelerated filer, a non-accelerated filer or an emerging growth company. See definition of “large accelerated filer,” “accelerated filer,” and “emerging growth company” in Rule 12b-2 of the Exchange Act.:
| | | | | | | | | | | | | | | | | | | | | | | |
| Large accelerated filer | þ | Accelerated filer | ¨ | Non-accelerated filer | ¨ | Emerging growth company | ¨ |
If an emerging growth company that prepares its financial statements in accordance with U.S. GAAP, indicate by check mark if the registrant has elected not to use the extended transition period for complying with any new or revised financial accounting standards† provided pursuant to Section 13(a) of the Exchange Act.
† The term “new or revised financial accounting standard” refers to any update issued by the Financial Accounting Standards Board to its Accounting Standards Codification after April 5, 2012.
Indicate by check mark whether the registrant has filed a report on and attestation to its management’s assessment of the effectiveness of its internal control over financial reporting under Section 404(b) of the Sarbanes-Oxley Act (15 U.S.C. 7262(b)) by the registered public accounting firm that prepared or issued its audit report. þ
Indicate by check mark which basis of accounting the registrant has used to prepare the financial statements included in this filing:
| | | | | | | | | | | | | | | | | |
| U.S. GAAP | ¨ | International Financial Reporting Standards | þ | Other | ¨ |
| | as issued by the International Accounting Standards Board | | | |
If “Other” has been checked in response to the previous question indicate by check mark which financial statement item the registrant has elected to follow. ¨ Item 17 ¨ Item 18
If this is an annual report, indicate by check mark whether the registrant is a shell company (as defined in Rule 12b-2 of the Exchange Act). ¨ Yes þ No
Contents
Strategic report
1a Forward-looking statements
1c Approach to ESG reporting
1d Certain defined terms
2 Highlights
4 Who we are
6 Group Chairman’s statement
8 Group Chief Executive’s review
12 Our strategy
15 How we do business
25 Remuneration
26 Financial overview
30 Global businesses
37 Risk overview
Environmental, social and
governance (‘ESG’) review
43 Our approach to ESG
45 Environmental
66 Social
79 Governance
Financial review
90 Financial summary
110 Global businesses and geographical regions
131 Reconciliation of alternative performance measures
134 Other information
Risk review
145 Our approach to risk
148 Top and emerging risks
155 Risk factors
167 Areas of special interest
171 Our material banking risks
Corporate governance report
254 Group Chairman’s governance statement
256 Biographies of Directors and senior management
273 Board committees
290 Directors’ remuneration report
Financial statements
334 Report of Independent Registered Public Accounting Firm to the Board of Directors and Shareholders of HSBC Holdings plc
(PCAOB ID 876)
336 Financial statements
346 Notes on the financial statements
Additional information
425 Shareholder information
435 Abbreviations
We have changed how we provide the disclosures against the Task Force on Climate-related Disclosures (‘TCFD’) framework by embedding the content previously provided in our stand-alone TCFD Update within this Form 20-F for the year ended 31 December 2021. The summary TCFD disclosure can be found on page 19.
This Strategic Report was approved by the Board on 22 February 2022.
Mark E Tucker
Group Chairman
A reminder
The currency we report in is US dollars.
Adjusted measures
We supplement our IFRSs figures with non-IFRSs measures used by management internally that constitute alternative performance measures under European Securities and Markets Authority guidance and non-GAAP financial measures defined in and presented in accordance with US Securities and Exchange Commission rules and regulations. These measures are highlighted with the following symbol: <>
Further explanation may be found on page 28.
None of the websites referred to in this Form 20-F for the year ended 31 December 2021 (the ‘Form 20-F’) (including where a link is provided), and none of the information contained on such websites, are incorporated by reference in this report.
Cover image: Opening up a world of opportunity
We connect people, ideas and capital across the world, opening up opportunities for our customers and the communities we serve.
Opening up a world of opportunity
Our ambition is to be the preferred international financial partner for our clients.
Our purpose, ambition and values reflect our strategy and support our focus on execution.
Read more on our values, strategy and purpose on pages 4, 12 and 15.
Key themes of 2021
The Group continued to make progress on our strategic aims, although challenges remain:
Financial performance
Performance reflected an improvement in global economic conditions, which resulted in releases of expected credit loss allowances, the impact of lower interest rates, and continued cost discipline. All of our regions were profitable, and our Asia operations continued to perform strongly. The outlook for net interest income is now significantly more positive.
Read more on pages 2 and 26.
Strategic transformation
We have made progress in areas of strength and expanded our digital capabilities across key products. During the year, we announced a number of strategic transactions including the planned sale of our retail banking business in France and our exit of mass market retail in the US. We also announced acquisitions in Singapore and India to develop our wealth capabilities across Asia.
Read more on page 12.
Climate ambition
We are helping to mobilise the transition to a net zero global economy. Since 2020, we have supported our customers’ transition to net zero and a sustainable future by providing and facilitating sustainable finance and investment. We have published our thermal coal phase-out policy and have set targets to reduce our on-balance sheet financed emissions of two priority sectors: oil and gas, and power and utilities by 2030.
Read more on page 18.
Delivery against our financial targets
Return on average tangible equity <>
8.3%
Target: ≥10% over the medium term.
(2020: 3.1%)
Adjusted operating expenses <>
$32.1bn
Updated target: 2022 adjusted operating expenses in line with 2021.
Previous target: ≤$31bn in 2022 (at December 2020 foreign exchange rates).
(2020: $32.4bn)
Gross RWA reduction
$104bn
Since the start of the programme. Updated target: >$110bn by end of 2022.
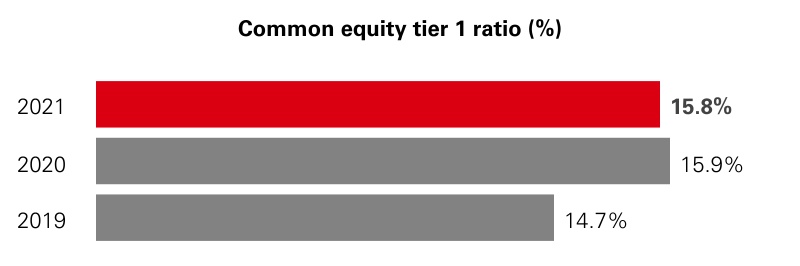
Common equity tier 1 capital ratio
15.8%
Target: >14%, managing in the range of 14% to 14.5% in the medium term; and manage the range down further long term.
(2020: 15.9%)
Dividend per share
$0.25
2021 payout ratio: 40.3%
Target: sustainable cash dividends with a payout ratio of 40% to 55% from 2022 onwards.
For our financial targets, we define medium term as three to four years and long term as five to six years, commencing 1 January 2020.
Further explanation of performance against Group financial targets may be found on page 26.
ESG performance indicators and targets
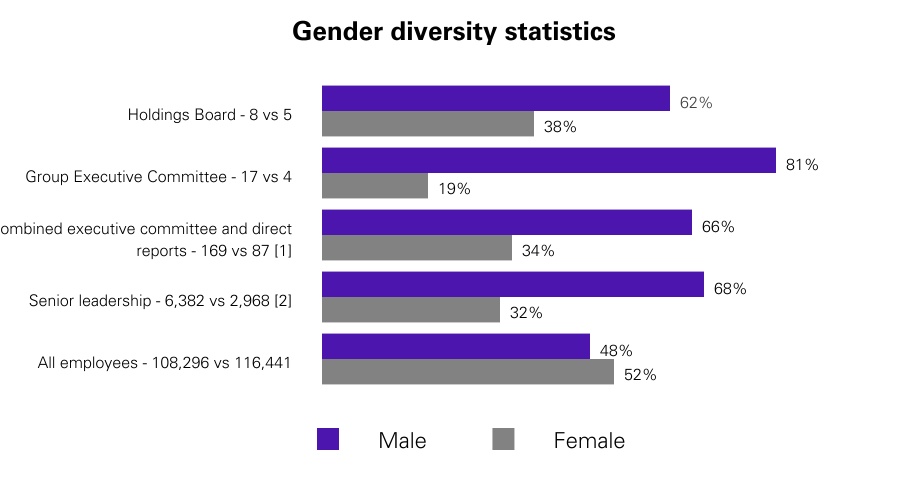
Gender diversity
31.7%
Women in senior leadership roles.
(2020: 30.3%)
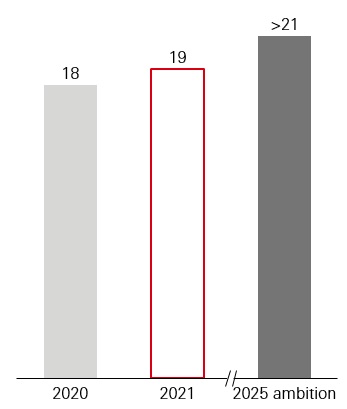
Sustainable finance and investment
$126.7bn
Cumulative total provided and facilitated since January 2020.
(2020: $44.1bn)
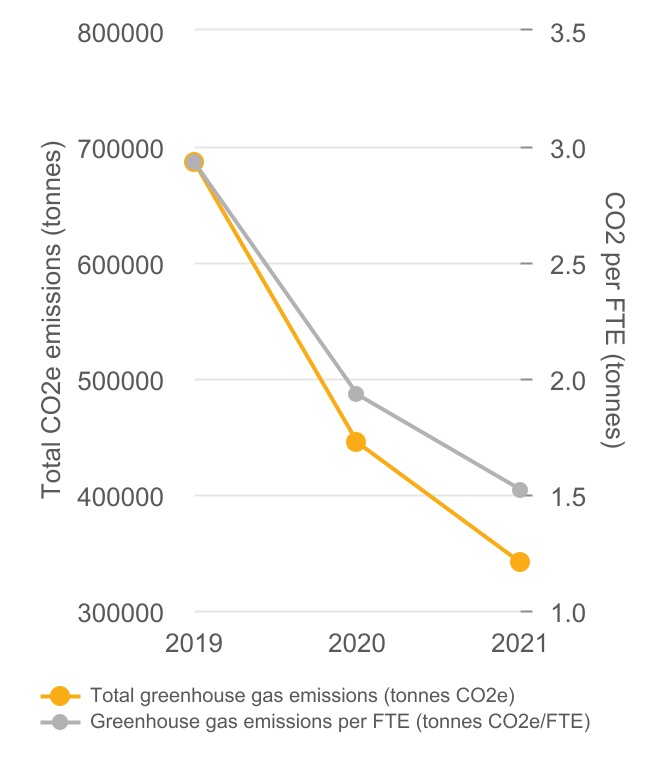
Net zero in our own operations
50.3%
Cumulative reduction in absolute greenhouse gas emissions from 2019 baseline.
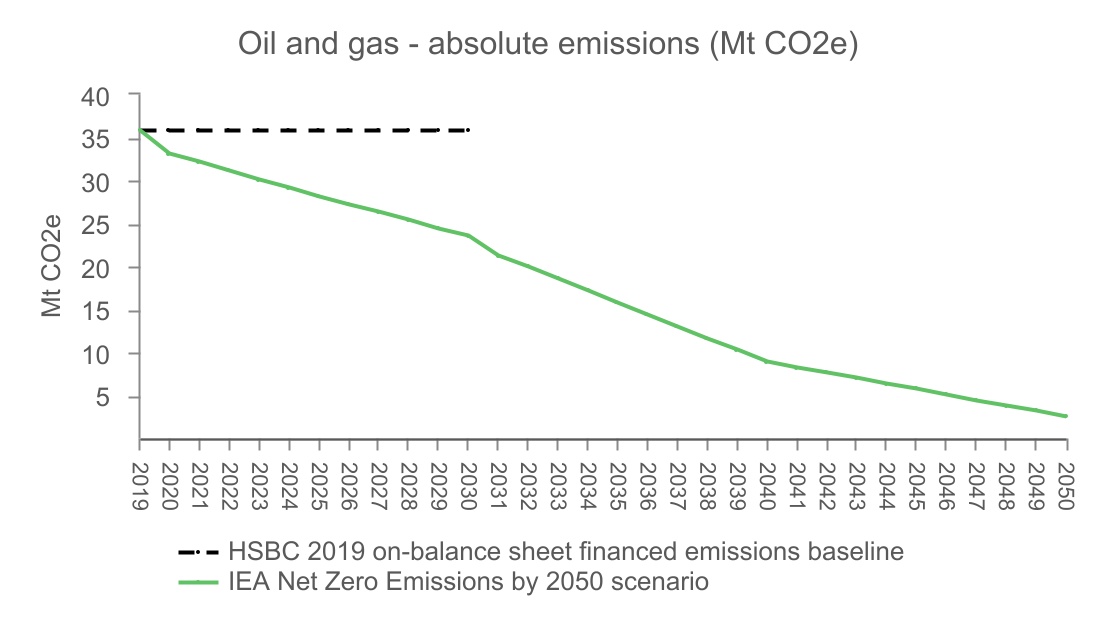
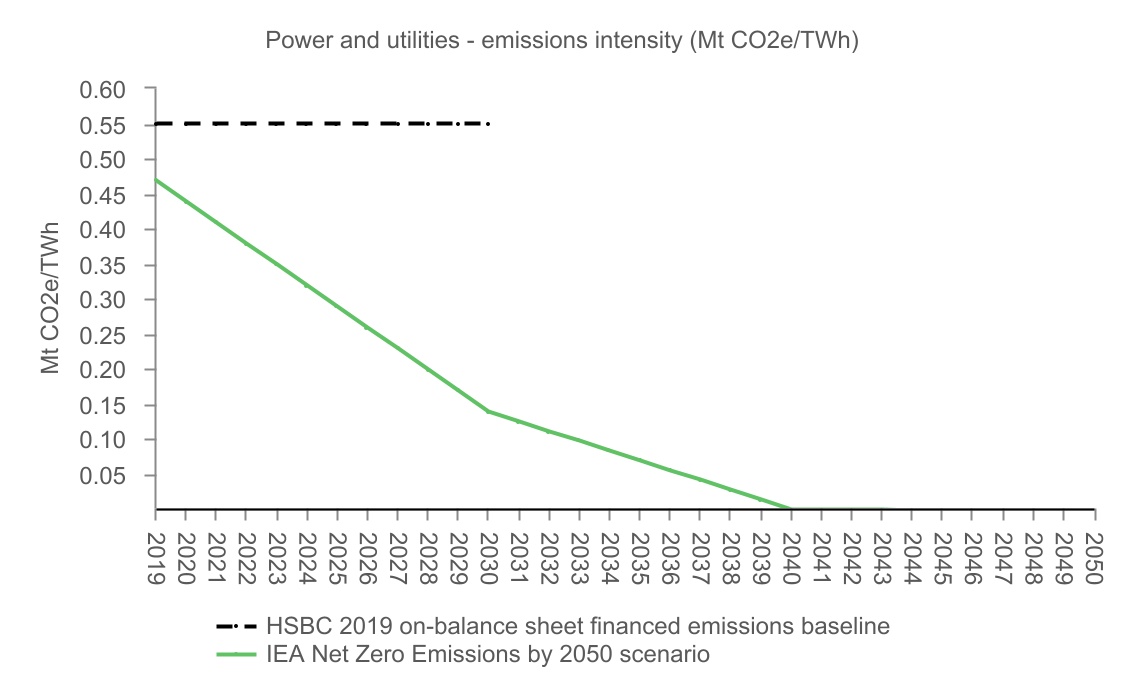
Financed emissions targets by 2030
34%
Mt CO2e reduction in oil and gas absolute on-balance sheet financed emissions
0.14
Mt CO2e/TWh power and utilities on-balance sheet financed emissions intensity, representing 75% reduction from 2019
Customer satisfaction
6 out of 10
Wealth and Personal Banking markets that sustained top-three rank and/or improved in customer satisfaction.
4 out of 13
Commercial Banking markets that sustained top-three rank and/or improved in customer satisfaction.
Read more on how we set and define our environmental, social and governance metrics on page 17.
Read more on our financed emissions scope, methodology and terminology on page 47 and our definition of sustainable finance and investment on page 53.
Cautionary statement regarding forward-looking statements
This Form 20-F contains certain forward-looking statements with respect to HSBC’s financial condition; results of operations and business, including the strategic priorities; financial, investment and capital targets; and ESG targets, commitments and ambitions described herein.
Statements that are not historical facts, including statements about HSBC’s beliefs and expectations, are forward-looking statements. Words such as ‘may’, ‘will’, ‘should’, ‘expects’, ‘targets’, ‘anticipates’, ‘intends’, ‘plans’, ‘believes’, ‘seeks’, ‘estimates’, ‘potential’ and ‘reasonably possible’, or the negative thereof, other variations thereon or similar expressions are intended to identify forward-looking statements. These statements are based on current plans, information, data, estimates and projections, and therefore undue reliance should not be placed on them. Forward-looking statements speak only as of the date they are made. HSBC makes no commitment to revise or update any forward-looking statements to reflect events or circumstances occurring or existing after the date of any forward-looking statements. Written and/or oral forward-looking statements may also be made in the periodic reports to the US Securities and Exchange Commission, summary financial statements to shareholders, proxy statements, offering circulars and prospectuses, press releases and other written materials, and in oral statements made by HSBC’s Directors, officers or employees to third parties, including financial analysts. Forward-looking statements involve inherent risks and uncertainties. Readers are cautioned that a number of factors could cause actual results to differ, in some instances materially, from those anticipated or implied in any forward-looking statement. These include, but are not limited to:
•changes in general economic conditions in the markets in which we operate, such as new recessions and fluctuations in employment and creditworthy customers beyond those factored into consensus forecasts (including, without limitation, as a result of the Covid-19 pandemic); the Covid-19 pandemic, which may continue to have adverse impacts on our income due to lower lending and transaction volumes, lower wealth and insurance manufacturing revenue, and volatile interest rates in markets where we operate, as well as, more generally, the potential for material adverse impacts on our financial condition, results of operations, prospects, liquidity, capital position and credit ratings; deviations from the market and economic assumptions that form the basis for our ECL measurements (including, without limitation, as a result of the Covid-19 pandemic); potential changes in HSBC’s dividend policy; changes in foreign exchange rates and interest rates, including the accounting impact resulting from financial reporting in respect of hyperinflationary economies; volatility in equity markets; lack of liquidity in wholesale funding or capital markets, which may affect our ability to meet our obligations under financing facilities or to fund new loans, investments and businesses; geopolitical tensions or diplomatic developments producing social instability or legal uncertainty, such as diplomatic tensions, including between China and the US, the UK, the EU, India and other countries, and developments in Hong Kong and Taiwan, alongside other potential areas of tension, which may affect the Group by creating regulatory, reputational and market risks; the efficacy of government, customer, and HSBC's actions in managing and mitigating ESG risks, in particular climate risk, nature-related risks and human rights risks, each of which can impact HSBC both directly and indirectly through our customers and which may result in potential financial and non-financial impacts; illiquidity and downward price pressure in national real estate markets; adverse changes in central banks’ policies with respect to the provision of liquidity support to financial markets; heightened market concerns over sovereign creditworthiness in over-indebted countries; adverse changes in the funding status of public or private defined benefit pensions; societal shifts in customer financing and investment needs, including consumer perception as to the continuing availability of credit; exposure to counterparty risk, including third parties using us as a conduit for illegal activities without our knowledge; the discontinuation of certain key Ibors and the development of near risk-free benchmark rates, as well as the transition of legacy Ibor contracts to near risk free benchmark rates, which exposes HSBC to material execution risks, and increases some financial and non-financial risks; and price competition in the market segments we serve;
•changes in government policy and regulation, including the monetary, interest rate and other policies of central banks and other regulatory authorities in the principal markets in which we operate and the consequences thereof (including, without limitation, actions taken as a result of the Covid-19 pandemic); initiatives to change the size, scope of activities and interconnectedness of financial institutions in connection with the implementation of stricter regulation of financial institutions in key markets worldwide; revised capital and liquidity benchmarks, which could serve to deleverage bank balance sheets and lower returns available from the current business model and portfolio mix; changes to tax laws and tax rates applicable to HSBC, including the imposition of levies or taxes designed to change business mix and risk appetite; the practices, pricing or responsibilities of financial institutions serving their consumer markets; expropriation, nationalisation, confiscation of assets and changes in legislation relating to foreign ownership; the UK’s relationship with the EU following the UK’s withdrawal from the EU, which may continue to be characterised by uncertainty, particularly with respect to the regulation of financial services, despite the signing of the Trade and Cooperation Agreement between the UK and the EU; passage of the Hong Kong national security law and restrictions on telecommunications, as well as the US Hong Kong Autonomy Act, which have caused tensions between China, the US and the UK; general changes in government policy that may significantly influence investor decisions; the costs, effects and outcomes of regulatory reviews, actions or litigation, including any additional compliance requirements; and the effects of competition in the markets where we operate including increased competition from non-bank financial services companies; and
•factors specific to HSBC, including our success in adequately identifying the risks we face, such as the incidence of loan losses or delinquency, and managing those risks (through account management, hedging and other techniques); our ability to achieve our financial, investment, capital and ESG targets, commitments and ambitions (including with respect to the commitments set forth in our thermal coal phase-out policy and our targets to reduce our on-balance sheet financed emissions in the oil and gas and power and utilities sectors), which may result in our failure to achieve any of the expected benefits of our strategic priorities; model limitations or failure, including, without limitation, the impact that the
consequences of the Covid-19 pandemic have had on the performance and usage of financial models, which may require us to hold additional capital, incur losses and/or use compensating controls, such as judgemental post model adjustments, to address model limitations; changes to the judgements, estimates and assumptions we base our financial statements on; changes in our ability to meet the requirements of regulatory stress tests; a reduction in the credit ratings assigned to us or any of our subsidiaries, which could increase the cost or decrease the availability of our funding and affect our liquidity position and net interest margin; changes to the reliability and security of our data management, data privacy, information and technology infrastructure, including threats from cyber-attacks, which may impact our ability to service clients and may result in financial loss, business disruption and/or loss of customer services and data; changes in insurance customer behaviour and insurance claim rates; our dependence on loan payments and dividends from subsidiaries to meet our obligations; changes in accounting standards, including the implementation of IFRS 17 ‘Insurance Contracts’, which may have a material impact on the way we prepare our financial statements and (with respect to IFRS 17) may negatively affect the profitability of HSBC’s insurance business; changes in our ability to manage third-party, fraud and reputational risks inherent in our operations; employee misconduct, which may result in regulatory sanctions and/or reputational or financial harm; changes in skill requirements, ways of working and talent shortages, which may affect our ability to recruit and retain senior management and diverse and skilled personnel; and changes in our ability to develop sustainable finance and climate-related products consistent with the evolving expectations of our regulators, and our capacity to measure the climate impact from our financing activity (including as a result of data limitations and changes in methodologies), which may affect our ability to achieve our climate ambition, our targets to reduce financed emissions in our oil and gas and power and utilities portfolio and the commitments set forth in our thermal coal phase-out policy, and increase the risk of greenwashing. Effective risk management depends on, among other things, our ability through stress testing and other techniques to prepare for events that cannot be captured by the statistical models it uses; our success in addressing operational, legal and regulatory, and litigation challenges; and other risks and uncertainties we identify in ‘Top and emerging risks’ on pages 148 to 167.
Approach to ESG reporting
The information set out in the ESG review on pages 42 to 88, taken together with other information relating to ESG issues included in this Form 20-F, aims to provide key ESG information and data relevant to our operations for the year ended 31 December 2021. The data is compiled for the financial year 1 January to 31 December 2021 unless otherwise specified. Measurement techniques and calculations are explained next to data tables where necessary. There are no significant changes from the previous reporting period in terms of scope, boundary or measurement of our reporting of ESG matters. Where relevant, rationale is provided for any restatement of information or data that has been previously published. We have also considered our obligations under the Environmental, Social and Governance Reporting Guide contained in Appendix 27 to The Rules Governing the Listing of Securities on the Stock Exchange of Hong Kong Limited (‘ESG Guide’) and under LR9.8.6R(8) of the Financial Conduct Authority’s (‘FCA’) Listing Rules. We will continue to develop and refine our reporting and disclosures on ESG matters in line with feedback received from our investors and other stakeholders, and in view of our obligations under the ESG Guide and the FCA’s Listing Rules.
ESG Guide
We comply with the ‘comply or explain’ provisions in the ESG Guide, save for certain items, which we describe in more detail below:
•A1(b) on relevant laws/regulations relating to air and greenhouse gas emissions, discharges into water and land, and generation of hazardous and non-hazardous waste: Taking into account the nature of our business, we do not believe that there are relevant laws and regulations in these areas that have significant impacts on HSBC.
•A1.3 on total hazardous waste produced, A1.4 on total non-hazardous waste produced: Taking into account the nature of our business, we do not consider hazardous waste to be a material issue for our stakeholders. As such, we report only on total waste produced, which includes hazardous and non-hazardous waste.
•A1.6 on handling hazardous and non-hazardous waste: Taking into account the nature of our business, we do not consider this to be a material issue for our stakeholders. Notwithstanding this, we continue to focus on the reduction and recycling of all waste. Building on the success of our previous operational environmental strategy, we are identifying key opportunities where we can lessen our wider environmental impact, including waste management. For further details, please see our ESG review on page 51.
•A2.4 on sourcing water issue: Taking into account the nature of our business, we do not consider this to be a material issue for our stakeholders. Notwithstanding this, we have implemented measures to further reduce water consumption through the installation of flow restrictors, auto-taps and low or zero flush sanitary fittings and continue to track our water consumption.
•A2.5 on packaging material, B2.2 on lost days due to work injury, B6(b) on issues related to health and safety and labelling relating to products and services provided, B6.1 on percentage of total products sold or shipped subject to recalls for safety and health reasons and B6.4 in recall procedures: Taking into account the nature of our business, we do not consider these to be material issues for our stakeholders.
This is aligned with the materiality reporting principle that is set out in the ESG Guide. See ‘How we decide what to measure’ on page 44 for further information on how we determine what matters are material to our stakeholders.
TCFD recommendations and recommended disclosures
As noted on page 19, we have considered our ‘comply or explain’ obligation under the FCA’s Listing Rules, and confirm that we have made disclosures consistent with the TCFD Recommendations and Recommended Disclosures in this Annual Report and Accounts 2021 save for certain items, which we describe below:
Targets setting
Metrics and targets (c) relating to short-term targets: Given that climate scenarios are mainly focused on medium- to long-term horizons, rather than short term, we have set interim 2030 targets for on-balance sheet financed emissions for the oil and gas, and power and utilities sectors. HSBC intends to review the financed emissions baseline and targets annually, where relevant, to help ensure that they are aligned with market practice and current climate science.
Impacts on financial planning and performance
Strategy (b) relating to financial planning and performance: We do not currently fully disclose the impacts of climate-related issues on financial planning, how these serve as an input to the financial planning process, the impact of climate-related issues on our financial performance (for example, revenues and costs) and financial position (for example, assets and liabilities), in each case due to transitional challenges including data and system limitations.
Metrics and targets (a) relating to internal carbon prices and climate-related opportunities metrics: We do not currently fully disclose the proportion of revenue or proportion of assets, or other business activities aligned with climate-related opportunities, including revenue from products and services, forward-looking metrics consistent with our business or strategic planning time horizons, or internal carbon prices, in each case due to transitional challenges including data and system limitations.
We expect the data and system limitations related to financial planning and performance, internal carbon prices and climate-related opportunities metrics to be addressed in the medium term as more reliable data becomes available and technology solutions are implemented.
Impacts of transition and physical risk
Strategy (c) relating to quantitative scenario analysis: We do not currently fully disclose the impacts of transition and physical risk quantitatively, due to transitional challenges including data limitations and evolving science and methodologies.
Metrics and targets (a) relating to detailed climate-related risk exposure metrics for retail and wholesale: We do not fully disclose metrics used to assess the impact of climate-related risks on retail lending, parts of wholesale lending and other financial intermediary business activities (specifically credit exposure, equity and debt holdings, or trading positions, each broken down by industry, geography, credit quality, average tenor). This is due to transitional challenges including data limitations.
Metrics and targets (c) on targets related to physical risk: We do not currently disclose targets used to measure and manage physical risk. This is due to transitional challenges including data limitations.
We expect the data limitations related to quantitative scenario analysis, specific risk metrics and physical risk targets to be addressed in the medium term as more reliable data becomes available and technology solutions are implemented.
Scope 3 emissions disclosure
Metrics and targets (b) relating to scope 3 emissions metrics: We currently disclose partial scope 3 greenhouse gas emissions including business travel and financed emissions. In relation to financed emissions, we are disclosing scope 3 greenhouse gas emissions for the oil and gas, and the power and utilities sectors. Future disclosure on scope 3 financed emissions (customers) and supply chain emissions (suppliers), and related risks is reliant on both our customers and suppliers publicly disclosing their carbon emissions and related risks. We aim to disclose financed emissions for additional sectors by 2023.
Our approach to disclosure of financed emissions for additional sectors can be found on: www.hsbc.com/who-we-are/esg-and-responsible-business/esg-reporting-centre.
Other matters
Strategy (b) relating to acquisitions/divestments and access to capital: We have considered the impact of climate-related issues on our businesses, strategy, and financial planning, but not specifically in relation to acquisitions/divestments or access to capital. Due to transitional challenges such as process limitations, we do not disclose the climate-related impact in these areas. We will aim to further enhance our processes in relation to acquisitions/divestments and access to capital in the medium term.
Metrics and targets (c) relating to water usage target: We have described the targets used by the organisation to manage climate-related risks and opportunities and performance against targets. However, taking into account the nature of our business, we do not consider water usage to be a material target for our business and, therefore, we have not included a target in this year’s disclosure.
With respect to our obligations under LR9.8.6R(8) of the FCA’s Listing Rules, as part of considering what to measure and publicly report, we perform an assessment to ascertain the appropriate level of detail to be included in the climate-related financial disclosures that are set out in our Annual Report and Accounts. Our assessment takes into account factors such as the level of our exposure to climate-related risks and opportunities, the scope and objectives of our climate-related strategy, transitional challenges, and the nature, size and complexity of our business. See ‘How we decide what to measure’ on page 44 for further information.
Certain defined terms
Unless the context requires otherwise, ‘HSBC Holdings’ means HSBC Holdings plc and ‘HSBC’, the ‘Group’, ‘we’, ‘us’ and ‘our’ refer to HSBC Holdings together with its subsidiaries. Within this document the Hong Kong Special Administrative Region of the People’s Republic of China is referred to as ‘Hong Kong’. When used in the terms ‘shareholders’ equity’ and ‘total shareholders’ equity’, ‘shareholders’ means holders of HSBC Holdings ordinary shares and those preference shares and capital securities issued by HSBC Holdings classified as equity. The abbreviations ‘$m’, ‘$bn’ and ‘$tn’ represent millions, billions (thousands of millions) and trillions of US dollars, respectively.
This page is intentionally left blank
Highlights
Financial performance reflected improved global economic conditions, and we continued to make progress against our four strategic pillars.
Financial performance (vs 2020)
•Reported profit after tax up $8.6bn to $14.7bn and reported profit before tax up $10.1bn to $18.9bn. The increase was driven by a net release of expected credit losses and other credit impairment charges (‘ECL’) and a higher share of profit from our associates. Adjusted profit before tax up 79% to $21.9bn.
•All regions were profitable in 2021, notably HSBC UK Bank plc, where reported profit before tax increased by $4.5bn to $4.8bn. Our Asia operations contributed $12.2bn to reported profit before tax and all other regions reported a material recovery in profitability, reflecting favourable ECL movements.
•Reported revenue down 2% to $49.6bn, primarily reflecting the impact of lower global interest rates and a decrease in revenue in Markets and Securities Services (‘MSS’) compared with a strong comparative period. Notwithstanding these factors, we saw revenue growth in areas of strategic focus, including Wealth, in part due to favourable market impacts in life insurance manufacturing, and Global Trade and Receivables Finance (‘GTRF’). Adjusted revenue down 3% to $50.1bn.
•Net interest margin (‘NIM’) of 1.20%, down 12 basis points (‘bps’) from 2020, with stabilisation in the second half of 2021.
•Reported ECL were a net release of $0.9bn, compared with an $8.8bn charge in 2020, reflecting an improvement in economic conditions relative to 2020, and better than expected levels of credit performance. In the fourth quarter of 2021, we recognised a net ECL charge of $450m, which included an increase in allowances to reflect recent developments in China’s commercial real estate sector.
•Reported operating expenses broadly unchanged at $34.6bn. Adjusted operating expenses down 1% to $32.1bn, despite inflationary pressures, as the impact of our cost-saving initiatives and a reduction in the UK bank levy charge absorbed higher performance-related pay and continued growth in technology investment.
•Customer lending balances in 2021 up $8bn on a reported basis and $23bn on a constant currency basis, primarily driven by growth in mortgage balances, mainly in the UK and Hong Kong.
•Common equity tier 1 (‘CET1’) capital ratio of 15.8%, down 0.1 percentage points. Capital generation was more than offset by dividends, the up to $2bn share buy-back announced in October, foreign exchange movements and other deductions. Risk-weighted assets (‘RWAs’) reduced despite new Pillar 1 requirements for structural foreign exchange, reflecting actions under our transformation programme.
•The Board has approved a second interim dividend of $0.18 per share, making a total for 2021 of $0.25 per share. We also intend to initiate a further share buy-back of up to $1bn, to commence after the existing up to $2bn buy-back has concluded.
Strategic progress
•In our wealth business in Asia, we attracted net new invested assets of $36bn in 2021. We also announced acquisitions in Singapore and India to develop our wealth capabilities across the region.
•Our cost-reduction programme continues to progress with $2.2bn of cost savings recognised in 2021. Since the start of the programme in 2020, we have delivered savings of $3.3bn, with costs to achieve of $3.6bn.
•In line with our climate change resolution, we published our thermal coal phase-out policy and have set on-balance sheet financed emission targets for our oil and gas, and power and utilities sectors.
•In 2021, we continued to support our customers in the transition to net zero and a sustainable future. Since 1 January 2020, we have provided and facilitated $126.7bn towards our ambition of $750bn to $1tn by 2030.
•We continued the transformation of our US business and HSBC Bank plc, our UK non-ring-fenced bank and Europe, reducing costs and RWAs. Furthermore, we announced the exit of mass market retail in the US, and the planned sale of our retail operations in France. During 2022, we expect to recognise a pre-tax loss, excluding transaction costs, of around $2.7bn upon the classification of our France retail operations as ‘held for sale’.
Outlook
We carry good business momentum into 2022 in most areas and expect mid-single-digit lending growth over the year. However, we expect a weaker Wealth performance in Asia in the first quarter of 2022.
We expect ECL charges to normalise towards 30bps of average loans in 2022, based on current consensus economic forecasts and default experience, noting we retain $0.6bn of Covid-19-related allowances as at the end of 2021. Uncertainty remains given recent developments in China’s commercial real estate sector, while inflationary pressures persist in many of our markets.
We continue to target 2022 adjusted operating expenses in line with 2021, despite inflationary pressures, with cost to achieve spend of $3.4bn expected to generate over $2bn of cost savings in 2022. In 2023, we intend to manage growth in adjusted
operating expenses to within a range of 0% to 2%, compared with 2022 (on an IFRS 4 basis), with cost savings of at least $0.5bn from actions taken in 2022 helping to offset inflation.
We expect mid-single-digit RWA growth in 2022 through a combination of business growth, acquisitions and regulatory changes, partly offset by additional RWA savings. This growth, together with capital returns are expected to normalise our CET1 position to be within our 14% to 14.5% target operating range during 2022.
Our net interest income outlook is now significantly more positive. If policy rates were to follow the current implied market consensus, we would expect to deliver a RoTE of at least 10% for 2023, one year ahead of our previous expectations.
We continue to target dividends within our 40% to 55% dividend payout ratio range.
Key financial metrics
| | | | | | | | | | | |
| For the year ended |
| Reported results | 2021 | 2020 | 2019 |
| Reported revenue ($m) | 49,552 | | 50,429 | | 56,098 | |
| Reported profit before tax ($m) | 18,906 | | 8,777 | | 13,347 | |
| Reported profit after tax ($m) | 14,693 | | 6,099 | | 8,708 | |
| Profit attributable to the ordinary shareholders of the parent company ($m) | 12,607 | | 3,898 | | 5,969 | |
| Cost efficiency ratio (%) | 69.9 | | 68.3 | | 75.5 | |
| Net interest margin (%) | 1.20 | | 1.32 | | 1.58 | |
| Basic earnings per share ($) | 0.62 | | 0.19 | | 0.30 | |
| Diluted earnings per share ($) | 0.62 | | 0.19 | | 0.30 | |
| Dividend per ordinary share (in respect of the period) ($) | 0.25 | | 0.15 | | 0.30 | |
Dividend payout ratio (%)1 | 40.3 | | 78.9 | | 100.0 | |
| Alternative performance measures <> | | | |
| Adjusted revenue ($m) | 50,090 | | 51,770 | | 56,435 | |
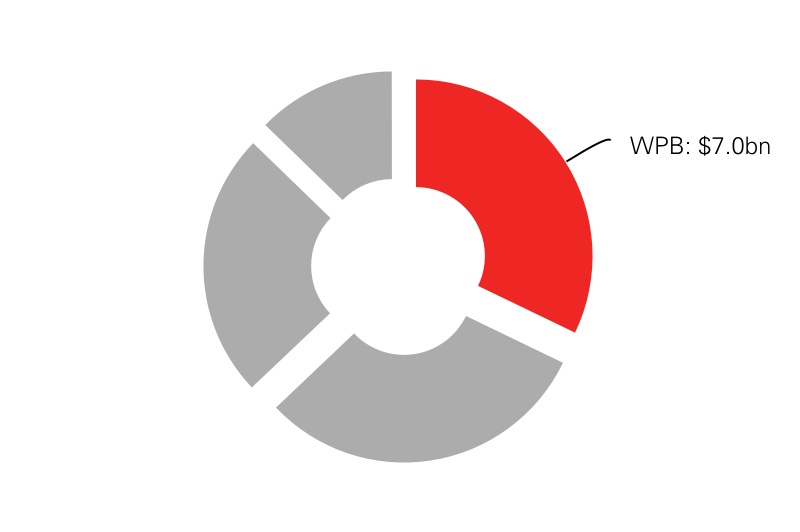
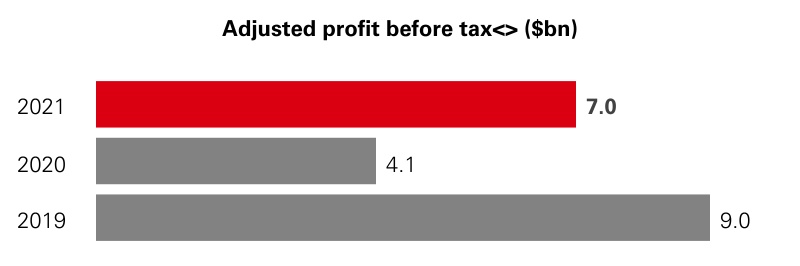
| Adjusted profit before tax ($m) | 21,916 | | 12,271 | | 22,681 | |
| | | |
| Adjusted cost efficiency ratio (%) | 64.2 | | 62.6 | | 59.5 | |
| Expected credit losses and other credit impairment charges (‘ECL’) as % of average gross loans and advances to customers (%) | (0.09) | | 0.87 | | 0.26 | |
| Return on average ordinary shareholders’ equity (%) | 7.1 | | 2.3 | | 3.6 | |
Return on average tangible equity (%)2 | 8.3 | | 3.1 | | 8.4 | |
| At 31 December |
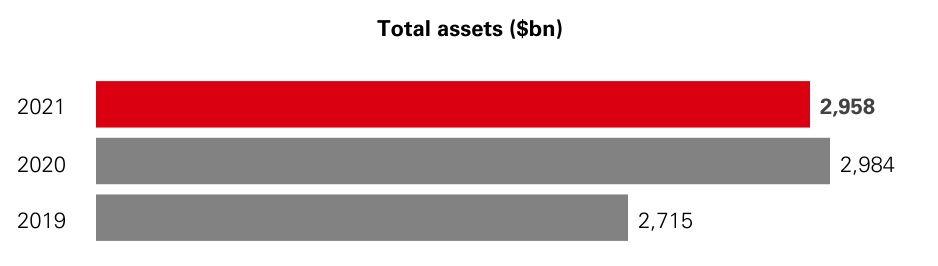
| Balance sheet | 2021 | 2020 | 2019 |
| Total assets ($m) | 2,957,939 | | 2,984,164 | | 2,715,152 | |
| Net loans and advances to customers ($m) | 1,045,814 | | 1,037,987 | | 1,036,743 | |
| Customer accounts ($m) | 1,710,574 | | 1,642,780 | | 1,439,115 | |
| Average interest-earning assets ($m) | 2,209,513 | | 2,092,900 | | 1,922,822 | |
| Loans and advances to customers as % of customer accounts (%) | 61.1 | | 63.2 | | 72.0 | |
| Total shareholders’ equity ($m) | 198,250 | | 196,443 | | 183,955 | |
| Tangible ordinary shareholders’ equity ($m) | 158,193 | | 156,423 | | 144,144 | |
| Net asset value per ordinary share at period end ($) | 8.76 | | 8.62 | | 8.00 | |
| Tangible net asset value per ordinary share at period end ($) | 7.88 | | 7.75 | | 7.13 | |
| Capital, leverage and liquidity | | | |
Common equity tier 1 capital ratio (%)3 | 15.8 | | 15.9 | | 14.7 | |
Risk-weighted assets ($m)3 | 838,263 | | 857,520 | | 843,395 | |
Total capital ratio (%)3 | 21.2 | | 21.5 | | 20.4 | |
Leverage ratio (%)3 | 5.2 | | 5.5 | | 5.3 | |
| High-quality liquid assets (liquidity value) ($bn) | 717 | | 678 | | 601 | |
| Liquidity coverage ratio (%) | 138 | | 139 | | 150 | |
| Share count | | | |
| Period end basic number of $0.50 ordinary shares outstanding (millions) | 20,073 | | 20,184 | | 20,206 | |
| Period end basic number of $0.50 ordinary shares outstanding and dilutive potential ordinary shares (millions) | 20,189 | | 20,272 | | 20,280 | |
| Average basic number of $0.50 ordinary shares outstanding (millions) | 20,197 | | 20,169 | | 20,158 | |
For reconciliations of our reported results to an adjusted basis, including lists of significant items, see page 110. Definitions and calculations of other alternative performance measures are included in our ‘Reconciliation of alternative performance measures’ on page 131.
1 Dividend per ordinary share, in respect of the period, expressed as a percentage of basic earning per share.
2 Profit attributable to ordinary shareholders, excluding impairment of goodwill and other intangible assets and changes in present value of in-force insurance contracts (‘PVIF’) (net of tax), divided by average ordinary shareholders’ equity excluding goodwill, PVIF and other intangible assets (net of deferred tax).
3 Unless otherwise stated, regulatory capital ratios and requirements are based on the transitional arrangements of the Capital Requirements Regulation in force at the time. These include the regulatory transitional arrangements for IFRS 9 ‘Financial Instruments’, which are explained further on page 231. Leverage ratios are calculated using the end point definition of capital and the IFRS 9 regulatory transitional arrangements. References to EU regulations and directives (including technical standards) should, as applicable, be read as references to the UK’s version of such regulation and/or directive, as onshored into UK law under the European Union (Withdrawal) Act 2018, and as may be subsequently amended under UK law.
Who we are
About HSBC
With assets of $3.0tn and operations in 64 countries and territories at 31 December 2021, HSBC is one of the largest banking and financial services organisations in the world. Approximately 40 million customers bank with us and we employ around 220,000 full-time equivalent staff. We have around 187,000 shareholders in 128 countries and territories.
Our values
Our values help define who we are as an organisation, and are key to our long-term success.
We value difference
Seeking out different perspectives
We succeed together
Collaborating across boundaries
We take responsibility
Holding ourselves accountable and taking the long view
We get it done
Moving at pace and making things happen
> For further details on our strategy and purpose, see pages 12 and 15.
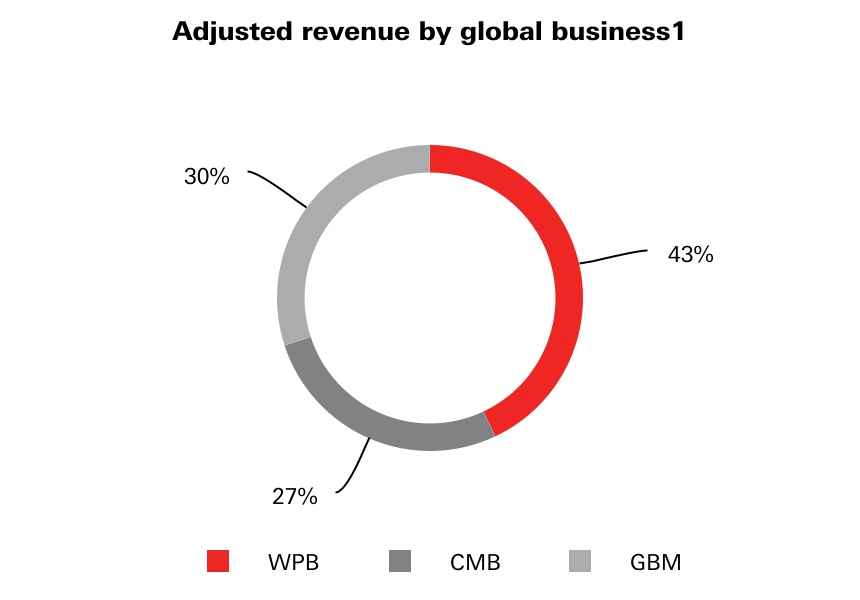
Our global businesses
We serve our customers through three global businesses. On pages 30 to 36 we provide an overview of our performance in 2021 for each of our global businesses, as well as our Corporate Centre. In each of our global businesses, we focus on delivering growth in areas where we have distinctive capabilities and have significant opportunities.
Each of the chief executive officers of our global businesses reports to our Group Chief Executive, who in turn reports to the Board of HSBC Holdings plc.
> For further information on how we are governed, see our corporate governance report on page 253.
Wealth and Personal Banking (’WPB’)
We help millions of our customers look after their day-to-day finances and manage, protect and grow their wealth.
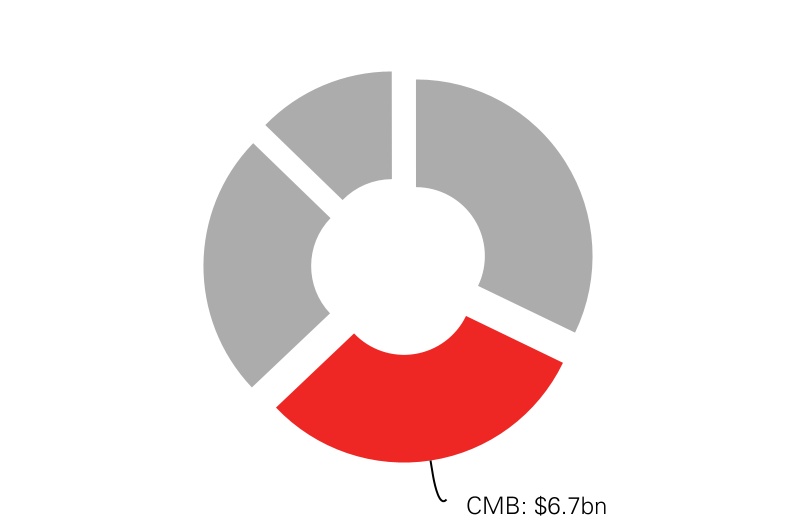
Commercial Banking (‘CMB’)
Our global reach and expertise help domestic and international businesses around the world unlock their potential.
Global Banking and Markets (’GBM’)
We provide a comprehensive range of financial services and products to corporates, governments and institutions.
1 Calculation is based on adjusted revenue of our global businesses excluding Corporate Centre, which is also excluded from the total adjusted revenue number. Corporate Centre had negative adjusted revenue of $437m in 2021.
Our global functions
Our business is supported by a number of corporate functions and our Digital Business Services teams. The global functions include Corporate Governance and Secretariat, Communications and Brand, Finance, Human Resources, Internal Audit, Legal, Risk and Compliance, Sustainability and Strategy. Digital Business Services provides real estate, procurement, technology and operational services to the business.
Our global reach
We aim to create long-term value for our shareholders and capture opportunity. One of our goals is to lead in wealth, with a particular focus on Asia and the Middle East. Taking advantage of our international network, we aspire to lead in cross-border banking flows, and to serve mid-market corporates globally. We continue to maintain a strong capital, funding and liquidity position with a diversified business model.
Value of customer accounts by geography
North America 10%
Latin America 2%
Rest of Europe 8%
UK 31%
Middle East and North Africa 2%
Rest of Asia 11%
Hong Kong 33%
Mainland China 3%
See page 99 for further information on our customers and approach to geographical information.
Engaging with our stakeholders
Customers
Employees
Investors
Communities
Regulators and governments
Suppliers
Building strong relationships with our stakeholders helps enable us to deliver our strategy in line with our long-term values, and operate the business in a sustainable way. Our stakeholders are the people who work for us, bank with us, own us, regulate us, and live in the societies we serve and the planet we all inhabit. These human connections are complex and overlap. Many of our employees are customers and shareholders, while our business customers are often suppliers. We aim to serve, creating value for our customers and shareholders. Our size and global reach mean our actions can have a significant impact. We are committed to doing business responsibly, and thinking for the long term. This is key to delivering our strategy.
Multi-award winning
We have won industry awards around the world for a variety of reasons – ranging from the quality of the service we provide to customers, to our efforts to support diversity and inclusion in the workplace.
Euromoney Awards for Excellence 2021
Best Bank for Sustainable Finance in Asia
Best Bank for Sustainable Finance in the Middle East
Best Bank for Transaction Services in Asia
Best Bank for Transaction Services in the Middle East
Western Europe’s Best Bank for SMEs
Euromoney Trade Finance Survey 2021
Number 1 Trade Finance Bank in the UK
The Banker, Transaction Banking Awards 2021
Transaction Bank of the Year for Asia-Pacific
Transaction Bank of the Year for Middle East
Asiamoney Global RMB Poll 2021
Best overall bank for global, onshore and offshore RMB products and services
Asian Private Banker Awards for Distinction 2021
Best Private Bank – Asia Pacific
Best Private Bank – Wealth Continuum
Payments Awards 2021
B2B Payments Innovation of the Year
Group Chairman’s statement
The progress we made in 2021 means that HSBC is well placed to open up a world of opportunity for our customers as economic recovery continues.
2021 was another challenging year. While Covid-19 vaccines were rolled out globally, some countries dealt with very significant outbreaks and many more operated under various restrictions at different points. As in 2020, this took a huge toll on our customers, our people, the communities we serve and our shareholders.
My colleagues once again demonstrated their resilience, their professionalism and, above all, their exceptional commitment to serving our customers. Our purpose as an organisation is to open up a world of opportunity. Our people have brought this to life in the way they have supported our customers and each other. On behalf of the Board, I would like to thank them warmly for everything they have done, and continue to do.
ESG was another major theme of 2021. The pandemic has exposed the fragility of the planet and society as a whole. It has also created a catalyst for change and highlighted the associated commercial opportunities. Businesses, governments, regulators and investors all continued along their ESG journeys in 2021, as public awareness grew and activism around climate change in particular increased. HSBC has long understood that good ESG performance goes hand-in-hand with good financial performance, and it is now abundantly clear that the action businesses take on sustainability is an important lens through which they are being viewed and assessed by their stakeholders.
Progress
HSBC delivered a good financial performance in 2021. Reported profit before tax was $18.9bn, an increase of $10.1bn as compared with 2020, while adjusted profit before tax was $21.9bn, up 79%. All of our regions were profitable in 2021, supported by the global economic recovery, demonstrating the value of our global network. There was also good growth in focus areas such as Asia wealth and trade. In line with the dividend policy announced in February 2021, the Board approved a second interim dividend for 2021 of $0.18, meaning the full year dividends for 2021 are $0.25.
Good progress has been made in executing our strategic plan. A number of key milestones were reached in 2021 – including resolving the future of our retail businesses in France and the US, the organic build-out of HSBC Personal Wealth Planning in mainland China, and acquisitions in Singapore and India to accelerate the development of our wealth capabilities across Asia. At the same time, our work to digitise HSBC and to play a leading role in the net zero transition has continued at pace. There is more to do – and it will be important to see successive consecutive quarters of growth – but good momentum exists across our businesses.
Board of Directors
Due to ongoing travel restrictions and safety concerns, the Board has not been able to meet in person for two years. We look forward to reconnecting with each other and welcoming those Board members we are yet to meet in person. At the same time, we have come to appreciate the benefits of this new way of working – which include more regular dialogue, less travel and reduced costs – and we will therefore use a hybrid model going forward.
“HSBC has long understood that good ESG performance goes hand-in-hand with good financial performance.”
We were pleased to hold our first hybrid AGM in May 2021, which the majority of shareholders attended virtually. It is a matter of deep regret to me, and to the Board as a whole, that we have been unable to meet our loyal Hong Kong shareholders face-to-face. We look forward to doing so again as soon as it is practicable and safe. In the meantime, a hybrid meeting does at least allow for constructive engagement and discussions with shareholders, which we continue to value highly.
At the 2021 AGM, Laura Cha, Henri de Castries and Heidi Miller all retired from the Board. We also recently announced that Irene Lee and Pauline van der Meer Mohr will step down from the Board at the conclusion of our 2022 AGM in April. I am enormously grateful to them all for their important and valuable contributions to the Board, the committees and the subsidiary entities on which they have served. We welcomed Dame Carolyn Fairbairn and Rachel Duan to the Board on 1 September. Both Carolyn and Rachel bring a wealth of skills and expertise that will be of great value to the Board’s discussions.
External environment
The roll-out of vaccines around the world and a robust global economic recovery mean we entered 2022 in a better state than we might have expected a year ago. There are clearly still significant challenges ahead, foremost among which is the uncertainty caused by the spread of the Omicron variant, and potentially other variants in the future. Supply chain bottlenecks, high energy and food prices, surging consumer demand and higher wages have combined to drive up inflation. Central banks have already begun to respond by tightening monetary policy and this is likely to continue in 2022.
Global economic growth forecasts are fairly resilient – our own forecast is 4.1% global GDP growth in 2022. However, there remains a great deal of uncertainty given the wide range of responses from governments to the different challenges they face.
After China’s strong recovery, growth slowed in the second half of 2021. As a result, we expect China’s government to take action to ease monetary and fiscal policies, with the aim of shoring up growth. Meanwhile, India’s economy is set to grow rapidly, but growth is expected to be slower in the UK and the US.
Global trade performed well in 2021, with volumes rising above pre-pandemic levels despite ongoing supply chain disruptions. Looking forward, trade growth could be further boosted by the lifting of restrictions on movement that remain in place in some countries. There are also signs that supply chain bottlenecks will ease as the year goes on, although when and how remains uncertain. The Regional Comprehensive Economic Partnership is expected to reinforce Asia’s central role in global trade. Along with the bilateral trade deals being struck by some countries, it also shows that trade liberalisation continues to advance in some parts of the world.
Although there is currently no long-term agreement between the UK and the EU on access to financial services, we have worked for a number of years to ensure we will be able to maintain a full service for our clients under all potential scenarios. Ideally, the temporary arrangements on access to financial services will be retained so as to minimise disruption and enable the UK financial services industry to continue to offer the many benefits it brings to the UK and EU economies. However, we are well prepared for a broad range of outcomes.
As a global bank operating in more than 60 countries and territories, with a history stretching back more than 156 years, we always have experienced – and always will experience – geopolitical tensions. However, we remain alive to the potential impact that geopolitics can have on our business, as well as on our clients. The relationship between the US and China remains a prominent feature of the external environment, but we do not currently expect it to change significantly in the near future. We also expect the mutual economic benefits brought by the UK-China relationship to outweigh any short-term pressures. We continue to engage with all governments and remain focused on serving the needs of our customers in both East and West, and the many points in between.
Stakeholder engagement
Our purpose of opening up a world of opportunity is equally applicable to our different stakeholders. For our people, it can mean helping them to develop new skills and advance in their careers, as well as being diverse and inclusive. For our shareholders, it can mean creating sustainable returns and value. For our suppliers, it can mean supporting them to grow their businesses and strengthen their own supply chains. And for the communities we serve, it can mean being a responsible citizen and leading the net zero transition.
Stakeholder engagement has been a priority for the Board in 2021. For example, the Board oversaw HSBC’s continuing work in support of our ambition to align our financed emissions to net zero by 2050 or sooner. This included engaging shareholders and leading NGOs ahead of the 2021 AGM, when our special resolution on the next steps in relation to our climate ambition was overwhelmingly approved. We also reviewed and approved a new thermal coal phase-out policy, which we announced in December 2021 and is designed to allow HSBC to help facilitate the transition to net zero in both developed and developing markets.
Thank you
Finally, I would like to reiterate how grateful I am to all my colleagues for the great dedication and care they have shown to our customers and to each other over the past year. Their tremendous efforts have, above everything else, made us what we are today – and will shape what we become tomorrow.
Mark E Tucker
Group Chairman
22 February 2022
Group Chief Executive’s review
We are making good progress transforming and growing HSBC, which is helping us to open up a world of opportunity for our customers, our colleagues and our shareholders.
A year ago, we refreshed our core purpose as an organisation. ‘Opening up a world of opportunity’ was the outcome of extensive consultation with colleagues and customers around the globe. I have been delighted by the way it has been embraced across HSBC – and in the many conversations I have had with colleagues, I have been greatly encouraged by how they see their roles contributing towards it.
Opening up a world of opportunity draws heavily on HSBC’s past, but it also encapsulates what we need to focus on to succeed now and in the future. Opportunities have always come in many shapes and forms, some of which have required us to change and evolve to make the most of them. We need to keep challenging ourselves to find and capture these opportunities. This is how we will help our customers to grow and succeed over the long term.
As we do so, we will be guided by the values underpinning our purpose – we value difference, we succeed together, we take responsibility and we get it done. These are the behaviours that will help us to identify and unlock new opportunities – and together they represent the kind of organisation we want HSBC to be.
With our purpose and values firmly in mind, we made good progress in 2021 against all four of our strategic pillars: focus on our strengths, digitise at scale, energise for growth and transition to net zero. Delivering against them contributed to a strong financial performance, which was supported by the global economic recovery. All of our regions were profitable and we have built a strong platform for future growth.
For some of our customers, the first priority has remained navigating the ongoing impact of Covid-19, particularly in markets that suffered severe outbreaks or faced restrictions during the course of 2021. To this end, I must again offer my deep thanks to my colleagues, who have exemplified our values in supporting our customers and each other, all the while continuing to deal with the pandemic themselves.
As economies recovered and opened up, we have helped more and more of our customers to look beyond the immediate horizon and towards the opportunities we can open up for them. In 2021, we helped almost 269,000 personal customers to buy their first homes. We lent $47bn to help our business banking customers to run, grow and digitise their businesses. We launched new products and services that make it easier for our customers to bank with us, and allow us to focus our efforts on serving them. We facilitated $799bn of trade, which has helped businesses and economies around the world to recover and grow again.
As our people also began to look to the future, we created opportunities for them too. We helped more than 30,000 colleagues move into new roles in 2021, and over 115,000 colleagues to develop future-ready skills through our learning programmes. An increasing number of these programmes focused on building skills and capabilities in areas like data and sustainability, which are essential to our future.
“The opportunities of the future will be defined by the single greatest challenge
of our time – the need for everyone to make the low-carbon transition.“
More than anything else, the opportunities of the future will be defined by the single greatest challenge of our time – the need for everyone to make the low-carbon transition. To seize them, we must change, adapt, invest and innovate. Since 2019, we have reduced greenhouse gas emissions across our operations by more than half. We also provided and facilitated $82.6bn of sustainable finance and investment – bringing the cumulative total since 1 January 2020 to $126.7bn, towards our ambition of $750bn to $1tn by 2030. Furthermore, we have collaborated with other banks and financial institutions to help accelerate the transition through initiatives including the Net-Zero Banking Alliance, the Glasgow Financial Alliance for Net Zero and the Sustainable Markets Initiative’s Financial Services Taskforce.
Financial performance
The global economic recovery supported our 2021 financial performance, as the release of expected credit losses resulted in an improvement in the profitability of the Group and all global businesses. Our interest-rate sensitive business lines continued to be adversely impacted by low interest rates, but our net interest margin remained broadly stable during 2021 and the outlook is now significantly more positive. After absorbing the impact of low interest rates for some time, we believe we have turned the corner on revenue. We have also seen good fee income growth, good growth in mortgage balances and our lending pipelines across both retail and wholesale remain strong. Our insurance business also continues to perform well, notably in Asia where we have seen strong growth in value of new business, despite the border between Hong Kong and mainland China remaining closed.
As a consequence, the Group delivered $18.9bn of reported profit before tax, up $10.1bn on the prior year, and $21.9bn of adjusted profits, up 79%. We were profitable in every region, with Asia leading the way and material increases in profits in the UK, continental Europe, the US and the Middle East.
Adjusted revenue was down 3%, due mainly to the impact of interest rate cuts. However, trade balances grew by 23% overall, while loans and advances increased by $23bn for the year.
Our cost reduction programmes were able to absorb increased technology investment and higher performance-related pay, with adjusted operating expenses down by 1%. Return on tangible equity was 8.3%. If rates follow the path currently implied by the market, we would expect to reach a return on tangible equity of at least 10% for 2023, one year ahead of our previous expectations.
In the fourth quarter of 2021, we took a charge on expected credit losses, due to changing market conditions in the mainland China commercial real estate sector. Since the year end, there has been some positive sentiment as a consequence of new policy actions. They will take time to impact the market and we will continue to support our clients, with whom we have good and long-standing relationships.
Our funding, liquidity and capital all remain strong. We grew deposits by $90bn on a constant currency basis, with growth in all three global businesses. Our common equity tier 1 ratio was 15.8%. As a consequence, we are able to announce a second interim dividend of $0.18, bringing the full-year dividends for 2021 to $0.25 per ordinary share. This is within our target payout ratio, and our aim is for a sustainable dividend in 2022.
Strategic progress
In 2021, we made good progress against our strategic pillars.
We brought in
$36.2bn
of net new invested assets in Asia Wealth.
We provided and facilitated
$82.6bn
of sustainable finance and investment.
Our strong capital position and confidence in the business enabled us to announce a share buy-back of up to $2bn in October 2021. We also intend to initiate a further share buy-back of up to $1bn, to commence after the existing buy-back of up to $2bn has concluded.
We are also helping to create sustainable returns for shareholders by driving underlying growth across the business. We have much more to do, but I am encouraged by what we have achieved so far.
Focus on our strengths
We have made good progress restructuring our portfolio of businesses, with the aim of investing in those areas in which we are strongest and withdrawing from those areas in which we lack the necessary scale to compete.
Over the last two years, we reduced gross risk-weighted assets by a cumulative $104bn, against our original three-year target of $110bn. Given this progress, we now expect to exceed this target by the end of 2022. In Global Banking and Markets, adjusted risk-weighted assets were 10% lower in 2021, as we moved capital and resources mainly into Asia and the Middle East. The extensive work undertaken to transform this business since 2019 was also designed to mitigate the impact of Basel III reforms.
We reached two key milestones for our transformation as we took steps to resolve the future of our businesses in the US and continental Europe. In the US, we entered into an agreement to sell our mass market retail business, which has now been completed on schedule. We also entered into an agreement to sell our retail banking activities in France, which we expect to complete in 2023. Both deals will help our US and continental Europe businesses to become more focused, better aligned to the Group and the international needs of our wholesale and wealth management customers.
In Asia, we continued to enhance our wealth proposition, including through the launch of HSBC Greater Bay Area Connect and more than 30 new asset management products across the region. In December, we received regulatory approval to acquire the remaining 50% stake in HSBC Life China, our joint venture insurance company in mainland China. All of this is enabling us to significantly expand our capabilities to serve the growing wealth and insurance needs of our customers in China, particularly in the Greater Bay Area.
We accelerated the development of our wealth capabilities across the rest of Asia by several years through two acquisitions. We entered into an agreement to buy AXA Singapore, which was completed earlier this month and will expand our insurance and wealth franchise in our ASEAN regional hub. We also agreed to buy L&T Investment Management to strengthen our asset management business in India. Both deals represent significant steps towards our ambition of being a leading wealth manager in Asia.
The overall investment we have made in Asia wealth was evidenced by strong customer acquisition, and significantly increased assets and balances, year-on-year. Net new invested assets in Asia wealth were $36.2bn, which was more than double the previous year.
In Commercial Banking, we grew our lending by $11bn and our international account opening increased by 13% in 2021, while trade balances grew by 30% and are now above pre-pandemic levels.
Digitise at scale
We invested $6bn in technology in 2021, as we continued to drive change in the way we approach technology across the organisation and ultimately improve the customer experience.
Around 97% of transactions are now fully automated. For example, automated credit and lending systems processed around $15bn of personal loans in 2021. Our use of the Cloud increased to cover 27% of technology services, giving us more processing power and speed, while we also increased our use of Agile across technology roles.
Almost half of our retail customers are now active on mobile, and we have developed new products and improved existing ones so we can better meet their needs. Our revamped mobile app is now available across 24 markets and Global Money was extended to more markets, allowing more of our international retail customers to hold, manage and send funds in various currencies. Corporate customers carried out over 9 million payments through the HSBCnet app – an increase of 58% year-on-year. HSBC Kinetic – our award-winning mobile banking app for business customers in the UK – has acquired more than 24,000 customers since it was launched.
Energise for growth
We have taken further steps to create a dynamic and inclusive culture, which helps us to attract and retain the best people.
After listening to our people, we introduced a hybrid working model, wherever appropriate, which allows us to strike the right balance between office-based work and home-based work. We have also taken the opportunity during Covid-19 to reconfigure much of our head office workspace to better facilitate team-based Agile working methods. We are still learning about what works, but we believe that trusting our colleagues to find the right balance is integral to building the culture we aspire to at HSBC. As a consequence of hybrid working, we will need less office space. In 2021, we reduced our global office footprint by more than 3.4 million square feet – equivalent to 18%.
We were pleased to exceed our target for 30% women in leadership roles globally in 2020, and we set a new target of 35% by 2025. HSBC was named in the Bloomberg Gender-Equality Index last month, with our overall score increasing by 21 percentage points in 2021 and outperforming the financial services average by 15 percentage points. We also continued to work to improve ethnicity representation, especially for Black colleagues. However, we still have a way to go to get to where we want, and need, to be on both measures.
”We were profitable in every region, with Asia leading the way and material increases in profits in the UK, continental Europe, the US and the Middle East.”
In our most recent colleague survey, our employee engagement index was 72%, which is unchanged on 2020 and 4 percentage points above the average for the financial services sector.
Transition to net zero
The industrial landscape of the world is being transformed by the transition to net zero. I am determined that HSBC will play a leading role in driving this change.
At the 2021 AGM, 99.7% of shareholders backed our special resolution on climate change, providing a strong endorsement of our climate plan and our commitment to support our customers on their transitions to a low-carbon future. However, we do not take this support for granted, and we have taken a number of further steps to maintain our leadership role.
In September, we partnered with Temasek, subject to regulatory approval, to launch a new debt financing fund for sustainable infrastructure in south-east Asia, with $150m of seed capital and the ambition to deploy $1bn of financing over five years. At the COP26 meeting in Glasgow, HSBC was one of over 100 public and private organisations behind the launch of FAST-Infra, a labelling system that aims to increase investor confidence in the sustainability credentials of projects in emerging markets. We are also supporting the Energy Transition Mechanism, a public-private partnership led by the Asian Development Bank that aims for the materially earlier retirement of coal assets without hindering growth. HSBC was presented with the Terra Carta seal by HRH the Prince of Wales in recognition of the work that we are doing to create truly sustainable markets.
After also joining the Powering Past Coal Alliance, we published a new thermal coal policy to phase out the financing of coal-fired power and thermal coal mining in EU and OECD markets by 2030, and globally by 2040. This fulfilled the commitment approved by our shareholders and followed a period of extensive engagement with our stakeholders. It has two clear objectives: to drive thermal coal phase-out within the timeframe required to reach net zero by 2050; and to help enable the energy transition in developing economies.
We are committed to working with our clients to develop valid, science-based transition plans to understand – sector-by-sector and client-by-client – how we will move to net zero by 2050. These transition plans and the targets within them must be predicated on the science relevant to the individual sectors. We will use them as a basis for further engagement and decision making, including how we drive change within our portfolios. As part of this process, we have disclosed interim targets for on-balance sheet financed emissions in the oil and gas, and power and utilities sectors. In the year ahead, we plan to set interim targets for financed emissions across a range of other sectors. We will also work on our climate transition plan, which will be published in 2023 and will bring together in one place how we will embed our net zero targets into our strategy, processes, policies and governance.
2022
We have good momentum coming into 2022 and are confident that we can continue to execute against our strategy. We also remain cognisant of the potential impact that further Covid-19-related uncertainty and continued inflation might have on us and our clients.
Throughout HSBC’s history, our people have always demonstrated great professionalism and commitment to those we serve, and that is as evident today as it has ever been. Despite the personal and professional challenges they continue to face after two years of living with the pandemic, I am proud of my colleagues, and the sense of duty and care they continue to show towards our customers and each other. Our success – now and in the future – is testament to them and all they continue to do for our bank.
Noel Quinn
Group Chief Executive
22 February 2022
Our strategy
We are implementing our strategy across the four strategic pillars aligned to our purpose, values and ambition announced in February 2021.
Progress on our commitments in 2021
In 2021, we made good progress on our strategy across all of our global businesses.
In Wealth and Personal Banking, we had strong wealth revenue momentum and augmented our fee generating portfolios with acquisitions in asset management and insurance to build further scale. In Commercial Banking, we saw strong growth in fee income, and momentum in trade volumes. In Global Banking and Markets, we had strong countercyclical revenue even as we exceeded our expectations on RWA rundowns and client exits. To support our global businesses, we also continued to invest in technology, develop our talent and culture, and play a role in the transition to a global net zero economy.
Our efforts to date are paving the way for us to accelerate execution of the growth opportunities across our businesses and international network and, in turn, to help meet our targets and ambitions.
Shifting capital to areas with the highest returns and growth
In line with our strategy, we set out aspirations in February 2021 to accelerate the shift of capital and resources to areas that have demonstrated the highest returns and where we are strongest, principally in Asia, with a pivot to fee income generating businesses such as wealth. We saw strong progress across all parameters in 2021. While the proportion of fee and insurance income increased relative to 2020, reflecting fee and insurance revenue growth, this metric was also favourably impacted by lower net interest income due to 2020 interest rate reductions, as well as favourable market impacts in life insurance manufacturing.
Capital allocation and revenue concentration
Asia
(as a % of Group tangible equity)1
Wealth and Personal Banking
(as a % of Group tangible equity)2
Adjusted fees and insurance revenue
(as a % of total adjusted revenue)
1 Based on tangible equity of the Group’s major legal entities excluding associates, holding companies, and consolidation adjustments.
2 WPB tangible equity as a share of tangible equity allocated to the global businesses (excluding Corporate Centre). Excludes holding companies, and consolidation adjustments.
Progress against Group targets
Adjusted operating expenses in 2021 <>
$32.1bn
Updated target: 2022 adjusted operating expenses in line with 2021. Previous target: ≤$31bn in 2022 (at December 2020 foreign exchange rates).
Gross RWA reduction1
$104bn
Since the start of the programme. Updated target: >$110bn by end of 2022.
CET1 ratio in 2021
15.8%
Target: >14%, managing in the range of 14% to 14.5% in the medium term; and manage range down further long term.
Dividend payout ratio2
40.3%
Target: sustainable cash dividends with a payout ratio of 40% to 55% from 2022 onwards.
RoTE3 in 2021 <>
8.3%
Target: ≥10% over the medium term.
For our financial targets, we define medium term as three to four years and long term as five to six years, commencing 1 January 2020. Further explanation of performance against Group financial targets may be found on page 26.
1 Given progress to date, we now expect to exceed our $110bn reduction target by the end of 2022.
2 In line with our dividend policy, we retain the flexibility to adjust earnings per ordinary share (‘EPS’) for non-cash significant items. In 2022, we intend to adjust EPS to exclude the forecast loss on the sale of our retail banking operations in France.
3 If policy rates were to follow the current implied market consensus, we would expect to deliver a return on average tangible equity (‘RoTE’) of at least 10% for 2023.
Our strategy
Our strategy centres around four key areas: focus on our areas of strengths, digitise at scale to adapt our operating model for the future, energise our organisation for growth, and support the transition to a net zero global economy.
Focus on our strengths
In our global businesses
In each of our global businesses, we continue to focus on areas where we are strongest and have opportunities to grow.
Wealth and Personal Banking
In Wealth and Personal Banking, we have continued to make progress in the execution of our wealth, asset management and insurance strategy, notably in Asia. We grew our net new invested assets from $53bn in 2020 to $64bn, with $36bn coming from Asia, where we saw an increase of 138%. This contributed to a 5% increase in Wealth and Personal Banking wealth balances to $1.67tn, including 5% growth in Asset Management’s funds under management to $630bn. In Asia, Wealth and Personal Banking wealth revenue – which comprises wealth, insurance, private banking, and asset management – grew by 10% to $5.8bn. This included a 40% growth in value of new business in insurance to $917m. We continued to enhance our wealth product offerings in the region, including launching Greater Bay Area Wealth Management Connect, and over 30 new asset management products. Globally, Wealth and Personal Banking customer lending balances were $489bn, an increase of 6% compared with 2020, notably reflecting mortgage balance growth across all regions, but particularly in the UK and Hong Kong.
$64bn
Net new invested assets in 2021.
Commercial Banking
Our Commercial Banking business continued to grow our lending pipeline and maintain leadership in supporting cross-border trade. Customer lending volume increased 3% to $349bn in 2021, mainly from continued growth in trade and term lending. The recovery in global trade volumes was also reflected in higher fee income in Global Trade and Receivables Finance, where we saw a 9% revenue growth compared with 2020. Over the same period, fee income in the overall Commercial Banking business also grew 9%, reaching approximately $3.6bn and surpassing pre-pandemic levels in 2019. We also committed to investing in global platforms and improving SME propositions in our key markets. Since the launch of our digital business banking account Kinetic in the UK in August 2020, we have reached approximately 24,000 customers at the end of 2021.
$3.6bn
Fee income in 2021.
Global Banking and Markets
We repositioned our capital and resources in Global Banking and Markets to create capacity for growth opportunities, mainly into Asia and the Middle East, and to serve international clients that are aligned to our strategy. As part of our transformation programme, we reduced adjusted RWAs by approximately 10% to $236bn at 31 December 2021, driven by saves in our Western franchise, comprising our Europe and Americas businesses. Despite the focus on repositioning, the business performed well in 2021, with overall revenue reaching approximately $15bn, driven by strong performances in Equities, Capital Markets and Advisory and Securities Services. Collaboration with other businesses through cross-selling products remains important for us. In 2021, the business facilitated $2.5bn into Commercial Banking, an increase of 12% compared with 2020, and $1.4bn into Wealth and Personal Banking, an increase of 2%.
18%
Adjusted RWA reduction in the West in 2021.
Repositioning for higher growth
We are repositioning our portfolio to support our areas of growth.
Restructuring the US and Europe
We aim to create capacity for growth by refocusing our US business and HSBC Bank plc, our non-ring-fenced bank in Europe and the UK. In May and June respectively, we announced the exit of mass market retail in the US, and the planned sale of our retail operations in France. Our plan to exit our US mass market retail banking business was completed in February 2022, which includes approximately $8.8bn of deposits held for sale and exiting and winding down approximately 125 branches, leaving us with approximately 25 international wealth centres. The planned sale of our France retail
business includes a network (using values at 31 December 2021) of 244 retail branches, approximately 800,000 customers, $24.9bn in customer loans and $22.6bn in deposits balances.
We also made strong progress in 2021 on reducing the capital and cost base in the two franchises. During the year, adjusted RWAs decreased $7bn in the US to $78bn at 31 December 2021, while in HSBC Bank plc, they decreased by $22bn to $141bn. The respective balances at 31 December 2021 included approximately $1.3bn relating to the announced US mass market retail disposal and approximately $7bn relating to the planned disposal of our France retail business. We also lowered the adjusted cost base in these franchises by 5% compared with 2020 to $10.4bn, in spite of strong inflationary pressures in these markets.
Repositioning Asia for growth
We announced three key acquisitions in 2021 to further strengthen our wealth franchise in Asia. In August, we entered an agreement to acquire AXA Singapore for $529m, with the intention to merge the business with the operations of our existing HSBC Life Singapore franchise. The acquisition was recently completed on 11 February 2022. The combined business would be the seventh largest life insurer in Singapore, based on annualised new premiums, and the fourth largest retail health insurer, based on gross premiums, with over 600,000 policies in-force, data as of end of 2020. In December, we announced the agreement to fully acquire L&T Investment Management, the 12th largest mutual fund management company in India with assets under management of $10.8bn and over 2.4 million portfolios as of September 2021. We also received regulatory approval to acquire the remaining 50% stake in HSBC Life China, bringing our shareholder ownership to 100% upon completion.
Digitise at scale
We continue to invest in our technology and operational capabilities to drive operating productivity across businesses and geographies and to offer better client experience. In 2021, approximately $6.0bn, or 19%, of our overall adjusted operating expenses were dedicated to technology (net of saves from our transformation programme), up from approximately $5.7bn in 2020. We aspire to progressively increase the share to greater than 21% by 2025.
We have made progress on automating our organisation at scale. Our Cloud adoption rate, which is the percentage of our technology services on the private or public Cloud, increased from approximately 20% in 2020 to 27% in 2021. We are also promoting an agile workforce to help equip our colleagues for the future of work. At the end of 2021, 15% of our total technology workforce in the global businesses and functions were aligned to at least one agile team per agile blueprint. This marks a significant improvement from 5% in 2020.
Our digital engagement with customers also improved. At the end of 2021, 43% of our customers active on our mobile services had logged onto a HSBC mobile app at least once in the last 30 days, compared with 38% in 2020. Our wholesale clients executed over 9 million payments on HSBCnet’s mobile banking app, a 58% increase compared with 2020. During the same period, the percentage of Commercial Banking transactions enabled digitally for HSBCnet grew from 83% to 94% in the 18 Asian markets where HSBCnet is available for wholesale clients. Across all our trade digital channels, 84% of transactions in 2021 were initiated digitally by our customers, compared with 69% of transactions in 2020. Seeing these improvements, we endeavour to continue investing in technology that helps enhance our customers’ digital experiences.
Technology spend as % of total adjusted operating expenses
Energise for growth
In February 2021, we set out the case for a more effective, agile and empowered organisation that could execute on our ambitious journey.
In 2021, our employee engagement score, a gauge of an employee’s propensity to recommend HSBC as a great place to work, was in line with 2020 at 72%, but notably up from 67% in 2019. This represents a strong endorsement of various initiatives around our purpose and values in our organisation.
Recruiting the right talent and diversifying our workforce remain important to us. We had 31.7% of senior leadership roles held by women, which are roles classified as those at band 3 and above in our global career band structure. We are on track to meet our ambition of having more than 35% representation of women in these roles by 2025.
We continue to energise our colleagues through initiatives that help develop their future skills and learning opportunities, especially in areas including data, digital and sustainability. In 2021, the average hours of training per full-time equivalent staff (‘FTE’) increased to 26.7 hours from 23.0 hours in 2020.
We outline how we put our purpose and values into practice in the following 'How we do business' section. For further details on how we plan to energise for growth, see the Social section in the ESG review on page 66.
Transition to net zero
In November, we participated in COP26 to play our part in bringing together the public and private sector to mobilise this transition. We also made good progress on our ambitions, including setting targets for our on-balance sheet financed emissions and launching innovative climate solutions and
products to support our customers in their transition to a net zero future.
Becoming a net zero bank
We have set a climate ambition to become net zero in our operations and supply chain by 2030, and align our financed emissions to the Paris Agreement goal of net zero by 2050. In 2021, we reduced our organisation’s absolute greenhouse gas emissions in our operations to 341,000 tonnes, a decrease of 50.3% from the 2019 baseline (the data for 2019 and 2020 has been revised as we have updated our air travel reporting methodology to include the cabin class travel and the impact of radiative forces, and therefore, the percentage change from 2019 baseline is based on the revised methodology). In December, we published a policy to phase out thermal coal financing in EU and OECD markets by 2030, and globally by 2040. We have also set targets for our on-balance sheet financed emissions for the oil and gas, and power and utilities sectors. On the journey to net zero, we recognise that individual markets have their own unique circumstances that we intend to factor in when laying out our net zero approach.
Supporting customers through transition
Our ambition is to support our customers in their transition to net zero and a sustainable future. In 2021, we provided and facilitated $82.6bn of sustainable finance and investment, taking the cumulative amount to $126.7bn since 1 January 2020, as part of our $750bn to $1tn by 2030 ambition. This comprised support including facilitation of capital flow and access to capital markets for sustainability-linked outcomes, as well as financing and investments in environmental and social goals such as decarbonisation of energy systems.
Unlocking new climate solutions
Scaled innovation in critical areas such as next generation climate technologies, nature-based solutions and sustainable infrastructure will be critical to tackling climate change. In September, we launched a new debt financing fund for sustainable infrastructure in south-east Asia in partnership (subject to regulatory approval) with Temasek, with $150m of seed capital and the ambition to deploy $1bn of financing over five years. We are leading the FAST-Infra initiative, which we co-founded to establish a consistent, globally applicable labelling system to identify and evaluate sustainable infrastructure assets. We are also supporting the Energy Transition Mechanism, a public-private partnership led by the Asian Development Bank, which endeavours to accelerate the retirement of coal-fired power stations and increase demand and investments in renewable energy.
For further details on our climate ambition, see the Environmental section in the ESG review on page 45.
How we do business
We conduct our business intent on supporting the sustained success of our customers, people and other stakeholders.
Our approach
We recognise that it is important to be clear about who we are and what we stand for to create long-term value for our stakeholders. This will help us deliver our strategy and operate our business in a way that is sustainable. Following an extensive consultation with our people and customers, we refined our purpose and values. Our new purpose is ‘Opening up a world of opportunity’ and our ambition is to be the preferred international financial partner for our clients.
To achieve this in a way that is sustainable, we are guided by our values: we value difference; we succeed together; we take responsibility; and we get it done.
Our Covid-19 actions
Having a clear purpose and strong values has never been more important, with the Covid-19 pandemic testing us all in ways we could never have anticipated. Since the world changed in 2020, we adapted to new ways of working and endeavoured to provide support to our customers during this challenging period. On the following page, we have set out further ways that we continued to support our stakeholders.
Fair outcomes
Our conduct approach guides us to do the right thing and to focus on the impact we have for our customers and the financial markets in which we operate. It complements our purpose and values and – together with more formal policies and the tools we have to do our jobs – provides a clear path to achieving our purpose and delivering our strategy. For further information on conduct, see page 83. For further details on our purpose-led conduct approach framework, see www.hsbc.com/who-we-are.
Our colleagues
Understanding the experience of colleagues is central to our efforts to open up a world of opportunity. Through our employee survey, Snapshot, we capture their views on issues from our strategy to their well-being to the future of work. These views will guide our approach as we embrace hybrid working.
We value difference among our colleagues, which is why we continue to build an inclusive workforce. Having surpassed our 2020 target to reach 30% women in senior leadership roles – classified as those at band 3 and above in our global career band structure – we have made strong progress towards our goal to achieve 35% by 2025, with 31.7% achieved in 2021.
We expanded the ability for our colleagues to share their diversity characteristics, with over 70% now able to self-identify their ethnic heritage, gender identity, disability and sexual orientation. This will help us to set locally appropriate goals, reflective of our markets. In July 2020, we set out our early global race commitments, which included the goal of doubling the number of Black employees in senior roles over the following five years. In 2021, we put in place important foundations to achieve this goal.
Developing the skills of colleagues is critical to energising our organisation. We foster a culture of learning through a range of resources, providing colleagues with a breadth of educational materials and opportunities.
As we continue to reshape the organisation, we are committed to managing change well, and redeploying impacted colleagues. In 2021, 23% of colleagues impacted through restructuring programmes found new jobs within HSBC.
Our climate ambition
We have set a climate ambition to become net zero in our operations and our supply chain by 2030, and align our financed emissions to the Paris Agreement goal of net zero by 2050. We have set on-balance sheet financed emissions targets for the oil and gas, and power and utilities sectors, aligned to the International Energy Agency’s (‘IEA’) net zero scenario, underpinned by a clear science-based strategy. To support our goal of net zero financed emissions, it will be crucial to unlock transition finance for our portfolio of clients.
> For further details of our ESG disclosures, see our ESG review on page 42.
Update on our purpose and values
We relaunched our purpose in March 2021. We have been pleased to see how quickly our colleagues have embraced 'Opening up a world of opportunity’ as our purpose, and how they are delivering against it. You can find some examples from 2021 below. We have enabled the recognition of colleagues who have lived up to our values, and there have been over 600,000 recognitions made in 2021.
•We helped 268,771 people buy their first home, lending $92.9bn in mortgages.
•We provided $47bn in loans to our business banking customers to help support, grow, internationalise and digitise their businesses.
•We facilitated $799bn of trade globally to help economies grow and prosper.
•We supported over 270,000 students move internationally to study by providing key financial products including account openings, fund transfer and day-to-day finance management in their new countries.
•Over 115,000 colleagues made use of our new learning platform, Degreed, during 2021.
•We enabled over 30,000 colleagues to progress their careers at the Group by helping them move into new roles.
Engaging with our stakeholders and our material ESG topics
Engaging with our stakeholders is core to being a responsible business. To determine material topics that our stakeholders are interested in, we conduct a number of activities throughout the year, including engagements outlined in the table below. Disclosure standards such as the TCFD, World Economic Forum (‘WEF’) Stakeholder Capitalism Metrics and Sustainability Accounting Standards Board (‘SASB’), as well as the ESG Guide under the Hong Kong Stock Exchange Listing Rules and other applicable rules and regulations, are considered as part of the identification of material issues and disclosures.
| | | | | | | | |
| Our stakeholders | How we engage | Material topics highlighted by the engagement1 |
| Customers | Our customers’ voices are heard through our interactions with them, surveys and by listening to their complaints | –Customer advocacy –Cybersecurity |
| Communities | We welcome dialogue with external stakeholders, including non-governmental organisations (‘NGOs’) and other civil societies groups. We engage directly on specific issues and by taking part in external forums and working groups | –Financial inclusion and community investment |
| Employees | Our colleagues’ voices are heard through our employee Snapshot survey, Exchange meetings and our ‘speak-up’ channels, including our global whistleblowing platform, HSBC Confidential | –Diversity and inclusion, in particular gender and ethnicity profile and pay gap –Employee training |
| Investors | We engage with our shareholders through our AGMs, virtual and in-person meetings, conferences and our annual investor survey | –Coal financing policies –Becoming a net zero bank in our own operations and financed emissions |
| Regulators and governments | We proactively engage with regulators and governments to facilitate strong relationships via virtual and in-person meetings, responses to consultations individually and jointly via the industry bodies | –Anti-bribery and corruption |
| Suppliers | Our ethical and environmental code of conduct for suppliers of goods and services sets out how we engage with our suppliers on ethical and environmental performance | –Supply chain management |
1 Material topics highlighted through the engagement form part of our ESG disclosures suite together with other requirements and are not exhaustive or exclusive to one stakeholder group. For further details on our disclosures, see our ESG review and ESG Data Pack, as well as our ESG reporting centre at www.hsbc.com/esg.
Supporting our stakeholders through Covid-19
The Covid-19 pandemic continues to create a great deal of uncertainty and disruption for the people, businesses and communities we serve around the world. It is affecting everyone in different ways, with markets at different stages of the crisis.
The pandemic continued to pose significant challenges for our customers. Our immediate priority has been to do what we can to provide them with support and flexibility. We continued to take steps to keep many of our branches open while protecting customers and our colleagues. However, with customers doing more of their banking online, we have also deployed new technology to help enable them to engage with us in new ways.
Employee well-being remains a top priority as we transition to new ways of working and continue to navigate through the pandemic. The support we provide is driven by the feedback from our people surveys. In 2021, we launched new tools and training to support mental, physical and financial health. We are also enabling more colleagues to work flexibly and continue to follow social distancing and protection measures in line with local guidance. We firmly believe that helping our people to be healthy and happy is a key enabler of our strategy, and benefits the people and communities we serve.
We continued to engage with our investors virtually and restarted face-to-face meetings where local guidance allowed.
We also donated a further $11.5m towards Covid-19 relief efforts to support the communities in which we operate, primarily in India.
Our COP26 actions
COP26, the UN climate change conference held in Glasgow, Scotland, in November, was a critical moment for the financial sector, including HSBC, to demonstrate how we are helping to accelerate the transition to net zero. The Glasgow Financial Alliance for Net Zero, which we are part of, announced potentially transformative measures for the sector, including setting short-term science-based targets, annual reporting of progress, embedding climate risk management into businesses, and mobilising transition finance for emerging and developing countries.
Our delegation, including our Group Chief Sustainability Officer, Celine Herweijer (pictured here at COP26) was involved in a series of major announcements around finance, energy transition, sustainable infrastructure and nature. This included joining the Powering Past Coal Alliance, a global coalition of countries, cities, regions and businesses focused on tackling the challenge of ending the world’s reliance on coal. We also announced that we are supporting the Asian Development Bank in the pioneering Energy Transition Mechanism initiative, which is working with developing countries on early retirement of coal power assets and unlocking new investment in clean energy, while supporting reskilling of workers in directly affected communities.
Our ESG ambitions, metrics and targets
We have established ambitions and targets that guide how we do business, including how we operate and how we serve our customers. These include targets designed to help us make our business – and those of our customers – more environmentally and socially sustainable. They also help us to improve employee advocacy and diversity at senior levels, as well as strengthen our market conduct.
The 2021 annual incentive scorecards of the Group Chief Executive, Group Chief Financial Officer and Group Executives contain customer and employee measures linked to the outcomes that underpin the ESG metrics below. These carry a 30% weighting in the scorecards of the Group Chief Executive and Group Chief Financial Officer. In addition, a 25% weighting is given to environment and sustainable finance measures in the 2020 and 2021 long-term incentive (‘LTI’) scorecards, which have three-year performance periods ending on 31 December 2023 and 31 December 2024, respectively. The targets for these measures are linked to our climate ambition of achieving net zero in our operations and supply chain by 2030 and supporting our clients in their transition to net zero and a sustainable future. For a summary of how all financial and non-financial metrics link to executive remuneration outcomes, see pages 297 to 309 in the Directors’ remuneration report.
The table below sets out how we have made progress against the following ESG-related ambitions and targets.
| | | | | | | | | | | |
| | Ambition/target | Progress to date |
| Environmental | | |
| Becoming a net zero bank | Ambition to align our financed emissions to achieve net zero by 2050 or sooner | Disclosed interim targets for the oil and gas, and power and utilities sectors (for further details, see page 47) |
| | | Published thermal coal phase-out policy (for further details, see page 62) |
| | Ambition to be net zero in our own operations and supply chain by 2030 or sooner | 50.3% cumulative reduction in absolute operational greenhouse gas emissions from 2019 baseline1 |
| Supporting our customers | Ambition to support our customers in their transition to net zero and a sustainable future with $750bn to $1tn of sustainable finance and investment by 2030 | Cumulative progress of $126.7bn since 20202 |
| Social | |
| Customer satisfaction | Target to be ranked top three and/or improve customer satisfaction rank | 6 out of 10 WPB markets sustained top-three rank and/or improved rank in customer satisfaction3 |
| 4 out of 13 CMB markets sustained top-three rank and/or improved rank in customer satisfaction3 |
| Employee engagement | Target to maintain employee engagement score at 72% | Employee engagement score of 72%4 |
| Employee gender diversity | Target to reach 35% women in senior leadership roles by the end of 2025 | Women in senior leadership roles of 31.7%5 |
| Employee ethnicity diversity | Target to at least double the number of Black senior leaders by 2025 | Increased number of Black senior leaders by 17.5% from 2020 baseline5 |
| Governance |
|
|
| Global conduct | Target to achieve at least 98% of employees complete conduct and financial crime training each year | 99% of staff completed training6 |
1 This absolute greenhouse gas emission figure covers scope 1, scope 2 and scope 3 (business travel) emissions. The data for 2019 and 2020 has been revised as we have updated our air travel reporting methodology to include the cabin class travel and the impact of radiative forces. For further details, see the ESG review on page 52. For further details on how this target links with the scorecards, see page 297.
2 In October 2020, we announced our ambition to provide and facilitate between $750bn to $1tn of sustainable finance and investment by 2030. For further details and breakdown, see the ESG review on page 43. For details on how this target links with the scorecards, see page 297.
3 Rank position reported for markets where net promoter score (‘NPS’) is live. In WPB, markets comprised: the UK, Hong Kong, Malaysia, Singapore, mainland China, Australia, UAE, Canada, Mexico and the US. In CMB, markets comprised: the UK, Hong Kong, Malaysia, Singapore, Pearl River Delta, mainland China, India, Indonesia, Australia, UAE, Canada, Mexico and the US. For further details on customer satisfaction, see the ESG review on page 67. For further details on how this target links with the scorecards, see page 305.
4 For further details, see the ESG review on page 75. For details on how this target links with the scorecards, see page 305.
5 Senior leadership is classified as those at band 3 and above in our global career band structure. Ethnicity target progress tracked from 31 December 2020 baseline. For further details, see the ESG review on page 72. For details on how this target links with the scorecards, see page 305.
6 The completion rate shown relates to the 2021 ‘Fighting financial crime’ training module. The latest global regulatory conduct training has been launched in January 2022 and will run through the first quarter of 2022.
How we measure our net zero progress
One of our strategic pillars is to support the transition to a net zero global economy. We believe our most significant contribution will be to align our financed emissions to the Paris Agreement goal to achieve net zero by 2050 or sooner. The Paris Agreement aims to limit the rise in global temperatures to well below 2°C, preferably to 1.5°C, above pre-industrial levels. To limit the rise in global temperatures to 1.5°C, the global economy would need to reach net zero greenhouse gas emissions by 2050.
In May 2021, a climate change resolution proposed by the Board was backed by more than 99% of our shareholders at our AGM. The resolution included a commitment to set out the next steps in our transition to net zero, including setting sector-based targets, publishing a thermal coal phase-out policy and reporting annually on our progress. We also indicated that we would provide further details on our approach to assessing financed emissions by the end of 2021.
We have set on-balance sheet financed emissions 2030 targets for the oil and gas, and power and utilities sectors, focusing on the companies within these sectors which we believe account for the majority of emissions in the sector. For further details including scope, methodology, assumptions and limitations, see page 47.
We continue to track our progress against our ambition to provide and facilitate $750bn to $1tn of sustainable finance and investment by 2030, aligned to our published data dictionary, and our transformation to a net zero bank by reducing our operations and our supply chain emissions to net zero by 2030.
In the year ahead we plan to set interim targets for financed emissions across a wide range of sectors, alongside a broad transformation programme to embed the climate transition into our core business and risk processes. We will also begin work on our climate transition plan, which will bring together – in one place – how we plan to embed our net zero targets into the Group’s strategy, processes, policies and governance. We plan to publish this in 2023, and update on progress annually thereafter.
We know this is a journey and recognise that certain metrics and targets may need to be revised as a result of changes or developments in methodology, climate science and improvements in data quality. In the following table, we set out our metrics and indicators and assess our progress against them.
| | | | | | | | | | | |
| Ambition | Metrics and indicators | Progress to date | |
Becoming a net zero bank1 Align our financed emissions to achieve net zero by 2050 or sooner | Absolute emissions for oil and gas sector (Mt CO2e) | –Set a Mt CO2e target of 34% reduction in oil and gas absolute on-balance sheet financed emissions by 2030 from 2019 baseline (see page 47) | |
| Physical emissions intensity for power and utilities sector (Mt CO2e/TWh) | –Set a target for power and utilities on-balance sheet financed emissions intensity of 0.14 Mt CO2e/ TWh, representing 75% reduction by 2030 from 2019 baseline (see page 47) | |
| Percentage of wholesale loans and advances in high transition risk sectors | –≤ 20.0% of wholesale loans and advances to high transition risk sectors at 31 December 2021 –Expanded the transition risk questionnaire to cover more sectors (see page 169) | |
| Thermal coal financing exposure ($) | –Published a thermal coal phase-out policy incorporating a target to reduce exposure to thermal coal financing by at least 25% by 2025, and by 50% by 2030, using 2020 data as the baseline (see page 62) | |
| Illustrative impacts of climate scenarios | –Ran our first climate stress test, covering our wholesale corporate lending, commercial real estate, retail mortgages and our own properties (see page 57) | |
| Be net zero in our operations and supply chain by 2030 or sooner | Absolute operational greenhouse gas emissions (tonnes CO2e) | –50.3% cumulative reduction in absolute greenhouse gas emissions from 2019 baseline | |
| Percentage of renewable electricity sourced (GWh) | –Remained stable from 37.4% in 2020 to 37.5% | |
| Energy consumption (GWh) | –20.6% cumulative reduction in energy consumption from 2019 baseline | |
Supporting our customers Support our customers in their transition to net zero and a sustainable future | Sustainable finance and investment provided and facilitated
($bn) | –$126.7bn cumulative progress since 2020 (for further breakdown see page 53) | |
Unlocking new climate solutions Help transform sustainable infrastructure into a global asset class, and create a pipeline of bankable projects | Natural capital investment | –Climate Asset Management is one of the three founding partners of Natural Capital Investment Alliance, which aims to mobilise $10bn towards natural capital themes (see page 55) | |
| Climate technology investment | –Lending commitments of $65m and raised our target to $250m (see page 55) | |
| Philanthropic investment to climate innovation ventures, renewable energy, and nature-based solutions | –Provided $28.4m to our NGO partners since 2020, as part of the Climate Solutions Partnership (see page 77)
| |
1 Our reported scope 3 greenhouse gas emissions of our own operations in 2021 is related to business travel. The data for 2019 and 2020 has been revised as we have updated our air travel reporting methodology to include the cabin class travel and the impact of radiative forces.For further details on scope 1, 2 and 3, and our progress on greenhouse gas emissions and renewable energy targets, see page 51 and our ESG Data Pack at www.hsbc.com/esg.
Task Force on Climate-related Financial Disclosures (‘TCFD’)
The Financial Stability Board’s Task Force on Climate-related Financial Disclosures (‘TCFD’) recommendations set an important framework for understanding and analysing climate-related risks, and we are committed to regular, transparent reporting to help communicate and track our progress. We will advocate the same from our customers, suppliers and the industry. We recognise that further work lies ahead as we develop our management and metrics capabilities.
The information set out on page 63 in this Form 20-F aims to provide key climate-related information and cross-references to where additional information can be found. In this context, we have considered our ‘comply or explain’ obligation under the UK’s Financial Conduct Authority’s Listing Rules, and confirm that we have made disclosures consistent with the TCFD Recommendations and Recommended Disclosures in this Form 20-F save for certain items, which we summarise below and describe in more detail in the information set out on page 63 and in the additional information section on page 1b.
There are certain areas where we have not included climate-related disclosures, a summary of these are set out below:
–Given that climate scenarios are mainly focused on medium- to long-term horizons, rather than short-term, we have set interim 2030 targets for on-balance sheet financed emissions for the oil and gas and power and utilities sectors. HSBC intends to review the financed emissions baseline and targets annually, where relevant, to help ensure that they are aligned with market practice and current climate science.
–We do not fully disclose impacts on financial planning and performance (including proportions of revenue, costs and balance sheet related to climate-related opportunities), quantitative scenario analysis, detailed climate risk exposures for all sectors and geographies or physical risk metrics. This is due to transitional challenges in relation to data limitations. We expect these data limitations to be addressed in the medium term as more reliable data becomes available and technology solutions are implemented.
–We currently disclose partial scope 3 greenhouse gas emissions. In relation to on-balance sheet financed emissions, we are disclosing our scope 3 greenhouse gas emissions for oil and gas, and the power and utilities sectors. Future disclosure on scope 3 financed emissions (customers) and supply chain emissions (suppliers), as well as related risks is reliant on both our customers and suppliers publicly disclosing their carbon emissions and related risks. We aim to disclose financed emissions for additional sectors by 2023, as set out in our Financed Emissions – Approach and Methodology Update published in December 2021, which can be found at www.hsbc.com/who-we-are/esg-and-responsible-business/esg-reporting-centre.
Leading on an inaugural green bond
We were joint lead manager and bookrunner as Arab Petroleum Investments Corporation (‘APICORP’) in September 2021 raised $750m with its inaugural green bond. The multilateral development bank, founded in 1975 by the 10 Arab oil-exporting countries, has a strategic focus to promote the energy sector within the region to a more sustainable future. As set out in its green bond framework, APICORP will use the proceeds to finance or invest in projects focused on renewable energy, pollution prevention and control, and green buildings.
Supporting renewable projects through our operations
We are expanding our efforts to bring additional renewable electricity in the markets where we operate, as part of our ambition to source 100% renewable power across our operations by 2030. In September 2021, we signed a power purchase agreement that supported the development of the Sorbie Wind Farm project in Ayrshire, south-west of Glasgow. This agreement will create a new renewable electricity source that will benefit us, as well as our customers and the wider communities we serve.
This power purchase agreement will be our fourth project in the UK, supporting wind or solar projects, and will result in approximately 90% of our UK electricity being sourced from such renewable projects.
Responsible business culture
We have the responsibility to protect our customers, our communities and the integrity of the financial system. In this section, we outline our requirements under the Non-Financial Reporting Directive.
Employee matters
We are opening up a world of opportunity for our colleagues through building an inclusive organisation that values difference, takes responsibility, and seeks different perspectives for the overall benefit of our customers.
We want to encourage a dynamic culture where our colleagues can expect to be treated with dignity and respect. We are an organisation that takes action where we find behaviours that fall short of this aspiration. We monitor our progress through metrics that we value and have benchmarked against peers.
Listening to our colleagues is critical to the business we conduct, and is reflected in our purpose and values, which were established through the largest employee engagement programme in our history.
We continue to seek innovative ways that encourage and provide opportunities for our people to speak up. We recognise that at times people may not feel comfortable speaking up through the usual channels. HSBC Confidential is our global whistleblowing channel, allowing our colleagues past and present to raise concerns confidentially and, if preferred, anonymously (subject to local laws).
Having surpassed our 2020 target to reach 30% women in senior leadership roles (classified as those at band 3 and above in our global career band structure), we aim to reach 35% by 2025, with 31.7% achieved in 2021.
In July 2020, we set out our early global race commitments, which included the goal of doubling the number of Black employees in senior roles over the next five years. To support our ambition, we have placed a strong focus on enhancing the quality and transparency of our ethnicity data through the expansion of our self-identification capability. We will use this data to develop market-specific goals that are connected to the communities we serve. While we know we need to do more, we have put in place important foundations in 2021 through leadership development, inclusive hiring practices and investing in the next generation of high-performing, diverse talent.
The table below outlines high-level diversity metrics.
| | | | | | | | | | | |
| All employees | Senior leadership1 | Directors |
| Male | 48% | 68% | 62% |
| Female | 52% | 32% | 38% |
1 Senior leadership is classified as those at band 3 and above in our global career band structure.
For further details on how we look after our people, including our diversity targets, transformation employee metrics and how we encourage our employees to speak up, see the Employees section of the ESG review on page 70.
Social matters
We have a responsibility to invest in the long-term prosperity of the communities where we operate. We recognise that technology is developing at a rapid pace and that a range of new and different skills are now needed to succeed in the workplace. For this reason, much of our focus is on programmes that develop employability and financial capability. We also back climate solutions and innovation, and contribute to disaster relief based on need. For further details of our programmes see ‘Communities’ on page 77.
Human rights
Our commitment to respecting human rights, principally as they apply to our employees, our suppliers and through our financial services lending, is set out in our Statement on Human Rights. This statement, along with our statements under the UK’s Modern Slavery Act, is available on www.hsbc.com/who-we-are/esg-and-responsible-business/esg-reporting-centre.
.
Anti-corruption and anti-bribery
We require compliance with all applicable anti-bribery and corruption laws in all markets and jurisdictions in which we operate. These include the UK Bribery Act, the US Foreign Corrupt Practices Act, the Hong Kong Prevention of Bribery Ordinance and France’s 'Sapin II’ law. We have a global anti-bribery and corruption policy, which gives practical effect to these laws and regulations, but also requires compliance with the spirit of laws and regulations to demonstrate our commitment to ethical behaviours and conduct as part of our environmental, social and corporate governance.
Environmental matters
For details of our climate ambition and carbon emission metrics, see the ESG review on page 45.
| | |
Non-financial information statement This section primarily covers our non-financial information as required by the regulations. Other related information can be found as follows: For further details on our key performance indicators, see page 1. For further details on our business model, see page 4. For further details on our principal risks and how they are managed, see pages 37 to 40.
|
Engaging colleagues in future skills
Our colleagues have explored digital, data, sustainability and personal skills as part of our ‘Future Skills’ campaign. Colleagues engaged with various tools, assessments and industry experts over 44,000 times throughout the campaign, and learned how these skills are critical for the future of our organisation. Colleagues identified specific skills they wanted to develop and assessed them through our skills platform to shape their development plan.
We helped a number of colleagues to share their own skills with others through our partnership with Ashoka. In 2021 we launched the global Green Skills Innovation Challenge to support innovations that connect people with the skills to support a green transition. Out of 340 submissions, 12 winners were selected, each receiving a prize of up to $20,000 alongside support and mentoring from HSBC colleagues.
This page is intentionally left blank
This page is intentionally left blank
This page is intentionally left blank
This page is intentionally left blank
Remuneration
Our remuneration policy supports the achievement of our strategic objectives by aligning reward with our long-term sustainable performance.
Our remuneration principles
Our performance and pay strategy aims to reward competitively the achievement of long-term sustainable performance by attracting, motivating and retaining the very best people, regardless of gender, ethnicity, age, disability or any other factor unrelated to performance or experience.
For further details of our principles and what we did during 2021 to help ensure remuneration outcomes were consistent with those principles, see page 314.
Variable pay
The 2021 Group variable pay pool has been determined taking into account the improvement in financial performance, with adjusted profit before tax up 79%, the reinstatement of dividends and the capital return to shareholders through share buy-backs, as well as performance against the strategic plan. It also took into account the challenges the Group faces with regard to a very competitive market for talent.
For details of how the Group Remuneration Committee sets the pool, see page 290.
Remuneration for our executive Directors
Our current remuneration policy for executive Directors was approved at our AGM in 2019 and is intended to apply for three performance years until the AGM in 2022. We are proposing to roll forward our current remuneration policy for shareholders’ approval at the 2022 AGM. We have made no changes to the remuneration structure or to the maximum opportunity payable for each element of remuneration. Details of the proposed policy can be found on page 293.
Variable pay for our executive Directors is driven by scorecard achievement, with measures and targets set to align pay outcomes with the delivery of our strategy and plan for the year.
Executive Directors’ annual incentive scorecard outcome
(% of maximum opportunity)
| | | | | |
| Group Chief Executive | 57.30% |
| Group Chief Financial Officer | 60.43% |
The table below shows the amount our executive Directors earned in 2021. For details of Directors’ pay and performance for 2021, see the Directors’ remuneration report on page 290.
| | | | | | | | | | | | | | |
| Single figure of remuneration |
| Noel Quinn | Ewen Stevenson |
| (£000) | 2021 | 2020 | 2021 | 2020 |
| Base salary1 | 1,288 | 1,266 | | 751 | 738 | |
| Fixed pay allowance ('FPA')1 | 1,700 | 1,700 | | 1,062 | 950 | |
| Cash in lieu of pension | 129 | 127 | | 75 | 74 | |
| Taxable benefits2 | 95 | 186 | | 3 | 12 | |
| Non-taxable benefits2 | 71 | 59 | | 42 | 32 | |
| Total fixed | 3,283 | 3,338 | | 1,933 | 1,806 | |
| Annual incentive3 | 1,590 | 799 | | 978 | 450 | |
| Notional returns4 | 22 | | 17 | | — | — | |
| Replacement award5 | — | — | | 754 | 1,431 | |
| Total variable | 1,612 | 816 | | 1,732 | 1,881 | |
| Total fixed and variable | 4,895 | 4,154 | | 3,665 | 3,687 | |
1 Executive Directors made the personal decision to donate 100% of their base salary increases for 2021 to charity given the ongoing challenging external environment. Ewen Stevenson also donated his FPA increase for 2021 to charity. Figures shown in the table above are the gross figures before charitable donations.
2 Taxable benefits include the provision of medical insurance, car and tax return assistance (including any associated tax due, where applicable). Non-taxable benefits include the provision of life assurance and other insurance cover.
3 Noel Quinn and Ewen Stevenson both voluntarily waived the cash portion of their 2020 annual incentive. Without this voluntary waiver, the 2020 annual incentive of Noel Quinn and Ewen Stevenson would have been £1,598,000 and £900,000, respectively.
4 The deferred cash awards granted in prior years includes a right to receive notional returns for the period between the grant and vesting date. This is determined by reference to a rate of return specified at the time of grant and paid annually, with the amount disclosed on a paid basis.
5 In 2019 Ewen Stevenson was granted replacement awards to replace unvested awards, which were forfeited as a result of him joining HSBC. The awards, in general, match the performance, vesting and retention periods attached to the awards forfeited. The values included in the table for 2020 relate to his 2017 LTI award granted by the Royal Bank of Scotland Group plc ('RBS'), now renamed as NatWest Group plc ('NatWest'), for performance year 2016, which was determined by applying the performance assessment outcome of 56.25% as disclosed in NatWest's Annual Report and Accounts 2019 (page 91) to the maximum number of shares subject to performance conditions. This resulted in a payout equivalent to 78.09% of NatWest award shares that were forfeited and replaced with HSBC shares. A total of 313,608 shares were granted in respect of his 2017 LTI replacement award at a share price of £6.643. The HSBC share price was £5.845 when the awards ceased to be subject to performance conditions, with no value attributable to share price appreciation. The value included in the table for 2021 relates to Ewen Stevenson's 2018 LTI replacement award granted by NatWest for performance year 2017 and was subject to a pre-vest performance test assessed and disclosed by NatWest in its Annual Report and Accounts 2020 (page 135). As no adjustment was proposed for Ewen Stevenson by NatWest, a total of 177,883 shares granted in respect of his 2018 LTI replacement award ceased to be subject to performance conditions. These awards were granted at a share price of £6.643 and the HSBC share price was £4.240 when the awards ceased to be subject to performance conditions, with no value attributable to share price appreciation.
Financial overview
In assessing the Group’s financial performance, management uses a range of financial measures that focus on the delivery of sustainable returns for our shareholders and maintaining our financial strength.
Executive summary
Financial performance in 2021 was supported by the improved economic outlook and resultant release in ECL allowances, which materially improved our profitability. While lower policy rates adversely impacted revenue compared with 2020, the interest rate outlook is now significantly more positive.
Reported profit before tax of $18.9bn increased by 115%, while our return on average tangible equity (‘RoTE’) improved by 5.2 percentage points to 8.3%. The growth in reported profit was due to a net release of ECL, compared with a significant charge in 2020, as well as an increase in share of profit from associates and joint ventures, while reported operating expenses remained broadly unchanged. These factors were partly offset by lower reported revenue.
In 2021, all of our regions were profitable. Notwithstanding lower policy rates, our Asia business continued to perform strongly, delivering 65% of Group reported profits, while there was a material recovery in profitability in all of our other regions.
The Group maintained its strong capital position with a CET1 ratio of 15.8% at 31 December 2021, and increased both customer deposit and lending balances.
Group financial targets
Return on average tangible equity <>
8.3%
2020: 3.1%
The Group is targeting a reported RoTE greater than or equal to 10% in the medium term. In 2021, RoTE was 8.3%, an increase of 5.2 percentage points from 2020, primarily reflecting net releases of ECL. Our net interest income outlook is now significantly more positive. If policy rates were to follow the current implied market consensus, we would expect to deliver a RoTE of at least 10% for 2023.
Adjusted operating expenses <>
$32.1bn
2020: $32.4bn
In February 2020, we announced a multi-year plan to substantially reduce the cost base and accelerate the pace of change, with the aim of becoming leaner, simpler and more competitive.
During 2021, we continued to demonstrate strong cost control, with adjusted operating expenses of $32.1bn, a reduction of 1% compared with 2020.
Adjusted operating expenses for 2022 are expected to be in line with 2021, with inflationary impacts, continued investment and the impact of acquisitions and disposals broadly offset by further savings from our cost-reduction programme. This compares with our original target of $31bn or less (based on average December 2020 rates of foreign exchange).
Our cost reduction programme remains on track to deliver cost saves of between $5bn and $5.5bn in the period from 2020 to 2022, while spending around $7bn in costs to achieve.
Cumulatively, since the start of our cost programme in 2020, we have generated savings of $3.3bn, with costs to achieve of $3.6bn, which included actions to restructure our businesses in Europe and the US.
Gross RWA reductions
$104bn
Since the start of the programme.
To improve the return profile of the Group, we are targeting a gross RWA reduction, mainly in low-returning parts of the Group.
During 2021, we updated the list of clients we are remediating and also implemented other methodology changes to improve how we align the tracking and reporting of reductions to how the programme is being managed. In line with these changes, we also increased our gross RWA reduction target from $100bn to $110bn by the end of 2022, updating executive scorecards accordingly.
At 31 December 2021, the Group had achieved cumulative RWA reductions of $104bn since the start of the programme, including accelerated saves of $9.6bn made in 2019. Given progress to date, we now expect to exceed our $110bn reduction target by the end of 2022.
Capital and dividend policy
CET1 ratio
15.8%
Dividend payout ratio
40.3%
At 31 December 2021, our CET1 ratio was 15.8%. We expect mid-single-digit RWA growth in 2022 through a combination of business growth, acquisitions and regulatory changes, partly offset by additional RWA savings. This growth, together with capital returns are expected to normalise our CET1 position to be within our 14% to 14.5% target operating range during 2022. Once we are within the target operating range, we intend to actively manage our CET1 position to stay within this range. However, due to normal capital volatility, we may be above or below this range in any given quarter. Our ambition remains to manage this operating range down in the longer term.
The Board has approved a second interim dividend for 2021 of $0.18 per ordinary share. The total dividend per share in 2021 of $0.25 results in a dividend payout ratio of 40.3% of reported earnings per share (‘EPS’), relative to our target range of between 40% and 55% from 2022 onwards. We also intend to initiate a further share buy-back of up to $1bn, to commence after the existing up to $2bn buy-back has concluded.
In line with our dividend policy, we retain the flexibility to adjust EPS for non-cash significant items. In 2022, we intend to adjust EPS to exclude the forecast loss on the planned sale of our retail banking operations in France.
Reported results
Reported profit
Reported profit after tax of $14.7bn was $8.6bn higher than in 2020.
Reported profit before tax of $18.9bn was $10.1bn higher than in 2020. The increase was primarily due to a net release in reported ECL, reflecting an improvement in the forward economic outlook, notably in the UK, compared with the significant build-up of stage 1 and stage 2 allowances in 2020. We also reported an increase in the share of profit from associates, while reported operating expenses remained broadly unchanged.
Lower reported revenue primarily reflected the impact of 2020 global interest rate reductions, as well as a decline in revenue in GBM’s Markets and Securities Services (‘MSS’) business compared with a strong performance in 2020. Reported revenue also included the net favourable impact of certain volatile items:
•In WPB, favourable market impacts in life insurance manufacturing of $504m compared with favourable movements in 2020 of $90m.
•In GBM, MSS included favourable movements in credit and funding valuation adjustments, as favourable adjustments of $30m compared with adverse adjustments of $252m in 2020.
•In Corporate Centre, there were adverse fair value movements on our long-term debt and associated swaps of $99m (2020: $150m favourable).
In 2021, all of our regions were profitable. Despite the impact of lower global interest rates, our Asia business continued to perform strongly. In addition, there was a material recovery in profitability in all other regions, primarily reflecting a net release in ECL as the economic outlook improved.
IFRS 17 ‘Insurance Contracts’ sets the requirements that an entity should apply in accounting for insurance contracts it issues and reinsurance contracts it holds. IFRS 17 is effective from 1 January 2023 and could have a significant adverse impact on the profitability of our insurance business. For further details on the impact of IFRS 17 on the results of our insurance operations, see page 346.
Reported revenue
Reported revenue of $49.6bn was $0.9bn or 2% lower than in 2020. The reduction primarily reflected a fall in net interest income as a result of the impact of lower global interest rates, notably affecting our deposit franchises in WPB and in Global Liquidity and Cash Management (‘GLCM’) in CMB and GBM. In GBM’s MSS business, revenue decreased in Global Foreign Exchange and Global Debt Markets, compared with a strong 2020, although revenue increased in Equities from higher volatility and there were favourable movements in credit and funding valuation adjustments. In addition, revenue was lower in Corporate Centre.
These reductions were in part mitigated by revenue growth in Wealth in WPB of $1.2bn, notably from a net favourable movement in market impacts in life insurance manufacturing, and growth in investment distribution, asset management and new business in insurance. GBM revenue also benefited from favourable valuation gains in Principal Investments. In CMB, revenue increased in Credit and Lending as margins improved, and a recovery in trade volumes resulted in higher fee income in Global Trade and Receivables Finance (‘GTRF’).
The reduction in reported revenue included adverse fair value movements on financial instruments of $0.5bn, although these were more than offset by the favourable impact of foreign currency translation differences of $1.4bn.
Reported ECL
Reported ECL were a net release of $0.9bn, compared with a charge of $8.8bn in 2020. The net release in 2021 reflected an improvement in the economic outlook, notably in the UK, partly offset by an increase in allowances in the fourth quarter, reflecting recent developments in China’s commercial real estate sector. This compared with the significant build-up of stage 1 and stage 2 allowances in 2020 due to the worsening economic outlook at the onset of the Covid-19 pandemic. The reduction in ECL also reflected historically low levels of stage 3 charges, although with some normalisation during the fourth quarter, as well as the non-recurrence of a significant charge in 2020 related to a corporate exposure in Singapore.
For further details on the calculation of ECL, including the measurement uncertainties and significant judgements applied to such calculations, the impact of the economic scenarios and management judgemental adjustments, see pages 180 to 188.
Reported operating expenses
Reported operating expenses of $34.6bn were broadly unchanged compared with 2020. This included the impact of our cost saving initiatives, as well as lower impairments of goodwill and other intangible assets, as 2021 included a $0.6bn impairment of goodwill related to our WPB business in Latin America to reflect the macroeconomic outlook, as well as the impact of foreign exchange rate deterioration and inflationary pressures, notably on our Argentina business. However, 2020 included a $1.3bn impairment of intangible assets, mainly in Europe. There was also a $0.6bn reduction in the UK bank levy due to a change in the basis of calculation to only include the UK balance sheet rather than the global balance sheet, as well as a credit of $0.1bn relating to the 2020 charge.
These decreases were broadly offset by an increase in performance-related pay of $0.7bn as Group performance improved, and by an increase in investment in technology of $0.9bn (gross of cost savings of $0.5bn). The remaining increase primarily reflected inflationary impacts, non-technology investment in regulatory programmes, and business growth notably Asia wealth investment. In addition, there was an adverse impact of foreign currency translation differences of $1.1bn.
In February 2020, we announced a plan to substantially reduce the cost base by 2022 and accelerate the pace of change. We continue to target $5bn to $5.5bn of cost saves for 2020 to 2022, while spending around $7bn in costs to achieve, which are included in restructuring and other related costs. Cumulative spend since the start of the programme in 2020 was $3.6bn, with cumulative saves of $3.3bn. In 2021, the total spend was $1.8bn with saves during the year of $2.2bn.
| | | | | | | | | | | |
| Reported results | 2021 $m | 2020 $m | 2019 $m |
| Net operating income before change in expected credit losses and other credit impairment charges (‘revenue’) | 49,552 | | 50,429 | | 56,098 | |
| Change in expected credit losses and other credit impairment charges | 928 | | (8,817) | | (2,756) | |
| Net operating income | 50,480 | | 41,612 | | 53,342 | |
| Total operating expenses | (34,620) | | (34,432) | | (42,349) | |
| Operating profit | 15,860 | | 7,180 | | 10,993 | |
| Share of profit in associates and joint ventures | 3,046 | | 1,597 | | 2,354 | |
| Profit before tax | 18,906 | | 8,777 | | 13,347 | |
| Tax expense | (4,213) | | (2,678) | | (4,639) | |
| Profit after tax | 14,693 | | 6,099 | | 8,708 | |
Reported share of profit from associates and joint ventures
Reported share of profit in associates and joint ventures of $3.0bn was $1.4bn higher, primarily reflecting a higher share of profit from Bank of Communications Co., Limited (‘BoCom’), British Growth Fund (‘BGF’) and The Saudi British Bank (‘SABB’). For BGF in the UK, this was due to a recovery in asset valuations relative to 2020, and for SABB, this was primarily due to the non-recurrence of our share of its goodwill impairment charge in 2020.
Tax expense
The effective tax rate for 2021 of 22.3% was lower than the 30.5% for 2020. The effective tax rate for 2021 was increased by the impact of substantively enacted legislation to increase the UK statutory tax rate from 1 April 2023. The 2020 effective tax rate was high, due mainly to the non-recognition of deferred tax on losses in the UK and France.
Adjusted performance
Our reported results are prepared in accordance with IFRSs, as detailed in the financial statements on page 346.
We also present alternative performance measures (non-GAAP financial measures). These include adjusted performance, which we use to align internal and external reporting, identify and quantify items management believes to be significant, and provide insight into how management assesses period-on-period performance. Alternative performance measures are highlighted with the following symbol:<>
To derive adjusted performance, we adjust for:
•the year-on-year effects of foreign currency translation differences; and
•the effect of significant items that distort year-on-year comparisons, which are excluded to improve understanding of the underlying trends in the business.
The results of our global businesses are presented on an adjusted basis, which is consistent with how we manage and assess global business performance.
For reconciliations of our reported results to an adjusted basis, including lists of significant items, see page 110. Definitions and calculations of other alternative performance measures are included in our ‘Reconciliation of alternative performance measures’ on page 90 and ‘Reconciliation of alternative performance measures’ on page 131.
| | | | | | | | | | | | | | | | | |
| Adjusted results<> | 2021 $m | 2020 $m | 2019
$m | 2021 vs 2020 $m | % |
| Net operating income before change in expected credit losses and other credit impairment charges (‘revenue’) | 50,090 | | 51,770 | | 56,435 | | (1,680) | | (3) | |
| Change in expected credit losses and other credit impairment charges | 928 | | (9,282) | | (2,687) | | 10,210 | | 110 | |
| Total operating expenses | (32,148) | | (32,409) | | (33,563) | | 261 | | 1 | |
| Operating profit | 18,870 | | 10,079 | | 20,185 | | 8,791 | | 87 | |
| Share of profit in associates and joint ventures | 3,046 | | 2,192 | | 2,496 | | 854 | | 39 | |
| Profit before tax | 21,916 | | 12,271 | | 22,681 | | 9,645 | | 79 | |
Adjusted profit before tax<>
Adjusted profit before tax of $21.9bn was $9.6bn or 79% higher than in 2020, primarily due to a net release of adjusted ECL due to an improvement in the economic outlook, notably in the UK, compared with the significant build-up of stage 1 and stage 2 allowances in 2020. Adjusted share of profit from associates and joint ventures increased and adjusted operating expenses fell, reflecting strong cost discipline.
These factors were in part offset by lower adjusted revenue, primarily reflecting a fall in net interest income as a result of the impact of lower global interest rates and a reduction in MSS revenue in GBM, compared with a strong performance in 2020.
Reconciliation of reported to adjusted profit before tax
| | | | | | | | | | | |
| 2021 $m | 2020 $m | 2019
$m |
| Reported profit before tax | 18,906 | | 8,777 | | 13,347 | |
| Currency translation | — | | (11) | | 240 | |
| Significant items: | 3,010 | | 3,505 | | 9,094 | |
| – costs of structural reform | — | | — | | 158 | |
| – customer redress programmes | 38 | | (33) | | 1,444 | |
| – disposals, acquisitions and investment in new businesses | — | | 10 | | (768) | |
| – fair value movements on financial instruments | 242 | | (264) | | (84) | |
| – impairment of goodwill and other intangibles | 587 | | 1,090 | | 7,349 | |
| – past service costs of guaranteed minimum pension benefits equalisation | — | | 17 | | — | |
| – restructuring and other related costs | 2,143 | | 2,078 | | 827 | |
| – settlements and provisions in connection with legal and regulatory matters | — | | 12 | | (61) | |
| – goodwill impairment (share of profit in associates and joint ventures) | — | | 462 | | — | |
| – currency translation on significant items | — | | 133 | | 229 | |
| Adjusted profit before tax | 21,916 | | 12,271 | | 22,681 | |
Adjusted revenue<>
Adjusted revenue of $50.1bn was $1.7bn or 3% lower than in 2020. The reduction was primarily in net interest income due to the impact of lower global interest rates, mainly affecting our deposit franchises within WPB and in GLCM in CMB and GBM. In GBM’s MSS business, revenue decreased in Global Foreign Exchange and Global Debt Markets, compared with a strong 2020, although revenue increased in Equities from higher volatility and there were favourable movements in credit and funding valuation adjustments of $301m. In addition, revenue was lower in Corporate Centre from a net adverse fair value movement relating to the economic hedging of interest rate and exchange rate risk on our long-term debt with associated swaps.
These reductions were in part mitigated by revenue growth of $1.1bn in Wealth in WPB, notably from a net favourable movement in market impacts in life insurance manufacturing of $434m, and growth in investment distribution, asset management and new business in insurance. In GBM, there were higher favourable revaluations in Principal Investments compared with 2020, and increased revenue in Capital Markets and Advisory. In CMB, revenue grew in Credit and Lending as margins improved, and a recovery in trade volumes resulted in higher fee income in GTRF.
Adjusted ECL<>
Adjusted ECL, which removes the period-on-period effects of foreign currency translation differences, were a net release of $0.9bn compared with a charge of $9.3bn in 2020. These reflected releases as a result of an improvement in the economic outlook, notably in the UK, partly offset by an increase in allowances in the fourth quarter, reflecting recent developments in China’s commercial real estate sector. This compared with the significant build-up of stage 1 and stage 2 allowances in 2020 due to the worsening economic outlook at the onset of the Covid-19 pandemic. The reduction in ECL also reflected historically low levels of stage 3 charges in 2021, although with some normalisation during the fourth quarter, as well as the non-recurrence of a significant stage 3 charge in 2020 related to a corporate exposure in Singapore.
Adjusted operating expenses<>
Adjusted operating expenses of $32.1bn were $0.3bn or 1% lower than in 2020. This reflected a favourable impact of $2.2bn from our cost-saving initiatives. It also included a reduction of $0.6bn in the UK bank levy, reflecting a change in the basis of calculation to only include the UK balance sheet rather than the global balance sheet, as well as a credit of $0.1bn relating to the 2020 charge. These reductions were partly offset by a higher performance-related pay of $0.7bn as Group performance improved, and an increase of $0.9bn in investment in technology (gross of cost savings of $0.5bn), which included enhancements to our digital capabilities. The remaining increase included inflation, non-technology investment in regulatory programmes and business growth, including Asia wealth investment.
The number of employees expressed in full-time equivalent staff (‘FTE’) at 31 December 2021 was 219,697, a decrease of 6,362 compared with 31 December 2020. The number of contractors at 31 December 2021 was 6,192, an increase of 500, primarily as a result of our growth and transformation initiatives.
Adjusted share of profit from associates and JVs<>
Adjusted share of profit from associates and joint ventures of $3.0bn was $0.9bn or 39% higher than in 2020, including increases in share of profits from BoCom and SABB. Our share of profit also rose from BGF in the UK due to a recovery in asset valuations relative to 2020.
Balance sheet and capital
Balance sheet strength
At 31 December 2021, our total assets of $3.0tn were $26bn or 1% lower than at 31 December 2020 on a reported basis and included adverse effects of foreign currency translation differences of $46bn.
The decrease in total assets reflected lower derivative assets and a fall in financial investments, reflecting a redeployment of our commercial surplus into cash, which rose by $99bn, in part due to higher customer deposits. Loans and advances to customers increased by $8bn on a reported basis and $23bn on a constant currency basis, mainly from growth in mortgage balances.
Reported loans and advances to customers of $1.0tn were 61.1% as a percentage of customer accounts, compared with 63.2% at 31 December 2020, primarily reflecting growth in customer account balances.
Distributable reserves
The distributable reserves of HSBC Holdings at 31 December 2021 were $32.2bn, compared with $31.3bn at 31 December 2020. The increase was primarily driven by profits generated of $10.8bn, offset by ordinary dividend payments and additional tier 1 coupon distributions of $5.8bn, other reserves movements of $2.1bn and $2bn related to our share buy-back programme.
Capital position
We actively manage the Group’s capital position to support our business strategy and meet our regulatory requirements at all times, including under stress, while optimising our capital efficiency. To do this, we monitor our capital position using a number of measures. These include: our capital ratios, the impact on our capital ratios as a result of stress, and the degree of double leverage being run by HSBC Holdings. Double leverage is one of the constraints on managing our capital position, given the complexity of the Group’s subsidiary structure and the multiple regulatory regimes under which we operate. For further details, see page 225.
Our CET1 ratio at 31 December 2021 was 15.8%, down 0.1 percentage points from 2020. Capital generation was more than offset by dividends, the up to $2bn share buy-back announced in October, foreign exchange movements and other deductions. RWAs reduced despite new Pillar 1 requirements for structural foreign exchange, reflecting actions under our transformation programme.
Liquidity position
We actively manage the Group’s liquidity and funding to support our business strategy and meet regulatory requirements at all times, including under stress. To do this, we monitor our position using a number of risk appetite measures, including the liquidity coverage ratio and the net stable funding ratio. At 31 December 2021, we held high-quality liquid assets of $717bn. This excludes high-quality liquid assets in legal entities which are not transferable due to local restrictions. For further details, see page 229.
$2,958bn
15.8%
Wealth and Personal Banking
Contribution to Group adjusted profit before tax<>
| | |
| % contribution to Group |
| 32 | % |
We serve more than 38 million customers from retail customers to ultra high net worth individuals and their families.
We offer locally-tailored products and services across multiple channels for our customers’ everyday banking needs, as well as insurance, investment management, advisory and wealth solutions for those with more sophisticated requirements. Our global presence provides for customers with international needs.
WPB grew customer deposits, lending and wealth sales, as markets emerged from the pandemic in 2021. Performance was favourably impacted by a net release of adjusted ECL provisions and strong wealth sales in Asia, although adjusted revenue was affected by the impact of lower interest rates, despite strong balance sheet growth. Aligned with our strategy, we continued to invest in our digital capabilities and people to expand our wealth franchise in Asia, and address our customers’ international needs.
| | | | | | | | | | | | | | | | | |
| Adjusted results<> | 2021 $m | 2020 $m | 2019 $m | 2021 vs 2020 |
| $m | % |
| Net operating income | 22,110 | | 22,571 | | 26,140 | | (461) | | (2) | |
| Change in expected credit losses and other credit impairment charges | 288 | | (3,005) | | (1,376) | | 3,293 | | 110 | |
| Operating expenses | (15,384) | | (15,443) | | (15,823) | | 59 | | — | |
| Share of profit in associates and JVs | 34 | | 7 | | 54 | | 27 | | >200 |
| Profit before tax | 7,048 | | 4,130 | | 8,995 | | 2,918 | | 71 | |
RoTE excluding significant items (%)1 | 15.2 | | 9.1 | | 19.7 | | | |
1 Since 1 January 2021, the UK bank levy has been included in the calculation of this measure. Comparative data have not been re-presented.
Opening up the gateway to international banking
We are making it easier than ever for our customers to manage their money around the world.
Global Money Account, our multi-currency account for personal customers, allows customers to hold, manage and send cash in various currencies without paying any fees. Having launched Global Money in the US in 2020, we expanded these capabilities into the UAE, Singapore and the Channel Islands and Isle of Man in 2021, and we aim to double the number of markets in 2022.
Our international account opening is getting simpler. It is now possible to open accounts in mainland China and either Singapore or the UK, in the same visit to a branch, and 80% faster than in 2020. Hong Kong identity card holders in Australia, Canada, Singapore, the US and the UK can now open an account online in 10 minutes, down from four weeks, with immediate access to mobile banking.
Financial performance
Adjusted profit before tax of $7.0bn was $2.9bn or 71% higher than in 2020. This reflected a net release of adjusted ECL as the economic outlook improved, compared with the significant build-up of allowances in 2020. Adjusted revenue fell as the impact of lower global interest rates resulted in a decrease in net interest income. This was partly offset by an increase in Wealth revenue of $1.1bn due to a net favourable movement of $434m in market impacts in insurance, higher new business in insurance (up $0.3bn), as well as growth in investment distribution (up $0.2bn) and asset management (up $0.1bn).
Adjusted revenue of $22.1bn was $0.5bn or 2% lower.
In Personal Banking, revenue of $12.3bn was down $1.1bn or 8%.
•Net interest income was $1.2bn lower due to narrower margins following the fall in global interest rates in 2020 due to the Covid-19 pandemic. This reduction was partly mitigated by deposit balance growth of $29bn or 4% and higher retail mortgage lending of $22bn or 7% across all regions, particularly in the UK and Hong Kong.
•Non-interest income increased by $0.1bn or 11%, driven by growth of mortgage fees in the UK and higher transaction volumes and spending on cards.
In Wealth, revenue of $9.1bn was up $1.1bn or 14%.
•Life insurance manufacturing revenue was $0.7bn higher, driven by a net favourable movement in market impacts of $434m. A favourable movement of $504m compared with a favourable movement of $70m in 2020, as equity markets performed strongly in 2021 compared with volatile conditions in 2020. The value of new business written was $0.3bn or 41% higher, reflecting market share growth, notably in Hong Kong, where we continued to scale up our health platforms and significantly broadened engagement with domestic customers.
•Investment distribution revenue was $0.2bn or 7% higher, driven by higher mutual fund sales in Hong Kong and mainland China.
•Asset management revenue was $0.1bn or 14% higher, driven by an increase in management fees, reflecting growth of $28bn in invested assets, and higher performance fees.
•Global Private Banking revenue was $37m or 2% higher due to growth in non-interest income of $78m or 7% driven by a rise in investment revenue, reflecting higher fees from advisory and discretionary mandates. This was partly offset by a reduction in net interest income of $41m or 6% as a result of the impact of lower global interest rates.
In Other, revenue fell by $0.5bn, reflecting a reduction in revenue allocated from Markets Treasury, lower interest income earned on capital held in the business and adverse valuations on properties.
Adjusted ECL were a net release of $0.3bn, reflecting an improvement in the economic outlook. This compared with a charge of $3.0bn in 2020 due to the significant build-up of allowances as a result of the Covid-19 pandemic.
Adjusted operating expenses of $15.4bn were $0.1bn lower, as the benefits of our cost-saving initiatives funded our continued investment in wealth in Asia and offset higher performance-related pay.
| | | | | | | | | | | | | | | | | |
| Management view of adjusted revenue<> | 2021
$m | 2020 $m | 2019 $m | 2021 vs 2020 |
| $m | % |
| Wealth | 9,123 | | 8,004 | | 8,923 | | 1,119 | | 14 | |
– investment distribution1 | 3,488 | | 3,252 | | 3,322 | | 236 | | 7 | |
| – Global Private Banking | 1,826 | | 1,789 | | 1,917 | | 37 | | 2 | |
| net interest income | 647 | | 688 | | 911 | | (41) | | (6) | |
| non-interest income | 1,179 | | 1,101 | | 1,006 | | 78 | | 7 | |
– life insurance manufacturing2 | 2,590 | | 1,890 | | 2,632 | | 700 | | 37 | |
| – asset management | 1,219 | | 1,073 | | 1,052 | | 146 | | 14 | |
| Personal Banking | 12,254 | | 13,330 | | 16,068 | | (1,076) | | (8) | |
– net interest income1 | 10,858 | | 12,070 | | 14,381 | | (1,212) | | (10) | |
| – non-interest income | 1,396 | | 1,260 | | 1,687 | | 136 | | 11 | |
Other2, 3 | 733 | | 1,237 | | 1,149 | | (504) | | (41) | |
Net operating income4 | 22,110 | | 22,571 | | 26,140 | | (461) | | (2) | |
1 In the fourth quarter of 2021, revenue of $62m for the full-year related to wealth lending was moved from Personal Banking to investment distribution. Comparative data have not been re-presented.
2 In the fourth quarter of 2021, revenue of $53m for the full-year, primarily related to interest on capital held in our insurance business, was moved from ‘Other’ to life insurance manufacturing (2020: $79m, 2019: $144m). Comparative data have been re-presented.
3 ‘Other’ includes the distribution (where applicable) of retail and credit protection insurance, disposal gains and other non-product specific income. It also includes allocated revenue from Markets Treasury, HSBC Holdings interest expense and Argentina hyperinflation.
4 ’Net operating income’ means net operating income before change in expected credit losses and other credit impairment charges (also referred to as ‘revenue’).
Divisional highlights
$1.7tn
WPB wealth balances at 31 December 2021, up 5% from 31 December 2020 with net new invested assets of $64bn.
$23bn
Growth in WPB mortgage book, notably in the UK (up 7%) and Hong Kong (up 7%) since 31 December 2020. <>
$7.0bn
$22.1bn
Commercial Banking
Contribution to Group adjusted profit before tax<>
| | |
| % contribution to Group |
| 31 | % |
We support businesses in 53 countries and territories, ranging from small enterprises to large companies operating globally.
We help businesses grow by supporting their financial needs, facilitating cross-border trade and payment services, and providing access to products and services. We help them access international markets, provide expert financial advice and offer a full suite of products and services from across the Group’s other businesses.
CMB supported our customers’ liquidity and working capital needs, growing lending and deposit balances in 2021. We enabled our clients to participate in the recovery in global trade volumes while dealing with supply chain constraints, increasing our fee income and trade-related lending. We also more than doubled our sustainable finance and investment compared with 2020. Performance was favourably impacted by the net release of adjusted ECL provisions, partly offset by the impact of lower interest rates globally on adjusted revenue.
| | | | | | | | | | | | | | | | | |
| Adjusted results<> | 2021
$m | 2020
$m | 2019
$m | 2021 vs 2020 |
| $m | % |
| Net operating income | 13,415 | | 13,718 | | 15,594 | | (303) | | (2) | |
| Change in expected credit losses and other credit impairment charges | 300 | | (4,989) | | (1,194) | | 5,289 | | 106 | |
| Operating expenses | (6,973) | | (6,897) | | (7,028) | | (76) | | (1) | |
| Share of profit in associates and JVs | 1 | | (1) | | 1 | | 2 | | 200 | |
| Profit before tax | 6,743 | | 1,831 | | 7,373 | | 4,912 | | >200 |
RoTE excluding significant items (%)1 | 10.8 | | 1.3 | | 13.0 | | | |
1 Since 1 January 2021, the UK bank levy has been included in the calculation of this measure. Comparative data have not been re-presented.
Supporting SMEs on the move
HSBC Kinetic provides cutting edge technology solutions to our customers and opens up a world of opportunity for small businesses. Launched on Apple’s App store in 2020, Kinetic is an app-based business account that allows sole traders and other small and medium-sized enterprises to apply for an account in minutes and manage their finances on the go. Onboarding is fast, with 87% of accounts approved within 48 hours during the second half of 2021. A range of new features and services have been added to the app throughout the year, which include credit cards, digital cheque deposits, a cashflow toolkit and predictive smart alerts informing customers about critical cash shortfalls in advance.
Designed using insights from over 3,000 small and medium-sized enterprises, we brought Kinetic to 21,000 additional customers during 2021, reaching 24,000 users at the end of 2021, achieving an Apple rating of 4.8.
Financial performance
Adjusted profit before tax of $6.7bn was $4.9bn higher than in 2020. This reflected a net release of adjusted ECL of $0.3bn in 2021 as the economic outlook improved, compared with a charge of $5.0bn in 2020 due to a significant build-up of allowances and a notable charge related to a corporate exposure in Singapore. This was partly offset by a decline in adjusted revenue, mainly due to the impact of lower global interest rates.
Adjusted revenue of $13.4bn was $0.3bn or 2% lower.
•In GLCM, revenue decreased by $0.7bn or 16%, reflecting the impact of lower global interest rates, mainly in Hong Kong and the UK. This was partly offset by a 14% increase in year-on-year average deposit balances, with growth particularly in Hong Kong, the UK and the US, as well as from an 11% increase in fee income, with growth across all regions.
•In Markets products, Insurance and Investments and Other, revenue reduced by $11m or 1%, reflecting the impact of lower global interest rates on income earned on capital held in the business and lower Markets Treasury revenue. This reduction was partly offset by a 12% increase in revenue from the sale of GBM products to CMB customers, notably Global Markets and Capital Markets and Advisory, as well as higher insurance and investment revenue.
•In Credit and Lending, revenue increased by $0.2bn or 4%, reflecting wider margins and a 9% increase in fee income, notably in the UK and North America. During 2021, we grew balances in Asia, although year-on-year average balances decreased, as customers' funding requirements fell due to Covid-19 restrictions, notably in Europe and North America.
•In GTRF, revenue rose by $0.2bn or 9%, driven by an 8% growth in fee income across all regions, partly reflecting a recovery in global trade volumes, as well as a 9% increase in average balances, notably in Asia, and higher margins in the UK.
Adjusted ECL were a net release of $0.3bn, compared with a charge of $5.0bn in 2020. ECL in 2021 reflected a release of stage 1 and stage 2 allowances as the economic outlook improved, notably in the UK, although ECL were a net charge of $0.2bn in the fourth quarter, including an increase in allowances relating to recent developments in China’s commercial real estate sector. This compared with the significant build-up of allowances in 2020 as a result of the adverse economic outlook due to the Covid-19 pandemic. The reduction in ECL also included lower stage 3 charges in 2021, and as 2020 included a significant charge related to a corporate exposure in Singapore.
Adjusted operating expenses of $7.0bn were $0.1bn or 1% higher, primarily reflecting an increase in performance-related pay. We continued to invest in our digital and transactional banking capabilities, as well as simplifying customer journeys for both onboarding and lending, and enhancing self-service capabilities. These investments helped us drive operational and hiring efficiencies, resulting in cost reductions, in addition to the impact of our cost-saving initiatives. From 2021, the UK bank levy was partially allocated to global businesses, which was previously retained in Corporate Centre, resulting in an additional $47m of operating expenses in 2021.
During 2021, we delivered $13bn of gross RWA reductions, taking our cumulative total to $26bn since January 2020, as part of our transformation programme.
| | | | | | | | | | | | | | | | | |
| Management view of adjusted revenue<> | 2021
$m | 2020 $m | 2019 $m | 2021 vs 2020 |
| $m | % |
| Global Trade and Receivables Finance | 1,945 | | 1,784 | | 1,876 | | 161 | | 9 | |
| Credit and Lending | 6,052 | | 5,828 | | 5,617 | | 224 | | 4 | |
| Global Liquidity and Cash Management | 3,575 | | 4,252 | | 6,066 | | (677) | | (16) | |
Markets products, Insurance and Investments and Other1 | 1,843 | | 1,854 | | 2,035 | | (11) | | (1) | |
| – of which: share of revenue for Markets and Securities Services and Banking products | 1,065 | | 950 | | 965 | | 115 | | 12 | |
Net operating income2 | 13,415 | | 13,718 | | 15,594 | | (303) | | (2) | |
1 Includes CMB’s share of revenue from the sale of Markets and Securities Services and Banking products to CMB customers. GBM’s share of revenue from the sale of these products to CMB customers is included within the corresponding lines of the GBM management view of adjusted revenue. Also includes allocated revenue from Markets Treasury, HSBC Holdings interest expense and Argentina hyperinflation.
2 ’Net operating income’ means net operating income before change in expected credit losses and other credit impairment charges (also referred to as ‘revenue’).
Divisional highlights
9%
Growth in adjusted net fee income from $3.3bn in 2020 to $3.6bn in 2021, rising above pre-pandemic levels. <>
30%
Growth in GTRF lending from $44.4bn in 2020 to $57.6bn in 2021, growing to above pre-pandemic levels.<>
$6.7bn
$13.4bn
Global Banking and Markets
Contribution to Group adjusted profit before tax<>
| | |
| % contribution to Group |
| 24 | % |
We repositioned our capital and resources in Global Banking and Markets to create capacity for growth opportunities, mainly into Asia and the Middle East, and to serve international clients that are aligned to our strategy. Our product specialists deliver a comprehensive range of transaction banking, financing, capital markets and advisory, as well as risk management services. Our products, combined with our expertise across industries, enable us to help clients achieve their sustainability goals.
GBM adjusted profit before tax increased, reflecting a net release in adjusted ECL in 2021. While adjusted revenue fell, there was continued momentum in Equities, Capital Markets and Advisory, as well as our Securities Services business, where during 2021 assets under custody surpassed $10tn for the first time. We also continued to invest in technology to support our clients and to improve our operational resilience.
| | | | | | | | | | | | | | | | | |
| Adjusted results<> | 2021
$m | 2020
$m | 2019
$m | 2021 vs 2020 |
| $m | % |
| Net operating income | 15,002 | | 15,768 | | 15,282 | | (766) | | (5) | |
| Change in expected credit losses and other credit impairment charges | 337 | | (1,289) | | (155) | | 1,626 | | 126 | |
| Operating expenses | (10,006) | | (9,640) | | (9,891) | | (366) | | (4) | |
| Share of profit in associates and JVs | — | | — | | 1 | | — | | — | |
| Profit before tax | 5,333 | | 4,839 | | 5,237 | | 494 | | 10 | |
RoTE excluding significant items (%)1 | 8.6 | | 6.7 | | 9.8 | | | |
1 Since 1 January 2021, the UK bank levy has been included in the calculation of this measure. Comparative data have not been re-presented.
Supporting customers to net zero
Etihad Airways has pledged to reduce CO2 emissions to 50% of 2019 levels by 2035 on the way to reaching net zero by 2050.
As part of this transition, we helped the UAE’s national airline raise $1.2bn with the first sustainability-linked loan in the global aviation industry to embed publicly disclosed environment, social and governance targets. We held joint ESG structuring and coordinator roles, as well as being joint bookrunner and mandated lead arranger. The targets included the amount of carbon emissions Etihad cuts from its passenger fleet, with financial penalties and incentives of up to $5.5m.
The loan builds on a $600m sustainability-linked Islamic bond, or sukuk, we helped arrange in October 2020.
Financial performance
Adjusted profit before tax of $5.3bn was $0.5bn or 10% higher than in 2020. This reflected a net release of adjusted ECL, compared with a significant build-up of allowances in 2020, although adjusted revenue fell and adjusted operating expenses rose.
Adjusted revenue of $15.0bn decreased by $0.8bn compared with 2020.
In MSS, revenue fell by $0.7bn or 8%, compared with a strong comparative period, primarily in Global Foreign Exchange and Global Debt Markets, from a reduction in client activity.
•In Equities, our diversified product mix and geographical coverage enabled us to benefit from volatility in Asian markets, particularly in wealth products, resulting in revenue growth of $0.4bn or 45%.
•In Securities Services, we continued to grow fees from client inflows and market-related growth, and increased average assets under custody by 18% to over $10tn. Net interest income decreased by 16% as lower global interest rates were in part mitigated by growth in average cash balances.
In Banking, revenue fell by $0.1bn or 2%.
•In GLCM, revenue fell by $0.2bn or 10%, as lower global interest rates compressed margins. This was partly offset by growth in average balances of 4% and increased fee income, reflecting higher transaction volumes.
•Revenue in Credit and Lending and GTRF was adversely affected by strategic actions taken to reduce RWAs.
•Capital Markets and Advisory benefited from a strong performance in leveraged and acquisition finance, particularly in the US, although debt underwriting volumes fell.
Adjusted ECL were a net release of $0.3bn, reflecting an improved economic outlook. This compared with a net charge of $1.3bn in 2020. ECL in 2021 also included an increase in allowances in the fourth quarter, reflecting recent developments in China’s commercial real estate sector.
Adjusted operating expenses of $10.0bn were $0.4bn or 4% higher from an increase in performance-related pay of approximately $0.2bn and higher technology investment. From 2021, the UK bank levy was partially allocated to global businesses, which was previously retained in Corporate Centre, resulting in an additional $0.2bn of operating expenses in 2021. These increases were partly offset by the impact of our cost-saving initiatives.
At 31 December 2021, we had delivered $77bn of cumulative gross RWA reductions as part of our transformation programme, reflecting the completion of structural elements of our transformation programme and approximately 90% of our target.
| | | | | | | | | | | | | | | | | | |
Management view of adjusted revenue<>1 | | 2021
$m | 2020 $m | 2019 $m | 2021 vs 2020 |
| $m | % |
| Markets and Securities Services | | 8,288 | | 8,997 | | 7,984 | | (709) | | (8) | |
| – Securities Services | | 1,923 | | 1,832 | | 2,075 | | 91 | | 5 | |
| – Global Debt Markets | | 878 | | 1,464 | | 1,043 | | (586) | | (40) | |
| – Global Foreign Exchange | | 3,355 | | 4,140 | | 3,179 | | (785) | | (19) | |
| – Equities | | 1,224 | | 844 | | 598 | | 380 | | 45 | |
| – Securities Financing | | 878 | | 988 | | 1,056 | | (110) | | (11) | |
| – Credit and funding valuation adjustments | | 30 | | (271) | | 33 | | 301 | | >100% |
| Banking | | 6,610 | | 6,748 | | 7,571 | | (138) | | (2) | |
| – Global Trade and Receivables Finance | | 714 | | 706 | | 703 | | 8 | | 1 | |
| – Global Liquidity and Cash Management | | 1,838 | | 2,034 | | 2,751 | | (196) | | (10) | |
| – Credit and Lending | | 2,596 | | 2,687 | | 2,785 | | (91) | | (3) | |
| – Capital Markets and Advisory | | 1,256 | | 1,073 | | 872 | | 183 | | 17 | |
– Other2 | | 206 | | 248 | | 460 | | (42) | | (17) | |
| GBM Other | | 104 | | 23 | | (273) | | 81 | | >100% |
| – Principal Investments | | 377 | | 115 | | 267 | | 262 | | >100% |
– Other3 | | (273) | | (92) | | (540) | | (181) | | >(100)% |
Net operating income4 | | 15,002 | | 15,768 | | 15,282 | | (766) | | (5) | |
1 From 1 June 2020, revenue from Issuer Services, previously reported in Securities Services, was reported in Banking. This resulted in $80m revenue being recorded in Securities Services in 2020. Comparative data have not been re-presented.
2 Includes portfolio management, earnings on capital and other capital allocations on all Banking products.
3 Includes notional tax credits and Markets Treasury, HSBC Holdings interest expense and Argentina hyperinflation.
4 ‘Net operating income’ means net operating income before change in expected credit losses and other credit impairment charges (also referred to as ‘revenue’).
Divisional highlights
48%
Adjusted revenue generated in Asia in 2021. <>
$28.9bn
Reduction in reported RWAs compared with 31 December 2020.
$5.3bn
$15.0bn
Corporate Centre
The results of Corporate Centre primarily comprise the share of profit from our interests in our associates and joint ventures. It also includes Central Treasury, stewardship costs and consolidation adjustments.
Corporate Centre performance improved from 2020, mainly due to a higher adjusted share of profit from associates and joint ventures and a lower UK bank levy charge.
| | | | | | | | | | | | | | | | | |
| Adjusted results<> | 2021
$m | 2020
$m | 2019
$m | 2021 vs 2020 |
| $m | % |
| Net operating income | (437) | | (287) | | (581) | | (150) | | (52) | |
| Change in expected credit losses and other credit impairment charges | 3 | | 1 | | 38 | | 2 | | 200 | |
| Operating expenses | 215 | | (429) | | (821) | | 644 | | 150 | |
| Share of profit in associates and JVs | 3,011 | | 2,186 | | 2,440 | | 825 | | 38 | |
| Profit before tax | 2,792 | | 1,471 | | 1,076 | | 1,321 | | 90 | |
RoTE excluding significant items (%)1 | 5.6 | | 3.1 | | 0.8 | | | |
1 Since 1 January 2021, the UK bank levy has been included in the calculation of this measure. Comparative data have not been re-presented.
Financial performance
Adjusted profit before tax of $2.8bn was $1.3bn higher than in 2020 due to an increased adjusted share of profit from associates and joint ventures and a net favourable movement in adjusted operating expenses, partly offset by adverse movements in adjusted revenue.
Adjusted revenue decreased by $0.2bn, mainly in Central Treasury, from a net adverse fair value movement of $0.3bn relating to the economic hedging of interest rate and exchange rate risk on our long-term debt with associated swaps. This was partly offset by the non-recurrence of revaluation losses on investment properties in 2020.
Adjusted operating expenses were a net credit of $0.2bn, which was $0.6bn favourable compared with 2020. This was driven by a reduction of $0.6bn in the UK bank levy, reflecting a change in the basis of calculation to only include the UK balance sheet rather than the global balance sheet, and by a credit of $0.1bn relating to the 2020 charge. In addition, in 2021 the UK bank levy was partially allocated to our global businesses, notably to GBM, resulting in a further reduction of $0.2bn. The effect of these changes resulted in a net credit of $0.1bn in Corporate Centre, compared with a charge of $0.8bn in 2020. This decrease was partly offset by lower recoveries from our global businesses.
Adjusted share of profit in associates and joint ventures of $3.0bn increased by $0.8bn. The increases were from BoCom and SABB, as well as from BGF in the UK, reflecting a recovery in asset valuations relative to 2020.
| | | | | | | | | | | | | | | | | | |
| Management view of adjusted revenue<> | | 2021
$m | 2020 $m | 2019 $m | 2021 vs 2020 |
| $m | % |
Central Treasury1 | | (99) | | 157 | | 179 | | (256) | | >(100) |
| Legacy portfolios | | (33) | | (20) | | (115) | | (13) | | (65) | |
Other2 | | (305) | | (424) | | (645) | | 119 | | 28 | |
Net operating income3 | | (437) | | (287) | | (581) | | (150) | | (52) | |
1 Central Treasury includes adverse valuation differences on issued long-term debt and associated swaps of $99m (2020: gains of $151m; 2019: gains of $146m).
2 Revenue from Markets Treasury, HSBC Holdings net interest expense and Argentina hyperinflation were allocated to the global businesses, to align them better with their revenue and expense. The total Markets Treasury revenue component of this allocation for 2021 was $2,339m (2020: $2,849m; 2019: $2,075m).
3 ’Net operating income’ means net operating income before change in expected credit losses and other credit impairment charges (also referred to as ‘revenue’).
Risk overview
Active risk management helps us to achieve our strategy, serve our customers and communities and grow our business safely.
Managing risk
The Covid-19 pandemic and its effect on the global economy have continued to impact our customers and our organisation. Despite the successful roll-out of vaccines around the world, a varying degree of uncertainty remained throughout 2021. This was caused by new variants of Covid-19, varying vaccine effectiveness rates and the need for the reimposition of government-imposed restrictions. While the global economic recovery in 2021 eased financial difficulties for some of our customers, the future effects remain uncertain.
Throughout the pandemic, we have continued to support our customers and adapted our operational processes. We maintained high levels of service as our people, processes and systems responded to the required changes.
The financial performance of our operations varied in different geographies, but our balance sheet and liquidity remained strong. This helped us to support our customers both during periods of government-imposed restrictions and when these restrictions were eased.
Tensions between China and the US, the UK, the EU, India and other countries were heightened during 2021. In addition, the potential for an escalation of hostilities between Russia and Ukraine further complicates the geopolitical landscape. The macroeconomic, trade and regulatory environments have become increasingly fragmented through disruptions to supply chains, increasing inflationary pressures, and market concerns regarding potential impacts following instability in China’s commercial real estate sector. We continue to monitor the situation closely.
We continued to focus on improving the quality and timeliness of the data used to inform management decisions, through measures such as early warning indicators, prudent active risk management of our risk appetite, and ensuring regular communication with our Board and key stakeholders.
Our risk appetite
Our risk appetite defines our desired forward-looking risk profile, and informs the strategic and financial planning process. It provides an objective baseline to guide strategic decision making, helping to ensure that planned business activities provide an appropriate balance of return for the risk assumed, while remaining within acceptable risk levels. Additionally, it supports senior management in allocating capital, funding and liquidity optimally to finance growth, while monitoring exposure to non-financial risks.
Capital and liquidity are at the core of our risk appetite framework, with forward-looking statements informed by stress testing. We continue to evolve our climate risk appetite to reflect the risks from climate change, setting out the measures we intend to take to support our climate ambition and our commitments to regulators, investors and stakeholders.
During 2021, metrics monitoring the change in expected credit losses and other credit impairment charges returned to within their defined risk appetite thresholds. This was achieved by the release in allowances for expected credit losses, reflecting: an improvement of the economic outlook; the adaption of our strategy following the Covid-19 pandemic; enhancements to how we monitor risks; reviews of our portfolios that are highly vulnerable to the economic environment; and the implementation of additional review measures for new credit requests.
| | | | | | | | | | | |
| Key risk appetite metrics |
| Component | Measure | Risk appetite | 2021 |
| Capital | CET1 ratio – end point basis | ≥13.0% | 15.8 | % |
| Change in expected credit losses and other credit impairment charges | Change in expected credit losses and other credit impairment charges as a % of advances: (WPB) | ≤0.50% | (0.06) | % |
Change in expected credit losses and other credit impairment charges as a % of advances: wholesale (GBM, CMB) | ≤0.45% | (0.10) | % |
Stress tests
We regularly conduct stress tests to assess the resilience of our balance sheet and our capital adequacy, as well as to provide actionable insights into how key elements of our portfolios may behave during crises. We use the outcomes to calibrate our risk appetite and to review the robustness of our strategic and financial plans, helping to improve the quality of management’s decision making. Stress testing analysis assists management in understanding the nature and extent of vulnerabilities to which the Group is exposed. The results from the stress tests also drive recovery and resolution planning to help enhance the Group’s financial stability under various macroeconomic scenarios. The selection of stress scenarios is based upon the identification and assessment of our top and emerging risks identified and our risk appetite.
In 2021, the Bank of England (‘BoE’) required all major UK banks to conduct a solvency stress test to assess whether the capital buffers that banks had built during the Covid-19 pandemic were sufficient to deal with a prevailing stress period. This exercise differed from previous BoE stress tests, which were used to determine the capital requirements for participating banks. The 2021 solvency stress test incorporated a ‘double dip’ scenario, whereby an economy faces a recession and then a partial or full recovery for a short period of time before entering a second recessionary period. Additionally, it represented an intensification of the macroeconomic shocks seen in 2020, with economic weaknesses persisting around the world, leading to ongoing weaknesses in global GDP.
We also conducted our own internal stress test, which explored the potential impacts of key vulnerabilities to which we are exposed, including geopolitical issues and the Covid-19 pandemic. The internal stress test considered the impacts of various risk scenarios across all risk types and on capital resources. The results of the internal stress test were shared with senior management, and showed that after taking appropriate actions, the Group would remain adequately capitalised.
In 2021, the Prudential Regulation Authority (‘PRA’) requested all major UK banks to run a climate-related stress test to explore the impacts of a set of scenarios: an early policy action, a late policy action and no additional policy action. To support the requirements for assessing the impacts of climate change, we have developed a set of capabilities to execute climate stress testing and scenario analysis. These are used to improve our understanding of our risk exposures for risk management and business decision making. In addition to the PRA requirements, we also delivered regulatory climate change stress testing exercises to a number of other regulators including the Hong Kong Monetary Authority and the Monetary Authority of Singapore. These have provided us with insights to identify appropriate areas of further development and actions to mitigate against the impact of climate change.
Our operations
We remain committed to investing in the reliability and resilience of our IT systems and critical services that support all parts of our business. We do so to help protect our customers, affiliates and counterparties, and to help ensure that we minimise any disruption to services that could result in reputational and regulatory consequences. We continue to operate in a challenging environment in which cyber threats are prevalent. We continue to invest in business and technical controls to help defend against these threats.
We are making progress with the implementation of our business transformation plans, while seeking to ensure that we are able to manage safely the risks of the restructuring, which include execution, operational, governance, reputational, conduct and financial risks.
For further details on our risk management framework and risks associated with our banking and insurance manufacturing operations, see pages 171 and 172 respectively.
Risks related to Covid-19
A global vaccination roll-out in 2021 helped reduce the social and economic impact of the Covid-19 pandemic, although there has been significant divergence in the speed at which vaccines have been deployed around the world. By the end of 2021, high vaccination rates had ensured that many Covid-19-related restrictions on activity in developed markets had been lifted and travel constraints were easing. However, the emergence of the Omicron variant in late 2021 demonstrated the continued risk new variants pose. There remains a divergence in approach taken by countries to the level of restrictions on activity and travel in response to the pandemic. Such diverging approaches to future pandemic waves could prolong or worsen supply chain and international travel disruptions. A full return to pre-pandemic levels of social interaction across all our key markets is unlikely in the short to medium term.
Our ECL models continue to be impacted by the pandemic, as a result of the continued economic uncertainty caused by new Covid-19 variants. We continued to carry out enhanced monitoring of model outputs and use of model overlays, including management judgemental adjustments based on the expert judgement of senior credit risk managers. In addition, we recalibrated certain key loss models to take into account the impacts of Covid-19 on critical model inputs. We also responded to complex conduct considerations and heightened risk of fraud related to the varying government support measures and restrictions. The continued economic uncertainty resulting from the pandemic could adversely impact our revenue assumptions, notably volume growth.
Our operations have been resilient throughout the pandemic. However, the operational support functions on which the Group relies are based in a number of countries worldwide, some of which have been particularly affected by the Covid-19 pandemic during 2021. As a result, business continuity responses have been implemented and the majority of service level agreements have been maintained in locations where the Group operates. We continue to monitor the situation closely, in particular in those countries and regions where Covid-19 infections are most prevalent and/or where travel restrictions are in place.
For further details on our approach to the risks related to Covid-19, see ‘Areas of special interest’ on page 167.
Geopolitical and macroeconomic risks
The macroeconomic, trade and regulatory environment has become increasingly fragmented, with the spread of new variants of Covid-19, alongside other factors, continuing to disrupt supply chains in several industries globally. It remains to be seen how supply chains will be impacted by the Omicron or other future variants. The mismatch between supply and demand has pushed up commodity and other prices, particularly in the energy sector, creating further challenges for monetary authorities and our customers. Against the backdrop of both a vaccine-led economic recovery and increasing inflationary pressures, interest rates generally rose during 2021. Central banks in developed markets have either begun, or are expected to soon begin, to raise benchmark rates in order to help ease inflationary pressures, although rates are expected to remain low by historical standards, as uncertainties over the economic outlook continue.
Market concerns remain about repercussions for the Chinese domestic economy from recent instability in its commercial real estate sector. Such repercussions may occur directly through financial exposures to the Chinese commercial real estate sector, or indirectly through the effect of a slowdown in economic activity in China and in the supply chain to the real estate sector. According to the Chinese government’s ‘three red lines’ framework used to govern the real estate sector, at 31 December 2021 we had no direct credit exposure to developers in the 'red' category, noting that deteriorating operating performance and challenging liquidity conditions were seen more broadly across the sector. We continue to monitor the situation closely, including potential indirect impacts, and seek to take mitigating actions as required.
In December 2021, the OECD published model rules that provided a template for countries to implement a new global minimum tax rate of 15% from 2023. In January 2022, the UK government opened a consultation on how the UK plans to implement the rules. The impact on HSBC will depend on exactly how the UK implements the model rules, as well as the profitability and local tax liabilities of HSBC’s operations in each tax jurisdiction from 2023. Separately, potential changes to tax legislation and tax rates in the countries in which we operate could increase our effective tax rate in future as governments seek revenue to pay for Covid-19 support packages.
Heightened tensions across the geopolitical landscape could also have implications for the Group and its customers. The relationship between the UK and the EU may come under further strain in 2022 with a number of potential areas of tension, notably the Northern Ireland Protocol, with possible repercussions for the operation of the EU-UK Trade and Cooperation Agreement. Diplomatic tensions between China and the US, and extending to the UK, the EU, India and other countries, and developments in Hong Kong and Taiwan, may affect the Group, creating regulatory, reputational and market risks. The US, the UK, the EU, Canada and other countries have imposed various sanctions and trade restrictions on Chinese individuals and companies. In response, China has announced sanctions, trade restrictions and laws that could impact the Group and its customers.
The financial impact on the Group of geopolitical risks in Asia is heightened owing to the strategic importance of the region in terms of profitability and prospects for growth. Business sentiment in some sectors in Hong Kong remains subdued, although the financial services sector has remained strong and has benefited from stable liquidity conditions.
Additionally, the US, the UK and the EU have threatened to expand sanctions significantly against Russia in response to an increasing risk of hostilities in Ukraine, which, together with any military conflict, could impact global markets as well as the Group and its customers. We continue to monitor developments and seek to manage the associated impacts on our customers and business.
For further details on our approach to geopolitical and macroeconomic risks, see ‘Top and emerging risks’ on page 148.
Climate risk
In 2021, the pace and volume of policy and regulatory changes and expectations increased, amid a global focus on formalising climate risk management, stress testing and scenario analysis and disclosures. We aim to manage climate risk across all our businesses in line with our Group-wide risk management framework. Our most material risks in terms of managing climate risk relate to corporate and retail client financing within our banking portfolio, but there are also significant responsibilities in relation to asset ownership by our insurance business and employee pension plans, as well as from the activities of our asset management business.
Climate change can have an impact across our risk taxonomy through both transition and physical channels. These have the potential to cause both idiosyncratic and systemic risks, resulting in potential financial and non-financial impacts for HSBC.
We continue to monitor the impacts of climate risk and accelerate the development of our climate risk management capabilities, through our dedicated climate risk programme. While financed emissions and other climate risk reporting has improved over time, data remains of limited quality and consistency. Developments in data and methodologies are expected to continue to help improve and enhance our measurement and reporting of climate risk and financed emissions.
For further details of our approach to climate risk management, see ‘Areas of special interest’ on page 167.
Ibor transition
During 2021, our interbank offered rate (‘Ibor’) transition programme – which is tasked with the development of new near risk-free rate (‘RFR’) products and the transition of legacy Ibor products – continued to facilitate engagement with our clients, and finalise IT and operational changes necessary to enable an orderly transition from Ibors to RFRs, or alternative benchmarks, such as policy interest rates. Following the announcement by ICE Benchmark Administration Limited in March 2021 that the publication of the US dollar London interbank offer rate (‘Libor’) would be extended to 30 June 2023, the Group’s transition programme focused mainly on client engagement for sterling, Swiss franc, euro and Japanese yen Libor interest rates, as well as Euro Overnight Index Average (‘Eonia’). These interest rate benchmarks were all demised from the end of 2021 although six sterling and Japanese yen settings are currently being published under an amended methodology, commonly known as ‘synthetic’ Libor. Over 90% of legacy contracts referencing rates that were demised from the end of 2021 were transitioned prior to 31 December 2021. The programme continues to support customers with transitioning remaining contracts linked to these rates, as well as customers whose contracts are utilising ‘synthetic’ sterling or Japanese yen Libor rates. In 2022, the programme will focus on the transition of these remaining contracts in addition to the wider portfolio of US dollar Libor legacy contracts.
At 31 December 2021, our exposure to contracts referencing rates that were demised from the end of 2021 included: contracts that have been transitioned but are yet to reach the next subsequent relevant interest payment date; contracts where the Ibor rate exposure only arises at a future date; legacy Ibor contracts that included robust industry fallback provisions that were invoked after 31 December 2021; and a small proportion of so-called ‘tough legacy’ contracts which will either use a ‘synthetic’ Libor or a contractual fallback rate.
For any ‘tough legacy’ contracts we continue to work with our clients and investors with the aim of transitioning them to appropriate products and interest rates at the earliest opportunity. In the meantime, these contracts will be valued using the appropriate interest rate methodology.
The key risks associated with Ibor transition beyond 2021 are unchanged and include regulatory compliance risk, resilience risk, financial reporting risk, legal risk and market risk. For ‘tough legacy’ contracts, we closely monitor legal, resilience and regulatory compliance risks. For the US dollar legacy portfolio these risks continue to be actively managed and mitigated with a focus on ensuring that fair outcomes for our clients are achieved.
For further details on our approach to Ibor transition, see ‘Top and emerging risks’ on page 148.
Top and emerging risks
Our top and emerging risks identify forward-looking risks so that they can be considered in determining whether any incremental action is needed to either prevent them from materialising or to limit their effect.
Top risks are those that have the potential to have a material adverse impact on the financial results, reputation or business model of the Group. We actively manage and take actions to mitigate our top risks, Emerging risks are those that while they could have a material impact on our risk profile were they to occur, are not considered immediate and are under regular review.
Our suite of top and emerging risks is subject to regular review by senior governance forums. In December 2021, we amended our top and emerging risks. ‘Environmental, social and governance’ replaced ‘Climate-related risks’ to cover the wider scope of climate, nature and human rights risks. ‘Digitalisation and technological advances’ was added as a new risk to capture the emerging strategic and operational risks associated with the advancement of technology.
| | | | | | | | |
| Risk | Trend | Mitigants |
| Externally driven | | |
Geopolitical and macroeconomic risks
| >
| We monitor macroeconomic risks and risks posed by heightened tensions across the geopolitical landscape. We adopt procedures and controls based on an assessment of the potential impacts on our portfolios. We maintain heightened monitoring activities to identify sectors and customers experiencing financial difficulties from the Covid-19 pandemic. In light of geopolitical tensions, we assess those sectors likely to be particularly impacted by laws and regulatory actions resulting from such tensions. |
| Cyber threat and unauthorised access to systems | >
| We help protect our customers and organisation by investing in our cybersecurity capabilities, helping us to execute our business priorities and grow safely. We focus on controls to prevent, detect and mitigate the impacts of persistent and increasingly advanced cyber threats. We closely monitor the continued dependency on widespread remote working and online facilities.
|
Regulatory compliance risk environment, including conduct
| > | We monitor regulatory and wider industry developments closely and engage with regulators, as appropriate, to help ensure new regulatory requirements are implemented effectively and in a timely way, adjusting our policies, procedures and relevant controls as required. We keep abreast of the emerging regulatory compliance and conduct agenda. Current areas of focus include developments in areas such as ESG, operational resilience, digital and technology changes (including payments), how we are ensuring good customer outcomes (including addressing customer vulnerabilities), regulatory reporting and employee compliance. |
| Financial crime risk environment | > | We continued to support our customers as our financial crime landscape evolved due to the Covid-19 pandemic, and as geopolitical, socioeconomic and technological shifts occurred across our markets. We continued to make improvements to our financial crime controls as emerging risks were identified, and to invest in advanced analytics and artificial intelligence as key elements of our next generation of tools to fight financial crime. |
| Ibor transition | > | We remain focused on completing the system and product updates to support additional geographies in the transition of demising Libor benchmarks, in particular US dollar Libor. We continue to support the transition of all legacy contracts referencing demised and demising Ibor benchmarks, including from any sterling or Japanese yen contracts using ‘synthetic’ Libor. Throughout 2022, there will be an increasing focus on customer engagement for US dollar Libor-related transition activities. |
Environmental, social and governance
| ^
| ESG risk has increased owing to the pace and volume of regulatory developments globally, with the focus on formalising climate risk management, enhanced disclosures, and integration of other ESG risks such as nature-related risks and human rights. Some stakeholders are also placing more emphasis on financial institutions’ actions and investment decisions in respect of ESG matters. We continue to develop our approach and engage with our stakeholders on ESG risk. |
| Digitalisation and technological advances | ^ | We monitor advances in technology to understand how changes may impact our customers and business. We closely monitor and assess the potential for consequent financial crime and the resulting impact on payment transparency and architecture. |
| Internally driven | |
| IT systems infrastructure and resilience | >
| We monitor and improve IT systems and network resilience to minimise service disruption and improve customer experience. To support the business strategy, we continue to strengthen our end-to-end service management, build and deployment controls and system monitoring capabilities. |
| Risks associated with workforce capability, capacity and environmental factors with potential impact on growth | > | We monitor workforce capacity and capability requirements in line with our published growth strategy. We have measures to support our people to work safely during the Covid-19 pandemic, and to integrate them back into the workplace as government restrictions ease. We monitor people risks that may arise due to business transformation to help manage redundancies sensitively and support impacted employees. |
| Risks arising from the receipt of services from third parties | >
| We continually enhance our third-party risk management framework as our supply chain evolves, and to stay aligned to the latest regulatory expectations. We closely monitor for Covid-19-related impacts on the delivery of services to the Group, with businesses and functions taking appropriate action where needed. |
| Model risk management | > | We continue to strengthen our oversight of models and model risk controls. We are redeveloping our capital models to reflect the evolving regulatory requirements, and in some cases the potential effects from the Covid-19 pandemic. Ibor models impacted by the switch to new alternative risk-free rates are also being redeveloped. We enhanced the oversight of models used in financial reporting processes in light of the potential impacts from the uncertain external environment. |
| Data management | > | We protect our customers and organisation by making focused investments in capabilities that manage data risk. We focus on controls that manage data governance, usage, integrity, privacy and retention. During 2021, we refreshed our data strategy and continued to improve our approach to data risk management and reporting. |
| Change execution risk | > | We continue to monitor and manage our change execution risk, including our capacity and resources to meet the increased levels of change associated with the delivery of our strategic priorities and regulatory requirements. We are working to deliver sustainable change efficiently and safely, through the embedding of a change framework launched in May 2021. |
^ Risk heightened during 2021
> Risk remained at the same level as 2020
This page is intentionally left blank
Environmental, social and governance review
Our ESG review sets out our approach to our environment, customers, employees and governance. It also explains how we aim to achieve our purpose and deliver our strategy in a way that is sustainable and how we build strong relationships with all of our stakeholders.
43 Our approach to ESG
45 Environmental
66 Social
79 Governance
Our approach to ESG
We are on a journey to incorporate environmental, social and governance principles throughout the organisation, as we have taken material steps to embed sustainability into our purpose and corporate strategy.
About the ESG review
Our purpose is: ‘Opening up a world of opportunity’.
To achieve our purpose and deliver our strategy in a way that is sustainable, we are guided by our values: we value difference; we succeed together; we take responsibility; and we get it done.
We also need to build strong relationships with all of our stakeholders, who are the people who work for us, bank with us, own us, regulate us, and live in the societies we serve and the planet we all inhabit.
We continue to make progress on our climate ambition to support our customers in their transition to net zero and a sustainable future, including through providing and facilitating sustainable finance and investment, as we set out on the following pages.
In May 2021, a climate change resolution proposed by the Board was backed by more than 99% of our shareholders at our Annual General Meeting (‘AGM’), including a commitment to set, disclose and implement a strategy with short- and medium-term targets to align our provision of finance with the goals and timelines of the Paris Agreement. It also included a commitment to publish a policy to phase out the financing of coal-fired power and thermal coal mining, by 2030 in the EU/OECD, and 2040 in all other markets.
We have disclosed our baseline financed emissions for two priority sectors – oil and gas, and power and utilities – and set targets to reduce on-balance sheet financed emissions in these sectors. In assessing financed emissions, we are focusing our analysis on those parts of the sectors that we believe are most material in terms of greenhouse gas emissions.
We are also working with peers and industry bodies to mobilise the financial system to take action on climate change, biodiversity and nature.
Through a series of surveys, we aim to listen to our customers to put them at the centre of our decision making. If things do go wrong, we aim to take action in a timely manner.
Our colleagues have needed to adapt at pace due to the impact of the Covid-19 pandemic. This has offered us the opportunity to rethink how our colleagues work, considering what worked well during the pandemic, and what challenges they face. Our future of work strategy will provide a framework through which we will implement hybrid working principles and adopt new technologies and working practices to enhance productivity, engagement and well-being.
We run a Snapshot survey every six months and report insights to our Group Executive Committee and the Board. We received 272,718 responses to our two Snapshot surveys in 2021, with record response rates. We will look to continue to focus on those aspects of the employee experience that we know to have the greatest impact on employee sentiment: fostering a healthy work-life balance, trust towards leadership, career progression opportunities and confidence in the company’s future.
We are on a journey to embed ESG principles across the organisation, including incorporating climate change-related risks within the risk framework, training our workforce, incorporating climate-related targets within executive scorecards, and engaging with customers and suppliers.
Environmental
•Since 2020, we have provided and facilitated $126.7bn of sustainable finance and investment towards our ambition of $750bn to $1tn by 2030.
•In line with the climate change resolution, we published our thermal coal phase-out policy. For the oil and gas sector, we target a 34% Mt CO2e reduction in oil and gas absolute on-balance sheet financed emissions by 2030, from a 2019 baseline. For the power and utilities sector, we target a 0.14 Mt CO2e/TWh power and utilities on-balance sheet financed emissions intensity, representing a 75% reduction from 2019.
Read more in the Environmental section on page 45.
Social
•We aim to be a top-three bank for customer satisfaction. Even though our performance, using the net promoter score, improved in many markets in which we operate, we still have work to do to improve our rank position against competitors, as some have accelerated their performance faster than us.
Read more in the Customers section on page 67.
•In 2021, 31.7% of women occupied senior leadership roles, with a target to achieve 35% by 2025. We have put in place important foundations to support our goal of doubling the number of Black employees in senior leadership roles by 2025.
•Employee engagement, which is our headline measure, remained unchanged in 2021 at 72% following a five-point increase from 2019 and was four points above benchmark.
Read more in the Employees section on page 70.
Governance
•Governance activities are managed through a combination of specialist governance infrastructure, and regular meetings and committees, where appropriate. We expect that our ESG governance approach will continue to develop, in line with our evolving approach to ESG matters and stakeholder expectations.
•In seeking to safeguard the financial system, we monitor on average over 1.1 billion transactions each month for signs of financial crime.
Read more in the Governance section on page 79.
How we decide what to measure
We listen to our stakeholders in a number of different ways, which we set out in more detail within the ESG review. We use the information they provide us with to identify the issues that are most important to them and consequently also matter to our own business.
Our ESG Committee (previously the ESG Steering Committee) and other relevant governance bodies regularly discuss the new and existing themes and issues that matter to our stakeholders. Our management team then uses this insight, alongside the framework of the ESG Guide (which refers to our obligations under the Environmental, Social and Governance Reporting Guide contained in Appendix 27 to The Rules Governing the Listing of Securities on the Stock Exchange of Hong Kong Limited), and other applicable laws and regulations to choose what we measure and publicly report in this ESG review.
Under the ESG Guide, ’materiality’ is considered to be the threshold at which ESG issues become sufficiently important to our investors and other stakeholders that they should be publicly reported. We are also informed by stock exchange listing and disclosure rules globally. We know that what is important to our stakeholders evolves over time and we plan to continue to assess our approach to ensure we remain relevant in what we measure and publicly report.
Recognising the need for a consistent and global set of ESG metrics, we started to report against the core World Economic Forum (‘WEF’) ‘Stakeholder Capitalism Metrics’ within the Annual Report and Accounts 2021 for the first time.
Consistent with the scope of financial information presented in our Annual Report and Accounts, the ESG review covers the operations of HSBC Holdings plc and its subsidiaries. Given the relative immaturity of the ESG data in general, we are on a continuous journey to ensure completeness and robustness.
For further information on our approach to reporting, see the ‘Additional information’ section on page 1b.
Our reporting around ESG
We report on ESG matters within this ESG review and throughout our Annual Report and Accounts, including the 'How we do business' section of the Strategic Report (pages 15 to 20), this ESG review (pages 43 to 88), and the ‘Climate-related risks’ section of our Risk review (pages 167 to 171). In addition, we have other supplementary materials, including our ESG Data Pack, which provides a more granular breakdown of ESG information.
| | | | | | | | |
| Detailed data | Additional reports | Indices |
| ESG Data Pack | UK Pay Gap Report 2021
Modern Slavery and Human Trafficking Statement 2021 | SASB Index 2021
WEF Index 2021 |
For further details of our supplementary materials, see our ESG reporting centre at www.hsbc.com/esg.
We have changed how we are presenting our TCFD disclosures
Our overall approach to TCFD can be found on page 19 and additional information is included on page 63. Further details, which last year were presented in a separate supplement, have been embedded in this section and the Risk review section on pages 167 to 171.
Assurance relating to ESG data
We recognise the importance of ESG disclosures and the quality of data underpinning it. Certain aspects of our ESG disclosures are subject to independent assurance and we will continue to enhance our approach in line with external expectations.
For 2021, ESG data is subject to stand-alone third-party limited assurance reports in accordance with International Standard on Assurance Engagements 3000 (Revised) ‘Assurance Engagements other than Audits or Reviews of Historical Financial Information’ and, in respect of the greenhouse gas emissions, in accordance with International Standard on Assurance Engagements 3410 ‘Assurance engagements on greenhouse gas statements’, issued by the International Auditing and Assurance Standards Board, on the following specific ESG-related metrics:
•our Green Bond Report 2021 (published in December 2021);
•our 2019 baseline for financed emissions related to our climate change resolution (see page 48);
•our own operations’ scope 1, 2 and 3 (business travel) greenhouse gas emissions data (see page 52); and
•our progress towards our ambition to provide and facilitate $750bn to $1tn of sustainable finance and investment (see page 53).
Our data dictionaries and methodologies for preparing the above ESG-related metrics and third-party limited assurance reports can be found on: www.hsbc.com/who-we-are/esg-and-responsible-business/esg-reporting-centre.
Environmental
We are accelerating new solutions to the climate crisis and supporting the transition of industries and markets to a net zero future, moving to net zero ourselves as we help our customers do so too.
At a glance
Our climate ambition
Our net zero ambition represents one of our four strategic pillars. At the core of it is an ambition to support our customers on their transition to net zero, so that the greenhouse gas emissions from our portfolio of clients reaches net zero by 2050. We also aim to be net zero in our operations and supply chain by 2030.
We aim to provide and facilitate $750bn to $1tn of sustainable finance and investment to support our customers in their transition to net zero and a sustainable future by 2030. To support our ambition of net zero financed emissions, unlocking transition finance for our portfolio of clients will be crucial.
As we describe in the following pages, we have set on-balance sheet financed emissions targets for the oil and gas, and power and utilities sectors, aligned to the IEA’s net zero scenario, underpinned by a clear science-based strategy.
Our approach to climate risk
We recognise that to achieve our climate ambition we need to further enhance our approach to managing climate risk. We have established a dedicated programme to develop a strong climate risk management capability.
We manage climate risks in line with our risk management framework and three lines of defence model. We also use stress testing and scenario analysis to assess how these risks will impact our customers, business and infrastructure. This approach gives the Board and senior management visibility and oversight of the climate risks that could have the greatest impact on HSBC, and helps us identify opportunities to deliver sustainable growth in support of our climate ambition. For further details on our approach to climate risk management, see Environmental, social and governance risk on page 149 and Climate-related risks on page 167.
Impact on financial statements
We have assessed the impact of climate risk on our balance sheet and have concluded that there is no material impact on the financial statements for the year ended 31 December 2021. We considered the impact on expected credit losses, classification and measurement of financial instruments, our owned properties, as well as our long-term viability and going concern.
During the year we also conducted a stress test to understand the impact of climate risk. While the focus of the exercise was solely on banking book impairments and RWAs, no issues were identified regarding the going concern status of the Group. For further details on how climate risk can impact HSBC in the medium to long term, including credit risk, see page 167.
| | | | | | | | | | | | | | |
| In this section | | | | |
| Our climate ambition | Becoming a net zero bank | We aim to achieve net zero in our financed emissions by 2050, and in our own operations and supply chain by 2030. | Page | 46 |
| Measuring our financed emissions | In delivering our financed emissions ambition, we have initially focused on the oil and gas, and power and utilities sectors. | Page | 47 |
| Our approach to our own operations | We aim to reduce energy consumption by 50% by 2030, against a 2019 baseline. | Page | 51 |
| Supporting customers through transition | Our ability to finance the transformation of businesses and infrastructure is key to building a sustainable future for our customers and society. | Page | 53 |
| Unlocking climate solutions and innovations | We are working closely with a range of partners to accelerate investment in natural resources, technology and sustainable infrastructure. | Page | 55 |
| Biodiversity and natural capital strategy | By addressing nature-related risks and investing in nature, we have an opportunity to accelerate the transition to net zero. | Page | 55 |
| Our approach to climate risk | Managing risk for our stakeholders | We manage climate risk across all our businesses in line with our Group-wide risk management framework. | Page | 56 |
| Insights from scenario analysis | Enhancing our climate change stress testing and scenario analysis capability is crucial in identifying and understanding climate-related risks and opportunities. | Page | 57 |
| Our approach to sustainability policies | Our sustainability risk policies seek to ensure that the financial services that we provide to customers do not contribute to unacceptable impacts on people or the environment. | Page | 62 |
| Our approach to climate reporting | Task Force on Climate-related Financial Disclosures (‘TCFD’) | Our TCFD index provides our responses to each of the 11 recommendations and summarises where additional information can be found. | Page | 63 |
Our climate ambition
Becoming a net zero bank
We are committed to a net zero future. We recognise that our planet urgently needs drastic and lasting action to protect our communities, businesses and the natural environment from the damaging effects of climate change.
The Paris Agreement aims to limit the rise in global temperatures to well below 2°C, preferably to 1.5°C, compared with pre-industrial levels. To limit the rise in global temperatures to 1.5°C, the global economy would need to reach net zero greenhouse gas emissions by 2050. Our ability to steer finance for the transformation of businesses and infrastructure will be key in helping to enable the transition to a net zero global economy.
We believe we can make the most significant impact by working with our customers to support their transition to a net zero future. We aim to align our financed emissions to net zero by 2050 or sooner.
We intend to set targets on a sector by sector basis that are consistent with net zero outcomes by 2050. In assessing financed emissions, we focus on those parts of the sector that are most material in terms of greenhouse gas emissions, and where we believe engagement and climate action have the greatest potential to effect change, taking into account industry and scientific guidance.
As an asset manager, we will work towards the target of net zero emissions across all assets under management by 2050 or sooner.
Our ambition is to become net zero in our operations and supply chain. This covers our direct and indirect greenhouse gas emissions, known as scope 1, 2 and 3 emissions. As well as transforming our own operations and supply chain to net zero across our own organisation by 2030, we are asking our suppliers to do the same.
The next two sections provide further details on how we are measuring our progress on our financed emissions ambition and the progress made to date on our own operations and supply chain.
The diagram below shows how these ambitions map to our scope 1, 2 and 3 emissions.
Explaining scope 1, 2 and 3 emissions
To measure and manage our carbon emissions, we follow the Greenhouse Gas Protocol global framework, which identifies three scopes of emissions. Scope 1 represents the direct emissions we create. Scope 2 represents the indirect emissions resulting from the use of electricity and energy to run a business. Scope 3 represents indirect emissions attributed to upstream and downstream activities taking place to provide services to customers. Our upstream activities include business travel and emissions from our supply chain including transport, distribution and waste. Our downstream activities include those related to investments and financed emissions.
For further details, see our ESG Data Pack at www.hsbc.com/esg.
| | | | | | | | | | | | |
| Our own operations and supply chain | Our financed emissions | |
Scope 2 Indirect | Scope 3 Indirect | Scope 1 Direct | Scope 3 Indirect | |
| | | | |
Electricity,
steam heating
and cooling | Employee commuting1 | Company
facilities | | |
| Investments and financed emissions | |
| Business travel | | |
| | Company
vehicles | |
| Supply chain | | |
| | | | |
| Upstream activities | HSBC Holdings | Downstream activities | |
|
| 1 HSBC - sponsored shuttles only | | | |
| | | | |
Supporting an energy provider through the transition
In March 2021, Air Liquide S.A., a French multinational specialised in gases, technologies and services, presented its plan to achieve carbon neutrality by 2050. The company has placed the use of a competitive low-carbon hydrogen offering at the cornerstone of its energy transition ambition, while aiming to decarbonise its production assets. We aim to support our clients through the transition. In May, we acted as a joint bookrunner for Air Liquide Finance’s inaugural green bond and helped them to raise €500m, which will be dedicated to eligible sustainable projects including hydrogen, biogas, carbon capture, air gases, energy efficiency and green buildings in accordance with its sustainable finance framework.
Measuring our financed emissions
We announced our ambition to become a net zero bank in October 2020, including an aim to align our financed emissions to net zero by 2050 or sooner. In May 2021, shareholders approved a climate change resolution at our AGM that commits us to set, disclose and implement a strategy with short- and medium-term targets to align our provision of finance with the goals and timelines of the Paris Agreement.
Our analysis of financed emissions considers on-balance sheet financing, including project finance and direct lending, as well as financing we help clients access through capital markets activities. Given the different nature of these two forms of financing, we distinguish between ‘on-balance sheet financed’ and ‘facilitated’ emissions where necessary in our reporting. Our analysis covers financing from both Global Banking and Markets, and Commercial Banking.
Financed emissions link the financing we provide to our customers and their activities in the real economy, and helps provide an indication of the greenhouse gas emissions associated with those activities. They form part of our scope 3 emissions, which include emissions associated with the use of a company’s products and services.
Our initial disclosures
We started with measuring our financed emissions for two emissions-intensive sectors: the oil and gas, and power and utilities sectors. On the following pages, we report on the results of our analysis for these two sectors. We plan to measure and report on an annual basis, and intend to extend our analysis in our Annual Report and Accounts 2022 and related disclosures.
Our analysis relies on data disclosed by our customers and other sources that may result in a time lag of one year or longer. We chose to use 2019 data as the basis for our initial disclosures, having taken into consideration potential distortions to economic activity caused by the Covid-19 pandemic during 2020.
The following pages also set out our initial 2030 targets to align our on-balance sheet financed emissions for the oil and gas, and power and utilities sectors to the International Energy Agency’s (‘IEA’) net zero emissions by 2050 scenario. The scenario provides a science-based decarbonisation pathway for the global economy that is consistent with a 1.5°C global warming target.
In developing our approach, we engaged with industry initiatives to help formulate our methodology for assessing and measuring financed emissions. In 2021, we were one of 43 founding members of the Net-Zero Banking Alliance (‘NZBA’), which seeks to reinforce, accelerate, and support the implementation of decarbonisation strategies for the banking sector. We also joined the Partnership for Carbon Accounting Financials (‘PCAF’), which seeks to define and develop greenhouse gas accounting standards for financial institutions.
What is included in our analysis
In 2021, we assessed our financed emissions related to the oil and gas, and power and utilities sectors using 2019 data. We believe these sectors are most material in terms of emissions, and are where we believe engagement and climate action have the greatest potential to effect change.
For the oil and gas sector, we focused on upstream companies, and integrated or diversified energy companies. Our assessment of this portfolio included scope 1, 2 and 3 greenhouse gas emissions of financed counterparties. By focusing on upstream and diversified energy producers, and including scope 3 greenhouse gas emissions, we believe we are accounting for the majority of emissions across the sector. These include emissions associated with the ultimate use of oil and gas products as a fuel source. We have excluded midstream and downstream companies within the sector to limit double-counting and to concentrate engagement with customers whose products contribute most to greenhouse gas emissions in the global economy.
For the power and utilities sector, our analysis focused on upstream power generation companies, including scope 1 and 2 greenhouse gas emissions of financed counterparties. We believe power generation is where the majority of sector emissions occur through the use of fossil fuel as a source of energy. In analysing the power and utilities sector, we did not take account of scope 3 greenhouse gas emissions because we believe them to be immaterial. We believe upstream power producers have the most potential to reduce greenhouse gas emissions by shifting to renewables and other sources of low-emissions power generation.
Regarding the different types of greenhouse gas measured, we include CO2 and methane (measured in CO2e) for the oil and gas sectors, and CO2 only for the power and utilities sector due to data availability and emissions materiality.
To calculate on-balance sheet financed emissions, we used drawn balances at 31 December 2019 related to wholesale credit and lending, which included business loans, trade and receivables finance, and project finance as the value of finance provided to customers in our analysis. We only included facilities with an original duration of 12 months or longer having considered industry guidance. We plan to continue to review the scope of facilities included in our analysis and update our approach following industry guidance.
For facilitated emissions, we used the apportioned value of underwriting for debt and equity issuances and syndicated loans as the proportion of funds provided to companies. We refer to these collectively as capital markets activities. Although we applied a similar methodology to assess facilitated and on-balance sheet financed emissions, using PCAF guidance as our foundation, we expect to continue to report them separately for transparency.
| | | | | | | | | | | | | | | | | | | | | | | | | | | | | | | | |
| Sector | Value chain in scope | | | | | | | |
| Oil and gas | Upstream (e.g. extraction) | | Midstream (e.g. transport) | | Downstream (e.g. fuel use) | | Integrated/ diversified | | | Included in analysis |
| | | | |
| Power and utilities | Upstream (e.g. generation) | | Midstream (e.g. transmission and distribution) | | Downstream (e.g. retail) | | | |
Measuring our financed emissions continued
Our analysis of oil and gas, and power and utilities portfolios
The table below summarises the results of our assessment of financed emissions using 2019 data. It indicates the emissions associated with our financing activities in terms of both absolute emissions and emissions per unit of output relevant to each sector. The table also includes the PCAF data quality scores for the various components of our analysis, as explained further in the box on this page.
From our analysis, total absolute on-balance sheet financed emissions associated with our oil and gas portfolio were more than three times greater than those from power and utilities. Similarly, the emissions associated with each dollar invested, or economic intensity, for our oil and gas portfolio is more than triple that of our power and utilities portfolio. More than 80% of on-balance sheet financed emissions for our oil and gas portfolio were attributed to our customers’ scope 3 emissions.
We found that data quality scores varied across the different components of our analysis, although not significantly. For the oil and gas portfolio, data quality scores for scope 3 emissions were found to be slightly higher due to lower availability of reported data. Differences between the data quality scores for on-balance sheet financed and facilitated emissions reflect the different composition of the customers and weighting of finance provided in each portfolio.
Notes on data and methodology
PCAF provides guidance on how to assess and disclose greenhouse gas emissions associated with loans and investments. It also provides a common approach for addressing variability in the data available to assess emissions.
We applied PCAF’s data quality score to the sources of data we used to determine counterparty emissions. The PCAF scores can be seen in the table below.
The majority of our clients do not yet report the full scope of greenhouse gas emissions included in our analysis, in particular scope 3 emissions. In the absence of client-reported emissions, we estimated emissions using proxies based on company production and revenue figures. We validated data inputs used in our analysis with the global relationship managers for the top clients ranked by financed emissions and covering a significant majority of total financed emissions for each sector portfolio. Although we sought to minimise the use of non-company specific data, we applied industry averages in our analysis where company-specific data was unavailable.
The methodology and data used to assess financed emissions and set targets is new and evolving, and we expect industry guidance, market practice, and regulations to continue to change. We plan to refine our analysis using the data sources and methodologies available for the sectors we analyse, including, among others, the Science Based Targets initiative (‘SBTi’) and the Paris Agreement Capital Transition Assessment (‘PACTA’) methodology. We expect our data quality scores to improve over time as companies continue to expand their disclosures to meet growing regulatory and stakeholder expectations.
Our initial set of baselines and targets may require updating as data availability changes over time and methodology and climate science evolve. We plan to report financed emissions and progress against our targets annually and seek to be transparent in our disclosures about the methodologies applied. However, financed emissions figures may not be reconcilable or comparable year-on-year and targets may require re-evaluation.
For further details of our approach and methodology, see our Financed Emissions – Approach and Methodology Update at www.hsbc.com/who-we-are/esg-and-responsible-business/esg-reporting-centre.
Financed emissions using 2019 data
| | | | | | | | | | | | | | | | | | | | | | | |
| Absolute emissions1 | Emissions intensity2 | | PCAF data quality scores3 |
| Scope 1–2 | Scope 3 | Physical intensity (per unit of output) | | Scope 1–2 | Scope 3 |
On-balance sheet financed emissions — wholesale credit lending and project finance (2019)4,5 | | | |
| Oil and gas | 6.0 † | 29.8 † | 68.4 | | 2.9 † | 3.4 † |
| Power and utilities | 10.1 † | N/A | 0.55 | | 3.0 † | N/A |
Facilitated emissions — capital markets (2019)6 |
| Oil and gas | 3.9 † | 25.6 † | 70.7 | | 2.4 † | 2.9 † |
| Power and utilities | 4.4 † | N/A | 0.36 | | 3.5 † | N/A |
1 Absolute emissions are measured by million tonnes of carbon dioxide equivalent (‘Mt CO2e’).
2 For the oil and gas portfolio, physical emissions intensity is measured in million tonnes of carbon dioxide equivalent per exajoule (‘Mt CO2e/EJ’); for the power and utilities sector, it is measured in million tonnes of carbon dioxide equivalent per terawatt hour (‘Mt CO2e/TWh’).
3 PCAF scores where 1 is high and 5 is low. This is a weighted average score based on loans/advances for on-balance sheet financed emissions, and apportioned value for facilitated emissions.
4 Total loans and advances analysed in 2019 were $23.5bn, comprising $12.3bn for the oil and gas sector, and $11.2bn for the power and utilities sector, representing 1.8% and 1.6% respectively of wholesale credit and lending and project finance at 31 December 2019. This compares with a total wholesale loan exposure of 7% for these two sectors overall, as reported in our TCFD disclosures for 2019, which covered the full value chain and all financing activities. On-balance sheet economic intensity for the oil and gas sector was 2.9 Mt CO2e/$bn, and for power and utilities it was 0.9 Mt CO2e/$bn.
5 For the oil and gas sector, the value chain analysed covers upstream and integrated/diversified operations. For the power and utilities sector, the value chain analysed covers upstream operations.
6 Total capital markets activities analysed in 2019 was $21.1bn, comprising $15.4bn for oil and gas, and $5.7bn for power and utilities.
† Data is subject to third-party limited assurance in accordance with International Standard on Assurance Engagements 3410. ‘Assurance engagements on greenhouse gas statements’. For further details, see our Financed Emissions Methodology and third-party limited assurance reports, which are available at www.hsbc.com/who-we-are/esg-and-responsible-business/esg-reporting-centre.
Measuring our financed emissions continued
Our oil and gas, and power and utilities targets
We have defined targets to 2030 for the on-balance sheet financed emissions of our oil and gas, and power and utilities portfolios, as set out below. These are aligned with global sector decarbonisation pathways set out by the IEA in its net zero emissions by 2050 scenario. For facilitated emissions, we are supporting efforts to establish an industry standard. When this becomes available, we intend to refresh our analysis and set interim targets. The methodology for targets is set out in our Financed Emissions Methodology, which is available at www.hsbc.com/who-we-are/esg-and-responsible-business/esg-reporting-centre.
For the oil and gas sector, we target a reduction of 34% in absolute on-balance sheet financed emissions by 2030, using 2019 as our baseline. Our target is equal to the percentage reduction that the IEA indicates in its scenario for global sector emissions to 2030 from a 2019 baseline. We chose to use an absolute emissions metric in order to reflect a direct link to reducing greenhouse gas emission in the real economy. Our on-balance sheet financed emissions for 2019 was 35.8 million tonnes of carbon dioxide equivalent (‘Mt CO2e’).
For the power and utilities sector, we target an on-balance sheet financed emissions intensity of 0.14 million tonnes of carbon dioxide equivalent per terawatt hour (‘Mt CO2e/TWh’) by 2030. Our emissions intensity target is equal to the global sector average emissions intensity for 2030 set out by the IEA, and represents a 75% reduction compared with our baseline of 0.55 Mt CO2e/TWh for 2019. We chose to use an emissions intensity metric, rather than absolute emissions, as the basis for our 2030 target for the power and utilities portfolio to reflect the need to reduce global greenhouse gas emissions from power generation while also meeting the anticipated increase in electricity demand. Electrification is central to the transition pathways for transport, heating, and other economic activities. This will require scaling up investment and financing for renewable and other low-emission sources of electricity to meet demand.
Our approach to target setting is in line with industry guidance on assessing portfolio alignment, including from – among others – the NZBA and the Financial Services Taskforce (‘FSTF’). Our approach does not rely on purchasing offsets to achieve any financed emissions targets we set.
In selecting a reference scenario to assess alignment to net zero, we reviewed the IEA’s net zero emissions by 2050 scenario against other available science-based 1.5°C scenarios. We believe it provides the greatest level of detail for assessing alignment across relevant sectors at a global level. Choosing this scenario allows us to make comparisons of our portfolio targets with other banks and peers who use this same scenario.
We have used the global decarbonisation pathway set out by the IEA’s net zero emissions by 2050 scenario by sector as the reference for setting targets for our oil and gas, and power and utilities portfolios. The IEA’s net zero emissions by 2050 scenario does not currently provide decarbonisation pathways at a regional level. We completed analysis to help ensure a global pathway is relevant for our financing portfolio and we will continue to assess this as further information becomes available over time. For further details on the IEA net zero by 2050 scenario, see www.iea.org/reports/net-zero-by-2050.
| | | | | |
| Target 34% reduction by 2030 from 2019 |
| | | | | |
| Target 0.14 Mt CO2e/TWh by 2030, representing 75% reduction from 2019 |
Helping to power a European first
We used our global reach and local expertise to attract a diverse base of international and domestic investors in March 2021 when Greece’s largest power producer issued a €650m high-yield sustainability-linked bond – a first for Europe. We acted as joint global coordinator and left-lead bookrunner on the bond, which committed Public Power Corporation to reducing its carbon emissions by 40% by the end of 2022, or face higher financing costs. We were also ratings adviser and ESG structuring adviser supporting the company in achieving an improved sustainability performance target, measured using a Sustainalytics rating. Public Power Corporation has committed to end its reliance on lignite – low-grade brown coal – plants over the next few years and significantly boost its solar and wind power capacity.
Measuring our financed emissions continued
Embedding financed emissions analysis into our business
Our net zero ambition is underpinned by our relationships with customers and collective engagement, so that we are able to support our customers to take action to address climate change in their own activities.
To achieve this, we aim to embed how we manage and assess financed emissions within our financing portfolios to provide a basis for informing client engagement and business management decisions from a climate perspective.
There are three key components we are undertaking to achieve these objectives.
•We are placing climate and sustainability at the centre of our engagement with customers, and in particular those customers with the greatest potential to effect change.
•We are seeking to support our customers in their transition to net zero and a sustainable future. We aim to provide and facilitate $750bn to $1tn of sustainable finance and investment by 2030 (see page 53).
•We are working to embed financed emissions considerations into our business activities and culture. Our global businesses have had active roles alongside our Corporate Sustainability, Global Risk and Compliance, and Global Finance functions in developing our financed emissions approach in 2021. Collaboration across the organisation will continue to be essential. This includes plans to strengthen our climate data and analytics capability to inform decision making and portfolio management, as well as expanding the resources to support business engagement.
As part of our annual disclosures for the year ending 31 December 2022, we plan to report baseline financed emissions and targets for the following sectors: coal mining; aluminium; cement; iron and steel; and transport (including automotive, aviation and shipping). We expect to also report on the agriculture, and commercial and residential real estate sectors in our annual disclosures for the year ending 31 December 2023 at the latest, following baseline analysis for these sectors.
In 2022 we will begin work on our climate transition plan, which will bring together – in one place – how we plan to embed our 2050 and 2030 net zero targets into the Group’s strategy, processes, policies and governance. We plan to publish this in 2023, and update on progress annually thereafter as part of our annual disclosures.
The transition to a net zero global economy has implications for our customers across industries and geographies. It introduces new risks that need to be managed, as well as opportunities. Given our global presence and relationships with clients across industries and customer groups, we recognise the role we can play in helping catalyse this change.
Financed emissions targets to 2030
| | | | | | | | | | | |
| Target metric | Our 2019 baseline | Our 2030 targets1 |
| Oil and gas | Absolute emissions (Mt CO2e)2 | 35.8 | 34 | % |
| Mt CO2e reduction in oil and gas absolute on-balance sheet financed emissions |
| Power and utilities | Physical emissions intensity (Mt CO2e/TWh)3 | 0.55 | 0.14 |
| Mt CO2e/TWh power and utilities on-balance sheet financed emissions intensity, representing 75% reduction from 2019 |
1 Our 2030 targets are based on IEA net zero emissions by 2050 scenario references. The methodology for targets is set out in our Financed Emissions Methodology, which is available at www.hsbc.com/who-we-are/esg-and-responsible-business/esg-reporting-centre.
2 For oil and gas, the IEA indicates in its scenario a reduction of 34% in global sector scope 1,2 and 3 emissions (Mt CO2e) to 2030 from a 2019 baseline.
3 For power and utilities, the IEA indicates a global sector scope 1 and 2 emissions intensity at 2030 of 0.14 Mt CO2e/TWh electricity produced.
Steering the automobile transition
We have been working with Ford Motor Co. towards its sustainability goals with two sustainability-linked transactions in 2021. In September, we supported Ford as it extended its revolving credit facilities worth a combined $15.5bn. Ford amended the credit facilities to include sustainability-linked targets, which included lower emissions from global manufacturing facilities and reduced exhaust emissions from passenger vehicles sold in Europe.
In November, we also acted as a joint lead manager on Ford’s $2.5bn inaugural 10-year green bond under its new sustainable finance framework. This framework targets investments in clean transportation, clean manufacturing, advancing economic opportunity and equity for underrepresented and/or disadvantaged populations and community revitalisation.
Our approach to our own operations
Part of our ambition to be a net zero bank is to achieve net zero carbon emissions in our operations and supply chain by 2030 or sooner.
Reduce, replace and remove
We have three elements to our strategy: reduce, replace and remove. We plan to first focus on reducing carbon emissions from consumption, and then replacing remaining emissions with low-carbon alternatives in line with the Paris Agreement. We plan to remove the remaining emissions that cannot be reduced or replaced by procuring, in accordance with prevailing regulatory requirements, high-quality offsets at a later stage.
Our energy consumption
In October 2020, we announced our ambition to reduce our energy consumption by 50% by 2030, against a 2019 baseline. To do this, we plan to reduce our energy consumption by optimising the use of our real estate portfolio.
In 2017, we announced our ambition to achieve 100% renewable power across our operations by 2030, joining other global companies in the RE100 initiative. In 2021, 37.5% of our electricity was renewable, mainly due to our power purchase agreements of wind and solar energy in the UK, Mexico and India. As part of this energy replacement strategy, in September 2021, we signed our fourth power purchase agreement for the UK. This agreement, which will support the development of the Sorbie Wind Farm project in Ayrshire, south-west of Glasgow, will result in approximately 90% of our UK electricity being sourced from such renewable projects (for further details, see page 19). We continue to look for opportunities to procure green energy in each of our markets. A key challenge is the limited opportunity to pursue power purchase agreements or green tariffs in key markets due to regulations.
We are considering the impact on our emissions from our colleagues working from home during the Covid-19 pandemic, and in the future, as they embrace more flexible ways of working. Using the EcoAct methodology, we calculated the emissions of our colleagues working from home was 4% of total electricity emissions in 2021. This only includes energy consumption from the IT equipment and lighting. We do not report employee home working emissions in our scope 1 and 2 performance data.
Business travel and employee commuting
Our travel emissions continued to reduce in 2021 as a result of ongoing international travel restrictions caused by the pandemic. As international travel gradually resumes, we will update our internal policies with the aim to halve travel emissions by 2030, compared with pre-pandemic levels. We will continue to encourage the use of technological solutions where possible to provide connectivity with colleagues and customers. To ensure we are following best practices, we updated our air travel reporting methodology in 2021 to include cabin class and indirect climate change effects in our travel emission calculations.
We continue to pursue the reduction of vehicles we use in our global markets, and accelerate the use of electric vehicles.
Focus on natural resources
Alongside our net zero operations ambition, our aim is to be a responsible consumer of natural resources. Building on the success of our previous operational environmental strategy, we are identifying the key opportunities where we can lessen our wider environmental impact over the coming decade. We plan to set interim and 2030 global targets to maintain short-term momentum while also changing behaviour through ambitious long-term goals.
Our environmental and sustainability management policies
Our buildings policy recognises that regulatory and environmental requirements vary across geographies and may include environmental certification. The policy is supported by Corporate Services procedures on environmental and sustainability management, ensuring HSBC's properties continually reduce their overall direct impact on the environment. Detailed design considerations documented in our Global Engineering Standards aim to reduce or avoid depletion of critical resources like energy, water, land, and raw materials. Suppliers are required to adhere to strict environmental management principles and reduce their impact on the environment in which they operate.
Our presence in environmentally sensitive areas
As a global organisation, our branches, offices and data centres may be located in – or near – areas of water stress and/or protected areas of biodiversity, as we support our customers and communities in these locations.
Approximately 28% of our global offices, branches and data centres are located in areas identified as being subject to high and very high water stress, accounting for 37% of our annual water consumption. These are predominantly urban or city centre locations with large, concentrated populations. Our industry is a low user of potable water, and we have implemented measures to further reduce water consumption through the installation of flow restrictors, auto-taps and low or zero flush sanitary fittings.
In addition, 1.7% of our global office, branch and data centre portfolio lies in protected areas and areas of biodiversity. We strive through our design, construction and operational standards to ensure that, where possible, our premises do not adversely affect the environment or natural resources in these areas.
Our approach to our own operations continued
Engaging with our supply chain
As the majority of our emissions are within our supply chain, we know we cannot achieve our net zero goal without our suppliers joining us on our journey.
In 2020, we began the three-year process of encouraging our largest suppliers to make their own carbon commitments, and to disclose their emissions via the CDP supply chain programme. The target for 2021 was for suppliers representing 45% of total supplier spend to have completed the CDP questionnaire. In total, suppliers representing 51.2% of total supplier spend completed the CDP questionnaire.
We will continue to engage with our supply chain with the aim of increasing the response rate, and have expanded the scope of our engagement with the CDP programme for 2022.
This engagement has allowed us to work on a new supply chain emissions methodology using actual supplier data. While substantial progress has been made, this methodology requires further refinement before it is ready to be disclosed.
Our aim is to use real supplier data where we have it through our engagement with the CDP programme. Where we do not have CDP data for suppliers, we will use industry averages and spend data to define the contribution to our supply chain emissions.
In 2021, we also updated our supplier selection process to include carbon emissions questions in new commercial engagements. This signals to our suppliers the importance we place in the transition to net zero, from the start of the engagement.
Working with our Cloud partners
Using Cloud technologies is one of the ways we are reducing our IT carbon footprint. Our Cloud providers run more efficiently than our own data centres due to the lower impact of shared resources. In 2021, we engaged with our Cloud partners to improve our understanding of our carbon footprint on Cloud, and collaborate towards more efficient applications. Our partners also continue to assist in the education of our internal IT colleagues by delivering sustainability learning sessions, and sharing research and experience.
Our greenhouse gas emissions in 2021
We report our emissions following the Greenhouse Gas Protocol, which incorporates the scope 2 market-based emissions methodology. We report greenhouse gas emissions resulting from the energy used in our buildings and employees’ business travel. Due to the nature of our primary business, carbon dioxide is the main type of greenhouse gas applicable to our operations. While the amount is immaterial, our current reporting also incorporates methane and nitrous oxide for completeness. We do not report employee home working emissions in our scope 1 and 2 performance data. Our environmental data for our own operations is based on a 12-month period to 30 September.
In 2021, we continued to decrease our emissions, achieving a 50.3% reduction compared with our 2019 baseline. This was mainly attributed to travel restrictions and the reduction of usage of our buildings due to the Covid-19 pandemic. We also implemented over 700 energy conservation measures that amounted to an estimated energy avoidance in excess of 14.9 million kWh.
In 2021, we collected data on energy use and business travel for our operations in 28 countries and territories, which accounted for approximately 92% of our FTEs. To estimate the emissions of our operations in countries and territories where we have operational control and a small presence, we scale up the emissions data from 92% to 100%. We then apply emission uplift rates to reflect uncertainty concerning the quality and coverage of emission measurement and estimation. This is consistent both with the Intergovernmental Panel on Climate Change’s Good Practice Guidance and Uncertainty Management in National Greenhouse Gas Inventories and our internal analysis of data coverage and quality. For further details on our methodology, our third-party assurance report and relevant environment key facts, see our ESG Data Pack at www.hsbc.com/esg.
| | | | | | | | | | | |
| Greenhouse gas emissions in tonnes CO2e | | | |
| | 2021 | 2020 2 |
| Total | ↓ | 341,000 | | 444,000 | |
Scope 1 – direct1 | ↑ | 22,000 | | 20,000 | |
Scope 2 – indirect1 | ↓ | 307,000 | | 343,000 | |
Scope 3 – indirect (Upstream activities – business travel only)1 | ↓ | 12,000 | | 81,000 | |
| Included energy UK | ↑ | 10,000 | 8,000 |
| | | | | | | | | | | |
| Greenhouse gas emissions in tonnes CO2e per FTE |
| | 2021 | 2020 2 |
| Total | ↓ | 1.52 | 1.93 |
| | | | | | | | | | | |
| Energy consumption in kWh in ‘000s |
| | 2021 | 2020 |
| Total Group | ↓ | 833 | 928 |
| UK only | ↓ | 227 | 247 |
Greenhouse gas emissions (total and FTE)2
1 Data in 2021 is subject to third-party limited assurance in accordance with International Standard on Assurance Engagements 3410 ‘Assurance engagements on greenhouse gas statements’. For further details, see GHG Reporting Guideline 2021 and third-party limited assurance report at www.hsbc.com/our-approach/esg-information/esg-reporting-and-policies.
2 Data for 2019 and 2020 has been revised as we have updated our air travel reporting methodology to include the cabin class travel and the impact of radiative forces. The emissions of HSBC's vehicle fleet were reported under scope 3 for these two years. For 2019 and 2020, see CO2 Emissions Reporting Guideline, ESG Data Pack, and third-party limited assurance reports, which are available at www.hsbc.com/our-approach/esg-information/esg-reporting-and-policies.
Supporting customers through transition
Our ability to finance the transformation of businesses and infrastructure is key to building a sustainable future for our customers and society. The most significant contribution we can make is by supporting our portfolio of customers to decarbonise within the transition to a net zero global economy.
A leader in sustainable finance
We are a recognised leader in sustainable finance, helping to pioneer the market for green, social and sustainable bonds and attaching ambitious environmental targets to business loans.
In 2021, we acted on more green, social, sustainability and sustainability-linked bonds for clients than in 2020. We were mandated to act as structuring adviser on nine ESG-related government bonds, including for the UK, Saudi Arabia, Canada and Indonesia. We were recognised by Euromoney as the Best Bank for Sustainable Finance in Asia and the Middle East for 2021.
In 2021, we continued to expand the horizons of sustainable finance:
•We acted as global coordinator and bookrunner for POSCO, the South Korean steelmaker, when it raised a €1.06bn five-year green convertible bond, which was South Korea’s first green convertible bond and its largest equity-linked deal, to help establish and expand its rechargeable battery and hydrogen business.
•We launched a £500m Green SME Fund in the UK to help remove the barriers small businesses face in the transition to a lower-carbon economy.
•We partnered with Walmart and CDP to create the industry’s first sustainable supply chain finance programme to use science-based targets to encourage suppliers to reduce emissions in alignment with the Paris Agreement. The initiative also included additional criteria for suppliers to meet certain scores on their environmental disclosures with the CDP.
•We launched green mortgages for customers in the UAE and Singapore to finance their purchase of homes that have been respectively accredited by the LEED and BCA Green Mark schemes as energy efficient.
•We supported the transition within the aviation sector, acting as the sole coordinator for a £1bn sustainability-linked loan – backed by the UK’s export credit agency, UK Export Finance – to British Airways plc, with the loan margin linked to aircraft fuel efficiency.
Transition solutions
We aim to help our customers transition to net zero and a sustainable future through providing and facilitating between $750bn and $1tn of sustainable finance and investment by 2030. Our sustainable finance ambition has enabled sustainable infrastructure and energy systems, promoted decarbonisation efforts across the real economy, and enhanced investor capital through sustainable investment.
Since 1 January 2020, we have provided and facilitated $109.8bn of sustainable finance, $11.7bn of sustainable investment and $5.2bn of sustainable infrastructure spanning more than 1,193 transactions, as defined in our data dictionary. This comprised 29% of green, social and sustainability-linked lending to companies, 9% of investments managed and distributed on behalf of investors, and 62% that facilitated the flow of capital and provided access to capital markets. Our data dictionary defining our sustainable finance and investment continues to evolve, which takes into account the revised marketing standards and guidelines. Our progress will be published each year, and we will seek to continue to be independently assured.
The breakdown of our sustainable finance and investment progress is included in our ESG Data Pack. The detailed definitions of the contributing activities for sustainable finance are available in our revised Sustainable Finance Data Dictionary 2021. For our ESG Data Pack, Sustainable Finance Data Dictionary and third-party limited assurance report, see www.hsbc.com/who-we-are/esg-and-responsible-business/esg-reporting-centre.
Sustainable finance summary1
| | | | | | | | | | | |
| 2021 | 2020 | Cumulative progress since 2020 |
| ($bn) | ($bn) | ($bn) |
| Balance sheet-related transactions provided | 26.2 | 10.4 | 36.6 |
| Capital markets/advisory (facilitated) | 48.7 | 30.0 | 78.7 |
| Investments (assets under management – flows) | 7.7 | 3.7 | 11.4 |
Total contribution2 | 82.6 | 44.1 | 126.7 |
1 This table has been prepared in accordance with our Sustainable Finance Data Dictionary 2021, which includes green, social and sustainability activities. The amounts provided and facilitated include: the limits agreed for balance sheet-related transactions provided, the proportional share of facilitated capital markets/advisory activities and the net new flows of sustainable investments within assets under management. For our sustainable finance ambition and progress figure, see www.hsbc.com/who-we-are/esg-and-responsible-business/esg-reporting-centre.
2 Data is subject to third-party limited assurance in accordance with International Standard on Assurance Engagements 3000 (Revised) ‘Assurance Engagements other than Audits or Reviews of Historical Financial Information’. For our Sustainable Finance Data Dictionary 2021 and third-party limited assurance report, see www.hsbc.com/who-we-are/esg-and-responsible-business/esg-reporting-centre.
$126.7bn
Cumulative progress since 2020 on our ambition to provide and facilitate sustainable finance and investment.
(Target: $750bn to $1tn by 2030)
Sustainable infrastructure
Good infrastructure is the backbone of any successful society and economy. However, addressing climate change requires the world – particularly emerging markets – to develop a new generation of sustainable infrastructure quickly. There remains a significant investment gap and lack of adequate, bankable projects. Stronger standards are also needed to bring investors to the table.
Sustainable finance and investment
We define sustainable finance and investment as:
•any form of financial service that integrates ESG criteria into business or investment decisions; and
•financing, investing and advisory activities that support the achievement of UN Sustainable Development Goals (‘SDGs’), including but not limited to the aims of the Paris Agreement on climate change. The SDGs, also known as the Global Goals, were adopted by all UN member states in 2015 as a universal call to action to end poverty, protect the planet and ensure that all people enjoy peace and prosperity by 2030.
We have reviewed and updated these definitions to reflect our updated climate ambition, which is available at www.hsbc.com/who-we-are/esg-and-responsible-business/esg-reporting-centre.
To help solve this, we are leading the Finance to Accelerate the Sustainable Transition-Infrastructure (‘FAST-Infra’) initiative, which in November 2021 launched the Sustainable Infrastructure (SI) label (see box to the right).
In September 2021, we partnered with Temasek to establish (subject to regulatory approval) a debt financing platform dedicated to sustainable infrastructure projects with an initial focus on south-east Asia. The platform aims to deploy blended finance at scale over time to unlock more marginally bankable projects and create a tradeable asset class. We also co-chair the Coalition for Climate Resilient Investment, which was launched at the UN Climate Action Summit to help investors and policymakers understand infrastructure investments and incorporate physical climate risk in decision making.
Responsible and sustainable investment
We offer a broad suite of ESG capabilities across asset management, global markets, research, wealth, private banking and securities services, enabling institutional and individual investors to manage risk and pursue ESG-related opportunities.
We expanded our investment offering for private banking and wealth clients, launching several cross-border ESG funds including a Sustainable Healthcare fund, to help investors generate long-term returns while contributing to the UN SDGs on good health and well-being. We launched a green certificate of deposit for the first time in renminbi to clients in Hong Kong and Singapore, as well as the first Hong Kong dollar-denominated sustainability-linked bonds to clients in Hong Kong. We also expanded our ESG offering to emerging markets, including a Global Equity Climate Change fund in India that helps clients to capture emerging opportunities during the low-carbon transition journey.
HSBC Asset Management strengthened its proposition with the formation of a new Sustainability Office, which is responsible for the delivery of our sustainability strategy and business-wide transition to sustainable investment. Our endeavour is to influence the markets through active engagement on ESG issues. HSBC Asset Management’s stewardship activities, through its portfolio managers and other investment analysts, led to ESG issues being raised in engagements with over 1,800 corporate and non-corporate issuers in 73 markets in 2021. We also voted on over 84,000 resolutions at over 8,400 company meetings in 72 markets by year end.
At HSBC Life, our insurance business, we continued to build our sustainable investment portfolios to support the UN SDGs and the Paris Agreement. During 2021, we made an effort to increase our sustainable investment across our different manufacturing entities in Asia, Europe and Latin America. The intent is to continue to build on the work and grow the assets under management. While previously, HSBC Life invested in only green bonds within the spectrum of traditional bond instruments, in 2021 it also invested in social, sustainability and sustainability-linked bonds.
Embedding ESG into our engagement
Our vision is to support our customers’ aspirations to make a positive change in the world through wealth value creation. We are embedding ESG in our client engagement and investment solutions across our business functions.
We provide our customers with ESG insights and foster industry development. HSBC Global Research published over 200 climate and ESG-related reports in 2021, accompanied by approximately 525 client meetings and close to 30 client webcasts and events. Our ESG team works in close collaboration with analysts from other asset classes and across markets, embedding sustainability into research and offering a deeper integration approach to a global investor client base. The team released five episodes of the ESG Brief podcast. ESG Insights from HSBC Global Research are also repackaged for retail investors as a series known as #WhyESGMatters. Through our sustainable finance think tank, HSBC Centre of Sustainable Finance, we launched 42 reports and collaborated with 15 partners to provide thought leadership on decarbonisation strategies and strengthen the financial system response to climate change. The centre and our reports are publicly available at www.sustainablefinance.hsbc.com.
For further details of our net zero ambition, see www.hsbc.com/who-we-are/our-climate-strategy/ becoming-a-net-zero-bank.
The Sustainable Infrastructure (SI) label
In 2021, FAST-Infra launched the Sustainable Infrastructure (SI) Label – a consistent, globally applicable labelling system designed to identify and evaluate sustainable infrastructure assets. The use of the label will help to address the estimated $6.9tn of annual investment that the OECD says is required until 2030 to meet the sustainable infrastructure objectives of the Paris Agreement. We helped conceive the FAST-Infra initiative, working with the IFC, OECD, the World Bank’s Global Infrastructure Facility and the Climate Policy Initiative, under the auspices of the One Planet Lab.
Developing a beacon of green luxury
The former US embassy at Grosvenor Square, London, is being converted into a luxury hotel and could become a model of sustainability for future hospitality developments. Qatari Diar – the property arm of Qatar’s sovereign wealth fund – is converting the former embassy into the Chancery Rosewood, which will feature green roofs, energy efficiency measures and a system to reduce water consumption. The Chancery Rosewood is aspiring to achieve a BREEAM ‘Outstanding’ rating for sustainable development, which would make it the first five-star hotel and first UK hotel to achieve this rating under the 2014 assessment scheme. As mandated lead arranger, facility and security agent, hedge coordinator, and green loan coordinator, in April 2021 we helped Qatari Diar secure a £450m green loan for the landmark development.
Unlocking climate solutions and innovations
We understand the need to find new solutions to increase the pace of change if the world is to achieve the Paris Agreement’s goal of being net zero by 2050.
We are working closely with a range of partners to accelerate investment in natural resources, technology and sustainable infrastructure to reduce emissions and address climate change.
Natural capital as an emerging asset class
As part of our goal to unlock new climate solutions, we announced the launch of Climate Asset Management, a joint venture with Pollination, in 2020. Climate Asset Management’s ambition is to become the world’s largest dedicated natural capital asset management company. Its investment strategies are grounded in nature-based investments, including sustainable forestry, regenerative agriculture, nature-based carbon projects, and exploration of new forms of natural capital. Climate Asset Management established a partnership with the Global EverGreening Alliance in November 2021, supporting the alliance’s aim to deliver a $150m nature-based carbon programme in Africa.
Climate Asset Management is one of the three founding partners of the Natural Capital Investment Alliance, which aims to mobilise $10bn towards natural capital themes by the end of 2022.
Backing new technology and innovation
Addressing climate change requires innovative ideas. By connecting financing with fresh thinking, we can help climate solutions to scale to support sustainable growth.
Our Climate Solutions Partnership aims to scale up climate innovation ventures and nature-based solutions, as well as help the energy sector transition towards renewable sources in Asia. For further details, see page 77.
We have expanded our venture debt platform to support climate technology hardware and software companies that are growing rapidly. In 2020, we committed to fund $100m to climate technology (climate tech) companies through this platform. We closed our first two deals in 2021 and expect to achieve the $100m goal by the end of the first quarter of 2022. Consequently, we have raised our commitment to $250m.
HSBC Asset Management has also developed a new venture capital capability that provides institutional and private banking customers with opportunities to invest in technology start-ups addressing global climate change challenges. We launched the first fund in November 2021 and provided it with a cornerstone investment.
Our climate technology venture debt and venture capital platforms invest in companies that are developing innovative technological solutions that help companies and governments understand, track and reduce their greenhouse gas emissions.
Biodiversity and natural capital strategy
We recognise that achieving net zero goes hand in hand with halting and reversing nature loss. Nature loss, which refers to the decline of natural capital, ecosystem services and biodiversity, is one of the greatest systemic risks to the global economy and the health of people and the planet.
Investing in nature
By addressing nature-related risks and investing in nature, we have an opportunity to accelerate the transition to net zero, help tackle climate change and open up a more resilient and inclusive global economy.
We recognise that more needs to be done to assess and manage our exposure to nature-related risks and that collective initiatives are needed to progress at pace. In 2021, we joined several working groups dedicated to helping us progress on this journey, such as the Taskforce on Nature-related Financial Disclosures (‘TNFD’). For further details on the nature-related initiatives we have joined, see ‘Key external memberships’ in the box on the right.
Catalyst for change
We are committed to playing a key role as a catalyst for change, using our scale, influence and financing to help preserve natural capital and protect biodiversity as a component of our net zero ambition. In 2021, we facilitated green and blue bonds, as well as provided lending to corporate and sovereign clients for sustainable projects. Highlights included:
•We co-led the provision of $90m of green loan facilities to support Instar Asset Management’s acquisition of PRT Growing Services, North America’s largest producer of container-grown forest seedlings.
•We launched the world’s first broad-based biodiversity screened equity indices, developed jointly with Euronext and Iceberg Data Lab, to explore ways to apply a biodiversity benchmark to trading and investment activities.
•Our asset management business published its biodiversity policy to publicly explain how our analysts address nature-related issues. In 2021, it also engaged with companies in the food industry on how to manage their suppliers’ impact on biodiversity. For further details on the biodiversity policy, see: www.assetmanagement.hsbc.com/about-us/responsible-investing/policies.
Key external memberships
Our nature-related external memberships and endorsements include:
•Taskforce on Nature-related Financial Disclosures
•Cambridge Institute on Sustainability Leadership’s nature-related financial risks working group
•Accountability Alignment on Deforestation Working Group
•Business for Nature’s Call to Action
•Get Nature Positive
•Signatory by the asset management business to the Finance for Biodiversity pledge
For further details of our sustainability-related memberships, see www.hsbc.com/who-we-are/our-climate-strategy/sustainability-memberships.
Our approach to climate risk
Managing risk for our stakeholders
We see managing climate risk as an opportunity to create value for our customers, investors, people and communities in which we operate. We manage climate risk across all our businesses in line with our Group-wide risk management framework. Our most material risks in terms of managing climate risk relate to corporate and retail client financing within our banking portfolio, but there are also significant responsibilities in relation to asset ownership by our insurance business and employee pension plans, as well as from the activities of our asset management business.
We tailor our underlying policies and controls to manage the different risks and exposures to reflect these respective roles to meet the needs of our key stakeholders. In the table below, we set out our duties to our stakeholders in our four more material roles.
For further details of our approach to climate risk, see Environmental, social and governance risk on page 149 and Climate-related risks on page 167.
| | | | | |
Banking We seek to manage the climate risk in our banking portfolios through our developing risk appetite and policies for our financial and non-financial risks. This helps enable us to identify opportunities to support our customers, while continuing to meet the expectations of our shareholders and regulators.
(Stakeholders: Customers, Investors, Regulators) | Employee pensions Our employee pension plans each manage climate risk in line with their fiduciary duties and local regulatory requirements, with global corporate policy encouraging consideration of ESG risks when selecting investments. We are developing internal climate risk exposure reporting for our largest plans, pending more widespread adoption of consistent reporting standards.
(Stakeholders: Employees, Regulators) |
| Climate risk |
Asset management As part of our asset management business’s fiduciary duty to clients, our solutions integrate key climate and sustainability considerations. Climate risk management is a key feature of our investment decision making and portfolio management. We also engage directly with companies on priority topics related to climate risk to drive positive change.
(Stakeholders: Customers, Investors, Regulators) | Insurance Our insurance business offers long-term life and health products. We manage climate risks, including wholesale credit risk, in assets to meet customer investment returns. We also take into consideration mortality and morbidity risks for customers as a result of climate risk. We have established an evolving ESG programme to meet changing external expectations and customer demands.
(Stakeholders: Customers, Investors, Regulators) |
Banking
Our banking business is well positioned to support our 40 million personal, wealth and corporate customers manage their own climate risk through financing. For our wholesale customers, we use our corporate questionnaire as part of our transition risk framework to understand their climate strategies and risk. We also use our climate change stress testing and scenario analysis capabilities to provide insights on the long-term effects of transition and physical risks across our retail and wholesale banking portfolios (for further details, see page 57). In December, we announced our thermal coal phase-out policy (see page 62) and we will use our deep relationships to partner with customers in this sector to help them transition to cleaner, safer and cheaper energy alternatives.
Asset management
HSBC Asset Management managed over $630bn assets – including assets managed for parts of HSBC Insurance and employee pensions – at the end of 2021. With the majority of assets managed in ESG-integrated strategies, it treats climate change risk as a key feature of the investment decision-making process. Investment teams examine and determine the level of importance of potential ESG risks that could impact current and/or future value of issuers. These risks are reflected in proprietary issuer ESG scoring methodology and are embedded into investment processes. Portfolio management tools also enable investment teams to assess their portfolios for climate-related risks, as part of
ongoing portfolio management activities. We continue to lead on the analysis of climate-related issues, in particular transition risks, and their impact on financial markets. Our analysts carry out proprietary research and collaborate with outside experts and industry initiatives.
Employee pensions
The Trustee of the HSBC Bank (UK) Pension Scheme, our largest plan with $51bn assets under management, announced an ambition in 2021 to achieve net zero greenhouse gas emissions across its defined benefit and defined contribution assets by 2050. To help achieve this, it is targeting a real economy emissions reduction interim target of 50% by 2030 for its equity and corporate bond mandates.
The weight given to climate-related factors in the asset allocation of this plan’s defined contribution fund was strengthened during 2021 to target additional green revenue and lower carbon emissions and reserves, and now excludes companies whose revenues are substantially derived from coal extraction or coal power generation.
For further details of the HSBC Bank (UK) Pension Scheme’s annual TCFD statements, see https://futurefocus.staff.hsbc.co.uk/-/media/project/futurefocus/information-centre/pensioner/other-information/2020-tcfd-statement.pdf.
Insurance
In 2021, our Insurance business, which has life insurance manufacturing subsidiaries in eight markets, a life insurance manufacturing associate in India and assets under management of approximately $123bn, developed a methodology for climate stress testing. It ran stress tests across the major portfolios considering adverse stresses as a result of transition risks on wholesale credit risks within the insurance investment portfolio.
The insurance business began a review of its sustainability policy to align with the Group’s new thermal coal phase-out policy published in December 2021. Risk appetite has been articulated relating to key ESG aspects. ESG standards have been implemented into insurance product development processes and operational capabilities.
In response to regulatory developments, HSBC’s insurance entities in the EU and UK have implemented key disclosure-related regulatory requirements, which mainly impacts insurance-based investment products manufactured and/or sold by HSBC.
Insights from scenario analysis
Our 2021 climate stress testing and scenario analysis exercise
A crucial component of our climate ambitions is having the ability to identify and understand climate-related risks and opportunities, and having insights on how our customers and business could be impacted under a range of climate change scenarios.
In 2021, we ran our first Group-wide climate change scenario analysis exercise, following on from a pilot exercise carried out in 2020. The 2021 exercise focused on the portfolios most exposed to climate risk: our wholesale corporate lending, commercial real estate and retail mortgage portfolios. We performed our assessment over a 30-year time horizon, reflecting the long-term nature and effects of transition and physical risks. For all portfolios, our assessments considered:
•transition risk arising from the process of moving to a net zero economy, including changes in policy, technology, and consumer behaviour and stakeholder perception, which will each impact borrowers’ operating income, financing requirements and asset values; and
•physical risk arising from the increased frequency and severity of weather events, such as hurricanes and floods, or chronic shifts in weather patterns, which will each impact property values, repair costs and lead to business interruptions.
Our progress in 2021
Climate change scenario analysis requires bespoke data, modelling techniques and analysis. In order to integrate climate considerations in our analysis, we used the people, processes, controls, and governance structures from traditional stress tests. Building on that, throughout 2021, we continued to develop our climate change scenario analysis capabilities, including:
•We identified new data requirements and sourced data for a vast number of inputs representing climate, macroeconomic and financial variables.
•We built and refined climate change models for wholesale corporate lending, commercial real estate and retail mortgage portfolios. Our models incorporated sector-specific adjustments for the higher risk industrial sectors. These portfolios represent a material part of our lending activities. The models projected the impact of climate change and produced outputs such as credit ratings, which helped us assess the financial impact on our portfolios.
•We held training sessions covering all levels of seniority from our colleagues to Board Directors, to allow our people to effectively understand, review, challenge and use the outcomes.
•Following the execution of results, we revisited the end-to-end process to learn key lessons and make continuous improvements for the next stress testing cycle.
The process has involved engaging with stakeholders across our Finance, Corporate Sustainability and Risk functions, as well as global businesses at Group and regional levels. We held ‘in-depth’ sessions with the Group Risk Management Meeting (‘RMM’), Group Risk Committee (‘GRC’) and the Group Executive Committee covering data, models, risk assessments and outcomes. A series of governance meetings culminating with the RMM and GRC reviewed, challenged and approved the overall outcomes of this exercise.
Our framework
We have created – and continue to develop – a target state framework for climate change stress testing and scenario analysis. This framework uses many of the building blocks from of our traditional capital stress testing framework, but it demands larger and richer data that feeds innovative and granular forecasting solutions. All activities in this framework need to be embedded in our business-as-usual processes to help drive business decisions.
Scenarios and time horizons
We have developed capabilities to define parameters for bespoke scenario modelling. Our 2021 climate-related scenario analysis was run on a suite of specific scenarios published by the Network of Central Banks and Supervisors for Greening the Financial System (‘NGFS’). The NGFS scenarios test a broad range of possible outcomes and have been created as a starting point for central banks and supervisors, encompassing a complex set of social, political and economic assumptions. The scenarios we considered were:
•An Orderly scenario assumes climate policies are introduced early and become gradually more stringent. As a result of early action to tackle global warming and climate change, both physical and transition risks are relatively subdued. A moderate level of carbon sequestration (which is the process of capturing and storing atmospheric carbon dioxide) is factored into the scenario.
•A Disorderly scenario explores higher transition risk due to policies being delayed or divergent across countries and sectors. Carbon prices are typically higher for a given temperature outcome. There is a low level of carbon sequestration assumed in this scenario due to the absence of timely and sizable investments in such technologies.
•A Hot house world scenario assumes that some climate policies are implemented in some jurisdictions, but global efforts are insufficient to halt significant global warming. Critical temperature thresholds are exceeded, leading to severe physical risks and irreversible impacts like sea-level rise. This scenario also assumes a low level of carbon sequestration.
Further details of these scenarios are available at: www.ngfs.net/ngfs-scenarios-portal.
The following pages highlight some of the analysis conducted. The nature of the scenarios, our developing capabilities, and limitations of the analysis have led to outcomes that are directionally indicative of climate change headwinds, but they are not a direct forecast. Developments in climate science, data, methodology, and scenario analysis techniques will help us shape our approach further. We therefore expect this view of risk to change over time.
Insights from scenario analysis continued
Wholesale corporate lending portfolio methodology
We have developed a standardised framework to assess the financial impact of climate change on our wholesale corporate counterparties. We carried out granular modelling for material counterparties, projecting how their financial position might be impacted under each scenario. As data limitations often posed a challenge, we performed a high-level impact assessment for less material counterparties.
For simplicity, we assumed that our counterparty exposures would remain static over the 30-year horizon under all scenarios. Sectors already transitioning, such as those with electric vehicles and renewable energy, are assumed to continue transitioning at a conservative level, based on verifiable data and scenario assumptions. Companies with government support are also assumed to benefit. We have not considered the impact of individual counterparties’ plans to adapt to climate change or the potential impact of supply chain disruptions. The analysis was performed on a sample of the portfolio that focused on our most material counterparties and regions. Results should therefore be interpreted accordingly.
How climate change is impacting our wholesale corporate lending portfolio
The table below illustrates the level of climate-related risk to which we are exposed within six key wholesale sectors. We have focused on these sectors because they are most likely to be impacted by climate risk. We assessed these sectors against Orderly, Disorderly and Hot house scenarios over a 30-year horizon. The two transition risk scenarios (Orderly and Disorderly) have the most impact on our wholesale portfolio and therefore the commentary focuses on these scenarios. While cumulative impacts over the 2020 to 2050 scenario horizon are broadly similar, the Disorderly scenario has a delayed disruptive transition and the Orderly scenario starts to impact the portfolio immediately.
| | | | | | | | | | | | | | | | | |
Impact for key wholesale transition risk sectors1 |
| Sector | Sub-sectors | Projected impact | Impact analysis |
| Orderly | Disorderly | Hot house | |
| Building and construction | Construction | d | d | d | Companies with carbon-intensive production activities, such as steel and cement companies, are significantly impacted under the Orderly and Disorderly scenarios due to their expected vulnerability to carbon price increases and limited options currently available to transition. |
| Steel | e | e | d |
|
| Cement | e | e | b |
| Oil and gas | Integrated | c | c | c | A number of our oil and gas counterparties are operating in regions with low extraction costs, and are expected to be more resilient in transition scenarios.
Profiting from greater diversification and size, integrated companies perform relatively better compared with counterparties specialised on one part of the value chain. |
| Services | c | c | b |
| Downstream | d | d | c |
| Upstream | d | d | c |
| Midstream | d | d | c |
| Automotive | Original equipment manufacturers | c | c | b | Impacts are broadly similar in the automotive sector under the transition risk scenarios due to a similar cumulative effect of electrical vehicle sales and carbon pricing over the 30 years. As expected, companies with existing investments in electrical vehicle manufacturing tend to be less impacted, particularly as they scale up over time. Dealers experience a more severe downgrade due to carbon pricing impacting current financial positions. |
| Dealers | d | d | c |
| Suppliers | c | c | b |
|
| Power and utilities | Gas and water utilities | c | c | b | Coal-focused companies are materially impacted in the transition scenarios. In contrast, renewables-focused counterparties benefit in the transition risk scenarios from the increase in demand for their products, lower carbon tax impacts and lower investment requirements. Overall, the ability of power and utilities companies to transfer costs to customers and the exposure to renewable-based power generators offsets negative impacts from fossil fuel-based counterparties. |
| Power generation companies | c | b | b |
| Transmission, distribution and other electricity companies | c | c | a |
| Chemicals | Chemical companies | e | d | c | Carbon-intensive processes significantly impact part of the chemicals sub-sector in the transition risk scenarios. In contrast, companies in the pharmaceutical and other sub-sectors tend to have less carbon-intensive processes, naturally leading to lower carbon costs and abatement expenses. |
| Pharmaceutical companies | d | d | c |
|
| Metals and mining | Core miners (bulk, base/diversified, precious metals) | d | d | c | As expected, coal-focused companies are heavily impacted under the transition risk scenarios. Energy transition miners, including companies mining lithium or copper, are less impacted due to an increased demand for electrification. Diversified miners also perform relatively better as they are able to shift away from coal to other minerals. Overall, energy transition and diversified miners offset some of the downgrades. |
| Pure traders/services | c | c | c |
|
| | | | | | | | | | | | | | | | | | | | |
| a | b | | c | d | | e |
| Lower Impact | | Higher Impact |
1 This heat map is based on projected change in average credit ratings between 2020 and 2050 of counterparties by sector/sub-sector. Colours are defined based on the distribution of credit rating changes for the six key wholesale sectors. The bigger the credit rating downgrade, the more severely the counterparty is impacted.
Insights from scenario analysis continued
Retail mortgage portfolio methodology
We used granular models to assess our material retail mortgage portfolios exposed to a high degree of climate change. After simulating thousands of weather events and assessing their impact on each property’s value, we estimated expected physical losses under all scenarios. Key parameters included insurance coverage, public defences and building resilience archetypes. Transition risk was modelled considering the changes in key macroeconomic variables and region-specific policies, such as the requirement for homes to have certain minimum-rated energy performance certificates (‘EPC’) in the UK.
Impact of climate risk on our retail mortgage portfolios
We assessed the impact of various peril risks that our retail mortgage customers could face, including flooding, wildfires and windstorms. These risks influence property values and the ability and willingness of borrowers to service their debts. Another risk driver is the ability to respond and adapt to new and emerging regulatory requirements, such as new energy efficiency standards, which may influence property values.
The table below focuses on our most material retail mortgage portfolios in Hong Kong and the UK – covering 66% of our retail mortgage portfolio as of 31 December 2020. It demonstrates the potential physical risks of river, surface and coastal flooding, and how this may vary under the Orderly, Disorderly and Hot house scenarios. We show the projected change in flood depth in metres given a 1-in-100-year flood event. Since the Orderly and Disorderly scenarios use the same physical risk forecasts, these are combined into a single column.
Our analysis indicates that the most pronounced effects of physical risk on our retail mortgage customers are under a Hot house scenario characterised by a more than 3°C increase in global temperatures, which leads to an increase in the frequency and severity of extreme weather events. There are also risks posed by the transition to a net zero economy, predominantly through macroeconomic disruption, as well as some country-specific policies that may be enacted to meet these targets, including introduction of minimum energy efficiency standards.
Impacts across mortgage portfolios are primarily driven by the increased risk of flooding, including river, surface and coastal flooding. While relatively small proportions of the portfolios are predicted to be impacted by flooding events, the severity of these events is expected to increase over time. Under a Hot house scenario, sea levels are expected to rise up to 1.5 metres, which would increase the risk of coastal flooding for parts of the Hong Kong portfolio in the latter part of the century. The table shows that the Hot house scenario puts 25.6% of properties in Hong Kong at risk of a 0.5 metre to 1.5 metres 1-in-100-year flood event, up 18.7% from 6.9% in the Orderly and Disorderly scenarios.
The risk of extreme wind stress has also been considered and is only deemed material in Hong Kong, where typhoons regularly occur. Buildings standards in Hong Kong mean that structures are designed to withstand high wind speeds, and the severity of wind events is not predicted to materially change between now and the end of the century.
We take into account the transition risk for our retail mortgage portfolio as part of our business-as-usual lending and scenario analysis exercises. We focused on physical risk on this page because our current analysis shows it to be a material climate risk for this business.
Exposure to flooding
Proportion of properties predicted to be impacted by floods given a 1-in-100-year severity flood event (%)
| | | | | | | | | | | | | | | | | | | | |
| Hong Kong | UK |
| Scenarios | 2020 1 | 2050 | 2020 1 | 2050 |
Flood depth in metres | | Orderly and Disorderly, +1.5°C2 | Hot house, +>3°C3 | | Orderly and Disorderly, +1.5°C2 | Hot house, +>3°C3 |
| 0–0.5 | 92.1 | 92.0 | 73.3 | 98.5 | 97.5 | 96.1 |
| 0.5–1.5 | 6.9 | 6.9 | 25.6 | 1.3 | 2.3 | 3.6 |
| >1.5 | 1.0 | 1.1 | 1.1 | 0.2 | 0.2 | 0.3 |
1 Represents the baseline flood risk in 2020.
2 Represents the flood risk in 2050 under a climate scenario aligned to a 1.5°C increase in global temperatures.
3 Represents the flood risk in 2050 under a climate scenario aligned to a more than 3°C increase in global temperatures.
Insights from scenario analysis continued
Commercial real estate portfolio methodology
The commercial real estate methodology is tailored to individual property characteristics and is used to analyse the impact on borrowers’ credit risk. We have also taken into account existing property insurance in our portfolio. Transition risk drivers include country-specific net zero policies,
such as requirements for EPCs, and the associated macroeconomic disruption.
Impact of climate risk on our commercial real estate portfolios
We assessed the impact of various perils that our commercial real estate customers could be vulnerable to, including flooding, wildfires and windstorms. The map below illustrates the potential impact of physical risk on our commercial real estate portfolio in Hong Kong under the Hot house scenario. We have focused on this portfolio as it is our most material commercial real estate portfolio in terms of exposure. The map shows a projected increase in average damage ratio, which represents the ratio between the cost of potential damage due to climate-related perils and the value of the property. The key peril drivers in our results are coastal, river and surface water flooding, and wind under a Hot house scenario.
Exposure to physical risk in Hong Kong under a Hot house scenario
The chart shows the increase in average damage ratio between 2020 and 2050 using a simple average for locations of our commercial real estate properties in each district. Our approach assumes an acceleration of physical risk impacts from later in the century.
The table alongside shows the projected increase in financial impact over 30 years for our most material commercial real estate portfolios – Hong Kong, the UK, Canada and the US, which cover 77% of the total commercial real estate portfolio as of 31 December 2020 – under the Orderly, Disorderly and Hot house scenarios. The increase in projected financial impact represents the increase in expected credit losses relative to exposure. The commentary highlights the key reasons for the change in impact between the Orderly scenario and alternative scenarios.
| | | | | | | | | | | | | | |
| Impact on commercial real estate for key countries/territories |
| | Projected impact1 |
| Countries /territories | Country/territory-specific EPC policies in the scenario | Orderly, +1.5°C | Disorderly, +1.5°C | Hot house, +>3°C |
| Hong Kong | — | a | a Higher value of collateral helps reduce impact | b
Increased risk of coastal flooding |
| Canada | — | a | b Macroeconomic disruption due to late policy action | b
Increased risk of riverine and surface water flooding |
| US | — | a | b
Macroeconomic disruption due to late policy action
| a
No material increase of physical risk due to location of properties |
UK2 | Energy efficiency standards introduced via EPC policies | a | b
Macroeconomic disruption and stricter EPC policies due to late policy action | b
Increased risk of coastal flooding |
| | | | | | | | | | | | | | | | | | | | |
| a | b | | c | d | | e |
| Lower Impact | | Higher impact |
1 Projected impacts from perils include flooding (coastal, river and surface water), wind and wildfires, without taking into account client adaptation plans or management actions.
2 UK financial projections include transition risks related to meeting minimum energy efficiency standards, whereas the other countries/territories do not.
Under the Hot house scenario, the impacts are driven primarily by the increased risk of flooding (coastal, riverine and surface water). In this scenario, Hong Kong and the UK would be particularly impacted by coastal flooding due to the estimated rise in the sea level of up to 1.5 metres, with an increase in the frequency and severity of extreme weather events. Risks posed by the transition to a net zero economy also exist, which manifest mainly through macroeconomic disruption under the Disorderly scenario, as well as country-specific policies enacted to meet these targets, such as, minimum energy efficiency standards in the UK.
We are continuing to refine the data used for physical and transition risk assessment of our portfolios together with our modelling capabilities which use these inputs.
Understanding the resilience of our critical properties
Climate change poses a physical risk to the buildings that we occupy as an organisation, including our offices, retail branches and data centres. We measure the impacts of climate and weather events to our buildings on an ongoing basis using historical, current and scenario modelled forecast data. In 2021, there were 47 major events that had no impact on the availability of our buildings.
We use stress testing to evaluate the potential for impact to our owned or leased premises. Our scenario stress test, conducted in 2021, analysed how seven different climate change-related hazards – comprising coastal inundation, extreme heat, extreme winds, wildfires, riverine flooding, soil movement due to drought, and surface water flooding – could impact 250 of our critical buildings.
The 2021 scenario stress test of 250 of our critical buildings modelled climate change with a Hot house scenario that projects that the rise in the temperature of the world will likely exceed 4°C by 2100. It also modelled a less severe scenario that projects that global warming will likely be limited to 2°C, in line with the upper limit ambition of the Paris Agreement.
Key findings from the 4°C or greater Hot house scenario included:
•By 2050, 22 of our 250 critical buildings will have a high potential for impact due to climate change, with insurance-related losses estimated to be in excess of 10% of the insured value of our buildings.
•The eight most affected locations face hazards relating to surface flooding, rising river levels and landslides, as well as coastal flooding from rising sea levels and storms. Of the remaining 14 locations, 11 are data centres where the predominant hazards emanate from a mixture of temperature extremes, water stress and drought for which the specific direct physical impact could be soil movement. The other three are offices where the predominant hazard is coastal flooding.
•A further 25 locations have the potential to be impacted by climate change, albeit to a lesser extent, with insurance-related losses estimated at between 5% and 10% of the insured value of our buildings.
A key finding from the 2°C, less severe scenario showed:
•The total number of buildings at risk reduces from 47 to 35, with the same eight key facilities still at risk by 2050 from the same perils.
This forward-looking data will inform real estate planning. We will continue to improve our understanding of how extreme weather events impact our building portfolio as climate risk assessment tools improve and evolve. Additionally, we buy insurance for property damage and business interruption, and consider insurance as a loss mitigation strategy depending on its availability and price.
We regularly review and enhance our building selection process and global engineering standards, and will continue to assess historic claims data to help ensure our building selection and design standards reflect the potential impacts of climate change.
Regulatory climate stress tests
Regulators in an increasing number of jurisdictions are incorporating climate factors in their supervisory tools, with different aspects considered around the world. We have built flexibility into our approach to climate stress tests to support these differences. During 2021, we completed a number of climate stress tests in response to regulatory requirements from the Bank of England, the Hong Kong Monetary Authority and the Monetary Authority of Singapore. We expect to complete further tests in 2022.
Any specific outcomes and balances disclosed in this section should not be assumed to be those that have fed into our aggregated final climate results for the Bank of England’s biennial exploratory scenario.
Our priority next steps
While we have conducted a number of climate change scenario analyses and stress tests in 2021, we continue to broaden and enhance our capabilities in order to overcome the limitations identified. These include enhancing our climate data repository, expanding scenario analysis methodology beyond credit risk, forecasting key climate metrics, integrating climate scenario analysis into risk management, business decisions and strategic planning. Together, they will help us define and monitor targets to support the Group’s climate strategy. We aim to continue to improve on scenario analysis disclosures in line with regulatory expectations, supported by robust control processes and governance.
Our approach to sustainability policies
We recognise that businesses can have an impact on the environment, individuals and communities around them. We have developed, implemented and refined our approach to working with our business customers to understand and manage these issues. We have joined various partnerships to support our role in this, including the Powering Past Coal Alliance and World Economic Forum’s Principles for Financing a Just and Urgent Energy Transition.
Our policies
Our sustainability risk policies cover agricultural commodities, chemicals, energy, forestry, mining and metals, thermal coal, UNESCO World Heritage Sites and Ramsar-designated wetlands.
These policies define our appetite for business in these sectors and seek to encourage customers to meet good international standards of practice. Where we identify activities that could cause material negative impacts, we will only provide finance if we can confirm clients are managing these risks responsibly. Such customers are subject to greater due diligence and generally require additional approval by sustainability risk specialists.
Our sustainability policies continue to be aligned with our approach to climate risk, and our net zero ambition.
For further details on how we manage sustainability risk, as well as our full policies, see www.hsbc.com/our-approach/risk-and-responsibility/sustainability-risk.
Supporting the transition
Reinforcing our ambition to support our clients’ transition to lower carbon through transition financing – and particularly to the phase-out of thermal coal – we published our thermal coal phase-out policy, which we introduced in December 2021 (see right).
Governance and implementation
Within our Global Risk and Compliance function, we have reputational and sustainability risk specialists who are responsible for reviewing, implementing and managing our sustainability risk policies as well as our application of the Equator Principles. Our global network of more than 75 sustainability risk managers supports the implementation of these policies. In 2021, these local sustainability risk managers continued to be supported by regional reputational risk managers across the Group who have taken on additional oversight responsibilities for sustainability risk.
The Sustainability Risk Oversight Forum, made up of senior members of the Global Risk and Compliance function and global businesses, continued to oversee the development and implementation of policies that identify, manage and mitigate the Group’s sustainability risk, including a refreshed assurance framework in 2021. This framework has been designed to take a more holistic view of the ESG risks we face in our sustainability risk policies, including:
•monitoring ESG news across the sustainability risk policies;
•overseeing clients considered to be of higher risk or under exit;
•reviewing client files across the sustainability risk policies; and
•setting and reporting against a defined set of key control indicators aligned to our risk appetite.
The framework is used to monitor the in-scope portfolio and keep track if there is any deterioration in the risk ratings. With the respective risk rating assigned, our sustainability risk specialists will take the necessary actions to mitigate unacceptable risks. If necessary, we will proactively end the client relationship.
Our thermal coal phase-out policy
In fulfilment of our commitment approved by shareholders at the AGM in May 2021, we published a policy to phase out thermal coal financing in EU and OECD markets by 2030, and globally by 2040. This incorporates project finance, direct lending, or arranging or underwriting of capital markets transactions to in-scope clients, as well as the refinancing of existing finance facilities.
Every year we commit to review our policy and targets, taking into account evolving science and internationally recognised guidance.
Using our TCFD disclosures in 2020 as our baseline, we intend to reduce thermal coal financing exposure by at least 25% by 2025, and by 50% by 2030. These targets will be reviewed in conjunction with assessments of client transition plans. For further details, see www.hsbc.com/news-and-media/hsbc-news/were-phasing-out-coal-financing.
As shown in the wholesale loan exposure table on page 169, within the power and utilities, and metals and mining sectors, and recognising external party assessments of power generation and mining capacity, our exposure to thermal coal at 31 December 2021 was $1.0bn (2020: $1.2bn) or 0.2% of the total wholesale loans and advances figures.
In 2021, HSBC, together with other financial institutions, participated in capital markets transactions relating to clients who own or operate thermal coal-fired powered plants or thermal coal mines. HSBC facilitated a total of $1.3bn out of the total of these transactions.
Biodiversity and natural capital-related policies
We have taken several steps to unlock the value of natural capital in the global economy, and help tackle biodiversity loss and other nature-related financial risks. However, we recognise we are at the beginning of our journey.
We regularly assess our clients for their commitment to sustainable business practices, and have clear policies to help mitigate the risk of nature loss. Our sustainability risk policies are designed to provide several protections against financing, which will have a negative impact on nature. These include our forestry and agricultural commodities policies, which put an emphasis on customers involved with the major forest-risk commodities to obtain independent certification that their businesses operate in a sustainable manner. These include requiring palm oil customers to commit to ‘No Deforestation, No Peat and No Exploitation’. Our World Heritage Sites and Ramsar-designated wetlands policy prohibits the financing of any project that threatens the special natural characteristics of these internationally protected areas.
Our approach to climate reporting
Task Force on Climate-related Financial Disclosures (‘TCFD’)
The table below sets out the 11 TCFD recommendations and summarises where additional information can be found.
Where we have not included climate-related financial disclosures consistent with all of the TCFD Recommendations and Recommended Disclosures, the reasons for this and steps we are taking are set out in the additional information section on page 1b.
| | | | | | | | |
| Recommendation | Response | Disclosure location |
| Governance | | |
| a) Describe the Board’s oversight of climate-related risks and opportunities |
| Process, frequency and training | The Board is responsible for our climate ambition, strategy and risk, receives climate-focused updates throughout the year and receives ESG-related training. | Page 80 Page 265 Page 268 |
| Sub-committee accountability, processes and frequency | The Group Risk Committee exercises oversight of climate risks.
The Group Audit Committee reviews and challenges ESG and climate-related reporting and disclosure, including the climate change resolution and scenario analysis disclosure. | Page 285
Page 281 |
| Examples of the Board and relevant Board committees taking climate into account | 2021 was a significant year for the Group in its efforts to support the transition to net zero – a key pillar of our overall Group strategy – with the passing of our climate change resolution at our 2021 AGM and the publication of our thermal coal phase-out policy being two of the most notable achievements. In January 2022, the Board also approved the necessary investment required to develop and implement a revised operating model for the Group's Sustainability function to help ensure delivery against our sustainability ambitions.
The GRC and GAC convened a joint meeting to review the thermal coal phase-out policy and our approach to financed emissions. | Page 24 Page 255
Page 277
|
| b) Describe management’s role in assessing and managing climate-related risks and opportunities |
| Who manages climate-related risks and opportunities | The Group Executive Committee (‘GEC’) manages our climate ambition with management responsibilities integrated into the relevant business and functional areas. It oversees and directs the climate-related opportunities. It discussed climate-related issues at six meetings in 2021.
The Group Chief Executive is responsible for overseeing the delivery of the sustainable finance and investment ambition and realisation of commercial opportunities.
The Group Chief Sustainability Officer holds joint responsibility for the ESG committee that supports Group Executives in the development and delivery of ESG strategy, key policies and material commitments by providing oversight, coordination and management of ESG commitments and activities.
The Group Chief Risk and Compliance Officer and the chief risk officers of our PRA-regulated businesses are the senior managers responsible for climate financial risks under the UK Senior Managers Regime. | Page 80 |
| | | | | | | | |
| How management reports to the Board | The Group Chief Executive, the Group Chief Financial Officer, and the Chief Risk and Compliance Officer provide regular verbal and written updates to the Board.
The ESG Committee will regularly report to the Board on progress against our ESG ambitions, climate strategy and related commitments. | Page 80 |
| Processes used to inform management | The Group Chief Financial Officer provides an ESG dashboard including key climate-related metrics within a quarterly report, presented to the GEC.
Management is informed by a number of specialist ESG governance forums. | Page 80 |
| Strategy | | |
| a) Describe the climate-related risks and opportunities the organisation has identified over the short, medium and long term |
| Processes used to determine material risks and opportunities | We use scenario analysis to help us identify and understand climate-related risks.
We understand the need to find new solutions to increase the pace of change if the world is to achieve the Paris Agreement’s goal of being net zero by 2050.
For wholesale customers, we use a questionnaire as part of the independent review of risk, to understand their climate strategies and risks. It also helps us to identify potential business opportunities to support the transition. | Page 57
Page 55
Page 169 |
| Relevant short, medium, and long term time horizons | We aim to achieve net zero in our financed emissions by 2050, and in our own operations and supply chain by 2030.
We aim to provide and facilitate $750bn to $1tn of sustainable finance and investment for our customers in their transition to net zero and a sustainable future between 2020 and 2030.
We have taken these time horizons into our consideration. We consider short term to be less than one year, medium term to be by 2030 and long term to be by 2050. | Page 46
Page 53
Page 168 |
| Transition or physical climate-related issues identified | Transition or physical climate-related risk impacts may manifest across our risk taxonomy across all time horizons.
We are supporting our customers in their transition through our sustainable finance and investment ambition. Our sustainable finance data dictionary includes a detailed definition of contributing activities. | Page 168
Page 53 |
Task Force on Climate-related Financial Disclosures (‘TCFD’) continued
| | | | | | | | |
| Recommendation | Response | Disclosure location |
| Risks and opportunities by sector and/or geography | For our wholesale exposure we have focused on a group lens as a starting point, primarily due to data limitations on client carbon emissions. Our scenario analysis shows that transition risk represents a more material risk for corporate customers, and physical risk is more material for our retail customers.
Opportunities include sustainable finance, sustainable investment and sustainable infrastructure. | Page 57
Page 53 |
| | | | | | | | |
| Concentrations of credit exposure to carbon-related assets | We have identified and disclosed six sectors where our corporate customers have the highest climate risk, which are: oil and gas; building and construction; chemicals; automotive; power and utilities; and metals and mining.
We have also disclosed our exposure to thermal coal.
Our approach to financed emissions has focused primarily on oil and gas, and power and utilities, and the specific areas of the value chain which are most carbon intensive. We will aim to enhance our scope 3 emissions disclosure by encouraging our customers to publicly disclose their carbon emissions
| Page 169
Page 62
Page 47 Page 1b |
| b) Describe the impact of climate-related risks and opportunities on the organisation’s businesses, strategy and financial planning |
| | |
| Impact on strategy, business, and financial planning | Transition to net zero represents one of our four strategic pillars. We aim to be net zero in our operations and supply chain by 2030 and in our financed emissions by 2050.
Due to transitional challenges, including data and system limitations, we do not currently fully disclose the way in which climate-related issues have affected our financial planning and performance. We have considered the impact of climate-related issues on our businesses, strategy and financial planning, and will aim to further enhance our processes in relation to acquisitions/divestments and access to capital.
| Page 14
Page 1b |
| Impact on products and services | We aim to help our customers’ transition to net zero and a sustainable future through providing and facilitating between $750bn and $1tn of sustainable finance and investment by 2030. | Page 53 |
| Impact on supply chain and/or value chain | We have started targeting our largest suppliers to encourage them to make their own carbon commitments, and to disclose their emissions. We take into account climate-related risks as part of our third-party risk management process. | Page 52 |
| Impact on adaptation and mitigation activities | We announced our ambition to achieving 100% renewable power across our operations by 2030, and continue to look for opportunities to procure green energy. We regularly review and enhance our building selection process and global engineering standards, to help ensure our building selection and design standards reflect the potential impacts of climate change. | Page 52 |
| Impact on operations | We have analysed the resilience of our critical properties, identifying 22 of our 250 critical buildings have a high potential for impact due to climate change by 2050. This will inform real estate planning. Our business continuity processes, including people and infrastructure, will continue to evolve to take in account of climate-related risks across regions and markets to avoid concentration risk. | Page 61 |
| Impact on investment in research and development | We are working with the World Resources Institute and WWF, focusing our collective efforts on climate-related innovation, nature-based solutions and energy efficiency initiatives in Asia. | Page 77 |
| How we are striving to meet investor expectations | The climate change resolution that was passed at our 2021 AGM committed us to publishing our thermal coal phase-out policy and setting short and medium term targets to align our provision of finance with the goals and timelines of the Paris Agreement. | Page 18 |
| c) Describe the resilience of the organisation’s strategy, taking into consideration different climate-related scenarios, including a 2°C or lower scenario |
| Embedding climate into scenario analysis | We use the people, processes, controls and governance structures from our traditional capital stress tests for our climate-related scenario analysis, as well as bespoke data, modelling techniques and analysis. | Page 57 |
| | | | | | | | |
| Key drivers of performance and how these have been taken into account | In 2021, we ran our first climate stress testing and scenario analysis exercise. For all portfolios, our assessments considered transition risk and physical risk.
We do not currently fully disclose the impacts of transition and physical risk quantitatively, due to transitional challenges such as data limitations and evolving science and methodologies. | Page 57
Page 1b |
| Scenarios used and how they factored in government policies | Our climate-related scenario analysis was run on a suite of scenarios including Hot house, Orderly and Disorderly scenarios, which incorporated a complex set of social, political and economic decisions, including taking into account government policies. | Page 57 |
| How our strategies may change and adapt | As our approach matures, we will look to begin incorporating our analysis into our core banking processes including strategic planning and risk appetite.
We regularly review and enhance our own building selection process and design standards to help these reflect the potential impacts of climate change. | Page 61 |
| Risk management | | |
| a) Describe the organisation’s processes for identifying and assessing climate-related risks |
| Traditional banking risk types considered | Our key climate risk types are: wholesale credit risk, retail credit risk, regulatory compliance risk, resilience risk and strategic (reputational) risk.
We tailor our underlying policies and controls to manage the different risks and exposures to reflect our respective roles in asset management, employee pensions and insurance to meet the needs of our key stakeholders. | Page 167
Page 56 |
Task Force on Climate-related Financial Disclosures (‘TCFD’) continued
| | | | | | | | |
| Recommendation | Response | Disclosure location |
| Process | The process of identification and assessment of climate risk differs according to the risk type, taking into account material risk drivers. We use scenario analysis to assess our portfolio’s exposure, which takes into account emerging regulatory requirements, and we use our transition risk questionnaire to request information from our corporate customers. | Page 167 |
| Integration into policies and procedures | We are integrating climate risk into the supporting policies, processes and controls for our key climate risks and we will continue to update these as our climate risk management capabilities mature over time. | Page 167 |
| b) Describe the organisation’s processes for managing climate-related risks |
| | | | | | | | |
| Process and how we make decisions | The Group Risk Management Meeting receives scheduled updates on climate risk, and receive regular updates on our climate risk appetite and top and emerging climate risks.
Our developing climate risk appetite metrics aim to support the oversight and management of the financial and non-financial risks from climate change.
Our approach to climate risk management is developing and how we manage these risks will vary by risk type. We will continue to align to our risk management framework when determining the materiality of its exposure to climate-related risks. | Page 80
Page 167 |
| c) Describe how processes for identifying, assessing and managing climate-related risks are integrated into the organisation’s overall risk management framework |
| How we have aligned and integrated our approach | Our approach to climate risk management is aligned to our Group-wide risk management framework and three lines of defence model. | Page 167 |
| How we take into account interconnections between entities, functions | Our dedicated climate risk programme continues to accelerate the development of our climate risk management capabilities, taking into account relevant interconnections within global businesses, functions and entities. | Page 167 |
| Metrics and targets | | |
| a) Disclose the metrics used by the organisation to assess climate-related risk and opportunities in line with its strategy and risk management process |
| Metrics used to assess the impact of climate-related risks on our loan portfolio | We disclose our wholesale loan exposure to the six high transition risk sectors. It is also used to be a metric, together with our transition risk questionnaire to assess impact of climate risk and help inform risk management.
We are starting to measure climate risk for our retail portfolio, starting with retail properties in the UK.
Our climate risk management information dashboard includes metrics relating to our key climate risks, and is reported to the Global Climate Risk Oversight Forum. However, we do not fully disclose metrics used to assess the impact of climate-related risks on retail lending, parts of wholesale lending and other financial intermediary business activities | Page 169
Page 170
Page 1b |
| Metrics used to assess progress against opportunities | We track our net zero progress using multiple metrics, tailoring methodologies to the specific measures.
We do not currently fully disclose the proportion of revenue or proportion of assets aligned with climate-related opportunities, relevant forward-looking metrics or internal carbon prices due to transitional challenges including data and system limitations.
| Page 18
Page 1b |
| Board or senior management incentives | We use a number of climate-related metrics within annual incentive scorecards, including those of the Group Chief Executive and Group Chief Financial Officer. | Page 17 |
| b) Disclose scope 1, scope 2 and, if appropriate, scope 3 greenhouse gas emissions and the related risks |
| Our own operations | We report scope 1, 2 and part of scope 3 greenhouse gas emissions resulting from the energy used in our buildings and employees’ business travel.
Future disclosure on scope 3 supply chain emissions (suppliers), as well as its related risks is reliant on our suppliers publicly disclosing their carbon emissions. | Page 52
Page 1b |
| Measuring our on-balance sheet financed emissions | We have started to measure our scope 3 portfolio impact, beginning with the oil and gas, and power and utilities sectors. Future disclosure on scope 3 financed emissions (customers) is reliant on our customers publicly disclosing their carbon emissions. | Page 47
Page 1b |
| c) Describe the targets used by the organisation to manage climate-related risks and opportunities and performance against targets |
| | | | | | | | |
| Details of targets set and whether they are absolute or intensity based | One of our strategic pillars is to support the transition to a net zero global economy. To support our ambition to align our financed emissions to achieve net zero by 2050 or sooner, we have set a new absolute on-balance sheet financed emissions 2030 target for the oil and gas sector, and an on-balance sheet financed emissions intensity 2030 target for the power and utilities sector.
Given that climate scenarios are mainly focused on medium- to long-term horizons, rather than short-term, we have set interim 2030 targets for on-balance sheet financed emissions for the oil and gas and power and utilities sectors. We do not currently disclose targets used to measure and manage physical risk, due to transitional challenges and data limitations. We do not consider water usage to be a material target for our business and therefore we have not included a target in this year’s disclosure.
| Page 50
Page 1b |
| Other key performance indicators used | We also use other indicators to assess our progress including energy consumption and percentage of renewable electricity sourced. | Page 18 |
Social
We aim to play an active role in opening up a world of opportunity for our customers, colleagues and communities as we bring the benefits of connectivity and global economy to more people around the world.
At a glance
Our relationships
Our purpose is opening up a world of opportunity, and we aim to bring that purpose to our customers, employees and the communities in which we operate.
We create value by providing the products and services our customers need and aim to do so in a way that fits seamlessly into their lives. This helps us to build long-lasting relationships with our customers. Through a series of surveys, we aim to listen to our customers to put them at the centre of our decision making. If things do go wrong, we aim to take action in a timely manner.
Our organisation has been shaped by the many cultures, communities and continents we serve, with almost 220,000 full-time equivalent employees (‘FTEs’) in 64 countries with 160 nationalities. We were founded on the strength of different experience and we continue to value that difference. We strive to champion inclusivity to better reflect the worlds of our customers and communities.
We have a long-standing commitment to support our communities, in areas where we can make a difference and support sustainable economic growth. We believe that financial services, when accessible and fair, can reduce inequality and help more people access opportunities.
Our culture is underpinned by our values: we value difference, we succeed together, we take responsibility, and we get it done.
| | | | | | | | | | | | | | |
| In this section | | | | |
| Customers | Customer satisfaction | While customer satisfaction improved during the year, we have work to do to improve our rank position against competitors. | Page | 67 |
| How we listen | We aim to be open and consistent in how we track, record and manage complaints. | Page | 68 |
| Employees | The future of work | As the Covid-19 pandemic tested our colleagues, we expect the way we work to change as the workforce meets new demands. | Page | 70 |
| Inclusion | We value diversity of thought and we are building an inclusive environment that reflects our customers and communities. | Page | 71 |
Learning and skills
development | We aim to build a dynamic, inclusive culture where colleagues can develop skills and experiences that help them fulfil their potential. | Page | 73 |
| Listening to our colleagues | We run a Snapshot survey every six months and report insights to our Group Executive Committee and the Board. | Page | 74 |
| Well-being | Our global well-being programme is a key enabler of our people strategy, especially as we move to a more hybrid way of working. | Page | 76 |
| Communities | Supporting communities | We focus on a number of priorities where we can make a difference and support sustainable economic growth. | Page | 77 |
| Financial inclusion | We aim to build financial health and remove barriers people can face in accessing financial services. | Page | 78 |
Customers
We create value by providing the products and services our customers need and aim to do so in a way that fits seamlessly into their lives.
We aim to listen, learn and act on our customers’ feedback, and use the net promoter score (‘NPS’) system to compare our customer satisfaction performance against our peers. We manage customer feedback when things go wrong and report on our actions against our key customer complaints.
In this section, we report on our customers as three distinct groups: our wealth and personal banking customers; medium and large-sized corporate customers; and our global and institutional customers. These groups are served by our three global businesses respectively: Wealth and Personal Banking (‘WPB’), Commercial Banking (‘CMB’) and Global Banking and Markets (‘GBM’).
Customer satisfaction
We remain committed to improving customers’ experiences. In 2021, we gathered feedback from over one million customers across our three global businesses to help us understand our strengths and the areas of focus.
Our recommendation scores improved in more than 60% of our markets, although we still have work to do to improve our rank position against competitors, as some have accelerated their performance faster than us.
Listening to drive continuous improvement
Throughout 2021, we continued to embed our new feedback system so we can better listen, learn and act on our customers’ feedback. We use NPS to provide a consistent measure of our performance. NPS is measured by subtracting the percentage of ‘Detractors’ from the percentage of ‘Promoters’. ‘Detractors’ are customers who provide a score of 0 to 6, and ‘promoters’ are customers who provide a score of 9 to 10 to the question: ‘On a scale on 0 to 10, how likely is it that you would recommend HSBC to a friend or colleague’.
We run studies that allow us to benchmark ourselves against other banks. In 2021, these were live in 10 WPB markets and 13 CMB markets, and in our key regions for our private bank and GBM. These will be expanded to other key markets in 2022. We try to make it as easy as possible for customers to give us feedback, accelerating our use of digital real-time surveys to capture insight. By sharing this and other feedback with our front-line teams, and allowing them to respond directly to customers, we are improving how we address issues and realising opportunities.
How we fared
In WPB, our NPS rose in seven markets. In Hong Kong, mainland China and UAE, we were ranked in the top-three banks, and in the UK, Malaysia and Mexico we improved rank positions. Our rank in Singapore and the US remained flat while our positions slipped in Australia and Canada. Customers told us we needed to focus on: making digital platforms more accessible, making payments easier, improving our account opening experience and helping customers better monitor their spending. We have made a commitment to invest in making these things better. In our private bank, our global NPS increased to 31, compared with 9 in 2020. This was largely due to an increase in our scores in Hong Kong, the US and Germany, with scores in Switzerland, the UK and Luxembourg also performing strongly.
In CMB, NPS rose in eight of our 13 key markets, with our rank positions in Malaysia, India, UAE and Mexico either improving or in the top three against competitors. In Hong Kong, we placed a stronger emphasis on innovation from a product and digital banking perspective. In the UK, as we continued to navigate the broader impacts of Covid-19, we faced challenges providing consistent levels of customer service. We are prioritising areas where we can improve the experience customers have with us.
In GBM, our NPS increased in Asia and the US. We ranked in first place in Asia, an improvement from third place in 2020. In the US, our NPS increased by 16 points, consequently placing us in sixth place versus our ninth place ranking in 2020. While our NPS declined in Europe by four points compared with 2020, our score improved among our key clients.
| | | | | |
Number of markets in top three or improving rank1 |
| 2021 |
| WPB | 6 out of 10 |
| CMB | 4 out of 13 |
1 In WPB, markets comprised: the UK, Hong Kong, Malaysia, Singapore, mainland China, Australia, UAE, Canada, Mexico and the US. In CMB, markets comprised: the UK, Hong Kong, Malaysia, Singapore, Pearl River Delta, mainland China, India, Indonesia, Australia, UAE, Canada, Mexico and the US. Rank positions are provided using data gathered through third-party research agencies.
Acting on feedback
We continued to focus on our digital capabilities in 2021 to enable better customer experiences.
In WPB, we introduced new mobile account opening functionality in Hong Kong, leading to improved NPS, and reaching an all-time high of 62 in March. We also launched Trade25, our new stock trading platform for 18 to 25 year-olds. By the end of the year, 1,800 users had opted into the programme. A new online banking platform was delivered across 20 markets to improve navigation and usability.
In CMB, our digital self-service programme launched to enable our customers to undertake more of their day-to-day banking online. Since introduction in early 2021, in the UK, over 140,000 customers changed their details online, 71,000 customers managed their debit and credit cards and 389,000 cheques were deposited using the mobile application.
In GBM, our digitised account onboarding and lifecycle management platform has been extended to 21 markets with enhanced features and capabilities including one time password and e-sign functionality. Integrated electronic identification and verification capabilities have also been deployed to simplify the onboarding experience for our clients.
How we listen
To improve how we serve our customers, we must be open to feedback and acknowledge when things go wrong. We have adapted quickly to support our customers facing new challenges and new ways of working, especially as a result of Covid-19-related lockdown restrictions.
We aim to be open and consistent in how we track, record and manage complaints, although as we serve a wide range of customers – from personal banking and wealth customers to large corporates, institutions and governments – we tailor our approach in each of our global businesses. As the table on the right demonstrates, we have a consistent set of principles that enable us to remain customer-focused throughout the complaints process.
For further details on complaints volumes by geography, see our ESG Data Pack at www.hsbc.com/esg.
| | | | | |
| How we handle complaints |
| Our principles | Our actions |
| Making it easy for customers to complain | Customers can complain via the channel that best suits them. We provide a point of contact along with clear information on next steps and timescales. |
| Acknowledging complaints | All colleagues welcome complaints as opportunities and exercise empathy to acknowledge our customers’ issues. Complaints are escalated if they cannot be resolved at first point of contact. |
| Keeping the customer up to date | We set clear expectations and keep customers informed throughout the complaint resolution process via their preferred channel. |
| Ensuring fair resolution | We thoroughly investigate all complaints to address concerns and ensure the right outcome for our customers. |
| Providing available rights | We provide customers with information on their rights and the appeal process if they are not satisfied with the outcome of the complaint. |
| Undertaking root cause analysis | Complaint causes are analysed on a regular basis to identify and address any systemic issues and to inform process improvements. |
Wealth and Personal Banking (‘WPB’)
In 2021, we received approximately 1.2 million complaints from customers. The ratio of complaints per 1,000 customers per month in our large markets reduced from 2.7 to 2.5.
In the UK, complaints relating to our response to the Covid-19 pandemic reduced, due to the decline in demand for financial support, payment holidays and additional lending. In the UK, we also implemented various initiatives to resolve common customer pain points and have provided our people with enhanced guidance to help them identify complaints.
The increase in complaints in Hong Kong mainly related to stresses to our operations caused by events including frauds, Covid-19-related government schemes and new business initiatives. We are addressing these by offering new flexible solutions, customer education on fraud prevention and enhanced digital services.
The increase in complaints in Mexico was driven by unrecognised charges in debit and credit cards caused by fraud attacks. In response, our fraud teams have taken actions to protect customers, including enhanced monitoring and customer alerts.
Our complaint management platform, now live in 11 markets, allows us to deliver a more customer-focused experience when managing feedback. We have streamlined complaints procedures, introduced greater automation to track complaints and provide customers with regular updates, and enhanced our reporting. Our new global complaints dashboard enables us to identify trends, and put in place actions to resolve emerging issues.
In our private bank in 2021, we received 431 complaints, a 25% decrease on 2020, largely due to the reduction in administration and service issues. Within this category, approximately 50% were attributable to processing errors/delays and client reporting delays/errors. In 2021, the private bank resolved 431 complaints.
WPB complaint volumes1 (per 1,000 customers per month)
| | | | | | | | | | | |
| | 2021 | 2020 |
Total2 | | 2.5 | 2.7 |
UK3 | ↓ | 1.6 | 2.1 |
Hong Kong3 | ↑ | 0.7 | 0.6 |
Mexico3 | ↑ | 5.5 | 4.9 |
1 A complaint is any expression of dissatisfaction about HSBC’s activities, products or services whether justified or not.
2 Markets included: Hong Kong, mainland China, France, the UK, UAE, Mexico, Canada, US.
3 The UK, Mexico and Hong Kong make up 84% of total complaints.
Acting on feedback
In 2021, we revised our global complaint handling policy to simplify our process, and set a principle-based approach. We aim to ensure we recognise those customers with enhanced care needs to deliver fair outcomes.
In March 2021, we were the first bank in Hong Kong to allow fully digital international account opening for both permanent and non-permanent residents through the launch of a new international account opening service through our internet banking.
Since October 2021, our UK customers have benefited from enriched transaction details for their debit and credit cards on the mobile app. The app provides a simpler interface, includes improved transaction descriptions and helps support customers where they are querying transactions through the dispute process.
Contact centres are accelerating the digital transformation to deliver enhanced customer experience by streamlining and automating processes. In 2021, we launched 14 new chat deployments, four new chatbots and security improvements that included voice biometrics and SMS passwords that drive towards delivering seamless customer experiences when connecting with our contact centres.
How we listen continued
Commercial Banking (‘CMB’)
In 2021, we received 82,238 customer complaints, a decrease of 22% from 2020. Of the overall volumes, 82% came from the UK, 10% from Hong Kong and 2% from France. We resolved 81,968 complaints.
The most common complaint related to operations, namely payment processing errors and delays. However, complaints in this category fell markedly compared with 2020, largely due to the significant reduction in complaints relating to the Bounce Back Loan Scheme in the UK after the scheme was closed in March 2021. In Hong Kong, the number of complaints received were significantly lower in 2021 due to a reduction in our due diligence reviews of customers as part of our global standards programme.
Encouraging our people to capture and log complaints allows us to continually improve the products and services we offer. To support this we rolled out a new complaints tool across 36 markets to ensure effective complaint handling remains at the front and centre of how we operate.
CMB complaint volumes1 (000s)
| | | | | | | | | | | |
| | 2021 | 2020 |
| Total | | 82.2 | 105.1 |
UK2 | ↓ | 67.1 | 81.9 |
Hong Kong2 | ↓ | 8.2 | 16.3 |
Acting on feedback
We seek to ensure that we treat customers fairly when managing complaints, especially those who may be considered vulnerable or who have enhanced care needs. In 2021, we introduced a way to identify complaints from such customers so that they get the right outcomes.
The majority of complaints related to payment processing. To improve our customers’ experience when making payments, we launched SMS and We Chat notifications in Hong Kong to accelerate payment screening times.
The second highest contributor to complaint volumes related to contact centres, in particular the time taken for our customers to be served. In the UK these complaints were driven by a rise in customer demand and operational challenges increasing call wait times. To improve response times, we provided customers with more digital channels including web chat and upgraded our Business Banking mobile app.
We continued to strengthen our financial crime procedures as part of our commitment to safeguard our customers. While complaints related to these processes and procedures remained high they fell by 2% compared with 2020.
Global Banking and Markets (‘GBM’)
We received 1,429 customer complaints in 2021, which was in line with complaint volumes in 2020. Of the complaints received in 2021, 92% were closed.
Our Global Liquidity and Cash Management business recorded the most complaints, corresponding to the high transaction volumes associated with this business. Complaint volumes were broadly stable throughout the year, with no material incidents observed. Some examples of complaints raised include temporary issues with system performance, and customers citing query resolution times.
GBM complaint volumes1
| | | | | | | | | | | |
| | 2021 | 2020 |
| Total | | 1,429 | 1,432 |
| Global Banking | ↓ | 282 | 309 |
| Global Markets and Securities Services | ↓ | 309 | 363 |
Global Liquidity and Cash Management3 | ↑ | 838 | 760 |
Acting on feedback
We have developed a client feedback tool to replace several legacy complaints logging tools for all GBM businesses. The tool is scheduled to go live across all GBM markets by September 2022.
While global systems were stable throughout 2021, where issues occurred we deployed resources to restore services quickly, and performed root-cause analysis to ensure fixes were implemented.
1 A complaint is any expression of dissatisfaction, whether justified or not, relating to the provision of, or failure to provide, a specific product or service or service activity.
2 For our CMB business, the UK and Hong Kong make up 92% of total complaints.
3 Global Liquidity and Cash Management excludes 1,190 complaints relating to payment operations, which is part of Digital Business Services.
Employees
Opening up a world of opportunity applies to colleagues, as well as our customers. We do this by building a diverse and inclusive organisation that prioritises well-being. We invest in the development of talent, creating a culture of learning and we empower our colleagues to shape the future of work.
We were founded on the strength of diverse experience, and we continue to seek different perspectives to ensure we are prepared to move at pace, and deliver on behalf of our colleagues, customers and shareholders. We regularly listen to our colleagues through surveys and Exchange sessions. The insight we collect shapes our approach to colleague engagement and support.
Our culture is underpinned by our values: we value difference, we succeed together, we take responsibility, and we get it done.
The future of work
The way we work is continuing to adapt as our workforce meets new demands, and as expectations change. In addition to this, our colleagues are developing new skills and working more flexibly than ever before.
Adapting at pace
During the Covid-19 pandemic, our colleagues adapted at pace in a fast-changing environment to provide continuity of service for our customers. This offered us the opportunity to rethink the future of work, taking the best of what we learnt to attract a better and more diverse workforce.
To support our approach, we created three guiding principles:
•Customer focus: We aim to make sure the way we work helps deliver the best commercial outcomes for our customers.
•Team commitment: We will connect with each other, build our community and collaborate.
•Flexibility: We will provide our colleagues with more choice on how, when and where we work, suitable for the roles we do.
Our future of work initiative is driven by feedback and insights that we gain from our colleagues. In April 2021, our return to workplace survey revealed approximately 70% of colleagues wanted individual flexibility around location and hours. In October 2021, our employee focus groups showed approximately 85% of colleagues wanted leaders to set an example and encourage our new ways of working.
In 2021, we started to formalise hybrid working arrangements, splitting time between home, office or other locations. We developed e-learnings and conversation guides to help managers discuss hybrid ways of working with their teams. We also created films and communications, showcasing how leaders and colleagues were role modelling new ways of working.
To further support individual flexibility, we created a new global flexible working framework and best practice guidelines to enable all colleagues to have more choice around how and where they work.
Our June 2021 Snapshot survey revealed there are five key areas our colleagues want us to get right for hybrid working to be successful:
•improve communication;
•offer the right level of flexibility;
•provide fit-for-purpose technology;
•facilitate collaboration; and
•enable our leaders to lead hybrid teams.
In line with this feedback, we improved technology platforms including the accelerated deployment of Microsoft Teams and improved remote internet connection capabilities. We have commenced refurbishment of buildings to support better collaboration, while ensuring the safety of our colleagues by continuing to provide social distancing measures. The future of work will remain an area of focus in 2022 and beyond.
We recognise we do not have all the answers, so we will continue to take a ‘test and learn’ approach, closely evaluating our success through regular feedback and business performance.
Spotlight on hybrid working
Our colleagues in mainland China – one of the first markets to reopen following Covid-19-related restrictions – embraced our new hybrid ways of working.
Managers assessed role types against a global ‘workstyle’ framework, which considers issues such as local laws, regulations and the need for face-to-face contact. This helped management understand and role model a balance between home and office working. Managers were then encouraged to have open discussions with their teams, supported by HR guidelines, around how individuals could be supported to work more flexibly. Following these changes, we received feedback that showed that ways of working had changed, and where roles allowed, hybrid working was now seen to be the standard way to work.
66%
of employees whose roles allow them to work remotely told us their ideal work pattern would be hybrid, according to the Snapshot employee survey in December 2021.
Inclusion
We value diversity of thought and we are building an environment that reflects our customers and communities. We are committed to attracting, developing and retaining diverse talent by fostering an inclusive culture.
We recognise the importance of data in driving change, and in 2021 placed an increased focus on capturing diversity data in markets where this is possible from a legal, data privacy and cultural perspective. We are now using data science to uncover barriers to more equal representation across the organisation.
Our approach to inclusion is organised under four pillars:
Investing in talent
To ensure that we have diversity of thought and represent the communities we serve it is imperative that we attract, hire and develop high-performing diverse talent. Our recruitment, retention and development initiatives include the following:
•In recruitment, it is now mandatory for all hiring managers to carry out inclusive hiring training. For external recruitment, we work with agencies that specialise in promoting more diverse hires at all levels of seniority.
•To support our people managers and colleagues, we have invested in expanding our leadership development programmes, and in initiatives relating to mental health and neurodiversity. We are also the first UK employer to be accredited as menopause friendly.
•We run targeted leadership programmes for underrepresented groups, and we have reviewed succession plans and pipelines for senior leadership roles in our key markets with a focus on representation of female and ethnically diverse talent.
For further details on awards and employee programmes, see the ESG Data Pack at www.hsbc.com/esg.
Investing in employee networks
Tens of thousands of colleagues are part of our employee networks, focusing on age, disability, mental health, ethnicity, faith, gender, LGBT+, working parents, carers, and wider common interest groups. Each network is supported by an executive sponsor. Some highlights from 2021 include:
•Balance, our gender network, launched an initiative that now runs across all employee networks, providing structured small group executive coaching sessions led by internal leaders in 38 markets. Nearly 3,000 colleagues have benefited to date.
•Embrace, our ethnicity network, hosted global panel sessions on World Day for Cultural Diversity to discuss the importance of ethnic and cultural inclusion and the actions needed to bring about sustainable change. In the US, Embrace held career insights workshops showcasing the skills needed for various internal vacancies.
•Our Pride network launched ‘How to be an LGBT+ Ally’ e-learning in 10 languages. Approximately 2,500 colleagues completed the training within five months, including the Group Executive Committee.
Investing in data
The diversity data we collect is reviewed by our Group Executive Committee on a quarterly basis and is used to make evidence-based decisions and hold us accountable for progress against our commitments. We will use diversity data to enhance our understanding of employee sentiment across diverse groups and to enable us to assess the inclusiveness of our hiring processes. In 2021, highlights included:
•We have expanded our self-identification capability to 38 markets, enabling 91% of our workforce to share their ethnic heritage.
•Employees can now also share their disability, gender identity and sexual orientation data. These self-identification options were enabled for 90%, 80% and 70% of our workforce respectively, in markets where this was permitted from a legal, regulatory and cultural perspective.
•As part of the hiring process, we have enabled candidates in 12 markets, including five of our largest, to share their diversity data. We will add a further seven markets in 2022.
Supporting customers and communities
We are committed to supporting the diverse communities we serve, with actions across HSBC, and in our personal and wholesale businesses specifically, including:
•We empowered female entrepreneurs to increase the scale of their business through masterclasses, coaching and networking as part of HSBC Roar, a customer coaching and networking programme launched by HSBC Global Business Banking in partnership with AllBright.
•We redesigned our retail banking apps in line with accessibility guidelines and transformed the physical appearance of our credit and debit cards to make them more accessible.
•We demonstrated our commitment to promoting a culture of respect and equality by becoming a signatory in 2021 to the UN Standards of Conduct for Business: Tackling discrimination against lesbian, gay, bi, trans and intersex people.
For further details of how we are making financial services more accessible and fair, see ‘Financial inclusion’ on page 78.
Disability confidence
Our employee networks are essential to fostering an inclusive culture. Our Ability network celebrated International Day of People with Disabilities in partnership with PurpleSpace, which launched the Purple Light Up movement to build disability confidence for employees and customers. Global events were held to celebrate the contribution of colleagues with disabilities, raise awareness of our disability confidence goals, and build empathy and allyship.
In 2021, we made progress on our ambition to become a disability confident organisation. Key highlights were: running more than 50 digital accessibility sessions attended by 15,000 employees and partners; launching local Ability networks in India and Poland, and increasing membership across the Group; and welcoming six new colleagues with Down’s Syndrome to work in our UK branches.
Inclusion continued
Women in senior leadership
After achieving our ambition of 30% women in senior leadership positions in 2020, we set a new goal to reach 35% by 2025. At the end of 2021, we had 31.7% of women in senior leadership roles.
Appointments of external female candidates into senior positions were 37.6%, up from 31.7% in 2020. Promotions of women into senior leadership roles were 43.2%.
Talent programmes – including Accelerating Female Leaders and our Explore leadership course – have provided skills and coaching to help high-performing women progress their careers at an accelerated rate.
1 Combined executive committee and direct reports includes HSBC Group Executives, General Managers, Managing Directors, Group Company Secretary and Chief Governance Officer and their direct reports (excluding administrative staff).
2 Senior leadership is classified as those at band 3 and above in our global career band structure.
Our ethnicity commitments
In July 2020, we made a commitment to double the number of Black colleagues in senior leadership positions by 2025. We have focused on the UK and US markets, where most of our Black colleagues are based. In 2021 we grew our number of Black senior leaders by 17.5%.
Our global campaign to invite colleagues to provide us with data on how they identify has provided us with a more robust understanding of the ethnic profile of our workforce. Using this data, in 2022 we are refining our ethnic diversity goals to work towards a diverse senior leadership representation that better reflects the communities we serve. We will maintain our focus on goals for Black senior leaders and will also establish goals for other underrepresented ethnically diverse groups.
We put in place important foundations in 2021 through leadership development programmes, inclusive hiring, and investing in the next generation of high-performing diverse talent.
Our Accelerating into Leadership programme was expanded to include ethnically diverse men as well as women in middle management. In the UK, we piloted the Solaris Bridge development programme for high-performing Black women.
We have partnered with organisations that specialise in engaging ethnically diverse talent for graduate, mid-career and leadership recruitment, and request diverse candidate slates from our recruitment partners.
We are building our pipeline of future talent through grants, scholarships and internships. We have signed up to the UK 10,000 Black Interns initiative, pledging to hire 35 interns – which is the highest number of places among all financial services companies. In the UK we also donated £2m to the #Merky Foundation to support 30 Stormzy Scholars at the University of Cambridge over the next three years. In the US, we have established an $800,000 scholarship with the Executive Leadership Council to fund Black students interested in a career at HSBC.
Representation and pay gap reporting
We publish our gender representation, ethnicity representation and pay gap data annually to ensure we continue to make progress and to help us identify new areas for action. We have been reporting our gender representation and pay gap data for the UK since 2017. In 2020, we voluntarily extended our reporting to include ethnicity for the UK and gender for the US. In 2021, we extended this further to include ethnicity
for the US and gender for mainland China, Hong Kong, India and Mexico. This covers 70% of our organisation, providing a clear view of overall representation.
While we are confident in our approach to pay, until women and ethnically diverse colleagues are appropriately represented at every level across the organisation, and we have more complete ethnicity self-identification data, we will continue to see gaps in average pay. We review our pay practices regularly and work with independent third parties to review equal pay. If pay differences are identified that are not due to objective, tangible reasons such as performance or skills and experience, we make adjustments.
In 2021, our median aggregate UK-wide gender pay gap, including all reported HSBC entities, was 46.7%, compared with 48.0% in 2020, and the ethnicity pay gap was -6.0%, compared with -5.6% in 2020. Our overall UK gender pay gap is driven by the shape of our UK workforce. There are more men than women in senior and higher-paid roles, and more women than men in junior roles. We also have a number of senior, global, head office roles based in the UK.
For further details on our gender representation, ethnicity representation, pay gap data, and actions we are taking, see www.hsbc.com/diversitycommitments and the ESG Data Pack at www.hsbc.com/esg.
Diversity data
During 2021, our inclusion team worked with legal, regulatory and diversity and inclusion colleagues in each of our markets to ensure we enabled as many colleagues as possible to share their data on a voluntary basis.
This was one of the biggest global initiatives we have run, and has resulted in significant engagement from colleagues sharing their ethnicity data so far.
It will be a multi-year process for colleagues and candidates to feel comfortable sharing their diversity data with us. We will need to demonstrate the robustness of our data security controls, deliver on our commitments to use this data to progress representation targets, identify and remove inclusion barriers and enhance our inclusion culture.
Percentage of our senior leadership who are women
31.7%
(2020: 30.3%; 2019: 29.4%; 2018: 28.2%)
Ethnicity declaration
52.4%
Colleagues who have shared their ethnic heritage with us to date, out of 91% who are able to do so.
Learning and skills development
We aim to build a dynamic, inclusive culture where colleagues can develop skills and undertake experiences that help them fulfil their potential. This determines not only how we develop our people but also how we recruit, identify and nurture talent.
Our resources
We use a range of resources to help colleagues take ownership of their development and career including:
–HSBC University is our home for learning and skills, which is accessed online and through a network of training centres. Learning is organised through technical academies aligned to businesses and functions and enterprise-wide academies.
–Our My HSBC Career portal offers career development information and resources to help colleagues manage the various stages of their career from joining through to career progression.
–HSBC Talent Marketplace is a new online platform using artificial intelligence (‘AI’) to match those keen to learn specific skills while they work, with opportunities to support relevant projects alongside existing work.
Developing strong foundations
We expect all colleagues to complete global mandatory training each year. It plays a critical role in shaping our culture, ensuring a focus on the issues that are fundamental to working with us – such as sustainability, financial crime risk, and our intolerance of bullying and harassment. New joiners attend our Global Discovery programme designed to enhance their knowledge of the organisation and engage them with our purpose, values and strategy.
As our risks and opportunities change, our technical academies offer general and targeted development. Our Risk Academy provides learning for every employee in traditional areas of risk like financial crime risk but also offers more specialised development for those in high-risk roles and for emerging issues like climate risk or the ethics of AI and Big Data.
A focus on skills
Our approach to learning is skills based. Our academy teams work with businesses and functions to identify the key skills and capabilities they need in the future. We also help colleagues identify, assess and develop the skills that match their aspirations.
In 2021, we ran a Future Skills campaign called Focus 4, encouraging colleagues to identify four skills to prioritise in their development plans. During four themed weeks colleagues attended various events that introduced them to areas such as data, digital and sustainability skills, as well as personal skills including critical thinking and resilience.
Changing how we learn
Colleagues can access HSBC University online via a learning platform called Degreed. This helps them identify, assess and develop skills through internal and external courses and resources in a way that suits them. Launched in 2021, usage of Degreed grew significantly through the year.
Degreed materials range from short videos, articles or podcasts to packaged programmes or curated learning pathways that link content in a logical structure. Degreed changes the nature of learning, balancing time-intensive classroom learning with simple accessible and timely content. By December, more than 115,000 colleagues were registered on the platform, and in 2021, overall training volumes were up to 26.7 hours per FTE from 23 hours per FTE in 2020.
Most development happens while our colleagues work. In 2021, we launched an AI-based platform called Talent Marketplace, which matches colleagues to projects and experiences based on their aspirations. By December, this had been rolled out to nearly 50,000 colleagues in the US, India, Singapore and the UK, and will be rolled out globally in 2022.
Leadership development
It remains critical to our ability to energise for growth that we manage people effectively and our leaders make an impact. In recent years, we have refreshed how we provide leadership development. In 2021, we launched a new executive development curriculum for our most senior leaders, combining internal programmes and business school activities with targeted technical programmes on key topics and skills.
Retaining and identifying future talent
The starting point to identifying talent is having a recruitment process that is fair and inclusive. In February 2021, we launched inclusive hiring training to help managers make decisions in line with our hiring principles. Managers can now only hire once they have completed this training, with over 13,500 managers receiving certification in 2021.
As we reshape HSBC we recognise that managing change well is critical. To that end, we have committed to focusing on redeploying those colleagues impacted by restructuring. In 2021, 23% of staff impacted found new jobs within HSBC, compared with 14% in 2020.
Our global graduate programme welcomed 650 new colleagues to the organisation in 2021. We held a three-day virtual induction to help graduates understand the programme and how they can play their part in bringing our purpose, strategy and values to life.
The Group Executive Committee takes time to identify successors for our most critical roles. Successors undergo robust assessment and participate in executive development programmes.
New routes to opportunity
Our Talent Marketplace platform helps our colleagues to open up a world of new opportunities to develop their skills, connections and careers to complement traditional learning.
Colleagues can create a profile that describes their skills, experience and aspirations. The system uses AI to match projects to potential candidates, providing our colleagues with an opportunity to learn and offering project owners a diverse pool of talent from which to draw.
Having launched in a number of countries in 2021, Talent Marketplace is helping our colleagues to connect with each other around the world and realise new opportunities. For example, one Singapore-based colleague who wanted to improve their communication skills and was matched with a London-based project owner who needed local market knowledge and language skills.
Training at HSBC
5.9 million
Training hours carried out by our colleagues in 2021.
(2020: 5.2 million)
Listening to our colleagues
We were founded on the strength of different experiences, attributes and voices. We believe that seeking out and listening to the views of our colleagues is a fundamental part of who we are and how we work. This has been especially important in 2021, as we look to define the future of work, support colleague well-being and develop the skills to enable future success.
Listening to colleague sentiment
We run a Snapshot survey every six months and report insights to our Group Executive Committee and the Board. Results are shared across the Group to provide managers in each region with a better understanding to plan and make decisions. We complement these all-employee surveys with targeted listening activity throughout the year, and in 2022 we will move to one all-employee Snapshot survey to reduce the risk of survey fatigue.
We received 272,718 responses to our two Snapshot surveys in 2021, with a record response rate of 64% in June and 61% in December, up from 62% and 56% respectively in the same periods of 2020.
Employee listening to support our people priorities
In addition to our regular Snapshot surveys, we captured monthly feedback through a series of pulse surveys from September 2020 through to April 2021 to understand colleagues’ views on returning to the workplace and their preferences for the future of work, with more than 60,000 participants. This feedback was complemented by a virtual focus group involving 3,400 colleagues across 20 markets in September 2021, deep-diving into hybrid working. We will continue to monitor employee attitudes and preferences for the future of work through our Snapshot surveys and other targeted research. For further details on the future of work, see page 70.
We also used our Snapshot surveys and virtual focus groups to engage with colleagues about learning and skills development, with over 1,100 participants to a series of virtual focus groups in March 2021 on learning, development and skills for the future. In our December Snapshot, 76% of colleagues said that where they work, people are empowered to seek opportunities to learn and develop new skills. For further details on learning and skills development, see page 73.
Employee well-being has remained a central focus of our Snapshot research throughout 2021 with a dedicated section of each survey focused on colleague well-being. For further details on well-being, see page 76.
We also used Snapshot and pulse surveys to measure the progress of our refreshed purpose, strategy and values, which we launched in February 2021. By the end of 2021, 78% of colleagues said they were aware of these, and 82% of those believed that we have the right purpose, strategy and values to drive success (see below).
Fostering an inclusive working environment
We expect our people to treat each other with dignity and respect and do not tolerate bullying or harassment on any grounds.
Over the past few years, we have strengthened our approach to bullying and harassment, improving our collective understanding of, and response to, these issues. In 2021, we reinforced expected standards of conduct with a refreshed global anti-bullying and harassment code, supplemented with local codes to reflect cultural context while maintaining consistent high standards across the Group.
We have added further anti-bullying and harassment messages to our mandatory training for all our colleagues, and continued our campaign to encourage colleagues to be ‘active bystanders’ and speak up when they see or experience poor behaviours or things that do not seem right.
We have mandatory local procedures for handling employee concerns, including complaints of bullying and harassment. Where investigations are required, we have a global framework setting the standards for those investigations and an additional quality assurance process. We monitor bullying and harassment cases to inform our response and identify actions that could prevent future issues. The data is reported to management committees.
We are not complacent and know that this journey continues. Our refreshed values will guide and inform our plans for 2022 to continue to create and promote an inclusive working environment.
| | | | | | | | |
| Employee engagement and turnover | 2021 | 2020 |
| Employee engagement | 72 | % | 72 | % |
| Voluntary turnover | 12.7 | % | 7.7 | % |
| Involuntary turnover | 3.8 | % | 3.6 | % |
Embedding our new purpose and values
Following the launch of our new purpose and values in February 2021, we have continued to embed them in how we operate.
As well as building awareness through communications, we have helped leaders, teams and individuals explore how they bring them to life through workshops, webinars and team discussions. We have further embedded the new values and their associated behaviours into our learning programmes, recognition schemes and performance management processes across HSBC. We continue to find ways to make our purpose and values a cornerstone of how we communicate, conduct business and deliver employee services.
Awareness of the new purpose and values has been consistently high, at 78% in June and December 2021. As evidence that the new purpose and values are becoming embedded, we had positive change in sentiment during the year. Among colleagues who were aware of our purpose and values, 76% of respondents to the December Snapshot survey believed that they will lead to meaningful changes in how we work. This was a seven point increase from the survey result in June. Similarly, a total of 77% of employees stated in December that people around them demonstrate the values in how they work, which was a seven point increase from June. Overall, 82% of aware employees believed that we have the right purpose, strategy and values to drive success.
Listening to our colleagues continued
Measuring our progress against peers
We use seven Snapshot indices to measure key areas of focus and to enable comparison against a peer group of global financial institutions. The table sets out how we performed.
| | | | | | | | | | | | | | |
| Index | Score1 | vs 2020 | HSBC vs benchmark2 | Questions that make up the index |
| Employee engagement | 72 | 0 | +4 | I am proud to say I work for this company.
I feel valued at this company.
I would recommend this company as a great place to work. |
| Employee focus | 71 | -1 | +3 | I generally look forward to going to work.
My work gives me a feeling of personal accomplishment.
My work is challenging and interesting. |
| Strategy | 72 | +4 | +2 | I have a clear understanding of this company's strategic objectives.
I am seeing the positive impact of our strategy.
I feel confident about this company's future. |
| Change leadership | 74 | 0 | -2 | Leaders in my area set a positive example.
My line manager does a good job of communicating reasons behind important changes that are made.
Senior leaders in my area communicate openly and honestly about changes to the business. |
| Speak-up | 75 | 0 | +8 | My company is genuine in its commitment to encourage colleagues to speak up.
I feel able to speak up when I see behaviour which I consider to be wrong.
Where I work, people can state their opinion without the fear of negative consequences. |
| Trust | 76 | +1 | +5 | I trust my direct manager.
I trust senior leadership in my area.
Where I work, people are treated fairly. |
Career (new)3 | 67 | +2 | +3 | I feel able to achieve my career objectives at this company.
I believe that we have fair processes for moving/promoting people into new roles.
My line manager actively supports my career development. |
1 Each index comprises three constituent questions, with the average of these questions forming the index score.
2 We benchmark Snapshot results against a peer group of global financial services institutions, provided by our research partner, Karian and Box. Scores for each question are calculated as the percentage of employees who agree to each statement. For further details on the constituent questions and past results, see the ESG Data Pack at www.hsbc.com/esg.
3 The career index was introduced in early 2021. It comprises questions that were asked in earlier surveys so we are able to report a comparison with 2020.
Managing employee engagement
Three of our seven Snapshot indices improved in 2021, following significant increases in 2020. Employee engagement, which is our headline measure, was four points above benchmark and five points above 2019 levels. The measure was unchanged from 2020, as were the speak-up and change leadership indices. The employee focus index dropped by one point, but remained three points above the benchmark.
Our response to the Covid-19 pandemic remained a strong positive driver of employee sentiment in 2021. Employee feedback frequently references flexibility and the ability to work from home as an important factor in why they would recommend HSBC as a great place to work, with employee well-being, HSBC’s Covid-19 response and the working environment having the greatest positive influence on employee engagement. Looking beyond the pandemic, we will continue to focus on aspects of the wider employee experience that our research shows are the strongest drivers of employee engagement. This included ensuring that colleagues feel a sense of belonging, feel trust towards leadership, see career progression opportunities at HSBC and are confident in the company’s future.
Our strategy index continued to strengthen with employees increasingly confident about the future. We still trailed the benchmark by five points for employees stating that they see the positive impact of our strategy. We hope to address this through a renewed focus on our purpose and strategy as part of our 2022 employee engagement activities.
We note that voluntary turnover increased from 7.7% in 2020 to 12.7% in 2021, consistent with trends across the wider employment market. Our Snapshot survey showed a slight decrease in employees who intend to stay with HSBC for five or more years, from 65% in 2020 to 64% in 2021. Our research shows that how employees feel about their career at HSBC is a key driver of their intent to stay. Ensuring that our people have the opportunity to develop new skills and further their careers with HSBC is therefore important for retaining talent. We are reassured that against this backdrop, our career index increased by two points since 2020 and was three points above the external benchmark.
For further details on how employee engagement scores, including among colleagues identifying as part of an ethnic minority or as having a disability, have an impact on executive Director remuneration scorecards, see page 304 in our corporate governance report.
Employee engagement
72%
Employee engagement index score
(2020: 72%)
74%
Of colleagues feel confident about this company’s future
(2020: 70%)
67%
Of colleagues feel they can achieve their career objectives at this company
(2020: 66%)
Well-being
We are deeply committed to supporting the well-being of our colleagues as we transition to new ways of working and support our colleagues through the pandemic. Guided by data and feedback from our employee surveys, our approach will continue to adapt to ensure our services remain relevant.
In 2021, our global well-being programme covered three pillars: mental, physical and financial. In 2022, we added social well-being as a fourth pillar.
Mental well-being
Despite the immense challenges of the Covid-19 pandemic, 82% of colleagues in our December Snapshot survey rated their mental well-being as positive, compared with 81% in 2020. However, colleagues faced challenges, with 27% asking for more support in this area. To address this, we made Headspace, a meditation app, available to all colleagues globally. Since July 2021, 23,000 colleagues have used Headspace to access guided exercises and meditations.
All colleagues took part in mental health awareness training, as part of our global mandatory training programme. We updated our mental health e-learning to help colleagues identify signs of mental ill-health in other colleagues, in both remote and face-to-face settings, as well as to help have supportive conversations with customers. Despite being voluntary, the e-learning has been completed by 26,000 colleagues, with 18% of these being line managers.
To celebrate World Mental Health Day, we ran a global awareness campaign and created a film featuring colleagues sharing personal stories. Throughout October 2021, we held over 60 virtual events globally, featuring external experts providing advice on mental health-related topics.
We know from employee surveys that colleagues are more likely to report better mental well-being when they are physically active, have a good work-life balance, and have regular well-being conversations with their manager. We recognise there is more we can do to support these good habits and will prioritise addressing them in 2022.
Physical well-being
Employee Snapshot surveys revealed 75% of colleagues rated their physical well-being positively, compared with 73% in 2020. As a result of the pandemic, access to doctor appointments became limited in some locations. To reduce the risk of serious illnesses going undetected, we increased the number of markets where we offered telemedicine services, allowing colleagues to have appointments with doctors virtually. Coverage of our workforce increased from 50% in 2020 to 66% in 2021. We have continued to provide access to private medical insurance in the majority of our countries, covering 98% of permanent employees. In certain countries we provide on-site medical centres that the majority of employees can access.
In June, we ran a month-long global physical well-being campaign, featuring guidance from sport ambassadors and our Chief Medical Adviser on topics including management of chronic conditions, exercise, nutrition and symptoms that should not be ignored.
Financial well-being
Snapshot surveys revealed a decrease in financial well-being, with 64% of colleagues reporting positively, compared with 68% in 2020. However, colleagues felt more supported to manage their financial well-being, at 58%, an increase of two points, and more confident talking about their financial well-being with their line manager, at 56%, an increase of six points.
During the pandemic, we preserved pay and benefits, and introduced hardship funds in some markets, which allowed colleagues to apply for financial support. In 2021, we expanded our employee banking proposition, HSBC Together, into Asia and parts of Europe, providing financial guidance and seminars in seven countries, covering 53% of colleagues.
We also introduced employee share plans in mainland China and Poland for the first time, meaning 90% of colleagues can invest in HSBC shares.
Social well-being
At the beginning of 2022, we formalised social well-being as a new pillar of our programme. This was done to address challenges around reduced in-person connections, and to continue the development of our colleagues’ work-life balance.
We will prioritise promoting team cohesion in a hybrid environment, with 25% of colleagues indicating they would like better technology and support with interacting with one another. Snapshot surveys revealed 76% of colleagues say they can integrate their work and personal life positively, compared with 74% in 2020. We will continue to facilitate this by introducing flexible working policies in line with our future of work initiative (see page 69).
In 2021, we refreshed our At Our Best recognition online platform, which allows for real-time recognition and appreciation between colleagues. In 2021, the total number of recognitions made was 1.1 million. In 2022, we will evolve the programme to encourage more recognitions, including through access on mobile devices.
Award
Global Centre for Healthy Workplace Awards 2021
-Best global healthy workplace programme, multinational employer
Advocating change for positive mental health
In January 2021, we helped found and launch the Global Business Collaboration for Better Workplace Mental Health. It is the first global business-led initiative of its kind designed to advocate for – and accelerate – positive change for mental health in the workplace.
Despite important progress in some countries, there remains a lack of evidence, best practice and tools, to effectively implement global approaches to workplace mental health. This challenge is exacerbated by cultural complexities and stigma.
Together with academic experts and not-for-profit organisations, we want to create a world where all business leaders recognise, have the right tools, and commit to take tangible and evidence-based action on mental health in the workplace, enabling their workplace to thrive.
This initiative seeks to advance progress around the world by committing business leaders to a pledge to create mentally healthy workplaces, and by freely sharing insights and best practices to create a roadmap for change, wherever an organisation is on its journey.
Communities
We have a long-standing commitment to support the communities in which we operate, in areas where we can make a difference and support sustainable economic growth.
Our Future Skills strategy aims to provide our customers, colleagues and communities with the employability and financial capability skills and knowledge needed to thrive in the post-pandemic environment, and through the transition to a sustainable future. Our five-year Climate Solutions Partnership, powered by $100m of our philanthropic funding, aims to scale up climate innovation ventures and nature-based solutions, and to help transition the energy sector towards renewable sources. We also recognise the importance of listening to – and addressing – local community needs and causes. We earmark approximately a quarter of our funding for causes that are important to communities across our network, such as environmental protection or healthcare.
Supporting communities
Future skills
Our Future Skills strategy, launched in 2018, has supported over 5.2 million people through more than $156m in charitable donations. Current projections from our charity partners indicate our support during 2021 reached more than 1.2 million people through donations of $41.8m.
With the global economy still feeling the effects and restrictions from the Covid-19 pandemic, our colleagues and partners have continued to deliver programmes aimed at ensuring that people likely to be most impacted are not left behind. We also funded global research by The Prince’s Trust group of charities, to get a true understanding of how young people feel about the future of work in this context.
We support our charity partners to deliver a combination of global and locally-led programmes, including:
•Junior Achievement’s International Innovation Challenges, which encourage young people to use their creativity to help communities develop financial capability;
•our Green Skills Innovation Challenge with Ashoka – a global network for social entrepreneurs – which recognised 12 innovators who are simultaneously solving environmental and social problems;
•the Technovation Girls programme, which aims to address the lack of diversity in the technology sector by equipping young women and girls with the skills to become technology entrepreneurs and leaders;
•Soliya, an international non-profit organisation, whose work enables young adults to gain the skills needed to thrive in a connected world; and
•the Ryerson Diversity Institute’s Pursue Entrepreneurship programme, which supports Black high school students and recent graduates to develop leadership skills and explore careers in entrepreneurship.
Our High Impact grants programme allows our teams to apply for additional funding to support local projects. This year we awarded $7.4m to 26 projects, which will be distributed over two years.
Climate Solutions Partnership
Working with the World Resources Institute and WWF, we are focusing our collective efforts on three global themes: climate-related innovation, nature-based solutions and energy efficiency initiatives in Asia. We see these as having the potential to make a significant impact in the mission to achieve a net zero, resilient and sustainable future. Since 2020, we have provided $28.4m to our NGO partners.
Local priorities
Our support for Covid-19 relief efforts continued in 2021, with a further $10m donated in India. Focusing on the longer-term response to the pandemic, we also launched a one-year programme with UNICEF to support the employability and financial capability of young people in Mexico, Indonesia and India.
Employee volunteering
We offer paid volunteering days, and encourage our people to give time, skills and knowledge to causes within their communities. In 2021, our colleagues gave over 79,000 hours to community activities during work time.
Engagement with pressure groups
We aim to maintain a constructive dialogue on important topics that are often raised by campaigning organisations and pressure groups.
Charitable giving in 2021
Social, including Future Skills: 39%
Environment, including the Climate Solutions Partnership: 18%
Local priorities: 22%
Disaster relief and other giving: 21%
Skills impact bond
In 2021, we supported India’s first skills impact bond, issued by the National Skills Development Corporation, a public-private partnership set up by India’s Ministry of Finance. We are providing $4.3m as one of four outcome funders, who commit to pay out once the partnership achieves its stated objectives. Over the next four years, the partnership aims to equip 50,000 young people with skills and vocational training, and to help
them to find employment. Our philanthropic funding towards the bond aims to prove the concept of this innovative approach, and act as a catalyst for much wider impact in the future.
Total cash giving towards charitable programmes
$113.8m
Hours volunteered during work time
>79,000
People reached through our Future Skills programme
1.2 million
Financial inclusion
We believe that financial services, when accessible and fair, can reduce inequality and help more people access opportunities. We aim to play an active role in opening up a world of opportunity for individuals by building financial health and removing the different barriers that people can face in accessing financial services.
Access to products and services
We remain committed to supporting individuals experiencing homelessness or housing difficulties through our ‘no fixed address’ service in the UK and Hong Kong. We continue to support survivors of human trafficking in the UK, as well as refugees and unified screening mechanism claimants in Hong Kong through the provision of basic banking services. In 2021, HSBC UK also supported 150 Afghan settlers who arrived in the country as part of a resettlement scheme to open bank accounts, a crucial first step to moving their lives forward. In May 2021, as part of our ongoing efforts to create innovative product offerings, we introduced basic banking services for ethnic minority customers in Hong Kong who have a limited understanding of English or Chinese.
Making banking accessible
Number of accounts opened for homeless, refugees and survivors of human trafficking
Access to financial education
We continue to invest in financial education content and features across different channels, to help customers, colleagues and communities be confident users of financial services. Throughout 2020 and 2021, we received over 2.8 million unique visitors to our digital financial education content, making progress towards our 2019 goal of reaching 4 million unique visitors by the end of 2022. In the UK, we have a financial fitness score that provides individuals with an indicative score on the healthiness of their finances based on details about their spending, borrowing and saving habits, as well as tips to improve their financial fitness.
Our financial education offering is extended to our colleagues in the form of online learning modules, empowering them to improve their skills and enhance their financial well-being. We also deliver digital content and webinars to employees of our corporate clients on a broad range of financial topics. These are supported by financial health checks – a one-on-one conversation on a non-advised basis to discuss individuals’ circumstances based on their learning.
We support charity programmes that deliver financial education to our local communities. In 2021, we launched our Saving for Good programme in partnership with JA Worldwide – Injaz Al-Arab. The programme aims to equip economically vulnerable migrant workers in Bahrain, Egypt, Kuwait, Qatar and the UAE with financial literacy skills to strengthen their financial resilience.
We understand the importance of building financial capability in children to ensure future resilience, and continue to collaborate with partners to deliver financial education programmes such as Money Heroes. In 2021, HSBC UK also introduced a programme to tackle the unhealthy spending habits associated with the increased amount of gaming that young people are engaging with today. The programme featured digital tools, videos and in-school lesson plans to educate children and parents on the issue.
Inclusive design
We aim to ensure that our banking products and services are designed to be accessible for customers experiencing either temporary or permanent challenging circumstances, such as disability, impairment or a major life event. For further details on our new HSBC UK accessible card features, see page 333.
We strive to make our digital channels accessible so they are usable by everyone, regardless of ability. We have now reviewed our browser-based websites in 27 retail markets and our mobile banking services in 21 markets against the Web Content Accessibility Guidelines 2.0 AA standards, which are stipulated by the World Wide Web Consortium. We are continuing to make progress in this area.
We also want to be more explicit about catering for neurodiverse users and have launched our first Neurodiversity Guidelines. The purpose of these guidelines is to provide members of HSBC digital teams with guidance for how they should design, code and create digital content to support the needs of people who are neurodiverse.
Within our insurance business, we are redesigning the layout of our documents, adding in visual graphics and simplifying the language used.
For further details of our product design and our product responsibilities, please see page 83.
Supporting women and minority-led businesses
We are aiming to support our diverse customers by opening up a world of opportunity for women and minorities. In October 2021, we committed to allocating $100m in lending for companies that are founded and led by women and minorities through HSBC Ventures, which provides capital to start-ups and early stage businesses around the world. We understand it is critical to provide financial support to founders who are historically underrepresented, so that their businesses can grow and expand. Since 2019, we have also been in partnership with AllBright, a network that helps women in business connect with funding and growth opportunities. Together with AllBright, we launched HSBC Roar in 2021, a customer coaching and networking programme for female entrepreneurs.
Governance
We remain committed to high standards of governance. We work alongside our regulators and recognise our contribution to building healthy and sustainable societies.
At a glance
Our relationship
We act on our responsibility to run our business in a way that upholds high standards of corporate governance.
We are committed to working with our regulators to manage the safety of the financial system, adhering to the spirit and the letter of the rules and regulations governing our industry. In our endeavour to restore trust in our industry, we aim to act with courageous integrity and learn from past events to help prevent their recurrence.
We strive to meet our responsibilities to society, including through being transparent in our approach to paying taxes. We also seek to ensure we respect global standards on human rights in our workplace and our supply chains, and continually work to improve our compliance management capabilities.
We acknowledge that increasing financial inclusion is a continuing effort, and we are carrying out a number of initiatives to increase access to financial services.
For further details on our corporate governance, see our corporate governance report on page 253.
| | | | | | | | | | | |
| In this section | | | |
| How ESG is governed | We expect that our ESG governance approach is likely to continue to develop, in line with our evolving approach to ESG matters and stakeholder expectations. | Page | 80 |
| Our respect for human rights | As set out in our Human Rights Statement, we strive for continual improvement in our approach to human rights. | Page | 81 |
| Conduct: Our product responsibilities | Our conduct approach guides us to do the right thing and to focus on the impact we have on our customers and the geographies in which we operate. | Page | 83 |
| Cybersecurity | We invest heavily in our business and technical controls to help prevent, detect and mitigate cyber threats. | Page | 85 |
| Data privacy | We are committed to protecting and respecting the data we hold and process, in accordance with the laws and regulations of the geographies in which we operate. | Page | 86 |
Our approach with
our suppliers | We require suppliers to meet our compliance and financial stability requirements, as well as to comply with our supplier ethical code of conduct. | Page | 86 |
Safeguarding the
financial system | We have continued our efforts to combat financial crime risks and reduce their impact on our organisation, customers and communities that we serve. | Page | 87 |
| Whistleblowing | Our global whistleblowing channel, HSBC Confidential, allows our colleagues and other stakeholders to raise concerns confidentially. | Page | 87 |
A responsible approach
to tax | We seek to pay our fair share of tax in all jurisdictions in which we operate. | Page | 88 |
| Acting with integrity | We aim to act with courageous integrity and learn from past events to prevent their recurrence. | Page | 88 |
How ESG is governed
The Board takes overall responsibility for ESG strategy, overseeing executive management in developing the approach, execution and associated reporting. Progress against our ESG ambitions is reviewed through Board discussion and review of key topics such as updates on net zero, customer experience and employee sentiment. Board members receive ESG-related training as part of their ongoing development, and seek out further opportunities to build their skills and experience in this area. For further details on Board members' ESG skills and experience, see page 256. For further details on their induction and training in 2021, see page 265. Given the wide-ranging remit of ESG matters, the governance activities are managed through a combination of specialist governance infrastructure and regular meetings and committees, where appropriate. These include the Disclosure Committee, which provides oversight for the scope and content of ESG disclosures, and the Group People Committee, which provides oversight support for the Group’s approach to performance management.
For some areas, such as climate where our approach is more advanced, dedicated governance activities exist to support the wide range of activities, from sustainable finance solution development in the Sustainability Execution Review Group to climate risk management in the Climate Risk Oversight Forum.
The Group Chief Risk and Compliance Officer and the chief risk officers of our Prudential Regulation Authority-regulated businesses are the senior managers responsible for climate financial risks under the UK Senior Managers Regime. The chief risk officers attend Board meetings and where appropriate provide regular verbal and written updates to the Board and Group Executive Committee. Climate risks are also considered in the Group Risk Management Meeting and the Group Risk Committee, with scheduled updates provided, as well as detailed reviews of material matters, such as climate-related stress testing exercises.
The below table details the main specialist governance forums, their responsibilities and the responsible executives for the management of ESG matters. We expect that our ESG governance approach is likely to continue to develop, in line with our evolving approach to ESG matters and stakeholder expectations. The Board is regularly provided with specific updates on ESG matters, including the thermal coal phase-out policy and exposures, human rights, and employee well-being.
| | | | | | | | |
| Governance forums | Responsible for: | Responsibility held by: |
| ESG Committee (new) | Supports Group Executives in the development and delivery of ESG strategy, key policies and material commitments by providing oversight, coordination and management of ESG commitments and activities | Group Chief Sustainability Officer and Group Company Secretary and Chief Governance Officer |
| Sustainability Execution Review Group (new) | Oversees the delivery of our ambition to provide and facilitate $750bn to $1tn of sustainable finance and investment, and realisation of commercial opportunities | Group Chief Executive |
| Social management forums | Oversees employee engagement, diversity and inclusion, community engagement, customer satisfaction, and social considerations for stakeholders | Group Chief Human Resources Officer and Group Chief Communications Officer |
| Governance management forums | Oversees subsidiaries, business conduct and ethics, corporate governance, whistleblowing, reputational factors, data privacy and human rights | Group Chief Risk and Compliance Officer and Group Company Secretary and Chief Governance Officer |
| Digital Business Services ESG Forum | Oversees the global delivery of ESG activities within our own operations, services and technology elements of our strategy | Group Chief Operating Officer |
| Human Rights Steering Committee | Supports global leadership in promoting, enhancing and reflecting human rights in execution of the Group's strategic goals, as well as developing the Group’s Human Rights, and Modern Slavery and Human Trafficking statements and associated oversight of implementation | Group Chief Risk and Compliance Officer |
| Climate Risk Oversight Forum | Oversees all global risk activities relating to climate risk management, including physical and transition risks. Equivalent forums have been established at regional level |
| Group Reputational Risk Committee | Oversees global executive support for identification, management and ongoing monitoring of reputational risks, including those related to ESG matters |
Our respect for human rights
As set out in our Human Rights Statement, we follow the UN Guiding Principles on Business and Human Rights (‘UNGPs’). In 2021, with the help of external stakeholders, we continued to review and improve our approach.
Our priorities on human rights
We respect all categories of human rights in the Universal Declaration of Human Rights. We focus our attention on those rights we assess as most likely to be affected by our business activities and by those of our customers and suppliers.
Such assessment takes account of a range of factors, including geographical and cultural context and economic sectors, and is subject to periodic review. After a policy review and prioritisation process, including consultation across key business units, we identified discrimination and modern slavery as the two priority human rights issues on which we could use our influence to make the most positive impact. These priorities also align closely with our commitments on diversity and inclusion and those we have made under the UN Global Compact and under the WEF metrics on risk for incidents of child and forced or compulsory labour.
| | | | | | | | | | | | | | | | | |
| Our priority human rights Issues in 2021 |
| Issues | Our employees | Suppliers’ employees | Customers | Communities |
| Discrimination | In the workplace | ● | ● | | ● |
| In our services | | | ● | |
| Modern slavery | | ● | ● | ● | ● |
For further details on our approach to tackling discrimination, see www.hsbc.com/diversitycommitments. For further details on our work on inclusion in the workplace, see ‘Inclusion’ on page 71.
For further details of our approach to tackling modern slavery, including steps taken to eliminate child and forced labour practices, see www.hsbc.com/modernslaveryact.
Sector policies
To meet our responsibility for respecting human rights under the UNGPs, we consider those rights that may be adversely impacted through involvement in high-risk sectors. Our sector policies for agricultural commodities, energy, forestry, mining and metals all refer specifically to human rights. These considerations include issues such as forced labour, harmful or exploitative child labour, trafficking, land rights, the rights of indigenous peoples such as ‘free prior and informed consent’, workers’ rights, and the health and safety of communities.
Our policy for financing forest plantations and downstream supply chain operations in, or sourced from, high-risk countries is linked to certification by the Forestry Stewardship Council or the Programme for the Endorsement of Forest Certification. Through our membership of international certification schemes such as the Forestry Stewardship Council, the Roundtable on Sustainable Palm Oil and the Equator Principles, we actively support the continual improvement of standards aimed at respecting human rights.
For further details of our policy prohibitions and other financing restrictions, see our sector-specific sustainability risk policies at www.hsbc.com/who-we-are/esg-and-responsible-business/managing-risk/sustainability-risk.
Financial crime controls
The risk of us causing, contributing or being linked to negative human rights impacts is also mitigated by our financial crime framework, with global policies to mitigate money laundering, sanctions, and bribery and corruption risks, including those where protecting human rights and preventing financial crime converge. Our financial crime controls include customer due diligence, sanctions screening, transaction monitoring, negative news screening and targeted investigations.
For further details of how we fight financial crime, see www.hsbc.com/who-we-are/esg-and-responsible-business/fighting-financial-crime.
Sustainable finance and the just transition
Our leading role in providing and facilitating sustainable finance to businesses around the world is another way in which we contribute to the rights of the communities we serve. We support the drive for a ‘just transition’ to net zero, harnessing political momentum for action with policies and finance to support disadvantaged sectors and communities. On 29 October 2021, we joined other private sector institutions in signing up to the WEF Just and Urgent Energy Transition principles.
We are also harnessing our leadership position in sustainable finance to create products that will help our clients to support social development, mobility and capability building, in line with International Capital Markets Association social bonds principles released in 2021.
For further details of how we support our customers with sustainable finance, see ‘Supporting customers through the transition’ on page 53.
Our respect for human rights continued
Supporting change
We continued to expand our Survivor Bank programme, which has now benefited over 1,000 survivors of modern slavery and human trafficking in the UK, and is a model for making financial services more accessible to vulnerable communities worldwide. We built on this experience in developing access to banking services for customers in the UK and in Hong Kong with no fixed abode.
In Hong Kong, we also introduced basic banking services for ethnic minority customers who do not speak English or Chinese. The service allows ethnic minorities who speak Hindi, Punjabi, Nepali and Urdu to open a Hong Kong Dollar Statement Savings account, by providing tailored material in each of the four languages. In addition, we hired part-time ethnic minority customer service ambassadors to offer further support at six designated branches. In May 2021, the Hong Kong Equal Opportunities Commission named HSBC a Gold Awardee in the inaugural Equal Opportunity Employer Recognition scheme, which recognises organisations for setting an example in promoting and implementing equal opportunities employment policies.
These initiatives support several different human rights, such as the right to adequate living standards and the right to own property. As well as benefiting the communities we serve in the UK and Hong Kong, these initiatives allowed us to work alongside local non-governmental organisations, learning from their understanding of human rights impacts.
We are committed to working with governments to help create inclusive communities. In 2021, we supported the development of regulation related to human rights, including as an adviser to the UK Government on developing their online Registry of Statements under the Modern Slavery Act.
Stakeholder engagement
In 2021, as part of an internal survey of senior executives, we gathered information from across our network on our engagement with civil society stakeholders and those who represent individuals or groups at risk of impact from our activities or from the activities of those with whom we have business relationships. As a result of this work, we acknowledged the need to expand our engagement in future. We also took steps to ensure that our approach to human rights was well understood by our colleagues. In 2021:
•We offered a detailed course on human trafficking to new employees in the Global Risk Operations function, highlighting the importance of identification and reporting.
•We provided detailed briefings to more than 250 senior colleagues on human rights and the UNGPs.
•We provided training materials to colleagues in our Procurement team on modern slavery.
•We delivered training on anti-discrimination as part of our diversity and inclusion programme.
As we develop our approach to human rights, we will focus on training modules for our colleagues, supplemented by role-specific training. We also intend to improve the process for our suppliers to ensure that the key elements of our ethical code of conduct that relate to human rights are clearly and regularly communicated. For retail customers, we aim to communicate our approach and expectations through our public statements, and for our business customers, we aim to integrate our approach to human rights more clearly into our processes.
In developing the initiatives described above, we drew upon expertise from within our organisation, including the insights of specialist staff in key departments and of 200 senior executives from every part of our network. We also engaged the support of external advisers with expertise in human rights as they relate to business.
Conduct: Our product responsibilities
Following the refresh of our purpose and values, we have taken the opportunity to align and simplify our conduct approach, making conduct easier to understand and showing how it fulfils our value ‘we take responsibility’.
Our conduct approach guides us to do the right thing and to focus on the impact we have on our customers and the financial markets in which we operate. It focuses on five clear outcomes:
•We understand our customers’ needs.
•We provide products and services that offer a fair exchange of value.
•We serve customers’ ongoing needs, and will put it right if we make a mistake.
•We act with integrity in the financial markets we operate in.
•We operate with resilience and security to avoid harm to customers and markets.
Our conduct approach is embedded into the way we develop, distribute, structure and execute products and services. For further details of our approach to conduct, see page 244.
Designing products and services
Our approach to product design and development – including how we advertise our products – is set out in our policies, and provides a clear basis from which strategic product and service decisions can be made. Our global businesses each take the following approach:
•We carry out robust testing during the design and development of a product to help ensure there is an identifiable need in the market.
•We consider the complexity of products and the possible financial risks to customers when determining the target market.
•We offer a carefully selected range of products that are managed through product inventories, helping to ensure they continue to meet customers’ needs and continue to deliver a fair exchange of value.
•We regularly review products to help ensure they remain relevant and perform in line with expectations we have set.
•Where products do not meet our customers’ needs or no longer meet our high standards, improvements are made or they are withdrawn from sale.
•Wherever possible, we act on feedback from our customers to provide better and more accessible products and services.
Our GBM business also considers our impact on the integrity of markets when introducing new products.
Oversight of product design and sales is provided by governance committees chaired and attended by senior executives who are accountable for ensuring we manage risks appropriately, and within appetite, to ensure fair customer outcomes.
In 2021, we continued to develop our product governance. In CMB, we deployed our new Google Cloud-based product inventory, which has improved the way we manage our products. Our product management and governance system supports our colleagues throughout the product lifecycle, from product development to demise. In GBM’s markets business, we continued to focus on the development of our ESG product suite across all asset classes, ensuring we maintain our position as an innovator of ESG products.
In WPB, we are developing our sustainable product suite, and remain committed to help mitigate against greenwashing risks. For further details on the Group’s sustainable finance and investment ambition, see page 53.
Meeting our customers’ needs
Our customers’ interests are at the centre of everything we do, and we have policies and procedures in place that set the standards required to protect them. These include:
•providing information on products and services that is clear, fair and not misleading;
•enabling customers to understand the key features of products and services, especially the risks, exclusions and limitations;
•enabling customers to make informed decisions before purchasing a product or service; and
•checking that customers are offered appropriate products and, where relevant, received the right advice.
Supporting customers with enhanced care needs
Our strategy to support customers with enhanced care needs continues to be a core focus. We have guidelines and have developed procedures to ensure we provide the right outcomes for customers who may require enhanced care. We have made a number of improvements to our products, services, governance and oversight, as well as developed our colleagues’ skills and capabilities.
In our CMB business in the UK, we identify customers with enhanced care needs to ensure we tailor our approach in our communications, services and product design. This is supported by post-sale calls with these customers to ensure we identify and support their needs fairly. In our UK retail branches, we have launched a daily quiet hour to help those needing access to banking in a calmer environment. For further details on inclusive product design, see ‘Financial inclusion’ on page 78.
Managing incentives for front-line colleagues
In WPB, we continued to apply a discretionary approach to incentivising our front-line colleagues rather than applying a formulaic link to sales. Following the review of incentives during 2020, we continued to embed the changes with the aim to be even more customer-centric and focused on employee development. We also continued to strengthen our approach to third-party sales agents that distribute our products, such as insurance and retail, to ensure that our principles on balanced reward are in place. While there is still more to do, this change is designed to improve oversight and alignment with third-party sales agents.
In our CMB and GBM businesses, we recognise and reward exceptional conduct demonstrated by our colleagues while discouraging misconduct and inappropriate behaviour that exposes us to financial, regulatory and reputational risks. During the annual pay review, we apply adjustments to variable pay to employees who exhibit either exceptional behaviours, or behaviours not aligned to our values. In addition, the
businesses have specific goals to help drive conduct outcomes and ensure they are incorporated into how employees achieve their goals. CMB has created a scorecard reference guide, and GBM has specific mandatory conduct objectives applicable to all global GBM colleagues.
Conduct: Our product responsibilities continued
Ensuring sales quality
In WPB, we consider our customers’ financial needs and personal circumstances to assist us in offering suitable product recommendations. This is achieved through measures such as:
•a globally consistent risk rating methodology for investment products, which is customised for local regulatory requirements; and
•a thorough customer risk profiling methodology to assess customers’ financial objectives, attitudes towards risk, financial ability to bear investment risk, and knowledge and experience.
In WPB, sales quality and mystery shopping reviews assess whether customers receive a fair outcome. If any issues are identified, we investigate the root cause, put things right and act to reduce the risk of the issue occurring again.
In CMB, we operate focused sales outcome testing to ensure that we correctly explain product features and pricing. We look at different customer needs and circumstances, particularly where customers may have enhanced needs. In 2021, we identified issues relating to documentation, sales process and pricing. Subsequently we ensured we put things right for our customers and took the necessary internal action.
In GBM’s markets business, we undertake sample-based testing on sales of products to customers to ensure that product features and pricing have been correctly explained and sales processes have been adhered to. Feedback is collated centrally and acted upon in a timely manner.
Supporting customers during Covid-19
We responded rapidly to the changing environment caused by the Covid-19 pandemic. Many of our personal banking and wealth customers needed financial relief as a result of the pandemic, which we sought to address in a responsible way. We provided significant financial relief to our WPB customers in several markets. These solutions varied by market and were aligned with government or regulatory guidance in each jurisdiction. At its peak in 2021, we had payment relief measures offered to 1.6 million customers, which equated to $31bn in balances. We support customers that are in arrears or experiencing financial difficulty, in line with our policies and procedures.
In our CMB business, we made more than 56 Covid-19-related enhancements to products in specific countries. We continue to review these to ensure they remain appropriate. We aim to support our customers as and when any relief products are demised.
In Asia, given the ongoing Covid-19 environment, our CMB business temporarily enabled manual payments processes in Bangladesh, India and Maldives to support relevant customers and ensure continuity of services and payment handling.
Training our colleagues to support our customers
In WPB, we provide training to our employees through our product management academy. In 2021, more than 750 of our colleagues completed over 2,000 courses, relating to customer insight, customer-focused design, communications, product development, balance sheet management and governance. We created global training, with over 60,000 courses completed by colleagues to manage situations for customers with enhanced care needs, assigning to both customer-facing and non-customer-facing colleagues.
In CMB, we focused on training all our UK-based colleagues on meeting the needs of customers who require enhanced care due to their circumstances. We delivered tailored training to our product managers to ensure that customers with enhanced care needs are considered across each stage of the product lifecycle.
In GBM, we continued to develop and roll out interactive conduct training that focuses on behaviour. Following the successful completion of the training by 21,000 colleagues early in 2021, this has now been adapted to cover joiners and those who have taken on a new management role.
Transition from Ibor
As a result of the planned cessation of the London interbank offered rates (‘Libor’), Euro Overnight Index Average (‘Eonia’) and other benchmarks collectively known as Ibors, we are ensuring that we have the product capability in place to support our customers on the transition to alternative rates. We aim to clearly outline the options available to our customers holding existing Ibor-based products, and our commercial strategy is designed to minimise value transfer when transitioning their products from Ibor to alternative rates.
Transition from Libor and Eonia benchmarks to alternative risk-free rates (‘RFRs’) progressed significantly over 2021 and all industry cessation milestones were met. We continued to proactively support the transition, or inclusion of contractual fallback provisions where more appropriate, of customers’ legacy contracts referencing sterling, Japanese yen, euro and Swiss franc Libor to RFR products, or other alternatives, by the end of 2021. We completed this transition in line with regulatory expectations and met our goal of transitioning more than 90% of contracts by the end of 2021, with the balance continuing to be actively transitioned in early 2022 ahead of the next interest rate reset.
For further details of the transition from Ibors, see ‘Ibor transition’ in the Risk section on page 150.
Cybersecurity
The threat of cyber-attacks remains a concern for our organisation, as it does across the entire financial sector. Failure to protect our operations from cyber-attacks may result in financial loss, disruption for customers or loss of data. This could negatively affect our reputation and ability to attract and retain customers.
Prevent, detect and mitigate
We invest in business and technical controls to help prevent, detect and mitigate cyber threats. We apply a 'defence in depth’ approach to cyber controls, recognising the complexity of our environment. Our abilities to detect and respond to attacks through round-the-clock security operations centre capabilities help to reduce the impact of attacks.
We continually evaluate threat levels for the most prevalent attack types and their potential outcomes. We have an internal cyber intelligence and threat analysis capability, which proactively collects and analyses external cyber information. We input into the broader cyber intelligence community through technical expertise in investigations and contributions to the cyber-sharing ecosystem in the financial services industry, alongside government agencies around the world.
As we continue to grow and digitise at scale, we may be exposed to new cyber threats. In 2021, we further strengthened our cyber defences and enhanced our cybersecurity capabilities to help reduce the likelihood and impact of advanced malware, security vulnerabilities being exploited, data leakage and unauthorised access. These defences are grounded in controls that help to mitigate cyber-attacks and build upon a proactive data analytical approach to help identify advanced targeted threats.
Policy and governance
We have a comprehensive range of cybersecurity policies and systems designed to help ensure that the organisation is well managed, with oversight and control.
We operate a three lines of defence model, aligned to the operational risk management framework, to help ensure oversight and challenge of our cybersecurity capabilities and priorities.
In the first line of defence, we have risk owners within global businesses and functions who are accountable for identifying, owning and managing the cyber risk. They work with control owners to help ensure controls are in place to mitigate issues, prevent risk events from occurring and resolve them if needed. These controls are executed in line with policies produced by our Resilience Risk teams, the second line of defence, which provide independent review and challenge. They are overseen by the Global Internal Audit function, the third line of defence.
We regularly report and review cyber risk and control effectiveness at relevant governance forums and to the Board to help ensure visibility and oversight. We also report across the global businesses, functions and regions to help ensure visibility and governance of risks and mitigating controls.
We also work with our third parties to help reduce the threat of cyber-attacks impacting our business processes. We have an assessment capability designed to review third parties’ compliance with our information security policies and standards.
Cyber training and awareness
We understand the important role our people play in protecting against cybersecurity threats. Our mission is to equip every colleague with the tools to help prevent, mitigate and report cyber incidents to keep our organisation and customers’ data safe.
We provide cybersecurity training and awareness to all our people, ranging from our top executives to IT developers to front-line relationship managers around the world.
We aim to ensure that cybersecurity is an integrated part of the building and maintenance of our technology environment. Over 90% of our IT developers hold at least one of our internal security certifications to help ensure we build secure systems and products.
We host an annual cyber awareness campaign for all colleagues, covering topics such as social engineering, remote working security and data management.
Our dedicated cybersecurity training and awareness team provides monthly webinars and bespoke training to our colleagues, customers, regulators, governments and cross-sector partners.
We know it is critical that we protect our customers. While online banking has brought enormous benefits for our customers, it has increased the threat of cyber-attacks. We provide a wide range of education and guidance about how to stay safe online to both customers and our colleagues.
Over 99%
Employees completed mandatory cybersecurity training on time.
Over 90%
IT developers who hold at least one of our internal secure developer certifications.
Over 75
Cybersecurity education events held globally.
Over 95%
Survey respondents to cybersecurity education events who said they have a better understanding of cybersecurity following these events.
Protecting customers online
We are a founding sponsor of Get Safe Online, a joint initiative between the UK Government, police law enforcement and businesses. It gives free advice in plain English about internet safety. We are committed to help our customers stay safe and secure when banking online. Our online security centres provide security guidance from ‘How to protect devices from security threats’ to ‘Learn to spot fake websites’.
Data privacy
We are committed to protecting and respecting the data we hold and process, in accordance with the laws and regulations of the geographies in which we operate.
Our approach rests on having the right talent, technology, systems, controls, policies and processes to help ensure appropriate management of privacy risk. Our Group-wide privacy policy and principles aim to provide a consistent global approach to managing data privacy risk, and must be applied by all of our global businesses and global functions. Our privacy principles are available at www.hsbc.com/who-we-are/esg-and-responsible-business/managing-risk/operational-risk.
We conduct regular employee training and awareness sessions on data privacy and security issues throughout the year, including global mandatory training for all our colleagues, along with additional training sessions, where required, to keep abreast of new developments in this space.
We provide transparency to our customers and stakeholders on how we collect, use and manage their personal data, and their associated rights. Where relevant, we work closely with third parties to help ensure adequate protections are provided, in line with our data privacy policy and as required under data privacy law. We offer a broad range of channels in the markets where we operate, through which customers and stakeholders can raise any concerns regarding the privacy of their data.
Our dedicated privacy teams report to the highest level of management on data privacy risks and issues, and oversee our global data privacy programmes. We review data privacy regularly at multiple governance forums, including at Board level, to help ensure there is appropriate challenge and visibility among senior executives. As part of our three lines of defence model, our Global Internal Audit function provides independent assurance as to whether our data privacy risk management approaches and processes are designed and operating effectively. In addition, we have established data privacy governance structures, and continue to embed accountability across all businesses and functions.
We continue to implement industry practices for data privacy and security. Our privacy teams work closely with industry bodies and research institutions to drive the design, implementation and monitoring of privacy solutions. We conduct regular reviews and privacy risk assessments, and continue to develop solutions to strengthen our data privacy controls. In 2021, we implemented new tooling to improve accountability for data privacy. We have procedures to articulate the actions needed to deal with data privacy considerations. These include notifying regulators, customers or other data subjects, as required under applicable privacy laws and regulations, in the event of a reportable incident occurring.
Intellectual property rights practices
We have policies, controls and guidance to manage risk relating to intellectual property. This is to ensure that intellectual property is identified, maintained and protected appropriately, and to help ensure we do not infringe third-party intellectual property rights during the course of business and/or operation.
These policies and controls support our management of intellectual property risk, and operate to help ensure that intellectual property risk is controlled consistently and effectively in line with our risk appetite.
The ethical use of Big Data and AI
Big Data technologies and artificial intelligence give us the ability to process and analyse data at a depth and breadth not previously possible. While this technology offers significant potential benefits for our customers, it also poses potential ethical risks for the financial services industry and society as a whole. We have developed a set of principles to help us consider and address the ethical issues that could arise. HSBC’s Principles for the Ethical Use of Big Data and Artificial Intelligence are available at www.hsbc.com/who-we-are/esg-and-responsible-business/our-conduct.
Our approach with our suppliers
We have globally consistent standards and procedures for the onboarding and use of external suppliers. We require suppliers to meet our compliance and financial stability requirements, and to comply with our supplier ethical code of conduct.
Ethical code of conduct
We have an ethical and environmental code of conduct for suppliers of goods and services, which must be complied with by all suppliers. The code of conduct provides suppliers with an outline for economic, environmental and social standards and the requirements for having a reasonable governance and management structure.
At the end of 2021, we had approximately 9,600 contracted suppliers. In 2021, we had 8,144 engagements with suppliers that resulted in either the confirmation that they adhered to our code of conduct or that their own code of conduct had been reviewed and accepted by Strategic Procurement Services.
Managing environmental and social risk
We use an ESG reputational risk tool to identify environmental and social risk for supplier engagements with a contract value over $500,000. The tool provides an ESG reputational risk score for the supplier. In 2021, 2,248 ESG reputational risk assessments were undertaken. A high-risk score drives a manual review to assess the extent of the risk and whether we are willing to accept the heightened risk and onboard the supplier. We are reviewing the reputational risk process to ensure we focus on sectors with high ESG risk going forward.
We formalise commitments to the ethical code with clauses in our suppliers’ contracts, which support the right to audit and act if a breach is discovered.
In 2021, we produced an internal toolkit to explain how Strategic Procurement Services can integrate net zero initiatives into everyday procurement activity. The toolkit, which outlines our net zero ambition and provides practical guidance on how Strategic Procurement Services can improve the way it drives net zero initiatives, is available to our teams globally to ensure a consistent approach.
For further details of the number of suppliers by geographical region, see the ESG Data Pack at www.hsbc.com/esg.
Safeguarding the financial system
We have continued our efforts to combat financial crime risks and reduce their impact on our organisation, customers and communities that we serve. These financial crime risks include money laundering, fraud, bribery and corruption, tax evasion, sanctions breaches, terrorist financing and proliferation financing.
We are committed to acting with integrity and have built a strong financial crime risk management framework across all global businesses and all countries and territories in which we operate. The financial crime risk framework, which is overseen by the Board, is supported by our holistic financial crime policies that enable adherence to applicable laws and regulations globally.
Annual mandatory training is provided to all colleagues, with additional targeted training tailored to certain individuals. We carry out regular risk assessments, identifying where we need to respond to evolving financial crime threats, as well as conducting monitoring and testing of our financial crime programme, with applicable findings included within our policies and framework.
We continue to invest in new technology such as contextual monitoring in our trade finance business, the enhancement of our fraud monitoring and market surveillance capabilities, and the application of machine learning to improve the accuracy and timeliness of our detection capabilities. We pay due care and attention to ethical questions when considering the use of AI. We are confident our adoption of these new technologies will continue to enhance our ability to respond quickly to suspicious activity and be more granular in our risk assessments, helping to protect our customers and the integrity of the financial system.
Our anti-bribery and corruption policy
Our global anti-bribery and corruption policy requires that all activity must be: conducted without intent to bribe or corrupt; reasonable and transparent; considered to not be lavish nor disproportionate to the professional relationship; appropriately documented with business rationale; and authorised at an appropriate level of seniority. There were no concluded, nor live active, legal cases regarding bribery or corruption brought against HSBC or its employees in 2021.
Our global anti-bribery and corruption policy requires that we identify and mitigate the risk of our customers and third parties committing bribery or corruption. We utilise anti-money laundering controls, including customer due diligence and transaction monitoring, to identify and mitigate the risk that our customers are involved in bribery or corruption. We perform a bribery risk assessment on all third parties, and impose risk-based controls on the third parties that expose us to bribery or corruption risk.
For further details on our financial crime risk management framework, see page 244.
The scale of our work
Each month, on average, we monitor over 1.1 billion transactions for signs of financial crime. During 2021, we filed over 56,000 suspicious activity reports to law enforcement and regulatory authorities where we identified potential financial crime. In addition, we screen approximately 116 million customer records monthly for sanctions exposure.
99%
Total percentage of employees who have received training on the organisation’s anti-corruption policies and procedures.
Whistleblowing
We want colleagues and stakeholders to have confidence in speaking up when they observe unlawful or unethical behaviour. We offer a range of speak-up channels to listen to their concerns and have a zero tolerance for acts of retaliation. However, we recognise that sometimes people may still not be comfortable using these routes.
Listening through whistleblowing channels
Our global whistleblowing channel, HSBC Confidential, allows our colleagues and stakeholders to raise concerns confidentially and, if preferred, anonymously (subject to local laws).
In the majority of countries, HSBC Confidential concerns are raised through an independent third-party provider that offers 24/7 hotlines and a multiple language web portal to our colleagues. We also provide an external email address for concerns about accounting, internal financial controls or auditing matters (accountingdisclosures@hsbc.com).
In 2021, while we continued to actively promote speak-up opportunities, the volume of HSBC Confidential concerns reduced by 11%, driven in part, we believe, by the continued change to the working environment during the Covid-19 pandemic. Of the HSBC Confidential concerns closed in 2021, 87% related to colleagues’ behaviour and personal conduct concerns, 9% to security and fraud risks, 3% to compliance risks and less than 1% to other issues.
Concerns are investigated proportionately and independently, with action taken where appropriate. Actions can include disciplinary action, dismissal, and adjustments to variable pay and performance ratings.
Compliance sets whistleblowing policy and procedures, and provides the Group Audit Committee with periodic reports on the effectiveness of whistleblowing arrangements. These reports are informed by first line of defence control assessments, second line assurance reviews and third line internal and external audit reports.
The Group Audit Committee has overall oversight of whistleblowing arrangements. The chair of the Group Audit Committee acts as HSBC’s whistleblowers’ champion with responsibility for ensuring and overseeing the integrity, independence and effectiveness of our whistleblowing policies and procedures.
Further details of the role of the Group Audit Committee in relation to whistleblowing can be found on page 280.
Whistleblowing concerns raised (subject to investigation) in 2021
2,224
(2020: 2,510)
Substantiated and partially substantiated whistleblowing cases in 2021
42%
(2020: 42%)
A responsible approach to tax
We seek to pay our fair share of tax in all jurisdictions in which we operate and to minimise the likelihood of customers using our products and services to evade or inappropriately avoid tax. We also abide by international protocols that affect our organisation. Our approach to tax and governance processes is designed to achieve these goals.
Through adoption of the Group’s risk management framework, we have put in place regularly maintained controls. These aim to ensure, among other things, that we do not adopt inappropriately tax-motivated transactions or products and that tax planning is scrutinised and supported by genuine commercial activity. HSBC has no appetite for using aggressive tax structures. We continue to commit to making a significant investment globally in implementation and maintenance of appropriate tax risk processes and controls.
With respect to our own taxes, we are guided by the following principles:
•We are committed to applying both the letter and spirit of the law. This includes adherence to a variety of measures arising from the OECD Base Erosion and Profit Shifting initiative.
•We seek to have open and transparent relationships with all tax authorities. Given the size and complexity of our organisation, which operates across over 60 jurisdictions, a number of areas of differing interpretation or disputes with tax authorities exist at any point in time. We cooperate with the relevant local tax authorities to mutually agree and resolve these in a timely manner.
•We have applied the OECD/G20 Inclusive Framework Pillar 2 guidance to identify those jurisdictions in which we operate that have nil or low tax rates (15% or below). We have identified 14 such jurisdictions in which we had active subsidiaries during 2021. We continually monitor the number of active subsidiaries within each jurisdiction as part of our ongoing entity rationalisation programme. We ensure that our entities active in nil or low tax jurisdictions have clear business rationale for why they are based in these locations and appropriate transparency over their activities.
With respect to our customers’ taxes, we are guided by the following principles:
•We have made considerable investment implementing processes designed to enable us to support external tax transparency initiatives and reduce the risk of banking services being used to facilitate customer tax evasion. Initiatives include the US Foreign Account Tax Compliance Act, the OECD Standard for Automatic Exchange of Financial Account Information (‘Common Reporting Standard’), and the UK legislation on the corporate criminal offence of failing to prevent the facilitation of tax evasion.
•We implement processes that aim to ensure that inappropriately tax-motivated products and services are not provided to our customers.
Our tax contributions
The effective tax rate for the year was 22.3%. Further details are provided on page 366.
As highlighted below, in addition to paying $6.3bn of our own tax liabilities during 2021, we collected taxes of $9.2bn on behalf of governments around the world. A more detailed geographical breakdown of the taxes paid in 2021 is provided in the ESG Data Pack.
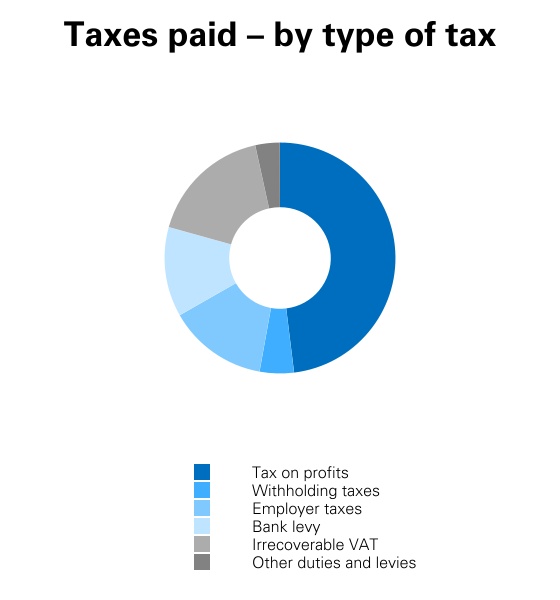
| | | | | |
$2,711m
Tax on profits
2020: $3,873m | $366m
Withholding taxes
2020: $386m |
$1,125m
Employer taxes
2020: $1,121m | $479m
Bank levy
2020: $1.011m |
$1,315m
Irrecoverable VAT
2020: $1,389m | $278m Other duties and levies1 2020: $278m |
1 Other duties and levies includes property taxes of $126m (2020: $129m)
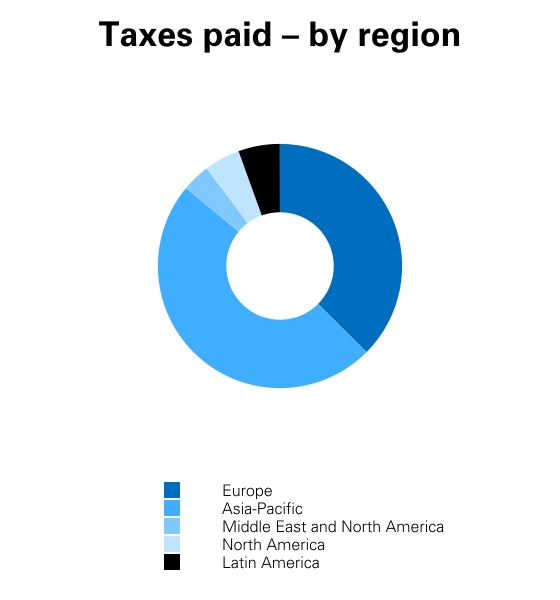
| | | | | |
$3,170m
Europe
2020: $3,022m | $2,077m
Asia-Pacific
2020: $3,911m |
$236m
Middle East and North Africa
2020: $299m | $469m
North America
2020: $382m |
$322m
Latin America
2020: $444m | |
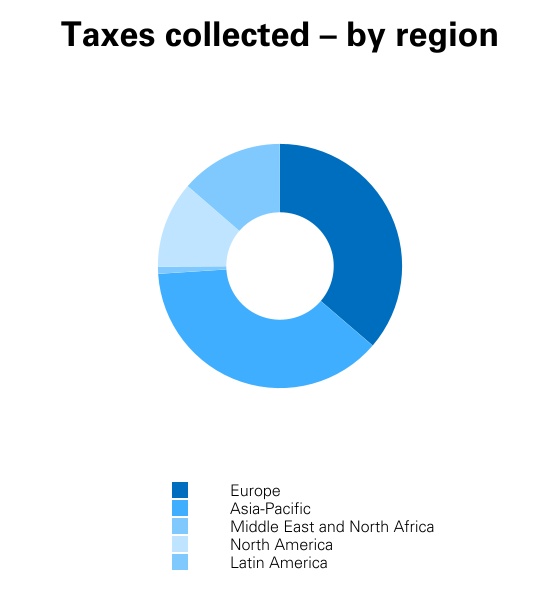
| | | | | |
$3,177m
Europe
2020: $3,462m | $3,584m
Asia-Pacific
2020: $3,595m |
$78m
Middle East and North Africa
2020: $90m | $1,081m
North America
2020: $1,089m |
$1,343m
Latin America
2020: $1,302m | |
Acting with integrity
We aim to act with courageous integrity and learn from past events to prevent their recurrence. We recognise that restoration of trust in our industry remains a significant challenge as past misdeeds continue to be in the spotlight. But it is a challenge we must meet successfully. We owe this not just to our customers and to society at large, but to our colleagues to ensure they can be rightly proud of the organisation where they work.
We aim to make decisions based on doing the right thing for our customers and never compromising our ethical standards or integrity.
Further information regarding the measures that we have taken to prevent the recurrence of past mistakes can be found at www.hsbc.com/who-we-are/esg-and-responsible-business/esg-reporting-and-policies.
A chart reflecting fines and penalties arising out of significant investigations involving criminal, regulatory, competition or other law enforcement authorities, and costs relating to payment protection insurance remediation is available in the ESG Data Pack at www.hsbc.com/esg.
Financial review
The financial review gives detailed reporting of our financial performance at Group level as well as across our different global businesses and geographical regions.
90 Financial summary
110 Global businesses and geographical regions
131 Reconciliation of alternative performance measures
134 Other information
Expanding opportunities beyond the branches
Mainland China has Asia’s largest pool of wealth and is set to become the world’s biggest life insurance market by 2030. Pinnacle is therefore critical to our ambition to be one of Asia’s leading wealth managers. Colleagues run specialist seminars for our customers, using digital tablets to facilitate visiting them in their homes and offices, and are further supported by an award-winning HSBC River bespoke financial planning mobile app. We have nearly 700 digitally enabled wealth planners across five mainland cities, and are looking to accelerate the trajectory of our hiring towards a target of 3,000 planners, supported by the recent regulatory approval to take full ownership of our life insurance manufacturing joint venture.
| | | | | |
| Financial summary |
| Page |
| Use of alternative performance measures | |
| Future accounting developments | |
| Critical accounting estimates and judgements | |
| Consolidated income statement | |
| Income statement commentary | |
| Consolidated balance sheet | |
| |
| |
| |
| |
| |
| |
| |
| |
| |
| | |
| Use of alternative performance measures |
Our reported results are prepared in accordance with IFRSs as detailed in the financial statements starting on page 336.
To measure our performance, we supplement our IFRSs figures with non-IFRSs measures, which constitute alternative performance measures under European Securities and Markets Authority guidance and non-GAAP financial measures defined in and presented in accordance with US Securities and Exchange Commission rules and regulations. These measures include those derived from our reported results that eliminate factors that distort year-on-year comparisons. The ‘adjusted performance’ measure used throughout this report is described below. Definitions and calculations of other alternative performance measures are included in our ‘Reconciliation of alternative performance measures’ on page 131. All alternative performance measures are reconciled to the closest reported performance measure.
The global business segmental results are presented on an adjusted basis in accordance with IFRS 8 ‘Operating Segments’ as detailed in Note 10 ‘Segmental analysis’ on page 369.
Adjusted performance
Adjusted performance is computed by adjusting reported results for the effects of foreign currency translation differences and significant items, which both distort year-on-year comparisons.
We consider adjusted performance provides useful information for investors by aligning internal and external reporting, identifying and quantifying items management believes to be significant, and providing insight into how management assesses year-on-year performance.
Significant items
‘Significant items’ refers collectively to the items that management and investors would ordinarily identify and consider separately to improve the understanding of the underlying trends in the business.
The tables on pages 110 to 113 and pages 122 to 127 detail the effects of significant items on each of our global business segments, geographical regions and selected countries/territories in 2021, 2020 and 2019.
Foreign currency translation differences
Foreign currency translation differences reflect the movements of the US dollar against most major currencies during 2021.
We exclude them to derive constant currency data, allowing us to assess balance sheet and income statement performance on a like-for-like basis and better understand the underlying trends in the business.
| | |
Foreign currency translation differences Foreign currency translation differences for 2021 are computed by retranslating into US dollars for non-US dollar branches, subsidiaries, joint ventures and associates: •the income statements for 2020 and 2019 at the average rates of exchange for 2021; and •the balance sheets at 31 December 2020 and 31 December 2019 at the prevailing rates of exchange on 31 December 2021. No adjustment has been made to the exchange rates used to translate foreign currency-denominated assets and liabilities into the functional currencies of any HSBC branches, subsidiaries, joint ventures or associates. The constant currency data of HSBC’s Argentinian subsidiaries have not been adjusted further for the impacts of hyperinflation.
|
| | |
| When reference is made to foreign currency translation differences in tables or commentaries, comparative data reported in the functional currencies of HSBC’s operations have been translated at the appropriate exchange rates applied in the current period on the basis described above. |
| | |
| Future accounting developments |
IFRS 17 ‘Insurance Contracts’
IFRS 17 ‘Insurance Contracts’ was issued in May 2017, with amendments to the standard issued in June 2020. It has been adopted for use in the EU but not yet for use in the UK. The standard sets out the requirements that an entity should apply in accounting for insurance contracts it issues and reinsurance contracts it holds. Following the amendments, IFRS 17 is effective from 1 January 2023. The Group is in the process of implementing IFRS 17. Industry practice and interpretation of the standard are still developing. Therefore, the likely impact of its implementation remains uncertain. We expect to provide an update on the likely impacts on our insurance business at or around our 2022 interim results announcement. For the purpose of planning the Group’s financial resources, our initial assumption (based on analysis of the expected 2022 position) is that the accounting changes may result in a reduction in the reported profit of our insurance business by approximately two thirds on the transition to IFRS 17, albeit with a range of expected outcomes. A similar impact is expected on the equity of the insurance business, primarily reflecting the elimination of the present value of in-force business ('PVIF') asset and creation of the contractual service margin (the latter impacting tangible equity). The return on average ordinary shareholders' equity ('RoE') of the insurance business is not expected to be significantly impacted. At 31 December 2021, the equity associated with our insurance manufacturing operations was $17.0bn, including PVIF assets of $9.5bn and an associated deferred tax liability of $1.6bn. These assumptions may change significantly in the period prior to adoption of the standard.
| | |
| Critical accounting estimates and judgements |
The results of HSBC reflect the choice of accounting policies, assumptions and estimates that underlie the preparation of HSBC’s consolidated financial statements. The significant accounting policies, including the policies which include critical accounting estimates and judgements, are described in Note 1.2 on the financial statements. The accounting policies listed below are highlighted as they involve a high degree of uncertainty and have a material impact on the financial statements:
•Impairment of amortised cost financial assets and financial assets measured at fair value through other comprehensive income (‘FVOCI’): The most significant judgements relate to defining what is considered to be a significant increase in credit risk, determining the lifetime and point of initial recognition of revolving facilities, and making assumptions and estimates to incorporate relevant information about past events, current conditions and forecasts of economic conditions. A high degree of uncertainty is involved in making estimations using assumptions that are highly subjective and very sensitive to the risk factors. See Note 1.2(i) on page 351.
•Deferred tax assets: The most significant judgements relate to judgements made in respect of expected future profitability. See Note 1.2(l) on page 355.
•Valuation of financial instruments: In determining the fair value of financial instruments a variety of valuation techniques are used, some of which feature significant unobservable inputs and are subject to substantial uncertainty. See Note 1.2(c) on page 349.
•Impairment of interests in associates: Impairment testing involves significant judgement in determining the value in use, and in particular estimating the present values of cash flows expected to arise from continuing to hold the investment, based on a number of management assumptions. The most significant judgements relate to the impairment testing of our
investment in Bank of Communications Co., Limited (‘BoCom’). See Note 1.2(a) on page 347.
•Impairment of goodwill and non-financial assets: A high degree of uncertainty is involved in estimating the future cash flows of the cash-generating units (‘CGUs’) and the rates used to discount these cash flows. See Note 1.2(a) on page 347.
•Provisions: Significant judgement may be required due to the high degree of uncertainty associated with determining whether a present obligation exists, and estimating the probability and amount of any outflows that may arise. See Note 1.2(m) on page 356.
•Post-employment benefit plans: The calculation of the defined benefit pension obligation involves the determination of key assumptions including discount rate, inflation rate, pension payments and deferred pensions, pay and mortality. See Note 1.2(k) on page 355.
Given the inherent uncertainties and the high level of subjectivity involved in the recognition or measurement of the items above, it is possible that the outcomes in the next financial year could differ from the expectations on which management’s estimates are based, resulting in the recognition and measurement of materially different amounts from those estimated by management in these financial statements.
| | |
| Consolidated income statement |
| | | | | | | | | | | | | | | | | |
| Summary consolidated income statement |
| 2021 | 2020 | 2019 | 2018 | 2017 |
| $m | $m | $m | $m | $m |
| Net interest income | 26,489 | | 27,578 | | 30,462 | | 30,489 | | 28,176 | |
| Net fee income | 13,097 | | 11,874 | | 12,023 | | 12,620 | | 12,811 | |
| Net income from financial instruments held for trading or managed on a fair value basis | 7,744 | | 9,582 | | 10,231 | | 9,531 | | 8,426 | |
| Net income/(expense) from assets and liabilities of insurance businesses, including related derivatives, measured at fair value through profit or loss | 4,053 | | 2,081 | | 3,478 | | (1,488) | | 2,836 | |
Change in fair value of designated debt and related derivatives1 | (182) | | 231 | | 90 | | (97) | | 155 | |
| Changes in fair value of other financial instruments mandatorily measured at fair value through profit or loss | 798 | | 455 | | 812 | | 695 | | N/A |
| Gains less losses from financial investments | 569 | | 653 | | 335 | | 218 | | 1,150 | |
| | | | | |
| Net insurance premium income | 10,870 | | 10,093 | | 10,636 | | 10,659 | | 9,779 | |
| Other operating income/(expense) | 502 | | 527 | | 2,957 | | 960 | | 443 | |
| Total operating income | 63,940 | | 63,074 | | 71,024 | | 63,587 | | 63,776 | |
| Net insurance claims and benefits paid and movement in liabilities to policyholders | (14,388) | | (12,645) | | (14,926) | | (9,807) | | (12,331) | |
Net operating income before change in expected credit losses and other credit impairment charges/Loan impairment charges and other credit risk provisions2 | 49,552 | | 50,429 | | 56,098 | | 53,780 | | 51,445 | |
| Change in expected credit losses and other credit impairment charges | 928 | | (8,817) | | (2,756) | | (1,767) | | N/A |
| Loan impairment charges and other credit risk provisions | N/A | N/A | N/A | N/A | (1,769) | |
| Net operating income | 50,480 | | 41,612 | | 53,342 | | 52,013 | | 49,676 | |
| Total operating expenses excluding impairment of goodwill and other intangible assets | (33,887) | | (33,044) | | (34,955) | | (34,622) | | (34,849) | |
| Impairment of goodwill and other intangible assets | (733) | | (1,388) | | (7,394) | | (37) | | (35) | |
| Operating profit | 15,860 | | 7,180 | | 10,993 | | 17,354 | | 14,792 | |
| Share of profit in associates and joint ventures | 3,046 | | 1,597 | | 2,354 | | 2,536 | | 2,375 | |
| Profit before tax | 18,906 | | 8,777 | | 13,347 | | 19,890 | | 17,167 | |
| Tax expense | (4,213) | | (2,678) | | (4,639) | | (4,865) | | (5,288) | |
| Profit for the year | 14,693 | | 6,099 | | 8,708 | | 15,025 | | 11,879 | |
| Attributable to: | | | | | |
| – ordinary shareholders of the parent company | 12,607 | | 3,898 | | 5,969 | | 12,608 | | 9,683 | |
| – preference shareholders of the parent company | 7 | | 90 | | 90 | | 90 | | 90 | |
| – other equity holders | 1,303 | | 1,241 | | 1,324 | | 1,029 | | 1,025 | |
| – non-controlling interests | 776 | | 870 | | 1,325 | | 1,298 | | 1,081 | |
| Profit for the year | 14,693 | | 6,099 | | 8,708 | | 15,025 | | 11,879 | |
| | | | | | | | | | | | | | | | | | |
| Five-year financial information |
| | 2021 | 2020 | 2019 | 2018 | 2017 |
| | $ | $ | $ | $ | $ |
| Basic earnings per share | | 0.62 | | 0.19 | | 0.30 | | 0.63 | | 0.48 | |
| Diluted earnings per share | | 0.62 | | 0.19 | | 0.30 | | 0.63 | | 0.48 | |
Dividends per ordinary share (paid in the period)3 | | 0.22 | | — | | 0.51 | | 0.51 | | 0.51 | |
| | % | % | % | % | % |
Dividend payout ratio4 | | 40.3 | | 78.9 | | 100.0 | | 81.0 | | 106.3 | |
| Post-tax return on average total assets | | 0.5 | | 0.2 | | 0.3 | | 0.6 | | 0.5 | |
| | | | | | |
| Return on average ordinary shareholders’ equity | | 7.1 | | 2.3 | | 3.6 | | 7.7 | | 5.9 | |
| Return on average tangible equity | | 8.3 | | 3.1 | | 8.4 | | 8.6 | | 6.8 | |
| Effective tax rate | | 22.3 | | 30.5 | | 34.8 | | 24.5 | | 30.8 | |
| | | | | | |
| | | | | | |
| | | | | | |
1 The debt instruments, issued for funding purposes, are designated under the fair value option to reduce an accounting mismatch.
2 Net operating income before change in expected credit losses and other credit impairment charges/Loan impairment charges and other credit risk provisions, also referred to as revenue.
3 Includes an interim dividend of $0.07 per ordinary share in respect of the financial year ending 31 December 2021, paid in September 2021, and an interim dividend of $0.15 per ordinary share in respect of the financial year ending 31 December 2020, paid in April 2021.
4 Dividend per ordinary share, in respect of the period, expressed as a percentage of basic earning per share.
Unless stated otherwise, all tables in the Annual Report and Accounts 2021 are presented on a reported basis.
For a summary of our financial performance in 2021, see page 27.
For further financial performance data for each global business and geographical region, see pages 110 to 113 and 120 to 130 respectively. The global business segmental results are presented on an adjusted basis in accordance with IFRS 8 ‘Operating Segments’, in Note 10: Segmental analysis on page 369.
| | |
| Income statement commentary |
The following commentary compares Group financial performance for the year ended 2021 with 2020.
Net interest income
| | | | | | | | | | | | | | | | | | | | | |
| | Year ended | Quarter ended |
| | 31 Dec | 31 Dec | 31 Dec | 31 Dec | 30 Sep | 31 Dec |
| | 2021 | 2020 | 2019 | 2021 | 2021 | 2020 |
| | $m | $m | $m | $m | $m | $m |
| Interest income | | 36,188 | | 41,756 | | 54,695 | | 9,219 | | 9,010 | | 9,301 | |
| Interest expense | | (9,699) | | (14,178) | | (24,233) | | (2,438) | | (2,400) | | (2,682) | |
| Net interest income | | 26,489 | | 27,578 | | 30,462 | | 6,781 | | 6,610 | | 6,619 | |
| Average interest-earning assets | | 2,209,513 | | 2,092,900 | | 1,922,822 | | 2,251,433 | | 2,207,960 | | 2,159,003 | |
| | % | % | % | % | % | % |
Gross interest yield1 | | 1.64 | | 2.00 | | 2.84 | | 1.62 | | 1.62 | | 1.71 | |
Less: gross interest payable1 | | (0.53) | | (0.81) | | (1.48) | | (0.52) | | (0.53) | | (0.60) | |
Net interest spread2 | | 1.11 | | 1.19 | | 1.36 | | 1.10 | | 1.09 | | 1.11 | |
Net interest margin3 | | 1.20 | | 1.32 | | 1.58 | | 1.19 | | 1.19 | | 1.22 | |
| | | | | | | |
1 Gross interest yield is the average annualised interest rate earned on average interest-earning assets (‘AIEA’). Gross interest payable is the average annualised interest cost as a percentage on average interest-bearing liabilities.
2 Net interest spread is the difference between the average annualised interest rate earned on AIEA, net of amortised premiums and loan fees, and the average annualised interest rate payable on average interest-bearing funds.
3 Net interest margin is net interest income expressed as an annualised percentage of AIEA.
| | | | | | | | | | | | | | | | | | | | | | | | | | | | | | | | |
| Summary of interest income by type of asset |
| | 2021 | 2020 | 2019 |
| | Average
balance | Interest
income | Yield | Average
balance | Interest
income | Yield | Average
balance | Interest
income | Yield |
| | $m | $m | % | $m | $m | % | $m | $m | % |
| Short-term funds and loans and advances to banks | | 450,678 | | 1,105 | | 0.25 | | 298,255 | | 1,264 | | 0.42 | | 212,920 | | 2,411 | | 1.13 | |
| Loans and advances to customers | | 1,060,658 | | 26,071 | | 2.46 | | 1,046,795 | | 29,391 | | 2.81 | | 1,021,554 | | 35,578 | | 3.48 | |
| Reverse repurchase agreements – non-trading | | 206,246 | | 1,019 | | 0.49 | | 221,901 | | 1,819 | | 0.82 | | 224,942 | | 4,690 | | 2.08 | |
| Financial investments | | 438,840 | | 6,729 | | 1.53 | | 463,542 | | 8,143 | | 1.76 | | 417,939 | | 10,705 | | 2.56 | |
| Other interest-earning assets | | 53,091 | | 1,264 | | 2.38 | | 62,407 | | 1,139 | | 1.83 | | 45,467 | | 1,311 | | 2.88 | |
| Total interest-earning assets | | 2,209,513 | | 36,188 | | 1.64 | | 2,092,900 | | 41,756 | | 2.00 | | 1,922,822 | | 54,695 | | 2.84 | |
| | | | | | | | | | | | | | | | | | | | | | | | | | | | | | |
| Summary of interest expense by type of liability |
| | 2021 | 2020 | 2019 |
| | Average
balance | Interest
expense | Cost | Average
balance | Interest
expense | Cost | Average
balance | Interest
expense | Cost |
| | $m | $m | % | $m | $m | % | $m | $m | % |
Deposits by banks1 | | 75,671 | | 198 | | 0.26 | | 65,536 | | 330 | | 0.50 | | 52,515 | | 702 | | 1.34 | |
| | | | | | | | | | |
Customer accounts2 | | 1,362,580 | | 4,099 | | 0.30 | | 1,254,249 | | 6,478 | | 0.52 | | 1,149,483 | | 11,238 | | 0.98 | |
| Repurchase agreements – non-trading | | 114,201 | | 363 | | 0.32 | | 125,376 | | 963 | | 0.77 | | 160,850 | | 4,023 | | 2.50 | |
| Debt securities in issue – non-trading | | 193,137 | | 3,603 | | 1.87 | | 219,610 | | 4,944 | | 2.25 | | 211,229 | | 6,522 | | 3.09 | |
| Other interest-bearing liabilities | | 70,929 | | 1,436 | | 2.02 | | 76,395 | | 1,463 | | 1.92 | | 59,980 | | 1,748 | | 2.91 | |
| Total interest-bearing liabilities | | 1,816,518 | | 9,699 | | 0.53 | | 1,741,166 | | 14,178 | | 0.81 | | 1,634,057 | | 24,233 | | 1.48 | |
1 Including interest-bearing bank deposits only.
2 Including interest-bearing customer accounts only.
Net interest income (‘NII’) for 2021 was $26.5bn, a decrease of $1.1bn or 4% compared with 2020. This reflected lower average market interest rates across the major currencies compared with 2020. This was partly offset by interest income associated with the increase in average interest-earning assets (‘AIEA’) of $116.6bn or 5.6%.
Excluding the favourable effects of foreign currency translation differences, net interest income decreased by $1.8bn or 6.2%.
NII for the fourth quarter was $6.8bn, up 2.4% compared with the previous year. The increase was driven by a change in funding composition leading to a reduction of debt securities and an increase in lower-yielding customer deposits. This was partly offset by lower interest income on AIEA, primarily driven by a shift of balances from financial investments to lower yielding short-term funds, and reduced yields on customer loans. Compared with the previous quarter, NII was up 2.5%. The increase was mainly driven by higher interest rates on other interest-earning assets as well as growth in AIEA.
Net interest margin (‘NIM’) for 2021 of 1.20% was 12 basis points (‘bps’) lower compared with 2020 as the reduction in the yield on AIEA of 36bps was partly offset by the fall in funding costs of average interest-bearing liabilities of 28bps. The decrease in NIM in 2021 included the adverse effects of foreign currency translation differences. Excluding this, NIM fell by 11bps.
NIM for the fourth quarter of 2021 was 1.19%, down 3bps year-on-year, predominantly driven by a change in balance sheet composition towards lower yielding short-term funds and loans and advances to banks. NIM remained unchanged compared with the previous quarter.
Interest income for 2021 of $36.2bn decreased by $5.6bn or 13%, primarily due to the lower average interest rates compared with 2020 as the yield on AIEA fell by 36bps. This was partly offset by income from balance sheet growth, predominantly in Asia and the UK. In particular, balances of short-term funds and loans and advances to banks grew by $152.4bn, and loans and advances to customers grew by $13.9bn. The decrease in interest income included $0.9bn from the favourable effects of foreign currency
translation differences. Excluding these, interest income decreased by $6.5bn.
Interest income of $9.2bn in the fourth quarter was down $0.1bn year-on-year. The decline was predominantly driven by a change in the balance sheet composition where high-yielding financial investments decreased by $33.8bn, while low-yielding short-term funds and loans and advances to banks increased by $138.8bn. Compared with the previous quarter interest income was up $0.2bn, mainly due to improved yield on other interest-earning assets, as well as growth in AIEA.
Interest expense for 2021 of $9.7bn represented a decrease by $4.5bn or 32% compared with 2020. This reflected a decrease in funding costs of 28bps, mainly arising from lower interest rates paid on interest-bearing customer accounts, debt securities in issue and repurchase agreements. Funding costs further declined due to a change in funding composition from debt securities to low-yielding customer deposits, which grew by $108bn, predominantly in Asia and Europe. The decrease in interest expense included the adverse effects of foreign currency translation differences of $0.3bn. Excluding this, interest expense decreased by $4.8bn.
Interest expense of $2.4bn in the fourth quarter of 2021 was down $0.2bn year-on-year. The decline was predominantly driven by an improved funding mix, with additional funding from lower costing customer accounts, coupled with the impact of lower market interest rates. Compared with the previous quarter, the interest expense was materially unchanged.
Net fee income of $13.1bn was $1.2bn higher than in 2020, and included a favourable impact from foreign currency translation differences of $0.3bn. Net fee income grew in all of our global businesses.
In WPB, net fee income increased by $0.5bn. Fee income grew, mainly in Wealth, as improved market sentiment resulted in increased customer demand. This increase included higher fee income from funds under management, notably in Hong Kong, the UK and France, and from unit trusts in Asia. Cards income grew as spending increased compared with 2020. This also resulted in higher fee expense.
In CMB, net fee income increased by $0.4bn. Fee income increased from credit facilities, as well as from trade products, as global trade volumes recovered during 2021. Income from account services and remittances also rose as customer activity increased.
In GBM, net fee income increased by $0.3bn. This was driven by higher fee income from growth in corporate finance activity and in account services, which included higher activity from transaction banking clients. Fee income also increased in remittances, credit facilities, funds under management and global custody, reflecting a higher level of client activity compared with 2020.
Net income from financial instruments held for trading or managed on a fair value basis of $7.7bn was $1.8bn lower compared with 2020 and included adverse fair value movements on non-qualifying hedges of $0.4bn.
The remaining reduction was mainly in GBM, as 2020 benefited from higher market volatility supporting a particularly strong performance within Global Foreign Exchange and Global Debt Markets, notably in the UK and the US.
Net income from assets and liabilities of insurance businesses, including related derivatives, measured at fair value through profit or loss of $4.1bn, compared with $2.1bn in 2020. This increase primarily reflected favourable equity market performances in France and Hong Kong and higher gains on unit trust assets, supporting insurance and investment contracts. This compared with 2020, which was adversely impacted by the onset of the Covid-19 pandemic.
This favourable movement resulted in a corresponding movement in liabilities to policyholders and the present value of in-force long-term insurance business (‘PVIF’) (see ‘Other operating income’ below). This reflected the extent to which the policyholders and
shareholders respectively participate in the investment performance of the associated assets.
Change in fair value of designated debt and related derivatives was $0.4bn adverse compared with 2020. These movements were driven by the widening of long-term interest rate curves between the periods, driven by the gradual recovery of major economies.
All of our financial liabilities designated at fair value are fixed-rate, long-term debt issuances and are managed in conjunction with interest rate swaps as part of our interest rate management strategy. These liabilities are discussed further on page 98.
Changes in fair value of other financial instruments mandatorily measured at fair value through profit or loss of $0.8bn was $0.3bn higher compared with 2020. This primarily reflected the impact of adverse movements in equity markets in the first half of 2020 following the onset of the Covid-19 pandemic, as well as from favourable equity market movements during 2021.
Gains less losses from financial investments of $0.6bn were $0.1bn lower compared with 2020, primarily reflecting lower gains on the disposal of debt securities.
Net insurance premium income of $10.9bn was $0.8bn higher than in 2020, primarily reflecting higher sales volumes, particularly in France, the UK and Singapore.
Other operating income of $0.5bn was broadly unchanged compared with 2020, as a $0.3bn decrease in net favourable movements in PVIF was broadly offset by the gain on the sale of a property in Germany and the non-recurrence of revaluation losses on investment properties in Hong Kong in 2020.
The change in PVIF included a net reduction of $0.7bn from assumption changes and experience variances, primarily reflecting increased interest rates and the effect of sharing higher investment returns with policyholders in Hong Kong and Singapore. These were partly offset by France where higher interest rates reduced the cost of guarantees. The net reduction due to assumption changes was partly offset by a $0.3bn increase in the value of new business written, primarily in Hong Kong.
PVIF is presented in accordance with IFRS 4 ‘Insurance Contracts’. As set out in our Annual Report and Accounts 2020, IFRS 17 ‘Insurance Contracts’ is effective from 1 January 2023. Under IFRS 17, there will be no PVIF asset recognised. Instead, the estimated future profit will be included in the measurement of the insurance contract liability as the contractual service margin and gradually recognised in revenue as services are provided over the duration of the insurance contract.
Net insurance claims and benefits paid and movement in liabilities to policyholders was $1.7bn higher, primarily due to higher returns on financial assets supporting contracts where the policyholder is subject to part or all of the investment risk and higher sales volumes, particularly in France and the UK.
Changes in expected credit losses and other credit impairment charges (‘ECL’) were a net release of $0.9bn, compared with a charge of $8.8bn in 2020. The net release in 2021 reflected an improvement in the economic outlook, notably in the UK, partly offset by an increase in allowances in the fourth quarter, reflecting recent developments in China’s commercial real estate sector. This compared with the significant build-up of stage 1 and stage 2 allowances in 2020 due to the worsening economic outlook at the onset of the Covid-19 pandemic. The reduction in ECL also reflected historically low levels of stage 3 charges, although with some normalisation during the fourth quarter, as well as the non-recurrence of a significant charge in 2020 related to a corporate exposure in Singapore.
For further details on the calculation of ECL, including the measurement uncertainties and significant judgements applied to such calculations, the impact of the economic scenarios and management judgemental adjustments, see pages 180 to 188.
| | | | | | | | |
| Operating expenses – currency translation and significant items |
| Year ended |
| 2021 | 2020 |
| $m | $m |
| Significant items | 2,472 | | 3,095 | |
| | |
| – customer redress programmes | 49 | | (54) | |
| | |
| – impairment of goodwill and other intangibles | 587 | | 1,090 | |
| – past service costs of guaranteed minimum pension benefits equalisation | — | | 17 | |
– restructuring and other related costs1 | 1,836 | | 1,908 | |
| – settlements and provisions in connection with legal and regulatory matters | — | | 12 | |
| – currency translation on significant items | | 122 | |
| Currency translation | | (1,072) | |
| Year ended 31 Dec | 2,472 | | 2,023 | |
1 The year ended 2020 included impairment of software intangible assets of $189m (of the total software intangible asset impairment of $1,347m) and impairment of tangible assets of $197m.
| | | | | | | | | | | |
| Operating expenses | |
| Year ended | |
| 2021 | 2020 | |
| $m | $m | |
| Gross employee compensation and benefits | 19,612 | | 19,396 | |
| Capitalised wages and salaries | (870) | | (1,320) | | |
| Goodwill impairment | 587 | | 41 | |
| Property and equipment | 5,145 | | 5,322 | |
| Amortisation and impairment of intangibles | 1,438 | | 2,519 | |
| UK bank levy | 116 | | 802 | |
| Legal proceedings and regulatory matters | 106 | | 289 | |
Other operating expenses1 | 8,486 | | 7,383 | |
| Total operating expenses (reported) | 34,620 | | 34,432 | |
| Total significant items (including currency translation on significant items) | (2,472) | | (3,095) | | |
| Currency translation | | 1,072 | | |
| Total operating expenses (adjusted) | 32,148 | | 32,409 | |
1 Other operating expenses includes professional fees, contractor costs, transaction taxes, marketing and travel. The increase was driven by the spend related to our cost reduction programme, as well as from the growth in investment in technology and regulatory programmes.
| | | | | | | | | | | |
| Staff numbers (full-time equivalents) |
| 2021 | 2020 | 2019 |
| Global businesses | | | |
| Wealth and Personal Banking | 130,185 | | 135,727 | | 141,341 | |
| Commercial Banking | 42,969 | | 43,221 | | 44,706 | |
| Global Banking and Markets | 46,166 | | 46,729 | | 48,859 | |
| Corporate Centre | 377 | | 382 | | 445 | |
| At 31 Dec | 219,697 | | 226,059 | | 235,351 | |
| | | |
Operating expenses of $34.6bn were broadly unchanged compared with 2020. This included the impact of our cost saving initiatives, as well as lower impairments of goodwill and other intangible assets, as 2021 included a $0.6bn impairment of goodwill related to our WPB business in Latin America to reflect the macroeconomic outlook, as well as the impact of foreign exchange rate deterioration and inflationary pressures, notably on our Argentina business. However, 2020 included a $1.3bn impairment of intangible assets, mainly in Europe. There was also a $0.6bn reduction in the UK bank levy due to a change in the basis of calculation to only include the UK balance sheet rather than the global balance sheet, as well as a credit of $0.1bn relating to the 2020 charge.
These decreases were broadly offset by an increase in performance-related pay of $0.7bn as Group performance improved, and by an increase in investment in technology of $0.9bn (gross of cost savings of $0.5bn). The remaining increase primarily reflected inflationary impacts, non-technology investment in regulatory programmes, and business growth notably Asia wealth investment. In addition, there was an adverse impact of foreign currency translation differences of $1.1bn.
In February 2020, we announced a plan to substantially reduce the cost base by 2022 and accelerate the pace of change. We continue to target $5bn to $5.5bn of cost saves for 2020 to 2022, while spending around $7bn in costs to achieve, which are included in restructuring and other related costs. Cumulative costs to achieve spend since the start of the programme in 2020 was
$3.6bn, with related saves of $3.3bn. In 2021, the total cost to achieve spend was $1.8bn with saves during the year of $2.2bn.
Share of profit in associates and joint ventures of $3.0bn was $1.4bn higher, primarily reflecting a higher share of profit from The Saudi British Bank (‘SABB’) due to the non-recurrence of our share of its goodwill impairment charge in 2020, and an increased share of profit from BoCom. Our share of profit also rose from Business Growth Fund in the UK due to a recovery in asset valuations relative to 2020.
At 31 December 2021, we performed an impairment review of our investment in BoCom and concluded that it was not impaired, based on our value-in-use (‘VIU’) calculations. The excess of the VIU of BoCom and its carrying value has increased over the period, reflecting the impact of BoCom’s performance on the VIU.
For more information, see Note 19: Interests in associates and joint ventures on page 387.
Tax expense
The effective tax rate for 2021 of 22.3% was lower than the 30.5% for 2020. The effective tax rate for 2021 was increased by the impact of substantively enacted legislation to increase the UK statutory tax rate from 1 April 2023. The 2020 effective tax rate was high, due mainly to the non-recognition of deferred tax on losses in the UK and France.
The following commentary compares Group financial performance for the year ended 2020 with 2019.
Net interest income (‘NII’) for 2020 was $27.6bn, a decrease of $2.9bn or 9.5% compared with 2019. This reflected lower average market interest rates across the major currencies compared with 2019. This was partly offset by interest income associated with the increase in average interest-earning assets (‘AIEA’) of $170.1bn or 8.8%.
Excluding the favourable impact of significant items and the adverse effects of foreign currency translation differences between 2020 and 2019, net interest income decreased by $2.7bn or 9%.
NII for the fourth quarter of 2020 was $6.6bn, down 13.5% year-on-year, and up 2.6% compared with the previous quarter. The year-on-year decrease was driven by the impact of lower market interest rates predominantly in Asia and North America. This was partly offset by higher NII from growth in AIEA, notably short-term funds and financial investments and predominantly in Asia and Europe. The increase compared with the previous quarter was mainly driven by lower rates on customer deposits and issued debt securities, which were partly offset by lower rates on AIEA.
Net interest margin (‘NIM’) for 2020 of 1.32% was
26 basis points (‘bps’) lower compared with 2019 as the reduction in the yield on AIEA of 84bps was partly offset by the fall in funding costs of average interest-bearing liabilities of 67bps. The decrease in NIM in 2020 included the favourable impacts of significant items and the adverse effects of foreign currency translation differences. Excluding this, NIM fell by 25bps.
NIM for the fourth quarter of 2020 was 1.22%, down 34bps year-on-year, and up 2bps compared with the previous quarter. The year-on-year decrease was mainly driven by Asia and caused by the impact of lower market interest rates. The increase compared with the previous quarter was driven by a reduction in funding costs of average interest-bearing liabilities of 8bps, which was partly offset by a reduction in the yield on AIEA of 5bps.
Interest income for 2020 of $41.8bn decreased by $12.9bn or 24%, primarily due to the lower average interest rates compared with 2019 as the yield on AIEA fell by 84bps. This was partly offset by income from balance sheet growth, predominantly in Asia and Europe. The balance sheet growth was driven by higher balances in short-term funds and loans and advances to banks and financial investments, which increased by $85.3bn and $45.6bn, respectively. The decrease in interest income included $0.2bn in relation to the favourable impact of significant items and $0.8bn from the adverse effects of foreign currency translation differences. Excluding these, interest income decreased by $12.3bn.
Interest income of $9.3bn in the fourth quarter of 2020 was down $3.9bn year-on-year, and down $0.2bn compared with the previous quarter. The year-on-year decrease was predominantly driven by the impact of lower market interest rates, predominantly in Asia and in North America, although partly offset by growth in AIEA, notably short-term funds and loans and advances to banks and financial investments. The small decrease compared with the previous quarter was mainly driven by reduced rates on financial investments and loans and advances to customers.
Interest expense for 2020 of $14.2bn decreased by $10.1bn or 41% compared with 2019. This reflected the decrease in funding costs of 67bps, mainly arising from lower interest rates paid on interest-bearing liabilities. This was partly offset by higher interest expense from growth in interest-bearing customer accounts, which increased by $104.8bn. The decrease in interest expense included the favourable effects of foreign currency translation differences of $0.5bn. Excluding this, interest expense decreased by $9.6bn.
Interest expense of $2.7bn in the fourth quarter of 2020 was down $2.9bn year-on-year, and down $0.3bn compared with the previous quarter.
The year-on-year decrease was predominantly driven by the impact of lower market interest rates, partly offset by growth in interest-bearing customer accounts, which increased by $142.9bn. The small decrease compared with the previous quarter was mainly due to reduced funding costs on customer deposits and debt issuances.
Net fee income of $11.9bn was $0.1bn lower, reflecting reductions in WPB and CMB, partly offset by an increase in GBM.
In WPB, lower fee income reflected a reduction in account services, notably in the UK, due to lower customer activity. Income from credit cards also reduced, as customer spending activity fell across most markets, mainly in Hong Kong, the UK, MENA and the US. Fee income on unit trusts fell, mainly in Hong Kong. These decreases were partly offset by higher income from broking, primarily in Hong Kong, as volatility in the equity markets resulted in increased customer activity. Fee expenses fell as a result of reduced customer activity levels, mainly in cards.
In CMB, trade-related fee income fell, reflecting the reduction in global trade activity, notably in Hong Kong and the UK. Income also fell in remittances due to lower client activity.
In GBM, net fee income was higher, mainly from growth in underwriting fees in the US and the UK. Global custody and broking fees also rose as client activity and turnover of securities increased due to market volatility. These increases were partly offset by a reduction in fee income from credit facilities, notably in the UK, Hong Kong and the US.
Net income from financial instruments held for trading or managed on a fair value basis of $9.6bn was $0.6bn lower and included a loss of $0.3bn from asset disposals relating to our restructuring programme. This was partly offset by favourable fair value movements on non-qualifying hedges of $0.1bn and favourable debit value adjustments of $0.1bn.
The remaining reduction was primarily due to lower trading interest income, reflecting lower market rates. However, other trading income increased in GBM as elevated market volatility and wider spreads supported a strong performance in Global Debt Markets and Global Foreign Exchange.
Net income from assets and liabilities of insurance businesses, including related derivatives, measured at fair value through profit or loss was a net income of $2.1bn, compared with a net income of $3.5bn in 2019. This decrease primarily reflected less favourable equity market performance, compared with 2019 in France and Hong Kong, due to the impact of the Covid-19 outbreak on the equity and unit trust assets supporting insurance and investment contracts. After large losses in the first quarter of 2020, there was a partial recovery in the remainder of the year, resulting in higher revenue in these subsequent quarters during 2020 compared with the equivalent quarters in 2019.
This adverse movement resulted in a corresponding movement in liabilities to policyholders and the present value of in-force long-term insurance business (‘PVIF’) (see ‘Other operating income’ below). This reflected the extent to which the policyholders and shareholders respectively participate in the investment performance of the associated assets.
Change in fair value of designated debt and related derivatives of $0.2bn was $0.1bn favourable compared with 2019. The movements were driven by the fall in interest rates between the periods, notably in US dollars and pounds sterling. The majority of our financial liabilities designated at fair value are fixed-rate, long-term debt issuances and are managed in conjunction with interest rate swaps as part of our interest rate management strategy.
Changes in fair value of other financial instruments mandatorily measured at fair value through profit or loss of $0.5bn was $0.4bn lower compared with 2019. This primarily reflected adverse movements in equity markets due to the impact of the Covid-19 outbreak.
Gains less losses from financial investments of $0.7bn increased by $0.3bn, reflecting higher gains from the disposal of debt securities in Markets Treasury.
Net insurance premium income of $10.1bn was $0.5bn lower than in 2019, reflecting lower new business volumes, particularly in France and Hong Kong, partly offset by lower reinsurance arrangements in Hong Kong.
Other operating income of $0.5bn decreased by $2.4bn compared with 2019, primarily due to lower favourable changes in PVIF compared with 2019 (down $1.4bn) and also the non recurrence of a $0.8bn dilution gain in 2019 following the merger of The Saudi British Bank (‘SABB’) with Alawwal bank in Saudi Arabia.
The change in PVIF included a reduction of $0.8bn due to assumption changes and experience variances, mainly in Hong Kong and France due to the effect of interest rate changes on the valuation of liabilities under insurance contracts. In addition, the value of new business written fell by $0.4bn, primarily in Hong Kong, as sales volumes decreased.
The reduction also reflected the non-recurrence of 2019 gains recognised in Argentina and Mexico.
Net insurance claims and benefits paid and movement in liabilities to policyholders was $2.3bn lower, primarily due to lower returns on financial assets supporting contracts where the policyholder is subject to part or all of the investment risk. New business volumes were also lower, particularly in Hong Kong and France, partly offset by lower reinsurance arrangements in Hong Kong.
Changes in expected credit losses and other credit impairment charges (‘ECL’) of $8.8bn were $6.1bn higher compared with 2019 with increases in all global businesses.
The ECL charge in 2020 reflected a significant increase in stage 1 and stage 2 allowances, notably in the first half of the year, to reflect the deterioration in the forward economic outlook globally as a result of the Covid-19 outbreak. The economic outlook stabilised in the second half of 2020 and as a result stage 1 and stage 2 allowances were broadly unchanged at 31 December 2020, compared with 30 June 2020. Stage 3 charges also increased compared with 2019, largely against wholesale exposures, including a significant charge related to a CMB client in Singapore in the first quarter of 2020.
Excluding currency translation differences, and based on the foreign exchange rates during 2020, ECL as a percentage of average gross loans and advances to customers was 0.81%, compared with 0.25% in 2019.
The estimated impact of the Covid-19 outbreak was incorporated in the ECL through additional scenario analysis, which considered differing severity and duration assumptions relating to the global pandemic. These included probability-weighted shocks to annual GDP and consequential impacts on unemployment and other economic variables, with differing economic recovery assumptions. Given the severity of the macroeconomic projections, and the complexities of the government measures, which have never been modelled, additional judgemental adjustments have been made to our provisions.
For further details on the calculation of ECL, including the measurement uncertainties and significant judgements applied to such calculations, the impact of alternative/additional scenarios and management judgemental adjustments, see pages 169 to 177 of the HSBC Holdings plc 20-F for the year ended 31 December 2020.
Operating expenses of $34.4bn were $7.9bn lower than in 2019, primarily reflecting the net favourable movements in significant items of $6.6bn, which included:
•the non-recurrence of a $7.3bn impairment of goodwill in 2019, primarily related to lower long-term economic growth assumptions in GBM and CMB, and the planned reshaping of GBM. This compared with a $1.1bn impairment of goodwill and other intangibles in 2020, primarily capitalised software related to the businesses within HSBC Bank plc, and to a lesser extent our businesses in the US. These impairments reflected underperformance and a deterioration in the future forecasts of these businesses, and in the case of HSBC Bank plc substantially relating to prior periods; and
•customer redress programme costs, which were a net release of $0.1bn in 2020, compared with charges of $1.3bn in 2019.
This was partly offset by:
•restructuring and other related costs of $1.9bn in 2020, of which $0.9bn related to severance, $0.2bn related to an impairment of software intangibles and $0.2bn related to the impairment of tangible assets in France and the US. This compared with restructuring and other related costs of $0.8bn in 2019.
The reduction also included favourable currency translation differences between 2020 and 2019 of $0.2bn.
The remaining reduction of $1.1bn reflected a $0.5bn decrease in performance-related pay and lower discretionary expenditure, including marketing (down $0.3bn) and travel costs (down $0.3bn). In addition, our cost-saving initiatives resulted in a reduction of $1.4bn, of which $1.0bn related to our costs to achieve programme, and the UK bank levy was $0.2bn lower than in 2019. These decreases were partly offset by an increase in investments in technology to enhance our digital and automation capabilities to improve how we serve our customers, as well as inflation and volume-related increases. In addition, the 2020 period included impairments of certain real estate assets.
During 2020, we reduced the number of employees expressed in full-time equivalent staff (‘FTE’) and contractors by 11,011. This included a 9,292 reduction in FTE to 226,059 at 31 December 2020, while the number of contractors reduced by 1,719 to 5,692 at 31 December 2020.
Share of profit in associates and joint ventures of $1.6bn was $0.8bn or 32% lower than in 2019, primarily reflecting our share of an impairment of goodwill by SABB of $0.5bn. This goodwill was recognised by SABB on the completion of its merger with Alawwal bank in 2019. The remaining reduction reflected a lower share of profit recognised from our associates in Asia and MENA due to the impact of the Covid-19 outbreak and the lower interest-rate environment.
At 31 December 2020, we performed an impairment review of our investment in BoCom and concluded that it was not impaired, based on our value-in-use (‘VIU’) calculations. However, the excess of the VIU of BoCom and its carrying value has reduced over the period, increasing the risk of impairment in the future.
For more information on the key assumptions in our VIU calculation, including the sensitivity of the VIU to each key assumption, see Note 18 on the financial statements of the HSBC Holdings plc 20-F for the year ended
31 December 2020.
Tax expense The effective tax rate for 2020 of 30.5% was lower than the 34.8% effective tax rate for 2019. An impairment of goodwill and non-deductible customer redress charges increased the 2019 effective tax rate. These were not repeated in 2020. Additionally, the non-taxable dilution gain arising on the merger of SABB with Alawwal bank decreased the effective tax rate in 2019. Higher charges in respect of the non-recognition of deferred tax assets, particularly in the UK ($0.4bn) and France ($0.4bn), increased the 202 effective tax rate.
Further details are provided in Note 7 on the financial statements of the HSBC Holdings plc 20-F for the year ended 31 December 2020.
| | |
| Consolidated balance sheet |
| | | | | | | | | | | | | | | | | | |
| Five-year summary consolidated balance sheet |
| | 2021 | 2020 | 2019 | 2018 | 2017 |
| | $m | $m | $m | $m | $m |
| Assets | | | | | | |
| Cash and balances at central banks | | 403,018 | | 304,481 | | 154,099 | | 162,843 | | 180,624 | |
| Trading assets | | 248,842 | | 231,990 | | 254,271 | | 238,130 | | 287,995 | |
| Financial assets designated and otherwise mandatorily measured at fair value through profit or loss | | 49,804 | | 45,553 | | 43,627 | | 41,111 | | N/A |
| Financial assets designated at fair value | | N/A | N/A | N/A | N/A | 29,464 | |
| Derivatives | | 196,882 | | 307,726 | | 242,995 | | 207,825 | | 219,818 | |
| Loans and advances to banks | | 83,136 | | 81,616 | | 69,203 | | 72,167 | | 90,393 | |
Loans and advances to customers1 | | 1,045,814 | | 1,037,987 | | 1,036,743 | | 981,696 | | 962,964 | |
| Reverse repurchase agreements – non-trading | | 241,648 | | 230,628 | | 240,862 | | 242,804 | | 201,553 | |
| Financial investments | | 446,274 | | 490,693 | | 443,312 | | 407,433 | | 389,076 | |
| Other assets | | 242,521 | | 253,490 | | 230,040 | | 204,115 | | 159,884 | |
| Total assets at 31 Dec | | 2,957,939 | | 2,984,164 | | 2,715,152 | | 2,558,124 | | 2,521,771 | |
| Liabilities and equity | | | | | | |
| Liabilities | | | | | | |
| Deposits by banks | | 101,152 | | 82,080 | | 59,022 | | 56,331 | | 69,922 | |
| Customer accounts | | 1,710,574 | | 1,642,780 | | 1,439,115 | | 1,362,643 | | 1,364,462 | |
| Repurchase agreements – non-trading | | 126,670 | | 111,901 | | 140,344 | | 165,884 | | 130,002 | |
| Trading liabilities | | 84,904 | | 75,266 | | 83,170 | | 84,431 | | 184,361 | |
| Financial liabilities designated at fair value | | 145,502 | | 157,439 | | 164,466 | | 148,505 | | 94,429 | |
| Derivatives | | 191,064 | | 303,001 | | 239,497 | | 205,835 | | 216,821 | |
| Debt securities in issue | | 78,557 | | 95,492 | | 104,555 | | 85,342 | | 64,546 | |
| Liabilities under insurance contracts | | 112,745 | | 107,191 | | 97,439 | | 87,330 | | 85,667 | |
| Other liabilities | | 199,994 | | 204,019 | | 194,876 | | 167,574 | | 113,690 | |
| Total liabilities at 31 Dec | | 2,751,162 | | 2,779,169 | | 2,522,484 | | 2,363,875 | | 2,323,900 | |
| Equity | | | | | | |
| Total shareholders’ equity | | 198,250 | | 196,443 | | 183,955 | | 186,253 | | 190,250 | |
| Non-controlling interests | | 8,527 | | 8,552 | | 8,713 | | 7,996 | | 7,621 | |
| Total equity at 31 Dec | | 206,777 | | 204,995 | | 192,668 | | 194,249 | | 197,871 | |
| Total liabilities and equity at 31 Dec | | 2,957,939 | | 2,984,164 | | 2,715,152 | | 2,558,124 | | 2,521,771 | |
1 Net of impairment allowances.
A more detailed consolidated balance sheet is contained in the financial statements on page 338.
| | | | | | | | | | | | | | | | | | |
| Five-year selected financial information |
| | 2021 | 2020 | 2019 | 2018 | 2017 |
| | $m | $m | $m | $m | $m |
| Called up share capital | | 10,316 | | 10,347 | | 10,319 | | 10,180 | | 10,160 | |
Capital resources1 | | 177,786 | | 184,423 | | 172,150 | | 173,238 | | 182,383 | |
| Undated subordinated loan capital | | 1,968 | | 1,970 | | 1,968 | | 1,969 | | 1,969 | |
Preferred securities and dated subordinated loan capital2 | | 28,568 | | 30,721 | | 33,063 | | 35,014 | | 42,147 | |
| Risk-weighted assets | | 838,263 | | 857,520 | | 843,395 | | 865,318 | | 871,337 | |
| | | | | | |
| Total shareholders’ equity | | 198,250 | | 196,443 | | 183,955 | | 186,253 | | 190,250 | |
| Less: preference shares and other equity instruments | | (22,414) | | (22,414) | | (22,276) | | (23,772) | | (23,655) | |
| Total ordinary shareholders’ equity | | 175,836 | | 174,029 | | 161,679 | | 162,481 | | 166,595 | |
| Less: goodwill and intangible assets (net of tax) | | (17,643) | | (17,606) | | (17,535) | | (22,425) | | (21,680) | |
| Tangible ordinary shareholders’ equity | | 158,193 | | 156,423 | | 144,144 | | 140,056 | | 144,915 | |
| | | | | | |
| Financial statistics | | | | | | |
| Loans and advances to customers as a percentage of customer accounts | | 61.1% | 63.2% | 72.0% | 72.0% | 70.6% |
| Average total shareholders’ equity to average total assets | | 6.62% | 6.46% | 6.97% | 7.16% | 7.33% |
Net asset value per ordinary share at year-end ($)3 | | 8.76 | | 8.62 | | 8.00 | | 8.13 | | 8.35 | |
Tangible net asset value per ordinary share at year-end ($)4 | | 7.88 | | 7.75 | | 7.13 | | 7.01 | | 7.26 | |
| Tangible net asset value per fully diluted share at year-end ($) | | 7.84 | | 7.72 | | 7.11 | | 6.98 | | 7.22 | |
| Number of $0.50 ordinary shares in issue (millions) | | 20,632 | | 20,694 | | 20,639 | | 20,361 | | 20,321 | |
| Basic number of $0.50 ordinary shares outstanding (millions) | | 20,073 | | 20,184 | | 20,206 | | 19,981 | | 19,960 | |
| Basic number of $0.50 ordinary shares outstanding and dilutive potential ordinary shares (millions) | | 20,189 | | 20,272 | | 20,280 | | 20,059 | | 20,065 | |
| Closing foreign exchange translation rates to $: | | | | | | |
| $1: £ | | 0.739 | | 0.732 | | 0.756 | | 0.783 | | 0.740 | |
| $1: € | | 0.880 | | 0.816 | | 0.890 | | 0.873 | | 0.834 | |
1 Capital resources are regulatory total capital, the calculation of which is set out on page 229.
2 Including perpetual preferred securities, details of which can be found in Note 28: Subordinated liabilities on page 398.
3 The definition of net asset value per ordinary share is total shareholders’ equity, less non-cumulative preference shares and capital securities, divided by the number of ordinary shares in issue, excluding own shares held by the company, including those purchased and held in treasury.
4 The definition of tangible net asset value per ordinary share is total ordinary shareholder’s equity excluding goodwill, PVIF and other intangible assets (net of deferred tax), divided by the number of basic ordinary shares in issue, excluding own shares held by the company, including those purchased and held in treasury.
Balance sheet commentary compared with
31 December 2020
At 31 December 2021, our total assets were $3.0tn, which were $26bn or 1% lower on a reported basis and $19bn or 1% higher on a constant currency basis.
The decrease in total assets reflected lower derivative assets and a fall in financial investments, in part reflecting a redeployment of our commercial surplus into cash. Reported customer lending balances were $8bn higher, mainly from growth in mortgage balances.
Reported loans and advances to customers as a percentage of customer accounts was 61.1%, which was lower compared with 63.2% at 31 December 2020. This was due to an increase in customer accounts as corporate customers continued to build up liquidity and personal customers grew their savings accounts.
Assets
Cash and balances at central banks increased by $99bn or 32%, mainly in the UK and the US, as we redeployed our commercial surplus to cash to increase liquidity for our clients and as a result of deposit inflows.
Trading assets increased by $17bn or 7%, notably from an increase in equity securities held, particularly in Hong Kong and the US, largely driven by client demand. These were partly offset by a reduction of debt securities in the US.
Derivative assets decreased by $111bn or 36%, primarily in the UK and France. This reflected adverse revaluation movements on interest rate contracts due to higher long-term yield curve rates in most major markets. Foreign exchange contracts also decreased as a result of foreign exchange rate movements in the UK and Hong Kong and lower client demand in the US. The decrease in derivative assets was consistent with the decrease in derivative liabilities, as the underlying risk is broadly matched.
Loans and advances to customers of $1.0tn increased by $8bn on a reported basis, which included adverse effects of foreign currency translation differences of $16bn. On a constant currency basis, customer lending balances were $23bn higher, despite $3bn of loans and advances to customers being reclassified to assets held for sale in the US.
The commentary below is on a constant currency basis.
Customer lending increased in WPB by $27bn to $489bn, mainly from growth in mortgage balances of $23bn, notably in the UK (up $10bn), Hong Kong (up $7bn) and Canada (up $4bn) as housing market activity continued to increase.
In CMB, customer lending of $349bn was $11bn higher, as we grew trade lending by $13bn, reflecting a recovery in global trade volumes, which more than offset a reduction in other term lending.
In GBM, lending of $207bn fell by $14bn, due to a reduction in other term lending mainly in the UK.
Reverse repurchase agreements – non-trading increased by $11bn or 5%, primarily in Asia due to client demand. This was partly offset by the redeployment of our commercial surplus to cash in the US.
There was also an increase in balances eligible for netting in the UK, resulting in an overall balance reduction.
Financial investments decreased by $44bn or 9%, mainly as we reduced our holdings of debt securities and treasury bills through a combination of disposals and maturities. A notable portion of these funds was redeployed into cash as we managed our commercial surplus.
Other assets decreased by $11bn due to lower cash collateral as derivative balances decreased, partly offset by an increase from the reclassification of loans and advances to customers to assets held for sale, reflecting our exit of mass market retail banking in the US.
Liabilities
Customer accounts of $1.7tn increased by $68bn or 4% on a reported basis, which included adverse effects of foreign currency translation differences of $23bn. On a constant currency basis, customer accounts were $90bn higher, with growth across all of our global businesses, despite a reclassification of $10bn to liabilities of disposal groups held for sale in the US. The increase was primarily in the UK, Hong Kong and the rest of Asia, as corporate customers continued to build up liquidity and personal customers grew their savings as spending remained below pre-pandemic levels.
Deposits by banks increased by $19bn or 23%, primarily in the UK, relating to the utilisation of a Bank of England scheme to provide loans to corporate customers during the year. There were also increases in Hong Kong and the US.
Repurchase agreements – non-trading increased by $15bn or 13%, primarily in Hong Kong, as client demand increased.
Derivative liabilities decreased by $112bn or 37%, which is consistent with the decrease in derivative assets, since the underlying risk is broadly matched.
Other liabilities decreased by $4bn or 2% due to lower cash collateral as derivative balances decreased, partly offset by an increase from a reclassification of customer accounts to liabilities held for sale, reflecting our exit of mass market retail banking in the US.
Equity
Total shareholders’ equity, including non-controlling interests, increased by $2bn or 1% compared with 31 December 2020. This reflected the effects of profits generated of $15bn, partly offset by a reduction in other comprehensive income (‘OCI’) of $5bn, dividend payments and coupon distributions on securities classified as equity of $6bn and a $2bn reduction related to our share buy-back programme. Movements in OCI included fair value losses on debt instruments of $2bn, driven by unrealised losses on fixed rate bonds due to higher long-term yield curve rates, and adverse foreign exchange differences of $2bn.
Risk-weighted assets
Risk-weighted assets (‘RWAs’) totalled $838.3bn at 31 December 2021, a $19.2bn decrease since 2020. Excluding foreign currency translation differences, RWAs fell by $6.3bn in 2021. This was due to the following movements:
•a $4.7bn asset size increase, mostly caused by CMB and WPB lending growth in Asia, while lending fell in GBM;
•a $8.0bn reduction in RWAs due to changes in asset quality from favourable portfolio mix and credit migration, mostly in CMB and WPB in Asia and North America; and
•a $3.0bn fall in RWAs due to changes in methodology and policy. This was primarily the result of risk parameter refinements in GBM and CMB, partly offset by higher market risk RWAs following our adoption of a Pillar 1 approach to the capitalisation of structural foreign exchange.
| | | | | | | | |
| Customer accounts by country/territory |
| 2021 | 2020 |
| $m | $m |
| Europe | 667,769 | | 629,647 | |
| – UK | 535,797 | | 504,275 | |
| – France | 56,841 | | 55,111 | |
| – Germany | 22,509 | | 21,605 | |
| – Switzerland | 10,680 | | 10,102 | |
| – other | 41,942 | | 38,554 | |
| Asia | 792,098 | | 762,406 | |
| – Hong Kong | 549,429 | | 531,489 | |
| – Singapore | 57,572 | | 55,140 | |
| – mainland China | 59,266 | | 56,826 | |
| – Australia | 28,240 | | 29,286 | |
| – India | 24,507 | | 20,199 | |
| – Malaysia | 16,500 | | 15,997 | |
| – Taiwan | 15,483 | | 16,041 | |
| – Indonesia | 6,019 | | 5,198 | |
| – other | 35,082 | | 32,230 | |
| Middle East and North Africa (excluding Saudi Arabia) | 42,629 | | 41,221 | |
| – United Arab Emirates | 20,943 | | 20,974 | |
| – Turkey | 4,258 | | 3,987 | |
| – Egypt | 6,699 | | 5,659 | |
| – other | 10,729 | | 10,601 | |
| North America | 178,565 | | 182,028 | |
– US1 | 111,921 | | 117,485 | |
| – Canada | 58,071 | | 56,520 | |
| – other | 8,573 | | 8,023 | |
| Latin America | 29,513 | | 27,478 | |
| – Mexico | 23,583 | | 22,220 | |
| – other | 5,930 | | 5,258 | |
| At 31 Dec | 1,710,574 | | 1,642,780 | |
1 At 31 December 2021, customer accounts of $8.8bn relating to the disposal of the US retail banking business met the criteria to be classified as held for sale and are reported within ‘Accruals, deferred income and other liabilities’ on the balance sheet. Refer to Note 36 on page 415 for further details.
| | | | | | | | | | | | | | | | | | | | | | | |
| Loans and advances, deposits by currency |
| At |
| 31 Dec 2021 |
| $m | USD | GBP | HKD | EUR | CNY | Others1 | Total |
| Loans and advances to banks | 21,474 | | 3,991 | | 524 | | 3,970 | | 6,545 | | 46,632 | | 83,136 | |
| Loans and advances to customers | 169,055 | | 280,909 | | 223,714 | | 83,457 | | 44,093 | | 244,586 | | 1,045,814 | |
| Total loans and advances | 190,529 | | 284,900 | | 224,238 | | 87,427 | | 50,638 | | 291,218 | | 1,128,950 | |
| | | | | | | |
| Deposits by banks | 37,962 | | 20,909 | | 2,757 | | 24,393 | | 5,049 | | 10,082 | | 101,152 | |
| Customer accounts | 453,864 | | 463,232 | | 318,702 | | 133,604 | | 65,052 | | 276,120 | | 1,710,574 | |
| Total deposits | 491,826 | | 484,141 | | 321,459 | | 157,997 | | 70,101 | | 286,202 | | 1,811,726 | |
| | | | | | | |
| At |
| 31 Dec 2020 |
| $m | USD | GBP | HKD | EUR | CNY | Others | Total |
| Loans and advances to banks | 17,959 | | 3,495 | | 7,155 | | 4,601 | | 6,063 | | 42,343 | | 81,616 | |
| Loans and advances to customers | 173,117 | | 280,803 | | 222,138 | | 89,851 | | 37,671 | | 234,407 | | 1,037,987 | |
| Total loans and advances | 191,076 | | 284,298 | | 229,293 | | 94,452 | | 43,734 | | 276,750 | | 1,119,603 | |
| | | | | | | |
| Deposits by banks | 30,239 | | 7,856 | | 2,884 | | 25,291 | | 4,904 | | 10,906 | | 82,080 | |
| Customer accounts | 433,647 | | 431,143 | | 310,197 | | 135,851 | | 60,971 | | 270,971 | | 1,642,780 | |
| Total deposits | 463,886 | | 438,999 | | 313,081 | | 161,142 | | 65,875 | | 281,877 | | 1,724,860 | |
1 ‘Others’ includes items with no currency information available ($11,028m for loans to banks, $64,491m for loans to customers, $23m for deposits by banks and $5m for customer accounts).
Average balance sheet and net interest income
Average balances and related interest are shown for the domestic operations of our principal commercial banks by geographical region. ‘Other operations’ comprise the operations of our principal commercial banking and consumer finance entities outside their domestic markets and all other banking operations, including investment banking balances and transactions.
Average balances are based on daily averages for the principal areas of our banking activities with monthly or less frequent averages used elsewhere.
Balances and transactions with fellow subsidiaries are reported gross in the principal commercial banking and consumer finance
entities, and the elimination entries are included within ‘Other operations’.
Net interest margin numbers are calculated by dividing net interest income as reported in the income statement by the average interest-earning assets from which interest income is reported within the ‘Net interest income’ line of the income statement. Total interest-earning assets include credit-impaired loans where the carrying amount has been adjusted as a result of impairment allowances. In accordance with IFRSs, we recognise interest income on credit-impaired assets after the carrying amount has been adjusted as a result of impairment. Fee income that forms an integral part of the effective interest rate of a financial instrument is recognised as an adjustment to the effective interest rate and recorded in ‘Interest income’.
| | | | | | | | | | | | | | | | | | | | | | | |
| Assets |
| 2021 | 2020 |
| Average
balance | Interest
income | Yield | Average
balance | Interest
income | Yield |
| $m | $m | % | $m | $m | % |
| Summary | | | | | | |
| Interest-earning assets measured at amortised cost (itemised below) | 2,209,513 | | 36,188 | | 1.64 | | 2,092,900 | | 41,756 | | 2.00 | |
| Trading assets and financial assets designated and otherwise mandatorily measured at fair value through profit or loss | 171,232 | | 3,342 | | 1.95 | | 188,648 | | 3,328 | | 1.76 | |
| Expected credit losses provision | (12,944) | | N/A | N/A
| (11,709) | | N/A | N/A |
| | | | | | |
| Non-interest-earning assets | 644,636 | | N/A | N/A | 667,100 | | N/A | N/A |
| Total assets and interest income | 3,012,437 | | 39,530 | | 1.31 | | 2,936,939 | | 45,084 | | 1.54 | |
| Average yield on all interest-earning assets | | | 1.66 | | | | 1.98 | |
| | | | | | |
| Short-term funds and loans and advances to banks | | | | | | |
| Europe | HSBC Bank plc | 163,708 | | 157 | | 0.10 | | 116,521 | | 182 | | 0.16 | |
| HSBC UK Bank plc | 124,627 | | 132 | | 0.11 | | 63,190 | | 111 | | 0.18 | |
| Asia | The Hongkong and Shanghai Banking Corporation Limited | 86,997 | | 502 | | 0.58 | | 76,521 | | 683 | | 0.89 | |
| MENA | HSBC Bank Middle East Limited | 5,647 | | 34 | | 0.60 | | 4,837 | | 54 | | 1.12 | |
| North America | HSBC North America Holdings Inc. | 53,984 | | 110 | | 0.20 | | 24,429 | | 89 | | 0.36 | |
| HSBC Bank Canada | 12,388 | | 29 | | 0.23 | | 8,953 | | 22 | | 0.25 | |
| Latin America | Grupo Financiero HSBC, S.A. de C.V. | 2,143 | | 85 | | 3.97 | | 2,084 | | 104 | | 4.99 | |
| HSBC Argentina Holdings S.A. | 72 | | — | | — | | 43 | | — | | — | |
| | | | | | | |
| Other operations and intra-region eliminations | 1,112 | | 56 | | 5.04 | | 1,677 | | 19 | | 1.13 | |
| At 31 Dec | 450,678 | | 1,105 | | 0.25 | | 298,255 | | 1,264 | | 0.42 | |
| | | | | | | | | | | | | | | | | | | | | | | |
|
| | |
| | | | | | |
| | | | | | |
| Loans and advances to customers | | | | | | |
| Europe | HSBC Bank plc | 136,373 | | 2,226 | | 1.63 | | 149,457 | | 2,685 | | 1.80 | |
| HSBC UK Bank plc | 267,177 | | 6,633 | | 2.48 | | 242,013 | | 6,307 | | 2.61 | |
| Asia | The Hongkong and Shanghai Banking Corporation Limited | 489,093 | | 10,599 | | 2.17 | | 479,165 | | 12,984 | | 2.71 | |
| MENA | HSBC Bank Middle East Limited | 20,022 | | 614 | | 3.07 | | 21,244 | | 786 | | 3.70 | |
| North America | HSBC North America Holdings Inc. | 54,761 | | 1,545 | | 2.82 | | 66,642 | | 2,090 | | 3.14 | |
| HSBC Bank Canada | 51,847 | | 1,322 | | 2.55 | | 46,432 | | 1,306 | | 2.81 | |
| Latin America | Grupo Financiero HSBC, S.A. de C.V. | 18,496 | | 1,849 | | 10.00 | | 18,796 | | 1,898 | | 10.10 | |
| HSBC Argentina Holdings S.A. | 1,529 | | 452 | | 29.56 | | 1,619 | | 462 | | 28.54 | |
| | | | | | | |
| Other operations and intra-region eliminations | 21,360 | | 831 | | 3.89 | | 21,427 | | 873 | | 4.07 | |
| At 31 Dec | 1,060,658 | | 26,071 | | 2.46 | | 1,046,795 | | 29,391 | | 2.81 | |
| | | | | | |
| Reverse repurchase agreements – banks | | | | | | |
| Europe | HSBC Bank plc | 41,531 | | 137 | | 0.33 | | 36,307 | | 244 | | 0.67 | |
| HSBC UK Bank plc | 845 | | 1 | | 0.12 | | 85 | | — | | — | |
| Asia | The Hongkong and Shanghai Banking Corporation Limited | 56,515 | | 384 | | 0.68 | | 51,230 | | 462 | | 0.90 | |
| MENA | HSBC Bank Middle East Limited | 2,021 | | 16 | | 0.79 | | 1,573 | | 22 | | 1.40 | |
| North America | HSBC North America Holdings Inc. | 12,820 | | 8 | | 0.06 | | 15,048 | | 125 | | 0.83 | |
| HSBC Bank Canada | 1,499 | | 4 | | 0.27 | | 277 | | 2 | | 0.72 | |
| Latin America | Grupo Financiero HSBC, S.A. de C.V. | 1,214 | | 53 | | 4.37 | | 1,755 | | 103 | | 5.87 | |
| HSBC Argentina Holdings S.A. | 589 | | 205 | | 34.80 | | 292 | | 69 | | 23.63 | |
| | | | | | | |
| Other operations and intra-region eliminations | (6,956) | | (63) | | 0.91 | | (7,540) | | (73) | | 0.97 | |
| At 31 Dec | 110,078 | | 745 | | 0.68 | | 99,027 | | 954 | | 0.96 | |
| | | | | | |
| | | | | | | | | | | | | | | | | | | | | | | |
| | | | | | | |
| Assets (continued) |
| 2021 | 2020 |
| Average
balance | Interest
income | Yield | Average
balance | Interest
income | Yield |
| $m | $m | % | $m | $m | % |
| Reverse repurchase agreements – customers | | | | | | |
| Europe | HSBC Bank plc | 37,735 | | 120 | | 0.32 | | 51,652 | | 291 | | 0.56 | |
| HSBC UK Bank plc | 4,103 | | 8 | | 0.19 | | 3,004 | | 11 | | 0.37 | |
| Asia | The Hongkong and Shanghai Banking Corporation Limited | 26,276 | | 64 | | 0.24 | | 20,095 | | 123 | | 0.61 | |
| MENA | HSBC Bank Middle East Limited | 210 | | 1 | | 0.48 | | 3 | | — | | — | |
| North America | HSBC North America Holdings Inc. | 26,204 | | 35 | | 0.13 | | 50,486 | | 397 | | 0.79 | |
| HSBC Bank Canada | 3,994 | | 13 | | 0.33 | | 5,370 | | 43 | | 0.80 | |
| Latin America | Grupo Financiero HSBC, S.A. de C.V. | 664 | | 33 | | 4.97 | | 310 | | — | | — | |
| | | | | | | |
| | | | | | | |
| Other operations and intra-region eliminations | (3,018) | | — | | — | | (8,046) | | (54) | | 0.67 | |
| At 31 Dec | 96,168 | | 274 | | 0.28 | | 122,874 | | 811 | | 0.66 | |
| | | | | | | |
| Financial investments | | | | | | |
| Europe | HSBC Bank plc | 62,091 | | 693 | | 1.12 | | 65,848 | | 842 | | 1.28 | |
| HSBC UK Bank plc | 20,022 | | 180 | | 0.90 | | 32,450 | | 232 | | 0.71 | |
| Asia | The Hongkong and Shanghai Banking Corporation Limited | 255,500 | | 4,001 | | 1.57 | | 251,760 | | 4,653 | | 1.85 | |
| MENA | HSBC Bank Middle East Limited | 10,963 | | 61 | | 0.56 | | 9,918 | | 99 | | 1.00 | |
| North America | HSBC North America Holdings Inc. | 42,823 | | 651 | | 1.52 | | 52,611 | | 888 | | 1.69 | |
| HSBC Bank Canada | 12,315 | | 77 | | 0.63 | | 16,522 | | 183 | | 1.11 | |
| Latin America | Grupo Financiero HSBC, S.A. de C.V. | 4,219 | | 223 | | 5.29 | | 4,791 | | 246 | | 5.13 | |
| HSBC Argentina Holdings S.A. | 898 | | 303 | | 33.74 | | 903 | | 312 | | 34.55 | |
| | | | | | | |
| Other operations and intra-region eliminations | 30,009 | | 540 | | 1.80 | | 28,739 | | 688 | | 2.39 | |
| At 31 Dec | 438,840 | | 6,729 | | 1.53 | | 463,542 | | 8,143 | | 1.76 | |
| | | | | | | | | | | | | | | | | | | | | | | | | | | |
| | | |
| | | | |
| | | | | | | | | | |
| | | | | | | | | | |
| Other interest-earning assets | | | | | | | | | | |
| Europe | HSBC Bank plc | | 45,908 | | 995 | | 2.17 | | 54,323 | | 994 | | 1.83 | | | | |
| HSBC UK Bank plc | | 181 | | 21 | | 11.60 | | 317 | | 4 | | 1.26 | | | | |
| Asia | The Hongkong and Shanghai Banking Corporation Limited | | 8,566 | | 63 | | 0.74 | | 8,661 | | 94 | | 1.09 | | | | |
| MENA | HSBC Bank Middle East Limited | | 1 | | — | | — | | 29 | | 2 | | 6.90 | | | | |
| North America | HSBC North America Holdings Inc. | | 4,869 | | 66 | | 1.36 | | 8,001 | | 46 | | 0.57 | | | | |
| HSBC Bank Canada | | 421 | | 2 | | 0.48 | | 746 | | 3 | | 0.40 | | | | |
| Latin America | Grupo Financiero HSBC, S.A. de C.V. | | 731 | | 1 | | 0.14 | | 1,062 | | 3 | | 0.28 | | | | |
| HSBC Argentina Holdings S.A. | | 18 | | 171 | | 950.00 | | 20 | | 135 | | 675.00 | | | | |
| | | | | | | | | | | |
| Other operations and intra-region eliminations | | (7,604) | | (55) | | 0.72 | | (10,752) | | (142) | | 1.32 | | | | |
| At 31 Dec | | 53,091 | | 1,264 | | 2.38 | | 62,407 | | 1,139�� | | 1.83 | | | | |
| | | | | | | | | | |
| Total interest-earning assets | | | | | | | | | | |
| Europe | HSBC Bank plc | | 487,346 | | 4,328 | | 0.89 | | 474,108 | | 5,238 | | 1.10 | | | | |
| HSBC UK Bank plc | | 416,955 | | 6,975 | | 1.67 | | 341,059 | | 6,665 | | 1.95 | | | | |
| Asia | The Hongkong and Shanghai Banking Corporation Limited | | 922,947 | | 15,613 | | 1.69 | | 887,432 | | 18,999 | | 2.14 | | | | |
| MENA | HSBC Bank Middle East Limited | | 38,102 | | 728 | | 1.91 | | 37,604 | | 963 | | 2.56 | | | | |
| North America | HSBC North America Holdings Inc. | | 195,461 | | 2,415 | | 1.24 | | 217,217 | | 3,635 | | 1.67 | | | | |
| HSBC Bank Canada | | 82,464 | | 1,447 | | 1.75 | | 78,300 | | 1,613 | | 2.06 | | | | |
| Latin America | Grupo Financiero HSBC, S.A. de C.V. | | 27,467 | | 2,244 | | 8.17 | | 28,798 | | 2,354 | | 8.17 | | | | |
| HSBC Argentina Holdings S.A. | | 3,106 | | 1,131 | | 36.41 | | 2,877 | | 978 | | 33.99 | | | | |
| | | | | | | | | | | |
| Other operations and intra-region eliminations | | 35,665 | | 1,307 | | 3.66 | | 25,505 | | 1,311 | | 5.14 | | | | |
| At 31 Dec | | 2,209,513 | | 36,188 | | 1.64 | | 2,092,900 | | 41,756 | | 2.00 | | | | |
| | | | | | | | | | | | | | | | | | | | | | | |
| Equity and liabilities | | | | | | | | | |
| 2021 | 2020 | |
| Average
balance | Interest
expense | Cost | Average
balance | Interest
expense | Cost | | | |
| $m | $m | % | $m | $m | % | | | |
| Summary | | | | | | | | | |
| Interest-bearing liabilities measured at amortised cost (itemised below) | 1,816,518 | | 9,699 | | 0.53 | | 1,741,166 | | 14,178 | | 0.81 | | | | |
Trading liabilities and financial liabilities designated at fair value
(excluding own debt issued) | 143,258 | | 2,602 | | 1.82 | | 137,349 | | 2,356 | | 1.72 | | | | |
| Non-interest bearing current accounts | 318,305 | | N/A | N/A | 267,944 | | N/A | N/A | | | |
| Total equity and other non-interest bearing liabilities | 734,356 | | N/A | N/A | 790,480 | | N/A | N/A | | | |
| Total equity and liabilities | 3,012,437 | | 12,301 | | 0.41 | | 2,936,939 | | 16,534 | | 0.56 | | | | |
| Average cost on all interest-bearing liabilities | | | 0.63 | | | | 0.88 | | | | |
| | | | | | | | | | | | | | | | | | | | | | | | |
| Equity and liabilities (continued) |
| | 2021 | 2020 |
| | Average
balance | Interest
expense | Cost | Average
balance | Interest
expense | Cost |
| | $m | $m | % | $m | $m | % |
Deposits by banks1 | | | | | | | |
| Europe | HSBC Bank plc | | 45,238 | | 61 | | 0.13 | | 36,958 | | 120 | | 0.32 | |
| HSBC UK Bank plc | | 3,273 | | 4 | | 0.12 | | 91 | | — | | — | |
| Asia | The Hongkong and Shanghai Banking Corporation Limited | | 30,568 | | 67 | | 0.22 | | 30,929 | | 123 | | 0.40 | |
| MENA | HSBC Bank Middle East Limited | | 2,738 | | 29 | | 1.06 | | 2,998 | | 39 | | 1.30 | |
| North America | HSBC North America Holdings Inc. | | 8,124 | | 4 | | 0.05 | | 7,174 | | 9 | | 0.13 | |
| HSBC Bank Canada | | 931 | | — | | — | | 919 | | 1 | | 0.11 | |
| Latin America | Grupo Financiero HSBC, S.A. de C.V. | | 749 | | 50 | | 6.68 | | 949 | | 63 | | 6.64 | |
| HSBC Argentina Holdings S.A. | | 19 | | 5 | | 26.32 | | 24 | | 5 | | 20.83 | |
| | | | | | | | |
| Other operations and intra-region eliminations | | (15,969) | | (22) | | 0.14 | | (14,506) | | (30) | | 0.21 | |
| At 31 Dec | | 75,671 | | 198 | | 0.26 | | 65,536 | | 330 | | 0.50 | |
| | | | | | | |
| Debt Securities in issue – non trading | | | | | | | |
| Europe | HSBC Holdings plc | | 109,472 | | 2,748 | | 2.51 | | 106,742 | | 3,101 | | 2.91 | |
| HSBC Bank plc | | 53,265 | | 353 | | 0.66 | | 67,703 | | 719 | | 1.06 | |
| HSBC UK Bank plc | | 16,904 | | 396 | | 2.34 | | 14,900 | | 423 | | 2.84 | |
| Asia | The Hongkong and Shanghai Banking Corporation Limited | | 39,936 | | 652 | | 1.63 | | 40,602 | | 841 | | 2.07 | |
| MENA | HSBC Bank Middle East Limited | | 3,165 | | 38 | | 1.20 | | 3,214 | | 57 | | 1.77 | |
| North America | HSBC North America Holdings Inc. | | 21,496 | | 366 | | 1.70 | | 31,352 | | 730 | | 2.33 | |
| HSBC Bank Canada | | 12,846 | | 233 | | 1.81 | | 14,592 | | 287 | | 1.97 | |
| Latin America | Grupo Financiero HSBC, S.A. de C.V. | | 1,983 | | 127 | | 6.40 | | 3,451 | | 212 | | 6.14 | |
| HSBC Argentina Holdings S.A. | | 101 | | 6 | | 5.94 | | 161 | | 28 | | 17.39 | |
| | | | | | | | |
| Other operations and intra-region eliminations | | (66,031) | | (1,316) | | 1.99 | | (63,107) | | (1,454) | | 2.30 | |
| At 31 Dec | | 193,137 | | 3,603 | | 1.87 | | 219,610 | | 4,944 | | 2.25 | |
| | | | | | | | |
Customer accounts2 | | | | | | | |
| Europe | HSBC Bank plc | | 206,377 | | 378 | | 0.18 | | 184,462 | | 603 | | 0.33 | |
| HSBC UK Bank plc | | 288,821 | | 166 | | 0.06 | | 237,077 | | 378 | | 0.16 | |
| Asia | The Hongkong and Shanghai Banking Corporation Limited | | 683,482 | | 1,934 | | 0.28 | | 651,288 | | 3,300 | | 0.51 | |
| MENA | HSBC Bank Middle East Limited | | 9,234 | | 25 | | 0.27 | | 10,678 | | 84 | | 0.79 | |
| North America | HSBC North America Holdings Inc. | | 86,228 | | 195 | | 0.23 | | 86,470 | | 504 | | 0.58 | |
| HSBC Bank Canada | | 50,317 | | 170 | | 0.34 | | 47,175 | | 428 | | 0.91 | |
| Latin America | Grupo Financiero HSBC, S.A. de C.V. | | 17,627 | | 411 | | 2.33 | | 16,325 | | 535 | | 3.28 | |
| HSBC Argentina Holdings S.A. | | 2,910 | | 424 | | 14.57 | | 2,596 | | 307 | | 11.83 | |
| | | | | | | | |
| Other operations and intra-region eliminations | | 17,584 | | 396 | | 2.25 | | 18,178 | | 339 | | 1.86 | |
| At 31 Dec | | 1,362,580 | | 4,099 | | 0.30 | | 1,254,249 | | 6,478 | | 0.52 | |
| | | | | | | |
| Repurchase agreements – with banks | | | | | | | |
| Europe | HSBC Bank plc | | 20,083 | | 27 | | 0.13 | | 20,940 | | 83 | | 0.40 | |
| HSBC UK Bank plc | | 256 | | — | | — | | 133 | | — | | — | |
| Asia | The Hongkong and Shanghai Banking Corporation Limited | | 21,808 | | 141 | | 0.65 | | 16,764 | | 160 | | 0.95 | |
| MENA | HSBC Bank Middle East Limited | | 777 | | 1 | | 0.13 | | 332 | | 1 | | 0.30 | |
| North America | HSBC North America Holdings Inc. | | 6,611 | | 4 | | 0.06 | | 10,933 | | 73 | | 0.67 | |
| HSBC Bank Canada | | 357 | | 2 | | 0.56 | | 1,336 | | 21 | | 1.57 | |
| Latin America | Grupo Financiero HSBC, S.A. de C.V. | | 160 | | 8 | | 5.00 | | 597 | | 23 | | 3.85 | |
| HSBC Argentina Holdings S.A. | | 9 | | 1 | | 11.11 | | 24 | | 5 | | 20.83 | |
| | | | | | | | |
| Other operations and intra-region eliminations | | (9,284) | | (6) | | 0.06 | | (12,096) | | (75) | | 0.62 | |
| At 31 Dec | | 40,777 | | 178 | | 0.44 | | 38,963 | | 291 | | 0.75 | |
| | | | | | | | |
| Repurchase agreements – with customers | | | | | | | |
| Europe | HSBC Bank plc | | 25,190 | | 41 | | 0.16 | | 28,866 | | 177 | | 0.61 | |
| HSBC UK Bank plc | | 5,635 | | 1 | | 0.02 | | 3,977 | | 2 | | 0.05 | |
| Asia | The Hongkong and Shanghai Banking Corporation Limited | | 11,641 | | 47 | | 0.40 | | 6,701 | | 37 | | 0.55 | |
| MENA | HSBC Bank Middle East Limited | | — | | — | | — | | — | | — | | — | |
| North America | HSBC North America Holdings Inc. | | 28,917 | | 7 | | 0.02 | | 47,314 | | 328 | | 0.69 | |
| HSBC Bank Canada | | 3,742 | | 8 | | 0.21 | | 2,852 | | 20 | | 0.70 | |
| Latin America | Grupo Financiero HSBC, S.A. de C.V. | | 1,850 | | 80 | | 4.32 | | 1,777 | | 107 | | 6.02 | |
| HSBC Argentina Holdings S.A. | | — | | — | | — | | — | | — | | — | |
| Other operations and intra-region eliminations | | (3,551) | | 1 | | (0.03) | | (5,074) | | 1 | | (0.02) | |
| At 31 Dec | | 73,424 | | 185 | | 0.25 | | 86,413 | | 672 | | 0.78 | |
| | | | | | | | |
| | | | | | | | |
| | | | | | | | | | | | | | | | | | | | | | | | | | |
| Equity and liabilities (continued) | | | |
| | | |
| | | | | | | | | |
| | | | | | | | | |
| | | | | | | | | |
| | | | | | | | | | |
| | | | | | | | | | |
| | | | | | | | | | |
| | | | | | | | | | |
| | | | | | | | | | |
| | | | | | | | | | |
| | | | | | | | | | |
| | | | | | | | | | |
| | | | | | | | | | |
| | | | | | | | | | |
| | | | | | | | | |
| | | | | | | | | |
| | | | | | | | | |
| 2021 | 2020 | |
| Average
balance | Interest
expense | Cost | Average
balance | Interest
expense | Cost | | | |
| $m | $m | % | $m | $m | % | | | |
| Other interest-bearing liabilities | | | | | | | | | |
| Europe | HSBC Bank plc | 50,629 | | 1,059 | | 2.09 | | 60,780 | | 1,100 | | 1.81 | | | | |
| HSBC UK Bank plc | 399 | | 10 | | 2.51 | | 406 | | 22 | | 5.42 | | | | |
| Asia | The Hongkong and Shanghai Banking Corporation Limited | 12,616 | | 152 | | 1.20 | | 12,950 | | 166 | | 1.28 | | | | |
| MENA | HSBC Bank Middle East Limited | 30 | | 3 | | 10.00 | | 40 | | 3 | | 7.50 | | | | |
| North America | HSBC North America Holdings Inc. | 9,549 | | 32 | | 0.34 | | 7,289 | | 71 | | 0.97 | | | | |
| HSBC Bank Canada | 2,149 | | 53 | | 2.47 | | 1,960 | | 44 | | 2.24 | | | | |
| Latin America | Grupo Financiero HSBC, S.A. de C.V. | 159 | | 27 | | 16.98 | | 165 | | 27 | | 16.36 | | | | |
| HSBC Argentina Holdings S.A. | 17 | | 77 | | 452.94 | | 23 | | 56 | | 243.48 | | | | |
| | | | | | | | | | |
| Other operations and intra-region eliminations | (4,619) | | 23 | | (0.50) | | (7,218) | | (26) | | 0.36 | | | | |
| At 31 Dec | 70,929 | | 1,436 | | 2.02 | | 76,395 | | 1,463 | | 1.92 | | | | |
| | | | | | | | | |
| Total interest-bearing liabilities | | | | | | | | | |
| Europe | HSBC Holdings plc | 110,981 | | 2,749 | | 2.48 | | 108,612 | | 3,104 | | 2.86 | | | | |
| HSBC Bank plc | 400,782 | | 1,919 | | 0.48 | | 399,709 | | 2,802 | | 0.70 | | | | |
| HSBC UK Bank plc | 315,288 | | 577 | | 0.18 | | 256,584 | | 825 | | 0.32 | | | | |
| Asia | The Hongkong and Shanghai Banking Corporation Limited | 800,051 | | 2,993 | | 0.37 | | 759,234 | | 4,627 | | 0.61 | | | | |
| MENA | HSBC Bank Middle East Limited | 15,944 | | 96 | | 0.60 | | 17,262 | | 184 | | 1.07 | | | | |
| North America | HSBC North America Holdings Inc. | 160,924 | | 608 | | 0.38 | | 190,531 | | 1,715 | | 0.90 | | | | |
| HSBC Bank Canada | 70,342 | | 466 | | 0.66 | | 68,834 | | 801 | | 1.16 | | | | |
| Latin America | Grupo Financiero HSBC, S.A. de C.V. | 22,528 | | 703 | | 3.12 | | 23,264 | | 967 | | 4.16 | | | | |
| HSBC Argentina Holdings S.A. | 3,056 | | 513 | | 16.79 | | 2,828 | | 401 | | 14.18 | | | | |
| | | | | | | | | | |
| Other operations and intra-region eliminations | (83,378) | | (925) | | 1.11 | | (85,692) | | (1,248) | | 1.46 | | | | |
| At 31 Dec | 1,816,518 | | 9,699 | | 0.53 | | 1,741,166 | | 14,178 | | 0.81 | | | | |
1 This includes interest-bearing bank deposits only. See page 108 for an analysis of all bank deposits.
2 This includes interest-bearing customer accounts only. See page 109 for an analysis of all customer accounts.
| | | | | | | | | | | | | | |
Net interest margin1 |
| | 2021 | 2020 | 2019 |
| | % | % | % |
| Europe | HSBC Bank plc | 0.49 | | 0.51 | | 0.43 | |
| HSBC UK Bank plc | 1.53 | | 1.71 | | 2.05 | |
| Asia | The Hongkong and Shanghai Banking Corporation Limited | 1.37 | | 1.62 | | 2.02 | |
| MENA | HSBC Bank Middle East Limited | 1.66 | | 2.07 | | 3.03 | |
| North America | HSBC North America Holdings Inc. | 0.93 | | 0.88 | | 0.98 | |
| HSBC Bank Canada | 1.19 | | 1.03 | | 1.38 | |
| Latin America | Grupo Financiero HSBC, S.A. de C.V. | 5.61 | | 4.82 | | 4.54 | |
| HSBC Argentina Holdings S.A. | 19.93 | | 19.99 | | 20.88 | |
| | | | |
| At 31 Dec | 1.20 | | 1.32 | | 1.58 | |
1 Net interest margin is calculated as net interest income divided by average interest-earning assets.
| | | | | | | | | | | | | | |
| Distribution of average total assets |
| | 2021 | 2020 | 2019 |
| | % | % | % |
| Europe | HSBC Bank plc | 30.0 | | 32.0 | | 32.0 | |
| HSBC UK Bank plc | 14.0 | | 12.0 | | 12.0 | |
| Asia | The Hongkong and Shanghai Banking Corporation Limited | 42.0 | | 40.0 | | 40.0 | |
| MENA | HSBC Bank Middle East Limited | 2.0 | | 2.0 | | 1.0 | |
| North America | HSBC North America Holdings Inc. | 9.0 | | 11.0 | | 12.0 | |
| HSBC Bank Canada | 3.0 | | 3.0 | | 3.0 | |
| Latin America | Grupo Financiero HSBC, S.A. de C.V. | 1.0 | | 2.0 | | 2.0 | |
| | | | |
| | | | |
| Other operations and intra-region eliminations | (1.0) | | (2.0) | | (2.0) | |
| At 31 Dec | 100.0 | | 100.0 | | 100.0 | |
Analysis of changes in net interest income and net interest expense
The following tables allocate changes in net interest income and net interest expense between volume and rate for 2021 compared
with 2020, and for 2020 compared with 2019. We isolate rate variances and allocate any change arising from both volume and rate/volume to volume.
| | | | | | | | | | | | | | | | | | | | | | | | | | |
| Interest income |
| | | Increase/(decrease)
in 2021 compared
with 2020 | | Increase/(decrease)
in 2020 compared
with 2019 | |
| | 2021 | Volume | Rate | 2020 | Volume | Rate | 2019 |
| | $m | $m | $m | $m | $m | $m | $m |
| Short-term funds and loans and advances to banks | | | | | | | |
| Europe | HSBC Bank plc | 157 | | 45 | | (70) | | 182 | | 50 | | (244) | | 376 | |
| HSBC UK Bank plc | 132 | | 65 | | (44) | | 111 | | 40 | | (206) | | 277 | |
| Asia | The Hongkong and Shanghai Banking Corporation Limited | 502 | | 56 | | (237) | | 683 | | 94 | | (558) | | 1,147 | |
| MENA | HSBC Bank Middle East Limited | 34 | | 5 | | (25) | | 54 | | 18 | | (35) | | 71 | |
| North America | HSBC North America Holdings Inc. | 110 | | 60 | | (39) | | 89 | | 32 | | (250) | | 307 | |
| HSBC Bank Canada | 29 | | 9 | | (2) | | 22 | | 20 | | (2) | | 4 | |
| Latin America | Grupo Financiero HSBC, S.A. de C.V. | 85 | | 2 | | (21) | | 104 | | (21) | | (55) | | 180 | |
| | | | | | | | |
| | | | | | | | |
| Other operations and intra-region eliminations | 56 | | (29) | | 66 | | 19 | | 7 | | (37) | | 49 | |
| At 31 Dec | 1,105 | | 348 | | (507) | | 1,264 | | 365 | | (1,512) | | 2,411 | |
| | | | | | | | |
| Loans and advances to customers | | | | | | | |
| Europe | HSBC Bank plc | 2,226 | | (205) | | (254) | | 2,685 | | (18) | | (495) | | 3,198 | |
| HSBC UK Bank plc | 6,633 | | 641 | | (315) | | 6,307 | | 281 | | (624) | | 6,650 | |
| Asia | The Hongkong and Shanghai Banking Corporation Limited | 10,599 | | 202 | | (2,587) | | 12,984 | | 281 | | (3,560) | | 16,263 | |
| MENA | HSBC Bank Middle East Limited | 614 | | (38) | | (134) | | 786 | | 24 | | (238) | | 1,000 | |
| North America | HSBC North America Holdings Inc. | 1,545 | | (332) | | (213) | | 2,090 | | 18 | | (641) | | 2,713 | |
| HSBC Bank Canada | 1,322 | | 137 | | (121) | | 1,306 | | 99 | | (378) | | 1,585 | |
| Latin America | Grupo Financiero HSBC, S.A. de C.V. | 1,849 | | (30) | | (19) | | 1,898 | | (161) | | (289) | | 2,348 | |
| HSBC Argentina Holdings S.A. | 452 | | (27) | | 17 | | 462 | | (132) | | (58) | | 652 | |
| | | | | | | | |
| Other operations and intra-region eliminations | 831 | | (3) | | (39) | | 873 | | 57 | | (353) | | 1,169 | |
| At 31 Dec | 26,071 | | 344 | | (3,664) | | 29,391 | | 657 | | (6,844) | | 35,578 | |
| | | | | | | | |
| Reverse repurchase agreements – with banks | | | | | | | |
| Europe | HSBC Bank plc | 137 | | 16 | | (123) | | 244 | | 1 | | (282) | | 525 | |
| HSBC UK Bank plc | 1 | | 1 | | — | | — | | — | | — | | — | |
| Asia | The Hongkong and Shanghai Banking Corporation Limited | 384 | | 35 | | (113) | | 462 | | 108 | | (454) | | 808 | |
| MENA | HSBC Bank Middle East Limited | 16 | | 4 | | (10) | | 22 | | 10 | | (20) | | 32 | |
| North America | HSBC North America Holdings Inc. | 8 | | (1) | | (116) | | 125 | | (50) | | (524) | | 699 | |
| HSBC Bank Canada | 4 | | 3 | | (1) | | 2 | | 1 | | (7) | | 8 | |
| Latin America | Grupo Financiero HSBC, S.A. de C.V. | 53 | | (24) | | (26) | | 103 | | 38 | | (10) | | 75 | |
| HSBC Argentina Holdings S.A. | 205 | | 103 | | 33 | | 69 | | 61 | | (8) | | 16 | |
| | | | | | | | |
| Other operations and intra-region eliminations | (63) | | 5 | | 5 | | (73) | | (26) | | 315 | | (362) | |
| At 31 Dec | 745 | | 68 | | (277) | | 954 | | 54 | | (901) | | 1,801 | |
| | | | | | | | |
| Reverse repurchase agreements – with customers | | | | | | | |
| Europe | HSBC Bank plc | 120 | | (47) | | (124) | | 291 | | (58) | | (317) | | 666 | |
| HSBC UK Bank plc | 8 | | 2 | | (5) | | 11 | | (5) | | (20) | | 36 | |
| Asia | The Hongkong and Shanghai Banking Corporation Limited | 64 | | 15 | | (74) | | 123 | | 20 | | (119) | | 222 | |
| MENA | HSBC Bank Middle East Limited | 1 | | 1 | | — | | — | | — | | — | | — | |
| North America | HSBC North America Holdings Inc. | 35 | | (29) | | (333) | | 397 | | (31) | | (1,433) | | 1,861 | |
| HSBC Bank Canada | 13 | | (5) | | (25) | | 43 | | (3) | | (67) | | 113 | |
| Latin America | Grupo Financiero HSBC, S.A. de C.V. | 33 | | 18 | | 15 | | — | | — | | — | | — | |
| | | | | | | | |
| | | | | | | | |
| Other operations and intra-region eliminations | — | | — | | 54 | | (54) | | 28 | | (73) | | (9) | |
| At 31 Dec | 274 | | (70) | | (467) | | 811 | | (59) | | (2,019) | | 2,889 | |
| | | | | | | | |
| | | | | | | | | | | | | | | | | | | | | | | | | | |
| Interest income (continued) |
| | | Increase/(decrease)
in 2021 compared
with 2020 | | Increase/(decrease)
in 2020 compared
with 2019 | |
| | 2021 | Volume | Rate | 2020 | Volume | Rate | 2019 |
| | $m | $m | $m | $m | $m | $m | $m |
| Financial investments | | | | | | | |
| Europe | HSBC Bank plc | 693 | | (44) | | (105) | | 842 | | 25 | | (378) | | 1,195 | |
| HSBC UK Bank plc | 180 | | (114) | | 62 | | 232 | | 84 | | (154) | | 302 | |
| Asia | The Hongkong and Shanghai Banking Corporation Limited | 4,001 | | 53 | | (705) | | 4,653 | | 423 | | (1,601) | | 5,831 | |
| MENA | HSBC Bank Middle East Limited | 61 | | 6 | | (44) | | 99 | | 22 | | (96) | | 173 | |
| North America | HSBC North America Holdings Inc. | 651 | | (148) | | (89) | | 888 | | 38 | | (352) | | 1,202 | |
| HSBC Bank Canada | 77 | | (27) | | (79) | | 183 | | (29) | | (159) | | 371 | |
| Latin America | Grupo Financiero HSBC, S.A. de C.V. | 223 | | (31) | | 8 | | 246 | | (117) | | (103) | | 466 | |
| HSBC Argentina Holdings S.A. | 303 | | (2) | | (7) | | 312 | | (20) | | (194) | | 526 | |
| | | | | | | | |
| Other operations and intra-region eliminations | 540 | | 22 | | (170) | | 688 | | 231 | | (182) | | 639 | |
| At 31 Dec | 6,729 | | (348) | | (1,066) | | 8,143 | | 782 | | (3,344) | | 10,705 | |
| | | | | | | | | | | | | | | | | | | | | | | | | | |
| Interest expense |
| | | Increase/(decrease)
in 2021 compared
with 2020 | | Increase/(decrease)
in 2020 compared
with 2019 | |
| | 2021 | Volume | Rate | 2020 | Volume | Rate | 2019 |
| | $m | $m | $m | $m | $m | $m | $m |
| Deposits by banks | | | | | | | |
| Europe | HSBC Bank plc | 61 | | 11 | | (70) | | 120 | | 26 | | (152) | | 246 | |
| HSBC UK Bank plc | 4 | | 4 | | — | | — | | — | | (25) | | 25 | |
| Asia | The Hongkong and Shanghai Banking Corporation Limited | 67 | | — | | (56) | | 123 | | 22 | | (189) | | 290 | |
| MENA | HSBC Bank Middle East Limited | 29 | | (3) | | (7) | | 39 | | 14 | | (28) | | 53 | |
| North America | HSBC North America Holdings Inc. | 4 | | 1 | | (6) | | 9 | | 1 | | (37) | | 45 | |
| HSBC Bank Canada | — | | — | | (1) | | 1 | | — | | (1) | | 2 | |
| Latin America | Grupo Financiero HSBC, S.A. de C.V. | 50 | | (13) | | — | | 63 | | (34) | | 4 | | 93 | |
| HSBC Argentina Holdings S.A. | 5 | | (1) | | 1 | | 5 | | (8) | | (5) | | 18 | |
| | | | | | | | |
| Other operations and intra-region eliminations | (22) | | (2) | | 10 | | (30) | | (3) | | 43 | | (70) | |
| At 31 Dec | 198 | | 25 | | (157) | | 330 | | 69 | | (441) | | 702 | |
| | | | | | | | |
| Customer accounts | | | | | | | |
| Europe | HSBC Bank plc | 378 | | 52 | | (277) | | 603 | | 28 | | (853) | | 1,428 | |
| HSBC UK Bank plc | 166 | | 25 | | (237) | | 378 | | 43 | | (471) | | 806 | |
| Asia | The Hongkong and Shanghai Banking Corporation Limited | 1,934 | | 132 | | (1,498) | | 3,300 | | 170 | | (2,390) | | 5,520 | |
| MENA | HSBC Bank Middle East Limited | 25 | | (3) | | (56) | | 84 | | 11 | | (61) | | 134 | |
| North America | HSBC North America Holdings Inc. | 195 | | (6) | | (303) | | 504 | | 120 | | (488) | | 872 | |
| HSBC Bank Canada | 170 | | 11 | | (269) | | 428 | | 51 | | (265) | | 642 | |
| Latin America | Grupo Financiero HSBC, S.A. de C.V. | 411 | | 31 | | (155) | | 535 | | (12) | | (285) | | 832 | |
| HSBC Argentina Holdings S.A. | 424 | | 46 | | 71 | | 307 | | (29) | | (218) | | 554 | |
| | | | | | | | |
| Other operations and intra-region eliminations | 396 | | (14) | | 71 | | 339 | | 106 | | (217) | | 450 | |
| At 31 Dec | 4,099 | | 380 | | (2,759) | | 6,478 | | 528 | | (5,288) | | 11,238 | |
| | | | | | | | | | | | | | | | | | | | | | | | | | |
| Interest expense (continued) |
| | | Increase/(decrease)
in 2021 compared
with 2020 | | Increase/(decrease)
in 2020 compared
with 2019 | |
| | 2021 | Volume | Rate | 2020 | Volume | Rate | 2019 |
| | $m | $m | $m | $m | $m | $m | $m |
| Repurchase agreements – with banks | | | | | | | |
| Europe | HSBC Bank plc | 27 | | 1 | | (57) | | 83 | | (13) | | (212) | | 308 | |
| HSBC UK Bank plc | — | | — | | — | | — | | — | | (4) | | 4 | |
| Asia | The Hongkong and Shanghai Banking Corporation Limited | 141 | | 31 | | (50) | | 160 | | 16 | | (244) | | 388 | |
| MENA | HSBC Bank Middle East Limited | 1 | | 1 | | (1) | | 1 | | 1 | | (2) | | 2 | |
| North America | HSBC North America Holdings Inc. | 4 | | (2) | | (67) | | 73 | | (31) | | (363) | | 467 | |
| HSBC Bank Canada | 2 | | (6) | | (13) | | 21 | | (10) | | (40) | | 71 | |
| Latin America | Grupo Financiero HSBC, S.A. de C.V. | 8 | | (22) | | 7 | | 23 | | (119) | | (129) | | 271 | |
| HSBC Argentina Holdings S.A. | 1 | | (2) | | (2) | | 5 | | (1) | | (7) | | 13 | |
| | | | | | | | |
| Other operations and intra-region eliminations | (6) | | 1 | | 68 | | (75) | | (10) | | 459 | | (524) | |
| At 31 Dec | 178 | | 8 | | (121) | | 291 | | (83) | | (626) | | 1,000 | |
| | | | | | | | |
| Repurchase agreements – with customers | | | | | | | |
| Europe | HSBC Bank plc | 41 | | (6) | | (130) | | 177 | | (66) | | (385) | | 628 | |
| HSBC UK Bank plc | 1 | | — | | (1) | | 2 | | 2 | | (4) | | 4 | |
| Asia | The Hongkong and Shanghai Banking Corporation Limited | 47 | | 20 | | (10) | | 37 | | (8) | | (38) | | 83 | |
| MENA | HSBC Bank Middle East Limited | — | | — | | — | | — | | — | | — | | — | |
| North America | HSBC North America Holdings Inc. | 7 | | (4) | | (317) | | 328 | | (113) | | (1,602) | | 2,043 | |
| HSBC Bank Canada | 8 | | 2 | | (14) | | 20 | | (15) | | (43) | | 78 | |
| Latin America | Grupo Financiero HSBC, S.A. de C.V. | 80 | | 3 | | (30) | | 107 | | (2) | | (78) | | 187 | |
| HSBC Argentina Holdings S.A. | — | | — | | — | | — | | — | | — | | — | |
| | | | | | | | |
| Other operations and intra-region eliminations | 1 | | (1) | | 1 | | 1 | | (1) | | 2 | | — | |
| At 31 Dec | 185 | | (29) | | (458) | | 672 | | (191) | | (2,160) | | 3,023 | |
| | | | | | | | |
| | | | | | | | |
| Debt securities in issue – non trading | | | | | | | |
| Europe | HSBC Holdings | 2,748 | | 74 | | (427) | | 3,101 | | 208 | | (904) | | 3,797 | |
| HSBC Bank plc | 353 | | (95) | | (271) | | 719 | | (17) | | (402) | | 1,138 | |
| HSBC UK Bank plc | 396 | | 48 | | (75) | | 423 | | 63 | | 6 | | 354 | |
| Asia | The Hongkong and Shanghai Banking Corporation Limited | 652 | | (10) | | (179) | | 841 | | 68 | | (429) | | 1,202 | |
| MENA | HSBC Bank Middle East Limited | 38 | | (1) | | (18) | | 57 | | 3 | | (57) | | 111 | |
| North America | HSBC North America Holdings Inc. | 366 | | (166) | | (198) | | 730 | | (38) | | (488) | | 1,256 | |
| HSBC Bank Canada | 233 | | (31) | | (23) | | 287 | | 60 | | (84) | | 311 | |
| Latin America | Grupo Financiero HSBC, S.A. de C.V. | 127 | | (94) | | 9 | | 212 | | 35 | | (35) | | 212 | |
| HSBC Argentina Holdings S.A. | 6 | | (4) | | (18) | | 28 | | (21) | | (45) | | 94 | |
| | | | | | | | |
| Other operations and intra-region eliminations | (1,316) | | (58) | | 196 | | (1,454) | | (118) | | 617 | | (1,953) | |
| At 31 Dec | 3,603 | | (506) | | (835) | | 4,944 | | 196 | | (1,774) | | 6,522 | |
.
Loan maturity and interest sensitivity analysis
At 31 December 2021, the analysis of loan maturity and interest sensitivity by loan type on a contractual repayment basis was as follows.
| | | | | | | | | | |
| | | | | | Total |
| | | | | | $m |
| Maturity of 1 year or less | | | | | | |
| Loans and advances to banks | | | | | | 74,533 | |
| Loans and advances to customers | | | | | | 404,010 | |
| | | | | | |
| | | | | | |
| | | | | | 478,543 | |
| Maturity after 1 year but within 5 years | | | | | | |
| Loans and advances to banks | | | | | | 8,459 | |
| Loans and advances to customers | | | | | | 331,901 | |
| | | | | | |
| | | | | | |
| | | | | | 340,360 | |
| Interest rate sensitivity of loans and advances to banks | | | | | | |
| Fixed interest rate | | | | | | 5,710 | |
| Variable interest rate | | | | | | 2,749 | |
| | | | | | 8,459 | |
| Interest rate sensitivity of loans and advances to customers | | | | | | |
| Fixed interest rate | | | | | | 94,792 | |
| Variable interest rate | | | | | | 237,109 | |
| | | | | | 331,901 | |
| Maturity after 5 years but within 15 years | | | | | | |
| Loans and advances to banks | | | | | | 161 | |
| Loans and advances to customers | | | | | | 176,310 | |
| | | | | | |
| | | | | | |
| | | | | | 176,471 | |
| Interest rate sensitivity of loans and advances to banks | | | | | | |
| Fixed interest rate | | | | | | 161 | |
| Variable interest rate | | | | | | — | |
| | | | | | 161 | |
| Interest rate sensitivity of loans and advances to customers | | | | | | |
| Fixed interest rate | | | | | | 77,000 | |
| Variable interest rate | | | | | | 99,310 | |
| | | | | | 176,310 | |
| Maturity after 15 years | | | | | | |
| Loans and advances to banks | | | | | | — | |
| Loans and advances to customers | | | | | | 145,010 | |
| | | | | | 145,010 | |
| Interest rate sensitivity of loans and advances to banks | | | | | | |
| Fixed interest rate | | | | | | — | |
| Variable interest rate | | | | | | — | |
| | | | | | — | |
| Interest rate sensitivity of loans and advances to customers | | | | | | |
| Fixed interest rate | | | | | | 64,016 | |
| Variable interest rate | | | | | | 80,994 | |
| | | | | | 145,010 | |
Deposits
The following tables summarise the average amount of bank deposits, customer deposits and certificates of deposit (‘CDs’) and other money market instruments (that are included within ‘Debt securities in issue’ in the balance sheet), together with the average interest rates paid thereon for each of the past two years.
The geographical analysis of average deposits is based on the location of the office in which the deposits are recorded and excludes balances with HSBC companies.
| | | | | | | | | | | | | | | | |
| Deposits by banks | | | | | | |
| 2021 | 2020 | |
| Average
balance | Average
rate | Average
balance | Average
rate | | |
| $m | % | $m | % | | |
| Europe | 49,069 | | | 38,299 | | | | |
| – demand and other – non-interest bearing | 5,443 | | — | | 5,100 | | — | | | |
| – demand – interest bearing | 18,044 | | 0.2 | | 14,492 | | 0.2 | | | |
| – time | 25,577 | | 0.1 | | 18,701 | | 0.5 | | | |
| – other | 5 | | — | | 6 | | — | | | |
| Asia | 29,785 | | | 29,791 | | | | |
| – demand and other – non-interest bearing | 4,390 | | — | | 3,787 | | — | | | |
| – demand – interest bearing | 19,623 | | 0.2 | | 19,381 | | 0.3 | | | |
| – time | 5,770 | | 0.5 | | 6,623 | | 0.7 | | | |
| – other | 2 | | — | | — | | — | | | |
| Middle East and North Africa | 1,631 | | | 1,528 | | | | |
| – demand and other – non-interest bearing | 235 | | — | | 220 | | — | | | |
| – demand – interest bearing | 426 | | 0.2 | | 280 | | 0.4 | | | |
| – time | 948 | | 1.3 | | 969 | | 1.7 | | | |
| – other | 22 | | — | | 59 | | — | | | |
| North America | 6,337 | | | 5,493 | | | | |
| – demand and other – non-interest bearing | 1,872 | | — | | 1,471 | | — | | | |
| – demand – interest bearing | 4,391 | | 0.1 | | 3,617 | | 0.2 | | | |
| – time | 74 | | — | | 405 | | 0.7 | | | |
| – other | — | | — | | — | | — | | | |
| Latin America | 790 | | | 1,005 | | | | |
| – demand and other – non-interest bearing | 1 | | — | | 2 | | — | | | |
| – demand – interest bearing | 66 | | 10.6 | | 71 | | 9.9 | | | |
| – time | 723 | | 6.8 | | 932 | | 6.7 | | | |
| – other | — | | — | | — | | — | | | |
| Total | 87,612 | | | 76,116 | | | | |
| – demand and other – non-interest bearing | 11,941 | | — | | 10,580 | | — | | | |
| – demand – interest bearing | 42,550 | | 0.2 | | 37,841 | | 0.3 | | | |
| – time | 33,092 | | 0.4 | | 27,630 | | 0.8 | | | |
| – other | 29 | | — | | 65 | | — | | | |
| | | | | | | | | | | | | | | | |
| Customer accounts |
| 2021 | 2020 | |
| Average
balance | Average
rate | Average
balance | Average
rate | | |
| $m | % | $m | % | | |
| Europe | 665,553 | | | 568,003 | | | | |
| – demand and other – non-interest bearing | 171,066 | | — | | 145,363 | | — | | | |
| – demand – interest bearing | 414,592 | | 0.1 | | 343,374 | | 0.2 | | |
| – savings | 54,670 | | 0.2 | | 52,584 | | 0.5 | | |
| – time | 24,519 | | 0.3 | | 25,755 | | 0.6 | | |
| – other | 706 | | 0.1 | | 927 | | 0.2 | | |
| Asia | 769,581 | | | 722,371 | | | | |
| – demand and other – non-interest bearing | 86,691 | | — | | 71,629 | | — | | | |
| – demand – interest bearing | 564,962 | | 0.1 | | 486,903 | | 0.2 | | |
| – savings | 101,749 | | 1.3 | | 138,508 | | 1.6 | | |
| – time | 16,173 | | 0.4 | | 25,324 | | 1.1 | | |
| – other | 6 | | — | | 7 | | 14.0 | | |
| Middle East and North Africa | 41,704 | | | 40,559 | | | | |
| – demand and other – non-interest bearing | 23,407 | | — | | 21,238 | | — | | | |
| – demand – interest bearing | 8,868 | | 0.3 | | 7,837 | | 0.4 | | |
| – savings | 9,425 | | 4.0 | | 11,478 | | 3.0 | | |
| – time | 4 | | — | | 6 | | — | | |
| | | | | | |
| North America | 180,828 | | | 169,636 | | | | |
| – demand and other – non-interest bearing | 36,003 | | — | | 28,486 | | — | | | |
| – demand – interest bearing | 55,460 | | 0.2 | | 49,422 | | 0.3 | | |
| – savings | 86,277 | | 0.3 | | 84,882 | | 0.8 | | |
| – time | 3,088 | | 0.3 | | 6,846 | | 1.3 | | |
| | | | | | |
| Latin America | 27,916 | | | 25,681 | | | | |
| – demand and other – non-interest bearing | 5,835 | | — | | 5,285 | | — | | | |
| – demand – interest bearing | 12,301 | | 2.9 | | 10,739 | | 3.1 | | |
| – savings | 2,884 | | 10.3 | | 2,746 | | 8.9 | | |
| – time | 6,896 | | 2.8 | | 6,911 | | 4.0 | | |
| | | | | | |
| Total | 1,685,582 | | | 1,526,250 | | | | |
| – demand and other – non-interest bearing | 323,002 | | — | | 272,001 | | — | | | |
| – demand – interest bearing | 1,056,183 | | 0.1 | | 898,275 | | 0.2 | | |
| – savings | 255,005 | | 0.9 | | 290,198 | | 1.3 | | |
| – time | 50,680 | | 0.7 | | 64,842 | | 1.2 | | |
| – other | 712 | | 0.1 | | 934 | | 0.3 | | |
| | |
| Net Charge-offs to average loans |
The following table provides the net charge-offs to average loans for loans and advances to banks and customers.
| | | | | | | | |
| Net charge-offs to average loans |
| 2021 | 2020 |
| % | % |
| Loans and advances to banks | 0.00 | 0.00 |
| Loans and advances to customers | 0.21 | | 0.25 |
Allowances for credit losses to total loans are presented in Summary of credit risk (excluding debt instruments measured at FVOCI) by stage distribution and ECL coverage by industry sector at page 178.
Estimate of uninsured deposits and uninsured time deposits
HSBC provides deposit services to customers across the many countries in which we operate and are therefore subject to differing national and state deposit insurance regimes. Uninsured deposits are presented on an estimated basis using the same methodologies and assumptions inherent in our liquidity reporting requirements to our primary regulator, the Prudential Regulation Authority.
The insured status of a deposit is determined on the basis of individual insurance limits enacted within local regulations.
At 31 December 2021, the amount of uninsured deposit was $1.4tn (31 December 2020: $1.3tn).
Uninsured time deposits are uninsured deposits which are subject to contractual maturity requirements prior to withdrawal. Amounts are presented on a residual contractual maturity basis and exclude overnight deposits where contractual requirements are imminently satisfied.
| | | | | | | | | | | | | | | | | |
| Maturity analysis of uninsured time deposits |
| At 31 Dec 2021 |
| 3 months
or less | After 3 months
but within
6 months | After 6 months
but within
12 months | After
12 months | Total |
| $m | $m | $m | $m | $m |
| | | | | |
| | | | | |
| | | | | |
| Uninsured time deposits | 149,939 | | 8,989 | | 8,042 | | 18,872 | | 185,842 | |
| | | | | |
Global businesses and geographical regions |
| Page |
| Summary | |
| Reconciliation of reported and adjusted items – global businesses | |
| Reconciliation of reported and adjusted risk-weighted assets | |
| Supplementary tables for WPB and GBM | |
| Analysis of reported results by geographical regions | |
| Reconciliation of reported and adjusted items – geographical regions | |
| Analysis by country | |
| |
.
The Group Chief Executive, supported by the rest of the Group Executive Committee (‘GEC'), reviews operating activity on a number of bases, including by global business and geographical region. Our global businesses – Wealth and Personal Banking,
Commerical Banking, and Global Banking and Markets – along with Corporate Centre are our reportable segments under IFRS 8 ‘Operating Segments’ and are presented below and in Note 10: Segmental analysis on page 369.
Geographical information is classified by the location of the principal operations of the subsidiary or, for The Hongkong and Shanghai Banking Corporation Limited, HSBC Bank plc, HSBC UK Bank plc, HSBC Bank Middle East Limited and HSBC Bank USA, by the location of the branch responsible for reporting the results or providing funding.
The expense of the UK bank levy is included in the Europe geographical region as HSBC regards the levy as a cost of being headquartered in the UK. From 2021, the UK bank levy was partially allocated to global businesses, which was previously retained in Corporate Centre. Comparative periods have not been re-presented.
The results of geographical regions are presented on a reported basis on page 120 and an adjusted basis on page 122.
| | |
| Reconciliation of reported and adjusted items – global businesses |
Supplementary unaudited analysis of significant items by global business is presented below.
| | | | | | | | | | | | | | | | | | |
|
| | 2021 |
| | Wealth and Personal Banking | Commercial
Banking | Global
Banking and
Markets | Corporate Centre | Total |
| | $m | $m | $m | $m | $m |
Revenue1 | | | | | | |
| Reported | | 22,117 | | 13,431 | | 14,588 | | (584) | | 49,552 | |
| Significant items | | (7) | | (16) | | 414 | | 147 | | 538 | |
| – customer redress programmes | | 7 | | (18) | | — | | — | | (11) | |
| | | | | | |
– fair value movements on financial instruments2 | | — | | (1) | | 19 | | 224 | | 242 | |
– restructuring and other related costs3 | | (14) | | 3 | | 395 | | (77) | | 307 | |
| Adjusted | | 22,110 | | 13,415 | | 15,002 | | (437) | | 50,090 | |
| ECL | | | | | | |
| Reported | | 288 | | 300 | | 337 | | 3 | | 928 | |
| Adjusted | | 288 | | 300 | | 337 | | 3 | | 928 | |
| Operating expenses | | | | | | |
| Reported | | (16,306) | | (7,055) | | (10,203) | | (1,056) | | (34,620) | |
| Significant items | | 922 | | 82 | | 197 | | 1,271 | | 2,472 | |
| – customer redress programmes | | 39 | | 1 | | — | | 9 | | 49 | |
| | | | | | |
| – impairment of goodwill and other intangibles | | 587 | | — | | — | | — | | 587 | |
| | | | | | |
| – restructuring and other related costs | | 296 | | 81 | | 197 | | 1,262 | | 1,836 | |
| | | | | | |
| Adjusted | | (15,384) | | (6,973) | | (10,006) | | 215 | | (32,148) | |
| Share of profit in associates and joint ventures | | | | | | |
| Reported | | 34 | | 1 | | — | | 3,011 | | 3,046 | |
| | | | | | |
| | | | | | |
| Adjusted | | 34 | | 1 | | — | | 3,011 | | 3,046 | |
| Profit before tax | | | | | | |
| Reported | | 6,133 | | 6,677 | | 4,722 | | 1,374 | | 18,906 | |
| Significant items | | 915 | | 66 | | 611 | | 1,418 | | 3,010 | |
| – revenue | | (7) | | (16) | | 414 | | 147 | | 538 | |
| | | | | | |
| – operating expenses | | 922 | | 82 | | 197 | | 1,271 | | 2,472 | |
| | | | | | |
| | | | | | |
| Adjusted | | 7,048 | | 6,743 | | 5,333 | | 2,792 | | 21,916 | |
| Loans and advances to customers (net) | | | | | | |
| Reported | | 488,786 | | 349,126 | | 207,162 | | 740 | | 1,045,814 | |
| Adjusted | | 488,786 | | 349,126 | | 207,162 | | 740 | | 1,045,814 | |
| Customer accounts | | | | | | |
| Reported | | 859,029 | | 506,688 | | 344,205 | | 652 | | 1,710,574 | |
| Adjusted | | 859,029 | | 506,688 | | 344,205 | | 652 | | 1,710,574 | |
1 Net operating income before change in expected credit losses and other credit impairment charges, also referred to as revenue.
2 Includes fair value movements on non-qualifying hedges and debt valuation adjustments on derivatives.
3 Comprises losses associated with the RWA reduction commitments and gains relating to the business update in February 2020.
| | | | | | | | | | | | | | | | | | |
| Reconciliation of reported and adjusted items (continued) |
| | 2020 |
| | Wealth and Personal Banking | Commercial
Banking | Global
Banking and
Markets | Corporate
Centre | Total |
| | $m | $m | $m | $m | $m |
Revenue1 | | | | | | |
| Reported | | 21,999 | | 13,294 | | 14,994 | | 142 | | 50,429 | |
| Currency translation | | 560 | | 405 | | 456 | | (28) | | 1,393 | |
| Significant items | | 12 | | 19 | | 318 | | (401) | | (52) | |
| – customer redress programmes | | 5 | | 16 | | — | | — | | 21 | |
| – disposals, acquisitions and investment in new businesses | | 9 | | — | | — | | 1 | | 10 | |
– fair value movements on financial instruments2 | | — | | 1 | | 2 | | (267) | | (264) | |
– restructuring and other related costs3 | | — | | 1 | | 307 | | (138) | | 170 | |
| – currency translation on significant items | | (2) | | 1 | | 9 | | 3 | | 11 | |
| Adjusted | | 22,571 | | 13,718 | | 15,768 | | (287) | | 51,770 | |
| ECL | | | | | | |
| Reported | | (2,855) | | (4,754) | | (1,209) | | 1 | | (8,817) | |
| Currency translation | | (150) | | (235) | | (80) | | — | | (465) | |
| Adjusted | | (3,005) | | (4,989) | | (1,289) | | 1 | | (9,282) | |
| Operating expenses | | | | | | |
| Reported | | (15,446) | | (6,900) | | (10,169) | | (1,917) | | (34,432) | |
| Currency translation | | (432) | | (214) | | (451) | | 25 | | (1,072) | |
| Significant items | | 435 | | 217 | | 980 | | 1,463 | | 3,095 | |
| | | | | | |
| – customer redress programmes | | (64) | | 1 | | — | | 9 | | (54) | |
| | | | | | |
| – impairment of goodwill and other intangibles | | 294 | | 45 | | 577 | | 174 | | 1,090 | |
| – past service costs of guaranteed minimum pension benefits equalisation | | — | | — | | — | | 17 | | 17 | |
– restructuring and other related costs4 | | 192 | | 165 | | 326 | | 1,225 | | 1,908 | |
| – settlements and provisions in connection with legal and regulatory matters | | — | | — | | 2 | | 10 | | 12 | |
| – currency translation on significant items | | 13 | | 6 | | 75 | | 28 | | 122 | |
| Adjusted | | (15,443) | | (6,897) | | (9,640) | | (429) | | (32,409) | |
| Share of profit in associates and joint ventures | | | | | | |
| Reported | | 6 | | (1) | | — | | 1,592 | | 1,597 | |
| Currency translation | | 1 | | — | | — | | 132 | | 133 | |
| Significant items | | — | | — | | — | | 462 | | 462 | |
– impairment of goodwill5 | | — | | — | | — | | 462 | | 462 | |
| – currency translation on significant items | | — | | — | | — | | — | | — | |
| Adjusted | | 7 | | (1) | | — | | 2,186 | | 2,192 | |
| Profit/(loss) before tax | | | | | | |
| Reported | | 3,704 | | 1,639 | | 3,616 | | (182) | | 8,777 | |
| Currency translation | | (21) | | (44) | | (75) | | 129 | | (11) | |
| Significant items | | 447 | | 236 | | 1,298 | | 1,524 | | 3,505 | |
| – revenue | | 12 | | 19 | | 318 | | (401) | | (52) | |
| – operating expenses | | 435 | | 217 | | 980 | | 1,463 | | 3,095 | |
| – share of profit in associates and joint ventures | | — | | — | | — | | 462 | | 462 | |
| Adjusted | | 4,130 | | 1,831 | | 4,839 | | 1,471 | | 12,271 | |
| Loans and advances to customers (net) | | | | | | |
| Reported | | 469,186 | | 343,182 | | 224,364 | | 1,255 | | 1,037,987 | |
| Currency translation | | (6,900) | | (4,989) | | (3,672) | | (24) | | (15,585) | |
| Adjusted | | 462,286 | | 338,193 | | 220,692 | | 1,231 | | 1,022,402 | |
| Customer accounts | | | | | | |
| Reported | | 834,759 | | 470,428 | | 336,983 | | 610 | | 1,642,780 | |
| Currency translation | | (10,768) | | (6,048) | | (5,819) | | (17) | | (22,652) | |
| Adjusted | | 823,991 | | 464,380 | | 331,164 | | 593 | | 1,620,128 | |
1 Net operating income before change in expected credit losses and other credit impairment charges, also referred to as revenue.
2 Includes fair value movements on non-qualifying hedges and debt valuation adjustments on derivatives.
3 Comprises losses associated with the RWA reduction commitments and gains relating to the business update in February 2020.
4 Includes impairment of software intangible assets of $189m (of the total software intangible asset impairment of $1,347m) and impairment of tangible assets of $197m.
5 In 2020, The Saudi British Bank ('SABB'), an associate of HSBC, impaired the goodwill that arose following the merger with Alawwal bank in 2019. HSBC's post-tax share of the goodwill impairment was $462m.
| | | | | | | | | | | | | | | | | | | |
| Reconciliation of reported and adjusted items (continued) |
| | 2019 |
| | Wealth and Personal Banking | Commercial
Banking | Global
Banking and
Markets | | Corporate
Centre | Total |
| | $m | $m | $m | | $m | $m |
Revenue1 | | | | | | | |
| Reported | | 25,552 | | 15,256 | | 14,894 | | | 396 | | 56,098 | |
| Currency translation | | 358 | | 327 | | 303 | | | 22 | | 1,010 | |
| Significant items | | 230 | | 11 | | 85 | | | (999) | | (673) | |
| – customer redress programmes | | 155 | | 7 | | — | | | 1 | | 163 | |
– disposals, acquisitions and investment in new businesses2 | | 52 | | — | | — | | | (820) | | (768) | |
– fair value movements on financial instruments3 | | 7 | | 4 | | 84 | | | (179) | | (84) | |
| – currency translation on significant items | | 16 | | — | | 1 | | | (1) | | 16 | |
| Adjusted | | 26,140 | | 15,594 | | 15,282 | | | (581) | | 56,435 | |
| ECL | | | | | | | |
| Reported | | (1,437) | | (1,192) | | (162) | | | 35 | | (2,756) | |
| Currency translation | | 61 | | (2) | | 7 | | | 3 | | 69 | |
| Adjusted | | (1,376) | | (1,194) | | (155) | | | 38 | | (2,687) | |
| Operating expenses | | | | | | | |
| Reported | | (17,351) | | (9,905) | | (13,790) | | | (1,303) | | (42,349) | |
| Currency translation | | (431) | | (184) | | (337) | | | (29) | | (981) | |
| Significant items | | 1,959 | | 3,061 | | 4,236 | | | 511 | | 9,767 | |
– costs of structural reform4 | | — | | 4 | | 42 | | | 112 | | 158 | |
| – customer redress programmes | | 1,264 | | 17 | | — | | | — | | 1,281 | |
| – goodwill impairment | | 431 | | 2,956 | | 3,962 | | | — | | 7,349 | |
| | | | | | | |
| | | | | | | |
| – restructuring and other related costs | | 180 | | 51 | | 217 | | | 379 | | 827 | |
| – settlements and provisions in connection with legal and regulatory matters | | (69) | | — | | 2 | | | 6 | | (61) | |
| – currency translation on significant items | | 153 | | 33 | | 13 | | | 14 | | 213 | |
| Adjusted | | (15,823) | | (7,028) | | (9,891) | | | (821) | | (33,563) | |
| Share of profit in associates and joint ventures | | | | | | | |
| Reported | | 55 | | — | | — | | | 2,299 | | 2,354 | |
| Currency translation | | (1) | | 1 | | 1 | | | 141 | | 142 | |
| Adjusted | | 54 | | 1 | | 1 | | | 2,440 | | 2,496 | |
| Profit before tax | | | | | | | |
| Reported | | 6,819 | | 4,159 | | 942 | | | 1,427 | | 13,347 | |
| Currency translation | | (13) | | 142 | | (26) | | | 137 | | 240 | |
| Significant items | | 2,189 | | 3,072 | | 4,321 | | | (488) | | 9,094 | |
| – revenue | | 230 | | 11 | | 85 | | | (999) | | (673) | |
| – operating expenses | | 1,959 | | 3,061 | | 4,236 | | | 511 | | 9,767 | |
| Adjusted | | 8,995 | | 7,373 | | 5,237 | | | 1,076 | | 22,681 | |
| Loans and advances to customers (net) | | | | | | | |
| Reported | | 443,025 | | 346,105 | | 246,492 | | | 1,121 | | 1,036,743 | |
| Currency translation | | 5,855 | | 2,611 | | 1,570 | | | 20 | | 10,056 | |
| Adjusted | | 448,880 | | 348,716 | | 248,062 | | | 1,141 | | 1,046,799 | |
| Customer accounts | | | | | | | |
| Reported | | 753,769 | | 388,723 | | 295,880 | | | 743 | | 1,439,115 | |
| Currency translation | | 4,645 | | 3,410 | | 2,738 | | | 17 | | 10,810 | |
| Adjusted | | 758,414 | | 392,133 | | 298,618 | | | 760 | | 1,449,925 | |
1 Net operating income before change in expected credit losses and other credit impairment charges, also referred to as revenue.
2 Includes $0.8bn dilution gain following the merger of The Saudi British Bank (‘SABB’) with Alawwal bank.
3 Includes fair value movements on non-qualifying hedges and debt valuation adjustments on derivatives.
4 Comprises costs associated with preparations for the UK’s exit from the European Union.
| | |
| Reconciliation of reported and adjusted risk-weighted assets |
| | | | | | | | | | | | | | | | | | |
|
| | At 31 Dec 2021 |
| | Wealth and Personal Banking | Commercial
Banking | Global
Banking and
Markets | Corporate Centre | Total |
| | $bn | $bn | $bn | $bn | $bn |
| Risk-weighted assets | | | | | | |
| Reported | | 178.3 | | 332.9 | | 236.2 | | 90.9 | | 838.3 | |
| | | | | | |
| | | | | | |
| | | | | | |
Adjusted1 | | 178.3 | | 332.9 | | 236.2 | | 90.9 | | 838.3 | |
| | | | | | |
| | At 31 Dec 2020 |
| Risk-weighted assets | | | | | | |
| Reported | | 172.8 | | 327.7 | | 265.1 | | 91.9 | | 857.5 | |
| Currency translation | | (2.7) | | (5.3) | | (4.1) | | (0.8) | | (12.9) | |
| | | | | | |
| | | | | | |
| | | | | | |
Adjusted1 | | 170.1 | | 322.4 | | 261.0 | | 91.1 | | 844.6 | |
| | | | | | | | | | | | | | | | | | |
| | At 31 Dec 2019 |
| | | | | | |
| | | | | | |
| Risk-weighted assets | | | | | | |
| Reported | | 162.6 | | 325.9 | | 273.4 | | 81.5 | | 843.4 | |
| Currency translation | | (0.3) | | 1.5 | | (0.6) | | 0.1 | | 0.7 | |
| | | | | | |
| | | | | | |
| | | | | | |
Adjusted1 | | 162.3 | | 327.4 | | 272.8 | | 81.6 | | 844.1 | |
1 Adjusted risk-weighted assets are calculated using reported risk-weighted assets adjusted for the effects of currency translation differences and significant items.
| | |
| Supplementary tables for WPB and GBM |
WPB adjusted performance by business unit
A breakdown of WPB by business unit is presented below to reflect the basis of how the revenue performance of the business units is assessed and managed.
| | | | | | | | | | | | | | | | | | |
| WPB – summary (adjusted basis) |
| | Total
WPB | Consists of1 |
| | Banking
operations | Insurance manufacturing | Global Private Banking | Asset
management |
| | $m | $m | $m | $m | $m |
| 2021 | | | | | | |
Net operating income before change in expected credit losses and other credit impairment charges2 | | 22,110 | | 16,440 | | 2,625 | | 1,826 | | 1,219 | |
| – net interest income | | 14,198 | | 11,237 | | 2,316 | | 647 | | (2) | |
| – net fee income/(expense) | | 5,894 | | 4,405 | | (620) | | 933 | | 1,176 | |
| – other income | | 2,018 | | 798 | | 929 | | 246 | | 45 | |
| ECL | | 288 | | 292 | | (17) | | 14 | | (1) | |
| Net operating income | | 22,398 | | 16,732 | | 2,608 | | 1,840 | | 1,218 | |
Total operating expenses3 | | (15,384) | | (12,401) | | (589) | | (1,565) | | (829) | |
| Operating profit | | 7,014 | | 4,331 | | 2,019 | | 275 | | 389 | |
| Share of profit in associates and joint ventures | | 34 | | 16 | | 18 | | — | | — | |
| Profit before tax | | 7,048 | | 4,347 | | 2,037 | | 275 | | 389 | |
| | | | | | |
| 2020 | | | | | | |
Net operating income before change in expected credit losses and other credit impairment charges2 | | 22,571 | | 17,840 | | 1,869 | | 1,789 | | 1,073 | |
| – net interest income | | 15,470 | | 12,536 | | 2,249 | | 688 | | (3) | |
| – net fee income/(expense) | | 5,519 | | 4,175 | | (527) | | 843 | | 1,028 | |
| – other income | | 1,582 | | 1,129 | | 147 | | 258 | | 48 | |
| ECL | | (3,005) | | (2,866) | | (67) | | (71) | | (1) | |
| Net operating income | | 19,566 | | 14,974 | | 1,802 | | 1,718 | | 1,072 | |
| Total operating expenses | | (15,443) | | (12,774) | | (486) | | (1,429) | | (754) | |
| Operating profit | | 4,123 | | 2,200 | | 1,316 | | 289 | | 318 | |
| Share of profit in associates and joint ventures | | 7 | | 6 | | 1 | | — | | — | |
| Profit before tax | | 4,130 | | 2,206 | | 1,317 | | 289 | | 318 | |
| | | | | | |
| | | | | | |
| | | | | | |
| | | | | | |
| | | | | | |
| | | | | | |
| | | | | | |
| | | | | | |
| | | | | | |
| | | | | | |
| | | | | | |
| | | | | | |
| | | | | | | | | | | | | | | | | | |
| WPB – summary (adjusted basis) (continued) |
| | Total
WPB | Consists of1 |
| | Banking
operations | Insurance manufacturing | Global Private Banking | Asset
management |
| | $m | $m | $m | $m | $m |
| 2019 | | | | | | |
Net operating income before change in expected credit losses and other credit impairment charges2 | | 26,140 | | 20,508 | | 2,663 | | 1,917 | | 1,052 | |
| – net interest income | | 17,820 | | 14,737 | | 2,179 | | 911 | | (7) | |
| – net fee income/(expense) | | 5,753 | | 4,684 | | (726) | | 797 | | 998 | |
| – other income | | 2,567 | | 1,087 | | 1,210 | | 209 | | 61 | |
| ECL | | (1,376) | | (1,286) | | (66) | | (24) | | — | |
| Net operating income | | 24,764 | | 19,222 | | 2,597 | | 1,893 | | 1,052 | |
| Total operating expenses | | (15,823) | | (13,085) | | (485) | | (1,480) | | (773) | |
| Operating profit | | 8,941 | | 6,137 | | 2,112 | | 413 | | 279 | |
| Share of profit in associates and joint ventures | | 54 | | 11 | | 43 | | — | | — | |
| Profit before tax | | 8,995 | | 6,148 | | 2,155 | | 413 | | 279 | |
1 The results presented for insurance manufacturing operations are shown before elimination of inter-company transactions with HSBC non-insurance operations. These eliminations are presented within Banking operations.
2 Net operating income before change in expected credit losses and other credit impairment charges, also referred to as revenue. This differs from the WPB Life insurance manufacturing revenue shown in the managed view of adjusted revenue on page 31, which excludes the impact of Argentina hyperinflation and includes the effect of goodwill adjustments.
3 Operating expenses in Global Private Banking in 2021 included a one-off charge of $0.1bn, which did not meet the criteria to be classified as a significant item.
WPB insurance manufacturing adjusted results
The following table shows the results of our insurance manufacturing operations by income statement line item. It shows the results of insurance manufacturing operations for WPB and for all global business segments in aggregate, and separately the insurance distribution income earned by HSBC bank channels.
These results are prepared in accordance with current IFRSs which will change following adoption of IFRS 17 ‘Insurance Contracts’, effective from 1 January 2023. Further information about the adoption of IFRS 17 is provided on page 90.
| | | | | | | | | | | | | | | | | | | | | | | |
Adjusted results of insurance manufacturing operations and insurance distribution income earned by HSBC bank channels1, 2 | | |
| | | | |
| | 2021 | 2020 | 2019 | | |
| | WPB | All global businesses | WPB | All global businesses | WPB | All global businesses | | |
| | $m | $m | $m | $m | $m | $m | | |
| Net interest income | | 2,316 | | 2,492 | | 2,249 | | 2,414 | | 2,179 | | 2,318 | | | |
| Net fee income/(expense) | | (620) | | (652) | | (527) | | (564) | | (726) | | (750) | | | |
| – fee income | | 105 | | 128 | | 111 | | 132 | | 108 | | 131 | | | |
| – fee expense | | (725) | | (780) | | (638) | | (696) | | (834) | | (881) | | | |
| Net income/(expenses) from financial instruments held for trading or managed on a fair value basis | | 6 | | — | | 66 | | 84 | | (107) | | (117) | | | |
| Net income/(expense) from assets and liabilities of insurance businesses, including related derivatives, measured at fair value through profit or loss | | 4,061 | | 4,100 | | 2,066 | | 2,019 | | 3,671 | | 3,654 | | | |
| Gains less losses from financial investments | | 86 | | 90 | | 13 | | 13 | | 5 | | 5 | | | |
| Net insurance premium income | | 10,516 | | 10,998 | | 9,822 | | 10,313 | | 10,572 | | 10,932 | | | |
| Other operating income | | 192 | | 175 | | 333 | | 347 | | 1,801 | | 1,814 | | | |
| Of which: PVIF | | 100 | | 93 | | 368 | | 381 | | 1,724 | | 1,769 | | | |
| Total operating income | | 16,557 | | 17,203 | | 14,022 | | 14,626 | | 17,395 | | 17,856 | | | |
| Net insurance claims and benefits paid and movement in liabilities to policyholders | | (13,932) | | (14,442) | | (12,153) | | (12,653) | | (14,732) | | (15,115) | | | |
Net operating income before change in expected credit losses and other credit impairment charges3 | | 2,625 | | 2,761 | | 1,869 | | 1,973 | | 2,663 | | 2,741 | | | |
| Change in expected credit losses and other credit impairment charges | | (17) | | (20) | | (67) | | (78) | | (66) | | (70) | | | |
| Net operating income | | 2,608 | | 2,741 | | 1,802 | | 1,895 | | 2,597 | | 2,671 | | | |
| Total operating expenses | | (589) | | (618) | | (486) | | (514) | | (485) | | (506) | | | |
| Operating profit | | 2,019 | | 2,123 | | 1,316 | | 1,381 | | 2,112 | | 2,165 | | | |
| Share of profit in associates and joint ventures | | 18 | | 18 | | 1 | | 1 | | 43 | | 43 | | | |
Profit before tax of insurance manufacturing operations4 | | 2,037 | | 2,141 | | 1,317 | | 1,382 | | 2,155 | | 2,208 | | | |
| | | | | | | | | |
| Annualised new business premiums of insurance manufacturing operations | | 2,838 | | 2,892 | | 2,320 | | 2,384 | | 3,348 | | 3,427 | | | |
| | | | | | | | | |
| Insurance distribution income earned by HSBC bank channels | | 762 | | 832 | | 751 | | 816 | | 961 | | 1,057 | | | |
| | | | | | | | | |
| | | | | | | | | |
1 Adjusted results are derived by adjusting for year-on-year effects of foreign currency translation differences, and the effect of significant items that distort year-on-year comparisons. There are no significant items included within insurance manufacturing, and the impact of foreign currency translation on all global businesses’ profit before tax is 2020: $5m favourable (reported: $1,377m), 2019: $73m favourable (reported: $2,135m).
2 The results presented for insurance manufacturing operations are shown before elimination of inter-company transactions with HSBC non-insurance operations.
3 Net operating income before change in expected credit losses and other credit impairment charges, also referred to as revenue.
4 The effect on the insurance manufacturing operations of applying hyperinflation accounting in Argentina resulted in an increase in adjusted revenue in 2021 of $12m (2020: increase of $5m, 2019: reduction of $1m) and an increase in profit before tax in 2021 of $10m (2020: increase of $12m, 2019: increase of $3m). These effects are recorded within ‘All global businesses’.
Insurance manufacturing
The following commentary, unless otherwise specified, relates to the ‘All global businesses’ results.
HSBC recognises the present value of long-term in-force insurance contracts and investment contracts with discretionary participation features (‘PVIF’) as an asset on the balance sheet. The overall balance sheet equity, including PVIF, is therefore a measure of the embedded value in the insurance manufacturing entities, and the movement in this embedded value in the period drives the overall income statement result.
Adjusted profit before tax of $2.1bn increased by $0.8bn or 55% compared with 2020.
Adjusted net operating income before change in expected credit losses and other credit impairment changes was $0.8bn or 40% higher than in 2020. This reflected the following:
•‘Net income from assets and liabilities of insurance businesses, including related derivatives, measured at fair value through profit or loss’ of $4.1bn in 2021 compared with $2.0bn in 2020. This increase primarily reflected favourable equity market performance in France and Hong Kong and higher gains on unit trust assets, supporting insurance and investment contracts. This compared with 2020, which was adversely impacted by the onset of the Covid-19 pandemic.
•This favourable movement resulted in a corresponding movement in liabilities to policyholders and PVIF (see ‘Other operating income’ below), to the extent to which policyholders and shareholders respectively participate in the investment performance of the associated assets.
•Net insurance premium income of $11bn was $0.7bn higher than in 2020, primarily reflecting higher sales volumes particularly in France, the UK and Singapore.
•Other operating income of $0.2bn decreased by $0.2bn compared with 2020, mainly from adverse movements in PVIF. This included a reduction of $0.7bn due to assumption changes and experience variances, primarily reflecting increased interest rates and the effect of sharing higher investment returns with policyholders in Hong Kong and Singapore, partly offset in France where higher interest rates reduced the cost of guarantees. The net reduction from assumption changes and experience variances was partly offset by a $0.3bn increase in the value of new business written, primarily in Hong Kong.
•Net insurance claims and benefits paid and movement in liabilities to policyholders was $1.8bn higher, primarily due to higher returns on financial assets supporting contracts where the policyholder is subject to part or all of the investment risk and higher sales volumes, particularly in France and the UK.
Adjusted operating expenses of $0.6bn increased by 20% compared with 2020, reflecting investments in core insurance functions and capabilities during the period.
Annualised new business premiums (‘ANP’) is used to assess new insurance premium generation by the business. It is calculated as 100% of annualised first year regular premiums and 10% of single premiums, before reinsurance ceded. Higher ANP during the period reflected improved new business volumes, mainly in Hong Kong.
Insurance distribution income from HSBC channels included $486m (2020: $476m; 2019: $665m) on HSBC manufactured products, for which a corresponding fee expense is recognised within insurance manufacturing, and $346m (2020: $340m; 2019: $392m) on products manufactured by third-party providers. The WPB component of this distribution income was $433m (2020: $428m; 2019: $589m) from HSBC manufactured products and $329m (2020: $323m; 2019: $372m) from third-party products.
WPB: Wealth adjusted revenue by geography
The following table shows the adjusted revenue of our Wealth business by region. Our Wealth business comprises investment distribution, life insurance manufacturing, Global Private Banking and Asset Management.
| | | | | | | | | | | |
| | |
| | | |
| | | |
| | | |
| | | |
| | | |
| | | |
| | | |
| | | |
| | | |
| Wealth adjusted revenue by geography |
| 2021 | 2020 | 2019 |
| $m | $m | $m |
| Europe | 2,381 | | 1,859 | | 2,402 | |
| Asia | 5,780 | | 5,246 | | 5,587 | |
| MENA | 180 | | 163 | | 126 | |
| North America | 530 | | 520 | | 562 | |
| Latin America | 252 | | 216 | | 246 | |
| Total | 9,123 | | 8,004 | | 8,923 | |
The following table shows the wealth balances, which include invested assets and wealth deposits. Invested assets comprise customer assets either managed by our Asset Management business or by external third-party investment managers, as well as self-directed investments by our customers.
| | | | | | | | | |
WPB – reported wealth balances1 |
| 2021 | 2020 | |
| $bn | $bn | |
| Global Private Banking invested assets | 351 | | 326 | | |
| – managed by Global Asset Management | 67 | | 66 | | |
| – external managers, direct securities and other | 284 | | 260 | | |
| Retail invested assets | 434 | | 407 | | |
| – managed by Global Asset Management | 229 | | 219 | | |
| – external managers, direct securities and other | 205 | | 188 | | |
| Asset Management third-party distribution | 334 | | 317 | | |
Reported invested assets1 | 1,119 | | 1,050 | | |
Wealth deposits (Premier, Jade and Global Private Banking)2 | 551 | | 538 | | |
| Total reported wealth balances | 1,670 | | 1,588 | | |
1 Invested assets are not reported on the Group’s balance sheet, except where it is deemed that we are acting as principal rather than agent in our role as investment manager.
2 Premier, Jade and Global Private Banking deposits, which include Prestige deposits in Hang Seng Bank, form part of the total WPB customer accounts balance of $859bn (2020: $835bn) on page 110.
Asset Management: funds under management
The following table shows the funds under management of our Asset Management business. Funds under management represents assets managed, either actively or passively, on behalf
of our customers. Funds under management are not reported on the Group’s balance sheet, except where it is deemed that we are acting as principal rather than agent in our role as investment manager.
| | | | | | | | | | | |
| | |
| | | |
| | | |
| | | |
| | | |
| | | |
| | | |
| | | |
| | | |
| | | |
| Asset Management – reported funds under management | |
| 2021 | 2020 | |
| $bn | $bn | |
| Opening balance | 602 | | 506 | | |
| Net new invested assets | 27 | | 53 | | |
| Net market movements | 18 | | 17 | | |
| Foreign exchange and others | (17) | | 26 | | |
| | | |
| Closing balance | 630 | | 602 | | |
| | | |
| | | |
| Asset Management – reported funds under management by geography | |
| 2021 | 2020 | |
| $bn | $bn | |
| Europe | 367 | | 346 | | |
| Asia | 180 | | 176 | | |
| MENA | 5 | | 6 | | |
| North America | 69 | | 65 | | |
| Latin America | 9 | | 9 | | |
| Closing balance | 630 | | 602 | | |
At 31 December 2021, Asset Management funds under management amounted to $630bn, an increase of $28bn or 5%. The increase reflected strong net new invested assets, primarily from passive and managed solutions investment products. There was a positive market performance, although this was largely offset by adverse foreign exchange translation.
Global Private Banking: client assets
Global Private Banking client assets comprises invested assets and deposits, which are translated at the rates of exchange applicable for their respective year-ends, with the effects of currency translation reported separately.
| | | | | | | | | | |
Global Private Banking – reported client assets1 | |
| 2021 | 2020 | | |
| $bn | $bn | | |
| Opening balance | 394 | | 361 | | | |
| Net new invested assets | 19 | | 3 | | | |
| Increase/(decrease) in deposits | 4 | | 3 | | | |
| Net market movements | 17 | | 6 | | | |
| | | | |
| Foreign exchange and others | (11) | | 21 | | | |
| Closing Balance | 423 | | 394 | | | |
| | | | | | | | | | |
Global Private Banking – reported client assets by geography1 |
| | 2021 | 2020 | |
| | $bn | $bn | |
| Europe | | 174 | | 174 | | |
| Asia | | 178 | | 176 | | |
| North America | | 71 | | 44 | | |
| | | | |
| | | | |
| Closing balance | | 423 | | 394 | | |
1 Client assets are not reported on the Group’s balance sheet, except where it is deemed that we are acting as principal rather than agent in our role as investment manager. Customer deposits included in these client assets are on balance sheet.
Retail invested assets
The following table shows the invested assets of our retail customers. These comprise customer assets either managed by our Asset Management business or by external third-party
investment managers as well as self-directed investments by our customers. Retail invested assets are not reported on the Group’s balance sheet, except where it is deemed that we are acting as principal rather than agent in our role as investment manager.
| | | | | | | | |
| |
| | |
| | |
| | |
| | |
| | |
| | |
| | |
| | |
| | |
| Retail invested assets |
| 2021 | 2020 |
| $bn | $bn |
| Opening balance | 407 | | 380 | |
Net new invested assets1 | 26 | | 10 | |
| Net market movements | 5 | | 5 | |
| Foreign exchange and others | (4) | | 12 | |
| Closing balance | 434 | | 407 | |
| | |
| Retail invested assets by geography |
| 2021 | 2020 |
| $bn | $bn |
| Europe | 81 | | 71 | |
| Asia | 293 | | 281 | |
| MENA | 4 | | 4 | |
| North America | 47 | | 42 | |
| Latin America | 9 | | 9 | |
| Closing balance | 434 | | 407 | |
1 ‘Retail net new invested assets’ covers nine markets, comprising Hong Kong including Hang Seng Bank (Hong Kong), mainland China, Malaysia, Singapore, HSBC Bank UK, UAE, US, Canada and Mexico. The net new invested assets related to all other geographies is reported in ‘exchange and other’.
WPB invested assets
Net new invested assets represents the net customer inflows from retail invested assets, Asset Management third-party distribution and Global Private Banking invested assets. It excludes all
customer deposits. The net new invested assets in the table below is non-additive from the tables above, as net new invested assets managed by Asset Management that is generated by retail clients or Global Private Banking will be recorded in both businesses.
| | | | | | | | |
| |
| | |
| | |
| | |
| | |
| | |
| | |
| | |
| | |
| | |
| WPB: Invested assets |
| 2021 | 2020 |
| $bn | $bn |
| Opening balance | 1,050 | | 925 | |
| Net new invested assets | 64 | | 53 | |
| Net market movements | 33 | | 21 | |
| Foreign exchange and others | (28) | | 51 | |
| Closing balance | 1,119 | | 1,050 | |
| | |
| WPB: Net new invested assets by geography |
| 2021 | 2020 |
| $bn | $bn |
| Europe | 17 | | 21 | |
| Asia | 36 | | 15 | |
| MENA | — | | — | |
| North America | 10 | | 16 | |
| Latin America | 1 | | 1 | |
| Total | 64 | | 53 | |
GBM: Securities Services and Issuer Services
Assets held in custody
Custody is the safekeeping and servicing of securities and other financial assets on behalf of clients. Assets held in custody are not reported on the Group’s balance sheet, except where it is deemed that we are acting as principal rather than agent in our role as investment manager. At 31 December 2021, we held $10.8tn of assets as custodian, 7% higher than at 31 December 2020. The balance comprised $10.0tn of assets in Securities Services, which were recorded at market value, and $0.8tn of assets in Issuer Services, recorded at book value.
The growth was driven by Securities Services balances, from net client asset inflows, including increases from new client mandates, notably in Asia, the US and the UK, and favourable market movements. These increases were partly offset by the adverse impact of currency translation differences.
Assets under administration
Our assets under administration business, which includes the provision of bond and loan administration services, transfer agency services and the valuation of portfolios of securities and other financial assets on behalf of clients, complements the custody business. At 31 December 2021, the value of assets held under administration by the Group amounted to $4.9tn, which was 10% higher than at 31 December 2020. The balance comprised $3.0tn of assets in Securities Services, which were recorded at market value, and $1.9tn of assets in Issuer Services, recorded at book value.
The increase was mainly driven by Securities Services balances, from a net inflow of client assets, particularly in the UK and Hong Kong, and from favourable market movements.
| | |
| Wealth and Personal Banking |
2020 compared with 2019
Financial performance
Adjusted profit before tax of $4.1bn was $4.9bn or 54% lower than in 2019. Despite this, we achieved a RoTE of 9.1%. The reduction in adjusted profit before tax reflected a fall in adjusted revenue and an increase in adjusted ECL from the impact of the Covid-19 outbreak. The reduction in revenue was mainly as a result of lower global interest rates, which particularly affected deposit margins, as well as from lower spending and reduced customer demand for borrowing.
Adjusted revenue of $22.6bn was $3.6bn or 14% lower, which included the non-recurrence of 2019 disposal gains in Argentina and Mexico of $133m.
In Personal Banking, revenue of $13.3bn was up $2.7bn or 17%.
– Net interest income was $2.3bn lower due to narrower margins from lower global interest rates. This reduction was partly offset by deposit balance growth of $67bn or 9%, particularly in Hong Kong and the UK, and higher mortgage lending of $22bn or 6%, mainly in the UK and Hong Kong.
– Non-interest income fell by $0.4bn, driven by lower fee income earned on unsecured lending products primarily due to lower customer activity as a result of the Covid-19 outbreak.
In Wealth, revenue of $8.0bn was down $0.9bn or 10%.
– In life insurance manufacturing revenue fell by $0.7bn or 28%, mainly as the value of new business written reduced by $0.4bn or 37% due to lower volumes following the Covid-19 outbreak, in part mitigated by continued actions to support customers by improving our digital channels. The reduction also included lower favourable movements in market impacts of $92m (2020: $70m favourable, 2019 $162m favourable), as the sharp movement we saw in the first quarter reversed over subsequent quarters.
– In Global Private Banking, revenue was $0.1bn or 7% lower, as net interest income fell as a result of lower global interest rates, although investment revenue increased, reflecting market volatility and higher fees from advisory and discretionary mandates.
– In investment distribution, revenue was $0.1bn or 2% lower, reflecting adverse market conditions, which resulted in lower mutual fund sales and a reduction in wealth insurance distribution. This was partly offset by higher brokerage fees from increased transaction volumes.
Adjusted ECL of $3.0bn were $1.6bn higher than in 2019, reflecting the global impact of the Covid-19 outbreak on the forward economic outlook across all regions, notably in the UK.
Adjusted operating expenses of $15.4bn were $0.4bn or 2% lower, as a decrease in performance-related pay and reduced discretionary expenditure more than offset the impact of inflation and our continued investment in digital.
2020 compared with 2019
Adjusted profit before tax of $1.8bn was $5.5bn or 75% lower than in 2019. Adjusted ECL were higher, reflecting the impact of the Covid-19 outbreak, and adjusted revenue fell, which was primarily due to the impact of lower global interest rates.
Adjusted revenue of $13.7bn was $1.9bn or 12% lower.
– In GLCM, revenue decreased by $1.8bn or 30% due to the impact of the lower global interest rates, mainly in Hong Kong and the UK. This was partly offset by a 16% increase in average deposit balances, with growth across all regions, particularly in the UK and the US.
– In GTRF, revenue decreased by $0.1bn or 5% from lower lending balances and fees, notably in Hong Kong and the UK, reflecting a reduction in global trade volumes as a result of the Covid-19 outbreak. This was partly offset by wider margins in the UK and Latin America.
– In ‘Markets products, Insurance and Investments and Other’, revenue was $0.4bn lower, reflecting the impact of lower interest rates on income earned on capital held in the business, a fall in revenue from Insurance, Investments and Markets products, as well as a reduction in revaluation gains on shares. In addition, 2019 included a disposal gain of $24m in Latin America.
This was partly offset by:
– In C&L, revenue increased by $0.2bn or 4%, reflecting growth in average balances driven by the uptake of government-backed lending schemes and from wider margins.
Adjusted ECL of $5.0bn were $3.8bn higher than in 2019. The increase reflected the global impact of the Covid-19 outbreak on the forward economic outlook, mainly in the UK and Asia. There were also higher charges against specific customers in 2020, particularly in the oil and gas and wholesale trade sectors, including a significant charge related to a corporate exposure in Singapore in the first quarter of 2020.
Adjusted operating expenses of $6.9bn were $0.1bn or 2% lower, reflecting a decrease in performance-related pay and reduced discretionary expenditure, while we continued to invest in our digital and transaction banking capabilities to improve customer experience.
In 2020, we delivered around $13bn of RWA reductions as part of our transformation programme, which mitigated an increase from asset quality deterioration.
| | |
| Global Banking and Markets |
2020 compared with 2019
Adjusted profit before tax of $4.8bn was $0.4bn or 8% lower than in 2019, mainly due to higher adjusted ECL, which reflected the global impact of the Covid-19 outbreak and included charges relating to specific exposures, partly offset by higher adjusted revenue and lower adjusted operating expenses.
Adjusted revenue of $15.8bn increased by $0.5bn compared with 2019. We grew adjusted revenue, which included adverse movements in credit and funding valuation adjustments of $0.3bn, while reducing net reported RWAs by $8bn, compared with
31 December 2019.
In Markets and Securities Services, revenue increased by $1.0bn or 13%, as higher volatility levels and increased client activity, together with wider spreads, supported an improved performance in Global Debt Markets and Global Foreign Exchange. These increases were partly offset by a reduction of $0.2bn or 12% in Securities Services due to lower global interest rates, mainly affecting Asia and Europe, although fees increased.
In Banking, revenue decreased $0.8bn or 11%.
– In GLCM, revenue fell by $0.7bn or 26% due to the impact of lower global interest rates and a fall in transaction volumes that reduced fee income, notably in the US and the UK, partly offset by a 21% growth in average balances, across all regions, particularly in the US, Asia and the UK.
– In GTRF revenue was broadly in line with 2019, reflecting repricing initiatives in Asia and Latin America, offset by lower fees in Europe due to management actions taken to reduce RWAs.
Revenue fell in Principal Investments by $0.2bn, reflecting revaluation losses incurred in the first quarter of 2020, mainly in Europe, as a result of the Covid-19 outbreak, which partly reversed in the remainder of the period.
Adjusted ECL were $1.3bn, up $1.1bn compared with 2019 from charges relating to the impact of the Covid-19 outbreak on the forward economic outlook, particularly in Europe, MENA and North and Latin America.
Adjusted operating expenses of $9.6bn were $0.3bn or 3% lower, reflecting management’s cost reduction initiatives and from lower performance-related pay, which more than offset growth in regulatory programme costs and investments in technology.
In 2020, net reported RWAs fell by $8bn. We delivered around $37bn of RWA reductions in 2020, taking our cumulative reduction, including accelerated saves relating to our transformation programme, to $47bn. This mitigated RWA growth from asset quality deterioration, elevated market volatility and from regulatory changes.
2020 compared with 2019
Adjusted profit before tax of $1.5bn was $0.4bn higher than in 2019.
Adjusted revenue increased by $0.3bn, which included inter-segment eliminations, largely related to movements in own shares held by the global businesses, which offset an equivalent adverse movement in these businesses. In addition, certain funding costs that were retained in Corporate Centre during 2019 were allocated to global businesses with effect from 1 January 2020. Revenue in our legacy portfolios rose by $0.1bn due to the non-recurrence of portfolio losses in 2019.
Adjusted operating expenses, which are stated after recovery of costs from our global businesses, decreased by $0.4bn due to a lower UK bank levy charge and a reduction in discretionary expenditure.
Adjusted share of profit in associates and joint ventures decreased by $0.3bn, primarily due to the impact of falling interest rates and the Covid-19 outbreak.
| | |
| Analysis of reported results by geographical regions |
| | | | | | | | | | | | | | | | | | | | | | | | |
| HSBC reported profit/(loss) before tax and balance sheet data |
| | 2021 |
| | Europe | Asia | MENA | North America | Latin America | Intra-HSBC | Total |
| | $m | $m | $m | $m | $m | $m | $m |
| Net interest income | | 6,454 | | 12,596 | | 1,299 | | 2,845 | | 2,195 | | 1,100 | | 26,489 | |
| Net fee income | | 3,882 | | 5,871 | | 774 | | 2,056 | | 514 | | — | | 13,097 | |
| Net income from financial instruments held for trading or managed on a fair value basis | | 2,602 | | 3,643 | | 431 | | 426 | | 476 | | 166 | | 7,744 | |
| Net income from assets and liabilities of insurance businesses, including related derivatives, measured at fair value through profit and loss | | 1,670 | | 2,340 | | — | | — | | 45 | | (2) | | 4,053 | |
| Changes in fair value of other financial instruments mandatorily measured at fair value through profit or loss | | 1,973 | | (3) | | (3) | | 54 | | 40 | | (1,263) | | 798 | |
Other income/(expense)1 | | 3,523 | | 1,316 | | 59 | | 673 | | (212) | | (7,988) | | (2,629) | |
Net operating income before change in
expected credit losses and other credit
impairment charges2 | | 20,104 | | 25,763 | | 2,560 | | 6,054 | | 3,058 | | (7,987) | | 49,552 | |
Change in expected credit losses and other credit
impairment charges | | 1,601 | | (840) | | 132 | | 238 | | (203) | | — | | 928 | |
| Net operating income | | 21,705 | | 24,923 | | 2,692 | | 6,292 | | 2,855 | | (7,987) | | 50,480 | |
| Total operating expenses excluding impairment of goodwill and other intangible assets | | (18,099) | | (15,136) | | (1,536) | | (4,905) | | (2,198) | | 7,987 | | (33,887) | |
| Impairment of goodwill and other intangible assets | | (95) | | (24) | | (8) | | (13) | | (593) | | — | | (733) | |
| Operating profit/(loss) | | 3,511 | | 9,763 | | 1,148 | | 1,374 | | 64 | | — | | 15,860 | |
| Share of profit/(loss) in associates and joint ventures | | 268 | | 2,486 | | 275 | | — | | 17 | | — | | 3,046 | |
| Profit/(loss) before tax | | 3,779 | | 12,249 | | 1,423 | | 1,374 | | 81 | | — | | 18,906 | |
| | % | % | % | % | % | | % |
| Share of HSBC’s profit before tax | | 20.0 | 64.8 | 7.5 | 7.3 | 0.4 | | 100.0 |
| Cost efficiency ratio | | 90.5 | 58.8 | 60.3 | 81.2 | 91.3 | | 69.9 |
| Balance sheet data | | $m | $m | $m | $m | $m | $m | $m |
| Loans and advances to customers (net) | | 397,090 | | 492,525 | | 26,375 | | 108,717 | | 21,107 | | — | | 1,045,814 | |
| Total assets | | 1,354,483 | | 1,261,707 | | 70,974 | | 362,150 | | 46,602 | | (137,977) | | 2,957,939 | |
| Customer accounts | | 667,769 | | 792,098 | | 42,629 | | 178,565 | | 29,513 | | — | | 1,710,574 | |
Risk-weighted assets3 | | 261,115 | | 396,206 | | 60,223 | | 110,412 | | 35,915 | | | 838,263 | |
|
|
|
| | | | | |
| | | | | | | | |
| | 2020 |
| | | | | | | | |
| | | | | | | | |
| Net interest income | | 5,695 | | 14,318 | | 1,465 | | 2,836 | | 1,960 | | 1,304 | | 27,578 | |
| Net fee income | | 3,499 | | 5,418 | | 695 | | 1,795 | | 467 | | — | | 11,874 | |
| Net income from financial instruments held for trading or managed on a fair value basis | | 3,266 | | 4,273 | | 402 | | 997 | | 593 | | 51 | | 9,582 | |
| Net income from assets and liabilities of insurance businesses, including related derivatives, measured at fair value through profit and loss | | 327 | | 1,699 | | — | | — | | 55 | | — | | 2,081 | |
| Changes in fair value of other financial instruments mandatorily measured at fair value through profit or loss | | 1,747 | | 17 | | 3 | | 2 | | 40 | | (1,354) | | 455 | |
Other income/(expense)1 | | 3,885 | | 1,197 | | 63 | | 745 | | (95) | | (6,936) | | (1,141) | |
Net operating income before change in expected credit losses and other credit impairment charges2 | | 18,419 | | 26,922 | | 2,628 | | 6,375 | | 3,020 | | (6,935) | | 50,429 | |
Change in expected credit losses and other credit
impairment charges | | (3,751) | | (2,284) | | (758) | | (900) | | (1,124) | | — | | (8,817) | |
| Net operating income | | 14,668 | | 24,638 | | 1,870 | | 5,475 | | 1,896 | | (6,935) | | 41,612 | |
| Total operating expenses excluding impairment of goodwill and other intangible assets | | (17,860) | | (13,584) | | (1,521) | | (5,081) | | (1,933) | | 6,935 | | (33,044) | |
| Impairment of goodwill and other intangible assets | | 1,014 | | (78) | | (65) | | (226) | | (5) | | — | | (1,388) | |
| Operating profit/(loss) | | (4,206) | | 10,976 | | 284 | | 168 | | (42) | | — | | 7,180 | |
| Share of profit/(loss) in associates and joint ventures | | 1 | | 1,856 | | (265) | | — | | 5 | | — | | 1,597 | |
| Profit/(loss) before tax | | (4,205) | | 12,832 | | 19 | | 168 | | (37) | | — | | 8,777 | |
| | % | % | % | % | % | | % |
| Share of HSBC’s profit before tax | | (47.9) | 146.2 | 0.2 | 1.9 | (0.4) | | 100.0 |
| Cost efficiency ratio | | 102.5 | 50.7 | 60.4 | 83.2 | 64.2 | | 68.3 |
| Balance sheet data | | $m | $m | $m | $m | $m | $m | $m |
| Loans and advances to customers (net) | | 408,495 | | 473,165 | | 28,700 | | 107,969 | | 19,658 | | — | | 1,037,987 | |
| Total assets | | 1,416,111 | | 1,206,404 | | 68,860 | | 373,167 | | 49,703 | | (130,081) | | 2,984,164 | |
| Customer accounts | | 629,647 | | 762,406 | | 41,221 | | 182,028 | | 27,478 | | — | | 1,642,780 | |
Risk-weighted assets3 | | 284,322 | | 384,228 | | 60,181 | | 117,755 | | 35,240 | | — | | 857,520 | |
| | | | | | | | |
| | | | | | | | |
| | | | | | | | | | | | | | | | | | | | | | | | |
| | | | | | | | |
| | | | | | | | |
| | | | | | | | |
| | | | | | | | |
| | | | | | | | |
| | | | | | | | |
| | | | | | | | |
| HSBC reported profit/(loss) before tax and balance sheet data (continued) |
| | 2019 |
| | Europe | Asia | MENA | North America | Latin
America | Intra-HSBC/global impairment4 | Total |
| | $m | $m | $m | $m | $m | $m | $m |
| Net interest income | | 5,601 | | 16,607 | | 1,781 | | 3,241 | | 2,061 | | 1,171 | | 30,462 | |
| Net fee income | | 3,668 | | 5,325 | | 685 | | 1,804 | | 540 | | 1 | | 12,023 | |
| Net income from financial instruments held for trading or managed on a fair value basis | | 3,785 | | 4,735 | | 327 | | 873 | | 883 | | (372) | | 10,231 | |
| Net income/(expense) from assets and liabilities of insurance businesses, including related derivatives, measured at fair value through profit and loss | | 1,656 | | 1,803 | | — | | — | | 14 | | 5 | | 3,478 | |
| Changes in fair value of other financial instruments mandatorily measured at fair value through profit or loss | | 1,516 | | 28 | | 1 | | 31 | | 41 | | (805) | | 812 | |
Other income/(expense)1 | | 1,830 | | 1,921 | | 916 | | 638 | | (23) | | (6,190) | | (908) | |
Net operating income before loan impairment (charges)/recoveries and other credit risk provisions2 | | 18,056 | | 30,419 | | 3,710 | | 6,587 | | 3,516 | | (6,190) | | 56,098 | |
Change in expected credit losses and other credit
impairment (charges)/recoveries | | (938) | | (724) | | (117) | | (237) | | (740) | | — | | (2,756) | |
| Net operating income | | 17,118 | | 29,695 | | 3,593 | | 6,350 | | 2,776 | | (6,190) | | 53,342 | |
| Total operating expenses excluding impairment of goodwill and other intangible assets | | (19,209) | | (13,284) | | (1,452) | | (5,150) | | (2,050) | | 6,190 | | (34,955) | |
| Impairment of goodwill and other intangible assets | | (2,550) | | (13) | | (97) | | (433) | | (339) | | (3,962) | | (7,394) | |
| Operating profit/(loss) | | (4,641) | | 16,398 | | 2,044 | | 767 | | 387 | | (3,962) | | 10,993 | |
| Share of profit in associates and joint ventures | | (12) | | 2,070 | | 283 | | — | | 13 | | — | | 2,354 | |
| Profit/(loss) before tax | | (4,653) | | 18,468 | | 2,327 | | 767 | | 400 | | (3,962) | | 13,347 | |
| | % | % | % | % | % | | % |
| Share of HSBC’s profit before tax | | (34.9) | | 138.4 | | 17.4 | | 5.7 | | 3.0 | | (29.6) | | 100.0 | |
| Cost efficiency ratio | | 120.5 | | 43.7 | | 41.8 | | 84.8 | | 67.9 | | | 75.5 | |
| Balance sheet data | | $m | $m | $m | $m | $m | $m | $m |
| Loans and advances to customers (net) | | 393,850 | | 477,727 | | 28,556 | | 113,474 | | 23,136 | | — | | 1,036,743 | |
| Total assets | | 1,248,205 | | 1,102,805 | | 65,369 | | 377,095 | | 52,879 | | (131,201) | | 2,715,152 | |
| Customer accounts | | 528,718 | | 697,358 | | 38,126 | | 146,676 | | 28,237 | | — | | 1,439,115 | |
Risk-weighted assets3 | | 280,983 | | 366,375 | | 57,492 | | 121,953 | | 38,460 | | — | | 843,395 | |
1 ‘Other income/(expense)’ in this context comprises where applicable net income/expense from other financial instruments designated at fair value, gains less losses from financial investments, dividend income, net insurance premium income and other operating income less net insurance claims and benefits paid and movement in liabilities to policyholders.
2 Net operating income before change in expected credit losses and other credit impairment charges, also referred to as revenue.
3 Risk-weighted assets are non-additive across geographical regions due to market risk diversification effects within the Group.
4 Includes the impact of goodwill impairment. As per Group accounting policy, HSBC’s cash-generating units are based on geographical regions subdivided by global business, except for Global Banking and Markets, for which goodwill is monitored on a global basis.
| | |
| Reconciliation of reported and adjusted items – geographical regions |
| | | | | | | | | | | | | | | | | | | | | |
| Reconciliation of reported and adjusted items |
| | 2021 |
| | Europe | Asia | MENA | North
America | Latin
America | Total |
| | $m | $m | $m | $m | $m | $m |
Revenue1 | | | | | | | |
Reported2 | | 20,104 | | 25,763 | | 2,560 | | 6,054 | | 3,058 | | 49,552 | |
Significant items2 | | 125 | | (164) | | — | | 10 | | 5 | | 538 | |
| – customer redress programmes | | (11) | | — | | — | | — | | — | | (11) | |
| | | | | | | |
– fair value movements on financial instruments3 | | 226 | | 11 | | — | | 5 | | — | | 242 | |
– restructuring and other related costs2,4 | | (90) | | (175) | | — | | 5 | | 5 | | 307 | |
Adjusted2 | | 20,229 | | 25,599 | | 2,560 | | 6,064 | | 3,063 | | 50,090 | |
| ECL | | | | | | | |
| Reported | | 1,601 | | (840) | | 132 | | 238 | | (203) | | 928 | |
| Adjusted | | 1,601 | | (840) | | 132 | | 238 | | (203) | | 928 | |
| Operating expenses | | | | | | | |
Reported2 | | (18,194) | | (15,160) | | (1,544) | | (4,918) | | (2,791) | | (34,620) | |
Significant items2 | | 1,367 | | 509 | | 56 | | 432 | | 670 | | 2,472 | |
| – customer redress programmes | | 49 | | — | | — | | — | | — | | 49 | |
| | | | | | | |
| – impairment of goodwill and other intangibles | | — | | — | | — | | — | | 587 | | 587 | |
| | | | | | | |
– restructuring and other related costs2 | | 1,318 | | 509 | | 56 | | 432 | | 83 | | 1,836 | |
| | | | | | | |
Adjusted2 | | (16,827) | | (14,651) | | (1,488) | | (4,486) | | (2,121) | | (32,148) | |
| Share of profit in associates and joint ventures | | | | | | | |
| Reported | | 268 | | 2,486 | | 275 | | — | | 17 | | 3,046 | |
| | | | | | | |
| | | | | | | |
| Adjusted | | 268 | | 2,486 | | 275 | | — | | 17 | | 3,046 | |
| Profit before tax | | | | | | | |
| Reported | | 3,779 | | 12,249 | | 1,423 | | 1,374 | | 81 | | 18,906 | |
| Significant items | | 1,492 | | 345 | | 56 | | 442 | | 675 | | 3,010 | |
– revenue2 | | 125 | | (164) | | — | | 10 | | 5 | | 538 | |
| | | | | | | |
– operating expenses2 | | 1,367 | | 509 | | 56 | | 432 | | 670 | | 2,472 | |
| | | | | | | |
| Adjusted | | 5,271 | | 12,594 | | 1,479 | | 1,816 | | 756 | | 21,916 | |
| Loans and advances to customers (net) | | | | | | | |
| Reported | | 397,090 | | 492,525 | | 26,375 | | 108,717 | | 21,107 | | 1,045,814 | |
| Adjusted | | 397,090 | | 492,525 | | 26,375 | | 108,717 | | 21,107 | | 1,045,814 | |
| Customer accounts | | | | | | | |
| Reported | | 667,769 | | 792,098 | | 42,629 | | 178,565 | | 29,513 | | 1,710,574 | |
| Adjusted | | 667,769 | | 792,098 | | 42,629 | | 178,565 | | 29,513 | | 1,710,574 | |
1 Net operating income before change in expected credit losses and other credit impairment charges, also referred to as revenue.
2 Amounts are non-additive across geographical regions due to inter-company transactions within the Group.
3 Includes fair value movements on non-qualifying hedges and debt valuation adjustments on derivatives.
4 Comprises losses associated with the RWA reduction commitments and gains relating to the business update in February 2020.
| | | | | | | | | | | | | | | | | | |
| Reconciliation of reported and adjusted items (continued) |
| | 2021 |
| | UK | Hong
Kong | Mainland China | US | Mexico |
| | $m | $m | $m | $m | $m |
Revenue1 | | | | | | |
| Reported | | 16,415 | | 14,463 | | 3,734 | | 4,006 | | 2,341 | |
| Significant items | | (18) | | 61 | | (41) | | 14 | | 15 | |
| – customer redress programmes | | (11) | | — | | — | | — | | — | |
| | | | | | |
– fair value movements on financial instruments2 | | 220 | | 7 | | — | | 5 | | — | |
– restructuring and other related costs3 | | (227) | | 54 | | (41) | | 9 | | 15 | |
| Adjusted | | 16,397 | | 14,524 | | 3,693 | | 4,020 | | 2,356 | |
| ECL | | | | | | |
| Reported | | 1,645 | | (608) | | (89) | | 205 | | (224) | |
| Adjusted | | 1,645 | | (608) | | (89) | | 205 | | (224) | |
| Operating expenses | | | | | | |
| Reported | | (14,808) | | (7,955) | | (2,773) | | (3,683) | | (1,565) | |
| Significant items | | 1,193 | | 227 | | 32 | | 355 | | 59 | |
| – customer redress programmes | | 49 | | — | | — | | — | | — | |
| | | | | | |
| | | | | | |
| | | | | | |
| – restructuring and other related costs | | 1,144 | | 227 | | 32 | | 355 | | 59 | |
| | | | | | |
| Adjusted | | (13,615) | | (7,728) | | (2,741) | | (3,328) | | (1,506) | |
| Share of profit in associates and joint ventures | | | | | | |
| Reported | | 267 | | 16 | | 2,461 | | — | | 17 | |
| | | | | | |
| | | | | | |
| Adjusted | | 267 | | 16 | | 2,461 | | — | | 17 | |
| Profit before tax | | | | | | |
| Reported | | 3,519 | | 5,916 | | 3,333 | | 528 | | 569 | |
| Significant items | | 1,175 | | 288 | | (9) | | 369 | | 74 | |
| – revenue | | (18) | | 61 | | (41) | | 14 | | 15 | |
| | | | | | |
| – operating expenses | | 1,193 | | 227 | | 32 | | 355 | | 59 | |
| | | | | | |
| Adjusted | | 4,694 | | 6,204 | | 3,324 | | 897 | | 643 | |
| Loans and advances to customers (net) | | | | | | |
| Reported | | 306,464 | | 311,947 | | 54,239 | | 52,678 | | 18,043 | |
| Adjusted | | 306,464 | | 311,947 | | 54,239 | | 52,678 | | 18,043 | |
| Customer accounts | | | | | | |
| Reported | | 535,797 | | 549,429 | | 59,266 | | 111,921 | | 23,583 | |
| Adjusted | | 535,797 | | 549,429 | | 59,266 | | 111,921 | | 23,583 | |
1 Net operating income before change in expected credit losses and other credit impairment charges, also referred to as revenue.
2 Includes fair value movements on non-qualifying hedges and debt valuation adjustments on derivatives.
3 Comprises losses associated with the RWA reduction commitments and gains relating to the business update in February 2020.
| | | | | | | | | | | | | | | | | | | | | |
| Reconciliation of reported and adjusted items (continued) | | | | | | | |
| | 2020 |
| | Europe | Asia | MENA | North
America | Latin
America | Total |
| | $m | $m | $m | $m | $m | $m |
Revenue1 | | | | | | | |
Reported2 | | 18,419 | | 26,922 | | 2,628 | | 6,375 | | 3,020 | | 50,429 | |
Currency translation2 | | 1,171 | | 335 | | (58) | | 109 | | (69) | | 1,393 | |
Significant items2 | | (233) | | (36) | | (1) | | 42 | | — | | (52) | |
| – customer redress programmes | | 21 | | — | | — | | — | | — | | 21 | |
| – disposals, acquisitions and investment in new businesses | | — | | — | | — | | 10 | | — | | 10 | |
– fair value movements on financial instruments3 | | (254) | | (5) | | — | | (2) | | (3) | | (264) | |
– restructuring and other related costs2,4 | | (9) | | (32) | | — | | 35 | | — | | 170 | |
| – currency translation on significant items | | 9 | | 1 | | (1) | | (1) | | 3 | | 11 | |
Adjusted2 | | 19,357 | | 27,221 | | 2,569 | | 6,526 | | 2,951 | | 51,770 | |
| ECL | | | | | | | |
| Reported | | (3,751) | | (2,284) | | (758) | | (900) | | (1,124) | | (8,817) | |
| Currency translation | | (337) | | (57) | | 3 | | (24) | | (50) | | (465) | |
| Adjusted | | (4,088) | | (2,341) | | (755) | | (924) | | (1,174) | | (9,282) | |
| Operating expenses | | | | | | | |
Reported 2 | | (18,874) | | (13,662) | | (1,586) | | (5,307) | | (1,938) | | (34,432) | |
Currency translation2 | | (1,000) | | (198) | | 39 | | (69) | | 61 | | (1,072) | |
Significant items2 | | 2,335 | | 171 | | 81 | | 603 | | 81 | | 3,095 | |
| | | | | | | |
| – customer redress programmes | | (54) | | — | | — | | — | | — | | (54) | |
| – impairment of goodwill and other intangibles | | 803 | | — | | 64 | | 223 | | — | | 1,090 | |
| – past service costs of guaranteed minimum pension benefits equalisation | | 17 | | — | | — | | — | | — | | 17 | |
– restructuring and other related costs2,5 | | 1,425 | | 171 | | 19 | | 378 | | 91 | | 1,908 | |
| – settlements and provisions in connection with legal and regulatory matters | | 12 | | — | | — | | — | | — | | 12 | |
| – currency translation on significant items | | 132 | | — | | (2) | | 2 | | (10) | | 122 | |
Adjusted2 | | (17,539) | | (13,689) | | (1,466) | | (4,773) | | (1,796) | | (32,409) | |
| Share of profit/(loss) in associates and joint ventures | | | | | | | |
| Reported | | 1 | | 1,856 | | (265) | | — | | 5 | | 1,597 | |
| Currency translation | | — | | 133 | | — | | — | | — | | 133 | |
| Significant items | | — | | — | | 462 | | — | | — | | 462 | |
– impairment of goodwill6 | | — | | — | | 462 | | — | | — | | 462 | |
| – currency translation on significant items | | — | | — | | — | | — | | — | | — | |
| Adjusted | | 1 | | 1,989 | | 197 | | — | | 5 | | 2,192 | |
| Profit/(loss) before tax | | | | | | | |
| Reported | | (4,205) | | 12,832 | | 19 | | 168 | | (37) | | 8,777 | |
| Currency translation | | (166) | | 213 | | (16) | | 16 | | (58) | | (11) | |
| Significant items | | 2,102 | | 135 | | 542 | | 645 | | 81 | | 3,505 | |
– revenue2 | | (233) | | (36) | | (1) | | 42 | | — | | (52) | |
– operating expenses2 | | 2,335 | | 171 | | 81 | | 603 | | 81 | | 3,095 | |
| – share of profit in associates and joint ventures | | — | | — | | 462 | | — | | — | | 462 | |
| Adjusted | | (2,269) | | 13,180 | | 545 | | 829 | | (14) | | 12,271 | |
| Loans and advances to customers (net) | | | | | | | |
| Reported | | 408,495 | | 473,165 | | 28,700 | | 107,969 | | 19,658 | | 1,037,987 | |
| Currency translation | | (9,176) | | (4,397) | | (1,423) | | 199 | | (788) | | (15,585) | |
| Adjusted | | 399,319 | | 468,768 | | 27,277 | | 108,168 | | 18,870 | | 1,022,402 | |
| Customer accounts | | | | | | | |
| Reported | | 629,647 | | 762,406 | | 41,221 | | 182,028 | | 27,478 | | 1,642,780 | |
| Currency translation | | (12,835) | | (6,887) | | (1,748) | | 234 | | (1,416) | | (22,652) | |
| Adjusted | | 616,812 | | 755,519 | | 39,473 | | 182,262 | | 26,062 | | 1,620,128 | |
1 Net operating income before change in expected credit losses and other credit impairment charges, also referred to as revenue.
2 Amounts are non-additive across geographical regions due to inter-company transactions within the Group.
3 Includes fair value movements on non-qualifying hedges and debt valuation adjustments on derivatives.
4 Comprises losses associated with the RWA reduction commitments and gains relating to the business update in February 2020.
5 Includes impairment of software intangible assets of $189m (of the total software intangible asset impairment of $1,347m) and impairment of tangible assets of $197m.
6 In 2020, The Saudi British Bank ('SABB'), an associate of HSBC, impaired the goodwill that arose following the merger with Alawwal bank in 2019. HSBC's post-tax share of the goodwill impairment was $462m.
| | | | | | | | | | | | | | | | | | |
| Reconciliation of reported and adjusted items (continued) |
| | 2020 |
| | UK | Hong
Kong | Mainland China | US | Mexico |
| | $m | $m | $m | $m | $m |
Revenue1 | | | | | | |
| Reported | | 13,886 | | 16,345 | | 3,088 | | 4,590 | | 2,234 | |
| Currency translation | | 1,048 | | (29) | | 220 | | — | | 124 | |
| Significant items | | (180) | | 14 | | (5) | | 41 | | (11) | |
| – customer redress programmes | | 21 | | — | | — | | — | | — | |
| – disposals, acquisitions and investment in new businesses | | — | | — | | — | | 10 | | — | |
– fair value movements on financial instruments2 | | (256) | | — | | (1) | | (2) | | (1) | |
– restructuring and other related costs3 | | 48 | | 15 | | (4) | | 33 | | (12) | |
| – currency translation on significant items | | 7 | | (1) | | — | | — | | 2 | |
| Adjusted | | 14,754 | | 16,330 | | 3,303 | | 4,631 | | 2,347 | |
| ECL | | | | | | |
| Reported | | (3,256) | | (824) | | (114) | | (622) | | (1,050) | |
| Currency translation | | (306) | | 2 | | (9) | | — | | (69) | |
| Adjusted | | (3,562) | | (822) | | (123) | | (622) | | (1,119) | |
| Operating expenses | | | | | | |
| Reported | | (14,855) | | (7,312) | | (2,211) | | (4,194) | | (1,376) | |
| Currency translation | | (875) | | 14 | | (152) | | — | | (74) | |
| Significant items | | 1,430 | | 99 | | 20 | | 556 | | 42 | |
| | | | | | |
| – customer redress programmes | | (54) | | — | | — | | — | | — | |
| – impairment of goodwill and other intangibles | | 650 | | — | | — | | 223 | | — | |
| – past service costs of guaranteed minimum pension benefits equalisation | | 17 | | — | | — | | — | | — | |
| – restructuring and other related costs | | 693 | | 100 | | 19 | | 333 | | 42 | |
| – settlements and provisions in connection with legal and regulatory matters | | 12 | | — | | — | | — | | — | |
| – currency translation on significant items | | 112 | | (1) | | 1 | | — | | — | |
| Adjusted | | (14,300) | | (7,199) | | (2,343) | | (3,638) | | (1,408) | |
| Share of profit/(loss) in associates and joint ventures | | | | | | |
| Reported | | 1 | | (2) | | 1,849 | | — | | 5 | |
| Currency translation | | — | | — | | 132 | | — | | — | |
| Adjusted | | 1 | | (2) | | 1,981 | | — | | 5 | |
| Profit/(loss) before tax | | | | | | |
| Reported | | (4,224) | | 8,207 | | 2,612 | | (226) | | (187) | |
| Currency translation | | (133) | | (13) | | 191 | | — | | (19) | |
| Significant items | | 1,250 | | 113 | | 15 | | 597 | | 31 | |
| – revenue | | (180) | | 14 | | (5) | | 41 | | (11) | |
| – operating expenses | | 1,430 | | 99 | | 20 | | 556 | | 42 | |
| Adjusted | | (3,107) | | 8,307 | | 2,818 | | 371 | | (175) | |
| Loans and advances to customers (net) | | | | | | |
| Reported | | 314,530 | | 302,454 | | 46,113 | | 58,082 | | 17,296 | |
| Currency translation | | (2,764) | | (1,741) | | 1,278 | | — | | (471) | |
| Adjusted | | 311,766 | | 300,713 | | 47,391 | | 58,082 | | 16,825 | |
| Customer accounts | | | | | | |
| Reported | | 504,275 | | 531,489 | | 56,826 | | 117,485 | | 22,220 | |
| Currency translation | | (4,432) | | (3,060) | | 1,575 | | — | | (605) | |
| Adjusted | | 499,843 | | 528,429 | | 58,401 | | 117,485 | | 21,615 | |
1 Net operating income before change in expected credit losses and other credit impairment charges, also referred to as revenue.
2 Includes fair value movements on non-qualifying hedges and debt valuation adjustments on derivatives.
3 Comprises losses associated with the RWA reduction commitments and gains relating to the business update in February 2020.
| | | | | | | | | | | | | | | | | | | | | |
| Reconciliation of reported and adjusted items (continued) |
| | 2019 |
| | Europe | Asia | MENA | North
America | Latin
America | Total |
| | $m | $m | $m | $m | $m | $m |
Revenue1 | | | | | | | |
Reported2 | | 18,056 | | 30,419 | | 3,710 | | 6,587 | | 3,516 | | 56,098 | |
Currency translation2 | | 1,353 | | 354 | | (72) | | 99 | | (666) | | 1,010 | |
| Significant items | | 41 | | 35 | | (827) | | 68 | | 10 | | (673) | |
| – customer redress programmes | | 163 | | — | | — | | — | | — | | 163 | |
– disposals, acquisitions and investment in new businesses3 | | — | | — | | (828) | | 59 | | 1 | | (768) | |
– fair value movements on financial investments4 | | (137) | | 35 | | — | | 9 | | 9 | | (84) | |
| – currency translation on significant items | | 15 | | — | | 1 | | — | | — | | 16 | |
Adjusted2 | | 19,450 | | 30,808 | | 2,811 | | 6,754 | | 2,860 | | 56,435 | |
| ECL | | | | | | | |
| Reported | | (938) | | (724) | | (117) | | (237) | | (740) | | (2,756) | |
| Currency translation | | (69) | | (11) | | 4 | | (4) | | 149 | | 69 | |
| Adjusted | | (1,007) | | (735) | | (113) | | (241) | | (591) | | (2,687) | |
| Operating expenses | | | | | | | |
Reported2,6 | | (21,759) | | (13,297) | | (1,549) | | (5,583) | | (2,389) | | (42,349) | |
Currency translation2 | | (1,246) | | (177) | | 59 | | (61) | | 386 | | (981) | |
Significant items6 | | 4,655 | | 127 | | 112 | | 544 | | 367 | | 9,767 | |
– costs of structural reform5 | | 154 | | 4 | | — | | — | | — | | 158 | |
| – customer redress programmes | | 1,281 | | — | | — | | — | | — | | 1,281 | |
– goodwill impairment6 | | 2,522 | | — | | 97 | | 431 | | 337 | | 7,349 | |
| | | | | | | |
| | | | | | | |
| – restructuring and other related costs | | 538 | | 123 | | 15 | | 113 | | 38 | | 827 | |
| – settlements and provisions in connection with legal and regulatory matters | | (60) | | (1) | | — | | — | | — | | (61) | |
| – currency translation on significant items | | 220 | | 1 | | — | | — | | (8) | | 213 | |
Adjusted2,6 | | (18,350) | | (13,347) | | (1,378) | | (5,100) | | (1,636) | | (33,563) | |
| Share of profit/(loss) in associates and joint ventures | | | | | | | |
| Reported | | (12) | | 2,070 | | 283 | | — | | 13 | | 2,354 | |
| Currency translation | | 1 | | 142 | | — | | — | | (1) | | 142 | |
| Adjusted | | (11) | | 2,212 | | 283 | | — | | 12 | | 2,496 | |
| Profit/(loss) before tax | | | | | | | |
Reported6 | | (4,653) | | 18,468 | | 2,327 | | 767 | | 400 | | 13,347 | |
Currency translation6 | | 39 | | 308 | | (9) | | 34 | | (132) | | 240 | |
Significant items6 | | 4,696 | | 162 | | (715) | | 612 | | 377 | | 9,094 | |
| – revenue | | 41 | | 35 | | (827) | | 68 | | 10 | | (673) | |
– operating expenses6 | | 4,655 | | 127 | | 112 | | 544 | | 367 | | 9,767 | |
| Adjusted | | 82 | | 18,938 | | 1,603 | | 1,413 | | 645 | | 22,681 | |
| Loans and advances to customers (net) | | | | | | | |
| Reported | | 393,850 | | 477,727 | | 28,556 | | 113,474 | | 23,136 | | 1,036,743 | |
| Currency translation | | 8,549 | | 4,264 | | (1,482) | | 1,165 | | (2,440) | | 10,056 | |
| Adjusted | | 402,399 | | 481,991 | | 27,074 | | 114,639 | | 20,696 | | 1,046,799 | |
| Customer accounts | | | | | | | |
| Reported | | 528,718 | | 697,358 | | 38,126 | | 146,676 | | 28,237 | | 1,439,115 | |
| Currency translation | | 11,240 | | 4,003 | | (2,091) | | 1,183 | | (3,525) | | 10,810 | |
| Adjusted | | 539,958 | | 701,361 | | 36,035 | | 147,859 | | 24,712 | | 1,449,925 | |
1 Net operating income before change in expected credit losses and other credit impairment charges, also referred to as revenue.
2 Amounts are non-additive across geographical regions due to inter-company transactions within the Group.
3 Includes $0.8bn dilution gain following the merger of The Saudi British Bank (‘SABB’) with Alawwal bank.
4 Includes fair value movements on non-qualifying hedges and debt valuation adjustments on derivatives.
5 Comprises costs associated with preparations for the UK’s exit from the European Union.
6 Amounts are non-additive across geographical regions due to goodwill impairment recognised on the Global Banking and Markets cash-generating unit, which is monitored on a global basis.
| | | | | | | | | | | | | | | | | | |
| Reconciliation of reported and adjusted items (continued) |
| | 2019 |
| | UK | Hong
Kong | Mainland China | US | Mexico |
| | $m | $m | $m | $m | $m |
Revenue1 | | | | | | |
| Reported | | 13,538 | | 19,412 | | 3,101 | | 4,638 | | 2,555 | |
| Currency translation | | 1,148 | | 153 | | 219 | | — | | (129) | |
| Significant items | | 40 | | 26 | | 1 | | 66 | | 7 | |
| – customer redress programmes | | 162 | | — | | — | | — | | — | |
| – disposals, acquisitions and investment in new businesses | | — | | — | | — | | 59 | | — | |
– fair value movements on financial instruments2 | | (139) | | 26 | | 1 | | 7 | | 8 | |
| – currency translation on significant items | | 17 | | — | | — | | — | | (1) | |
| Adjusted | | 14,726 | | 19,591 | | 3,321 | | 4,704 | | 2,433 | |
| ECL | | | | | | |
| Reported | | (714) | | (459) | | (129) | | (170) | | (491) | |
| Currency translation | | (58) | | (3) | | (9) | | — | | 25 | |
| Adjusted | | (772) | | (462) | | (138) | | (170) | | (466) | |
| Operating expenses | | | | | | |
| Reported | | (16,157) | | (6,935) | | (2,111) | | (4,033) | | (1,390) | |
| Currency translation | | (1,010) | | (51) | | (153) | | — | | 71 | |
| Significant items | | 1,941 | | 65 | | 7 | | 93 | | 19 | |
– costs of structural reform3 | | 101 | | 4 | | — | | — | | — | |
| – customer redress programmes | | 1,281 | | — | | — | | — | | — | |
| | | | | | |
| – restructuring and other related costs | | 405 | | 61 | | 6 | | 93 | | 20 | |
| – settlements and provisions in connection with legal and regulatory matters | | 8 | | (1) | | — | | — | | — | |
| – currency translation on significant items | | 146 | | 1 | | 1 | | — | | (1) | |
| Adjusted | | (15,226) | | (6,921) | | (2,257) | | (3,940) | | (1,300) | |
| Share of profit in associates and joint ventures | | | | | | |
| Reported | | (12) | | 31 | | 2,016 | | — | | 13 | |
| Currency translation | | 1 | | — | | 143 | | — | | (1) | |
| Adjusted | | (11) | | 31 | | 2,159 | | — | | 12 | |
| Profit/(loss) before tax | | | | | | |
| Reported | | (3,345) | | 12,049 | | 2,877 | | 435 | | 687 | |
| Currency translation | | 81 | | 99 | | 200 | | — | | (34) | |
| Significant items | | 1,981 | | 91 | | 8 | | 159 | | 26 | |
| – revenue | | 40 | | 26 | | 1 | | 66 | | 7 | |
| – operating expenses | | 1,941 | | 65 | | 7 | | 93 | | 19 | |
| Adjusted | | (1,283) | | 12,239 | | 3,085 | | 594 | | 679 | |
| Loans and advances to customers (net) | | | | | | |
| Reported | | 303,041 | | 306,964 | | 42,380 | | 63,588 | | 20,426 | |
| Currency translation | | 7,175 | | (372) | | 4,054 | | — | | (1,561) | |
| Adjusted | | 310,216 | | 306,592 | | 46,434 | | 63,588 | | 18,865 | |
| Customer accounts | | | | | | |
| Reported | | 419,642 | | 499,955 | | 48,323 | | 90,834 | | 23,051 | |
| Currency translation | | 9,935 | | (606) | | 4,622 | | — | | (1,762) | |
| Adjusted | | 429,577 | | 499,349 | | 52,945 | | 90,834 | | 21,289 | |
1 Net operating income before change in expected credit losses and other credit impairment charges, also referred to as revenue.
2 Includes fair value movements on non-qualifying hedges and debt valuation adjustments on derivatives.
3 Comprises costs associated with preparations for the UK’s exit from the European Union.
| | | | | | | | | | | | | | | | | | |
| Profit/(loss) before tax by country/territory within global businesses |
| | Wealth and
Personal
Banking | Commercial Banking | Global Banking and Markets | Corporate
Centre | Total |
| | $m | $m | $m | $m | $m |
| Europe | | 1,817 | | 2,893 | | (299) | | (632) | | 3,779 | |
– UK1 | | 1,511 | | 2,475 | | (487) | | 20 | | 3,519 | |
| – of which: HSBC UK Bank plc (ring-fenced bank) | | 2,047 | | 2,929 | | 127 | | (318) | | 4,785 | |
| – of which: HSBC Bank plc (non-ring-fenced bank) | | 176 | | 259 | | 220 | | (17) | | 638 | |
| – of which: Holdings and other | | (712) | | (713) | | (834) | | 355 | | (1,904) | |
| – France | | 236 | | 163 | | (97) | | (133) | | 169 | |
| – Germany | | 17 | | 82 | | 155 | | 67 | | 321 | |
| – Switzerland | | 46 | | 10 | | — | | (12) | | 44 | |
| – other | | 7 | | 163 | | 130 | | (574) | | (274) | |
| Asia | | 4,366 | | 2,364 | | 3,193 | | 2,326 | | 12,249 | |
| – Hong Kong | | 4,076 | | 1,303 | | 920 | | (383) | | 5,916 | |
| – Australia | | 146 | | 132 | | 131 | | (26) | | 383 | |
| – India | | 20 | | 265 | | 593 | | 232 | | 1,110 | |
| – Indonesia | | 14 | | 12 | | 111 | | (8) | | 129 | |
| – mainland China | | (95) | | 288 | | 586 | | 2,554 | | 3,333 | |
| – Malaysia | | 37 | | (23) | | 145 | | (20) | | 139 | |
| – Singapore | | 145 | | 107 | | 231 | | (13) | | 470 | |
| – Taiwan | | 14 | | 16 | | 106 | | (5) | | 131 | |
| – other | | 9 | | 264 | | 370 | | (5) | | 638 | |
| Middle East and North Africa | | 194 | | 235 | | 805 | | 189 | | 1,423 | |
| – Egypt | | 79 | | 42 | | 163 | | (2) | | 282 | |
| – UAE | | 91 | | 3 | | 342 | | (61) | | 375 | |
| – Saudi Arabia | | 17 | | — | | 65 | | 274 | | 356 | |
| – other | | 7 | | 190 | | 235 | | (22) | | 410 | |
| North America | | 60 | | 1,023 | | 697 | | (406) | | 1,374 | |
| – US | | (131) | | 472 | | 524 | | (337) | | 528 | |
| – Canada | | 141 | | 544 | | 145 | | (62) | | 768 | |
| – other | | 50 | | 7 | | 28 | | (7) | | 78 | |
| Latin America | | (304) | | 162 | | 326 | | (103) | | 81 | |
| – Mexico | | 305 | | 88 | | 222 | | (46) | | 569 | |
– other2 | | (609) | | 74 | | 104 | | (57) | | (488) | |
| Year ended 31 Dec 2021 | | 6,133 | | 6,677 | | 4,722 | | 1,374 | | 18,906 | |
| | | | | | |
1 UK includes results from the ultimate holding company, HSBC Holdings plc, and the separately incorporated group of service companies (‘ServCo Group’).
2 Includes the impact of goodwill impairment of $587m. As per Group accounting policy, HSBC’s cash-generating units are based on geographical regions, subdivided by global business.
| | | | | | | | | | | | | | | | | | |
| Profit/(loss) before tax by country/territory within global businesses (continued) | | |
| | Wealth and
Personal
Banking | Commercial
Banking | Global
Banking
and Markets | Corporate
Centre | Total |
| | $m | $m | $m | $m | $m |
| Europe | | (680) | | (529) | | (1,809) | | (1,187) | | (4,205) | |
– UK1 | | (357) | | (543) | | (1,769) | | (1,555) | | (4,224) | |
| – of which: HSBC UK Bank plc (ring-fenced bank) | | 113 | | 167 | | 90 | | (124) | | 246 | |
| – of which: HSBC Bank plc (non-ring-fenced bank) | | 109 | | 36 | | (1,030) | | (454) | | (1,339) | |
| – of which: Holdings and other | | (579) | | (746) | | (829) | | (977) | | (3,131) | |
| – France | | (340) | | (168) | | (347) | | (310) | | (1,165) | |
| – Germany | | 17 | | 16 | | 197 | | (15) | | 215 | |
| – Switzerland | | (2) | | (4) | | — | | (10) | | (16) | |
| – other | | 2 | | 170 | | 110 | | 703 | | 985 | |
| Asia | | 5,031 | | 1,944 | | 4,002 | | 1,855 | | 12,832 | |
| – Hong Kong | | 4,927 | | 1,787 | | 1,674 | | (181) | | 8,207 | |
| – Australia | | 108 | | 76 | | 138 | | (7) | | 315 | |
| – India | | 16 | | 187 | | 593 | | 228 | | 1,024 | |
| – Indonesia | | (6) | | (14) | | 147 | | (13) | | 114 | |
| – mainland China | | (34) | | 295 | | 506 | | 1,845 | | 2,612 | |
| – Malaysia | | 8 | | 33 | | 141 | | (55) | | 127 | |
| – Singapore | | 45 | | (644) | | 239 | | (12) | | (372) | |
| – Taiwan | | 9 | | 18 | | 104 | | (2) | | 129 | |
| – other | | (42) | | 206 | | 460 | | 52 | | 676 | |
| Middle East and North Africa | | (15) | | (120) | | 478 | | (324) | | 19 | |
| – Egypt | | 68 | | 46 | | 185 | | (1) | | 298 | |
| – UAE | | (21) | | (210) | | 102 | | (39) | | (168) | |
| – Saudi Arabia | | 21 | | — | | 26 | | (264) | | (217) | |
| – other | | (83) | | 44 | | 165 | | (20) | | 106 | |
| North America | | (449) | | 366 | | 712 | | (461) | | 168 | |
| – US | | (547) | | 139 | | 573 | | (391) | | (226) | |
| – Canada | | 52 | | 225 | | 100 | | (67) | | 310 | |
| – other | | 46 | | 2 | | 39 | | (3) | | 84 | |
| Latin America | | (183) | | (22) | | 233 | | (65) | | (37) | |
| – Mexico | | (115) | | (106) | | 59 | | (25) | | (187) | |
| – other | | (68) | | 84 | | 174 | | (40) | | 150 | |
| | | | | | |
| Year ended 31 Dec 2020 | | 3,704 | | 1,639 | | 3,616 | | (182) | | 8,777 | |
| | | | | | |
| | | | | | |
| | | | | | |
| | | | | | |
| | | | | | |
| | | | | | |
| | | | | | |
| | | | | | |
| | | | | | |
| | | | | | |
| | | | | | |
| | | | | | |
| | | | | | |
| | | | | | |
| | | | | | |
| | | | | | |
| | | | | | |
| | | | | | |
| | | | | | |
| | | | | | |
| | | | | | |
| | | | | | |
| | | | | | |
| | | | | | |
| | | | | | |
| | | | | | |
| | | | | | |
| | | | | | |
| | | | | | |
| | | | | | |
| | | | | | |
| | | | | | |
| | | | | | |
1 UK includes results from the ultimate holding company, HSBC Holdings plc, and the separately incorporated group of service companies (‘ServCo Group’).
| | | | | | | | | | | | | | | | | | |
| Profit/(loss) before tax by country/territory within global businesses (continued) |
| | Wealth and Personal Banking | Commercial
Banking | Global
Banking
and Markets | Corporate
Centre | Total |
| | $m | $m | $m | $m | $m |
| Europe | | (841) | | (1,324) | | (997) | | (1,491) | | (4,653) | |
– UK1 | | (1,053) | | 904 | | (1,217) | | (1,979) | | (3,345) | |
| – of which: HSBC UK Bank plc (ring-fenced bank) | | (331) | | 1,555 | | 70 | | 13 | | 1,307 | |
| – of which: HSBC Bank plc (non-ring fenced bank) | | 245 | | 278 | | (186) | | (467) | | (130) | |
| – of which: Holdings and other | | (967) | | (929) | | (1,101) | | (1,525) | | (4,522) | |
| – France | | 55 | | 120 | | (65) | | (74) | | 36 | |
| – Germany | | 18 | | 46 | | 95 | | 2 | | 161 | |
| – Switzerland | | 93 | | 7 | | (3) | | (6) | | 91 | |
– other2 | | 46 | | (2,401) | | 193 | | 566 | | (1,596) | |
| Asia | | 7,715 | | 4,519 | | 4,083 | | 2,151 | | 18,468 | |
| – Hong Kong | | 7,220 | | 3,242 | | 1,729 | | (142) | | 12,049 | |
| – Australia | | 130 | | 127 | | 199 | | (12) | | 444 | |
| – India | | 67 | | 201 | | 533 | | 205 | | 1,006 | |
| – Indonesia | | 20 | | 55 | | 127 | | 14 | | 216 | |
| – mainland China | | (73) | | 317 | | 512 | | 2,121 | | 2,877 | |
| – Malaysia | | 102 | | 73 | | 189 | | (22) | | 342 | |
| – Singapore | | 154 | | 105 | | 250 | | (31) | | 478 | |
| – Taiwan | | 43 | | 25 | | 97 | | (4) | | 161 | |
| – other | | 52 | | 374 | | 447 | | 22 | | 895 | |
| Middle East and North Africa | | 254 | | 212 | | 761 | | 1,100 | | 2,327 | |
| – Egypt | | 73 | | 81 | | 245 | | 11 | | 410 | |
| – UAE | | 139 | | 94 | | 246 | | (54) | | 425 | |
| – Saudi Arabia | | (3) | | — | | 13 | | 1,145 | | 1,155 | |
– other2 | | 45 | | 37 | | 257 | | (2) | | 337 | |
| North America | | (573) | | 855 | | 729 | | (244) | | 767 | |
| – US | | (277) | | 386 | | 547 | | (221) | | 435 | |
| – Canada | | 70 | | 427 | | 143 | | (22) | | 618 | |
– other2 | | (366) | | 42 | | 39 | | (1) | | (286) | |
| Latin America | | 264 | | (103) | | 328 | | (89) | | 400 | |
| – Mexico | | 311 | | 176 | | 229 | | (29) | | 687 | |
– other2 | | (47) | | (279) | | 99 | | (60) | | (287) | |
GBM goodwill impairment2 | | — | | — | | (3,962) | | — | | (3,962) | |
| Year ended 31 Dec 2019 | | 6,819 | | 4,159 | | 942 | | 1,427 | | 13,347 | |
| | | | | | |
| | | | | | |
| | | | | | |
| | | | | | |
| | | | | | |
| | | | | | |
| | | | | | |
| | | | | | |
| | | | | | |
| | | | | | |
| | | | | | |
| | | | | | |
| | | | | | |
| | | | | | |
| | | | | | |
| | | | | | |
| | | | | | |
| | | | | | |
| | | | | | |
| | | | | | |
| | | | | | |
| | | | | | |
| | | | | | |
| | | | | | |
| | | | | | |
| | | | | | |
| | | | | | |
| | | | | | |
| | | | | | |
| | | | | | |
| | | | | | |
| | | | | | |
| | | | | | |
1 UK includes results from the ultimate holding company, HSBC Holdings plc, and the separately incorporated group of service companies (‘ServCo Group’).
2 Includes the impact of goodwill impairment. As per Group accounting policy, HSBC’s cash-generating units are based on geographical regions, subdivided by global business.
| | | | | |
| Reconciliation of alternative performance measures |
| Page |
| |
| Use of alternative performance measures | |
| Return on average ordinary shareholders’ equity and return on average tangible equity | |
| Net asset value and tangible net asset value per ordinary share | |
| Post-tax return and average total shareholders’ equity on average total assets | |
| Expected credit losses and other credit impairment charges as % of average gross loans and advances to customers | |
| |
| |
| |
| |
| | |
| Use of alternative performance measures |
Our reported results are prepared in accordance with IFRSs as detailed in our financial statements starting on page 336.
As described on page 90, we use a combination of reported and alternative performance measures, including those derived from our reported results that eliminate factors that distort year-on-year comparisons. These are considered alternative performance measures (non-GAAP financial measures).
The following information details the adjustments made to the reported results and the calculation of other alternative performance measures. All alternative performance measures are reconciled to the closest reported performance measure.
| | |
Return on average ordinary shareholders’
equity and return on average tangible equity |
Return on average ordinary shareholders’ equity (‘RoE’) is computed by taking profit attributable to the ordinary shareholders of the parent company (‘reported results’), divided by average ordinary shareholders’ equity (‘reported equity’) for the period. The adjustment to reported results and reported equity excludes amounts attributable to non-controlling interests and holders of preference shares and other equity instruments.
Return on average tangible equity (‘RoTE’) is computed by adjusting reported results for the movements in the present value of in-force long-term insurance business (‘PVIF’) and for impairment of goodwill and other intangible assets (net of tax), divided by average reported equity adjusted for goodwill, intangibles and PVIF for the period.
Return on average tangible equity excluding significant items is annualised profit attributable to ordinary shareholders, excluding changes in PVIF and significant items (net of tax), divided by average tangible shareholders’ equity excluding fair value of own debt, debt valuation adjustment (‘DVA’) and other adjustments for the period. Since 1 January 2021, the UK bank levy has no longer been excluded from the calculation of this measure. Comparative data have not been re-presented.
We provide RoTE ratios in addition to RoE as a way of assessing our performance, which is closely aligned to our capital position.
| | | | | | | | | | | |
| Return on average ordinary shareholders’ equity and return on average tangible equity |
| 2021 | 2020 | 2019 |
| $m | $m | $m |
| Profit | | | |
| Profit attributable to the ordinary shareholders of the parent company | 12,607 | | 3,898 | | 5,969 | |
| Impairment of goodwill and other intangible assets (net of tax) | 608 | | 1,036 | | 7,349 | |
| Decrease/(increase) in PVIF (net of tax) | (58) | | (253) | | (1,248) | |
Profit attributable to the ordinary shareholders, excluding goodwill, other
intangible assets impairment and PVIF | 13,157 | | 4,681 | | 12,070 | |
Significant items (net of tax) and other adjustments1 | 2,086 | | 2,402 | | 2,251 | |
Profit attributable to the ordinary shareholders, excluding goodwill impairment, PVIF and significant items1 | 15,243 | | 7,083 | | 14,321 | |
| Equity | | | |
| Average total shareholders’ equity | 199,295 | | 189,719 | | 189,035 | |
| Effect of average preference shares and other equity instruments | (22,814) | | (22,326) | | (23,614) | |
| Average ordinary shareholders’ equity | 176,481 | | 167,393 | | 165,421 | |
| Effect of goodwill, PVIF and other intangibles (net of deferred tax) | (17,705) | | (17,292) | | (22,574) | |
| Average tangible equity | 158,776 | | 150,101 | | 142,847 | |
| Fair value of own debt, DVA and other adjustments | 1,278 | | 422 | | 1,032 | |
| Average tangible equity excluding fair value of own debt, DVA and other adjustments | 160,054 | | 150,523 | | 143,879 | |
| % | % | % |
| Ratio | | | |
| Return on average ordinary shareholders’ equity | 7.1 | | 2.3 | | 3.6 | |
| Return on average tangible equity | 8.3 | | 3.1 | | 8.4 | |
Return on average tangible equity excluding significant items1 | 9.5 | | 4.7 | | 10.0 | |
1 Since 1 January 2021, the UK bank levy has no longer been excluded from the calculation of this measure. Comparative data have not been re-presented.
Reconciliation of alternative performance measures
The following table details the adjustments made to reported results by global business:
| | | | | | | | | | | | | | | | | |
| Return on average tangible equity by global business |
| Year ended 31 Dec 2021 |
| Wealth and
Personal
Banking | Commercial
Banking | Global
Banking and
Markets | Corporate
Centre | Total |
| $m | $m | $m | $m | $m |
| Profit before tax | 6,133 | | 6,677 | | 4,722 | | 1,374 | | 18,906 | |
| Tax expense | (1,540) | | (1,783) | | (1,020) | | 130 | | (4,213) | |
| Profit after tax | 4,593 | | 4,894 | | 3,702 | | 1,504 | | 14,693 | |
| Less attributable to: preference shareholders, other equity holders, non-controlling interests | (735) | | (665) | | (618) | | (68) | | (2,086) | |
| Profit attributable to ordinary shareholders of the parent company | 3,858 | | 4,229 | | 3,084 | | 1,436 | | 12,607 | |
| Increase in PVIF (net of tax) | (65) | | 4 | | — | | 3 | | (58) | |
Significant items (net of tax)1 | 850 | | 51 | | 517 | | 1,269 | | 2,687 | |
| Other adjustments | 3 | | (4) | | (3) | | 11 | | 7 | |
Profit attributable to ordinary shareholders, excluding PVIF, significant items1 | 4,646 | | 4,280 | | 3,598 | | 2,719 | | 15,243 | |
| Average tangible shareholders’ equity excluding fair value of own debt, DVA and other adjustments | 30,587 | | 39,487 | | 41,816 | | 48,164 | | 160,054 | |
Return on average tangible equity excluding significant items (%)1 | 15.2 | | 10.8 | | 8.6 | | 5.6 | | 9.5 | |
|
| Year ended 31 Dec 2020 |
| Profit before tax | 3,704 | | 1,639 | | 3,616 | | (182) | | 8,777 | |
| Tax expense | (509) | | (661) | | (977) | | (531) | | (2,678) | |
| Profit after tax | 3,195 | | 978 | | 2,639 | | (713) | | 6,099 | |
| Less attributable to: preference shareholders, other equity holders, non-controlling interests | (736) | | (673) | | (784) | | (8) | | (2,201) | |
| Profit attributable to ordinary shareholders of the parent company | 2,459 | | 305 | | 1,855 | | (721) | | 3,898 | |
| Increase in PVIF (net of tax) | (242) | | (10) | | — | | (1) | | (253) | |
| Significant items (net of tax) and UK bank levy | 190 | | 208 | | 958 | | 2,041 | | 3,397 | |
| Other adjustments | 20 | | (14) | | (25) | | 60 | | 41 | |
| Profit attributable to ordinary shareholders, excluding PVIF, significant items and bank levy | 2,427 | | 489 | | 2,788 | | 1,379 | | 7,083 | |
| Average tangible shareholders’ equity excluding fair value of own debt, DVA and other adjustments | 26,551 | | 37,826 | | 41,566 | | 44,580 | | 150,523 | |
| Return on average tangible equity excluding significant items and UK bank levy (%) | 9.1 | | 1.3 | | 6.7 | | 3.1 | | 4.7 | |
1 Since 1 January 2021, the UK bank levy has no longer been excluded from the calculation of this measure. Comparative data have not been re-presented.
| | |
| Net asset value and tangible net asset value per ordinary share |
Net asset value per ordinary share is total shareholders' equity less non-cumulative preference shares and capital securities (‘total ordinary shareholders’ equity’), divided by the number of ordinary shares in issue excluding shares that the company has purchased and are held in treasury.
Tangible net asset value per ordinary share is total ordinary shareholders’ equity excluding goodwill, PVIF and other intangible assets (net of deferred tax) (‘tangible ordinary shareholders’ equity’), divided by the number of basic ordinary shares in issue excluding shares that the company has purchased and are held in treasury.
| | | | | | | | | | | |
| Net asset value and tangible net asset value per ordinary share |
| 2021 | 2020 | 2019 |
| $m | $m | $m |
| Total shareholders’ equity | 198,250 | | 196,443 | | 183,955 | |
| Preference shares and other equity instruments | (22,414) | | (22,414) | | (22,276) | |
| Total ordinary shareholders’ equity | 175,836 | | 174,029 | | 161,679 | |
| Goodwill, PVIF and intangible assets (net of deferred tax) | (17,643) | | (17,606) | | (17,535) | |
| Tangible ordinary shareholders’ equity | 158,193 | | 156,423 | | 144,144 | |
| Basic number of $0.50 ordinary shares outstanding | 20,073 | | 20,184 | | 20,206 | |
| $ | $ | $ |
| Value per share | | | |
| Net asset value per ordinary share | 8.76 | | 8.62 | | 8.00 | |
| Tangible net asset value per ordinary share | 7.88 | | 7.75 | | 7.13 | |
| | |
Post-tax return and average total shareholders’
equity on average total assets |
Post-tax return on average total assets is profit after tax divided by average total assets for the period.
Average total shareholders’ equity to average total assets is average total shareholders' equity divided by average total assets for the period.
| | | | | | | | | | | |
| Post-tax return and average total shareholders’ equity on average total assets | | | |
| 2021 | 2020 | 2019 |
| $m | $m | $m |
| Profit after tax | 14,693 | | 6,099 | | 8,708 | |
| Average total shareholders’ equity | 199,295 | | 189,719 | | 189,035 | |
| Average total assets | 3,012,437 | | 2,936,939 | | 2,712,376 | |
| | | |
| Ratio | % | % | % |
| Post-tax return on average total assets | 0.5 | | 0.2 | | 0.3 | |
| Average total shareholders’ equity to average total assets | 6.62 | | 6.46 | | 6.97 | |
| | |
| Expected credit losses and other credit impairment charges as % of average gross loans and advances to customers |
Expected credit losses and other credit impairment charges (‘ECL’) as % of average gross loans and advances to customers is the
annualised adjusted ECL divided by adjusted average gross loans and advances to customers for the period.
The adjusted numbers are derived by adjusting reported ECL and loans and advances to customers for the effects of foreign currency translation differences.
| | | | | | | | | | | |
| Expected credit losses and other credit impairment charges as % of average gross loans and advances to customers |
| 2021 | 2020 | 2019 |
| $m | $m | $m |
| Expected credit losses and other credit impairment charges (‘ECL’) | 928 | | (8,817) | | (2,756) | |
| Currency translation | | (465) | | 69 | |
| Adjusted ECL | 928 | | (9,282) | | (2,687) | |
| Average gross loans and advances to customers | 1,057,412 | | 1,047,114 | | 1,021,238 | |
| Currency translation | (8,487) | | 20,243 | | 22,292 | |
| Average gross loans and advances to customers – at most recent balance sheet foreign exchange rates | 1,048,925 | | 1,067,357 | | 1,043,530 | |
| % | % | % |
| Ratio | | | |
| Expected credit losses and other credit impairment charges as % of average gross loans and advances to customers | (0.09) | | 0.87 | | 0.26 | |
| | | | | |
| Other information |
| Page |
| Disclosure controls | |
| Management’s assessment of internal controls over financial reporting | |
| Regulation and supervision | |
| Disclosures pursuant to Section 13(r) of the Securities Exchange Act | |
The Group Chief Executive and Group Chief Financial Officer, with the assistance of other members of management, carried out an evaluation of the effectiveness of the design and operation of HSBC Holdings’ disclosure controls and procedures as at
31 December 2021. Based upon that evaluation, the Group Chief Executive and Group Chief Financial Officer concluded that the disclosure controls and procedures at 31 December 2021 were effective to provide reasonable assurance that information required to be disclosed in the reports that the company files and submits under the US Securities Exchange Act of 1934, as amended, is recorded, processed, summarised and reported as and when required. There are inherent limitations to the effectiveness of any system of disclosure controls and procedures, including the possibility of human error and the circumvention or overriding of the controls and procedures. Accordingly, even effective disclosure controls and procedures can only provide reasonable assurance of achieving their control objectives.
There have been no changes in HSBC Holdings’ internal control over financial reporting during the year ended 31 December 2021 that have materially affected, or are reasonably likely to materially affect, HSBC Holdings’ internal control over financial reporting.
| | |
| Management’s assessment of internal controls over financial reporting |
Management is responsible for establishing and maintaining an adequate internal control structure and procedures for financial reporting, and has completed an assessment of the effectiveness of the Group’s internal controls over financial reporting for the year ended 31 December 2021. In making the assessment, management used the framework for internal control evaluation contained in the Financial Reporting Council’s Guidance on Risk Management, Internal Control and Related Financial and Business Reporting (September 2014), as well as the criteria established by the Committee of Sponsoring Organizations of the Treadway Commission (‘COSO’) in ‘Internal Control-Integrated Framework (2013)’.
Based on the assessment performed, management concluded that for the year ended 31 December 2021, the Group’s internal controls over financial reporting were effective.
PricewaterhouseCoopers LLP, which has audited the consolidated financial statements of the Group for the year ended 31 December 2021, has also audited the effectiveness of the Group’s internal control over financial reporting under Auditing Standard No. 5 of the Public Company Accounting Oversight Board (United States) as stated in their report on page 334.
| | |
| Regulation and supervision |
The ordinary shares of HSBC Holdings are listed in London,
Hong Kong, New York and Bermuda. As a result of the listing in London, HSBC Holdings is subject to the Listing Rules of the Financial Conduct Authority (‘FCA’). As a result of the listing in Hong Kong, HSBC Holdings is subject to The Rules Governing the Listing of Securities on The Stock Exchange of Hong Kong Limited (‘HKE’). In the US, where the listing is through an American Depositary Receipt Programme, shares are traded in the form of American Depositary Shares (‘ADS’), which are registered with the US Securities and Exchange Commission (‘SEC’). As a consequence of its US listing, HSBC Holdings is also subject to the reporting and other requirements of: the US Securities Act of 1933, as amended; the Securities Exchange Act of 1934, as amended; and the New York Stock Exchange’s (‘NYSE’) Listed Company Manual, in each case as applied to foreign private issuers. In Bermuda, HSBC Holdings is subject to the listing rules of the Bermuda Stock Exchange applicable to companies with secondary listings.
A statement of our compliance with the provisions of the UK Corporate Governance Code issued by the Financial Reporting Council and with the Hong Kong Corporate Governance Code set out in Appendix 14 to the Rules Governing the Listing of Securities on The Stock Exchange of Hong Kong Limited can be found in the ‘Report of the Directors: Statement of Compliance’ on page 332.
Our operations throughout the world are regulated and supervised globally by a large number of different regulatory authorities, central banks and other bodies in those jurisdictions in which we have offices, branches or subsidiaries. These authorities impose a variety of requirements and controls designed to provide financial stability, transparency in financial markets and a contribution to economic growth. The requirements to which our operations must adhere include those relating to capital and liquidity, disclosure standards and restrictions on certain types of products or transaction structures, recovery and resolution, governance standards, conduct of business and financial crime.
The UK Prudential Regulation Authority (‘PRA’) is the HSBC Group’s consolidated lead regulator. HSBC Holdings is now approved by, and directly responsible to the PRA for ensuring the HSBC group meets consolidated prudential requirements. The other lead UK regulator, the FCA, supervises 15 HSBC entities in the UK, including eight where the PRA is responsible for prudential supervision.The FCA maintains global oversight of the Group’s management of financial crime risk both generally, in the exercise of its wider powers under the Financial Services and Markets Act 2000, and more specifically through the exercise of direct supervisory powers over HSBC Holdings and the 2020 Direction, as described in the Financial crime section on page 244. In addition, and as required under relevant local laws, each operating bank, finance company and insurance operation within HSBC is regulated by relevant local regulatory authorities.
The Group’s primary regulatory authorities include those in the UK, Hong Kong and the US and our other principal jurisdictions of operation. However, and in addition, with the implementation of the European Union's (‘EU’) Single Supervisory Mechanism (‘SSM’) in 2014, the European Central Bank (‘ECB’) assumed direct supervisory responsibility for HSBC Continental Europe and HSBC Malta as ‘significant supervised entities’ within the eurozone for the purposes of the EU’s SSM Regulation. Under the SSM, the ECB increasingly engages with the relevant ‘national competent authorities’ in relation to HSBC’s businesses in other eurozone countries and more widely with HSBC's other regulators. It is therefore expected that we will continue to see changes in how the Group is regulated and supervised on a day-to-day basis in the eurozone and, more generally, as the ECB and other of our regulators develop their powers having regard to some of the developments highlighted in this report including those that follow the UK’s exit from the EU.
UK regulation and supervision
The UK's financial services regulatory structure is comprised of three regulatory bodies: the Financial Policy Committee, a committee of the BOE; the PRA; and the FCA.
The Financial Policy Committee is responsible for macro-prudential supervision, focusing on systemic risks that may affect the UK’s financial stability.
The BoE prudentially regulates and supervises financial services firms through the PRA, and in addition to its wider role as the UK’s central bank, the BoE is the resolution authority responsible for taking action to manage the failure of financial institutions in the UK, if necessary. The latter involves a set of responsibilities and powers that apply outside of an actual bank failure and relate to general resolution planning, including an assessment of any barriers to the resolution of banks, the exercise of powers to require the removal of impediments to resolvability and the setting of minimum requirements for own funds and eligible liabilities.
The PRA and the FCA are micro-prudential supervisors. The Group’s banking subsidiaries in the UK, such as HSBC Bank plc and HSBC UK, are ‘dual-regulated’ firms, subject to prudential regulation by the PRA and to conduct regulation by the FCA. Other (generally smaller, non-bank) UK-based subsidiaries are ‘solo regulated’ by the FCA (i.e. the FCA is responsible for both prudential and conduct regulation of those subsidiaries). HSBC Group is subject to consolidated supervision by the PRA.
UK banking and financial services institutions are subject to multiple regulations. The primary UK statute in this context is the Financial Services and Markets Act 2000, as amended by subsequent legislation. As a result of a referendum in 2016, the UK left the EU on 31 January 2020 and agreed a transition period which ended at 11pm on 31 December 2020. At the end of the transition period, HSBC Holdings and its subsidiaries in the UK ceased to be subject to EU law. However, at that time, the EU’s financial services legislation was "onshored" into UK law under the European Union (Withdrawal) Act 2018 (‘EUWA’). EU law continues to apply to HSBC’s subsidiaries in the EU. The UK and the EU have entered into a Trade and Cooperation Agreement, and have made certain declarations relating to financial services. See the European Regulation section for more information.
The PRA and FCA are together responsible for authorising and supervising all our operating businesses in the UK that require authorisation under the Financial Services and Markets Act 2000. These include deposit-taking, retail banking, consumer credit, life and general insurance, pensions, investments, mortgages, custody and share-dealing businesses, and treasury and capital markets activity. The FCA is also responsible for promoting effective competition in the interests of consumers, and an independent subsidiary of the FCA, the Payment Systems Regulator, regulates payment systems in the UK.
The PRA and FCA's rules establish the minimum criteria for the authorisation of banks and other financial sector entities that carry out regulated activities. In the UK, the PRA and FCA have the right to object, on prudential grounds, to persons who hold, or intend to hold, 10% or more of the voting power or shares of a financial institution that they regulate, or of its parent undertaking. In its capacity as our supervisor on a consolidated basis, the PRA receives information on the capital adequacy of, and sets requirements for, the Group as a whole. In addition, it conducts stress tests both on HSBC’s UK entities and more widely on the Group. Individual banking subsidiaries in the Group are directly regulated by their local banking supervisors, who set and monitor, inter-alia, their capital adequacy requirements.
The Group is subject to capital requirements as set out in the Capital Requirements Regulation (the ‘CRR’), the PRA Rulebook and the UK law implementing the Capital Requirements Directive (the ‘CRD’ and together with the CRR, and the relevant rules of the PRA rulebook, the ‘Capital Requirements Legislative Package’). Broadly, the changes to the framework that resulted from onshoring the legislation under EUWA will be delayed until
31 March 2022 under transitional powers exercised by the PRA.
The Pillar 1 regulatory capital framework has been, and continues to be, significantly enhanced. The UK implemented the first tranche of changes associated with the Basel III Reforms in January 2022. These include the changes in relation to counterparty risk, equity investments in funds and market risk RWAs and the leverage ratio. The other elements of the Basel III Reforms, including the changes to credit and operational risk RWAs and the implementation of an RWA output floor, are currently scheduled by the Basel Committee for implementation in January 2023. Given the PRA is currently not expected to consult on these other elements until mid-2022, implementation in the UK is likely to be delayed. UK law implementing the Bank Recovery and Resolution Directive (the 'BRRD') requires the UK’s resolution authority to set a minimum requirement for own funds and eligible liabilities ('MREL') for banks in the UK. These include own funds and liabilities that can be written down or converted into capital resources in order to absorb losses or recapitalise a bank in the event of its failure. These requirements are based on the resolution strategy for the Group, as agreed by the BoE in consultation with our local regulators. The UK has implemented the MREL requirements through the Banking Act, and the Bank Recovery and Resolution (No 2) Order 2014. The BoE separately updated its statement of policy on its approach to setting MREL in December 2021. The BoE has set interim MREL requirements for the Group and to some of the Group’s UK subsidiaries,which were applicable from 1 January 2019; end state MREL requirements are applicable from 1 January 2022.
The UK MREL framework has been designed to be broadly compatible with the term sheet published by the Financial Stability Board (the 'FSB') on total loss absorbing capacity ('TLAC') requirements for global systemically important banks ('G-SIBs'). Additional TLAC requirements were implemented in 2019 through amendments to the CRR in line with the FSB's TLAC standards and these also apply to HSBC as a G-SIB.
The Group is also subject to liquidity requirements as set out in the Capital Requirements Legislative Package and implemented by the PRA, and became subject to the net stable funding ratio ('NSFR') requirements prescribed under the Basel III Reforms in January 2022.
The PRA and FCA monitor authorised institutions through ongoing supervision and the review of routine and ad hoc reports relating to financial, prudential and conduct of business matters. They may also obtain independent reports from a Skilled Person on the adequacy of procedures and systems covering internal control and governing records and accounting. The PRA meets regularly with the Group’s senior executives to discuss our adherence to its prudential requirements. In addition, both the PRA and FCA regularly discuss with relevant management fundamental matters relating to our business in the UK and internationally, including areas such as strategic and operating plans, risk control, loan portfolio composition, organisational changes, succession planning and recovery and resolution arrangements.
Hong Kong regulation and supervision
The Banking Ordinance provides the legal framework for banking supervision in Hong Kong. Section 7(1) of the Ordinance provides that the principal function of the Hong Kong Monetary Authority (‘HKMA’) is to ‘promote the general stability and effective working of the banking system’. The HKMA seeks to establish a regulatory framework in line with international standards, in particular those issued by the Basel Committee on Banking Supervision (‘Basel Committee’) and the Financial Stability Board (‘FSB’). The objective is to maintain a prudential supervisory system that underpins the general stability and effective working of the banking system, while at the same time providing sufficient flexibility for authorised institutions to take commercial decisions. Under the Banking Ordinance, the HKMA is the licensing authority responsible for the authorisation, suspension and revocation of authorised institutions. To provide checks and balances, the HKMA is required under the Ordinance to consult with the Financial Secretary on important authorisation decisions, such as suspension and involuntary revocation.
Other information | Regulation and supervision
The Hongkong and Shanghai Banking Corporation Limited and its overseas branches and subsidiaries are licensed under the Banking Ordinance and hence subject to the supervision, regulation and examination of the HKMA.
The HKMA follows international practices as recommended by the Basel Committee to supervise authorised institutions. Under the Banking Ordinance, the HKMA imposes capital requirements on authorised institutions through the Banking (Capital) Rules, liquidity requirements through the Banking (Liquidity) Rules and large exposure limits through the Banking (Exposure Limits) Rules. These rules take into account the latest standards set by the Basel Committee.
The HKMA adopts a risk-based supervisory approach based on a policy of ‘continuous supervision’ through on-site examinations, off-site reviews, prudential meetings, cooperation with external auditors and sharing information with other supervisors.
The HKMA requires all authorised institutions to have adequate systems of internal control and requires the institutions’ external auditors, upon request, to report on those systems and other matters, such as the accuracy of information provided to the HKMA.
In addition, the HKMA may from time to time conduct tripartite discussions with authorised institutions and their external auditors.
The HKMA aims to ensure that the standards for regulatory disclosure in Hong Kong remain in line with those of other leading financial centres. The Banking (Disclosure) Rules take into account the latest disclosure standards released by the Basel Committee, which prescribe quarterly, semi-annual and annual disclosure of specified items, including in the form of standard templates and tables, in order to promote user-relevance and the consistency and comparability of regulatory disclosure among banks and across jurisdictions.
The HKMA's powers to collect prudential data from authorised institutions on a routine or ad hoc basis are provided by Section 63 of the Banking Ordinance. The same section of the Ordinance also empowers the HKMA to require any holding company or subsidiary or sister company of an authorised institution to submit such information as may be required for the exercise of the HKMA’s functions under the Ordinance.
The HKMA has the power to serve a notice of objection on persons if they are no longer deemed to be fit and proper to be controllers of the authorised institution, if they may otherwise threaten the interests of depositors or potential depositors, or if they have contravened any conditions specified by the HKMA. The HKMA may revoke authorisation in the event of an institution’s non-compliance with the provisions of the Banking Ordinance. These provisions require, among other things, the furnishing of accurate reports.
The HKMA is the relevant authority under the Anti-Money Laundering and Counter-Terrorist Financing Ordinance for supervising authorised institutions’ compliance with the legal and supervisory requirements set out in the Anti-Money Laundering and Counter-Terrorist Financing Ordinance and the Guideline on Anti-Money Laundering and Counter-Financing of Terrorism (for Authorised Institutions). The HKMA requires authorised institutions in Hong Kong and its overseas branches and subsidiaries to establish effective systems and controls to prevent and detect money laundering and terrorist financing. It works closely with other stakeholders within both the government and the industry to ensure that the banking sector is able to play its gatekeeper role in Hong Kong’s anti-money laundering and counter-financing of terrorism regime.
To enhance the exchange of supervisory information and cooperation, the HKMA has entered into a Memorandum of Understanding or other formal arrangements with a number of banking supervisory authorities within and outside Hong Kong.
The marketing of, dealing in and provision of advice and asset management services in relation to securities and futures in Hong Kong are subject to the provisions of the Securities and Futures Ordinance of Hong Kong. Entities engaging in activities regulated
by the Ordinance (including the Hongkong and Shanghai Banking Corporation Limited) are required to be licensed or registered with the Securities and Futures Commission (‘SFC’). The HKMA is the front-line regulator for banks involved in the securities and futures business.
The HKMA and the SFC work very closely to ensure that there is an open market with a level playing field for all intermediaries in the securities industry of Hong Kong. The HKMA has entered into a Memorandum of Understanding with the SFC, which elaborates on the legal framework and sets out the operational details relating to the respective roles and responsibilities of the two regulators regarding the securities-related activities of authorised institutions. The HKMA and the SFC hold regular meetings under the Memorandum of Understanding to discuss matters of mutual interest.
Among other functions, the Securities and Futures Ordinance vests the SFC with powers to set and enforce market regulations, including investigating breaches of rules and market misconduct and taking appropriate enforcement action.
The SFC is responsible for licensing and supervising intermediaries conducting SFC-regulated activities, such as investment advisers, fund managers and brokers. Additionally, the SFC sets standards for the authorisation and regulation of investment products, and reviews and authorises offering documents of retail investment products to be marketed to the public.
To promote proper conduct and increase awareness of individual responsibility and accountability, the SFC introduced and implemented the Manager-In-Charge (‘MIC’) regime in Hong Kong in October 2017. The MIC regime applies to senior individuals of licensed corporations responsible for managing core functions within financial services businesses supervised by the SFC. The regime required SFC licensed corporations to review their organisational structure and the roles of senior management and their responsible officers in light of the SFC’s classification of core functions within licensed corporations and its guidelines on identifying Managers-In-Charge of Core Functions. The regime also imposes new reporting requirements on SFC licensed corporations.
Similar to the SFC, the HKMA launched its Management Accountability Initiative in October 2017 aimed at increasing the accountability of the senior management of Hong Kong registered institutions (‘RIs’) i.e. Hong Kong banks registered to carry on one or more regulated activities under the SFO. The Management Accountability Initiative clarified the HKMA’s expectations on the responsibility and accountability of RIs’ senior management and enhanced its information gathering on RIs’ regulated activities, while requiring RIs to better identify lines of responsibility and accountability for their regulated activities. In order to support capacity building and talent development, the HKMA is also working with the banking industry and relevant professional bodies to implement an industry-wide enhanced competency framework for banking practitioners. The availability of a set of common and transparent competency standards enables more effective training for new entrants and professional development for existing practitioners. Authorised institutions are encouraged to adopt it as the benchmark for enhancing the level of core competence and ongoing professional development of banking practitioners.
Currently, the enhanced competency framework for banking practitioners covers five professional work streams: anti-money laundering and counter-financing of terrorism; cybersecurity; treasury management; retail and wealth management, with Fintech, risk management and compliance to be launched in due course.
Relevant to the Group's insurance business in Hong Kong, the HKMA and the Hong Kong Insurance Authority (‘IA’) have also signed a Memorandum of Understanding to enhance the cooperation, exchange of information and mutual assistance between the two authorities. This Memorandum of Understanding sets out the framework between the HKMA and the IA for strengthening co-operation in respect of regulation and
supervision of entities or financial groups in which the two authorities have a common regulatory interest.
Pursuant to the statutory regulatory regime for insurance intermediaries under the Insurance Ordinance, the IA has delegated its inspection and investigation powers to the HKMA in relation to insurance related businesses of authorised institutions in Hong Kong, which aims to improve efficiency and minimise possible regulatory overlap.
Under the statutory regime for the regulation of Mandatory Provident Fund (‘MPF’) intermediaries, the Mandatory Provident Fund Schemes Authority is the lead regulator in respect of regulation of MPF intermediaries whereas the HKMA, the IA and the SFC are the front-line regulators of the MPF intermediaries.
A Memorandum of Understanding Concerning the Regulation of Regulated Persons with Respect to Registered Schemes under the Mandatory Provident Fund Schemes Ordinance has been signed by the four regulators. It sets out certain administrative and operational arrangements among the four regulators regarding the exercise of their respective functions under the Mandatory Provident Fund Schemes Ordinance concerning regulation of MPF intermediaries.
The Financial Institutions (Resolution) Ordinance established the legal basis for a cross-sector resolution regime in Hong Kong, under which the HKMA is the resolution authority for banking sector entities, including all authorised institutions. The HKMA is also designated as the lead resolution authority for the cross-sectoral groups in Hong Kong that include banking sector entities within the scope of the Financial Institutions (Resolution) Ordinance ('FIRO'). The HKMA’s function as a resolution authority is supported by the Resolution Office within the HKMA. The Resolution Office is operationally independent and has a direct reporting line to the chief executive of the HKMA.
The Financial Institutions (Resolution) (Loss-absorbing Capacity Requirements – Banking Sector) Rules (‘LAC Rules’) were made by the HKMA under section 19(1) of the FIRO. The LAC Rules enable the HKMA to designate entities within Hong Kong as resolution entities or material subsidiaries and require them to issue Loss Absorbing Capacity (‘LAC’) instruments, in accordance with the Financial Stability Board’s standard ‘Principles on Loss-absorbing and Recapitalisation Capacity of G-SIBs in Resolution – Total Loss-absorbing Capacity (‘TLAC’) Term Sheet’. The LAC Rules also incorporate the Basel Committee’s disclosure standards on TLAC.
US regulation and supervision
The Group is subject to federal and state supervision and regulation in the US. Banking laws and regulations of the Federal Reserve Board (‘FRB’), the Office of the Comptroller of the Currency (the ‘OCC’) and the Federal Deposit Insurance Corporation (the ‘FDIC’) (collectively, the ‘US banking regulators’) govern all aspects of our US business. HSBC Bank USA, N.A. (‘HSBC Bank USA’) is subject to direct supervision and regulation by the Consumer Financial Protection Bureau (‘CFPB’), which has the authority to examine and take enforcement action related to compliance with US federal consumer financial laws and regulations. The Group’s US securities broker/dealer and investment banking operations are also subject to ongoing supervision and regulation by the Securities and Exchange Commission ('SEC'), the Financial Industry Regulatory Authority and other government agencies and self-regulatory organisations under US federal and state securities laws. Similarly, the Group’s US commodity futures, commodity options and swaps-related and client clearing operations are subject to ongoing supervision and regulation by the Commodity Futures Trading Commission (‘CFTC’), the National Futures Association and other self-regulatory organisations under US federal commodities laws. Furthermore, since we have substantial operations outside the US that conduct many of their day-to-day transactions with the US, HSBC entities’ operations outside the US are also subject to the extraterritorial effects of US regulation in many respects.
HSBC Holdings and its US operations are subject to supervision, regulation and examination by the FRB because HSBC Holdings is a ‘bank holding company’ ('BHC') under the US Bank Holding Company Act of 1956, as a result of its control of HSBC Bank USA and HSBC Trust Company (Delaware), N.A., Wilmington, Delaware (‘HTCD’). HNAH and HSBC USA Inc., are each a ‘bank holding company’ and HNAH is also an intermediate holding company (‘IHC’) regulated by the FRB. HSBC Holdings, HNAH and HSBC USA Inc. have elected to be financial holding companies pursuant to the provisions of the Gramm-Leach-Bliley Act and, accordingly, may affiliate with securities firms and insurance companies, and engage in other activities that are financial in nature or incidental or complementary to activities that are financial in nature.
Under regulations implemented by the FRB, if any financial holding company, or any depository institution controlled by a financial holding company, ceases to meet certain capital or management standards, the FRB may impose corrective capital and/or managerial requirements on the financial holding company and place limitations on its ability to conduct the broader financial activities permissible for financial holding companies. In addition, the FRB may require divestiture of the holding company’s depository institutions or its affiliates engaged in broader financial activities in reliance on the Gramm-Leach-Bliley Act if the deficiencies persist.
The regulations also provide that if any depository institution controlled by a financial holding company fails to maintain a satisfactory rating under the Community Reinvestment Act of 1977, the FRB must prohibit the financial holding company and its subsidiaries from engaging in any additional activities other than those permissible for bank holding companies that are not financial holding companies.
The two US banks, HSBC Bank USA and HTCD, are subject to regulation and examination primarily by the OCC. HSBC Bank USA and HTCD are subject to additional regulation and supervision by the FDIC, the Consumer Financial Protection Bureau and the FRB. Banking laws and regulations restrict many aspects of their operations and administration, including the establishment and maintenance of branch offices, capital and reserve requirements, deposits and borrowings, investment and lending activities, payment of dividends and numerous other matters.
In 2019, the FRB and the other US banking regulators jointly finalised rules that would tailor the application of the enhanced prudential standards for large US banking organisations and certain foreign banking organisations (the ‘Tailoring Rules’). The Tailoring Rules assign each BHC and US IHC with $50bn or more in total US assets to one of five categories based on their relative
Other information | Regulation and supervision
size and complexity and assessed on asset size, cross-jurisdictional activity, reliance on short-term wholesale funding, nonbank asset size, and off-balance sheet exposures. As of 31 December, 2021, HNAH and HSBC Bank USA were subject to Category III standards. As of 1 January 2022, HNAH met the criteria to be re-classified as a Category IV firm and the enhanced prudential standards applicable to HNAH and HSBC Bank USA are expected to change commensurate with their risk profile.
Following implementation of the Basel III capital framework by the US banking regulators, HNAH, HSBC USA Inc. and HSBC Bank USA are required to maintain minimum capital ratios (exclusive of any capital buffers), including a minimum Tier 1 leverage ratio of 4%, and a minimum total risk-based capital ratio of at least 8%. Through 31 December 2021, HNAH and HSBC Bank USA were subject to a minimum supplementary leverage ratio ('SLR') of 3%. HNAH, HSBC USA Inc. and HSBC Bank USA each calculate their risk-based capital requirements as Non-Advanced Approaches banks in accordance with the Basel III rule as adopted by US banking regulators. As a result of HNAH's re-classification as a Category IV firm, HNAH and HSBC Bank USA expect to no longer be subject to the SLR or the countercyclical capital buffer, but continue to review the composition of their capital structure and capital buffers in light of these developments. Over and above the minimum risk-based requirements, HNAH is subject to a Stress Capital Buffer (‘SCB’), which has replaced the static 2.5% Capital Conservation Buffer (‘CCB’) and is floored at 2.5%. HSBC USA Inc. and HSBC Bank USA continue to be subject to the static 2.5% CCB. Compliance with the SCB/CCB does not represent minimum requirements per se, but rather a necessary condition to allow capital distributions and discretionary bonus payments. In addition to stress testing requirements imposed under the FRB’s Comprehensive Capital Analysis and Review ('CCAR'), the Dodd-Frank Act Stress Test (‘DFAST’) requires that HNAH undergo supervisory stress tests conducted by the FRB.
Under CCAR, the FRB assesses whether the largest US banking organisations have sufficient capital to continue operations throughout times of economic and financial stress and whether they have robust, forward-looking capital-planning processes that account for their unique risks. As part of the CCAR process, the FRB undertakes a supervisory assessment of the capital adequacy of bank holding companies, including HNAH, based on a review of a comprehensive capital plan submitted by each participating bank holding company to the FRB that describes the company’s planned capital actions, such as plans to pay or increase common stock dividends, reinstate or increase common stock repurchase programmes, or redeem preferred stock or other regulatory capital instruments, during the nine-quarter review period, as well as the results of stress tests conducted under different hypothetical macroeconomic scenarios, including a severely adverse scenario provided by the FRB.
HNAH submitted its CCAR capital plan and company-run DFAST results in April 2021. The company-run stress tests are forward-looking exercises to assess the impact of hypothetical macroeconomic baseline and severely adverse scenarios provided by the FRB, and internally developed scenarios for both the periodic exercises, on the financial condition and capital adequacy of a bank holding company over a nine-quarter planning horizon.
As a result of re-classification as a Category IV firm, HNAH expects to no longer be subject to company-run stress testing and related disclosure requirements. Category IV firms are subject to supervisory stress testing on an every-other-year basis, although they may opt into such testing in an "off year" in order to recalibrate their SCB based on their most recent supervisory stress test. The SCB equals (i) a CCAR firm's projected decline in common equity tier 1 under the CCAR supervisory severely adverse stress testing scenario plus (ii) one year of planned common stock dividends. In response to the Covid-19 pandemic, during the first six months of 2021, the FRB imposed additional restrictions on certain capital distributions for CCAR firms separate from the SCB. These additional capital distribution restrictions were lifted on 1 July 2021. In August 2021, the FRB announced a new SCB for participating CCAR firms based on 2021 CCAR stress tests, which took effect 1 October 2021. The FRB continues to
supervise Category IV firms on an ongoing basis, including evaluation of the capital adequacy and capital planning processes during off-cycle years.
HNAH already utilizes an internal capital assessment approach that is analogous to the SCB and continues to review the composition of its capital structures and capital buffers in light of these developments.
Under the Tailoring Rules, certain US banking organizations are subject to the US LCR rule and are required to report their LCRs to US regulators on a daily basis. An 85 percent LCR requirement applies to Category III firms with weighted short-term wholesale funding under $75 billion and their depository institution subsidiaries. As a result, under the US LCR rule, a LCR of 100 percent or higher reflects an unencumbered HQLA balance that is equal to or exceeds 85 percent of a Category III firm's liquidity needs for a 30 calendar day liquidity stress scenario. In 2020, US regulators issued a final rule to implement the NSFR in the US, applicable to certain large banking organizations, including HNAH and HSBC Bank USA, which took effect on 1 July 2021. Consistent with the Tailoring Rules, an 85 percent NSFR requirement applies to Category III firms with weighted short-term wholesale funding under $75 billion and their depository institution subsidiaries. As a result, under the US NSFR rule, a NSFR of 100 percent or more reflects an available stable funding balance from liabilities and capital over the next 12 months that is equal to or exceeds 85 percent of a Category III firm's required amount of funding for assets and off-balance sheet exposures. As a result of HNAH re-classification as a Category IV firm, HNAH and HSBC Bank USA expect to be subject to a further reduced US LCR and NSFR requirement of 70 percent so long as HNAH's weighted short-term wholesale funding equals or exceeds $50 billion. As a Category III firm, HNAH was subject to liquidity stress testing on a monthly basis and related liquidity buffer and liquidity risk management requirements. As a Category IV firm, HNAH remains subject to liquidity risk management and liquidity buffer requirements, but would be subject to liquidity stress testing on a quarterly, rather than monthly basis.
Simultaneous with the Tailoring Rules, the FRB and FDIC jointly adopted revisions to the regulations implementing the SIFI Plan requirements in the Dodd-Frank Act (the ‘SIFI Plan Rule’).
Under the SIFI Plan Rule, HSBC Holdings is required to file a resolution plan every three years, alternating between a full resolution plan and a targeted resolution plan, which would generally be limited to core areas such as capital and liquidity, as well as material changes in other areas. HSBC submitted its latest SIFI Plan, which was a targeted plan, in December 2021. As a result of HNAH's re-classification as a Category IV firm, HSBC would be required to submit a reduced SIFI Plan every three years. Reduced plans generally include only changes to the firm's plan since its previous filing. The SIFI Plan Rule did not revise the resolution plan requirements applicable to HSBC Bank USA, which are administered solely by the FDIC. In April 2019, the FDIC requested comment on an advance notice of proposed rulemaking that would alter the FDIC’s separate resolution plan requirements for insured depository institutions (the 'IDI Plan') with total consolidated assets of at least $50bn (‘Covered IDIs’), including HSBC Bank USA. The proposal delayed the requirement for HSBC Bank USA (as well as other Covered IDIs) to file a resolution plan under the FDIC’s current rules until a future date to be specified by the FDIC. Consequently, HSBC Bank USA has not been required to file an IDI Plan since 2018. In January 2021, the FDIC announced it will resume requiring IDI Plan submission for banks with $100 billion or more in assets (‘Large IDIs’) and will provide at least
12 months advance notice to firms required to submit IDI Plans. The FRB has separately established a framework for recovery plans, although HSBC is not currently required to submit a recovery plan to US regulators unless specifically requested to do so. The FRB limits credit exposures to single counterparties for large BHCs and IHCs, including HNAH. As a Category III firm, HNAH, together with its subsidiaries, is prohibited from having net credit exposure to a single unaffiliated counterparty in excess of 25% of HNAH's Tier 1 capital. As a result of re-classification as a Category IV firm, HNAH expects to no longer be directly subject to
these single counterparty credit limits. Independent of HNAH's re-classification to a Category IV firm, HNAH, together with its subsidiaries, could become subject to a separate limit on its exposures to certain unaffiliated systemically important counterparties if its parent, HSBC, cannot certify its compliance with a large exposure regime in the UK that is consistent with the Basel large exposure framework.
In 2018, the FRB adopted final rules implementing the FSB’s TLAC standard. The rules require that IHCs of non-US G-SIBs, including HNAH, maintain minimum amounts of TLAC that may include minimum levels of tier 1 capital and long-term debt satisfying certain eligibility criteria, and a related TLAC buffer commencing
1 January 2019 without the benefit of a phase-in period. In October 2020, the FRB finalised a proposal to align the calculation of TLAC buffer for US IHCs of non-US G-SIBs with the calculation methodology used by US G-SIBs which took effect on 1 April 2021. The TLAC rules also include ‘clean holding company requirements’ that impose limitations on the types of financial transactions HSBC’s US IHC, HNAH, may engage in. HNAH maintains TLAC and long-term debt to support compliance with the TLAC rules and will continue to assess if additional long-term debt is needed to remain compliant in future periods.
In September 2017, HSBC Holdings and HNAH entered into a consent order with the FRB in connection with its investigation into HSBC’s historical foreign exchange activities, which requires HSBC Holdings and HNAH to undertake certain remedial steps.
The US government response to the Covid-19 pandemic included enactment of the Coronavirus Aid, Relief, and Economic Security Act (‘CARES Act’) and a number of emergency lending and liquidity facilities established by the FRB. The CARES Act provides financial institutions with the option to temporarily suspend certain requirements under US GAAP for loan modifications related to Covid-19 and any determination that a loan modified as a result of Covid-19 is a troubled debt restructuring (including impairment for accounting purposes). The CARES Act also created the Paycheck Protection Program (the ‘PPP’), a programme designed to aid small- and medium-sized businesses through federally guaranteed loans distributed through banks. In December 2020, additional federal stimulus legislation was enacted, which included additional funding for the PPP. HSBC Bank USA participated in the PPP program. Throughout 2020, the US banking regulators issued a number of regulatory rule changes in response to the Covid-19 pandemic, including the following key rules:
In March 2020, the US banking regulators issued an interim final rule allowing US banks the option to delay, over a five-year transition period, the regulatory capital impacts of implementing the Current Expected Credit Loss accounting standard. In May 2020, the US banking regulators issued an interim final rule allowing banks that are subject to the SLR to temporarily exclude on-balance sheet US Treasury securities and deposits held at the Federal Reserve from the SLR denominator until 31 March 2021.
Title VII of the Dodd-Frank Act provides for an extensive framework for the regulation of over-the-counter (‘OTC’) derivatives by the CFTC and the SEC, including mandatory clearing, exchange trading, and public and regulatory transaction reporting of certain OTC derivatives, as well as rules regarding the registration of swap dealers, major swap participants, security-based swap (‘SBS’) dealers, and major SBS participants and related capital, margin, business conduct, record keeping and other requirements applicable to such entities.
The CFTC has adopted rules implementing the most significant provisions of Title VII. In particular, HSBC Bank USA and HSBC Bank plc are provisionally registered as swap dealers with the CFTC. Because HSBC Bank plc is a non-US swap dealer, application of certain CFTC requirements is limited to HSBC Bank plc's swap transactions with US persons and certain affiliates of US persons. In July 2020, the CFTC finalised rules that largely codified existing cross-border guidance and existing no action relief issued to date for transactions between non-US persons.
The cross-border application of CFTC requirements that were not addressed in the final rule, including mandatory clearing,
exchange trading and public transaction reporting requirements, remain subject to prior CFTC guidance and, where applicable, exemptive relief until the CFTC addresses each in further rulemakings. In addition, the CFTC has continued to permit UK-based swap dealers (e.g., HSBC Bank plc) to temporarily rely on existing substituted compliance orders for comparable EU regulations to satisfy certain CFTC requirements. The ability of HSBC Bank plc to transact with non-US persons and compete with other non-UK swap dealers could be negatively affected were existing CFTC exemptive relief to expire or additional CFTC requirements to apply.
In October 2020, the CFTC finalised rules that applied position limits to certain futures contracts as of 1 January 2021 and will apply position limits to certain swaps as of 1 January 2023
The expansion of position limits requirements for swaps will significantly increase the burden and cost of executing certain commodity swaps and may adversely affect HSBC to a greater extent than some of our competitors.
Also, HSBC Bank plc and HSBC Bank USA engage in equity and credit derivatives businesses that are subject to the SEC’s jurisdiction to regulate security-based swaps (‘SBS’) under Title VII of the Dodd-Frank Act. The SEC has finalised the key rules governing the application of Title VII requirements to SBS dealers and major SBS participants. The registration requirements and other rules applicable to SBS dealers and major SBS participants generally came into effect on 1 November 2021. Both HSBC Bank plc and HSBC Bank USA registered with the SEC as SBS dealers prior to that date.
While the SEC’s rules have largely paralleled many of the CFTC’s rules, key differences between the final CFTC and SEC rules could materially increase the compliance costs associated with, and hinder the efficiency of, our equity and credit derivatives businesses with US persons.
The SEC has issued final orders for substituted compliance for non-US, SEC-registered SBS dealers that are subject to certain UK regulations, which would allow such SBS dealers to comply with certain SBS requirements via compliance with corresponding requirements of the UK.
HSBC Bank plc expects to avail itself of such substituted compliance, which reduces the extent of its burden of having to reconcile compliance with conflicting SEC and UK requirements. However, the order includes extensive conditions and limitations, especially with respect to certain counterparty protection and financial reporting requirements, which will limit the extent to which HSBC Bank plc may avail itself of substituted compliance and subject HSBC Bank plc to additional costs and burdens.
In 2015, the US banking regulators, adopted final rules establishing margin requirements for non-cleared swaps and SBS. Subject to certain exceptions, the final margin rules require HSBC Bank USA and HSBC Bank plc to collect and post initial and variation margin for non-cleared swaps and SBS entered into with other swap dealers and financial end-users that exceed a minimum threshold of transactional activity and for financial end-users that do not meet the minimum transactional activity threshold, to collect and post variation margin (but not initial margin).
The margin rules also limit the types of assets that are eligible to satisfy initial and variation margin requirements, require initial margin to be segregated at a third-party custodian, impose requirements on internal models used to calculate initial margin requirements and contain specific provisions for cross-border and inter-affiliate transactions. The margin rules follow a phased implementation schedule with additional counterparties becoming subject to initial margin requirements in September 2021 and September 2022, depending on the transactional volume of the parties and their affiliates. These final rules, as well as parallel non-cleared swaps and SBS margin rules from the CFTC, the SEC and certain non-US regulators increase the costs and liquidity burden associated with trading non-cleared swaps and SBS, and may adversely affect our business in such products.
Other information | Regulation and supervision
In June 2020, the US banking regulators finalized a rule that makes significant amendments to the margin rules, including (i) mostly exempting swap entities from needing to collect initial margin for swaps with affiliates; (ii) preserving legacy status for swaps that are amended to replace certain interest rate provisions or due to technical amendments, notional reductions, or portfolio compression exercises; (iii) clarifying the time at which initial margin trading documentation must be in place; and (iv) adding a new compliance phase for initial margin requirements. The amendments in the final rule took effect 31 August 2020, which reduced the amount of initial margin HSBC Bank USA and HSBC Bank plc need to collect from many of their affiliates.
Dodd-Frank grants the SEC discretionary rule-making authority to modify the standard of care that applies to brokers, dealers and investment advisers when providing personalised investment advice to retail customers and to harmonise other rules applying to these regulated entities. In June 2019, pursuant to this authority, the SEC finalised a rule that requires broker-dealers to act in the best interest of a retail customer when making a recommendation of any securities transaction or investment strategy involving securities. This rule impacts the manner in which business is conducted with customers seeking investment advice and may affect certain investment product offerings.
Dodd-Frank also expands the extra-territorial jurisdiction of US courts over actions brought by the SEC or the US with respect to violations of the anti-fraud provisions in the Securities Act, the Securities Exchange Act of 1934 and the Investment Advisers Act of 1940. In addition, regulations which the FSOC, the Consumer Financial Protection Bureau or other regulators may adopt could affect the nature of the activities that our FDIC-insured depository institution subsidiaries may conduct, and may impose restrictions and limitations on the conduct of such activities. The implementation of the remaining Dodd-Frank provisions could result in additional costs or limit or restrict the way we conduct our business in the US.
Global and regional prudential and other regulatory developments
The Group is subject to regulation and supervision by a large number of regulatory bodies and other agencies. In addition to changes being introduced at a country level, changes are often driven by global bodies such as the G20, the FSB and the Basel Committee, which are then implemented at country level or regionally, sometimes with modifications and with separate additional measures.
We are also subject to regulatory stress testing in many jurisdictions. These have increased both in frequency and in the granularity of information required by supervisors. They include the programmes of the BoE, the FRB (as explained in the ‘US regulation and supervision’ section), the OCC, the EBA, the ECB, the HKMA and other regulators. For further details, see ‘Stress testing’ on page 109. On prudential changes, further details can be found in the ‘Regulatory developments’ section on page 6 of the Pillar 3 Disclosures as at 31 December 2021.
Recovery and resolution
As outlined above, the HSBC Group is subject to recovery and resolution requirements in many of the jurisdictions in which it operates. In the UK, the Banking Act implemented the BRRD to create the SRR. Under the SRR, the Authorities are granted substantial powers to resolve and stabilise UK-incorporated institutions. In Europe, the BRRD establishes a framework for the recovery and resolution of EU credit institutions and investment firms. This framework applies where HSBC has operating banks in the European region, including France and Malta. In Hong Kong, the Banking Ordinance and Financial Institutions (Resolution) Ordinance sets out requirements for recovery and resolution planning, respectively. In the US, the Board of Governors of the Federal Reserve System ('FRB') and Federal Deposit Insurance Corporation ('FDIC') have jointly implemented Dodd-Frank Act resolution planning requirements for depository institution holding companies that are at or above certain thresholds. The FDIC has a separate resolution planning requirement for insured depository institutions (the ‘IDI Plan’). The FRB has separately established a framework for recovery plans, although HSBC is not currently required to submit a recovery plan to US regulators unless specifically requested to do so. In general, each respective part of the HSBC Group is responsible for ensuring that it meets local recovery and resolution requirements where they exist, which are mainly applicable only to those regulated entities in a particular jurisdiction. The PRA and BoE, however, represent the lead regulators from a prudential and resolution perspective for the consolidated HSBC Group.
Recovery
HSBC maintains recovery plans that are designed to outline credible actions that the HSBC Group could implement in the event of severe stress in order to restore its business to a stable and sustainable condition. HSBC typically submits recovery plans on an annual basis both to the PRA and to other regulators that have implemented recovery planning requirements. HSBC’s recovery plans are frequently re-appraised, and this involves stress testing and ‘fire drill’ tests at the Group and material entity levels.
Resolution
In general terms, resolution refers to the exercise of statutory powers where a financial institution and/or its parent or other group company is deemed by its regulators to be failing, or likely to fail and it is not reasonably likely that action could be taken that would result in the institution recovering.
In view of the HSBC Group’s corporate structure, which comprises a group of locally regulated operating banks, the preferred resolution strategy for the HSBC Group, as confirmed by its regulators, is a multiple point of entry (‘MPE’) bail-in strategy. This provides flexibility for HSBC to be resolved (i) through a bail-in at the HSBC Holdings level, which enables the recapitalisation of operating bank subsidiaries in the HSBC Group (as required) while restructuring actions are undertaken, with the HSBC Group remaining together; or (ii) at a local subsidiary level pursuant to the application of statutory resolution powers by local resolution authorities.
In the event of a resolution of the HSBC Group, it is anticipated that the MREL issued externally by HSBC Holdings would be written down or converted to equity by the BoE using its statutory powers. This would enable subsidiaries of the HSBC Group to be recapitalised, as needed, to support the resolution objectives and maintain the provision of critical functions. Recapitalisation of operating bank subsidiaries could be achieved through the write-down, or conversion to equity, of internally issued MREL, TLAC or LAC. It is anticipated that this approach to recapitalising the HSBC Group’s operating bank subsidiaries would allow the HSBC Group to stay together in order to ensure an effective stabilisation of the HSBC Group, as a whole, whilst also facilitating an orderly restructuring process, as needed, to remediate the cause of resolution. Any resolution of HSBC as a group would be coordinated by the BoE.
Given the HSBC Group’s corporate structure, HSBC is overseen by various regulators and resolution authorities, such as its lead
global regulators and resolution authority, the BoE and the PRA and a number of host regulators and resolution authorities, such as the ECB, the European Banking Union’s Single Resolution Board, the HKMA, and, in the US, the FRB, FDIC and OCC. Many of these host resolution authorities have statutory resolution powers which could be applied to subsidiaries of the HSBC Group in their jurisdictions. The application of these local statutory resolution powers may result in one or more individual resolution authorities leading a local resolution of the subsidiaries within their jurisdiction. This may or may not result in such subsidiaries ceasing to be part of the HSBC Group, depending on the resolution strategy adopted by the relevant resolution authority.
HSBC considers that a bail-in at the HSBC Holdings level that enables subsidiaries in the HSBC Group to be recapitalised, (as required), and the subsequent implementation of restructuring actions while the HSBC Group remains together, is the strategy most likely to deliver the most effective resolution outcome for the HSBC Group’s stakeholders.
In July 2019, the BoE and PRA published final policies on the Resolvability Assessment Framework ('RAF'), which places the onus on firms to demonstrate their own resolvability and is designed to increase transparency and accountability for resolution planning. In order to be considered resolvable, HSBC must meet three outcomes (i) have adequate resources in resolution; (ii) be able to continue business through resolution and restructuring; and (iii) be able to co-ordinate its resolution and communicate effectively with stakeholders.
The RAF requires HSBC to prepare a report on the HSBC Group’s assessment of its resolvability, which must be submitted to the PRA on a biennial basis. HSBC submitted its first such report to the PRA in October 2021 and will publish a public summary of the report in June 2022. The BoE will similarly publish a statement concerning the resolvability of HSBC at the same time.
HSBC continues to engage with the BoE, PRA and its global regulators in other jurisdictions to ensure that it meets current and future recovery and resolution requirements.
UK's withdrawal from the EU
Through the UK’s membership of the EU, HSBC was both directly and indirectly subject to EU financial services regulation. The UK left the EU on 31 January 2020 but was subject to EU law during a transition period, which ended on 31 December 2020. At the end of the transition period, the HSBC Group and its subsidiaries in the UK ceased to be subject to EU law. However, EU law continues to apply to HSBC’s EU subsidiaries.
On 30 December 2020, the UK and the EU signed a Trade and Cooperation Agreement ('TCA') setting out their future relationship. The UK Parliament ratified the TCA the same day and the EU completed its ratification process in April 2021. The financial services provisions of the agreement are limited. In particular, the TCA provided no new arrangements to replace the "passporting" arrangements which previously allowed UK and EU firms access to the others markets. The agreement preserves the respective rights of both the UK and EU to put in place measures for prudential reasons. In a declaration accompanying the TCA, the UK and EU have agreed to establish structured regulatory cooperation on financial services, with the aim of establishing a durable and stable relationship. The declaration states that these arrangements will allow for ‘transparency and appropriate dialogue in the process of adoption, suspension and withdrawal of equivalence decisions’ and ‘enhanced cooperation and coordination’. On 26 March 2021, the EU and UK announced the completion of negotiations for a Memorandum of Understanding establishing a Joint UK-EU Financial Regulatory Forum to serve as a platform for dialogue on financial services issues
During the transition period, the UK implemented EU legislative changes that were scheduled to enter into force before the end of the transition period. Certain changes that were scheduled to enter into force after 31 December 2020 have been implemented separately by the UK under the Financial Services Act (the ‘Act’) which gave powers to HMT to revoke rules within the CRR where they were superseded by new rules published by the Basel
Committee. The Act contains a specified list of publications by the Basel Committee that may be used as a basis to revoke the CRR. This includes all of the papers that form the basis of the Basel III Reforms, including those that have been enacted by the EU as part of its amendments to the CRR (‘CRR2’).
The PRA is responsible for designing and writing the new rules. The Act does not require that the PRA implement rules that replicate the Basel III Reforms in the UK; instead, the PRA has been given the discretion to decide the substance of the rules, having regards to the likely effect of the rules on the relative standing of the UK as a place for internationally active banks to be based or to carry on activities.
In the EU, the principal changes arising from the CRR2 entered into force in June 2021. In order to give firms a reasonable time to implement following the finalisation of the rules, the UK’s implementation of equivalent rules was delayed until 1 January 2022. This includes the changes to the RWA rules on counterparty risk, equity investments in funds and market risk, NSFR and the leverage ratio.
Financial crime regulation
HSBC has built a strong financial crime risk management framework across its global business and functions. We are committed to acting with integrity, and conducting our activities in each of the countries and territories in which we operate around the world in accordance with all applicable laws and regulations relating to financial crime; money laundering, terrorist financing and proliferation financing, tax evasion, bribery and corruption, sanctions and fraud.
HSBC has established a global anti-money laundering ('AML') programme which is designed to enable the bank to mitigate the money laundering, terrorist financing and proliferation financing risks that we may face. HSBC’s Global AML Policy is informed by applicable laws, regulations and regulatory guidance of the United Kingdom, Hong Kong Special Administrative Region, the European Union and the United States of America, although where country requirements are more stringent, the HSBC business or entity will apply local standards. The AML programme is designed to enable our employees to detect, prevent and manage money laundering risks, and we continue to evolve our AML programme in light of emerging risks and new regulations.
Technical and digital innovation in the financial sector continues apace and we are actively monitoring developments, defining risk appetite and appropriate controls to manage the risks of digital assets and currencies and, more generally, the effects of accelerated digitisation as a result of the Covid-19 pandemic, which has seen changes in customer behaviour and required enhancements to our transaction monitoring capabilities.
We have also spent time and attention on the detection, deterrence and disruption of terrorist financing and proliferation financing, as well as on our commitment to act with integrity and conduct our global activities in accordance with all applicable laws and regulations relating to tax evasion and tax evasion facilitation risks. These include the UK Corporate Criminal Offence for failing to prevent the criminal facilitation of tax evasion which has extra-territorial reach.
HSBC’s Global Sanctions Policy is derived from the sanctions resolutions, laws, regulations and regulatory guidance of the United Nations, the United Kingdom, the Hong Kong Special Administrative Region, the European Union and the United States of America and takes into account broader financial crime concerns. The Policy seeks, subject to the primacy of local law, to establish a globally consistent standard to effectively manage sanctions compliance risk across all HSBC legal entities in all jurisdictions in which HSBC operates.
The external sanctions environment remains dynamic, and sanctions regimes are increasingly complex and less predictable as geopolitical tensions continue to rise, particularly between the US and China but increasingly extending to the UK, the EU, India and other countries, and more recently as between Russia and the US, the UK and the EU in response to an escalation of hostilities
Other information | Regulation and supervision
relating to Ukraine. Other material sanctions regulatory developments in 2021 include, but are not limited to: new EU, UK and US debt, equity and insurance restrictions involving the Government of Belarus as well as certain EU and UK trade restrictions involving Belarus. Further, the new autonomous UK sanctions regulations, which became effective following expiry of the Brexit transition period, with notable divergences from the EU in relation to Libya and Russia. HSBC continues to monitor regulatory developments and their impact to HSBC’s Global Sanctions Policy and risk appetite. We do not consider that our business activities with counterparties with whom transactions are restricted under applicable sanctions are material to our business for the year ended 31 December 2021.
HSBC requires compliance with all applicable anti-bribery and corruption laws in all markets and jurisdictions in which we operate. These include the UK Bribery Act, the US Foreign Corrupt Practices Act, the Hong Kong Prevention of Bribery Ordinance and France's "Sapin II" law. We have a global anti-bribery and corruption policy, which gives practical effect to these laws and regulations, but also requires compliance with the spirit of laws and regulations to demonstrate HSBC’s commitment to ethical behaviours and conduct as part of our environmental, social and corporate governance.
HSBC provides annual mandatory AB&C training to all staff and carries out regular risk assessments, monitoring and testing of its AB&C programme, with any applicable findings included within the annual AB&C Policy refresh. HSBC also maintains clear whistleblowing policies and processes, to ensure that individuals can confidentially report concerns.
In December 2012, Holdings entered into a cease-and-desist order with the Federal Reserve Board (the “2012 Order”) and agreed to an undertaking with the Financial Services Authority (replaced with a Direction from the UK Financial Conduct Authority in 2013 and again in 2020 (the “FCA Direction”)), both of which contained certain forward-looking obligations in relation to HSBC’s AML and sanctions compliance programme. The 2012 Order and the FCA Direction remain in effect as of year-end 2021.
| | |
| Disclosures pursuant to Section 13(r) of the Securities Exchange Act |
Section 13(r) of the Securities Exchange Act requires each issuer registered with the SEC to disclose in its annual or quarterly reports whether it or any of its affiliates have knowingly engaged in specified activities or transactions with persons or entities targeted by U.S. sanctions programmes relating to Iran, terrorism, or the proliferation of weapons of mass destruction, even if those activities are not prohibited by U.S. law and are conducted outside the U.S. by non-U.S. affiliates in compliance with local laws and regulations.
To comply with this requirement, HSBC Holdings plc (together with its affiliates, “HSBC”) has requested relevant information from its affiliates globally. The following activities conducted by HSBC are disclosed in response to Section 13(r):
Legacy contractual obligations related to guarantees
Between 1996 and 2007, we provided guarantees to a number of our non-Iranian customers in Europe and the Middle East for various business activities in Iran. In a number of cases, we issued counter indemnities involving Iranian banks as the Iranian beneficiaries of the guarantees required that they be backed directly by Iranian banks. The Iranian banks to which we provided counter indemnities included Bank Tejarat, Bank Melli, and the Bank of Industry and Mine.
There was no measurable gross revenue in 2021 under those guarantees and counter indemnities. We do not allocate direct costs to fees and commissions and, therefore, have not disclosed a separate net profit measure. We are seeking to cancel all relevant guarantees and counter indemnities, and we do not currently intend to provide any new guarantees or counter indemnities involving Iran. Three guarantees were cancelled in 2021, and approximately 14 remain outstanding.
Other relationships with Iranian banks
Activity related to U.S.-sanctioned Iranian banks not covered elsewhere in this disclosure includes the following:
•We act as the trustee and administrator for a pension scheme involving eight employees of a U.S.-sanctioned Iranian bank in Hong Kong. Under the rules of this scheme, we accept contributions from the Iranian bank each month and allocate the funds into the pension accounts of the Iranian bank’s employees. We run and operate this pension scheme in accordance with Hong Kong laws and regulations. Estimated gross revenue, which includes fees and/or commissions, generated by this pension scheme during 2021, was approximately $3,011.
For the Iranian bank related-activity discussed above, we do not allocate direct costs to fees and commissions and, therefore, have not disclosed a separate net profit measure.
We have been holding a safe custody box for the Central Bank of Iran. For a number of years, the box has not been accessed by the Central Bank of Iran, and no fees have been charged to the Central Bank of Iran.
We currently intend to continue to wind down the above activities, to the extent legally permissible, and not enter into any new such activity.
Activity related to U.S. Executive Order 13224
During 2021, we processed a small number of low-value domestic local currency payments on behalf of UK customers to a UK-registered charity that is designated under Executive Order 13224, but that is not sanctioned by the UK, EU, or the United Nations Security Council.
HSBC maintained accounts for two individual customers in the Middle East who were designated under Executive Order 13224 in 2021. The accounts were closed and exited during 2021. HSBC
engaged in three local currency domestic transactions as part of the exit processes for the two customers.
There was no measurable gross revenue or net profit to HSBC during 2021 relating to these transactions.
Other activity
HSBC has an insurance company customer in the United Arab Emirates that, during 2021, made local currency payments for the reimbursement of medical treatment to a hospital located in the United Arab Emirates and owned by the Government of Iran. HSBC processed these payments from its customer to the hospital.
HSBC has four individual customers in the United Arab Emirates that, during 2021, made local currency payments for medical treatment to a hospital located in the United Arab Emirates and owned by the Government of Iran. HSBC processed these payments from its customers to the hospital.
HSBC has customers in the United Arab Emirates that, during 2021, received local currency checks from an insurance company owned by the Government of Iran. HSBC processed these checks from the insurance company to its customers.
HSBC has three customers in France that, during 2021, received local currency payments from a bank owned by the Government of Iran in relation to management charges and office supplies for property owned by the bank. HSBC processed these payments to its customers.
HSBC has an individual customer in Hong Kong that, during 2021, received local currency salary payments from a bank owned by the Government of Iran. HSBC processed these payments to its customer.
HSBC has a customer in Hong Kong that, during 2021, received local currency payments, for rental income and management fees, from a bank owned by the Government of Iran. HSBC processed these payments to its customer.
HSBC has an individual customer in Malta that, during 2021, made a Euro-denominated payment to the Iranian Consulate in Rome for passport renewal fees. HSBC processed this payment.
The HSBC Group has an individual customer in the UK that, during 2021, was identified as a director of a bank owned by the Government of Iran. The HSBC Group processed a number of local currency domestic payments for its customer.
HSBC has an international organisation as a customer in France that, during 2021, received a local currency payment from the Iranian Embassy in Austria for membership fees. HSBC processed this payment.
HSBC has individual customers in the Middle East that, during 2021, made local currency credit card payments to an Iranian Consulate for visa, birth certificate, passport, dual citizenship, and marriage license application fees. HSBC processed these payments.
For these activities, there was no measurable gross revenue or net profit to HSBC during 2021.
Frozen accounts and transactions
We maintain several accounts that are frozen as a result of relevant sanctions programmes, and safekeeping boxes and other similar custodial relationships, for which no activity, except as licensed or otherwise authorised, took place during 2021. There was no measurable gross revenue or net profit to HSBC during 2021 relating to these frozen accounts.
| | | | | |
| Corporate governance report |
The corporate governance report gives details of our Board of Directors, senior management, and Board committees. It outlines key aspects of our approach to corporate governance, including internal control.
It also includes the Directors’ remuneration report, which explains our policies on remuneration. |
| Page |
| Group Chairman's governance statement | |
| The Board | |
| Senior management | |
| |
| How we are governed | |
| Board activities during 2021 | |
| |
| |
| |
| Board and committee effectiveness, performance and accountability | 270 | |
| Board committees | |
| Directors' remuneration report | |
| Share capital and other related disclosures | |
| Internal control | |
| Going concern | |
| Employees | |
| Statement of compliance | |
| |
We have a comprehensive range of policies and systems in place designed to help ensure that the Group is well managed, with effective oversight and control.
Report of the Directors | Corporate governance report
| | |
Group Chairman's governance statement The Board and its committees continued to operate well in a challenging environment, and focused on enhancing governance practices.
|
"Following the launch of the Group’s refreshed purpose, strategy and values in March, we introduced a 'culture moment' at the beginning of each Board meeting."
Dear Shareholder
The global health crisis continued into 2021 as a result of the Covid-19 pandemic. Despite promising developments in relation to the efficacy of vaccines in combating the virus, there remained significant restrictions across our markets. It was therefore important that our governance framework and practices remained flexible to ensure that the Board could effectively discharge its duties.
While the Board and its committees have operated well in a virtual environment, it was unfortunate that we were again unable to come together physically as a Board. It has been two years since the full Board was last together in person for a Board meeting, with five new Directors appointed in that time. I hope to hold in-person meetings as soon as it is safe to do so, particularly in our largest markets of Hong Kong and the UK.
We continued our focus on enhancing our governance practices throughout the year, with key decisions and areas of focus set out in further detail below.
Board changes
A key aspect of my role as Group Chairman is ensuring that collectively the Board has the skills, knowledge and experience it requires. The Nomination & Corporate Governance Committee retained a keen focus on succession planning during the year. For further details on its work, see page 273. We are currently in the process of completing a search for new non-executive Directors to join our Board, with knowledge and experience of banking and Asia a priority. The Committee is actively progressing this search and will provide an update in due course.
There were a number of changes to the Board during 2021, with Laura Cha, Heidi Miller and Henri de Castries retiring following our 2021 Annual General Meeting ('AGM') in May, and Rachel Duan and Dame Carolyn Fairbairn appointed with effect from 1 September.
We also recently announced that, in line with our succession planning and having each served on the Board for six years, Irene Lee and Pauline van der Meer Mohr would step down from the Board at the conclusion of our 2022 AGM in April. Irene’s existing roles on our subsidiary boards in Asia are not impacted by her retirement from the Holdings Board. On behalf of the Board, I wish to thank Irene and Pauline for their outstanding dedication and the enormous contributions they have made to the success of HSBC during their time on the Board. We wish them both well in their future endeavours.
Purpose, strategy and values
Following the launch of the Group’s refreshed purpose, strategy and values in March, we introduced a 'culture moment' at the beginning of each Board meeting. These discussions have allowed Board members to share their insights on the culture of the Group, and have raised awareness of employee and stakeholder perspectives in the Boardroom. This has supported the Board in helping to create greater alignment between culture and strategy, and in driving a tone from the top focused on the Group’s purpose of opening up a world of opportunity.
Technology governance
Digitise at scale is one of our four strategic pillars and reflects the increasingly important role that technology plays in delivering for our customers. It is therefore critical that our governance helps enable the Board to effectively shape and oversee progress against our technology strategy. As such, we took the decision to establish the Technology Governance Working Group at the beginning of 2021 to determine the most effective approach for the Board to discharge its responsibilities in relation to technology strategy and oversight.
The Co-Chairs of the Technology Governance Working Group presented to the Board in January 2022 on their work during 2021. In light of the significant role that technology will continue to play in the Group's strategy, it was recommended that the Technology Governance Working Group continues to meet throughout 2022. The Board agreed to continue with the Technology Governance Working Group in its current format through 2022, but with the scope extended to include a focus on business execution of the technology strategy. This will allow for a better understanding of the progress, challenges involved in implementing the strategy and the impact on key stakeholders.
Environmental, social and governance
The Board recognises the growing importance of ESG and oversees the ESG agenda. It was a significant year for the Group in its efforts to support the transition to net zero – a key pillar of our overall Group strategy – with the passing of our climate resolution at our 2021 AGM and the publication of our thermal coal phase-out policy, being two of the most notable achievements. Given its significance, the Board has decided to retain responsibility for development and oversight of our ESG strategy directly, rather than establishing a specific Board-level committee and we will include a dedicated item on our agenda for ESG matters. Within their existing responsibilities, the Group Risk Committee, Group Audit Committee and Group Remuneration Committee will also continue to have specific roles to play in overseeing and supporting the delivery of our ESG objectives.
At the management level, we have asked our team to further enhance ESG governance, with the introduction of an ESG Committee, co-chaired by our Group Chief Sustainability Officer, Celine Herweijer, and our Group Company Secretary and Chief Governance Officer, Aileen Taylor. This committee will regularly report to the Board on progress against our ESG ambitions, climate strategy and related commitments. In February 2022, the Board also approved the proposal to develop and implement a sustainability target operating model for the Group. The new operating model will help ensure that our businesses have the technical expertise, specialist resources and training to equip and support them in assisting our clients in their transition to net zero.
For further information on our climate ambition and progress against our transition to net zero strategic pillar, see page 45.
Board evaluation
We again conducted a review of the effectiveness of the Board and Board committees, which helps to support the continuous improvement of the operation of our key governance practices. Following two successive externally facilitated evaluations, we took the decision that the 2021 evaluations should be facilitated internally. The process was led by our Group Company Secretary and Chief Governance Officer and involved the completion of online surveys tailored for each Board and committee,
complemented by individual interviews with Directors and attendees.
Further details on the progress made against the 2020 findings, as well as the findings and recommendations from the 2021 review, can be found on page 271 and in each of the respective committee reports on pages 273 to 303.
Subsidiary governance
Subsidiary governance remained a key priority, as it has been since my appointment as Group Chairman, and we continued to build strong connectivity with our principal subsidiaries. In 2021, we sought to enhance the standard and consistency of governance across the Group, with the launch of our refreshed subsidiary accountability framework. The refreshed framework makes clear the Group's expectations of subsidiaries in relation to their governance approach and board practices through overarching principles and detailed provisions.
A key aspect of the framework is focused on the composition of our subsidiary boards, with our most significant subsidiaries required to submit their succession plans to the Nomination & Corporate Governance Committee through the course of the year. This provided clarity on plans to refresh and enhance the calibre and diversity of boards across the Group. Further details are set out in the Nomination & Corporate Governance Committee report on page 273.
Given the continued uncertainty externally, we looked to strengthen the connectivity between the Group and principal subsidiaries during the year through virtual forums held between the Board and committee chairs and our counterparts at subsidiary level. We further supplemented this connectivity with the introduction of a virtual Non-Executive Director Summit, which saw all subsidiary non-executive directors invited to come together to discuss areas of common interest. This was a valuable opportunity to share and discuss material topics, including strategy, risk, data, culture, diversity, climate and technology. Following the success of the summit, we have taken the decision to make these sessions a part of our annual governance calendar.
Workforce engagement
Various opportunities for members of the Board to engage with employees have been provided during 2021, including through partnerships with our employee resource groups and sessions with members of our global graduate programme. The Board greatly values the opportunity to engage with employees from across the business and markets, and of different backgrounds and seniority. We will continue to prioritise this, along with interaction with all our key stakeholders, during 2022.
For further details on the arrangements we have in place to facilitate workforce engagement, see page 269.
2021 Annual General Meeting
The pandemic has continued to pose many challenges for the Group, as it does for many of our stakeholders. However, the Group has benefited significantly from the speed at which digital tools have been adopted since the beginning of the pandemic.
This has also been true of our AGM, where I was delighted to host our first hybrid AGM, which enabled shareholders globally to attend virtually, or in person. The use of technology enabled a broader range of shareholders to attend and participate than had been the case pre-pandemic.
Further details of our plans for the 2022 AGM, which will be a hybrid meeting again, will be provided when our Notice of AGM is published on 25 March 2022.
Looking ahead
Despite the concerns of the Covid-19 pandemic, I am hopeful that the success of vaccine roll-out will allow us to safely resume in-person engagement with each other and all stakeholders in the near future.
On behalf of myself and the Board, many thanks for your continued commitment and support.
Mark E Tucker
Group Chairman
22 February 2022
Report of the Directors | Corporate governance report
The Board
The Board aims to promote the Group’s long-term success, deliver sustainable value to shareholders and promote a culture of openness and debate.
Chairman and executive Directors
Mark E Tucker (64) 4C
Group Chairman
Appointed to the Board: September 2017
Group Chairman since: October 2017
Skills and experience: With over 35 years of experience in financial services in Asia, Africa, the US and the UK, including 25 years based in Hong Kong, Mark has a deep understanding of the industry and markets in which we operate.
Career: Mark was most recently Group Chief Executive and President of AIA Group Limited (‘AIA’), having joined in July 2010. Prior to AIA he was Group Chief Executive of Prudential plc. He served on Prudential's Board for nearly 10 years.
Mark previously served as non-executive Director of the Court of the Bank of England and as an independent non-executive Director of Goldman Sachs Group.
Other appointments:
•Chair of TheCityUK
•Non-executive Chairman of Discovery Limited
•Supporting Chair of Chapter Zero
•Member of the UK Investment Council
•Co-Chair of the B20 Finance and Infrastructure Task Force (Indonesia 2022)
•Director, Peterson Institute for International Economics
•Director, Institute of International Finance
•International Adviser to the Hong Kong Academy of Finance
•Asia Society Board of Trustees
Noel Quinn (60)
Group Chief Executive
Appointed to the Board: August 2019
Group Chief Executive since: March 2020
Skills and experience: Having qualified as an accountant in 1987, Noel has more than 30 years of banking and financial services experience, both in the UK and Asia.
Career: Noel was formally named Group Chief Executive in March 2020, having held the role on an interim basis since August 2019. He has held various roles across HSBC, or its constituent companies, since 1987.
Prior to becoming Group Chief Executive, Noel was most recently CEO, Global Commercial Banking. He has also served as Regional Head of Commercial Banking for Asia-Pacific; Head of Commercial Banking UK; Head of Commercial Finance Europe; and Group Director of Strategy and Development at HSBC Insurance Services North America.
Other appointments:
•Chair of the Financial Services Task Force of HRH The Prince of Wales’ Sustainable Market Initiative
•Member of the Principals Group of the Glasgow Financial Alliance for Net Zero
•Member of the World Economic Forum’s International Business Council
Ewen Stevenson (55)
Group Chief Financial Officer
Appointed to the Board: January 2019
Skills and experience: Ewen has over 25 years of experience in the banking industry as an adviser and executive to major banks and large financial institutions. In addition to his existing leadership responsibilities for Group Finance, Ewen assumed responsibility for the oversight of the Group's transformation programme in February 2021 and the Group’s corporate development activities in April 2021.
Career: Ewen was Chief Financial Officer at the Royal Bank of Scotland Group plc from 2014 to 2018. Before this, Ewen spent 25 years with Credit Suisse, where his last role was co-Head of the EMEA Investment Banking Division and co-Head of the Global Financial Institutions Group.
Other appointments:
•Director of The Hongkong and Shanghai Banking Corporation Limited
Board committee membership key
C. Committee Chair
1.Group Audit Committee
2.Group Risk Committee
3.Group Remuneration Committee
4.Nomination & Corporate Governance Committee
For full biographical details of our Board members, see
www.hsbc.com/who-we-are/leadership-and-governance.
Independent non-executive Directors
Rachel Duan (51) 3,4
Independent non-executive Director
Appointed to the Board: September 2021
Skills and experience: Rachel is a business leader with exceptional international experience in the US, Japan, mainland China and Hong Kong.
Career: Rachel spent 24 years at General Electric (‘GE’), most recently as Senior Vice President of GE, and President and Chief Executive Officer of GE’s Global Markets, where she was responsible for driving GE’s growth in Asia-Pacific, the Middle East, Africa, Latin America, and Russia and the Commonwealth of Independent States. She has also previously served as President and Chief Executive Officer of GE Advanced Materials China and then of the Asia-Pacific, President and CEO of GE Healthcare China, and President and CEO of GE China.
Other appointments:
•Independent Director of Sanofi S.A.
•Independent Director of AXA S.A.
•Independent Director of the Adecco Group
Dame Carolyn Fairbairn (61) 2,3,4
Independent non-executive Director
Appointed to the Board: September 2021
Skills and experience: Carolyn has significant experience across the media, government and finance sectors.
Career: An economist by training, Carolyn has served as a Partner at McKinsey & Company, Director-General of the Confederation of British Industry, and Group Development and Strategy Director at ITV plc. She has extensive board experience, having previously served as non-executive Director of Lloyds Banking Group plc, the Vitec Group plc and Capita plc. She has also served as a non-executive Director of the UK Competition and Markets Authority and the Financial Services Authority.
Other appointments:
•Non-executive Director of BAE Systems plc
James Forese (58) 1,3,4
Independent non-executive Director
Appointed to the Board: May 2020
Skills and experience: James has over 30 years of international business and management experience in the finance industry.
Career: James formerly served as President of Citigroup. He began his career in securities trading with Salomon Brothers, one of Citigroup’s predecessor companies, in 1985. In addition to his most recent role as President, he was Chief Executive Officer of Citigroup’s Institutional Clients Group. He has also been Chief Executive of its Securities and Banking division and head of its Global Markets business.
Other appointments:
•Chair of HSBC North America Holdings Inc
•Non-executive Chairman of Global Bamboo Technologies
•Trustee of Colby College
Steven Guggenheimer (56) 2,4
Independent non-executive Director
Appointed to the Board: May 2020
Skills and experience: Steven brings extensive insight into technologies ranging from artificial intelligence to Cloud computing, through his experience advising businesses on digital transformation.
Career: Steven has more than 25 years of experience at Microsoft, where he held a variety of senior leadership roles. These included: Corporate Vice President, Artificial Intelligence and Independent Software Vendor Engagement; Corporate Vice President, Chief Evangelist; and Corporate Vice President, Original Equipment Manufacturer.
Other appointments:
•Non-executive Director of Forrit Technologies Limited
•Independent Director of Software Acquisition Group
•Adviser to Tensility Venture Partners LLC
•Advisory Board Member of 5G Open Innovation Lab
Report of the Directors | Corporate governance report
Irene Lee (68) 4
Independent non-executive Director
Appointed to the Board: July 2015
Skills and experience: Irene has more than 40 years of experience in the finance industry, having worked in the UK, the US and Australia.
Career: Irene held senior investment banking and fund management roles at Citibank, the Commonwealth Bank of Australia and SealCorp Holdings Limited. She has served as a member of the Advisory Council for J.P. Morgan Australia, a member of the Australian Government Takeovers Panel and as a non-executive Director of QBE Insurance Group Limited, Keybridge Capital Limited, ING Bank (Australia) Limited, Noble Group Limited, CLP Holdings Limited and Cathay Pacific Airways Limited.
Other appointments:
•Chair of Hang Seng Bank Limited
•Non-executive Director of the Hongkong and Shanghai Banking Corporation Limited
•Executive Chair of Hysan Development Company Limited
•Member of the Exchange Fund Advisory Committee of the Hong Kong Monetary Authority
Dr José Antonio Meade Kuribreña (52) 2,3,4
Independent non-executive Director
Appointed to the Board: March 2019
Skills and experience: José has extensive experience in public administration, banking, financial policy and foreign affairs.
Career: José has held Cabinet-level positions in the federal government of Mexico, including as Secretary of Finance and Public Credit, Secretary of Social Development, Secretary of Foreign Affairs and Secretary of Energy. Prior to his appointment to the Cabinet, he served as Undersecretary and as Chief of Staff in the Ministry of Finance and Public Credit. José is also a former Director General of Banking and Savings at the Ministry of Finance and Public Credit, and served as Chief Executive Officer of the National Bank for Rural Credit.
Other appointments:
•Non-executive Director of Alfa S.A.B. de C.V.
•Non-executive Director of Grupo Comercial Chedraui, S.A.B. de C.V.
•Board member of The Global Center on Adaptation
•Member of the Independent Task Force on Creative Climate Action
•Member of the UNICEF Mexico Advisory Board
Eileen Murray (63) 2,4
Independent non-executive Director
Appointed to the Board: July 2020
Skills and experience: Eileen has extensive knowledge in financial technology and corporate strategy from a career spanning more than 40 years.
Career: Eileen most recently served as co-Chief Executive Officer of Bridgewater Associates, LP. Before this, she was Chief Executive Officer for Investment Risk Management LLC, and President and co-Chief Executive Officer of Duff Capital Advisors. Eileen started her professional career at Morgan Stanley, having held positions including Controller, Treasurer, and Global Head of Technology and Operations, as well as Chief Operating Officer for its Institutional Securities Group. At Credit Suisse, she was Head of Global Technology, Operations and Product Control.
Other appointments:
•Chair of the Financial Industry Regulatory Authority
•Non-executive Director of Guardian Life Insurance Company of America
•Adviser of Invisible Urban Charging
•Adviser of ConsenSys, Aquarion Company
David Nish (61) 1C,2,4
Independent non-executive Director
Appointed to the Board: May 2016
Senior Independent non-executive Director since: February 2020
Skills and experience: David has international experience in financial services, corporate governance, financial accounting, and strategic and operational transformation.
Career: David served as Group Chief Executive Officer of Standard Life plc between 2010 and 2015, having joined the company in 2006 as Group Finance Director. He is also a former Group Finance Director of Scottish Power plc and was a partner at Price Waterhouse. David has also previously served as a non-executive Director of HDFC Life (India), Northern Foods plc, London Stock Exchange Group plc, the UK Green Investment Bank plc and Zurich Insurance Group.
Other appointments:
•Non-executive Director of Vodafone Group plc
•Honorary Professor of Dundee University Business School
Jackson Tai (71) 1,2C,4
Independent non-executive Director
Appointed to the Board: September 2016
Skills and experience: Jackson has held senior operating and governance roles across Asia, North America and Europe.
Career: Jackson was Vice Chairman and Chief Executive Officer of DBS Group and DBS Bank Ltd., having served as Chief Financial Officer and then as President and Chief Operating Officer. He worked for 25 years with J.P. Morgan & Co. Incorporated, holding roles as Chairman of Asia-Pacific Management Committee and Head of Japan Capital Markets. Other former appointments included non-executive Director of Canada Pension Plan Investment Board, Royal Philips N.V., Bank of China Limited, Singapore Airlines, NYSE Euronext, ING Groep N.V., CapitaLand Ltd, SingTel Ltd. and Jones Lang LaSalle Inc. He also served as Vice Chairman of Islamic Bank of Asia.
Other appointments:
•Non-executive Director of Eli Lilly and Company
•Non-executive Director of MasterCard Incorporated
Pauline van der Meer Mohr (62) 1,3C,4
Independent non-executive Director
Appointed to the Board: September 2015
Skills and experience: Pauline has extensive legal, corporate governance and human resources experience across a number of different sectors.
Career: Pauline served on the Supervisory Board of ASML Holding N.V. between 2009 and 2018. She was also Deputy Chair of the Supervisory Board of Royal DSM N.V. from 2018 to 2021, while also chairing its Sustainability Committee. Pauline was formerly President of Erasmus University Rotterdam, a member of the Dutch Banking Code Monitoring Commission, and a Senior Vice President and Head of Group Human Resources Director at ABN AMRO Bank N.V. and TNT N.V. She also held various executive roles at the Royal Dutch Shell Group. Pauline also chaired the Group’s former Conduct and Values Committee.
Other appointments:
•Chair of the Dutch Corporate Governance Code Monitoring Committee
•Chair of the Supervisory Board of EY Netherlands LLP
•Member of the Selection and Nomination Committee of the Supreme Court of the Netherlands
•Member of the Capital Markets Committee of the Dutch Authority for Financial Markets
•Non-executive Director of Viatris, Inc.
•Chair of the ASM International NV Supervisory Board
Aileen Taylor (49)
Group Company Secretary and Chief Governance Officer
Appointed: November 2019
Skills and experience: Aileen is a solicitor with significant governance and regulatory experience across various roles in the banking industry. She is a member of the European Corporate Governance Council, the GC100 and the Financial Conduct Authority's Listing Authority Advisory Panel.
Career: Prior to joining HSBC, Aileen spent 19 years at the Royal Bank of Scotland Group, holding various legal, risk and compliance roles. She was appointed Group Secretary in 2010 and subsequently Chief Governance Officer and Board Counsel.
Former Directors who served for part of the year
Heidi Miller
Heidi Miller retired from the Board on 28 May 2021.
Henri de Castries
Henri de Castries retired from the Board on 28 May 2021.
Laura Cha, GBM
Laura Cha, GBM retired from the Board on 28 May 2021.
For full biographical details of our Board members, see www.hsbc.com/who-we-are/leadership-and-governance.
Report of the Directors | Corporate governance report
Senior management, which includes the Group Executive Committee, supports the Group Chief Executive in the day-to-day management of the business and the implementation of strategy.
| | |
Elaine Arden, 53 Group Chief Human Resources Officer |
Elaine joined HSBC as Group Chief Human Resources Officer in June 2017. Prior to joining HSBC, she was Group Human Resources Director at Royal Bank of Scotland Group for six years. She has held a number of human resources and employee relations roles in financial services, including Clydesdale Bank and Direct Line Group. Elaine is a member of the Chartered Institute of Personnel and Development, and a fellow of the Chartered Institute of Banking in Scotland.
| | |
Chira Barua, 48 Global Head of Strategy |
Chira joined HSBC in May 2020 as Global Head of Strategy and was appointed to the Group Executive Committee in April 2021. Before joining HSBC, he was a partner at McKinsey & Company in its financial services practice and a managing director at Sanford C. Bernstein between 2011 and 2017. Earlier in his career, Chira held a number of strategy, management and operational roles at Standard Chartered and Citigroup in India.
| | |
Colin Bell, 54 Chief Executive Officer, HSBC Bank plc and HSBC Europe |
Colin joined HSBC in July 2016 and was appointed Chief Executive Officer, HSBC Bank plc and HSBC Europe in February 2021. He previously held the role of Group Chief Compliance Officer. Before HSBC, Colin worked at UBS as Global Head of Compliance and Operational Risk Control. He served for 16 years in the British Army, having held a variety of command and staff positions, including within operational tours of Iraq and Northern Ireland, the Ministry of Defence and NATO.
| | |
Jonathan Calvert-Davies, 53 Group Head of Internal Audit |
Jonathan is a standing attendee of the Group Executive Committee, having joined HSBC as Group Head of Internal Audit in October 2019. He has 30 years of experience providing assurance, audit and advisory services to the banking and securities industries in the UK, the US and Europe. Jonathan's previous roles included leading KPMG UK’s financial services internal audit services practice and PwC's UK internal audit services practice. He has also served as interim Group Head of Internal Audit at the Royal Bank of Scotland Group.
| | |
Georges Elhedery, 47 Co-Chief Executive Officer, Global Banking and Markets |
Georges joined HSBC in 2005 and was appointed co-Chief Executive Officer of Global Banking and Markets in March 2020. He is also head of the Markets and Securities Services division of the business, with responsibility for its strategic direction in more than 55 countries and territories. Georges previously served as Head of Global Markets; Chief Executive Officer for HSBC, Middle East, North Africa and Turkey; Head of Global Banking and Markets, MENA; and Regional Head of Global Markets, MENA. Georges will be on sabbatical leave between March and September 2022.
| | |
Greg Guyett, 58 Co-Chief Executive Officer, Global Banking and Markets |
Greg joined HSBC in October 2018 as Head of Global Banking and became co-Chief Executive Officer of Global Banking and Markets in March 2020. Greg will assume sole responsibility of the business while Georges Elhedery is on sabbatical leave between March and September 2022. Before joining HSBC, he was President and Chief Operating Officer of East West Bank. Greg began his career as an investment banker at J.P. Morgan, where positions included: Chief Executive Officer for Greater China; Chief Executive Officer, Global Corporate Bank; Head of Investment Banking for Asia-Pacific; and Co-Head of Banking Asia-Pacific.
| | |
Dr Celine Herweijer, 44 Group Chief Sustainability Officer |
Celine joined HSBC as Group Chief Sustainability Officer in July 2021, and is responsible for the Group’s sustainability agenda including its ambition to transition to net zero. She previously worked as a partner at PwC for over a decade, where she held global leadership roles including acting as its global innovation and sustainability leader. Before joining PwC, Celine worked as Director of Climate Change and Consulting for Risk Management Solutions. She is a World Economic Forum Young Global Leader, a co-chair of the We Mean Business Coalition, a PhD climate scientist and a NASA fellow by training.
| | |
John Hinshaw, 51 Group Chief Operating Officer |
John became Group Chief Operating Officer in February 2020, having joined HSBC in December 2019. He has an extensive background in transforming organisations across a range of industries. Most recently, John served as Executive Vice President of Hewlett Packard and Hewlett Packard Enterprise, where he managed technology and operations and was Chief Customer Officer. He also held senior roles at Boeing and Verizon and served on the Board of Directors of BNY Mellon, DocuSign and the US National Academy Foundation.
| | |
Bob Hoyt, 57 Group Chief Legal Officer |
Bob joined HSBC as Group Chief Legal Officer in January 2021. He was most recently Group General Counsel at Barclays from 2013 to 2020. Prior to that he was General Counsel and Chief Regulatory Affairs Officer for The PNC Financial Services Group. Bob has served as General Counsel and senior policy adviser to the US Department of the Treasury under Secretary Paulson, and as Special Assistant and Associate Counsel to the White House under President George W. Bush.
| | |
Steve John, 48 Group Chief Communications Officer |
Steve was appointed as Group Chief Communications Officer in December 2019 and appointed to the Group Executive Committee in April 2021. He has a wealth of senior communications, public policy and leadership experience acquired across a number of multinational and charitable organisations. Prior to joining HSBC, Steve was a partner and Global Director of Communications at McKinsey & Company from 2014 to 2019. He has also held roles with Bupa as Global Director of Communications and PepsiCo as Director of Corporate Affairs for their UK and Ireland franchises.
| | |
Pam Kaur, 58 Group Chief Risk and Compliance Officer |
Pam was appointed Group Chief Risk and Compliance Officer in July 2021, having held the role of Group Risk Officer since January 2020. She joined HSBC in 2013 and was previously Group Head of Internal Audit, Head of Wholesale Market and Credit Risk, and Chair of the enterprise-wide non-financial risk forum. Pam has also held a variety of audit and compliance roles in the banking industry, including with Deutsche Bank, Royal Bank of Scotland Group, Lloyds TSB and Citigroup. She serves as a non-executive Director of Centrica plc.
| | |
David Liao, 49 Co-Chief Executive Officer, Asia-Pacific – The Hongkong and Shanghai Banking Corporation Limited |
David was appointed co-Chief Executive Officer of the Asia-Pacific region in June 2021. He is a Director of the Hongkong and Shanghai Banking Corporation Limited, Bank of Communications Co., Limited, Hang Seng Bank Limited and HSBC Global Asset Management Limited. David joined HSBC in 1997, with previous roles including: Head of Global Banking Coverage for Asia-Pacific; President and Chief Executive at HSBC China; Head of Global Banking and Markets at HSBC China; and Treasurer and Head of Global Markets at HSBC China.
Report of the Directors | Corporate governance report
| | |
Nuno Matos, 54 Chief Executive Officer, Wealth and Personal Banking |
Nuno joined HSBC in 2015 and was appointed Chief Executive Officer of Wealth and Personal Banking in February 2021. He is a Director of HSBC Global Asset Management Limited. He was previously the Chief Executive Officer of HSBC Bank plc and HSBC Europe, a role he held from March 2020. Nuno has also served as Chief Executive Officer of HSBC Mexico, and as regional head of Retail Banking and Wealth Management in Latin America. Before joining HSBC, he held senior positions at Santander Group.
| | |
Stephen Moss, 55 Regional Chief Executive Officer – Middle East. North Africa and Turkey |
Stephen was appointed Regional Chief Executive Officer for the Middle East, North Africa and Turkey in April 2021. He has held a series of roles since joining HSBC in 1992, including as Chief of Staff to the Group Chief Executive and overseeing the Group’s mergers and acquisitions, and strategy and planning activities. Stephen is a Director of The Saudi British Bank, HSBC Bank Middle East Limited, HSBC Middle East Holdings B.V, HSBC Bank Egypt S.A.E and HSBC Saudi Arabia.
| | |
Barry O'Byrne, 46 Chief Executive Officer, Global Commercial Banking |
Barry joined HSBC in April 2017 and was appointed Chief Executive Officer of Global Commercial Banking in February 2020, having served in the role on an interim basis since August 2019. He was previously Chief Operating Officer for Global Commercial Banking. Before joining HSBC, Barry worked at GE Capital for 19 years in a number of senior leadership roles, including as Chief Executive Officer and Chief Operating Officer for GE Capital International.
| | |
Michael Roberts, 61 Chief Executive Officer, HSBC USA and Americas |
Michael was appointed Chief Executive Officer for HSBC USA and the Americas with oversight responsibility for Canada and Latin America in April 2021. He joined HSBC in October 2019 and is a Director of HSBC Bank Canada; executive Director, President and Chief Executive Officer of HSBC North America Holdings Inc.; and Chairman of HSBC Bank USA, N.A. and HSBC USA Inc. Previously, Michael spent 33 years at Citigroup in a number of senior leadership roles, most recently as Global Head of Corporate Banking and Capital Management and Chief Lending Officer.
| | |
Surendra Rosha, 53 Co-Chief Executive Officer, Asia-Pacific – The Hongkong and Shanghai Banking Corporation Limited |
Surendra was appointed co-Chief Executive Officer of the Asia-Pacific region in June 2021. He is a Director of The Hongkong and Shanghai Banking Corporation Limited and HSBC Bank Australia Limited. Surendra joined HSBC in 1991 and has held several senior positions within Global Banking and Markets, including as Head of Global Markets in Indonesia and Head of Institutional Sales, Asia-Pacific. He was Chief Executive for HSBC India and Head of HSBC’s financial institutions group for Asia-Pacific.
| | |
John David Stuart (known as Ian Stuart), 58 Chief Executive Officer, HSBC UK Bank plc |
Ian has been Chief Executive Officer of HSBC UK Bank plc since April 2017 and has worked in financial services for over four decades. He joined HSBC as Head of Commercial Banking Europe in 2014, having previously led the corporate and business banking businesses at Barclays and NatWest. He started his career at Bank of Scotland. Ian is a business ambassador for Meningitis Now and a member of the Economic Crime Strategic Board.
Additional members of the Group Executive Committee
Noel Quinn
Ewen Stevenson
Aileen Taylor
Biographies are provided on pages 256 and 259.
We are committed to high standards of corporate governance. The Group has a comprehensive range of policies and procedures in place designed to help ensure that it is well managed, with effective oversight and controls. We comply with the UK Corporate Governance Code and the applicable requirements of the Hong Kong Corporate Governance Code.
Board’s role, Directors’ responsibilities and meeting attendance
The Board, led by the Group Chairman, is responsible among other matters for:
•promoting the Group’s long-term success and delivering sustainable value to shareholders;
•establishing and approving the Group’s strategy and objectives, and monitoring the alignment of the Group’s purpose, strategy and values with the desired culture;
•setting the Group’s risk appetite and monitoring the Group’s risk profile;
•approving and monitoring capital and operating plans for achieving strategic objectives;
•approving material transactions;
•approving the appointment of Directors, including Board roles; and
•reviewing the Group's overall corporate governance arrangements.
The Board's terms of reference are available on our website at www.hsbc.com/who-we-are/leadership-and-governance/board-responsibilities. The Board's powers are subject to relevant laws, regulations and HSBC’s articles of association.
The role of the independent non-executive Directors is to support the development of proposals on strategy, hold management to account and ensure the executive Directors are discharging their responsibilities properly, while creating the right culture to encourage constructive challenge. Further details on the independence of the Board and the value independence brings can be found in the Nomination & Corporate Governance Committee report. Non-executive Directors also review the performance of management in meeting agreed goals and objectives. The Group Chairman meets with the non-executive Directors without the executive Directors in attendance after Board meetings and otherwise, as necessary.
The roles of Group Chairman and Group Chief Executive are separate. There is a clear division of responsibilities between the leadership of the Board by the Group Chairman, and the executive responsibility for day-to-day management of HSBC’s business, which is undertaken by the Group Chief Executive.
The majority of Board members are independent non-executive Directors. At 31 December 2021, the Board comprised the Group Chairman, 10 non-executive Directors, and two executive Directors who are the Group Chief Executive and the Group Chief Financial Officer. Two non-executive Directors will not stand for re-election at the AGM in April 2022.
For further details of the Board’s career background, skills, experience and external appointments, see pages 256 to 259.
Operation of the Board
The Board is ordinarily scheduled to meet at least seven times a year. In 2021, the Board held 12 meetings. For further details on attendance at those meetings, see page 264. The Board agenda is agreed by the Group Chairman, working with both the Group Chief Executive and the Group Company Secretary and Chief Governance Officer. For more information, see 'Board activities during 2021' on page 268.
The Group Company Secretary and Chief Governance Officer, the Group Chief Risk and Compliance Officer, the Group Chief Legal Officer and the non-executive Chairman of The Hongkong and Shanghai Banking Corporation Limited are all regular attendees at
Board meetings. Other senior executives attend Board meetings as required.
In addition to formal Board meetings, the Board Oversight Sub-Group, established by the Group Chairman in 2020, meets in advance of each Board meeting. Such meetings are an informal mechanism for a smaller group of Board members and management to discuss emerging issues and upcoming Board matters. Standing attendees comprise the Group Chairman, the Chair of the Group Audit Committee (who is also the Senior Independent Director), the Chair of the Group Risk Committee, the Group Chief Executive, the Group Chief Financial Officer, the Group Chief Risk and Compliance Officer, and the Group Company Secretary and Chief Governance Officer. Other non-executive Directors and management are invited on a rotational basis, depending on the subject to be discussed. The forum is not decision making but provides regular opportunities for Board members to communicate with senior management to deepen their understanding of, and provide input into, key issues facing the Group. For further details on how the Board engages with the wider workforce, see page 269.
| | |
| Board governance enhancements due to Covid-19 |
The Board continued many of the governance changes introduced in 2020 in response to the Covid-19 pandemic, including meeting online during 2021. The Board was kept informed of the continuing challenges and priorities of the management team as part of the formal executive reporting received at these meetings. The following practices continued: •The Group Chairman prepared a weekly Board update note. •The Group Chief Risk and Compliance Officer produced a weekly Board report on risk matters, including in relation to the Covid-19 pandemic, as well as market highlights, industry events and results. •Immunologists and pandemic experts updated the Board on emerging issues. •The Group Chairman's Forum was held monthly. It was attended by Board committee chairs, as well as chairs of principal subsidiaries. |
| | |
| Technology governance |
| A Technology Governance Working Group was established in 2021, initially for a period of 12 months, to provide recommendations to enhance the Board's oversight of technology strategy, governance and emerging risks, and to enhance connectivity with the principal subsidiaries. Given their industry expertise and experience, the working group is jointly chaired by Eileen Murray and Steven Guggenheimer. Its members include Group Risk Committee chair Jackson Tai and other non-executive Directors representing each of our US, UK, European and Asian principal subsidiaries. Key technology and business stakeholders have attended the working group to provide insights on technology and information security issues across the Group. The working group has met formally eight times since its inception, and has held additional ad hoc sessions on priority strategic topics including data and cybersecurity. The Technology Governance Working Group's recommendations were presented to the Board in January 2022 when it was decided that the working group will remain an informal committee of the Board. For further details on the future of the working group, see the Group Chairman's governance statement on page 254. |
Report of the Directors | Corporate governance report
| | |
| Board engagement with shareholders |
| In 2021, the Group Chairman, Senior Independent Director and other non-executive Directors, often with the Group Company Secretary and Chief Governance Officer, engaged with a number of our large institutional investors in 15 meetings. The Group Chief Executive and the Group Chief Financial Officer attended over 30 meetings with investors in 2021. Key topics included our financial performance, climate policies and progress in relation to the climate resolution passed at the 2021 AGM. Other topics discussed with investors included geopolitical tensions, primarily |
| | |
relating to Hong Kong, mainland China, the US and the UK, as well as Board composition, changes to the Group Executive Committee, and the impact of the Covid-19 pandemic on the Group, its employees, customers and communities.
The Group Remuneration Committee Chair met with representatives from key investors and proxy advisory firms numerous times during the fourth quarter of 2021, in preparation for its discussion and decision making on the 2021 executive Directors' performance outcomes and the renewal of the 2022 Directors' remuneration policy. |
| | |
|
| Board roles, responsibilities and meeting attendance |
| | | | | | | | | |
The table below sets out the Board members' respective roles, responsibilities and attendance at Board meetings and the AGM in 2021. For a full description of responsibilities, see www.hsbc.com/who-we-are/leadership-and-governance/board-responsibilities. | |
| Roles | Board attendance in 2021 | Responsibilities | |
Group Chairman Mark E Tucker1,2
| 12/12 | •Provides effective leadership of the Board and promotes the highest standards of corporate governance practices. •Leads the Board in providing strong strategic oversight and setting the Board’s agenda, culture and values. •Leads the Board in challenging management’s thinking and proposals, and fosters open and constructive debate among Directors. •Maintains external relationships with key stakeholders and communicates investors' views to the Board. •Organises periodic monitoring and evaluation, including externally facilitated evaluation, of the performance of the Board, its committees and individual Directors. | |
Executive Director Group Chief Executive Noel Quinn2 | 12/12 | •Leads and directs the implementation of the Group’s business strategy, embedding the organisation’s culture and values. •Leads the Group Executive Committee with responsibility for the day-to-day operations of the Group, under authority delegated to him from the Board. •Maintains relationships with key internal and external stakeholders including the Group Chairman, the Board, regulators, governments and investors. | |
Executive Director Chief Financial Officer Ewen Stevenson2 | 12/12 | •Supports the Group Chief Executive in developing and implementing the Group strategy and recommends the annual budget and long-term strategic and financial plan. •Leads the Finance function and is responsible for effective financial reporting, including the effectiveness of the processes and controls, to ensure the financial control framework is robust and fit for purpose. •Maintains relationships with key stakeholders including shareholders. | |
Non-executive Directors Senior Independent Director David Nish2,3 | 12/12 | •Supports the Group Chairman, acting as intermediary for non-executive Directors when necessary. •Leads the non-executive Directors in the oversight of the Group Chairman, supporting the clear division of responsibility between the Group Chairman and the Group Chief Executive. •Listens to shareholders' views if they have concerns that cannot be resolved through the normal channels. | |
Laura Cha2,3,4 | 6/6 | •Develop and approve the Group strategy. •Challenge and oversee the performance of management. •Approve the Group’s risk appetite and review risk profile and performance. | |
Henri de Castries2,3,4,6 | 5/6 | |
Rachel Duan3,5 | 4/4 | |
Dame Carolyn Fairbairn3,5 | 4/4 | |
James Forese2,3 | 12/12 | |
Steven Guggenheimer2,3 | 12/12 | |
Irene Lee2,3 | 12/12 | |
Dr José Antonio Meade Kuribreña2,3 | 12/12 | |
Heidi Miller2,3,4 | 6/6 | |
Eileen Murray2,3.6 | 9/12 | |
Jackson Tai2,3 | 12/12 | |
Pauline van der Meer Mohr2,3 | 12/12 | |
Group Company Secretary and Chief Governance Officer Aileen Taylor | | •Maintains strong and consistent governance practices at Board level and throughout the Group. •Supports the Group Chairman in ensuring effective functioning of the Board and its committees, and transparent engagement between senior management and non-executive Directors. •Facilitates induction and professional development of non-executive Directors. •Advises and supports the Board and management in ensuring effective end-to-end governance and decision making across the Group. | |
1 The non-executive Group Chairman was considered to be independent on appointment.
2 Attended the AGM on 28 May 2021.
3 Independent non-executive Director. All of the non-executive Directors are considered to be independent of HSBC. There are no relationships or circumstances that are likely to affect any individual non-executive Director’s judgement. All non-executive Directors have confirmed their independence during the year.
4 Heidi Miller, Laura Cha and Henri de Castries retired from the Board on 28 May 2021.
5 Rachel Duan and Dame Carolyn Fairbairn joined the Board effective 1 September 2021.
6 Henri de Castries was unable to attend one Board meeting due to a conflict of interest. Eileen Murray was unable to attend meetings in the last few months of 2021 due to personal health reasons, but was kept informed of Board and relevant committee matters. She was fully briefed ahead of her return to regular meeting attendance in January 2022. Eileen continues to have sufficient time to dedicate to her role with HSBC.
Board induction and training
The Group Company Secretary and Chief Governance Officer works with the Group Chairman to oversee appropriate induction and ongoing training programmes for the Board. On appointment, new Board members are provided with tailored and comprehensive induction programmes to fit with their individual experiences and needs, including the process for dealing with conflicts.
The induction programme is delivered through formal briefings and introductory sessions with Board members, senior management, legal counsel, auditors, tax advisers and regulators, as appropriate. Topics covered include, but are not limited to: purpose and values; culture and leadership; governance and stakeholder management; Directors' legal and regulatory duties; recovery and resolution risk; anti-money laundering and anti-bribery; technical and business briefings; and strategy.
An early focus on induction allows a new Board member to contribute meaningfully from appointment. The structure of the induction supports good information flows within the Board and its committees, as well as between senior management and non-executive Directors, providing a clear understanding of our culture and way of operating.
During 2021 we welcomed two new non-executive Directors, Rachel Duan and Dame Carolyn Fairbairn, to our Board. We gave careful consideration to creating relevant and bespoke induction programmes for each of the new non-executive Directors, particularly given their differing geographical locations and the continuing Covid-19-related challenges for meetings in person. For illustrations of the typical induction modules, see the 'Directors' induction and ongoing development in 2021' table on the following page.
Non-executive Directors continued to engage with each other through virtual meetings amid continuing Covid-19-related travel restrictions. We continue to plan and look forward to opportunities to facilitate safe and comprehensive person-to-person engagement, both in and out of Board meetings. These opportunities provide invaluable insight and understanding of our business, customers, culture and people.
Directors undertook routine training during 2021. They also participated in 'deep dive' sessions into specific areas of the Group’s strategic priorities, risk appetite and approach to managing certain risks. These training sessions included external consultants who provided insights into geopolitical matters, macroeconomics and investor sentiments. Other topics of focus included: operations and technology strategy; the resolvability assessment framework; and climate change and sustainability.
Non-executive Directors also discussed individual development areas with the Group Chairman during performance reviews and in conversations with the Group Company Secretary and Chief Governance Officer. The Group Company Secretary and Chief Governance Officer makes appropriate arrangements for any additional training needs identified using internal resources, or otherwise, at HSBC’s expense.
Members of Board committees receive relevant training as appropriate. Directors may take independent professional advice at HSBC’s expense.
Board Directors who serve on principal subsidiary boards also receive training relevant to those boards. Opportunities exist for the principal subsidiary and principal subsidiary committee chairs to share their understanding in specific areas with the Board Directors. During 2021, the Group Chairman hosted a Non-Executive Director Summit where 200 independent non-executive directors from the Group's subsidiaries attended a virtual session along with Board Directors. They received updates and training on Group-wide matters including climate change, technology, culture and the launch of the newly developed Non-Executive Director Handbook. Following its success, further Non-Executive Director Summits will take place during 2022.
| | | | | |
|
| |
| |
| |
| |
| |
| |
| |
| |
| |
| |
| |
| Q&A with Rachel Duan |
| |
|
|
Q: What is your impression and experience of the onboarding process for HSBC? From the very start of the process I was impressed at the level of attention given to my induction programme. Care was taken to tailor my meetings and the information provided so that it was relevant for me and thereby ensured a smooth, efficient and thoughtful process. Q: How have you managed to get insight into the wider Group governance? Before my joining date I was afforded many opportunities to meet colleagues, both virtually and physically. Shortly after joining, I visited our Hong Kong office to meet, among others, Peter Wong, non-executive chairman of The Hongkong and Shanghai Banking Corporation Limited. This gave me the chance to gain insight into governance matters in Asia. In July 2021, I was invited to attend the Non-Executive Director Summit, which was a great introduction into the Group's and its subsidiaries' governance matters. These engagements highlighted key areas of focus for HSBC and provided clear insight into the Group's way of working. Q: How prepared did you feel for the first Board meeting in September? My tailored engagements and bespoke briefings started shortly after the announcement of my intention to join the HSBC Board in March, all of which helped me get my arms around this complex organisation and made me feel included and ready to execute my role in the boardroom with ease. |
|
| | | | | | | |
| |
| Q&A with Dame Carolyn Fairbairn | |
| | |
| | |
| Q: How have you got an understanding of the Board's focus on culture? The culture at HSBC is thoughtful and inclusive. I could see from the carefully planned induction meetings which were arranged well ahead of my joining. I have been introduced to two employee resource groups: Ability, the disability and mental health network, and Embrace, an ethnicity network, and value the opportunity to support them. Also, the Board opens every meeting with a ‘culture moment’, which really demonstrates how it connects closely with the corporate values, and openly expresses how these are observed. Q: What has been your experience of preparing for membership of the Group Remuneration Committee and the Group Risk Committee? Before I joined, I engaged closely with the committees' chairs, as well as senior management, to understand their priorities, including a new remuneration policy for the 2022 AGM and the climate agenda. I remain actively engaged with the members to ensure a smooth transition onto these committees. Q: Did your attendance at the 2021 AGM give you a better understanding of the Group's business? Attending the 2021 AGM, ahead of my official appointment to the Board, enabled me to witness HSBC’s first hybrid meeting with shareholders. I was pleased to see that the company’s planning enabled as many shareholders as possible to participate in this annual event, despite the persistent Covid-19 pandemic challenges, demonstrating HSBC's inclusive culture. The questions from shareholders were insightful and gave me a good sense of what was top of investors’ minds and how the company was responding to such concerns, particularly on the climate agenda. | |
| | | |
| | |
| | |
| | |
| | |
| | |
| | |
Report of the Directors | Corporate governance report
| | | | | | | | | | | | | | | | | | | | |
| Directors’ induction and ongoing development in 2021 |
| Director | Induction1 | Strategy and business briefings2 | Risk and control3 | Corporate governance, ESG and other reporting matters4 | Board and global mandatory training5 | Chair and subsidiary non-executive Director forums6 |
| Rachel Duan | l | l | l | l | l | l |
| Dame Carolyn Fairbairn | l | l | l | l | l | l |
| James Forese | ô | l | l | l | l | l |
| Steven Guggenheimer | ô | l | l | l | l | l |
| Irene Lee | ô | l | l | l | l | l |
| José Antonio Meade Kuribreña | ô | l | l | l | l | l |
| Eileen Murray | ô | l | l | l | l | l |
| David Nish | ô | l | l | l | l | l |
| Noel Quinn | ô | l | l | l | l | l |
| Ewen Stevenson | ô | l | l | l | l | l |
| Jackson Tai | ô | l | l | l | l | l |
| Mark Tucker | ô | l | l | l | l | l |
| Pauline van der Meer Mohr | ô | l | l | l | l | l |
1 The induction programme was delivered through formal briefings and introductory sessions with Board members, senior management, legal counsel, auditors, tax advisers and regulators, as appropriate. Topics covered included, but were not limited to: purpose and values; culture and leadership; governance and stakeholder management; Directors’ legal and regulatory duties; recovery and resolution risk; anti-money laundering and anti-bribery; technical and business briefings; and strategy.
2 Directors participated in business strategy, market development and business briefings, which are global, regional and/or market-specific. Examples of specific sessions held in 2021 included: 'US strategy: restructuring of the operating model' and 'Climate change: becoming net zero by 2050'.
3 Directors received risk and control training. Examples of specific sessions held in 2021 included: 'Stress testing' and 'ICAAP/ILAAP'.
4 All Directors received training on topics such as: 'Resolvability assessment framework', 'Climate and sustainable finance' and 'IFRS 17'.
5 Global mandatory training, issued to all Directors, mirrored training undertaken by all employees, including senior management. This included: management of risk under the enterprise risk management framework, with a focus on operational risk; cybersecurity risk; health, safety and well-being; data privacy and the protection of data of our customers and colleagues; combating financial crime, including understanding money laundering, sanctions, fraud and bribery and corruption risks; and our values and conduct, including workplace harassment and speaking up.
6 Chairman's Forum, Remuneration Committee Chairs' Forum and the Non-Executive Director Summit.
Board committees and working groups
The Board delegates oversight of certain audit, risk, remuneration, nomination and governance matters to its committees. Each standing Board committee is chaired by a non-executive Board member and has a remit to cover specific topics in accordance with their respective terms of reference. Only independent non-executive Directors are members of Board committees. Details of the work carried out by each of the Board committees can be found in the respective committee reports from page 273.
In addition to the Board committees, working groups are established to enhance Board governance. The Technology Governance Working Group was first convened in March 2021 to enhance the Board's oversight of technology strategy, governance
and emerging risks, and to enhance connectivity with the principal subsidiaries. The working group will continue in 2022 but will remain a working group, not a formal committee of the Board. For further details, see page 263.
The Board Oversight Sub-Group is also part of the group operating rhythm ahead of Board meetings. As described on page 263, this group offers the Board and senior management an informal forum to discuss key matters before they are considered by the Board.
In addition, the Chairman’s Committee is convened to provide flexibility for the Board to consider ad hoc Board and routine matters between scheduled Board meetings. All Board members are invited to attend all Chairman's Committees.
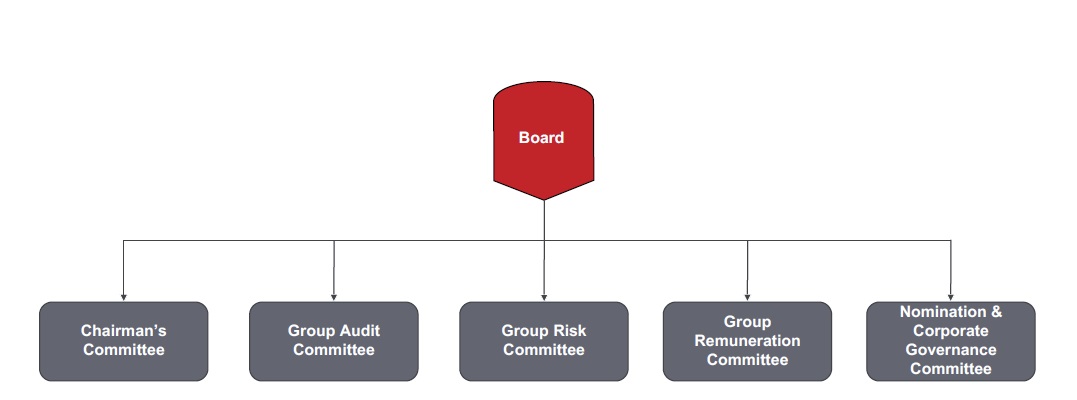
Relationship between Board and senior management
The Board delegates day-to-day management of the business and implementation of strategy to the Group Chief Executive. The Group Chief Executive is supported in his management of the Group by recommendations and advice from the Group Executive Committee ('GEC'), an executive forum comprising members of senior management that include chief executive officers of the global businesses, regional chief executive officers and functional heads.
The Directors are encouraged to have contact with management at all levels, and have full access to all relevant information. Non-executive Directors are encouraged to visit local business operations and meet local management when they attend off-site Board meetings and when travelling for other reasons but only when it is safe to do so. While there were limited physical opportunities for Board members to meet in 2021, there were several virtual meetings with senior executives including induction meetings and subject matter 'deep dives', as well as regular working meetings.
Connectivity between management and the Board is further facilitated through informal discussion held as required on an ad hoc basis, and as part of the Board Oversight Sub-Group meetings.
| | |
| Executive governance |
The Group’s executive governance is underpinned by the Group operating rhythm, which helps facilitate end-to-end governance between senior leadership and the Board, and sets out the Board and executive engagement schedule. The Group operating rhythm is characterised by three pillars: •The GEC normally meets every week to discuss current and emerging issues. •On a monthly basis, the GEC reviews the performance of global businesses, principal geographical areas and legal entities. These performance reviews are supplemented by operating unit performance review meetings between the Group Chief Financial Officer and each of the chief executive officers of the global businesses, principal geographical areas and legal entities on an individual basis. The Group Chief Executive and Group Risk and Compliance Officer have standing invitations to these meetings. •The GEC holds a strategy and governance meeting two weeks in advance of each Board meeting. Separate committees have been established to provide specialist oversight for matters delegated to the Group Chief Executive and senior management, in keeping with their responsibilities under the Senior Managers and Certification Regime. Some of these committees are dedicated sub-committees of the GEC, including the new ESG Committee, the Transformation Oversight Executive Committee and the Acquisitions and Disposals Committee, and all committees together support and facilitate collective decision taking and individual accountabilities. These committees support the Group Chief Executive and GEC members in areas such as capital and liquidity, risk management, disclosure and financial reporting, restructuring and investment considerations, transformation programmes, ESG matters and talent and development. In addition to our regional company secretaries supporting our principal subsidiaries, we have corporate governance officers supporting our global businesses and our larger global functions to assist in effective end-to-end governance, consistency and connectivity. |
Subsidiary governance
Certain subsidiaries are formally designated as principal subsidiaries by approval of the Board. In addition to their obligations under their respective local laws and regulation, principal subsidiaries have an important role in supporting effective and high standards of governance across the Group.
The designated principal subsidiaries are:
| | | | | |
| Principal subsidiary | Oversight responsibility |
| The Hongkong and Shanghai Banking Corporation Limited | Asia-Pacific |
| HSBC Bank plc | Europe, Bermuda (excluding Switzerland and UK ring-fenced activities) |
| HSBC UK Bank plc | UK ring-fenced bank and its subsidiaries |
| HSBC Middle East Holdings BV | Middle East and North Africa |
| HSBC North America Holdings Inc. | US |
| HSBC Latin America Holdings (UK) Limited | Mexico and Latin America |
| HSBC Bank Canada | Canada |
In general, principal subsidiaries are responsible for overseeing the implementation of the subsidiary accountability framework for Group companies in the region for which they are responsible. The subsidiary accountability framework, approved in 2020, and refreshed by the Board in 2021, set out to improve communications and connectivity between the Group and its subsidiaries. It is subject to regular review and is occasionally updated to improve how the respective roles of principal subsidiaries and other subsidiaries are articulated. This helps to provide the Group with a shared understanding and a consistent approach towards its strategic objectives, culture and values and furthers the efforts to streamline and align corporate governance.
The Group Chairman interacts regularly with the chairs of the principal subsidiaries, including through the Chairman’s Forum, which brings together the chairs of the principal subsidiaries, the chairs of the Group's audit, risk and remuneration committees and the Group Chief Executive to discuss Group-wide and regional matters. The Group Chairman hosted 11 Chairman’s Forums in 2021, which were also attended by relevant executive management, to cover sessions on strategy, financial performance and investor sentiment, geopolitics, culture, employee engagement, diversity and inclusion, technology and data, group recovery planning, corporate governance and implementation of the updated subsidiary accountability framework. The Non-Executive Director Summit, hosted by the Group Chairman, was also an effective subsidiary directors' engagement event. For further details, see page 265.
The chairs of the principal subsidiaries’ committees are invited to attend the relevant forums to raise and discuss current and future global issues, including regulatory priorities in each of the regions. While the Audit and Risk Committee Chairs' Forums did not take place in 2021, the chairs of the Group Audit Committee and Group Risk Committee continued to have regular dialogue with the respective committees of the principal subsidiaries to ensure an awareness and coordinated approach to key issues. The annual Remuneration Committee Chairs' Forum took place in October, and provided the principal subsidiary chairs with an opportunity to discuss performance, key considerations and positioning in advance of the pay review process. A follow-up forum was held in early December to provide transparency around pay outcomes and allocation, with feedback from the discussion used to shape the final pay proposals, which were considered and approved by the Group Remuneration Committee.
Board members attend principal subsidiary meetings as guests from time to time. Similarly, principal subsidiary directors are invited to attend committee meetings at Group level, where relevant, and in particular, when the Prudential Regulation Authority ('PRA') is in attendance. The chairs of the principal subsidiary risk committees are regular attendees at the Group Risk Committee.
Report of the Directors | Corporate governance report
| | |
| Board activities during 2021 |
During 2021, the Board was focused on HSBC's strategic direction and overseeing performance and risk. It considered performance against financial and other strategic objectives, key business challenges, emerging risks, business development, investor relations and the Group’s relationships with its stakeholders. The end-to-end governance framework facilitated discussion on strategy and performance by each of the global businesses and across the principal geographical areas, which enabled the Board to support executive management with its delivery of the Group’s strategy.
The Board's key areas of focus in 2021 are set out by theme below.
Strategy and business performance
Since the Group announced a new strategic focus and associated transformation programme in February 2020, it has set out to reshape underperforming businesses, simplify the organisation and reduce costs. The strategy aims to increase returns for investors, create capacity for future investment and build a sustainable platform for growth.
The Board, which held a dedicated strategy session in May 2021, assessed the delivery of strategic achievements throughout the year through both the perspectives of the global businesses and the regions. The Board took a holistic view by reviewing management’s strategic alignment to, and outcomes against, HSBC's four strategic pillars of: focus on our strengths, digitise at scale, energise for growth and transition to net zero.
Environmental, social and governance
In 2020, the Group announced its new climate ambition to align financed emissions to net zero by 2050 and become net zero for its own operations and supply chain by 2030. The Group aims to achieve this by supporting clients on the road to a net zero carbon economy and a focus on sustainable finance opportunities. In 2021, the Board considered more climate matters at its meetings, including participating in four climate 'deep-dives' and approving the climate-related resolution for the 2021 AGM. For further details on how the Board is meeting its climate agenda ambitions, see the ESG review on page 43.
The Board has also considered other sustainability matters, including human rights, a new thermal coal phase-out policy, the operating model for sustainability and the methodology for climate-aligned financing.
The Board received regular reports on the continuing challenges presented by the ongoing Covid-19 pandemic, which supported the Group’s responses and measures to mitigate the effects, including, providing medical aid and assistance to our colleagues in India and other regions.
The Board takes overall responsibility for ESG strategy, overseeing executive management in developing the approach, execution and associated reporting. It has enhanced its oversight of ESG matters, with a dedicated agenda item on this topic introduced for 2022. Management has also enhanced its governance model with the introduction of a new ESG Committee and supporting forums, which will support senior management in the delivery of the Group’s ESG strategy, key policies and material commitments by providing holistic oversight over – and management and coordination of – ESG commitments and activities.
Financial decisions
The Board approved key financial decisions throughout the year and approved the Annual Report and Accounts 2020, the Interim Report 2021 and the first quarter and the third quarter Earnings Releases.
At the start of 2021, the Board approved the 2021 annual financial resourcing plan and in December 2021 approved the financial resourcing plan for 2022. The Board monitored the Group's performance against the approved 2021 financial resourcing plan, as well as the plans of each of the global businesses. The Board
also approved the renewal of the debt issuance programme, and as announced on 26 October 2021 the buy-back programme.
Following the decision in 2020 to cancel the fourth interim dividend for 2019, on 23 February 2021, we announced that after considering the requirements set out in the PRA's temporary approach to shareholder distributions for 2020, an interim dividend for 2020 of $0.15 per ordinary share would be paid in cash on
29 April 2021. On 2 August 2021, we announced an interim dividend of $0.07 for the 2021 half-year paid in cash on
30 September 2021. For further details of dividend payments, see page 425.
The Board has adopted a policy designed to provide sustainable dividends going forward. For the financial year 2021, we are at the lower end of our target dividend payout ratio range of between 40% and 55% of reported earnings per ordinary share (‘EPS’), driven by ECL releases and higher restructuring costs. The dividend policy has the flexibility to adjust EPS for non-cash significant items such as goodwill or intangible impairments. The Board believes this payout ratio approach will allow for a good level of income to shareholders and a progressive dividend, assuming good levels of economic and earnings growth.
Risk, regulatory and legal considerations
The Board, advised by the Group Risk Committee, promotes a strong risk governance culture that shapes the Group’s risk appetite and supports the maintenance of a strong risk management framework, giving consideration to the measurement, evaluation, acceptance and management of risks, including emerging risks.
The Board considered the Group’s approach to risk including its regulatory obligations. A number of key frameworks, control documents, core processes and legal responsibilities were also reviewed and approved as required. These included:
•the Group's risk appetite framework and risk appetite statement;
•the individual liquidity adequacy assessment process;
•the individual capital adequacy assessment process;
•the Group’s obligations under the Modern Slavery Act and approval of the Modern Slavery and Human Trafficking Statement;
•stress testing and capabilities required to meet the PRA’s resolvability assessment framework;
•the revised terms of reference for the Board and Board committees; and
•delegations of authority.
The Board also reviewed and monitored the implications of geopolitical developments during the year including US-China relations and the impacts to trade following the UK's departure from the EU.
Technology
Throughout the year, the Board received regular updates on technology from the Group Chief Operating Officer, including updates on the refreshed technology strategy and restructuring of the technology leadership function.
In early 2021, the Technology Governance Working Group was established to oversee and enhance the Group's governance of technology. For further details on this group’s work and the future of the Board’s oversight of technology governance, see page 263.
People and culture
The Board continued to spend time discussing people and culture-related topics. To set the right cultural tone, since March 2021, each Board meeting has begun with a Director or regular attendee describing a 'cultural moment' he or she had experienced, including observations of behaviours within the Group aligned to the purpose and values. Once a year the chairs from each of the principal subsidiaries present to the Chairman's Forum on their respective board engagement activities and learnings, including
cultural insights. Twice a year the Group Chief Human Resources Officer attends the Board to provide insights into the Group’s employee Snapshot survey results measuring employee sentiment, talent plans, progress on the embedding of the new purpose and values, and the measurement of culture. This reporting includes a culture insights report, which allows the Board to monitor culture through receipt of data on culture perceptions and using the indicators of behaviours/sentiment and business outcomes/people data. These presentations help enable the Board to monitor and assess the organisation's culture.
Board engagement with management and the wider workforce continued to remain a strong area of attention.
Governance
The Board continued to oversee the governance, smooth operation and oversight of the Group and its principal and material subsidiaries. Following a review of subsidiary governance, the Board oversaw the implementation of the review findings, with the support of the Nomination & Corporate Governance Committee.
The Board also supported new governance initiatives to encourage simplification and promote effective decision making in the business. Such initiatives included the refinement of Board and committee papers, and a review to reduce unnecessary committee meetings to free management time and encourage individual accountability and decision taking.
Succession planning was considered at the Nomination & Corporate Governance Committee. During the year, Laura Cha, Henri de Castries and Heidi Miller retired as independent non-executive Directors. The Board appointed Rachel Duan and Dame Carolyn Fairbairn as independent non-executive Directors who joined the Board in September 2021. The Board, supported by the Nomination & Corporate Governance Committee, will continue to review the skills and experience of the Board as a whole to ensure that it comprises the relevant skills, diversity, experiences and competencies to discharge its responsibilities effectively.
For further details on the review, subsequent actions and changes to the Board, see the Nomination & Corporate Governance Committee report on page 273.
The Board monitored its compliance with the UK Corporate Governance Code, the Hong Kong Corporate Governance Code and the Companies Act 2006 throughout the year.
| | |
| Workforce engagement |
The Board continued to place great emphasis on the importance of engagement with the workforce, including colleagues affected by the continued impact of the Covid-19 pandemic and the return to offices in the UK and elsewhere. The Board also considered the impact of the launch of our new purpose and values and the ongoing transformation activity, including the announcement of the disposal of our retail businesses in the US and France. In accordance with the UK Corporate Governance Code, the Board reaffirmed that it continued to believe that the 'alternative arrangements' approach remained most appropriate for the Group in engaging and understanding the views of the workforce. The programme of engagement covered a variety of interaction styles: more bespoke sessions with smaller groups; formal presentations; Q&A opportunities; and other sessions to facilitate engagement across a breadth of experience, geographical spread and seniority. This variety of engagements enabled open dialogue and two-way discussions between Directors and employees. These sessions allowed the Board to gain valuable insight on employee perspectives, which in turn informed their deliberations and decision making at Board and committee meetings. The Board receives updates on how the Group engages with stakeholders, including the workforce, by way of the Group Chief Executive's Board report and the Group Chairman's weekly Board note. In addition, the Board's agenda regularly includes non-executive Director workforce and other stakeholder engagement updates. These help to inform the Board of employee initiatives and sentiment and allow the Board to plan for future engagement activities. The flexibility of this approach allowed all Board members the opportunity for direct engagement – albeit often virtually during 2021 – with a broad cross-section of the workforce, spanning global businesses, functions and geographies. It also gave insights provided by management through our employee listening tools and surveys. The Board received formal updates from the Group Chief Executive and the Group Chief Human Resources Officer on employee views and sentiment. These include results of employee engagement surveys, benchmarked data, and additional surveys to understand well-being throughout the Covid-19 pandemic. The Chairman’s Forum meetings also discussed employee feedback from the Group's subsidiaries. Specific engagement between the Board and the wider workforce included meetings and events with: •representatives of the employee resource groups and each of the non-executive Directors who have been partnered to support the designated groups: Ability, Balance, Embrace, Faith, Generations, Nurture, Pride, and Communities; •the Nurture employee resource group, which hosted online events on domestic abuse and working fathers, during which non-executive Directors discussed with a small group of employees how the Group had supported them during such challenging times and how the Board could promote further initiatives; •first and second year members of the HSBC graduate scheme, who discussed their experiences of hybrid working and HSBC's culture, purpose and values; •US executive management, who held succession and emerging talent sessions, and who also discussed our net zero ambitions, career pathways, and the delivery of our strategy; and •African heritage employee resource group leaders, who held a roundtable event to discuss inclusivity at work. |
|
|
Report of the Directors | Corporate governance report
| | | | | | | | | | | | | | | | | | | | | | | | | | | | | | | | | | | |
| Board activities in 2021 |
| Main topic | Sub-topic | Meetings at which topics were discussed1 |
| | Jan | Feb | Mar | Apr | May | Jun | Jul | Sep | Nov | Dec |
| Strategy | Group strategy | ô | ô | ô | ô | l | ô | ô | ô | ô | l |
| Regional strategy/global business strategy | l | l | ô | l | l | l | l | l | ô | ô |
| Environmental, social, governance | ô | ô | ô | ô | l | ô | ô | l | l | l |
| Business and financial performance | Region/global business | l | l | ô | l | l | ô | l | l | ô | l |
| Financial performance | l | l | ô | l | l | ô | l | l | ô | l |
| Financial | Results and accounts | l | l | ô | ô | ô | ô | ô | ô | ô | ô |
| Dividends | l | l | ô | ô | ô | ô | ô | ô | ô | ô |
| Group financial resource planning | l | ô | ô | l | ô | ô | ô | ô | ô | l |
| Risk | Risk function | l | l | ô | l | l | ô | l | ô | ô | l |
| Risk appetite | l | ô | ô | ô | ô | ô | l | l | ô | l |
| Capital and liquidity adequacy | l | ô | l | l | ô | ô | ô | ô | ô | ô |
| Regulatory | Regulatory and legal matters2 | ô | l | l | l | l | l | l | l | ô | l |
Regulatory matters with regulators in attendance3 | ô | ô | ô | ô | ô | ô | l | l | ô | ô |
| External | External insights | ô | l | ô | l | ô | ô | l | ô | ô | l |
| Technology | Strategic and operational | l | ô | ô | ô | ô | ô | l | ô | l | l |
| People and culture | Purpose, values and engagement | l | l | ô | l | ô | ô | ô | l | ô | ô |
| Governance | Subsidiary governance framework | ô | l | ô | ô | ô | ô | ô | ô | ô | ô |
| Policies and terms of reference | l | ô | ô | l | ô | l | l | ô | ô | ô |
| Board/committee effectiveness | l | ô | ô | ô | ô | ô | ô | ô | ô | ô |
| Appointment and succession | l | l | l | ô | l | l | l | ô | ô | ô |
| AGM and resolutions | l | l | ô | l | l | ô | ô | ô | ô | ô |
1 No formal Board meetings were held during August and October 2021.
2 Includes resolvability assessment framework, modern slavery and human trafficking, statement of business principles and code of conduct, regional updates and listing renewals.
3 Meetings attended by members of the Financial Conduct Authority, Prudential Regulation Authority, Monetary Authority of Singapore, Hong Kong Monetary Authority.
| | |
| Board and committee effectiveness, performance and accountability |
The Board and its committees are committed to regular, independent evaluation of their effectiveness at least once every three years.
In 2020, the Nomination & Corporate Governance Committee invited Dr Tracy Long of Boardroom Review Limited to support the Board with its annual evaluation and to conduct a follow-up review on the Board's progress against the findings and recommendations from her 2019 report.
In 2021, the Nomination & Corporate Governance Committee approved the conducting of an internal evaluation of the Board and its committees, with the assistance of an externally facilitated questionnaire system managed by Lintstock, an independent service provider with no other connection to the Group or any individual Director. The questions were designed by the Group Company Secretary and Chief Governance Officer and included some of the themes addressed by Dr Long's previous reviews, namely: leadership, shared perspective, culture, end-to-end governance and future thinking. A summary of the effectiveness reviews of the Board and the Board committees can be found on page 271 and in the respective committee reports on pages 273 to 303.
To gather qualitative feedback the Group Company Secretary and Chief Governance Officer, together with the Deputy Group Secretary, conducted one-to-one interviews with all questionnaire respondents, including all the Board Directors, regular attendees of the relevant meetings and key advisers. The Group Chairman and committee chairs also participated in additional discussion following the consolidation of feedback in respect of the individual committees.
In general, there were consistent findings across the Board and committee reviews. These included: a desire to be more forward looking; more discussion of contextual matters such as economic, social, and geopolitical issues; maintaining a supportive and challenging relationship between the Board, its committees and senior management; providing clear governance for our subsidiaries; and a more consistent approach in leading and living the Group purpose and values.
At its January 2022 meeting, the Board considered the findings and noted the following areas of focus: in person Board and committee meetings; succession planning; diversity in Board composition including the need for more Asian and banking experience; prioritising digital opportunities; and more Board meeting time dedicated to customers.
The Group Chairman led a discussion at which the Board agreed the actions and priorities to be implemented, which will be monitored and addressed on an ongoing basis. Similar discussions were carried out by each of the committee chairs in their respective January meetings. Progress against these actions will be included in the Annual Report and Accounts 2022.
During 2021, a review of the Group Chairman’s performance was led by the Senior Independent Director in consultation with the other independent non-executive Directors, management and key stakeholders. Non-executive Directors also undergo regular individual reviews with the Group Chairman. These reviews confirmed that the performance of the Group Chairman and each Director was effective and that each had met their time commitments during the year.
The review of executive Directors’ performance, which helps determine the level of variable pay they receive each year, is contained in the Directors’ remuneration report on page 304.
| | | | | | | | | | |
| Summary of 2020 Board effectiveness recommendations and actions: |
| | Recommendation from the evaluation | Progress against recommendations | |
| | | | |
| Leadership | | •Continue to focus on Board succession planning, building on the progress made during 2020 to facilitate and manage succession for Board and committee positions, cognisant of diversity in all aspects and making full use of external advisers and skills matrix analysis. •Embed executive succession so that it translates into a stronger, more diversified talent pool for future senior leadership. | Significant time has been allocated at Nomination & Corporate Governance Committee meetings to discuss these items. An additional session was held in March to discuss Board and committee composition, and senior executive changes. Discussions have included succession candidates at the layer below the GEC, and plans to simplify the senior grade structure at managing director level and above. Progress reports for the Asia talent programme were submitted to Nomination & Corporate Governance Committee meetings, with the first received at the May meeting. | |
| | | | |
| Shared perspective | | •Optimise use of Board information to enhance testing of the effectiveness of the strategic and business plans with reference to the evolving external factors and competitive landscape across its key markets. | The Board operating rhythm continues to be effective. Positive feedback from non-executive and executive Directors confirmed that the Board Oversight Sub-Group is valuable for all stakeholders. We have made use of the expertise and experience of our non-executive Directors by rotating attendance at our Board Oversight Sub-Group meetings, according to the topic to be discussed. Regular feedback is sought from members of the GEC and the Board to ensure that the Board operating rhythm continues to support the Group's decision making. | |
| | | | |
| Culture | | •Continue to review and determine the culture and key behaviours required to support the delivery of the revised strategy with a clear focus on pace and execution. | The Board Oversight Sub-Group meetings supported both the executive Directors and the Board to take strategic decisions in a timely manner, and ensure effective use of time in Board meetings. The enhanced strategy was announced alongside the 2021 interim results, including the Group's proposed disposal of the US retail banking franchise. Cadence of reporting to the Board in support of its oversight of culture was agreed. This takes place twice per year alongside updates on workforce engagement. The Board has adopted a 'culture moment' at the beginning of each meeting. | |
| | | | |
| Future thinking | | •Maintain and evolve good quality papers and presentations to the Board to continue providing insight and supporting informed decision making | The Group’s new Board paper template and guidance on the most effective writing approach has now been implemented across the Board and committee meetings. We also provided presenter and chair training to members of the Group Executive and wider management. | |
Report of the Directors | Corporate governance report
| | | | | | | | | | |
| Summary of 2021 Board effectiveness recommendations and actions |
| | Findings from the evaluation | Recommendations for action | |
| | | | |
| Composition and Board dynamics | | •The Board's overall skills and capability, and diversity and inclusion representation, could be improved, particularly with Asian background and banking experience. •Significant collective knowledge of existing chairs who are all extremely able and active in their roles must be considered as part of succession planning. •Strong relationships exist among Board members and senior management with the Board providing appropriate challenge and support as necessary. •The Board Oversight Sub-Group has been a useful forum for Directors and senior management to hold discussions in advance of Board meetings. •There is a strong desire to return to in-person meetings. The Group Chairman was complimented on his management of meetings and Board communication throughout the pandemic. •Increased engagement outside of formal meetings with executives and employees to aid focused, informed and efficient discussion in formal meetings was welcomed. | The Board will support the Nomination & Corporate Governance Committee’s focus on identifying and securing additional Board members, reflecting on the membership of the committees, and with a particular focus on Hong Kong, mainland China and south-east Asian representation, as well as banking expertise and diversity. In addition, through the Nomination & Corporate Governance Committee, the Board should consider the tenure of the Chairs of the Board, the Group Audit Committee and the Group Risk Committee to ensure there is well planned succession so as not to lose their collective knowledge and experience within too short a space of time. The Board will explore different approaches to in-person meetings during 2022 to allow members to meet face to face in different locations, and to continue to facilitate communication between the Board and management. The Board will support an appropriate level of employee and customer engagement outside formal meetings while ensuring both receive adequate time on the Board agenda. | |
| | | | |
| Meetings, priorities and materials | | •Board meetings were efficiently and effectively managed, in terms of the logistics and support, as well as the quality of materials which had improved during the year as a result of the introduction of the new templates. Continuation of that improvement would help the effort to reduce length, improve timelines and drive clarity. •The Board should build on foundational work to date to provide greater clarity on climate matters, and more broadly ESG issues. •The Board should increase its focus on understanding of – and attention to – customers, and also digital opportunities and threats. •Strategic oversight was highly regarded overall, with a request for the development of Board materials to more easily track progress of the strategic priorities. Attention to execution, prioritisation, capability and capacity were recurring themes. | Senior management will clearly articulate progress against strategic objectives in Board materials, particularly in relation to relevant strategic levers and prioritisation. The forward agenda planner will capture the key areas of future focus, particularly ESG, digital and customer issues. The improvement in style and content of Board and committee papers will continue in 2022 with the Corporate Governance and Secretariat facilitating management’s commitment to improving information to the Board. A 2022 Board meeting will include digital opportunities and threats as an agenda item. | |
| | | | |
| Risk | | •The Board oversaw risk matters as part of its dedicated sessions but suggested more focus on emerging risks and consideration of 'what keeps management awake at night' with forward-looking discussion and debate at Board meetings in addition to at the Group Risk Committee. | The Board will hold two forward-looking strategic risk discussions per year focused on emerging areas of threat and/or opportunity, to ensure that the Board is considering how to maximise growth opportunities and appropriate mitigants. | |
| | | | |
| Principal subsidiaries | | •The Board should continue to evolve good quality papers and presentations at meetings to continue providing insight, and support for, informed decision making. | Through the subsidiary accountability framework, the Board will continue to monitor progress of governance of principal subsidiaries and maintain subsidiary director interactions through the annual virtual Non-Executive Director Summit. | |
| | | | |
| Committee connectivity and collaboration | | •The Board should look to improve coordination between Board committees and the Technology Governance Working Group to ensure minimal overlap in content and optimal coverage of relevant matters, and ensure appropriate reporting to the Board for discussion. | The Board will undertake a review of the Board committees’ and Technology Governance Working Group's terms of reference, with particular reference to technology, transformation, data, cyber-related matters and ESG matters. In each case, the Board will ensure that there is clarity as to the remit and responsibilities of each committee and the Technology Governance Working Group, with a view to reducing any duplication and ensuring optimal coverage of relevant matters. Enhanced planning will be implemented across Board and committee agendas to improve rhythm of topics for discussion by the Board. | |
Nomination & Corporate Governance Committee
| | |
 "The Committee has overseen another year of significant activity, with a number of changes to the Board and senior executive team, as well as to our subsidiary governance practices." "The Committee has overseen another year of significant activity, with a number of changes to the Board and senior executive team, as well as to our subsidiary governance practices." |
Dear Shareholder
I am pleased to present the Nomination & Corporate Governance Committee report, which provides an overview of the work of the Committee and its activities during the year.
The Committee has overseen another year of significant activity, with a number of changes to the Board and senior executive team, as well as to our subsidiary governance practices.
Executive development and succession has continued to be a priority for the Committee, with various joiners approved throughout the year, improving the capability and depth of our senior leadership team. This included the approval of a new senior leadership structure with an expanded Group Executive Committee and a new General Manager cohort with enterprise-wide responsibilities. The Committee has supported the establishment of a flagship development programme for senior executives and the first HSBC Bank Director Programme, which aims to prepare senior talent for roles on subsidiary boards.
Significant progress has also been made in enhancing our subsidiary governance practices over recent years, with further improvements made during 2021. In accordance with the recommendation arising from the subsidiary governance review undertaken in 2020, we implemented a refreshed subsidiary accountability framework, which now applies to all HSBC subsidiaries on a proportionate basis and provides greater clarity on the Group’s expectations of subsidiary boards. A key element of this has been succession planning for our principal and material subsidiary boards, with the Committee overseeing all succession plans and considering requests for exceptions from the requirements of the framework.
As we look ahead to the remainder of 2022, the Committee will continue to play an important role in overseeing our work in improving the standards of corporate governance across HSBC and achieving our ambition of world class governance.
Mark E Tucker
Chair
Nomination & Corporate Governance Committee
22 February 2022
| | | | | | | | |
| Membership |
| Member since | Meeting attendance in 2021 |
| Mark Tucker (Chair) | Oct 2017 | 8/8 |
Laura Cha1 | May 2014 | 4/4 |
Henri de Castries1 | Apr 2018 | 4/4 |
Rachel Duan2 | Sep 2021 | 2/2 |
Dame Carolyn Fairbairn2 | Sep 2021 | 2/2 |
| James Forese | May 2020 | 8/8 |
| Steven Guggenheimer | May 2020 | 8/8 |
| Irene Lee | Apr 2018 | 8/8 |
| José Antonio Meade Kuribreña | Apr 2019 | 8/8 |
Eileen Murray3 | Jul 2020 | 7/8 |
Heidi Miller1 | Apr 2018 | 4/4 |
| David Nish | Apr 2018 | 8/8 |
| Jackson Tai | Apr 2018 | 8/8 |
| Pauline van der Meer Mohr | Apr 2016 | 8/8 |
1 Laura Cha, Henri de Castries and Heidi Miller stepped down from the Board following the conclusion of the AGM on 28 May 2021.
2 Rachel Duan and Dame Carolyn Fairbairn were appointed to the Board on 1 September 2021.
3 Eileen Murray was unable to attend the December committee meeting for personal health reasons.
Key responsibilities
The Committee’s key responsibilities include:
•leading the process for identifying and nominating candidates for appointment to the Board and its committees;
•overseeing succession planning and development for the Group Executive Committee and other senior executives; and
•overseeing and monitoring the corporate governance framework of the Group and ensuring that this is consistent with best practice.
Committee governance
The Group Chief Executive, Group Chief Human Resources Officer and Group Company Secretary and Chief Governance Officer routinely attended Nomination & Corporate Governance Committee meetings.
Russell Reynolds Associates, which supported the Committee and the management team in relation to Board and senior executive succession planning, regularly attended meetings during the year. It has no other connection with the Group or members of the Board.
The Group Company Secretary and Chief Governance Officer ensured that the Committee fulfilled its governance responsibilities, considering input from various stakeholders when finalising meeting agendas and tracking progress on actions and Committee priorities.
Board composition and succession
The main focus of the Committee during 2021 was on succession planning for the Board and committees. The Committee keeps the composition of the Board and its committees under constant review and continually strives to ensure that the membership, both individually and collectively, has the skills, knowledge and experience necessary to oversee, challenge and support management in the achievement of the Group’s strategic and business objectives.
There were a number of retirements from the Board during the year, with Henri de Castries, Laura Cha and Heidi Miller retiring at the conclusion of the 2021 AGM. In addition, since the year-end, we announced that Irene Lee and Pauline van der Meer Mohr would retire from the Board at the conclusion of the 2022 AGM. The Committee is actively considering Pauline’s successor as Chair of the Group Remuneration Committee and will provide an update in due course.
The Committee considered both the short-term and long-term succession needs to identify candidates for immediate
Report of the Directors | Corporate governance report
appointment, and to develop a pipeline for potential future appointments. This will ensure that the longer-term shape of the Board is well aligned to our purpose, strategy and values, and provides relevant skills, experience and knowledge of our priority markets.
In late 2020, the Committee engaged Russell Reynolds Associates to conduct a thorough and robust search to identify prospective candidates for appointment to the Board. This identified a number of potential candidates who met our agreed search criteria, which reflected prior feedback from stakeholders including investors, regulators and the management team. This was initially reviewed by the Group Chairman, with potential candidates presented and discussed by the Committee at various meetings during 2021. Following consideration by the Committee, and meetings between various members of the Committee and priority candidates to understand their interest and capacity, the Board approved the appointments of Rachel Duan and Dame Carolyn Fairbairn with effect from 1 September 2021.
A search for additional non-executive Director candidates, which looks to enhance the Board’s collective knowledge and experience of banking and Asia in particular, was initiated during 2021. The search will also look to further enhance diversity on the Board in line with its diversity and inclusion policy. The Committee’s search was again supported by Russell Reynolds. The Committee is actively progressing this search and will provide an update in due course.
Board diversity
The Board recognises the importance of gender, social and ethnic diversity, and the strengths this brings to Board effectiveness. There was a significant focus on diversity at Board and senior executive levels in 2021, with consultations issued by our UK regulators and the UK Listing Authority. We are well positioned against the proposals outlined in those consultations and, in line with the Board diversity and inclusion policy, remain committed to increasing diversity at Board and senior levels to ensure we reflect the markets and societies we serve. The policy, which was updated in 2021 to incorporate new targets on female representation, details our approach to achieving our diversity ambitions, and helps to ensure that diversity and inclusion factors are taken into account in succession planning. The revised Board diversity and inclusion policy is available at www.hsbc.com/who-we-are/leadership-and-governance/board-responsibilities.
At the end of 2021, we had a 38% female Board representation, with five female Board members out of 13. Our aspirational female representative target is at least 40% by the end of 2023, aligned to the recommendation in the final Hampton-Alexander Review. We continue to exceed the Parker Review target of at least one Director from an ethnic minority background by 2021, with four members of our Board self-identifying in line with the ethnicity/ethnic definition set by Parker. Given the global and international nature of HSBC, including our strong presence and heritage in Asia, the Committee expects the composition of the Board to exceed the current Parker Review recommendations. In line with our purpose and values, the Board believes that a diverse and inclusive Board, reflective of the communities we serve, is key to effective decision making and to developing a sustainable and successful business for HSBC.
Further details on activities to improve diversity across senior management and the wider workforce, together with representation statistics, can be found on page 72.
Independence
Independence is a critical component of good corporate governance, and is a principle that is applied consistently at both Holdings and subsidiary level. The Committee has delegated authority from the Board in relation to the assessment of the independence of non-executive Directors. In accordance with the UK and Hong Kong Corporate Governance Codes, the Committee has reviewed and confirmed that all non-executive Directors who have submitted themselves for election and re-election at the AGM are considered to be independent. This conclusion was reached
after consideration of all relevant circumstances that are likely to impair, or could appear to impair, independence.
Senior executive succession and development
The Group Executive Committee underwent a period of significant change during 2021 and engaged Russell Reynolds to identify the best talent for roles on the committee. The changes included the addition of three new roles, as well as the appointments of new Co-Chief Executives for our Asia-Pacific region. These appointments recognised the leadership and capabilities that the Group requires to deliver our strategic commitments.
Succession plans for the Group Executive Committee members were approved at the Nomination & Corporate Governance Committee meeting in December. These reflected continued efforts to support the development and progression of diverse talent and promote the long-term success of the Group.
The Committee also discussed progress under the Asia talent programme, which aims to support the development of potential future leaders from the Group’s key region. The initiative exceeded the target of appointing the top talent from the region into stretch roles as part of their development. As part of succession plans, we also identified at least one credible successor of Asia heritage for the region's key roles. Other regions across the Group have begun work to replicate the success in Asia, with updates on their efforts to be provided to the Committee during 2022.
Committee evaluation
The annual review of the effectiveness of the Committee was internally facilitated in 2021. The review concluded that the Committee continued to operate effectively, with a number of positive aspects of the Committee’s operation and practices highlighted. Areas for improvement that were identified included the Committee’s succession planning practices, and the need to review the support and guidance provided in relation to executive succession activity, including the expectations of leaders in relation to succession preparedness. The Committee discussed the outcomes of the evaluation in January 2022, and endorsed the findings and actions to be taken. The outcomes of the evaluation have been reported to the Board and the Committee will track progress on the recommendations through the year.
Subsidiary governance
The importance of robust, effective and proportionate governance at all levels of the Group is critical, with the 2020 subsidiary governance review of principal subsidiaries identifying a number of areas of good practice and areas where further improvement would be beneficial.
One of the recommended areas for improvement was a refresh of the existing subsidiary governance policy, and the subsidiary accountability framework, to provide greater clarity and guidance on the Group’s expectations of various subsidiaries. The refreshed framework, which included additional principles, underpinned by provisions and detailed guidance, took effect from 1 April 2021.
Subsidiary board composition and ensuring effective succession planning practices were key objectives of the refreshed framework. The subsidiary governance review also recommended that guidance should be developed and enhanced with additional provisions to support effective board composition and succession planning. It also expected that boards should use a skills matrix. In connection with the revised expectations, all principal and material subsidiaries submitted their succession plans for the Committee’s review. The Committee approved a number of required exceptions from strict compliance with the framework to manage transition for a limited period, and to reflect varying market practices, laws and regulations across our markets.
As part of efforts to make greater use of the skills, expertise and experience among our senior employees for roles on subsidiary boards, the Committee approved the development of the HSBC Bank Director Programme. This programme seeks to equip our internal talent with the appropriate skills and knowledge required to serve on a HSBC subsidiary board. The initiative was developed following consultation with our principal subsidiary chairs, who
supported the greater use of an internal talent pool on subsidiary boards, where permitted by applicable laws and regulations.
Business governance review
Following the success of the 2020 review, an equivalent review of the executive governance practices across our three global businesses, Wealth and Personal Banking, Commercial Banking and Global Banking and Markets, was conducted during the fourth quarter of 2021. This work had the strong support of the Group Executive Committee, and involved desktop reviews, meeting observations and interviews.
Overall, the review concluded that the governance of the three global businesses operated effectively, and had improved as a
result of governance simplification initiatives sponsored by the Group Executive Committee. The main opportunities for improvement related to further simplification of governance structures. In particular, the role of the global business governance forums within regions and countries will be considered to avoid duplication by ensuring that their roles and responsibilities are clear and distinct.
The findings and recommendations from the review were discussed and endorsed by the Committee in January 2022, with oversight of the actions and next steps to be overseen by the respective global business executive committees and the Group Executive Committee.
| | | | | | | | | | | | | | | | | | | | | | | | | | |
| Matters considered during 2021 |
| | | | | | | | |
| Jan | Feb | Mar | Apr | May | Jul | Sep | Dec |
| Board composition and succession | | | | | | | | |
| Board composition, including succession planning and skills matrices | l | l | ô | l | l | l | l | l |
| Approval of diversity and inclusion policy | ô | ô | ô | ô | l | ô | ô | ô |
| Executive talent and development | | | | | | | | |
| Senior executive succession | l | l | l | l | l | l | l | ô |
| Approval of executive succession plans | ô | ô | ô | ô | ô | ô | ô | l |
| Talent programmes | ô | l | ô | ô | l | l | ô | ô |
| Governance | | | | | | | | |
| Board and committee evaluation | ô | ô | ô | l | ô | ô | l | l |
| Subsidiary governance | l | ô | ô | ô | ô | l | l | l |
| Subsidiary and executive appointments | l | l | ô | l | l | l | l | l |
Report of the Directors | Corporate governance report
| | |
 "In 2021, the Group Audit Committee carried out significant development in our internal financial controls and regulatory reporting processes to meet a number of challenges." "In 2021, the Group Audit Committee carried out significant development in our internal financial controls and regulatory reporting processes to meet a number of challenges." |
Dear Shareholder
The Group Audit Committee (‘GAC’) had a busy agenda in 2021.
We carried out significant development in our internal financial controls and regulatory reporting processes to help meet the challenges of organisational transformation, the continued impact of the Covid-19 pandemic, a changing regulatory landscape and the growing demand for better and more ESG and climate reporting.
To ensure alignment of priorities and understand local challenges, I attended a number of principal subsidiary audit committee meetings. These were supplemented with regular communications that we cascade through the Group, informal meetings with audit committee chairs and a breakout session on key areas for focus at the Non-Executive Director Summit in July 2021.
I regularly met the whistleblowing team to discuss material whistleblowing cases and the effectiveness of whistleblowing arrangements. The GAC spent significant time considering enhancements to whistleblowing arrangements, management's responses to internal audit findings and the thematic and cultural insights that could be used to improve the speak-up culture.
The Committee received regular updates from the Group Chief Financial Officer and the Group Head of Internal Audit on functional transformation, its impact on the control environment and the capacity and capabilities of the functions. The Committee also invited the Global Finance Executive Committee for a private session, and I attended a session of the Global Internal Audit Executive Committee to discuss key topics and themes from a management perspective.
Recognising the importance of providing enhanced trust in reporting to all stakeholders, the Committee provided a detailed response to the UK Government's consultation paper on ‘Restoring Trust in Audit and Corporate Governance’.
The Committee implemented all the actions from the 2020 evaluation. The 2021 review determined that the GAC continued to operate effectively.
Eileen Murray stepped down as a member at the 2021 AGM. The Committee continues to have a wide range of financial services experience and I would like to thank all the GAC members and management for their diligent contributions and support to the work of the Committee during the year.
David Nish
Chair, Group Audit Committee, 22 February 2022
| | | | | | | | |
| Membership |
| Member since | Meeting attendance in 20211 |
| David Nish (Chair) | May 2016 | 11/11 |
| | |
James Forese2 | May 2020 | 10/11 |
Eileen Murray3 | Jul 2020 | 5/6 |
| | |
| Jackson Tai | Dec 2018 | 11/11 |
Pauline van der Meer Mohr4 | Apr 2020 | 10/11 |
1 These included two joint meetings with the Group Risk Committee.
2 James Forese was unable to attend one meeting due to extreme weather conditions disrupting air travel.
3 Eileen Murray was unable to attend one meeting due to personal circumstances and stepped down from the Group Audit Committee on 28 May 2021.
4 Pauline van der Meer Mohr was unable to attend one meeting due to personal circumstances and another due to a prior commitment.
Key responsibilities
The Committee’s key responsibilities include:
•monitoring and assessing the integrity of the financial statements, formal announcements and regulatory information in relation to the Group's financial performance, as well as significant accounting judgements;
•reviewing the effectiveness of, and ensuring that management has appropriate internal controls over, financial reporting;
•reviewing and monitoring the relationship with the external auditor and overseeing its appointment, tenure, rotation, remuneration, independence and engagement for non-audit services;
•overseeing the Group’s policies, procedures and arrangements for capturing and responding to whistleblower concerns and ensuring they are operating effectively; and
•overseeing the work of Global Internal Audit and monitoring and assessing the effectiveness, performance, resourcing, independence and standing of the function.
Committee governance
The Committee keeps the Board informed and advises on matters concerning the Group's financial reporting requirements to ensure that the Board has exercised oversight of the work carried out by management, Global Internal Audit and the external auditor.
Committee meetings usually take place a couple of days before Board meetings to allow the Committee to report its findings and recommendations in a timely and orderly manner. This is done through the Chair who comments on matters of particular relevance. The Board also receives copies of the Committee agenda and minutes of meetings.
The Group Chief Executive, Group Chief Financial Officer, Group Head of Finance, Global Financial Controller, Group Head of Internal Audit, Group Chief Risk and Compliance Officer, Group Company Secretary and Chief Governance Officer and other members of senior management routinely attended meetings of the GAC. The external auditor attended all meetings.
The Chair held regular meetings with management, Global Internal Audit and the external auditor to discuss agenda planning and specific issues as they arose during the year outside the formal Committee process. The Committee also regularly met separately with the internal and external auditors and other senior management to discuss matters in private.
The Committee Secretary regularly met with the Chair to ensure the Committee fulfilled its governance responsibilities, and to consider input from stakeholders when finalising meeting agendas, tracking progress on actions and Committee priorities.
| | | | | | | | | | | | | | | | | | | | | | | | | | | | | | | | |
| Matters considered during 2021 | | | | |
| | | | | | | | | | |
| Jan | Feb | Mar | Apr | Jun | Jul | Sep | Oct | Nov | Dec |
| Reporting | | | | | | | | | | |
Financial reporting matters including: –review of financial statements, ensuring that disclosures are fair, balanced and understandable –significant accounting judgements –going concern assumptions and viability statement –supplementary regulatory information | l | l | ô | l | l | l | l | l | l | l |
| ESG and climate reporting | l | l | ô | ô | ô | l | ô | l | l | l |
| Regulatory reporting-related matters | l | l | l | l | l | l | l | ô | ô | l |
| Certificates from principal subsidiary audit committees | ô | l | ô | ô | ô | l | ô | ô | ô | ô |
| Control environment | | | | | | | | | | |
| Control enhancement programmes | l | l | l | l | l | l | l | l | ô | ô |
| Group transformation | l | ô | ô | ô | l | ô | l | l | ô | l |
| Review of deficiencies and effectiveness of internal financial controls | l | l | ô | l | l | l | l | l | ô | l |
| Internal audit | | | | | | | | | | |
| Reports from Global Internal Audit | l | l | ô | l | ô | l | ô | l | ô | l |
| Annual audit plan, independence and effectiveness | l | ô | ô | l | ô | l | ô | ô | ô | l |
| External audit | | | | | | | | | | |
| Reports from external audit, including external audit plan | l | l | ô | l | l | l | l | l | ô | l |
| Appointment, remuneration, non-audit services and effectiveness | l | l | ô | l | l | ô | ô | l | ô | ô |
| Compliance | | | | | | | | | | |
| Accounting standards and critical accounting policies | l | l | ô | ô | ô | ô | ô | ô | ô | l |
| Corporate governance codes and listing rules | ô | l | ô | ô | ô | l | ô | ô | ô | ô |
| Whistleblowing | | | | | | | | | | |
| Whistleblowing arrangements and effectiveness | ô | l | ô | ô | l | ô | ô | ô | ô | l |
Compliance with regulatory requirements
The Board has confirmed that each member of the Committee is independent according to the criteria from the US Securities and Exchange Commission, and the Committee continues to have competence relevant to the sector in which the Group operates. The Board has determined that David Nish and Jackson Tai are ‘financial experts’ for the purposes of section 407 of the Sarbanes-Oxley Act and have recent and relevant financial experience for the purposes of the UK and Hong Kong Corporate Governance Codes.
The GAC Chair had regular meetings with the regulators, including the UK’s PRA and the Financial Conduct Authority ('FCA'). These included trilateral meetings involving the Group’s external auditor PwC.
The Committee assessed the adequacy of resources of the accounting and financial reporting function. It also monitored the legal and regulatory environment relevant to its responsibilities.
How the Committee discharged its responsibilities
Connectivity with principal subsidiary audit committees
The Committee maintains a close working relationship with the principal subsidiary audit committees through formal and informal channels.
On a half-year basis, principal subsidiary audit committees provide certifications to the GAC regarding the preparation of their financial statements, adherence to Group policies and escalation of any issues that require the attention of the GAC. Recognising the additional focus on prudential regulatory reporting, the GAC sought additional information via these certifications regarding the governance, review and assurance activities undertaken by the principal subsidiary audit committees in relation to prudential regulatory reporting.
The GAC Chair regularly met with the chairs of the principal subsidiary audit committees, and attended meetings to enable close links and deeper understanding on judgements around key issues. Certain chairs and audit committee members from the principal subsidiary audit committees were also invited to attend meetings of the GAC on relevant topics.
At the Non-Executive Director Summit, the GAC Chair engaged with a number of subsidiary non-executive Directors in a breakout session to discuss key focus areas, including regulatory reporting, ESG and climate reporting and whistleblowing arrangements.
Regular post-meeting communications to principal subsidiary audit chairs were supplemented with informal quarterly catch-ups with a group of the audit committee chairs. These provided opportunities for the discussion of key matters impacting subsidiaries and the Group in between formal meetings.
Internal controls
In 2021, the GAC devoted significant time in overseeing management’s approach to enabling a sustainable transformation of the control environment that supports financial, prudential regulatory and other regulatory reporting to meet the evolving expectations of regulators and other stakeholders. The programme will drive end-to-end organisational alignment so that principles and control standards can be designed to deliver a more integrated, standardised and automated control environment. The Committee received regular updates on the mobilisation of the programme workstreams, resourcing and engagement throughout the Group and with regulators. The oversight and implementation of the programme and its component parts will be a key focus for the Committee in 2022.
The Committee received regular updates and confirmations that management had taken, or was taking, the necessary actions to remediate any failings or weaknesses identified through the operation of the Group’s framework of controls. For further details on how the Board reviewed the effectiveness of key aspects of internal control, see page 327.
As required by the Sarbanes-Oxley Act, the GAC received updates on the Group's work on section 404 compliance and the Group's broader financial control environment during the year. This was to assess the effectiveness of the internal control system for financial reporting and any developments affecting it. Based on this work, the GAC recommended that the Board support the assessment of the internal controls over financial reporting.
Financial reporting
The Committee is responsible for reviewing the Group’s financial reporting during the year, including the Annual Report and Accounts, Interim Report, quarterly earnings releases, analyst presentations and, where material, Pillar 3 disclosures and other items arising from the review of the Group Disclosure Committee. As part of its review, the GAC:
•evaluated management’s application of critical accounting policies and material areas in which significant accounting judgements were applied;
Report of the Directors | Corporate governance report
•focused on compliance with disclosure requirements to ensure these were consistent, appropriate and acceptable under the relevant financial and governance reporting requirements;
•provided advice to the Board on the form and basis underlying the long-term viability statement; and
•gave careful consideration to the key performance metrics related to strategic priorities and ensured that the performance and outlook statements were fair, balanced and reflected the risks and uncertainties appropriately.
In conjunction with the Group Risk Committee (‘GRC’), the GAC considered the current position of the Group, along with the emerging and principal risks, and carried out a robust assessment of the Group’s prospects, before making a recommendation to the Board on the Group’s long-term viability statement. The GAC also undertook a detailed review before recommending to the Board that the Group continues to adopt the going concern basis in preparing the annual and interim financial statements. Further details can be found on page 329.
Fair, balanced and understandable
Following review and challenge of the disclosures, the Committee recommended to the Board that the financial statements, taken as a whole, were fair, balanced and understandable. The financial statements provided the shareholders with the necessary information to assess the Group’s position and performance, business model, strategy and risks facing the business, including in relation to the increasingly important ESG considerations.
The Committee reviewed the draft Annual Report and Accounts 2021 and results announcements to enable input and comment. It was supported by the work of the Group Disclosure Committee, which also reviewed and assessed the Annual Report and Accounts 2021 and investor communications.
This work enabled the GAC to provide positive assurance to the Board to assist them in making the statement required in compliance with the 2018 UK Corporate Governance Code.
ESG and climate reporting
During the year, the GAC reviewed the strategy, scope and status of ESG and climate reporting, including the climate change resolution and scenario analysis disclosure. Management updates were also informed by an HSBC-specific stakeholder feedback survey, which highlighted the appetite for more detailed ESG disclosures on climate metrics, emissions targets and plans on how these would be achieved. The Committee considered the operational, disclosure and litigation risks, which could arise from making further external commitments related to ESG and climate reporting.
The development of methodologies, tools and data to support our ESG strategy remained a key challenge. The GAC discussed management plans to enhance and assure internal and external ESG data sourcing across the Group to develop a common ESG data inventory. The Committee considered the approach to subsidiary reporting, in particular the availability of granular data to support the Group subsidiaries in fulfilling their mandatory disclosure requirements.
Management updated the Committee on the verification and assurance framework to ensure that ESG and climate disclosures were materially accurate, consistent, fair and balanced. The GAC discussed the roles and work of the three lines of defence as part of this framework, as well as proposals for further limited third-party assurance to be performed over specific ESG-related metrics.
The Committee oversaw and challenged management on the proposals to further expand the ESG review section of the Annual Report and Accounts to incorporate additional disclosures. These include the integration of TCFD disclosures, which were previously published in a stand-alone supplement, and net zero disclosures in relation to the special shareholder resolution on climate change.
The GAC and the GRC held a joint meeting to review the progress made to deliver on the commitment – under the climate change special resolution – to publish a policy to phase out the financing
of coal-fired power and thermal coal mining. The committees discussed the positions taken, and the risks associated with the policy, as well as the methodology for capturing and reporting the emissions data across the financing portfolio.
Regulatory reporting
The GAC focused on what improvements were required to regulatory reporting processes and controls, which were operating outside the Board’s risk tolerance. The Committee continued to focus heavily on the quality and reliability of regulatory reporting to strengthen the end-to-end processes to meet regulatory expectations. It also challenged management on the scope of the regulatory reporting enhancement programmes. This was in response to findings from HSBC-specific external reviews and other regulatory pronouncements including the PRA's ‘Dear CEO’ letter on thematic findings on the reliability of regulatory reporting across the industry. The Committee Chair invited certain principal subsidiary audit committee members to GAC meetings to participate in discussions to ensure alignment and understanding of key issues and ongoing regulatory engagement.
Management discussed root cause themes, remediation of known issues and areas of increased risk identified from the risk-based read-across exercise. The Committee considered the near-term actions being taken by management, as well as the strategic remediation plan, including the costs, resources and time for implementation. It also challenged management on the delivery risks and the dependency on other ongoing programmes.
Management also highlighted potential impacts on some of the Group's regulatory ratios, such as CET1 and LCR, and adjustments required to external disclosures.
UK audit reform
The Committee spent significant time in reviewing a UK Government consultation paper – from the Department of Business, Energy and Industrial Strategy – on ‘Restoring Trust in Audit and Corporate Governance’. The GAC oversaw the development of the direct HSBC response to the consultation, as well as management’s engagement across a number of industry bodies to understand wider views.
In addition, the Committee discussed the management activities being undertaken in preparation for future stages of the consultation. The GAC took steps to review its audit and assurance policy and expand assurance in certain areas, particularly regulatory reporting and ESG. The Committee also considered the impact on the future audit tender strategy, and will be looking to tender in advance of the 10-year rotation point. The Committee has proactively started engagement with the Big Four and challenger audit firms, as part of its preparations.
The Committee will continue to monitor outcomes and next steps arising from the UK Government’s consultation.
External auditor
The GAC has the primary responsibility for overseeing the relationship with the Group’s external auditor, PwC.
PwC completed its seventh audit, providing robust challenge to management and sound independent advice to the Committee on specific financial reporting judgements and the control environment. The senior audit partner is Scott Berryman who has been in the role since 2019. The Committee reviewed the external auditor’s approach and strategy for the annual audit and also received regular updates on the audit, including observations on the control environment. Critical audit matters discussed with PwC are set out in its report on page 334.
External audit plan
The GAC reviewed the PwC external audit approach, including the materiality, risk assessment and scope of the audit. The Committee invited a number of the principal subsidiary audit partners to discuss their priorities as part of the review of the external audit plan.
PwC highlighted the changes being made to their approach to enhance the quality and effectiveness of the audit. Changes for the
2022 audit included more auditing being performed centrally across legal entities and the increased use of technology solutions, some of which are aligned to technology change and transformation activities across HSBC.
Effectiveness of external audit process
The GAC assessed the effectiveness of PwC as the Group's external auditor, using a questionnaire that focused on the overall audit process, its effectiveness and the quality of output. PwC highlighted the actions being taken in response to the HSBC effectiveness review, including the development of audit quality indicators, which would provide a balanced scorecard and transparent reporting to the GAC. These focused on the following areas:
•findings from inspections across the Group on PwC as a firm;
•the hours of audit work delivered by senior PwC audit team members, the extent of specialist and expert involvement, delivery against agreed timetable and milestones and the use of technology;
•any new control deficiencies in Sarbanes-Oxley locations, proportion of management identified deficiencies and delivery of audit deliverables to agreed timelines; and
•outcomes and scores from annual audit surveys, independent senior partner reviews and prior period errors.
The GAC will continue to receive regular updates from PwC and management on the progress of the external audit plan and PwC performance across the audit quality indicators.
The GAC monitored the policy on hiring employees or former employees of the external auditor, and there were no breaches of the policy highlighted during the year. The external auditor attended all Committee meetings and the GAC Chair maintains regular contact with the senior audit partner and his team throughout the year.
Independence and objectivity
The Committee assessed any potential threats to independence that were self-identified or reported by PwC. The GAC considered PwC to be independent and PwC, in accordance with professional ethical standards and applicable rules and regulations, provided the GAC with written confirmation of its independence for the duration of 2021.
The Committee confirms it has complied with the provisions of the The Statutory Audit Services for Large Companies Market Investigation (Mandatory Use of Competitive Tender Processes and Audit Committee Responsibilities) Order 2014 for the financial statements. The Committee acknowledges the provisions contained in the 2018 UK Corporate Governance Code in respect of audit tendering. In conformance with these requirements, HSBC will be required to tender for the audit for the 2025 financial year end and beyond, having appointed PwC from 1 January 2015.
The Committee believed it would not be appropriate to re-tender in 2021 as a change in auditor would have a significant impact on the organisation, including on the Global Finance function and would increase operational risk. In 2021, the Committee's priority was to monitor closely the ongoing industry developments and proposals on reform of the UK external audit market and the impact this may have on any tender process. As a result, the Committee has commenced planning for the next tender process in advance of the 10-year re-tender period, likely to take place no later than early 2023.
The Committee has recommended to the Board that PwC should be reappointed as auditor. Resolutions concerning the reappointment of PwC and its audit fee for 2022 will be proposed to shareholders at the 2022 AGM.
Non-audit services
The Committee is responsible for setting, reviewing and monitoring the appropriateness of the provision of non-audit services by the external auditor. It also applies the Group’s policy on the award of non-audit services to the external auditor. The non-audit services are carried out in accordance with the external
auditor independence policy to ensure that services do not create a conflict of interest. All non-audit services are either approved by the GAC, or by Group Finance when acting within delegated limits and criteria set by the GAC.
During the period, it was identified that PwC provided an impermissible training service via a publicly available seminar in respect of the implementation of a new Indonesian IT security regulation. The attendees at this seminar included six members of staff from HSBC Indonesia. The HSBC staff who attended the course were not from the Finance function and were not in roles relevant to the audit. In addition, HSBC Indonesia is not within the scope of the Group audit. In light of the nature and scope of the original service and the mitigating factors mentioned above, we do not believe that the provision of the service has affected PwC’s professional judgement or integrity in respect of the audit of the Group. Mitigating actions have been implemented by both PwC and HSBC to reinforce the controls around the provision of non-audit services by PwC, including additional independence training and improved communication between relevant parties.
The non-audit services carried out by PwC included 69 engagements approved during the year where the fees were over $100,000 but less than $1m. Global Finance, as a delegate of GAC, considered that it was in the best interests of the Group to use PwC for these services because they were:
•audit-related engagements that were largely carried out by members of the audit engagement team, with the work closely related to the work performed in the audit;
•engagements covered under other assurance services that require obtaining appropriate audit evidence to express a conclusion designed to enhance the degree of confidence of the intended users other than the responsible party about the subject matter information; or
•other permitted services to advisory attestation reports on internal controls of a service organisation primarily prepared for and used by third-party end users.
Ten engagements during the year were approved where the fees exceeded $1m. These were mainly engagements required by the regulator and incremental fees related to previously approved engagements, including the provision of services by PwC relating to the Section 166 Financial Services and Markets Act 2000 Skilled Person report. The PRA instructed a Section 166 review of HSBC's credit risk RWAs as reported at 31 December 2020 and agreed for PwC to provide a reasonable assurance opinion on the accuracy of the regulatory reporting at that date. One new engagement outside the scope of the pre-approved services related to preliminary advanced audit procedures for the adoption of IFRS 17 in 2023.
| | | | | | | | | | | | |
| 2021 | 2020 | |
| Auditors‘ remuneration | $m | $m |
| Total fees payable | 129.4 | | 130.2 | |
| Fees for non-audit services | 41.3 | | 37.3 | |
Global Internal Audit
The primary role of the Global Internal Audit function is to help the Board and management protect the assets, reputation and sustainability of the Group. Global Internal Audit does this by providing independent and objective assurance on the design and operating effectiveness of the Group’s governance, risk management and control framework and processes, prioritising the greatest areas of risk.
The independence of Global Internal Audit from day-to-day line management responsibility is critical to its ability to deliver objective audit coverage by maintaining an independent and objective stance. Global Internal Audit is free from interference by any element in the organisation, including on matters of audit selection, scope, procedures, frequency, timing, or internal audit report content. Global Internal Audit adheres to The Institute of Internal Auditors' mandatory guidance.
The Group Head of Internal Audit reports to the Chair of the GAC and there are frequent and regular meetings held between them.
Report of the Directors | Corporate governance report
Results of audit work, together with an assessment of the Group’s overall governance, risk management and control framework and processes are reported regularly to the GAC, GRC and local audit and risk committees, as appropriate. This reporting highlights key themes identified through audit activity, and the output from continuous monitoring. This includes business and regulatory developments and an independent view of emerging and horizon risk, together with details of audit coverage and any required changes to the annual audit plan.
Audit coverage is achieved using a combination of business and functional audits of processes and controls, risk management frameworks and major change initiatives, as well as regulatory audits, investigations and special reviews. In addition to the ongoing importance of regulatory-focused work, key risk theme categories for 2021 audit coverage were strategy, governance and culture, financial crime, conduct and compliance, financial resilience and operational resilience. In 2021, Global Internal Audit increased coverage on the Group’s transformation programme and performed project audit activity for selected complex and high-priority business cases. Global Internal Audit also continued its 'real-time audit' approach, notably to cover areas of strategic importance. 'Real-time audits' provide real-time, independent ongoing observations to management, with issues being raised for significant observations that are not addressed in a timely manner. In addition, in 2021, Global Internal Audit implemented its revised 'culture audit' approach which assesses the impact of culture in supporting or inhibiting sustainable performance against strategic aspirations and managing risk within risk appetite. The approach combines internal audit and behavioural science principles, which align to regulator culture assessments and industry best practice.
Executive management is responsible for ensuring that issues raised by the Global Internal Audit function are addressed within an appropriate and agreed timetable. Confirmation to this effect must be provided to Global Internal Audit, which validates closure on a risk basis.
Consistent with previous years, the 2022 audit planning process includes assessing the inherent risks and strength of the control environment across the audit entities representing the Group. Results of this assessment are combined with a top-down analysis of risk themes by risk category to ensure that themes identified are addressed in the annual plan. Risk theme categories for the 2022 audit work continue to be strategy, governance and culture, financial crime, conduct and compliance, financial resilience and operational resilience. In 2022, a quarterly assessment of key risk themes will form the basis of thematic reporting and plan updates and will ultimately drive the 2023 planning process. The annual audit plan and material plan updates made in response to changes in the Group’s structure and risk profile are approved by the GAC.
Based on regular internal audit reporting to the GAC, private sessions with the Group Head of Internal Audit, the Global Professional Practices annual assessment and quarterly quality assurance updates, the GAC is satisfied with the effectiveness of the Global Internal Audit function and the appropriateness of its resources.
Global Internal Audit maintains a close working relationship with HSBC’s external auditor, PwC. The external auditor is kept informed of Global Internal Audit’s activities and results, and is afforded free access to all internal audit reports and supporting records.
Principal activities and significant issues considered during 2021
Collaborative oversight by GAC and GRC
The GAC and GRC worked closely to ensure there were procedures to manage risk and oversee the internal control framework. They also worked together to ensure any common areas of responsibility were addressed appropriately with inter-committee communication or joint discussions with the Chairs.
The Chairs are members of both committees and engage on the agendas of each other’s committees to further enhance connectivity, coordination and flow of information.
Areas of joint focus for the GAC and GRC during 2021 were:
Sustainable control environment
As discussed in the ‘Internal controls’ section of this report, the GAC oversaw management’s approach to create a sustainable transformation of the control environment. The programme, and its impact on the internal control environment as a whole, was also discussed by the GRC.
In conjunction with the GRC, the GAC monitored the remediation of significant deficiencies and weaknesses in controls raised by management and the external auditor. The GAC will continue to monitor the progress of remediation as well as efforts to integrate requirements of the Sarbanes-Oxley Act with the operational risk framework as part of the sustainable control environment programme. The committees will also continue to monitor the regulatory reporting enhancements programmes to bring regulatory reporting processes within the risk appetite.
In 2021, the GAC and GRC Chairs worked closely with the Group Chief Risk and Compliance Officer and the Group Head of Internal Audit to:
•ensure that risks and issues highlighted at the GAC from audit reports were appropriately captured and reported as part of the wider internal controls discussion at the GRC; and
•coordinate the approach and oversight required for the remediation of very high risk and high risk issues identified by Global Internal Audit, as well as the establishment of a single repository of issues across HSBC.
The GAC and the GRC also held a joint meeting to consider data strategy and data management. Further details can be found in the GRC report on page 286.
Financial reporting
In addition to the GRC’s overall review of the Group’s risk appetite and risk management framework, the GAC gave particular focus to risk measures impacting financial reporting. This included the review of the financial reporting, tax and pension risk appetite statements. The GAC and the GRC also considered how the approach to financial reporting risk appetite could be evolved to drive a reduction in the exposure to this risk over the medium term and provide better visibility to financial and prudential regulatory reporting separately.
The committees worked collaboratively in reviewing ESG and climate risks, as well as the financial and regulatory reporting impacts. For further details, see the 'ESG and climate reporting’ section of this report on page 80.
Given the continued impact from the Covid-19 pandemic, the GAC and the GRC reviewed the risks arising from models used for the estimation of expected credit losses under IFRS 9. The committees challenged the underlying economic scenarios, additional scenarios added by management and the reasonableness of the weightings applied to each scenario in order to understand the impact on the financial statements.
Whistleblowing and speak-up culture
An important part of HSBC's values is ensuring that colleagues have the confidence to speak up when they observe unlawful or unethical behaviour. HSBC provides a variety of channels for colleagues to raise concerns, including through the Group’s whistleblowing channel, HSBC Confidential (see page 87 for further information). The GAC is responsible for the oversight of the effectiveness of the Group’s whistleblowing arrangements. The Group Head of Compliance provides periodic reporting to the GAC on the efficacy of the whistleblowing arrangements, providing an assessment of controls and detailing the results of internal audit assessments. The Committee is also briefed on culture and conduct risks and associated management actions arising from whistleblowing cases. The Chair of the GAC acts as the Group’s whistleblowers’ champion, with responsibility for ensuring and overseeing the integrity, independence and effectiveness of HSBC’s policies and procedures on whistleblowing and the protection of whistleblowers. The Chair met with the Group Head of Conduct, Policy and Whistleblowing
throughout the year for briefings on material whistleblowing cases and assessments of the whistleblowing arrangements.
The Committee has requested updates on a number of key areas during 2021, including: enhancements made to the Group’s whistleblowing arrangements following an external benchmarking assessment in December 2020; completion of actions arising from
Global Internal Audit reviews; and details of key emerging conduct themes across the arrangements. During 2022, the Committee will be provided with updates on how whistleblowing arrangements are actively supporting our purpose and values, and conduct approach.
| | | | | | | | | | | |
| Principal activities and significant issues considered during 2021 | | |
| Areas of focus | | Key issues | Conclusions and actions | | |
| Financial and regulatory reporting | | Key financial metrics and strategic priorities The GAC considered the key judgements in relation to external reporting to track the key financial metrics and strategic priorities and to review the forecast performance and outlook. | In exercising its oversight, the Committee assessed management's assurance and preparation of external financial reporting disclosures. The Committee was particularly focused on the ongoing Covid-19-related uncertainty and how management addressed and reflected the impact of the pandemic in external reporting and disclosures. The Committee reviewed the draft external reporting disclosures and provided feedback and challenge on the top sensitive disclosures, including key financial metrics and strategic priorities to ensure HSBC was consistent and transparent in its messaging. | | |
| Environmental, social and governance (‘ESG’) reporting The Committee considered management's efforts to enhance ESG disclosures and associated verification and assurance activities. The GAC reviewed the 2021 ESG disclosure approach in line with our external commitments. | In relation to our climate change resolution, particular attention was given to the disclosure of the financed emissions. The Committee reviewed the ESG reporting strategy, including the broadening of ESG coverage in the Annual Report and Accounts and management’s approach on integrated reporting, which will be further informed by feedback from external stakeholders. | | |
| Regulatory reporting assurance programme The GAC monitored the progress of the regulatory reporting assurance programme to enhance the Group’s regulatory reporting, impact on the control environment and oversee regulatory reviews and engagement. | The Committee reflected on the continued focus on the quality and reliability of regulatory reporting by the PRA and other regulators globally. The GAC reviewed management’s efforts to strengthen and simplify the end-to-end operating model, including commissioning independent external reviews of various aspects of regulatory reporting. The Committee discussed and provided management’s engagement plans with the Group’s regulators, including any potential impacts on some of our regulatory ratios such as CET1 and LCR. We continue to keep the PRA and other relevant regulators informed of our progress. | | |
| | | | | |
| Significant accounting judgements | | Expected credit losses The measurement of expected credit losses involves significant judgements, particularly under current economic conditions. Despite a general recovery in economic conditions in 2021, there remains an elevated degree of uncertainty over ECL estimation under current conditions, due to macroeconomic, political and epidemiological uncertainties. | The GAC reviewed the economic scenarios for the key countries in which the Group operates, and challenged management's judgements as to the weightings assigned to these scenarios. The GAC also challenged management's approach to making management adjustments to account for the uncertainty in outcomes arising from Covid-19 and China commercial real estate,, including the rationale for such adjustments, the controls underpinning the adjustment processes, and under what conditions such adjustments could be reduced or removed. The GAC also challenged management on the overall levels of ECL across portfolios, including looking at historical performances of portfolios and peer group comparisons. | | |
| Goodwill, other non-financial assets and investment in subsidiaries impairment During the year, management tested for impairment goodwill, other non-financial assets and investments in subsidiaries. Key judgements in this area relate to long-term growth rates, discount factors and what cash flows to include for each cash-generating unit tested, both in terms of compliance with the accounting standards and reasonableness of the forecast. During the year, the Group recognised $0.6bn impairment in relation to goodwill and an impairment reversal of $3.1bn in investments in subsidiaries. | The GAC received reports on management's approach to goodwill, other non-financial assets and investments in subsidiaries impairment testing and challenged the approach and methodologies used,with a key focus on the cashflows included within the forecasts and the discount rates used. The GAC also challenged management's key judgements and considered the reasonableness of the outcomes as a sense check against the business forecasts and strategic objectives of HSBC. | | |
| | | |
| Associates (Bank of Communications Co., Limited) During the year, management performed the impairment review of HSBC’s investment in Bank of Communications Co., Ltd (‘BoCom’). The impairment reviews are complex and require significant judgements, such as projected future cash flows, discount rate, and regulatory capital assumptions. | The GAC reviewed the judgements in relation to the impairment review of HSBC’s investment in BoCom, including the sensitivity of the results to estimates and key assumptions such as projected future cash flows and regulatory capital assumptions. Additionally, the GAC reviewed the model’s sensitivity to long-term assumptions including the continued appropriateness of the discount rates. The GAC also challenged management to review all aspects of its approach to accounting for BoCom to ensure the approach remains the most appropriate in terms of accounting judgements including compliance with the relevant accounting requirements. | | |
| Legal proceedings and regulatory matters Management has used judgement in relation to the recognition and measurement of provisions, as well as the existence of contingent liabilities for legal and regulatory matters, including, for example, an FCA investigation into HSBC Bank’s and HSBC UK Bank’s compliance with the UK money laundering regulations and financial crime systems and controls requirements. | The GAC received reports from management on the legal proceedings and regulatory matters that highlight the accounting judgements for matters where these are required. The matters requiring significant judgements were highlighted. The GAC has reviewed these reports and agrees with the conclusions reached by management. | | |
Report of the Directors | Corporate governance report
| | | | | | | | | | | |
| Principal activities and significant issues considered during 2021 (continued) | | |
| Areas of focus | | Key issues | Conclusions and actions | | |
| Significant accounting judgements | | Valuation of defined benefit pension obligations The valuation of defined benefit pension obligations involves highly judgemental inputs and assumptions, of which the most sensitive are the discount rate, pension payments and deferred pensions, inflation rate and changes in mortality. | The GAC has considered the effect of changes in key assumptions on the HSBC UK Bank plc section of the HSBC Bank (UK) Pensions Scheme, which is the principal plan of HSBC Group. | | |
| Valuation of financial instruments Due to the ongoing volatile market conditions in 2021, management continuously refined its approach to valuing the Group’s investment portfolio. In addition, as losses were incurred on the novation of certain derivative portfolios, management considered whether fair value adjustments were required under the fair value framework. Management’s analysis provided insufficient evidence to support the introduction of these adjustments in line with IFRSs. | The GAC considered the key valuation metrics and judgements involved in the determination of the fair value of financial instruments. The GAC considered the valuation control framework, valuation metrics, significant year-end judgements and emerging valuation topics and agrees with the judgements applied by management. | | |
| Long-term viability and going concern statement The GAC has considered a wide range of information relating to present and future projections of profitability, cash flows, capital requirements and capital resources. These considerations include stressed scenarios that reflect the increasing uncertainty that the global Covid-19 pandemic continues to have on HSBC’s operations, as well as considering potential impacts from other top and emerging risks, and the related impact on profitability, capital and liquidity. | In accordance with the UK and Hong Kong Corporate Governance Codes, the Directors carried out a robust assessment of the principal risks of the Group and parent company. The GAC considered the statement to be made by the Directors and concluded that the Group and parent company will be able to continue in operation and meet liabilities as they fall due, and that it is appropriate that the long-term viability statement covers a period of three years. | | |
| Tax-related judgements HSBC has recognised deferred tax assets to the extent that they are recoverable through expected future taxable profits. Significant judgement continues to be exercised in assessing the probability and sufficiency of future taxable profits, future reversals of existing taxable temporary differences and ongoing tax planning strategies. | The GAC considered the recoverability of deferred tax assets, in particular in the US, France and the UK. The GAC also considered management’s judgements relating to tax positions in respect of which the appropriate tax treatment is uncertain, open to interpretation or has been challenged by the tax authority. | | |
| | Impact of acquisitions and disposals In 2021, HSBC engaged in a number of business acquisition and disposal activities, notably in the US, France, Singapore and India. There are a number of accounting impacts that need to be considered, including the timing of recognition of assets held-for-sale, gains or losses, and the measurement of assets and liabilities on acquisition or disposal. | The GAC considered the impacts of the planned exits of the French and US retail banking businesses and the timing of the accounting recognition of these transactions. The GAC also considered the financial and accounting impacts of other acquisitions and disposals. | | |
| | | | | |
| | | | | |
| | | | | | | | | | | |
| Principal activities and significant issues considered during 2021 (continued) | | |
| Areas of focus | | Key issues | Conclusions and actions | | |
| Group transformation | | Transformation and sustainable control environment The GAC will oversee the impact on the risk and control environment from the Group transformation programme.
| The Committee received regular updates on the Group transformation programme – and the broader change framework – to review the impact on the risk and control environment and to oversee progress of the transformation programme. In these updates, the Committee monitored the progress of the programme, and focused on the implementation of the new change framework and the management of the entire change portfolio. This oversight helped the Committee to understand the key improvements being made to the management of the change portfolio, and progress on the implementation. Management’s updates were supplemented by significant focus and assurance work from Global Internal Audit where a dedicated team continuously monitored and reviewed the Group transformation programme. This included carrying out a number of targeted audit reviews, in addition to audits of significant programmes. These reviews focused on key elements of change management. | | |
| |
| Global Finance transformation The Committee reviewed the proposals for the Global Finance organisational design, the migration to Cloud and the impact on financial controls. | The Committee has oversight for the adequacy of resources and expertise, as well as succession planning for the Global Finance function. During 2021, the Committee dedicated significant time to the review and progress of the multi-year Global Finance transformation programme, with the overall objectives being to improve the control environment and customer outcomes and to make use of technology to increase overall efficiency. In particular, the Committee discussed the challenges to Global Finance operations, including financial reporting, from the Covid-19 pandemic and sought assurance that controls were in place to maintain standards and quality. The Committee has received regular status updates on the progress of the Global Finance transformation, the outcomes achieved to date and challenges encountered. The Committee has continued to dedicate significant time to the review of the progress of the programme. A key objective of the programme is to improve the Group’s control environment and a particular focus of the Committee has been the interaction of the Global Finance transformation programme and the programmes to enhance the Group’s regulatory reporting control environment. The Committee has also considered the dependencies that key regulatory change programmes, such as the Basel III Reform programme, have on the Global Finance transformation. In addition, the Committee has specifically sought to understand the impact of new requirements and programme re-planning on the delivery and timing of programme outcomes. Sessions have been held with individual Committee members to support a more detailed understanding of the programme risks and challenges. The results of Global Internal Audit reviews of the programme have been considered by the Committee and there have been frequent discussions with Global Internal Audit on its assessment of the progress and risks of the programme. The Group Chief Financial Officer had private sessions with the Committee to share his perspectives on the progress of the Global Finance transformation and where additional focus was required. | | |
| | | | | |
| Regulatory change | | IFRS 17 'Insurance Contracts' The Committee will oversee the transition to IFRS 17 and consider the wider strategic implications of the change on the insurance business. | Earlier in 2021, management provided an update on the potential impact of IFRS 17 on HSBC’s reported numbers in the financial statements, and conducted a walk-through of the relevant disclosure requirements applicable to HSBC, including an introduction to GAAP and potential non-GAAP metrics to support investor communications during and after the transitional period. In response to questions from GAC members, including from the Chair, relating to the overall financial management of the insurance business, a separate session was organised with the Chair of the GAC on 16 June 2021. The meeting covered different aspects of insurance financial management, with a particular focus on interest rate management and business strategy. Since then, HSBC released further information on the impact of IFRS 17 on HSBC’s reported numbers, as part of the third quarter 2021 earnings release statement, as well as providing a briefing to analysts on IFRS 17. Feedback from analysts so far has been positive, particularly given HSBC was the first to provide high-level indicative impact based on planning assumptions. In December 2021, management provided an update on the disclosure of performance metrics on adoption of IFRS 17, including its current intention to continue to provide Value of New Business and embedded value metrics for comparability. | | |
| Basel III Reform The GAC considered the implementation of the Basel III Reform and the impact on the capital requirements and RWA assurance. This was considered in the context of the strategy and structure of the balance sheet.
| The Committee received an update on the progress and impact of the Basel III Reform programme on the Group. Management discussed the uncertainty over the final definition of the rules and the actions taken to ensure sufficient flexibility to make changes and mitigate risks from legislation being finalised at a later date. The discussion highlighted the dependencies of the Basel III Reform programme with other Group transformation programmes, in particular the dependency on adoption of the Finance on the Cloud solution and the impact on data delivery and storage. The Committee reviewed and challenged management on the findings from an audit on the programme structure, governance and the significant cost increase year on year. Management explained the actions being taken in response to the audit findings and the reasons for the increase in costs, which included delays to implementation dates caused by the Covid-19 pandemic. | | |
| |
Report of the Directors | Corporate governance report
| | | | | | | | | | | |
| Principal activities and significant issues considered during 2021 (continued) | | |
| Areas of focus | | Key issues | Conclusions and actions | | |
| Regulatory change | | Interest rate benchmark replacement The financial reporting risks of interest rate benchmark transition include the potential for volatility arising from financial instruments valuation, contract modification and hedge accounting. The transitions involve significant operational complexity for financial institutions, and industry approaches to transition continue to develop. | The GAC noted management’s early adoption of ‘Interest Rate Benchmark Reform – Phase 2’ amendments to IFRSs in relation to benchmark reform, including the disclosures necessary to support adoption of the reliefs. The Committee considered the risks and financial reporting impacts arising from the Ibor transition. Management discussed actions being taken to mitigate the risks, which included new product development and a client outreach programme, to ensure we were ready to migrate and able to explain the changes and outcomes arising from the transition to clients. Management advised about the operational challenges, such as the updates to current systems and processes that were required to support the accounting for the Ibor transition, and our external dependency on market and client readiness. In particular, management drew attention to the potentially material impact on hedge accounting programmes from the Ibor transition and the substantial costs and risks involved in the redocumentation of hedges. The Committee discussed the approach being taken across the industry with management and PwC, and potential impacts on the control environment relevant to financial reporting from the Ibor transition.
| | |
| | |
| | | | | |
Committee evaluation and effectiveness
The annual review of the effectiveness of the Board committees, including the GAC, was conducted internally in 2021. Led by the Group Company Secretary and Chief Governance Officer, the review concluded that the GAC continued to operate effectively. Management of meetings and reporting to the Board on discussions, in particular, were rated highly.
The review also made certain recommendations for continual improvement. The GAC was recommended to review the composition of the GAC to broaden the skillset, ensure clarity in roles and improve the coordination between the GAC and other Board committees and working groups relating to technology and ESG. Succession planning was also highlighted as a priority. The Committee considered the outcomes of the evaluation and accepts the findings. The evaluation outcomes were reported to the Board and the Committee will track progress against the recommendations during 2022.
Focus of future activities
At the beginning of each year, the Committee discusses its key priorities for the year ahead. In 2022, the Committee will continue to focus strongly on the remediation of controls, particularly those supporting regulatory reporting. The Committee will continue to monitor the execution of the Group's transformation programme and its impact on the risk and control environment. It will also monitor the interdependencies between the transformation programme and the implementation of large-scale regulatory change programmes, such as the Basel III reforms, the Ibor transition and IFRS 17 'Insurance Contracts'. A key priority will be to further embed ESG and climate-related disclosures to meet increasing expectations of stakeholders, in particular the implementation of robust processes and controls to support these disclosures. The Committee will focus on the audit tender strategy in preparation for the next re-tender, and will consider the impact of potential changes to the UK external audit market on HSBC's approach to audit and assurance.
| | |
"The GRC provided oversight on the management of Covid-19-related financial risks, including the Group's release of expected credit loss reserves in response to the improving macroeconomic conditions." |
Dear Shareholder
I am pleased to present the Group Risk Committee (‘GRC’) report.
The year commenced with a challenging risk outlook due to increasing Covid-19 infections and lockdowns across markets. The outlook began to stabilise by the second quarter, with the roll-out of global vaccine programmes, and the GRC monitored the impact of new strains, including the Omicron variant.
Against this backdrop, the GRC provided oversight on the management of Covid-19-related financial risks, including the Group’s release of expected credit loss reserves in response to the improving macroeconomic conditions. The Committee worked closely with the Group Chief Risk and Compliance Officer in strengthening the Group’s risk management framework to be even more forward looking, granular and risk connected. The GRC continued its oversight of people and operational challenges presented by the pandemic and market conditions.
Throughout the year, the GRC played a central role in reviewing and challenging management on the Group’s regulatory submissions and programmes, including the Bank of England's requirements for the resolvability assessment framework. The GRC had primary non-executive responsibility for reviewing the outcomes of regulatory stress tests, including the Bank of England's biennial exploratory scenario on the financial risk from climate risk, and the 2021 solvency stress test. The GRC reviewed and challenged the Group’s thermal coal phase-out policy and approach to climate-aligned finance in a joint meeting with the GAC. The Committee continued its oversight of the Group’s preparations to meet the PRA’s requirements on operational resilience.
The GRC continued to strengthen its composition, skills and experience to ensure that it remains well positioned to promote proactive risk governance. On 1 September 2021, we welcomed Dame Carolyn Fairbairn, a seasoned macroeconomic and political environment expert. Heidi Miller and Pauline van der Meer Mohr left the GRC on 28 May 2021. I extended our gratitude to each for their valued commitments and support to the GRC.
The GRC convened 11 formal meetings, two of which were joint meetings with the GAC, and 13 education and special meetings to review and challenge some of our most important responsibilities.

Jackson TaiChair
Group Risk Committee
22 February 2022
| | | | | | | | |
| Membership |
| Member since | Meeting attendance in 20211 |
| Jackson Tai (Chair) | Sep 2016 | 11/11 |
Dame Carolyn Fairbairn2 | Sep 2021 | 3/3 |
| Steven Guggenheimer | May 2020 | 11/11 |
| José Antonio Meade Kuribreña | May 2019 | 11/11 |
Heidi Miller3 | Sep 2014 | 6/6 |
Eileen Murray4 | Jul 2020 | 9/11 |
David Nish5 | Feb 2020 | 10/11 |
Pauline van der Meer Mohr6 | Apr 2018 | 5/6 |
1 These included two joint meetings with the Group Audit Committee.
2 Dame Carolyn Fairbairn joined the GRC on 1 September 2021.
3 Heidi Miller stepped down from the GRC on 28 May 2021.
4 Eileen Murray was unable to attend two meetings due to personal circumstances.
5 David Nish was unable to attend one meeting due to a prior commitment.
6 Pauline van der Meer Mohr was unable to attend one meeting due to personal circumstances, and stepped down from the GRC on 28 May 2021.
Key responsibilities
The GRC has overall non-executive responsibility for the oversight of risk-related matters and the risks impacting the Group. The GRC’s key responsibilities are:
•overseeing and advising the Board on all risk-related matters, including financial risks, non-financial risks and the effectiveness of the Group’s conduct framework;
•advising the Board on risk appetite-related matters, and key regulatory submissions;
•reviewing the effectiveness of the Group’s enterprise risk management framework and internal controls systems (other than internal financial controls overseen by the GAC); and
•reviewing and challenging the Group's stress testing exercises.
Committee governance
The Group Chief Risk and Compliance Officer, Group Chief Financial Officer, Group Chief Operating Officer, Group Company Secretary and Chief Governance Officer, Group Chief Legal Officer, Group Head of Internal Audit, Group Head of Finance and Group Head of Risk Strategy are standing attendees and regularly attend GRC meetings to contribute their subject matter expertise and insight. The Chair and members of the GRC also hold private meetings with the Group Chief Risk and Compliance Officer, the Group Head of Internal Audit and external auditor, PwC, following scheduled GRC meetings.
The participation of our senior business leaders, including the Group Chief Executive who attended 9 GRC meetings in 2021, reaffirmed the ownership and accountability of risks in the first line of defence and strengthened our holistic three lines of defence review of our most pressing risks.
The Chair meets regularly with the Group Chief Risk and Compliance Officer to discuss priorities, track progress on key actions and plan GRC meeting agendas. The Chair also has regular meetings with members of senior management to discuss specific risk matters that arise during the year outside formal meetings. The Chair meets regularly with the GRC Secretary and other members of the Corporate Governance and Secretariat to ensure the GRC meets its governance responsibilities, and to consider input from stakeholders when finalising meeting agendas, tracking progress on actions and GRC priorities. A summary of coverage is set out in the 'Matters considered during 2021' table on page 286.
Report of the Directors | Corporate governance report
| | | | | | | | | | | | | | | | | | | | | | | | | | | | | | | | |
| Matters considered during 2021 |
| | | | | | | | | | |
| Jan | Feb | Mar | Apr | May | Jun | Jul | Sep | Nov | Dec |
| Financial risk | l | l | l | l | l | l | l | l | ô | l |
| Credit risk | l | l | l | l | l | ô | l | l | ô | l |
| Climate risk | ô | ô | l | l | ô | ô | l | l | l | l |
| IT and operational risk including outsourcing, third-party risk management, cyber risk | l | l | l | l | l | ô | l | l | ô | l |
| Model risk | l | ô | ô | l | l | ô | ô | ô | ô | ô |
| People and conduct risk | ô | ô | l | ô | l | ô | ô | l | ô | l |
| Risk appetite | l | l | ô | ô | ô | ô | l | l | ô | l |
| Financial crime risk | l | l | l | l | l | ô | l | l | ô | l |
| Regulatory compliance | l | l | ô | l | l | ô | l | l | ô | l |
| Legal risk | l | l | ô | l | ô | ô | l | ô | ô | l |
How the Committee discharged its responsibilities
Activities outside formal meetings
The GRC held a number of meetings outside its regular schedule to facilitate more effective oversight of the risks impacting the Group. In particular, Directors’ education meetings and GRC Chair’s preview meetings strengthened the understanding of more technical topics and promoted constructive challenge. Areas covered included stress testing, ICAAP and ILAAP preparations, as well as recovery and resolution planning. Further details on these sessions are included in the 'Principal activities and significant issues considered during 2021' table starting on page 287.
Connectivity with principal subsidiary risk committees
During 2021 the GRC continued to actively engage with principal subsidiary risk committees through the scheduled participation of principal subsidiary risk committee chairs at GRC meetings, and through two connectivity meetings with the principal subsidiary risk committee chairs. This participation and connectivity promoted the sharing of information and best practices between the GRC and principal subsidiary risk committees.
The GRC also received reports on the key risks facing particular principal subsidiaries at its regular meetings and continued to review certifications from the principal subsidiary risk committees. The certifications confirmed that the principal subsidiary risk committees had challenged management on the quality of the information provided, reviewed the actions proposed by management to address any emerging issues and that the risk management and internal control systems have been operating effectively.
The principal subsidiary risk committee chairs have attended regular GRC meetings, education meetings and special review meetings. The engagement facilitated the GRC’s holistic review of regulatory submissions including stress tests, the Group recovery plan and the resolution self-assessment. The interactions furthered the GRC’s understanding of the risk profile of the principal subsidiaries, leading to more comprehensive review and challenge by the GRC.
Collaborative oversight by the GRC and the GAC
The GRC collaborated with the GAC to address any areas of significant overlap and to oversee risk more comprehensively, through inter-committee communication and joint meetings. The GRC and GAC Chairs are members of both committees to strengthen connectivity and the flow of information between the committees.
Joint meetings with the GAC
The GRC and the GAC convened a meeting on data strategy and data management in April 2021, with the attendance and support of the Group Chief Executive and the chief executive officers of the three global businesses. The committees reviewed the Group’s data strategy and the work required to embed its data policies, define its technology landscape and build a data-led culture. The committees challenged the first and second lines of defence on
how they are pursuing a data-driven strategy across four key areas for the Group. In the process the committees reviewed the regulatory landscape in relation to the Group's use of data, and the roles of the first and second lines of defence as co-owners of the management of data risk. The committees also reviewed the Group's approach to harnessing and using data to better unlock value for our customers.
The GRC and the GAC convened a joint meeting in November 2021 to review HSBC's thermal coal phase-out policy and the Group's approach to climate-aligned finance. The committees reviewed the progress made to deliver on the commitment to publish a policy to phase out the financing of coal-fired power and thermal coal mining by 2030 in EU/OECD markets, and by 2040 in other markets. The committees recommended the thermal coal phase-out policy and the approach to climate-aligned finance to the Board for approval.
Sustainable control environment
The GRC continued to review and challenge the Group’s internal controls to improve the control environment. The GRC reviewed entity level controls, which form the basis of HSBC’s control environment, as well as the results and remediation plans of a self-assessment performed by entity level control owners. At the request of the GRC Chair, with support of the GAC Chair, the GRC received an update on the thematic analysis and remediation plans for any overdue very high risk and high risk issues identified by Global Internal Audit.
Financial risk
During 2021, the GRC and the GAC reviewed and challenged the Group’s risk appetite and risk management framework relating to financial risk. In the process the committees discussed risk tolerance for financial reporting risk and financial reporting and tax risk, as well as improvement and remediation plans to enhance the broad regulatory reporting control environment.
Collaborative oversight by the GRC and the Technology Governance Working Group
The GRC worked closely with the Technology Governance Working Group to ensure appropriate alignment in the review, discussion, challenge and conclusions on technology risk-related matters. The GRC organised a technology-specific session with the working group in advance of the broader discussion at the joint GRC and GAC meeting on data strategy and data management. This ensured that the GRC benefited from the working group’s expertise and challenge in advance of the GRC and GAC discussion. The GRC also arranged for the Technology Governance Working Group Co-Chairs to lead discussions on data, models and infrastructure at the GRC climate biennial exploratory scenario pre-meetings.
Coordination and collaboration between the GRC and the Technology Working Group is supported by cross-membership. The GRC Chair is a member of the Technology Working Group and the Co-Chairs of the Technology Working Group are members of the GRC.
| | | | | | | | | |
| Principal activities and significant issues considered during 2021 |
| Areas of focus | | Key issues | Conclusions and actions |
| Risk appetite | | The Group risk appetite statement defines the Group’s risk appetite and tolerance thresholds and forms the basis of the first and second lines of defence’s management of risks, the Group's capacity and capabilities to support customers, and the pursuit of strategic goals. | The GRC maintained oversight of changes to the Group’s risk appetite statements, which in turn provided the basis for the Committee’s regular interactive review of financial and non-financial management information at each GRC meeting. The GRC continued to promote the development of more granular risk appetite statements that are more forward looking and risk responsive. The Committee continued to strengthen the linkage between risk appetite statements with the Group’s corporate strategy, stress testing, annual operating plan, as well as the Group's move towards stronger, sustainably higher returns for stakeholders, so that it may serve customers well. In January 2021, the GRC recommended the Group’s climate risk appetite statement to the Board for approval. It also recommended significant changes to the Group’s risk appetite statement, including in the areas of liquidity risk, wholesale credit risk metrics, climate risk, model risk, resilience risk, financial crime risk and regulatory compliance. |
|
| | | |
| Geopolitical developments and risks | | Geopolitical developments and risks continue to present significant challenges for the Group’s customer franchise and for the resilience of our operations. | The GRC continued to monitor global geopolitical risks that could impact the Group’s strategy, business performance or operations, including trade tensions between the US and China and the related regulatory and reputational risks for operations globally. |
|
| | | |
| Managing through the Covid-19 pandemic | | Managing operational risk and counterparty credit risk to enable the Group’s support of our customers, communities and the local economy throughout the Covid-19 pandemic. | The GRC continued to review the economic uncertainty stemming from the Covid-19 pandemic and the impact to the Group’s own risk management and exposures, including those related to credit risk and models. The Committee received updates on the progress of economic recovery and how the Group continued to support customers and sustain operational resilience during the pandemic. The GRC closely monitored Covid-19-related lending and financial support packages, including forbearance and other support to customers following the closure of government lending schemes. |
| | | |
| | | |
| Operational resilience | | Management’s operational resilience programme defines the Group’s policies and practices to strengthen its ability to protect customers. The programme identifies priority business services and their readiness to serve customers in the event of unforeseen disruptions in key markets. | The GRC continued its oversight of the Group’s operational resilience programme with a focus on 2021 and 2022 regulatory commitments to the PRA. The GRC reviewed and challenged the remediation plans for identified gaps, relevant controls, and the business ownership model and its supporting infrastructure. The GRC worked with management, including the Group Chief Control Officer to ensure ownership and the delivery of resilience outcomes is embedded with business and function leaders in the first line of defence. The Committee encouraged early adoption of operational resilience learnings across key markets and business, as well as the effective management of third-party risk. |
|
| | | |
| Technology resilience including cybersecurity and Cloud strategy | | Technology resilience is the risk of unmanaged disruption to any IT system within HSBC, as a result of malicious acts, accidental actions or poor IT practice or IT system failure. | The GRC reviewed reports on the state of the Group’s technology risk profile, as well as reports on cybersecurity. The GRC also maintained a strong focus on understanding the Group’s data risk landscape and its data strategy and data management programme. The GRC convened a joint meeting with the Group Audit Committee in April to review and challenge the data strategy and data management programme, which had the strong support of the Group Chief Executive and the chief executives of the global businesses. The committees agreed that the Group’s data strategy and data management programme should be elevated to the highest level of prominence within the Group. Further details on the joint meeting are included in the 'Joint meetings with the GAC' section on page 286. |
| | | |
| | | |
| | | |
| People, conduct and culture | | The Group promotes a culture that is effective in managing risk and leads to fair conduct outcomes. It seeks to actively manage the risk of not having the right people with the right skills doing the right thing, including risks associated with employment practices and relations. | The GRC monitored people risk and employee conduct, with support from the Group Chief Human Resources Officer and Group Chief Risk and Compliance Officer. The Committee considered people risk issues, including those arising from the impact of Covid-19, the link between remuneration and talent retention and acquisition, and reviewed workplace harassment data and insights. The GRC reviewed and challenged the alignment of risk and reward, and the impact of risk and compliance objectives on the Group’s variable pay pool. The GRC reviewed the Group’s new conduct approach, which was refreshed in 2021, to reflect prevailing regulatory and industry standards and to align with the Group’s new purpose and values. The GRC monitored progress in remediating the market conduct issues underlying the 2017 Federal Reserve Bank Consent Order (which remains in force) arising from its investigation into HSBC’s historical foreign exchange activities, and to ensure the reforms are effective and sustainable in the long term. |
| | | |
Financial crime risk | | The Group is committed to closely monitoring and managing the risk of knowingly or unknowingly helping parties to commit or to further potentially illegal activity, including both internal and external fraud | The GRC continued to review the Group’s approach to managing its financial crime risk across a number of important areas. These included the Group’s progress in enhancing its transaction monitoring framework, the use of next generation technology, the fraud landscape (particularly against heightened Covid-19 conditions), the Group’s fraud risk profile and the nature and scale of insider risk and the strategies for managing such risk. The GRC also maintained oversight of the ever-changing and increasingly complex international sanctions landscape in which the Group and its customers operate, as well as the Group’s approach to managing its compliance with sanctions regimes globally. |
| | | |
| | | |
Report of the Directors | Corporate governance report
| | | | | | | | | |
| Principal activities and significant issues considered during 2021 (continued) |
| Areas of focus | | Key issues | Conclusions and actions |
Capital and liquidity risk
including ICAAP and ILAAP
| | The GRC oversees the Group’s management of its financial risk. | The GRC reviewed the Group’s ongoing capital and liquidity management activities, including early warning indicators, scenario stress testing and the Group’s capital and liquidity adequacy. The GRC conducted its annual review, challenge and recommendation of the Group ICAAP and ILAAP to the Board for approval. GRC members received both an education session and previewed the ICAAP and ILAAP submissions in depth, with input from the principal subsidiary risk committee chairs. In the process the Committee evaluated the Group’s capital and liquidity strategies, capabilities including progress on the Group liquidity remediation programme and internal liquidity metric. |
|
| | | |
| Credit risk | | HSBC faces risk from the possibility of losses resulting from the failure of a counterparty to meet its agreed obligations to pay the Group | The Committee reviewed updates from management on the strategy and approach to manage credit risk and credit risk capabilities. The Committee reviewed forward economic scenarios and received quarterly updates on the Group’s expected credit losses and provisions, loan impairment charges and the credit risk arising from the wholesale portfolio and mortgage books. The GRC also reviewed the potential impact for the Group from external and secondary market events and recommended a management-led comprehensive review of the learnings and actions to be taken to drive a stronger credit risk culture. |
|
| | | |
| | | |
| | | |
| Climate risk | | Successful delivery of our climate ambition will be determined by our ability to measure and manage all components of climate risk. | The GRC remained focused on climate risk, reviewed quarterly reports on climate risk management, and maintained oversight over delivery plans to ensure the Group develops robust climate risk management capabilities. The GRC reviewed the Group's approach to climate risk appetite. The GRC approved the Group’s climate biennial exploratory scenario stress test submission to the PRA. In preparation, the GRC reviewed the scenario and convened an education session. The GRC challenged management on the results of the submission during three preparatory meetings on the key risks of climate change. During the sessions the GRC reviewed the engagement with clients, their transition plans and the importance of advancing risk appetite and management actions; the challenges in relation to data, modelling and infrastructure support; and the impact of climate change on our physical risks including through our residential and corporate real estate mortgage books. The GRC also reviewed new business and lending opportunities for our Wealth and Personal Banking business to support customers. The GRC and the GAC convened a joint meeting in November to review HSBC's thermal coal phase-out policy and the Group's approach to climate-aligned finance and recommended the thermal coal phase-out policy and approach to climate-aligned finance to the Board for approval. Further details on the joint meeting are included in the 'Joint meetings with the GAC' section on page 286. |
|
| | | |
| Model risk | | HSBC faces risk from the inappropriate or incorrect business decisions arising from the use of models that have been inadequately designed, implemented or used, or from models that do not perform in line with expectations and predictions. | The GRC continued to receive ongoing updates on the Group’s progress in managing model risk through the Group Chief Risk and Compliance Officer’s Group risk profile report and from the second line of defence. In January 2021, the Committee received an update on a number of material post-model adjustments to the Group’s wholesale portfolio, and on alternative modelling concepts being considered to recalibrate the idiosyncratic economic effects of the pandemic not captured by models. The update to the Committee in May 2021 reported on model risk deliverables against external review findings, improvements to enhance first line of defence engagement in the model lifecycle, and progress made to transform the model risk management function and implementation of new global model risk policy and standards. |
| | | |
| Stress testing | | HSBC performs internal and regulatory stress tests to measure the Group’s resilience and performance against stress. | The GRC reviewed and approved the outcomes of the initial submission of the impairments and RWA impact to the Bank of England's solvency stress test in April 2021 and subsequently the final outcomes of the 2021 solvency stress test scenarios in May 2021. In advance of the review, the Committee convened a preview meeting with the principal subsidiary risk committee chairs to review the solvency stress test submissions and the key learnings for the principal subsidiaries, including early identification of adjustments that might strengthen resilience in advance of a stress event. The Committee also undertook significant review and challenge of the Group’s 2021 GRC climate biennial exploratory analysis and approved the submissions to the PRA. The GRC undertook a technical review of the 2021 Group internal stress test outcomes at a GRC Chair’s preview meeting, which was followed by formal review and approval at the January 2021 GRC meeting. In the lead-up to the 2022 financial resource plan, the GRC reviewed and endorsed the economic scenarios underpinning the financial resource plan and Group internal stress test in July 2021. The GRC subsequently reviewed, challenged and approved the final Group internal stress test results in December 2021. The GRC also reviewed the implications of the results of the Federal Reserve’s Comprehensive Capital Analysis and Review severely adverse scenario stress test resubmission in relation to HSBC North America Holdings, and considered action being progressed by management in response. |
| | | |
| | | | | | | | | |
| Principal activities and significant issues considered during 2021 (continued) |
| Areas of focus | | Key issues | Conclusions and actions |
| Recovery and resolvability | | HSBC is required to show how its resolution strategy could be carried out in an orderly way, including identification of any risks to successful resolution. | The GRC continued its oversight of the Group’s progress in understanding its capabilities against the Bank of England’s requirements for recovery and resolvability. The GRC reviewed and challenged the governance pathway for the 2021 Group recovery plan, including review of the recovery indicator framework and a special session to consider the key messages, the recovery playbook and strategic management actions. In advance of review by the Committee the GRC Chair met with senior management to consider the Group recovery plan, including principal subsidiary risk committee components. The GRC was also heavily involved in the governance of the resolvability assessment framework, with updates on the valuation in resolution requirements, and the Group’s resolvability self-assessment and resolvability assessment framework testing approach. The GRC reviewed and recommended the resolvability assessment framework self-assessment to the Board for approval. The Board meeting was preceded by four Board sub-Group preview meetings jointly sponsored by the GRC and GAC Chairs to examine the Group’s submission. |
Committee evaluation
During 2021, the GRC implemented the recommendations of the internal committee evaluation conducted by the Group Company Secretary and Chief Governance Officer in November 2020. This included strengthening the focus of meeting agendas, and further increasing the GRC’s engagement with the Risk and Compliance functions and principal subsidiary risk committee chairs.
Continuing the commitment to regular evaluation, the Group Company Secretary and Chief Governance Officer performed an annual review of the effectiveness of the GRC in December 2021. The evaluation concluded that the GRC continued to operate effectively and in line with regulatory requirements, and identified enhancements, including a review of GRC composition, to help strengthen the GRC's ability to effectively review and challenge the Group's risk profile. Other recommendations included: strengthening the focus of agendas with an ongoing emphasis on emerging risks; continued enhancement to papers and presentations; optimising the use of member time spent outside of formal governance; and even stronger coordination of the roles of the Board committees. As with the GAC, succession planning will also remain a priority. The outcomes of the evaluation have been reported to the Board, and the GRC will track the progress in implementing recommendations during 2022.
Focus of future activities
The GRC’s focus for 2022 will include the following activities. It will:
•oversee the continued strengthening of the Group's risk appetite and risk management framework;
•continue to review the Group’s work to enhance its credit risk capabilities and culture;
•continue to oversee financial crime and fraud;
•oversee the delivery against climate change commitments and enhancing climate risk capabilities;
•continue the oversight of the delivery of technology-related programmes including the adoption of Cloud platforms, and enhancement of the Group’s IT systems/platform; and
•oversee key regulatory actions, including the implementation of the Group’s operational resilience strategy on a global basis, recovery and resolution, and stress testing submissions and capabilities.
Report of the Directors | Corporate governance report
| | | | | |
| Directors’ remuneration report |
| Page |
| Committee Chair's statement | |
| Directors' remuneration policy | |
| Annual report on Directors' remuneration | |
| Our approach to workforce remuneration | |
| |
| Additional regulatory remuneration disclosures | |
All disclosures in the Directors’ remuneration report are unaudited unless otherwise stated. Disclosures marked as audited should be considered audited in the context of financial statements taken as a whole.
| | |
'The remuneration outcomes for 2021 reflect the improvement in the Group's financial performance, our strong cost controls and execution of our strategy at pace.' |
Dear shareholder
I am pleased to present our 2021 Directors’ remuneration report on behalf of the members of the Group Remuneration Committee.
During 2021 the Group's financial performance improved against a backdrop of continuing challenging circumstances, including the emergence of new Covid-19 variants and ongoing low interest rates. We continued to execute our strategy at pace. The decisions the Committee has taken reflect the improvement in the Group's performance and progress towards its strategic targets. I have summarised our decisions in this statement.
At the 2022 Annual General Meeting ('AGM'), we will be seeking shareholder approval for a renewed Directors' remuneration policy. Our current policy received 97% of votes cast in favour at our 2019 AGM and its implementation received strong support with more than 96% of votes cast in favour in both 2020 and 2021. The Committee reviewed the remuneration policy, considering carefully whether it provides a fair and competitive remuneration opportunity to incentivise long-term performance. We also noted that the UK regulatory requirements currently restrict us from using a structure with a greater focus on variable pay and lower fixed pay.
Based on this review, engagement with our largest shareholders, and the premise that the policy, within our regulatory framework, supports the execution of our strategy, we have decided to roll forward our current policy with no changes to the fixed or variable pay structure and approach.
| | | | | | | | |
| Membership |
| Member since | Meeting attendance in 2021 |
| Pauline van der Meer Mohr (Chair) | Jan 2016 | 6/6 |
| Rachel Duan | Sept 2021 | 2/2 |
| Dame Carolyn Fairbairn | Sept 2021 | 2/2 |
| James Forese | May 2020 | 6/6 |
| José Antonio Meade Kuribreña | May 2021 | 4/4 |
Henri de Castries1 | May 2017 | 2/3 |
Irene Lee1 | Apr 2018 | 3/3 |
David Nish1 | May 2017 | 2/2 |
1 David Nish stepped down from the Committee on 23 February 2021; Henri de Castries and Irene Lee stepped down from the Committee on 28 May 2021.
Performance in 2021
Financial performance
The Group's financial performance improved in 2021 and all regions were profitable. Reported profit before tax of $18.9bn was up $10.1bn from 2020. Adjusted profit before tax of $21.9bn was up $9.6bn, with net ECL releases more than offsetting the impact of lower revenue, which reflected continuing external pressures during 2021. We continued to demonstrate strong cost control. Despite inflationary pressures and continued investment in technology, our adjusted costs were $32.1bn. Our return on tangible equity ('RoTE') improved from 3.1% in 2020 to 8.3%. We also achieved a $104bn RWA reduction in legacy assets and low-return areas and we have now achieved 95% of the $110bn reduction targeted by the end of 2022. We were able to restart our dividend payments to shareholders and we remain well placed to fund growth and step up capital returns.
Workforce pay
Support for our colleagues
The well-being of our people remained a critical focus, specifically as the operating environment continued to be challenging for many colleagues and their families. The pandemic, which remains a presence in all of our lives, continued to impact our customers, colleagues and communities and we have continued to provide support to our colleagues.
While we have sustained our employee engagement scores, which remain above pre-pandemic levels, we are monitoring carefully the well-being of our people. Our survey results showed that overall well-being has remained stable with 82% of our colleagues reporting positive mental health. We are moving to a hybrid working model wherever possible, giving people the flexibility to work in a way that balances the needs of our customers, their teams and their personal preferences.
To help people to develop skills for the changing world around us, we launched Future Skills in September 2021, supporting colleagues to explore new personal, digital, data and sustainability skills through a series of learning activities and events.
Group variable pay pool
2021 was characterised by a sharp economic rebound and an extraordinarily competitive labour market. Our financial performance was strong, and it is critical for our long-term performance that we continue to attract and retain the talent necessary to deliver our strategic priorities. As a Committee, we reflected on this throughout the year, and particularly when we reviewed and agreed the Group variable pay pool of $3,495m, a year-on-year increase of 31%.
In deciding the Group variable pay pool, we reviewed performance against financial and non-financial metrics set out in the Group risk framework, including conduct. We took into account the improvement in the Group's financial performance with adjusted profit before tax up 79%, our strong capital position, the reinstatement of dividends and the capital return to shareholders through the up to $2bn buy-back announced in October 2021. Subsequently, the Group has announced that it intends to initiate a further up to $1bn share buy-back, to commence after the existing
buy-back has concluded. We also took into account the operating environment and the challenges created by a very competitive market for talent manifesting through higher than normal voluntary attrition rates.
The pool was determined in line with our countercyclical funding methodology, whereby variable pay as a percentage of profits generally reduces as performance increase. In 2020, the variable pay pool was reduced by 20% when the adjusted profit before tax was down 45% to recognise the need to remain competitive in retaining talent even in challenging circumstances. In 2021, our countercyclical approach meant that while the adjusted profit before tax was up 79%, the pool increased by 31%.
As part of the year-end pay review, the Committee considered the remuneration outcomes. Overall, total compensation across all our businesses was up relative to 2020. For our junior colleagues, the increase is slightly lower, as their outcomes last year were broadly stable in order to protect their outcomes against material year-on-year volatility. Outcomes correlated well with performance and behaviours, with the largest increase in variable pay for those who performed most strongly and who acted as role models for our values. Fixed pay increases were targeted towards junior colleagues to help address the impact of rising inflation in many of our locations. The outcomes were in line with our pay principles and the approach decided by the Committee for 2021.
Key remuneration decisions for Directors
Executive Directors' annual performance assessment
The financial measures in the executive Directors’ 2021 scorecards were growing revenue in Asia, meeting the Group's adjusted cost target and our strategic priority of reducing RWAs in legacy assets and low-return areas. Strategic performance measures were customer satisfaction, employee engagement and diversity and personal objectives aligned with delivery of our strategy.
Overall, the Committee considered the executive Directors delivered a strong performance. The adjusted cost performance was above the minimum set for the year. As noted earlier, strong performance in RWA reduction, with 95% of our end-2022 target already achieved, led to a maximum payout against the RWA performance metrics. We did not meet the target for revenue growth in Asia, primarily due to the impact of low interest rates on certain business lines.
We also made good progress on strategic measures, by improving customer satisfaction, maintaining the high level of employee engagement from 2020, exceeding our gender representation target in senior leadership roles and executing our strategy at pace (see page 304 for details).
Executive Directors' annual incentive scorecard outcome
This resulted in an overall annual incentive outcome of 57.30% for Noel Quinn and 60.43% for Ewen Stevenson (further details are provided on page 262). These are slightly below the 2020 scorecard outcomes and results in an annual incentive award of £1.59m for Noel Quinn (2020: £1.60m before voluntarily waiver of cash bonus) and £0.98m for Ewen Stevenson (2020: £0.90m before voluntary waiver of cash bonus).
Long-term incentive ('LTI') for executive Directors
Noel Quinn and Ewen Stevenson will receive LTI awards of £4.13m and £2.41m respectively, in respect of their performance for 2021 and subject to a three-year forward-looking performance period from 1 January 2022 to 31 December 2024. The Committee decided to retain the RoTE, relative total shareholder return ('TSR'), capital reallocation to Asia and transition to net zero measures in the LTI scorecard given their strong alignment with the Group’s strategy. Details of the measures and targets are set out on page 307.
Executive Directors' fixed pay for 2022
We have increased the base salary of our executive Directors by 3.5%, effective from 1 March 2022. The Committee considered the increase was necessary to ensure that the total remuneration opportunity of our executive Directors does not fall further behind
desired levels based on the size, complexity and international peer group of the Group. This was discussed with shareholders during our engagement with them on the new Directors' remuneration policy. The increase is in line with the average salary increase for our wider workforce.
New Directors' remuneration policy
We are proposing to roll forward our current remuneration policy for shareholder approval at the 2022 AGM. During the year, we undertook a review of the policy based on the key principles that it should be easy to understand, align reward with stakeholder interests, incentivise long-term performance, be competitive and meet expectations of investors and regulators.
As part of the review, the Committee considered whether the current policy provides a remuneration opportunity that is appropriate given the size and complexity of the Group's operations and is commensurate with its aim of fairly remunerating executives for delivering its strategic priorities. The review clearly demonstrated that over time, HSBC’s overall remuneration opportunity has fallen significantly behind desired levels to reflect the calibre of the executives and positioning against international peers. The Committee also noted that the UK regulatory requirements currently restrict us from using a remuneration structure with a greater focus on variable pay for performance, which is typically used by our international peers.
We engaged with our shareholders to take into account their views on our policy and remuneration structure. As ever, we found engagement with our shareholders to be very helpful and we were pleased with the level of feedback and support received. Noting the strong support from shareholders for our current policy and on the basis that it supports the execution of our strategy within our regulatory framework, we are proposing to roll forward our current policy for shareholders’ approval at the 2022 AGM. We will keep the issue on appropriate positioning of our executive Directors' total remuneration opportunity under review for the duration of the policy. Further details of the remuneration policy and how each element supports the Group’s strategy are set out on page 293.
On behalf of the Committee I would like to thank our shareholders for their engagement and feedback. The Committee looks forward to maintaining an open and transparent dialogue in 2022.
Our annual report on remuneration
The section on Directors' remuneration policy provides an overview of our remuneration policy for our Directors, for which we are seeking shareholder approval at the 2022 AGM.
In the annual report section, we provide details of decisions made for executive Directors in respect of their 2021 remuneration for which, along with this statement, we will seek shareholder approval with an advisory vote at the 2022 AGM.
We also provide details of our remuneration framework for our Group colleagues. In the additional remuneration disclosure section of this report, we provide other related disclosures.
As Chair of the Committee, I hope you will support our remuneration policy and the 2021 Directors' remuneration report.
Finally, as announced in January, I will step down as Chair of this Committee and from the Board at the conclusion of the 2022 AGM. An update on my successor will be announced in due course.
Pauline van der Meer Mohr
Chair
Group Remuneration Committee
22 February 2022
Report of the Directors | Corporate governance report
| | |
| Summary 2021 remuneration outcomes for executive Directors |
An overview of the 2021 remuneration outcomes and the release profile of remuneration for executive Directors is set out below. Further details are available on page 304.
Total remuneration (£000)
Total remuneration (£000)
Annual incentive outcome
Shareholding (% of salary)1
1 Executive Directors are expected to meet their shareholding guidelines within five years of the date of their appointment. Noel Quinn and Ewen Stevenson were appointed on 5 August 2019 and 1 January 2019 respectively.
Illustration of release profile
The following chart provides an illustrative release profile of the remuneration awarded for executive Directors in respect of 2021.
| | | | | | | | | | | | | | | | | | | | | | | | | | | | | | | | | | | | | | | | | | | | | | | | | | | | | | | | | | | | | | | | | | | | | | | | | | | | | | | | | | | | | | | | | | | | | | | | | | | | | | | | | | | | | | | | | | | | | | | | | | | | | | | | | | | | | | |
| | | | | | | | | | | | | | | | | | | | | | | | | | | | | | | | | | | | | | | | | | | |
| | | 2021 | 2022 | 2023 | 2024 | 2025 | 2026 | 2027 | 2028 | 2029 | 2030 | u | |
| Salary and benefits | •Received during 2021. | | | | | | | | | | | | | | | | | | | | | | | | | | | | | | | | | | | | | | | | | | |
| u | | | u | | | | | | | | | | | | | | | | | | | | | | | | | | | | | | | | | | | | | |
| | | | | | | | | | | | | | | | | | | | | | | | | | | | | | | | | | | | | | | |
| | | | | | | | | | | | | | | | | | | | | | | | | | | | | | | | | | | | | | | | | | |
| Fixed pay allowance | •Released in five equal annual instalments starting from March 2022. | | | | | | | | | | | | | | | | | | | | | | | | | | | | | | | | | | | | | | | | | | | |
| | | | | | u | | | | u | | | | u | | | | u | | | | u | | | | | | | | | | | | | | | | | | | | |
| | | | | | | | | | | | | | | | | | | | | | | | | | | | | | | | | | | | |
| | | | | | | | | | | | | | | | | | | | | | | | | | | | | | | | | | | | | | | | | | |
| Annual incentive | •Paid 50% in cash and 50% in immediately vested shares subject to a retention period of one year. •Subject to clawback provisions for seven years from grant, which may be extended to 10 years in the event of an ongoing internal/regulatory investigation. | | | | | | | | | | | | | | | | | | | | | | | | | | | | | | | | | | | | | | | | | | | |
| Perform-ance period | | Retained shares | | | | | | | | | | | | | | | | | | | | | | | | | | | | | | | |
| u | | | u | | u | | | | u | | | | | | | | | | | | | | | | | | | | | | | | | | | | | | | | |
| | | | | | | | | | | | | | | | | | | | | | | | | | | | | | | | | | | | | | |
| | | | | | | | | | | | | | | | | | | | | | | | | | | | | | | | | | | | | | | | | | |
| | | | | | | | | | | | | | Clawback | | | | | | | | | | | | | |
| | | | | | | | | | | | | | | | | | | | | | | | | | | | | | | | | | u | | | | | | | | |
| | | | | | | | | | | | | | | | | | | | | | | | | | | | | | | | | | | | | | | | | |
| | | | | | | | | | | | | | | | | | | | | | | | | | | | | | | | | | | | | | | | | | |
| Long-term incentive | •Award granted taking into consideration performance over the prior year and subject to three-year forward-looking performance conditions. •Subject to performance outcome, awards will vest in five equal annual instalments starting from the third anniversary of the grant date. •On vesting, shares are subject to a retention period of one year. •Unvested awards subject to malus provisions. •Subject to clawback provisions for seven years from grant, which may be extended to 10 years in the event of an ongoing internal/regulatory investigation. | | | | | | | | | | | | | | | | | | | | | | | | | | | | | | | | | | | | | | | | | | | |
| | | | | | | Performance period | | | | | | | | Vesting period | | | | | | | | | | | | | |
| | | | | u | | | | | | | | | | | u | | u | | | | u | | | | u | | | | u | | | | u | | | | | | | | |
| | | | | | | | | | | | | | | | | | | | | | | | | | | | | | | | | | | |
| | | | | | | | | | | | | | | | | | | | | | | | | | | | | | | | | | | | | | | | | | |
| | | | | | | | | | | | | Retention period | u | | | | u | | | | u | | | | u | | | | u | | | | |
| | | | | | | | | | | | | | | | | | | | | | | | | | | | |
| | | | | | | | | | | | | | | | | | | | | | | | | | | | | | | | | | | | | | | | | | |
| | | | | | | | | | | | | | | | | | Malus | | | | | | | | | |
| | | | | | | | | | | | | | | | | | | | | | | | | | | | | | | | | | u | | | | | | | | |
| | | | | | | | | | | | | | | | | | | | | | | | | | | | | | | | | | | | | | | | | |
| | | | | | | | | | | | | | | | | | Clawback | | | | | | | | | |
| | | | | | | | | | | | | | | | | | | | | | | | | | | | | | | | | | u | | | | | | | | |
| | | | | | | | | | | | | | | | | | | | | | | | | | | | | | | | | | | | | | | | | |
| | | | | | | | | | | | | | | | | | | | | | | | | | | | | | | | | | | | | | | | | | |
| | |
| Directors’ remuneration policy |
This section sets outs the Directors' remuneration policy proposed for shareholders' approval at the AGM on 29 April 2022. We have made no changes to the remuneration structure or to the maximum opportunity payable for each element of remuneration and are seeking to roll forward our current policy. Minor changes have been made to provide the Committee with sufficient flexibility to implement the policy as intended over its term. Subject to receiving shareholder approval, the policy is intended to apply immediately for three years to the end of the AGM in 2025, although we may seek shareholders' approval for a new policy during the period depending on regulatory developments, changes to our strategy or competitive pressures.
Remuneration policy – key principles
The Committee is responsible for reviewing and recommending to the Board the Directors' remuneration policy to be put forward for approval by shareholders.
The guiding principles that form the basis of our review of the remuneration policy for Directors are as follows:
•The rationale and operation of the policy should be easy to understand and transparent.
•There should be a strong alignment between reward and the interests of our stakeholders, including shareholders, customers and employees.
•The policy should maintain a focus on long-term performance.
•The total compensation package should be competitive to ensure we can retain and attract talent to deliver our strategic priorities.
•The structure should meet the expectations of investors and our regulators.
Setting the policy
The Committee undertook a detailed review of the Group's remuneration policy during 2021 to assess whether it continues to be appropriate based on the size and complexity of its operations, investor feedback, best practice and market developments. Input was received from the Group Chairman and management while ensuring that conflicts of interest were suitably mitigated. Input was also provided by the Committee’s appointed independent advisers throughout the process.
As highlighted in the 2020 Directors' remuneration report, the Committee – while conscious of external sentiment – planned to focus the review on whether overall remuneration levels remain appropriate and support the delivery of our strategic priorities.
The Committee has become increasingly concerned that, over time, the remuneration opportunity of our executive Directors has fallen behind desired levels to reflect their calibre and positioning against our international peers. This is supported by benchmarked data for comparable roles in organisations similar in size, geographical presence and with whom we compete for talent.
The Committee noted that UK regulatory requirements restrict us from using a remuneration structure with a greater focus on variable pay for performance, which is typically used by our international peers. Our preference would be to use such a structure to improve the total compensation opportunity of our executive Directors. This view was supported by a number of our shareholders, who also expressed a preference for a structure with lower fixed pay and higher variable pay opportunity, but understood that UK regulatory rules impact our ability to use such a structure.
The Committee also noted that our current policy and its implementation have received strong support from shareholders over the last few years. This was reaffirmed during our engagement with shareholders on the new policy.
Based on the review and taking into account the feedback received during our discussions with shareholders, we are proposing to roll forward our current policy for shareholders’ approval at the 2022 AGM. We will keep the issues on appropriate positioning of our executive Directors' total remuneration opportunity under review throughout the duration of the policy.
Other matters considered as part of policy review
We also reviewed the remuneration structure, fixed and variable pay mix, the deferral and post-vesting retention periods and our shareholding guidelines to ensure there is strong alignment between reward and interests of our stakeholders. We also considered whether a formal post-employment shareholding policy should be introduced. For this purpose, the Committee took into consideration the following features of our existing policy:
•Shares delivered to executive Directors as part of the fixed pay allowance ('FPA') have a five-year retention period, which continues to apply following a departure of an executive Director.
•Shares delivered as part of an annual incentive award are subject to a one-year retention period, which continues to apply following a departure of an executive Director.
•LTI awards have a seven-year vesting period with a one-year post-vesting retention period, which is not accelerated on departure. The weighted average holding period of an LTI award within HSBC is therefore six years, in excess of the five-year holding period typically implemented by FTSE-listed companies. When an executive Director ceases employment, if they are treated as a good leaver under our policy, any LTI awards granted will continue to be released over a period of up to eight years, subject to the outcome of performance conditions.
Reflecting on the above, and the in-employment shareholding requirement of up to 400% of salary for executive Directors, we agreed our existing policy structure achieves the objective of ensuring there is ongoing alignment of executive Directors' interests with shareholder experience post-cessation of their employment. We discussed this with major shareholders during our consultation on the new policy.
Report of the Directors | Corporate governance report
Remuneration policy – executive Directors
| | | | | |
| Fixed pay |
| Elements | Details |
| Base salary | To attract, retain and develop key talent by being market competitive and rewarding ongoing contribution to role. |
| Operation | The base salary for an executive Director is designed to reflect the individual’s role, experience and responsibility.
Base salaries are normally benchmarked on an annual basis against relevant comparator groups and may be reviewed more frequently at the discretion of the Committee. The Committee reviews and approves changes, taking into consideration factors such as scope of the role, local requirements, employee increases and market competitiveness. |
| Maximum opportunity | In normal circumstances, the base salary for the current executive Directors will not increase by more than 15% above the level at the start of the policy period in total for the duration of this policy. The Committee may determine larger increases in exceptional circumstances, such as a change in responsibility, where the overall remuneration opportunity has been set lower than the market and when it is justified based on skills, experience and performance in the role. |
| Fixed pay allowance (‘FPA’) | To deliver a level of fixed pay required to reflect the role, skills and experience of the executive Directors and to maintain a competitive total remuneration package for executive Directors. |
| Operation | FPAs are non-pensionable and will normally be granted in three instalments of immediately vested shares per year, or at any other frequency that the Committee deems appropriate. Shares equivalent to the net number of shares delivered (after those sold to cover any income tax and social security) will be subject to a retention period and normally released on a pro-rata basis over five years, starting from the March immediately following the end of the financial year in respect of which the shares are granted. Dividends will be paid on the vested shares held during the retention period. The Committee retains the discretion to amend the retention period and/or pay the FPA in cash if required to do so to meet any regulatory requirements or for any other reason the Committee deems appropriate. |
Maximum opportunity
| FPAs are determined based on the role, skills and responsibility of each individual and taking into account factors such as market competitiveness of the total remuneration opportunity and other elements of remuneration set out in this policy.
Other than in exceptional circumstances, the FPA for the duration of this policy will be capped at 150% of base salary levels at the start of this policy. |
| Cash in lieu of pension | To help executive Directors build retirement savings |
| Operation | Directors receive a cash allowance in lieu of a pension entitlement. |
| Maximum opportunity | The maximum opportunity will be aligned with the maximum contribution rate that HSBC could make for the majority of employees in the relevant jurisdiction. This is currently set at 10% of base salary in line with the maximum contribution rate, as a percentage of salary, that HSBC could make for a majority of employees who are defined contribution members of the HSBC Bank (UK) pension scheme in the UK. |
| | | | | |
| Benefits and all employee share plans |
| Elements | Details |
| Benefits | To provide support for physical, mental and financial health in accordance with local market practice. |
| Operation | Benefits take account of local market practice and include, but are not restricted to: •taxable benefits (gross value before payment of tax) including provision of medical insurance, accommodation, car, club membership, independent legal advice in relation to a matter arising out of the performance of employment duties for HSBC, tax return assistance or preparation, and travel assistance (including any associated tax due, where applicable); and •non-taxable benefits including the provision of a health assessment, life assurance and other insurance coverage. The Group Chief Executive is also eligible to be provided with accommodation and car benefits in Hong Kong. Any tax and/or social security due on these benefits will be paid by HSBC. Additional benefits may also be provided when an executive is relocated or spends a substantial proportion of their time in more than one jurisdiction for business needs, or in such other circumstances as the Committee may determine in its discretion. Such benefits could include, but are not restricted to, airfare, accommodation, shipment, storage, utilities, and any tax and social security that may be due in respect of such benefits. |
| Maximum opportunity | The maximum opportunity is determined by the nature of the benefit provided. The benefit amount will be disclosed in the single figure of remuneration table for the relevant year. |
| All employee share plans | To promote share ownership by all employees. |
| Operation | Executive Directors are entitled to participate in all employee share plans, such as the HSBC Sharesave, on the same basis as all other employees. Under the Sharesave, executive Directors can make monthly savings over a period of three or five years towards the grant of an option over HSBC shares. The option price can be at a discount, currently up to 20%, on the share price at the time that the option is granted. |
| Maximum opportunity | The maximum number of options is determined by the maximum savings limit set by HM Revenue and Customs. This is currently £500 per month. |
| | | | | |
Variable pay Adhering to the values-aligned behaviours is a prerequisite to be considered for any variable pay. Executive Directors receive a performance and behaviour rating that is considered by the Committee in determining the variable pay awards. |
| Elements | Details |
| Annual incentive | To drive and reward performance against annual financial and non-financial objectives that are consistent with the strategy and align to shareholder interests. |
| Operation | Annual incentive awards are discretionary and can be delivered in any combination of cash and shares under the HSBC Share Plan 2011 (‘HSBC Share Plan’). Shares will not represent less than 50% of any award and are normally immediately vested. On vesting, shares equivalent to the net number of shares that vested (after those sold to cover any income tax and social security payable) must be held for a retention period up to one year, or such other period as required by regulators. The awards will be subject to clawback (i.e. repayment or recoupment of paid/vested awards) on or after vesting for a period of seven years from the date of award. This may be extended to 10 years in the event of an ongoing internal/regulatory investigation at the end of the seven-year period. Details of the clawback provision are set out in the following section on LTI awards. The Committee retains the discretion to: •apply a longer retention period; •increase the proportion of the award to be delivered in shares; and •defer the vesting of a portion of the awards, subject to such conditions that the Committee may determine at its discretion (which may include continued employment). The deferred awards will be subject to malus (i.e. reduction and/or cancellation of unvested awards) provisions during any applicable deferral period. Any deferred shares may be entitled to dividend equivalents during the vesting period, which will be paid on vesting. Where awards do not receive dividend equivalents during the vesting period (to meet regulatory requirements), the number of shares to be awarded will be determined using a share price discounted for the expected dividend yield. Any deferred cash award may be entitled to notional returns during the deferral period, or any appropriate adjustment to reflect such notional returns, as determined by the Committee. The Committee may adjust and amend awards in accordance with the relevant plan rules. |
| Maximum opportunity | The maximum opportunity for the annual incentive award, in respect of a financial year, is up to 215% of base salary. |
| Performance metrics | Performance is measured against an annual scorecard, based on targets set for financial and non-financial measures. The scorecards may vary by individual. Measures with financial targets will generally have a weighting of 60% for the Group Chief Executive and 50% for the Group Chief Financial Officer. The Committee will review the scorecard annually and may vary the measures, weighting and targets each year. The overall payout of the annual incentive could be between 0% (for below threshold performance) and 100% of the maximum. At threshold level of performance set in the scorecard for each measure, 25% of the award opportunity for that measure will pay out. An achievement of maximum performance set in the scorecard means a payout of 100% of the award. The Committee exercises its judgement to determine performance achieved and awards at the end of the performance period, which in normal circumstances will be one financial year, to ensure that the outcome is fair in the context of overall Group and individual performance. The Committee can adjust the payout based on the outcome of the performance measures, if it considers that the payout determined does not appropriately reflect the overall position and performance of the Group for the relevant performance period. The scorecard outcome may also be subject to a risk and compliance modifier and/or a capital underpin under which the Committee will have the discretion to adjust down the overall scorecard outcome, taking into account performance against those factors. The Committee has the discretion to: •change the overall weighting of the financial and non-financial measures; •vary the measures and their respective weightings within each category. The specific performance measures will be disclosed in the ‘annual report on remuneration’ for the relevant year; and •make adjustments to performance targets, measures, weighting and/or outcomes in exceptional circumstances. This may be to reflect significant one-off items that occur during the measurement period and/or where the Committee determines that original measures, targets or conditions are no longer appropriate or that amendment is required so that the measures, targets or conditions achieve their original purpose. Full and clear disclosure of any such adjustments will be made in the 'annual report on remuneration' for the relevant year, subject to commercial confidentiality. |
Report of the Directors | Corporate governance report
| | | | | |
| Elements | Details |
| Long-term incentives (‘LTI’) | To incentivise sustainable long-term performance and alignment with shareholder interests. |
| Operation | LTI awards are discretionary and are granted if the Committee considers that there has been satisfactory performance over the prior year. The awards are granted as rights to receive shares under the HSBC Share Plan, normally subject to a forward-looking three-year performance period from the start of the financial year in which the awards are granted. At the end of the performance period, the performance outcome will be used to assess the percentage of the awards that will vest. These shares will then normally vest in five equal instalments, with the first vesting on or around the third anniversary of the grant date and the last instalment vesting on or around the seventh anniversary of the grant date, in accordance with the UK's Prudential Regulation Authority's ('PRA') remuneration rules. On each vesting, shares equivalent to the net number of shares that vested (after those sold to cover any income tax and social security payable) must be held for a retention period up to one year (or such other period as required by regulators). Awards are subject to malus provisions prior to vesting. The awards will also be subject to clawback on or after vesting for a period of seven years from the date of award. This may be extended to 10 years in the event of an ongoing internal/regulatory investigation at the end of the seven-year period. Details of the malus and clawback provisions are set out in the bottom section of this table. Awards may be entitled to dividend equivalents during the vesting period, which will be paid on vesting. Where awards do not receive dividend equivalents during the vesting period (to meet regulatory requirements), the number of shares to be awarded will be determined using a share price discounted for the expected dividend yield. The Committee may adjust or amend awards in accordance with the rules of the HSBC Share Plan. |
| Maximum opportunity | The maximum opportunity for the LTI award, in respect of a financial year, is up to 320% of base salary. |
| Performance metrics | The Committee will take into consideration prior performance when assessing the value of the LTI grant. Forward-looking performance is measured against a long-term scorecard. Financial measures will generally have a weighting of 60% or more. For each measure, the Committee will determine the extent of achievement based on actual performance against the target set and other relevant factors that the Committee considers appropriate to take account of in order to better reflect the Group's underlying performance. The overall payout level could be between 0% (for below threshold performance) and 100% of the maximum. At threshold level of performance set in the scorecard for each measure, 25% of the award opportunity for that measure will vest. 100% of the award will vest for achieving the maximum level of performance set for each measure. Where performance achieved is between the threshold, target and maximum level of performance set in the scorecard, the number of awards that will vest will be determined on a straight-line basis. The Committee can adjust the LTI payout based on the outcome of the performance measures, if it considers that the payout determined does not appropriately reflect the overall position and performance of the Group during the performance period. The scorecard outcome may also be subject to a risk and compliance modifier and/or a capital underpin under which the Committee will have the discretion to adjust down the overall scorecard outcome, taking into account performance against those factors. Performance targets will normally be set annually for each three-year cycle. The Committee has the discretion to: •change the overall weighting of the financial and non-financial measures; •vary the measures and their respective weightings within each category. The specific performance measures will be disclosed in the ‘annual report on remuneration’ for the relevant year; •vary the risk and compliance and/or any underpin measures; and •make adjustments to performance targets, measures, weighting and/or outcomes in exceptional circumstances. This may be to reflect significant one-off items that occur during the measurement period and/or where the Committee determines that original measures, targets or conditions are no longer appropriate or that an amendment is required so that the measures, targets or conditions achieve their original purpose. Revised targets/measures will be, in the opinion of the Committee, no less difficult to satisfy had they been set at the same time as the original targets. Full and clear disclosure of any such adjustments will be made within the 'annual report on remuneration' for the relevant year, subject to commercial confidentiality. |
Malus and clawback
(applicable to both annual incentive and LTI) | The Committee has the discretion to operate malus and clawback provisions. Malus can be applied to unvested awards in circumstances including: •detrimental conduct, including conduct that brings the business into disrepute; •past performance being materially worse than originally reported; •restatement, correction or amendment of any financial statements; and •improper or inadequate risk management. Clawback can be applied to vested or paid awards for a period of seven years from the grant date. This may be extended to 10 years in the event of ongoing internal/regulatory investigation at the end of the seven-year period. Clawback may be applied in circumstances including: •participation in, or responsibility for, conduct that results in significant losses; •failing to meet appropriate standards and propriety; •reasonable evidence of misconduct or material error that would justify, or would have justified, summary termination of a contract of employment; •a material failure of risk management suffered by HSBC or a business unit in the context of Group risk management standards, policies and procedures; and •any other circumstances required by local regulatory obligations to which any member of the HSBC Group or its subsidiary is subject. |
| | | | | |
| Other |
| Elements | Details |
| Shareholding guidelines | To ensure appropriate alignment with the interest of our shareholders. |
| Operation | Executive Directors are expected to satisfy the following shareholding requirement as a percentage of base salary within five years from the date of their appointment: •Group Chief Executive: 400% •Group Chief Financial Officer: 300% For this purpose, unvested shares which are not subject to forward-looking performance conditions (on a net of tax basis) will count towards the shareholding requirement. HSBC operates an anti-hedging policy under which individuals are not permitted to enter into any personal hedging strategies in relation to HSBC shares subject to a vesting and/or retention period. |
| Maximum opportunity | Not applicable. |
The Committee reserves the right to make any remuneration payments and payments for loss of office, notwithstanding that they are not in line with the policy set out above, where the terms of the payment were agreed:
•before the policy set out above or any previous policy came into effect;
•at a time where a previous policy, approved by shareholders, was in place provided the payment is in line with the terms of that policy; or
•at a time when the relevant individual was not a Director of the Group and the payment was not in consideration for the individual becoming a Director of the Group.
For these purposes, payments include the Committee satisfying awards of variable remuneration. This means making payments in line with the terms that were agreed at the time the award was granted.
In addition to the specific discretions expressly set out in the policy, the incentive plans include a number of operational discretions available to the Committee, including:
•the right to grant awards in the form of conditional share awards or options (including nil-cost options);
•the right to amend a performance condition in accordance with
its terms, or if anything happens that causes the Committee to consider it appropriate to do so;
•the right to settle the award in cash, based on the relevant share price, or shares as appropriate; and
•the right to adjust the award on a variation of share capital or other corporate event that affects the current or future value of the award, or alternatively, the right to vest the award early in such circumstances.
Choice of performance measures and targets
The performance measures selected for the annual incentive and LTI awards will be set on an annual basis by the Committee, taking into account the Group’s strategic priorities and any feedback received from our shareholders. The following table sets out the performance measures we currently consider for inclusion in our scorecards. The Committee retains the discretion to choose other measures that are considered to be appropriate for achieving our strategic priorities and meeting any regulatory expectation.
The targets for the performance measures will be set taking into account a number of factors, including the targets set in our financial and resource plan, our strategic priorities, shareholder expectations, the economic environment and risk appetite.
| | | | | | | | | | | |
| Performance measures |
| Measures and modifier/underpin | Example measures for annual incentive scorecard | Example measures for LTI scorecard | Rationale |
| Financial measures | •Adjusted profit before tax •Operating profit •RoTE •Revenue growth •Volume growth •Adjusted costs | •RoTE •Total shareholder return •Underpin to maintain a minimum CET1 ratio | Measures are selected to incentivise the achievement of our financial targets as set out in our strategic priorities and financial and resource plan. |
| Strategic measures | •Customer satisfaction •Employee engagement •Succession planning and diversity •Carbon reduction and sustainable finance | •Reduce carbon emissions •Sustainable finance •Capital reallocation to areas of strategic focus | Measures are selected to support the delivery of our strategic priorities. |
| Risk and compliance measures, modifier and/or underpin | •Sustained delivery of global conduct outcomes •Effective financial crime risk management •Effective management of material operational risks in support of strategic priorities •Risk metrics to identify when business activities are outside of tolerance level for a significant period of time •Failures in risk management that have resulted in significant customer detriment, reputational damage and/or regulatory censure. •CET1 level | •Modifier linked to risk and compliance performance | Measures are chosen to ensure a high level of accountability of risk and conduct, to promote an effective risk management environment and to embed a robust governance system. |
Report of the Directors | Corporate governance report
Approach to recruitment remuneration – executive Directors
On the recruitment or appointment of a new executive Director, the Committee would adhere to the following principles:
•Remuneration packages should be in line with the approved policy for executive Directors.
•Remuneration packages must meet any applicable local regulatory requirements.
•Where necessary, compensation may be provided in respect of forfeiture of awards from an existing employer (for example, buy-out awards).
Outlined in the following table are all components that would be considered for inclusion in the remuneration package of a new executive Director appointment and, for each, the approach that would be adopted.
In the case of an internal appointment, any existing commitments will be honoured and any variable element awarded in respect of the prior role will be allowed to be paid out according to its existing terms.
| | | | | |
| Components of remuneration package of a new executive Director |
| Component | Approach taken to each component of remuneration |
| Fixed pay | The base salary and FPA will reflect the individual’s role, experience and responsibility, and will be set in the context of market practice. The maximum cash in lieu of pension allowance will be no more than the maximum contribution, as a percentage of salary, that can be made for the majority of employees in the relevant jurisdiction. |
| Benefits | Benefits to be provided will be dependent on circumstances while in line with Group policy and the remuneration policy table, including the global mobility policy (where applicable) and local regulations. |
| Variable pay awards | New appointments will be eligible to be considered for variable pay awards consisting of an annual incentive and/or LTI award (or any other element which the Committee considers appropriate given the particular circumstances but not exceeding the maximum level of variable remuneration set out below). For the year in which the individual commences providing services as an executive Director, the Committee retains the discretion to determine the proportion of variable pay to be deferred, the deferral and retention period, whether any performance and/or continued employment conditions should be applied, and the period over which such performance should be assessed. In exercising this discretion, the Committee will take into account the circumstances in which the individual is appointed (for example, if it is promotion of an internal candidate or an external appointment), expectation of shareholders and any regulatory requirements. Total variable pay awarded for the year in which the individual is newly appointed as an executive Director will be limited to 535% of base salary. This limit excludes buy-out awards and is in line with the aggregate maximum variable pay opportunity set out in the remuneration policy table. Guaranteed bonuses are only permitted by exception and in very rare and limited circumstances (for example, where the individual loses a variable pay opportunity with the previous employer as a result of joining HSBC and such an award is considered essential to attract and hire the candidate). If such an award is provided then, in line with the PRA remuneration rules, it will be limited to the first year of service, subject to the Group deferral policy and performance requirements. |
| Buy-out | The Committee may make an award to buy out remuneration terms forfeited on resignation from the previous employer. The Group buy-out policy is in line with the PRA remuneration rules, which state that both the terms and amount of any replacement awards will not be more generous than the award forfeited on departure from the former employer. In considering buy-out levels and conditions, the Committee will take into account the type of award, performance measures and likelihood of performance conditions being met in setting the quantum of the buy-out. Buy-out awards will match the terms of forfeited awards with the previous employer as closely as possible, subject to proof of forfeiture and other relevant documentation. Where the vesting time is fewer than 90 days, cash or deferred cash may be awarded for administrative purposes. Where appropriate, the Committee retains the discretion to utilise the provisions provided in the UK Listing Rules for the purpose of making buy-out awards. |
Policy on payments for loss of office – executive Directors
The following table sets out the basis on which payments on loss of office may be made. Other than as set out in the table, there are
no further obligations that could give rise to remuneration payments or payments for loss of office:
| | | | | |
| Payments on loss of office |
| Component of remuneration | Approach taken |
| Fixed pay and benefits | Executive Directors may be entitled to payments in lieu of: •notice, which may consist of base salary, FPA, cash in lieu of pension allowance, pension entitlements and other contractual benefits, or an amount in lieu of; and/or •accrued but untaken holiday entitlement. Payments may be made in instalments or a lump sum, and may be subject to mitigation, and subject to applicable tax and social security deductions. |
Annual incentive and LTI | In exceptional circumstances, as determined by the Committee, an executive Director may be eligible for the grant of annual and/or long-term incentives under the HSBC Share Plan, taking into account the time worked in the performance year and based on the individual’s contribution. |
| Unvested awards | All unvested awards will be forfeited when an executive Director ceases employment voluntarily and is not deemed a good leaver. An executive Director may be considered a good leaver, under the HSBC Share Plan, if their employment ceases in specified circumstances, which include: •ill heath, injury or disability, as established to the satisfaction of the Committee; •retirement with the agreement and approval of the Committee; •the employee's employer ceasing to be a member of the Group; •redundancy with the agreement and approval of the Committee; or •any other reason at the discretion of the Committee. If an executive Director is considered a good leaver, unvested awards will normally continue to vest in line with the applicable vesting dates, subject to performance conditions, the share plan rules, and malus and clawback provisions. Unless the Committee determined otherwise, awards made subject to forward-looking performance conditions, including LTI awards, will normally be subject to time pro-rating for time in employment during the performance period. In the event of death, unvested awards will vest and will be released to the executive Director’s estate as soon as practicable. In respect of outstanding unvested awards, the Committee may determine that good leaver status is contingent upon the Committee being satisfied that the executive has no current or future intention at the date of leaving HSBC of being employed by any competitor financial services firm. The Committee determines the list of competitor firms from time to time, and the length of time for which this restriction applies. If the Committee becomes aware of any evidence to the contrary before vesting, the award will lapse. |
| Post-departure benefits | Executive Directors can be provided certain benefits for up to a maximum of seven years from date of departure for those who depart under good leaver provisions under the HSBC Share Plan, in accordance with the terms of the policy. Benefits may include, but are not limited to, medical coverage, tax return preparation assistance and legal expenses. |
| Other | Where an executive Director has been relocated as part of their employment, the Committee retains the discretion to pay the repatriation costs. This may include, but is not restricted to, airfare, accommodation, shipment, storage, utilities, and any tax and social security that may be due in respect of such benefits. Except in the case of gross misconduct or resignation, an executive Director may also receive retirement gifts. |
| Legal claims | The Committee retains the discretion to make payments (including professional and outplacement fees) in connection with an executive Director’s cessation of office or employment. This may include payments that are made in good faith in discharge of an existing legal obligation (or by way of damages for breach of such an obligation) or by way of settlement of any claim arising in connection with the cessation of that executive Director’s office or employment. |
| Change of control | In the event of a change of control, outstanding awards will be treated in line with the provisions set out in the respective plan rules. |
Other directorships
Executive Directors may accept appointments as non-executive Directors of companies that are not part of HSBC if so authorised by either the Board or the Nomination & Corporate Governance Committee.
When considering a request to accept a non-executive appointment, the Board or the Nomination & Corporate Governance Committee will take into account, among other
things, the expected time commitment associated with the proposed appointment.
The time commitment for external appointments is also routinely reviewed to ensure that it will not compromise the Director's commitment to HSBC. Any remuneration receivable in respect of an external appointment of an executive Director is normally paid to the Group unless otherwise approved by the Nomination & Corporate Governance Committee or the Board.
Report of the Directors | Corporate governance report
Remuneration scenarios
The following charts show how the total value of remuneration and its composition would vary under different performance scenarios for executive Directors under the proposed policy, which will be effective from the date of the 2022 AGM, subject to shareholders’ approval. Benefits in the charts below represents value of regular benefits as per the 2021 single figure table of remuneration. Additional benefits may arise but will always be provided in line with the shareholder approved policy.
The charts set out:
•the minimum level of remuneration receivable under the policy for each performance year;
•the remuneration level for achieving target level of performance (which assumes 50% of maximum variable pay opportunity is realised); and
•the maximum level of remuneration (which assumes 100% of the variable pay opportunity is realised), as well as the maximum value assuming a 50% increase in share price for LTI awards.
The charts have been prepared using 2022 salaries and, therefore, the annual incentive and LTI opportunities have been computed as percentages of 2022 salaries.
| | |
| Group Chief Executive (£000) |
| | | | | | | | | | | | | | | | | | | | | | | | | | | | | | | | | | | | | | | | | | | | | | | | |
| | | | | | | | | Fixed pay | | Benefits | | Annual incentive | | LTI |
| | | | | | | | | | | £12,621 | | | | |
| | | | | £10,483 | | | | | | 51% | | | |
| | | | | 41% | | | | | | | | |
| | | | | | | | | | | | |
| | £6,909 | | | | | | | | | | |
| 5% | 31% | | | | | | | | | | |
| | | 27% | | | | | | 23% | | | |
| £3,336 | 21% | | | | | | |
| | | | | | | |
| 95% | 46% | 2% | | 30% | 2% | | | | | 25% | 1% | | |
| Proposed policy | | Proposed policy | | | Proposed policy | | | | Proposed policy with 50% share price increase | |
| Minimum | | Target | | | | Maximum | | | | | | | |
| | |
| Group Chief Financial Officer (£000) |
| | | | | | | | | | | | | | | | | | | | | | | | | | | | | | | | | | | | | | | | | | | | | | | | |
| | | | | | | | | Fixed pay | | Benefits | | Annual incentive | | LTI |
| | | | | | | | | | | £7,401 | | | | |
| | | | | £6,155 | | | | | | 50% | | | |
| | | | | 40% | | | | | | | | |
| | | | | | | | | | | | |
| | £4,071 | | | | | | | | | | |
| 2% | 30% | | | | | | | | | | |
| | | 27% | | | | | | 23% | | | |
| £1,987 | 21% | | | | | | |
| | | | | | | | |
| 98% | 48% | 1% | | 32% | 1% | | | | | 26% | 1% | | |
| Proposed policy | | Proposed policy | | | Proposed policy | | | | Proposed policy with 50% share price increase | |
| Minimum | | Target | | | | Maximum | | | | | | | |
Service contracts
The service contracts of executive Directors do not have a fixed term. The notice periods of executive Directors are set at the discretion of the Committee, taking into account market practice, governance considerations, and the skills and experience of the particular candidate at that time.
Service agreements for each executive Director are available for inspection at HSBC Holdings’ registered office. Consistent with
the best interests of the Group, the Committee will seek to minimise termination payments. Directors may be eligible for a payment in relation to statutory rights.
| | | | | | | | |
| Contract date (rolling) | Notice period
(Director and HSBC) |
| Noel Quinn | 18 March 2020 | 12 months |
| Ewen Stevenson | 1 December 2018 | 12 months |
| | |
Remuneration policy – non-executive Directors
The Nomination & Corporate Governance Committee has reviewed and revised the time commitments required for all non-executive Directors as the Board supports HSBC through its ambitious agenda of governance reform, growth and organisational
development in an environment of increasing regulatory, political and organisational complexity.
The following table sets out the framework that will be used to determine the fees for non-executive Directors during the term of this policy.
| | | | | | | | |
| Elements and link to strategy | Operation | Maximum opportunity |
Fees To reflect the time commitment and responsibilities of a non-executive Director of HSBC Holdings. | The policy for non-executive Directors is to pay: •base fees; •further fees for additional Board duties, including but not limited to chairmanship, membership of a committee, or acting as the Senior Independent Director and/or Deputy Chairman; and •travel allowances. Fees are paid in cash. The Board retains the discretion to pay in shares rather than cash where appropriate. The non-executive Group Chairman will be paid a fixed annual fee for all Board responsibilities based on their experience and the time commitments expected for the role, together with such other benefits as the Group Remuneration Committee may in its absolute discretion determine. A newly appointed non-executive Director would be paid in line with the policy on a time-apportioned basis in the first year as necessary. No sign-on payments are offered to non-executive Directors. The Board (excluding the non-executive Directors) has discretion to approve changes to the fees. The Board may also introduce any new component of fees for non-executive Directors, subject to the principles, parameters and other requirements set out in this remuneration policy. Certain non-executive Directors may be entitled to receive fees for their services as directors of subsidiary companies of HSBC Holdings plc. Such additional remuneration is determined by the Board of Directors of each relevant subsidiary within a framework set by the Committee. | The Board will normally review the amount of each component of fees periodically to assess whether, individually and in aggregate, they remain competitive and appropriate in light of changes in roles, responsibilities and/or time commitment of the non-executive Directors, and to ensure that individuals of the appropriate calibre are retained or appointed. Other than in exceptional circumstances, during the term of this policy, fees will not increase by more than 20% above the 2022 levels. Travel allowances are set at an appropriate level, taking into account the time requirement for non-executive Directors to travel to overseas meetings. Any new fees, allowance or component part (for example, for a new committee) would be set and then subject to a maximum of 20% increase for the duration of the policy, subject to the exceptional circumstances referred to above. |
| Expenses/benefits | Any taxable or other expenses incurred in performing their role are reimbursed, as well as any related tax cost on such reimbursement. Non-executive Directors may on occasion receive reimbursement for costs incurred in relation to the provision of professional advice. These payments, if made, are taxable benefits to the non-executive Directors and the tax arising is paid by the Group on the Directors’ behalf. | Not applicable |
Shareholding guidelines To ensure appropriate alignment with the interests of our shareholders. | Non-executive Directors, individually or with their connected persons, are expected to satisfy a shareholding guideline of 15,000 shares within five years from their appointment. The Committee reviews compliance with the guidelines annually. The Committee has full discretion in determining any consequences in cases of non-compliance. | Not applicable |
Service contracts
Non-executive Directors are appointed for fixed terms not exceeding three years, which may be renewed subject to their re-election by shareholders at AGMs. Non-executive Directors do not have service contracts, but are bound by letters of appointment issued for and on behalf of HSBC Holdings, which are available for inspection at HSBC Holdings’ registered office. There are no obligations in the non-executive Directors’ letters of appointment that could give rise to remuneration payments or payments for loss of office.
Policy on payments on loss of office – non-executive Directors
There are no obligations in the non-executive Directors’ letters of appointment that could give rise to remuneration payments or payments for loss of office.
Non-executive Directors are entitled to notice under their letter of appointment. Non-executive Directors' current terms of appointment will expire as follows:
| | | | | | | | |
| 2022 AGM | 2023 AGM | 2024 AGM |
| José Antonio Meade Kuribreña | David Nish | Mark Tucker |
Rachel Duan1 | Jackson Tai | James Forese |
Dame Carolyn Fairbairn1 | | Steven Guggenheimer |
| | Eileen Murray |
| | |
| | |
1 Rachel Duan and Dame Carolyn Fairbairn were appointed following the 2021 AGM and therefore their initial three-year appointment terms are subject to approval of their election by shareholders at the 2022 AGM. Their initial three-year term of appointment will end at the conclusion of the 2025 AGM, subject to annual re-election by shareholders' at the relevant AGMs.
Remuneration arrangements for colleagues
Our remuneration arrangements for our colleagues, including the executive Directors, are driven by the Group reward strategy. The Committee reviews the Group reward strategy to ensure it continues to support HSBC's overall ability to attract, retain, develop and motivate the best people, who are aligned to HSBC’s values and committed to maintaining a long-term career within the Group. Full details of our remuneration framework for our colleagues are disclosed on page 315.
Our executive Directors' remuneration policy aligns with our remuneration policy for our colleagues as follows:
•Externally sourced market data is used to help guide pay decisions for colleagues, including executive Directors.
•The base salary increases for executive Directors take into consideration base salary increases of colleagues across the Group, and relevant market conditions.
•The cash in lieu of pension allowance for executive Directors will not exceed the maximum contribution (as a percentage of salary) that can be made for the majority of colleagues in the relevant jurisdiction.
•All colleagues are eligible to be considered for an annual incentive award based on their performance and behaviour ratings. The variable pay for all colleagues, including executive Directors, is funded from a Group variable pay pool that is determined by reference to Group performance. Colleagues who receive a variable pay award above a certain level have a portion of their award deferred over a period of three to seven years.
Report of the Directors | Corporate governance report
•LTI awards are considered for senior management, given their ability to influence directly the long-term performance.
The Board gathers views from our colleagues through a number of engagement channels. Our management engages with colleagues, either on a Group-wide basis or in the context of smaller focus groups, to solicit feedback generally on a wide range of matters, including pay. Our annual survey on pay seeks the views of all colleagues on their performance and pay outcomes. The Committee reviews the outcomes of the survey and determines the key remuneration priorities for the forthcoming year. Many of our colleagues are also shareholders and therefore have the opportunity to vote on the policy at the 2022 AGM.
As part of our annual calendar, the Committee Chair also hosts a forum attended by the chairs of our principal subsidiaries boards and remuneration committees. This event allows the Committee to understand local market factors and feedback gathered from employees, within the regions where we operate, on pay and
performance matters. This helps both management and the Committee to determine the prioritisation of pay budgets, and allows the Committee to ensure that funding is directed to the areas of need in support of the Group’s strategic ambitions.
In 2022, the Committee has requested that a detailed review of the reward strategy be conducted to reflect the changes in the Group’s strategy, and our employee value proposition as a result of the Covid-19 pandemic, as well as to ensure that we are well positioned versus developments in the market, both within financial services and more broadly. This will include engagement with colleagues to ensure their feedback on the various elements of our reward strategy can be taken into account as part of the Committee’s decision making. An update will be provided as part of next year’s Directors’ remuneration report.
The table below details how the Group Remuneration Committee addresses the principles set out in the UK Corporate Governance Code in respect of the Directors' remuneration policy.
| | | | | |
| Provision | Approach |
| Clarity | •The Committee regularly engages and consults with key shareholders to take into account shareholder feedback and to ensure there is transparency on our policy and its implementation. •Details of our remuneration practices and our remuneration policy for Directors are published and available to all our employees. |
| Remuneration arrangements should be transparent and promote effective engagement with shareholders and the workforce. |
| Simplicity | •Our Directors' remuneration policy has been designed so that it is easy to understand and transparent, while complying with the provisions set out in the UK Corporate Governance Code and the remuneration rules of the UK's PRA and FCA, as well as meeting the expectations of our shareholders. The objective of each remuneration element is explained and the amount paid in respect of each element of pay is clearly set out. |
Remuneration structures should avoid complexity and their rationale and operation should be easy to understand.
|
| Risk | •In line with regulatory requirements, our remuneration practices promote sound and effective risk management while supporting our business objectives (see page 317). •The Group Chief Risk and Compliance Officer attends Committee meetings and updates the Committee on the overall risk profile of the Group. The Committee also seeks inputs from the Group Risk Committee when making remuneration decisions. •Risk and conduct considerations are taken into account in setting the variable pay pool, from which any executive Director variable pay is funded. •Executive Directors' annual incentive and LTI scorecards include a mix of financial and non-financial measures. Financial measures in the scorecards are subject to a CET1 capital underpin to ensure CET1 capital remains within risk tolerance levels while achieving financial targets. In addition, the overall scorecard outcome is subject to a risk and compliance modifier. •The deferred portion of any awards granted to executive Directors is subject to a seven-year deferral period during which our malus policy can be applied. All variable pay awards that have vested are subject to our clawback policy for a period of up to seven years from the award date (extending to 10 years where an investigation is ongoing). |
| Remuneration structures should identify and mitigate against reputational and other risks from excessive rewards, as well as behavioural risks that can arise from target-based incentive plans. |
| Predictability | •The charts set out on page 300 show how the total value of remuneration and its composition vary under different performance scenarios for executive Directors. |
| The range of possible values of rewards to individual Directors and any other limits or discretions should be identified and explained at the time of approving the policy. |
| Proportionality | •The annual incentive and LTI scorecards reward achievement of our financial and resource plan targets, as well as long-term financial and shareholder value creation targets. •The Committee retains the discretion to adjust the annual incentive and LTI payout based on the outcome of the relevant scorecards, if it considers that the payout determined does not appropriately reflect the overall position and performance of the Group during the performance period.
|
| The link between individual awards, the delivery of strategy and the long-term performance of the Group should be clear and outcomes should not reward poor performance. |
| Alignment with culture | •In order for any annual incentive award to be made, each executive Director must achieve a required behaviour rating. •Annual incentive and LTI scorecards contain non-financial measures linked to our wider social obligations. These include measures related to reducing the environmental impact of our operations, improving customer satisfaction, diversity and employee engagement. •Each year senior employees participate in a 360 degree survey, which gathers feedback on values-aligned behaviours from peers, direct reports, skip level reports and managers. |
Incentive schemes should drive behaviours consistent with the Group's purpose, values and strategy.
|
| | |
| Group Remuneration Committee |
The Group Remuneration Committee is responsible for setting the overarching principles, parameters and governance of the Group's remuneration framework for our colleagues, and the remuneration of executive Directors, the Group Chairman and other senior Group colleagues. The Committee regularly reviews the framework to ensure it supports the Group's purpose, values, culture and strategy, as well as promoting sound risk management. The Committee also reviews the framework to satisfy itself that it complies with the regulatory requirements of multiple jurisdictions.
All members of the Committee are independent non-executive Directors of HSBC Holdings. No Directors are involved in deciding their own remuneration. A copy of the Committee’s terms of reference can be found on our website at www.hsbc.com/our-approach/corporate-governance/board-committees.
The Committee met six times during 2021. Rachel Duan, Dame Carolyn Fairbairn and José Antonio Meade Kuribreña were appointed as members of the Committee during 2021. David Nish, Henri de Castries and Irene Lee stepped down as members of the Committee during 2021. The following is a summary of the Committee’s key activities during 2021.
| | | | | | | | | | | | | | | | | | | | |
| Matters considered during 2021 |
| | | | | | |
| Jan | Feb | May | Jul | Sep | Dec |
| Remuneration framework and governance |
| Group variable pay pool, workforce performance and pay matters, gender pay gap report, and employee surveys | l | ô | l | l | l | l |
| Directors' remuneration policy design | ô | ô | l | l | l | l |
| Executive Director remuneration policy implementation, scorecards and pay proposals | l | l | l | ô | l | l |
| Remuneration for other senior executives of the Group | l | l | l | l | l | l |
| Directors’ remuneration report | l | l | ô | ô | ô | l |
| Regulatory, risk and governance |
| Information on material risk and audit events, and performance and remuneration impacts for individuals involved | l | ô | l | l | l | l |
| Regulatory updates, including approach and outcomes for the identification of Material Risk Takers | l | l | l | l | l | l |
| Governance matters | l | l | l | l | l | l |
| Principal subsidiaries |
| Matters from subsidiary committees | l | l | l | l | l | l |
Advisers
The Committee received input and advice from different advisers on specific topics during 2021. Deloitte LLP’s engagement with the Committee was extended during 2021. Deloitte provided benchmarking data on remuneration policy matters and independent advice to the Committee. Deloitte also provided tax compliance and other advisory services to the Group. Deloitte is a founding member of the Remuneration Consultants Group and voluntarily operates under the code of conduct in relation to executive remuneration consulting in the UK.
The Committee also received advice from Willis Towers Watson on market data and remuneration trends. Willis Towers Watson was appointed by management after considering invited proposals from similar consultancy firms. It provides actuarial support to Global Finance and benchmarking data and services related to benefits administration for our Group employees. The Committee was satisfied the advice provided by Deloitte and Willis Towers Watson was objective and independent in 2021.
For 2021, total fees of £176,550 and £35,060 were incurred in relation to remuneration advice provided by Deloitte and Willis Towers Watson, respectively. This was based on pre-agreed fees and a time-and-materials basis.
Attendees and interaction with other Board committees
During the year, Noel Quinn as the Group Chief Executive provided regular briefings to the Committee. In addition, the Committee engaged with and received updates from the following:
•Mark Tucker, Group Chairman;
•Elaine Arden, Group Chief Human Resources Officer;
•Jenny Craik, Group Head of Performance Management, Reward and Employee Relations;
•Alexander Lowen, Former Group Head of Performance Management and Reward;
•Pam Kaur, Group Chief Risk and Compliance Officer;
•Colin Bell, former Group Chief Compliance Officer;
•Bob Hoyt, Group Chief Legal Officer;
•Shawn Chen, Group General Counsel for Litigation and Regulatory Enforcement; and
•Aileen Taylor, Group Company Secretary and Chief Governance Officer.
The Committee also received feedback and input from the Group Risk Committee and Group Audit Committee on risk, conduct and compliance-related matters relevant to remuneration.
Committee effectiveness
The annual review of the effectiveness of the Committee was internally facilitated for 2021. The review concluded that the Committee continued to operate effectively, with a number of positive aspects of the Committee’s operation and practices highlighted. Areas identified for focus during 2022 included:
•The Committee needs to receive suitable and relevant data and insight to support its discussion and decision making on pay, including for the wider workforce.
•It should facilitate the right level of preparation for its members.
•The Committee should consider how best the Committee’s advisers and other external consultants could add value and insights on developing market context and stakeholder views to its discussions.
The Committee discussed the outcomes of the evaluation in January 2022, and endorsed the findings and actions to be taken. The outcomes of the evaluation have been reported to the Board and the Committee will track progress on the recommendations through the year.
Voting results from Annual General Meeting
The table below shows the voting results from our last AGM.
| | | | | | | | | | | |
| 2021 Annual General Meeting voting results |
| For | Against | Withheld |
Remuneration report
(votes cast) | 97.30 | % | 2.70% | –– |
| 8,898,898,415 | 246,557,676 | 12,404,292 |
| Remuneration policy (2019) (votes cast) | 97.36 | % | 2.64% | –– |
| 9,525,856,097 | 258,383,075 | 47,468,297 |
Report of the Directors | Corporate governance report
| | |
| Annual report on Directors' remuneration |
This section sets out how our approved Directors’ remuneration policy was implemented during 2021.
Determining executive Directors’ incentive outcomes
(Audited)
The maximum 2021 annual incentive opportunity for our 2 executive Directors, Noel Quinn and Ewen Stevenson, was set at 215% of salary.
In order for any annual incentive award to be made, each executive Director must achieve a minimum values-aligned behaviour rating. For 2021, both executive Directors met this requirement.
The level of award is determined by applying the outcome of their annual incentive scorecard to the maximum opportunity. The scorecard measures, weighting and targets were determined at the start of the financial year taking into account the Group's plan for 2021 and the Group's strategic priorities and commitments.
The financial targets were set at the start of the financial year when there was significant uncertainty and challenging circumstances, including the emergence of new Covid-19 variants and ongoing low interest rates. For strategic measures, the performance assessment involved considering performance against targets set in line with our commitments, such as employee diversity, survey results for employee experience and customer satisfaction measures, as well as an assessment of the progress made and momentum generated to achieve our strategic priorities.
The Group's financial performance improved in 2021. In particular, the Committee noted:
•reported profit before tax was $18.9bn, which represented an increase of 115% compared with 2020 and an increase of 42% compared with 2019;
•strong cost controls were demonstrated, despite inflationary pressures and continued investment in technology, with adjusted costs at $32.15bn;
•RoTE was 8.3%; and
•there was a more positive shareholder experience, including share price performance and shareholder returns through dividends and capital returns.
As set out in the scorecard assessment table below, while cost performance was towards the lower end of the target range, it was broadly in line with the Group’s revised adjusted cost guidance of $32bn, reflecting increases in technology investment and inflationary pressures. Adjusted revenue in Asia was down, due mainly to the impact of interest rate cuts. However, wealth and trade revenues grew, while loans and advances increased by $33bn for the year, indicating that demand remains high. We made strong progress towards our core objective of reducing RWAs in low-return franchises, achieving $104bn by the end of 2021 and more than 95% of our cumulative target for the end of 2022. We also made good progress on strategic measures, by improving customer satisfaction, maintaining the high level of employee engagement from 2020 and exceeding our gender representation target in senior leadership roles.
Overall, this level of performance resulted in a payout of 57.30% of the maximum for Noel Quinn and 60.43% for Ewen Stevenson.
The annual incentive scorecard is subject to a risk and compliance modifier, which provides the Committee with the discretion to adjust down the overall scorecard outcome, taking into account information such as any risk metrics being outside of tolerance for a significant period of time and any risk management failures that have resulted in significant customer detriment, reputational damage and/or regulatory censure. Taking into account the Group's performance against the risk metrics, inputs from the Group Risk Committee and overall performance of the executive Directors, the Committee determined that the application of the risk modifier was not required for 2021.
The Committee also reviewed these outcomes in the context of a number of internal and external considerations to determine whether it should exercise its discretion to reduce the formulaic outcome. The Committee determined that the 2021 formulaic outcome appropriately rewards the executive Directors for their performance within the context of Group's financial performance and overall stakeholder experience.
| | | | | | | | | | | | | | | | | | | | | | | | | | | | | |
| Annual incentive assessment |
| | Noel Quinn | Ewen Stevenson |
| Minimum (25% payout) | Maximum (100% payout) | Performance | Weighting (%) | Assessment (%) | Outcome
(%) | Weighting (%) | Assessment (%) | Outcome (%) |
Adjusted cost ($bn) | 32.27 | 31.47 | 32.15 | 20.00 | | 36.25 | | 7.25 | | 20.00 | | 36.25 | | 7.25 | |
Revenue growth in Asia (%) | 0.44% | 0.89% | -5.96 | % | 20.00 | | — | | — | | 15.00 | | — | | — | |
RWA reduction in legacy assets/low-return areas ($bn)1 | 38.35 | 42.40 | 43.00 | 20.00 | | 100.00 | | 20.00 | | 15.00 | | 100.00 | | 15.00 | |
| Customer satisfaction | See following section for
non-financial performance commentary | 15.00 | | 67.00 | | 10.05 | | 15.00 | | 67.00 | | 10.05 | |
| Employee experience | 15.00 | | 75.00 | | 11.25 | | 15.00 | | 75.00 | | 11.25 | |
| Personal objectives | 10.00 | | 87.50 | | 8.75 | | 20.00 | | 84.40 | | 16.88 | |
| Total | | | | 100.00 | | | 57.30 | | 100.00 | | | 60.43 | |
| Maximum annual incentive opportunity (£000) | | | | | | £2,776 | | | £1,619 |
Annual incentive outcome
(£000) | | | | | | £1,590 | | | £978 |
1 As set out in our February 2020 business update, one of our objectives has been to reduce RWAs in low-return franchises and redeploy capital in areas of faster growth and higher returns, with a target of achieving a $100bn reduction in RWAs by the end of 2022. This target was subsequently amended during 2021, following a change to the methodology of capturing RWA saves. Following this amendment in methodology, the Committee adjusted the original target range of $28.35bn to $32.4bn and increased it to $38.35bn to $42.40bn.
Non-financial performance
| | | | | | | | | | | | |
| Shared objectives for Noel Quinn and Ewen Stevenson | |
| Objectives | Weighting | Assessment | Performance | |
Customer satisfaction Maintain and improve net promoter score ('NPS') in the UK and Hong Kong | 15% | 67% | •In Wealth and Personal Banking, our NPS ranking in Hong Kong remained in third place, and in the UK our NPS increased and our overall rank improved by one place (assessed at 65%). •In Commercial Banking, our overall NPS ranking was fourth in Hong Kong, and we ranked in the top three among our large corporate customers. In the UK, overall we declined one rank position in 2021. We continued to have a top placed NPS ranking for mid-market enterprises, and we maintained our NPS ranks for large corporates and small business banking clients, while our ranking fell for business banking customers (assessed at 57%). •For Global Banking and Markets, we improved our overall NPS ranking in Asia from third to first place, and our rank improved by one place in Europe among priority clients (assessed at 80%). | |
Employee experience Improve engagement, diversity and inclusion | 15% | 75% | Employee engagement (assessed at 100%) •We met our stretch target to sustain last year’s historically strong employee engagement score of 72%. The result is 4 points above the global financial services benchmark and 5 points above 2019 levels. •The index comprises 3 areas: willingness to recommend HSBC as a great place to work, feeling proud to work for HSBC, and feeling valued by HSBC. •Commentary from our survey suggests that focus on employee well-being, flexible work arrangements and our response to the Covid-19 pandemic have had a strong positive impact on employee engagement. Gender representation in leadership roles (assessed at 100%) •At the end of 2021, we had 31.7% of our senior leadership roles held by female colleagues, exceeding our target of 31.0% for the year and on track to achieving our new goal of 35.0% by 2025. •This has been achieved through a focus on the hiring, retention and career development of female colleagues. Black employees' representation in leadership roles (assessed at 100%) •The number of Black heritage employees in senior leadership increased by 17.5%. •We are reliant on our colleagues’ choice to self-identify or not, noting that we have made good progress on this ethnicity data with 78.1% of UK colleagues and 95.2% of US colleagues having self-identified. This improvement has enabled a much clearer picture of where to focus attention and we are using it as part of progress check-ins with executives. Engagement among colleagues identifying as part of an ethnic minority and who identify as having a disability (assessed at 0%) •At a global level, we have not closed the gap in employee engagement scores between ethnic minority and non-ethnic-minority colleagues, or between colleagues with disabilities versus those who do not have a disability. •While delivering meaningful change will take time, we are deepening our understanding of where differences arise – in particular looking at how engagement is shaped by the way diverse groups are represented differently across our businesses, geographies and job types. •We have also introduced an inclusion index to help understand the sentiment of all colleagues, including diverse groups. This includes questions related to a sense of belonging, speak-up, trust, career, fair treatment and self-expression. | |
Report of the Directors | Corporate governance report
| | | | | | | | | | | |
| Personal objectives for Noel Quinn and Ewen Stevenson |
| Objectives | Weighting | Assessment | Performance |
Noel Quinn •Launch of refreshed purpose and values •Delivery of strategy | 10% | 87.5% | Launch of refreshed purpose and values •Our refreshed purpose and values were successfully deployed with strong leadership tone from the Group Chief Executive and Group Executives internally and externally. •Our employee survey to test awareness and understanding of our new purpose, values and strategy found that 82% of respondents said that HSBC has the right purpose, strategy and values to drive success, and 76% believed that the purpose and values will lead to meaningful changes in how we work. The strategy index is at 72%, 2 points ahead of the financial services benchmark that has trended downwards. •The purpose and values have been embedded into our onboarding and induction processes for 26,500 new joiners, our recognition framework and performance management approach. Delivery of strategy •We are making progress across the 4 strategic pillars: Focus on our strengths, digitise at scale, energise for growth and transition to net zero. •Focus on our strengths: –In Wealth and Personal Banking, we saw growth of 138% in net new invested assets for Asia wealth. In asset management, our funds under management rose 5% to $630bn. In insurance, the value of new business in Singapore, mainland China, and Hong Kong (including Hang Seng Bank) increased 40% from 2020, to reach $917m. –In Commercial Banking, we saw strong growth in fee income in 2021, reaching $3.6bn, a growth of 9% compared with 2020. Our customer lending volume increased 3% to $349bn. We made progress on improving SME propositions in our key markets. Since the launch of Kinetic in the UK in 2020 we have reached 24,000 customers at the end of 2021. –In Global Banking and Markets, we reduced adjusted RWAs by 10% to $236bn at 31 December 2021, driven by saves in our Western franchise, comprising of our Europe and Americas businesses. Overall, Global Banking and Markets revenue reached approximately $15bn, driven by strong performance in Equities, Capital Markets and Advisory, and Securities Services. –We made progress on restructuring our US business and HSBC Bank plc, our non-ring-fenced bank in Europe and the UK. We announced 3 key acquisitions in 2021 to further strengthen our wealth franchise in Asia. We entered into an agreement to acquire AXA Singapore, pending regulatory approval, with the intention to merge the business with the operations of our existing HSBC Life Singapore franchise. We agreed to fully acquire L&T Investment Management, the 12th largest mutual fund management company in India. We received regulatory approval to acquire the remaining 50% stake in HSBC Life China, bringing our shareholder ownership to 100% upon completion. •Digitise at scale: We made good progress on automating our organisation at scale. Our Cloud adoption rate, which is the percentage of our technology services on the private or public Cloud, increased from approximately 20% in 2020 to 27% in 2021. At the end of 2021, 43% of our customers were 'mobile active' users, who are customers that had logged onto a mobile app at least once in the last 30 days. This is an improvement compared with 38% in 2020. •Energise for growth: We continue to help to energise our colleagues through initiatives that help develop their future skills and learning opportunities, in areas including data, digital and sustainability. •Transition to net zero: In 2021, we reduced our organisation’s absolute greenhouse gas emissions in our operations to 341,000 CO2 tonnes, a decrease of 50% using 2019 as the baseline. We provided and facilitated $82.6bn of sustainable finance and investment, taking the cumulative amount to $126.7bn since 1 January 2020, as part of our $750bn to $1tn by 2030 ambition. |
Ewen Stevenson •Finance on the Cloud deployment •Climate stress test •Resolvability assessment framework attestation •Reduce Global Finance function costs and number of FTEs | 20% | 84.4% | •The Finance on the Cloud programme entered into the implementation phase in 2021. The RWA and liquidity Cloud migrations from the legacy Platfora solution was completed and the UK Cloud transformation was extended to liquidity. All regulatory obligations in relation to this were met. We also made progress with the global roll-out of the Cloud solution in Hong Kong and the US. •We significantly developed our climate scenario capabilities, largely driven by the climate biennial exploratory scenario exercise and through developing a framework to incorporate client adaptation plans into climate scenario analysis to address insufficient client data issues. We developed reporting that includes the Group’s carbon reduction metrics, with reporting of high-risk sectors included in the quarterly Group Executive Committee update. We also enhanced disclosures to cover quantitative risk metrics aligned with the climate risk appetite statement. •We built capabilities to support the resolvability assessment framework and met all regulatory deadlines during 2021 in relation to this. •The Global Finance function costs were marginally above target due to market pay challenges and the target for full-time equivalent colleagues was largely met. |
Single figure of remuneration
(Audited)
The following table shows the single figure of total remuneration of each executive Director for 2021, together with comparative figures.
| | | | | | | | | | | | | | |
| Single figure of remuneration |
| Noel Quinn | Ewen Stevenson |
| (£000) | 2021 | 2020 | 2021 | 2020 |
Base salary1 | 1,288 | 1,266 | 751 | 738 |
Fixed pay allowance ('FPA')1 | 1,700 | 1,700 | 1,062 | 950 |
| Cash in lieu of pension | 129 | 127 | 75 | 74 |
Taxable benefits2 | 95 | 186 | 3 | 12 |
Non-taxable benefits2 | 71 | 59 | 42 | 32 |
| Total fixed | 3,283 | 3,338 | 1,933 | 1,806 |
Annual incentive3 | 1,590 | 799 | 978 | 450 |
Notional returns4 | 22 | 17 | — | — |
Replacement award5 | — | | — | 754 | 1,431 |
| Total variable | 1,612 | 816 | 1,732 | 1,881 |
| Total fixed and variable | 4,895 | 4,154 | 3,665 | 3,687 |
1 Executive Directors made the personal decision to donate 100% of their base salary increases for 2021 to charity given the ongoing challenging external environment. Ewen Stevenson also donated his FPA increase for 2021 to charity. Figures shown in the table above are the gross figures before charitable donations.
2 Taxable benefits include the provision of medical insurance, car and tax return assistance (including any associated tax due, where applicable). Non-taxable benefits include the provision of life assurance and other insurance cover.
3 Noel Quinn and Ewen Stevenson both voluntarily waived the cash portion of their 2020 annual incentive. Without this voluntary waiver, the 2020 annual incentive of Noel Quinn and Ewen Stevenson would have been £1,598,000 and £900,000, respectively.
4 The deferred cash awards granted in prior years includes a right to receive notional returns for the period between the grant and vesting date. This is determined by reference to a rate of return specified at the time of grant and paid annually, with the amount disclosed on a paid basis.
5 In 2019 Ewen Stevenson was granted replacement awards to replace unvested awards, which were forfeited as a result of him joining HSBC. The awards, in general, match the performance, vesting and retention periods attached to the awards forfeited. The values included in the table for 2020 relate to his 2017 LTI award granted by the Royal Bank of Scotland Group plc ('RBS'), now renamed as NatWest Group plc ('NatWest'), for performance year 2016, which was determined by applying the performance assessment outcome of 56.25% as disclosed in NatWest's Annual Report and Accounts 2019 (page 91) to the maximum number of shares subject to performance conditions. This resulted in a payout equivalent to 78.09% of NatWest award shares that were forfeited and replaced with HSBC shares. A total of 313,608 shares were granted in respect of his 2017 LTI replacement award at a share price of £6.643. The HSBC share price was £5.845 when the awards ceased to be subject to performance conditions, with no value attributable to share price appreciation. The value included in the table for 2021 relates to Ewen Stevenson's 2018 LTI replacement award granted by NatWest for performance year 2017 and was subject to a pre-vest performance test assessed and disclosed by NatWest in its Annual Report and Accounts 2020 (page 135). As no adjustment was proposed for Ewen Stevenson by NatWest, a total of 177,883 shares granted in respect of his 2018 LTI replacement award ceased to be subject to performance conditions. These awards were granted at a share price of £6.643 and the HSBC share price was £4.240 when the awards ceased to be subject to performance conditions, with no value attributable to share price appreciation.
Benefits
The values of the significant benefits in the single figure table are set out in the following table.1
| | | | | | | | |
| Noel Quinn |
| (£000) | 2021 | 2020 |
| Insurance benefit (non-taxable) | 67 | 51 |
Car and driver (UK and Hong Kong)2 | 87 | 139 |
1 The insurance and car benefits for Ewen Stevenson are not included in the above table as they were not deemed significant.
2 The 2021 car and driver benefit was lower than 2020 due to the impact of travel restrictions during the Covid-19 pandemic.
Long-term incentive awards
(Audited)
Long-term incentive in respect of 2021
After taking into account performance for 2021, the Committee decided to grant Noel Quinn and Ewen Stevenson LTI awards of £4,131,000 and £2,410,000, respectively.
The 2021 LTI awards will have a three-year performance period starting 1 January 2022. During this period, performance will be assessed based on four equally weighted measures: two financial measures to incentivise value creation for our shareholders; a measure linked to our climate ambitions; and a measure for relative total shareholder return ('TSR'). This is consistent with the measures used for our last LTI award.
RoTE is a key measure of our financial performance and how we generate returns that deliver value for our shareholders. The target range for this measure is aligned with our medium-term objective of achieving a RoTE of 10% or more.
Capital reallocation to Asia remains one of the key levers of our strategy and business transformation plan. This measure will be assessed based on the share of Group tangible equity allocated to
Asia at the end of the performance period. The target range for this measure is aligned with our long-term strategic plan.
The transition to net zero scorecard measures are aligned to our strategic priority of bringing carbon emissions in our own operations to net zero by 2030 and supporting our customers in the transition to a more sustainable future, by providing and facilitating $750bn to $1tn of sustainable finance and investment over the same time period. Targets are linked to this climate ambition and performance will be assessed based on the reduction in our carbon footprint and the financing we provide to our clients in their net zero transition.
Relative TSR rewards executive Directors based on comparison of the TSR performance of the Group and a relevant peer group. No changes were made to the peer group for this LTI award. The Committee will review the TSR peer group for future LTI awards to ensure the peer group remains appropriate, taking into account the progress in the execution of our strategic shifts in our geographical and business mix, notably future growth investment in Asia and wealth business.
The LTI continues to be subject to a risk and compliance modifier, which gives the Committee the discretion to adjust down the
Report of the Directors | Corporate governance report
overall outcome to ensure that the Group operates soundly when achieving its financial targets. For this purpose, the Committee will receive information including any risk metrics outside of tolerance for a significant period of time and any risk management failures that have resulted in significant customer detriment, reputational damage and/or regulatory censure.
The RoTE and capital reallocation to Asia measures are also subject to a CET1 underpin. If the CET1 ratio at the end of the performance period is below the CET1 risk tolerance level set in the risk appetite statement, then the assessment for these measures will be reduced to nil.
As the awards are not entitled to dividend equivalents in
accordance with regulatory requirements, the number of shares to be awarded will be adjusted to reflect the expected dividend yield of the shares over the vesting period.
To the extent performance conditions are satisfied at the end of the three-year performance period, the awards will vest in 5 equal annual instalments commencing from around the third anniversary of the grant date. On vesting, shares equivalent to the net number of shares that have vested (after those sold to cover any income tax and social security payable) will be held for a retention period of up to one year, or such period as required by regulators.
| | | | | | | | | | | | | | | | | |
| Performance conditions for LTI awards in respect of 2021 (performance period 1 January 2022 to 31 December 2024) |
Measures1 | Minimum
(25% payout) | Target
(50% payout) | Maximum
(100% payout) | Weighting
% |
RoTE (with CET1 underpin)2 | 8.0% | 9.5% | 11.0% | 25.0 |
Capital reallocation to Asia (with CET1 underpin)3 | 46.0% | 48.0% | 50.0% | 25.0 |
Transition to net zero4 | Carbon reduction | 52.0% | 56.0% | 60.0% | 25.0 |
| Sustainable finance and investment | $285.0bn | $340.0bn | $370.0bn |
Relative TSR5 | | At the median of the peer group | Straight-line vesting between minimum and maximum | At the upper quartile of the peer group | 25.0 |
1Awards will vest on a straight-line basis for performance between the minimum, target and maximum levels of performance set in this table.
2To be assessed based on RoTE at the end of the performance period. This metric will be subject to the CET1 underpin outlined above.
3 To be assessed based on share of Group tangible equity (on a constant currency basis and excluding associates) allocated to Asia by 31 December 2024. This metric will be subject to the CET1 underpin outlined above.
4 Carbon reduction will be measured based on percentage reduction in total energy and travel emissions achieved by 31 December 2024 using 2019 as the baseline. The sustainable finance and investment metric will assess cumulative financing provided over the period commencing on
1 January 2020 and ending on 31 December 2024.
5 The peer group for the 2021 award is: Bank of America, Barclays, BNP Paribas, Citigroup, Credit Suisse Group, DBS Group Holdings, Deutsche Bank, J.P. Morgan Chase & Co., Lloyds Banking Group, Morgan Stanley, Standard Chartered and UBS Group.
2018 long-term incentive performance
The 2018 LTI award was granted to John Flint (former Group Chief Executive) and Marc Moses (former Group Chief Risk Officer).
Based on the scorecard outcome, 78,071 shares will vest for John Flint and 54,932 shares will vest for Marc Moses (determined by pro-rating their awards for time in employment during the performance period of 1 January 2019 to 31 December 2021). The awards will vest in 5 equal annual instalments commencing in March 2022. Using the average daily closing share prices over the three months to 31 December 2021 of £4.339 the value of awards to vest to John Flint and Marc Moses is £338,750 and £238,350, respectively.
| | | | | | | | | | | | | | | | | | | | |
| Assessment of the LTI award in respect of 2018 (performance period 1 January 2019 to 31 December 2021) |
| Measures (with weighting) | Minimum (25% payout) | Target (50% payout) | Maximum (100% payout) | Actual | Assessment | Outcome |
Average RoTE (with CET1 underpin) (75%) | 10.0% | 11.0% | 12.0% | 6.6% | 0.0% | 0.00% |
Employer advocacy1 (12.5%) | 65% | 70% | 75% | 70% | 50.0% | 6.25% |
Environmental, social and governance rank2 (12.5%) | At median of the peer group | Straight-line vesting between minimum and maximum | At upper quartile of peer group | Above upper quartile | 100.0% | 12.50% |
Total3 | | | | | | 18.75% |
1 Assessed based on results of the 2021 employee Snapshot survey question: 'I would recommend this company as a great place to work'.
2 Based on Sustainalytics ratings. Peer group for this measure included Bank of America, Barclays, BNP Paribas, Citigroup, Credit Suisse Group, Deutsche Bank, DBS Group Holdings, J.P. Morgan Chase & Co., Lloyds Banking Group, Standard Chartered, UBS Group, ICBC, Itau and Santander.
3 The award was subject to a risk and compliance underpin which gives the Committee the discretion to adjust down the overall scorecard outcome, taking into account performance against risk and compliance factors during the performance period for the award. Taking into account inputs received from Group Risk and Compliance and the Group Risk Committee, the Committee considered the application of the risk and compliance underpin was not required.
Scheme interests awarded during 2021
The table below sets out the scheme interests granted to executive Directors during 2021 in respect of performance year 2020, as disclosed in the 2020 Directors’ remuneration report. No non-executive Directors received scheme interests during the financial year.
| | | | | | | | | | | | | | | | | | | | | | | |
| Scheme awards in 2021 |
| (Audited) |
| Type of interest awarded | Basis on which
award made | Date of award | Face value awarded1 £000 | Percentage receivable for minimum
performance | Number of
shares
awarded | End of performance period |
| Ewen Stevenson | LTI deferred shares2 | % of salary2 | 1 March 2021 | 2,716 | | 25 | | 637,197 | 31 December 2023 |
| | | | | | | |
| Noel Quinn | LTI deferred shares2 | % of salary2 | 1 March 2021 | 4,767 | | 25 | | 1,118,554 | 31 December 2023 |
| | | | | | | |
1The face value of the award has been computed using HSBC's closing share price of £4.262 taken on 26 February 2021. LTI awards are subject to a three-year forward-looking performance period and vest in 5 equal annual instalments, between the third and seventh anniversary of the award date, subject to performance achieved. On vesting, awards will be subject to a one-year retention period. Awards are subject to malus during the vesting period and clawback for a maximum period of 10 years from the date of the award.
2 In line with regulatory requirements, scheme interests awarded during 2021 were not eligible for dividend equivalents. In accordance with the remuneration policy approved by shareholders at the 2019 AGM, the LTI award was determined at 293% of salary for Noel Quinn and 286% of salary for Ewen Stevenson. The number of shares to be granted was determined by taking HSBC's closing share price of £4.262 taken on 26 February 2021, and applying a discount based on HSBC’s expected dividend yield of 5% per annum for the vesting period (£3.324).
The above table does not include details of shares issued as part of the fixed pay allowance and shares issued as part of the 2020 annual incentive award that vested on grant and were not subject to any further service or performance conditions. Details of the performance measures and targets for the LTI award in respect of 2020 are set out below:
| | | | | | | | | | | | | | | | | |
| Performance conditions for LTI awards in respect of 2020 (performance period 1 January 2021 to 31 December 2023) |
Measures1 | Minimum
(25% payout) | Target
(50% payout) | Maximum
(100% payout) | Weighting
% |
RoTE (with CET1 underpin)2 | 8.0% | 9.0% | 10.0% | 25.0 |
Capital reallocation to Asia (with CET1 underpin)3 | 45.0% | 47.0% | 50.0% | 25.0 |
Environment and sustainability4 | Carbon reduction | 42.0% | 48.0% | 51.0% | 25.0 |
| Sustainable finance and investment | $200.0bn | $240.0bn | $260.0bn |
Relative TSR5 | | At median of the
peer group | Straight-line vesting between minimum and maximum | At upper quartile of
peer group | 25.0 |
1Awards will vest on a straight-line basis for performance between the minimum, target and maximum levels of performance set in this table.
2 To be assessed based on RoTE at the end of the performance period. The measure will also be subject to a CET1 underpin. If the CET1 ratio at the end of the performance period is below the CET1 risk tolerance level set in the risk appetite statement, then the assessment for this measure will be reduced to nil.
3 To be assessed based on share of Group tangible equity (on a constant currency basis and excluding associates) allocated to Asia by 31 December 2023. This metric will be measured on an organic basis and will exclude changes in Group tangible equity allocation resulting from acquisitions and disposals (and also part-acquisitions or part-disposals) of businesses and is subject to the CET1 underpin outlined above.
4 Carbon reduction will be measured based on percentage reduction in total energy and travel emissions achieved by 31 December 2023 using 2019 as the baseline. The sustainable finance and investment metric will assess cumulative financing provided over the period commencing on
1 January 2020 and ending on 31 December 2023.
5 The peer group for the 2020 award is: Bank of America, Barclays, BNP Paribas, Citigroup, Credit Suisse Group, DBS Group Holdings, Deutsche Bank, J.P. Morgan Chase & Co., Lloyds Banking Group, Morgan Stanley, Standard Chartered and UBS Group.
Executive Directors’ interests in shares
(Audited)
The shareholdings of executive Directors in 2021, including the shareholdings of their connected persons, at 31 December 2021 (or the date they stepped down from the Board, if earlier) are set out below. The following table shows the comparison of shareholdings with the company shareholding guidelines. There have been no changes in the shareholdings of the executive Directors from 31 December 2021 to the date of this report.
Individuals have five years from their appointment date to build up the recommended levels of shareholding. In line with investor guidance, for executive Directors, unvested shares which are not subject to forward-looking performance conditions (on a net of tax basis) will count towards their shareholding requirement under the new policy proposed for shareholder approval at the 2022 AGM.
The Committee reviews compliance with the shareholding requirement and has full discretion in determining if any unvested shares should be taken into consideration for assessing compliance with this requirement, taking into account shareholder expectations and guidelines. The Committee also has full discretion in determining any penalties for non-compliance.
With regard to post-employment shareholding arrangements,
we believe that our remuneration structure achieves the objective of ensuring there is ongoing alignment of executive Directors' interests with shareholder experience post-cessation of their employment due to the following features of the policy:
•Shares delivered to executive Directors as part of the FPA have a five-year retention period, which continues to apply following a departure of an executive Director.
•Shares delivered as part of an annual incentive award are subject to a one-year retention period, which continues to apply following a departure of an executive Director.
•LTI awards have a seven-year vesting period with a one-year post-vesting retention period, which is not accelerated on departure. The weighted average holding period of an LTI award within HSBC is therefore six years, in excess of the five-year holding period typically implemented by FTSE-listed companies. When an executive Director ceases employment as a good leaver under our policy, any LTI awards granted will continue to be released over a period of up to eight years, subject to the outcome of performance conditions.
HSBC operates an anti-hedging policy under which individuals are not permitted to enter into any personal hedging strategies in relation to HSBC shares subject to a vesting and/or retention period.
Report of the Directors | Corporate governance report
| | | | | | | | | | | | | | | | | | | | |
| Shares |
| (Audited) |
| Shareholding guidelines
(% of salary) | Shareholding at 31 Dec 20212 (% of salary) | At 31 Dec 2021 |
| | Scheme interests |
| Share interests
(number
of shares) | Share options3 | Shares awarded subject to deferral1 |
| without performance conditions4 | with performance conditions5 |
| Executive Directors | | | | | |
Noel Quinn6 | 400% | 380% | 1,131,278 | | — | | 481,634 | | 1,118,554 | |
Ewen Stevenson6 | 300% | 483% | 838,154 | | — | | 506,743 | | 1,113,954 | |
1The gross number of shares is disclosed. A portion of these shares will be sold at vesting to cover any income tax and social security that falls due at the time of vesting.
2 The value of the shareholding is calculated using an average of the daily closing share prices in the three months to 31 December 2021 (£4.339).
3 At 31 December 2021, Noel Quinn and Ewen Stevenson did not hold any options under the HSBC Holdings Savings-Related Share Option Plan (UK).
4 The amount for Ewen Stevenson reflects the award granted in May 2019, replacing the 2015 to 2018 LTIs forfeited by the Royal Bank of Scotland Group plc, now renamed as NatWest Group plc ('NatWest'), and is subject to any performance adjustments assessed and disclosed in the relevant NatWest Annual Report and Accounts.
5 LTI awards granted in February 2020 and 2021 are subject to the performance conditions as set out on page 309.
6 All Group Executives and executive Directors are expected to meet their shareholding guidelines within five years of the date of their appointment (Noel Quinn and Ewen Stevenson were appointed on 5 August 2019 and 1 January 2019 respectively). For Group Executives, their shareholding requirement is 250% of salary and unvested shares that are not subject to forward-looking performance conditions (on a net of tax basis) are counted towards their shareholding requirement.
Total pension entitlements
(Audited)
No employees who served as executive Directors during the year have a right to amounts under any HSBC final salary pension scheme for their services as executive Directors or are entitled to additional benefits in the event of early retirement. There is no
retirement age set for Directors, but the normal retirement age for colleagues is 65.
Payments to past Directors
(Audited)
Details of the 2018 LTI outcome, in which John Flint (former Group Chief Executive) and Marc Moses (former Group Chief Risk Officer) participated, are outlined on page 308. No payments were made to, or in respect of, former Directors in the year in excess of the minimum threshold of £50,000 set for this purpose.
Payments for loss of office
(Audited)
No payments for loss of office were made to, or in respect of, former or current Directors in the year.
External appointments
During 2021, executive Directors did not receive any fees from external appointments.
Implementation of remuneration policy in 2022 for executive Directors
The base salary of our executive Directors will increase by 3.5% with effect from 1 March 2022. The Committee determined the increase was necessary to ensure that the total remuneration opportunity of our executive Directors does not fall further behind desired levels based on the size, complexity and international peer group of the Group. This was discussed with shareholders during our engagement with them on the new Directors' remuneration policy.
The increase is in line with the average salary increase of our wider workforce. There is no other change to the remuneration elements of our executive Directors.
The following table summarises how the maximum opportunity for each element of our remuneration policy for executive Directors will be implemented in 2022.
| | | | | | | | | | | |
| Implementation of remuneration policy in 2022 |
| Summary of operation | Noel Quinn | Ewen Stevenson |
| Base salary | 3.5% increase with effect from 1 March 2022 (in line with the increase for the wider workforce) | £1,336,000 | £779,000 |
| Fixed pay allowance | No change | £1,700,000 | £1,085,000 |
| Cash in lieu of pension | No change | 10% of base salary |
| Benefits | No change | Same benefit provisions will be made available |
| Annual incentive | No change in maximum opportunity | Maximum opportunity will be 215% of base salary |
| Long-term incentive | No change in maximum opportunity | Maximum opportunity will be 320% of base salary |
2022 annual incentive scorecards
The 2022 annual incentive scorecard measures for our executive Directors have been set to deliver growth and business transformation. The targets for the measures have been set, reflecting on the Group's plan for 2022 and the macroeconomic uncertainty, including the interest rate environment and inflation.
The Committee will continue to retain discretion to adjust the formulaic outcomes of scorecards, taking into account factors such as Group profits, wider business performance and stakeholder experience, to ensure executive reward is aligned with underlying Group performance and the broader stakeholder experience.
The weightings and performance measures for the 2022 annual incentive award for executive Directors are disclosed below. The performance targets are commercially sensitive and it would be
detrimental to the Group’s interests to disclose them at the start of the financial year. Subject to commercial sensitivity, we will disclose the targets for a given year in the Annual Report and Accounts for that year in the Directors' remuneration report.
Executive Directors will be eligible for an annual incentive award of up to 215% of base salary.
The 2022 annual incentive scorecards for members of our Group Executive Committee include similar measures as for the executive Directors to drive performance in each of our businesses, functions and regions that contribute to the overall success of the Group. The Group Executives' LTI awards in respect of 2021 will also be subject to the same three-year forward-looking scorecard measures and targets as set out on page 307.
| | | | | | | | |
| 2022 annual incentive scorecard measures and weightings |
| Noel Quinn | Ewen Stevenson |
| Measures | Weighting % | Weighting % |
| Group adjusted profit before tax | 20.0 | | 15.0 | |
| Growth in Group lending and net new invested assets | 15.0 | | 10.0 | |
| RoTE | 15.0 | | 15.0 | |
| Group adjusted costs | 10.0 | | 10.0 | |
| Customer satisfaction in the UK, Hong Kong and key growth markets | 15.0 | | 15.0 | |
| Employee experience through maintaining and improving engagement, increasing diversity and improving inclusion | 15.0 | | 15.0 | |
Personal objectives Group Chief Executive •Technology transformation, growth initiatives, restructuring of the Group and driving innovation programmes. Group Chief Financial Officer •Finance of the future, creating strong corporate development and Group transformation functions, Global Finance function employee experience and Global Finance function efficiency. | 10.0 | | 20.0 | |
| Total | 100.0 | | 100.0 | |
The Group adjusted profit before tax, Group lending and net new invested assets growth, RoTE and Group adjusted costs measures will be subject to a CET1 underpin. If the CET1 ratio on 31 December 2022 is below the CET1 risk tolerance level set in the risk appetite statement, then the assessment for these measures will be reduced to nil. The 2022 annual incentive scorecard is subject to a risk and compliance modifier, which allows the
Committee the discretion to adjust down the overall scorecard outcome to ensure that the Group operates soundly when achieving its financial targets. For this purpose, the Committee will receive information including any risk thresholds outside of tolerance for a significant period of time and any risk management failures that have resulted in significant customer detriment, reputational damage and/or regulatory censure.
Non-executive Directors
(Audited)
The following table shows the total fees and benefits of non-executive Directors for 2021, together with comparative figures for 2020.
| | | | | | | | | | | | | | | | | | | | | |
| Fees and benefits |
| (Audited) | | Fees1 | Benefits2 | Total |
| (£000) | | 2021 | 2020 | 2021 | 2020 | 2021 | 2020 |
Henri de Castries3 | | 82 | | 202 | | 22 | | 1 | | 104 | | 203 | |
Laura Cha3, 4 | | 242 | | 587 | | 18 | | — | | 260 | | 587 | |
Rachel Duan5 | | 67 | | — | | — | | — | | 67 | | — | |
Dame Carolyn Fairbairn6 | | 80 | | — | | — | | — | | 80 | | — | |
James Forese7 | | 572 | | 160 | | — | | — | | 572 | | 160 | |
Steven Guggenheimer8 | | 250 | | 134 | | — | | — | | 250 | | 134 | |
Irene Lee9 | | 556 | | 546 | | — | | — | | 556 | | 546 | |
José Antonio Meade Kuribreña10 | | 223 | | 202 | | — | | 4 | | 223 | | 206 | |
Heidi Miller3, 11 | | 251 | | 632 | | 19 | | 7 | | 270 | | 639 | |
Eileen Murray12 | | 266 | | 120 | | — | | — | | 266 | | 120 | |
David Nish13 | | 482 | | 480 | | 10 | | 8 | | 492 | | 488 | |
| | | | | | | |
| Jackson Tai | | 350 | | 355 | | — | | 12 | | 350 | | 367 | |
Mark Tucker14 | | 1,500 | | 1,500 | | 33 | | 52 | | 1,533 | | 1,552 | |
Pauline van der Meer Mohr15 | | 291 | | 312 | | — | | 2 | | 291 | | 314 | |
| Total (£000) | | 5,212 | | 5,230 | | 102 | | 79 | | 5,314 | | 5,309 | |
| Total ($000) | | 7,169 | 6,958 | 140 | 105 | 7,309 | 7,063 |
1Fees are in line with the Directors' remuneration policy that was approved at the 2019 AGM. Fees include a travel allowance of £4,000 for non-UK based non-executive Directors and for all non-executive Directors effective from 1 June 2019. Given the travel restrictions in place, the Board was unable to travel to attend meetings in person. Therefore, no travel allowance was paid to non-executive Directors during 2021.
2 Benefits include taxable expenses such as accommodation, travel and subsistence relating to attendance at Board and other meetings at HSBC Holdings' registered offices. Amounts disclosed have been grossed up using a tax rate of 45%, where relevant.
3 Retired from the Board on 28 May 2021.
4 Includes fees of £177,000 (2020: £423,800) for her role as non-executive Chair and member of the Nomination Committee of The Hongkong and Shanghai Banking Corporation Limited.
5 Appointed to the Board and as a member of the Group Remuneration Committee and Nomination & Corporate Governance Committee on 1 September 2021.
6 Appointed to the Board and as a member of the Group Risk Committee, Group Remuneration Committee and Nomination & Corporate Governance Committee on 1 September 2021.
7 Includes fees of £332,000 (2020: £nil) in relation to his role as a non-executive Director of HSBC North America Holdings, Inc. He was appointed as non-executive Chair on 28 May 2021.
8 Appointed as Co-Chair of the Technology Governance Working Group on 1 March 2021.
9 Includes fees of £380,000 (2020: £546,000) in relation to her roles as a Director, Remuneration Committee Chair, Audit Committee member and Risk Committee member of The Hongkong and Shanghai Banking Corporation Limited and in relation to her role as non-executive Chair of Hang Seng Bank Limited.
10 Appointed to the Group Remuneration Committee on 28 May 2021.
11 Includes fees of £169,000 (2020: £431,000) in relation to her role as non-executive Chair of HSBC North America Holdings, Inc.
12 Appointed as Co-Chair of the Technology Governance Working Group on 1 March 2021. Stepped down as a member of the Group Audit Committee on 28 May 2021.
13 Stepped down as a member of Group Remuneration Committee on 23 February 2021.
14 As previously announced in 2020, a part of the fee for 2021 was donated to charity. The fee shown in the single figure of remuneration is the gross fee before charitable donations.
15 Stepped down as a member of the Group Risk Committee on 28 May 2021.
Report of the Directors | Corporate governance report
Non-executive Directors’ interests in shares
(Audited)
The shareholdings of persons who were non-executive Directors in 2021, including the shareholdings of their connected persons, at
31 December 2021, or date of cessation as a Director if earlier, are
set out below.
Non-executive Directors are expected to meet the shareholding guidelines within five years of the date of their appointment. All non-executive Directors who had been appointed for five years or more at 31 December 2021 met the guidelines.
| | | | | | | | |
| Shares |
| Shareholding guidelines (number of shares) | Share interests (number of shares) |
| Laura Cha (retired on 28 May 2021) | 15,000 | 16,200 | |
| Henri de Castries (retired on 28 May 2021) | 15,000 | 19,251 | |
| Rachel Duan (appointed to the Board on 1 Sep 2021) | 15,000 | — | |
| Dame Carolyn Fairbairn (appointed to the Board on 1 Sep 2021) | 15,000 | — | |
| James Forese | 15,000 | 115,000 | |
| Steven Guggenheimer | 15,000 | 15,000 | |
| Irene Lee | 15,000 | 15,000 | |
| José Antonio Meade Kuribreña | 15,000 | 15,000 | |
| Heidi Miller (retired on 28 May 2021) | 15,000 | 15,700 | |
| Eileen Murray | 15,000 | 75,000 | |
| David Nish | 15,000 | 50,000 | |
| Jackson Tai | 15,000 | 66,515 | |
| Mark Tucker | 15,000 | 307,352 | |
| Pauline van der Meer Mohr | 15,000 | 15,000 | |
2022 fees for non-executive Directors
The table below sets out the 2022 fees for non-executive Directors.
| | | | | | | | |
| | 2022 fees |
| Position | | £ |
Non-executive Group Chairman1 | | 1,500,000 |
| Non-executive Director (base fee) | | 127,000 |
| Senior Independent Director | | 200,000 |
| Group Risk Committee | Chair | 150,000 |
| Member | 40,000 |
| Group Audit Committee and Group Remuneration Committee | Chair | 75,000 |
| Member | 40,000 |
| Nomination & Corporate Governance Committee | Chair | –– |
| Member | 33,000 |
| Technology Governance Working Group | Co-Chair | 60,000 |
1 The Group Chairman does not receive a base fee or any other fee in respect of chairing of the Nomination & Corporate Governance Committee.
Summary of shareholder return and Group Chief Executive remuneration
The following graph shows HSBC TSR performance (based on the daily spot Return Index in sterling) against the FTSE 100 Total Return Index for the 10-year period ended 31 December 2021.
The FTSE 100 Total Return Index has been chosen as a recognised broad equity market index of which HSBC Holdings is a member. The single figure remuneration for the Group Chief Executive over the past 10 years, together with the outcomes of the respective annual incentive and LTI awards, are presented in the following table.
| | |
| HSBC TSR and FTSE 100 Total Return Index |
| | | | | | | | | | | | | | | | | | | | | | | | | | | | | | | | | | | | | | | |
| | 2012 | 2013 | 2014 | 2015 | 2016 | 2017 | 2018 | 2019 | 2020 | 2021 |
| Group Chief Executive | | Stuart Gulliver | Stuart Gulliver | Stuart Gulliver | Stuart Gulliver | Stuart Gulliver | Stuart Gulliver | Stuart Gulliver | John Flint | John Flint | Noel Quinn | Noel Quinn | Noel Quinn |
| Total single figure £000 | | 7,532 | 8,033 | 7,619 | 7,340 | 5,675 | 6,086 | 2,387 | 4,582 | 2,922 | 1,977 | 4,154 | 4,895 |
Annual incentive1 (% of maximum) | | 52% | 49% | 54% | 45% | 64% | 80% | 76% | 76% | 61% | 66% | 32% | 57% |
Long-term incentive1,2,3 (% of maximum) | | 40% | 49% | 44% | 41% | –% | –% | 100% | –% | –% | –% | –% | — | % |
1 The 2012 annual incentive figure for Stuart Gulliver used for this table includes 60% of the annual incentive disclosed in the 2012 Directors’ remuneration report, which was deferred for five years and subject to service conditions and satisfactory completion of the five-year deferred prosecution agreement with the US Department of Justice, entered into in December 2012 ('AML DPA') as determined by the Committee. The AML DPA performance condition was met and the award vested in 2018. The value of the award at vesting was included in the 2018 single figure of remuneration and included as long-term incentive for 2018.
2 Long-term incentive awards are included in the single figure for the year in which the performance period is deemed to be substantially completed. For Group Performance Share Plan ('GPSP') awards, this is the end of the financial year preceding the date of grant. GPSP awards shown in 2012 to 2015 are therefore related to awards granted in 2013 to 2016.
3 The GPSP was replaced by the LTI in 2016 and the value for GPSP is nil for 2016 as no GPSP award was made for 2016. LTI awards have a three-year performance period and the first LTI award was made in February 2017. The value of the LTI awards expected to vest will be included in the total single figure of remuneration of the year in which the performance period ends. Noel Quinn did not receive the 2018 LTI award that had a performance period ended on 31 December 2021.
Relative importance of spend on pay
The following chart shows the change in:
•total staff pay between 2020 and 2021; and
•dividends and share buy-backs in respect of 2020 and 2021.
In 2021, total spend on pay was up from 2020, and the distribution to shareholders also increased from 2020 with the reinstatement of dividends (following the suspension of dividend payments during 2020) and the capital return to shareholders through the up to $2bn share buy-back announced in October 2021. In addition, the Group has announced the intention to initiate a further up to $1bn buy-back, to commence after the existing buy-back has concluded. Dividends include an approximation of the amount payable on 28 April 2022 in relation to the second interim dividend of $0.18 per ordinary share.
| | |
| Relative importance of spend on pay |
| | | | | | | | | | | | | | | | | | | | | | | | | | | | | | | | | | | |
| | | | | | | | | | | |
| Total return to shareholder | 2021 — | | $5,070m | | $2,000m | $7,070m | | | ì |
| | | | | | | | | | 131.1% |
| 2020 — | | $3,059m | | | | | | | | |
| | | | | | | | | | | ì |
| Employee pay | 2021 — | | | | | $18,742m | | |
| | | | | | | | | |
| 2020 — | | | | | $18,076m | | | | | 3.7% |
| | | | | | | | | | | |
| | | | | | | | | | | |
| | | Employee pay | | Dividends | | Share buy-back | | |
Report of the Directors | Corporate governance report
| | |
| Our approach to workforce remuneration |
Remuneration principles
Our performance and pay strategy aims to competitively reward long-term sustainable performance. Our goal is to attract, motivate and retain the very best people, regardless of gender, ethnicity,
age, disability or any other factor unrelated to performance or experience. This supports the long-term interests of our stakeholders, including our customers and the communities we serve, our shareholders and our regulators.
Our approach to performance and pay in 2021 for the broader workforce was underpinned by our remuneration principles.
| | | | | |
| Principle | Our approach in 2021 |
Fair, appropriate and free from bias
| •We help managers to make informed, consistent and fair pay decisions. Variable pay for 92% of our employees is either set centrally or based on a starting point recommendation from HR. •Communications and reporting encourage our managers to: challenge their assessments; question whether they were objective; and use facts to make decisions. •Managers in similar roles complete ‘fairness reviews’ where they discuss the performance and values-aligned behaviour ratings of their teams. They help each other to make objective decisions by providing a diverse range of examples, facts and viewpoints, and challenge each other to mitigate the risk of unconscious bias. •During the annual review process, HR and management perform checks to ensure outcomes are in line with our principles and are equitable. We use data to identify employees whose pay is lower than their comparable peer group. If there is no objective reason for these variances, such as performance or skills and experience, we make adjustments. |
| A culture of continuous feedback through manager and employee empowerment | •We seek to create a culture where our people can fulfil their potential, gain new skills and develop their careers for the future. •In 2021, we further improved our culture of continuous feedback, with 66% of our colleagues saying that conversations with their managers across the year had a positive impact on their performance and 62% reporting positive effects on their well-being. •Our continuous feedback tool, including a mobile app, makes it easier for our colleagues to share feedback with each other in the moment, providing a structure so that they can share what went well and what they could do better in specific situations. •We encourage colleagues to use our online career planning tools to help them with their thinking about future roles and the capabilities they require and to drive conversations. |
Reward and recognition of sustainable performance and values-aligned behaviour
| •Individual performance is assessed against clear and relevant financial and non-financial objectives. These set out expectations for each colleague in terms of performance and development. •We recognise our colleagues not just for results, but also for demonstrating our values. As such, subject to local law, our colleagues receive a behaviour rating as well as a performance rating. •Group and business performance is used to determine the Group variable pay pool and that of each business. Where performance in a year is weak, as measured by both financial and non-financial metrics, this will impact the relevant pool. The final pool also considers the external operating environment and the expectations of our stakeholders. •We undertake analytical reviews to ensure there is clear pay differentiation across both performance and behaviour ratings. This is provided to senior management and the Committee as part of their oversight of the remuneration outcomes for the Group. •We recognise examples of exceptional positive conduct through an increase in variable pay, and apply a reduction in variable pay for misconduct or inappropriate behaviour that exposes us to financial, regulatory or reputational risk. •We promote employee share ownership through variable pay deferrals and voluntary enrolment in an all-employee share plan. |
| Balanced, simple and transparent total reward packages, which support employee well-being | •Paying our colleagues fairly and appropriately is critical to delivering on our strategic commitments. We work extensively with our external market benchmarking consultants to get the latest insights on market pay levels and areas of potential risk. That guides us as we make pay decisions, allowing us to focus on managing people risks and areas critical to our strategy. •We maintain an appropriate balance between fixed pay, variable pay and employee benefits, taking into consideration an employee’s seniority, role, individual performance and the market. Decisions are informed, but not driven, by market position and practice. •We are committed to employee well-being and offer employee benefits that support the mental, physical and financial health of a diverse workforce. •We review pay based on gender to uphold our commitment to inclusion and pay equity. •All HSBC employees that work in a jurisdiction with a legal minimum wage are paid at or above this amount. In 2014, HSBC in the UK was formally accredited by the Living Wage Foundation for having adopted the ‘Living Wage’ and the ‘London Living Wage’. In nine of our jurisdictions where a 'living wage' has been defined, our employees are paid at or above that level. We also undertake regular reviews of equal pay for gender. •As part of our commitment to the World Economic Forum ('WEF') metrics on measuring stakeholder capitalism, we review entry level wages in key markets to compare both men and women against the local minimum wage. This provided an indication of fairness at point of career entry. We have included data from the UK, US and Mexico where we have sufficient entry-level colleagues and good quality gender disclosures to allow for meaningful analysis (see table below). In line with expectations, the data shows broad consistency between male and female outcomes. |
| | | | | | | | | | | |
| Average standard entry level vs. minimum wage by gender as at 31 December 2021 |
| Market | Male | Female | All |
| UK | 115% | 114% | 114% |
| US | 153% | 162% | 158% |
| Mexico | 259% | 250% | 254% |
To calculate the above, we have used an average of annualised fixed pay to allow for a like-for-like comparison to include colleagues who work part-time. For colleagues based in the UK, we have compared the entry level wage against the UK national minimum wage. For the US, our comparison is against the respective state minimum wage, which is slightly higher than the federal minimum wage. In Mexico, we have used the minimum wage, which is regulated by the National Minimum Wage Commission.
Supporting colleagues in 2021
The well-being of our people remained a critical focus, in particular as the operating environment continued to be challenging for many colleagues and their families. The pandemic was a key influence on our activities during the year and our country-based approach allowed us to respond quickly and flexibly to specific situations in each of our markets. In India, we took urgent steps during the second wave of the pandemic to help our colleagues and their dependants with access to support via a Covid-19 taskforce consisting of employee volunteers working in collaboration with partners. Our offices in India were set up to manage vaccination drives for employees and their families and we provided financial support to local non-profit organisations delivering the relief effort on the ground.
Our global well-being programme covered three pillars: mental, physical and financial well-being. Despite the immense challenges, sentiment remained high. A total of 82% of colleagues rated their mental well-being as positive, 75% rated their physical well-being positively and 64% of colleagues reported their financial well-being as positive in our December survey.
Our survey suggests that work-life balance has improved, with 76% of colleagues saying they can integrate their work and personal life positively, compared with 74% in 2020.
The pandemic offered us the opportunity to take the best of what we learnt and rethink the future of work. To support our approach, we created three guiding principles:
•Customer focus: We aim to make sure the way we work helps deliver the best commercial outcomes for our customers.
•Team commitment: We will connect with each other, build our community and collaborate.
•Flexibility: We will provide our colleagues with more choice on how, when and where we work, suitable to the roles we do.
Considering the challenges colleagues faced, it was encouraging to see that check-ins happened regularly, with 60% of colleagues having frequent conversations with their managers, an increase
from 56% in 2020. Our colleagues tell us that these have a positive impact on their performance, development and well-being, and are important in motivating them to perform at their best.
We also measure our colleagues’ sentiment on performance and pay matters through our annual pay review surveys. In the most recent survey, a significant proportion of the respondents’ comments indicated they believed they were paid fairly for what they do. It also highlighted challenges on market positions and potential retention issues in certain areas. Noting this sentiment of our colleagues, the extraordinarily competitive market for talent and material improvement in the Group's financial performance, we agreed a Group variable pay pool of $3,495m. This was determined using our countercyclical funding methodology under which a ceiling is used to limit the increase in variable pay pool at higher levels of performance. Therefore, while adjusted profit before tax rose 79%, the year-on-year increase in Group variable pay pool was 31%, following a reduction of 20% in 2020. In addition, fixed pay increases were targeted towards junior colleagues to help address the impact of rising inflation in many of our locations.
Throughout the year we also recognise our colleagues for demonstrating our values. The ‘At Our Best‘ recognition online platform allows for real-time recognition and communication of positive behaviours by colleagues, in line with our refreshed purpose and values. We ran a special ‘Spotlight on valuing difference’ campaign to recognise the exceptional actions of our colleagues in being empathetic, championing inclusivity, listening and seeking out different perspectives. An additional points budget was allocated and there were over 130,000 recognitions during the campaign.
Remuneration structure for Group employees
Total compensation, which comprises fixed and variable pay, is the key focus of our remuneration framework, with variable pay differentiated by performance and demonstration of values-aligned behaviours. We set out below the key features and design characteristics of our remuneration framework, which apply on a Group-wide basis, subject to compliance with local laws:
| | | | | | | | |
| Overview of remuneration structure for employees |
| Remuneration components and objectives | Application for Group employees | Approach for executive Directors |
Fixed pay Attract and retain employees with market competitive pay for the role, skills and experience required. | •May include salary, fixed pay allowance, cash in lieu of pension and other cash allowances in accordance with local market practice. •Based on predetermined criteria, non-discretionary, transparent and not reduced based on performance. •Represents a higher proportion of total compensation for more junior employees. •May change to reflect an individual’s position, role or grade, cost of living in the country, individual skills, capabilities and experience. •Fixed pay is generally delivered in cash on a monthly basis. | •Consistent with approach for Group colleagues except fixed pay allowance paid in shares. |
Benefits Support the physical, mental and financial health of a diverse workforce in accordance with local market practice. | •Benefits may include, but are not limited to, the provision of a pension, medical insurance, life insurance, health assessment and relocation support. | •Provision of medical insurance, life insurance, car and tax return assistance. Group Chief Executive is eligible to receive accommodation and a car benefit in Hong Kong. |
Annual incentive Incentivise and reward performance based on annual financial and non-financial measures consistent with the medium- to long-term strategy, stakeholder interests and values-aligned behaviours. | •All employees are eligible to be considered for a discretionary variable pay award. Individual awards are determined against objectives for performance set at the start of the year. •Represents a higher proportion of total compensation for more senior employees and will be more closely aligned to Group and business performance as seniority increases. •Variable pay for Group employees identified as Material Risk Takers ('MRTs') under European Union Regulatory Technical Standard ('RTS') 2021/923 is limited to 200% of fixed pay, as approved by shareholders at the 2014 AGM held on 23 May 2014 (98% in favour). •Awards are generally paid in cash and shares. For MRTs, at least 50% of the awards are in shares and/or where required by regulations, in units linked to asset management funds. | •Annual incentive is determined based on the outcomes of annual scorecard of financial and non-financial measures. •Executive Directors and Group Executives are also eligible to be considered for a long-term incentive award, which is subject to three-year forward-looking performance measures. See details on page 293. |
Report of the Directors | Corporate governance report
| | | | | | | | |
| Overview of remuneration structure for employees (continued) |
| Remuneration components and objectives | Application for Group employees | Approach for executive Directors |
Deferral Align employee interests with the medium- to long-term strategy, stakeholder interests and values-aligned behaviours. | •A Group-wide deferral approach is applicable to all employees. A portion of annual incentive awards above a specified threshold is deferred in shares vesting annually over a three-year period with 33% vesting on the first and second anniversaries of grant and 34% on the third anniversary. •For MRTs awards are generally subject to a minimum 40% deferral (60% for awards of £500,000 or more) over a minimum period of four years. •A deferral period of five years is applied for senior management and individuals identified in specified roles with managerial responsibilities as prescribed under the PRA and FCA remuneration rules. •A deferral period of seven years is applied for individuals in PRA-designated senior management functions. •In accordance with the terms of the PRA and FCA remuneration rules, and subject to compliance with local regulations, the deferral requirement for MRTs is not applied to individuals where their total variable pay is £44,000 or less and variable pay is not more than one-third of total compensation. For these individuals, the Group standard deferral applies. •Individuals based outside the UK and identified as MRTs under local regulations, would be subject to local requirements where necessary. •All deferred awards are subject to malus provisions, subject to compliance with local laws. Awards granted to MRTs on or after 1 January 2015 are subject to clawback. •HSBC operates an anti-hedging policy for all employees, which prohibits employees from entering into any personal hedging strategies in respect of HSBC securities. •For Group and local MRTs, excluding executive Directors where deferral is typically in the form of shares only, a minimum of 50% of the deferred awards is in HSBC shares and the balance is deferred into cash. Local regulatory requirements would also apply where necessary. •For some employees in our asset management business, where required by the regulations applicable to asset management entities within the Group, at least 50% of the deferred award is linked to fund units reflective of funds managed by those entities, with the remaining portion of deferred awards being in the form of deferred cash awards. •Variable pay awards made in HSBC shares or linked to relevant fund units granted to MRTs are generally subject to a one-year retention period post-vesting. •MRTs who are subject to a five-year deferral period, except senior management or individuals in PRA- and FCA-designated senior management functions, have a six-month retention period applied to their awards. •Where an employee is subject to more than one regulation, the requirement specific to the sector and/or country in which the individual is working is applied. | •All of the LTI award, or at least 60% of the total variable award (including LTI), is deferred. The deferred awards will vest in five equal annual instalments, with the first vesting on or around the third anniversary of the grant date and the last instalment vesting on or around the seventh anniversary of the grant date. •All deferred awards are in HSBC shares and subject to a post-vesting retention period of one year. |
| | |
| |
| | |
| |
| | |
Buy-out awards Support recruitment of key individuals. | •Buy-out awards may be offered if an individual holds any outstanding unvested awards that are forfeited on resignation from the previous employer. •The terms of the buy-out awards will not be more generous than the terms attached to the awards forfeited on cessation of employment with the previous employer. | •For new hires, the approach is consistent with the approach taken for employees and policy approved by shareholders. |
Guaranteed variable remuneration Support recruitment of key individuals. | •Guaranteed variable remuneration is awarded in exceptional circumstances for new hires, and is limited to the individual’s first year of employment only. •The exceptional circumstances would typically involve a critical new hire and would also depend on factors such as the seniority of the individual, whether the new hire candidate has any competing offers and the timing of the hire during the performance year. | •For new hires, the approach is consistent with the approach taken for employees and policy approved by shareholders. |
Severance payments Adhere to contractual agreements with involuntary leavers.
| •Where an individual’s employment is terminated involuntarily for gross misconduct then, subject to compliance with local laws, the Group’s policy is not to make any severance payment in such cases and all outstanding unvested awards are forfeited. •For other cases of involuntary termination of employment, the determination of any severance will take into consideration the performance of the individual, contractual notice period, applicable local laws and circumstances of the case. •Generally, all outstanding unvested awards will normally continue to vest in line with the applicable vesting dates. Where relevant, any performance conditions attached to the awards, and malus and clawback provisions, will remain applicable to those awards. •Severance amounts awarded to MRTs are not considered as variable pay for the purpose of application of the deferral and variable pay cap rules under the PRA and FCA remuneration rules where such amounts include: (i) payments of fixed remuneration that would have been payable during the notice and/or consultation period; (ii) statutory severance payments; (iii) payments determined in accordance with any approach applicable in the relevant jurisdictions; and (iv) payments made to settle a potential or actual dispute. | •Any payments will be in line with the policy on loss of office as noted on page 310. |
Link between risk, performance and reward
Our remuneration practices promote sound and effective risk management while supporting our business objectives and the delivery of our strategy.
We set out below the key features of our framework, which help enable us to achieve alignment between risk, performance and reward, subject to compliance with local laws and regulations:
| | | | | |
| Alignment between risk and reward |
| Framework elements | Application |
| Variable pay pool | The Group variable pay pool is expected to move in line with Group performance, based on a range of financial, non-financial and contextual factors. We also use a countercyclical funding methodology, with both a floor and a ceiling, with the payout ratio generally reducing as performance increases to avoid pro-cyclicality. The floor recognises that even in challenging times, remaining competitive is important. The ceiling recognises that at higher levels of performance it is not always necessary to continue to increase the variable pay pool, thereby limiting the risk of inappropriate behaviour to drive financial performance. The main quantitative and qualitative performance and risk metrics used for assessment of performance include: •Group and business unit financial performance, including capital requirements; •current and future risks, taking into consideration performance against the risk appetite, financial and resourcing plan and global conduct outcomes; and •fines, penalties and provisions for customer redress, which are automatically included in the Committee’s definition of profit for determining the pool. In the event that the Group was unable to distribute dividends to shareholders for reasons such as capital adequacy, then the Group may determine that as a year of weak performance. In such a year, the Group may withhold some, or all, variable pay for employees including unvested share awards, using the metrics outlined above as a basis for that determination. |
| Individual performance scorecard | •Assessment of individual performance is made with reference to clear and relevant financial and non-financial objectives. Objectives for senior management take into account appropriate measures linked to sustainability risks, such as: reduction in carbon footprint; facilitating financing to help clients with their transition to net zero; employee diversity targets; and risk and compliance measures. A mandatory global risk objective is included in the scorecard of all other employees. All employees receive a behaviour rating as well as a performance rating, which ensures performance is assessed not only on what is achieved but also on how it is achieved. |
| Control function staff | •The performance and reward of individuals in control functions, including risk and compliance employees, are assessed according to a balanced scorecard of objectives specific to the functional role they undertake. •Their remuneration is determined independent of the performance of the business areas they oversee. •The Committee is responsible for approving the remuneration for the Group Chief Risk and Compliance Officer and Group Head of Internal Audit. •Group policy is for control functions staff to report into their respective function. Remuneration decisions for senior functional roles are made by the global function head. •Remuneration is carefully benchmarked with the market and internally to ensure it is set at an appropriate level. |
| Variable pay adjustments and conduct recognition | •Variable pay awards may be adjusted downwards in circumstances including: – detrimental conduct, including conduct that brings HSBC into disrepute; – involvement in events resulting in significant operational losses, or events that have caused or have the potential to cause significant harm to HSBC; and – non-compliance with the values-aligned behaviours and other mandatory requirements or policies. •Rewarding positive conduct may take the form of use of our global recognition programme, At Our Best, or positive adjustments to variable pay awards. |
| Malus | Malus can be applied to unvested deferred awards granted in prior years in circumstances including: •detrimental conduct, including conduct that brings the business into disrepute; •past performance being materially worse than originally reported; •restatement, correction or amendment of any financial statements; and •improper or inadequate risk management. |
| Clawback | Clawback can be applied to vested or paid awards granted to MRTs on or after 1 January 2015 for a period of seven years, extended to 10 years for employees in PRA and FCA designated senior management functions in the event of ongoing internal/regulatory investigation at the end of the seven-year period. Clawback may be applied in circumstances including: •participation in, or responsibility for, conduct that results in significant losses; •failing to meet appropriate standards and propriety; •reasonable evidence of misconduct or material error that would justify, or would have justified, summary termination of a contract of employment; and •a material failure of risk management suffered by HSBC or a business unit in the context of Group risk-management standards, policies and procedures. |
| Sales incentives | •We generally do not operate commission-based sales plans. |
| Identification of MRTs | •We identify individuals as MRTs based on the qualitative and quantitative criteria set out in the RTS and using the following key principles that underpin HSBC’s identification process: –MRTs are identified at Group, HSBC Bank (consolidated) and HSBC UK Bank level. –MRTs are also identified at other solo regulated entity level as required by the regulations. –When identifying an MRT, HSBC considers an employee’s role within its matrix management structure. The global business and function that an individual works within takes precedence, followed by the geographical location in which they work. •We also identify additional MRTs based on our own internal criteria, which include compensation thresholds and individuals in certain roles and grades who otherwise would not be identified as MRTs under the criteria prescribed in the RTS. |
Report of the Directors | Corporate governance report
Comparison of Directors' and employees' pay
The following table compares the changes in each Director's salary, taxable benefits and annual incentive between 2020 and 2021 with the percentage change in each of those elements of pay for UK-based employees of HSBC Group Management Services Limited, the employing entity of the executive Directors.
There were no changes to the fees or benefits of the non-executive Directors between 2021 and 2020. The year-on-year percentage change in fees noted in the table below is primarily driven by any
pro-rated fees received by the non-executive Director for 2021 and/or 2020 based on time served by them on the Board and the relevant Board committees and any additional responsibilities taken on by the non-executive Director during each year. The value of benefits received by the non-executive Directors reflect the taxable expense reimbursements claimed, and the associated gross-up tax, in relation to attending the Board meetings in each year. Non-executive Directors who joined after 1 January 2021 are not included.
| | | | | | | | | | | | | | | | | | | | | |
| Annual percentage change in remuneration | |
| 2020 | 2021 | |
| Director/employees | Base salary/fees | Benefits | Annual incentive | Base salary/fees | Benefits | Annual incentive2 | |
| Executive Directors | |
Noel Quinn1 | 151.7% | 353.7% | 20.2% | 1.7% | -48.9% | 99.0% | |
| Ewen Stevenson | 2.6% | -25.0% | -58.4% | 1.8% | -75.0% | 117.3% | |
Non-executive Directors3 | |
| Kathleen Casey (retired on 24 April 2020) | -65.0% | 200.0% | - | - | - | - | |
Laura Cha4 | 97.0% | - | - | -58.8% | - | - | |
Henri de Castries4,5 | 4.1% | -75.0% | - | -59.4% | 2,100.0% | - | |
James Forese6 | - | - | - | 257.5% | - | - | |
Steven Guggenheimer7 | - | - | - | 86.6% | - | - | |
| Irene Lee | 20.3% | -100.0% | - | 1.8% | - | - | |
José Antonio Meade Kuribreña8 | 28.7% | 100.0% | - | 10.4% | -100.0% | - | |
Heidi Miller4,5 | 1.1% | -100.0% | - | -60.3% | 171.4% | - | |
Eileen Murray7 | - | - | - | 121.7% | - | - | |
| David Nish | 108.7% | -50.0% | - | 0.4% | 25.0% | - | |
| Sir Jonathan Symonds (retired on 18 February 2020) | -86.5% | -4.8% | - | - | - | - | |
Jackson Tai8 | -10.8% | -78.9% | - | -1.4% | -100.0% | - | |
| Mark Tucker | - | -77.5% | - | — | -36.5% | - | |
Pauline van der Meer Mohr8 | 17.7% | -75.0% | - | -6.7% | -100.0% | - | |
Employee group9 | 2.0% | 2.3% | -20.0% | 1.0% | 1.3% | 25.2% | |
1 Noel Quinn succeeded John Flint as interim Group Chief Executive with effect from 5 August 2019 and was appointed permanently into the role on 17 March 2020. The annual percentage change in 2020 for Noel Quinn is based on remuneration reported in his 2019 single figure of remuneration (for the period 5 August 2019 to 31 December 2019) and his 2020 single figure of remuneration (for the period 1 January 2020 to 31 December 2020). Based on his annualised 2019 compensation as an executive Director, his percentage change in salary, benefits and annual incentive was 2.1%, 85.2% and -50.9%, respectively for 2020.
2 Noel Quinn and Ewen Stevenson both voluntarily waived the cash portion of their 2020 annual incentive. The year-on-year percentage change between 2020 and 2021 would be -1% for Noel Quinn and 9% for Ewen Stevenson without this cash waiver.
3 In some instances, non-executive Directors may have served only part of the year resulting in large year-on-year percentage changes in fees and/or benefits. Page 311 provides the underlying single figure of remuneration for non-executive Directors used to calculate the figures above.
4 Retired from the Board during 2021 and therefore fees received during 2021 were lower than the fees received in 2020.
5 There was no change to the benefit provided. The year-on-year change reflected the increase in taxable expense reimbursement claimed in 2021 for attending Board and other meetings at HSBC Holdings' registered offices.
6 In 2021, James Forese was appointed as non-executive Chair of HSBC North America Holdings, Inc. Fees for 2021 included fees in relation to this role.
7 Joined the Board during 2020 and therefore received fees for only part of 2020.
8 Received no taxable benefits in 2021, resulting in a 100% reduction from 2021.
9 Employee group consists of individuals employed by HSBC Group Management Services Ltd, the employing entity of the executive Directors, as no individuals are employed directly by HSBC Holdings.
Pay ratio
The following table shows the ratio between the total pay of the Group Chief Executive and the lower quartile, median and upper quartile pay of our UK employees.
| | | | | | | | | | | | | | |
| Total pay ratio |
| Method | Lower quartile | Median | Upper quartile |
| 2021 | A | 154:1 | 90:1 | 46:1 |
| 2020 | A | 139:1 | 85:1 | 43:1 |
| 2019 | A | 169:1 | 105:1 | 52:1 |
| | | | | | | | | | | | | | | | | | | | | | | |
| Total pay and benefits amounts used to calculate the ratio |
| (£) | Method | Lower quartile | Median | Upper quartile |
| Total pay and benefits | Total salary | Total pay and benefits | Total salary | Total pay and benefits | Total salary |
| 2021 | A | 31,727 | 27,666 | 54,678 | 41,500 | 106,951 | 84,000 |
| 2020 | A | 29,833 | 23,264 | 48,703 | 36,972 | 96,386 | 75,000 |
| 2019 | A | 28,920 | 24,235 | 46,593 | 41,905 | 93,365 | 72,840 |
The increase in median ratio is primarily driven by a higher annual incentive payout than 2020 when the Group Chief Executive voluntarily decided to waive the cash portion of his annual incentive award and we protected the outcomes for junior colleagues against material year-on-year volatility when the Group variable pay pool was down 20%. The 2021 annual incentive award of the Group Chief Executive was higher than in 2020, reflecting the improvement in the financial performance of the Group and execution of our strategy at pace.
The total pay and benefits for the median employee for 2021 was £54,678, a 12.3% increase compared with 2020.
Our UK workforce comprises a diverse mix of employees across different businesses and levels of seniority, from junior cashiers in our retail branches to senior executives managing our global business units. We aim to deliver market-competitive pay for each role, taking into consideration the skills and experience required for the business. Our approach to pay is designed to attract and motivate the very best people, regardless of gender, ethnicity, age, disability or any other factor unrelated to performance or experience. We actively promote learning and development opportunities for our employees to provide a framework for them to develop their career. To help people to develop skills for the changing world around us, we launched Future Skills in September 2021, supporting colleagues to explore new personal, digital, data and sustainability skills through a series of learning activities and events. As an individual progresses in their career we would expect their total compensation opportunity to also increase, reflecting their role and responsibilities.
Pay structure varies across roles in order to deliver an appropriate mix of fixed and variable pay. Junior employees have a greater portion of their pay delivered in a fixed component, which does not vary with performance and allows them to predictably meet their day-to-day needs. Our senior management, including executive Directors, generally have a higher portion of their total compensation opportunity structured as variable pay and linked to the performance of the Group, given their role and ability to influence the strategy and performance of the Group. Executive Directors also have a higher proportion of their variable pay delivered in shares, which vest over a period of seven years with a post-vesting retention period of one year. During this deferral and retention period, the awards are linked to the share price so the value of award realised by them after the vesting and retention period will be aligned to the performance of the Group.
We are satisfied that the median pay ratio is consistent with the pay, reward and progression policies for our UK workforce, taking into account the diverse mix of our UK employees, the compensation structure mix applicable to each role and our objective of delivering market competitive pay for each role subject to Group, business and individual performance.
Our ratios have been calculated using the option ‘A’ methodology prescribed under the UK Companies (Miscellaneous Reporting) Regulations 2018. Under this option, the ratios are calculated using full-time equivalent pay and benefits of all employees providing services in the UK at 31 December 2021. We believe this approach provides accurate information and representation of the ratios. The ratio has been computed taking into account the pay and benefits of over 37,000 UK employees, other than the
individual performing the role of Group Chief Executive. We calculated our lower quartile, median and upper quartile pay and benefits information for our UK employees using:
•full-time equivalent annualised fixed pay, which includes salary and allowances, at 31 December 2021;
•variable pay awards for 2021;
•return on deferred cash awards granted in prior years. The deferred cash portion of the annual incentive granted in prior years includes a right to receive notional returns for the period between the grant date and vesting date, which is determined by reference to a rate of return specified at the time of grant. A payment of notional return is made annually and the amount is disclosed on a paid basis in the year in which the payment is made;
•gains realised from exercising awards from taxable employee share plans; and
•full-time equivalent value of taxable benefits and pension contributions.
For this purpose, full-time equivalent fixed pay and benefits for each employee have been calculated by using each employee’s fixed pay and benefits at 31 December 2021. Where an employee works part-time, fixed pay and benefits are grossed up, where appropriate, to full-time equivalent. One-off benefits provided on a temporary basis to employees on secondment to the UK have not been included in calculating the ratios as these are not permanent in nature and in some cases, depending on individual circumstances, may not truly reflect a benefit to the employee.
Total pay and benefits for the Group Chief Executive used for this purpose is the total remuneration for Noel Quinn as reported in the single figure of remuneration table. Total remuneration does not include an LTI as he has not received an LTI award with a performance period that ended during 2021. In a year in which the value of an LTI is included in the single figure table of remuneration, the ratios could be higher.
Given the different business mix, size of the business, methodologies for computing pay ratios, estimates and assumptions used by other companies to calculate their respective pay ratios, as well as differences in employment and compensation practices between companies, the ratios reported may not be comparable to those reported by other listed peers on the FTSE 100 and our international peers.
Report of the Directors | Corporate governance report
| | |
| Additional regulatory remuneration disclosures |
This section provides disclosures required under the Hong Kong Ordinances, Hong Kong Listing Rules and the Pillar 3 remuneration disclosures.
For the purpose of the Pillar 3 remuneration disclosures, executive Directors and non-executive Directors are considered to be members of the management body. Members of the Group Executive Committee other than the executive Directors are considered as senior management.
MRT remuneration disclosures
The following tables set out the remuneration disclosures for
individuals identified as MRTs for HSBC Holdings.
Remuneration information for individuals who are only identified as MRTs at HSBC Bank plc, HSBC UK Bank plc or other solo-regulated entity levels is included, where relevant, in those entities' disclosures.
The 2021 variable pay information included in the following tables is based on the market value of awards. For share awards, the market value is based on HSBC Holdings' share price at the date of grant (unless indicated otherwise). For cash awards, it is the value of awards expected to be paid to the individual over the deferral period.
| | | | | | | | | | | | | | | | | |
| Remuneration awarded for the financial year (REM1) |
| | Supervisory function | Management function | Other senior management | Other identified staff |
| Fixed remuneration | Number of identified staff | 14.0 | 2.0 | 22.9 | 1,020.7 |
| Total fixed pay ($m) | 7.2 | 6.9 | 48.9 | 619.6 |
Of which: cash-based ($m)1 | 7.2 | 3.1 | 48.9 | 619.6 |
Of which: shares or equivalent ownership interests ($m)2 | — | 3.8 | — | — |
| Of which: share-linked instruments or equivalent non-cash instruments ($m) | — | — | — | — |
| Of which: other instruments ($m) | — | — | — | — |
| Of which: other forms ($m) | — | — | — | — |
Variable remuneration3 | Number of identified staff | 14.0 | 2.0 | 22.9 | 1,020.7 |
Total variable remuneration ($m)4,5 | — | 15.1 | 76.3 | 637.5 |
| Of which: cash-based ($m) | — | 1.8 | 27.1 | 307.2 |
| Of which: deferred ($m) | — | — | 16.2 | 161.6 |
Of which: shares or equivalent ownership interests ($m)2 | — | 13.3 | 49.2 | 318.1 |
| Of which: deferred ($m) | — | 11.5 | 38.3 | 178.2 |
| Of which: share-linked instruments or equivalent non-cash instruments ($m) | — | — | — | 8.8 |
| Of which: deferred ($m) | — | — | — | 4.7 |
| Of which: other instruments ($m) | — | — | — | — |
| Of which: deferred ($m) | — | — | — | — |
| Of which: other forms ($m) | — | — | — | 3.4 |
| Of which: deferred ($m) | — | — | — | 2.1 |
| Total remuneration ($m) | 7.2 | 22.0 | 125.2 | 1,257.1 |
1 Cash-based fixed remuneration is paid immediately.
2 Paid in HSBC shares. Vested shares are subject to a retention period of up to one year.
3 Variable pay awarded in respect of 2021. In accordance with shareholder approval received on 23 May 2014 (98% in favour), for each MRT the variable component of remuneration for any one year is limited to 200% of fixed component of the total remuneration.
4 The Group has used the discount rate under PRA remuneration rule 15.13 for 15 individuals for the purpose of calculating the ratio between fixed and variable components of 2021 total remuneration.
5 13 identified staff members were exempt from the application of the remuneration structure requirements for MRTs under the PRA and FCA remuneration rules. Their total remuneration is $4.2m, of which $3.6m is fixed pay and $0.6m is variable remuneration.
| | | | | | | | | | | | | | |
| Special payments to staff whose professional activities have a material impact on institutions’ risk profile (REM2) |
| Supervisory function | Management function | Other senior management | Other identified staff |
Guaranteed variable remuneration awards1 |
| Number of identified staff | — | — | — | — |
| Total amount ($m) | — | — | — | — |
| Of which guaranteed variable remuneration awards paid during the financial year, that are not taken into account in the bonus cap ($m) | — | — | — | — |
Severance payments awarded in previous periods, that have been paid out during the financial year2 |
| Number of identified staff | — | — | — | — |
| Total amount ($m) | — | — | — | — |
Severance payments awarded during the financial year2 |
| Number of identified staff | — | — | — | 64.6 |
| Total amount ($m) | — | — | — | 68.2 |
| Of which paid during the financial year ($m) | — | — | — | 54.3 |
| Of which deferred ($m) | — | — | — | — |
| Of which severance payments paid during the financial year, that are not taken into account in the bonus cap ($m) | — | — | — | 68.2 |
| Of which highest payment that has been awarded to a single person ($m) | — | — | — | 5.0 |
1 No guaranteed variable remuneration was awarded in 2021. HSBC would offer a guaranteed variable remuneration award in exceptional circumstances for new hires, and for the first year of employment only. It would typically involve a critical new hire, and would also depend on factors such as the seniority of the individual, whether the new hire candidate has any competing offers and the timing of the hire during the performance year.
2 Includes payments such as payment in lieu of notice, statutory severance, outplacement service, legal fees, ex-gratia payments and settlements (excludes pre-existing benefit entitlements triggered on terminations).
| | | | | | | | | | | | | | | | | | | | | | | | | | |
Deferred remuneration at 31 December1 (REM3) |
| $m | Total amount of deferred remuneration awarded for previous performance periods | Of which:
due to vest in the financial year | Of which: vesting in subsequent financial years | Amount of performance adjustment made in the financial year to deferred remuneration that was due to vest in the financial year | Amount of performance adjustment made in the financial year to deferred remuneration that was due to vest in future performance years | Total amount of adjustment during the financial year due to ex post implicit adjustments | Total amount of deferred remuneration awarded before the financial year actually paid out in the financial year | Total of amount of deferred remuneration awarded for previous performance period that has vested but is subject to retention periods |
| Supervisory function | — | — | — | — | — | — | — | — |
| Cash-based | — | — | — | — | — | — | — | — |
| Shares | — | — | — | — | — | — | — | — |
| Share-linked instruments | — | — | — | — | — | — | — | — |
| Other instruments | — | — | — | — | — | — | — | — |
| Other forms | — | — | — | — | — | — | — | — |
| Management function | 24.7 | 1.9 | 22.8 | — | — | 2.0 | 1.9 | 0.2 |
| Cash-based | 3.5 | 0.3 | 3.2 | — | — | — | 0.3 | — |
| Shares | 21.2 | 1.6 | 19.6 | — | — | 2.0 | 1.6 | 0.2 |
| Share-linked instruments | — | — | — | — | — | — | — | — |
| Other instruments | — | — | — | — | — | — | — | — |
| Other forms | — | — | — | — | — | — | — | — |
| Other senior management | 82.5 | 13.2 | 69.3 | — | — | 4.6 | 13.3 | 1.8 |
| Cash-based | 40.2 | 7.2 | 33.0 | — | — | — | 7.2 | — |
| Shares | 40.6 | 4.9 | 35.7 | — | — | 4.3 | 5.0 | 1.3 |
| Share-linked instruments | 1.7 | 1.1 | 0.6 | — | — | 0.2 | 1.1 | 0.5 |
| Other instruments | — | — | — | — | — | — | — | — |
| Other forms | — | — | — | — | — | 0.1 | — | — |
| Other identified staff | 717.9 | 173.0 | 544.9 | — | — | 39.8 | 175.4 | 35.6 |
| Cash-based | 349.9 | 94.3 | 255.6 | — | — | — | 95.3 | — |
| Shares | 350.4 | 70.4 | 280.0 | — | — | 38.5 | 71.6 | 31.8 |
| Share-linked instruments | 11.8 | 5.4 | 6.4 | — | — | 1.0 | 5.5 | 2.0 |
| Other instruments | — | — | — | — | — | — | — | — |
| Other forms | 5.8 | 2.9 | 2.9 | — | — | 0.3 | 3.0 | 1.8 |
| Total amount | 825.1 | 188.1 | 637.0 | — | — | 46.4 | 190.6 | 37.6 |
1 This table provides details of balances and movements during performance year 2021. For details of variable pay awards granted for 2021, refer to the 'Remuneration awarded for the financial year' table. Deferred remuneration is made in cash and/or shares. Share-based awards are made in HSBC shares.
| | | | | |
Identified staff - remuneration by band1 (REM4) | |
| Identified staff that are high earners as set
out in Article 450(i) CRR |
| €1,000,000 – 1,500,000 | 243 | |
| €1,500,000 – 2,000,000 | 85 | |
| €2,000,000 – 2,500,000 | 54 | |
| €2,500,000 – 3,000,000 | 25 | |
| €3,000,000 – 3,500,000 | 11 | |
| €3,500,000 – 4,000,000 | 8 | |
| €4,000,000 – 4,500,000 | 6 | |
| €4,500,000 – 5,000,000 | 5 | |
| €5,000,000 – 6,000,000 | 4 | |
| €6,000,000 – 7,000,000 | 4 | |
| €7,000,000 – 8,000,000 | 3 | |
| €8,000,000 – 9,000,000 | — | |
| €9,000,000 – 10,000,000 | 2 | |
| €10,000,000 – 11,000,000 | — | |
| €11,000,000 – 12,000,000 | 1 | |
1 Table prepared in euros in accordance with Article 450 of the European Union Capital Requirements Regulation, using the exchange rates published by the European Commission for financial programming and budget for December of the reported year as published on its website.
Report of the Directors | Corporate governance report
| | | | | | | | | | | | | | | | | | | | | | | | | | | | | | | | |
| Information on remuneration of staff whose professional activities have a material impact on institutions’ risk profile (REM5) |
| Management body | Business areas | Total |
| Supervisory function | Management function | Total | Investment banking | Retail banking | Asset management | Corporate function | Independent internal control function | All other |
| Total number of identified staff | | | | | | | | | | 1,059.6 |
| Of which members of the Board | 14.0 | 2.0 | 16.0 | | | | | | | |
| Of which senior management | | | | 2.0 | 3.0 | — | 7.9 | 4.0 | 6.0 | |
| Of which other identified staff | | | | 504.5 | 162.0 | 30.0 | 110.6 | 142.6 | 71.0 | |
| Total remuneration of identified staff ($m) | 7.2 | | 22.0 | | 29.2 | | 741.3 | | 186.3 | | 39.7 | | 167.3 | | 118.7 | | 129.0 | | |
Of which variable remuneration ($m)1 | — | | 15.1 | | 15.1 | | 410.7 | | 87.5 | | 21.0 | | 82.8 | | 48.5 | | 63.3 | | |
| Of which fixed remuneration ($m) | 7.2 | | 6.9 | | 14.1 | | 330.6 | | 98.8 | | 18.7 | | 84.5 | | 70.2 | | 65.7 | | |
1 Variable pay awarded in respect of 2021. In accordance with shareholder approval received on 23 May 2014 (98% in favour), for each MRT the variable component of remuneration for any one year is limited to 200% of fixed component of the total remuneration.
Directors’ emoluments
The details of compensation paid to executive and non-executive Directors for the year ended 31 December 2021 are set out below.
| | | | | | | | | | | | | | | | | | | | |
| Emoluments | | | | | | |
| Noel Quinn | Ewen Stevenson | Non-executive Directors |
| 2021 | 2020 | 2021 | 2020 | 2021 | 2020 |
| £000 | £000 | £000 | £000 | £000 | £000 |
| Directors' base salary, allowances and benefits in kind | 3,283 | | 3,338 | | 1,933 | | 1,806 | | | |
| Non-executive Directors' fees and benefits in kind | | | | | 5,314 | | 5,309 | |
| Pension contributions | — | | — | | — | | — | | — | | — | |
Performance-related pay paid or receivable1 | 5,721 | | 4,517 | | 3,388 | | 2,568 | | — | | — | |
| Inducements to join paid or receivable | — | | — | | 754 | | 1,431 | | — | | — | |
| Compensation for loss of office | — | | — | | — | | — | | — | | — | |
| Notional return on deferred cash | 22 | | 17 | | — | | — | | — | | — | |
| Total | 9,026 | | 7,872 | | 6,075 | | 5,805 | | 5,314 | | 5,309 | |
| | | | | | |
| Total ($000) | 12,414 | | 10,097 | | 8,356 | | 7,446 | | 7,309 | | 7,063 |
1Includes the value of the deferred and LTI awards at grant.
The aggregate amount of Directors' emoluments (including both executive Directors and non-executive Directors) for the year ended 31 December 2021 was $28,079,057. As per our policy, benefits in kind may include, but are not limited to, the provision of medical insurance, income protection insurance, health assessment, life assurance, club membership, tax assistance, car benefit, travel assistance, provision of company owned-accommodation and relocation costs (including any tax due on these benefits, where applicable). Post-employment medical insurance benefit was provided to former Directors, including Douglas Flint valued at £6,477 ($8,909), Stuart Gulliver valued at £6,477 ($8,909), John Flint valued at £10,303 ($14,171), and Marc Moses valued at £15,310 ($21,058). Tax return support was also provided to John Flint £8,292 ($11,405), and Marc Moses £2,500 ($3,439). The total aggregate value of benefits provided to former executive Directors was £49,359 ($67,891). The aggregate value of Director retirement benefits for current Directors is nil. Amounts are converted into US dollars based on the average year-to-date exchange rates for the respective year.
There were payments under retirement benefit arrangements with two former Directors of $435,131. The provision at 31 December 2021 in respect of unfunded pension obligations to former Directors amounted to $8,162,646. This relates to unfunded unapproved retirement benefits schemes.
Emoluments of senior management and five highest paid employees
The following tables set out the details of emoluments paid to senior management, which in this case comprises executive Directors and members of the Group Executive Committee, for the year ended 31 December 2021, or for the period of appointment in 2021 as a Director or member of the Group Executive Committee. Details of the remuneration paid to the five highest paid employees, comprising one executive Director and four Group Executives, for the year ended 31 December 2021, are also presented.
| | | | | | | | |
| Emoluments | |
| £000s | Five highest paid employees | Senior management |
| Basic salaries, allowances and benefits in kind | 13,070 | | 37,816 | |
| Pension contributions | 22 | | 303 | |
Performance-related pay paid or receivable1 | 21,870 | | 54,033 | |
| Inducements to join paid or receivable | 6,388 | | 7,039 | |
| Compensation for loss of office | — | | — | |
| Total | 41,350 | | 99,191 | |
| Total ($000) | 56,873 | | 136,428 | |
1Includes the value of deferred shares awards at grant.
| | | | | | | | | | | |
| Emoluments by bands |
| Hong Kong dollars | US dollars | Number of highest paid employees | Number of senior management |
| $0 – $1,000,000 | $0 – $128,652 | — | | 1 | |
| $5,000,001 – $5,500,000 | $643,262 – $707,588 | — | | 1 | |
| $6,000,001 – $6,500,000 | $771,915 – $836,241 | — | | 1 | |
| $12,500,001 – $13,000,000 | $1,608,156 – $1,672,482 | — | | 1 | |
| $14,000,001 – $14,500,000 | $1,801,134 – $1,865,461 | — | | 1 | |
| $19,000,001 – $19,500,000 | $2,444,397 – $2,508,723 | — | | 1 | |
| $24,500,001 – $25,000,000 | $3,151,985 – $3,216,311 | — | | 1 | |
| $25,500,001 – $26,000,000 | $3,280,638 – $3,344,964 | — | | 1 | |
| $26,500,001 – $27,000,000 | $3,409,290 – $3,473,616 | — | | 2 | |
| $27,500,001 – $28,000,000 | $3,537,943 – $3,602,269 | — | | 1 | |
| $38,000,001 – $38,500,000 | $4,888,793 – $4,953,119 | — | | 1 | |
| $39,500,001 – $40,000,000 | $5,081,772 – $5,146,098 | — | | 1 | |
| $40,000,001 – $40,500,000 | $5,146,098 – $5,210,424 | — | | 1 | |
| $41,500,001 – $42,000,000 | $5,339,077 – $5,403,403 | — | | 1 | |
| $42,000,001 – $42,500,000 | $5,403,403 – $5,467,729 | — | | 1 | |
| $45,500,001 – $46,000,000 | $5,853,687 – $5,918,013 | — | | 1 | |
| $56,500,001 – $57,000,000 | $7,268,864 – $7,333,190 | — | | 1 | |
| $58,000,001 – $58,500,000 | $7,461,842 – $7,526,168 | — | | 1 | |
| $65,500,001 – $66,000,000 | $8,426,736 – $8,491,062 | — | | 1 | |
| $68,000,001 – $68,500,000 | $8,748,367 – $8,812,693 | 1 | | 1 | |
| $76,500,001 – $77,000,000 | $9,841,913 – $9,906,239 | 1 | | 1 | |
| $77,500,001 – $78,000,000 | $9,970,565 – $10,034,891 | 1 | | 1 | |
| $96,000,001 – $96,500,000 | $12,350,636 – $12,414,962 | 1 | | 1 | |
| $122,500,001 – $123,000,000 | $15,759,926 – $15,824,252 | 1 | | 1 | |
| | |
| Share capital and other related disclosures |
Share buy-back programme
On 26 October 2021, HSBC Holdings commenced a share buy-back to purchase its ordinary shares of $0.50 each up to a maximum consideration of $2.0bn. This programme will end no later than 20 April 2022. The purpose of the programme is to reduce HSBC’s number of outstanding ordinary shares. As at
31 December 2021, 120,366,714 ordinary shares had been purchased and cancelled representing a nominal value of $60,183,357 and an aggregate consideration paid by HSBC of £524,301,527. The shares cancelled represented 0.58% of the shares in issue and 0.59% of the shares in issue, excluding treasury shares.
The table that follows outlines details of the shares purchased and cancelled on a monthly basis during 2021.
| | | | | | | | | | | | | | | | | |
| Number
of shares | Highest price
paid per share | Lowest price
paid per share | Average price paid per share | Aggregate
price paid |
| Month | | £ | £ | £ | £ |
| Share buy-back of 2021 | | | | | |
| Oct-21 | 5,260,011 | | 4.4800 | 4.4155 | 4.4553 | 23,435,159 |
| Nov-21 | 67,010,270 | | 4.4750 | 4.1525 | 4.3602 | 292,178,124 |
| Dec-21 | 48,096,433 | | 4.5280 | 4.0990 | 4.3390 | 208,688,243 |
| 120,366,714 | | | | | 524,301,527 |
Dividends
Dividends for 2021
An interim dividend of $0.07 for the 2021 half-year was paid on 30 September 2021. For further details of the dividends approved in 2021, see Note 8 on the financial statements.
On 22 February 2022, the Directors approved a second interim dividend for 2021 of $0.18 per ordinary share, making a total of $0.25 for the 2021 full year. The second interim dividend for 2021 will be payable on 28 April 2022 in cash in US dollars, or in sterling or Hong Kong dollars at exchange rates to be determined on 19 April 2022. As the second interim dividend for 2021 was approved after 31 December 2021, it has not been included in the balance sheet of HSBC as a liability. The distributable reserves of HSBC Holdings at 31 December 2021 were $32.2bn.
A quarterly dividend of £0.01 per Series A sterling preference share was paid on 15 March, 15 June, 15 September and 15 December 2021. The Series A dollar preference shares were redeemed on 13 January 2021.
Dividends for 2022
The Group has reviewed whether it will revert to paying quarterly dividends and is currently not intending to pay quarterly dividends during 2022. The Group will continue to review whether to revert to paying quarterly dividends in future years, and a further update
will be given at or ahead of the 2022 results announcement in February 2023.
A dividend of £0.01 per Series A sterling preference share was approved on 22 February 2022 for payment on 15 March 2022.
Share capital
Issued share capital
The nominal value of HSBC Holdings’ issued share capital paid up at 31 December 2021 was $10,315,760,219.50 divided into 20,631,520,439 ordinary shares of $0.50 each and one non-cumulative preference share of £0.01, representing approximately 100.00% and 0.00% respectively of the nominal value of HSBC Holdings’ total issued share capital paid up at 31 December 2021. The 1,450,000 non-cumulative preference shares of $0.01 each were redeemed on 13 January 2021.
Rights, obligations and restrictions attaching to shares
The rights and obligations attaching to each class of ordinary and non-cumulative preference shares in our share capital are set out in full in our Articles of Association. The Articles of Association may be amended by special resolution of the shareholders and can be found on our website at www.hsbc.com/who-we-are/leadership-and-governance/board-responsibilities.
Report of the Directors | Corporate governance report
Ordinary shares
HSBC Holdings has one class of ordinary share, which carries no right to fixed income. There are no voting restrictions on the issued ordinary shares, all of which are fully paid. On a show of hands, each member present has the right to one vote at general meetings. On a poll, each member present or voting by proxy is entitled to one vote for every $0.50 nominal value of share capital held.
There are no specific restrictions on transfers of ordinary shares, which are governed by the general provisions of the Articles of Association and prevailing legislation.
Information on the policy adopted by the Board for paying interim dividends on the ordinary shares may be found in the 'Shareholder information' section on page 425.
Dividend waivers
HSBC Holdings' employee benefit trusts, which hold shares in HSBC Holdings in connection with the operation of its share plans, have lodged standing instructions to waive dividends on shares held by them that have not been allocated to employees. Shares held by custodians in connection with the vesting of employee share awards also lodged instructions to waive dividends. The total amount of dividends waived during 2021 was $6.8m.
Preference shares
The preference shares, which have preferential rights to income and capital, do not, in general, confer a right to attend and vote at general meetings.
There are three classes of preference shares in the share capital of
HSBC Holdings: non-cumulative US dollar preference shares of $0.01 each (‘dollar preference shares’); non-cumulative preference shares of £0.01 each (‘sterling preference shares’); and non-cumulative preference shares of €0.01 (‘euro preference shares’).
The sterling preference share in issue is a Series A sterling preference share. There are no dollar preference shares or euro preference shares in issue.
Information on dividends approved for 2020 and 2021 may be found in Note 8 on the financial statements on page 368.
Further details of the rights and obligations attaching to the HSBC Holdings’ issued share capital may be found in Note 31 on the financial statements.
Compliance with Hong Kong Listing Rule 13.25A(2)
HSBC Holdings has been granted a waiver from strict compliance with Rule 13.25A(2) of the Rules Governing the Listing of Securities on the Stock Exchange of Hong Kong.
Under this waiver, HSBC’s obligation to file a Next Day Return following the issue of new shares, pursuant to the vesting of share awards granted under its share plans to persons who are not Directors, would only be triggered where it falls within one of the circumstances set out under Rule 13.25A(3).
Share capital changes in 2021
The following events occurred during the year in relation to the ordinary share capital of HSBC Holdings:
Scrip dividends
There were no scrip dividends issued during the year.
| | | | | | | | | | | | | | | |
| All-employee share plans |
| Number | Aggregate
nominal value | | Exercise price |
| from | to |
| | $ | | £ | £ |
| HSBC Holdings Savings-Related Share Option Plan (UK) | | | | | |
| HSBC ordinary shares issued in £ | 3,197,834 | | 1,598,917 | | | 2.627 | | 4.4037 | |
| Options over HSBC ordinary shares lapsed | 19,287,652 | | 9,643,826 | | | | |
| Options over HSBC ordinary shares granted in response to approximately 11,183 applications from HSBC employees in the UK on 22 September 2021 | 15,410,381 | | 7,705,191 | | | | |
|
| HSBC Holdings
ordinary shares issued | Aggregate
nominal value | | Market value per share |
| | from | to |
| | $ | | £ | £ |
| HSBC International Employee Share Purchase Plan | 283,004 | | 141,502 | | | 3.5975 | | 4.4995 | |
| | | | | |
| | | | | | | | | | | | | | |
| HSBC share plans |
| HSBC Holdings
ordinary shares issued | Aggregate
nominal value | Market value per share |
| from | to |
| | $ | £ | £ |
| Vesting of awards under the HSBC Share Plan 2011 | 54,785,215 | | 27,392,608 | | 4.052 | | 4.555 | |
Authorities to allot and to purchase shares and
pre-emption rights
At the AGM in 2021, shareholders renewed the general authority for the Directors to allot new shares up to 13,615,199,500 ordinary shares, 15,000,000 non-cumulative preference shares of £0.01 each, 15,000,000 non-cumulative preference shares of $0.01 each and 15,000,000 non-cumulative preference shares of €0.01 each. Shareholders also renewed the authority for the Directors to make market purchases of up to 2,042,279,925 ordinary shares. The Directors exercised this authority during the year and purchased 120,366,714 ordinary shares.
In addition, shareholders gave authority for the Directors to grant rights to subscribe for, or to convert any security into, no more than 4,084,559,850 ordinary shares in relation to any issue by HSBC Holdings or any member of the Group of contingent convertible securities that automatically convert into or are exchanged for ordinary shares in HSBC Holdings in prescribed circumstances. For further details on the issue of contingent convertible securities, see Note 31 on the financial statements.
Other than as disclosed in the tables above headed ‘Share capital changes in 2021’, the Directors did not allot any shares during 2020.
Debt securities
In 2021, HSBC Holdings issued the equivalent of $19.34bn of debt securities in the public capital markets in a range of currencies and maturities in the form of senior securities to ensure it meets the current and proposed regulatory rules, including those relating to the availability of adequate total loss-absorbing capacity. For details of capital instruments and subordinated bail-inable debt, see Notes 28 and 31 on pages 398 and 407.
Treasury shares
In accordance with the terms of a waiver granted by the Hong Kong Stock Exchange on 19 December 2005, HSBC Holdings will comply with the applicable law and regulation in the UK in relation to the holding of any shares in treasury and with the conditions of the waiver in connection with any shares it may hold in treasury. At 31 December 2021, pursuant to Chapter 6 of the UK Companies Act 2006, 325,273,407 ordinary shares were held in treasury. This was the maximum number of shares held at any
time during 2021, representing 1.58% of the shares in issue as at 31 December 2021. The nominal value of shares held in treasury was $162,636,704.
Notifiable interests in share capital
During 2021, HSBC Holdings did not receive any notification of major holdings of voting rights pursuant to the requirements of Rule 5 of the Disclosure, Guidance and Transparency Rules. No further notifications had been received between 31 December 2021 and 11 February 2022. Previous notifications received are as follows:
•BlackRock, Inc. gave notice on 3 March 2020 that on
2 March 2020 it had the following: an indirect interest in HSBC Holdings ordinary shares of 1,235,558,490; qualifying financial instruments with 7,294,459 voting rights that may be acquired if the instruments are exercised or converted; and financial instruments with a similar economic effect to qualifying financial instruments, which refer to 2,441,397 voting rights, representing 6.07%, 0.03% and 0.01%, respectively, of the total voting rights at 2 March 2020.
•Ping An Asset Management Co., Ltd. gave notice on 6 December 2017 that on 4 December 2017 it had an indirect interest in HSBC Holdings ordinary shares of 1,007,946,172, representing 5.04% of the total voting rights at that date.
At 31 December 2021, according to the register maintained by HSBC Holdings pursuant to section 336 of the Securities and Futures Ordinance of Hong Kong:
•BlackRock, Inc. gave notice on 1 September 2020 that on
27 August 2020 it had the following interests in HSBC Holdings ordinary shares: a long position of 1,477,023,361 shares and a short position of 38,760,188 shares, representing 7.14% and 0.19%, respectively, of the ordinary shares in issue at that date.
•Ping An Asset Management Co., Ltd., gave notice on
25 September 2020 that on 23 September 2020 it had a long position of 1,655,479,531 in HSBC Holdings ordinary shares, representing 8.00% of the ordinary shares in issue at that date.
On 8 February 2022, pursuant to section 324 of Part XV of the
Securities and Futures Ordinance of Hong Kong, BlackRock, Inc. gave notice that on 3 February 2022 it had the following interests in HSBC Holdings ordinary shares: a long position of 1,638,892,657 shares and a short position of 13,731,141 shares, representing 7.96% and 0.07%, respectively, of the ordinary shares in issue at that date.
Sufficiency of float
In compliance with the Rules Governing the Listing of Securities on The Stock Exchange of Hong Kong Limited, at least 25% of the total issued share capital has been held by the public at all times during 2021 and up to the date of this report.
Dealings in HSBC Holdings listed securities
The Group has policies and procedures that, except where permitted by statute and regulation, prohibit specified transactions in respect of its securities listed on The Stock Exchange of Hong Kong Limited. Except for dealings as intermediaries or as trustees by subsidiaries of HSBC Holdings, neither HSBC Holdings nor any of its subsidiaries has purchased, sold or redeemed any of its securities listed on The Stock Exchange of Hong Kong Limited during the year ended 31 December 2021.
Directors’ interests
Pursuant to the requirements of the UK Listing Rules and according to the register of Directors’ interests maintained by HSBC Holdings pursuant to section 352 of the Securities and Futures Ordinance of Hong Kong, the Directors of HSBC Holdings at 31 December 2021 had certain interests, all beneficial unless otherwise stated, in the shares or debentures of HSBC Holdings and its associated corporations.
Save as stated in the following table, no further interests were held by Directors, and no Directors or their connected persons were awarded or exercised any right to subscribe for any shares or debentures in any HSBC corporation during the year.
No Directors held any short position as defined in the Securities and Futures Ordinance of Hong Kong in the shares or debentures of HSBC Holdings and its associated corporations.
| | | | | | | | | | | | | | | | | | | | |
| Directors’ interests – shares and debentures |
| | At 31 Dec 2021 or date of cessation, if earlier |
| At 1 Jan 2021, or
date of appointment,
if later | Beneficial
owner | Child
under 18
or spouse | Jointly with
another
person | Trustee | Total
interests |
| HSBC Holdings ordinary shares | | | | | | |
| | | | | | |
| Laura Cha (retired on 28 May 2021) | 16,200 | | 16,200 | | — | | — | | — | | 16,200 | |
| Henri de Castries (retired on 28 May 2021) | 19,251 | | 19,251 | | — | | — | | — | | 19,251 | |
| Rachel Duan (appointed to the Board on 1 Sep 2021) | — | | — | | — | | — | | — | | — | |
| Dame Carolyn Fairbairn (appointed to the Board on 1 Sep 2021) | — | | — | | — | | — | | — | | — | |
James Forese1 | 115,000 | | 115,000 | | — | | — | | — | | 115,000 | |
Steven Guggenheimer1 | 15,000 | | — | | — | | 15,000 | | — | | 15,000 | |
| Irene Lee | 11,904 | | 15,000 | | — | | — | | — | | 15,000 | |
| | | | | | |
José Antonio Meade Kuribreña1 | 15,000 | | 15,000 | | — | | — | | — | | 15,000 | |
Heidi Miller1 (retired on 28 May 2021) | 15,700 | | 15,700 | | — | | — | | — | | 15,700 | |
Eileen Murray1 | 75,000 | | 75,000 | | — | | — | | — | | 75,000 | |
| David Nish | 50,000 | | — | | 50,000 | | — | | — | | 50,000 | |
Noel Quinn2 | 778,958 | | 1,131,278 | | — | | — | | — | | 1,131,278 | |
Ewen Stevenson2 | 545,731 | | 838,154 | | — | | — | | — | | 838,154 | |
| | | | | | |
Jackson Tai1,3 | 66,515 | | 32,800 | | 11,965 | | 21,750 | | — | | 66,515 | |
| Mark Tucker | 307,352 | | 307,352 | | — | | — | | — | | 307,352 | |
| Pauline van der Meer Mohr | 15,000 | | 15,000 | | — | | — | | — | | 15,000 | |
1James Forese has an interest in 23,000, Steven Guggenheimer has an interest in 3,000, José Antonio Meade Kuribreña has an interest in 3,000, Heidi Miller has an interest in 3,140, Eileen Murray has an interest in 15,000 and Jackson Tai has an interest in 13,303 listed American Depositary Shares ('ADS'), which are categorised as equity derivatives under Part XV of the Securities and Futures Ordinance of Hong Kong. Each ADS represents five HSBC Holdings ordinary shares.
2 Executive Directors’ other interests in HSBC Holdings ordinary shares arising from the HSBC Holdings Savings-Related Share Option Plan (UK) and the HSBC Share Plan 2011 are set out in the Scheme interests in the Directors’ remuneration report on page 290. At 31 December 2021, the aggregate interests under the Securities and Futures Ordinance of Hong Kong in HSBC Holdings ordinary shares, including interests arising through employee share plans and the interests above were: Noel Quinn – 2,731,466; and Ewen Stevenson – 2,458,851. Each Director’s total interests represents approximately 0.01% of the shares in issue and 0.01% of the shares in issue excluding treasury shares.
3 Jackson Tai has a non-beneficial interest in 11,965 shares of which he is custodian.
Report of the Directors | Corporate governance report
There have been no changes in the shares or debentures of the current Directors from 31 December 2021 to the date of this report.
Listing Rule 9.8.4 and other disclosures
This section of the Form 20-F forms part of and includes certain disclosures required in the Report of the Directors incorporated by cross-reference, including under Listing Rule 9.8.4 and otherwise as applicable by law.
| | | | | |
| Content | Page references |
| Long-term incentives | 307 |
| Dividend waivers | 323 |
| Dividends | 323 |
| Share buy-back | 24, 323 |
| Emissions | 46 |
| Energy efficiency | 46, 53, 55 |
| |
| Principal activities of HSBC | 13, 30, 99, 390 |
| Business review and future developments | 12–41, 43, 146, 171, 416 |
Directors’ governance
Appointment and re-election
A rigorous selection process is followed for the appointment of Directors. Appointments are made on merit and candidates are considered against objective criteria, having regard to the benefits of a diverse Board. Appointments are made in accordance with HSBC Holdings' Articles of Association. The Nomination & Corporate Governance Committee report sets out further details of the Board selection process. The number of Directors (other than any alternate Directors) must not be fewer than five nor exceed 25.
The Board may at any time appoint any person as a Director, either to fill a vacancy or as an addition to the existing Board. The Board may appoint any Director to hold any employment or executive office, and may revoke or terminate any such appointment.
Non-executive Directors are appointed for an initial three-year term and, subject to continued satisfactory performance based upon an assessment by the Group Chairman and the Nomination & Corporate Governance Committee, are proposed for re-election by shareholders at each AGM. They typically serve two three-year terms. The Board may invite a Director to serve additional periods but any term beyond six years is subject to review with an explanation to be provided in the Annual Report and Accounts.
Shareholders vote at each AGM on whether to elect and re-elect individual Directors. All Directors that stood for election and re-election at the 2021 AGM were elected and re-elected by shareholders.
None of the Directors who retired during the year or who are not offering themselves for re-election at the 2022 AGM have raised concerns about the operation of the Board or the management of the company.
No executive Director is involved in deciding their own remuneration outcome.
Commitments
The terms and conditions of the appointments of non-executive Directors are set out in a letter of appointment, which includes the expectations of them and the estimated time required to perform their role. Letters of appointment of each non-executive Director are available for inspection at the registered office of HSBC Holdings. The anticipated time commitment for non-executive Directors serving on the Board and as a member of any committees is no more than 75 days per annum. Directors who in addition chair a large committee should expect to commit up to 100 days per annum. Any additional time commitment connected with Board-related appointments will be confirmed separately.
Board approval is required for any non-executive Directors’ external commitments, with consideration given to time commitments and conflicts of interest.
Conflicts of interest
The Board has an established policy and set of procedures to ensure that the Board’s management of the Directors’ conflicts of
interest policy operates effectively. The Board has the power to authorise conflicts where they arise, in accordance with the Companies Act 2006 and HSBC Holdings' Articles of Association. Details of all Directors’ conflicts of interest are recorded in the register of conflicts, which is maintained by the Group Company Secretary and Chief Governance Officer's office. The Board agreed for 2022 onwards that the conflicts register be reviewed annually by the Board and quarterly by the Nomination & Corporate Governance Committee. Upon appointment, new Directors are advised of the policy and procedures for managing conflicts. Directors are required to notify the Board of any actual or potential conflicts of interest and to update the Board with any changes to the facts and circumstances surrounding such conflicts. Directors are requested to review and confirm their own and their respective closely associated persons' outside interests and appointments twice a year. The Board has considered, and authorised (with or without conditions) where appropriate, potential conflicts as they have arisen during the year in accordance with the said policy and procedures. All non-executive Directors are re-vetted by the compliance team every three years from appointment and as part of such process all conflicts checks are refreshed.
Directors' indemnity
The Articles of Association of HSBC Holdings contain a qualifying third-party indemnity provision, which entitles Directors and other officers to be indemnified out of the assets of HSBC Holdings against claims from third parties in respect of certain liabilities.
HSBC Holdings has granted, by way of deed poll, indemnities to the Directors, including former Directors, against certain liabilities arising in connection with their position as a Director of HSBC Holdings or of any Group company. Directors are indemnified to the maximum extent permitted by law.
The indemnities that constitute a 'qualifying third-party indemnity provision', as defined by section 234 of the Companies Act 2006, remained in force for the whole of the financial year (or, in the case of Directors appointed during 2021, from the date of their appointment). The deed poll is available for inspection at the registered office of HSBC Holdings.
Additionally, Directors have the benefit of Directors’ and officers’ liability insurance.
Qualifying pension scheme indemnities have also been granted to the Trustees of the Group's pension schemes, which were in force for the whole of the financial year and remain in force as at the date of this report.
Contracts of significance
During 2021, none of the Directors had a material interest, directly or indirectly, in any contract of significance with any HSBC company. During the year, all Directors were reminded of their obligations in respect of transacting in HSBC securities and following specific enquiry all Directors have confirmed that they have complied with their obligations.
Shareholder engagement
The Board is directly accountable to, and gives high priority to communicating with, HSBC’s shareholders. Information about HSBC and its activities is provided to shareholders in its Interim Reports and the Annual Report and Accounts as well as on www.hsbc.com.
To complement regular publications, there is continual dialogue between members of the Board and institutional investors throughout the year. For examples of such engagement see the Group Chairman's governance statement on page 254 and the Remuneration Committee Chair's letter on page 290.
Directors are encouraged to develop an understanding of the views of shareholders. Enquiries from individuals on matters relating to their shareholdings and HSBC’s business are welcomed.
Any individual or institutional investor can make an enquiry by contacting the investor relations team, Group Chairman, Group Chief Executive, Group Chief Financial Officer and Group Company Secretary and Chief Governance Officer. Our Senior Independent Director is also available to shareholders if they have concerns that
cannot be resolved or for which the normal channels would not be appropriate. He can be contacted via the Group Company Secretary and Chief Governance Officer at 8 Canada Square, London E14 5HQ.
Annual General Meeting
The AGM in 2022 is planned to be held in London at 11:00am on Friday, 29 April 2022. Information on how to participate, both in advance and on the day, can be found in the Notice of the 2022 AGM, which will be sent to shareholders on 25 March 2022 and be available on www.hsbc.com/agm. A live webcast will be available on www.hsbc.com. A recording of the proceedings will be available on www.hsbc.com shortly after the conclusion of the AGM. Due to the current environment, these arrangements may change. Shareholders should monitor our website and announcements for any updates. Shareholders may send enquiries to the Board in writing via the Group Company Secretary and Chief Governance Officer, HSBC Holdings plc, 8 Canada Square, London E14 5HQ or by sending an email to shareholderquestions@hsbc.com.
General meetings and resolutions
Shareholders may require the Directors to call a general meeting other than an AGM, as provided by the UK Companies Act 2006. A valid request to call a general meeting may be made by members representing at least 5% of the paid-up capital of HSBC Holdings as carries the right of voting at its general meetings (excluding any paid-up capital held as treasury shares). A request must state the general nature of the business to be dealt with at the meeting and may include the text of a resolution that may properly be moved and is intended to be moved at the meeting. At any general meeting convened on such request, no business may be transacted except that stated by the requisition or proposed by the Board.
Shareholders may request the Directors to send a resolution to shareholders for consideration at an AGM, as provided by the UK Companies Act 2006. A valid request must be made by
(i) members representing at least 5% of the paid-up capital of HSBC Holdings as carries the right of voting at its general meetings (excluding any paid-up capital held as treasury shares), or (ii) at least 100 members who have a right to vote on the resolution at the AGM in question and hold shares in HSBC Holdings on which there has been paid up an average sum, per member, of at least £100.
The request must be received by the company not later than (i) six weeks before the AGM in question; or (ii) if later, the time at which the notice of AGM is published.
A request may be in hard copy form or in electronic form, and must be authenticated by the person or persons making it. A request may be made in writing to HSBC Holdings at its UK address, referred to in the paragraph above or by sending an email to shareholderquestions@hsbc.com.
Events after the balance sheet date
For details of events after the balance sheet date, see Note 37 on the financial statements.
Change of control
The Group is not party to any significant agreements that take effect, alter or terminate following a change of control of the Group. The Group does not have agreements with any Director or employee that would provide compensation for loss of office or employment resulting from a takeover bid.
Branches
The Group provides a wide range of banking and financial services through branches and offices in the UK and overseas.
Research and development activities
During the ordinary course of business the Group develops new products and services within the global businesses.
Political donations
HSBC does not make any political donations or incur political expenditure within the ordinary meaning of those words. We have
no intention of altering this policy. However, the definitions of political donations, political parties, political organisations and political expenditure used in the UK Companies Act 2006 are very wide. As a result, they may cover routine activities that form part of the normal business activities of the Group and are an accepted part of engaging with stakeholders. To ensure that neither the Group nor any of its subsidiaries inadvertently breaches the UK Companies Act 2006, authority is sought from shareholders at the AGM to make political donations.
HSBC provides administrative support to two political action committees ('PACs') in the US funded by voluntary political contributions by eligible employees. We do not control the PACs, and all decisions regarding the amounts and recipients of contributions are directed by the respective steering committee of each PAC, which are comprised of eligible employees. The PACs recorded combined political donations of $15,500 during 2021 (2020: $100,750).
Charitable contributions
For details of charitable contributions, see page 77.
The Board is responsible for maintaining and reviewing the effectiveness of risk management and internal control systems, and for determining the level and type of risks the Group is willing to take in achieving its strategic objectives.
To meet this requirement and to discharge its obligations under the FCA Handbook and the PRA Handbook, procedures have been designed: for safeguarding assets against unauthorised use or disposal; for maintaining proper accounting records; and for ensuring the reliability and usefulness of financial information used within the business or for publication.
These procedures provide reasonable assurance against material misstatement, errors, losses or fraud. They are designed to provide effective internal control within the Group and accord with the Financial Reporting Council‘s guidance for Directors issued in 2014, on risk management, internal control and related financial and business reporting. The procedures have been in place throughout the year and up to 22 February 2022, the date of approval of the Annual Report and Accounts 2021.
The key risk management and internal control procedures include the following:
Global principles
The Group's Global Principles set an overarching standard for all other policies and procedures and are fundamental to the Group’s risk management structure. They inform and connect our purpose, values, strategy and risk management principles, guiding us to do the right thing and treat our customers and our colleagues fairly at all times.
Risk management framework
The risk management framework supports our Global Principles. It outlines the key principles and practices that we employ in managing material risks. It applies to all categories of risk and supports a consistent approach in identifying, assessing, managing and reporting the risks we accept and incur in our activities.
Delegation of authority within limits set by the Board
Subject to certain matters reserved for the Board, the Group Chief Executive has been delegated authority limits and powers within which to manage the day-to-day affairs of the Group, including the right to sub-delegate those limits and powers. Each relevant Group Executive Committee member or executive Director has delegated authority within which to manage the day-to-day affairs of the business or function for which he or she is accountable.
Delegation of authority from the Board requires those individuals to maintain a clear and appropriate apportionment of significant responsibilities and to oversee the establishment and maintenance of systems of control that are appropriate to their business or function. Authorities to enter into credit and market risk exposures
Report of the Directors | Corporate governance report
are delegated with limits to line management of Group companies. However, credit proposals with specified higher-risk characteristics require the concurrence of the appropriate global function. Credit and market risks are measured and reported at subsidiary company level and aggregated for risk concentration analysis on a Group-wide basis.
Risk identification and monitoring
Systems and procedures are in place to identify, assess, control and monitor the material risk types facing HSBC as set out in the risk management framework. The Group‘s risk measurement and reporting systems are designed to help ensure that material risks are captured with all the attributes necessary to support well-founded decisions, that those attributes are accurately assessed and that information is delivered in a timely manner for those risks to be successfully managed and mitigated.
Changes in market conditions/practices
Processes are in place to identify new risks arising from changes in market conditions/practices or customer behaviours, which could expose the Group to heightened risk of loss or reputational damage. The Group employs a top and emerging risks framework, which contains an aggregate of all current and forward-looking risks and enables it to take action that either prevents them materialising or limits their impact.
During 2021 due to the prolonged impact of the Covid-19 pandemic on the global economy, banks continued to play an expanded role to support society and customers. The pandemic and its impact on the global economy have impacted many of our customers’ business models and income, requiring significant levels of support from both governments and banks.
To meet the additional challenges, we supplemented our existing approach to risk management with additional tools and practices and these continue to be in place. We continue our focus on the quality and timeliness of the data used to inform management decisions, through measures such as early warning indicators, prudent active risk management of our risk appetite, and ensuring regular communication with our Board and other key stakeholders.
Responsibility for risk management
All employees are responsible for identifying and managing risk within the scope of their role as part of the three lines of defence model. This is an activity-based model to delineate management accountabilities and responsibilities for risk management and the control environment. The second line of defence sets the policy and guidelines for managing specific risk areas, provides advice and guidance in relation to the risk, and challenges the first line of defence (the risk owners) on effective risk management.
The Board delegated authority to the Group Audit Committee ('GAC') and it reviewed the independence, autonomy and effectiveness of the Group's policies and procedures on whistleblowing, including the procedures for the protection of staff who raise concerns of detrimental treatment.
Strategic plans
Strategic plans are prepared for global businesses, global functions and geographical regions within the framework of the Group’s overall strategy. Financial resource plans, informed by detailed analysis of risk appetite describing the types and quantum of risk that the Group is prepared to take in executing its strategy, are prepared and adopted by all major Group operating companies and set out the key business initiatives and the likely financial effects of those initiatives.
The effectiveness of the Group’s system of risk management and internal control is reviewed regularly by the Board, the GRC and the GAC.
During 2021, the Group continued to focus on operational resilience and invest in the non-financial risk infrastructure. There was a particular focus on material and emerging risks and areas undergoing strategic growth.
The GRC and the GAC received confirmation that executive management has taken or is taking the necessary actions to
remedy any failings or weaknesses identified through the operation of the Group's framework of controls. In response to the prolonged Covid-19 pandemic, our business continuity responses have been successfully implemented and the majority of service level agreements continue to be maintained.
Internal control over financial reporting
HSBC is required to comply with section 404 of the US Sarbanes-Oxley Act of 2002 and assess its effectiveness of internal control over financial reporting at 31 December 2021. In 2014, the GAC endorsed the adoption of the COSO 2013 framework for the monitoring of risk management and internal control systems to satisfy the requirements of section 404 of the Sarbanes-Oxley Act.
The key risk management and internal control procedures over financial reporting include the following:
Entity level controls
The primary mechanism through which comfort over risk management and internal control systems is achieved is through assessments of the effectiveness of controls to manage risk, and the reporting of issues on a regular basis through the various risk management and risk governance forums. Entity level controls are a defined suite of internal controls that have a pervasive influence over the entity as a whole and meet the principles of the Committee of Sponsoring Organizations of the Treadway Commission ('COSO') framework. They include controls related to the control environment, such as the Group's values and ethics, the promotion of effective risk management and the overarching governance exercised by the Board and its non-executive committees. The design and operational effectiveness of entity level controls are assessed annually as part of the assessment of the effectiveness of internal controls over financial reporting. If issues are significant to the Group, they are escalated to the GRC and also to the GAC, if concerning financial reporting matters.
Process level transactional controls
Key process level controls that mitigate the risk of financial misstatement are identified, recorded and monitored in accordance with the risk framework. This includes the identification and assessment of relevant control issues against which action plans are tracked through to remediation. Further details on HSBC’s approach to risk management can be found on page 145. The GAC has continued to receive regular updates on HSBC’s ongoing activities for improving the effective oversight of end-to-end business processes, and management continued to identify opportunities for enhancing key controls, such as through the use of automation technologies.
Financial reporting
The Group’s financial reporting process is controlled using documented accounting policies and reporting formats, supported by detailed instructions and guidance on reporting requirements, issued to all reporting entities within the Group in advance of each reporting period end. The submission of financial information from each reporting entity is supported by a certification by the responsible financial officer and analytical review procedures at reporting entity and Group levels.
Disclosure Committee
Chaired by the Group Chief Financial Officer, the Disclosure Committee supports the discharge of the Group’s obligations under relevant legislation and regulation including the UK and Hong Kong listing rules, the UK Market Abuse Regulation and US Securities and Exchange Commission rules. In so doing, the Disclosure Committee is empowered to determine whether a new event or circumstance should be disclosed, including the form and timing of such disclosure, and review certain material disclosures made or to be made by the Group. The membership of the Disclosure Committee consists of senior management, including the Group Chief Financial Officer, Group Chief Legal Officer and Group Company Secretary and Chief Governance Officer. The Group's brokers, external auditors and its external legal counsel also attend as required. The integrity of disclosures is underpinned by structures and processes within the Global Finance and Global Risk and Compliance functions that support rigorous analytical
review of financial reporting and the maintenance of proper accounting records. As required by the Sarbanes-Oxley Act, the Group Chief Executive and the Group Chief Financial Officer have certified that the Group's disclosure controls and procedures were effective as at the end of the period covered by the Annual Report and Accounts 2021.
The annual review of the effectiveness of the Group's system of risk management and internal control over financial reporting was conducted with reference to the COSO 2013 framework. Based on the assessment performed, the Directors concluded that for the year ended 31 December 2021, the Group's internal control over financial reporting was effective.
PwC has audited the effectiveness of HSBC's internal control over financial reporting and has given an unqualified opinion.
The Directors considered it appropriate to prepare the financial statements on a going concern basis.
In making the going concern assessment, the Directors have considered a wide range of detailed information relating to present and potential conditions, including projections for profitability, cash flows, capital requirements and capital resources.
In carrying out their assessment of the principal risks (as detailed on page 148 of the Form 20-F for the year ended 31 December 2021), the Directors considered a wide range of information including:
•details of the Group’s business and operating models, and strategy;
•details of the Group’s approach to managing risk and allocating capital;
•a summary of the Group’s financial performance, its ability to maintain minimum levels of regulatory capital, liquidity funding and the minimum requirement for own funds and eligible liabilities over the period of assessment. Notable are the risks which the Directors believe could cause the Group's future results or operations to adversely impact any of the above;
•enterprise risk reports, including the Group’s risk appetite profile (see page 145 of the Form 20-F for the year ended 31 December 2021) and top and emerging risks (see page 148 of the Form 20-F for the year ended 31 December 2021);
•the impact on the Group due to the Covid-19 pandemic, including the emergence of the Delta and Omicron variants; recent instability in China's commercial real estate sector; and strained economic and diplomatic tensions between China and the US, the UK, the EU and other countries;
•reports and updates regarding regulatory and internal stress testing. During 2021, the Bank of England ('BoE') mandated an industry wide solvency stress test exercise which incorporated a ‘double dip’ scenario and represented an intensification of the macroeconomic shocks seen in 2020. The outcomes of the stress test showed that taking account of strategic management actions, the Group would remain adequately capitalised;
•the results of our 2021 climate stress testing and scenario analysis exercise. No issues were identified around the going concern status of the Group. Further details of the insights from the 2021 climate stress test are explained on page 149 of the Form 20-F for the year ended 31 December 2021;
•reports and updates from management on risk-related issues selected for in-depth consideration;
•reports and updates on regulatory developments;
•legal proceedings and regulatory matters set out in Note 34 of the financial statements in the Form 20-F for the year ended 31 December 2021; and
•reports and updates from management on the operational resilience of the Group.
Report of the Directors | Corporate governance report
At 31 December 2021, HSBC had a total workforce equivalent to 220,000 full-time employees compared with 226,000 at the end of 2020 and 235,000 at the end of 2019. Our main centres of employment were India with approximately 38,000 employees, the UK with 35,000, mainland China with 30,000, Hong Kong with 28,000, Mexico with 16,000 and the US with 7,000.
Our business spans many cultures, communities and continents. We aim to provide an environment where our colleagues can fulfil their potential by building their skills and capabilities while focusing on the development of a diverse and inclusive culture. We use confidential employee surveys to assess progress and make changes. We want to provide an open culture, where our colleagues feel connected, supported to speak up and where our leaders encourage and use feedback. Where we make organisational changes, we support our people, in particular where there are job impacts.
Employee relations
We consult with and, where appropriate, negotiate with employee representative bodies where we have them. It is our policy to maintain well-developed communications and consultation programmes with all employee representative bodies. There have been no material disruptions to our operations from labour disputes during the past five years.
We are committed to complying with the applicable employment law and regulations in the jurisdictions in which we operate. HSBC’s global employment practices and relations policy provides the framework and controls through which we seek to uphold that commitment.
Diversity and inclusion
Our customers, colleagues and communities span many cultures and continents. We value difference, and believe that diversity makes us strong. We are dedicated to building a diverse and connected workforce where everyone feels a sense of belonging.
Our Group People Committee, which is made up of Group Executive Committee members, governs our diversity and inclusion agenda. It meets regularly to agree actions to improve diverse representation and build a more inclusive culture where our colleagues can bring the best of themselves to work, and deliver more equal outcomes for our stakeholders. Members of our Group Executive Committee are held to account for the actions they take on diversity via aspirational targets contained within their performance scorecards. Every colleague at HSBC must treat each other with dignity and respect to ensure an inclusive environment. Our policies make it clear that we do not tolerate unlawful discrimination, bullying or harassment on any grounds.
To align our approach to inclusion best practices, we participate in global diversity benchmarks that help us to identify improvement opportunities. We also track a large number of diversity and inclusion metrics, which enable us to pinpoint inclusion barriers, and take action where required. Our gender diversity statistics are set out on page 72.
Further details of our diversity and inclusion activity, together with our Gender and Ethnicity Pay Gap Report 2021, can be found at www.hsbc.com/diversitycommitments.
Employment of people with a disability
We strongly believe in providing equal opportunities for all employees. The employment of people with a disability is included in this commitment. The recruitment, training, development and promotion of people with a disability are based on the aptitudes and abilities of the individual. Should employees become disabled during their employment with us, efforts are made to continue their employment. Where necessary, we will provide appropriate training, facilities and reasonable equipment.
Employee development
We aim to build a dynamic, inclusive culture where the best want to develop the skills and experiences that help them fulfil their potential. This determines how we develop our people and recruit, identify and nurture talent. A range of resources bring this to life including:
•HSBC University, our platform for learning and development with specific business and technical academies;
•our My HSBC Career portal, which offers career development information and resources; and
•HSBC Talent Marketplace, our new online platform that uses AI to provide opportunities to learn as we work.
Each year, every employee is asked to complete global mandatory training. It plays a critical role in shaping our culture by ensuring everyone is focused on issues that are fundamental to working at HSBC, from sustainability, to financial crime risk, to our intolerance of bullying and harassment.
As the opportunities we face change, we provide development to key populations through business and technical academies. This includes our risk academy, which helps us to develop broad capabilities in traditional areas of risk like financial crime but also in emerging risk issues like climate risk and the ethics of AI and Big Data.
Our approach to learning is skills based. Our academies work with our businesses to identify the key skills and capabilities we need in the future. Alongside this, we help colleagues identify, assess and develop the skills that match their ambition and aspirations. In 2021, as part of our Future Skills programme a ‘Focus 4’ campaign encouraged colleagues to identify four future skills they want to prioritise in their development plans. Over four themed weeks, various events introduced colleagues to areas such as data, digital and sustainability skills, as well as personal skills like critical thinking and resilience.
Our new platform for learning content is Degreed. This helps colleagues identify, assess and develop key skills through internal and external training materials in a way that suits them. Content can range from quick videos, articles or podcasts to packaged programmes or learning pathways.
In 2021, we launched the HSBC Talent MarketPlace, an AI-based platform, which matches colleagues to projects and experiences based on their aspirations. By December, this had been rolled out to nearly 50,000 colleagues in the US, India, Singapore and the UK, and will be rolled out globally in 2022.
Effective people management and impactful leadership remain critical to our ability to energise for growth. In 2021, we launched a refreshed executive development curriculum for our most senior population. This combines internal programmes and business school activities with targeted technical programmes on key topics and skills.
Health and safety
We are committed to providing a safe and healthy working environment for everyone. We have adopted global policies, mandatory procedures, and incident and information reporting systems across the organisation that reflect our core values and are aligned to international standards. Our global health and safety performance is subject to ongoing monitoring and assurance.
Our chief operating officers have overall responsibility for engendering a positive health and safety culture and ensuring that global policies, procedures and systems are put into practice locally. They also have responsibility for ensuring all local legal requirements are met.
We delivered a range of programmes in 2021 to help us understand and manage our health and safety risks:
•We continued to provide enhancements to our workplaces globally to minimise the risks of Covid-19, including enhanced cleaning, improved ventilation and social distancing measures.
•We updated our advice and risk assessment methodology on working from home, providing more awareness and best practices on good ergonomics and well-being to be adopted as we transitioned to new ways of working.
•We delivered health and safety training and awareness to 220,000 of our employees and contractors globally, ensuring roles and responsibilities were clear and understood.
•We completed the annual safety inspection on all of our buildings globally, subject to local Covid-19 restrictions, to ensure we were meeting our standards and continuously improving our safety performance.
•We continued to focus on enhancing the safety culture in our supply chain through our SAFER Together programme, covering the five key elements of best practice safety culture, including speaking up about safety, and recognising excellence. Our 2021 safety climate survey results showed a continued high level of positive safety culture, significantly above the industry average.
•We commenced a targeted guidance and training programme for our construction partners in our key markets globally to help them understand and deliver industry leading health and safety performance, with over 130 construction workers receiving safety passporting training.
•Our Eat Well Live Well programme continued educating and informing our colleagues on how to make healthy food and drink choices. We enhanced the programme to provide digital educational and information resources, including a suite of videos and recipe ideas. The programme was a key component of HSBC’s winning entry in the 2021 Global Healthy Workplace Awards.
•We put in place effective storm preparation controls and processes to ensure the protection of our people and operations. In 2021, there were 38 named storms that passed over 1,935 of our buildings, resulting in 0 injuries or material business impact.
| | | | | | | | | | | |
| Employee health and safety |
| 2021 | 2020 | 2019 |
| Rate of workplace fatalities per 100,000 employees | — | | — | — |
Number of major injuries to employees1 | 14 | | 15 | | 29 |
| All injury rate per 100,000 employees | 64 | | 88 | | 189 |
1 Fractures, dislocation, concussion, loss of consciousness, overnight admission to hospital.
Remuneration
HSBC’s pay and performance strategy is designed to reward competitively the achievement of long-term sustainable performance and attract and motivate the very best people, regardless of gender, ethnicity, age, disability or any other factor unrelated to performance or experience with the Group, while performing their role in the long-term interests of our stakeholders.
For further details of the Group’s approach to remuneration, see page 314.
Employee share plans
Share options and discretionary awards of shares granted under HSBC share plans align the interests of employees with the creation of shareholder value. The following table sets out the particulars of outstanding options, including those held by employees working under employment contracts that are regarded as ‘continuous contracts’ for the purposes of the Hong Kong Employment Ordinance. The options were granted at nil consideration. No options have been granted to substantial shareholders and suppliers of goods or services, nor in excess of the individual limit for each share plan. No options were cancelled by HSBC during the year.
A summary for each plan of the total number of the options that were granted, exercised or lapsed during 2021 is shown in the following table. Further details required to be disclosed pursuant to Chapter 17 of the Rules Governing the Listing of Securities on The Stock Exchange of Hong Kong Limited are available on our website at www.hsbc.com/who-we-are/leadership-and-governance/remuneration and on the website of The Stock Exchange of Hong Kong Limited at www.hkex.com.hk, or can be obtained upon request from the Group Company Secretary and Chief Governance Officer, 8 Canada Square, London E14 5HQ.
Particulars of options held by Directors of HSBC Holdings are set out on
page 309.
Note 5 on the financial statements gives details of share-based payments, including discretionary awards of shares granted under HSBC share plans.
All-employee share plans
HSBC operates all-employee share option plans under which options are granted over HSBC ordinary shares. Subject to leaver provisions, options are normally exercisable after three or five years. During 2021, options were granted by reference to the average market value of HSBC Holdings ordinary shares on the five business days immediately preceding the invitation date, then applying a discount of 20%. The closing price for HSBC Holdings ordinary shares quoted on the London Stock Exchange on
21 September 2021, the day before the options were granted and as derived from the Daily Official List, was £3.5975.
The HSBC Holdings Savings-Related Share Option Plan (UK) will expire on 24 April 2030, by which time the plan may be extended with approval from shareholders, unless the Directors resolve to terminate the plan at an earlier date.
The HSBC International Employee Share Purchase Plan was introduced in 2013 and now includes employees based in
28 jurisdictions, although no options are granted under this plan.
During 2021, approximately 190,000 employees were offered participation in these plans.
| | | | | | | | | | | | | | | | | | | | | | | | | | | | | | | | |
| HSBC Holdings Savings-Related Share Option Plan (UK) |
| | | HSBC Holdings ordinary shares |
| Dates of awards | Exercise price | Usually exercisable | At | Granted | Exercised | Lapsed | At |
| from | to | from | to | from | to | 1 Jan 2021 | during year | during year1 | during year | 31 Dec 2021 |
| | (£) | (£) | | | | | | | |
| 20 Sep 2015 | 22 Sep 2021 | 2.6270 | | 5.9640 | | 1 Nov 2019 | 30 Apr 2027 | 130,952,539 | | 15,410,381 | | 3,878,418 | | 19,287,652 | | 123,196,850 | |
| | | | | |
1 The weighted average closing price of the shares immediately before the dates on which options were exercised was £4.3351.
Report of the Directors | Corporate governance report
The statement of corporate governance practices set out on pages 253 to 332 and the information referred to therein constitutes the 'Corporate governance report' and 'Report of the Directors' of HSBC Holdings. The websites referred to do not form part of this report.
| | | | | |
| Relevant corporate governance codes, role profiles and policies |
| UK Corporate Governance Code | www.frc.org.uk |
| Hong Kong Corporate Governance Code (set out in Appendix 14 to the Rules Governing the Listing of Securities on the Stock Exchange of Hong Kong Limited) | www.hkex.com.hk |
Descriptions of the roles and responsibilities of the: – Group Chairman – Group Chief Executive – Senior Independent Director – Board | www.hsbc.com/who-we-are/leadership-and-governance/board-responsibilities |
| Board and senior management | www.hsbc.com/who-we-are/leadership-and-governance |
| Roles and responsibilities of the Board's committees | www.hsbc.com/who-we-are/leadership-and-governance/board-committees |
Board’s policies on: – diversity and inclusion – shareholder communication – human rights – remuneration practices and governance | www.hsbc.com/who-we-are/leadership-and-governance/board-responsibilities |
| Global Internal Audit Charter | www.hsbc.com/who-we-are/leadership-and-governance/corporate-governance-codes/internal-control |
HSBC is subject to corporate governance requirements in both the UK and Hong Kong. During 2021, HSBC complied with the provisions and requirements of both the UK and Hong Kong Corporate Governance Codes.
Under the Hong Kong Code, the audit committee should be responsible for the oversight of all risk management and internal control systems. HSBC’s Group Risk Committee is responsible for oversight of internal control, other than internal control over financial reporting, and risk management systems. This is permitted under the UK Corporate Governance Code.
HSBC Holdings has codified obligations for transactions in Group securities in accordance with the requirements of the UK Market Abuse Regulation and the rules governing the listing of securities on HKEx, save that the HKEx has granted waivers from strict compliance with the rules that take into account accepted practices in the UK, particularly in respect of employee share plans. During the year, all Directors were reminded of their obligations in respect of transacting in HSBC Group securities. Following specific enquiry all Directors have confirmed that they have complied with their obligations.
On behalf of the Board
Mark E Tucker
Group Chairman
HSBC Holdings plc
Registered number 617987
22 February 2022
| | | | | |
| Risk |
Our risk review outlines our approach to risk management, how we identify and monitor top and emerging risks, and the actions we take to mitigate them. In addition, it explains our material banking risks, including how we manage capital. |
| Page |
| Our approach to risk | |
| Our risk appetite | |
| Risk management | |
| Key developments in 2021 | |
| |
| |
| |
| Top and emerging risks | |
| Externally driven | |
| Internally driven | |
| Risk factors | |
| Areas of special interest | |
| Risks related to Covid-19 | |
| Climate-related risks | |
| |
| |
| Our material banking risks | |
| Credit risk | |
| Treasury risk | |
| Market risk | |
| Resilience risk | |
| Regulatory compliance risk | |
| Financial crime risk | |
| |
| Model risk | |
| Insurance manufacturing operations risk | |
Investing in technology to screen suspicious activities
We screen the names of more than 112 million personal and corporate customers every day against external and internal watchlists to identify potential financial crime risks and their impact on our customers and organisation. This currently generates approximately 350,000 alerts for our colleagues to review each month. In October, working with technology company Silent Eight, we launched a global automated alert adjudication tool for name screening, which will be able to close 50% of the false positives without human intervention. This will help us increase the speed and accuracy of monitoring adherence to risk appetite, while reducing the cost of compliance.
Our risk appetite
We recognise the importance of a strong culture, which refers to our shared attitudes, values and standards that shape behaviours related to risk awareness, risk taking and risk management. All our people are responsible for the management of risk, with the ultimate accountability residing with the Board.
We seek to build our business for the long term by balancing social, environmental and economic considerations in the decisions we make. Our strategic priorities are underpinned by our endeavour to operate in a sustainable way. This helps us to carry out our social responsibility and manage the risk profile of the business. We are committed to managing and mitigating climate-related risks, both physical and transition risks, and continue to incorporate consideration of these into how we manage and oversee risks internally and with our customers.
The following principles guide the Group’s overarching appetite for risk and determine how our businesses and risks are managed.
Financial position
•We aim to maintain a strong capital position, defined by regulatory and internal capital ratios.
•We carry out liquidity and funding management for each operating entity, on a stand-alone basis.
Operating model
•We seek to generate returns in line with our risk appetite and strong risk management capability.
•We aim to deliver sustainable and diversified earnings and consistent returns for shareholders.
Business practice
•We have zero tolerance for any of our people knowingly engaging in any business, activity or association where foreseeable reputational risk or damage has not been considered and/or mitigated.
•We have no appetite for deliberately or knowingly causing detriment to consumers, or incurring a breach of the letter or spirit of regulatory requirements.
•We have no appetite for inappropriate market conduct by any member of staff or by any Group business.
•We are committed to managing the climate risks that have an impact on our financial position, and delivering on our net zero ambition.
Enterprise-wide application
Our risk appetite encapsulates the consideration of financial and non-financial risks. We define financial risk as the risk of a financial loss as a result of business activities. We actively take these types of risks to maximise shareholder value and profits. Non-financial risk is the risk to achieving our strategy or objectives as the result of failed internal processes, people and systems, or from external events.
Our risk appetite is expressed in both quantitative and qualitative terms and applied at the global business level, at the regional level and to material operating entities. Every three years, the Global Risk and Compliance function commissions an external independent firm to review the Group’s approach to risk appetite and to help ensure that it remains in line with market best practice and regulatory expectations. This review was last carried out in 2019 and confirmed the Group’s risk appetite statement (‘RAS’) remains aligned to best practices, regulatory expectations and strategic goals. Our risk appetite continues to evolve and expand its scope as part of our regular review process.
The Board reviews and approves the Group’s risk appetite twice a year to make sure it remains fit for purpose. The Group’s risk appetite is considered, developed and enhanced through:
•an alignment with our strategy, purpose, values and customer needs;
•trends highlighted in other Group risk reports;
•communication with risk stewards on the developing risk landscape;
•strength of our capital, liquidity and balance sheet;
•compliance with applicable laws and regulations;
•effectiveness of the applicable control environment to mitigate risk, informed by risk ratings from risk control assessments;
•functionality, capacity and resilience of available systems to manage risk; and
•the level of available staff with the required competencies to manage risks.
We formally articulate our risk appetite through our RAS. Setting out our risk appetite ensures that we agree a suitable level of risk for our strategy. In this way, risk appetite informs our financial planning process and helps senior management to allocate capital to business activities, services and products.
The RAS consists of qualitative statements and quantitative metrics, covering financial and non-financial risks. It is applied to the development of business line strategies, strategic and business planning and remuneration. At a Group level, performance against the RAS is reported to the Group Risk Management Meeting (‘RMM’) alongside key risk indicators to support targeted insight and discussion on breaches of risk appetite and any associated mitigating actions. This reporting allows risks to be promptly identified and mitigated, and informs risk-adjusted remuneration to drive a strong risk culture.
Each global business, region and strategically important country and territory is required to have its own RAS, which is monitored to help ensure it remains aligned with the Group’s RAS. Each RAS and business activity is guided and underpinned by qualitative principles and/or quantitative metrics.
Risk management
We recognise that the primary role of risk management is to protect our customers, business, colleagues, shareholders and the communities that we serve, while ensuring we are able to support our strategy and provide sustainable growth. This is supported through our three lines of defence model described on page 147.
The implementation of our business strategy, which includes a major transformation programme, remains a key focus. As we implement change initiatives, we actively manage the execution risks. We also perform periodic risk assessments, including against strategies, to help ensure retention of key personnel for our continued safe operation.
We aim to use a comprehensive risk management approach across the organisation and across all risk types, underpinned by our culture and values. This is outlined in our risk management framework, including the key principles and practices that we employ in managing material risks, both financial and non-financial. The framework fosters continual monitoring, promotes risk awareness and encourages a sound operational and strategic decision-making and escalation process. It also supports a consistent approach to identifying, assessing, managing and reporting the risks we accept and incur in our activities, with clear accountabilities. We continue to actively review and develop our risk management framework and enhance our approach to managing risk, through our activities with regard to: people and capabilities; governance; reporting and management information; credit risk management models; and data.
We merged our Group Risk and Compliance functions on 1 July 2021 to take an increasingly comprehensive view of risk, and enhance cross-discipline collaboration on key areas such as fraud, credit and conduct risk. This merger did not have an impact on our policies and practices regarding the management of risk. Led by the Group Chief Risk and Compliance Officer, this merged function plays an important role in reinforcing our culture and values. It focuses on creating an environment that encourages our people to speak up and do the right thing.
Group Risk and Compliance is independent from the global businesses, including our sales and trading functions, to provide challenge, oversight and appropriate balance in risk/reward decisions.
Our risk management framework
The following diagram and descriptions summarise key aspects of the risk management framework, including governance, structure, risk management tools and our culture, which together help align employee behaviour with risk appetite.
| | | | | | | | | | | | | | | | | | | | | | | | | | | | | | | | |
| Key components of our risk management framework |
| HSBC Values and risk culture |
| | | | | | | | | | |
| Risk governance | | Non-executive risk governance | | The Board approves the Group’s risk appetite, plans and performance targets. It sets the ‘tone from the top’ and is advised by the Group Risk Committee (see page 268). |
| | | |
| | | |
| Executive risk governance | | Our executive risk governance structure is responsible for the enterprise-wide management of all risks, including key policies and frameworks for the management of risk within the Group (see pages 147 and 171). |
| | | | |
| | | | |
| Roles and responsibilities | | Three lines of defence model | | Our ‘three lines of defence’ model defines roles and responsibilities for risk management. An independent Global Risk and Compliance function helps ensure the necessary balance in risk/return decisions (see page 147). |
| | | | |
| | | | |
| Processes and tools | | Risk appetite | | The Group has processes in place to identify/assess, monitor, manage and report risks to help ensure we remain within our risk appetite. |
| | |
| Enterprise-wide risk management tools | |
| | |
| Active risk management: identification/assessment, monitoring, management and reporting | |
| | | | |
| | | | |
| Internal controls | | Policies and procedures | | Policies and procedures define the minimum requirements for the controls required to manage our risks. |
| | | |
| Control activities | | Operational and resilience risk management defines minimum standards and processes for managing operational risks and internal controls. |
| | | |
| Systems and infrastructure | | The Group has systems and/or processes that support the identification, capture and exchange of information to support risk management activities. |
| | | | | | | | | | |
| | | | | | | | | | |
Risk governance
The Board has ultimate responsibility for the effective management of risk and approves our risk appetite.
The Group Chief Risk and Compliance Officer, supported by the RMM, holds executive accountability for the ongoing monitoring, assessment and management of the risk environment and the effectiveness of the risk management framework.
The Group Chief Risk and Compliance Officer is also responsible for the oversight of reputational risk, with the support of the Group Reputational Risk Committee. The Group Reputational Risk Committee considers matters arising from customers, transactions and third parties that either present a serious potential reputational risk to the Group or merit a Group-led decision to ensure a consistent risk management approach across the regions, global
businesses and global functions. Our reputational risk policy sets out our risk appetite and the principles for managing reputational risk. Further details can be found under the ‘Reputational risk’ section of www.hsbc.com/our-approach/risk-and-responsibility.
Day-to-day responsibility for risk management is delegated to senior managers with individual accountability for decision making. All our people have a role to play in risk management. These roles are defined using the three lines of defence model, which takes into account our business and functional structures as described in the following commentary, 'Our responsibilities’.
We use a defined executive risk governance structure to help ensure there is appropriate oversight and accountability of risk, which facilitates reporting and escalation to the Group RMM. This structure is summarised in the following table.
| | | | | | | | |
| Governance structure for the management of risk and compliance |
| Authority | Membership | Responsibilities include: |
| | |
| Risk Management Meeting | Group Chief Risk and Compliance Officer Group Chief Legal Officer Group Chief Executive Group Chief Financial Officer All other Group Executive Committee members | •Supporting the Group Chief Risk and Compliance Officer in exercising Board-delegated risk management authority •Overseeing the implementation of risk appetite and the risk management framework •Forward-looking assessment of the risk environment, analysing possible risk impacts and taking appropriate action •Monitoring all categories of risk and determining appropriate mitigating action •Promoting a supportive Group culture in relation to risk management and conduct |
| Global Risk Executive Committee | Group Chief Risk and Compliance Officer Chief risk officers of HSBC’s global businesses and regions Heads of Global Risk and Compliance sub-functions | •Supporting the Group Chief Risk and Compliance Officer in providing strategic direction for the Global Risk and Compliance function, setting priorities and providing oversight •Overseeing a consistent approach to accountability for, and mitigation of, risk and compliance across the Group |
| Global business/regional risk management meetings | Global business/regional chief risk officer Global business/regional chief executive officer Global business/regional chief financial officer Global business/regional heads of global functions | •Supporting the Group Chief Risk and Compliance Officer in exercising Board-delegated risk management authority •Forward-looking Group assessment of the risk environment, analysing the possible risk impact and taking appropriate action •Implementation of risk appetite and the risk management framework •Monitoring all categories of risk and determining appropriate mitigating actions •Embedding a supportive culture in relation to risk management and controls |
The Board committees with responsibility for oversight of risk-related matters are set out on page 273.
.
Our responsibilities
All our people are responsible for identifying and managing risk within the scope of their roles. Roles are defined using the three lines of defence model, which takes into account our business and functional structures as described below.
Three lines of defence
To create a robust control environment to manage risks, we use an activity-based three lines of defence model. This model delineates management accountabilities and responsibilities for risk management and the control environment.
The model underpins our approach to risk management by clarifying responsibility and encouraging collaboration, as well as enabling efficient coordination of risk and control activities. The three lines of defence are summarised below:
•The first line of defence owns the risks and is responsible for identifying, recording, reporting and managing them in line with risk appetite, and ensuring that the right controls and assessments are in place to mitigate them.
•The second line of defence challenges the first line of defence on effective risk management, and provides advice and guidance in relation to the risk.
•The third line of defence is our Global Internal Audit function, which provides independent assurance as to whether our risk management approach and processes are designed and operating effectively.
Global Risk and Compliance function
Our Global Risk and Compliance function is responsible for the Group’s risk management framework. This responsibility includes establishing global policy, monitoring risk profiles, and identifying and managing forward-looking risk. Global Risk and Compliance is made up of sub-functions covering all risks to our business. Forming part of the second line of defence, the Global Risk and Compliance function is independent from the global businesses, including sales and trading functions, to provide challenge, appropriate oversight and balance in risk/return decisions.
Responsibility for minimising both financial and non-financial risk lies with our people. They are required to manage the risks of the business and operational activities for which they are responsible. We maintain adequate oversight of our risks through our various specialist risk stewards and the collective accountability held by our chief risk officers.
We have continued to strengthen the control environment and our approach to the management of non-financial risk, as broadly set out in our risk management framework. The management of non-financial risk focuses on governance and risk appetite, and provides a single view of the non-financial risks that matter the most and the associated controls. It incorporates a risk management system designed to enable the active management of non-financial risk. Our ongoing focus is on simplifying our approach to non-financial risk management, while driving more effective oversight and better end-to-end identification and management of non-financial risks. This is overseen by the Operational and Resilience Risk function, headed by the Group Head of Operational and Resilience Risk.
Stress testing and recovery planning
We operate a wide-ranging stress testing programme that is a key part of our risk management and capital and liquidity planning. Stress testing provides management with key insights into the impact of severely adverse events on the Group, and provides confidence to regulators on the Group’s financial stability.
Our stress testing programme assesses our capital and liquidity strength through a rigorous examination of our resilience to external shocks. As well as undertaking regulatory-driven stress tests, we conduct our own internal stress tests in order to understand the nature and level of all material risks, quantify the impact of such risks and develop plausible business-as-usual mitigating actions.
Internal stress tests
Our internal capital assessment uses a range of stress scenarios that explore risks identified by management. They include potential adverse macroeconomic, geopolitical and operational risk events, as well as other potential events that are specific to HSBC.
The selection of stress scenarios is based upon the output of our identified top and emerging risks and our risk appetite. Stress testing analysis helps management understand the nature and extent of vulnerabilities to which the Group is exposed. Using this information, management decides whether risks can or should be mitigated through management actions or, if they were to crystallise, be absorbed through capital and liquidity. This in turn informs decisions about preferred capital and liquidity levels and allocations.
In addition to the Group-wide stress testing scenarios, each major subsidiary conducts regular macroeconomic and event-driven
scenario analyses specific to its region. They also participate, as required, in the regulatory stress testing programmes of the jurisdictions in which they operate, such as the Bank of England (‘BoE’) stress tests required in the UK, Comprehensive Capital Analysis and Review and Dodd-Frank Act Stress Testing programmes in the US, and the stress tests of the Hong Kong Monetary Authority (‘HKMA’). Global functions and businesses also perform bespoke stress testing to inform their assessment of risks to potential scenarios.
We also conduct reverse stress tests each year at Group level and, where required, at subsidiary entity level to understand potential extreme conditions that would make our business model non-viable. Reverse stress testing identifies potential stresses and vulnerabilities we might face, and helps inform early warning triggers, management actions and contingency plans designed to mitigate risks.
Recovery and resolution plans
Recovery and resolution plans form part of the integral framework safeguarding the Group’s financial stability. The Group recovery plan, together with stress testing, helps us understand the likely outcomes of adverse business or economic conditions and in the identification of appropriate risk mitigating actions. The Group is committed to further developing its recovery and resolution capabilities in line with the BoE resolvability assessment framework requirements.
Key developments in 2021
We continued to actively manage the risks resulting from the Covid-19 pandemic and its impacts on our customers and operations during 2021, as well as other key risks described in this section. In addition, we enhanced our risk management in the following areas:
•We streamlined the articulation of our risk appetite framework, providing further clarity on how risk appetite interacts with strategic planning and recovery planning processes.
•We continued to simplify our approach to non-financial risk management, with the implementation of more effective oversight tools and techniques to improve end-to-end identification and management of these risks.
•We accelerated the transformation of our approach to managing financial risks across the businesses and risk functions, including initiatives to enhance portfolio monitoring and analytics, credit risk management, traded risk management, treasury risk management and models used to manage financial risks.
•We are progressing with a comprehensive regulatory reporting programme to strengthen our global processes, improve consistency, and enhance controls.
•We launched an enhanced approach to conduct for all colleagues, businesses and geographies, establishing the outcomes to be achieved for customers and markets in all risk disciplines, operations and technologies and integrating it into our approach to culture and our risk management arrangements.
•We continued to enhance our approach to portfolio risk management, through clearly defined roles and responsibilities, and improving our data and management information reporting capabilities.
•The Climate Risk Oversight Forum continued to shape and oversee our approach to climate risk. We appointed a Head of Climate Risk in support of our climate change strategy and to oversee the development of our climate risk management capabilities. The climate risk programme continues to drive the delivery of our enhanced climate risk management approach.
•We continued to improve the effectiveness of our financial crime controls with a targeted update of our fraud controls. We refreshed our financial crime policies, ensuring they remained up to date and addressed changing and emerging risks, and we continued to meet our regulatory obligations.
•We introduced enhanced governance and oversight around management judgemental adjustments and related processes for IFRS 9 models and Sarbanes-Oxley controls.
We use a top and emerging risks process to provide a forward-looking view of issues with the potential to threaten the execution of our strategy or operations over the medium to long term.
We proactively assess the internal and external risk environment, as well as review the themes identified across our regions and global businesses, for any risks that may require global escalation. We update our top and emerging risks as necessary.
Our current top and emerging risks are as follows.
Externally driven
Geopolitical and macroeconomic risks
Our operations and portfolios are exposed to risks associated with political instability, civil unrest and military conflict, which could lead to disruption of our operations, physical risk to our staff and/or physical damage to our assets.
Global tensions over trade, technology and ideology are manifesting themselves in divergent regulatory standards and compliance regimes, presenting long-term strategic challenges for multinational businesses.
The Covid-19 pandemic brought supply chain issues into focus, with shortages appearing across several regions and products throughout 2020 and 2021, and it is not expected that these issues will ease significantly before mid-2022.
The pandemic has also heightened geopolitical tensions, which could have implications for the Group and its customers.
The Group will continue to need to consider potential regulatory, reputational and market risks arising from the evolving geopolitical landscape. In 2021, there was an escalation of diplomatic tensions between China and the US, and increasingly extending to the UK, the EU, India and other countries.
The US-China relationship in particular remains complex, with tensions over a number of critical issues. The US, the UK, the EU, Canada and other countries have imposed various sanctions and trade restrictions on Chinese individuals or companies, and the US continues to develop its approach to perceived strategic competition with China.
Among these, the US Hong Kong Autonomy Act authorises the imposition of secondary sanctions against non-US financial institutions found to be knowingly engaged in significant transactions with individuals and entities subject to US sanctions for engaging in certain activities that undermine Hong Kong’s autonomy. In addition, the US has imposed restrictions on US persons’ ability to buy or sell certain publicly traded securities linked to a number of prominent Chinese companies.
There is also a risk of increased sanctions being imposed by the US and other governments in relation to human rights, technology and other issues with China, and this could create a more complex operating environment for the Group and its customers. Notably, alongside the EU, UK, and Canada, the US has increasingly imposed sanctions and other measures in response to allegations of human rights abuses in Xinjiang.
China, in turn, has announced a number of its own sanctions and trade restrictions that target, or provide authority to target, foreign individuals or companies. These have been imposed mainly against certain public officials associated with the implementation of foreign sanctions against China. China has also promulgated new laws that provide a legal framework for imposing further sanctions and export restrictions, including laws prohibiting implementation of – or compliance with – foreign sanctions against China and creating a private right of action in Chinese courts for damages caused by third parties implementing foreign sanctions or other discriminatory measures.
These and any future measures and countermeasures that may be taken by the US, China and other countries may affect the Group, its customers and the markets in which the Group operates.
As the geopolitical landscape evolves, compliance by multinational corporations with their legal or regulatory obligations in one jurisdiction may be seen as supporting the law or policy objectives of that jurisdiction over another, creating additional compliance, reputational and political risks for the Group. We maintain dialogue with our regulators in various jurisdictions on the impact of legal and regulatory obligations on our business and customers.
Tensions between Russia and the US and a number of European states have heightened significantly following the increasing risk of hostilities between Russia and Ukraine. While negotiations are ongoing to seek a resolution, a continuation of or any further deterioration to the situation could have significant geopolitical implications, including economic, social and political repercussions on a number of regions that may impact HSBC and its customers. In addition, the US, the UK and the EU have threatened a significant expansion of sanctions and trade restrictions against Russia in the event of a Russian incursion into Ukraine, and Russian countermeasures are also possible.
Expanding data privacy and cybersecurity laws in a number of markets could pose potential challenges to intra-group data sharing. These developments could increase financial institutions’ compliance burdens in respect of cross-border transfers of personal information.
Political disagreements between the UK and the EU, notably over the future operation of the Northern Ireland Protocol, have meant work on the creation of a framework for voluntary regulatory cooperation in financial services following the UK’s withdrawal from the EU has stalled. While negotiations are continuing, it is unclear whether or when an agreement will be reached, and this has led to speculation that the UK may trigger Article 16 of the Protocol, which could suspend the operation of the Protocol in certain respects. Any decision to do so could be met with retaliatory action by the EU, complicating the terms of trade between the UK and the EU and potentially preventing progress in other areas such as financial services. We are monitoring the situation closely, including the potential impacts on our customers.
Our global presence and diversified customer base should help mitigate the direct impacts on our financial position of the absence of a comprehensive EU-UK agreement on financial services. Our wholesale and markets footprint in the EU provides a strong foundation for us to build upon. Over the medium to long term, the UK’s withdrawal from the EU may impact markets and increase economic risk, particularly in the UK, which could adversely impact our profitability and prospects for growth in this market.
Monetary and fiscal policies in developed markets will likely remain broadly accommodative for some time owing to uncertainty over the economic outlook, although rising global inflation – partly on the back of higher energy prices – is putting pressure on central banks to tighten monetary policy. The US Federal Reserve Board began tapering its asset purchases in November 2021 and financial markets currently expect it to raise the Federal Funds rate over the next year. The European Central Bank is on course to end its extraordinary asset purchase programme in March 2022.
Persistent supply issues or further increases in energy prices – for instance as a result of escalation in the Russia-Ukraine crisis – could keep inflation high and force central banks to tighten monetary policies faster than currently envisaged. Conversely, monetary policy tightening may be constrained by the emergence and spread of new Covid-19 variants that dampen economic recovery. We continue to monitor our risk profile closely in the context of uncertainty over monetary policy.
The global economic recovery in 2021 eased financial difficulties for some of our customers, which contributed to a reduction in ECL charges. For further details on customer relief programmes, see page 195.
Mitigating actions
•We closely monitor geopolitical and economic developments in key markets and sectors and undertake scenario analysis where appropriate. This helps us to take portfolio actions where necessary, including enhanced monitoring, amending our risk appetite and/or reducing limits and exposures.
•We stress test portfolios of particular concern to identify sensitivity to loss under a range of scenarios, with management actions being taken to rebalance exposures and manage risk appetite where necessary.
•We regularly review key portfolios to help ensure that individual customer or portfolio risks are understood and our ability to manage the level of facilities offered through any downturn is appropriate.
•We continue to monitor the UK’s relationship with the EU, and assess the potential impact on our people, operations and portfolios.
•We have taken steps, where necessary, to enhance physical security in geographical areas deemed to be at high risk from terrorism and military conflicts.
Environmental, social and governance risk
We are subject to financial and non-financial risks associated with environmental, social and governance (‘ESG’) related matters. Our current areas of focus are climate risk, nature-related risks and human rights risks. These can impact us both directly and indirectly through our customers. For details on how we govern ESG, see page 80.
Climate-related risk increased over 2021, owing to the pace and volume of policy and regulatory changes globally particularly on climate risk management, stress testing and scenario analysis and disclosures. If we fail to meet evolving regulatory expectations or requirements on climate risk management, this could have regulatory compliance and reputational impacts.
We face increased reputational, legal and regulatory risk as we make progress towards our net zero ambition, with stakeholders likely to place greater focus on our actions such as the development of climate-related policies, our disclosures and financing and investment decisions relating to our ambition. We will face additional risks if we are perceived to mislead stakeholders in respect of our climate strategy, the climate impact of a product or service, or the commitments of our customers.
To track and report on progress towards achieving our ambition, we rely on internal and, where appropriate and available, external data, guided by certain industry standards. While emissions reporting has improved over time, data remains of limited quality and consistency. Methodologies we have used may develop over time in line with market practice and regulations, as well as owing to developments in climate science. Any developments in data and methodologies could result in revisions to reported data going forward, including on financed emissions, meaning that reported figures may not be reconcilable or comparable year-on-year. We may also have to reevaluate our progress towards our climate-related targets in future and this could result in reputational, legal and regulatory risks.
Climate risk will also have an impact on model risk, as models play an important role in risk management and the financial reporting of climate-related risks. The uncertain impacts of climate change and data limitations present challenges to creating reliable and accurate model outputs.
We could also face increased resilience risk, retail credit risk and wholesale credit risk owing to the increase in frequency and severity of weather events and chronic shifts in weather patterns. These risks could affect our own critical operations, impacting our customers and resulting in losses to our operations. Our customers’ operations and assets could also be affected, reducing their ability to afford mortgage or loan repayments, and leading to credit risk impacts.
There is increasing evidence that a number of nature-related risks beyond climate change – which include risks that can be
represented more broadly by economic dependence on nature – can and will have significant economic impact. These risks arise when the provision of natural services – such as water availability, air quality, and soil quality – is compromised by overpopulation, urban development, natural habitat and ecosystem loss, and other environmental stresses beyond climate change. They can show themselves in various ways, including through macroeconomic, market, credit, reputational, legal and regulatory risks, for both HSBC and our customers. In 2021, we added nature-related risks as a new emerging risk driver, under the umbrella theme of ESG risks and we continue to engage with investors, regulators and customers on nature-related risks to evolve our approach and understand best practice risk mitigation.
Regulation and disclosure requirements in relation to human rights, and to modern slavery in particular, are increasing. Businesses are expected to explain more about their efforts to identify and respond to the risk of negative human rights impacts arising from the actions of their employees, suppliers, customers and those in whom they invest.
Mitigating actions
•We continue to deepen our understanding of the drivers of climate risk as well as manage our exposure. A dedicated Climate Risk Oversight Forum is responsible for shaping and overseeing our approach and providing support in managing climate risk. For further details on the Group’s ESG governance structure, see page 80.
•Our climate risk programme continues to accelerate the development of our climate risk management capabilities across four key pillars – governance and risk appetite, risk management, stress testing and scenario analysis, and disclosures. We are also enhancing our approach to greenwashing risk management.
•In December, we published our thermal coal phase-out policy, which committed to phase out the financing of coal-fired power and thermal coal mining in EU/OECD markets by 2030, and globally by 2040. The policy helps us chart the path to net zero and is a component of our approach towards managing the climate risk of our lending portfolio.
•Climate stress tests and scenarios are being used to further improve our understanding of our risk exposures for use in risk management and business decision making.
•We are undertaking training and adding additional roles with specialist skills to manage climate-related model risk.
•We have delivered climate risk training to our legal entity boards and wider target audiences.
•With the help of external stakeholders, we continued to review and improve our approach to human rights issues, following the UN Guiding Principles on Business and Human Rights.
•In 2021, we joined several industry working groups dedicated to helping us assess and manage nature-related risks, such as the Taskforce on Nature-related Financial Disclosure (‘TNFD’). Our asset management business also published its biodiversity policy to publicly explain how our analysts address nature-related issues.
•We continue to engage with our customers, investors and regulators proactively on the management of ESG risks. We also engage with initiatives, including the Climate Financial Risk Forum, Equator Principles, Taskforce on Climate-related Financial Disclosures and CDP (formerly the Carbon Disclosure Project) to drive best practice for climate risk management.
For further details on our approach to climate risk management, see ‘Areas of special interest’ on page 167.
For further details on ESG risk management see ‘Financial crime risk environment and ‘Regulatory compliance risk environment including conduct’ on page 153.
Our ESG review can be found on page 43.
Ibor transition
Interbank offered rates (‘Ibors’) have historically been used extensively to set interest rates on different types of financial transactions and for valuation purposes, risk measurement and performance benchmarking.
Following the UK’s Financial Conduct Authority (‘FCA’) announcement in July 2017 that it would no longer continue to persuade or require panel banks to submit rates for the London interbank offered rate (‘Libor’) after 2021, we have been actively working to transition legacy contracts from Ibors to products linked to near risk-free replacement rates (‘RFRs’) or alternative reference rates. In March 2021, in accordance with the 2017 FCA announcement, ICE Benchmark Administration Limited (‘IBA’) announced that it would cease publication of 24 of the 35 main Libor currency interest rate benchmark settings from the end of 2021, and that the most widely used US dollar Libor settings would cease from 30 June 2023. The FCA subsequently used its regulatory powers to compel IBA to publish the remaining six sterling and Japanese yen settings, from 1 January 2022, under an amended methodology, commonly known as ‘synthetic’ Libor. As a result, our focus during 2021 was on the transition of legacy contracts referencing the Euro Overnight Index average (‘Eonia’) and the Libor settings that demised from the end of 2021, including those settings subsequently being published on a ‘synthetic’ basis.
During 2021, we continued the development of IT and RFR product capabilities, implemented supporting operational processes, and engaged with our clients to discuss options for the transition of their legacy contracts. The successful implementation of new processes and controls, as well as the transition of contracts away from Ibors, reduced the heightened financial and non-financial risks to which we were exposed. However, while all but exceptional new Libor contract issuance ceased during 2021, or from the end of 2021 for US dollar Libor, we remain exposed to material risks. These include from so-called ‘tough legacy’ contracts, which have not been able to be transition to a new RFR rate and will use a ‘synthetic’ Libor or a contractual fallback rate, and from legacy contracts that reference the remaining US dollar Libor tenors, which are expected to demise from June 2023.
Financial risks have been largely mitigated as a result of the implementation of model and pricing changes. However, differences in US dollar Libor and its replacement RFR, Secured Overnight Funding Rate (‘SOFR’), create a basis risk in the trading book and banking book due to the asymmetric adoption of SOFR across assets, liabilities and products that we need to actively manage through appropriate financial hedging. Additionally, the comparatively limited use of the SOFR benchmark for new RFR products to date and lack of alignment around conventions could potentially delay transition of some US dollar contracts into 2023. This would compress the amount of time to transition these contracts, which could lead to heightened operational and conduct-related risk.
Additional non-financial risks, including regulatory compliance risk, resilience risk, financial reporting risk, and legal risk also remain for ‘tough legacy’ contracts, and the US dollar legacy portfolio. These risks continue to be actively managed and mitigated with a focus on ensuring that fair outcomes for our clients are achieved.
These risks are present in different degrees across our product offering.
Transition of legacy contracts
During 2021 we successfully transitioned over 90% of legacy Ibor lending contracts in sterling, Swiss franc, euro and Japanese yen Libor interest rates, as well as Eonia, directly or via appropriate fallback mechanisms. The majority of the remaining contracts will transition in advance of their next interest payment date, with only a small proportion of ‘tough legacy’ contracts remaining. We expect that out of approximately 5,000 lending contracts there will be less than 50 ‘tough legacy’ contracts, the majority of which will be transitioned to alternative rates during 2022. Our approach to transition ‘tough legacy’ and US dollar Libor legacy contracts will
differ by product and business area, but will be based on the lessons learned from the successful transition of contracts during 2021. We will continue to communicate with our clients and investors in a structured manner and be client led in the timing and nature of the transition.
For derivatives, approximately 99% of our sterling, Swiss franc, euro and Japanese yen Libor interest rate exposures at the end of 2021 had successfully transitioned directly or via appropriate fallback mechanisms, leaving a small number of ‘tough legacy’ contracts. Out of the approximately 13,000 bilateral derivatives trades there are expected to be less than 20 that remain ‘tough legacy’, the majority of which are expected to mature or transition in 2022. We anticipate our ‘tough legacy’ and US dollar exposure will continue to reduce through 2022 as a result of contract maturities, and active transition. We will continue to look to actively reduce our US dollar exposure by transitioning trades ahead of the demise date of 30 June 2023, by working with our clients to determine their needs and discuss how we transition their contracts. Additionally, we are working with market participants, including clearing houses, to ensure we are able to transition our cleared derivative contracts as the US dollar Libor benchmark demise date approaches.
For our loan book, approximately 85% of our reported exposure at the end of 2021 linked to sterling, Swiss franc, euro and Japanese yen Libor interest rate contracts required no further client negotiation but remained drawn as they have yet to reach their next interest payment date. The majority of the remaining exposure linked to benchmarks that demised from the end of 2021 relates to contracts where discussions with our clients and other market participants, for syndicated transactions, have continued into early 2022, in advance of their next scheduled interest payment date, and this has led to further transitions being completed. A small number of ‘tough legacy’ contracts, less than 50, that were unable to transition prior to their first interest payment date in 2022, are expected to use legislative reliefs, such as ‘synthetic’ Libor, or an alternative rate determined by the contractual fallback language, and in the main will be transitioned during 2022. For the remaining demising Ibors, notably US dollar Libor, we have implemented new products and processes and updated our systems in readiness for transition. In our US retail bank, our mortgage products are offered in SOFR, and the transition of legacy contracts will occur once an industry spread adjustment is available. Global Banking, Commercial Banking and Global Private Banking have begun to engage with clients who have upcoming contract maturities with a view to refinancing using an appropriate replacement rate. Further communications and outreach to customers with US dollar Libor contracts with later maturities will occur in due course.
For the Group’s own debt securities issuances, in 2021 HSBC launched a consent solicitation to remediate Ibor references in five of its English law governed regulatory capital and MREL sterling and Singapore dollar instruments. The proposed amendments were successfully adopted on all of the sterling instruments, but were not adopted with respect to the Singapore dollar instruments as the minimum quorum requirements were not met. The terms of these two instruments provide for an Ibor benchmark being used to reset the coupon rate if HSBC chooses not to redeem the instruments on the respective call date, or dates, for each series. We remain mindful of the various factors that impact on the Ibor remediation strategy for our regulatory capital and MREL instruments, including – but not limited to – timescales for
cessation of relevant Ibor rates, constraints relating to the governing law of outstanding instruments, and the potential relevance of legislative solutions. We remain committed in seeking to remediate or mitigate relevant risks relating to Ibor-demise, as appropriate, on our outstanding regulatory capital and MREL instruments before the relevant calculation dates, which may occur post-cessation of the relevant Ibor rate or rates. Where we hold bonds issued by other institutions, we have remained dependent on the issuer’s agents to engage in the transition process, although analysis will be undertaken of the issuers in US dollar Libor bonds to reduce our exposure, as occurred through 2021.
The completion of an orderly transition from the remaining Ibors, notably US dollar Libor, continues to be our programme’s key objective through 2022 and 2023, with the aim of putting systems and processes in place to help achieve this.
Mitigating actions
•Our global Ibor transition programme, which is overseen by the Group Chief Risk and Compliance Officer, will continue to deliver IT and operational processes to meet its objectives.
•We carry out extensive training, communication and client engagement to facilitate appropriate selection of new rates and products.
•We have dedicated teams in place to support the transition.
•We actively transitioned legacy contracts and ceased new issuance of Libor-based contracts, other than those allowed under regulatory exemptions, with associated monitoring and controls.
•We assess, monitor and dynamically manage risks arising from Ibor transition, and implement specific mitigating controls when required.
•We continue to actively engage with regulatory and industry bodies to mitigate risks relating to ‘tough legacy’ contracts.
Financial instruments impacted by Ibor reform
(Audited)
Interest Rate Benchmark Reform Phase 2, the amendments to IFRSs issued in August 2020, represents the second phase of the IASB’s project on the effects of interest rate benchmark reform. The amendments address issues affecting financial statements when changes are made to contractual cash flows and hedging relationships.
Under these amendments, changes made to a financial instrument measured at other than fair value through profit or loss that are economically equivalent and required by interest rate benchmark reform, do not result in the derecognition or a change in the carrying amount of the financial instrument. Instead they require the effective interest rate to be updated to reflect the change in the interest rate benchmark. In addition, hedge accounting will not be discontinued solely because of the replacement of the interest rate benchmark if the hedge meets other hedge accounting criteria.
| | | | | | | | | | | | | | | | | | |
| Financial instruments yet to transition to alternative benchmarks, by main benchmark |
| USD Libor | GBP Libor | JPY Libor | | | | Others1 | |
| At 31 Dec 2021 | $m | $m | $m | | | | $m | |
| Non-derivative financial assets | | | | | | | | |
| Loans and advances to customers | 70,932 | | 18,307 | | 370 | | | | | 8,259 | | |
| Other financial assets | 5,131 | | 1,098 | | — | | | | | 2 | | |
Total non-derivative financial assets2 | 76,063 | | 19,405 | | 370 | | | | | 8,261 | | |
| | | | | | | | |
| Non-derivative financial liabilities | | | | | | | | |
| Financial liabilities designated at fair value | 20,219 | | 4,019 | | 1,399 | | | | | 1 | | |
| Debt securities in issue | 5,255 | | — | | — | | | | | — | | |
| Other financial liabilities | 2,998 | | 78 | | — | | | | | — | | |
| Total non-derivative financial liabilities | 28,472 | | 4,097 | | 1,399 | | | | | 1 | | |
| | | | | | | | |
| Derivative notional contract amount | | | | | | | | |
| Foreign exchange | 137,188 | | 5,157 | | 31,470 | | | | | 9,652 | | |
| Interest rate | 2,318,613 | | 284,898 | | 72,229 | | | | | 133,667 | | |
| Others | — | | — | | — | | | | | — | | |
| Total derivative notional contract amount | 2,455,801 | | 290,055 | | 103,699 | | | | | 143,319 | | |
| | | | | | | | |
| | | | | | | | | | | | | | | | | | |
| |
| | | | | | | | |
| At 31 Dec 2020 | | | | | | | | |
| | | | | | | | |
| Non-derivative financial assets | | | | | | | | |
| Loans and advances to customers | 85,378 | | 43,681 | | 371 | | | | | 10,751 | | |
| Other financial assets | 8,770 | | 2,906 | | — | | | | | 12 | | |
Total non-derivative financial assets2 | 94,148 | | 46,587 | | 371 | | | | | 10,763 | | |
| | | | | | | | |
| Non-derivative financial liabilities | | | | | | | | |
| Financial liabilities designated at fair value | 24,350 | | 6,219 | | 1,548 | | | | | 128 | | |
| Debt securities in issue | 5,840 | | — | | — | | | | | 416 | | |
| Other financial liabilities | 3,412 | | 964 | | — | | | | | 5 | | |
| Total non-derivative financial liabilities | 33,602 | | 7,183 | | 1,548 | | | | | 549 | | |
| | | | | | | | |
| Derivative notional contract amount | | | | | | | | |
| Foreign exchange | 196,774 | | 6,374 | | 28,411 | | | | | 22,762 | | |
| Interest rate | 2,848,552 | | 1,190,491 | | 479,789 | | | | | 492,197 | | |
| Others | 11 | | — | | — | | | | | — | | |
| Total derivative notional contract amount | 3,045,337 | | 1,196,865 | | 508,200 | | | | | 514,959 | | |
1 Comprises financial instruments referencing other significant benchmark rates yet to transition to alternative benchmarks (euro Libor, Swiss franc Libor, Eonia, SOR, THBFIX and Sibor).
2 Gross carrying amount excluding allowances for expected credit losses.
The amounts in the above table relate to HSBC’s main operating entities where HSBC has material exposures impacted by Ibor reform, including in the UK, Hong Kong, France, the US, Mexico, Canada, Singapore, the UAE, Bermuda, Australia, Qatar, Germany, Japan and Thailand. The amounts provide an indication of the extent of the Group’s exposure to the Ibor benchmarks that are due to be replaced. Amounts are in respect of financial instruments that:
•contractually reference an interest rate benchmark that is planned to transition to an alternative benchmark;
•have a contractual maturity date beyond the date by which the reference interest rate benchmark is expected to cease; and
•are recognised on HSBC’s consolidated balance sheet.
In March 2021, the administrator of Libor, IBA, announced that the publication date of most US dollar Libor tenors has been extended from 31 December 2021 to 30 June 2023. Publication of one-week and two-month tenors ceased after 31 December 2021. This change, together with the extended publication dates of Sibor, SOR and THBFIX, reduce the amounts presented at 31 December 2021 in the above table as some financial instruments included at 31 December 2020 will reach their contractual maturity date prior to the extended publication dates. Comparative data have not been re-presented.
Financial crime risk environment
Financial institutions remain under considerable regulatory scrutiny regarding their ability to prevent and detect financial crime. The financial crime threats we face have continued to evolve, often in tandem with broader geopolitical, socioeconomic and technological shifts in our markets, leading to challenges such as managing conflicting laws and approaches to legal and regulatory regimes.
Financial crime risk evolved during the Covid-19 pandemic, notably with the manifestation of fraud risks linked to the economic slowdown and resulting deployment of government relief measures. The accelerated digitisation of financial services has fostered significant changes to the payments ecosystem, including a multiplicity of providers and new payment mechanisms, not all of which are subject to the same level of regulatory scrutiny or regulations as financial institutions. This is presenting increasing challenges to the industry in terms of maintaining required levels of transparency, notably where institutions serve as intermediaries. Developments around digital assets and currencies, notably the role of stablecoins and central bank digital currencies, have continued at pace, with an increasing regulatory and enforcement focus on the financial crimes linked to these types of assets.
Expectations with respect to the intersection of ESG issues and financial crime as our organisation, customers and suppliers transition to net zero, are increasing, not least with respect to potential ‘greenwashing’. Companies also face a heightened regulatory focus on both human rights issues and environmental crimes from a financial crime perspective. We also continue to face increasing challenges presented by national data privacy
requirements, which may affect our ability to manage financial crime risks holistically and effectively.
Mitigating actions
•We are strengthening our fraud and surveillance controls, and investing in next generation capabilities to fight financial crime through the application of advanced analytics and artificial intelligence (‘AI’).
•We are looking at the impact of a rapidly changing payments ecosystem to ensure our financial crime controls remain appropriate for changes in customer behaviour and gaps in regulatory coverage, including the development of procedures and controls to manage the risks associated with direct and indirect exposure to digital assets and currencies.
•We are assessing our existing policies and control framework to ensure that developments in the ESG space are considered and the risks mitigated.
•We work with jurisdictions and relevant international bodies to address data privacy challenges through international standards, guidance, and legislation to help enable effective management of financial crime risk.
•We work closely with our regulators and engage in public-private partnerships, playing an active role in shaping the industry’s financial crime controls for the future, notably with respect to the enhanced, and transparent, use of technology.
Regulatory compliance risk environment including conduct
We keep abreast of the emerging regulatory compliance and conduct agenda, which currently includes, but is not limited to: ESG matters; operational resilience; how digital and technology changes, including payments, are impacting financial institutions; how we are ensuring good customer outcomes, including addressing customer vulnerabilities; regulatory reporting; and employee compliance. We monitor regulatory developments closely and engage with regulators, as appropriate, to help ensure new regulatory requirements are implemented effectively and in a timely way.
The competitive landscape in which the Group operates may be impacted by future regulatory changes and government intervention. In the UK, potential regulatory developments include any legislative changes resulting from a statutory review of ring-fencing, which has been undertaken by an independent panel appointed by HM Treasury. The panel has recommended several adjustments to the regime and HM Treasury is reviewing these recommendations. Legislative amendments may be proposed in due course.
Mitigating actions
•We monitor for regulatory developments to understand the evolving regulatory landscape and respond with changes in a timely way.
•We engage, wherever possible, with governments and regulators to make a positive contribution to regulations and ensure that new requirements are considered properly and can be implemented effectively. We hold regular meetings with relevant authorities to discuss strategic contingency plans, including those arising from geopolitical issues.
•We launched our simplified conduct approach to align to our new purpose and values, in particular the value ‘we take responsibility’.
Cyber threat and unauthorised access to systems
Together with other organisations, we continue to operate in an increasingly hostile cyber threat environment. This requires ongoing investment in business and technical controls to defend against these threats, including potential unauthorised access to customer accounts, attacks on our systems, and attacks on our third-party suppliers.
Mitigating actions
•We continually evaluate threat levels for the most prevalent attack types and their potential outcomes. To further protect HSBC and our customers and help ensure the safe expansion of our global business lines, we strengthen our controls to reduce the likelihood and impact of advanced malware, data leakage, exposure through third parties and security vulnerabilities.
•We continue to enhance our cybersecurity capabilities, including Cloud security, identity and access management, metrics and data analytics, and third-party security reviews. An important part of our defence strategy is ensuring our colleagues remain aware of cybersecurity issues and know how to report incidents.
•We report and review cyber risk and control effectiveness at executive and non-executive Board level. We also report across our global businesses, functions and regions to help ensure appropriate visibility and governance of the risk and mitigating actions.
•We participate globally in industry bodies and working groups to collaborate on tactics employed by cyber-crime groups and to collaborate in fighting, detecting and preventing cyber-attacks on financial organisations.
Digitalisation and technological advances
Developments in technology and changes in regulations are enabling new entrants to the industry. This challenges HSBC to continue to innovate and optimise in order to take advantage of new digital capabilities to best serve our customers, and adapt our products to attract and retain customers. As a result, we may need to increase our investment in our business to modify or adapt our existing products and services or develop new products and services to respond to our customers’ needs.
Mitigating actions:
•We continue to monitor this emerging risk, as well as the advances in technology, and changes in customer behaviours to understand how these may impact our business.
•We closely monitor and assess financial crime and the impact on payment transparency and architecture.
Internally driven
Data management
We use a large number of systems and growing quantities of data to support our customers. Risk arises if data is incorrect, unavailable, misused, or unprotected. Along with other banks and financial institutions, we need to meet external regulatory obligations and laws that cover data, such as the Basel Committee on Banking Supervision’s 239 guidelines and the General Data Protection Regulation (‘GDPR’).
Mitigating actions
•Through our global data management framework, we monitor proactively the quality, availability and security of data that supports our customers and internal processes. We resolve any identified data issues in a timely manner.
•We have made improvements to our data policies and are implementing an updated control framework to enhance the end-to-end management of data risk by our global businesses, global functions and regions.
•We protect customer data via our data privacy framework, which establishes practices, design principles and guidelines that enable us to demonstrate compliance with data privacy laws and regulations.
•We continue to modernise our data and analytics infrastructure through investments in Cloud technology, data visualisation, machine learning and AI.
•We educate our employees on data risk and data management and have delivered global mandatory training on the importance of protecting data and managing data appropriately.
Model risk management
Model risk arises whenever business decision making includes reliance on models. We use models in both financial and non-financial contexts, as well as in a range of business applications such as customer selection, product pricing, financial crime transaction monitoring, creditworthiness evaluation and financial reporting. Assessing model performance is a continuous undertaking. Models can need redevelopment as market conditions change. This was required following the outbreak of Covid-19 as some models used for estimating credit losses needed to be redeveloped due to the dramatic change to inputs. This included GDP; unemployment rates; housing prices; and the varying government support measures introduced.
We prioritised the redevelopment of internal ratings-based (‘IRB’) and internal model methods (‘IMM’) models, in relation to counterparty credit, as part of the IRB repair and Basel III programmes with a key focus on enhancing the quality of data used as model inputs. Submission of these models to the UK’s Prudential Regulation Authority (‘PRA’) and other key regulators for feedback and approval is in progress. Some IMM and internal model approach (‘IMA’) models have been approved for use and feedback has been received for some IRB models. Climate risk modelling is a key focus for the Group as HSBC’s commitment to sustainability has become a critical part of the Group’s strategy.
Mitigating actions
•We further enhanced the monitoring, review and challenge of loss model performance through our Model Risk Management function as part of a broader quarterly process to determine loss levels. The Model Risk Management team aims to provide strong and effective review and challenge of any future redevelopment of these models.
•Model Risk Management works closely with businesses to ensure that IRB/IMM/IMA models in development meet risk management, pricing and capital management needs. Global Internal Audit provides assurance over the risk management framework for models.
•Additional assurance work is performed by the model risk governance teams, which act as second lines of defence. The teams test whether controls implemented by model users comply with model risk policy and if model risk standards are adequate.
•Models using advanced machine learning techniques are validated and monitored to ensure that risks that are determined by the algorithms have adequate oversight and review.
Risks arising from the receipt of services from third parties
We use third parties to provide a range of goods and services. Risks arising from the use of third-party providers and their supply chain may be harder to identify. It is critical that we ensure we have appropriate risk management policies, processes and practices over the selection, governance and oversight of third parties and their supply chain, particularly for key activities that could affect our operational resilience. Any deficiency in the management of risks associated with our third parties could affect our ability to support our customers and meet regulatory expectations.
Mitigating actions
•We have enhanced our control framework for external supplier arrangements to ensure the risks associated with third-party arrangements are understood and managed effectively by our global businesses, global functions and regions.
•We have applied the same control standards to intra-group arrangements as we have for external third-party arrangements to ensure we are managing them effectively.
•We are implementing the changes required by the new global third-party risk policy to comply with new regulations as defined by our regulators.
Risks associated with workforce capability, capacity and environmental factors with potential impact on growth
Our success in delivering our strategic priorities and managing the regulatory environment proactively depends on the development and retention of our leadership and high-performing employees. A very competitive employment market will continue to test our ability to attract and retain talent. Changed working arrangements, local Covid-19 restrictions and health concerns during the pandemic have also impacted on employee mental health and well-being.
Mitigating actions
•We have put in place measures to help support our people so they are able to work safely during the Covid-19 pandemic. While our approach to workplace recovery around the world is consistent, the measures we take in different locations are specific to their environment.
•We promote a diverse and inclusive workforce and provide active support across a wide range of health and well-being activities. We continue to build our speak-up culture through active campaigns.
•We monitor people risks that could arise due to organisational restructuring, helping to ensure we manage redundancies sensitively and support impacted employees. We encourage our people leaders to focus on talent retention at all levels, with an empathetic mindset and approach, while ensuring the whole proposition of working at HSBC is well understood.
•Our Future Skills curriculum helps provide critical skills that will enable employees and HSBC to be successful in the future.
•We continue to develop succession plans for key management roles, with actions agreed and reviewed on a regular basis by the Group Executive Committee.
IT systems infrastructure and resilience
We operate an extensive and complex technology landscape, which must remain resilient in order to support customers, the organisation and markets globally. Risks arise where technology is not understood or maintained, and development of technology is not controlled.
Mitigating actions
•We continue to invest in transforming how software solutions are developed, delivered and maintained. We concentrate on improving system resilience and service continuity testing. We continue to ensure security is built into our software development life cycle and improve our testing processes and tools.
•We continue to upgrade many of our IT systems, simplify our service provision and replace older IT infrastructure and applications. These enhancements supported global improvements in service availability during 2021 for both our customers and colleagues.
Change execution risk
We have continued our increased investment in strategic change to support the delivery of our strategic priorities and regulatory commitments. This requires change to be executed safely and efficiently.
Mitigating actions
•A global transformation programme is progressing with the delivery of strategic change commitments made in February 2020 to restructure our business, reallocate capital into higher growth and higher return businesses and markets, and to simplify our organisation to improve operational resilience and reduce costs.
•The remit of the Transformation Oversight Executive Committee, established in 2020 to oversee the global transformation programme, was expanded in 2021 to oversee the prioritisation, strategic alignment and management of execution risk for all change portfolios and initiatives.
•We continue to work to strengthen our change management practices to deliver sustainable change, increased adoption of Agile ways of working, and a more consistent standard of delivery. The Transformation Oversight Executive Committee oversees the continued embedding of our improved Group-wide change framework released in May 2021, which sets out the mandatory principles and standards relating to leading and delivering change.
We have identified a suite of risk factors that cover a broad range of risks our businesses are exposed to. These risks have the potential to have a material adverse effect on our business, financial condition, results of operations, prospects, capital position, strategy, reputation and/or customers.
They may not necessarily be deemed as top or emerging risks; however, they inform the ongoing assessment of our top and emerging risks that may result in our risk appetite being revised.
The risk factors are set out below.
Macroeconomic and geopolitical risk
Current economic and market conditions may adversely affect our results
Our earnings are affected by global and local economic and market conditions.
Uncertain and at times volatile economic conditions can create a challenging operating environment for financial services companies such as HSBC.
In particular, we have faced and may continue to face the following challenges to our operations and operating model in connection with these factors:
•the Covid-19 pandemic and its impact on global economies could have a material adverse effect on (among other things) the profitability, capital and liquidity of financial services companies such as HSBC (see 'Risks relating to the impact of Covid-19');
•the demand for borrowing from creditworthy customers may diminish during periods of recession or where economic activity slows or remains subdued;
•low or negative interest rates could impact bank profitability due to reductions in banks’ net interest income. This deterioration in bank profits might affect financial stability or cause credit supply to subsequently tighten;
•our ability to borrow from other financial institutions or to engage in funding transactions may be adversely affected by market disruption; and
•market developments may depress consumer and business confidence beyond expected levels. If economic growth is subdued, for example, asset prices and payment patterns may be adversely affected, leading to greater than expected increases in delinquencies, default rates and ECLs. However, if growth is too rapid, new asset valuation bubbles could appear, particularly in the real estate sector, with potentially negative consequences for banks.
The occurrence of any of these events or circumstances could have a material adverse effect on our business, financial condition, results of operations, prospects and customers.
Risks relating to the impact of Covid-19
The Covid-19 pandemic and its effect on the global economy have continued to impact our customers and organisation, and the future effects of the pandemic remain uncertain. Covid-19 necessitated governments to respond at unprecedented levels to protect public health, and to support local economies and livelihoods. It has affected regions at different times and to varying degrees as it has developed. The resulting government support measures and restrictions have created additional challenges given the rapid pace of change and significant operational demands. Renewed outbreaks, particularly those resulting from
the emergence of new variants of the virus, emphasise the ongoing threat of Covid-19 and could result in further tightening of government restrictions.
Over the course of 2021, government restrictions across many countries were gradually unwound, allowing the global economy to stage a robust recovery up until the fourth quarter, when the highly transmissible Omicron variant began to emerge. While government restrictions were re-imposed in many countries in response to this variant, they have in certain countries been less restrictive than those that were imposed during previous waves of the pandemic.
The global vaccination roll-out in 2021 helped reduce the social and economic impact of the Covid-19 pandemic, although there has been significant divergence in the speed at which vaccines have been deployed around the world. Most developed countries have now vaccinated a large proportion of their populations, but many less developed countries have struggled to secure supplies and are at an earlier stage of their roll-out. By the end of 2021, high vaccination rates had ensured that many Covid-19-related restrictions on activity in developed markets had been lifted and travel constraints were easing. However, the emergence of the Omicron variant, which proved to be more contagious and able, to a certain extent, to evade vaccine immunity, demonstrated the risk that new variants pose and led to government restrictions being reintroduced. A full return to pre-pandemic levels of social interaction across all our key markets is therefore, unlikely in the short to medium term. There remains a divergence in approach taken by countries with regards to the level of restrictions on activity and travel imposed in response to the pandemic. Such diverging approach to future pandemic waves could prolong or worsen supply chain and international travel disruptions. The evolving Covid-19 restrictions in Hong Kong, including travel, public gathering and social distancing restrictions are impacting the Hong Kong economy, and may affect the ability to attract and retain staff.
Mismatches between the supply and demand of goods and services contributed to a rise in inflation in 2021. Central banks in major markets are expected to raise interest rates, but such increases are expected to be gradual and monetary policy is expected to remain accommodative overall. Policy tightening in major emerging markets has already begun in order to counteract rising inflation and the risk of capital outflows. Governments are also expected to reduce the level of fiscal support they offer households and businesses as the appetite for broad lockdowns and public health restrictions decreases. Government debt has risen in most advanced economies, and is expected to remain high into the medium term. High government debt burdens have raised fiscal vulnerabilities, increasing the sensitivity of debt service costs to interest rate increases and potentially reducing the fiscal space available to address any future economic downturns.
Economic growth in the Group's major markets is expected to slow in 2022 to more sustainable rates, contingent on the successful further containment of the virus, the continued roll-out of vaccination programmes, and the evolution of other top risks.
There remains a material risk of a renewed drop in economic activity, particularly in countries with low vaccination rates. The economic fallout from Covid-19 risks increasing inequality across markets, which may leave the burden on governments and central banks to continue providing fiscal and monetary stimulus, possibly in a more targeted fashion than seen during 2020 and 2021. After financial markets suffered a sharp fall in the early phases of the spread of Covid-19, they rebounded but still remain volatile. Depending on the long-term impact on global economic growth, financial asset prices may suffer a further sharp fall.
Depending on the time taken for economic activity to return to previous levels, there could be further adverse impacts on the Group's income due to lower lending and transaction volumes and lower wealth and insurance manufacturing revenue due to equity market volatility and weakness. Lower or negative interest rates globally increase the cost of guarantees for insurance manufacturing, and there could also be adverse impacts on other assets, such as the Group's investment in Bank of
Communications Co., Limited, goodwill and other intangible assets.
The Covid-19 pandemic may also have material impacts on capital and liquidity. This may include downward customer credit rating migration, which could negatively impact the Group's risk-weighted assets ('RWAs') and capital position, and potential liquidity stress due, among other factors, to increased customer drawdowns, notwithstanding the significant initiatives that governments and central banks have put in place to support funding and liquidity. Central banks in some markets also initiated a series of capital measures, including the reduction of certain regulatory capital buffers, to support the ability of banks to supply credit to businesses and households through periods of economic disruption.
The Group continues to support its personal and business customers through market-specific measures initiated during the Covid-19 pandemic and by supporting the remaining national government schemes that focus on the parts of the economy most impacted by the pandemic.
Central bank and government actions and support measures taken in response to the Covid-19 pandemic, and the Group's responses to those, have created, and may in the future create, restrictions in relation to capital. This has limited and may in the future limit management's flexibility in managing the business and taking action in relation to capital distribution and capital allocation.
Should central banks or regulatory authorities introduce new or further restrictions in relation to our capital distributions, our ability to declare, or to pay, dividends or to carry out share buybacks may be negatively impacted.
The rapid introduction and varying nature of the government support schemes introduced throughout the Covid-19 pandemic led to increased operational risks, including complex conduct considerations, increased reputational risk and increased risk of fraud. These risks are likely to be heightened further as and when those remaining government support schemes are unwound. These events have also led to increased litigation risk.
The impact of the pandemic on the long-term prospects of businesses in the most vulnerable sectors of the economy – such as retail, hospitality and commercial real estate – remains uncertain and may lead to significant credit losses on specific exposures, which may not be fully captured in ECL estimates. In addition, in times of stress, fraudulent activity is often more prevalent, leading to potentially significant credit or operational losses.
Our financial models continue to be impacted by the pandemic. These include retail and wholesale credit models such as IFRS loss models, as well as capital models, traded risk models and models used in the asset/liability management process. This continues to require enhanced monitoring of model outputs and the use of model overlays, including management judgemental adjustments based on the expert judgement of senior credit risk managers and the recalibration of key loss models to take into account the impacts of Covid-19 on critical model inputs. See "We could incur losses or be required to hold additional capital as a result of model limitations or failure."
The operational support functions on which the Group relies are based in a number of countries worldwide, some of which were particularly affected by the Covid-19 pandemic during 2021. We continue to monitor the situation, in particular in those countries and regions where Covid-19 infections are most prevalent and/or where travel restrictions are in place.
Despite the ongoing economic recovery, significant uncertainties remain in assessing the duration and impact of the Covid-19 pandemic, including where government restrictions are re-imposed as a result of further outbreaks of the virus, in particular those outbreaks which result from the emergence of new variants. There is a risk that economic activity remains below pre-pandemic levels for a prolonged period and this could have a material adverse effect on the Group's financial condition, results of operations, prospects, liquidity, capital position and credit ratings.
We are subject to political, social and other risks in the countries in which we operate
We operate through an international network of subsidiaries and affiliates across countries and territories around the world. Our global operations are subject to potentially unfavourable political, social, environmental and economic developments in such jurisdictions, which may include:
•coups, civil wars or acts of terrorism;
•political and/or social instability;
•geopolitical tensions;
•climate change, acts of God, including epidemics and pandemics (such as Covid-19, further details on which can be found in 'Risks relating to the impact of Covid-19') and natural disasters (such as floods and hurricanes); and
•infrastructure issues, such as transportation or power failures.
Each of the above could impact credit RWAs, and the financial losses caused by any of these risk events or developments could impair asset values and the creditworthiness of customers.
These risk events or developments may also give rise to disruption to the Group's services and some may result in physical damage to our operations and/or risks to the safety of our personnel and customers.
Geopolitical tensions could have significant ramifications for the Group and its customers. In particular:
•Diplomatic tensions between China and the US, and extending to the UK, the EU, India and other countries, and developments in Hong Kong and Taiwan, may affect the Group, creating regulatory, reputational and market risks.
•In particular, the US-China relationship remains complex, with tensions over a number of critical issues. The US, the UK, the EU, Canada and other countries have imposed various sanctions and trade restrictions on Chinese individuals or companies, and the US continues to develop its approach to perceived strategic competition with China. Among these, the US Hong Kong Autonomy Act authorises the imposition of secondary sanctions against non-US financial institutions found to be knowingly engaged in significant transactions with individuals and entities subject to US sanctions for engaging in certain activities that undermine Hong Kong’s autonomy. In addition, the US has imposed restrictions on US persons’ ability to buy or sell certain publicly traded securities linked to a number of prominent Chinese companies.
•There is also a risk of increased sanctions being imposed by the US and other governments in relation to human rights, technology and other issues with China, and this could create a more complex operating environment for the Group and its customers. Notably, alongside the EU, UK, and Canada, the US has increasingly imposed sanctions and other measures in response to allegations of human rights abuses in Xinjiang.
•China, in turn, has announced a number of its own sanctions and trade restrictions that target, or provide authority to target, foreign individuals or companies. These have been imposed mainly against certain public officials associated with the implementation of foreign sanctions against China. China has also promulgated new laws that provide a legal framework for imposing further sanctions and export restrictions, including laws prohibiting implementation of – or compliance with – foreign sanctions against China and creating a private rights of action in Chinese courts for damages caused by third parties implementing foreign sanctions or other discriminatory measures.
•These and any future measures and countermeasures that may be taken by the US, China and other countries may affect the Group, its customers and the markets in which the Group operates. The financial impact to the Group of geopolitical risks in Asia is heightened due to the importance and profitability of the region, and Hong Kong in particular.
•Political disagreements between the UK and the EU, notably over the future operation of the Northern Ireland Protocol ('the protocol'), has meant work on the creation of a framework for voluntary regulatory cooperation in financial services following the UK’s withdrawal from the EU has stalled. While negotiations are continuing, it is unclear whether or when an agreement will be reached, and this has led to speculation that the UK may trigger Article 16 of the Protocol, which could suspend the operation of the Protocol in certain respects. Any decision to do so could be met with retaliatory action by the EU, complicating the terms of trade between the UK and the EU and potentially preventing progress in other areas such as financial services. See “The UK’s trading relationship with the EU, following the UK’s withdrawal from the EU, may adversely affect our operating model and financial results"
•Tensions between Russia and the US and a number of European states have heightened significantly following the increasing risk of hostilities between Russia and Ukraine. While negotiations are ongoing to seek a resolution, a continuation of or any further deterioration to the situation could have significant geopolitical implications, including economic, social and political repercussions on a number of regions that may impact HSBC and its customers. In addition, the US, the UK and the EU have threatened a significant expansion of sanctions and trade restrictions against Russia in the event of a Russian incursion into Ukraine, and Russian countermeasures are also possible.
As the geopolitical landscape evolves, the compliance by multinational corporations with their legal or regulatory obligations in one jurisdiction may be seen as supporting the law or policy objectives of that jurisdiction over another, creating additional compliance, reputational and political risks for the Group.
While it is the Group's policy to comply with all applicable laws and regulations of all jurisdictions in which it operates, geopolitical risks and tensions, and potential ambiguities in the Group’s compliance obligations, will continue to present challenges and risks for the Group and could have a material adverse impact on the Group's business, financial condition, results of operations, prospects and strategy, as well as on the Group’s customers.
We are likely to be affected by global geopolitical trends, including the risk of government intervention
While economic globalisation appears to remain deeply embedded in the international system, it is increasingly challenged by nationalism and protectionism and international institutions may be less capable of arresting this trend. A dispersion of global economic power from the US and Europe towards China and emerging markets appears to be occurring, providing a backdrop for greater US-China competition.
A rise in nationalism and protectionism, including trade barriers, may be driven by populist sentiment and structural challenges facing developed and developing economies. Similarly, if capital flows are disrupted, some emerging markets may impose protectionist measures that could affect financial institutions and their clients, and other emerging, as well as developed, markets, may be tempted to follow suit. This rise could contribute to weaker global trade, potentially affecting HSBC’s traditional lines of business.
The broad geographic footprint and coverage of HSBC will make us and our customers susceptible to protectionist measures taken by national governments and authorities, including imposition of trade tariffs, restrictions on market access, restrictions on the ability to transact on a cross border basis, expropriation, restrictions on international ownership, interest-rate caps, limits on dividend flows and increases in taxation.
There may be uncertainty as to the conflicting nature of such measures, their duration, the potential for escalation, and their potential impact on global economies. Whether these emerging trends are cyclical or permanent is hard to determine, and their causes are likely to be difficult to address. The occurrence of any of these events or circumstances could have a material adverse
effect on our business, financial condition, results of operations and prospects.
We are subject to financial and non-financial risks associated with Environmental, Social and Governance ('ESG') related matters, such as climate change, nature-related and human rights issues.
ESG related matters such as climate change, society’s impact on nature and human rights violations brings risks to our business, our customers and wider society.
Climate change, through transitional and physical channels, could have both financial and non-financial impacts on HSBC either directly or indirectly through our customers. Transition risk can arise from the move to a low-carbon economy, such as through policy, regulatory and technological changes. Physical risk can arise through increasing severity and/or frequency of severe weather or other climatic events, such as rising sea levels and flooding.
We currently expect that the following are the most likely ways in which climate risk may materialise for the Group:
•transition and physical risk may impact our corporate customers, for example if regulatory, legislative or technological developments impact customers' business models resulting in financial difficulty for customers and/or stranded assets;
•residential real estate may be affected by changes to the climate and extreme weather events which could impact both property values and the ability of borrowers to afford their mortgage payments;
•physical risk may impact HSBC’s operations, for example if flooding or extreme weather events impacted our critical operations;
•regulatory compliance risk may result from the increasing pace, breadth and depth of regulatory expectations requiring implementation in short timeframes across multiple jurisdictions;
•conduct risks could develop associated with the increasing demand for ‘green’ products where there are differing and developing standards or taxonomies; and
•reputational risks may result from our decisions on how we support our customers in high-emitting sectors, including our ability to reach our climate-related ambitions, targets and commitments.
We also face increased reputational, legal and regulatory risks as we make progress towards our net zero ambition, with stakeholders likely to place greater focus on our actions, such as the development of climate-related policies, our disclosures and financing and investment decisions relating to our ambition. We will face additional risks if we are perceived to mislead stakeholders in respect of our climate strategy, the climate impact of a product or service, or the commitments of our customers.
In addition, there is increasing evidence that a number of nature-related risks beyond climate change - which include risks that can be represented more broadly by economic dependency on nature – can and will have significant economic impact. These risks arise when the provision of natural services such as water availability, air quality, and soil quality is compromised by overpopulation, urban development, natural habitat and ecosystem loss, and other environmental stresses beyond climate change. They can show themselves in a variety of ways, including through macroeconomic, market, credit, reputational, legal and regulatory risks, for both HSBC and its customers.
The key human rights risks that currently impact HSBC include discrimination, in particular with respect to our employees and our customers, and modern slavery in our supply chains and those of our customers. Failure to manage these risks may result in negative impacts on our people (both in terms of hiring and retention), our business and our reputation. Such failure could also lead to breaches of rapidly evolving legal and regulatory
requirements and expectations in certain markets and this could have reputational, legal and financial consequences for HSBC.
Human rights issues have recently become a focus for geopolitical tensions, notably between the US and China, and these issues are further heightened for HSBC due to its extensive geographic footprint and presence in a number of markets.
In respect of all ESG-related risks, we also need to ensure that our strategy and business model, including the products and services we provide to customers and non-financial risk management processes (including processes to measure and manage the various financial and non-financial risks the Group faces as a result of ESG related matters) adapt to meet regulatory requirements and stakeholder and market expectations, which continue to evolve significantly and at pace. Achieving our strategy with respect to ESG matters, including any ESG-related ambitions, commitments and targets that we may set, will depend on a number of different factors outside of the Group’s control, such as advancements in technologies and supportive public policies in the markets where we operate. If these external factors and other changes do not occur, or do not occur on a timely basis, the Group may fail to achieve its ESG related ambitions, commitments and targets.
In order to track and report on our progress against our ESG-related ambitions, commitments and targets, we rely on internal and, where appropriate and available, external data sources, guided by certain industry standards. While ESG related reporting has improved over time, data remains of limited quality and consistency. Methodologies we have used may develop over time in line with market practice, regulation and/or developments in science, where applicable. Any such developments in methodologies, and changes in the availability and quality of data over time could result in revisions to reported data going forward, including on financed emissions, meaning that such data may not be reconcilable or comparable year-on-year. This could also result in the Group having to re-evaluate its progress towards its ESG-related ambitions, commitments and targets in the future and this could result in reputational, legal and regulatory risks.
If any of the above risks materialise, this could have financial and non-financial impacts for HSBC which could, in turn, have a material adverse effect on our business, financial condition, results of operations, reputation, prospects and strategy.
The UK’s trading relationship with the EU, following the UK's withdrawal from the EU, may adversely affect our operating model and financial results
The EU and the UK agreed a Trade and Cooperation Agreement on 31 December 2020, following the UK’s withdrawal from the EU. The agreement mainly focused on goods and services but also covered a wide range of other areas, including competition, state aid, tax, fisheries, transport, data and security. While the agreement only addressed financial services in a limited manner, bilateral discussions have now concluded at a technical level to create a framework for voluntary regulatory cooperation in financial services between the UK and EU through the establishment of a Joint UK-EU Financial Regulatory Forum. This is expected to provide a platform within which both parties will be able to discuss financial services-rellated issues, including future equivalence determinations.
Broader political disagreements, notably over the future operation of the Northern Ireland Protocol, have, however, increased tensions in the UK-EU relationship. While negotiations relating to the Protocol between the UK and the EU are continuing, it remains uncertain whether an agreement will be reached. If the failure to reach an agreement were to lead to the UK triggering Article 16 of the Protocol, this could suspend the Protocol’s operation in certain respects, which may further complicate the terms of trade between the UK and the EU and prevent progress in other areas such as financial services.
As the financial passporting arrangement that existed prior to, and during, the transition period expired, we put in place new arrangements in the provision of cross-border banking and investment services to customers and counterparties in the EEA. Notwithstanding the progress made in ensuring we were prepared
for the end of the transition period, there remain risks, many of them linked to the uncertain outcome of ongoing negotiations relating to potential developments in the financial services trading relationship between the UK and EU, including the rules under which financial services may be provided on a cross-border basis into the EU and its member states. Significant uncertainty also remains as to the extent to which EU laws will diverge from UK law (including bank regulation) in the future. Any changes to the current rules in this respect and any further divergences in the legal regimes could require modifications to our UK and European operating models, with resulting impacts to our clients and employees. The exact impacts on our clients will depend on the nature of any developments and their individual circumstances and, in a worst case scenario, could include disruption to the provision of products and services, and this could in turn increase operational complexity and/or costs for the Group.
More generally, over the medium to long term, the UK’s withdrawal from the EU and the operation of the Trade and Cooperation Agreement (and any complexities that may result there from), may lead to increased market volatility and economic risk, particularly in the UK, which could adversely impact our profitability and prospects for growth in this market.
In addition, the UK’s future trading relationship with the EU and the rest of the world will likely take a number of years to fully resolve. This may result in a prolonged period of uncertainty, unstable economic conditions and market volatility. This could include reduced international trade flows and loss of export market shares, as well as currency fluctuations.
We operate in markets that are highly competitive
We compete with other financial institutions in a highly competitive industry that continues to undergo significant change as a result of financial regulatory reform, including Open Banking in the UK, as well as increased public scrutiny and a continued challenging macro-economic environment.
We target internationally mobile clients who need sophisticated global solutions. We generally compete on the basis of the quality of our customer service; the wide variety of products and services that we can offer our customers; the ability of our products and services to satisfy our customers’ needs; the extensive distribution channels available for our customers;our innovation; and our reputation. Continued and increased competition in any one or all of these areas may negatively affect our market share and/or cause us to increase our capital investment in our businesses in order to remain competitive. Additionally, our products and services may not be accepted by our targeted clients.
In many markets, there is increased competitive pressure to provide products and services at current or lower prices.
Consequently, our ability to reposition or reprice our products and services from time to time may be limited, and could be influenced significantly by the actions of our competitors who may or may not charge similar fees for their products and services. Any changes in the types of products and services that we offer our customers, and/or the pricing for those products and services, could result in a loss of customers and market share.
Further, new entrants to the market or new technologies challenge HSBC to continue to innovate and optimise to take advantage of new digital capabilities to best serve our customers, and adapt our products to attract and retain customers. We may not respond effectively to these competitive threats from existing and new competitors, and as a result may need to increase our investment in our business to modify or adapt our existing products and services or develop new products and services to respond to our customers’ needs.
Any of these factors could have a material adverse effect on our business, financial condition, results of operations, prospects and reputation.
Changes in foreign currency exchange rates may affect our results
We prepare our accounts in US dollars because the US dollar and currencies linked to it form the major currency bloc in which we
transact and fund our business. However, a substantial portion of our assets, liabilities, assets under management, revenues and expenses are denominated in other currencies. Changes in foreign exchange rates, including those that may result from a currency becoming de-pegged from the US dollar, have an effect on our accounting standards, reported income, cash flows and shareholders’ equity. Unfavourable changes in foreign exchange rates could have a material adverse effect on our business, financial condition, results of operations and prospects.
Market fluctuations may reduce our income or the value of our portfolios
Our businesses are inherently subject to risks in financial markets and in the wider economy, including changes in, and increased volatility of, interest rates, inflation rates, credit spreads, foreign exchange rates, commodity, equity, bond and property prices, and the risk that our customers act in a manner inconsistent with our business, pricing and hedging assumptions.
Market pricing can be volatile and ongoing market movements could significantly affect us in a number of key areas. For example, banking and trading activities are subject to interest rate risk, foreign exchange risk, inflation risk and credit spread risk. Changes in interest rate levels, interbank spreads over official rates and yield curves affect the interest rate spread realised between lending and borrowing costs. The potential for future volatility and margin changes remains. See 'Risks relating to the impact of Covid-19' above regarding the impact of Covid-19 on the interest rate environment.
Competitive pressures on fixed rates or product terms in existing loans and deposits sometimes restrict our ability to change interest rates applying to customers in response to changes in official and wholesale market rates. Our pension scheme assets include equity and debt securities, the cash flows of which change as equity prices and interest rates vary.
Our insurance businesses are exposed to the risk that market fluctuations may cause mismatches to occur between product liabilities and the investment assets that back them. Market risks can affect our insurance products in a number of ways depending upon the product and associated contract. For example, mismatches between assets and liability yields and maturities give rise to interest rate risk. Some of these risks are borne directly by the customer and some are borne by the insurance businesses, with their excess capital invested in the markets. Some insurance contracts involve guarantees and options that increase in value in adverse investment markets. There is a risk that the insurance businesses could bear some of the cost of such guarantees and options. The performance of the investment markets could thus have a direct effect upon the value embedded in the insurance and investment contracts and our operating results, financial condition and prospects.
It is difficult to predict with any degree of accuracy changes in market conditions, and such changes could have a material adverse effect on our business, financial condition, results of operations and prospects.
Liquidity, or ready access to funds, is essential to our businesses
Our ability to borrow on a secured or unsecured basis, and the cost of doing so, can be affected by increases in interest rates or credit spreads, the availability of credit, regulatory requirements relating to liquidity or the market perceptions of risk relating to the Group or the banking sector, including our perceived or actual creditworthiness.
Current accounts and savings deposits payable on demand or at short notice form a significant part of our funding, and we place considerable importance on maintaining their stability. For deposits, stability depends upon preserving investor confidence in our capital strength and liquidity, and on comparable and transparent pricing. Although deposits have been a stable source of funding historically, this may not continue.
We also access wholesale markets in order to provide funding for entities that do not accept deposits, to align asset and liability
maturities and currencies, and to maintain a presence in local markets. In 2021 we issued the equivalent of $24.3bn of debt securities in the public capital markets in a range of currencies and maturities from a number of Group entities, including $19bn of senior securities issued by HSBC Holdings.
An inability to obtain financing in the unsecured long-term or short-term debt capital markets, or to access the secured lending markets, could have a material adverse effect on our liquidity.
Unfavourable macroeconomic developments, market disruptions or regulatory developments may increase our funding costs or challenge our ability to raise funds to support or expand our businesses.
If we are unable to raise funds through deposits and/or in the capital markets, our liquidity position could be adversely affected, and we might be unable to meet deposit withdrawals on demand or at their contractual maturity, to repay borrowings as they mature, to meet our obligations under committed financing facilities and insurance contracts or to fund new loans, investments and businesses.
We may need to liquidate unencumbered assets to meet our liabilities. In a time of reduced liquidity, we may be unable to sell some of our assets, or we may need to sell assets at reduced prices, which in either case could materially adversely affect our business, financial condition, results of operations and prospects.
Macro-prudential, regulatory and legal risks to our business model
We are subject to numerous legislative or regulatory requirements and developments and changes in the policy of regulators or governments and we may fail to comply with applicable regulations, particularly any changes thereto
Our businesses are subject to ongoing regulation and associated regulatory risks, including the effects of changes in the laws, regulations, policies, voluntary codes of practice and interpretations in the UK, the US, Hong Kong, the EU, China and the other markets in which we operate. Many regulatory changes relevant to our business may have an effect beyond the country in which they are enacted, either because our regulators deliberately enact regulation with extra-territorial impact or our global operations mean that the Group is obliged to give effect to ‘local’ laws and regulations on a wider basis.
In recent years, regulators and governments have focused on reforming both the prudential regulation of the financial services industry and the ways in which the business of financial services is conducted. Measures taken include enhanced capital, liquidity and funding requirements, the separation or prohibition of certain activities by banks, changes in the operation of capital markets activities, the introduction of tax levies and transaction taxes, changes in compensation practices and more detailed requirements on how business is conducted. The governments and regulators in the UK, the US, Hong Kong, the EU or elsewhere may intervene further in relation to areas of industry risk already identified, or in new areas, which could adversely affect us.
Specific areas where regulatory changes could have a material effect on our business, financial condition, results of operations, prospects, capital position, and reputation and current and anticipated areas of particular focus for HSBC’s regulators, include, but are not limited to:
•the ongoing regulatory response to the Covid-19 pandemic and its implications for banks credit risk management and provisioning processes, capital adequacy and liquidity, and a renewed focus on vulnerable customers including the treatment of customers, including consideration of longer-term initiatives to support borrowers in financial difficulty and measures designed to maximise access to cash for consumers;
•the increasing focus by regulators, international bodies, organisations and unions on how institutions conduct business, particularly with regard to the delivery of fair outcomes for customers, promoting effective competition in the interests of
consumers and ensuring the orderly and transparent operation of global financial markets, including the proposed introduction in the UK of a new Consumer Duty and measures resulting from ongoing thematic reviews into the workings of the retail, SME and wholesale banking sectors and the provision of financial advice to consumers;
•the implementation of any conduct measures as a result of regulators’ focus on organisational culture, employee behaviour and whistleblowing;
•the demise of certain Ibor reference rates and the transition to new replacement rates (as discussed further under ‘We may not manage risks associated with the replacement of benchmark rates and indices effectively’);
•reviews of regulatory frameworks applicable to the wholesale financial markets, including reforms and other changes to conduct of business, listing, securitisation and derivatives related requirements;
•the focus globally on technology adoption and digital delivery, underpinned by customer protection, including the use of artificial intelligence and digital assets (data, identity and disclosures), financial technology risks, payments and related infrastructure, operational resilience, virtual currencies (including central bank digital currencies and global stablecoins) and cybersecurity. This also includes the introduction of new and/or enhanced regulatory standards in these areas;
•the increased supervisory expectations arising from expanding and increasingly complex regulatory reporting obligations, including expectations on data integrity and associated governance and controls, as evidenced in regulatory fines imposed against other financial institutions. HSBC has commissioned a number of independent external reviews of its regulatory reporting processes and controls, some at the request of its regulators, including one of its credit risk RWA reporting process which is currently ongoing;
•increasing regulatory expectations of firms around governance and risk management frameworks, particularly for management of climate change, diversity and inclusion and other ESG risks and enhanced ESG disclosure and reporting obligations;
•the continued evolution of the UK’s regulatory framework following the UK's withdrawal from the EU, and similarly regarding the access of UK and other non-EU financial institutions to EU markets, for example, in the light of proposals within the EU Commission’s CRDVI package which could restrict cross border activity by non-EU firms without a branch, except on a reverse solicitation basis. For further details see 'The UK’s trading relationship with the EU, following the UK's withdrawal from the EU, may adversely affect our operating model and financial results';
•the recommendations of an independent panel appointed by HM Treasury which undertook a statutory review of the UK regime for ring-fencing and proprietary trading during 2021 are expected during the first quarter of 2022. This may result in proposed legislative amendments to the regime in due course;
•the implementation of the reforms to the Basel III package, which includes changes to the RWA approaches to credit risk, market risk, counterparty risk, operational risk, and credit valuation adjustments and the application of RWA floors and the leverage ratio (as discussed further under the 'Risks to Capital’ section on page 225;
•the implementation of more stringent capital, liquidity and funding requirements, including changes to IRB modelling;
•the financial effects of climate changes being incorporated within the global prudential framework, including the transition risks resulting from a shift to a low carbon economy;
•restrictions on the structure of remuneration and increasing requirements to detail management accountability within the
Group (for example, the requirements of the Senior Managers and Certification Regime in the UK and similar regimes in Hong Kong, Singapore, Australia and elsewhere that are either in effect or under consideration/implementation);
•changes in national or supra-national requirements regarding the ability to offshore or outsource the provision of services and resources or transfer material risk to financial services companies located in other countries, which impact our ability to implement globally consistent and efficient operating models;
•financial crime, fraud and market abuse standards and increasing expectations for related control frameworks, to ensure firms are adapting to new threats such as those arising from the Covid-19 pandemic, and are protecting customers from cyber-enabled crime;
•the application and enforcement of economic sanctions including those with extra-territorial effect and those arising from geopolitical tensions (see ‘We are subject to political, social and other risks in the countries in which we operate’);
•requirements flowing from arrangements for the resolution strategy of the Group and its individual operating entities that may have different effects in different countries;
•the increasing regulatory expectations and requirements relating to various aspects of operational resilience, including an increasing focus on the response of institutions to operational disruptions; and
•continuing regulatory focus on the effectiveness of internal controls and risk management frameworks, as evidenced in regulatory fines and other measures imposed against other financial institutions.
We may not manage risks associated with the replacement of benchmark rates and indices effectively
Key benchmark rates and indices, including interbank offered rates (“Ibors”) such as the London interbank offered rate (‘Libor’), have been the subject of national, international and other regulatory scrutiny and reform for a number of years. This has resulted in significant changes to the methodology and operation of certain benchmarks and indices, the adoption of replacement near risk free rates (“RFRs”) and the proposed discontinuation of certain reference rates (including Libor). In May 2019, the European Money Markets Institute (‘EMMI’) announced the cessation of the Euro Overnight Index average (Eonia) from the end of 2021 and, in March 2021, ICE Benchmark Administration Limited (‘IBA’) announced that it would cease publication of (i) all sterling, Euro, Swiss franc and Japanese yen settings, and the 1-week and 2-month U.S. dollar Libor settings immediately after 31 December 2021 and (ii) the remaining U.S. dollar Libor settings immediately after 30 June 2023. The FCA subsequently used its regulatory powers to compel IBA to publish a number of sterling and Japanese Yen Libor settings on an alternative methodology basis (so-called “synthetic Libor”) from 1 January 2022 for an undetermined period of time.
The discontinuation of sterling, Swiss franc, Euro and Japanese Yen Libor interest rates, and Eonia has occurred with the adoption of respective replacement near risk free rates (‘RFR’).
The continued existence of legacy contracts in benchmark rates that demised from the end of 2021, so called ‘tough legacy,’ and legacy contracts referencing other Ibors that are expected to demise at a later date, notably a number of US dollar Libor settings, results in a number of risks for HSBC, its clients and the financial services industry more widely. These include but are not limited to;
•Regulatory compliance, legal and conduct risks, that arise from the transition of legacy contracts to RFRs or alternative rates and from the sales of products referencing RFRs could lead to unintended or unfavourable outcomes for clients and market participants. These risks could be heightened if HSBC’s sales processes and procedures are not appropriately adapted or
executed to detail the risks and complexity of the RFR market conventions;
•Legal risks are associated with legacy contracts that HSBC is unable to appropriately transition and legacy contracts that rely on the use of legislative solutions, such as 'synthetic' Libor. If HSBC is unable to appropriately transition legacy contracts this could lead to reliance on fallback provisions which do not contemplate the permanent cessation of the relevant Ibor, and there is a risk that these fallback provisions do not work from a contractual, practical or financial perspective, potentially resulting in unintended outcomes for clients. While legislative solutions are (in some circumstances) expected to assist market participants with transitioning contracts or mitigating risks associated with 'tough legacy' contracts, there remains some uncertainty around the operation and implementation of such solutions as well as their longevity. For legacy contracts that utilise 'synthetic' Libor there is a risk that we are unable to transition such contracts to a new RFR or alternative rate before the relevant 'synthetic' Libor is discontinued. This could lead to reliance on the above mentioned fallback provisions, which do not contemplate permanent cessation of Libor. Each of these issues could result in unintended or unfavourable outcomes for clients and market participants and this could potentially increase the risk of disputes;
•Financial risks result from the discontinuation of US dollar Libor and the development of liquidity in its replacement RFR, Secured Overnight Funding rate (‘SOFR’). Differences in US dollar Libor and SOFR interest rate levels create a basis risk in the trading book and banking book due to asymmetric adoption of SOFR across assets, liabilities and products that we need to actively manage through appropriate financial hedging. In addition, this may limit the ability to hedge effectively; and
•Resilience and operational risks, resulting from ‘tough legacy’ and other legacy Ibor contracts that are expected to be transitioned to RFRs and alternative rates. In particular, there is a risk that our systems, processes and controls have not been appropriately adapted to account for new RFR methodology changes or fallback provisions, leading to complaints and disputes. The operational and resilience risks may be further heightened if there is a slow take-up of the use of the SOFR benchmark for new financing and hedging activities in 2022, as this could compress the timelines for transition of legacy contracts referencing US dollar Libor settings that are demising in 2023.
If any of these risks materialise this could have a material adverse effect on our business, financial condition, results of operations, prospects and customers.
We are subject to the risk of current and future legal, regulatory or administrative actions and investigations, the outcomes of which are inherently difficult to predict
We face significant risks in our business relating to legal, regulatory or administrative actions and investigations. The volume and amount of damages claimed in litigation, regulatory proceedings, investigations, administrative actions and other adversarial proceedings against financial institutions are increasing for many reasons, including a substantial increase in the number of regulatory changes taking place globally, increasing focus from regulators, investors and other stakeholders on ESG disclosures, including in relation to the measurement and reporting of such matters as both local and international standards in this area continue to significantly evolve and develop, increased media attention and higher expectations from regulators and the public. In addition, criminal prosecutions of financial institutions for, among other things, alleged conduct breaches, breaches of AML, anti-bribery/corruption and sanctions regulations, antitrust violations, market manipulation, aiding and abetting tax evasion, and providing unlicensed cross-border banking services, have become more commonplace and may increase in frequency due to increased media attention and higher expectations from prosecutors and the public.
Any such legal, regulatory or administrative action or investigation against HSBC Holdings or one or more of our subsidiaries could result in, among other things, substantial fines, civil penalties, criminal penalties, cease and desist orders, forfeitures, the suspension or revocation of key licences, requirements to exit certain businesses, other disciplinary actions and/or withdrawal of funding from depositors and other stakeholders. Any threatened or actual litigation, regulatory proceeding, administrative action, investigation or other adversarial proceeding against HSBC Holdings or one or more of our subsidiaries could have a material adverse effect on our business, financial condition, results of operations, prospects and reputation. Additionally, the Group’s financial statements reflect provisioning for legal proceedings, regulatory and customer remediation matters. Provisions for legal proceedings, regulatory and customer remediation matters, such as, for example, the customer redress programme related to and any legal claims resulting from the mis-selling of payment protection insurance policies, typically require a higher degree of judgement than other types of provisions, and the actual costs resulting from such proceedings and matters may exceed existing provisioning.
Additionally, as described in Note 34 on the Financial Statements, we continue to be subject to a number of material legal proceedings, regulatory actions and investigations, the outcomes of which are inherently difficult to predict, particularly those cases in which the matters are brought on behalf of various classes of claimants, seek damages of unspecified or indeterminate amounts or involve novel legal claims. Moreover, we may face additional legal proceedings, investigations or regulatory actions in the future, including in other jurisdictions and/or with respect to matters similar to, or broader than, the existing legal proceedings, investigations or regulatory actions. An unfavourable result in one or more of these proceedings could have a material adverse effect on our business, financial condition, results of operations, prospects and reputation.
We may fail to meet the requirements of regulatory stress tests
We are subject to regulatory stress testing in many jurisdictions, which are described on page 246. These exercises are designed to assess the resilience of banks to potential adverse economic or financial developments and ensure that they have robust, forward-looking capital planning processes that account for the risks associated with their business profile. Assessment by regulators is on both a quantitative and qualitative basis, the latter focusing on our data provision, stress testing capability and internal management processes and controls.
Failure to meet quantitative or qualitative requirements of regulatory stress test programmes, or the failure by regulators to approve our stress results and capital plans, could result in the Group being required to enhance its capital position and/or position additional capital in specific subsidiaries, and this could, in turn, have a material adverse effect on our business, financial condition, results of operations, prospects, capital position and reputation.
We and our UK subsidiaries may become subject to stabilisation provisions under the Banking Act, in certain significant stress situations
The Banking Act implemented the BRRD in the UK and creates a special resolution regime (the ‘SRR’). Under the SRR, HM Treasury, the BoE and the PRA and FCA (together, the ‘Authorities’) are granted substantial powers to implement resolution measures and stabilisation options with respect to UK banks or certain investment firms in circumstances in which the relevant Authority is satisfied that the resolution conditions are met. The SRR presently consists of five stabilisation options:
(i) transfer of all of the business of a relevant entity or the shares of the relevant entity to a private sector purchaser; (ii) transfer of all or part of the business of the relevant entity to a ‘bridge bank’ wholly owned by the BoE; (iii) transfer of part of the assets, rights or liabilities of the relevant entity to one or more asset management vehicles for management of the transferor’s assets, rights or liabilities; (iv) the write-down, conversation, transfer,
modification, or suspension of the relevant entity’s equity, capital instruments and liabilities (the so-called “bail-in power”); and
(v) temporary public ownership of the relevant entity. These tools may also be applied to a parent company or affiliate of a UK bank or relevant investment firm (which, in respect of HSBC, could include HSBC Holdings) where certain conditions are met. In addition, the SRR provides for modified insolvency and administration procedures for relevant entities. It also confers ancillary powers on the Authorities, including the power to modify or override certain contractual arrangements in certain circumstances.
The Authorities are also empowered by order to amend the law for the purpose of enabling the powers under the SRR to be used effectively. Such orders may promulgate provisions with retrospective applicability.
In addition to the stabilisation options, the relevant Authority may, in certain circumstances, in accordance with the Banking Act, require the permanent write-down or conversion into equity of any outstanding tier 1 capital instruments and tier 2 capital instruments prior to the exercise of any stabilisation option (including the bail-in power), which may lead to the cancellation, transfer or dilution of HSBC Holdings’ ordinary share capital.
In general, the Banking Act requires the Authorities to have regard to specified objectives in exercising the powers provided for by the Banking Act. One of the objectives (which is required to be balanced as appropriate with the other specified objectives) refers to the protection and enhancement of the stability of the financial system of the UK. The Banking Act includes, in certain circumstances, and with respect to the exercise of certain powers provided for by the Banking Act, provisions related to compensation in respect of transfer instruments and orders made under it. This includes a ‘no creditor worse off’ safeguard, which requires that no shareholder or creditor must be left worse off from the use of resolution powers than they would have been had the entity entered insolvency rather than resolution.
However, if we are at or approaching the point where we may be deemed by our regulators to be failing, or likely to fail, such as to require regulatory intervention, any exercise of the above mentioned powers by the Authorities may result in holders of our ordinary shares, or other instruments that may fall within the scope of the ‘bail in’ or other write-down and conversion powers granted under the Banking Act, being materially adversely affected, including by the cancellation of shares, the write-down or conversion into shares of other instruments, the transfer of shares to a third party appointed by the BoE, the loss of rights associated with shares or other instruments (including rights to dividends or interest payments), the dilution of their percentage ownership of our share capital, and any corresponding material adverse effect on the market price of our ordinary shares and other instruments.
We are subject to tax-related risks in the countries in which we operate
We are subject to the substance and interpretation of tax laws in all countries in which we operate and are subject to routine review and audit by tax authorities in relation thereto. Our interpretation or application of these tax laws may differ from those of the relevant tax authorities and we provide for potential tax liabilities that may arise on the basis of the amounts expected to be paid to the tax authorities. The amounts ultimately paid may differ materially from the amounts provided depending on the ultimate resolution of such matters. In December 2021, the OECD published model rules that provided a template for countries to implement a new global minimum tax rate of 15% from 2023. In January 2022, the UK government opened a consultation on how the UK implements the rules. The impact on HSBC will depend on exactly how the UK implements the model rules, as well as the profitability and local tax liabilities of HSBC’s operations in each tax jurisdiction from 2023. Separately, potential changes to tax legislation and tax rates in the countries in which we operate could increase our effective tax rate in future as governments seek revenue to pay for Covid-19 support packages.
Risks related to our operations
Our operations are highly dependent on our information technology systems
The reliability and security of the HSBC Group's information technology infrastructure is crucial to HSBC Group's provision of banking services and protecting the HSBC brand.
The effective functioning of our payment systems, financial control, risk management, credit analysis and reporting, accounting, customer service and other information technology systems, as well as the communication networks between our branches and main data processing centres, are important to our operations.
Critical system failure, prolonged service unavailability or a material breach of data security, particularly of confidential customer data, could compromise HSBC Group's ability to service its clients, could breach regulations and could cause long-term damage to our business and brand that could have a material adverse effect on the HSBC Group's business, financial condition, results of operations, prospects and reputation.
We remain susceptible to a wide range of cyber risks that impact and/or are facilitated by technology
The threat of cyber-attacks remains a concern for our organisation, as it does across the entire financial sector. Failure to protect our operations from cyber-attacks may result in financial loss, disruption for customers or a loss of data. This could negatively affect our reputation and ability to attract and retain customers, and as we continue to grow and digitise at scale, we may be exposed to new cyber threats.
Adversaries attempt to achieve their objectives by compromising HSBC and related third party systems. They use techniques that include malware (including ransomware), exploitation of both known and unpublished (zero-day) vulnerabilities in vendor-supplied and HSBC-developed software, phishing emails, distributed denial of service, as well as potentially physical compromise of premises and coercion of staff. Our customers are also subject to these cyber-attack techniques. These techniques are constantly evolving and cyber-attacks are increasing in terms of frequency, sophistication, impact and severity. The Group, like other financial institutions, experiences numerous attempts to compromise its cyber security. We expect to continue to be the target of such attacks in the future.
Cybersecurity risks will continue to increase, due to factors such as the increasing demand across the industry and customers’ expectations for the continued expansion of services delivered over the internet; increasing reliance on internet-based products, applications and data storage; and changes in ways of working by HSBC’s employees, contractors, third party service providers and suppliers and their sub-contractors in response to the Covid-19 pandemic.
A failure in HSBC’s adherence to its cyber security policies, procedures or controls, employee malfeasance, or human, governance or technological error could also compromise HSBC’s ability to successfully defend against cyber-attacks. Should any of the aforementioned cybersecurity risks materialise, they could have a material adverse effect on our customers, business, financial condition, results of operations, prospects, and reputation.
We could incur losses or be required to hold additional capital as a result of model limitations or failure
HSBC uses models for a range of purposes in managing its business, including regulatory capital calculations, stress testing, credit approvals, calculation of ECLs on an IFRS9, Financial Instruments ('IFRS9') basis, financial crime and fraud risk management and financial reporting. HSBC could face adverse consequences as a result of decisions that may lead to actions by management based on models that are poorly developed, implemented or used, or as a result of the modelled outcome being misunderstood or the use of such information for purposes for which it was not designed or by inherent limitations arising
from the uncertainty inherent in predicting or estimating future outcomes. Regulatory scrutiny and supervisory concerns over banks’ use of models is considerable, particularly the internal models and assumptions used by banks in the calculation of regulatory capital. If regulatory approval for key capital models is not achieved in a timely manner or if those models are subject to review and challenge, HSBC could be required to hold additional capital. Evolving regulatory requirements have resulted in changes to HSBC’s approach to model risk management, which poses execution challenges. The adoption of more sophisticated modelling approaches including artificial intelligence related risks and technology by both HSBC and the financial services industry could also lead to increased model risk. HSBC’s commitment to changes to business activities due to climate and sustainability challenges will also have an impact on model risk going forward. Models will play an important role in risk management and financial reporting of climate related risks. Challenges such as uncertainty of the long dated impacts of climate change and lack of robust and high quality climate related data present challenges to creating reliable and accurate model outputs for these models.
The economic consequences of the Covid-19 pandemic have impacted the reliability of model outputs beyond how IFRS 9 models have been built and calibrated to operate. Moreover, complexities of current governmental support programmes and regulatory guidance on the treatment of customer impacts, such as forbearance and payment holidays, and the unpredictable pathways of the pandemic, cannot realistically be factored into the modelling. Consequently, IFRS 9 models under the current economic conditions are generating outputs that do not accurately assess the actual level of credit quality in all cases. In order to calculate more realistic valuation of assets, compensating controls, such as post model management adjustments based on expert judgement are required. Such compensating controls require a significant degree of management judgment and assumptions. There is a risk that future actual results/performance may differ from such judgments and assumptions.
Risks arising from the use of models could have a material adverse effect on our business, financial condition, results of operations, prospects, capital position and reputation.
Our operations utilise third-party suppliers and service providers
HSBC relies on third parties to supply goods and services. The use of third-party service providers by financial institutions is of particular focus to global regulators. This includes how outsourcing decisions are made, how key relationships are managed and our understanding of third party dependencies and their impact on service provision.
The inadequate management of third-party risk could impact our ability to meet strategic, regulatory and client expectations.
This may lead to a range of impacts, including regulatory censure, civil penalties or damage both to shareholder value and to our reputation, which could have a material adverse effect on our business, financial condition, results of operations, prospects and strategy.
Risks related to our governance and internal controls
Our data management and data privacy controls must be sufficiently robust to support the increasing data volumes and evolving regulations.
As HSBC Group becomes more data-driven and our business processes move to digital channels, the volume of data that we rely on has grown. As a result, management of data (including data retention and deletion, data quality, data privacy and data architecture policies and procedures) from creation to destruction must be robust and designed to identify quality and availability issues. Inadequate data management could result in negative impacts to customer service, business process, or require manual intervention and reconciliation to reduce the risk of errors in reporting to senior management, regulators, or executives.
In addition, failure to comply with data privacy laws and other legislation in the jurisdictions in which we operate may result in regulatory sanctions. Any of these failures could have a material adverse effect on our business, financial condition, results of operations, prospects and reputation.
Third parties may use us as a conduit for illegal activities without our knowledge
We are required to comply with applicable AML and sanctions laws and regulations, and have adopted various policies and procedures, including internal control and ‘know your customer’ procedures, aimed at preventing use of HSBC products and services for the purpose of committing or concealing financial crime. Moreover, in relevant situations, and where permitted by regulation, we may rely upon certain counterparties to maintain and properly apply their own appropriate AML procedures. While permitted by regulation, such reliance may not prevent third parties from using us (and our relevant counterparties) as a conduit for money laundering, without our knowledge (and that of our relevant counterparties). Further, a major focus of US and UK government policy relating to financial institutions in recent years has been combating money laundering and enforcing compliance with US and EU sanctions.
HSBC Bank USA has taken a number of remedial actions as a result of the matters to which the AML DPA related, which are intended to better protect the Group’s businesses in respect of these risks. However, there can be no assurance that these will be completely effective.
Becoming a party to, associated with, or even accusations of being associated with, money laundering, or violations of sanctions laws or regulations could damage our reputation and could make us subject to fines, sanctions and/or legal enforcement. Any one of these outcomes could have a material adverse effect on our business, financial condition, results of operations, prospects and reputation.
HSBC Bank USA, as the primary US dollar correspondent bank for the Group, is subject to heightened financial crime risk arising from business conducted on behalf of its non-US HSBC affiliates. HSBC Bank USA has implemented policies, procedures and controls reasonably designed to comply with financial crime legal and regulatory requirements and mitigate financial crime risk from its affiliates. Nevertheless, in the event that these controls are ineffective, it could lead to a breach of these requirements resulting in a potential enforcement action by OFAC or other US agencies that may include substantial fines or penalties. Any such action against HSBC Bank USA could have a material adverse effect on our business, financial condition, results of operations, prospects and reputation.
We may suffer losses due to employee misconduct
Our businesses are exposed to risk from potential non-compliance with Group policies, including the HSBC Values, and related behaviours and employee misconduct such as fraud, negligence or non-financial misconduct, all of which could result in regulatory sanctions and/or reputational or financial harm. In recent years, a number of multinational financial institutions have suffered material losses due to the actions of ‘rogue traders’ or other employees. It is not always possible to deter employee misconduct, and the precautions we take to prevent and detect this activity may not always be effective. Misconduct risks could be increased if prevent and detect measures are less effective because of remote and home working. Employee misconduct or regulatory sanctions if a regulator deems HSBC's actions to deter such activity to be insufficient, could have a material adverse effect on our business, financial condition, results of operations, prospects and reputation.
The delivery of our strategic actions is subject to execution risk and we may not achieve any of the expected benefits of our strategic initiatives
Effective management of transformation projects is required to effectively deliver the Group's strategic priorities, involving delivering both on externally driven programmes for example, Ibor
transition, as well as key business initiatives to deliver revenue growth, product enhancement and operational efficiency outcomes. The magnitude, complexity and, at times, concurrent demands of the projects required to meet these can result in heightened execution risk.
The Group’s strategy (see pages 12 to 13) set out in February 2021 was supported by global trends – the continued economic development in Emerging Markets, growth of international trade and capital flows, and wealth creation, particularly in faster-growing markets. We took into consideration global trends along with our strategic advantages to help us better deploy capital. The development and implementation of our strategy requires difficult, subjective and complex judgements, including forecasts of economic conditions in various parts of the world. We may fail to correctly identify the relevant factors in making decisions as to capital deployment and cost reduction. We may also encounter unpredictable changes in the external environment that are unfavourable to our strategy.
Our ability to execute our strategy may be limited by our operational capacity and the increasing complexity of the regulatory environment in which we operate. We continue to pursue our cost management initiatives, though they may not be as effective as expected, and we may be unable to meet our cost saving targets.
The global economic outlook continues to remain uncertain, particularly with regard to the effects of the Covid-19 pandemic, interest rate volatility, changes in tax legislation, heightened geopolitical tensions and the UK relationship with the EU. There remains a risk that, in the absence of an improvement in economic conditions, our cost and investment actions may not be sufficient to achieve the expected benefits.
The failure to successfully deliver or achieve any of the expected benefits of these key strategic initiatives could have a material adverse effect on our business, financial condition, results of operations, prospects and reputation.
Our risk management measures may not be successful
The management of risk is an integral part of all our activities. Risk constitutes our exposure to uncertainty and the consequent variability of return. Specifically, risk equates to the adverse effect on profitability or financial condition arising from different sources of uncertainty, including retail and wholesale credit risk, market risk, non-traded market risk, operational risk, insurance risk, concentration risk, liquidity and funding risk, litigation risk, reputational risk, strategic risk, pension risk and regulatory risk.
While we employ a broad and diversified set of risk monitoring and mitigation techniques, such methods and the judgements that accompany their application cannot anticipate every unfavourable event or the specifics and timing of every outcome. Failure to manage risks appropriately could have a material adverse effect on our business, financial condition, results of operations, prospects, strategy and reputation.
Risks related to our business
Our business has inherent reputational risk
Reputational risk is the risk of failing to meet stakeholder expectations as a result of any event, behaviour, action or inaction, either by HSBC, our employees or those with whom we are associated. Any material lapse in standards of integrity, compliance, customer service or operating efficiency may represent a potential reputational risk. Stakeholder expectations constantly evolve, and so reputational risk is dynamic and varies between geographical regions, groups and individuals. In addition, our business faces increasing scrutiny in respect to ESG related matters. If we fail to act responsibly, or to achieve our announced targets, commitments, goals or ambitions, in a number of areas, such as diversity and inclusion, climate change, sustainability, workplace conduct, human rights, and support for local communities, our reputation and the value of our brand may be negatively affected.
Modern technologies, in particular online social media channels and other broadcast tools that facilitate communication with large
audiences in short time frames and with minimal costs, may significantly enhance and accelerate the distribution and effect of damaging information and allegations. Reputational risk could also arise from negative public opinion about the actual, or perceived, manner in which we conduct our business activities, or our financial performance, as well as actual or perceived practices in banking and the financial services industry generally. Negative public opinion may adversely affect our ability to retain and attract customers, in particular, corporate and retail depositors, and to retain and motivate staff, and could have a material adverse effect on our business, financial condition, results of operations, and prospects.
Non-Financial risks are inherent in our business, including the risk of fraudulent activity
We are exposed to many types of non-financial risks that are inherent in banking operations. Non-financial risk can be defined as the risk to HSBC of achieving its strategy or objectives as a result of inadequate or failed internal processes, people and systems, or from external events. It includes; fraudulent and other criminal activities (both internal and external), breakdowns in processes or procedures, breaches of regulations or law, financial reporting and tax errors, external events and systems failure or non-availability. These risks are also present when we rely on outside suppliers or vendors to provide services to us and our customers.
In particular, fraudsters may target any of our products, services and delivery channels, including lending, internet banking, payments, bank accounts and cards. This may result in financial loss to the Group and/or our customers, an adverse customer experience, reputational damage and potential litigation, regulatory proceeding, administrative action or other adversarial proceeding in any jurisdiction in which we operate, depending on the circumstances of the event.
These non-financial risks could have a material adverse effect on our business, financial condition, results of operations, prospects, strategy and reputation.
We rely on recruiting, retaining and developing appropriate senior management and skilled personnel
Meeting the demand to recruit, retain and develop appropriate senior management and skilled personnel remains subject to a number of challenges. These include rapidly changing skill requirements and ways of working, the evolving regulatory landscape plus increased requirements and expectations regarding nationalisation and diversity in some jurisdictions. Ongoing talent shortages in key markets and capabilities, particularly where those with the scarce capabilities are globally mobile, add to the complexity of our supply challenge.
Our continued success and implementation of our growth strategy depend in part on the retention of key members of our management team and wider employee base, the availability of skilled management in each of our global businesses and global functions, and the ability to continue to attract, train, motivate and retain highly qualified professionals, each of which may depend on factors beyond our control, including economic, market and regulatory conditions, and the impact of the Covid-19 pandemic on health and well-being. In addition, the Group announced goals in relation to increasing the representation of women and Black employees in senior leadership roles by 2025. If the Group fails to achieve these goals, its ability to attract and retain qualified professionals may be negatively affected.
If global businesses or global functions fail to staff their operations appropriately or lose one or more of their key senior executives and fail to successfully replace them in a satisfactory and timely manner, or fail to implement successfully the organisational changes required to support the Group’s strategy, our business, financial condition, results of operations and prospects, including control and operational risks, could be materially adversely affected.
We have significant exposure to counterparty risk
We are exposed to counterparties that are involved in virtually all major industries, and we routinely execute transactions with counterparties in financial services, including brokers and dealers, central clearing counterparties, commercial banks, investment banks, mutual and hedge funds, and other institutional clients.
Many of these transactions expose us to credit risk in the event of default by our counterparty or client. Our ability to engage in routine transactions to fund our operations and manage our risks could be materially adversely affected by the actions and commercial soundness of other financial services institutions. Financial institutions are necessarily interdependent because of trading, clearing, counterparty or other relationships. As a consequence, a default by, or decline in market confidence in, individual institutions, or anxiety about the financial services industry generally, can lead to further individual and/or systemic difficulties, defaults and losses.
Mandatory central clearing of OTC derivatives poses risks to the Group. As a clearing member, we are required to underwrite losses incurred at a central counterparty by the default of other clearing members and their clients. Increased moves towards central clearing brings with it a further element of interconnectedness between clearing members and clients that we believe may increase rather than reduce our exposure to systemic risk. At the same time, our ability to manage such risk ourselves will be reduced because control has been largely outsourced to central counterparties, and it is unclear at present how, at a time of stress, regulators and resolution authorities will intervene.
Where bilateral counterparty risk has been mitigated by taking collateral, our credit risk may remain high if the collateral we hold cannot be realised or has to be liquidated at prices that are insufficient to recover the full amount of our loan or derivative exposure.
There is a risk that collateral cannot be realised, including situations where this arises by change of law that may influence our ability to foreclose on collateral or otherwise enforce contractual rights.
The Group also has credit exposure arising from mitigants, such as credit default swaps, and other credit derivatives, each of which is carried at fair value. The risk of default by counterparties to credit default swaps and other credit derivatives used as mitigants affects the fair value of these instruments depending on the valuation and the perceived credit risk of the underlying instrument against which protection has been purchased. Any such adjustments or fair value changes could have a material adverse effect on our business, financial condition, results of operations and prospects.
Any reduction in the credit rating assigned to HSBC Holdings, any subsidiaries of HSBC Holdings or any of their respective debt securities could increase the cost or decrease the availability of our funding and adversely affect our liquidity position and net interest margin
Credit ratings affect the cost and other terms upon which we are able to obtain market funding. Rating agencies regularly evaluate HSBC Holdings and certain of its subsidiaries, as well as their respective debt securities. Their ratings are based on a number of factors, including their assessment of the relative financial strength of the Group or of the relevant subsidiary, as well as conditions affecting the financial services industry generally. There can be no assurance that the rating agencies will maintain HSBC Holdings’ or the relevant subsidiary’s current ratings or outlook, particularly given the rating agencies’ current review of their bank rating methodologies and the potential impact on HSBC Holdings’ or its subsidiaries’ ratings.
At the date hereof, HSBC Holdings’ long-term debt was rated ‘A+’ by Fitch, ‘A-’ by Standard and Poor’s (‘S&P’) and ‘A3’ by Moody’s.
The ratings outlook by both S&P and Moody's were stable and the ratings outlook by Fitch was negative. Any reductions in these
ratings and outlook could increase the cost of our funding, limit access to capital markets and require additional collateral to be placed and, consequently, materially adversely affect our interest margins and our liquidity position.
Under the terms of our current collateral obligations under derivative contracts, we could be required to post additional collateral as a result of a downgrade in HSBC Holdings’ credit rating.
Risks concerning borrower credit quality are inherent in our businesses
Risks arising from changes in credit quality and the recoverability of loans and amounts due from borrowers and counterparties (e.g. reinsurers and counterparties in derivative transactions) are inherent in a wide range of our businesses. Adverse changes in the credit quality of our borrowers and counterparties arising from a general deterioration in economic conditions or systemic risks in the financial systems, including from the impact of the ongoing Covid-19 pandemic (see 'Risks relating to the impact of Covid-19') could reduce the recoverability and value of our assets, and require an increase in our ECLs.
We estimate and recognise ECLs in our credit exposure. This process, which is critical to our results and financial condition, requires difficult, subjective and complex judgements, including forecasts of how the economic conditions might impair the ability of our borrowers to repay their loans and the ability of other counterparties to meet their obligations. This assessment considers multiple alternative forward-looking economic conditions (including GDP estimates) and incorporates this into the ECL estimates to meet the measurement objective of IFRS 9. As is the case with any such assessments, we may fail to estimate accurately the effect of factors that we identify or fail to identify relevant factors. Further, the information we use to assess the creditworthiness of our counterparties may be inaccurate or incorrect. Any failure by us to accurately estimate the ability of our counterparties to meet their obligations could have a material adverse effect on our business, financial condition, results of operations and prospects.
Our insurance businesses are subject to risks relating to insurance claim rates and changes in insurance customer behaviour
We provide various insurance products for customers with whom we have a banking relationship, including several types of life insurance products. The cost of claims and benefits can be influenced by many factors, including mortality and morbidity rates, lapse and surrender rates and, if the policy has a savings element, the performance of assets to support the liabilities. Adverse developments in any of these factors could materially adversely affect our business, financial condition, results of operations and prospects.
HSBC Holdings is a holding company and, as a result, is dependent on loan/instrument payments and dividends from its subsidiaries to meet its obligations, including obligations with respect to its debt securities, and to provide profits for payment of future dividends to shareholders
HSBC Holdings is a non-operating holding company and, as such, its principal source of income is from operating subsidiaries that hold the principal assets of the Group. As a separate legal entity, HSBC Holdings relies on remittance of its subsidiaries’ loan/instrument interest payments and dividends in order to be able to pay obligations to debt holders as they fall due, and to pay dividends to its shareholders. The ability of HSBC Holdings' subsidiaries and affiliates to pay remittances and dividends to HSBC Holdings is subject to such subsidiaries’ and affiliates’ financial performance and could also be restricted by applicable laws, regulations, exchange controls and other requirements.
We may be required to make substantial contributions to our pension plans
We operate a number of pension plans throughout the world for our personnel, including defined benefit plans. Pension scheme obligations fluctuate with changes in long-term interest rates, inflation, salary levels and the longevity of scheme members. They can also be affected by operational and legal risks. The level of contributions we make to our pension plans has a direct effect on our cash flow. To the extent plan assets are insufficient to cover existing liabilities, higher levels of contributions may be required. As a result, deficits in those pension plans could have a material adverse effect on our business, financial condition, operations and prospects.
Risk related to our financial statements and accounts
Our financial statements are based in part on judgements, estimates and assumptions that are subject to uncertainty
The preparation of financial information requires management to make judgements and use estimates and assumptions that affect the reported amounts of assets, liabilities, income and expenses. Due to the inherent uncertainty in making estimates, particularly those involving the use of complex models, actual results reported in future periods could differ from those on which management’s estimates are based. Estimates, judgements, assumptions and models are continually evaluated, and are based on historical experience and other factors, including expectations of future events that are believed to be reasonable under the prevailing circumstances. The impacts of revisions to accounting estimates are recognised in the period in which the estimates are revised and in any future periods affected. Accounting policies deemed critical to our results and financial position are those that involve a high degree of uncertainty and have a material impact on the financial statements. In 2021 these include impairment of amortised cost financial assets and assets measured at fair value through other comprehensive income, impairment of goodwill and non-financial assets, valuation of financial instruments, deferred tax assets, provisions, impairment of interests in associates and post-employment benefit plans, which are discussed in detail in ‘Critical accounting estimates and judgements’ on page 90.
The measurement of impairment of amortised cost financial assets and financial assets measured at fair value through other comprehensive income requires the selection and calibration of complex models and the use of estimates and assumptions to incorporate relevant information about past events, current conditions and forecasts of economic conditions. Additionally, significant judgement is involved in determining what is considered to be significant increases in credit risk and what the point of initial recognition is for revolving facilities.
The assessment of whether goodwill and non-financial assets are impaired, and the measurement of any impairment, involves the application of judgement in determining key assumptions, including discount rates, estimated cash flows for the periods for which detailed cash flows are available and projecting the long-term pattern of sustainable cash flows thereafter. The recognition and measurement of deferred tax assets involves significant judgement regarding the probability and sufficiency of future taxable profits, taking into account the future reversal of existing taxable temporary differences and tax planning strategies, including corporate reorganisations. The recognition and measurement of provisions involve significant judgements due to the high degree of uncertainty in determining whether a present obligation exists, and in estimating the probability and amount of any outflows that may arise. The valuation of financial instruments measured at fair value can be subjective, in particular where models are used that include unobservable inputs. The assessment of interests in associates for impairment involves significant judgements in determining the value in use, in particular estimating the present values of cash flows expected to arise from continuing to hold the investment, based on a number of management assumptions. At 31 December 2021, we
performed an impairment review of our investment in BoCom and concluded it was not impaired based on our value in use calculation.
The calculation of the defined benefit pension obligation involves the determination of key assumptions, including discount rate, inflation rate, pension payments and deferred pension and pay and mortality. Given the uncertainty and subjectivity associated with the above critical accounting judgements and estimates, future outcomes may differ materially from those assumed using information available at the reporting date.
The effect of these changes on the future results of operations and the future financial position of the Group may be material, and could have a material adverse effect on our business, financial condition, results of operations and prospects. For further details, see ‘Critical accounting estimates and judgements’ on page 90.
Changes in accounting standards may have a material impact on how we report our financial results and financial condition
We prepare our consolidated financial statements in conformity with the requirements of the Companies Act 2006 and in accordance with International Financial Reporting Standards (‘IFRS’) as issued by the International Accounting Standards Board (‘IASB’), including interpretations (‘IFRICS’) issued by the IFRS Interpretations Committee. From time to time, the IASB or the IFRS Interpretations Committee may issue new accounting standards or interpretations that could materially impact how we calculate, report and disclose our financial results and financial condition, and which may affect our capital ratios, including the CET1 ratio. For example, IFRS 17 ‘Insurance Contracts’ sets the requirements that an entity should apply in accounting for insurance contracts it issues and reinsurance contracts it holds. IFRS 17 is effective from 1 January 2023 and could have a significant adverse impact on the profitability of our insurance business. We could also be required to apply new or revised standards retrospectively, resulting in our restating prior period financial statements in material amounts.
| | |
| Areas of special interest |
During 2021, a number of areas were identified and considered as part of our top and emerging risks because of the effect they may have on the Group. While considered under the themes captured under top and emerging risks, in this section we have placed a particular focus on the Covid-19 pandemic and climate-related risks.
Risks related to Covid-19
Despite the successful roll-out of vaccines around the world, the Covid-19 pandemic and its effect on the global economy have continued to impact our customers and organisation. The global vaccination roll-out in 2021 helped reduce the social and economic impact of the Covid-19 pandemic, although there has been significant divergence in the speed at which vaccines have been deployed around the world. Most developed countries have now vaccinated a large proportion of their populations, but many less developed countries have struggled to secure supplies and are at an earlier stage of their roll-out. By the end of 2021, high vaccination rates had ensured that many Covid-19-related restrictions on activity in developed markets had been lifted and travel constraints were easing. However, the emergence of the Omicron variant in late 2021 demonstrated the continued risk new variants pose.
The pandemic necessitated governments to respond at unprecedented levels to protect public health, and to support local economies and livelihoods. The resulting government support measures and restrictions created additional challenges, given the rapid pace of change and significant operational demands. Renewed outbreaks, particularly those resulting from the emergence of variants of the virus, emphasise the ongoing threat of Covid-19 and could result in further tightening of government restrictions. There remains a divergence in approach taken by countries to the level of restrictions on activity and travel. Such diverging approaches to future pandemic waves could prolong or worsen supply chain and international travel disruptions. The evolving Covid-19 restrictions in Hong Kong, including travel, public gathering and social distancing restrictions, are impacting the Hong Kong economy, and may affect the ability to attract and retain staff.
We continue to support our personal and business customers through market-specific measures initiated during the Covid-19 pandemic, and by supporting those remaining national government schemes that focus on the parts of the economy most impacted by the pandemic. For further details of our customer relief programmes, see page 195.
The rapid introduction and varying nature of the government support schemes introduced throughout the Covid-19 pandemic led to increased operational risks, including complex conduct considerations, increased reputational risk and increased risk of fraud. These risks are likely to be heightened further as and when those remaining government support schemes are unwound. These events have also led to increased litigation risk.
The impact of the pandemic on the long-term prospects of businesses in the most vulnerable sectors of the economy – such as retail, hospitality, travel and commercial real estate – remains uncertain and may lead to significant credit losses on specific exposures, which may not be fully captured in ECL estimates. In addition, in times of stress, fraudulent activity is often more prevalent, leading to potentially significant credit or operational losses.
As economic conditions improve, and government support measures come to an end, there is a risk that the outputs of IFRS 9 models may have a tendency to underestimate loan losses. To help mitigate this risk, model outputs and management adjustments are closely monitored and independently reviewed at the Group and country level for reliability and appropriateness. For further details on model risk, see page 245.
Despite the ongoing economic recovery, significant uncertainties remain in assessing the duration and impact of the Covid-19 pandemic, including whether any subsequent outbreaks result in a
reimposition of government restrictions. There is a risk that economic activity remains below pre-pandemic levels for a prolonged period, increasing inequality across markets, and it will likely be some time before societies return to pre-pandemic levels of social interactions. As a result, there may still be a requirement for additional mitigating actions including further use of adjustments, overlays and model redevelopment.
Governments and central banks in major economies have deployed extensive measures to support their local populations. This is expected to reverse partially in 2022. Central banks in major markets are expected to raise interest rates, but such increases are expected to be gradual and monetary policy is expected to remain accommodative overall. Policy tightening in major emerging markets has already begun in order to counteract rising inflation and the risk of capital outflows. Governments are also expected to reduce the level of fiscal support they offer households and businesses as the appetite for broad lockdowns and public health restrictions decreases. Government debt has risen in most advanced economies, and is expected to remain high into the medium term. High government debt burdens have raised fiscal vulnerabilities, increasing the sensitivity of debt service costs to interest rate increases and potentially reducing the fiscal space available to address future economic downturns. Our Central scenario used to calculate impairment assumes that economic activity will continue to recover through 2022, surpassing peak pre-pandemic levels of GDP in all our key markets. It is assumed that private sector growth accelerates, ensuring a strong recovery is sustained even as pandemic-related fiscal support is withdrawn. However, there is a high degree of uncertainty associated with economic forecasts in the current environment and there are significant risks to our Central scenario. The degree of uncertainty varies by market, driven by country-specific trends in the evolution of the pandemic and associated policy responses. As a result, our Central scenario for impairment has not been assigned an equal likelihood of occurrence across our key markets. For further details of our Central and other scenarios, see ‘Measurement uncertainty and sensitivity analysis of ECL estimates’ on page 180.
We continue to monitor the situation closely, and given the novel and prolonged nature of the pandemic, additional mitigating actions may be required.
Climate-related risks
Climate change can have an impact across HSBC’s risk taxonomy through both transition and physical channels. Transition risk can arise from the move to a net zero economy, such as through policy, regulatory and technological changes. Physical risk can arise through increasing severity and/or frequency of severe weather or other climatic events, such as rising sea levels and flooding.
These have the potential to cause both idiosyncratic and systemic risks, resulting in potential financial and non-financial impacts for HSBC. Financial impacts could materialise if transition and physical risks impact the ability of our customers to repay their loans. Non-financial impacts could materialise if our own assets or operations are impacted by extreme weather or chronic changes in weather patterns, or as a result of business decisions to achieve our climate ambition.
How climate risk can impact our customers
Climate change could impact our customers in two main ways. Firstly, customer business models may fail to align to a net zero economy, which could mean that new climate-related regulation would have a material impact on their business. Secondly, extreme weather events or chronic changes in weather patterns may damage our customers’ assets leaving them unable to operate their business or potentially even live in their home.
One of the most valuable ways we can help our customers navigate the transition challenges and to become more resilient to the physical impacts of climate change is through financing and investment. To do this effectively, we must understand the risks they are facing.
The table below summarises the key categories of transition and physical risk, with examples of how our customers might be affected financially by climate change and the shift to a low-carbon economy.
| | | | | | | | |
| Climate risk | | Main causes of financial impact on customers |
| Transition | Policy and legal | Mandates on, and regulation of, existing products and services
Litigation from parties who have suffered from the effects of climate change |
| Technology | Replacement of existing products with lower emission options |
| End-demand (market) | Changing consumer behaviour |
| Reputational | Increased scrutiny following a change in stakeholder perceptions of climate-related action or inaction |
| Physical | Acute | Increased frequency and severity of weather events |
| Chronic | Changes in precipitation patterns
Rising temperatures |
For further details on how we manage climate risk for our other stakeholders, see the ESG review on page 56.
Integrating climate into enterprise-wide risk management
Our approach to climate risk management is aligned to our Group-wide risk management framework and three lines of defence model, which sets out how we identify, assess and manage our risks. This approach ensures the Board and senior management have visibility and oversight of our key climate risks.
Climate risk appetite
Our developing climate risk appetite measures support the oversight and management of the financial and non-financial risks from climate change, meet regulatory expectations and support the business to deliver our climate ambition in a safe and sustainable way. Our initial measures are focused on the oversight and management of our key climate risks: wholesale credit risk, retail credit risk, reputational risk, resilience risk and regulatory compliance. These measures are implemented at a global and regional level. We continue to develop climate risk appetite measures and our future ambition for our climate risk appetite is to:
•adapt the risk appetite metrics to incorporate forward-looking transition plans and net zero commitments;
•expand metrics to consider other financial and non-financial risks; and
•use enhanced scenario analysis capabilities.
Climate risk policies, processes and controls
We are integrating climate risk into the policies, processes and controls for our key climate risks and we will continue to update these as our climate risk management capabilities mature over time. We have updated our policy on product management, and developed the first version of a climate risk scoring tool for our corporate portfolios. In addition, we published and started to implement our new thermal coal phase-out policy. For further details on our thermal coal phase-out policy, see page 62.
Climate risk governance and reporting
Our global and regional Climate Risk Oversight Forums are responsible for the oversight, management and escalation of
climate risks across the Group and are supported by specific forums for our global businesses, as well as for our Risk and Compliance function. These include the Sustainability Risk Oversight Forum, the WPB Risk Management Meeting and the Regulatory Compliance ESG and Climate Risk Working Group.
Our climate risk management information dashboard includes metrics relating to our key climate risks, and is reported to the Group Climate Risk Oversight Forum. The Group Risk Management Meeting and the Group Risk Committee receive scheduled updates on climate risk, and receive regular updates on our climate risk appetite and top and emerging climate risks.
For further details on the Group’s ESG governance structure, see page 80.
The Group Chief Risk and Compliance Officer is the key senior manager responsible for the management of climate-related financial risks under the UK Senior Managers Regime. The Group Chief Risk and Compliance Officer is the overall accountable executive for the Group’s climate risk programme, including responsibility for governance, risk management, stress testing and scenario analysis and disclosures.
Climate risk programme
Our dedicated programme continues to accelerate the development of our climate risk management capabilities. The key achievements in 2021 include:
•We delivered tailored training sessions to our legal entity boards.
•We delivered training to colleagues across the three lines of defence so they can understand climate risk as part of their role, and we also included an introduction to our climate ambition in our global mandatory training.
•We developed our climate risk scoring tool for corporate customers for use in priority regions, which builds on our corporate transition questionnaire.
•We introduced a risk appetite based on monitoring climate risk exposure at property level across the UK mortgage portfolio.
•We have continued to develop our climate stress testing and scenarios capabilities, including model development and delivered regulatory climate stress tests. These are being used to further improve our understanding of our risk exposures for use in risk management and business decision making. For more detail on our approach to climate stress testing and scenario analysis, see page 57.
We will continue to enhance our climate risk management capabilities throughout 2022. This will include the further roll-out of training, refinement of our risk appetite, enhancement of our climate risk scoring tool and increasing the availability and quality of data so that new metrics can be developed.
How climate risk can impact HSBC
Below, we provide details on how climate risk impacts to our customers might manifest across our key climate risks, and the potential timeframes involved using the TCFD’s four main drivers of transition climate risk – policy and legal, technology, end-demand (market) and reputational – and two physical risk drivers – acute and chronic.
| | | | | | | | | | | | | | | | | |
| Risk management framework |
| Financial risks | Non-financial risk |
| Risk type | Wholesale credit | Retail credit | Strategic risk (reputational) | Resilience risk | Regulatory compliance risk |
Timescale1 | All term periods | Medium–long term | All term periods | All term periods | Short–medium |
Transition risk drivers2 | | | | | |
| – policy and legal | l | l | | | l |
| – technology | l | | | | |
| – end-demand (market) | l | l | | | |
| – reputational | l | l | l | | |
Physical risk drivers2 | | | | | |
| – acute – increased frequency and severity of weather events | l | l | | l | |
| – chronic – changes in weather patterns | l | l | | l | |
1 Short-term: less than one year; medium term: period to 2030; long term: period to 2050.
2 Transition and physical risk drivers defined by TCFD.
Wholesale credit risk
Identification and assessment
We have identified six key sectors where our wholesale credit customers have the highest climate risk, based on their carbon emissions. These are oil and gas, building and construction, chemicals, automotive, power and utilities, and metals and mining. We continue to roll out our transition and physical risk questionnaire to our largest customers in high-risk sectors, with the addition of four more sectors: agriculture, manufacturing, real estate and transportation. The questionnaires will help us to assess and improve our understanding of the impact of climate changes on our customers’ business models and any related transition strategies. It also helps us to identify potential business opportunities to support the transition. In 2022, we intend to increase the scope of the questionnaires by adding more countries to the scope.
Management
In 2021, we developed a scoring tool, which provides a climate risk score for each customer based on questionnaire responses. The climate risk score will then be used in portfolio level management information to assess and compare clients. The scoring tool will be enhanced and refined over time as more data becomes available. The results of the tool have been provided to business and risk management teams. During 2021, we also performed a climate-related stress test, as explained further on page 58. In 2022 we aim to further embed climate risk considerations in our credit risk management processes.
Aggregation and reporting
We currently internally report our transition risk exposure and RWAs consumed by the six high-risk sectors in the wholesale portfolio.
We also report the proportion of questionnaire responses that reported either having a board policy or management plan for transition risk. Our key wholesale credit exposures are included as part of our broader ESG management information dashboard, which is presented to the Group Executive Committee each quarter. In addition, a representative from wholesale credit risk attends the Global Climate Risk Oversight Forum to ensure consideration of this risk type, and we report our exposure through the climate risk management information dashboard at this meeting.
We will continue to report these metrics in 2022 and will aim to cascade these measures to global businesses and to provide insight on the climate risk profile of our portfolio and customers.
In the table below, we capture our lending activity, including environmentally responsible and sustainable finance activities, to customers within the six high risk sectors. Green financing for large companies that work in high transition sectors is also included. The overall exposure has increased slightly to 20.0% (2020:19.6%). For further details on how we designate counterparties as high transition risk, see footnote 2.
Since 2019, we have received responses from customers within the six high transition risk sectors, which represent 56% of our exposure, an increase in coverage of 15% since last year. The breakdown of our customer responses is presented by sector in the table below.
Within the power and utilities, and metals and mining sectors shown in the table below, and recognising external third-party assessments of power generation and mining capacity, our exposure to thermal coal is 0.2% of the total wholesale loans and advances figures.
| | |
| Wholesale loan exposure to transition risk sectors and customer questionnaire responses at 31 December 2021 |
| | | | | | | | | | | | | | | | | | | | | | | |
| Automotive | Chemicals | Construction and building materials | Metals and mining | Oil and gas | Power and utilities | Total |
| % | % | % | % | % | % | % |
Wholesale loan exposure as % of total wholesale loans and advances to customers and banks1,2,3 | ≤ 2.8 | ≤ 3.4 | ≤ 4.5 | ≤ 2.4 | ≤ 3.4 | ≤ 3.5 | ≤ 20.0 |
Proportion of sector for which questionnaires were completed4 | 59 | 44 | 56 | 52 | 64 | 59 | 56 |
Proportion of questionnaire responses that reported either having a board policy or a management plan4 | 65 | 76 | 76 | 57 | 77 | 90 | 75 |
Sector weight as proportion of high transition risk sector4 | 14 | 17 | 22 | 12 | 17 | 18 | 100 |
1 Amounts shown in the table also include green and other sustainable finance loans, which support the transition to the net zero economy. The methodology for quantifying our exposure to high transition risk sectors and the transition risk metrics will evolve over time as more data becomes available and is incorporated in our risk management systems and processes.
2 Counterparties are allocated to the high transition risk sectors via a two-step approach. Firstly, where the main business of a group of connected counterparties is in a high transition risk sector, all lending to the group is included irrespective of the sector of each individual obligor within the group. Secondly, where the main business of a group of connected counterparties is not in a high transition risk sector, only lending to individual obligors in the high transition risk sectors is included. For Global Banking and Markets clients, the main business of a group of connected counterparties is identified by the relationship manager for the group. For Commercial Banking clients, the main business of a group of connected counterparties is identified based on the largest industry of HSBC’s total lending limits to the group.
3 Total wholesale loans and advances to customers and banks amount to $662bn (2020: $673bn).
4 All percentages are weighted by exposure.
Retail credit risk
Identification and assessment
We manage retail credit risk under a framework of controls that enable the identification and assessment of credit risk across the retail portfolio.
In 2021, we completed a Group-wide climate scenario analysis and stress testing exercise. This enabled us to enhance our understanding and assess the impact of physical risk to our mortgage portfolio under three potential future climate scenarios, with a focus on the UK, Hong Kong and Canada.
Additionally, for the UK mortgage portfolio, we considered the impact of potential minimum energy performance certificate (‘EPC’) rating requirements, as well as changes to the availability of buildings insurance following the demise of FloodRe. These factors were considered alongside macroeconomic drivers, given the supplemental data available for the UK.
FloodRe is a scheme between the UK Government and the insurance industry that aims to improve the availability and affordability of flood cover for properties in high flood risk areas. It is currently in place until 2039.
Understanding the impact of future climate risk relies heavily upon the availability of quality data, as well as on the evolution of climate risk modelling expertise. As this matures, we plan to expand our approach to additional markets.
Management
We are focusing on embedding climate risk into retail credit risk management processes, prioritising the largest residential mortgage portfolios.
We continue to update our risk management framework to reflect lessons learnt.
Aggregation and reporting
We manage and monitor the integration of climate risk across Wealth and Personal Banking through the Risk Management Meeting.
We have also developed and are implementing metrics to support active risk management, which will be tracked and monitored through relevant credit risk meetings.
A representative from Retail Credit Risk attends the Group Climate Risk Oversight Forum to ensure this risk type is considered.
How we are starting to measure climate risk
We are starting to measure climate risk with the most material market, which is the UK, where the primary risk facing properties is flooding.
Using a risk methodology that considers a combination of the likelihood and severity of flood hazard affecting individual properties, we estimate that on a total volume basis, and at present day levels, 3.5% of the UK retail banking mortgage portfolio is at high risk of flooding, and 0.3% is at a very high risk. This is based on 94% coverage of our mortgage portfolio and is reliant on flood data provided by Ambiental Risk Analytics, flood risk experts and suppliers of flood models to more than 50% of the UK insurance industry.
This data will enable monitoring and reporting of properties at risk of flooding, which will support activities to educate impacted customers and protect the Group from incurring losses as a result of climate events.
Our transition risk efforts in the UK have focused on obtaining current and potential energy efficiency ratings for individual properties, sourced from property EPC data.
The UK Government has a stated ambition to improve the EPC ratings of housing stock as set out in its Clean Growth Strategy. We are working towards improving the proportion of properties on our book with an EPC rating of C or above and on improving the EPC data coverage.
We have approximately 53% of properties in our portfolio with a valid EPC certificate (i.e. dated within the last 10 years) and 35.7% of these are rated A to C.
For further details and metrics relating to physical and transition risk to our UK mortgage portfolio, see our ESG Data Pack at www.hsbc.com/esg.
Reputational risk
Identification and assessment
We implement sustainability risk policies, including the Equator Principles, as part of our broader reputational risk framework. We focus on sensitive sectors that may have a high adverse impact on people or the environment, and in which we have a significant number of customers. A key area of focus is high-carbon sectors, which include oil and gas, power generation, mining, agricultural commodities and forestry. During 2021 we published our thermal coal phase-out policy.
Management
As the primary point of contact for our customers, our relationship managers are responsible for checking that our customers meet policies aimed at reducing carbon impacts. Our global network of more than 75 sustainability risk managers provides local policy support and expertise to relationship managers. A central Sustainability Risk team provides a higher level of guidance and is responsible for the oversight of policy compliance and implementation over wholesale banking activities. During 2021, we introduced a refreshed assurance framework, which takes a risk-based approach focusing on higher risks.
For further details on our sustainability risk policies, see our ESG review on page 62.
Aggregation and reporting
Our Sustainability Risk Oversight Forum provides a Group-wide forum for senior members of our Global Risk and Compliance team and global businesses. It also oversees the development and implementation of sustainability risk policies. Cases involving complex sustainability risk issues related to customers, transactions or third parties are managed through the reputational risk and client selection governance process. We report annually on our implementation of the Equator Principles and the corporate loans, project-related bridge loans and advisory mandates completed under the principles. With the introduction of Equator Principles IV, a training programme was delivered to raise the awareness of the changes and obligations therein.
For the latest report, see: www.hsbc.com/who-we-are/our-climate-strategy/sustainability-risk/equator-principles.
A representative from Reputational risk attends the Group Climate Risk Forum to ensure consideration of this risk type.
Regulatory compliance risk
Identification and assessment
Compliance, as a sub-function within Group Risk and Compliance, continues to prioritise the identification and assessment of compliance risks that may arise from climate risk. Although not an exhaustive list, key regulatory compliance risks under consideration include those related to product management, mis-selling, marketing, conflicts of interest and regulatory change.
An area of particular focus is the risk of greenwashing. We regard greenwashing as the act of knowingly or unknowingly misleading stakeholders regarding our climate ambition, the climate impact/benefits of a product or service or regarding the climate commitments of our customers. For the Compliance function, product-based greenwashing is a key area of focus. When considering product-based greenwashing, we seek to:
•effectively and consistently consider climate risk factors in the development and ongoing governance of new, changed or withdrawn products and services through the enhancement of existing risk management frameworks utilised within the Group’s operating entities and lines of business, enabling climate risks to be identified and assessed in a timely manner;
•ensure that climate-related products and services offered to customers are appropriately designed and that related sales practices and marketing materials are clear, fair and not misleading; and
•develop climate-related products and services consistent with the evolving expectations of the Group’s regulators and other relevant authorities.
Management
We continue to develop our compliance policies and underlying measurement capability to enhance the management of climate risks in line with our climate ambition and risk appetite. As such, we have integrated and are continuing to enhance climate risk considerations within our product and customer life-cycle policies. Our policies set the minimum standards that are required to manage the risk of breaches of our regulatory duty to customers, including those related to climate risk, ensuring fair customer outcomes are achieved.
The Compliance sub-function placed significant focus in 2021 on supporting and improving the capability of Compliance colleagues through climate-specific training, communications and guidance materials to ensure the robust identification, assessment and management of climate risks.
Aggregation and reporting
The Compliance sub-function continues to operate an ESG and Climate Risk Working Group. This group tracks and monitors the integration and embedding of Climate risk within the management of regulatory compliance risks and controls more generally, and monitors ongoing regulatory and legislative changes across the sustainability and climate risk agenda.
We have also developed and implemented climate risk metrics and indicators aligned to wider regulatory compliance risks.
The Compliance sub-function is also represented at the Group’s Climate Risk Oversight Forum to ensure this risk type is considered.
Resilience risk
Identification and assessment
Our assessment of climate risk identified building unavailability, workplace safety, information technology and cybersecurity risk, transaction processing risk, and third-party risk as the key risks facing our operational resilience.
In 2021 we repeated and extended our scenario stress testing. We will continue to work with our partners to identify and assess emerging climate risks.
Management
In 2021, we reviewed existing policies, processes and controls, which were then revised as required. This work will continue in subsequent years.
Identification of new tooling, both internally and through collaboration with business partners, for the management of climate risk is ongoing with new tooling being introduced as appropriate.
Our stress test results will continue to inform our approach to climate risk management.
Aggregation and reporting
Our exposure to climate risk will continue to be aggregated and reported to the Group Climate Risk Forum and other relevant formal governance forums.
| | |
| Our material banking risks |
The material risk types associated with our banking and insurance manufacturing operations are described in the following tables:
| | | | | | | | |
| Description of risks – banking operations |
| Risks | Arising from | Measurement, monitoring and management of risk |
| Credit risk (see page 173) |
| Credit risk is the risk of financial loss if a customer or counterparty fails to meet an obligation under a contract. | Credit risk arises principally from direct lending, trade finance and leasing business, but also from other products such as guarantees and derivatives. | Credit risk is: •measured as the amount that could be lost if a customer or counterparty fails to make repayments; •monitored using various internal risk management measures and within limits approved by individuals within a framework of delegated authorities; and •managed through a robust risk control framework, which outlines clear and consistent policies, principles and guidance for risk managers. |
|
| | |
| Treasury risk (see page 225) |
| Treasury risk is the risk of having insufficient capital, liquidity or funding resources to meet financial obligations and satisfy regulatory requirements, including the risk of adverse impact on earnings or capital due to structural foreign exchange exposures and changes in market interest rates, together with pension and insurance risk. | Treasury risk arises from changes to the respective resources and risk profiles driven by customer behaviour, management decisions, or the external environment
| Treasury risk is: •measured through risk appetite and more granular limits, set to provide an early warning of increasing risk, minimum ratios of relevant regulatory metrics, and metrics to monitor the key risk drivers impacting treasury resources; •monitored and projected against appetites and by using operating plans based on strategic objectives together with stress and scenario testing; and •managed through control of resources in conjunction with risk profiles, strategic objectives and cash flows. |
|
| | |
| Market risk (see page 239) |
| Market risk is the risk of an adverse financial impact on trading activities arising from changes in market parameters such as interest rates, foreign exchange rates, asset prices, volatilities, correlations and credit spreads. | Exposure to market risk is separated into two portfolios: trading portfolios and non-trading portfolios.
Market risk exposures arising from our insurance operations are discussed on page 185.
| Market risk is: •measured using sensitivities, value at risk and stress testing, giving a detailed picture of potential gains and losses for a range of market movements and scenarios, as well as tail risks over specified time horizons; •monitored using value at risk, stress testing and other measures; and •managed using risk limits approved by the RMM and the risk management meeting in various global businesses. |
| | | | | | | | |
| Description of risks – banking operations (continued) |
| Risks | Arising from | Measurement, monitoring and management of risk |
| Resilience risk (see page 243) |
| Resilience risk is the risk that we are unable to provide critical services to our customers, affiliates and counterparties as a result of sustained and significant operational disruption. | Resilience risk arises from failures or inadequacies in processes, people, systems or external events. | Resilience risk is: •measured using a range of metrics with defined maximum acceptable impact tolerances, and against our agreed risk appetite; •monitored through oversight of enterprise processes, risks, controls and strategic change programmes; and •managed by continual monitoring and thematic reviews. |
|
| | |
| Regulatory compliance risk (see page 244) |
| Regulatory compliance risk is the risk associated with breaching our duty to clients and other counterparties, inappropriate market conduct and breaching related financial services regulatory standards. | Regulatory compliance risk arises from the failure to observe relevant laws, codes, rules and regulations and can manifest itself in poor market or customer outcomes and lead to fines, penalties and reputational damage to our business. | Regulatory compliance risk is: •measured by reference to risk appetite, identified metrics, incident assessments, regulatory feedback and the judgement and assessment of our regulatory compliance teams; •monitored against the first line of defence risk and control assessments, the results of the monitoring and control assurance activities of the second line of defence functions, and the results of internal and external audits and regulatory inspections; and •managed by establishing and communicating appropriate policies and procedures, training employees in them and monitoring activity to help ensure their observance. Proactive risk control and/or remediation work is undertaken where required. |
|
| | |
| | |
|
| | |
| Financial crime risk (see page 244) |
| Financial crime risk is the risk of knowingly or unknowingly helping parties to commit or to further potentially illegal activity through HSBC, including money laundering, fraud, bribery and corruption, tax evasion, sanctions breaches, and terrorist and proliferation financing. | Financial crime risk arises from day-to-day banking operations involving customers, third parties and employees. | Financial crime risk is: • measured by reference to risk appetite, identified metrics, incident assessments, regulatory feedback and the judgement of, and assessment by, our compliance teams; • monitored against the first line of defence risk and control assessments, the results of the monitoring and control assurance activities of the second line of defence functions, and the results of internal and external audits and regulatory inspections; and • managed by establishing and communicating appropriate policies and procedures, training employees in them and monitoring activity to help ensure their observance. Proactive risk control and/or remediation work is undertaken where required. |
|
|
| | |
| Model risk (see page 245) |
| Model risk is the risk of inappropriate or incorrect business decisions arising from the use of models that have been inadequately designed, implemented or used or that model does not perform in line with expectations and predictions. | Model risk arises in both financial and non-financial contexts whenever business decision making includes reliance on models.
| Model risk is: •measured by reference to model performance tracking and the output of detailed technical reviews, with key metrics including model review statuses and findings; •monitored against model risk appetite statements, insight from the independent review function, feedback from internal and external audits, and regulatory reviews; and •managed by creating and communicating appropriate policies, procedures and guidance, training colleagues in their application, and supervising their adoption to ensure operational effectiveness. |
Our insurance manufacturing subsidiaries are regulated separately from our banking operations. Risks in our insurance entities are managed using methodologies and processes that are subject to Group oversight. Our insurance operations are also subject to
many of the same risks as our banking operations, and these are covered by the Group’s risk management processes. However, there are specific risks inherent to the insurance operations as noted below.
| | | | | | | | |
| Description of risks – insurance manufacturing operations |
| Risks | Arising from | Measurement, monitoring and management of risk |
| Financial risk (see page 250) | |
| For insurance entities, financial risk includes the risk of not being able to effectively match liabilities arising under insurance contracts with appropriate investments and that the expected sharing of financial performance with policyholders under certain contracts is not possible. | Exposure to financial risk arises from: •market risk affecting the fair values of financial assets or their future cash flows; •credit risk; and •liquidity risk of entities being unable to make payments to policyholders as they fall due. | Financial risk is: •measured (i) for credit risk, in terms of economic capital and the amount that could be lost if a counterparty fails to make repayments; (ii) for market risk, in terms of economic capital, internal metrics and fluctuations in key financial variables; and (iii) for liquidity risk, in terms of internal metrics including stressed operational cash flow projections; •monitored through a framework of approved limits and delegated authorities; and •managed through a robust risk control framework, which outlines clear and consistent policies, principles and guidance. This includes using product design, asset liability matching and bonus rates. |
| Insurance risk (see page 252) | |
| Insurance risk is the risk that, over time, the cost of insurance policies written, including claims and benefits, may exceed the total amount of premiums and investment income received. | The cost of claims and benefits can be influenced by many factors, including mortality and morbidity experience, as well as lapse and surrender rates. | Insurance risk is: •measured in terms of life insurance liabilities and economic capital allocated to insurance underwriting risk; •monitored through a framework of approved limits and delegated authorities; and •managed through a robust risk control framework, which outlines clear and consistent policies, principles and guidance. This includes using product design, underwriting, reinsurance and claims-handling procedures. |
| | | | | |
| Credit risk |
| Page |
| Overview | |
| Credit risk management | |
| Credit risk in 2021 | |
| Summary of credit risk | 176 | |
| Stage 2 decomposition as at December 2021 | |
| Credit exposure | |
| Measurement uncertainty and sensitivity analysis of ECL estimates | |
| Reconciliation of changes in gross carrying/nominal amount and allowances for loans and advances to banks and customers including loan commitments and financial guarantees | |
| Credit quality | |
| Customer relief programmes | |
| Wholesale lending | |
| Personal lending | |
| Supplementary information | |
| |
| HSBC Holdings | |
| |
| |
Overview
Credit risk is the risk of financial loss if a customer or counterparty fails to meet an obligation under a contract. Credit risk arises principally from direct lending, trade finance and leasing business, but also from other products such as guarantees and credit derivatives.
Credit risk management
Key developments in 2021
There were no material changes to the policies and practices for the management of credit risk in 2021. We continued to apply the requirements of IFRS 9 ‘Financial Instruments’ within the Credit Risk sub-function.
Due to the Covid-19 pandemic and its continued effects on the global economy we provided short-term support to customers through market-specific measures under the current credit policy framework. We have also implemented the guidance provided by regulators on managing the credit portfolio as required throughout the course of the customer relief life cycle.
The extent of our support depends on the degree of country-specific government support measures, restrictions, associated policy responses, and the effects of new Covid-19 variants.
The majority of the customer relief programmes that we provided during the Covid-19 pandemic ended by 31 December 2021 and will not be reassessed under the revised definition of default. For further details of market-specific measures to support our personal and business customers, see page 195.
In the second half of 2021, market concerns regarding China’s commercial real estate sector emerged. At 31 December 2021 we had no direct exposures to developers in the ‘red’ category under the Chinese government’s ‘three red lines’ framework used to govern the real estate sector. We continue to monitor the situation closely, including potential indirect impacts that may arise, and seek to take mitigating actions as required under our existing policy framework.
During 2021, we adopted the EBA ‘Guidelines on the application of definition of default’ for our wholesale portfolios. This did not have a material impact on our wholesale portfolios. For our retail portfolios, these guidelines will be adopted in 2022 and this is not expected to have a material impact.
Governance and structure
We have established Group-wide credit risk management and related IFRS 9 processes. We continue to assess the impact of economic developments in key markets on specific customers, customer segments or portfolios. As credit conditions change, we take mitigating actions, including the revision of risk appetites or limits and tenors, as appropriate. In addition, we continue to evaluate the terms under which we provide credit facilities within the context of individual customer requirements, the quality of the relationship, local regulatory requirements, market practices and our local market position.
Credit Risk sub-function
(Audited)
Credit approval authorities are delegated by the Board to the Group Chief Executive together with the authority to sub-delegate them. The Credit Risk sub-function in Global Risk and Compliance is responsible for the key policies and processes for managing credit risk, which include formulating Group credit policies and risk rating frameworks, guiding the Group’s appetite for credit risk exposures, undertaking independent reviews and objective assessment of credit risk, and monitoring performance and management of portfolios.
The principal objectives of our credit risk management are:
•to maintain across HSBC a strong culture of responsible lending, and robust risk policies and control frameworks;
•to both partner and challenge our businesses in defining, implementing and continually re-evaluating our risk appetite under actual and scenario conditions; and
•to ensure there is independent, expert scrutiny of credit risks, their costs and their mitigation.
Key risk management processes
IFRS 9 ‘Financial Instruments’ process
The IFRS 9 process comprises three main areas: modelling and data; implementation; and governance.
Modelling and data
We have established IFRS 9 modelling and data processes in various geographies, which are subject to internal model risk governance including independent review of significant model developments.
Implementation
A centralised impairment engine performs the expected credit losses calculation using data, which is subject to a number of validation checks and enhancements, from a variety of client, finance and risk systems. Where possible, these checks and processes are performed in a globally consistent and centralised manner.
Governance
Regional management review forums are established in key sites and regions in order to review and approve the impairment results. Regional management review forums have representatives from Credit Risk and Finance. The key site and regional approvals are reported up to the global business impairment committee for final approval of the Group’s ECL for the period. Required members of the committee are the global heads of Wholesale Credit, Market Risk, and Wealth and Personal Banking Risk, as well as the relevant global business Chief Financial Officer and the Global Financial Controller.
Concentration of exposure
(Audited)
Concentrations of credit risk arise when a number of counterparties or exposures have comparable economic characteristics, or such counterparties are engaged in similar activities or operate in the same geographical areas or industry sectors so that their collective ability to meet contractual obligations is uniformly affected by changes in economic, political or other conditions. We use a number of controls and measures to minimise undue concentration of exposure in our portfolios across industries, countries and global businesses. These include portfolio and counterparty limits, approval and review controls, and stress testing.
Credit quality of financial instruments
(Audited)
Our risk rating system facilitates the internal ratings-based approach under the Basel framework adopted by the Group to support the calculation of our minimum credit regulatory capital requirement. The five credit quality classifications encompass a range of granular internal credit rating grades assigned to
wholesale and retail customers, and the external ratings attributed by external agencies to debt securities.
For debt securities and certain other financial instruments, external ratings have been aligned to the five quality classifications based upon the mapping of related customer risk rating (‘CRR’) to external credit rating.
Wholesale lending
The CRR 10-grade scale summarises a more granular underlying 23-grade scale of obligor probability of default (‘PD’). All corporate customers are rated using the 10- or 23-grade scale, depending on the degree of sophistication of the Basel approach adopted for the exposure.
Each CRR band is associated with an external rating grade by reference to long-run default rates for that grade, represented by the average of issuer-weighted historical default rates. This mapping between internal and external ratings is indicative and may vary over time.
Retail lending
Retail lending credit quality is based on a 12-month point-in-time probability-weighted PD.
| | | | | | | | | | | | | | | | | | | | |
| Credit quality classification |
| Sovereign debt securities
and bills | Other debt
securities
and bills | Wholesale lending
and derivatives | Retail lending |
| External credit rating | External credit rating | Internal credit rating | 12-month Basel probability of default % | Internal credit rating | 12 month probability- weighted PD % |
Quality classification1,2 | | | | | | |
| Strong | BBB and above | A- and above | CRR 1 to CRR 2 | 0–0.169 | Band 1 and 2 | 0.000–0.500 |
| Good | BBB- to BB | BBB+ to BBB- | CRR 3 | 0.170–0.740 | Band 3 | 0.501–1.500 |
| Satisfactory | BB- to B and unrated | BB+ to B and unrated | CRR 4 to CRR 5 | 0.741–4.914 | Band 4 and 5 | 1.501–20.000 |
| Sub-standard | B- to C | B- to C | CRR 6 to CRR 8 | 4.915–99.999 | Band 6 | 20.001–99.999 |
| Credit impaired | Default | Default | CRR 9 to CRR 10 | 100 | Band 7 | 100 |
1 Customer risk rating (‘CRR’).
2 12-month point-in-time probability-weighted probability of default (‘PD’).
| | |
Quality classification definitions •‘Strong’ exposures demonstrate a strong capacity to meet financial commitments, with negligible or low probability of default and/or low levels of expected loss. •‘Good’ exposures require closer monitoring and demonstrate a good capacity to meet financial commitments, with low default risk. •‘Satisfactory’ exposures require closer monitoring and demonstrate an average-to-fair capacity to meet financial commitments, with moderate default risk. •‘Sub-standard’ exposures require varying degrees of special attention and default risk is of greater concern. •‘Credit-impaired’ exposures have been assessed as described on Note 1.2(i) on the financial statements. |
Renegotiated loans and forbearance
(Audited)
‘Forbearance’ describes concessions made on the contractual terms of a loan in response to an obligor’s financial difficulties.
A loan is classed as ‘renegotiated’ when we modify the contractual payment terms on concessionary terms because we have significant concerns about the borrowers’ ability to meet contractual payments when due. Non-payment-related concessions (e.g. covenant waivers), while potential indicators of impairment, do not trigger identification as renegotiated loans under our existing disclosures.
Loans that have been identified as renegotiated retain this designation until maturity or derecognition under our existing disclosures.
For details of our policy on derecognised renegotiated loans, see Note 1.2(i) on the financial statements.
Credit quality of renegotiated loans
On execution of a renegotiation, the loan will also be classified as credit impaired if it is not already so classified. In wholesale lending, all facilities with a customer, including loans that have not been modified, are considered credit impaired following the identification of a renegotiated loan under our existing disclosures.
Wholesale renegotiated loans are classified as credit impaired until there is sufficient evidence to demonstrate a significant reduction in the risk of non-payment of future cash flows, observed over a minimum one-year period, and there are no other indicators of impairment. Personal renegotiated loans generally remain credit impaired until repayment, write-off or derecognition.
Renegotiated loans and recognition of expected credit losses
(Audited)
For retail lending, unsecured renegotiated loans are generally segmented from other parts of the loan portfolio. Renegotiated expected credit loss assessments reflect the higher rates of losses typically encountered with renegotiated loans. For wholesale lending, renegotiated loans are typically assessed individually. Credit risk ratings are intrinsic to the impairment assessments. The individual impairment assessment takes into account the higher risk of the future non-payment inherent in renegotiated loans.
Customer relief programmes and renegotiated loans
In response to the Covid-19 pandemic, governments and regulators around the world encouraged a range of customer relief programmes including payment deferrals. In determining whether a customer is experiencing financial difficulty for the purposes of identifying renegotiated loans a payment deferral requested under such schemes, or an extension thereof, is not automatically determined to be evidence of financial difficulty and would therefore not automatically trigger identification as renegotiated loans. Rather, information provided by payment deferrals is considered in the context of other reasonable and supportable information. The IFRS 9 treatment of customer relief programmes is explained on page 195.
Impairment assessment
(Audited)
For details of our impairment policies on loans and advances and financial investments, see Note 1.2(i) on the financial statements.
Write-off of loans and advances
(Audited)
For details of our policy on the write-off of loans and advances, see Note 1.2(i) on the financial statements.
Unsecured personal facilities, including credit cards, are generally written off at between 150 and 210 days past due. The standard period runs until the end of the month in which the account becomes 180 days contractually delinquent. However, in exceptional circumstances to achieve a fair customer outcome, and in line with regulatory expectations, they may be extended further.
For secured facilities, write-off should occur upon repossession of collateral, receipt of proceeds via settlement, or determination that recovery of the collateral will not be pursued.
Any secured assets maintained on the balance sheet beyond
60 months of consecutive delinquency-driven default require additional monitoring and review to assess the prospect of recovery.
There are exceptions in a few countries and territories where local regulation or legislation constrains earlier write-off, or where the realisation of collateral for secured real estate lending takes more time. Write-off, either partially or in full, may be earlier when there is no reasonable expectation of further recovery, for example, in the event of a bankruptcy or equivalent legal proceedings. Collection procedures may continue after write-off.
Credit risk in 2021
At 31 December 2021, gross loans and advances to customers and banks of $1,140bn increased by $6.3bn, compared with 31 December 2020. This included adverse foreign exchange movements of $17.0bn and a $2.4bn decrease due to domestic mass market retail banking in the US being reclassified to assets held for sale.
Excluding foreign exchange movements, the growth was driven by a $24.0bn increase in personal loans and advances to customers and a $3.0bn increase in loans and advances to banks. Wholesale loans and advances to customers decreased by $3.7bn.
The increase in personal loans and advances to customers was driven by mortgage growth of $22.8bn, mainly in the UK (up $10.1bn), Hong Kong (up $6.6bn), Canada (up $3.4bn) and Australia (up $2.1bn). Other personal lending increased by $1.2bn, mainly from unsecured personal lending in Hong Kong (up $1.0bn) and Latin America (up $0.7bn), as well as guaranteed loans in respect of residential property in France (up $0.8bn). These were offset by a decrease in credit cards mainly in the US (down $0.9bn).
At 31 December 2021, the allowance for ECL of $12.2bn decreased by $3.5bn compared with 31 December 2020, including favourable foreign exchange movements of $0.4bn. The $12.2bn allowance comprised $11.6bn in respect of assets held at amortised cost, $0.4bn in respect of loan commitments and financial guarantees, and $0.1bn in respect of debt instruments measured at fair value through other comprehensive income (‘FVOCI’).
During the first half of 2021, the Group experienced a release in allowances for ECL, reflecting an improvement of the economic outlook. This trend continued during the second half of the year following better than expected levels of credit performance and lower levels of stage 3 charges. However, in the later part of the
year the trend slowed down due to the emergence of the new Omicron variant and the recent developments in China’s commercial real estate sector.
Excluding foreign exchange movements, the allowance for ECL in relation to loans and advances to customers decreased by $2.7bn from 31 December 2020. This was attributable to:
•a $1.2bn decrease in wholesale loans and advances to customers, of which $1.0bn was driven by stages 1 and 2; and
•a $1.5bn decrease in personal loans and advances to customers, of which $1.3bn was driven by stages 1 and 2.
During the first six months of the year, the Group experienced significant migrations from stage 2 to stage 1, reflecting an improvement of the economic outlook. This trend continued during the second half of 2021 as forecasts underpinning forward economic guidance stabilised.
Stage 3 balances at 31 December 2021 remained broadly stable compared with 31 December 2020.
The ECL release for 2021 was $0.9bn, inclusive of recoveries. This release comprised $0.6bn in respect of wholesale lending, of which the stage 3 and purchased or originated credit impaired (‘POCI‘) charge was $0.5bn, and $0.3bn in respect of personal lending, of which the stage 3 charge was $0.4bn. Uncertainty remains as countries recover from the pandemic at different speeds, government support measures unwind and the emergence of new strains of the virus continue to test the efficacy of vaccination programmes.
During 2021, we continued to provide Covid-19-related support to customers under the current policy framework. For further details of market-specific measures to support our personal and business customers, see page 195.
Income statement movements are analysed further on page 92.
While credit risk arises across most of our balance sheet, ECL have typically been recognised on loans and advances to customers and banks, in addition to securitisation exposures and other structured products. As a result, our disclosures focus primarily on these two areas. For further details of:
•maximum exposure to credit risk, see page 180;
•measurement uncertainty and sensitivity analysis of ECL estimates, see page 180;
•reconciliation of changes in gross carrying/nominal amount and allowances for loans and advances to banks and customers including loan commitments and financial guarantees, see page 188;
•credit quality, see page 191;
•customer relief programmes, see page 195;
•total wholesale lending for loans and advances to banks and customers by stage distribution, see page 199;
•wholesale lending collateral, see page 205;
•total personal lending for loans and advances to customers at amortised cost by stage distribution, see page 213; and
•personal lending collateral, see page 217.
Summary of credit risk
The following disclosure presents the gross carrying/nominal amount of financial instruments to which the impairment requirements in IFRS 9 are applied and the associated allowance for ECL.
| | | | | | | | | | | | | | | | | | | | | | | | |
| Summary of financial instruments to which the impairment requirements in IFRS 9 are applied | | | | | | | | | | |
| (Audited) |
| 31 Dec 2021 | At 31 Dec 2020 | | | | | | | | | | |
| Gross carrying/nominal amount | Allowance for ECL1 | Gross carrying/nominal amount | Allowance for ECL1 | | | | | | | | | | |
| $m | $m | $m | $m | | | | | | | | | | |
| Loans and advances to customers at amortised cost | 1,057,231 | | (11,417) | | 1,052,477 | | (14,490) | | | | | | | | | | | |
| – personal | 478,337 | | (3,103) | | 460,809 | | (4,731) | | | | | | | | | | | |
| – corporate and commercial | 513,539 | | (8,204) | | 527,088 | | (9,494) | | | | | | | | | | | |
| – non-bank financial institutions | 65,355 | | (110) | | 64,580 | | (265) | | | | | | | | | | | |
| Loans and advances to banks at amortised cost | 83,153 | | (17) | | 81,658 | | (42) | | | | | | | | | | | |
| Other financial assets measured at amortised cost | 880,351 | | (193) | | 772,408 | | (175) | | | | | | | | | | | |
| – cash and balances at central banks | 403,022 | | (4) | | 304,486 | | (5) | | | | | | | | | | | |
| – items in the course of collection from other banks | 4,136 | | — | | 4,094 | | — | | | | | | | | | | | |
| – Hong Kong Government certificates of indebtedness | 42,578 | | — | | 40,420 | | — | | | | | | | | | | | |
| – reverse repurchase agreements – non-trading | 241,648 | | — | | 230,628 | | — | | | | | | | | | | | |
| – financial investments | 97,364 | | (62) | | 88,719 | | (80) | | | | | | | | | | | |
– prepayments, accrued income and other assets2 | 91,603 | | (127) | | 104,061 | | (90) | | | | | | | | | | | |
| Total gross carrying amount on-balance sheet | 2,020,735 | | (11,627) | | 1,906,543 | | (14,707) | | | | | | | | | | | |
| Loans and other credit-related commitments | 627,637 | | (379) | | 659,783 | | (734) | | | | | | | | | | | |
| – personal | 239,685 | | (39) | | 236,170 | | (40) | | | | | | | | | | | |
| – corporate and commercial | 283,625 | | (325) | | 299,802 | | (650) | | | | | | | | | | | |
| – financial | 104,327 | | (15) | | 123,811 | | (44) | | | | | | | | | | | |
| Financial guarantees | 27,795 | | (62) | | 18,384 | | (125) | | | | | | | | | | | |
| – personal | 1,130 | | — | | 900 | | (1) | | | | | | | | | | | |
| – corporate and commercial | 22,355 | | (58) | | 12,946 | | (114) | | | | | | | | | | | |
| – financial | 4,310 | | (4) | | 4,538 | | (10) | | | | | | | | | | | |
Total nominal amount off-balance sheet3 | 655,432 | | (441) | | 678,167 | | (859) | | | | | | | | | | | |
| 2,676,167 | | (12,068) | | 2,584,710 | | (15,566) | | | | | | | | | | | |
| | | | | | | | | | | | | | |
| Fair value | Memorandum allowance for ECL4 | Fair value | Memorandum allowance for ECL4 | | | | | | | | | | |
| $m | $m | $m | $m | | | | | | | | | | |
| Debt instruments measured at fair value through other comprehensive income (‘FVOCI’) | 347,203 | | (96) | | 399,717 | | (141) | | | | | | | | | | | |
1 The total ECL is recognised in the loss allowance for the financial asset unless the total ECL exceeds the gross carrying amount of the financial asset, in which case the ECL is recognised as a provision.
2 Includes only those financial instruments that are subject to the impairment requirements of IFRS 9. ‘Prepayments, accrued income and other assets’, as presented within the consolidated balance sheet on page 338, includes both financial and non-financial assets. The 31 December 2021 balances include $2,424m gross carrying amounts and $39m allowances for ECL related to assets held for sale due to the exit of domestic mass market retail banking in the US.
3 Represents the maximum amount at risk should the contracts be fully drawn upon and clients default.
4 Debt instruments measured at FVOCI continue to be measured at fair value with the allowance for ECL as a memorandum item. Change in ECL is recognised in ‘Change in expected credit losses and other credit impairment charges’ in the income statement.
The following table provides an overview of the Group’s credit risk by stage and industry, and the associated ECL coverage. The financial assets recorded in each stage have the following characteristics:
•Stage 1: These financial assets are unimpaired and without significant increase in credit risk on which a 12-month allowance for ECL is recognised.
•Stage 2: A significant increase in credit risk has been experienced on these financial assets since initial recognition for which a lifetime ECL is recognised.
•Stage 3: There is objective evidence of impairment and the financial assets are therefore considered to be in default or otherwise credit impaired on which a lifetime ECL is recognised.
•POCI: Financial assets that are purchased or originated at a deep discount are seen to reflect the incurred credit losses on which a lifetime ECL is recognised.
| | | | | | | | | | | | | | | | | | | | | | | | | | | | | | | | | | | | | | | | | | | | | | | |
Summary of credit risk (excluding debt instruments measured at FVOCI) by stage distribution and ECL coverage by industry sector at 31 December 2021 |
| (Audited) |
| Gross carrying/nominal amount1 | Allowance for ECL | ECL coverage % |
| Stage 1 | Stage 2 | Stage 3 | POCI2 | Total | Stage 1 | Stage 2 | Stage 3 | POCI2 | Total | Stage 1 | Stage 2 | Stage 3 | POCI2 | Total |
| | | | | | | | | | | | | | | |
| $m | $m | $m | $m | $m | $m | $m | $m | $m | $m | % | % | % | % | % |
| Loans and advances to customers at amortised cost | 918,936 | | 119,224 | | 18,797 | | 274 | | 1,057,231 | | (1,367) | | (3,119) | | (6,867) | | (64) | | (11,417) | | 0.1 | | 2.6 | | 36.5 | | 23.4 | | 1.1 | |
| – personal | 456,956 | | 16,439 | | 4,942 | | — | | 478,337 | | (658) | | (1,219) | | (1,226) | | — | | (3,103) | | 0.1 | | 7.4 | | 24.8 | | — | | 0.6 | |
| – corporate and commercial | 400,894 | | 98,911 | | 13,460 | | 274 | | 513,539 | | (665) | | (1,874) | | (5,601) | | (64) | | (8,204) | | 0.2 | | 1.9 | | 41.6 | | 23.4 | | 1.6 | |
| – non-bank financial institutions | 61,086 | | 3,874 | | 395 | | — | | 65,355 | | (44) | | (26) | | (40) | | — | | (110) | | 0.1 | | 0.7 | | 10.1 | | — | | 0.2 | |
| Loans and advances to banks at amortised cost | 81,636 | | 1,517 | | — | | — | | 83,153 | | (14) | | (3) | | — | | — | | (17) | | — | | 0.2 | | — | | — | | — | |
| Other financial assets measured at amortised cost | 875,016 | | 4,988 | | 304 | | 43 | | 880,351 | | (91) | | (54) | | (42) | | (6) | | (193) | | — | | 1.1 | | 13.8 | | 14.0 | | — | |
| Loan and other credit-related commitments | 594,473 | | 32,389 | | 775 | | — | | 627,637 | | (165) | | (174) | | (40) | | — | | (379) | | — | | 0.5 | | 5.2 | | — | | 0.1 | |
| – personal | 237,770 | | 1,747 | | 168 | | — | | 239,685 | | (37) | | (2) | | — | | — | | (39) | | — | | 0.1 | | — | | — | | — | |
| – corporate and commercial | 254,750 | | 28,269 | | 606 | | — | | 283,625 | | (120) | | (165) | | (40) | | — | | (325) | | — | | 0.6 | | 6.6 | | — | | 0.1 | |
| – financial | 101,953 | | 2,373 | | 1 | | — | | 104,327 | | (8) | | (7) | | — | | — | | (15) | | — | | 0.3 | | — | | — | | — | |
| Financial guarantees | 24,932 | | 2,638 | | 225 | | — | | 27,795 | | (11) | | (30) | | (21) | | — | | (62) | | — | | 1.1 | | 9.3 | | — | | 0.2 | |
| – personal | 1,114 | | 15 | | 1 | | — | | 1,130 | | — | | — | | — | | — | | — | | — | | — | | — | | — | | — | |
| – corporate and commercial | 20,025 | | 2,107 | | 223 | | — | | 22,355 | | (10) | | (28) | | (20) | | — | | (58) | | — | | 1.3 | | 9.0 | | — | | 0.3 | |
| – financial | 3,793 | | 516 | | 1 | | — | | 4,310 | | (1) | | (2) | | (1) | | — | | (4) | | — | | 0.4 | | 100.0 | | — | | 0.1 | |
| At 31 Dec 2021 | 2,494,993 | | 160,756 | | 20,101 | | 317 | | 2,676,167 | | (1,648) | | (3,380) | | (6,970) | | (70) | | (12,068) | | 0.1 | | 2.1 | | 34.7 | | 22.1 | | 0.5 | |
1 Represents the maximum amount at risk should the contracts be fully drawn upon and clients default.
2 Purchased or originated credit-impaired (‘POCI’).
Unless identified at an earlier stage, all financial assets are deemed to have suffered a significant increase in credit risk when they are 30 days past due (‘DPD’) and are transferred from stage 1 to stage 2. The following disclosure presents the ageing of stage 2
financial assets by those less than 30 days and greater than 30 DPD and therefore presents those financial assets classified as stage 2 due to ageing (30 DPD) and those identified at an earlier stage (less than 30 DPD).
| | | | | | | | | | | | | | | | | | | | | | | | | | | | | | | | | | | | | | | | | |
| Stage 2 days past due analysis at 31 December 2021 | | | |
| (Audited) |
| Gross carrying amount | Allowance for ECL | ECL coverage % | | | |
| | | | | | | | | | | | | | | |
| Stage 2 | Up-to-date | 1 to 29 DPD1,2 | 30 and > DPD1,2 | Stage 2 | Up-to-date | 1 to 29 DPD1,2 | 30 and > DPD1,2 | Stage 2 | Up-to-date | 1 to 29 DPD1,2 | 30 and > DPD1,2 | | | |
| $m | $m | $m | $m | $m | $m | $m | $m | % | % | % | % | | | |
| Loans and advances to customers at amortised cost | 119,224 | | 115,350 | | 2,193 | | 1,681 | | (3,119) | | (2,732) | | (194) | | (193) | | 2.6 | | 2.4 | | 8.8 | | 11.5 | | | | |
| – personal | 16,439 | | 14,124 | | 1,387 | | 928 | | (1,219) | | (884) | | (160) | | (175) | | 7.4 | | 6.3 | | 11.5 | | 18.9 | | | | |
| – corporate and commercial | 98,911 | | 97,388 | | 806 | | 717 | | (1,874) | | (1,822) | | (34) | | (18) | | 1.9 | | 1.9 | | 4.2 | | 2.5 | | | | |
| – non-bank financial institutions | 3,874 | | 3,838 | | — | | 36 | | (26) | | (26) | | — | | — | | 0.7 | | 0.7 | | — | | — | | | | |
| Loans and advances to banks at amortised cost | 1,517 | | 1,517 | | — | | — | | (3) | | (3) | | — | | — | | 0.2 | | 0.2 | | — | | — | | | | |
| Other financial assets measured at amortised cost | 4,988 | | 4,935 | | 22 | | 31 | | (54) | | (47) | | (4) | | (3) | | 1.1 | | 1.0 | | 18.2 | | 9.7 | | | | |
1 Days past due (‘DPD’).
2 The days past due amounts presented above are on a contractual basis and include the benefit of any customer relief payment holidays granted.
| | | | | | | | | | | | | | | | | | | | | | | | | | | | | | | | | | | | | | | | | | | | | | | | | |
Summary of credit risk (excluding debt instruments measured at FVOCI) by stage distribution and ECL coverage by industry sector at 31 December 2020 (continued) | | |
| (Audited) | | |
| Gross carrying/nominal amount1 | Allowance for ECL | ECL coverage % | | |
| Stage 1 | Stage 2 | Stage 3 | POCI2 | Total | Stage 1 | Stage 2 | Stage 3 | POCI2 | Total | Stage 1 | Stage 2 | Stage 3 | POCI2 | Total | | |
| $m | $m | $m | $m | $m | $m | $m | $m | $m | $m | % | % | % | % | % | | |
| Loans and advances to customers at amortised cost | 869,920 | | 163,185 | | 19,095 | | 277 | | 1,052,477 | | (1,974) | | (4,965) | | (7,439) | | (112) | | (14,490) | | 0.2 | | 3.0 | | 39.0 | | 40.4 | | 1.4 | | | |
| – personal | 430,134 | | 25,064 | | 5,611 | | — | | 460,809 | | (827) | | (2,402) | | (1,502) | | — | | (4,731) | | 0.2 | | 9.6 | | 26.8 | | — | | 1.0 | | | |
| – corporate and commercial | 387,563 | | 126,287 | | 12,961 | | 277 | | 527,088 | | (1,101) | | (2,444) | | (5,837) | | (112) | | (9,494) | | 0.3 | | 1.9 | | 45.0 | | 40.4 | | 1.8 | | | |
| – non-bank financial institutions | 52,223 | | 11,834 | | 523 | | — | | 64,580 | | (46) | | (119) | | (100) | | — | | (265) | | 0.1 | | 1.0 | | 19.1 | | — | | 0.4 | | | |
| Loans and advances to banks at amortised cost | 79,654 | | 2,004 | | — | | — | | 81,658 | | (33) | | (9) | | — | | — | | (42) | | — | | 0.4 | | — | | — | | 0.1 | | | |
| Other financial assets measured at amortised cost | 768,216 | | 3,975 | | 177 | | 40 | | 772,408 | | (80) | | (44) | | (42) | | (9) | | (175) | | — | | 1.1 | | 23.7 | | 22.5 | | — | | | |
| Loan and other credit-related commitments | 604,485 | | 54,217 | | 1,080 | | 1 | | 659,783 | | (290) | | (365) | | (78) | | (1) | | (734) | | — | | 0.7 | | 7.2 | | 100.0 | | 0.1 | | | |
| – personal | 234,337 | | 1,681 | | 152 | | — | | 236,170 | | (39) | | (1) | | — | | — | | (40) | | — | | 0.1 | | — | | — | | — | | | |
| – corporate and commercial | 253,062 | | 45,851 | | 888 | | 1 | | 299,802 | | (236) | | (338) | | (75) | | (1) | | (650) | | 0.1 | | 0.7 | | 8.4 | | 100.0 | | 0.2 | | | |
| – financial | 117,086 | | 6,685 | | 40 | | — | | 123,811 | | (15) | | (26) | | (3) | | — | | (44) | | — | | 0.4 | | 7.5 | | — | | — | | | |
| Financial guarantees | 14,090 | | 4,024 | | 269 | | 1 | | 18,384 | | (37) | | (62) | | (26) | | — | | (125) | | 0.3 | | 1.5 | | 9.7 | | — | | 0.7 | | | |
| – personal | 872 | | 26 | | 2 | | — | | 900 | | — | | (1) | | — | | — | | (1) | | — | | 3.8 | | — | | — | | 0.1 | | | |
| – corporate and commercial | 9,536 | | 3,157 | | 252 | | 1 | | 12,946 | | (35) | | (54) | | (25) | | — | | (114) | | 0.4 | | 1.7 | | 9.9 | | — | | 0.9 | | | |
| – financial | 3,682 | | 841 | | 15 | | — | | 4,538 | | (2) | | (7) | | (1) | | — | | (10) | | 0.1 | | 0.8 | | 6.7 | | — | | 0.2 | | | |
| At 31 Dec 2020 | 2,336,365 | | 227,405 | | 20,621 | | 319 | | 2,584,710 | | (2,414) | | (5,445) | | (7,585) | | (122) | | (15,566) | | 0.1 | | 2.4 | | 36.8 | | 38.2 | | 0.6 | | | |
| | | | | | | | | | | | | | | | | |
| | | | | | | | | | | | | | | | | |
1 Represents the maximum amount at risk should the contracts be fully drawn upon and clients default.
2 Purchased or originated credit-impaired (‘POCI’).
| | | | | | | | | | | | | | | | | | | | | | | | | | | | | | | | | | | | | | | | | |
| Stage 2 days past due analysis at 31 December 2020 | | | |
| (Audited) |
| Gross carrying amount | Allowance for ECL | ECL coverage % | | | |
| | | | | | | | | | | | | | | |
| Stage 2 | Up-to-date | 1 to 29 DPD1,2 | 30 and > DPD1,2 | Stage 2 | Up-to-date | 1 to 29 DPD1,2 | 30 and > DPD1,2 | Stage 2 | Up-to-date | 1 to 29 DPD1,2 | 30 and > DPD1,2 | | | |
| $m | $m | $m | $m | $m | $m | $m | $m | % | % | % | % | | | |
| Loans and advances to customers at amortised cost | 163,185 | | 159,367 | | 2,052 | | 1,766 | | (4,965) | | (4,358) | | (275) | | (332) | | 3.0 | | 2.7 | | 13.4 | | 18.8 | | | | |
| – personal | 25,064 | | 22,250 | | 1,554 | | 1,260 | | (2,402) | | (1,895) | | (227) | | (280) | | 9.6 | | 8.5 | | 14.6 | | 22.2 | | | | |
| – corporate and commercial | 126,287 | | 125,301 | | 489 | | 497 | | (2,444) | | (2,344) | | (48) | | (52) | | 1.9 | | 1.9 | | 9.8 | | 10.5 | | | | |
| – non-bank financial institutions | 11,834 | | 11,816 | | 9 | | 9 | | (119) | | (119) | | — | | — | | 1.0 | | 1.0 | | — | | — | | | | |
| Loans and advances to banks at amortised cost | 2,004 | | 2,004 | | — | | — | | (9) | | (9) | | — | | — | | 0.4 | | 0.4 | | — | | — | | | | |
| Other financial assets measured at amortised cost | 3,975 | | 3,963 | | 3 | | 9 | | (44) | | (44) | | — | | — | | 1.1 | | 1.1 | | — | | — | | | | |
1 Days past due (‘DPD’).
2 The days past due amounts presented above are on a contractual basis and include the benefit of any customer relief payment holidays granted.
Stage 2 decomposition at 31 December 2021
The following disclosure presents the stage 2 decomposition of gross carrying amount and allowances for ECL for loans and advances to customers.
The table below discloses the reasons why an exposure moved into stage 2 originally, and is therefore presented as a significant increase in credit risk since origination.
The quantitative classification shows when the relevant reporting date PD measure exceeds defined quantitative thresholds for retail
and wholesale exposures, as set out in Note 1.2 ‘Summary of significant accounting policies’, on page 352.
The qualitative classification primarily accounts for CRR deterioration, watch and worry and retail management judgemental adjustments.
For further details on our approach to the assessment of significant increase in credit risk, see ‘Summary of significant accounting policies’ on page 352.
| | | | | | | | | | | | | | | | | | | | | | | | | | | | | |
Loans and advances to customers1 |
| Gross carrying amount | Allowance for ECL | ECL coverage
Total |
| Personal | Corporate and commercial | Non-bank financial institutions | Total | Personal | Corporate and commercial | Non-bank financial institutions | Total |
| $m | $m | $m | $m | $m | $m | $m | $m | % |
| Quantitative | 9,907 | | 68,000 | | 3,041 | | 80,948 | | (1,076) | | (1,347) | | (19) | | (2,442) | | 3.0 | |
| Qualitative | 6,329 | | 30,326 | | 818 | | 37,473 | | (134) | | (520) | | (7) | | (661) | | 1.8 | |
30 DPD backstop2 | 203 | | 585 | | 15 | | 803 | | (9) | | (7) | | — | | (16) | | 2.0 | |
| Total stage 2 | 16,439 | | 98,911 | | 3,874 | | 119,224 | | (1,219) | | (1,874) | | (26) | | (3,119) | | 2.6 | |
1 Where balances satisfy more than one of the above three criteria for determining a significant increase in credit risk, the corresponding gross exposure and ECL have been assigned in order of categories presented.
2 Days past due (‘DPD’).
Credit exposure
Maximum exposure to credit risk
(Audited)
This section provides information on balance sheet items and their offsets as well as loan and other credit-related commitments.
Commentary on consolidated balance sheet movements in 2021 is provided on page 98.
The offset on derivatives remains in line with the movements in maximum exposure amounts.
| | |
‘Maximum exposure to credit risk’ table The following table presents our maximum exposure before taking account of any collateral held or other credit enhancements (unless such enhancements meet accounting offsetting requirements). The table excludes financial instruments whose carrying amount best represents the net exposure to credit risk, and it excludes equity securities as they are not subject to credit risk. For the financial assets recognised on the balance sheet, the maximum exposure to credit risk equals their carrying amount and is net of the allowance for ECL. For financial guarantees and other guarantees granted, it is the maximum amount that we would have to pay if the guarantees were called upon. For loan commitments and other credit-related commitments, it is generally the full amount of the committed facilities. The offset in the table relates to amounts where there is a legally enforceable right of offset in the event of counterparty default and where, as a result, there is a net exposure for credit risk purposes. However, as there is no intention to settle these balances on a net basis under normal circumstances, they do not qualify for net presentation for accounting purposes. No offset has been applied to off-balance sheet collateral. In the case of derivatives, the offset column also includes collateral received in cash and other financial assets. |
Other credit risk mitigants
While not disclosed as an offset in the following ‘Maximum exposure to credit risk’ table, other arrangements are in place that reduce our maximum exposure to credit risk. These include a charge over collateral on borrowers’ specific assets, such as residential properties, collateral held in the form of financial instruments that are not held on the balance sheet and short positions in securities. In addition, for financial assets held as part of linked insurance/investment contracts the risk is predominantly borne by the policyholder. See page 350 and Note 30 on the financial statements for further details of collateral in respect of certain loans and advances and derivatives.
Collateral available to mitigate credit risk is disclosed in the ‘Collateral’ section on page 205.
| | | | | | | | | | | | | | | | | | | | | | | | | | | | | |
| Maximum exposure to credit risk | | | | | | | | | |
| (Audited) |
| 2021 | 2020 | | | | | | | | | |
| Maximum
exposure | Offset | Net | Maximum
exposure | Offset | Net | | | | | | | | | |
| $m | $m | $m | $m | $m | $m | | | | | | | | | |
| Loans and advances to customers held at amortised cost | 1,045,814 | | (22,838) | | 1,022,976 | | 1,037,987 | | (27,221) | | 1,010,766 | | | | | | | | | | |
| – personal | 475,234 | | (4,461) | | 470,773 | | 456,078 | | (4,287) | | 451,791 | | | | | | | | | | |
| – corporate and commercial | 505,335 | | (16,824) | | 488,511 | | 517,594 | | (21,102) | | 496,492 | | | | | | | | | | |
| – non-bank financial institutions | 65,245 | | (1,553) | | 63,692 | | 64,315 | | (1,832) | | 62,483 | | | | | | | | | | |
| Loans and advances to banks at amortised cost | 83,136 | | — | | 83,136 | | 81,616 | | — | | 81,616 | | | | | | | | | | |
| Other financial assets held at amortised cost | 882,708 | | (12,231) | | 870,477 | | 774,116 | | (14,668) | | 759,448 | | | | | | | | | | |
| – cash and balances at central banks | 403,018 | | — | | 403,018 | | 304,481 | | — | | 304,481 | | | | | | | | | | |
| – items in the course of collection from other banks | 4,136 | | — | | 4,136 | | 4,094 | | — | | 4,094 | | | | | | | | | | |
| – Hong Kong Government certificates of indebtedness | 42,578 | | — | | 42,578 | | 40,420 | | — | | 40,420 | | | | | | | | | | |
| – reverse repurchase agreements – non-trading | 241,648 | | (12,231) | | 229,417 | | 230,628 | | (14,668) | | 215,960 | | | | | | | | | | |
| – financial investments | 97,302 | | — | | 97,302 | | 88,639 | | — | | 88,639 | | | | | | | | | | |
| – prepayments, accrued income and other assets | 94,026 | | — | | 94,026 | | 105,854 | | — | | 105,854 | | | | | | | | | | |
| Derivatives | 196,882 | | (188,284) | | 8,598 | | 307,726 | | (293,240) | | 14,486 | | | | | | | | | | |
| Total on-balance sheet exposure to credit risk | 2,208,540 | | (223,353) | | 1,985,187 | | 2,201,445 | | (335,129) | | 1,866,316 | | | | | | | | | | |
| Total off-balance sheet | 928,183 | | — | | 928,183 | | 940,185 | | — | | 940,185 | | | | | | | | | | |
| – financial and other guarantees | 113,088 | | — | | 113,088 | | 96,147 | | — | | 96,147 | | | | | | | | | | |
| – loan and other credit-related commitments | 815,095 | | — | | 815,095 | | 844,038 | | — | | 844,038 | | | | | | | | | | |
| At 31 Dec | 3,136,723 | | (223,353) | | 2,913,370 | | 3,141,630 | | (335,129) | | 2,806,501 | | | | | | | | | | |
Concentration of exposure
We have a number of global businesses with a broad range of products. We operate in a number of geographical markets with the majority of our exposures in Asia and Europe.
For an analysis of:
•financial investments, see Note 17 on the financial statements;
•trading assets, see Note 11 on the financial statements;
•derivatives, see page 212 and Note 16 on the financial statements; and
•loans and advances by industry sector and by the location of the principal operations of the lending subsidiary (or, in the case of the operations of The Hongkong and Shanghai Banking Corporation Limited, HSBC Bank plc, HSBC Bank Middle East Limited and HSBC Bank USA, by the location of the lending branch), see page 198 for wholesale lending and page 212 for personal lending.
Credit deterioration of financial instruments
(Audited)
A summary of our current policies and practices regarding the identification, treatment and measurement of stage 1, stage 2, stage 3 (credit impaired) and POCI financial instruments can be found in Note 1.2 on the financial statements.
Measurement uncertainty and sensitivity analysis of ECL estimates
(Audited)
Despite a broad recovery in economic conditions during 2021, ECL estimates continued to be subject to a high degree of uncertainty, and management judgements and estimates continued to reflect a degree of caution, both in the selection of economic scenarios and their weightings, and through management judgemental adjustments. Releases of provisions were made progressively as economic conditions recovered and by 31 December 2021 the majority of the 2020 uplift in ECL provisions had been reversed. By the end of 2021, we retained $0.6bn (15%) of the $3.9bn uplift in stage 1 and stage 2 ECL provisions on loans made during 2020.
The recognition and measurement of ECL involves the use of significant judgement and estimation. We form multiple economic scenarios based on economic forecasts, apply these assumptions to credit risk models to estimate future credit losses, and probability-weight the results to determine an unbiased ECL estimate. Management judgemental adjustments are used to address late-breaking events, data and model limitations, model deficiencies and expert credit judgements.
Methodology
NaN economic scenarios are used to capture the current economic environment and to articulate management’s view of the range of potential outcomes. Scenarios produced to calculate ECL are aligned to HSBC’s top and emerging risks.
In the second quarter of 2020, to ensure that the severe risks associated with the pandemic were appropriately captured, management added a fourth, more severe, scenario to use in the measurement of ECL. Starting in the fourth quarter of 2021, HSBC’s methodology has been adjusted so that the use of four scenarios, of which two are Downside scenarios, is the standard approach to ECL calculation.
NaN of the scenarios are drawn from consensus forecasts and distributional estimates. The Central scenario is deemed the ‘most likely’ scenario, and usually attracts the largest probability weighting, while the outer scenarios represent the tails of the distribution, which are less likely to occur. The Central scenario is created using the average of a panel of external forecasters. Consensus Upside and Downside scenarios are created with reference to distributions for select markets that capture forecasters’ views of the entire range of outcomes. In the later years of the scenarios, projections revert to long-term consensus trend expectations. In the consensus outer scenarios, reversion to trend expectations is done mechanically with reference to historically observed quarterly changes in the values of macroeconomic variables.
The fourth scenario, Downside 2, is designed to represent management’s view of severe downside risks. It is a globally consistent narrative-driven scenario that explores more extreme economic outcomes than those captured by the consensus scenarios. In this scenario, variables do not, by design, revert to long-term trend expectations. They may instead explore alternative states of equilibrium, where economic activity moves permanently away from past trends.
The consensus Downside and the consensus Upside scenarios are each constructed to be consistent with a 10% probability. The Downside 2 is constructed with a 5% probability. The Central scenario is assigned the remaining 75%. This weighting scheme is deemed appropriate for the unbiased estimation of ECL in most circumstances. However, management may depart from this probability-based scenario weighting approach when the economic outlook is determined to be particularly uncertain and risks are elevated.
In light of ongoing risks, related primarily to the Covid-19 pandemic, management deviated from this probability weighting in most markets in the fourth quarter of 2021.
Description of economic scenarios
The economic assumptions presented in this section have been formed by HSBC with reference to external forecasts specifically for the purpose of calculating ECL.
The global economy experienced a recovery in 2021, following an unprecedented contraction in 2020. Restrictions to mobility and travel eased across our key markets, aided by the successful roll-out of vaccination programmes. The emergence of new variants that potentially reduce the efficacy of vaccines remains a risk.
Economic forecasts remain subject to a high degree of uncertainty. Risks to the economic outlook are dominated by the progression of the pandemic, vaccine roll-out and the public policy response. Geopolitical risks also remain significant and include continued differences between the US and other countries with China over a range of economic and strategic defence issues. Continued uncertainty over the long-term economic relationship between the UK and EU also present downside risks.
The scenarios used to calculate ECL in the Annual Report and Accounts 2021 are described below.
The consensus Central scenario
HSBC’s Central scenario features a continued recovery in economic growth in 2022 as activity and employment gradually return to the levels reached prior to the outbreak of Covid-19.
Our Central scenario assumes that the stringent restrictions on activity, imposed across several countries and territories in 2020 and 2021 are not repeated. The new viral strain that emerged late in 2021, Omicron, has only a limited impact on the recovery, according to this scenario. Consumer spending and business investment, supported by elevated levels of private sector savings, are expected to drive the economic recovery as fiscal and monetary policy support recedes.
Regional differences in the speed of economic recovery in the Central scenario reflect differences over the progression of the pandemic, roll-out of vaccination programmes, national level restrictions imposed and scale of support measures. Global GDP is expected to grow by 4.2% in 2022 in the Central scenario and the average rate of global GDP growth is 3.1% over the five-year
forecast period. This exceeds the average growth rate over the five-year period prior to the onset of the pandemic.
The key features of our Central scenario are:
•Economic activity in our top eight markets continues to recover. GDP grows at a moderate rate and exceeds pre-pandemic levels across all our key markets in 2022.
•Unemployment declines to levels only slightly higher than existed pre-pandemic, with the exception of France where the downward trend in unemployment, related to structural changes to the labour market, resumes.
•Covid-19-related fiscal spending recedes in 2022 as fewer restrictions on activity allow fiscal support to be withdrawn. Deficits remain high in several countries as they embark on multi-year investment programmes to support recovery, productivity growth and climate transition.
•Inflation across many of our key markets remains elevated through 2022. Supply-driven price pressures persist through the first half of 2022 before gradually easing. In subsequent years, inflation quickly converges back towards central bank target rates.
•Policy interest rates in key markets rise gradually over our projection period, in line with economic recovery.
•The West Texas Intermediate oil price is forecast to average $62 per barrel over the projection period.
In the longer term, growth reverts back towards similar rates that existed prior to the pandemic, suggesting that the damage to long-term economic prospects is expected to be minimal.
The Central scenario was first created with forecasts available in November, and subsequently updated in December. Probability weights assigned to the Central scenario vary from 60% to 80% and reflect relative differences in uncertainty across markets.
The following table describes key macroeconomic variables and the probabilities assigned in the consensus Central scenario.
| | | | | | | | | | | | | | | | | | | | | | | | | | |
| Central scenario 2022–2026 |
| UK | US | Hong Kong | Mainland China | Canada | France | UAE | Mexico |
| % | % | % | % | % | % | % | % |
| GDP growth rate | | | | | | | | |
| 2022: Annual average growth rate | 5.0 | | 4.0 | | 3.1 | | 5.3 | | 4.1 | | 3.9 | | 4.4 | | 2.9 | |
| 2023: Annual average growth rate | 2.1 | | 2.4 | | 2.9 | | 5.4 | | 2.8 | | 2.1 | | 3.4 | | 2.3 | |
| 2024: Annual average growth rate | 1.9 | | 2.1 | | 2.6 | | 5.1 | | 2.0 | | 1.6 | | 3.0 | | 2.2 | |
| 5-year average | 2.5 | | 2.5 | | 2.7 | | 5.1 | | 2.5 | | 2.1 | | 3.2 | | 2.3 | |
| Unemployment rate | | | | | | | | |
| 2022: Annual average rate | 4.5 | | 4.2 | | 4.1 | | 3.8 | | 6.3 | | 8.0 | | 3.1 | | 4.0 | |
| 2023: Annual average rate | 4.3 | | 3.8 | | 3.6 | | 3.7 | | 5.9 | | 7.7 | | 3.0 | | 3.9 | |
| 2024: Annual average rate | 4.2 | | 3.8 | | 3.5 | | 3.8 | | 5.8 | | 7.6 | | 2.9 | | 3.8 | |
| 5-year average | 4.3 | | 3.8 | | 3.6 | | 3.8 | | 5.9 | | 7.7 | | 3.0 | | 3.8 | |
| House price growth | | | | | | | | |
| 2022: Annual average growth rate | 5.5 | | 10.3 | | 3.4 | | 0.3 | | 6.4 | | 4.9 | | 4.9 | | 5.8 | |
| 2023: Annual average growth rate | 3.3 | | 5.4 | | 2.4 | | 4.7 | | 2.8 | | 4.6 | | — | | 5.0 | |
| 2024: Annual average growth rate | 3.3 | | 3.7 | | 2.0 | | 4.9 | | 2.1 | | 4.0 | | 2.1 | | 4.4 | |
| 5-year average | 3.5 | | 5.4 | | 2.6 | | 3.5 | | 3.3 | | 3.9 | | 2.7 | | 4.7 | |
| Short-term interest rate | | | | | | | | |
| 2022: Annual average rate | 1.0 | | 0.5 | | 0.5 | | 3.1 | | 1.1 | | (0.5) | | 1.1 | | 7.2 | |
| 2023: Annual average rate | 1.3 | | 1.1 | | 1.1 | | 3.2 | | 2.0 | | (0.3) | | 1.7 | | 8.1 | |
| 2024: Annual average rate | 1.2 | | 1.5 | | 1.6 | | 3.4 | | 2.2 | | (0.1) | | 2.2 | | 8.0 | |
| 5-year average | 1.2 | | 1.3 | | 1.4 | | 3.4 | | 1.9 | | (0.2) | | 2.0 | | 7.9 | |
| Probability | 60 | | 75 | | 70 | | 80 | | 75 | | 60 | | 70 | | 65 | |
The graphs comparing the respective Central scenarios in the fourth quarters of 2020 and 2021 reveal the extent of economic dislocation that occurred in 2020 and compare current economic expectations with those held a year ago.
GDP growth: Comparison
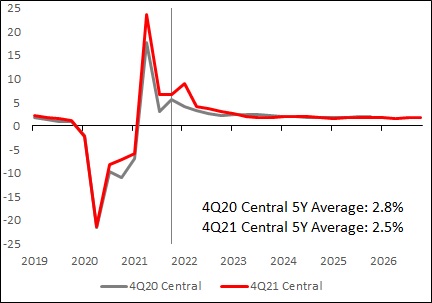 Note: Real GDP shown as year-on-year percentage change.
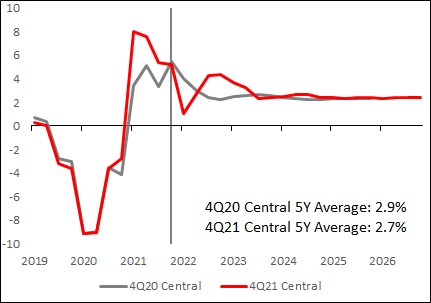 Note: Real GDP shown as year-on-year percentage change.
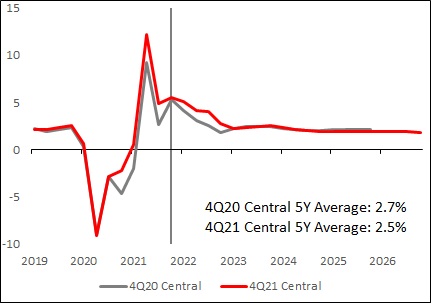 Note: Real GDP shown as year-on-year percentage change.
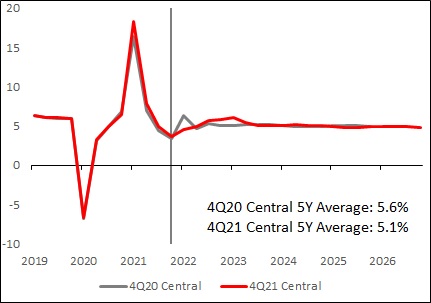 Note: Real GDP shown as year-on-year percentage change.
The consensus Upside scenario
Compared with the Central scenario, the consensus Upside scenario features a faster recovery in economic activity during the first two years, before converging to long-run trend expectations.
The scenario is consistent with a number of key upside risk themes. These include the orderly and rapid global abatement of
Covid-19 via successful containment and ongoing vaccine efficacy; de-escalation of tensions between the US and China; continued fiscal and monetary support; and smooth relations between the UK and the EU.
The following table describes key macroeconomic variables and the probabilities assigned in the consensus Upside scenario.
| | | | | | | | | | | | | | | | | | | | | | | | | | | | | | | | | | | | | | | | | | | | | | | | | | |
| Consensus Upside scenario best outcome |
| UK | US | Hong Kong | Mainland China | Canada | France | UAE | Mexico |
| % | | % | | % | | % | | % | | % | | % | | % | |
| GDP growth rate | 9.9 | | (1Q22) | 7.3 | | (3Q22) | 10.3 | | (4Q22) | 11.8 | | (4Q22) | 9.1 | | (3Q22) | 7.0 | | (2Q22) | 10.8 | | (1Q22) | 7.6 | | (3Q22) |
| Unemployment rate | 3.0 | | (4Q23) | 2.7 | | (2Q23) | 2.7 | | (4Q23) | 3.5 | | (1Q23) | 5.0 | | (2Q23) | 6.6 | | (4Q23) | 2.3 | | (4Q23) | 3.3 | | (3Q22) |
| House price growth | 7.4 | | (2Q23) | 14.8 | | (1Q22) | 11.9 | | (4Q22) | 8.2 | | (4Q22) | 16.0 | | (4Q22) | 6.8 | | (2Q22) | 14.4 | | (2Q22) | 9.6 | | (1Q23) |
| Short-term interest rate | 0.7 | | (1Q22) | 0.4 | | (1Q22) | 0.6 | | (1Q22) | 3.2 | | (1Q22) | 0.9 | | (1Q22) | (0.5) | | (1Q22) | 0.9 | | (1Q22) | 8.7 | | (1Q22) |
| Probability | 10 | 5 | 5 | 5 | 10 | 10 | 5 | 5 |
Note: Extreme point in the consensus Upside is ‘best outcome’ in the scenario, for example the highest GDP growth and the lowest unemployment rate, in the first two years of the scenario.
Downside scenarios
The progress of the pandemic and the ongoing public policy response continue to be a key sources of risk. Downside scenarios assume that new strains of the virus result in an acceleration in infection rates and increased pressure on public health services, necessitating restrictions on activity. The reimposition of such restrictions could be assumed to have a damaging effect on consumer and business confidence.
Government fiscal programmes in advanced economies in 2020 and 2021 were supported by accommodative actions taken by central banks. These measures have provided households and firms with significant support. An inability or unwillingness to
continue with such support or the untimely withdrawal of support present a downside risk to growth.
While Covid-19 and related risks dominate the economic outlook, geopolitical risks also present a threat. These risks include:
•continued differences between the US and other countries with China, which could affect sentiment and restrict global economic activity;
•the re-emergence of social unrest in Hong Kong; and
•potential disagreements between the UK and the EU, which may hinder the ability to reach a more comprehensive agreement on trade and services, despite the Trade and Cooperation Agreement averting a disorderly UK departure.
The consensus Downside scenario
In the consensus Downside scenario, economic recovery is weaker compared with the Central scenario as key global risks, including the Covid-19 pandemic, escalate. Compared with the Central scenario, GDP growth is expected to be lower, unemployment rates rise moderately and asset and commodity
prices fall, before gradually recovering towards their long-run trend expectations.
The following table describes key macroeconomic variables and the probabilities assigned in the consensus Downside scenario.
| | | | | | | | | | | | | | | | | | | | | | | | | | | | | | | | | | | | | | | | | | | | | | | | | | |
| Consensus Downside scenario worst outcome |
| UK | US | Hong Kong | Mainland China | Canada | France | UAE | Mexico |
| % | | % | | % | | % | | % | | % | | % | | % | |
| GDP growth rate | (0.5) | | (3Q23) | 0.0 | | (4Q22) | (1.0) | | (4Q22) | 2.3 | | (4Q22) | (0.5) | | (4Q22) | 0.5 | | (4Q23) | (2.0) | | (4Q22) | (0.7) | | (4Q22) |
| Unemployment rate | 5.6 | | (4Q22) | 5.6 | | (3Q22) | 5.6 | | (2Q22) | 4.0 | | (2Q22) | 7.3 | | (3Q22) | 9.1 | | (3Q22) | 4.3 | | (3Q22) | 4.8 | | (3Q22) |
| House price growth | (4.2) | | (1Q23) | 3.0 | | (4Q23) | (7.9) | | (4Q22) | (3.7) | | (2Q22) | (2.3) | | (4Q22) | 2.0 | | (4Q22) | (6.6) | | (1Q23) | 2.5 | | (1Q23) |
| Short-term interest rate | 0.2 | | (4Q23) | 0.3 | | (1Q22) | 0.4 | | (1Q22) | 2.9 | | (1Q22) | 0.5 | | (3Q23) | (0.5) | | (1Q22) | 0.6 | | (4Q23) | 4.6 | | (1Q22) |
| Probability | 15 | 10 | 20 | 10 | 10 | 15 | 20 | 20 |
Note: Extreme point in the consensus Downside is 'worst outcome' in the scenario, for example lowest GDP growth and the highest unemployment rate, in the first two years of the scenario.
Downside 2 scenario
The Downside 2 scenario features a deep global recession. In this scenario, new Covid-19 variants emerge that cause infections to rise sharply in 2022, resulting in setbacks to vaccination programmes and the rapid imposition of restrictions on mobility
and travel across some countries. The scenario also assumes governments and central banks are unable to significantly increase fiscal and monetary support, which results in abrupt corrections in labour and asset markets.
The following table describes key macroeconomic variables and the probabilities assigned in the Downside 2 scenario.
| | | | | | | | | | | | | | | | | | | | | | | | | | | | | | | | | | | | | | | | | | | | | | | | | | |
| Downside 2 scenario worst outcome |
| UK | US | Hong Kong | Mainland China | Canada | France | UAE | Mexico |
| % | | % | | % | | % | | % | | % | | % | | % | |
| GDP growth rate | (4.6) | | (4Q22) | (4.6) | | (4Q22) | (8.2) | | (4Q22) | (4.8) | | (4Q22) | (13.9) | | (4Q22) | (4.6) | | (4Q22) | (12.5) | | (4Q22) | (8.5) | | (4Q22) |
| Unemployment rate | 7.5 | | (2Q23) | 10.6 | | (4Q23) | 6.1 | | (4Q22) | 5.4 | | (4Q23) | 11.5 | | (2Q23) | 10.0 | | (4Q23) | 4.7 | | (2Q22) | 5.9 | | (2Q23) |
| House price growth | (14.2) | | (2Q23) | (6.2) | | (4Q22) | (17.7) | | (4Q22) | (24.8) | | (4Q22) | (23.8) | | (1Q23) | (6.0) | | (2Q23) | (16.2) | | (4Q22) | 1.0 | | (2Q23) |
| Short-term interest rate | 1.6 | | (2Q22) | 1.3 | | (2Q22) | 1.3 | | (2Q22) | 4.0 | | (2Q22) | 0.5 | | (3Q23) | 0.4 | | (2Q22) | 1.5 | | (2Q22) | 9.6 | | (2Q22) |
| Probability | 15 | 10 | 5 | 5 | 5 | 15 | 5 | 10 |
Note: Extreme point in the Downside 2 is 'worst outcome' in the scenario, for example lowest GDP growth and the highest unemployment rate, in the first two years of the scenario.
Scenario weighting
In reviewing the economic conjuncture, the level of uncertainty and risk, management has considered both global and country-specific factors. This has led management to assign scenario probabilities that are tailored to its view of uncertainty in individual markets.
To inform its view, management has considered the progression of the virus in individual countries, the speed of vaccine roll-outs, the degree of current and expected future government support and connectivity with other countries. Management has also been guided by the policy response and economic performance through the pandemic, as well as the evidence that economies have adapted as the virus has progressed.
A key consideration in the fourth quarter was the emergence of the new variant, Omicron. The virulence and severity of the new strain, in addition to the continued efficacy of vaccines against it, was unknown when the variant first emerged. Management therefore determined that uncertainty attached to forecasts had increased and sought to reflect this in scenario weightings.
China’s significant capacity to extend policy support to the economy and manage through Covid-19-related disruptions, led management to conclude that the outlook for mainland China was the least uncertain of all our key markets. The Central scenario was given an 80% probability while a total of 15% has been assigned to the 2 Downside scenarios.
In Hong Kong, the combination of recurrent outbreaks and the other risks outlined above led management to assign a 25% weight to the 2 Downside scenarios.
The UK and France faced the greatest economic uncertainties of our key markets. The emergence of Omicron exacerbated the rise in case rates and hospitalisations in both countries, necessitating the imposition of new restrictions. These increase uncertainties around economic growth and employment. Accordingly, the Central scenario was assigned a 60% weight in both countries. The 2 Downside scenarios were given a combined probability weighting of 30% for both the UK and France.
For the US, Canada and Mexico, connectivity across the 3 North American economies has been considered. For the US and Mexico, management similarly sought to reflect the increase in uncertainty by raising the probability weighting of the Downside 2 scenario. The 2 Downside scenarios combined have been given weights of between 20% and 30%. For Canada, the probability attached to the Downside 2 scenario was reduced. This follows from an adjustment to the methodology used for this scenario, which increased its overall severity. The change aligned the methodology to the global approach and weighting adjustments reflect the greater implied severity. In the UAE, the impact of the oil price on the economy and the ability of non-oil sectors to contribute to economic recovery have influenced the view of uncertainty. The Central scenario has been assigned between 65% and 75% weight for these 4 markets and, with risks perceived as being weighted to the downside, the two Downside scenarios have been given weights of between 15% and 30%.
The following graphs show the historical and forecasted GDP growth rate for the various economic scenarios in our 4 largest markets.
Critical accounting estimates and judgements
The calculation of ECL under IFRS 9 involves significant judgements, assumptions and estimates. Despite a general recovery in economic conditions during 2021, the level of estimation uncertainty and judgement has remained high during 2021 as a result of the ongoing economic effects of the Covid-19 pandemic and other sources of economic instability, including significant judgements relating to:
•the selection and weighting of economic scenarios, given rapidly changing economic conditions in an unprecedented manner, uncertainty as to the effect of government and central bank support measures designed to alleviate adverse economic impacts, and a wider distribution of economic forecasts than before the pandemic. The key judgements are the length of time over which the economic effects of the pandemic will occur, and the speed and shape of recovery. The main factors include the effectiveness of pandemic containment measures, the pace of roll-out and effectiveness of vaccines, and the emergence of new variants of the virus, plus a range of geopolitical uncertainties, which together represent a high degree of estimation uncertainty, particularly in assessing Downside scenarios;
•estimating the economic effects of those scenarios on ECL, where there is no observable historical trend that can be reflected in the models that will accurately represent the effects of the economic changes of the severity and speed brought about by the Covid-19 pandemic and the recovery from those conditions. Modelled assumptions and linkages between economic factors and credit losses may underestimate or overestimate ECL in these conditions, and there is significant uncertainty in the estimation of parameters such as collateral values and loss severity; and
•the identification of customers experiencing significant increases in credit risk and credit impairment, particularly where those customers have accepted payment deferrals and other reliefs designed to address short-term liquidity issues given muted default experience to date. The use of segmentation techniques for indicators of significant increases in credit risk involves significant estimation uncertainty.
How economic scenarios are reflected in ECL calculations
Models are used to reflect economic scenarios on ECL estimates. As described above, modelled assumptions and linkages based on historical information could not alone produce relevant information under the conditions experienced in 2021, and management judgemental adjustments were still required to support modelled outcomes.
We have developed globally consistent methodologies for the application of forward economic guidance into the calculation of ECL for wholesale and retail credit risk. These standard approaches are described below, followed by the management judgemental adjustments made, including those to reflect the circumstances experienced in 2021.
For our wholesale portfolios, a global methodology is used for the estimation of the term structure of probability of default (‘PD’) and loss given default (‘LGD’). For PDs, we consider the correlation of forward economic guidance to default rates for a particular industry in a country. For LGD calculations, we consider the correlation of forward economic guidance to collateral values and realisation rates for a particular country and industry. PDs and LGDs are estimated for the entire term structure of each instrument.
For impaired loans, LGD estimates take into account independent recovery valuations provided by external consultants where available or internal forecasts corresponding to anticipated economic conditions and individual company conditions. In estimating the ECL on impaired loans that are individually considered not to be significant, we incorporate forward economic guidance proportionate to the probability-weighted outcome and the Central scenario outcome for non-stage 3 populations.
For our retail portfolios, the impact of economic scenarios on PD is modelled at a portfolio level. Historical relationships between observed default rates and macroeconomic variables are integrated into IFRS 9 ECL estimates by using economic response models. The impact of these scenarios on PD is modelled over a period equal to the remaining maturity of the underlying asset or assets. The impact on LGD is modelled for mortgage portfolios by forecasting future loan-to-value (‘LTV’) profiles for the remaining maturity of the asset by using national level forecasts of the house price index and applying the corresponding LGD expectation.
These models are based largely on historical observations and correlations with default rates. Management judgemental adjustments are described below.
Management judgemental adjustments
In the context of IFRS 9, management judgemental adjustments are short-term increases or decreases to the ECL at either a customer, segment or portfolio level to account for late-breaking events, model and data limitations and deficiencies, and expert credit judgement applied following management review and challenge.
At 31 December 2021, management judgements were applied to reflect credit risk dynamics not captured by our models. The drivers of the management judgemental adjustments reflect the changing economic outlook and evolving risks across our geographies.
Where the macroeconomic and portfolio risk outlook continues to improve, supported by low levels of observed defaults, adjustments initially taken to reflect increased risk expectations have been retired or reduced.
However, other adjustments have increased where modelled outcomes are overly sensitive and not aligned to observed changes in the risk of the underlying portfolios during the pandemic, or where sector-specific risks are not adequately captured.
The effects of management judgemental adjustments are considered for balances and ECL when determining whether or not a significant increase in credit risk has occurred and are attributed or allocated to a stage as appropriate. This is in accordance with the internal adjustments framework.
Management judgemental adjustments are reviewed under the governance process for IFRS 9 (as detailed in the section ‘Credit risk management’ on page 173). Review and challenge focuses on the rationale and quantum of the adjustments with a further review carried out by the second line of defence where significant. For some management judgemental adjustments, internal frameworks establish the conditions under which these adjustments should no longer be required and as such are considered as part of the governance process. This internal governance process allows management judgemental adjustments to be reviewed regularly and, where possible, to reduce the reliance on these through model recalibration or redevelopment, as appropriate.
Management judgemental adjustments made in estimating the scenario-weighted reported ECL at 31 December 2021 are set out in the following table. The table includes adjustments in relation to data and model limitations, including those driven by late-breaking events and sector-specific risks and as a result of the regular process of model development and implementation.
| | | | | | | | | | | |
Management judgemental adjustments to ECL at 31 December 20211 |
| Retail | Wholesale | Total |
| $bn | $bn | $bn |
| | | |
| Low-risk counterparties (banks, sovereigns and government entities) | | (0.1) | | (0.1) | |
| Corporate lending adjustments | | 1.3 | | 1.3 | |
| Retail lending probability of default adjustments | 0 | | — | |
| Retail model default timing adjustments | 0 | | — | |
| Macroeconomic-related adjustments | 0 | | — | |
| Pandemic-related economic recovery adjustments | 0.2 | | | 0.2 | |
| Other retail lending adjustments | 0.3 | | | 0.3 | |
| Total | 0.5 | | 1.2 | | 1.7 | |
.
| | | | | | | | | | | |
Management judgemental adjustments to ECL at 31 December 20201 |
| Retail | Wholesale | Total |
| $bn | $bn | $bn |
| | | |
| Low-risk counterparties (banks, sovereigns and government entities) | | (0.7) | | (0.7) | |
| Corporate lending adjustments | | 0.5 | | 0.5 | |
| Retail lending probability of default adjustments | (0.8) | | | (0.8) | |
| Retail model default timing adjustment | 1.9 | | | 1.9 | |
| Macroeconomic-related adjustments | 0.1 | | | 0.1 | |
| Pandemic-related economic recovery adjustments | | | — | |
| Other retail lending adjustments | 0.3 | | | 0.3 | |
| Total | 1.5 | | (0.2) | | 1.3 | |
1 Management judgemental adjustments presented in the table reflect increases or (decreases) to ECL, respectively.
Management judgemental adjustments at 31 December 2021 were an increase to ECL of $1.2bn for the wholesale portfolio and an increase to ECL of $0.5bn for the retail portfolio.
During 2021, management judgemental adjustments reflected an evolving macroeconomic outlook and the relationship of the modelled ECL to this outlook and to late-breaking and sector-specific risks.
At 31 December 2021, wholesale management judgemental adjustments were an ECL increase of $1.2bn (31 December 2020: $0.2bn decrease).
•Adjustments relating to low credit-risk exposures decreased ECL by $0.1bn at 31 December 2021 (31 December 2020: $0.7bn decrease). These were mainly to highly rated banks, sovereigns and US government-sponsored entities, where modelled credit factors did not fully reflect the underlying fundamentals of these entities or the effect of government support and economic programmes in the Covid-19 environment. The decrease in adjustment impact relative to 31 December 2020 was mostly driven by increased alignment of modelled outcomes to management expectations following changes in systems and data.
•Adjustments to corporate exposures increased ECL by $1.3bn at 31 December 2021 (31 December 2020: $0.5bn increase). These principally reflected the outcome of management judgements for high-risk and vulnerable sectors in some of our key markets, supported by credit experts’ input, portfolio risk metrics, quantitative analyses and benchmarks. Considerations include risk of individual exposures under different
macroeconomic scenarios and comparison of key risk metrics to pre-pandemic levels, resulting in either releases or increases to ECL in each geography. The increase in adjustment impact relative to 31 December 2020 was mostly driven by management judgements as a result of the effect of further improvement of macroeconomic scenarios on modelled outcomes and increased dislocation of modelled outcomes to management expectations for high-risk sectors and due to late-breaking events not fully reflected in the underlying data. The highest increase was observed in the real estate sector, including an adjustment to reflect the uncertainty of the higher risk Chinese commercial real estate offshore exposures, booked in Hong Kong, on account of tightening liquidity and increased refinancing risks resulting in the downgrade of even some previously highly rated borrowers.
At 31 December 2021, retail management judgemental adjustments were an ECL increase of $0.5bn (31 December 2020: $1.5bn increase).
•Pandemic-related economic recovery adjustments increased ECL by $0.2bn (31 December 2020: $0) to adjust for the effects of the volatile pace of recovery from the pandemic. This is where in management’s judgement, supported by quantitative analyses of portfolio and economic metrics, modelled outcomes are overly sensitive given the limited observed deterioration in the underlying portfolio during the pandemic.
•Other retail lending adjustments increased ECL by $0.3bn
(31 December 2020: $0.3bn increase). These were primarily to address areas such as model recalibration and redevelopment, customer relief and data limitations.
Economic scenarios sensitivity analysis of ECL estimates
Management considered the sensitivity of the ECL outcome against the economic forecasts as part of the ECL governance process by recalculating the ECL under each scenario described above for selected portfolios, applying a 100% weighting to each scenario in turn. The weighting is reflected in both the determination of a significant increase in credit risk and the
measurement of the resulting ECL.
The ECL calculated for the Upside and Downside scenarios should not be taken to represent the upper and lower limits of possible ECL outcomes. The impact of defaults that might occur in the future under different economic scenarios is captured by recalculating ECL for loans at the balance sheet date.
There is a particularly high degree of estimation uncertainty in numbers representing more severe risk scenarios when assigned a 100% weighting.
For wholesale credit risk exposures, the sensitivity analysis excludes ECL and financial instruments related to defaulted (stage 3) obligors. It is generally impracticable to separate the effect of macroeconomic factors in individual assessments of obligors in default. The measurement of stage 3 ECL is relatively more sensitive to credit factors specific to the obligor than future economic scenarios, and loans to defaulted obligors are a small portion of the overall wholesale lending exposure, even if representing the majority of the allowance for ECL. Therefore, the sensitivity analysis to macroeconomic scenarios does not capture the residual estimation risk arising from wholesale stage 3 exposures.
For retail credit risk exposures, the sensitivity analysis includes ECL for loans and advances to customers related to defaulted obligors. This is because the retail ECL for secured mortgage portfolios including loans in all stages is sensitive to macroeconomic variables.
Wholesale and retail sensitivity
The wholesale and retail sensitivity analysis is stated inclusive of management judgemental adjustments, as appropriate to each scenario. The results tables exclude portfolios held by the insurance business and small portfolios, and as such cannot be directly compared to personal and wholesale lending presented in other credit risk tables. Additionally, in both the wholesale and retail analysis, the comparative period results for Downside 2 scenarios are also not directly comparable with the current period, because they reflect different risk profiles relative to the consensus scenarios for the period end.
Wholesale analysis
| | | | | | | | | | | | | | | | | | | | |
IFRS 9 ECL sensitivity to future economic conditions1, 2, 3 |
| Gross carrying amount2 | Reported ECL | Consensus Central scenario ECL | Consensus Upside scenario ECL | Consensus Downside scenario ECL | Downside 2 scenario ECL |
| By geography at 31 Dec 2021 | $m | $m | $m | $m | $m | $m |
| | | | | | |
| UK | 483,273 | | 920 | | 727 | | 590 | | 944 | | 1,985 | |
| US | 227,817 | | 227 | | 204 | | 155 | | 317 | | 391 | |
| Hong Kong | 434,608 | | 767 | | 652 | | 476 | | 984 | | 1,869 | |
| Mainland China | 120,627 | | 149 | | 113 | | 36 | | 216 | | 806 | |
| Canada | 85,117 | | 151 | | 98 | | 61 | | 150 | | 1,121 | |
| Mexico | 23,054 | | 118 | | 80 | | 61 | | 123 | | 358 | |
| UAE | 44,767 | | 158 | | 122 | | 73 | | 214 | | 711 | |
| France | 163,845 | | 133 | | 121 | | 106 | | 162 | | 187 | |
| | | | | | | | | | | | | | | | | | | | |
| By geography at 31 Dec 2020 | | | | | | |
| | | | | | |
| UK | 430,555 | | 2,077 | | 1,514 | | 1,026 | | 2,271 | | 3,869 | |
| US | 201,263 | | 369 | | 314 | | 219 | | 472 | | 723 | |
| Hong Kong | 452,983 | | 474 | | 388 | | 211 | | 672 | | 1,363 | |
| Mainland China | 118,163 | | 116 | | 93 | | 28 | | 252 | | 1,158 | |
| Canada | 85,720 | | 183 | | 140 | | 82 | | 253 | | 528 | |
| Mexico | 25,920 | | 246 | | 222 | | 177 | | 285 | | 437 | |
| UAE | 44,777 | | 250 | | 241 | | 190 | | 330 | | 536 | |
| France | 164,899 | | 117 | | 109 | | 97 | | 131 | | 238 | |
1 ECL sensitivity includes off-balance sheet financial instruments that are subject to significant measurement uncertainty.
2 Includes low credit-risk financial instruments such as debt instruments at FVOCI, which have high carrying amounts but low ECL under all the above scenarios.
3 Excludes defaulted obligors. For a detailed breakdown of performing and non-performing wholesale portfolio exposures, see page 198.
At 31 December 2021, the most significant level of ECL sensitivity was observed in Hong Kong, the UK and Canada. Real estate was the sector with higher sensitivity to a severe scenario, namely in Hong Kong and Canada. In the case of Hong Kong, the higher ECL sensitivity was mainly driven by increased uncertainty due to tightening liquidity and increased refinancing risks resulting in the
downgrade of even some previously highly rated borrowers. In the case of Canada, the higher ECL sensitivity was mainly driven by the adoption of a new Downside 2 scenario, which resulted in increased modelled ECL for this scenario relative to 31 December 2020.
Retail analysis
| | | | | | | | | | | | | | | | | | | | |
IFRS 9 ECL sensitivity to future economic conditions1 |
| Gross carrying amount | Reported ECL | Consensus Central scenario ECL | Consensus Upside scenario ECL | Consensus Downside scenario ECL | Downside 2 scenario ECL |
| ECL of loans and advances to customers at 31 December 2021 | $m | $m | $m | $m | $m | $m |
| UK | | | | | | |
| Mortgages | 155,084 | | 191 | | 182 | | 175 | | 197 | | 231 | |
| Credit cards | 8,084 | | 439 | | 381 | | 330 | | 456 | | 987 | |
| Other | 7,902 | | 369 | | 298 | | 254 | | 388 | | 830 | |
| Mexico | | | | | | |
| Mortgages | 4,972 | | 123 | | 116 | | 106 | | 130 | | 164 | |
| Credit cards | 1,167 | | 141 | | 134 | | 122 | | 150 | | 176 | |
| Other | 2,935 | | 366 | | 360 | | 350 | | 374 | | 401 | |
| Hong Kong | | | | | | |
| Mortgages | 96,697 | | — | | — | | — | | — | | — | |
| Credit cards | 7,644 | | 218 | | 206 | | 154 | | 231 | | 359 | |
| Other | 5,628 | | 109 | | 101 | | 88 | | 128 | | 180 | |
| UAE | | | | | | |
| Mortgages | 1,982 | | 45 | | 44 | | 42 | | 46 | | 57 | |
| Credit cards | 429 | | 43 | | 41 | | 29 | | 54 | | 82 | |
| Other | 615 | | 19 | | 18 | | 13 | | 21 | | 25 | |
| France | | | | | | |
| Mortgages | 23,159 | | 63 | | 62 | | 62 | | 63 | | 64 | |
| Other | 1,602 | | 61 | | 61 | | 60 | | 61 | | 63 | |
| US | | | | | | |
| Mortgages | 15,379 | | 28 | | 27 | | 26 | | 29 | | 41 | |
| Credit cards | 446 | | 80 | | 76 | | 70 | | 83 | | 118 | |
| Canada | | | | | | |
| Mortgages | 26,097 | | 28 | | 27 | | 26 | | 29 | | 48 | |
| Credit cards | 279 | | 9 | | 9 | | 9 | | 10 | | 13 | |
| Other | 1,598 | | 19 | | 18 | | 17 | | 19 | | 27 | |
| | | | | | | | | | | | | | | | | | | | |
IFRS 9 ECL sensitivity to future economic conditions1 |
| Gross carrying amount | Reported ECL | Central scenario ECL | Upside scenario ECL | Downside scenario ECL | Additional Downside scenario |
| ECL of loans and advances to customers at 31 December 2020 | $m | $m | $m | $m | $m | $m |
| UK | | | | | | |
| Mortgages | 146,478 | | 197 | | 182 | | 172 | | 205 | | 221 | |
| Credit cards | 7,869 | | 857 | | 774 | | 589 | | 904 | | 1,084 | |
| Other | 9,164 | | 897 | | 795 | | 471 | | 1,022 | | 1,165 | |
| Mexico | | | | | | |
| Mortgages | 3,896 | | 111 | | 101 | | 79 | | 136 | | 167 | |
| Credit cards | 1,113 | | 260 | | 255 | | 243 | | 269 | | 290 | |
| Other | 2,549 | | 436 | | 428 | | 411 | | 451 | | 491 | |
| Hong Kong | | | | | | |
| Mortgages | 89,943 | | — | | — | | — | | — | | — | |
| Credit cards | 7,422 | | 266 | | 259 | | 247 | | 277 | | 405 | |
| Other | 6,020 | | 112 | | 105 | | 102 | | 115 | | 130 | |
| UAE | | | | | | |
| Mortgages | 1,889 | | 66 | | 63 | | 53 | | 73 | | 78 | |
| Credit cards | 426 | | 92 | | 81 | | 62 | | 107 | | 126 | |
| Other | 683 | | 38 | | 37 | | 33 | | 41 | | 46 | |
| France | | | | | | |
| Mortgages | 24,565 | | 68 | | 68 | | 68 | | 69 | | 70 | |
| Other | 1,725 | | 88 | | 87 | | 85 | | 88 | | 91 | |
| US | | | | | | |
| Mortgages | 15,399 | | 41 | | 39 | | 38 | | 41 | | 53 | |
| Credit cards | 570 | | 86 | | 84 | | 81 | | 88 | | 119 | |
| Canada | | | | | | |
| Mortgages | 22,454 | | 31 | | 30 | | 29 | | 31 | | 36 | |
| Credit cards | 260 | | 9 | | 9 | | 8 | | 9 | | 9 | |
| Other | 1,775 | | 22 | | 21 | | 20 | | 24 | | 28 | |
1 ECL sensitivities exclude portfolios utilising less complex modelling approaches.
At 31 December 2021, the most significant level of ECL sensitivity was observed in the UK, Mexico and Hong Kong. Mortgages reflected the lowest level of ECL sensitivity across most markets as collateral values remained resilient. Hong Kong mortgages had low levels of reported ECL due to the credit quality of the portfolio, and so presented sensitivity was negligible. Credit cards and other unsecured lending are more sensitive to economic forecasts, which improved during 2021.
Group ECL sensitivity results
The ECL impact of the scenarios and management judgemental adjustments are highly sensitive to movements in economic forecasts. Based upon the sensitivity tables presented above, if the Group ECL balance was estimated solely on the basis of the Central scenario, Downside scenario or the Downside 2 scenario at 31 December 2021, it would increase/(decrease) as presented in the below table.
| | | | | | | | |
| Retail1 | Wholesale1 |
| Total Group ECL at 31 December 2021 | $bn | $bn |
| Reported ECL | 3.0 | | 3.1 | |
| Scenarios | | |
| 100% Consensus Central scenario | (0.2) | | (0.6) | |
| 100% Consensus Upside scenario | (0.5) | | (1.2) | |
| 100% Consensus Downside scenario | 0.2 | | 0.6 | |
| 100% Downside 2 scenario | 2.0 | | 5.5 | |
| | | | | | | | |
| Retail1 | Wholesale |
| Total Group ECL at 31 December 2020 | $bn | $bn |
| Reported ECL | 4.5 | | 4.5 | |
| Scenarios | | |
| 100% Consensus Central scenario | (0.3) | | (0.9) | |
| 100% Consensus Upside scenario | (1.0) | | (2.0) | |
| 100% Consensus Downside scenario | 0.3 | | 1.0 | |
| 100% Downside 2 scenario | 1.3 | | 5.9 | |
1 On the same basis as retail and wholesale sensitivity analysis.
For both retail and wholesale portfolios, the reported ECL decreased since 31 December 2020. The relative sensitivity of the Group total consensus Central scenario remained relatively stable, while the Group total consensus Upside and consensus Downside sensitivities both reduced since 31 December 2020. The Group total Downside 2 scenario continues to present the highest level of sensitivity. The Group results are reflective of the improvement in economic expectations, inclusive of the continuing pandemic-related and sector-specific uncertainty.
Reconciliation of changes in gross carrying/nominal amount and allowances for loans and advances to banks and customers including loan commitments and financial guarantees
The following disclosure provides a reconciliation by stage of the Group’s gross carrying/nominal amount and allowances for loans and advances to banks and customers, including loan commitments and financial guarantees. Movements are calculated on a quarterly basis and therefore fully capture stage movements between quarters. If movements were calculated on a year-to-date basis they would only reflect the opening and closing position of the financial instrument.
The transfers of financial instruments represents the impact of stage transfers upon the gross carrying/nominal amount and associated allowance for ECL.
The net remeasurement of ECL arising from stage transfers represents the increase or decrease due to these transfers, for example, moving from a 12-month (stage 1) to a lifetime (stage 2) ECL measurement basis. Net remeasurement excludes the underlying customer risk rating (‘CRR’)/probability of default (‘PD’) movements of the financial instruments transferring stage. This is captured, along with other credit quality movements in the ‘changes in risk parameters – credit quality’ line item.
Changes in ‘New financial assets originated or purchased’, ‘assets derecognised (including final repayments)’ and ‘changes to risk parameters – further lending/repayment’ represent the impact from volume movements within the Group’s lending portfolio.
| | | | | | | | | | | | | | | | | | | | | | | | | | | | | | | | | | | | | |
Reconciliation of changes in gross carrying/nominal amount and allowances for loans and advances to banks and customers including loan commitments and financial guarantees | | | | | |
| (Audited) |
| Non-credit impaired | Credit impaired | | | | | | |
| Stage 1 | Stage 2 | Stage 3 | POCI | Total | | | | | |
| Gross carrying/ nominal amount | Allowance for ECL | Gross carrying/ nominal amount | Allowance for ECL | Gross carrying/ nominal amount | Allowance for ECL | Gross carrying/ nominal amount | Allowance for ECL | Gross carrying/ nominal amount | Allowance for ECL | | | | | |
| $m | $m | $m | $m | $m | $m | $m | $m | $m | $m | | | | | |
| At 1 Jan 2021 | 1,506,451 | | (2,331) | | 223,432 | | (5,403) | | 20,424 | | (7,544) | | 279 | | (113) | | 1,750,586 | | (15,391) | | | | | | |
| Transfers of financial instruments: | 21,107 | | (1,792) | | (27,863) | | 2,601 | | 6,756 | | (809) | | — | | — | | — | | — | | | | | | |
| – transfers from stage 1 to stage 2 | (159,633) | | 527 | | 159,633 | | (527) | | — | | — | | — | | — | | — | | — | | | | | | |
| – transfers from stage 2 to stage 1 | 182,432 | | (2,279) | | (182,432) | | 2,279 | | — | | — | | — | | — | | — | | — | | | | | | |
| – transfers to stage 3 | (2,345) | | 24 | | (6,478) | | 1,010 | | 8,823 | | (1,034) | | — | | — | | — | | — | | | | | | |
| – transfers from stage 3 | 653 | | (64) | | 1,414 | | (161) | | (2,067) | | 225 | | — | | — | | — | | — | | | | | | |
| Net remeasurement of ECL arising from transfer of stage | — | | 1,225 | | — | | (596) | | — | | (34) | | — | | — | | — | | 595 | | | | | | |
| | | | | | | | | | | | | | | |
| New financial assets originated or purchased | 444,070 | | (553) | | — | | — | | — | | — | | 124 | | — | | 444,194 | | (553) | | | | | | |
| Assets derecognised (including final repayments) | (304,158) | | 174 | | (31,393) | | 489 | | (2,750) | | 458 | | (10) | | 6 | | (338,311) | | 1,127 | | | | | | |
| Changes to risk parameters – further lending/repayment | (61,742) | | 547 | | (3,634) | | 498 | | (1,268) | | 576 | | (108) | | 12 | | (66,752) | | 1,633 | | | | | | |
| | | | | | | | | | | | | | | |
| Changes to risk parameters – credit quality | — | | 1,111 | | — | | (1,012) | | — | | (2,354) | | — | | 28 | | — | | (2,227) | | | | | | |
| Changes to models used for ECL calculation | — | | (17) | | — | | (33) | | — | | 1 | | — | | — | | — | | (49) | | | | | | |
| Assets written off | — | | — | | — | | — | | (2,610) | | 2,605 | | (7) | | 7 | | (2,617) | | 2,612 | | | | | | |
| Credit-related modifications that resulted in derecognition | — | | — | | — | | — | | (125) | | — | | — | | — | | (125) | | — | | | | | | |
| | | | | | | | | | | | | | | |
| Foreign exchange | (25,231) | | 26 | | (2,918) | | 45 | | (479) | | 157 | | (4) | | 1 | | (28,632) | | 229 | | | | | | |
Others1 | (2,915) | | 53 | | (1,882) | | 85 | | (151) | | 16 | | — | | (5) | | (4,948) | | 149 | | | | | | |
| At 31 Dec 2021 | 1,577,582 | | (1,557) | | 155,742 | | (3,326) | | 19,797 | | (6,928) | | 274 | | (64) | | 1,753,395 | | (11,875) | | | | | | |
| ECL income statement change for the period | | 2,487 | | | (654) | | | (1,353) | | | 46 | | | 526 | | | | | | |
| Recoveries | | | | | | | | | | 409 | | | | | | |
| Others | | | | | | | | | | (111) | | | | | | |
| Total ECL income statement change for the period | | | | | | | | | | 824 | | | | | | |
1 Total includes $3.0bn of gross carrying loans and advances to customers, which were classified to assets held for sale and a corresponding allowance for ECL of $123m, reflecting our exit of the domestic mass market retail banking in the US.
| | | | | | | | | | | | |
| At 31 Dec 2021 | | 12 months ended
31 Dec 2021 |
| Gross carrying/nominal amount | Allowance for ECL | | ECL charge |
| | $m | $m | | $m |
| As above | 1,753,395 | | (11,875) | | | 824 | |
| Other financial assets measured at amortised cost | 880,351 | | (193) | | | (19) | |
| Non-trading reverse purchase agreement commitments | 42,421 | | — | | | — | |
| Performance and other guarantees not considered for IFRS 9 | — | | — | | | 75 | |
| Summary of financial instruments to which the impairment requirements in IFRS 9 are applied/Summary consolidated income statement | 2,676,167 | | (12,068) | | | 880 | |
| Debt instruments measured at FVOCI | 347,203 | | (96) | | | 48 | |
| Total allowance for ECL/total income statement ECL change for the period | n/a | (12,164) | | | 928 | |
As shown in the previous table, the allowance for ECL for loans and advances to customers and banks and relevant loan commitments and financial guarantees decreased $3,516m during the period from $15,391m at 31 December 2020 to $11,875m at 31 December 2021.
This decrease was primarily driven by:
•$2,612m of assets written off;
•$2,207m relating to volume movements, which included the ECL allowance associated with new originations, assets derecognised and further lending/repayment;
•$595m relating to the net remeasurement impact of stage transfers; and
•foreign exchange and other movements of $378m.
These were partly offset by:
•$2,227m relating to underlying credit quality changes, including the credit quality impact of financial instruments transferring between stages; and
•$49m of changes to models used for ECL calculation.
The ECL release for the period of $526m presented in the previous table consisted of $2,207m relating to underlying net book volume movement and $595m relating to the net remeasurement impact of stage transfers. This was partly offset by $2,227m relating to underlying credit quality changes, including the credit quality impact of financial instruments transferring between stages and $49m in changes to models used for ECL calculation.
Summary views of the movement in wholesale and personal lending are presented on pages 201 and 215.
| | | | | | | | | | | | | | | | | | | | | | | | | | | | | | | | | | | | | |
Reconciliation of changes in gross carrying/nominal amount and allowances for loans and advances to banks and customers including loan commitments and financial guarantees | | | | | |
| (Audited) |
| Non-credit impaired | Credit impaired | Total | | | | | |
| Stage 1 | Stage 2 | Stage 3 | POCI | | | | | |
| Gross exposure | Allowance/ provision for ECL | Gross exposure | Allowance/ provision for ECL | Gross exposure | Allowance/ provision for ECL | Gross exposure | Allowance/ provision for ECL | Gross exposure | Allowance/ provision for ECL | | | | | |
| $m | $m | $m | $m | $m | $m | $m | $m | $m | $m | | | | | |
| At 1 Jan 2020 | 1,561,613 | | (1,464) | | 105,551 | | (2,441) | | 14,335 | | (5,121) | | 345 | | (99) | | 1,681,844 | | (9,125) | | | | | | |
| Transfers of financial instruments: | (129,236) | | (1,122) | | 116,783 | | 1,951 | | 12,453 | | (829) | | — | | — | | — | | — | | | | | | |
| – transfers from stage 1 to stage 2 | (298,725) | | 947 | | 298,725 | | (947) | | — | | — | | — | | — | | — | | — | | | | | | |
| – transfers from stage 2 to stage 1 | 172,894 | | (2,073) | | (172,894) | | 2,073 | | — | | — | | — | | — | | — | | — | | | | | | |
| – transfers to stage 3 | (3,942) | | 30 | | (10,320) | | 986 | | 14,262 | | (1,016) | | — | | — | | — | | — | | | | | | |
| – transfers from stage 3 | 537 | | (26) | | 1,272 | | (161) | | (1,809) | | 187 | | — | | — | | — | | — | | | | | | |
| Net remeasurement of ECL arising from transfer of stage | — | | 907 | | — | | (1,158) | | — | | (750) | | — | | — | | — | | (1,001) | | | | | | |
| New financial assets originated or purchased | 437,836 | | (653) | | — | | — | | — | | — | | 25 | | (1) | | 437,861 | | (654) | | | | | | |
| Assets derecognised (including final repayments) | (313,347) | | 160 | | (37,409) | | 464 | | (3,430) | | 485 | | (23) | | 2 | | (354,209) | | 1,111 | | | | | | |
| Changes to risk parameters – further lending/repayment | (83,147) | | 157 | | 29,092 | | 85 | | (597) | | 248 | | (50) | | (2) | | (54,702) | | 488 | | | | | | |
| Changes to risk parameters – credit quality | — | | (408) | | — | | (4,374) | | — | | (4,378) | | — | | (39) | | — | | (9,199) | | | | | | |
| Changes to models used for ECL calculation | — | | 134 | | — | | 294 | | — | | 5 | | — | | — | | — | | 433 | | | | | | |
| Assets written off | — | | — | | — | | — | | (2,946) | | 2,944 | | (30) | | 30 | | (2,976) | | 2,974 | | | | | | |
| Credit-related modifications that resulted in derecognition | — | | — | | — | | — | | (23) | | 7 | | — | | — | | (23) | | 7 | | | | | | |
| Foreign exchange | 32,808 | | (47) | | 9,123 | | (223) | | 633 | | (163) | | 4 | | (3) | | 42,568 | | (436) | | | | | | |
| Others | (76) | | 5 | | 292 | | (1) | | (1) | | 8 | | 8 | | (1) | | 223 | | 11 | | | | | | |
| At 31 Dec 2020 | 1,506,451 | | (2,331) | | 223,432 | | (5,403) | | 20,424 | | (7,544) | | 279 | | (113) | | 1,750,586 | | (15,391) | | | | | | |
| ECL income statement change for the period | | 297 | | | (4,689) | | | (4,390) | | | (40) | | | (8,822) | | | | | | |
| Recoveries | | | | | | | | | | 326 | | | | | | |
| Others | | | | | | | | | | (84) | | | | | | |
| Total ECL income statement change for the period | | | | | | | | | | (8,580) | | | | | | |
| | | | | | | | | | | |
| At 31 Dec 2020 | 12 months ended 31 Dec 2020 |
| Gross carrying/nominal amount | Allowance for ECL | ECL charge |
| | $m | $m | $m |
| As above | 1,750,586 | | (15,391) | | (8,580) | |
| Other financial assets measured at amortised cost | 772,408 | | (175) | | (95) | |
| Non-trading reverse purchase agreement commitments | 61,716 | | — | | — | |
| Performance and other guarantees not considered for IFRS 9 | — | | — | | (94) | |
| Summary of financial instruments to which the impairment requirements in IFRS 9 are applied/ Summary consolidated income statement | 2,584,710 | | (15,566) | | (8,769) | |
| Debt instruments measured at FVOCI | 399,717 | | (141) | | (48) | |
| Total allowance for ECL/total income statement ECL change for the period | n/a | (15,707) | | (8,817) | |
Credit quality
Credit quality of financial instruments
(Audited)
We assess the credit quality of all financial instruments that are subject to credit risk. The credit quality of financial instruments is a point-in-time assessment of PD, whereas stages 1 and 2 are determined based on relative deterioration of credit quality since initial recognition. Accordingly, for non-credit-impaired financial
instruments, there is no direct relationship between the credit quality assessment and stages 1 and 2, although typically the lower credit quality bands exhibit a higher proportion in stage 2.
The five credit quality classifications each encompass a range of granular internal credit rating grades assigned to wholesale and personal lending businesses and the external ratings attributed by external agencies to debt securities, as shown in the table on page 174.
| | | | | | | | | | | | | | | | | | | | | | | | | | | | | | | | | |
| Distribution of financial instruments by credit quality at 31 December 2021 | | | | | | | |
| (Audited) |
| Gross carrying/notional amount | Allowance for ECL/other credit provisions | Net | | | | | | | |
| Strong | Good | Satisfactory | Sub-standard | Credit impaired | Total | | | | | | | |
| $m | $m | $m | $m | $m | $m | $m | $m | | | | | | | |
| In-scope for IFRS 9 | | | | | | | | | | | | | | | |
| Loans and advances to customers held at amortised cost | 544,695 | | 230,326 | | 233,739 | | 29,404 | | 19,067 | | 1,057,231 | | (11,417) | | 1,045,814 | | | | | | | | |
| – personal | 388,903 | | 52,080 | | 30,492 | | 1,920 | | 4,942 | | 478,337 | | (3,103) | | 475,234 | | | | | | | | |
| – corporate and commercial | 124,819 | | 158,938 | | 188,858 | | 27,194 | | 13,730 | | 513,539 | | (8,204) | | 505,335 | | | | | | | | |
| – non-bank financial institutions | 30,973 | | 19,308 | | 14,389 | | 290 | | 395 | | 65,355 | | (110) | | 65,245 | | | | | | | | |
| Loans and advances to banks held at amortised cost | 72,978 | | 4,037 | | 5,020 | | 1,118 | | — | | 83,153 | | (17) | | 83,136 | | | | | | | | |
| Cash and balances at central banks | 400,176 | | 1,675 | | 1,171 | | — | | — | | 403,022 | | (4) | | 403,018 | | | | | | | | |
| Items in the course of collection from other banks | 4,122 | | 10 | | 4 | | — | | ��� | | 4,136 | | — | | 4,136 | | | | | | | | |
| Hong Kong Government certificates of indebtedness | 42,578 | | — | | — | | — | | — | | 42,578 | | — | | 42,578 | | | | | | | | |
| Reverse repurchase agreements – non-trading | 175,576 | | 46,412 | | 18,881 | | 779 | | — | | 241,648 | | — | | 241,648 | | | | | | | | |
| Financial investments | 84,477 | | 11,442 | | 1,401 | | 1 | | 43 | | 97,364 | | (62) | | 97,302 | | | | | | | | |
| Prepayments, accrued income and other assets | 67,097 | | 12,109 | | 11,685 | | 408 | | 304 | | 91,603 | | (127) | | 91,476 | | | | | | | | |
| – endorsements and acceptances | 1,742 | | 5,240 | | 4,038 | | 199 | | 26 | | 11,245 | | (17) | | 11,228 | | | | | | | | |
| – accrued income and other | 65,355 | | 6,869 | | 7,647 | | 209 | | 278 | | 80,358 | | (110) | | 80,248 | | | | | | | | |
Debt instruments measured at
fair value through other comprehensive income1 | 320,161 | | 12,298 | | 11,677 | | 1,087 | | 46 | | 345,269 | | (96) | | 345,173 | | | | | | | | |
| Out-of-scope for IFRS 9 | | | | | | | | | | | | | | | |
| Trading assets | 101,879 | | 16,254 | | 20,283 | | 678 | | 134 | | 139,228 | | — | | 139,228 | | | | | | | | |
| Other financial assets designated and otherwise mandatorily measured at fair value through profit or loss | 6,438 | | 723 | | 4,455 | | 150 | | — | | 11,766 | | — | | 11,766 | | | | | | | | |
| Derivatives | 146,748 | | 42,717 | | 6,691 | | 719 | | 7 | | 196,882 | | — | | 196,882 | | | | | | | | |
| | | | | | | | | | | | | | | |
| Total gross carrying amount on balance sheet | 1,966,925 | | 378,003 | | 315,007 | | 34,344 | | 19,601 | | 2,713,880 | | (11,723) | | 2,702,157 | | | | | | | | |
| Percentage of total credit quality | 72.5% | 13.9% | 11.6% | 1.3% | 0.7% | 100% | | | | | | | | | |
| Loan and other credit-related commitments | 389,865 | | 136,297 | | 92,558 | | 8,142 | | 775 | | 627,637 | | (379) | | 627,258 | | | | | | | | |
| | | | | | | | | | | | | | | |
| | | | | | | | | | | | | | | |
| Financial guarantees | 16,511 | | 4,902 | | 5,166 | | 991 | | 225 | | 27,795 | | (62) | | 27,733 | | | | | | | | |
| In-scope: Irrevocable loan commitments and financial guarantees | 406,376 | | 141,199 | | 97,724 | | 9,133 | | 1,000 | | 655,432 | | (441) | | 654,991 | | | | | | | | |
| Loan and other credit-related commitments | 62,701 | | 65,031 | | 56,446 | | 3,327 | | 332 | | 187,837 | | — | | 187,837 | | | | | | | | |
| Performance and other guarantees | 31,510 | | 32,193 | | 19,265 | | 2,027 | | 539 | | 85,534 | | (179) | | 85,355 | | | | | | | | |
| Out-of-scope: Revocable loan commitments and non-financial guarantees | 94,211 | | 97,224 | | 75,711 | | 5,354 | | 871 | | 273,371 | | (179) | | 273,192 | | | | | | | | |
1 For the purposes of this disclosure, gross carrying value is defined as the amortised cost of a financial asset before adjusting for any loss allowance. As such, the gross carrying value of debt instruments at FVOCI as presented above will not reconcile to the balance sheet as it excludes fair value gains and losses.
| | | | | | | | | | | | | | | | | | | | | | | | | | |
| Distribution of financial instruments by credit quality at 31 December 2020 (continued) |
| (Audited) |
| Gross carrying/notional amount | Allowance for ECL/other credit provisions | Net |
| Strong | Good | Satisfactory | Sub- standard | Credit impaired | Total |
| $m | $m | $m | $m | $m | $m | $m | $m |
| In-scope for IFRS 9 | | | | | | | | |
| Loans and advances to customers held at amortised cost | 506,231 | | 233,320 | | 256,584 | | 36,970 | | 19,372 | | 1,052,477 | | (14,490) | | 1,037,987 | |
| – personal | 357,821 | | 53,892 | | 38,520 | | 4,965 | | 5,611 | | 460,809 | | (4,731) | | 456,078 | |
| – corporate and commercial | 120,971 | | 158,601 | | 203,560 | | 30,718 | | 13,238 | | 527,088 | | (9,494) | | 517,594 | |
| – non-bank financial institutions | 27,439 | | 20,827 | | 14,504 | | 1,287 | | 523 | | 64,580 | | (265) | | 64,315 | |
| Loans and advances to banks held at amortised cost | 71,318 | | 5,496 | | 3,568 | | 1,276 | | — | | 81,658 | | (42) | | 81,616 | |
| Cash and balances at central banks | 302,028 | | 1,388 | | 1,070 | | — | | — | | 304,486 | | (5) | | 304,481 | |
| Items in the course of collection from other banks | 4,079 | | 9 | | 6 | | — | | — | | 4,094 | | — | | 4,094 | |
| Hong Kong Government certificates of indebtedness | 40,420 | | — | | — | | — | | — | | 40,420 | | — | | 40,420 | |
| Reverse repurchase agreements – non-trading | 177,457 | | 40,461 | | 12,398 | | 312 | | — | | 230,628 | | — | | 230,628 | |
| Financial investments | 77,361 | | 9,781 | | 1,537 | | 1 | | 39 | | 88,719 | | (80) | | 88,639 | |
| Prepayments, accrued income and other assets | 81,886 | | 10,129 | | 11,570 | | 298 | | 178 | | 104,061 | | (90) | | 103,971 | |
| – endorsements and acceptances | 1,458 | | 4,355 | | 4,245 | | 229 | | 20 | | 10,307 | | (30) | | 10,277 | |
| – accrued income and other | 80,428 | | 5,774 | | 7,325 | | 69 | | 158 | | 93,754 | | (60) | | 93,694 | |
Debt instruments measured at fair value through other comprehensive income1 | 367,685 | | 12,678 | | 10,409 | | 825 | | 306 | | 391,903 | | (141) | | 391,762 | |
| Out-of-scope for IFRS 9 | | | | | | | | |
| Trading assets | 117,972 | | 14,694 | | 20,809 | | 829 | | 43 | | 154,347 | | — | | 154,347 | |
| Other financial assets designated and otherwise mandatorily measured at fair value through profit or loss | 6,440 | | 2,378 | | 1,827 | | 109 | | — | | 10,754 | | — | | 10,754 | |
| Derivatives | 243,005 | | 54,581 | | 8,709 | | 1,359 | | 72 | | 307,726 | | — | | 307,726 | |
| | | | | | | | |
| Total gross carrying amount on balance sheet | 1,995,882 | | 384,915 | | 328,487 | | 41,979 | | 20,010 | | 2,771,273 | | (14,848) | | 2,756,425 | |
| Percentage of total credit quality | 72.0% | 13.9% | 11.9% | 1.5% | 0.7% | 100% | | |
| Loan and other credit-related commitments | 400,911 | | 157,339 | | 90,784 | | 9,668 | | 1,081 | | 659,783 | | (734) | | 659,049 | |
| | | | | | | | |
| | | | | | | | |
| Financial guarantees | 6,356 | | 5,194 | | 5,317 | | 1,247 | | 270 | | 18,384 | | (125) | | 18,259 | |
| In-scope: Irrevocable loan commitments and financial guarantees | 407,267 | | 162,533 | | 96,101 | | 10,915 | | 1,351 | | 678,167 | | (859) | | 677,308 | |
| Loan and other credit-related commitments | 59,392 | | 62,664 | | 59,666 | | 2,837 | | 430 | | 184,989 | | — | | 184,989 | |
| Performance and other guarantees | 26,082 | | 27,909 | | 21,256 | | 2,112 | | 755 | | 78,114 | | (226) | | 77,888 | |
| Out-of-scope: Revocable loan commitments and non-financial guarantees | 85,474 | | 90,573 | | 80,922 | | 4,949 | | 1,185 | | 263,103 | | (226) | | 262,877 | |
1 For the purposes of this disclosure, gross carrying value is defined as the amortised cost of a financial asset before adjusting for any loss allowance. As such, the gross carrying value of debt instruments at FVOCI as presented above will not reconcile to the balance sheet as it excludes fair value gains and losses.
| | | | | | | | | | | | | | | | | | | | | | | | | | |
| Distribution of financial instruments to which the impairment requirements in IFRS 9 are applied, by credit quality and stage allocation |
| (Audited) |
| Gross carrying/notional amount | Allowance for ECL | Net |
| Strong | Good | Satisfactory | Sub-
standard | Credit impaired | Total |
| $m | $m | $m | $m | $m | $m | $m | $m |
| Loans and advances to customers at amortised cost | 544,695 | | 230,326 | | 233,739 | | 29,404 | | 19,067 | | 1,057,231 | | (11,417) | | 1,045,814 | |
| – stage 1 | 537,642 | | 206,645 | | 169,809 | | 4,840 | | — | | 918,936 | | (1,367) | | 917,569 | |
| – stage 2 | 7,053 | | 23,681 | | 63,930 | | 24,560 | | — | | 119,224 | | (3,119) | | 116,105 | |
| – stage 3 | — | | — | | — | | — | | 18,797 | | 18,797 | | (6,867) | | 11,930 | |
| – POCI | — | | — | | — | | 4 | | 270 | | 274 | | (64) | | 210 | |
| Loans and advances to banks at amortised cost | 72,978 | | 4,037 | | 5,020 | | 1,118 | | — | | 83,153 | | (17) | | 83,136 | |
| – stage 1 | 72,903 | | 3,935 | | 4,788 | | 10 | | — | | 81,636 | | (14) | | 81,622 | |
| – stage 2 | 75 | | 102 | | 232 | | 1,108 | | — | | 1,517 | | (3) | | 1,514 | |
| – stage 3 | — | | — | | — | | — | | — | | — | | — | | — | |
| – POCI | — | | — | | — | | — | | — | | — | | — | | — | |
| Other financial assets measured at amortised cost | 774,026 | | 71,648 | | 33,142 | | 1,188 | | 347 | | 880,351 | | (193) | | 880,158 | |
| – stage 1 | 773,427 | | 70,508 | | 30,997 | | 84 | | — | | 875,016 | | (91) | | 874,925 | |
| – stage 2 | 599 | | 1,140 | | 2,145 | | 1,104 | | — | | 4,988 | | (54) | | 4,934 | |
| – stage 3 | — | | — | | — | | — | | 304 | | 304 | | (42) | | 262 | |
| – POCI | — | | — | | — | | — | | 43 | | 43 | | (6) | | 37 | |
| Loan and other credit-related commitments | 389,865 | | 136,297 | | 92,558 | | 8,142 | | 775 | | 627,637 | | (379) | | 627,258 | |
| – stage 1 | 387,434 | | 129,455 | | 76,043 | | 1,541 | | — | | 594,473 | | (165) | | 594,308 | |
| – stage 2 | 2,431 | | 6,842 | | 16,515 | | 6,601 | | — | | 32,389 | | (174) | | 32,215 | |
| – stage 3 | — | | — | | — | | — | | 775 | | 775 | | (40) | | 735 | |
| – POCI | — | | — | | — | | — | | — | | — | | — | | — | |
| Financial guarantees | 16,511 | | 4,902 | | 5,166 | | 991 | | 225 | | 27,795 | | (62) | | 27,733 | |
| – stage 1 | 16,351 | | 4,469 | | 3,929 | | 183 | | — | | 24,932 | | (11) | | 24,921 | |
| – stage 2 | 160 | | 433 | | 1,237 | | 808 | | — | | 2,638 | | (30) | | 2,608 | |
| – stage 3 | — | | — | | — | | — | | 225 | | 225 | | (21) | | 204 | |
| – POCI | — | | — | | — | | — | | — | | — | | — | | — | |
| At 31 Dec 2021 | 1,798,075 | | 447,210 | | 369,625 | | 40,843 | | 20,414 | | 2,676,167 | | (12,068) | | 2,664,099 | |
Debt instruments at FVOCI1 | | | | | | | | |
| – stage 1 | 319,557 | | 12,196 | | 11,354 | | — | | — | | 343,107 | | (67) | | 343,040 | |
| – stage 2 | 604 | | 102 | | 323 | | 1,087 | | — | | 2,116 | | (22) | | 2,094 | |
| – stage 3 | — | | — | | — | | — | | — | | — | | — | | — | |
| – POCI | — | | — | | — | | — | | 46 | | 46 | | (7) | | 39 | |
| At 31 Dec 2021 | 320,161 | | 12,298 | | 11,677 | | 1,087 | | 46 | | 345,269 | | (96) | | 345,173 | |
1 For the purposes of this disclosure, gross carrying value is defined as the amortised cost of a financial asset before adjusting for any loss allowance. As such, the gross carrying value of debt instruments at FVOCI as presented above will not reconcile to the balance sheet as it excludes fair value gains and losses.
| | | | | | | | | | | | | | | | | | | | | | | | | | |
Distribution of financial instruments to which the impairment requirements in IFRS 9 are applied, by credit quality and stage allocation (continued) |
| (Audited) |
| Gross carrying/notional amount | | |
| Strong | Good | Satisfactory | Sub-standard | Credit impaired | Total | Allowance for ECL | Net |
| $m | $m | $m | $m | $m | $m | $m | $m |
| Loans and advances to customers at amortised cost | 506,231 | | 233,320 | | 256,584 | | 36,970 | | 19,372 | | 1,052,477 | | (14,490) | | 1,037,987 | |
| – stage 1 | 499,836 | | 199,138 | | 165,507 | | 5,439 | | — | | 869,920 | | (1,974) | | 867,946 | |
| – stage 2 | 6,395 | | 34,182 | | 91,077 | | 31,531 | | — | | 163,185 | | (4,965) | | 158,220 | |
| – stage 3 | — | | — | | — | | — | | 19,095 | | 19,095 | | (7,439) | | 11,656 | |
| – POCI | — | | — | | — | | — | | 277 | | 277 | | (112) | | 165 | |
| Loans and advances to banks at amortised cost | 71,318 | | 5,496 | | 3,568 | | 1,276 | | — | | 81,658 | | (42) | | 81,616 | |
| – stage 1 | 71,126 | | 5,098 | | 3,357 | | 73 | | — | | 79,654 | | (33) | | 79,621 | |
| – stage 2 | 192 | | 398 | | 211 | | 1,203 | | — | | 2,004 | | (9) | | 1,995 | |
| – stage 3 | — | | — | | — | | — | | — | | — | | — | | — | |
| – POCI | — | | — | | — | | — | | — | | — | | — | | — | |
| Other financial assets measured at amortised cost | 683,231 | | 61,768 | | 26,581 | | 611 | | 217 | | 772,408 | | (175) | | 772,233 | |
| – stage 1 | 682,412 | | 61,218 | | 24,532 | | 54 | | — | | 768,216 | | (80) | | 768,136 | |
| – stage 2 | 819 | | 550 | | 2,049 | | 557 | | — | | 3,975 | | (44) | | 3,931 | |
| – stage 3 | — | | — | | — | | — | | 177 | | 177 | | (42) | | 135 | |
| – POCI | — | | — | | — | | — | | 40 | | 40 | | (9) | | 31 | |
| Loan and other credit-related commitments | 400,911 | | 157,339 | | 90,784 | | 9,668 | | 1,081 | | 659,783 | | (734) | | 659,049 | |
| – stage 1 | 396,028 | | 143,600 | | 63,592 | | 1,265 | | — | | 604,485 | | (290) | | 604,195 | |
| – stage 2 | 4,883 | | 13,739 | | 27,192 | | 8,403 | | — | | 54,217 | | (365) | | 53,852 | |
| – stage 3 | — | | — | | — | | — | | 1,080 | | 1,080 | | (78) | | 1,002 | |
| – POCI | — | | — | | — | | — | | 1 | | 1 | | (1) | | — | |
| Financial guarantees | 6,356 | | 5,194 | | 5,317 | | 1,247 | | 270 | | 18,384 | | (125) | | 18,259 | |
| – stage 1 | 6,286 | | 4,431 | | 3,163 | | 210 | | — | | 14,090 | | (37) | | 14,053 | |
| – stage 2 | 70 | | 763 | | 2,154 | | 1,037 | | — | | 4,024 | | (62) | | 3,962 | |
| – stage 3 | — | | — | | — | | — | | 269 | | 269 | | (26) | | 243 | |
| – POCI | — | | — | | — | | — | | 1 | | 1 | | — | | 1 | |
| At 31 Dec 2020 | 1,668,047 | | 463,117 | | 382,834 | | 49,772 | | 20,940 | | 2,584,710 | | (15,566) | | 2,569,144 | |
Debt instruments at FVOCI1 | | | | | | | | |
| – stage 1 | 367,542 | | 12,585 | | 10,066 | | — | | — | | 390,193 | | (88) | | 390,105 | |
| – stage 2 | 143 | | 93 | | 343 | | 825 | | — | | 1,404 | | (20) | | 1,384 | |
| – stage 3 | — | | — | | — | | — | | 257 | | 257 | | (23) | | 234 | |
| – POCI | — | | — | | — | | — | | 49 | | 49 | | (10) | | 39 | |
| At 31 Dec 2020 | 367,685 | | 12,678 | | 10,409 | | 825 | | 306 | | 391,903 | | (141) | | 391,762 | |
1 For the purposes of this disclosure, gross carrying value is defined as the amortised cost of a financial asset before adjusting for any loss allowance. As such, the gross carrying value of debt instruments at FVOCI as presented above will not reconcile to the balance sheet as it excludes fair value gains and losses.
Credit-impaired loans
(Audited)
We determine that a financial instrument is credit impaired and in stage 3 by considering relevant objective evidence, primarily whether:
•contractual payments of either principal or interest are past due for more than 90 days;
•there are other indications that the borrower is unlikely to pay, such as when a concession has been granted to the borrower for economic or legal reasons relating to the borrower’s financial condition; and
•the loan is otherwise considered to be in default. If such unlikeliness to pay is not identified at an earlier stage, it is deemed to occur when an exposure is 90 days past due, even where regulatory rules permit default to be defined based on 180 days past due. Therefore, the definitions of credit impaired and default are aligned as far as possible so that stage 3 represents all loans that are considered defaulted or otherwise credit impaired.
Renegotiated loans and forbearance
The following table shows the gross carrying amounts of the Group’s holdings of renegotiated loans and advances to customers by industry sector and by stages. Mandatory and general offer loan modifications that are not borrower-specific, for example market-wide customer relief programmes, have not been classified as renegotiated loans. For details on customer relief schemes, see page 195.
A summary of our current policies and practices for renegotiated loans and forbearance is set out in ‘Credit risk management’ on page 173.
| | | | | | | | | | | | | | | | | |
| Renegotiated loans and advances to customers at amortised cost by stage allocation |
| Stage 1 | Stage 2 | Stage 3 | POCI | Total |
| $m | $m | $m | $m | $m |
| Gross carrying amount | | | | | |
| Personal | — | | — | | 2,256 | | — | | 2,256 | |
| – first lien residential mortgages | — | | — | | 1,547 | | — | | 1,547 | |
| – other personal lending | — | | — | | 709 | | — | | 709 | |
| Wholesale | 366 | | 559 | | 4,505 | | 253 | | 5,683 | |
| – corporate and commercial | 355 | | 550 | | 4,491 | | 253 | | 5,649 | |
| – non-bank financial institutions | 11 | | 9 | | 14 | | — | | 34 | |
| At 31 Dec 2021 | 366 | | 559 | | 6,761 | | 253 | | 7,939 | |
| Allowance for ECL | | | | | |
| Personal | — | | — | | (400) | | — | | (400) | |
| – first lien residential mortgages | — | | — | | (178) | | — | | (178) | |
| – other personal lending | — | | — | | (222) | | — | | (222) | |
| Wholesale | (7) | | (24) | | (1,282) | | (52) | | (1,365) | |
| – corporate and commercial | (7) | | (24) | | (1,274) | | (52) | | (1,357) | |
| – non-bank financial institutions | — | | — | | (8) | | — | | (8) | |
| At 31 Dec 2021 | (7) | | (24) | | (1,682) | | (52) | | (1,765) | |
| | | | | | | | | | | | | | | | | |
|
| | | | | |
| | | | | |
| Gross carrying amount | | | | | |
| Personal | — | | — | | 2,429 | | — | | 2,429 | |
| – first lien residential mortgages | — | | — | | 1,692 | | — | | 1,692 | |
| – other personal lending | — | | — | | 737 | | — | | 737 | |
| Wholesale | 328 | | 989 | | 3,929 | | 239 | | 5,485 | |
| – corporate and commercial | 324 | | 972 | | 3,903 | | 239 | | 5,438 | |
| – non-bank financial institutions | 4 | | 17 | | 26 | | — | | 47 | |
| At 31 Dec 2020 | 328 | | 989 | | 6,358 | | 239 | | 7,914 | |
| Allowance for ECL | | | | | |
| Personal | — | | — | | (452) | | — | | (452) | |
| – first lien residential mortgages | — | | — | | (152) | | — | | (152) | |
| – other personal lending | — | | — | | (300) | | — | | (300) | |
| Wholesale | (10) | | (36) | | (1,276) | | (86) | | (1,408) | |
| – corporate and commercial | (10) | | (36) | | (1,263) | | (86) | | (1,395) | |
| – non-bank financial institutions | — | | — | | (13) | | — | | (13) | |
| At 31 Dec 2020 | (10) | | (36) | | (1,728) | | (86) | | (1,860) | |
| | | | | | | | | | | | | | | | | | | | | | | | | | |
| Renegotiated loans and advances to customers by geographical region |
| | | | | | | Of which: |
| Europe | Asia | MENA | North America | Latin
America | Total | UK | Hong Kong |
| $m | $m | $m | $m | $m | $m | $m | $m |
| At 31 Dec 2021 | 4,119 | | 1,322 | | 954 | | 1,064 | | 480 | | 7,939 | | 3,469 | | 528 | |
| At 31 Dec 2020 | 4,274 | | 745 | | 1,279 | | 1,349 | | 267 | | 7,914 | | 3,483 | | 220 | |
Customer relief programmes
In response to the Covid-19 pandemic, governments and regulators around the world introduced a number of support measures for both personal and wholesale customers in market-wide schemes. The following table presents the number of personal accounts/wholesale customers and the associated drawn loan values of customers under these schemes and HSBC-specific measures for major markets at 31 December 2021. When schemes expire, accounts and customers and their associated drawn balances are no longer reported under relief regardless of their repayment status. In relation to personal lending, the majority of relief measures, including payment holidays, relate to existing lending, while in wholesale lending the relief measures comprise payment holidays, refinancing of existing facilities and new lending under government-backed schemes.
At 31 December 2021, the gross carrying value of loans to personal customers under relief was $1.7bn (31 December 2020: $5.5bn). This comprised $1.0bn in relation to mortgages (31 December 2020: $4.7bn) and $0.7bn in relation to other personal lending (31 December 2020: $0.9bn). The decrease in personal customer relief during the year was driven by customers exiting relief measures. The gross carrying value of loans to wholesale customers under relief was $26.3bn (31 December 2020: $35.3bn). We continue to monitor the recoverability of loans granted under customer relief programmes, including loans to a small number of customers that were subsequently found to be ineligible for such relief. The ongoing performance of such loans remains an area of uncertainty at 31 December 2021.
| | | | | | | | | | | | | | | | | | | | |
| Personal lending |
| Extant at 31 December 2021 | | UK | Hong
Kong | US | Other major markets1,2 | Total |
| Market-wide schemes | | | | | | |
| Number of accounts granted mortgage customer relief | 000s | — | — | | — | | 8 | 8 | |
| Drawn loan value of accounts granted mortgage customer relief | $m | — | — | | — | | 657 | 657 | |
| Number of accounts granted other personal lending customer relief | 000s | — | — | | — | | 34 | 34 | |
| Drawn loan value of accounts granted other personal lending customer relief | $m | — | — | | — | | 613 | 613 | |
| HSBC-specific measures | | | | | | |
| Number of accounts granted mortgage customer relief | 000s | — | | — | 1 | — | 1 | |
| Drawn loan value of accounts granted mortgage customer relief | $m | — | | 57 | 336 | 3 | 396 | |
| Number of accounts granted other personal lending customer relief | 000s | — | | — | — | 1 | 1 | |
| Drawn loan value of accounts granted other personal lending customer relief | $m | — | | 34 | 18 | 10 | 62 | |
| Total personal lending to major markets under market-wide schemes and HSBC-specific measures | | | | | | |
| Number of accounts granted mortgage customer relief | 000s | — | | — | | 1 | | 8 | | 9 | |
| Drawn loan value of accounts granted mortgage customer relief | $m | — | | 57 | | 336 | | 660 | | 1,053 | |
| Number of accounts granted other personal lending customer relief | 000s | — | | — | | — | | 35 | | 35 | |
| Drawn loan value of accounts granted other personal lending customer relief | $m | — | | 34 | | 18 | | 623 | | 675 | |
| | | | | | |
| | | | | | |
| | | | | | |
| | | | | | |
| | | | | | |
| | | | | | |
| | | | | | |
| | | | | | |
| | | | | | |
| | | | | | |
| | | | | | |
| | | | | | |
| | | | | | |
| | | | | | |
| | | | | | |
| | | | | | |
| | | | | | |
| | | | | | |
| | | | | | |
| | | | | | |
| | | | | | |
| | | | | | |
| | | | | | |
| | | | | | |
| | | | | | |
| | | | | | |
| | | | | | |
| | | | | | |
| | | | | | |
| | | | | | |
| Market-wide schemes and HSBC-specific measures – mortgage relief as a proportion of total mortgages | % | — | | 0.1 | | 2.0 | | 0.8 | | 0.3 | |
| Market-wide schemes and HSBC-specific measures – other personal lending relief as a proportion of total other personal lending loans and advances | % | — | | 0.1 | | 2.3 | | 1.2 | | 0.7 | |
| | | | | | |
| Wholesale lending |
| Extant at 31 December 2021 | | UK | Hong
Kong | US | Other major markets1 | Total |
| Market-wide schemes | | | | | | |
| Number of customers under market-wide measures | 000s | 227 | 1 | 1 | 5 | 234 | |
| Drawn loan value of customers under market-wide schemes | $m | 12,468 | 2,907 | 262 | 4,501 | 20,138 | |
| HSBC-specific schemes | | | | | | |
| Number of customers under HSBC-specific measures | 000s | — | 5 | — | | — | 5 | |
| Drawn loan value of customers under HSBC-specific measures | $m | 82 | 4,611 | 42 | 1,420 | 6,155 | |
| Total wholesale lending to major markets under market-wide schemes and HSBC-specific measures | | | | | | |
| Number of customers | 000s | 227 | | 6 | | 1 | | 5 | | 239 | |
| Drawn loan value | $m | 12,550 | | 7,518 | | 304 | | 5,921 | | 26,293 | |
| | | | | | |
| | | | | | |
| | | | | | |
| | | | | | |
| | | | | | |
| | | | | | |
| | | | | | |
| | | | | | |
| | | | | | |
| | | | | | |
| | | | | | |
| | | | | | |
| | | | | | |
| | | | | | |
| | | | | | |
| | | | | | |
| | | | | | |
| Market-wide schemes and HSBC-specific measures as a proportion of total wholesale lending loans and advances | % | 9.9 | | 4.1 | | 0.9 | | 2.9 | | 4.8 | |
| | | | | | | | | | | | | | | | | | | | | |
| Personal lending (continued) | |
| Extant at 31 December 2020 | | UK | Hong Kong | US | Other major markets1,2,3 | Total | |
| Market-wide schemes | | | | | | | |
| Number of accounts granted mortgage customer relief | 000s | 6 | — | | — | | 5 | 11 | | |
| Drawn loan value of accounts granted mortgage customer relief | $m | 1,412 | — | | — | | 908 | 2,320 | | |
| Number of accounts granted other personal lending customer relief | 000s | 15 | — | | — | | 28 | 43 | | |
| Drawn loan value of accounts granted other personal lending customer relief | $m | 140 | — | | — | | 386 | 526 | | |
| HSBC-specific measures | | | | | | | |
| Number of accounts granted mortgage customer relief | 000s | — | | 3 | 2 | 3 | 8 | | |
| Drawn loan value of accounts granted mortgage customer relief | $m | 7 | | 1,124 | 864 | 360 | 2,355 | | |
| Number of accounts granted other personal lending customer relief | 000s | — | | 1 | 6 | 18 | 25 | | |
| Drawn loan value of accounts granted other personal lending customer relief | $m | — | | 75 | 67 | 182 | 324 | | |
| Total personal lending to major markets under market-wide schemes and HSBC-specific measures | | | | | | | |
| Number of accounts granted mortgage customer relief | 000s | 6 | | 3 | | 2 | | 8 | | 19 | | |
| Drawn loan value of accounts granted mortgage customer relief | $m | 1,419 | | 1,124 | | 864 | | 1,268 | | 4,675 | | |
| Number of accounts granted other personal lending customer relief | 000s | 15 | | 1 | | 6 | | 46 | | 68 | | |
| Drawn loan value of accounts granted other personal lending customer relief | $m | 140 | | 75 | | 67 | | 568 | | 850 | | |
| | | | | | | |
| | | | | | | |
| | | | | | | |
| | | | | | | |
| | | | | | | |
| | | | | | | |
| | | | | | | |
| | | | | | | |
| | | | | | | |
| | | | | | | |
| | | | | | | |
| | | | | | | |
| | | | | | | |
| | | | | | | |
| | | | | | | |
| | | | | | | |
| | | | | | | |
| | | | | | | |
| | | | | | | |
| | | | | | | |
| | | | | | | |
| | | | | | | |
| | | | | | | |
| | | | | | | |
| | | | | | | |
| | | | | | | |
| | | | | | | |
| | | | | | | |
| | | | | | | |
| | | | | | | |
| Market-wide schemes and HSBC-specific measures – mortgage relief as a proportion of total mortgages | % | 0.9 | | 1.2 | | 4.7 | | 1.6 | | 1.4 | | |
| Market-wide schemes and HSBC-specific measures – other personal lending relief as a proportion of total other personal lending loans and advances | % | 0.7 | | 0.2 | | 3.1 | | 1.1 | | 0.8 | | |
| | | | | | | |
| | | | | | | | | | | | | | | | | | | | | |
| | | | | | | |
| Wholesale lending (continued) | |
| Extant at 31 December 2020 | | UK | Hong Kong | US | Other major markets1 | Total | |
| Market-wide schemes | | | | | | | |
| Number of customers under market-wide measures | 000s | 226 | 3 | 3 | 5 | 237 | | |
| Drawn loan value of customers under market-wide schemes | $m | 13,517 | 10,622 | 1,043 | 6,017 | 31,199 | | |
| HSBC-specific schemes | | | | | | | |
| Number of customers under HSBC-specific measures | 000s | — | — | — | | — | — | | |
| Drawn loan value of customers under HSBC-specific measures | $m | 349 | — | 924 | 2,869 | 4,142 | | |
| Total wholesale lending to major markets under market-wide schemes and HSBC-specific measures | | | | | | | |
| Number of customers | 000s | 226 | | 3 | | 3 | | 5 | | 237 | | |
| Drawn loan value | $m | 13,866 | | 10,622 | | 1,967 | | 8,886 | | 35,341 | | |
| | | | | | | |
| | | | | | | |
| | | | | | | |
| | | | | | | |
| | | | | | | |
| | | | | | | |
| | | | | | | |
| | | | | | | |
| | | | | | | |
| | | | | | | |
| | | | | | | |
| | | | | | | |
| | | | | | | |
| | | | | | | |
| | | | | | | |
| | | | | | | |
| | | | | | | |
| Market-wide schemes and HSBC-specific measures as a proportion of total wholesale lending loans and advances | % | 9.6 | | 5.9 | | 5.2 | | 4.6 | | 6.4 | | |
1 Other major markets include Australia, Canada, mainland China, Egypt, France, Germany, India, Indonesia, Malaysia, Mexico, Singapore, Switzerland, Taiwan and UAE.
2 In Malaysia, personal lending customers are granted an automatic moratorium programme for all eligible retail customers. As a result of further loosening of eligibility criteria and scope of relief measures, the country is now the major contributor to the figures reported under ‘Other major markets’. At 31 December 2021, the number of accounts under relief was 39,000 (31 December 2020: 26,000) with an associated drawn balance of $1,151m (31 December 2020: $452m).
3 In Mexico, at 31 December 2020, there were 16,000 personal lending accounts under customer relief with an associated drawn balance of $233m.
The initial granting of customer relief does not automatically trigger a migration to stage 2 or 3. However, information provided by payment deferrals is considered in the context of other reasonable and supportable information. This forms part of the overall assessment for whether there has been a significant increase in credit risk and credit impairment to identify loans for which lifetime ECL is appropriate. An extension in payment deferral does not automatically result in a migration to stage 2 or stage 3. The key accounting and credit risk judgement to ascertain whether a significant increase in credit risk has occurred is whether the economic effects of the Covid-19 pandemic on the customer are likely to be temporary over the lifetime of the loan, and whether they indicate that a concession is being made in respect of financial difficulty that would be consistent with stage 3.
Market-wide schemes
The following narrative provides further details on the major government and regulatory schemes offered in the UK, Hong Kong and the US.
UK personal lending
Mortgages
Customer relief granted on UK mortgages primarily consisted of payment holidays or partial payment deferrals.
Relief was offered for an initial period of three months and could be extended for a further three months in certain circumstances. No payment was required from the customer during this period (though with a partial payment deferral the customer had expressed a desire to make a contribution) and interest continued to be charged as usual. The customer’s arrears status was not worsened from utilisation of these schemes. All UK personal lending schemes expired during 2021.
Other personal lending payment holidays
Customer relief was granted for an initial period of three months and could be extended for a further three months. The maximum relief value was up to the due payment amount during the period. All UK personal lending schemes expired during 2021.
UK wholesale lending
The primary relief granted under government schemes consisted of the Bounce Back Loan Scheme, Coronavirus Business Interruption Loan Scheme and Coronavirus Large Business Interruption Loan Scheme. Since their initial launch, the application deadline for these schemes was extended to 31 March 2021. The key features of these schemes were as follows:
•The Bounce Back Loan Scheme provided small and medium-sized enterprises (‘SME’) with loans of up to £50,000 for a
maximum period of six years. Interest was charged at 2.5% and the government paid the fees and interest for the first 12 months. No capital repayment was required by the customer for the first 12 months of the scheme. A government guarantee of 100% was provided under the scheme. Before their first payment was due customers could extend the term of the loan to 10 years, move to interest-only repayments for a period of six months (customers could use this option up to three times) and/or pause repayments for a period of six months (customers could use this option once).
•The Coronavirus Business Interruption Loan Scheme provided SMEs that had a turnover of less than £45m with loans of up to £5m for a maximum period of six years. Interest was charged between 3.49% and 3.99% above the UK base rate and no capital repayment was required by the customer for the first 12 months of the scheme. A government guarantee of up to 80% was provided under the scheme.
•The Coronavirus Large Business Interruption Loan Scheme provided medium and large-sized enterprises that had a turnover in excess of £45m with loans of up to £200m. The interest rate and tenor of the loan were negotiated on commercial terms. A government guarantee of 80% was provided under the scheme.
Until 31 December 2021, the Recovery Loan Scheme, launched on 6 April 2021, provided businesses of any size financial support to recover from the Covid-19 pandemic with loans of £25,001 to £10m subject to eligibility and viability assessments. A government guarantee of 80% was provided under the scheme.
For term loans and asset finance, businesses could borrow for three months up to six years and for overdrafts and invoice finance, three months up to three years. The scheme was extended until 30 June 2022, with the following changes coming into force from 1 January 2022: the scheme remains open to small and medium-sized enterprises and the maximum amount of finance available is £2m per business. A government guarantee of 70% is provided on such loans.
Hong Kong wholesale lending
Pre-approved Principal Payment Holiday Scheme for Corporate Customers
The above scheme enabled eligible customers to apply for a payment holiday of six months (or 90 days for trade finance) with no change to the existing interest rate charge. On 2 September 2020, the Hong Kong Monetary Authority (‘HKMA’) announced that this scheme had been extended for a further six months to April 2021 and on 4 March 2021, it was extended for a further six months (or 90 days for trade finance) to October 2021.
Given the persistence of the Covid-19 pandemic around the world and the severity of the ensuing impact on the global and local economy, HKMA – together with the Banking Sector SME Lending Coordination Mechanism – announced on 21 September 2021 that the Pre-approved Principal Payment Holiday Scheme would be extended for another six months until April 2022. HKMA and the coordination mechanism agreed that all principal payments of loans falling due between November 2021 and April 2022 by eligible corporate customers would be deferred by another six months except for repayments of trade loans, which would be deferred by 90 days.
US wholesale lending
Paycheck Protection Program
The CARES Act created the Paycheck Protection Program (‘PPP’) loan guarantee programme to provide small businesses with support to cover payroll and certain other expenses. Loans made under the PPP were fully guaranteed by the Small Business Administration, whose guarantee was backed by the full faith and credit of the US. PPP-covered loans also afforded customers forgiveness up to the principal amount of the PPP-covered loan, plus accrued interest, if the loan proceeds were used to retain workers and maintain payroll or to make certain mortgage interest, lease and utility payments, and certain other criteria were satisfied. The Small Business Administration would reimburse PPP lenders for any amount of a PPP-covered loan that was forgiven, and PPP lenders would not be liable for any representations made by PPP borrowers in connection with their requests for loan forgiveness. Lenders received pre-determined fees for processing and servicing PPP loans. The schemes have now been closed.
HSBC-specific measures
UK wholesale lending
HSBC offered capital repayment holidays to CMB customers. Relief was offered on a preferred term of six months. However, some were granted for three months with the option of an extension. Interest continued to be paid as usual. Schemes have now been closed for application.
Hong Kong personal lending
Mortgages
Customer relief granted on Hong Kong mortgages consisted of deferred principal repayment of up to 12 months. This relief programme was available to existing HSBC mortgage loan customers who had a good repayment record during the six months prior to application. Schemes have now been closed for application.
Hong Kong wholesale lending
On 20 May 2021, the Group announced a new SME financing scheme in Hong Kong, with HK$40bn reserved to support SME customers as the economy started to recover. The scheme has now been closed for application.
US total personal lending
Customer relief granted on US mortgages and other personal lending consisted of deferrals of up to 12 months and up to nine months respectively. Schemes have now been closed for application.
Wholesale lending
This section provides further details on the regions, countries, territories and products comprising wholesale loans and advances to customers and banks. Product granularity is also provided by stage with geographical data presented for loans and advances to customers, banks, other credit commitments, financial guarantees and similar contracts. Additionally, this section provides a reconciliation of the opening 1 January 2021 to 31 December 2021 closing gross carrying/nominal amounts and the associated allowance for ECL.
At 31 December 2021, wholesale lending for loans and advances to banks and customers of $662bn decreased by $11.3bn since 31 December 2020. This included adverse foreign exchange movements of $10.6bn. Excluding foreign exchange movements, the total wholesale lending decrease was driven by a $5.2bn decline in corporate and commercial balances. This was partly offset by a $3bn increase in loans and advances to banks and a $1.5bn increase in balances from non-bank financial institutions.
The primary driver of the decline in corporate and commercial balances was $11.2bn in Europe, notably $12.4bn in the UK and $1bn in Germany, partly offset by growth of $4.6bn in France.
In MENA and North America, balances declined $1.4bn and $0.9bn respectively, while they grew in Asia by $8.0bn, notably $4.3bn in mainland China, $1.6bn in Hong Kong and $1.1bn in India.
Loan commitments and financial guarantees declined $26.5bn since 31 December 2020 to $415bn at 31 December 2021, including a $19.3bn decrease related to unsettled reverse repurchase agreements. This also included adverse foreign exchange movements of $12.7bn.
The allowance for ECL attributable to wholesale loans and advances to banks and customers decreased $1.5bn to $8.3bn at 31 December 2021 from $9.8bn at 31 December 2020. This included favourable foreign exchange movements of $0.2bn.
Excluding foreign exchange movements, the total decrease in the wholesale ECL allowance for loans and advances to customers and banks was driven by a $1.1bn decline in corporate and commercial allowances. The primary driver of this decrease in corporate and commercial allowance for ECL was $1.1bn in Europe, notably $1.1bn in the UK. Additionally, there were decreases of $0.2bn, $0.2bn and $0.1bn in MENA, North America and Latin America, respectively. There was an increase of $0.6bn in Asia, notably $0.4bn in Hong Kong.
The allowance for ECL attributable to loan commitments and financial guarantees of $0.4bn at 31 December 2021 decreased from $0.8bn at 31 December 2020.
| | | | | | | | | | | | | | | | | | | | | | | | | | | | | | | | |
| Total wholesale lending for loans and advances to banks and customers by stage distribution |
| Gross carrying amount | Allowance for ECL |
| Stage 1 | Stage 2 | Stage 3 | POCI | Total | Stage 1 | Stage 2 | Stage 3 | POCI | Total |
| $m | $m | $m | $m | $m | $m | $m | $m | $m | $m |
| Corporate and commercial | 400,894 | | 98,911 | | 13,460 | | 274 | | 513,539 | | (665) | | (1,874) | | (5,601) | | (64) | | (8,204) | |
| – agriculture, forestry and fishing | 6,510 | | 1,026 | | 362 | | 1 | | 7,899 | | (10) | | (23) | | (104) | | (1) | | (138) | |
| – mining and quarrying | 7,167 | | 2,055 | | 447 | | 16 | | 9,685 | | (17) | | (39) | | (159) | | (12) | | (227) | |
| – manufacturing | 75,193 | | 16,443 | | 2,019 | | 88 | | 93,743 | | (110) | | (176) | | (931) | | (31) | | (1,248) | |
| – electricity, gas, steam and air-conditioning supply | 15,255 | | 1,285 | | 78 | | — | | 16,618 | | (16) | | (21) | | (31) | | — | | (68) | |
| – water supply, sewerage, waste management and remediation | 3,376 | | 468 | | 51 | | — | | 3,895 | | (5) | | (4) | | (20) | | — | | (29) | |
| – construction | 9,506 | | 3,605 | | 842 | | 1 | | 13,954 | | (24) | | (44) | | (439) | | (1) | | (508) | |
| – wholesale and retail trade, repair of motor vehicles and motorcycles | 79,137 | | 12,802 | | 3,003 | | 2 | | 94,944 | | (71) | | (99) | | (1,936) | | (1) | | (2,107) | |
| – transportation and storage | 21,199 | | 7,726 | | 658 | | 9 | | 29,592 | | (56) | | (116) | | (191) | | — | | (363) | |
| – accommodation and food | 8,080 | | 14,096 | | 1,199 | | 1 | | 23,376 | | (67) | | (245) | | (110) | | (1) | | (423) | |
| – publishing, audiovisual and broadcasting | 16,417 | | 1,804 | | 222 | | 28 | | 18,471 | | (37) | | (47) | | (94) | | (6) | | (184) | |
| – real estate | 93,633 | | 25,154 | | 2,375 | | 98 | | 121,260 | | (132) | | (737) | | (775) | | — | | (1,644) | |
| – professional, scientific and technical activities | 16,160 | | 2,888 | | 637 | | — | | 19,685 | | (26) | | (40) | | (172) | | — | | (238) | |
| – administrative and support services | 23,186 | | 4,740 | | 719 | | 30 | | 28,675 | | (40) | | (84) | | (296) | | (11) | | (431) | |
| – public administration and defence, compulsory social security | 938 | | 333 | | — | | — | | 1,271 | | (5) | | (3) | | — | | — | | (8) | |
| – education | 1,455 | | 273 | | 65 | | — | | 1,793 | | (4) | | (15) | | (18) | | — | | (37) | |
| – health and care | 3,743 | | 928 | | 183 | | — | | 4,854 | | (11) | | (24) | | (37) | | — | | (72) | |
| – arts, entertainment and recreation | 1,620 | | 826 | | 152 | | — | | 2,598 | | (6) | | (44) | | (42) | | — | | (92) | |
| – other services | 10,123 | | 1,726 | | 448 | | — | | 12,297 | | (26) | | (101) | | (246) | | — | | (373) | |
| – activities of households | 860 | | 117 | | — | | — | | 977 | | — | | — | | — | | — | | — | |
| – extra-territorial organisations and bodies activities | 2 | | — | | — | | — | | 2 | | — | | — | | — | | — | | — | |
| – government | 7,010 | | 602 | | — | | — | | 7,612 | | (2) | | (2) | | — | | — | | (4) | |
| – asset-backed securities | 324 | | 14 | | — | | — | | 338 | | — | | (10) | | — | | — | | (10) | |
| Non-bank financial institutions | 61,086 | | 3,874 | | 395 | | — | | 65,355 | | (44) | | (26) | | (40) | | — | | (110) | |
| Loans and advances to banks | 81,636 | | 1,517 | | — | | — | | 83,153 | | (14) | | (3) | | — | | — | | (17) | |
| At 31 Dec 2021 | 543,616 | | 104,302 | | 13,855 | | 274 | | 662,047 | | (723) | | (1,903) | | (5,641) | | (64) | | (8,331) | |
| By geography | | | | | | | | | | |
| Europe | 154,575 | | 31,871 | | 6,741 | | 30 | | 193,217 | | (356) | | (654) | | (1,806) | | (9) | | (2,825) | |
| – of which: UK | 101,029 | | 24,461 | | 5,126 | | 28 | | 130,644 | | (306) | | (518) | | (1,060) | | (6) | | (1,890) | |
| Asia | 297,423 | | 53,993 | | 3,997 | | 199 | | 355,612 | | (182) | | (830) | | (2,299) | | (43) | | (3,354) | |
| – of which: Hong Kong | 165,437 | | 30,305 | | 1,990 | | 159 | | 197,891 | | (85) | | (650) | | (836) | | (21) | | (1,592) | |
| MENA | 26,135 | | 5,295 | | 1,682 | | 22 | | 33,134 | | (62) | | (108) | | (1,028) | | (11) | | (1,209) | |
| North America | 53,513 | | 10,397 | | 652 | | — | | 64,562 | | (57) | | (215) | | (169) | | — | | (441) | |
| Latin America | 11,970 | | 2,746 | | 783 | | 23 | | 15,522 | | (66) | | (96) | | (339) | | (1) | | (502) | |
| At 31 Dec 2021 | 543,616 | | 104,302 | | 13,855 | | 274 | | 662,047 | | (723) | | (1,903) | | (5,641) | | (64) | | (8,331) | |
| | | | | | | | | | | | | | | | | | | | | | | | | | | | | | | | |
Total wholesale lending for loans and other credit-related commitments and financial guarantees by stage distribution1 |
| Nominal amount | Allowance for ECL |
| Stage 1 | Stage 2 | Stage 3 | POCI | Total | Stage 1 | Stage 2 | Stage 3 | POCI | Total |
| $m | $m | $m | $m | $m | $m | $m | $m | $m | $m |
| Corporate and commercial | 274,775 | | 30,376 | | 829 | | — | | 305,980 | | (130) | | (193) | | (60) | | — | | (383) | |
| Financial | 105,746 | | 2,889 | | 2 | | — | | 108,637 | | (9) | | (9) | | (1) | | — | | (19) | |
| At 31 Dec 2021 | 380,521 | | 33,265 | | 831 | | — | | 414,617 | | (139) | | (202) | | (61) | | — | | (402) | |
| By geography | | | | | | | | | | |
| Europe | 189,770 | | 15,585 | | 673 | | — | | 206,028 | | (67) | | (76) | | (47) | | — | | (190) | |
| – of which: UK | 68,136 | | 8,430 | | 389 | | — | | 76,955 | | (55) | | (49) | | (28) | | — | | (132) | |
| Asia | 72,179 | | 5,229 | | 20 | | — | | 77,428 | | (35) | | (40) | | (5) | | — | | (80) | |
| – of which: Hong Kong | 31,314 | | 1,517 | | 10 | | — | | 32,841 | | (11) | | (17) | | (2) | | — | | (30) | |
| MENA | 6,335 | | 1,017 | | 19 | | — | | 7,371 | | (10) | | (18) | | (3) | | — | | (31) | |
| North America | 109,851 | | 11,350 | | 91 | | — | | 121,292 | | (24) | | (66) | | (1) | | — | | (91) | |
| Latin America | 2,386 | | 84 | | 28 | | — | | 2,498 | | (3) | | (2) | | (5) | | — | | (10) | |
| At 31 Dec 2021 | 380,521 | | 33,265 | | 831 | | — | | 414,617 | | (139) | | (202) | | (61) | | — | | (402) | |
1 Included in loans and other credit-related commitments and financial guarantees is $42bn relating to unsettled reverse repurchase agreements, which once drawn are classified as ‘Reverse repurchase agreements – non-trading’.
| | | | | | | | | | | | | | | | | | | | | | | | | | | | | | | | |
| Total wholesale lending for loans and advances to banks and customers by stage distribution |
| Gross carrying amount | Allowance for ECL |
| Stage 1 | Stage 2 | Stage 3 | POCI | Total | Stage 1 | Stage 2 | Stage 3 | POCI | Total |
| $m | $m | $m | $m | $m | $m | $m | $m | $m | $m |
| Corporate and commercial | 387,563 | | 126,287 | | 12,961 | | 277 | | 527,088 | | (1,101) | | (2,444) | | (5,837) | | (112) | | (9,494) | |
| – agriculture, forestry and fishing | 6,087 | | 1,026 | | 331 | | 1 | | 7,445 | | (12) | | (45) | | (149) | | (1) | | (207) | |
| – mining and quarrying | 7,429 | | 3,705 | | 797 | | 16 | | 11,947 | | (33) | | (112) | | (209) | | (11) | | (365) | |
| – manufacturing | 68,179 | | 23,564 | | 2,076 | | 87 | | 93,906 | | (201) | | (442) | | (905) | | (40) | | (1,588) | |
| – electricity, gas, steam and air-conditioning supply | 14,240 | | 1,907 | | 53 | | — | | 16,200 | | (25) | | (40) | | (8) | | — | | (73) | |
| – water supply, sewerage, waste management and remediation | 2,874 | | 253 | | 47 | | — | | 3,174 | | (8) | | (7) | | (22) | | — | | (37) | |
| – construction | 9,368 | | 4,455 | | 773 | | 4 | | 14,600 | | (42) | | (118) | | (426) | | (4) | | (590) | |
| – wholesale and retail trade, repair of motor vehicles and motorcycles | 65,937 | | 21,518 | | 3,196 | | 12 | | 90,663 | | (174) | | (326) | | (2,029) | | (3) | | (2,532) | |
| – transportation and storage | 19,510 | | 9,143 | | 769 | | 11 | | 29,433 | | (90) | | (163) | | (240) | | — | | (493) | |
| – accommodation and food | 10,616 | | 14,918 | | 536 | | 1 | | 26,071 | | (76) | | (285) | | (129) | | (1) | | (491) | |
| – publishing, audiovisual and broadcasting | 17,019 | | 2,796 | | 131 | | 33 | | 19,979 | | (45) | | (85) | | (39) | | (20) | | (189) | |
| – real estate | 102,933 | | 22,186 | | 1,907 | | 1 | | 127,027 | | (169) | | (260) | | (738) | | — | | (1,167) | |
| – professional, scientific and technical activities | 17,162 | | 6,379 | | 498 | | 33 | | 24,072 | | (56) | | (149) | | (185) | | (8) | | (398) | |
| – administrative and support services | 17,085 | | 8,361 | | 907 | | 70 | | 26,423 | | (66) | | (153) | | (291) | | (24) | | (534) | |
| – public administration and defence, compulsory social security | 1,530 | | 475 | | 3 | | — | | 2,008 | | (2) | | (11) | | (1) | | — | | (14) | |
| – education | 1,402 | | 691 | | 29 | | — | | 2,122 | | (12) | | (20) | | (9) | | — | | (41) | |
| – health and care | 4,049 | | 1,192 | | 261 | | 8 | | 5,510 | | (21) | | (45) | | (120) | | — | | (186) | |
| – arts, entertainment and recreation | 1,631 | | 1,570 | | 236 | | — | | 3,437 | | (9) | | (62) | | (87) | | — | | (158) | |
| – other services | 11,380 | | 1,320 | | 410 | | — | | 13,110 | | (54) | | (105) | | (249) | | — | | (408) | |
| – activities of households | 660 | | 142 | | — | | — | | 802 | | — | | (1) | | — | | — | | (1) | |
| – extra-territorial organisations and bodies activities | 10 | | — | | — | | — | | 10 | | — | | — | | — | | — | | — | |
| – government | 7,866 | | 671 | | 1 | | — | | 8,538 | | (6) | | (2) | | (1) | | — | | (9) | |
| – asset-backed securities | 596 | | 15 | | — | | — | | 611 | | — | | (13) | | — | | — | | (13) | |
| Non-bank financial institutions | 52,223 | | 11,834 | | 523 | | — | | 64,580 | | (46) | | (119) | | (100) | | — | | (265) | |
| Loans and advances to banks | 79,654 | | 2,004 | | — | | — | | 81,658 | | (33) | | (9) | | — | | — | | (42) | |
| At 31 Dec 2020 | 519,440 | | 140,125 | | 13,484 | | 277 | | 673,326 | | (1,180) | | (2,572) | | (5,937) | | (112) | | (9,801) | |
| By geography | | | | | | | | | | |
| Europe | 156,474 | | 51,708 | | 6,531 | | 109 | | 214,822 | | (589) | | (1,400) | | (2,097) | | (51) | | (4,137) | |
| – of which: UK | 104,534 | | 40,454 | | 4,712 | | 53 | | 149,753 | | (536) | | (1,234) | | (1,320) | | (33) | | (3,123) | |
| Asia | 279,985 | | 58,159 | | 3,443 | | 106 | | 341,693 | | (337) | | (383) | | (2,040) | | (43) | | (2,803) | |
| – of which: Hong Kong | 156,817 | | 39,257 | | 1,637 | | 45 | | 197,756 | | (162) | | (260) | | (751) | | (23) | | (1,196) | |
| MENA | 24,753 | | 7,893 | | 1,952 | | 30 | | 34,628 | | (91) | | (216) | | (1,205) | | (12) | | (1,524) | |
| North America | 46,852 | | 18,220 | | 913 | | — | | 65,985 | | (77) | | (302) | | (281) | | — | | (660) | |
| Latin America | 11,376 | | 4,145 | | 645 | | 32 | | 16,198 | | (86) | | (271) | | (314) | | (6) | | (677) | |
| At 31 Dec 2020 | 519,440 | | 140,125 | | 13,484 | | 277 | | 673,326 | | (1,180) | | (2,572) | | (5,937) | | (112) | | (9,801) | |
| | | | | | | | | | | | | | | | | | | | | | | | | | | | | | | | |
Total wholesale lending for loans and other credit-related commitments and financial guarantees by stage distribution1 |
| Nominal amount | Allowance for ECL |
| Stage 1 | Stage 2 | Stage 3 | POCI | Total | Stage 1 | Stage 2 | Stage 3 | POCI | Total |
| $m | $m | $m | $m | $m | $m | $m | $m | $m | $m |
| Corporate and commercial | 262,598 | | 49,008 | | 1,140 | | 2 | | 312,748 | | (271) | | (392) | | (100) | | (1) | | (764) | |
| Financial | 120,768 | | 7,526 | | 55 | | — | | 128,349 | | (17) | | (33) | | (4) | | — | | (54) | |
| At 31 Dec 2020 | 383,366 | | 56,534 | | 1,195 | | 2 | | 441,097 | | (288) | | (425) | | (104) | | (1) | | (818) | |
| By geography | | | | | | | | | | |
| Europe | 210,141 | | 28,705 | | 851 | | 2 | | 239,699 | | (152) | | (208) | | (83) | | (1) | | (444) | |
| – of which: UK | 81,153 | | 17,048 | | 480 | | 1 | | 98,682 | | (138) | | (176) | | (72) | | (1) | | (387) | |
| Asia | 63,586 | | 6,311 | | 20 | | — | | 69,917 | | (73) | | (43) | | (6) | | — | | (122) | |
| – of which: Hong Kong | 26,502 | | 3,639 | | 4 | | — | | 30,145 | | (24) | | (22) | | (1) | | — | | (47) | |
| MENA | 4,975 | | 1,609 | | 85 | | — | | 6,669 | | (14) | | (44) | | (2) | | — | | (60) | |
| North America | 102,399 | | 19,360 | | 198 | | — | | 121,957 | | (39) | | (124) | | (7) | | — | | (170) | |
| Latin America | 2,265 | | 549 | | 41 | | — | | 2,855 | | (10) | | (6) | | (6) | | — | | (22) | |
| At 31 Dec 2020 | 383,366 | | 56,534 | | 1,195 | | 2 | | 441,097 | | (288) | | (425) | | (104) | | (1) | | (818) | |
1 Included in loans and other credit-related commitments and financial guarantees is $62bn relating to unsettled reverse repurchase agreements, which once drawn are classified as ‘Reverse repurchase agreements – non-trading’.
| | | | | | | | | | | | | | | | | | | | | | | | | | | | | | | | |
Wholesale lending – reconciliation of changes in gross carrying/nominal amount and allowances for loans and advances to banks and customers including loan commitments and financial guarantees |
| (Audited) |
| Non-credit impaired | Credit impaired | |
| Stage 1 | Stage 2 | Stage 3 | POCI | Total |
| Gross carrying/ nominal amount | Allowance for ECL | Gross carrying/ nominal amount | Allowance for ECL | Gross carrying/ nominal amount | Allowance for ECL | Gross carrying/ nominal amount | Allowance for ECL | Gross carrying/ nominal amount | Allowance for ECL |
| $m | $m | $m | $m | $m | $m | $m | $m | $m | $m |
| At 1 Jan 2021 | 841,105 | | (1,465) | | 196,662 | | (2,998) | | 14,662 | | (6,041) | | 279 | | (113) | | 1,052,708 | | (10,617) | |
| Transfers of financial instruments | 19,285 | | (638) | | (23,361) | | 888 | | 4,076 | | (250) | | — | | — | | — | | — | |
| | | | | | | | | | |
| | | | | | | | | | |
| | | | | | | | | | |
| | | | | | | | | | |
| Net remeasurement of ECL arising from transfer of stage | — | | 400 | | — | | (233) | | — | | (27) | | — | | — | | — | | 140 | |
| | | | | | | | | | |
| | | | | | | | | | |
| | | | | | | | | | |
| | | | | | | | | | |
| Net new and further lending/ repayments | 38,224 | | 20 | | (32,150) | | 454 | | (2,501) | | 764 | | 6 | | 18 | | 3,579 | | 1,256 | |
| Change in risk parameters – credit quality | — | | 793 | | — | | (234) | | — | | (1,347) | | — | | 28 | | — | | (760) | |
| Changes to models used for ECL calculation | — | | (15) | | — | | (33) | | — | | — | | — | | — | | — | | (48) | |
| Assets written off | — | | — | | — | | — | | (1,085) | | 1,085 | | (7) | | 7 | | (1,092) | | 1,092 | |
| Credit-related modifications that resulted in derecognition | — | | — | | — | | — | | (125) | | — | | — | | — | | (125) | | — | |
| Foreign exchange and other | (16,872) | | 43 | | (3,610) | | 51 | | (341) | | 114 | | (4) | | (4) | | (20,827) | | 204 | |
| | | | | | | | | | |
| | | | | | | | | | |
| At 31 Dec 2021 | 881,742 | | (862) | | 137,541 | | (2,105) | | 14,686 | | (5,702) | | 274 | | (64) | | 1,034,243 | | (8,733) | |
| ECL income statement change for the period | | 1,198 | | | (46) | | | (610) | | | 46 | | | 588 | |
| Recoveries | | | | | | | | | | 54 | |
| Others | | | | | | | | | | (102) | |
| Total ECL income statement change for the period | | | | | | | | | | 540 | |
| | | | | | | | | | |
| | | | | | | | | | |
As shown in the above table, the allowance for ECL for loans and advances to customers and banks and relevant loan commitments and financial guarantees decreased $1,884m during the period from $10,617m at 31 December 2020 to $8,733m at 31 December 2021.
This decrease was primarily driven by:
•$1,256m relating to volume movements, which included the ECL allowance associated with new originations, assets derecognised and further lending/repayments;
•$1,092m of assets written off;
•$140m relating to the net remeasurement impact of stage transfers; and
•foreign exchange and other movements of $204m.
These were partly offset by:
•$760m relating to underlying credit quality changes, including the credit quality impact of financial instruments transferring between stages; and
•$48m of changes to models used for ECL calculation.
The ECL release for the period of $588m presented in the previous table consisted of $1,256m relating to underlying net book volume movement and $140m relating to the net remeasurement impact of stage transfers. This was partly offset by $760m relating to underlying credit quality changes, including the credit quality impact of financial instruments transferring between stages and $48m in changes to models used for ECL calculation.
The net transfer of gross carrying/nominal amounts to stage 1 of $19,285m reflects the overall improvement in the economic outlook as the effects of the Covid-19 outbreak subsided. It was primarily driven by $14,393m in Europe, $8,871m in North America, $3,674m in Middle East and North Africa, and was partly offset by a net transfer out of stage 1 of $8,285m in Asia mainly driven by an increase in Downside scenario weighting for China, reflecting management’s concern for potential deterioration on forward looking credit quality.
| | | | | | | | | | | | | | | | | | | | | | | | | | | | | | | | |
Wholesale lending – reconciliation of changes in gross carrying/nominal amount and allowances for loans and advances to banks and customers including loan commitments and financial guarantees |
| (Audited) |
| Non-credit impaired | Credit impaired | |
| Stage 1 | Stage 2 | Stage 3 | POCI | Total |
| Gross carrying/ nominal amount | Allowance for ECL | Gross carrying/ nominal amount | Allowance for ECL | Gross carrying/ nominal amount | Allowance for ECL | Gross carrying/ nominal amount | Allowance for ECL | Gross carrying/ nominal amount | Allowance for ECL |
| $m | $m | $m | $m | $m | $m | $m | $m | $m | $m |
| At 1 Jan 2020 | 925,652 | | (867) | | 88,169 | | (1,103) | | 9,289 | | (3,906) | | 345 | | (99) | | 1,023,455 | | (5,975) | |
| Transfers of financial instruments | (113,217) | | (493) | | 103,413 | | 770 | | 9,804 | | (277) | | — | | — | | — | | — | |
| Net remeasurement of ECL arising from transfer of stage | — | | 476 | | — | | (603) | | — | | (742) | | — | | — | | — | | (869) | |
| Net new and further lending/repayments | 10,451 | | (437) | | (2,910) | | 141 | | (3,350) | | 583 | | (48) | | (1) | | 4,143 | | 286 | |
| Changes to risk parameters – credit quality | — | | (261) | | — | | (2,349) | | — | | (3,120) | | — | | (39) | | — | | (5,769) | |
| Changes to models used for ECL calculation | — | | 137 | | — | | 303 | | — | | — | | — | | — | | — | | 440 | |
| Assets written off | — | | — | | — | | — | | (1,537) | | 1,537 | | (30) | | 30 | | (1,567) | | 1,567 | |
| Credit-related modifications that resulted in derecognition | — | | — | | — | | — | | (23) | | 7 | | — | | — | | (23) | | 7 | |
| Foreign exchange and other | 18,219 | | (20) | | 7,990 | | (157) | | 479 | | (123) | | 12 | | (4) | | 26,700 | | (304) | |
| At 31 Dec 2020 | 841,105 | | (1,465) | | 196,662 | | (2,998) | | 14,662 | | (6,041) | | 279 | | (113) | | 1,052,708 | | (10,617) | |
| ECL income statement change for the period | | (85) | | | (2,508) | | | (3,279) | | | (40) | | | (5,912) | |
| Recoveries | | | | | | | | | | 46 | |
| Others | | | | | | | | | | (59) | |
| Total ECL income statement change for the period | | | | | | | | | | (5,925) | |
| | | | | | | | | | | | | | | | | | | | | | | | | | |
| Wholesale lending – distribution of financial instruments to which the impairment requirements of IFRS 9 are applied by credit quality |
| Gross carrying/nominal amount | Allowance for ECL | Net |
| Strong | Good | Satisfactory | Sub-
standard | Credit impaired | Total |
| $m | $m | $m | $m | $m | $m | $m | $m |
| By geography | | | | | | | | |
| Europe | 48,758 | 49,254 | 74,240 | 14,196 | 6,769 | 193,217 | (2,825) | | 190,392 | |
| – of which: UK | 30,390 | 37,212 | 48,694 | 9,192 | 5,156 | 130,644 | (1,890) | | 128,754 | |
| Asia | 155,072 | 95,626 | 96,046 | 4,670 | 4,198 | 355,612 | (3,354) | | 352,258 | |
| – of which: Hong Kong | 74,440 | 54,703 | 63,301 | 3,297 | 2,150 | 197,891 | (1,592) | | 196,299 | |
| MENA | 12,264 | 7,004 | 10,321 | 1,844 | 1,701 | 33,134 | (1,209) | | 31,925 | |
| North America | 11,683 | 24,663 | 22,022 | 5,543 | 651 | 64,562 | (441) | | 64,121 | |
| Latin America | 993 | 5,736 | 5,638 | 2,349 | 806 | 15,522 | (502) | | 15,020 | |
| At 31 Dec 2021 | 228,770 | 182,283 | 208,267 | 28,602 | 14,125 | 662,047 | (8,331) | | 653,716 | |
| Percentage of total credit quality | 34.6% | 27.5% | 31.5% | 4.3% | 2.1% | 100.0% | | |
| | | | | | | | | | | | | | | | | | | | | | | | | | | |
| |
| | | | |
| | | | | | | |
| | | | | | | | | |
| By geography | | | | | | | | | |
| Europe | 53,373 | 55,436 | 81,049 | 18,327 | 6,637 | 214,822 | (4,137) | | 210,685 | | |
| – of which: UK | 35,050 | 42,476 | 55,106 | 12,357 | 4,764 | 149,753 | (3,123) | | 146,630 | | |
| Asia | 141,811 | 93,350 | 98,488 | 4,493 | 3,551 | 341,693 | (2,803) | | 338,890 | | |
| – of which: Hong Kong | 72,088 | 52,601 | 68,826 | 2,558 | 1,683 | 197,756 | (1,196) | | 196,560 | | |
| MENA | 12,398 | 7,810 | 10,990 | 1,448 | 1,982 | 34,628 | (1,524) | | 33,104 | | |
| North America | 11,157 | 22,973 | 24,978 | 5,964 | 913 | 65,985 | (660) | | 65,325 | | |
| Latin America | 989 | 5,355 | 6,127 | 3,049 | 678 | 16,198 | (677) | | 15,521 | | |
| At 31 Dec 2020 | 219,728 | 184,924 | 221,632 | 33,281 | 13,761 | 673,326 | (9,801) | | 663,525 | | |
| Percentage of total credit quality | 32.6% | 27.5% | 32.9% | 4.9% | 2.0% | 100.0% | | | |
Our risk rating system facilitates the internal ratings-based approach under the Basel framework adopted by the Group to support calculation of our minimum credit regulatory capital requirement. The credit quality classifications can be found on page 174.
| | | | | | | | | | | | | | | | | | | | | | | | | | | | | | | | | | | | | | | | | |
| Wholesale lending – credit risk profile by obligor grade for loans and advances at amortised cost |
| | Gross carrying amount | Allowance for ECL | | |
| Basel one-year PD range | Stage 1 | Stage 2 | Stage 3 | POCI | Total | Stage 1 | Stage 2 | Stage 3 | POCI | Total | ECL coverage | Mapped external rating |
| % | $m | $m | $m | $m | $m | $m | $m | $m | $m | $m | % | |
| Corporate and commercial | | 400,894 | | 98,911 | | 13,460 | | 274 | | 513,539 | | (665) | | (1,874) | | (5,601) | | (64) | | (8,204) | | 1.6 | | |
| – CRR 1 | 0.000 to 0.053 | 40,583 | | 599 | | — | | — | | 41,182 | | (7) | | (1) | | — | | — | | (8) | | — | | AA- and above |
| – CRR 2 | 0.054 to 0.169 | 78,794 | | 4,843 | | — | | — | | 83,637 | | (26) | | (43) | | — | | — | | (69) | | 0.1 | | A+ to A- |
| – CRR 3 | 0.170 to 0.740 | 139,739 | | 19,199 | | — | | — | | 158,938 | | (165) | | (145) | | — | | — | | (310) | | 0.2 | | BBB+ to BBB- |
| – CRR 4 | 0.741 to 1.927 | 91,268 | | 23,365 | | — | | — | | 114,633 | | (218) | | (258) | | — | | — | | (476) | | 0.4 | | BB+ to BB- |
| – CRR 5 | 1.928 to 4.914 | 45,850 | | 28,375 | | — | | — | | 74,225 | | (185) | | (424) | | — | | — | | (609) | | 0.8 | | BB- to B |
| – CRR 6 | 4.915 to 8.860 | 3,280 | | 11,197 | | — | | — | | 14,477 | | (22) | | (242) | | — | | — | | (264) | | 1.8 | | B- |
| – CRR 7 | 8.861 to 15.000 | 1,101 | | 4,406 | | — | | — | | 5,507 | | (24) | | (167) | | — | | — | | (191) | | 3.5 | | CCC+ |
| – CRR 8 | 15.001 to 99.999 | 279 | | 6,927 | | — | | 4 | | 7,210 | | (18) | | (594) | | — | | — | | (612) | | 8.5 | | CCC to C |
| – CRR 9/10 | 100.000 | | — | | — | | 13,460 | | 270 | | 13,730 | | — | | — | | (5,601) | | (64) | | (5,665) | | 41.3 | | D |
| Non-bank financial institutions | | 61,086 | | 3,874 | | 395 | | — | | 65,355 | | (44) | | (26) | | (40) | | — | | (110) | | 0.2 | | |
| – CRR 1 | 0.000 to 0.053 | 14,370 | | 122 | | — | | — | | 14,492 | | (2) | | (1) | | — | | — | | (3) | | — | | AA- and above |
| – CRR 2 | 0.054 to 0.169 | 16,438 | | 43 | | — | | — | | 16,481 | | (5) | | — | | — | | — | | (5) | | — | | A+ to A- |
| – CRR 3 | 0.170 to 0.740 | 18,282 | | 1,026 | | — | | — | | 19,308 | | (11) | | (4) | | — | | — | | (15) | | 0.1 | | BBB+ to BBB- |
| – CRR 4 | 0.741 to 1.927 | 6,835 | | 1,204 | | — | | — | | 8,039 | | (15) | | (11) | | — | | — | | (26) | | 0.3 | | BB+ to BB- |
| – CRR 5 | 1.928 to 4.914 | 5,053 | | 1,297 | | — | | — | | 6,350 | | (11) | | (4) | | — | | — | | (15) | | 0.2 | | BB- to B |
| – CRR 6 | 4.915 to 8.860 | 102 | | 98 | | — | | — | | 200 | | — | | (5) | | — | | — | | (5) | | 2.5 | | B- |
| – CRR 7 | 8.861 to 15.000 | 5 | | 25 | | — | | — | | 30 | | — | | (1) | | — | | — | | (1) | | 3.3 | | CCC+ |
| – CRR 8 | 15.001 to 99.999 | 1 | | 59 | | — | | — | | 60 | | — | | — | | — | | — | | — | | — | | CCC to C |
| – CRR 9/10 | 100.000 | | — | | — | | 395 | | — | | 395 | | — | | — | | (40) | | — | | (40) | | 10.1 | | D |
| Banks | | 81,636 | | 1,517 | | — | | — | | 83,153 | | (14) | | (3) | | — | | — | | (17) | | — | | |
| – CRR 1 | 0.000 to 0.053 | 61,275 | | 10 | | — | | — | | 61,285 | | (4) | | — | | — | | — | | (4) | | — | | AA- and above |
| – CRR 2 | 0.054 to 0.169 | 11,628 | | 65 | | — | | — | | 11,693 | | (3) | | — | | — | | — | | (3) | | — | | A+ to A- |
| – CRR 3 | 0.170 to 0.740 | 3,935 | | 102 | | — | | — | | 4,037 | | (2) | | — | | — | | — | | (2) | | — | | BBB+ to BBB- |
| – CRR 4 | 0.741 to 1.927 | 4,232 | | 180 | | — | | — | | 4,412 | | (5) | | — | | — | | — | | (5) | | 0.1 | | BB+ to BB- |
| – CRR 5 | 1.928 to 4.914 | 556 | | 52 | | — | | — | | 608 | | — | | (1) | | — | | — | | (1) | | 0.2 | | BB- to B |
| – CRR 6 | 4.915 to 8.860 | 9 | | 541 | | — | | — | | 550 | | — | | — | | — | | — | | — | | — | | B- |
| – CRR 7 | 8.861 to 15.000 | 1 | | 564 | | — | | — | | 565 | | — | | — | | — | | — | | — | | — | | CCC+ |
| – CRR 8 | 15.001 to 99.999 | — | | 3 | | — | | — | | 3 | | — | | (2) | | — | | — | | (2) | | 66.7 | | CCC to C |
| – CRR 9/10 | 100.000 | | — | | — | | — | | — | | — | | — | | — | | — | | — | | — | | — | | D |
| At 31 Dec 2021 | | 543,616 | | 104,302 | | 13,855 | | 274 | | 662,047 | | (723) | | (1,903) | | (5,641) | | (64) | | (8,331) | | 1.3 | | |
| | | | | | | | | | | | | | | | | | | | | | | | | | | | | | | | | | | | | | | | | |
|
| | | | | |
| | | | | | | | | | |
| | | | | | | | | | | | | |
Corporate and
commercial | | 387,563 | | 126,287 | | 12,961 | | 277 | | 527,088 | | (1,101) | | (2,444) | | (5,837) | | (112) | | (9,494) | | 1.8 | | |
| – CRR 1 | 0.000 to 0.053 | 36,047 | | 486 | | — | | — | | 36,533 | | (8) | | (5) | | — | | — | | (13) | | — | | AA- and above |
| – CRR 2 | 0.054 to 0.169 | 81,298 | | 3,140 | | — | | — | | 84,438 | | (42) | | (36) | | — | | — | | (78) | | 0.1 | | A+ to A- |
| – CRR 3 | 0.170 to 0.740 | 131,540 | | 27,061 | | — | | — | | 158,601 | | (262) | | (197) | | — | | — | | (459) | | 0.3 | | BBB+ to BBB- |
| – CRR 4 | 0.741 to 1.927 | 91,385 | | 35,376 | | — | | — | | 126,761 | | (390) | | (375) | | — | | — | | (765) | | 0.6 | | BB+ to BB- |
| – CRR 5 | 1.928 to 4.914 | 42,214 | | 34,585 | | — | | — | | 76,799 | | (330) | | (686) | | — | | — | | (1,016) | | 1.3 | | BB- to B |
| – CRR 6 | 4.915 to 8.860 | 3,523 | | 14,560 | | — | | — | | 18,083 | | (35) | | (476) | | — | | — | | (511) | | 2.8 | | B- |
| – CRR 7 | 8.861 to 15.000 | 1,111 | | 7,241 | | — | | — | | 8,352 | | (21) | | (322) | | — | | — | | (343) | | 4.1 | | CCC+ |
| – CRR 8 | 15.001 to 99.999 | 445 | | 3,838 | | — | | — | | 4,283 | | (13) | | (347) | | — | | — | | (360) | | 8.4 | | CCC to C |
| – CRR 9/10 | 100.000 | | — | | — | | 12,961 | | 277 | | 13,238 | | — | | — | | (5,837) | | (112) | | (5,949) | | 44.9 | | D |
| Non-bank financial institutions | | 52,223 | | 11,834 | | 523 | | — | | 64,580 | | (46) | | (119) | | (100) | | — | | (265) | | 0.4 | | |
| – CRR 1 | 0.000 to 0.053 | 12,234 | | 28 | | — | | — | | 12,262 | | (3) | | — | | — | | — | | (3) | | — | | AA- and above |
| – CRR 2 | 0.054 to 0.169 | 15,128 | | 49 | | — | | — | | 15,177 | | (5) | | (1) | | — | | — | | (6) | | — | | A+ to A- |
| – CRR 3 | 0.170 to 0.740 | 16,741 | | 4,086 | | — | | — | | 20,827 | | (12) | | (9) | | — | | — | | (21) | | 0.1 | | BBB+ to BBB- |
| – CRR 4 | 0.741 to 1.927 | 4,931 | | 3,917 | | — | | — | | 8,848 | | (15) | | (27) | | — | | — | | (42) | | 0.5 | | BB+ to BB- |
| – CRR 5 | 1.928 to 4.914 | 2,859 | | 2,797 | | — | | — | | 5,656 | | (10) | | (34) | | — | | — | | (44) | | 0.8 | | BB- to B |
| – CRR 6 | 4.915 to 8.860 | 103 | | 505 | | — | | — | | 608 | | (1) | | (22) | | — | | — | | (23) | | 3.8 | | B- |
| – CRR 7 | 8.861 to 15.000 | 87 | | 329 | | — | | — | | 416 | | — | | (9) | | — | | — | | (9) | | 2.2 | | CCC+ |
| – CRR 8 | 15.001 to 99.999 | 140 | | 123 | | — | | — | | 263 | | — | | (17) | | — | | — | | (17) | | 6.5 | | CCC to C |
| – CRR 9/10 | 100.000 | | — | | — | | 523 | | — | | 523 | | — | | — | | (100) | | — | | (100) | | 19.1 | | D |
| Banks | | 79,654 | | 2,004 | | — | | — | | 81,658 | | (33) | | (9) | | — | | — | | (42) | | 0.1 | | |
| – CRR 1 | 0.000 to 0.053 | 62,291 | | 46 | | — | | — | | 62,337 | | (10) | | — | | — | | — | | (10) | | — | | AA- and above |
| – CRR 2 | 0.054 to 0.169 | 8,835 | | 146 | | — | | — | | 8,981 | | (7) | | — | | — | | — | | (7) | | 0.1 | | A+ to A- |
| – CRR 3 | 0.170 to 0.740 | 5,098 | | 398 | | — | | — | | 5,496 | | (5) | | (2) | | — | | — | | (7) | | 0.1 | | BBB+ to BBB- |
| – CRR 4 | 0.741 to 1.927 | 2,558 | | 168 | | — | | — | | 2,726 | | (4) | | (4) | | — | | — | | (8) | | 0.3 | | BB+ to BB- |
| – CRR 5 | 1.928 to 4.914 | 799 | | 43 | | — | | — | | 842 | | (1) | | (1) | | — | | — | | (2) | | 0.2 | | BB- to B |
| – CRR 6 | 4.915 to 8.860 | 71 | | 20 | | — | | — | | 91 | | (6) | | — | | — | | — | | (6) | | 6.6 | | B- |
| – CRR 7 | 8.861 to 15.000 | 2 | | 1 | | — | | — | | 3 | | — | | — | | — | | — | | — | | — | | CCC+ |
| – CRR 8 | 15.001 to 99.999 | — | | 1,182 | | — | | — | | 1,182 | | — | | (2) | | — | | — | | (2) | | 0.2 | | CCC to C |
| – CRR 9/10 | 100.000 | | — | | — | | — | | — | | — | | — | | — | | — | | — | | — | | — | | D |
| At 31 Dec 2020 | | 519,440 | | 140,125 | | 13,484 | | 277 | | 673,326 | | (1,180) | | (2,572) | | (5,937) | | (112) | | (9,801) | | 1.5 | | |
Commercial real estate
Commercial real estate lending includes the financing of corporate, institutional and high net worth customers who are investing primarily in income-producing assets and, to a lesser extent, in their construction and development. The portfolio is globally diversified with larger concentrations in Hong Kong, the UK and the US.
Our global exposure is centred largely on cities with economic, political or cultural significance. In more developed markets, our exposure mainly comprises the financing of investment assets, the redevelopment of existing stock and the augmentation of both
commercial and residential markets to support economic and population growth. In less developed commercial real estate markets, our exposures comprise lending for development assets on relatively short tenors with a particular focus on supporting larger, better capitalised developers involved in residential construction or assets supporting economic expansion.
Commercial real estate lending declined $7.5bn, including adverse foreign exchange movements of $1.2bn, mainly in the UK and, to a lesser extent, within the US.
| | | | | | | | | | | | | | | | | | | | | | | | | | |
| Commercial real estate lending |
| | | | | | | Of which: |
| Europe | Asia | MENA | North
America | Latin America | Total | UK | Hong Kong |
| $m | $m | $m | $m | $m | $m | $m | $m |
| Gross loans and advances | | | | | | | | |
| Stage 1 | 20,317 | | 56,734 | | 781 | | 8,328 | | 1,073 | | 87,233 | | 14,235 | | 42,951 | |
| Stage 2 | 3,505 | | 17,103 | | 569 | | 1,265 | | 218 | | 22,660 | | 2,781 | | 13,300 | |
| Stage 3 | 1,062 | | 543 | | 206 | | 9 | | 249 | | 2,069 | | 905 | | 435 | |
| POCI | — | | 98 | | — | | — | | — | | 98 | | — | | 98 | |
| At 31 Dec 2021 | 24,884 | | 74,478 | | 1,556 | | 9,602 | | 1,540 | | 112,060 | | 17,921 | | 56,784 | |
| – of which: renegotiated loans | 440 | | 251 | | 145 | | — | | — | | 836 | | 436 | | 170 | |
| Allowance for ECL | (450) | | (693) | | (158) | | (26) | | (130) | | (1,457) | | (366) | | (604) | |
| | | | | | | | | | | | | | | | | | | | | | | | | | |
|
| | | | | | | |
| | | | | | | | |
| | | | | | | | |
| Gross loans and advances | | | | | | | | |
| Stage 1 | 22,639 | | 63,276 | | 1,147 | | 7,373 | | 1,269 | | 95,704 | | 16,207 | | 48,735 | |
| Stage 2 | 5,549 | | 11,686 | | 436 | | 4,093 | | 381 | | 22,145 | | 4,299 | | 9,105 | |
| Stage 3 | 1,114 | | 37 | | 250 | | 42 | | 240 | | 1,683 | | 966 | | 18 | |
| POCI | 1 | | — | | — | | — | | — | | 1 | | — | | — | |
| At 31 Dec 2020 | 29,303 | | 74,999 | | 1,833 | | 11,508 | | 1,890 | | 119,533 | | 21,472 | | 57,858 | |
| – of which: renegotiated loans | 751 | | 3 | | 201 | | — | | — | | 955 | | 744 | | — | |
| Allowance for ECL | (650) | | (117) | | (190) | | (64) | | (120) | | (1,141) | | (575) | | (65) | |
Refinance risk in commercial real estate
Commercial real estate lending tends to require the repayment of a significant proportion of the principal at maturity. Typically, a customer will arrange repayment through the acquisition of a new loan to settle the existing debt. Refinance risk is the risk that a
customer, being unable to repay the debt on maturity, fails to refinance it at commercial rates. We monitor our commercial real estate portfolio closely, assessing indicators for signs of potential issues with refinancing.
| | | | | | | | | | | | | | | | | | | | | | | | | | |
| Commercial real estate gross loans and advances maturity analysis |
| | | | | | | Of which: |
| Europe | Asia | MENA | North America | Latin America | Total | UK | Hong Kong |
| $m | $m | $m | $m | $m | $m | $m | $m |
| On demand, overdrafts or revolving | | | | | | | | |
| < 1 year | 12,980 | | 26,736 | | 478 | | 5,961 | | 336 | | 46,491 | | 10,546 | | 20,466 | |
| 1–2 years | 4,794 | | 18,192 | | 159 | | 1,098 | | 280 | | 24,523 | | 3,921 | | 14,399 | |
| 2–5 years | 5,352 | | 26,668 | | 631 | | 2,297 | | 559 | | 35,507 | | 2,805 | | 19,562 | |
| > 5 years | 1,758 | | 2,882 | | 288 | | 246 | | 365 | | 5,539 | | 649 | | 2,357 | |
| At 31 Dec 2021 | 24,884 | | 74,478 | | 1,556 | | 9,602 | | 1,540 | | 112,060 | | 17,921 | | 56,784 | |
| | | | | | | | | | | | | | | | | | | | | | | | | | |
|
| | | | | | | | |
| | | | | | | | |
| On demand, overdrafts or revolving | | | | | | | | |
| < 1 year | 13,728 | | 25,075 | | 750 | | 5,793 | | 263 | | 45,609 | | 12,131 | | 19,998 | |
| 1–2 years | 6,373 | | 18,396 | | 119 | | 3,112 | | 434 | | 28,434 | | 4,991 | | 13,237 | |
| 2–5 years | 6,241 | | 27,699 | | 668 | | 2,288 | | 927 | | 37,823 | | 3,135 | | 21,694 | |
| > 5 years | 2,961 | | 3,829 | | 296 | | 315 | | 266 | | 7,667 | | 1,215 | | 2,929 | |
| At 31 Dec 2020 | 29,303 | | 74,999 | | 1,833 | | 11,508 | | 1,890 | | 119,533 | | 21,472 | | 57,858 | |
The following table presents the Group’s total exposure to mainland China commercial real estate at 31 December 2021, by country/territory and credit quality. Mainland China reported real estate exposures comprise exposures booked in mainland China and offshore where the ultimate parent and beneficial owner is based in mainland China, and all exposures booked on mainland China balance sheets.
| | | | | | | | | | | | | | |
| Mainland China commercial real estate |
| Hong Kong | Mainland China | Rest of the Group | Total |
| $m | $m | $m | $m |
Loans and advances to customers1 | 9,903 | | 6,811 | | 410 | | 17,124 | |
Guarantees issued and others2 | 1,747 | | 2,376 | | 79 | | 4,202 | |
| Total mainland China commercial real estate exposure at 31 Dec 2021 | 11,650 | | 9,187 | | 489 | | 21,326 | |
| | | | |
| Distribution of mainland China commercial real estate exposure by credit quality | | | | |
| – Strong | 3,543 | | 3,864 | | 155 | | 7,562 | |
| – Good | 2,652 | | 2,354 | | 73 | | 5,079 | |
| – Satisfactory | 3,383 | | 2,855 | | 106 | | 6,344 | |
| – Sub-standard | 1,570 | | 12 | | 155 | | 1,737 | |
| – Credit impaired | 502 | | 102 | | — | | 604 | |
| At 31 Dec 2021 | 11,650 | | 9,187 | | 489 | | 21,326 | |
| Allowance for ECL | 560 | | 49 | | 2 | | 611 | |
1 Amounts represent gross carrying amount.
2 Amounts represent nominal amount.
At 31 December 2021, the Group had no direct credit exposure to developers in the ‘red’ category of the Chinese government’s ‘three red lines’ framework. The Group’s exposures related to companies whose primary activities are focused on residential, commercial and mixed-use real estate activities. Lending is generally focused on tier 1 and 2 cities.
Booked in Hong Kong are higher risk exposures to a combination of state and privately owned enterprises. This portfolio had 89% of exposure booked with a credit quality of ‘satisfactory’ or above, but had a higher degree of uncertainty due to tightening liquidity and increased refinancing risks. In addition, offshore exposures are typically higher risk than onshore exposures. At 31 December 2021, the Group had allowances for ECL of $560m held against mainland China commercial real estate exposures booked in Hong Kong. We will continue to monitor the prevailing situation closely.
Collateral and other credit enhancements
(Audited)
Although collateral can be an important mitigant of credit risk, it is the Group’s practice to lend on the basis of the customer’s ability to meet their obligations out of cash flow resources rather than placing primary reliance on collateral and other credit risk enhancements. Depending on the customer’s standing and the type of product, facilities may be provided without any collateral or other credit enhancements. For other lending, a charge over collateral is obtained and considered in determining the credit decision and pricing. In the event of default, the Group may utilise the collateral as a source of repayment.
Depending on its form, collateral can have a significant financial effect in mitigating our exposure to credit risk. Where there is sufficient collateral, an expected credit loss is not recognised. This is the case for reverse repurchase agreements and for certain loans and advances to customers where the loan to value (‘LTV’) is very low.
Mitigants may include a charge on borrowers’ specific assets, such as real estate or financial instruments. Other credit risk mitigants include short positions in securities and financial assets held as part of linked insurance/investment contracts where the risk is predominantly borne by the policyholder. Additionally, risk may be managed by employing other types of collateral and credit risk enhancements, such as second charges, other liens and unsupported guarantees. Guarantees are normally taken from corporates and export credit agencies. Corporates would normally provide guarantees as part of a parent/subsidiary relationship and span a number of credit grades. The export credit agencies will normally be investment grade.
Certain credit mitigants are used strategically in portfolio management activities. While single name concentrations arise in
portfolios managed by Global Banking and Corporate Banking, it is only in Global Banking that their size requires the use of portfolio level credit mitigants. Across Global Banking, risk limits and utilisations, maturity profiles and risk quality are monitored and managed proactively. This process is key to the setting of risk appetite for these larger, more complex, geographically distributed customer groups. While the principal form of risk management continues to be at the point of exposure origination, through the lending decision-making process, Global Banking also utilises loan sales and credit default swap (‘CDS’) hedges to manage concentrations and reduce risk. These transactions are the responsibility of a dedicated Global Banking portfolio management team. Hedging activity is carried out within agreed credit parameters, and is subject to market risk limits and a robust governance structure. Where applicable, CDSs are entered into directly with a central clearing house counterparty. Otherwise, the Group’s exposure to CDS protection providers is diversified among mainly banking counterparties with strong credit ratings.
CDS mitigants are held at portfolio level and are not included in the expected credit loss calculations. CDS mitigants are not reported in the following tables.
Collateral on loans and advances
Collateral held is analysed separately for commercial real estate and for other corporate, commercial and financial (non-bank) lending. The following tables include off-balance sheet loan commitments, primarily undrawn credit lines.
The collateral measured in the following tables consists of fixed first charges on real estate, and charges over cash and marketable financial instruments. The values in the tables represent the expected market value on an open market basis. No adjustment has been made to the collateral for any expected costs of recovery. Marketable securities are measured at their fair value.
Other types of collateral such as unsupported guarantees and floating charges over the assets of a customer’s business are not measured in the following tables. While such mitigants have value, often providing rights in insolvency, their assignable value is not sufficiently certain and they are therefore assigned no value for disclosure purposes.
The LTV ratios presented are calculated by directly associating loans and advances with the collateral that individually and uniquely supports each facility. When collateral assets are shared by multiple loans and advances, whether specifically or, more generally, by way of an all monies charge, the collateral value is pro-rated across the loans and advances protected by the collateral.
For credit-impaired loans, the collateral values cannot be directly compared with impairment allowances recognised. The LTV
figures use open market values with no adjustments. Impairment allowances are calculated on a different basis, by considering other cash flows and adjusting collateral values for costs of realising collateral as explained further on page 352.
Commercial real estate loans and advances
The value of commercial real estate collateral is determined by using a combination of external and internal valuations
and physical inspections. For commercial real estate, where the
facility exceeds regulatory threshold requirements, Group policy requires an independent review of the valuation at least every three years, or more frequently as the need arises.
In Hong Kong, market practice is typically for lending to major property companies to be either secured by guarantees or unsecured. In Europe, facilities of a working capital nature are generally not secured by a first fixed charge, and are therefore disclosed as not collateralised.
| | | | | | | | | | | | | | | | | | | | | | | | | | |
Wholesale lending – commercial real estate loans and advances including loan commitments by level of collateral for key countries/territories (by stage) | | | | |
| (Audited) | | | | |
| | | Of which: | | | | |
| Total | UK | Hong Kong | | | | | |
| Gross carrying/nominal amount | ECL coverage | Gross carrying/nominal amount | ECL coverage | Gross carrying/nominal amount | ECL coverage | | | | | | |
| $m | % | $m | % | $m | % | | | | | | |
| Stage 1 | | | | | | | | | | | | |
| Not collateralised | 50,603 | | 0.1 | | 7,623 | | 0.4 | | 23,864 | | — | | | | | | | |
| Fully collateralised | 71,769 | | 0.1 | | 13,139 | | 0.2 | | 32,951 | | — | | | | | | | |
| LTV ratio: | | | | | | | | | | | | |
| – less than 50% | 35,984 | | 0.1 | | 4,142 | | 0.2 | | 22,645 | | — | | | | | | | |
| – 51% to 75% | 26,390 | | 0.1 | | 6,460 | | 0.2 | | 8,082 | | — | | | | | | | |
| – 76% to 90% | 5,284 | | 0.2 | | 1,859 | | 0.2 | | 1,181 | | — | | | | | | | |
| – 91% to 100% | 4,111 | | 0.1 | | 678 | | — | | 1,043 | | 0.1 | | | | | | | |
| Partially collateralised (A): | 5,429 | | 0.1 | | 2,018 | | 0.1 | | 714 | | — | | | | | | | |
| – collateral value on A | 2,942 | | | 874 | | | 447 | | | | | | | | |
| Total | 127,801 | | 0.1 | | 22,780 | | 0.3 | | 57,529 | | — | | | | | | | |
| Stage 2 | | | | | | | | | | | | |
| Not collateralised | 11,729 | | 4.3 | | 1,970 | | 0.9 | | 7,758 | | 5.9 | | | | | | | |
| Fully collateralised | 12,741 | | 1.1 | | 1,131 | | 2.3 | | 6,385 | | 0.4 | | | | | | | |
| LTV ratio: | | | | | | | | | | | | |
| – less than 50% | 5,759 | | 1.0 | | 605 | | 3.1 | | 3,633 | | 0.3 | | | | | | | |
| – 51% to 75% | 4,804 | | 1.1 | | 471 | | 1.3 | | 2,389 | | 0.5 | | | | | | | |
| – 76% to 90% | 757 | | 1.5 | | 43 | | — | | 269 | | 0.4 | | | | | | | |
| – 91% to 100% | 1,421 | | 1.5 | | 12 | | — | | 94 | | — | | | | | | | |
| Partially collateralised (B): | 1,783 | | 2.7 | | 366 | | 0.3 | | 172 | | 2.9 | | | | | | | |
| – collateral value on B | 930 | | | 223 | | | 70 | | | | | | | | |
| Total | 26,253 | | 2.7 | | 3,467 | | 1.3 | | 14,315 | | 3.4 | | | | | | | |
| Stage 3 | | | | | | | | | | | | |
| Not collateralised | 828 | | 40.9 | | 407 | | 42.0 | | 198 | | 35.9 | | | | | | | |
| Fully collateralised | 1,176 | | 22.0 | | 346 | | 5.2 | | 290 | | 11.0 | | | | | | | |
| LTV ratio: | | | | | | | | | | | | |
| – less than 50% | 645 | | 19.8 | | 36 | | 2.8 | | 284 | | 10.9 | | | | | | | |
| – 51% to 75% | 286 | | 9.1 | | 250 | | 5.2 | | — | | — | | | | | | | |
| – 76% to 90% | 62 | | 14.5 | | 11 | | — | | 2 | | — | | | | | | | |
| – 91% to 100% | 183 | | 52.5 | | 49 | | 8.2 | | 4 | | 25.0 | | | | | | | |
| Partially collateralised (C): | 265 | | 47.9 | | 204 | | 49.0 | | — | | — | | | | | | | |
| – collateral value on C | 149 | | | 97 | | | — | | | | | | | | |
| Total | 2,269 | | 32.0 | | 957 | | 30.2 | | 488 | | 21.1 | | | | | | | |
| POCI | | | | | | | | | | | | |
| Not collateralised | — | | — | | — | | — | | — | | — | | | | | | | |
| Fully collateralised | 98 | | — | | — | | — | | 98 | | — | | | | | | | |
| LTV ratio: | | | | | | | | | | | | |
| – less than 50% | 98 | | — | | — | | — | | 98 | | — | | | | | | | |
| – 51% to 75% | — | | — | | — | | — | | — | | — | | | | | | | |
| – 76% to 90% | — | | — | | — | | — | | — | | — | | | | | | | |
| – 91% to 100% | — | | — | | — | | — | | — | | — | | | | | | | |
| Partially collateralised (D): | — | | — | | — | | — | | — | | — | | | | | | | |
| – collateral value on D | — | | | — | | | — | | | | | | | | |
| Total | 98 | | — | | — | | — | | 98 | | — | | | | | | | |
| At 31 Dec 2021 | 156,421 | | 1.0 | | 27,204 | | 1.5 | | 72,430 | | 0.8 | | | | | | | |
| | | | | | | | | | | | | | | | | | | | | | |
Wholesale lending – commercial real estate loans and advances including loan commitments by level of collateral for key countries/territories (by stage) (continued) |
| (Audited) |
| | | Of which: |
| Total | UK | Hong Kong | |
| Gross carrying/nominal amount | ECL
coverage | Gross carrying/nominal amount | ECL
coverage | Gross carrying/nominal amount | ECL
coverage | | |
| $m | % | $m | % | $m | % | | |
| Stage 1 | | | | | | | | |
| Not collateralised | 55,376 | | 0.1 | | 7,205 | | 0.6 | | 29,422 | | — | | | |
| Fully collateralised | 71,915 | | 0.2 | | 14,053 | | 0.2 | | 33,386 | | — | | | |
| LTV ratio: | | | | | | | | |
| – less than 50% | 36,408 | | 0.1 | | 4,665 | | 0.3 | | 22,361 | | — | | | |
| – 51% to 75% | 26,081 | | 0.2 | | 7,031 | | 0.2 | | 9,091 | | — | | | |
| – 76% to 90% | 5,098 | | 0.3 | | 1,932 | | 0.2 | | 1,093 | | — | | | |
| – 91% to 100% | 4,328 | | 0.3 | | 425 | | 0.5 | | 841 | | — | | | |
| Partially collateralised (A): | 5,477 | | 0.2 | | 1,463 | | 0.1 | | 769 | | — | | | |
| – collateral value on A | 3,486 | | | 912 | | | 594 | | | | |
| Total | 132,768 | | 0.1 | | 22,721 | | 0.4 | | 63,577 | | — | | | |
| Stage 2 | | | | | | | | |
| Not collateralised | 8,710 | | 1.3 | | 3,337 | | 2.2 | | 1,084 | | 0.1 | | | |
| Fully collateralised | 18,383 | | 1.0 | | 2,534 | | 1.6 | | 8,719 | | 0.5 | | | |
| LTV ratio: | | | | | | | | |
| – less than 50% | 8,544 | | 0.8 | | 1,132 | | 1.5 | | 5,359 | | 0.4 | | | |
| – 51% to 75% | 8,097 | | 1.1 | | 1,020 | | 2.0 | | 2,955 | | 0.8 | | | |
| – 76% to 90% | 849 | | 1.1 | | 350 | | 0.9 | | 319 | | 0.3 | | | |
| – 91% to 100% | 893 | | 1.0 | | 32 | | 3.1 | | 86 | | — | | | |
| Partially collateralised (B): | 1,260 | | 1.0 | | 713 | | 0.8 | | 196 | | 1.0 | | | |
| – collateral value on B | 517 | | | 246 | | | 147 | | | | |
| Total | 28,353 | | 1.1 | | 6,584 | | 1.8 | | 9,999 | | 0.5 | | | |
| Stage 3 | | | | | | | | |
| Not collateralised | 1,038 | | 45.3 | | 635 | | 50.7 | | — | | — | | | |
| Fully collateralised | 583 | | 11.5 | | 348 | | 9.5 | | 20 | | 5.0 | | | |
| LTV ratio: | | | | | | | | |
| – less than 50% | 177 | | 13.6 | | 56 | | 5.4 | | 11 | | — | | | |
| – 51% to 75% | 161 | | 15.5 | | 128 | | 12.5 | | 3 | | — | | | |
| – 76% to 90% | 149 | | 6.7 | | 139 | | 5.8 | | — | | — | | | |
| – 91% to 100% | 96 | | 8.3 | | 25 | | 24.0 | | 6 | | 16.7 | | | |
| Partially collateralised (C): | 474 | | 45.6 | | 195 | | 27.7 | | — | | — | | | |
| – collateral value on C | 331 | | | 120 | | | — | | | | |
| Total | 2,095 | | 35.9 | | 1,178 | | 34.7 | | 20 | | 5.0 | | | |
| POCI | | | | | | | | |
| Not collateralised | — | | — | | — | | — | | — | | — | | | |
| Fully collateralised | 1 | | — | | — | | — | | — | | — | | | |
| LTV ratio: | | | | | | | | |
| – less than 50% | 1 | | — | | — | | — | | — | | — | | | |
| – 51% to 75% | — | | — | | — | | — | | — | | — | | | |
| – 76% to 90% | — | | — | | — | | — | | — | | — | | | |
| – 91% to 100% | — | | — | | — | | — | | — | | — | | | |
| Partially collateralised (D): | — | | — | | — | | — | | — | | — | | | |
| – collateral value on D | — | | — | | — | | — | | — | | — | | | |
| Total | 1 | | — | | — | | — | | — | | — | | | |
| At 31 Dec 2020 | 163,217 | | 0.8 | | 30,483 | | 2.0 | | 73,596 | | 0.1 | | | |
| | | | | | | | | | | | | | | | | | | | | | |
Wholesale lending – commercial real estate loans and advances including loan commitments by level of collateral for key countries/territories |
| (Audited) |
| | | Of which: |
| Total | UK | Hong Kong | |
| Gross carrying/nominal amount | ECL coverage | Gross carrying/nominal amount | ECL coverage | Gross carrying/nominal amount | ECL coverage | | |
| $m | % | $m | % | $m | % | | |
| Rated CRR/PD1 to 7 | | | | | | | | |
| Not collateralised | 61,279 | | 0.5 | | 9,586 | | 0.5 | | 30,917 | | 0.6 | | | |
| Fully collateralised | 83,456 | | 0.2 | | 14,218 | | 0.2 | | 38,817 | | 0.1 | | | |
| Partially collateralised (A): | 7,059 | | 0.5 | | 2,379 | | 0.2 | | 886 | | 0.6 | | | |
| – collateral value on A | 3,729 | | | 1,092 | | | 517 | | | | |
| Total | 151,794 | | 0.3 | | 26,183 | | 0.3 | | 70,620 | | 0.3 | | | |
| Rated CRR/PD8 | | | | | | | | |
| Not collateralised | 1,053 | | 26.5 | | 7 | | 42.9 | | 705 | | 38.6 | | | |
| Fully collateralised | 1,054 | | 3.8 | | 52 | | 38.5 | | 519 | | 2.1 | | | |
| LTV ratio: | | | | | | | | |
| – less than 50% | 503 | | 4.8 | | 41 | | 41.5 | | 378 | | 0.8 | | | |
| – 51% to 75% | 447 | | 3.1 | | 8 | | 25.0 | | 137 | | 5.8 | | | |
| – 76% to 90% | 60 | | 1.7 | | 1 | | — | | 4 | | — | | | |
| – 91% to 100% | 44 | | 2.3 | | 2 | | — | | — | | — | | | |
| Partially collateralised (B): | 153 | | 15.0 | | 5 | | 20.0 | | — | | — | | | |
| – collateral value on B | 143 | | | 5 | | | — | | | | |
| Total | 2,260 | | 15.1 | | 64 | | 37.5 | | 1,224 | | 23.1 | | | |
| Rated CRR/PD9 to 10 | | | | | | | | |
| Not collateralised | 828 | | 40.9 | | 407 | | 42.0 | | 198 | | 35.9 | | | |
| Fully collateralised | 1,274 | | 20.3 | | 346 | | 5.2 | | 388 | | 8.2 | | | |
| LTV ratio: | | | | | | | | |
| – less than 50% | 743 | | 17.2 | | 36 | | 2.8 | | 382 | | 8.1 | | | |
| – 51% to 75% | 286 | | 9.1 | | 250 | | 5.2 | | — | | — | | | |
| – 76% to 90% | 62 | | 14.5 | | 11 | | — | | 2 | | — | | | |
| – 91% to 100% | 183 | | 52.5 | | 49 | | 8.2 | | 4 | | 25.0 | | | |
| Partially collateralised (C): | 265 | | 47.9 | | 204 | | 49.0 | | — | | — | | | |
| – collateral value on C | 149 | | | 97 | | | — | | | | |
| Total | 2,367 | | 30.6 | | 957 | | 30.2 | | 586 | | 17.6 | | | |
| At 31 Dec 2021 | 156,421 | | 1.0 | | 27,204 | | 1.5 | | 72,430 | | 0.8 | | | |
| | | | | | | | | | | | | | | | | | | | | | |
|
|
| | | |
| | | | |
| | | | | | | | |
| | | | | | | | |
| Rated CRR/PD1 to 7 | | | | | | | | |
| Not collateralised | 64,046 | | 0.3 | | 10,527 | | 1.1 | | 30,506 | | — | | | |
| Fully collateralised | 89,664 | | 0.3 | | 16,483 | | 0.4 | | 41,861 | | 0.1 | | | |
| Partially collateralised (A): | 6,728 | | 0.4 | | 2,174 | | 0.3 | | 965 | | 0.2 | | | |
| – collateral value on A | 3,994 | | | 1,157 | | | 741 | | | | |
| Total | 160,438 | | 0.3 | | 29,184 | | 0.6 | | 73,332 | | — | | | |
| Rated CRR/PD8 | | | | | | | | |
| Not collateralised | 40 | | 22.5 | | 15 | | 6.7 | | — | | — | | | |
| Fully collateralised | 634 | | 8.2 | | 104 | | 12.5 | | 244 | | 12.7 | | | |
| LTV ratio: | | | | | | | | |
| – less than 50% | 282 | | 7.1 | | 15 | | 6.7 | | 102 | | 11.8 | | | |
| – 51% to 75% | 321 | | 9.0 | | 75 | | 13.3 | | 138 | | 13.0 | | | |
| – 76% to 90% | 14 | | 21.4 | | 5 | | 20.0 | | 4 | | 25.0 | | | |
| – 91% to 100% | 17 | | — | | 9 | | — | | — | | — | | | |
| Partially collateralised (B): | 9 | | 11.1 | | 2 | | 50.0 | | — | | — | | | |
| – collateral value on B | 9 | | | 1 | | | — | | | | |
| Total | 683 | | 9.1 | | 121 | | 12.4 | | 244 | | 12.7 | | | |
| Rated CRR/PD9 to 10 | | | | | | | | |
| Not collateralised | 1,038 | | 45.3 | | 635 | | 50.7 | | — | | — | | | |
| Fully collateralised | 584 | | 11.5 | | 348 | | 9.5 | | 20 | | 5.0 | | | |
| LTV ratio: | | | | | | | | |
| – less than 50% | 178 | | 13.5 | | 56 | | 5.4 | | 11 | | — | | | |
| – 51% to 75% | 161 | | 15.5 | | 128 | | 12.5 | | 3 | | — | | | |
| – 76% to 90% | 149 | | 6.7 | | 139 | | 5.8 | | — | | — | | | |
| – 91% to 100% | 96 | | 8.3 | | 25 | | 24.0 | | 6 | | 16.7 | | | |
| Partially collateralised (C): | 474 | | 45.6 | | 195 | | 27.7 | | — | | — | | | |
| – collateral value on C | 331 | | | 120 | | | — | | | | |
| Total | 2,096 | | 35.9 | | 1,178 | | 34.7 | | 20 | | 5.0 | | | |
| At 31 Dec 2020 | 163,217 | | 0.8 | | 30,483 | | 2.0 | | 73,596 | | 0.1 | | | |
Other corporate, commercial and financial (non-bank) loans and advances
Other corporate, commercial and financial (non-bank) loans are analysed separately in the following table, which focuses on the countries/territories containing the majority of our loans and advances balances. For financing activities in other corporate and commercial lending, collateral value is not strongly correlated to principal repayment performance.
Collateral values are generally refreshed when an obligor’s general credit performance deteriorates and we have to assess the likely performance of secondary sources of repayment should it prove necessary to rely on them.
Accordingly, the following table reports values only for customers with CRR 8–10, recognising that these loans and advances generally have valuations that are comparatively recent.
| | | | | | | | | | | | | | | | | | | | | | |
Wholesale lending – other corporate, commercial and financial (non-bank) loans and advances including loan commitments by level of collateral for key countries/territories (by stage) |
| (Audited) |
| | | Of which: |
| Total | UK | Hong Kong | |
| Gross carrying/nominal amount | ECL coverage | Gross carrying/nominal amount | ECL coverage | Gross carrying/nominal amount | ECL coverage | | |
| $m | % | $m | % | $m | % | | |
| Stage 1 | | | | | | | | |
| Not collateralised | 624,935 | | 0.1 | | 112,188 | | 0.2 | | 111,948 | | — | | | |
| Fully collateralised | 112,905 | | 0.1 | | 22,971 | | 0.2 | | 45,479 | | 0.1 | | | |
| LTV ratio: | | | | | | | | |
| – less than 50% | 40,636 | | 0.1 | | 6,512 | | 0.2 | | 16,915 | | — | | | |
| – 51% to 75% | 38,709 | | 0.1 | | 9,431 | | 0.2 | | 16,533 | | 0.1 | | | |
| – 76% to 90% | 13,284 | | 0.1 | | 2,556 | | 0.1 | | 4,920 | | 0.1 | | | |
| – 91% to 100% | 20,276 | | 0.1 | | 4,472 | | — | | 7,111 | | 0.1 | | | |
| Partially collateralised (A): | 64,058 | | 0.1 | | 8,665 | | 0.1 | | 20,358 | | — | | | |
| – collateral value on A | 30,890 | | | 4,826 | | | 9,322 | | | | |
| Total | 801,898 | | 0.1 | | 143,824 | | 0.2 | | 177,785 | | — | | | |
| Stage 2 | | | | | | | | |
| Not collateralised | 85,394 | | 1.1 | | 18,562 | | 2.0 | | 8,310 | | 1.1 | | | |
| Fully collateralised | 32,019 | | 1.1 | | 8,231 | | 1.3 | | 11,503 | | 0.7 | | | |
| LTV ratio: | | | | | | | | |
| – less than 50% | 10,892 | | 1.2 | | 3,148 | | 1.5 | | 3,378 | | 0.5 | | | |
| – 51% to 75% | 14,281 | | 1.1 | | 4,161 | | 1.2 | | 5,202 | | 0.9 | | | |
| – 76% to 90% | 2,752 | | 1.2 | | 687 | | 1.5 | | 1,148 | | 0.9 | | | |
| – 91% to 100% | 4,094 | | 0.9 | | 235 | | 1.7 | | 1,775 | | 0.2 | | | |
| Partially collateralised (B): | 12,484 | | 1.0 | | 1,824 | | 1.9 | | 1,788 | | 0.4 | | | |
| – collateral value on B | 6,675 | | | 937 | | | 785 | | | | |
| Total | 129,897 | | 1.1 | | 28,617 | | 1.8 | | 21,601 | | 0.8 | | | |
| Stage 3 | | | | | | | | |
| Not collateralised | 8,122 | | 47.3 | | 2,979 | | 21.6 | | 732 | | 74.7 | | | |
| Fully collateralised | 2,278 | | 12.7 | | 1,212 | | 3.4 | | 240 | | 2.1 | | | |
| LTV ratio: | | | | | | | | |
| – less than 50% | 603 | | 20.9 | | 249 | | 4.8 | | 76 | | — | | | |
| – 51% to 75% | 1,110 | | 5.0 | | 786 | | 1.4 | | 110 | | 3.6 | | | |
| – 76% to 90% | 295 | | 11.5 | | 115 | | 9.6 | | 26 | | — | | | |
| – 91% to 100% | 270 | | 27.4 | | 62 | | 9.7 | | 28 | | 3.6 | | | |
| Partially collateralised (C): | 2,134 | | 38.7 | | 318 | | 35.5 | | 616 | | 28.9 | | | |
| – collateral value on C | 1,200 | | | 186 | | | 358 | | | | |
| Total | 12,534 | | 39.6 | | 4,509 | | 17.7 | | 1,588 | | 46.0 | | | |
| POCI | | | | | | | | |
| Not collateralised | 114 | | 36.0 | | 28 | | 21.4 | | 4 | | — | | | |
| Fully collateralised | 61 | | 34.4 | | — | | — | | 57 | | 36.8 | | | |
| LTV ratio: | | | | | | | | |
| – less than 50% | — | | — | | — | | — | | — | | — | | | |
| – 51% to 75% | 57 | | 36.8 | | — | | — | | 57 | | 36.8 | | | |
| – 76% to 90% | — | | — | | — | | — | | — | | — | | | |
| – 91% to 100% | 4 | | — | | — | | — | | — | | — | | | |
| Partially collateralised (D): | 2 | | 100.0 | | — | | — | | — | | — | | | |
| – collateral value on D | 2 | | | — | | | — | | | | |
| Total | 177 | | 36.2 | | 28 | | 21.4 | | 61 | | 34.4 | | | |
| At 31 Dec 2021 | 944,506 | | 0.8 | | 176,978 | | 0.9 | | 201,035 | | 0.5 | | | |
| | | | | | | | | | | | | | | | | | | | | | |
Wholesale lending – other corporate, commercial and financial (non-bank) loans and advances including loan commitments by level of collateral for key countries/territories (by stage) (continued) |
| (Audited) |
| | | Of which: |
| Total | UK | Hong Kong | |
| Gross carrying/nominal amount | ECL coverage | Gross carrying/nominal amount | ECL coverage | Gross carrying/nominal amount | ECL coverage | | |
| $m | % | $m | % | $m | % | | |
| Stage 1 | | | | | | | | |
| Not collateralised | 617,592 | | 0.2 | | 122,554 | | 0.4 | | 95,061 | | 0.1 | | | |
| Fully collateralised | 110,528 | | 0.2 | | 28,232 | | 0.3 | | 40,207 | | 0.1 | | | |
| LTV ratio: | | | | | | | | |
| – less than 50% | 37,991 | | 0.1 | | 7,367 | | 0.3 | | 14,744 | | 0.1 | | | |
| – 51% to 75% | 36,696 | | 0.2 | | 11,891 | | 0.3 | | 13,961 | | 0.2 | | | |
| – 76% to 90% | 13,542 | | 0.2 | | 2,624 | | 0.4 | | 6,522 | | 0.1 | | | |
| – 91% to 100% | 22,299 | | 0.1 | | 6,350 | | 0.1 | | 4,980 | | 0.1 | | | |
| Partially collateralised (A): | 52,892 | | 0.2 | | 6,826 | | 0.5 | | 19,163 | | 0.1 | | | |
| – collateral value on A | 25,903 | | | 3,524 | | | 9,208 | | | | |
| Total | 781,012 | | 0.2 | | 157,612 | | 0.4 | | 154,431 | | 0.1 | | | |
| Stage 2 | | | | | | | | |
| Not collateralised | 118,959 | | 1.6 | | 37,430 | | 2.6 | | 19,466 | | 0.4 | | | |
| Fully collateralised | 37,753 | | 1.3 | | 9,316 | | 2.1 | | 15,044 | | 0.8 | | | |
| LTV ratio: | | | | | | | | |
| – less than 50% | 11,992 | | 1.3 | | 2,498 | | 1.5 | | 3,920 | | 0.7 | | | |
| – 51% to 75% | 16,982 | | 1.6 | | 5,715 | | 2.2 | | 6,657 | | 1.0 | | | |
| – 76% to 90% | 3,727 | | 1.2 | | 502 | | 3.2 | | 2,150 | | 0.7 | | | |
| – 91% to 100% | 5,052 | | 0.9 | | 601 | | 2.0 | | 2,317 | | 0.3 | | | |
| Partially collateralised (B): | 16,829 | | 1.5 | | 3,984 | | 2.7 | | 3,849 | | 0.9 | | | |
| – collateral value on B | 9,425 | | | 1,714 | | | 2,104 | | | | |
| Total | 173,541 | | 1.5 | | 50,730 | | 2.5 | | 38,359 | | 0.6 | | | |
| Stage 3 | | | | | | | | |
| Not collateralised | 7,852 | | 50.0 | | 2,793 | | 28.5 | | 865 | | 66.0 | | | |
| Fully collateralised | 1,939 | | 17.3 | | 585 | | 7.9 | | 342 | | 6.4 | | | |
| LTV ratio: | | | | | | | | |
| – less than 50% | 637 | | 24.0 | | 151 | | 8.6 | | 83 | | 6.0 | | | |
| – 51% to 75% | 526 | | 19.0 | | 182 | | 12.6 | | 128 | | 4.7 | | | |
| – 76% to 90% | 294 | | 9.2 | | 211 | | 1.9 | | 49 | | 14.3 | | | |
| – 91% to 100% | 482 | | 11.6 | | 41 | | 14.6 | | 82 | | 4.9 | | | |
| Partially collateralised (C): | 2,847 | | 35.5 | | 553 | | 23.1 | | 592 | | 26.4 | | | |
| – collateral value on C | 1,619 | | | 337 | | | 322 | | | | |
| Total | 12,638 | | 41.7 | | 3,931 | | 24.7 | | 1,799 | | 41.6 | | | |
| POCI | | | | | | | | |
| Not collateralised | 211 | | 39.8 | | 54 | | 63.0 | | 1 | | — | | | |
| Fully collateralised | 63 | | 41.3 | | — | | — | | 45 | | 51.1 | | | |
| LTV ratio: | | | | | | | | |
| – less than 50% | 6 | | 50.0 | | — | | — | | — | | — | | | |
| – 51% to 75% | 11 | | 9.1 | | — | | — | | 11 | | 9.1 | | | |
| – 76% to 90% | 34 | | 64.7 | | — | | — | | 34 | | 64.7 | | | |
| – 91% to 100% | 12 | | — | | — | | — | | — | | — | | | |
| Partially collateralised (D): | 4 | | 75.0 | | — | | — | | — | | — | | | |
| – collateral value on D | 4 | | | — | | | — | | | | |
| Total | 278 | | 40.6 | | 54 | | 63.0 | | 46 | | 50.0 | | | |
| At 31 Dec 2020 | 967,469 | | 1.0 | | 212,327 | | 1.3 | | 194,635 | | 0.6 | | | |
| | | | | | | | | | | | | | | | | | | | | | |
Wholesale lending – other corporate, commercial and financial (non-bank) loans and advances including loan commitments by level of collateral for key countries/territories |
| (Audited) |
| | | Of which: |
| Total | UK | Hong Kong | |
| Gross carrying/nominal amount | ECL coverage | Gross carrying/nominal amount | ECL coverage | Gross carrying/nominal amount | ECL coverage | | |
| $m | % | $m | % | $m | % | | |
| Rated CRR/PD8 | | | | | | | | |
| Not collateralised | 4,790 | | 3.9 | | 1,587 | | 3.1 | | 79 | | 30.4 | | | |
| Fully collateralised | 1,653 | | 3.9 | | 259 | | 6.6 | | 32 | | — | | | |
| LTV ratio: | | | | | | | | |
| – less than 50% | 803 | | 3.5 | | 113 | | 6.2 | | 2 | | — | | | |
| – 51% to 75% | 583 | | 3.8 | | 110 | | 8.2 | | 1 | | — | | | |
| – 76% to 90% | 116 | | 5.2 | | 23 | | 4.3 | | 29 | | — | | | |
| – 91% to 100% | 151 | | 5.3 | | 13 | | — | | — | | — | | | |
| Partially collateralised (A): | 1,253 | | 3.7 | | 138 | | 8.0 | | 11 | | — | | | |
| – collateral value on A | 921 | | | 40 | | | 6 | | | | |
| Total | 7,696 | | 3.9 | | 1,984 | | 3.9 | | 122 | | 20.5 | | | |
| Rated CRR/PD9 to 10 | | | | | | | | |
| Not collateralised | 8,239 | | 47.1 | | 3,007 | | 21.5 | | 736 | | 74.3 | | | |
| Fully collateralised | 2,335 | | 13.3 | | 1,212 | | 3.4 | | 297 | | 9.1 | | | |
| LTV ratio: | | | | | | | | |
| – less than 50% | 604 | | 20.9 | | 249 | | 4.8 | | 75 | | — | | | |
| – 51% to 75% | 1,166 | | 6.7 | | 786 | | 1.4 | | 168 | | 14.9 | | | |
| – 76% to 90% | 295 | | 11.5 | | 115 | | 9.6 | | 26 | | — | | | |
| – 91% to 100% | 270 | | 27.4 | | 62 | | 9.7 | | 28 | | 3.6 | | | |
| Partially collateralised (B): | 2,137 | | 38.7 | | 318 | | 35.5 | | 616 | | 28.9 | | | |
| – collateral value on B | 1,203 | | | 186 | | | 358 | | | | |
| Total | 12,711 | | 39.5 | | 4,537 | | 17.7 | | 1,649 | | 45.6 | | | |
| At 31 Dec 2021 | 20,407 | | 26.1 | | 6,521 | | 13.5 | | 1,771 | | 43.8 | | | |
| | | | | | | | | | | | | | | | | | | | | | |
|
|
| | | |
| | | | |
| | | | | | | | |
| | | | | | | | |
| Rated CRR/PD8 | | | | | | | | |
| Not collateralised | 3,787 | | 7.1 | | 924 | | 8.7 | | 103 | | 25.2 | | | |
| Fully collateralised | 1,107 | | 5.2 | | 171 | | 9.4 | | 15 | | — | | | |
| LTV ratio: | | | | | | | | |
| – less than 50% | 269 | | 4.1 | | 29 | | 10.3 | | 1 | | — | | | |
| – 51% to 75% | 480 | | 6.3 | | 87 | | 6.9 | | — | | — | | | |
| – 76% to 90% | 140 | | 5.0 | | 13 | | 23.1 | | 14 | | — | | | |
| – 91% to 100% | 218 | | 4.1 | | 42 | | 9.5 | | — | | — | | | |
| Partially collateralised (A): | 493 | | 8.1 | | 174 | | 9.2 | | 27 | | 3.7 | | | |
| – collateral value on A | 352 | | | 83 | | | 13 | | | | |
| Total | 5,387 | | 6.8 | | 1,269 | | 8.7 | | 145 | | 18.6 | | | |
| Rated CRR/PD9 to 10 | | | | | | | | |
| Not collateralised | 8,062 | | 49.7 | | 2,847 | | 29.1 | | 865 | | 66.0 | | | |
| Fully collateralised | 2,003 | | 18.1 | | 585 | | 7.9 | | 388 | | 11.6 | | | |
| LTV ratio: | | | | | | | | |
| – less than 50% | 644 | | 24.2 | | 151 | | 8.6 | | 84 | | 6.0 | | | |
| – 51% to 75% | 538 | | 18.8 | | 182 | | 12.6 | | 139 | | 5.0 | | | |
| – 76% to 90% | 327 | | 15.0 | | 211 | | 1.9 | | 83 | | 34.9 | | | |
| – 91% to 100% | 494 | | 11.3 | | 41 | | 14.6 | | 82 | | 4.9 | | | |
| Partially collateralised (B): | 2,851 | | 35.6 | | 553 | | 23.1 | | 592 | | 26.4 | | | |
| – collateral value on B | 1,623 | | | 337 | | | 322 | | | | |
| Total | 12,916 | | 41.7 | | 3,985 | | 25.2 | | 1,845 | | 41.8 | | | |
| At 31 Dec 2020 | 18,303 | | 31.4 | | 5,254 | | 21.2 | | 1,990 | | 40.2 | | | |
Other credit risk exposures
In addition to collateralised lending, other credit enhancements are employed and methods used to mitigate credit risk arising from financial assets. These are summarised below:
•Some securities issued by governments, banks and other financial institutions benefit from additional credit enhancements provided by government guarantees that cover the assets.
•Debt securities issued by banks and financial institutions include asset-backed securities (‘ABSs’) and similar instruments, which are supported by underlying pools of financial assets. Credit risk associated with ABSs is reduced through the purchase of credit default swap (‘CDS’) protection.
•Trading loans and advances mainly pledged against cash collateral are posted to satisfy margin requirements. There is limited credit risk on cash collateral posted since in the event of
default of the counterparty this would be set off against the related liability. Reverse repos and stock borrowing are by their nature collateralised.
Collateral accepted as security that the Group is permitted to sell or repledge under these arrangements is described on page 386 of the financial statements.
•The Group’s maximum exposure to credit risk includes financial guarantees and similar contracts granted, as well as loan and other credit-related commitments. Depending on the terms of the arrangement, we may use additional credit mitigation if a guarantee is called upon or a loan commitment is drawn and subsequently defaults.
For further information on these arrangements, see Note 32 on the financial statements.
Derivatives
We participate in transactions exposing us to counterparty credit risk. Counterparty credit risk is the risk of financial loss if the counterparty to a transaction defaults before satisfactorily settling it. It arises principally from over-the-counter (‘OTC’) derivatives and securities financing transactions and is calculated in both the trading and non-trading books. Transactions vary in value by reference to a market factor such as an interest rate, exchange rate or asset price.
The counterparty risk from derivative transactions is taken into account when reporting the fair value of derivative positions. The adjustment to the fair value is known as the credit valuation adjustment (‘CVA’).
For an analysis of CVAs, see Note 12 on the financial statements.
The following table reflects by risk type the fair values and gross notional contract amounts of derivatives cleared through an exchange, central counterparty or non-central counterparty.
| | | | | | | | | | | | | | | | | | | | |
| Notional contract amounts and fair values of derivatives |
| 2021 | 2020 |
| Notional | Fair value | Notional | Fair value |
| amount | Assets | Liabilities | amount | Assets | Liabilities |
| $m | $m | $m | $m | $m | $m |
| Total OTC derivatives | 21,964,665 | | 246,108 | | 241,136 | | 22,749,280 | | 372,373 | | 368,010 | |
| – total OTC derivatives cleared by central counterparties | 10,086,344 | | 59,147 | | 60,686 | | 9,898,260 | | 74,054 | | 75,253 | |
| – total OTC derivatives not cleared by central counterparties | 11,878,321 | | 186,961 | | 180,450 | | 12,851,020 | | 298,319 | | 292,757 | |
| Total exchange traded derivatives | 1,359,692 | | 4,152 | | 3,306 | | 1,332,438 | | 4,456 | | 4,094 | |
| Gross | 23,324,357 | | 250,260 | | 244,442 | | 24,081,718 | | 376,829 | | 372,104 | |
| Offset | | (53,378) | | (53,378) | | | (69,103) | | (69,103) | |
| At 31 Dec | | 196,882 | | 191,064 | | | 307,726 | | 303,001 | |
The purposes for which HSBC uses derivatives are described in Note 15 on the financial statements.
The International Swaps and Derivatives Association (‘ISDA’) master agreement is our preferred agreement for documenting derivatives activity. It is common, and our preferred practice, for the parties involved in a derivative transaction to execute a credit support annex (‘CSA’) in conjunction with the ISDA master agreement. Under a CSA, collateral is passed between the parties to mitigate the counterparty risk inherent in outstanding positions. The majority of our CSAs are with financial institutional clients.
We manage the counterparty exposure on our OTC derivative contracts by using collateral agreements with counterparties and netting agreements. Currently, we do not actively manage our general OTC derivative counterparty exposure in the credit markets, although we may manage individual exposures in certain circumstances.
We place strict policy restrictions on collateral types and as a consequence the types of collateral received and pledged are, by value, highly liquid and of a strong quality, being predominantly cash.
Where a collateral type is required to be approved outside the collateral policy, approval is required from a committee of senior representatives from Markets, Legal and Risk.
See page 406 and Note 30 on the financial statements for details regarding legally enforceable right of offset in the event of counterparty default and collateral received in respect of derivatives.
Personal lending
This section presents further disclosures related to personal lending. It provides details of the regions, countries and products that are driving the change observed in personal loans and advances to customers, with the impact of foreign exchange separately identified. Additionally, Hong Kong and UK mortgage book LTV data is provided.
This section also provides a reconciliation of the opening 1 January 2021 to 31 December 2021 closing gross carrying/nominal amounts and associated allowance for ECL. Further product granularity is also provided by stage, with geographical data presented for loans and advances to customers, loan and other credit-related commitments and financial guarantees.
At 31 December 2021, total personal lending for loans and advances to customers of $478bn increased by $17.5bn compared with 31 December 2020. This increase included adverse foreign exchange movements of $6.4bn. Excluding foreign exchange movements, there was growth of $24.0bn, primarily driven by $11.4bn in Asia and $10.2bn in Europe. The allowance for ECL attributable to personal lending, excluding off-balance sheet loan commitments and guarantees and foreign exchange movements, decreased $1.5bn to $3.1bn at 31 December 2021.
Excluding foreign exchange movements, total personal lending was primarily driven by mortgage growth, which grew by $22.8bn. Mortgages grew $10.1bn in the UK; $9.9bn in Asia, notably $6.6bn in Hong Kong and $2.1bn in Australia; and $3.4bn in Canada. This was partly offset by a decrease of $1.8bn due to domestic mass market retail banking in the US being reclassified to assets held for sale. The allowance for ECL, excluding foreign exchange, attributable to mortgages of $0.7bn decreased by $0.1bn compared with 31 December 2020.
The quality of both our Hong Kong and UK mortgage books remained high, with low levels of impairment allowances. The average LTV ratio on new mortgage lending in Hong Kong was 62%, compared with an estimated 47% for the overall mortgage portfolio. The average LTV ratio on new lending in the UK was 67%, compared with an estimated 51% for the overall mortgage portfolio.
Excluding foreign exchange movements, other personal lending balances at 31 December 2021 increased by $1.2bn compared with 31 December 2020, mainly from unsecured personal lending in Hong Kong (up $1.0bn) and in Latin America (up $0.7bn), as well as from guaranteed loans in respect of residential property in France (up $0.8bn). These were offset by a decrease in credit cards mainly in the US (down $0.9bn).
The allowance for ECL, excluding foreign exchange, attributable to other personal lending of $2.4bn decreased by $1.5bn compared with 31 December 2020. Excluding foreign exchange, the allowance for ECL attributable to credit cards decreased by $0.9bn while unsecured personal lending decreased by $0.6bn.
| | | | | | | | | | | | | | | | | | | | | | | | | | |
| Total personal lending for loans and advances to customers at amortised cost by stage distribution |
| Gross carrying amount | Allowance for ECL |
| Stage 1 | Stage 2 | Stage 3 | Total | Stage 1 | Stage 2 | Stage 3 | Total |
| $m | $m | $m | $m | $m | $m | $m | $m |
| By portfolio | | | | | | | | |
| First lien residential mortgages | 360,686 | | 7,637 | | 3,045 | | 371,368 | | (128) | | (131) | | (416) | | (675) | |
| | | | | | | | |
| – of which: interest only (including offset) | 28,506 | | 1,795 | | 255 | | 30,556 | | (5) | | (24) | | (81) | | (110) | |
| – affordability (including US adjustable rate mortgages) | 13,621 | | 712 | | 452 | | 14,785 | | (6) | | (6) | | (5) | | (17) | |
| Other personal lending | 96,270 | | 8,802 | | 1,897 | | 106,969 | | (530) | | (1,088) | | (810) | | (2,428) | |
| – second lien residential mortgages | 314 | | 44 | | 37 | | 395 | | (1) | | (4) | | (9) | | (14) | |
| – guaranteed loans in respect of residential property | 20,643 | | 731 | | 236 | | 21,610 | | (9) | | (7) | | (42) | | (58) | |
| – other personal lending which is secured | 36,533 | | 1,096 | | 366 | | 37,995 | | (21) | | (15) | | (120) | | (156) | |
| – credit cards | 18,623 | | 3,897 | | 338 | | 22,858 | | (246) | | (675) | | (214) | | (1,135) | |
| – other personal lending which is unsecured | 18,743 | | 2,820 | | 915 | | 22,478 | | (240) | | (378) | | (421) | | (1,039) | |
| – motor vehicle finance | 1,414 | | 214 | | 5 | | 1,633 | | (13) | | (9) | | (4) | | (26) | |
| – IPO loans | — | | — | | — | | — | | — | | — | | — | | — | |
| At 31 Dec 2021 | 456,956 | | 16,439 | | 4,942 | | 478,337 | | (658) | | (1,219) | | (1,226) | | (3,103) | |
| By geography | | | | | | | | |
| Europe | 212,284 | | 5,639 | | 2,148 | | 220,071 | | (199) | | (499) | | (637) | | (1,335) | |
| – of which: UK | 176,547 | | 4,668 | | 1,488 | | 182,703 | | (167) | | (480) | | (399) | | (1,046) | |
| Asia | 187,391 | | 7,796 | | 1,303 | | 196,490 | | (158) | | (381) | | (226) | | (765) | |
| – of which: Hong Kong | 125,854 | | 4,959 | | 202 | | 131,015 | | (65) | | (231) | | (43) | | (339) | |
| MENA | 4,965 | | 252 | | 202 | | 5,419 | | (38) | | (40) | | (94) | | (172) | |
| North America | 43,489 | | 2,126 | | 1,005 | | 46,620 | | (43) | | (67) | | (118) | | (228) | |
| Latin America | 8,827 | | 626 | | 284 | | 9,737 | | (220) | | (232) | | (151) | | (603) | |
| At 31 Dec 2021 | 456,956 | | 16,439 | | 4,942 | | 478,337 | | (658) | | (1,219) | | (1,226) | | (3,103) | |
| | | | | | | | | | | | | | | | | | | | | | | | | | |
| Total personal lending for loans and other credit-related commitments and financial guarantees by stage distribution |
| Nominal amount | Allowance for ECL |
| Stage 1 | Stage 2 | Stage 3 | Total | Stage 1 | Stage 2 | Stage 3 | Total |
| $m | $m | $m | $m | $m | $m | $m | $m |
| Europe | 57,109 | | 558 | | 107 | | 57,774 | | (11) | | (1) | | — | | (12) | |
| – of which: UK | 54,704 | | 407 | | 104 | | 55,215 | | (10) | | (1) | | — | | (11) | |
| Asia | 160,248 | | 894 | | 21 | | 161,163 | | — | | — | | — | | — | |
| – of which: Hong Kong | 121,597 | | 292 | | 19 | | 121,908 | | — | | — | | — | | — | |
| MENA | 2,568 | | 30 | | 16 | | 2,614 | | (5) | | — | | — | | (5) | |
| North America | 15,039 | | 251 | | 23 | | 15,313 | | (15) | | (1) | | — | | (16) | |
| Latin America | 3,920 | | 29 | | 2 | | 3,951 | | (6) | | — | | — | | (6) | |
| At 31 Dec 2021 | 238,884 | | 1,762 | | 169 | | 240,815 | | (37) | | (2) | | — | | (39) | |
| | | | | | | | | | | | | | | | | | | | | | | | | | | |
Total personal lending for loans and advances to customers at amortised cost by stage distribution (continued)1 | |
| Gross carrying amount | Allowance for ECL | |
| Stage 1 | Stage 2 | Stage 3 | Total | Stage 1 | Stage 2 | Stage 3 | Total | |
| $m | $m | $m | $m | $m | $m | $m | $m | |
| By portfolio | | | | | | | | | |
| First lien residential mortgages | 336,666 | | 12,233 | | 3,383 | | 352,282 | | (125) | | (188) | | (442) | | (755) | | |
| – of which: interest only (including offset) | 29,143 | | 3,074 | | 351 | | 32,568 | | (9) | | (19) | | (88) | | (116) | | |
| – affordability (including US adjustable rate mortgages) | 13,265 | | 2,209 | | 606 | | 16,080 | | (11) | | (11) | | (5) | | (27) | | |
| Other personal lending | 93,468 | | 12,831 | | 2,228 | | 108,527 | | (702) | | (2,214) | | (1,060) | | (3,976) | | |
| – second lien residential mortgages | 593 | | 100 | | 51 | | 744 | | (3) | | (9) | | (10) | | (22) | | |
| – guaranteed loans in respect of residential property | 21,558 | | 835 | | 159 | | 22,552 | | (4) | | (7) | | (32) | | (43) | | |
| – other personal lending which is secured | 36,230 | | 1,357 | | 448 | | 38,035 | | (13) | | (19) | | (127) | | (159) | | |
| – credit cards | 17,327 | | 5,292 | | 680 | | 23,299 | | (386) | | (1,281) | | (380) | | (2,047) | | |
| – other personal lending which is unsecured | 16,338 | | 5,096 | | 882 | | 22,316 | | (288) | | (888) | | (506) | | (1,682) | | |
| – motor vehicle finance | 1,374 | | 151 | | 8 | | 1,533 | | (8) | | (10) | | (5) | | (23) | | |
| – IPO loans | 48 | | — | | — | | 48 | | — | | — | | — | | — | | |
| At 31 Dec 2020 | 430,134 | | 25,064 | | 5,611 | | 460,809 | | (827) | | (2,402) | | (1,502) | | (4,731) | | |
| By geography | | | | | | | | | |
| Europe | 200,120 | | 11,032 | | 2,511 | | 213,663 | | (247) | | (1,271) | | (826) | | (2,344) | | |
| – of which: UK | 163,338 | | 9,476 | | 1,721 | | 174,535 | | (223) | | (1,230) | | (545) | | (1,998) | | |
| Asia | 178,175 | | 7,969 | | 1,169 | | 187,313 | | (234) | | (446) | | (241) | | (921) | | |
| – of which: Hong Kong | 118,252 | | 5,133 | | 206 | | 123,591 | | (102) | | (237) | | (48) | | (387) | | |
| MENA | 4,879 | | 403 | | 251 | | 5,533 | | (54) | | (112) | | (152) | | (318) | | |
| North America | 40,387 | | 4,613 | | 1,378 | | 46,378 | | (93) | | (200) | | (132) | | (425) | | |
| Latin America | 6,573 | | 1,047 | | 302 | | 7,922 | | (199) | | (373) | | (151) | | (723) | | |
| At 31 Dec 2020 | 430,134 | | 25,064 | | 5,611 | | 460,809 | | (827) | | (2,402) | | (1,502) | | (4,731) | | |
1 During the period, the Group has re-presented the other personal lending with additional granularity.
| | | | | | | | | | | | | | | | | | | | | | | | | | |
| Total personal lending for loans and other credit-related commitments and financial guarantees by stage distribution (continued) |
| Nominal amount | Allowance for ECL |
| Stage 1 | Stage 2 | Stage 3 | Total | Stage 1 | Stage 2 | Stage 3 | Total |
| $m | $m | $m | $m | $m | $m | $m | $m |
| Europe | 56,920 | | 719 | | 96 | | 57,735 | | (22) | | (2) | | — | | (24) | |
| – of which: UK | 54,348 | | 435 | | 92 | | 54,875 | | (21) | | (2) | | — | | (23) | |
| Asia | 156,057 | | 790 | | 11 | | 156,858 | | — | | — | | — | | — | |
| – of which: Hong Kong | 118,529 | | 10 | | 10 | | 118,549 | | — | | — | | — | | — | |
| MENA | 2,935 | | 46 | | 8 | | 2,989 | | (1) | | — | | — | | (1) | |
| North America | 15,835 | | 124 | | 38 | | 15,997 | | (11) | | — | | — | | (11) | |
| Latin America | 3,462 | | 28 | | 1 | | 3,491 | | (5) | | — | | — | | (5) | |
| At 31 Dec 2020 | 235,209 | | 1,707 | | 154 | | 237,070 | | (39) | | (2) | | — | | (41) | |
Exposure to UK interest-only mortgage loans
The following information is presented for HSBC branded UK interest-only mortgage loans with balances of $15.2bn. This excludes offset mortgages in the first direct brand and Private Bank mortgages.
At the end of 2021, the average LTV ratio in the portfolio was 40% and 99% of mortgages had an LTV ratio of 75% or less.
Of the interest-only mortgage loans that expired in 2019, 89%
were repaid within 12 months of expiry with a total of 91% being repaid within 24 months of expiry. For those expiring during 2020, 73% were repaid within 12 months of expiry. The drop in the amount fully repaid within the 12 months is explained by the extensions granted as part of the FCA guidance on helping borrowers with maturing interest-only mortgages during the pandemic that ended in October 2021. Excluding the extensions, only $3.9m remains outstanding.
The profile of maturing UK interest-only loans is as follows:
| | | | | |
| UK interest-only mortgage loans |
| $m |
| Expired interest-only mortgage loans | 167 | |
| Interest-only mortgage loans by maturity | |
| – 2022 | 267 | |
| – 2023 | 401 | |
| – 2024 | 330 | |
| – 2025 | 420 | |
| – 2026–2030 | 3,288 | |
| – post-2030 | 10,333 | |
| At 31 Dec 2021 | 15,206 | |
| | | | | |
|
| |
| Expired interest-only mortgage loans | 169 | |
| Interest-only mortgage loans by maturity | |
| – 2021 | 356 | |
| – 2022 | 392 | |
| – 2023 | 500 | |
| – 2024 | 407 | |
| – 2025–2029 | 3,317 | |
| – post-2030 | 9,914 | |
| At 31 Dec 2020 | 15,055 | |
Exposure to offset mortgage in first direct
The offset mortgage in first direct is a flexible way for our customers to take control of their finances. It works by grouping together the customer’s mortgage, savings and current accounts to offset their credit and debit balances against their mortgage exposure.
At 31 December 2021, exposures were worth a total $7.0bn with an average LTV ratio of 35% (31 December 2020: $8.6bn exposure and 37% LTV ratio).
| | | | | | | | | | | | | | | | | | | | | | | | | | |
Personal lending – reconciliation of changes in gross carrying/nominal amount and allowances for loans and advances to customers including loan commitments and financial guarantees |
| (Audited) | | |
| Non-credit impaired | Credit impaired | |
| Stage 1 | Stage 2 | Stage 3 | Total |
| Gross carrying/ nominal amount | Allowance for ECL | Gross carrying/ nominal amount | Allowance for ECL | Gross carrying/ nominal amount | Allowance for ECL | Gross carrying/ nominal amount | Allowance for ECL |
| $m | $m | $m | $m | $m | $m | $m | $m |
| At 1 Jan 2021 | 665,346 | | (866) | | 26,770 | | (2,405) | | 5,762 | | (1,503) | | 697,878 | | (4,774) | |
| Transfers of financial instruments | 1,822 | | (1,154) | | (4,502) | | 1,713 | | 2,680 | | (559) | | — | | — | |
| | | | | | | | |
| | | | | | | | |
| | | | | | | | |
| | | | | | | | |
| Net remeasurement of ECL arising from transfer of stage | — | | 825 | | — | | (363) | | — | | (7) | | — | | 455 | |
| | | | | | | | |
| | | | | | | | |
| | | | | | | | |
| | | | | | | | |
| Net new and further lending/repayments | 39,946 | | 148 | | (2,877) | | 533 | | (1,517) | | 270 | | 35,552 | | 951 | |
| Change in risk parameters – credit quality | — | | 318 | | — | | (778) | | — | | (1,007) | | — | | (1,467) | |
| Changes to models used for ECL calculation | — | | (2) | | — | | — | | — | | 1 | | — | | (1) | |
| Assets written off | — | | — | | — | | — | | (1,525) | | 1,520 | | (1,525) | | 1,520 | |
| | | | | | | | |
Foreign exchange and other1 | (11,274) | | 36 | | (1,190) | | 79 | | (289) | | 59 | | (12,753) | | 174 | |
| | | | | | | | |
| | | | | | | | |
| At 31 Dec 2021 | 695,840 | | (695) | | 18,201 | | (1,221) | | 5,111 | | (1,226) | | 719,152 | | (3,142) | |
| ECL income statement change for the period | | 1,289 | | | (608) | | | (743) | | | (62) | |
| Recoveries | | | | | | | | 355 | |
| | | | | | | | |
| | | | | | | | |
| | | | | | | | |
| Other | | | | | | | | (9) | |
| Total ECL income statement change for the period | | | | | | | | 284 | |
1 Total includes $3.0bn of gross carrying loans and advances to customers, which were classified to assets held for sale and a corresponding allowance for ECL of $123m, reflecting our exit of the domestic mass market retail banking in the US.
As shown in the above table, the allowance for ECL for loans and advances to customers and relevant loan commitments and financial guarantees decreased $1,632m during the period from $4,774m at 31 December 2020 to $3,142m at 31 December 2021.
This decrease was primarily driven by:
•$1,520m of assets written off;
•$951m relating to volume movements, which included the ECL allowance associated with new originations, assets derecognised and further lending/repayment;
•$455m relating to the net remeasurement impact of stage transfers; and
•foreign exchange and other movements of $174m.
These were partly offset by:
•$1,467m relating to underlying credit quality changes, including
the credit quality impact of financial instruments transferring between stages.
The ECL charge for the period of $62m presented in the above table consisted of $1,467m relating to underlying credit quality changes, including the credit quality impact of financial instruments transferring between stages. This was partly offset by $951m relating to underlying net book volume movements and $455m relating to the net remeasurement impact of stage transfers.
The net transfer of gross carrying/nominal amounts to stage 1 of $1,822m reflects the overall improvement in the economic outlook as the effects of the Covid-19 outbreak subsided. It was primarily driven by $2,854m in Europe and $1,074m in North America, and was partly offset by a net transfer out of stage 1 of $2,346m in Asia, mainly driven by management judgemental adjustments primarily in Hong Kong during 1H21.
| | | | | | | | | | | | | | | | | | | | | | | | | | |
Personal lending – reconciliation of changes in gross carrying/nominal amount and allowances for loans and advances to customers including loan commitments and financial guarantees |
| (Audited) |
| Non-credit impaired | Credit impaired | |
| Stage 1 | Stage 2 | Stage 3 | Total |
| Gross carrying/ nominal amount | Allowance for ECL | Gross carrying/ nominal amount | Allowance for ECL | Gross carrying/ nominal amount | Allowance for ECL | Gross carrying/ nominal amount | Allowance for ECL |
| $m | $m | $m | $m | $m | $m | $m | $m |
| At 1 Jan 2020 | 635,961 | | (597) | | 17,382 | | (1,338) | | 5,046 | | (1,215) | | 658,389 | | (3,150) | |
| Transfers of financial instruments | (16,019) | | (629) | | 13,370 | | 1,181 | | 2,649 | | (552) | | — | | — | |
| Net remeasurement of ECL arising from transfer of stage | — | | 431 | | — | | (555) | | — | | (8) | | — | | (132) | |
| Net new and further lending/repayments | 30,891 | | 101 | | (5,407) | | 408 | | (677) | | 150 | | 24,807 | | 659 | |
| Change in risk parameters – credit quality | — | | (147) | | — | | (2,025) | | — | | (1,258) | | — | | (3,430) | |
| Changes to models used for ECL calculation | — | | (3) | | — | | (9) | | — | | 5 | | — | | (7) | |
| Assets written off | — | | — | | — | | — | | (1,409) | | 1,407 | | (1,409) | | 1,407 | |
| Foreign exchange and other | 14,513 | | (22) | | 1,425 | | (67) | | 153 | | (32) | | 16,091 | | (121) | |
| At 31 Dec 2020 | 665,346 | | (866) | | 26,770 | | (2,405) | | 5,762 | | (1,503) | | 697,878 | | (4,774) | |
| ECL income statement change for the period | | 382 | | | (2,181) | | | (1,111) | | | (2,910) | |
| Recoveries | | | | | | | | 280 | |
| Other | | | | | | | | (25) | |
| Total ECL income statement change for the period | | | | | | | | (2,655) | |
| | | | | | | | |
| | | | | | | | |
| | | | | | | | |
| | | | | | | | |
| | | | | | | | |
| | | | | | | | |
| | | | | | | | |
| | | | | | | | |
| | | | | | | | |
| | | | | | | | |
| | | | | | | | |
| | | | | | | | |
| | | | | | | | |
| | | | | | | | |
| | | | | | | | | | | | | | | | | | | | | | | | | | | | | | | | |
| Personal lending – credit risk profile by internal PD band for loans and advances to customers at amortised cost |
| | Gross carrying amount | Allowance for ECL | |
| PD range1 | Stage 1 | Stage 2 | Stage 3 | Total | Stage 1 | Stage 2 | Stage 3 | Total | ECL coverage |
| % | $m | $m | $m | $m | $m | $m | $m | $m | % |
| First lien residential mortgages | | 360,686 | | 7,637 | | 3,045 | | 371,368 | | (128) | | (131) | | (416) | | (675) | | 0.2 | |
| – Band 1 | 0.000 to 0.250 | 310,042 | | 451 | | — | | 310,493 | | (30) | | (5) | | — | | (35) | | — | |
| – Band 2 | 0.251 to 0.500 | 19,741 | | 203 | | — | | 19,944 | | (7) | | (2) | | — | | (9) | | — | |
| – Band 3 | 0.501 to 1.500 | 25,835 | | 1,936 | | — | | 27,771 | | (79) | | (8) | | — | | (87) | | 0.3 | |
| – Band 4 | 1.501 to 5.000 | 4,976 | | 2,657 | | — | | 7,633 | | (12) | | (30) | | — | | (42) | | 0.6 | |
| – Band 5 | 5.001 to 20.000 | 88 | | 1,416 | | — | | 1,504 | | — | | (35) | | — | | (35) | | 2.3 | |
| – Band 6 | 20.001 to 99.999 | 4 | | 974 | | — | | 978 | | — | | (51) | | — | | (51) | | 5.2 | |
| – Band 7 | 100.000 | — | | — | | 3,045 | | 3,045 | | — | | — | | (416) | | (416) | | 13.7 | |
| Other personal lending | | 96,270 | | 8,802 | | 1,897 | | 106,969 | | (530) | | (1,088) | | (810) | | (2,428) | | 2.3 | |
| – Band 1 | 0.000 to 0.250 | 45,049 | | 187 | | — | | 45,236 | | (50) | | (13) | | — | | (63) | | 0.1 | |
| – Band 2 | 0.251 to 0.500 | 12,625 | | 605 | | — | | 13,230 | | (27) | | (6) | | — | | (33) | | 0.2 | |
| – Band 3 | 0.501 to 1.500 | 22,791 | | 1,518 | | — | | 24,309 | | (102) | | (30) | | — | | (132) | | 0.5 | |
| – Band 4 | 1.501 to 5.000 | 13,006 | | 2,360 | | — | | 15,366 | | (213) | | (108) | | — | | (321) | | 2.1 | |
| – Band 5 | 5.001 to 20.000 | 2,732 | | 3,257 | | — | | 5,989 | | (138) | | (554) | | — | | (692) | | 11.6 | |
| – Band 6 | 20.001 to 99.999 | 67 | | 875 | | — | | 942 | | — | | (377) | | — | | (377) | | 40.0 | |
| – Band 7 | 100.000 | — | | — | | 1,897 | | 1,897 | | — | | — | | (810) | | (810) | | 42.7 | |
| At 31 Dec 2021 | | 456,956 | | 16,439 | | 4,942 | | 478,337 | | (658) | | (1,219) | | (1,226) | | (3,103) | | 0.6 | |
| | | | | | | | | | | | | | | | | | | | | | | | | | | | | | | | | | |
|
| | | | |
| | | | | | | | | | | | |
| | | | | | | | | | | | |
| First lien residential mortgages | | 336,666 | | 12,233 | | 3,383 | | | 352,282 | | (125) | | (188) | | (442) | | | (755) | | 0.2 | |
| – Band 1 | 0.000 to 0.250 | 284,252 | | 1,283 | | — | | | 285,535 | | (36) | | (3) | | — | | | (39) | | — | |
| – Band 2 | 0.251 to 0.500 | 16,259 | | 302 | | — | | | 16,561 | | (9) | | (3) | | — | | | (12) | | 0.1 | |
| – Band 3 | 0.501 to 1.500 | 27,055 | | 1,755 | | — | | | 28,810 | | (64) | | (8) | | — | | | (72) | | 0.2 | |
| – Band 4 | 1.501 to 5.000 | 8,858 | | 5,134 | | — | | | 13,992 | | (15) | | (32) | | — | | | (47) | | 0.3 | |
| – Band 5 | 5.001 to 20.000 | 238 | | 1,806 | | — | | | 2,044 | | (1) | | (41) | | — | | | (42) | | 2.1 | |
| – Band 6 | 20.001 to 99.999 | 4 | | 1,953 | | — | | | 1,957 | | — | | (101) | | — | | | (101) | | 5.2 | |
| – Band 7 | 100.000 | — | | — | | 3,383 | | | 3,383 | | — | | — | | (442) | | | (442) | | 13.1 | |
| Other personal lending | | 93,468 | | 12,831 | | 2,228 | | | 108,527 | | (702) | | (2,214) | | (1,060) | | | (3,976) | | 3.7 | |
| – Band 1 | 0.000 to 0.250 | 41,565 | | 589 | | — | | | 42,154 | | (96) | | (8) | | — | | | (104) | | 0.2 | |
| – Band 2 | 0.251 to 0.500 | 13,053 | | 518 | | — | | | 13,571 | | (31) | | (63) | | — | | | (94) | | 0.7 | |
| – Band 3 | 0.501 to 1.500 | 23,802 | | 1,280 | | — | | | 25,082 | | (108) | | (37) | | — | | | (145) | | 0.6 | |
| – Band 4 | 1.501 to 5.000 | 11,787 | | 2,175 | | — | | | 13,962 | | (270) | | (112) | | — | | | (382) | | 2.7 | |
| – Band 5 | 5.001 to 20.000 | 3,234 | | 5,288 | | — | | | 8,522 | | (197) | | (821) | | — | | | (1,018) | | 11.9 | |
| – Band 6 | 20.001 to 99.999 | 27 | | 2,981 | | — | | | 3,008 | | — | | (1,173) | | — | | | (1,173) | | 39.0 | |
| – Band 7 | 100.000 | — | | — | | 2,228 | | | 2,228 | | — | | — | | (1,060) | | | (1,060) | | 47.6 | |
| At 31 Dec 2020 | | 430,134 | | 25,064 | | 5,611 | | | 460,809 | | (827) | | (2,402) | | (1,502) | | | (4,731) | | 1.0 | |
1 12-month point in time adjusted for multiple economic scenarios.
Collateral on loans and advances
(Audited)
The following table provides a quantification of the value of fixed charges we hold over specific assets where we have a history of enforcing, and are able to enforce, collateral in satisfying a debt in the event of the borrower failing to meet its contractual
obligations, and where the collateral is cash or can be realised by sale in an established market. The collateral valuation excludes any adjustments for obtaining and selling the collateral and, in particular, loans shown as not collateralised or partially collateralised may also benefit from other forms of credit mitigants.
| | | | | | | | | | | | | | | | | | | | | | |
| Personal lending – residential mortgage loans including loan commitments by level of collateral for key countries/territories by stage |
| (Audited) |
| | | Of which: |
| Total | UK | Hong Kong | |
| Gross carrying/nominal amount | ECL coverage | Gross carrying/nominal amount | ECL coverage | Gross carrying/nominal amount | ECL coverage | | |
| $m | % | $m | % | $m | % | | |
| Stage 1 | | | | | | | | |
| Fully collateralised | 377,454 | | — | | 168,737 | | — | | 98,020 | | — | | | |
| LTV ratio: | | | | | | | | |
| – less than 50% | 190,370 | | — | | 81,582 | | — | | 61,234 | | — | | | |
| – 51% to 60% | 64,217 | | — | | 28,555 | | — | | 12,070 | | — | | | |
| – 61% to 70% | 51,842 | | — | | 25,949 | | — | | 4,649 | | — | | | |
| – 71% to 80% | 46,932 | | 0.1 | | 24,114 | | — | | 8,360 | | — | | | |
| – 81% to 90% | 18,778 | | 0.1 | | 7,899 | | — | | 8,420 | | — | | | |
| – 91% to 100% | 5,315 | | 0.1 | | 638 | | — | | 3,287 | | — | | | |
| Partially collateralised (A): | 682 | | 0.3 | 358 | | — | | 30 | | — | | | |
| LTV ratio: | | | | | | | | |
| – 101% to 110% | 254 | | 0.6 | 104 | | — | | 26 | | — | | | |
| – 111% to 120% | 98 | | 0.4 | 60 | | — | | 1 | | — | | | |
| – greater than 120% | 330 | | 0.1 | 194 | | — | | 3 | | — | | | |
| – collateral value on A | 484 | | | 235 | | | 28 | | | | |
| Total | 378,136 | | — | | 169,095 | | — | | 98,050 | | — | | | |
| Stage 2 | | | | | | | | |
| Fully collateralised | 7,710 | | 1.7 | 2,738 | | 2.1 | 1,166 | | — | | | |
| LTV ratio: | | | | | | | | |
| – less than 50% | 4,380 | | 1.5 | 1,846 | | 1.6 | 905 | | — | | | |
| – 51% to 60% | 1,317 | | 1.4 | 397 | | 2.4 | 106 | | — | | | |
| – 61% to 70% | 1,016 | | 1.6 | 282 | | 3.0 | 34 | | — | | | |
| – 71% to 80% | 725 | | 2.3 | 175 | | 4.7 | 50 | | — | | | |
| – 81% to 90% | 208 | | 4.3 | 32 | | 5.6 | 58 | | — | | | |
| – 91% to 100% | 64 | | 4.1 | 6 | | 1.9 | 13 | | — | | | |
| Partially collateralised (B): | 24 | | 13.6 | 3 | | 7.7 | — | | — | | | |
| LTV ratio: | | | | | | | | |
| – 101% to 110% | 7 | | 18.6 | 1 | | 1.0 | — | | — | | | |
| – 111% to 120% | 8 | | 16.6 | — | | — | — | | — | | | |
| – greater than 120% | 9 | | 6.7 | 2 | | 11.1 | — | | — | | | |
| – collateral value on B | 20 | | | 2 | | | — | | | | |
| Total | 7,734 | | 1.7 | 2,741 | | 2.1 | 1,166 | | — | | | |
| Stage 3 | | | | | | | | |
| Fully collateralised | 2,853 | | 11.5 | 954 | | 14.2 | 68 | | 0.3 | | | |
| LTV ratio: | | | | | | | | |
| – less than 50% | 1,490 | | 9.2 | 635 | | 13.0 | 48 | | 0.5 | | | |
| – 51% to 60% | 443 | | 8.6 | 129 | | 14.0 | 10 | | 0.1 | | | |
| – 61% to 70% | 371 | | 10.9 | 79 | | 16.2 | 2 | | 0.1 | | | |
| – 71% to 80% | 256 | | 15.4 | 67 | | 19.1 | 3 | | — | | | |
| – 81% to 90% | 171 | | 20.4 | 21 | | 25.2 | 4 | | — | | | |
| – 91% to 100% | 122 | | 32.2 | 23 | | 18.6 | 1 | | — | | | |
| Partially collateralised (C): | 220 | | 39.6 | 7 | | 30.8 | — | | — | | | |
| LTV ratio: | | | | | | | | |
| – 101% to 110% | 56 | | 27.5 | 4 | | 22.3 | — | | — | | | |
| – 111% to 120% | 29 | | 29.2 | — | | — | — | | — | | | |
| – greater than 120% | 135 | | 46.9 | 3 | | 45.5 | — | | — | | | |
| – collateral value on C | 143 | | | 6 | | | — | | | | |
| Total | 3,073 | | 13.5 | 961 | | 14.4 | 68 | | 0.3 | | | |
| At 31 Dec 2021 | 388,943 | | 0.2 | 172,797 | | 0.1 | 99,284 | | — | | | |
| | | | | | | | | | | | | | | | | | | | | | |
Personal lending – residential mortgage loans including loan commitments by level of collateral for key countries/territories by stage (continued) |
| (Audited) |
| | | Of which: |
| Total | UK | Hong Kong | |
| Gross carrying/nominal amount | ECL coverage | Gross carrying/nominal amount | ECL coverage | Gross carrying/nominal amount | ECL coverage | | |
| $m | % | $m | % | $m | % | | |
| Stage 1 | | | | | | | | |
| Fully collateralised | 354,102 | | — | | 159,562 | | — | | 90,733 | | — | | | |
| LTV ratio: | | | | | | | | |
| – less than 50% | 174,370 | | — | | 76,535 | | — | | 54,866 | | — | | | |
| – 51% to 60% | 60,180 | | — | | 23,967 | | — | | 14,253 | | — | | | |
| – 61% to 70% | 48,159 | | — | | 23,381 | | — | | 6,042 | | — | | | |
| – 71% to 80% | 40,395 | | 0.1 | | 20,846 | | — | | 4,288 | | — | | | |
| – 81% to 90% | 23,339 | | 0.1 | | 12,936 | | — | | 6,837 | | — | | | |
| – 91% to 100% | 7,659 | | 0.1 | | 1,897 | | 0.1 | | 4,447 | | — | | | |
| Partially collateralised (A): | 973 | | 0.4 | | 289 | | — | | 336 | | — | | | |
| LTV ratio: | | | | | | | | |
| – 101% to 110% | 592 | | 0.4 | | 84 | | — | | 334 | | — | | | |
| – 111% to 120% | 101 | | 0.5 | | 45 | | — | | — | | — | | | |
| – greater than 120% | 280 | | 0.3 | | 160 | | — | | 2 | | — | | | |
| – collateral value on A | 847 | | | 212 | | | 328 | | | | |
| Total | 355,075 | | — | | 159,851 | | — | | 91,069 | | — | | | |
| Stage 2 | | | | | | | | |
| Fully collateralised | 12,252 | | 1.5 | | 4,229 | | 1.4 | | 1,802 | | — | | | |
| LTV ratio: | | | | | | | | |
| – less than 50% | 6,694 | | 1.1 | | 2,442 | | 1.2 | | 1,256 | | — | | | |
| – 51% to 60% | 2,223 | | 1.1 | | 730 | | 1.3 | | 253 | | — | | | |
| – 61% to 70% | 1,779 | | 1.6 | | 606 | | 1.3 | | 83 | | — | | | |
| – 71% to 80% | 987 | | 2.8 | | 244 | | 2.9 | | 111 | | — | | | |
| – 81% to 90% | 400 | | 4.9 | | 139 | | 3.6 | | 60 | | — | | | |
| – 91% to 100% | 169 | | 5.7 | | 68 | | 3.3 | | 39 | | — | | | |
| Partially collateralised (B): | 53 | | 13.6 | | 4 | | 3.3 | | 9 | | — | | | |
| LTV ratio: | | | | | | | | |
| – 101% to 110% | 28 | | 11.9 | | 3 | | 1.5 | | 9 | | — | | | |
| – 111% to 120% | 9 | | 16.8 | | — | | — | | — | | — | | | |
| – greater than 120% | 16 | | 14.8 | | 1 | | 8.5 | | — | | — | | | |
| – collateral value on B | 47 | | | 4 | | | 9 | | | | |
| Total | 12,305 | | 1.5 | | 4,233 | | 1.4 | | 1,811 | | — | | | |
| Stage 3 | | | | | | | | |
| Fully collateralised | 3,083 | | 9.8 | | 1,050 | | 12.3 | | 63 | | — | | | |
| LTV ratio: | | | | | | | | |
| – less than 50% | 1,472 | | 8.0 | | 676 | | 10.9 | | 53 | | — | | | |
| – 51% to 60% | 505 | | 8.7 | | 144 | | 15.1 | | 6 | | — | | | |
| – 61% to 70% | 435 | | 9.2 | | 112 | | 12.9 | | — | | — | | | |
| – 71% to 80% | 378 | | 11.5 | | 81 | | 13.7 | | 2 | | — | | | |
| – 81% to 90% | 195 | | 17.3 | | 28 | | 22.4 | | 2 | | — | | | |
| – 91% to 100% | 98 | | 24.3 | | 9 | | 17.8 | | — | | — | | | |
| Partially collateralised (C): | 328 | | 42.7 | | 17 | | 22.9 | | — | | — | | | |
| LTV ratio: | | | | | | | | |
| – 101% to 110% | 75 | | 30.4 | | 9 | | 16.7 | | — | | — | | | |
| – 111% to 120% | 56 | | 38.8 | | 5 | | 17.6 | | — | | — | | | |
| – greater than 120% | 197 | | 48.5 | | 3 | | 50.3 | | — | | — | | | |
| – collateral value on C | 228 | | | 10 | | | 1 | | | | |
| Total | 3,411 | | 13.0 | | 1,067 | | 12.5 | | 63 | | — | | | |
| At 31 Dec 2020 | 370,791 | | 0.2 | | 165,151 | | 0.1 | | 92,943 | | — | | | |
| | | | | | | | |
Supplementary information
| | | | | | | | | | | | | | | | | | | | | | | | | | |
| Wholesale lending – loans and advances to customers at amortised cost by country/territory |
| Gross carrying amount | Allowance for ECL |
| Corporate and commercial | Of which: real estate1 | Non-bank financial institutions | Total | Corporate and commercial | Of which: real estate1 | Non-bank financial institutions | Total |
| $m | $m | $m | $m | $m | $m | $m | $m |
| Europe | 163,341 | | 23,137 | | 17,818 | | 181,159 | | (2,770) | | (546) | | (41) | | (2,811) | |
| – UK | 115,386 | | 16,233 | | 11,306 | | 126,692 | | (1,855) | | (489) | | (32) | | (1,887) | |
| – France | 34,488 | | 5,520 | | 4,391 | | 38,879 | | (654) | | (47) | | (2) | | (656) | |
| – Germany | 6,746 | | 306 | | 987 | | 7,733 | | (120) | | — | | (3) | | (123) | |
| – Switzerland | 1,188 | | 731 | | 688 | | 1,876 | | (8) | | — | | — | | (8) | |
| – other | 5,533 | | 347 | | 446 | | 5,979 | | (133) | | (10) | | (4) | | (137) | |
| Asia | 263,821 | | 81,453 | | 36,321 | | 300,142 | | (3,297) | | (731) | | (44) | | (3,341) | |
| – Hong Kong | 162,684 | | 62,792 | | 20,182 | | 182,866 | | (1,585) | | (624) | | (7) | | (1,592) | |
| – Australia | 9,937 | | 2,596 | | 717 | | 10,654 | | (108) | | (3) | | — | | (108) | |
| – India | 8,221 | | 1,786 | | 4,003 | | 12,224 | | (84) | | (29) | | (8) | | (92) | |
| – Indonesia | 3,436 | | 86 | | 226 | | 3,662 | | (246) | | (2) | | (1) | | (247) | |
| – mainland China | 33,555 | | 6,811 | | 9,359 | | 42,914 | | (198) | | (41) | | (28) | | (226) | |
| – Malaysia | 7,229 | | 1,741 | | 197 | | 7,426 | | (172) | | (21) | | — | | (172) | |
| – Singapore | 16,401 | | 4,158 | | 782 | | 17,183 | | (792) | | (5) | | — | | (792) | |
| – Taiwan | 6,291 | | 31 | | 47 | | 6,338 | | — | | — | | — | | — | |
| – other | 16,067 | | 1,452 | | 808 | | 16,875 | | (112) | | (6) | | — | | (112) | |
| Middle East and North Africa (excluding Saudi Arabia) | 21,963 | | 1,555 | | 376 | | 22,339 | | (1,207) | | (158) | | (3) | | (1,210) | |
| – Egypt | 1,788 | | 69 | | 152 | | 1,940 | | (161) | | (7) | | — | | (161) | |
| – UAE | 12,942 | | 1,370 | | 190 | | 13,132 | | (811) | | (149) | | — | | (811) | |
| – other | 7,233 | | 116 | | 34 | | 7,267 | | (235) | | (2) | | (3) | | (238) | |
| North America | 52,577 | | 13,639 | | 10,197 | | 62,774 | | (427) | | (87) | | (18) | | (445) | |
| – US | 27,002 | | 5,895 | | 8,511 | | 35,513 | | (207) | | (64) | | (1) | | (208) | |
| – Canada | 25,048 | | 7,650 | | 1,546 | | 26,594 | | (198) | | (15) | | (6) | | (204) | |
| – other | 527 | | 94 | | 140 | | 667 | | (22) | | (8) | | (11) | | (33) | |
| Latin America | 11,837 | | 1,476 | | 643 | | 12,480 | | (503) | | (122) | | (4) | | (507) | |
| – Mexico | 9,561 | | 1,475 | | 618 | | 10,179 | | (452) | | (122) | | (4) | | (456) | |
| – other | 2,276 | | 1 | | 25 | | 2,301 | | (51) | | — | | — | | (51) | |
| At 31 Dec 2021 | 513,539 | | 121,260 | | 65,355 | | 578,894 | | (8,204) | | (1,644) | | (110) | | (8,314) | |
| | | | | | | | | | | | | | | | | | | | | | | | | | |
|
| | |
| | | | | | | | |
| | | | | | | | |
| Europe | 179,104 | | 26,505 | | 22,176 | | 201,280 | | (3,918) | | (632) | | (185) | | (4,103) | |
– UK | 128,933 | | 18,890 | | 16,165 | | 145,098 | | (2,958) | | (574) | | (147) | | (3,105) | |
| – France | 32,278 | | 5,740 | | 3,557 | | 35,835 | | (645) | | (40) | | (26) | | (671) | |
| – Germany | 8,309 | | 364 | | 1,156 | | 9,465 | | (125) | | — | | (3) | | (128) | |
| – Switzerland | 1,489 | | 576 | | 513 | | 2,002 | | (14) | | — | | — | | (14) | |
| – other | 8,095 | | 935 | | 785 | | 8,880 | | (176) | | (18) | | (9) | | (185) | |
| Asia | 257,942 | | 82,359 | | 31,637 | | 289,579 | | (2,766) | | (162) | | (38) | | (2,804) | |
| – Hong Kong | 162,039 | | 64,216 | | 18,406 | | 180,445 | | (1,180) | | (83) | | (15) | | (1,195) | |
| – Australia | 9,769 | | 1,813 | | 1,348 | | 11,117 | | (95) | | (2) | | — | | (95) | |
| – India | 7,223 | | 1,951 | | 3,075 | | 10,298 | | (90) | | (18) | | (4) | | (94) | |
| – Indonesia | 3,699 | | 81 | | 246 | | 3,945 | | (229) | | (2) | | — | | (229) | |
| – mainland China | 28,443 | | 6,251 | | 7,128 | | 35,571 | | (187) | | (23) | | (18) | | (205) | |
| – Malaysia | 7,228 | | 1,968 | | 123 | | 7,351 | | (86) | | (27) | | — | | (86) | |
| – Singapore | 18,859 | | 4,637 | | 362 | | 19,221 | | (782) | | (2) | | — | | (782) | |
| – Taiwan | 6,115 | | 50 | | 60 | | 6,175 | | — | | — | | — | | — | |
| – other | 14,567 | | 1,392 | | 889 | | 15,456 | | (117) | | (5) | | (1) | | (118) | |
| Middle East and North Africa (excluding Saudi Arabia) | 24,625 | | 1,839 | | 379 | | 25,004 | | (1,512) | | (187) | | (9) | | (1,521) | |
| – Egypt | 2,162 | | 37 | | 13 | | 2,175 | | (157) | | (7) | | (3) | | (160) | |
| – UAE | 13,485 | | 1,690 | | 170 | | 13,655 | | (1,019) | | (176) | | (2) | | (1,021) | |
| – other | 8,978 | | 112 | | 196 | | 9,174 | | (336) | | (4) | | (4) | | (340) | |
| North America | 53,386 | | 14,491 | | 9,292 | | 62,678 | | (637) | | (73) | | (23) | | (660) | |
| – US | 30,425 | | 7,722 | | 7,708 | | 38,133 | | (367) | | (38) | | (3) | | (370) | |
| – Canada | 22,361 | | 6,645 | | 1,440 | | 23,801 | | (243) | | (27) | | (9) | | (252) | |
| – other | 600 | | 124 | | 144 | | 744 | | (27) | | (8) | | (11) | | (38) | |
| Latin America | 12,031 | | 1,833 | | 1,096 | | 13,127 | | (661) | | (113) | | (10) | | (671) | |
| – Mexico | 10,244 | | 1,832 | | 1,083 | | 11,327 | | (589) | | (113) | | (10) | | (599) | |
| – other | 1,787 | | 1 | | 13 | | 1,800 | | (72) | | — | | — | | (72) | |
| At 31 Dec 2020 | 527,088 | | 127,027 | | 64,580 | | 591,668 | | (9,494) | | (1,167) | | (265) | | (9,759) | |
1 Real estate lending within this disclosure corresponds solely to the industry of the borrower. Commercial real estate on page 204 includes borrowers in multiple industries investing in income-producing assets and to a lesser extent, their construction and development.
| | | | | | | | | | | | | | | | | | | | | | | | | | |
| Personal lending – loans and advances to customers at amortised cost by country/territory |
| Gross carrying amount | Allowance for ECL |
| First lien residential mortgages | Other personal | Of which: credit cards | Total | First lien residential mortgages | Other personal | Of which: credit cards | Total |
| $m | $m | $m | $m | $m | $m | $m | $m |
| Europe | 170,818 | | 49,253 | | 8,624 | | 220,071 | | (329) | | (1,006) | | (437) | | (1,335) | |
| – UK | 163,549 | | 19,154 | | 8,213 | | 182,703 | | (223) | | (823) | | (434) | | (1,046) | |
– France1 | 3,124 | | 22,908 | | 366 | | 26,032 | | (38) | | (91) | | (3) | | (129) | |
| – Germany | — | | 282 | | — | | 282 | | — | | — | | — | | — | |
| – Switzerland | 1,367 | | 6,615 | | — | | 7,982 | | — | | (75) | | — | | (75) | |
| – other | 2,778 | | 294 | | 45 | | 3,072 | | (68) | | (17) | | — | | (85) | |
| Asia | 149,709 | | 46,781 | | 11,413 | | 196,490 | | (59) | | (706) | | (428) | | (765) | |
| – Hong Kong | 98,019 | | 32,996 | | 8,154 | | 131,015 | | (1) | | (338) | | (217) | | (339) | |
| – Australia | 21,149 | | 504 | | 427 | | 21,653 | | (5) | | (33) | | (32) | | (38) | |
| – India | 981 | | 543 | | 181 | | 1,524 | | (10) | | (30) | | (20) | | (40) | |
| – Indonesia | 76 | | 272 | | 147 | | 348 | | (1) | | (20) | | (14) | | (21) | |
| – mainland China | 10,525 | | 1,103 | | 563 | | 11,628 | | (4) | | (72) | | (66) | | (76) | |
| – Malaysia | 2,532 | | 2,657 | | 791 | | 5,189 | | (33) | | (122) | | (34) | | (155) | |
| – Singapore | 7,811 | | 6,649 | | 367 | | 14,460 | | — | | (40) | | (13) | | (40) | |
| – Taiwan | 5,672 | | 1,188 | | 271 | | 6,860 | | — | | (17) | | (5) | | (17) | |
| – other | 2,944 | | 869 | | 512 | | 3,813 | | (5) | | (34) | | (27) | | (39) | |
| Middle East and North Africa (excluding Saudi Arabia) | 2,262 | | 3,157 | | 761 | | 5,419 | | (26) | | (146) | | (60) | | (172) | |
| – Egypt | — | | 368 | | 98 | | 368 | | — | | (3) | | (1) | | (3) | |
| – UAE | 1,924 | | 1,232 | | 417 | | 3,156 | | (18) | | (88) | | (39) | | (106) | |
| – other | 338 | | 1,557 | | 246 | | 1,895 | | (8) | | (55) | | (20) | | (63) | |
| North America | 43,529 | | 3,091 | | 555 | | 46,620 | | (141) | | (87) | | (47) | | (228) | |
| – US | 16,642 | | 799 | | 232 | | 17,441 | | (12) | | (53) | | (36) | | (65) | |
| – Canada | 25,773 | | 2,123 | | 284 | | 27,896 | | (33) | | (27) | | (8) | | (60) | |
| – other | 1,114 | | 169 | | 39 | | 1,283 | | (96) | | (7) | | (3) | | (103) | |
| Latin America | 5,050 | | 4,687 | | 1,505 | | 9,737 | | (120) | | (483) | | (163) | | (603) | |
| – Mexico | 4,882 | | 4,006 | | 1,172 | | 8,888 | | (119) | | (450) | | (148) | | (569) | |
| – other | 168 | | 681 | | 333 | | 849 | | (1) | | (33) | | (15) | | (34) | |
| At 31 Dec 2021 | 371,368 | | 106,969 | | 22,858 | | 478,337 | | (675) | | (2,428) | | (1,135) | | (3,103) | |
| | | | | | | | | | | | | | | | | | | | | | | | | | |
|
| | |
| | | | | | | | |
| | | | | | | | |
| Europe | 162,630 | | 51,033 | | 8,471 | | 213,663 | | (364) | | (1,980) | | (859) | | (2,344) | |
– UK | 154,839 | | 19,696 | | 8,064 | | 174,535 | | (236) | | (1,762) | | (852) | | (1,998) | |
– France1 | 3,623 | | 23,982 | | 358 | | 27,605 | | (43) | | (120) | | (5) | | (163) | |
| – Germany | — | | 368 | | — | | 368 | | — | | — | | — | | — | |
| – Switzerland | 1,195 | | 6,641 | | — | | 7,836 | | — | | (79) | | — | | (79) | |
| – other | 2,973 | | 346 | | 49 | | 3,319 | | (85) | | (19) | | (2) | | (104) | |
| Asia | 141,581 | | 45,732 | | 11,186 | | 187,313 | | (80) | | (841) | | (563) | | (921) | |
| – Hong Kong | 91,997 | | 31,594 | | 7,573 | | 123,591 | | — | | (387) | | (265) | | (387) | |
| – Australia | 20,320 | | 602 | | 514 | | 20,922 | | (12) | | (47) | | (45) | | (59) | |
| – India | 933 | | 544 | | 215 | | 1,477 | | (9) | | (45) | | (34) | | (54) | |
| – Indonesia | 71 | | 288 | | 167 | | 359 | | — | | (37) | | (26) | | (37) | |
| – mainland China | 9,679 | | 1,155 | | 644 | | 10,834 | | (6) | | (81) | | (73) | | (87) | |
| – Malaysia | 2,797 | | 2,964 | | 841 | | 5,761 | | (41) | | (102) | | (35) | | (143) | |
| – Singapore | 7,394 | | 6,537 | | 375 | | 13,931 | | — | | (55) | | (17) | | (55) | |
| – Taiwan | 5,407 | | 1,069 | | 277 | | 6,476 | | — | | (15) | | (5) | | (15) | |
| – other | 2,983 | | 979 | | 580 | | 3,962 | | (12) | | (72) | | (63) | | (84) | |
| Middle East and North Africa (excluding Saudi Arabia) | 2,192 | | 3,341 | | 863 | | 5,533 | | (43) | | (275) | | (142) | | (318) | |
| – Egypt | — | | 360 | | 89 | | 360 | | — | | (8) | | (3) | | (8) | |
| – UAE | 1,841 | | 1,158 | | 432 | | 2,999 | | (37) | | (163) | | (92) | | (200) | |
| – other | 351 | | 1,823 | | 342 | | 2,174 | | (6) | | (104) | | (47) | | (110) | |
| North America | 41,826 | | 4,552 | | 1,373 | | 46,378 | | (159) | | (266) | | (193) | | (425) | |
| – US | 18,430 | | 2,141 | | 1,091 | | 20,571 | | (26) | | (226) | | (182) | | (252) | |
| – Canada | 22,241 | | 2,230 | | 244 | | 24,471 | | (36) | | (31) | | (10) | | (67) | |
| – other | 1,155 | | 181 | | 38 | | 1,336 | | (97) | | (9) | | (1) | | (106) | |
| Latin America | 4,053 | | 3,869 | | 1,406 | | 7,922 | | (109) | | (614) | | (290) | | (723) | |
| – Mexico | 3,901 | | 3,351 | | 1,119 | | 7,252 | | (107) | | (578) | | (268) | | (685) | |
| – other | 152 | | 518 | | 287 | | 670 | | (2) | | (36) | | (22) | | (38) | |
| At 31 Dec 2020 | 352,282 | | 108,527 | | 23,299 | | 460,809 | | (755) | | (3,976) | | (2,047) | | (4,731) | |
1 Included in other personal lending at 31 December 2021 is $19,972m (31 December 2020: $20,625m) guaranteed by Crédit Logement.
| | | | | | | | | | | | | | | | | | | | | | | | | | | | | | | | | | |
| Summary of financial instruments to which the impairment requirements in IFRS 9 are applied – by global business | | |
| Gross carrying/nominal amount | Allowance for ECL | | |
| Stage 1 | Stage 2 | Stage 3 | POCI | Total | Stage 1 | Stage 2 | Stage 3 | POCI | Total |
| $m | $m | $m | $m | $m | $m | $m | $m | $m | $m | | |
| Loans and advances to customers at amortised cost | 918,936 | | 119,224 | | 18,797 | | 274 | | 1,057,231 | | (1,367) | | (3,119) | | (6,867) | | (64) | | (11,417) | | | |
| – WPB | 469,477 | | 17,285 | | 5,211 | | — | | 491,973 | | (664) | | (1,247) | | (1,276) | | — | | (3,187) | | | |
| – CMB | 267,517 | | 76,798 | | 11,462 | | 245 | | 356,022 | | (571) | | (1,369) | | (4,904) | | (53) | | (6,897) | | | |
| – GBM | 181,247 | | 25,085 | | 2,124 | | 29 | | 208,485 | | (132) | | (493) | | (687) | | (11) | | (1,323) | | | |
| – Corporate Centre | 695 | | 56 | | — | | — | | 751 | | — | | (10) | | — | | — | | (10) | | | |
| Loans and advances to banks at amortised cost | 81,636 | | 1,517 | | — | | — | | 83,153 | | (14) | | (3) | | — | | — | | (17) | | | |
| – WPB | 20,464 | | 481 | | — | | — | | 20,945 | | (1) | | (1) | | — | | — | | (2) | | | |
| – CMB | 15,269 | | 352 | | — | | — | | 15,621 | | (1) | | — | | — | | — | | (1) | | | |
| – GBM | 36,875 | | 654 | | — | | — | | 37,529 | | (10) | | (2) | | — | | — | | (12) | | | |
| – Corporate Centre | 9,028 | | 30 | | — | | — | | 9,058 | | (2) | | — | | — | | — | | (2) | | | |
| Other financial assets measured at amortised cost | 875,016 | | 4,988 | | 304 | | 43 | | 880,351 | | (91) | | (54) | | (42) | | (6) | | (193) | | | |
| – WPB | 207,335 | | 1,407 | | 175 | | 43 | | 208,960 | | (51) | | (44) | | (14) | | (6) | | (115) | | | |
| – CMB | 163,457 | | 2,370 | | 61 | | — | | 165,888 | | (12) | | (8) | | (20) | | — | | (40) | | | |
| – GBM | 409,808 | | 1,204 | | 62 | | — | | 411,074 | | (28) | | (2) | | (8) | | — | | (38) | | | |
| – Corporate Centre | 94,416 | | 7 | | 6 | | — | | 94,429 | | — | | — | | — | | — | | — | | | |
| Total gross carrying amount on-balance sheet at 31 Dec 2021 | 1,875,588 | | 125,729 | | 19,101 | | 317 | | 2,020,735 | | (1,472) | | (3,176) | | (6,909) | | (70) | | (11,627) | | | |
| Loans and other credit-related commitments | 594,473 | | 32,389 | | 775 | | — | | 627,637 | | (165) | | (174) | | (40) | | — | | (379) | | | |
| – WPB | 235,722 | | 2,111 | | 153 | | — | | 237,986 | | (37) | | (3) | | — | | — | | (40) | | | |
| – CMB | 126,728 | | 17,490 | | 555 | | — | | 144,773 | | (80) | | (118) | | (37) | | — | | (235) | | | |
| – GBM | 231,890 | | 12,788 | | 67 | | — | | 244,745 | | (48) | | (53) | | (3) | | — | | (104) | | | |
| – Corporate Centre | 133 | | — | | — | | — | | 133 | | — | | — | | — | | — | | — | | | |
| Financial guarantees | 24,932 | | 2,638 | | 225 | | — | | 27,795 | | (11) | | (30) | | (21) | | — | | (62) | | | |
| – WPB | 1,295 | | 15 | | 1 | | — | | 1,311 | | — | | (1) | | — | | — | | (1) | | | |
| – CMB | 6,105 | | 1,606 | | 126 | | — | | 7,837 | | (7) | | (16) | | (17) | | — | | (40) | | | |
| – GBM | 17,531 | | 1,017 | | 98 | | — | | 18,646 | | (4) | | (13) | | (4) | | — | | (21) | | | |
| – Corporate Centre | 1 | | — | | — | | — | | 1 | | — | | — | | — | | — | | — | | | |
| Total nominal amount off-balance sheet at 31 Dec 2021 | 619,405 | | 35,027 | | 1,000 | | — | | 655,432 | | (176) | | (204) | | (61) | | — | | (441) | | | |
| | | | | | | | | | | | |
| WPB | 143,373 | | 718 | | — | | 35 | | 144,126 | | (20) | | (7) | | — | | (5) | | (32) | | | |
| CMB | 86,247 | | 471 | | — | | 10 | | 86,728 | | (11) | | (1) | | — | | (1) | | (13) | | | |
| GBM | 111,473 | | 526 | | — | | 1 | | 112,000 | | (13) | | (2) | | — | | — | | (15) | | | |
| Corporate Centre | 4,038 | | 311 | | — | | — | | 4,349 | | (25) | | (11) | | — | | — | | (36) | | | |
Debt instruments measured at FVOCI at
31 Dec 2021 | 345,131 | | 2,026 | | — | | 46 | | 347,203 | | (69) | | (21) | | — | | (6) | | (96) | | | |
| | | | | | | | | | | | | | | | | | | | | | | | | | | | | | | | | | |
| Summary of financial instruments to which the impairment requirements in IFRS 9 are applied – by global business (continued) | | |
| Gross carrying/nominal amount | Allowance for ECL | | |
| Stage 1 | Stage 2 | Stage 3 | POCI | Total | Stage 1 | Stage 2 | Stage 3 | POCI | Total |
| $m | $m | $m | $m | $m | $m | $m | $m | $m | $m | | |
| Loans and advances to customers at amortised cost | 869,920 | | 163,185 | | 19,095 | | 277 | | 1,052,477 | | (1,974) | | (4,965) | | (7,439) | | (112) | | (14,490) | | | |
| – WPB | 442,641 | | 25,694 | | 5,753 | | — | | 474,088 | | (854) | | (2,458) | | (1,590) | | — | | (4,902) | | | |
| – CMB | 238,517 | | 101,960 | | 10,408 | | 212 | | 351,097 | | (917) | | (2,029) | | (4,874) | | (96) | | (7,916) | | | |
| – GBM | 187,564 | | 35,461 | | 2,934 | | 65 | | 226,024 | | (203) | | (465) | | (975) | | (16) | | (1,659) | | | |
| | | | | | | | | | | | |
| – Corporate Centre | 1,198 | | 70 | | — | | — | | 1,268 | | — | | (13) | | — | | — | | (13) | | | |
| Loans and advances to banks at amortised cost | 79,654 | | 2,004 | | — | | — | | 81,658 | | (33) | | (9) | | — | | — | | (42) | | | |
| – WPB | 16,837 | | 519 | | — | | — | | 17,356 | | (2) | | (2) | | — | | — | | (4) | | | |
| – CMB | 12,253 | | 222 | | — | | — | | 12,475 | | (2) | | — | | — | | — | | (2) | | | |
| – GBM | 33,361 | | 1,166 | | — | | — | | 34,527 | | (23) | | (7) | | — | | — | | (30) | | | |
| | | | | | | | | | | | |
| – Corporate Centre | 17,203 | | 97 | | — | | — | | 17,300 | | (6) | | — | | — | | — | | (6) | | | |
| Other financial assets measured at amortised cost | 768,216 | | 3,975 | | 177 | | 40 | | 772,408 | | (80) | | (44) | | (42) | | (9) | | (175) | | | |
| – WPB | 167,053 | | 1,547 | | 50 | | 39 | | 168,689 | | (41) | | (22) | | (7) | | (9) | | (79) | | | |
| – CMB | 111,299 | | 1,716 | | 65 | | 1 | | 113,081 | | (17) | | (19) | | (25) | | — | | (61) | | | |
| – GBM | 391,967 | | 705 | | 56 | | — | | 392,728 | | (22) | | (3) | | (10) | | — | | (35) | | | |
| | | | | | | | | | | | |
| – Corporate Centre | 97,897 | | 7 | | 6 | | — | | 97,910 | | — | | — | | — | | — | | — | | | |
Total gross carrying amount on-balance sheet at
31 Dec 2020 | 1,717,790 | | 169,164 | | 19,272 | | 317 | | 1,906,543 | | (2,087) | | (5,018) | | (7,481) | | (121) | | (14,707) | | | |
| Loans and other credit-related commitments | 604,485 | | 54,217 | | 1,080 | | 1 | | 659,783 | | (290) | | (365) | | (78) | | (1) | | (734) | | | |
| – WPB | 232,027 | | 2,591 | | 136 | | — | | 234,754 | | (41) | | (2) | | — | | — | | (43) | | | |
| – CMB | 111,800 | | 29,150 | | 779 | | 1 | | 141,730 | | (157) | | (203) | | (72) | | (1) | | (433) | | | |
| – GBM | 260,527 | | 22,476 | | 165 | | — | | 283,168 | | (92) | | (160) | | (6) | | — | | (258) | | | |
| | | | | | | | | | | | |
| – Corporate Centre | 131 | | — | | — | | — | | 131 | | — | | — | | — | | — | | — | | | |
| Financial guarantees | 14,090 | | 4,024 | | 269 | | 1 | | 18,384 | | (37) | | (62) | | (26) | | — | | (125) | | | |
| – WPB | 1,048 | | 23 | | 2 | | — | | 1,073 | | — | | — | | — | | — | | — | | | |
| – CMB | 5,556 | | 2,519 | | 146 | | 1 | | 8,222 | | (19) | | (36) | | (12) | | — | | (67) | | | |
| – GBM | 7,482 | | 1,482 | | 121 | | — | | 9,085 | | (17) | | (26) | | (14) | | — | | (57) | | | |
| | | | | | | | | | | | |
| – Corporate Centre | 4 | | — | | — | | — | | 4 | | (1) | | — | | — | | — | | (1) | | | |
Total nominal amount off-balance sheet at
31 Dec 2020 | 618,575 | | 58,241 | | 1,349 | | 2 | | 678,167 | | (327) | | (427) | | (104) | | (1) | | (859) | | | |
| | | | | | | | | | | | |
| WPB | 159,988 | | 625 | | 154 | | 39 | | 160,806 | | (27) | | (10) | | (15) | | (8) | | (60) | | | |
| CMB | 95,182 | | 313 | | 51 | | 10 | | 95,556 | | (22) | | (3) | | (2) | | (2) | | (29) | | | |
| GBM | 136,909 | | 126 | | 93 | | — | | 137,128 | | (24) | | (1) | | (3) | | — | | (28) | | | |
| | | | | | | | | | | | |
| Corporate Centre | 5,838 | | 389 | | — | | — | | 6,227 | | (17) | | (6) | | (1) | | — | | (24) | | | |
Debt instruments measured at FVOCI at
31 Dec 2020 | 397,917 | | 1,453 | | 298 | | 49 | | 399,717 | | (90) | | (20) | | (21) | | (10) | | (141) | | | |
| | | | | | | | | | | | | | | | | | | | | | | | | |
| Loans and advances to customers and banks metrics |
| Gross carrying amount | Of which: stage 3 and POCI | | Allowance for ECL | Of which: stage 3 and POCI | | Change in ECL | Write-offs | Recoveries |
| $m | $m | | $m | $m | | $m | $m | $m |
| First lien residential mortgages | 371,368 | | 3,045 | | | (675) | | (416) | | | — | | (70) | | 31 | |
| – second lien residential mortgages | 395 | | 37 | | | (14) | | (9) | | | 12 | | (1) | | 6 | |
| – guaranteed loans in respect of residential property | 21,610 | | 236 | | | (58) | | (42) | | | (5) | | (8) | | 2 | |
| – other personal lending which is secured | 37,995 | | 366 | | | (156) | | (120) | | | (11) | | (11) | | 1 | |
| – credit cards | 22,858 | | 338 | | | (1,135) | | (214) | | | 172 | | (751) | | 153 | |
| – other personal lending which is unsecured | 22,478 | | 915 | | | (1,039) | | (421) | | | 135 | | (659) | | 156 | |
| – motor vehicle finance | 1,633 | | 5 | | | (26) | | (4) | | | (22) | | (20) | | 6 | |
| – IPO loans | — | | — | | | — | | — | | | — | | — | | — | |
| Other personal lending | 106,969 | | 1,897 | | | (2,428) | | (810) | | | 281 | | (1,450) | | 324 | |
| Personal lending | 478,337 | | 4,942 | | | (3,103) | | (1,226) | | | 281 | | (1,520) | | 355 | |
| – agriculture, forestry and fishing | 7,899 | | 363 | | | (138) | | (105) | | | 61 | | (5) | | — | |
| – mining and quarrying | 9,685 | | 463 | | | (227) | | (171) | | | 72 | | (57) | | (1) | |
| – manufacturing | 93,743 | | 2,107 | | | (1,248) | | (962) | | | 102 | | (222) | | 7 | |
| – electricity, gas, steam and air-conditioning supply | 16,618 | | 78 | | | (68) | | (31) | | | 5 | | — | | — | |
| – water supply, sewerage, waste management and remediation | 3,895 | | 51 | | | (29) | | (20) | | | 3 | | (7) | | — | |
| – construction | 13,954 | | 843 | | | (508) | | (440) | | | (13) | | (94) | | 9 | |
| – wholesale and retail trade, repair of motor vehicles and motorcycles | 94,944 | | 3,005 | | | (2,107) | | (1,937) | | | 163 | | (238) | | 15 | |
| – transportation and storage | 29,592 | | 667 | | | (363) | | (191) | | | 100 | | (10) | | 2 | |
| – accommodation and food | 23,376 | | 1,200 | | | (423) | | (111) | | | 12 | | (17) | | 6 | |
| – publishing, audiovisual and broadcasting | 18,471 | | 250 | | | (184) | | (100) | | | (12) | | (4) | | 1 | |
| – real estate | 121,260 | | 2,473 | | | (1,644) | | (775) | | | (674) | | (152) | | 5 | |
| – professional, scientific and technical activities | 19,685 | | 637 | | | (238) | | (172) | | | 97 | | (39) | | 1 | |
| – administrative and support services | 28,675 | | 749 | | | (431) | | (307) | | | 48 | | (37) | | — | |
| – public administration and defence, compulsory social security | 1,271 | | — | | | (8) | | — | | | 6 | | — | | 1 | |
| – education | 1,793 | | 65 | | | (37) | | (18) | | | 1 | | (1) | | — | |
| – health and care | 4,854 | | 183 | | | (72) | | (37) | | | 44 | | (69) | | 1 | |
| – arts, entertainment and recreation | 2,598 | | 152 | | | (92) | | (42) | | | 27 | | (26) | | — | |
| – other services | 12,297 | | 448 | | | (373) | | (246) | | | (59) | | (109) | | 6 | |
| – activities of households | 977 | | — | | | — | | — | | | — | | — | | — | |
| – extra-territorial organisations and bodies activities | 2 | | — | | | — | | — | | | 1 | | — | | 1 | |
| – government | 7,612 | | — | | | (4) | | — | | | (6) | | — | | — | |
| – asset-backed securities | 338 | | — | | | (10) | | — | | | 3 | | — | | — | |
| Corporate and commercial | 513,539 | | 13,734 | | | (8,204) | | (5,665) | | | (19) | | (1,087) | | 54 | |
| Non-bank financial institutions | 65,355 | | 395 | | | (110) | | (40) | | | 129 | | (5) | | — | |
| Wholesale lending | 578,894 | | 14,129 | | | (8,314) | | (5,705) | | | 110 | | (1,092) | | 54 | |
| Loans and advances to customers | 1,057,231 | | 19,071 | | | (11,417) | | (6,931) | | | 391 | | (2,612) | | 409 | |
| Loans and advances to banks | 83,153 | | — | | | (17) | | — | | | 22 | | — | | — | |
| At 31 Dec 2021 | 1,140,384 | | 19,071 | | | (11,434) | | (6,931) | | | 413 | | (2,612) | | 409 | |
| | | | | | | | | | | | | | | | | | | | | | | | | |
| Loans and advances to customers and banks metrics (continued) |
| Gross carrying amount | Of which: stage 3 and POCI | | Allowance for ECL | Of which: stage 3 and POCI | | Change in ECL | Write-offs | Recoveries |
| $m | $m | | $m | $m | | $m | $m | $m |
| First lien residential mortgages | 352,282 | | 3,383 | | | (755) | | (442) | | | (259) | | (92) | | 35 | |
| – second lien residential mortgages | 744 | | 51 | | | (22) | | (10) | | | (5) | | — | | — | |
| – guaranteed loans in respect of residential property | 22,552 | | 159 | | | (43) | | (32) | | | 1 | | (3) | | — | |
| – other personal lending which is secured | 38,035 | | 448 | | | (159) | | (127) | | | (62) | | (5) | | 1 | |
| – credit cards | 23,299 | | 680 | | | (2,047) | | (380) | | | (1,194) | | (736) | | 131 | |
| – other personal lending which is unsecured | 22,316 | | 882 | | | (1,682) | | (506) | | | (1,085) | | (543) | | 108 | |
| – motor vehicle finance | 1,533 | | 8 | | | (23) | | (5) | | | (18) | | (28) | | 5 | |
| – IPO loans | 48 | | — | | | — | | — | | | — | | — | | — | |
| Other personal lending | 108,527 | | 2,228 | | | (3,976) | | (1,060) | | | (2,363) | | (1,315) | | 245 | |
| Personal lending | 460,809 | | 5,611 | | | (4,731) | | (1,502) | | | (2,622) | | (1,407) | | 280 | |
| – agriculture, forestry and fishing | 7,445 | | 332 | | | (207) | | (150) | | | (28) | | (3) | | — | |
| – mining and quarrying | 11,947 | | 813 | | | (365) | | (220) | | | (513) | | (311) | | — | |
| – manufacturing | 93,906 | | 2,163 | | | (1,588) | | (945) | | | (652) | | (375) | | 7 | |
| – electricity, gas, steam and air-conditioning supply | 16,200 | | 53 | | | (73) | | (8) | | | (7) | | (14) | | — | |
| – water supply, sewerage, waste management and remediation | 3,174 | | 47 | | | (37) | | (22) | | | (8) | | — | | — | |
| – construction | 14,600 | | 777 | | | (590) | | (430) | | | (151) | | (135) | | 13 | |
| – wholesale and retail trade, repair of motor vehicles and motorcycles | 90,663 | | 3,208 | | | (2,532) | | (2,032) | | | (1,560) | | (280) | | 11 | |
| – transportation and storage | 29,433 | | 780 | | | (493) | | (240) | | | (308) | | (62) | | 1 | |
| – accommodation and food | 26,071 | | 537 | | | (491) | | (130) | | | (365) | | (28) | | — | |
| – publishing, audiovisual and broadcasting | 19,979 | | 164 | | | (189) | | (59) | | | (94) | | (2) | | — | |
| – real estate | 127,027 | | 1,908 | | | (1,167) | | (738) | | | (424) | | (47) | | 4 | |
| – professional, scientific and technical activities | 24,072 | | 531 | | | (398) | | (193) | | | (219) | | (36) | | 1 | |
| – administrative and support services | 26,423 | | 977 | | | (534) | | (315) | | | (298) | | (61) | | — | |
| – public administration and defence, compulsory social security | 2,008 | | 3 | | | (14) | | (1) | | | (5) | | — | | — | |
| – education | 2,122 | | 29 | | | (41) | | (9) | | | (26) | | (6) | | 1 | |
| – health and care | 5,510 | | 269 | | | (186) | | (120) | | | (127) | | (2) | | 1 | |
| – arts, entertainment and recreation | 3,437 | | 236 | | | (158) | | (87) | | | (170) | | (2) | | — | |
| – other services | 13,110 | | 410 | | | (408) | | (249) | | | (360) | | (168) | | 4 | |
| – activities of households | 802 | | — | | | (1) | | — | | | — | | — | | — | |
| – extra-territorial organisations and bodies activities | 10 | | — | | | — | | — | | | 1 | | — | | 1 | |
| – government | 8,538 | | 1 | | | (9) | | (1) | | | 2 | | (5) | | — | |
| – asset-backed securities | 611 | | — | | | (13) | | — | | | 1 | | — | | — | |
| Corporate and commercial | 527,088 | | 13,238 | | | (9,494) | | (5,949) | | | (5,311) | | (1,537) | | 44 | |
| Non-bank financial institutions | 64,580 | | 523 | | | (265) | | (100) | | | (146) | | (30) | | 2 | |
| Wholesale lending | 591,668 | | 13,761 | | | (9,759) | | (6,049) | | | (5,457) | | (1,567) | | 46 | |
| Loans and advances to customers | 1,052,477 | | 19,372 | | | (14,490) | | (7,551) | | | (8,079) | | (2,974) | | 326 | |
| Loans and advances to banks | 81,658 | | — | | | (42) | | — | | | (23) | | — | | — | |
| At 31 Dec 2020 | 1,134,135 | | 19,372 | | | (14,532) | | (7,551) | | | (8,102) | | (2,974) | | 326 | |
HSBC Holdings
(Audited)
Risk in HSBC Holdings is overseen by the HSBC Holdings Asset and Liability Management Committee. The major risks faced by HSBC Holdings are credit risk, liquidity risk and market risk (in the form of interest rate risk and foreign exchange risk).
Credit risk in HSBC Holdings primarily arises from transactions with Group subsidiaries and its investments in those subsidiaries.
In HSBC Holdings, the maximum exposure to credit risk arises from two components:
•financial instruments on the balance sheet (see page 343); and
•financial guarantees and similar contracts, where the maximum exposure is the maximum that we would have to pay if the guarantees were called upon (see Note 32).
In the case of our derivative balances, we have amounts with a legally enforceable right of offset in the case of counterparty default that are not included in the carrying value. These offsets also include collateral received in cash and other financial assets.
The total offset relating to our derivative balances was $1.6bn at 31 December 2021 (2020: $1.7bn).
The credit quality of loans and advances and financial investments, both of which consist of intra-Group lending and US Treasury bills and bonds, is assessed as ‘strong’, with 100% of the exposure being neither past due nor impaired (2020: 100%). For further details of credit quality classification, see page 174.
| | | | | |
| Treasury risk |
| Page |
| Overview | |
| Treasury risk management | |
| Other Group risks | |
| Capital risk in 2021 | |
| Liquidity and funding risk in 2021 | |
| Structural foreign exchange risk in 2021 | |
| Interest rate risk in the banking book in 2021 | |
| |
| |
Overview
Treasury risk is the risk of having insufficient capital, liquidity or funding resources to meet financial obligations and satisfy regulatory requirements, together with the financial risks arising from the provision of pensions and other post-employment benefits to staff and their dependants. Treasury risk also includes the risk to our earnings or capital due to non-trading book foreign exchange exposures and changes in market interest rates.
Treasury risk arises from changes to the respective resources and risk profiles driven by customer behaviour, management decisions or the external environment.
Approach and policy
(Audited)
Our objective in the management of treasury risk is to maintain appropriate levels of capital, liquidity, funding, foreign exchange and market risk to support our business strategy, and meet our regulatory and stress testing-related requirements.
Our approach to treasury management is driven by our strategic and organisational requirements, taking into account the regulatory, economic and commercial environment. We aim to maintain a strong capital and liquidity base to support the risks inherent in our business and invest in accordance with our strategy, meeting both consolidated and local regulatory requirements at all times.
Our policy is underpinned by our risk management framework, our internal capital adequacy assessment process (‘ICAAP’) and our internal liquidity adequacy assessment process (‘ILAAP’). The risk framework incorporates a number of measures aligned to our assessment of risks for both internal and regulatory purposes. These risks include credit, market, operational, pensions, non-trading book foreign exchange risk, and interest rate risk in the banking book.
For further details, refer to our Pillar 3 Disclosures at 31 December 2021.
Treasury risk management
Key developments in 2021
•Global Treasury initiated a new flagship programme to deliver a more resilient, effective and efficient Treasury function over the next four years with a focus on safeguarding and optimising financial resources. The programme will aim to deliver modernised infrastructure and upgraded modelling capabilities alongside a broad reorganisation of the Global Treasury function.
•As announced in February 2021, we intend to maintain a common equity tier 1 (‘CET1’) ratio above 14%, normalising within our target operating range of 14% to 14.5% by the end of 2022. For the financial year 2021, we were at the lower end of our target dividend payout ratio range of between 40% and 55% of reported earnings per ordinary share (‘EPS’), driven by ECL releases and higher restructuring costs.
•We continued to build our recovery and resolution capabilities, including in relation to the Bank of England (‘BoE’) Resolvability Assessment Framework, which had an overall compliance deadline of 1 January 2022. We submitted a self-assessment report on our resolvability to the Prudential Regulation Authority (‘PRA’) and the BoE on 1 October 2021. This included an assessment of how we addressed resolvability outcomes that impact treasury risk, including valuations, and capital, liquidity and funding capabilities in resolution. We will publish a
summary of our self-assessment report in June 2022. The BoE will similarly publish a statement relating to the resolvability of HSBC at the same time.
•The BoE’s Financial Policy Committee (‘FPC’) confirmed its guidance on the path for the UK countercyclical capital buffer rate. It has announced that it is increasing the rate from 0% to 1%, effective December 2022 in line with the usual 12‑month implementation lag. Absent a material change in the outlook for the UK’s financial stability, the FPC would expect to further increase the rate to 2% in the second quarter of 2022, which would take effect 12 months later. The Hong Kong Monetary Authority (‘HKMA’) maintained the countercyclical capital buffer rate at 1% for Hong Kong, but it will continue to monitor credit and economic conditions closely.
•The PRA has confirmed that the capitalisation of structural foreign exchange risk should align to a Pillar 1 approach. In response, we adopted this approach from 31 December 2021. As a result, market risk RWAs increased by $8.4bn, offset by a reduction in Pillar 2 requirements. In advance of this change, we undertook incremental hedging transactions to reduce structural foreign exchange risk and RWAs.
•We revised the approach to calculate the Group liquidity coverage ratio (‘LCR’) better reflecting the free transferability of liquidity within the Group, in consideration with currency convertibility and regulatory intra-Group limits. A risk appetite has been set against the Group LCR. We first published the Group LCR as part of our 30 June 2021 disclosures. Based on the consolidation methodology, the Group LCR was 138.4% at 31 December 2021.
•As part of our continuing focus on enhancing the quality of our regulatory reporting, we are progressing with a comprehensive programme to strengthen our global processes, improve consistency and enhance control standards on various aspects of regulatory reporting. Further details can be found in the subsequent sub-section ‘Regulatory reporting processes and controls’.
•We worked with the fiduciaries of all our pension plans to ensure the measures taken in response to the Covid-19 pandemic, including remote working for plan providers and dealing appropriately with affected plan members, were properly maintained and supported. Our de-risking programmes continued to provide protection against the volatility in financial markets that resulted from the pandemic’s economic impact.
•We created a new team within the Global Treasury function to be accountable for monitoring and managing the financial risk and capital implications of the Group’s employee defined benefit pension plans. This change creates clearer delineation of the roles and responsibilities of the first and second lines of defence.
The Group’s CET1 ratio was 15.8% at 31 December 2021 and the leverage ratio, calculated in accordance with the Capital Requirements Regulation, was 5.2%. The Group continues to maintain and plan for the appropriate resources required to manage its risk and deliver its strategic objectives while supporting local economies.
All of the Group’s material operating entities were above regulatory minimum levels of liquidity and funding at 31 December 2021.
For quantitative disclosures on capital ratios, own funds and RWAs, see pages 229 to 230. For quantitative disclosures on liquidity and funding metrics, see pages 232 to 233. For quantitative disclosures on interest rate risk in the banking book, see pages 236 to 237.
Governance and structure
The Global Head of Traded and Treasury Risk Management and Risk Analytics is the accountable risk steward for all treasury risks. The Group Treasurer is the risk owner for all treasury risks, with the exception of pension risk, which is co-owned together with the Group Head of Performance, Reward and Employee Relations.
Capital risk, liquidity risk, interest rate risk in the banking book and non-trading book foreign exchange risk are the responsibility of the Group Executive Committee and the Group Risk Committee (‘GRC’). The Global Treasury function actively manages these risks on an ongoing basis, supported by the Holdings Asset and Liability Management Committee (‘ALCO’) and local ALCOs, overseen by Treasury Risk Management and the Risk Management Meeting (‘RMM’).
Pension risk is overseen by a network of local and regional pension risk management meetings. The Global Pensions Risk Management Meeting provides oversight of all pension plans sponsored by HSBC globally and is chaired by the accountable risk steward.
Capital, liquidity and funding risk management processes
Assessment and risk appetite
Our capital management policy is underpinned by a global capital management framework and our ICAAP. The framework incorporates key capital risk appetites including CET1, total capital, minimum requirements for own funds and eligible liabilities (‘MREL’), leverage ratio and double leverage. The ICAAP is an assessment of the Group’s capital position, outlining both regulatory and internal capital resources and requirements resulting from HSBC’s business model, strategy, risk profile and management, performance and planning, risks to capital, and the implications of stress testing. Our assessment of capital adequacy is driven by an assessment of risks. These risks include credit, market, operational, pensions, insurance, structural foreign exchange, interest rate risk in the banking book and Group risk driven by credit concentration risk in HSBC UK. Climate risk is also considered as part of the ICAAP, and we are continuing to develop our approach. The Group’s ICAAP supports the determination of the consolidated capital risk appetite and target ratios, as well as enables the assessment and determination of capital requirements by regulators. Subsidiaries prepare ICAAPs in line with global guidance, while considering their local regulatory regimes to determine their own risk appetites and ratios.
HSBC Holdings is the provider of equity capital and MREL-eligible debt to its subsidiaries, and also provides them with non-equity capital where necessary. These investments are funded by HSBC Holdings’ own equity capital and MREL-eligible debt.
HSBC Holdings seeks to maintain a prudent balance between the composition of its capital and its investments in subsidiaries, including management of double leverage. Double leverage reflects the extent to which equity investments in operating entities are funded by holding company debt. Where Group capital requirements are less than the aggregate of operating entity capital requirements, double leverage can be used to improve Group capital efficiency provided it is managed appropriately. In 2021, we updated the basis of preparation for the calculation of double leverage, to better reflect the economics of the risk and align with the Group accounting view. The Group recognises that double leverage can give rise to holding company cash flow risk, and the risk framework reflects the view that the holding company should be a source of support for its subsidiaries in times of stress. Double leverage is one of the constraints on managing our capital position, given the complexity of the Group’s subsidiary structure and the multiple regulatory regimes under which we operate. As a matter of long-standing policy, the holding company retains a substantial holdings capital buffer comprising high-quality liquid assets (‘HQLA’), which at 31 December 2021 was in excess of $13bn. The portfolio of HQLA helps to mitigate the risks associated with double leverage. Further mitigation is provided by additional tier 1 (‘AT1’) securities issued in excess of the regulatory requirements of our subsidiaries.
We aim to ensure that management has oversight of our liquidity and funding risks at Group and entity level by maintaining comprehensive policies, metrics and controls. We manage liquidity and funding risk at an operating entity level to make sure that obligations can be met in the jurisdiction where they fall due, generally without reliance on other parts of the Group. Operating
entities are required to meet internal minimum requirements and any applicable regulatory requirements at all times. These requirements are assessed through the ILAAP, which ensures that operating entities have robust strategies, policies, processes and systems for the identification, measurement, management and monitoring of liquidity risk over an appropriate set of time horizons, including intra-day. The ILAAP informs the validation of risk tolerance and the setting of risk appetite. It also assesses the capability to manage liquidity and funding effectively in each major entity. These metrics are set and managed locally but are subject to robust global review and challenge to ensure consistency of approach and application of the Group’s policies and controls.
Planning and performance
Capital and risk-weighted asset (‘RWA’) plans form part of the annual financial resource plan that is approved by the Board. Capital and RWA forecasts are submitted to the Group Executive Committee on a monthly basis, and capital and RWAs are monitored and managed against the plan. The responsibility for global capital allocation principles rests with the Group Chief Financial Officer, supported by the Group Capital Management Meeting. This is a specialist forum addressing capital management, reporting into Holdings ALCO.
Through our internal governance processes, we seek to strengthen discipline over our investment and capital allocation decisions, and to ensure that returns on investment meet management’s objectives. Our strategy is to allocate capital to businesses and entities to support growth objectives where returns above internal hurdle levels have been identified and in order to meet their regulatory and economic capital needs. We evaluate and manage business returns by using a return on average tangible equity measure.
Funding and liquidity plans form part of the financial resource plan that is approved by the Board. The Board-level appetite measures are the LCR and net stable funding ratio (‘NSFR’), together with an internal liquidity metric which was introduced in January 2021 to supplement the LCR and NSFR. In addition, we use a wider set of measures to manage an appropriate funding and liquidity profile, including legal entity depositor concentration limits, intra-day liquidity, forward-looking funding assessments and other key measures.
Risks to capital and liquidity
Outside the stress testing framework, other risks may be identified that have the potential to affect our RWAs, capital and/or liquidity position. Downside and Upside scenarios are assessed against our management objectives, and mitigating actions are assigned as necessary. We closely monitor future regulatory changes and continue to evaluate the impact of these upon our capital and liquidity requirements. These include the UK’s implementation of amendments to the Capital Requirements Regulation (‘CRR II’), the Basel III Reforms, and the regulatory impact from the UK’s withdrawal from the EU, as well as other regulatory statements including changes to internal ratings-based (‘IRB’) modelling requirements.
Regulatory developments
The PRA has confirmed that software assets are deducted in full from CET1 capital, starting 1 January 2022. This reverses the beneficial changes to the treatment of software assets that were implemented as part of the EU’s response to the Covid-19 pandemic. As a result, the CET1 capital ratio will reduce by approximately 25bps.
Overall, we expect RWAs to increase by around 3% as a result of changes in regulations during 2022. These include the changes to the UK’s version of the CRR II, as well as other regulatory statements including changes to IRB modelling requirements and the expiry of transitional provisions in relation to the UK’s withdrawal from the EU. The CRR II changes, including the PRA’s new rules on NSFR, counterparty credit risk, equity investment in funds, and leverage ratio, will be reflected in disclosures starting in the first quarter of 2022.
Further changes will occur with the introduction of the remaining Basel III Reforms on which the PRA is expected to consult in the second half of 2022. We currently do not foresee a material net impact on initial implementation. The RWA output floor under the Basel III reforms will be subject to a five-year transitional provision. Any impact from the output floor would be towards the end of the transition period.
Regulatory reporting processes and controls
The quality of regulatory reporting remains a key priority for management and regulators. Notably, the PRA published a Dear CEO letter addressed to UK regulated banks, which highlighted areas of concern over the processes firms use to deliver regulatory returns. Recent sanctions issued by the PRA demonstrate their intent in this respect. We are progressing with a comprehensive programme to strengthen our processes, improve consistency, and enhance controls on various aspects of regulatory reporting. We have commissioned a number of independent external reviews, some at the request of our regulators, including one on our credit risk RWA reporting process, which is currently ongoing. As a result of these initiatives, there may be an impact on some of our regulatory ratios, such as the CET1 and LCR.
Stress testing and recovery planning
The Group uses stress testing to evaluate the robustness of plans and risk portfolios including the impact of ECL, and to meet the stress testing requirements set by supervisors. Stress testing also informs the ICAAP and ILAAP and supports recovery planning in many jurisdictions. It is an important output used to evaluate how much capital and liquidity the Group requires in setting risk appetite for capital and liquidity risk. It is also used to re-evaluate business plans where analysis shows capital, liquidity and/or returns do not meet their target.
In addition to a range of internal stress tests, we are subject to supervisory stress testing in many jurisdictions. These include the programmes of the Bank of England, the US Federal Reserve Board, the European Banking Authority, the European Central Bank and the Hong Kong Monetary Authority, as well as stress tests undertaken in other jurisdictions. The results of regulatory stress testing and our internal stress tests are used when assessing our internal capital requirements through the ICAAP. The outcomes of stress testing exercises carried out by the PRA and other regulators feed into the setting of regulatory minimum ratios and buffers.
The Group and subsidiaries have established recovery plans, which set out potential options management could take in a range of stress scenarios that could result in a breach of capital or liquidity buffers. All entities monitor internal and external triggers that could threaten their capital, liquidity or funding positions. Entities have established recovery plans providing detailed actions that management would consider taking in a stress scenario should their positions deteriorate and threaten to breach risk appetite and regulatory minimum levels. This is to help ensure that our capital and liquidity position can be recovered even in an extreme stress event.
Overall, recovery and resolution plans form part of the integral framework safeguarding the Group’s financial stability. The Group is committed to developing its recovery and resolution capabilities further, including in relation to the BoE’s Resolvability Assessment Framework.
Measurement of interest rate risk in the banking book processes
Assessment and risk appetite
Interest rate risk in the banking book is the risk of an adverse impact to earnings or capital due to changes in market interest rates. It is generated by our non-traded assets and liabilities, specifically loans, deposits and financial instruments that are not held for trading intent or in order to hedge positions held with trading intent. Interest rate risk that can be economically hedged may be transferred to the Markets Treasury business. Hedging is generally executed through interest rate derivatives or fixed-rate government bonds. Any interest rate risk that Markets Treasury
cannot economically hedge is not transferred and will remain within the global business where the risks originate.
The Global Treasury function uses a number of measures to monitor and control interest rate risk in the banking book, including:
•net interest income sensitivity; and
•economic value of equity sensitivity
Net interest income sensitivity
A principal part of our management of non-traded interest rate risk is to monitor the sensitivity of expected net interest income (‘NII’) under varying interest rate scenarios (i.e. simulation modelling), where all other economic variables are held constant. This monitoring is undertaken at an entity level by local ALCOs, where entities calculate both one-year and five-year NII sensitivities across a range of interest rate scenarios.
NII sensitivity figures represent the effect of pro forma movements in projected yield curves based on a static balance sheet size and structure. The exception to this is where the size of the balances or repricing is deemed interest rate sensitive, for example, non-interest-bearing current account migration and fixed-rate loan early prepayment. These sensitivity calculations do not incorporate actions that would be taken by Markets Treasury or in the business that originates the risk to mitigate the effect of interest rate movements.
The NII sensitivity calculations assume that interest rates of all maturities move by the same amount in the ‘up-shock’ scenario. The sensitivity calculations in the ‘down-shock’ scenarios reflect no floors to the shocked market rates. However, customer product-specific interest rate floors are recognised where applicable.
Economic value of equity sensitivity
Economic value of equity (‘EVE’) represents the present value of the future banking book cash flows that could be distributed to equity holders under a managed run-off scenario. This equates to the current book value of equity plus the present value of future NII in this scenario. EVE can be used to assess the economic capital required to support interest rate risk in the banking book. An EVE sensitivity represents the expected movement in EVE due to pre-specified interest rate shocks, where all other economic variables are held constant. Operating entities are required to monitor EVE sensitivities as a percentage of capital resources.
Further details of HSBC’s risk management of interest rate risk in the banking book can be found in the Group’s Pillar 3 Disclosures at 31 December 2021.
Other Group risks
Non-trading book foreign exchange exposures
Structural foreign exchange exposures
Structural foreign exchange exposures represent net assets or capital investments in subsidiaries, branches, joint arrangements or associates, together with any associated hedges, the functional currencies of which are currencies other than the US dollar. An entity’s functional currency is normally that of the primary economic environment in which the entity operates.
Exchange differences on structural exposures are recognised in other comprehensive income (‘OCI’). We use the US dollar as our presentation currency in our consolidated financial statements because the US dollar and currencies linked to it form the major currency bloc in which we transact and fund our business. Therefore, our consolidated balance sheet is affected by exchange differences between the US dollar and all the non-US dollar functional currencies of underlying subsidiaries.
Our structural foreign exchange exposures are managed with the primary objective of ensuring, where practical, that our consolidated capital ratios and the capital ratios of individual banking subsidiaries are largely protected from the effect of changes in exchange rates.
We hedge structural foreign exchange positions where it is capital efficient to do so, and subject to approved limits. This is achieved
through a combination of net investment hedges and economic hedges. Hedging positions are monitored and rebalanced periodically to manage RWA or downside risks associated with HSBC’s foreign currency investments.
For further details of our structural foreign exchange exposures, see page 235.
Transactional foreign exchange exposures
Transactional foreign exchange exposures arise from transactions in the banking book generating profit and loss or OCI reserves in a currency other than the reporting currency of the operating entity. Transactional foreign exchange exposure generated through profit and loss is periodically transferred to Markets and Securities Services and managed within limits with the exception of limited residual foreign exchange exposure arising from timing differences or for other reasons. Transactional foreign exchange exposure generated through OCI reserves is managed by the Markets Treasury business within a limit framework to be agreed in the first half of 2022.
HSBC Holdings risk management
As a financial services holding company, HSBC Holdings has limited market risk activities. Its activities predominantly involve maintaining sufficient capital resources to support the Group’s diverse activities; allocating these capital resources across the Group’s businesses; earning dividend and interest income on its investments in the businesses; payment of operating expenses; providing dividend payments to its equity shareholders and interest payments to providers of debt capital; and maintaining a supply of short-term liquid assets for deployment under extraordinary circumstances.
The main market risks to which HSBC Holdings is exposed are banking book interest rate risk and foreign currency risk. Exposure to these risks arises from short-term cash balances, funding positions held, loans to subsidiaries, investments in long-term financial assets, financial liabilities including debt capital issued and structural foreign exchange hedges. The objective of HSBC Holdings’ market risk management strategy is to manage volatility in capital resources, cash flows and distributable reserves that could be caused by movements in market parameters. Market risk for HSBC Holdings is monitored by Holdings ALCO in accordance with its risk appetite statement.
HSBC Holdings uses interest rate swaps and cross-currency interest rate swaps to manage the interest rate risk and foreign currency risk arising from its long-term debt issues and forward foreign exchange contracts to manage its structural foreign exchange exposures.
For quantitative disclosures on interest rate risk in the banking book, see pages 236 to 237.
Pension risk management processes
Our global pensions strategy is to move from defined benefit to defined contribution plans, where local law allows and it is considered competitive to do so. We will continue to review and enhance our risk appetite metrics to assist the internal monitoring of our de-risking programmes.
In defined contribution pension plans, the contributions that HSBC is required to make are known, while the ultimate pension benefit will vary, typically with investment returns achieved by investment choices made by the employee. While the market risk to HSBC of defined contribution plans is low, the Group is still exposed to operational and reputational risk.
In defined benefit pension plans, the level of pension benefit is
known. Therefore, the level of contributions required by HSBC will vary due to a number of risks, including:
•investments delivering a return below that required to provide the projected plan benefits;
•the prevailing economic environment leading to corporate failures, thus triggering write-downs in asset values (both equity and debt);
•a change in either interest rates or inflation expectations, causing an increase in the value of plan liabilities; and
•plan members living longer than expected (known as longevity risk).
Pension risk is assessed using an economic capital model that takes into account potential variations in these factors. The impact of these variations on both pension assets and pension liabilities is assessed using a one-in-200-year stress test. Scenario analysis and other stress tests are also used to support pension risk management.
To fund the benefits associated with defined benefit plans, sponsoring Group companies, and in some instances employees, make regular contributions in accordance with advice from actuaries and in consultation with the plan’s fiduciaries where relevant. These contributions are normally set to ensure that there are sufficient funds to meet the cost of the accruing benefits for the future service of active members. However, higher contributions are required when plan assets are considered insufficient to cover the existing pension liabilities. Contribution rates are typically revised annually or once every three years, depending on the plan.
The defined benefit plans invest contributions in a range of investments designed to limit the risk of assets failing to meet a plan’s liabilities. Any changes in expected returns from the investments may also change future contribution requirements. In pursuit of these long-term objectives, an overall target allocation is established between asset classes of the defined benefit plan. In addition, each permitted asset class has its own benchmarks, such as stock-market or property valuation indices or liability characteristics. The benchmarks are reviewed at least once every three to five years and more frequently if required by local legislation or circumstances. The process generally involves an extensive asset and liability review.
In addition, some of the Group’s pension plans hold longevity swap contracts. These arrangements provide long-term protection to the relevant plans against costs resulting from pensioners or their dependants living longer than initially expected. The most sizeable plan to do this is the HSBC Bank (UK) Pension Scheme, which holds longevity swaps covering approximately 60% of the plan’s pensioner liabilities.
Capital risk in 2021
Capital overview
| | | | | | | | | |
| Capital adequacy metrics |
| | At |
| | 31 Dec | 31 Dec |
| | 2021 | 2020 |
| | | |
| Risk-weighted assets (‘RWAs’) ($bn) | | | |
| Credit risk | | 680.6 | | 691.9 | |
| Counterparty credit risk | | 35.9 | | 42.8 | |
| Market risk | | 32.9 | | 28.5 | |
| Operational risk | | 88.9 | | 94.3 | |
| Total RWAs | | 838.3 | | 857.5 | |
| Capital on a transitional basis ($bn) | | | |
| Common equity tier 1 (‘CET1’) capital | | 132.6 | | 136.1 | |
| Tier 1 capital | | 156.3 | | 160.2 | |
| Total capital | | 177.8 | | 184.4 | |
| Capital ratios on a transitional basis (%) | | | |
| Common equity tier 1 ratio | | 15.8 | | 15.9 | |
| Tier 1 ratio | | 18.6 | | 18.7 | |
| Total capital ratio | | 21.2 | | 21.5 | |
| Capital on an end point basis ($bn) | | | |
| Common equity tier 1 (‘CET1’) capital | | 132.6 | | 136.1 | |
| Tier 1 capital | | 155.0 | | 158.5 | |
| Total capital | | 167.5 | | 173.2 | |
| Capital ratios on an end point basis (%) | | | |
| Common equity tier 1 ratio | | 15.8 | | 15.9 | |
| Tier 1 ratio | | 18.5 | | 18.5 | |
| Total capital ratio | | 20.0 | | 20.2 | |
| Liquidity coverage ratio (‘LCR’) | | | |
| Total high-quality liquid assets ($bn) | | 717.0 | 677.9 |
| Total net cash outflow ($bn) | | 518.0 | 487.3 |
| LCR ratio (%) | | 138.4 | | 139.1 | |
References to EU regulations and directives (including technical standards) should, as applicable, be read as references to the UK’s version of such regulation or directive, as onshored into UK law under the European Union (Withdrawal) Act 2018, and as may be subsequently amended under UK law.
Capital figures and ratios in the previous table are calculated in accordance with the revised Capital Requirements Regulation and Directive, as implemented (‘CRR II’). The table presents them under the transitional arrangements in CRR II for capital instruments and after their expiry, known as the end point. The end point figures in the table above include the benefit of the regulatory transitional arrangements in CRR II for IFRS 9, which are more fully described below. Where applicable, they also reflect government relief schemes intended to mitigate the impact of the Covid-19 pandemic.
At 31 December 2021, our common equity tier 1 (‘CET1’) capital ratio decreased to 15.8% from 15.9% at 31 December 2020. RWAs decreased due to RWA reductions under the transformation programme and favourable movements in asset quality. CET1 capital fell due to higher regulatory deductions and fair value movements net of capital generation.
Own funds
The $3.5bn fall in CET1 capital was mainly as a result of:
•a $2.9bn net increase in deductions for excess expected loss, investment in financial sector entities and defined benefit pension assets surplus;
•$2.5bn unfavourable foreign currency translation differences; and
•a $2.2bn decrease in fair value through other comprehensive income reserve.
These decreases were partly offset by capital generation of $3.9bn through profits net of share buy-back, foreseeable dividend and dividends paid.
Our Pillar 2A requirement at 31 December 2021, as per the PRA’s Individual Capital Requirement based on a point-in-time assessment, was $22.5bn, equivalent to 2.7% of RWAs, of which 1.5% was required to be met by CET1. With effect from 31 December 2021, structural foreign exchange risk is capitalised in RWAs under Pillar 1, with a consequent reduction in Pillar 2A. Going forward, structural foreign exchange risk will be assessed for Pillar 2A in the same manner as other risks capitalised under Pillar 1.
| | | | | | | | | | | | |
| Own funds disclosure |
| (Audited) | | | |
| | At |
| | 31 Dec | | 31 Dec |
| | 2021 | | 2020 |
| Ref* | | $m | | $m |
| Common equity tier 1 (‘CET1’) capital: instruments and reserves | | | |
| 1 | Capital instruments and the related share premium accounts | 23,513 | | | 23,219 | |
| – ordinary shares | 23,513 | | | 23,219 | |
| 2 | Retained earnings1 | 121,059 | | | 126,314 | |
| 3 | Accumulated other comprehensive income (and other reserves) | 8,273 | | | 9,768 | |
| 5 | Minority interests (amount allowed in consolidated CET1) | 4,186 | | | 4,079 | |
| 5a | Independently reviewed interim net profits net of any foreseeable charge or dividend | 5,887 | | | (252) | |
| 6 | Common equity tier 1 capital before regulatory adjustments1 | 162,918 | | | 163,128 | |
| | | | |
| | | | |
| | | | |
| | | | |
| | | | |
| | | | |
| | | | |
| | | | |
| | | | |
| | | | |
| 28 | Total regulatory adjustments to common equity tier 11 | (30,353) | | | (27,078) | |
| 29 | Common equity tier 1 capital | 132,565 | | | 136,050 | |
| | | | |
| | | | |
| | | | |
| | | | |
| | | | |
| | | | |
| 36 | Additional tier 1 capital before regulatory adjustments | 23,787 | | | 24,183 | |
| | | | |
| | | | |
| | | | |
| | | | |
| 43 | Total regulatory adjustments to additional tier 1 capital | (60) | | | (60) | |
| 44 | Additional tier 1 capital | 23,727 | | | 24,123 | |
| 45 | Tier 1 capital | 156,292 | | | 160,173 | |
| | | | |
| | | | |
| | | | |
| | | | |
| | | | |
| | | | |
| | | | |
| 51 | Tier 2 capital before regulatory adjustments | 23,018 | | | 25,722 | |
| | | | |
| | | | |
| | | | |
| 57 | Total regulatory adjustments to tier 2 capital | (1,524) | | | (1,472) | |
| 58 | Tier 2 capital | 21,494 | | | 24,250 | |
| 59 | Total capital | 177,786 | | | 184,423 | |
* The references identify the lines prescribed in the European Banking Authority (‘EBA’) template, which are applicable and where there is a value.
1The figures for 31 December 2020 have been restated to reflect the reclassification of the IFRS 9 transitional adjustment from retained earnings (within row 6) to ‘Total regulatory adjustments to common equity tier 1’ (row 28).
Throughout 2021, we complied with the PRA’s regulatory capital adequacy requirements, including those relating to stress testing.
Regulatory and other developments
During 2022, we expect our CET1 ratio to be affected by regulatory developments including:
• the change in the treatment of software assets;
• the implementation of the standardised approach for counterparty credit risk calculation, which came into effect on 1 January 2022;
•measures to improve the comparability of internal ratings-based (‘IRB’) models, including the introduction of a minimum risk weight for performing mortgage portfolios in the UK; and
•the expiry of transitional provisions in relation to the UK’s withdrawal from the EU.
Based on our capital position at 31 December 2021, we would expect that the proposed classification of our retail banking operations in France as being held for sale would reduce our CET1 ratio by around 30bps. Separately, our recent strategic actions are likely to lead to a fall in our CET1 ratio of around 15bps, of which we expect approximately half will occur in the first quarter of 2022. These actions include the acquisitions of AXA Singapore, L&T Investment Management and HSBC Life China, and the exit of mass market retail banking in the US.
Risk-weighted assets
| | | | | | | | | | | | | | | | | |
| RWAs by global business |
| WPB | CMB | GBM | Corporate Centre | Total |
| $bn | $bn | $bn | $bn | $bn |
| Credit risk | 143.0 | | 305.4 | | 151.8 | | 80.4 | | 680.6 | |
| Counterparty credit risk | 1.1 | | 0.7 | | 33.5 | | 0.6 | | 35.9 | |
| Market risk | 1.7 | | 0.9 | | 20.3 | | 10.0 | | 32.9 | |
| Operational risk | 32.5 | | 25.9 | | 30.6 | | (0.1) | | 88.9 | |
| At 31 Dec 2021 | 178.3 | | 332.9 | | 236.2 | | 90.9 | | 838.3 | |
| | | | | | | | | | | | | | | | | | | | | | | | | | |
| RWAs by geographical region |
| | Europe | | Asia | | MENA | | North
America | | Latin
America | | Total |
| | $bn | | $bn | | $bn | | $bn | | $bn | | $bn |
| Credit risk | | 193.7 | | | 318.1 | | | 50.6 | | | 90.6 | | | 27.6 | | | 680.6 | |
| Counterparty credit risk | | 19.4 | | | 9.9 | | | 1.3 | | | 3.3 | | | 2.0 | | | 35.9 | |
Market risk1 | | 24.6 | | | 25.3 | | | 2.3 | | | 5.3 | | | 1.0 | | | 32.9 | |
| Operational risk | | 23.4 | | | 43.0 | | | 6.0 | | | 11.2 | | | 5.3 | | | 88.9 | |
| At 31 Dec 2021 | | 261.1 | | | 396.3 | | | 60.2 | | | 110.4 | | | 35.9 | | | 838.3 | |
1 RWAs are non-additive across geographical regions due to market risk diversification effects within the Group.
| | | | | | | | | | | | | | | | | | | | | | | | | | |
| RWA movement by global business by key driver |
| Credit risk, counterparty credit risk and operational risk | | | | |
| WPB | | CMB | | GBM | | | Corporate Centre | | Market
risk | | Total
RWAs |
| $bn | | $bn | | $bn | | | $bn | | $bn | | $bn |
| RWAs at 1 Jan 2021 | 171.2 | | | 326.8 | | | 242.2 | | | | 88.8 | | | 28.5 | | | 857.5 | |
| Asset size | 5.5 | | | 12.5 | | | (12.1) | | | | 0.6 | | | (1.8) | | | 4.7 | |
| Asset quality | (2.2) | | | (4.9) | | | (0.4) | | | | (0.5) | | | — | | | (8.0) | |
| Model updates | 2.0 | | | (0.4) | | | — | | | | — | | | (1.2) | | | 0.4 | |
| | | | | | | | | | | | |
| | | | | | | | | | | | |
| Methodology and policy | 3.4 | | | 3.3 | | | (9.8) | | | | (7.3) | | | 7.4 | | | (3.0) | |
| | | | | | | | | | | | |
| | | | | | | | | | | | |
| Acquisitions and disposals | (0.4) | | | — | | | — | | | | — | | | — | | | (0.4) | |
| Foreign exchange movements | (2.9) | | | (5.3) | | | (4.0) | | | | (0.7) | | | — | | | (12.9) | |
| Total RWA movement | 5.4 | | | 5.2 | | | (26.3) | | | | (7.9) | | | 4.4 | | | (19.2) | |
| RWAs at 31 Dec 2021 | 176.6 | | | 332.0 | | | 215.9 | | | | 80.9 | | | 32.9 | | | 838.3 | |
| | | | | | | | | | | | | | | | | | | | | | | | | | | | | |
| RWA movement by geographical region by key driver |
| Credit risk, counterparty credit risk and operational risk | | | | |
| Europe | | Asia | | MENA | | North
America | | Latin
America | | Market risk | | Total
RWAs |
| $bn | | $bn | | $bn | | $bn | | $bn | | $bn | | $bn |
| RWAs at 1 Jan 2021 | 260.8 | | | 363.3 | | | 57.8 | | | 113.1 | | | 34.0 | | | 28.5 | | | 857.5 | |
| Asset size | (15.9) | | | 17.2 | | | 2.3 | | | 0.8 | | | 2.1 | | | (1.8) | | | 4.7 | |
| Asset quality | 2.9 | | | (4.9) | | | (0.5) | | | (6.2) | | | 0.7 | | | — | | | (8.0) | |
| Model updates | — | | | 1.7 | | | — | | | (0.1) | | | — | | | (1.2) | | | 0.4 | |
| | | | | | | | | | | | | |
| | | | | | | | | | | | | |
| Methodology and policy | (5.5) | | | (3.2) | | | 0.6 | | | (2.3) | | | — | | | 7.4 | | | (3.0) | |
| | | | | | | | | | | | | |
| | | | | | | | | | | | | |
| Acquisitions and disposals | — | | | — | | | — | | | (0.4) | | | — | | | — | | | (0.4) | |
| Foreign exchange movements | (5.8) | | | (3.1) | | | (2.3) | | | 0.2 | | | (1.9) | | | — | | | (12.9) | |
| Total RWA movement | (24.3) | | | 7.7 | | | 0.1 | | | (8.0) | | | 0.9 | | | 4.4 | | | (19.2) | |
| RWAs at 31 Dec 2021 | 236.5 | | | 371.0 | | | 57.9 | | | 105.1 | | | 34.9 | | | 32.9 | | | 838.3 | |
| | | | | | | | | | | | | |
Risk-weighted assets (‘RWAs’) fell by $19.2bn during the year, including a drop of $12.9bn due to foreign currency translation differences. The $6.3bn decrease (excluding foreign currency translation differences) resulted from RWA saves and favourable movements in asset quality, which more than offset increases due
to lending growth and regulatory change. At 31 December 2021, our cumulative RWA saves as part of our transformation programme were $104bn, including accelerated reductions of $9.6bn from 31 December 2019.
Asset size
The $12.5bn increase in CMB RWAs reflected corporate loan growth in mainland China, Hong Kong and North America, while lending in Europe reduced.
WPB RWAs rose by $5.5bn, primarily due to lending growth in Asia, largely in the mortgage portfolio. Sovereign exposures drove the $0.6bn rise in Corporate Centre RWAs.
The $12.1bn fall in GBM was mostly due to lower lending, management initiatives and mark-to-market movements in Europe, North America and Latin America, partly offset by growth in Asia.
Market risk RWAs decreased by $1.8bn, largely as a result of reduced exposures and risk mitigation actions.
Asset quality
The RWA decreases in CMB, WPB and Corporate Centre were mostly due to favourable portfolio mix changes in Asia and North America, and credit migration in Europe and North America.
In GBM, favourable portfolio mix changes in Asia and credit migration in North America were partly offset by increases in the UK due to portfolio changes, leading to an overall fall of $0.4bn.
Model updates
The $2.0bn increase in WPB was mostly due to changes to our Australian mortgages model.
This was partly offset by the $1.2bn reduction in market risk RWAs, largely from the implementation of an options risk model. The fall in CMB RWAs was driven by corporate model updates.
Methodology and policy
Changes to Markets Treasury allocation methodologies decreased RWAs in Corporate Centre and increased RWAs in WPB, CMB and GBM. However, the increase in GBM was more than offset by parameter refinements across our major regions.
The $7.4bn rise in market risk included an $8.4bn increase on our adoption of a Pillar 1 approach to the capitalisation of structural foreign exchange risk, following confirmation from the PRA. This was partly offset by enhancements to foreign exchange risk calculations under the standardised approach.
Acquisitions and disposals
The sale of a US credit card portfolio led to a $0.4bn fall in WPB RWAs.
Leverage ratio1
| | | | | | | | | | | | |
| | At |
| | 31 Dec | | 31 Dec |
| | 2021 | | 2020 |
| Ref* | | $bn | | $bn |
| 20 | Tier 1 capital | 155.0 | | | 158.5 | |
| 21 | Total leverage ratio exposure | 2,962.7 | | | 2,897.1 | |
| | % | | % |
| 22 | Leverage ratio | 5.2 | | | 5.5 | |
| EU-23 | Choice of transitional arrangements for the definition of the capital measure | Fully phased-in | | Fully phased-in |
| UK leverage ratio exposure – quarterly average2 | 2,545.6 | | | 2,555.5 | |
| | % | | % |
| UK leverage ratio – quarterly average2 | 6.0 | | | 6.1 | |
| UK leverage ratio – quarter end2 | 6.2 | | | 6.2 | |
* The references identify the lines prescribed in the EBA template.
1 The CRR II regulatory transitional arrangements for IFRS 9 are applied in both leverage ratio calculations.
2 UK leverage ratio denotes the Group’s leverage ratio calculated under the PRA’s UK leverage framework. This measure excludes from the calculation of exposure qualifying central bank balances and loans under the UK Bounce Back Loan Scheme.
Our leverage ratio calculated in accordance with the Capital Requirements Regulation was 5.2% at 31 December 2021, down from 5.5% at 31 December 2020, due to a decrease in tier 1 capital and an increase in leverage exposure, primarily due to growth in central bank deposits and customer lending, offset by a decrease in financial investments.
At 31 December 2021, our UK minimum leverage ratio requirement of 3.25% under the PRA’s UK leverage framework was supplemented by an additional leverage ratio buffer of 0.7% and a countercyclical leverage ratio buffer of 0.1%. These additional buffers translated into capital values of $17.6bn and $2.5bn respectively. We exceeded these leverage requirements.
Regulatory transitional arrangements for IFRS 9 ‘Financial Instruments’
We have adopted the regulatory transitional arrangements in CRR II for IFRS 9, including paragraph four of article 473a. Our capital and ratios are presented under these arrangements throughout the tables in this section, including in the end point figures. Without their application, our CET1 ratio would be 15.7%.
The IFRS 9 regulatory transitional arrangements allow banks to add back to their capital base a proportion of the impact that IFRS 9 has upon their loan loss allowances. The impact is defined as:
• the increase in loan loss allowances on day one of IFRS 9 adoption; and
•any subsequent increase in ECL in the non-credit-impaired book thereafter.
Any add-back must be tax affected and accompanied by a recalculation of exposure and RWAs. The impact is calculated separately for portfolios using the standardised (‘STD’) and internal ratings-based (‘IRB’) approaches. For IRB portfolios, there is no add-back to capital unless loan loss allowances exceed regulatory 12-month expected losses.
The EU’s CRR II ‘Quick Fix’ relief package enacted in June 2020 increased from 70% to 100% the relief that banks may take for loan loss allowances recognised since 1 January 2020 on the
non-credit-impaired book.
In the current period, the add-back to CET1 capital amounted to $1.0bn under the STD approach with a tax impact of $0.2bn. At 31 December 2020, the add-back to the capital base under the STD approach was $1.6bn with a tax impact of $0.4bn.
Pillar 3 disclosure requirements
Pillar 3 of the Basel regulatory framework is related to market discipline and aims to make financial services firms more transparent by requiring publication of wide-ranging information on their risks, capital and management. Our Pillar 3 Disclosures at 31 December 2021 is published on our website at www.hsbc.com/investors.
Liquidity and funding risk in 2021
Liquidity metrics
At 31 December 2021, all of the Group’s material operating entities were above regulatory minimum liquidity and funding levels.
Each entity maintains sufficient unencumbered liquid assets to comply with local and regulatory requirements. The liquidity value of these assets for each entity is shown in the following table along with the individual LCR levels based on European Commission Delegated Regulation (EU) 2015/61. This basis may differ from local LCR measures due to differences in the way non-EU regulators have implemented the Basel III standards. Each
entity maintains sufficient stable funding relative to the required stable funding assessed using the NSFR or other appropriate metrics. From 1 January 2022, we started managing funding risk based on the PRA’s NSFR rules.
In addition to regulatory metrics, we enhanced our liquidity framework in 2021 to include an internal liquidity metric, which is being used to monitor and manage liquidity risk via a low-point measure across a 270-day horizon, taking into account recovery capacity.
The Group liquidity and funding position at the end of 2021 is analysed in the following sections.
| | | | | | | | | | | | | | |
| Operating entities’ liquidity |
| At 31 December 2021 |
| LCR | HQLA | Net outflows | NSFR |
| % | $bn
| $bn | % |
HSBC UK Bank plc (ring-fenced bank)1 | 241 | | 163 | | 68 | | 178 | |
HSBC Bank plc (non-ring-fenced bank)2 | 150 | | 135 | | 90 | | 107 | |
The Hongkong and Shanghai Banking Corporation – Hong Kong branch3 | 154 | | 145 | | 94 | | 135 | |
The Hongkong and Shanghai Banking Corporation – Singapore branch3 | 179 | | 18 | | 10 | | 145 | |
| Hang Seng Bank | 169 | | 43 | | 25 | | 144 | |
| HSBC Bank China | 141 | | 17 | | 12 | | 130 | |
| HSBC Bank USA | 119 | | 98 | | 83 | | 140 | |
HSBC Continental Europe4, 5 | 145 | | 54 | | 37 | | 128 | |
| HSBC Bank Middle East Ltd – UAE branch | 210 | | 12 | | 6 | | 146 | |
HSBC Canada4 | 119 | | 22 | | 18 | | 123 | |
| HSBC Mexico | 200 | | 9 | | 5 | | 141 | |
| | | | | | | | | | | | | | |
|
| | | | |
| | | | |
|
| | | | |
| At 31 December 2020 |
| | | | |
| | | | |
HSBC UK Bank plc (ring-fenced bank)1 | 198 | | 121 | | 61 | | 164 | |
HSBC Bank plc (non-ring-fenced bank)2 | 136 | | 138 | | 102 | | 124 | |
The Hongkong and Shanghai Banking Corporation – Hong Kong branch3 | 195 | | 146 | | 75 | | 146 | |
The Hongkong and Shanghai Banking Corporation – Singapore branch3 | 162 | | 16 | | 10 | | 135 | |
| Hang Seng Bank | 212 | | 50 | | 24 | | 151 | |
| HSBC Bank China | 232 | | 24 | | 10 | | 158 | |
| HSBC Bank USA | 130 | | 106 | | 82 | | 130 | |
HSBC Continental Europe4 | 143 | | 48 | | 34 | | 130 | |
| HSBC Bank Middle East Ltd – UAE branch | 280 | | 11 | | 4 | | 164 | |
HSBC Canada4 | 165 | | 30 | | 18 | | 136 | |
| HSBC Mexico | 198 | | 10 | | 5 | | 139 | |
1HSBC UK Bank plc refers to the HSBC UK liquidity group, which comprises four legal entities: HSBC UK Bank plc, Marks and Spencer Financial Services plc, HSBC Private Bank (UK) Ltd and HSBC Trust Company (UK) Limited, managed as a single operating entity, in line with the application of UK liquidity regulation as agreed with the PRA.
2HSBC Bank plc includes oversea branches and special purpose entities consolidated by HSBC for financial statements purposes.
3The Hongkong and Shanghai Banking Corporation – Hong Kong branch and The Hongkong and Shanghai Banking Corporation – Singapore branch represent the material activities of The Hongkong and Shanghai Banking Corporation Limited. Each branch is monitored and controlled for liquidity and funding risk purposes as a stand-alone operating entity.
4HSBC Continental Europe and HSBC Canada represent the consolidated banking operations of the Group in France and Canada, respectively. HSBC Continental Europe and HSBC Canada are each managed as single distinct operating entities for liquidity purposes.
5The net stable funding ratio for HSBC Continental Europe is based on the EU’s CRR II rules.
At 31 December 2021, all of the Group’s principal operating entities were above regulatory minimum levels.
The most significant movements in 2021 are explained below:
•HSBC UK Bank plc retained a strong liquidity position, reflecting growth in its commercial surplus that was driven by customer deposits and the drawdown of a central bank term funding scheme.
•HSBC Bank plc’s liquidity ratio increased to 150%, mainly due to growth in customer deposits and a decline in loans.
•HSBC Continental Europe maintained a strong liquidity position, reflecting growth in deposits.
•The Hongkong and Shanghai Banking Corporation – Hong Kong branch’s liquidity position remained strong, although its
liquidity ratio dropped to 154%, mainly due to growth in equity holding and loans.
•Hang Seng Bank’s liquidity ratio dropped to 169%, mainly due to growth in loans.
•HSBC Bank China’s liquidity ratio dropped to 141%, mainly driven by growth in loans coupled with lower deposits and debt issuances.
•HSBC Bank Middle East Ltd – UAE branch retained a strong liquidity position, with a liquidity ratio of 210%.
•HSBC Canada’s liquidity ratio dropped to 119%, mainly driven by the maturity of the short-term funding raised during the pandemic and growth in loans.
Consolidated liquidity metrics
Liquidity coverage ratio
At 31 December 2021, the total HQLA held at entity level amounted to $880bn (31 December 2020: $857bn), an increase of $23bn. In 2021, we implemented a revised approach to the application of the requirements under the European Commission Delegated Regulation (EU) 2015/61. This revised approach was used to assess the limitations in the transferability of entity liquidity around the Group and resulted in an adjustment of $163bn to LCR HQLA and $9bn to LCR inflows. This reflected an increase in the adjustment of $62bn compared with the approach used for the disclosure in the Annual Report and Accounts 2020. The change in methodology was designed to better incorporate local regulatory restrictions on the transferability of liquidity.
| | | | | | | | | | | |
| At |
| 31 Dec | 30 Jun | 31 Dec |
| 2021 | 2021 | 20201 |
| $bn | $bn | $bn |
| High-quality liquid assets (in entities) | 880 | 844 | 857 |
EC Delegated Act adjustment for transfer restrictions2 | (172) | (189) | (179) |
| Group LCR HQLA | 717 | 659 | 678 |
| Net outflows | 518 | 494 | 487 |
| Liquidity coverage ratio | 138% | 134% | 139% |
1 Group LCR numbers above for 31 December 2020 are based on the approach used before the methodology was revised.
2 This includes adjustments made to high-quality liquid assets and inflows in entities to reflect liquidity transfer restrictions
Liquid assets
After the $163bn adjustment, the Group LCR HQLA of $717bn (31 December 2020: $678bn) was held in a range of asset classes and currencies. Of these, 97% were eligible as level 1 (31 December 2020: 90%).
The following tables reflect the composition of the liquidity pool by asset type and currency at 31 December 2021.
| | | | | | | | | | | | | | |
| Liquidity pool by asset type |
| Liquidity pool | Cash | Level 11 | Level 21 |
| $bn | $bn | $bn | $bn |
| Cash and balance at central bank | 390 | | 390 | | — | | — | |
| Central and local government bonds | 302 | | — | | 281 | | 21 | |
| Regional government public sector entities | 3 | | — | | 2 | | 1 | |
| International organisation and multilateral developments banks | 9 | | — | | 9 | | — | |
| Covered bonds | 4 | | — | | 2 | | 2 | |
| Other | 9 | | — | | 8 | | 1 | |
| Total at 31 Dec 2021 | 717 | | 390 | | 302 | | 25 | |
| Total at 31 Dec 2020 | 678 | 307 | 301 | 70 |
1 As defined in EU regulations, level 1 assets means ‘assets of extremely high liquidity and credit quality’, and level 2 assets means ‘assets of high liquidity and credit quality’.
| | | | | | | | | | | | | | | | | | | | |
| Liquidity pool by currency |
| $ | £ | € | HK$ | Other | Total |
| $bn | $bn | $bn | $bn | $bn | $bn |
| Liquidity pool at 31 Dec 2021 | 189 | | 211 | | 104 | | 56 | | 157 | | 717 | |
| Liquidity pool at 31 Dec 2020 | 218 | | 176 | | 117 | | 74 | | 93 | | 678 | |
Sources of funding
Our primary sources of funding are customer current accounts and savings deposits payable on demand or at short notice. We issue secured and unsecured wholesale securities to supplement customer deposits, meet regulatory obligations and to change the currency mix, maturity profile or location of our liabilities.
The following ‘Funding sources’ and ‘Funding uses’ tables provide a view of how our consolidated balance sheet is funded. In practice, all the principal operating entities are required to manage liquidity and funding risk on a stand-alone basis.
The tables analyse our consolidated balance sheet according to the assets that primarily arise from operating activities and the sources of funding primarily supporting these activities. Assets and liabilities that do not arise from operating activities are presented at a net balancing source or deployment of funds.
| | | | | | | | |
| Funding sources |
| (Audited) |
| 2021 | 2020 |
| $m | $m |
| Customer accounts | 1,710,574 | | 1,642,780 | |
| Deposits by banks | 101,152 | | 82,080 | |
| Repurchase agreements – non-trading | 126,670 | | 111,901 | |
| Debt securities in issue | 78,557 | | 95,492 | |
| | |
| Cash collateral, margin and settlement accounts | 65,452 | | 78,565 | |
| Liabilities of disposal groups held for sale | 9,005 | | — | |
| Subordinated liabilities | 20,487 | | 21,951 | |
| Financial liabilities designated at fair value | 145,502 | | 157,439 | |
Liabilities under insurance contracts
| 112,745 | | 107,191 | |
| Trading liabilities | 84,904 | | 75,266 | |
| – repos | 11,004 | | 11,728 | |
| – stock lending | 2,332 | | 4,597 | |
| | |
| – other trading liabilities | 71,568 | | 58,941 | |
| Total equity | 206,777 | | 204,995 | |
Other balance sheet liabilities
| 296,114 | | 406,504 | |
| At 31 Dec | 2,957,939 | | 2,984,164 | |
| | |
| | |
| | |
| | |
| | |
| | |
| | |
| | |
| | |
| | |
| | |
| | |
| | |
| | |
| | |
| | |
| | |
| | | | | | | | |
| Funding uses |
| (Audited) |
| 2021 | 2020 |
| $m | $m |
| Loans and advances to customers | 1,045,814 | | 1,037,987 | |
| Loans and advances to banks | 83,136 | | 81,616 | |
| Reverse repurchase agreements – non-trading | 241,648 | | 230,628 | |
| | |
| Cash collateral, margin and settlement accounts | 59,884 | | 76,859 | |
| Assets held for sale | 3,411 | | 299 | |
| Trading assets | 248,842 | | 231,990 | |
| – reverse repos | 14,994 | | 13,990 | |
| – stock borrowing | 8,082 | | 8,286 | |
| | |
| – other trading assets | 225,766 | | 209,714 | |
| Financial investments | 446,274 | | 490,693 | |
| Cash and balances with central banks | 403,018 | | 304,481 | |
| Other balance sheet assets | 425,912 | | 529,611 | |
| At 31 Dec | 2,957,939 | | 2,984,164 | |
Wholesale term debt maturity profile
The maturity profile of our wholesale term debt obligations is set out in the following table.
The balances in the table are not directly comparable with those in the consolidated balance sheet because the table presents gross cash flows relating to principal payments and not the balance sheet carrying value, which includes debt securities and subordinated liabilities measured at fair value.
| | | | | | | | | | | | | | | | | | | | | | | | | | | | | |
| Wholesale funding cash flows payable by HSBC under financial liabilities by remaining contractual maturities |
| Due not
more than
1 month | Due over
1 month
but not more than
3 months | Due over
3 months
but not more than
6 months | Due over
6 months
but not more than
9 months | Due over
9 months
but not more
than
1 year | Due over
1 year
but not more than
2 years | Due over
2 years
but not more than
5 years | Due over
5 years | Total |
| $m | $m | $m | $m | $m | $m | $m | $m | $m |
| Debt securities issued | 17,602 | | 14,593 | | 9,293 | | 9,249 | | 5,233 | | 25,058 | | 55,388 | | 56,639 | | 193,055 | |
| – unsecured CDs and CP | 4,586 | | 6,795 | | 4,281 | | 2,837 | | 1,189 | | 947 | | 834 | | 931 | | 22,400 | |
| – unsecured senior MTNs | 8,542 | | 4,140 | | 2,633 | | 2,078 | | 2,074 | | 14,932 | | 45,063 | | 45,259 | | 124,721 | |
| – unsecured senior structured notes | 2,090 | | 1,610 | | 1,017 | | 975 | | 1,206 | | 2,996 | | 3,382 | | 8,604 | | 21,880 | |
| – secured covered bonds | — | | 1,137 | | — | | 997 | | — | | 2,417 | | 1,997 | | — | | 6,548 | |
| – secured asset-backed commercial paper | 956 | | — | | — | | — | | — | | — | | — | | — | | 956 | |
| – secured ABS | 1 | | 133 | | 33 | | 31 | | 193 | | 896 | | 1,696 | | 98 | | 3,081 | |
| – others | 1,427 | | 778 | | 1,329 | | 2,331 | | 571 | | 2,870 | | 2,416 | | 1,747 | | 13,469 | |
| Subordinated liabilities | — | | — | | 11 | | — | | — | | 417 | | 7,023 | | 21,274 | | 28,725 | |
| – subordinated debt securities | — | | — | | 11 | | — | | — | | 417 | | 7,023 | | 19,427 | | 26,878 | |
| – preferred securities | — | | — | | — | | — | | — | | — | | — | | 1,847 | | 1,847 | |
| At 31 Dec 2021 | 17,602 | | 14,593 | | 9,304 | | 9,249 | | 5,233 | | 25,475 | | 62,411 | | 77,913 | | 221,780 | |
| | | | | | | | | |
| | | | | | | | | |
|
| | | | | | | | | |
| | | | | | | | | |
| Debt securities issued | 18,057 | | 16,848 | | 20,314 | | 15,208 | | 7,561 | | 20,768 | | 49,948 | | 59,911 | | 208,615 | |
| – unsecured CDs and CP | 4,048 | | 8,440 | | 9,977 | | 6,186 | | 2,945 | | 1,474 | | 1,454 | | 1,546 | | 36,070 | |
| – unsecured senior MTNs | 9,625 | | 3,363 | | 3,915 | | 4,684 | | 2,005 | | 9,295 | | 35,834 | | 49,209 | | 117,930 | |
| – unsecured senior structured notes | 2,075 | | 1,539 | | 1,451 | | 1,242 | | 1,241 | | 3,702 | | 4,979 | | 6,765 | | 22,994 | |
| – secured covered bonds | — | | — | | 28 | | — | | 750 | | 2,514 | | 3,917 | | — | | 7,209 | |
| – secured asset-backed commercial paper | 1,094 | | — | | — | | — | | — | | — | | — | | — | | 1,094 | |
| – secured ABS | 19 | | 119 | | 171 | | 45 | | 41 | | 410 | | 1,865 | | 646 | | 3,316 | |
| – others | 1,196 | | 3,387 | | 4,772 | | 3,051 | | 579 | | 3,373 | | 1,899 | | 1,745 | | 20,002 | |
| Subordinated liabilities | 618 | | — | | 237 | | — | | 12 | | 12 | | 6,081 | | 22,941 | | 29,901 | |
| – subordinated debt securities | 618 | | — | | 237 | | — | | 12 | | 12 | | 6,081 | | 21,085 | | 28,045 | |
| – preferred securities | — | | — | | — | | — | | — | | — | | — | | 1,856 | | 1,856 | |
| At 31 Dec 2020 | 18,675 | | 16,848 | | 20,551 | | 15,208 | | 7,573 | | 20,780 | | 56,029 | | 82,852 | | 238,516 | |
Structural foreign exchange risk in 2021
Structural foreign exchange exposures represent net assets or capital investments in subsidiaries, branches, joint arrangements or associates, together with any associated hedges, the functional currencies of which are currencies other than the US dollar. Exchange differences on structural exposures are usually recognised in ‘Other comprehensive income’.
| | | | | | | | | | | | | | | | | | | | |
| Net structural foreign exchange exposures |
| 20211 |
| Currency of structural exposure | Net investment in foreign operations (excl non-controlling interest) | Net investment hedges | Structural foreign exchange exposures (pre-economic hedges) | Economic hedges – structural FX hedges2 | Economic hedges – equity securities (AT1)3 | Net structural foreign exchange exposures |
| $m | $m | $m | $m | $m | $m |
| Hong Kong dollars | 44,714 | | (4,992) | | 39,722 | | (7,935) | | — | | 31,787 | |
| Pounds sterling | 47,935 | | (15,717) | | 32,218 | | — | | (1,353) | | 30,865 | |
| Chinese renminbi | 35,879 | | — | | 35,879 | | (1,255) | | — | | 34,624 | |
| Euros | 14,671 | | — | | 14,671 | | — | | (4,262) | | 10,409 | |
| Canadian dollars | 5,147 | | (1,093) | | 4,054 | | — | | — | | 4,054 | |
| Indian rupees | 5,106 | | — | | 5,106 | | — | | — | | 5,106 | |
| Mexican pesos | 3,598 | | — | | 3,598 | | — | | — | | 3,598 | |
| Saudi riyals | 4,115 | | — | | 4,115 | | — | | — | | 4,115 | |
| UAE dirhams | 4,155 | | (700) | | 3,455 | | (1,985) | | — | | 1,470 | |
| Malaysian ringgit | 2,713 | | — | | 2,713 | | — | | — | | 2,713 | |
| Singapore dollars | 2,339 | | (680) | | 1,659 | | — | | (1,298) | | 361 | |
| Australian dollars | 2,300 | | — | | 2,300 | | — | | — | | 2,300 | |
| Taiwanese dollars | 2,105 | | (1,019) | | 1,086 | | — | | — | | 1,086 | |
| Indonesian rupiah | 1,748 | | — | | 1,748 | | — | | — | | 1,748 | |
| Swiss francs | 1,107 | | (809) | | 298 | | — | | — | | 298 | |
| Korean won | 1,219 | | (696) | | 523 | | — | | — | | 523 | |
| Thai baht | 859 | | — | | 859 | | — | | — | | 859 | |
| Egyptian pound | 1,051 | | — | | 1,051 | | — | | — | | 1,051 | |
| Qatari rial | 725 | | — | | 725 | | (332) | | — | | 393 | |
| Argentinian peso | 795 | | — | | 795 | | — | | — | | 795 | |
| | | | | | |
| Others, each less than $700m | 5,242 | | (200) | | 5,042 | | (36) | | — | | 5,006 | |
| At 31 Dec | 187,523 | | (25,906) | | 161,617 | | (11,543) | | (6,913) | | 143,161 | |
| | | | | | |
| 20201 |
| | | | | | |
| | | | | | |
| Hong Kong dollars | 47,623 | | — | | 47,623 | | (5,564) | | — | | 42,059 | |
| Pounds sterling | 46,506 | | (11,221) | | 35,285 | | — | | (1,365) | | 33,920 | |
| Chinese renminbi | 32,165 | | — | | 32,165 | | (1,191) | | — | | 30,974 | |
| Euros | 15,672 | | — | | 15,672 | | — | | (4,596) | | 11,076 | |
| Canadian dollars | 5,123 | | — | | 5,123 | | — | | — | | 5,123 | |
| Indian rupees | 4,833 | | — | | 4,833 | | — | | — | | 4,833 | |
| Mexican pesos | 4,139 | | — | | 4,139 | | — | | — | | 4,139 | |
| Saudi riyals | 3,892 | | — | | 3,892 | | — | | — | | 3,892 | |
| UAE dirhams | 3,867 | | — | | 3,867 | | (1,985) | | — | | 1,882 | |
| Malaysian ringgit | 2,771 | | — | | 2,771 | | — | | — | | 2,771 | |
| Singapore dollars | 2,473 | | — | | 2,473 | | — | | (1,324) | | 1,149 | |
| Australian dollars | 2,357 | | — | | 2,357 | | — | | — | | 2,357 | |
| Taiwanese dollars | 2,036 | | — | | 2,036 | | — | | — | | 2,036 | |
| Indonesian rupiah | 1,726 | | — | | 1,726 | | — | | — | | 1,726 | |
| Swiss francs | 1,444 | | — | | 1,444 | | — | | — | | 1,444 | |
| Korean won | 1,368 | | — | | 1,368 | | — | | — | | 1,368 | |
| Thai baht | 991 | | — | | 991 | | — | | — | | 991 | |
| Egyptian pound | 889 | | — | | 889 | | — | | — | | 889 | |
| Qatari rial | 667 | | — | | 667 | | (382) | | — | | 285 | |
| Argentinian peso | 614 | | — | | 614 | | — | | — | | 614 | |
| | | | | | |
| Others, each less than $700m | 5,577 | | — | | 5,577 | | (75) | | — | | 5,502 | |
| At 31 Dec | 186,733 | | (11,221) | | 175,512 | | (9,197) | | (7,285) | | 159,030 | |
1 Incremental hedging transactions were undertaken in 2021 to reduce structural foreign exchange risk. The disclosure has therefore been expanded and comparatives re-presented.
2 Represents hedges that do not qualify as net investment hedges for accounting purposes.
3 Represents foreign currency denominated preference share and AT1 instruments. These are accounted for at historical cost under IFRSs and do not qualify as net investment hedges for accounting purposes. The gain or loss arising from changes in the US dollar value of these instruments is recognised on redemption in retained earnings.
Shareholders’ equity would decrease by $2,981m (2020: $2,427m) if euro and sterling foreign currency exchange rates weakened by 5% relative to the US dollar.
Interest rate risk in the banking book in 2021
Net interest income sensitivity
The following tables set out the assessed impact to a hypothetical base case projection of our banking book NII under the following scenarios:
•an immediate shock of 25 basis points (‘bps’) to the current market-implied path of interest rates across all currencies on
1 January 2022 (effects over one year and five years);
•an immediate shock of 100bps to the current market-implied path of interest rates across all currencies on 1 January 2022 (effects over one year and five years).
The sensitivities shown represent a hypothetical simulation of the base case NII, assuming a static balance sheet, no management actions from the Markets Treasury business and a simplified 50% pass-on assumption applied for material entities as described below. This incorporates the effect of interest rate behaviouralisation, hypothetical managed rate product pricing assumptions and customer behaviour, including prepayment of mortgages under the specific interest rate scenarios. The scenarios represent interest rate shocks to the current market implied path of rates. The sensitivity calculations exclude pensions, insurance and investments in subsidiaries.
The NII sensitivity analysis performed in the case of a down-shock does not include floors to market rates, and it does not include floors on some wholesale assets and liabilities. However, floors have been maintained for deposits and loans to customers where this is contractual or where negative rates would not be applied.
As market and policy rates move, the degree to which these changes are passed on to customers will vary based on a number of factors, including the absolute level of market rates, regulatory and contractual frameworks, and competitive dynamics in particular markets. Previously we disclosed NII sensitivity using a range of different pass-on assumptions, varying by currency, product and market. To aid comparability between markets, we have simplified the basis of preparation for our disclosure, and have used a 50% pass-on assumption for major entities on certain
interest bearing deposits. Our pass-through asset assumptions are largely in line with our contractual agreements or established market practice, which typically results in a significant portion of interest rate changes being passed on. Using this basis has resulted in a modest reduction in interest rate sensitivities in comparison with the previous basis of preparation. Comparatives have not been restated.
The one-year and five-year NII sensitivities in the down-shock scenarios increased at 31 December 2021 at Group level when compared with 31 December 2020. This was driven by the changes in the forecasted yield curves and changes in balance sheet composition. The NII sensitivities are forecasted for the whole period of one and five years each quarter.
The NII sensitivities shown are hypothetical and based on simplified scenarios. Immediate interest rate rises of 25bps and 100bps would increase projected NII for the 12 months to
31 December 2022 by $1,309m and $5,414m, respectively. Conversely, falls of 25bps and 100bps would decrease projected NII for the 12 months to 31 December 2022 by $1,952m and $5,761m, respectively.
The sensitivity of NII for 12 months increased by $66m in the plus 100bps parallel shock and increased by $907m in the minus 100bps parallel shock, comparing 31 December 2021 with
31 December 2020. The increase in the sensitivity of NII for 12 months in the plus 100bps parallel shock was mainly driven by change in market sentiment, reflecting current market expectations of main policy rates and changes in pass-on assumptions referred to above.
The change in NII sensitivity for five years is also driven by the factors above.
The tables do not include Markets Treasury management actions or changes in Markets and Securities Services net trading income that may further limit the impact.
For further details on measurement of interest rate risk in the banking book, see page 227.
| | | | | | | | | | | | | | | | | | | | |
| NII sensitivity to an instantaneous change in yield curves (12 months) – 1 year NII sensitivity by currency |
| | | | | | |
| Currency | |
| $ | HK$ | £ | € | Other | Total |
| $m | $m | $m | $m | $m | $m |
| Change in Jan 2022 to Dec 2022 (based on balance sheet at 31 December 2021) | | | | | | |
| +25bps parallel | 125 | | 265 | | 420 | | 106 | | 393 | | 1,309 | |
| -25bps parallel | (257) | | (536) | | (594) | | (170) | | (395) | | (1,952) | |
| +100bps parallel | 458 | | 1,054 | | 1,739 | | 632 | | 1,532 | | 5,414 | |
| -100bps parallel | (466) | | (1,020) | | (2,070) | | (595) | | (1,610) | | (5,761) | |
| Change in Jan 2021 to Dec 2021 (based on balance sheet at 31 December 2020) | | | | | | |
| +25bps parallel | 223 | | 423 | | 555 | | 126 | | 320 | | 1,647 | |
| -25bps parallel | (227) | | (343) | | (548) | | (88) | | (302) | | (1,508) | |
| +100bps parallel | 546 | | 1,267 | | 1,811 | | 502 | | 1,222 | | 5,348 | |
| -100bps parallel | (565) | | (749) | | (1,906) | | (299) | | (1,335) | | (4,854) | |
.
| | | | | | | | | | | | | | | | | | | | |
| NII sensitivity to an instantaneous change in yield curves (5 years) – Cumulative 5 years NII sensitivity by currency |
| | | | | | |
| Currency | |
| $ | HK$ | £ | € | Other | Total |
| $m | $m | $m | $m | $m | $m |
| Change in Jan 2022 to Dec 2026 (based on balance sheet at 31 December 2021) | | | | | | |
| +25bps parallel | 1,026 | | 1,410 | | 3,333 | | 827 | | 2,510 | | 9,106 | |
| -25bps parallel | (1,701) | | (2,887) | | (4,216) | | (997) | | (2,600) | | (12,401) | |
| +100bps parallel | 3,922 | | 4,870 | | 13,389 | | 3,919 | | 9,841 | | 35,941 | |
| -100bps parallel | (5,060) | | (7,052) | | (14,893) | | (3,571) | | (10,481) | | (41,057) | |
| Change in Jan 2021 to Dec 2025 (based on balance sheet at 31 December 2020) | | | | | | |
| +25bps parallel | 1,233 | | 1,732 | | 3,718 | | 761 | | 2,128 | | 9,571 | |
| -25bps parallel | (1,466) | | (1,968) | | (3,826) | | (605) | | (2,094) | | (9,959) | |
| +100bps parallel | 3,891 | | 6,465 | | 12,571 | | 3,020 | | 8,203 | | 34,149 | |
| -100bps parallel | (4,650) | | (5,285) | | (13,469) | | (1,888) | | (8,808) | | (34,098) | |
The net interest income sensitivities arising from the scenarios presented in the tables above are not directly comparable. This is due to timing differences relating to interest rate changes and the repricing of assets and liabilities.
| | | | | | | | | | | | | | | | | | | | |
| NII sensitivity to an instantaneous change in yield curves (5 years) – NII sensitivity by years |
| | |
| Year 1 | Year 2 | Year 3 | Year 4 | Year 5 | Total |
| $m | $m | $m | $m | $m | $m |
| Change in Jan 2022 to Dec 2026 (based on balance sheet at 31 December 2021) | | | | | | |
| +25bps parallel | 1,309 | | 1,758 | | 1,896 | | 2,002 | | 2,141 | | 9,106 | |
| -25bps parallel | (1,952) | | (2,324) | | (2,593) | | (2,687) | | (2,845) | | (12,401) | |
| +100bps parallel | 5,414 | | 6,738 | | 7,492 | | 7,937 | | 8,359 | | 35,941 | |
| -100bps parallel | (5,761) | | (7,664) | | (8,675) | | (9,354) | | (9,603) | | (41,057) | |
| Change in Jan 2021 to Dec 2025 (based on balance sheet at 31 December 2020) | | | | | | |
| +25bps parallel | 1,647 | | 1,866 | | 1,930 | | 2,028 | | 2,100 | | 9,571 | |
| -25bps parallel | (1,508) | | (1,986) | | (2,307) | | (2,045) | | (2,113) | | (9,959) | |
| +100bps parallel | 5,348 | | 6,538 | | 7,083 | | 7,444 | | 7,736 | | 34,149 | |
| -100bps parallel | (4,854) | | (6,174) | | (7,087) | | (7,660) | | (8,323) | | (34,098) | |
Sensitivity of capital and reserves
Hold-to-collect-and-sell stressed value at risk (‘VaR’) is a quantification of the potential losses to a 99% confidence level of the portfolio of high-quality liquid assets held under a hold-to-collect-and-sell business model in the Markets Treasury business. The portfolio is accounted for at fair value through other comprehensive income together with the derivatives held in designated hedging relationships with these securities. The mark-to-market of this portfolio therefore has an impact on CET1. Stressed VaR is quantified based on the worst losses over a one-year period going back to the beginning of 2007 and the assumed holding period is 60 days. At the end of 2021, the stressed VaR of the portfolio was $3.63bn (2020: $2.94bn). The increase was mainly driven by the extension in the duration of our mortgage- backed securities exposures in US dollars as well as increases to the hold-to-collect-and-sell portfolios in US dollars and pounds sterling, partially offset by a reduction of exposure in a variety of other currencies.
Alongside our monitoring of the stressed VaR of this portfolio, we also monitor the sensitivity of reported cash flow hedging reserves to interest rate movements on a yearly basis by assessing the
expected reduction in valuation of cash flow hedges due to parallel movements of plus or minus 100bps in all yield curves. Although we allow rates to go negative in this assessment, we apply a floor on the shocks in the minus 100bps scenario set at the lower of either minus 50bps or the central bank deposit rate. Due to increases in interest rates during 2021, the effect of this flooring has reduced significantly when compared with 2020.
The following table describes the sensitivity of our cash flow hedge reported reserves to the stipulated movements in yield curves at the year end. The sensitivities are indicative and based on simplified scenarios. These particular exposures form only a part of our overall interest rate exposure.
Comparing 31 December 2021 with 31 December 2020, the sensitivity of the cash flow hedging reserve increased by $866m in the plus 100bps scenario and increased by $1.13bn in the minus 100bps scenario. The increase in both scenarios was mainly driven by an increase in fixed rate pound sterling hedges transacted in HSBC UK Bank plc against a change in the interest rate risk behaviouralisation profile for non-interest-bearing current accounts. The increase in the down scenario is also driven by the reduced effect of flooring as interest rates increased over the year.
| | | | | |
| Sensitivity of cash flow hedging reported reserves to interest rate movements |
| |
| $m |
| At 31 Dec 2021 | |
| +100 basis point parallel move in all yield curves | (1,531) | |
| As a percentage of total shareholders’ equity | (0.77)% |
| -100 basis point parallel move in all yield curves | 1,537 | |
| As a percentage of total shareholders’ equity | 0.78% |
| |
| At 31 Dec 2020 | |
| +100 basis point parallel move in all yield curves | (665) | |
| As a percentage of total shareholders’ equity | (0.34)% |
| -100 basis point parallel move in all yield curves | 409 | |
| As a percentage of total shareholders’ equity | 0.21% |
Third-party assets in Markets Treasury
Third-party assets in Markets Treasury increased by 8% compared with 31 December 2020. The net increase of $57bn is reflective of higher commercial surpluses during the year, with the increase of $115bn in ‘Cash and balances at central banks’ and decrease of
$52bn in ‘Financial investments’ being largely attributed to the reduction of investments in high-quality liquid assets driven by the change in outlook for interest rate expectations across many markets, with the resulting cash deployed with central banks.
| | | | | | | | |
| Third-party assets in Markets Treasury |
| 2021 | 2020 |
| $m | $m |
| Cash and balances at central banks | 379,106 | | 263,656 | |
| Trading assets | 329 | | 392 | |
| Loans and advances: | | |
| – to banks | 47,363 | | 34,555 | |
| – to customers | 371 | | 1,167 | |
| Reverse repurchase agreements | 47,067 | | 61,693 | |
| Financial investments | 338,692 | | 391,017 | |
| Other | 5,451 | | 8,724 | |
| At 31 Dec | 818,379 | | 761,204 | |
Defined benefit pension plans
Market risk arises within our defined benefit pension plans to the extent that the obligations of the plans are not fully matched by assets with determinable cash flows.
For details of our defined benefit plans, including asset allocation, see Note 5 on the financial statements, and for pension risk management, see page 228.
.
Additional market risk measures applicable only to the parent company
HSBC Holdings monitors and manages foreign exchange risk and interest rate risk. In order to manage interest rate risk, HSBC Holdings uses the projected sensitivity of its NII to future changes in yield curves and the interest rate repricing gap tables.
During 2021, HSBC Holdings issued approximately $19.3bn of debt, replacing $5.6bn of maturing or callable debt and generating $13.7bn of net new debt. A total $3.1bn of this new debt was left unhedged and the impact can be observed in the NII sensitivity tables where the 12 months sensitivity increased compared with last year.
Foreign exchange risk
HSBC Holdings’ foreign exchange exposures derive almost entirely from the execution of structural foreign exchange hedges on behalf of the Group as its business-as-usual foreign exchange exposures are managed within tight risk limits. At 31 December 2021, HSBC Holdings had forward foreign exchange contracts of
$25.9bn (2020: $11.2bn) to manage the Group’s structural foreign exchange exposures.
For further details of our structural foreign exchange exposures, see page 235.
Sensitivity of net interest income
HSBC Holdings monitors NII sensitivity over 12-month and five-year time horizons, reflecting the longer-term perspective on interest rate risk management appropriate to a financial services holding company. These sensitivities assume that any issuance where HSBC Holdings has an option to reimburse at a future call date is called at this date. The tables below set out the effect on HSBC Holdings’ future NII based on the following scenarios:
•an immediate shock of 25 basis points (‘bps’) to the current market-implied path of interest rates across all currencies on
1 January 2022; and
•an immediate shock of 100bps to the current market-implied path of interest rates across all currencies on 1 January 2022.
The NII sensitivities shown are indicative and based on simplified scenarios. Immediate interest rate rises of 25bps and 100bps would increase projected NII for the 12 months to 31 December 2022 by $29m and $113m, respectively. Conversely, falls of 25bps and 100bps would decrease projected NII for the 12 months to 31 December 2022 by $28m and $109m, respectively.
| | | | | | | | | | | | | | | | | | | | |
| NII sensitivity to an instantaneous change in yield curves (12 months) |
| $ | HK$ | £ | € | Other | Total |
| $m | $m | $m | $m | $m | $m |
| Change in Jan 2022 to Dec 2022 (based on balance sheet at 31 December 2021) | | | | | | |
| +25bps | 16 | | — | | 8 | | 4 | | — | | 29 | |
| -25bps | (16) | | — | | (8) | | (4) | | — | | (28) | |
| +100bps | 65 | | — | | 31 | | 16 | | — | | 113 | |
| -100bps | (64) | | — | | (31) | | (14) | | — | | (109) | |
| Change in Jan 2021 to Dec 2021 (based on balance sheet at 31 December 2020) | | | | | | |
| +25bps | 13 | | — | | 8 | | 2 | | — | | 23 | |
| -25bps | (13) | | — | | (8) | | (3) | | — | | (23) | |
| +100bps | 50 | | — | | 33 | | 7 | | — | | 91 | |
| -100bps | (51) | | — | | (32) | | (13) | | — | | (95) | |
| | | | | | | | | | | | | | | | | | | | |
| NII sensitivity to an instantaneous change in yield curves (5 years) |
| Year 1 | Year 2 | Year 3 | Year 4 | Year 5 | Total |
| $m | $m | $m | $m | $m | $m |
| Change in Jan 2022 to Dec 2022 (based on balance sheet at 31 December 2021) | | | | | | |
| +25bps | 29 | | 44 | | 45 | | 38 | | 28 | | 184 | |
| -25bps | (28) | | (44) | | (45) | | (38) | | (28) | | (183) | |
| +100bps | 113 | | 177 | | 180 | | 152 | | 112 | | 733 | |
| -100bps | (109) | | (174) | | (174) | | (148) | | (109) | | (715) | |
| Change in Jan 2021 to Dec 2021 (based on balance sheet at 31 December 2020) | | | | | — | | |
| +25bps | 23 | | 40 | | 43 | | 39 | | 31 | | 176 | |
| -25bps | (23) | | (42) | | (46) | | (41) | | (32) | | (184) | |
| +100bps | 91 | | 159 | | 171 | | 156 | | 126 | | 702 | |
| -100bps | (95) | | (169) | | (189) | | (169) | | 139 | | (761) | |
The figures represent hypothetical movements in NII based on our projected yield curve scenarios, HSBC Holdings’ current interest rate risk profile and assumed changes to that profile during the next five years.
The sensitivities represent our assessment of the change to a hypothetical base case based on a static balance sheet assumption, and do not take into account the effect of actions that could be taken to mitigate this interest rate risk.
Interest rate repricing gap table
The interest rate risk on the fixed-rate securities issued by HSBC Holdings is not included within the Group VaR, but is managed on a repricing gap basis. The following ‘Repricing gap analysis of HSBC Holdings’ table analyses the full-term structure of interest rate mismatches within HSBC Holdings’ balance sheet where debt issuances are reflected based on either the next repricing date if floating rate or the maturity/call date (whichever is first) if fixed rate.
| | | | | | | | | | | | | | | | | | | | |
| Repricing gap analysis of HSBC Holdings |
| Total | Up to
1 year | From over
1 to 5 years | From over
5 to 10 years | More than
10 years | Non-interest
bearing |
| $m | $m | $m | $m | $m | $m |
| Cash at bank and in hand: | | | | | | |
| – balances with HSBC undertakings | 2,590 | | 2,590 | | | | | |
| Derivatives | 2,811 | | | | | | 2,811 | |
| Loans and advances to HSBC undertakings | 76,516 | | 22,545 | | 29,759 | | 20,347 | | 2,000 | | 1,865 | |
| Financial investments in HSBC undertakings | 26,194 | | 22,917 | | 3,268 | | | | 9 | |
| Investments in subsidiaries | 163,211 | | 5,425 | | 8,395 | | 600 | | | 148,791 | |
| Other assets | 1,850 | | | | | | 1,850 | |
| Total assets | 273,172 | | 53,477 | | 41,422 | | 20,947 | | 2,000 | | 155,326 | |
| Amounts owed to HSBC undertakings | (111) | | | | | | (111) | |
| Financial liabilities designated at fair values | (32,418) | | (5,925) | | (10,801) | | (14,942) | | (750) | | |
| Derivatives | (1,220) | | | | | | (1,220) | |
| Debt securities in issue | (67,483) | | (11,244) | | (34,917) | | (19,322) | | (2,000) | | |
| Other liabilities | (4,551) | | | | | | (4,551) | |
| Subordinated liabilities | (17,059) | | (1,131) | | (3,705) | | (1,780) | | (10,443) | | |
| Total equity | (150,330) | | (2,446) | | (11,096) | | (8,721) | | | (128,067) | |
| Total liabilities and equity | (273,172) | | (20,746) | | (60,519) | | (44,765) | | (13,193) | | (133,949) | |
| Off-balance sheet items attracting interest rate sensitivity | | (18,797) | | (10,871) | | 1,434 | | 6,184 | | 308 | |
| Net interest rate risk gap at 31 Dec 2021 | | 13,952 | | (8,226) | | (22,384) | | (5,009) | | 21,667 | |
| Cumulative interest rate gap | | 13,952 | | 5,726 | | (16,658) | | (21,667) | | |
| | | | | | |
| Cash at bank and in hand: | | | | | | |
| – balances with HSBC undertakings | 2,913 | | 2,913 | | — | | — | | — | | — | |
| Derivatives | 4,698 | | — | | — | | — | | — | | 4,698 | |
| Loans and advances to HSBC undertakings | 75,696 | | 25,610 | | 22,190 | | 20,398 | | 2,000 | | 5,498 | |
| Financial investments in HSBC undertakings | 17,485 | | 15,112 | | 2,771 | | — | | — | | (398) | |
| Investments in subsidiaries | 156,485 | | 5,381 | | 7,660 | | 1,500 | | — | | 141,944 | |
| Other assets | 1,721 | | 257 | | — | | — | | — | | 1,464 | |
| Total assets | 258,998 | | 49,273 | | 32,621 | | 21,898 | | 2,000 | | 153,206 | |
| Amounts owed to HSBC undertakings | (330) | | (330) | | — | | — | | — | | — | |
| Financial liabilities designated at fair values | (25,664) | | (1,827) | | (6,533) | | (13,535) | | (750) | | (3,019) | |
| Derivatives | (3,060) | | — | | — | | — | | — | | (3,060) | |
| Debt securities in issue | (64,029) | | (9,932) | | (29,026) | | (22,063) | | (2,000) | | (1,008) | |
| Other liabilities | (5,375) | | — | | — | | — | | — | | (5,375) | |
| Subordinated liabilities | (17,916) | | — | | (3,839) | | (1,780) | | (10,463) | | (1,834) | |
| Total equity | (142,624) | | (1,464) | | (11,439) | | (9,198) | | | (120,523) | |
| Total liabilities and equity | (258,998) | | (13,553) | | (50,837) | | (46,576) | | (13,213) | | (134,819) | |
| Off-balance sheet items attracting interest rate sensitivity | | (20,324) | | 11,562 | | 2,492 | | 6,200 | | 70 | |
Net interest rate risk gap at 31 Dec 20201 | | 15,396 | | (6,654) | | (22,186) | | (5,013) | | 18,457 | |
| Cumulative interest rate gap | | 15,396 | | 8,742 | | (13,444) | | (18,457) | | — | |
1 Investments in subsidiaries and equity have been allocated based on call dates for any callable bonds. The prior year figures have been amended to reflect this.
| | | | | |
| Market risk |
| Page |
| Overview | |
| Market risk management | |
| Market risk in 2021 | |
| Trading portfolios | |
| Non-trading portfolios | |
| Market risk balance sheet linkages | |
Overview
Market risk is the risk of adverse financial impact on trading activities arising from changes in market parameters such as interest rates, foreign exchange rates, asset prices, volatilities, correlations and credit spreads. Exposure to market risk is separated into two portfolios: trading portfolios and non-trading portfolios
Market risk management
Key developments in 2021
There were no material changes to our policies and practices for the management of market risk in 2021.
Governance and structure
The following diagram summarises the main business areas where trading and non-trading market risks reside, and the market risk
measures used to monitor and limit exposures.
| | | | | | | | | | | | | | | | | |
| Risk types | Trading risk | Non-trading risk |
•Foreign exchange and commodities •Interest rates •Credit spreads •Equities | •Interest rates1 •Credit spreads •Foreign exchange |
| Global business | GBM | GBM, Global Treasury, CMB and WPB |
| Risk measure | Value at risk | Sensitivity | Stress testing | Value at risk | Sensitivity | Stress testing |
1 The interest rate risk on the fixed-rate securities issued by HSBC Holdings is not included in the Group value at risk. The management of this risk is described on page 238.
Where appropriate, we apply similar risk management policies and measurement techniques to both trading and non-trading portfolios. Our objective is to manage and control market risk exposures to optimise return on risk while maintaining a market profile consistent with our established risk appetite.
Market risk is managed and controlled through limits approved by the Group Chief Risk and Compliance Officer for HSBC Holdings. These limits are allocated across business lines and to the Group’s legal entities. Each major operating entity has an independent market risk management and control sub-function, which is
responsible for measuring, monitoring and reporting market risk exposures against limits on a daily basis. Each operating entity is required to assess the market risks arising in its business and to transfer them either to its local Markets and Securities Services or Markets Treasury unit for management, or to separate books managed under the supervision of the local ALCO. The Traded Risk function enforces the controls around trading in permissible instruments approved for each site as well as changes that follow completion of the new product approval process. Traded Risk also restricts trading in the more complex derivative products to offices with appropriate levels of product expertise and robust control systems.
Key risk management processes
Monitoring and limiting market risk exposures
Our objective is to manage and control market risk exposures while maintaining a market profile consistent with our risk appetite.
We use a range of tools to monitor and limit market risk exposures including sensitivity analysis, VaR and stress testing.
Sensitivity analysis
Sensitivity analysis measures the impact of individual market factor movements on specific instruments or portfolios, including interest rates, foreign exchange rates and equity prices. We use sensitivity measures to monitor the market risk positions within each risk type. Granular sensitivity limits are set for trading desks with consideration of market liquidity, customer demand and capital constraints, among other factors.
Value at risk
(Audited)
VaR is a technique for estimating potential losses on risk positions as a result of movements in market rates and prices over a specified time horizon and to a given level of confidence. The use of VaR is integrated into market risk management and calculated for all trading positions regardless of how we capitalise them. In addition, we calculate VaR for non-trading portfolios to have a complete picture of risk. Where we do not calculate VaR explicitly, we use alternative tools as summarised in the ‘Stress testing’ section below.
Our models are predominantly based on historical simulation that incorporates the following features:
•historical market rates and prices, which are calculated with reference to foreign exchange rates, commodity prices, interest rates, equity prices and the associated volatilities;
•potential market movements that are calculated with reference to data from the past two years; and
•calculations to a 99% confidence level and using a one-day holding period.
The models also incorporate the effect of option features on the underlying exposures. The nature of the VaR models means that an increase in observed market volatility will lead to an increase in VaR without any changes in the underlying positions.
VaR model limitations
Although a valuable guide to risk, VaR is used with awareness of its limitations. For example:
•The use of historical data as a proxy for estimating future market moves may not encompass all potential market events, particularly those that are extreme in nature.
•The use of a one-day holding period for risk management purposes of trading and non-trading books assumes that this short period is sufficient to hedge or liquidate all positions.
•The use of a 99% confidence level by definition does not take into account losses that might occur beyond this level of confidence.
•VaR is calculated on the basis of exposures outstanding at the close of business and therefore does not reflect intra-day exposures.
Risk not in VaR framework
The risks not in VaR (‘RNIV’) framework captures and capitalises material market risks that are not adequately covered in the VaR model.
Risk factors are reviewed on a regular basis and are either incorporated directly in the VaR models, where possible, or quantified through either the VaR-based RNIV approach or a stress test approach within the RNIV framework. While VaR-based RNIVs are calculated by using historical scenarios, stress-type RNIVs are estimated on the basis of stress scenarios whose severity is calibrated to be in line with the capital adequacy requirements. The outcome of the VaR-based RNIV approach is included in the overall VaR calculation but excluded from the VaR measure used for regulatory back-testing. In addition, the stressed VaR measure also includes risk factors considered in the VaR-based RNIV approach.
Stress-type RNIVs include a deal contingent derivatives capital charge to capture risk for these transactions and a de-peg risk measure to capture risk to pegged and heavily managed currencies.
Stress testing
Stress testing is an important procedure that is integrated into our market risk management framework to evaluate the potential impact on portfolio values of more extreme, although plausible, events or movements in a set of financial variables. In such scenarios, losses can be much greater than those predicted by VaR modelling.
Stress testing is implemented at legal entity, regional and overall Group levels. A set of scenarios is used consistently across all regions within the Group. The risk appetite around potential stress losses for the Group is set and monitored against a referral limit.
Market risk reverse stress tests are designed to identify vulnerabilities in our portfolios by looking for scenarios that lead to loss levels considered severe for the relevant portfolio. These scenarios may be quite local or idiosyncratic in nature, and complement the systematic top-down stress testing.
Stress testing and reverse stress testing provide senior management with insights regarding the ‘tail risk’ beyond VaR, for which our appetite is limited.
Trading portfolios
Trading portfolios comprise positions held for client servicing and market-making, with the intention of short-term resale and/or to hedge risks resulting from such positions.
Back-testing
We routinely validate the accuracy of our VaR models by back-testing the VaR metric against both actual and hypothetical profit and loss. Hypothetical profit and loss excludes non-modelled items such as fees, commissions and revenue of intra-day transactions. The hypothetical profit and loss reflects the profit and loss that would be realised if positions were held constant from the end of one trading day to the end of the next. This measure of profit and loss does not align with how risk is dynamically hedged, and is not therefore necessarily indicative of the actual performance of the business.
The number of back-testing exceptions is used to gauge how well the models are performing. We consider enhanced internal monitoring of a VaR model if more than five profit exceptions or more than five loss exceptions occur in a 250-day period.
We back-test our VaR at set levels of our Group entity hierarchy.
Market risk in 2021
Financial markets performed well in 2021. During the first half of the year, the roll-out of Covid-19 vaccination programmes, as well as continued monetary and fiscal support, contributed to a gradual recovery of major economies. Concerns of rising inflationary pressures were mainly interpreted as transitory. While the path of monetary policies remained uncertain, central banks continued to provide liquidity. This supported risk asset valuations, while
volatility in most asset classes was subdued. In the second half of 2021, amid the emergence of new Covid-19 variants, global equities reached further record highs, as investors focused on global economic resilience and strong corporate earnings. Bond yields followed a downward trend for most of the third quarter of 2021, before reversing in the final weeks of the year, when markets began pricing in expectations of a faster pace of interest rate rises in some of the major economies, due to persistently elevated inflation. Credit markets remained strong, with credit benchmark indices for investment-grade and high-yield debt close to pre-pandemic levels.
We continued to manage market risk prudently during 2021. Sensitivity exposures and VaR remained within appetite as the business pursued its core market-making activity in support of our customers. Market risk was managed using a complementary set of risk measures and limits, including stress and scenario analysis.
Trading portfolios
Value at risk of the trading portfolios
Trading VaR was predominantly generated by the Markets and Securities Services business.
Trading VaR at 31 December 2021 did not change materially compared with 31 December 2020 and it remained within a relatively narrow range for most of 2021. On a consolidated portfolio basis, larger contributions from credit spread risks and foreign exchange risks were offset by:
•gains from exposures to equity risks and interest rate risks; and
•reduced equity risks captured in the RNIV framework.
On a stand-alone basis, credit spread risks and interest rate risks from fixed income market-making activities were the main drivers of VaR at the end of 2021, with larger contributions compared with the end of 2020.
The daily levels of total trading VaR during 2021 are set out in the graph below.
| | |
| Daily VaR (trading portfolios), 99% 1 day ($m) |
The Group trading VaR for the year is shown in the table below.
| | | | | | | | | | | | | | | | | | | | |
Trading VaR, 99% 1 day1 |
| (Audited) | | | | | | |
| Foreign
exchange and commodity | Interest
rate | Equity | Credit
spread | Portfolio diversification2 | Total3 |
| $m | $m | $m | $m | $m | $m |
| Balance at 31 Dec 2021 | 9.1 | | 25.9 | | 15.4 | | 24.8 | | (36.5) | | 38.8 | |
| Average | 12.9 | | 33.8 | | 16.7 | | 19.2 | | (45.5) | | 37.1 | |
| Maximum | 31.8 | | 51.7 | | 24.3 | | 29.4 | | | 53.8 | |
| Minimum | 6.7 | | 18.5 | | 12.1 | | 12.2 | | | 27.7 | |
| | | | | | |
| Balance at 31 Dec 2020 | 13.7 | | 20.3 | | 21.5 | | 24.3 | | (36.4) | | 43.4 | |
| Average | 11.0 | | 26.6 | | 27.3 | | 21.6 | | (38.3) | | 48.1 | |
| Maximum | 25.7 | | 43.5 | | 42.0 | | 44.1 | | | 69.3 | |
| Minimum | 5.6 | | 19.1 | | 13.6 | | 12.6 | | | 33.6 | |
1 Trading portfolios comprise positions arising from the market-making and warehousing of customer-derived positions.
2 Portfolio diversification is the market risk dispersion effect of holding a portfolio containing different risk types. It represents the reduction in unsystematic market risk that occurs when combining a number of different risk types – such as interest rate, equity and foreign exchange – together in one portfolio. It is measured as the difference between the sum of the VaR by individual risk type and the combined total VaR. A negative number represents the benefit of portfolio diversification. As the maximum and minimum occurs on different days for different risk types, it is not meaningful to calculate a portfolio diversification benefit for these measures.
3 The total VaR is non-additive across risk types due to diversification effects.
The table below shows trading VaR at a 99% confidence level compared with trading VaR at a 95% confidence level at
31 December 2021. This comparison facilitates the benchmarking
of the trading VaR, which can be stated at different confidence levels, with financial institution peers. The 95% VaR is unaudited.
| | | | | | | | |
| Comparison of trading VaR, 99% 1 day vs trading VaR, 95% 1 day |
| | |
| Trading VaR, 99% 1 day | Trading VaR, 95% 1 day |
| $m | $m |
| Balance at 31 Dec 2021 | 38.8 | | 21.6 | |
| Average | 37.1 | | 24.0 | |
| Maximum | 53.8 | | 30.0 | |
| Minimum | 27.7 | | 18.9 | |
| | |
| Balance at 31 Dec 2020 | 43.4 | | 27.6 | |
| Average | 48.1 | | 32.7 | |
| Maximum | 69.3 | | 47.3 | |
| Minimum | 33.6 | | 22.4 | |
Back-testing
During 2021, the Group experienced two loss back-testing exceptions against hypothetical profit and loss and two loss back-testing exceptions against actual profit and loss.
These exceptions comprised:
•a loss back-testing exception against hypothetical profit and loss in March, mainly driven by the effect of lower volatility in the equity markets and by the increase in some emerging markets foreign exchange forward rates volatilities;
•a loss exception against actual profit and loss in September, attributable to the payment of novation fees under our RWA optimisation programme; and
•a loss back-testing exception against both hypothetical and actual profit and loss in late November, due to a number of relatively small losses spread across credit spread, equity and interest rates asset classes.
Non-trading portfolios
Non-trading portfolios comprise positions that primarily arise from the interest rate management of our retail and commercial banking assets and liabilities, financial investments measured at
fair value through other comprehensive income, debt instruments measured at amortised cost, and exposures arising from our insurance operations.
Value at risk of the non-trading portfolios
The VaR for non-trading activity at 31 December 2021 was lower than at 31 December 2020. The decrease arose mainly from an increase in the diversification benefit across interest rate and credit exposures. On a stand-alone basis, interest rate VaR increased, mainly due to higher levels of market volatility observed in February 2021, while credit VaR reduced over the year driven by a reduction in credit spread exposure in the portfolio of non-trading financial instruments managed by Markets Treasury.
Non-trading VaR includes the interest rate risk in the banking book transferred to and managed by Markets Treasury and the exposures generated by the portfolio of high-quality liquid assets held by Markets Treasury to meet liquidity requirements. The management of interest rate risk in the banking book is described further in the ‘Net interest income sensitivity’ section.
The daily levels of total non-trading VaR in 2021 are set out in the graph below.
| | |
| Daily VaR (non-trading portfolios), 99% 1 day ($m) |
The Group non-trading VaR for 2021 is shown in the table below.
| | | | | | | | | | | | | | |
| Non-trading VaR, 99% 1 day |
| (Audited) |
| Interest
rate | Credit
spread | Portfolio
diversification1 | Total2 |
| $m | $m | $m | $m |
| Balance at 31 Dec 2021 | 216.4 | | 70.3 | | (66.3) | | 220.4 | |
| Average | 200.7 | | 76.9 | | (40.3) | | 237.3 | |
| Maximum | 248.7 | | 99.3 | | — | | 298.8 | |
| Minimum | 163.3 | | 64.7 | | — | | 193.5 | |
| | | | |
| Balance at 31 Dec 2020 | 166.6 | | 87.0 | | (5.7) | | 247.8 | |
| Average | 150.2 | | 82.5 | | (42.0) | | 190.7 | |
| Maximum | 196.4 | | 133.4 | | — | | 274.6 | |
| Minimum | 59.0 | | 44.2 | | — | | 79.7 | |
1 Portfolio diversification is the market risk dispersion effect of holding a portfolio containing different risk types. It represents the reduction in unsystematic market risk that occurs when combining a number of different risk types – such as interest rate and credit spreads – together in one portfolio. It is measured as the difference between the sum of the VaR by individual risk type and the combined total VaR. A negative number represents the benefit of portfolio diversification. As the maximum and minimum occurs on different days for different risk types, it is not meaningful to calculate a portfolio diversification benefit for these measures.
2 The total VaR is non-additive across risk types due to diversification effects.
Non-trading VaR excludes equity risk on securities held at fair value, non-trading book foreign exchange risk and interest rate risk on fixed-rate securities issued by HSBC Holdings. HSBC’s management of market risks in non-trading books is described further in the Treasury Risk section.
Market risk balance sheet linkages
The following balance sheet lines in the Group’s consolidated position are subject to market risk:
Trading assets and liabilities
The Group’s trading assets and liabilities are in almost all cases originated by GBM. These assets and liabilities are treated as traded risk for the purposes of market risk management, other than a limited number of exceptions, primarily in Global Banking where the short-term acquisition and disposal of the assets are linked to other non-trading-related activities such as loan origination.
Derivative assets and liabilities
We undertake derivative activity for three primary purposes: to create risk management solutions for clients, to manage the portfolio risks arising from client business, and to manage and hedge our own risks. Most of our derivative exposures arise from sales and trading activities within GBM. The assets and liabilities included in trading VaR give rise to a large proportion of the income included in net income from financial instruments held for trading or managed on a fair value basis. Adjustments to trading income such as valuation adjustments are not measured by the trading VaR model.
For information on the accounting policies applied to financial instruments at fair value, see Note 1 on the financial statements
Overview
Resilience risk is the risk that we are unable to provide critical services to our customers, affiliates and counterparties as a result of sustained and significant operational disruption. Resilience risk arises from failures or inadequacies in processes, people, systems or external events.
Resilience risk management
Key developments in 2021
The Operational and Resilience Risk sub-function provides robust non-financial risk steward oversight of the management of risk by the Group businesses, functions and legal entities. It also provides effective and timely independent challenge. During the year, we carried out a number of initiatives to strengthen the management of non-financial risks:
•We developed a more robust understanding of our risk and control environment, by updating our material risk taxonomy and control libraries, and refreshing material risk and control assessments.
•We further strengthened our non-financial risk governance and senior leadership.
•We created a consolidated view of all risk issues across the Group, enabling better senior management focus on non-financial risk, and the ability to identify material control issues and intervention as required.
•We improved how we provide analysis and reporting of non-financial risks, with more risk practitioners now having access to a wider range of management information on their risks and controls.
•We increased the capability of risk stewards to allow for effective stewardship to be in place across the Group.
•We strengthened our approach in the comparison of issues and near misses by implementing a Group-wide harmonised approach across businesses, functions and regions.
•We enhanced risk management oversight across our most material change initiatives to support growth in our strategic transformation.
We prioritise our efforts on material risks and areas undergoing strategic growth, aligning our location strategy to this need. We also remotely provide oversight and stewardship, including support of chief risk officers, in territories where we have no physical presence.
Governance and structure
The Operational and Resilience Risk target operating model provides a globally consistent view across resilience risks, strengthening our risk management oversight while operating effectively as part of a simplified non-financial risk structure. We view resilience risk across seven risk types related to: third parties and supply chains; information, technology and cybersecurity; payments and manual processing; physical security; business interruption and contingency risk; building unavailability; and workplace safety.
A principal senior management meeting for operational and resilience risk governance is the Non-Financial Risk Management Board, chaired by the Group Chief Risk and Compliance Officer, with an escalation path to the Group Risk Management Meeting.
Key risk management processes
Operational resilience is our ability to anticipate, prevent, adapt, respond to, recover and learn from internal or external disruption, protecting customers, the markets we operate in and economic stability. Resilience is determined by assessing whether we are
able to continue to provide our most important services, within an agreed level. We accept we will not be able to prevent all disruption but we prioritise investment to continually improve the response and recovery strategies for our most important business services.
Business operations continuity
Business continuity, in response to the Covid-19 pandemic, remains in place across a number of locations where the Group operates, allowing the majority of service level agreements to be maintained. There were no significant impacts to service delivery in locations where the Group operates.
| | |
| Regulatory compliance risk |
Overview
Regulatory compliance risk is the risk associated with breaching our duty to clients and other counterparties, inappropriate market conduct and breaching related financial services regulatory standards. Regulatory compliance risk arises from the failure to observe relevant laws, codes, rules and regulations and can manifest itself in poor market or customer outcomes and lead to fines, penalties and reputational damage to our business.
Regulatory compliance risk management
Key developments in 2021
We continued to embed the structural changes made in 2020 to our wider approach to compliance risk management. The integration of the Risk and Compliance functions in May 2021 has brought together two complementary functions, which will strengthen the regulatory compliance function’s mandate and our capability to drive the right standards with regard to the conduct of our business.
In June 2021, we also announced our new purpose-led approach to conduct. As part of this, we took the opportunity to align and simplify our approach, making conduct easier to understand and showing how it relates to and helps fulfil our value: ‘we take responsibility’.
Governance and structure
Following the integration of the Global Risk and Compliance functions, the Group Head of Compliance and the Group Head of Financial Crime – who is also the Group Money Laundering Reporting Officer – each report to the Group Chief Risk and Compliance Officer. They also each attend the Risk and Compliance Executive Committee, the Group RMM and the GRC. The structure of the Compliance function below this level is substantively unchanged and the Group Regulatory Conduct capability and Group Financial Crime capability both continue to work closely with the regional chief compliance officers and their respective teams to help them identify and manage regulatory and financial crime compliance risks across the Group. They also work together to ensure we achieve good conduct outcomes and provide enterprise-wide support on the Compliance risk agenda in collaboration with the Group’s Risk function.
Key risk management processes
The Group Regulatory Conduct capability is responsible for setting global policies, standards and risk appetite to guide the Group’s management of regulatory compliance risk. It also devises the required frameworks and support processes to protect against regulatory compliance risks. The Group capability provides oversight, review and challenge to the regional chief compliance officers and their teams to help them identify, assess and mitigate regulatory compliance risks, where required. The Group’s regulatory compliance risk policies are regularly reviewed. Global policies and procedures require the prompt identification and escalation of any actual or potential regulatory breaches, and relevant reportable events are escalated to the Group RMM and the GRC, as appropriate.
Conduct of business
Our new, simplified conduct approach, which was launched in 2021, guides us to do the right thing and to recognise the real impact we have for our customers and the financial markets in which we operate. It complements our purpose and values, setting outcomes to be achieved for our customers and markets. It recognises cultural and behavioural drivers of good conduct outcomes and applies across all risk disciplines, operational processes and technologies. During 2021:
•We understood and served our customers’ ongoing needs, and continued to champion a strong conduct and customer-focused culture. This was demonstrated through the continued provision of support to our customers facing financial difficulties as a result of the prolonged impacts of the pandemic and the resulting uncertainty in trading conditions.
•We began the integration of climate risk into the Group’s risk management approach to recognise the importance of strengthened controls and oversight for our related activities.
•We operated resiliently and securely to avoid harm to our customers and markets by continuing to embed conduct within our business line processes and through our non-financial and financial risk steward activities.
•We continued our focus on culture and behaviours as a driver of good conduct outcomes.
•We placed a particular focus on the importance of well-being and collaborative working as we continued to adapt to changing working practices as the pace of change resulting from the pandemic varied across our markets.
•We continued to emphasise – and worked to create – an environment in which employees are encouraged and feel safe to speak up.
•We delivered our latest annual global mandatory training course on conduct to reinforce the importance of conduct for all colleagues.
The Board continues to maintain oversight of conduct matters through the GRC.
Further details can be found under the ‘Our conduct’ section of www.hsbc.com/our-approach/risk-and-responsibility.
Overview
Financial crime risk is the risk of knowingly or unknowingly helping parties to commit or to further illegal activity through HSBC, including money laundering, fraud, bribery and corruption, tax evasion, sanctions breaches, and terrorist and proliferation financing. Financial crime risk arises from day-to-day banking operations involving customers, third parties and employees.
Financial crime risk management
Key developments in 2021
We continuously review the effectiveness of our financial crime risk management framework, which includes consideration of the complex and dynamic nature of sanctions risk, notably with respect to the array of new regulations and designations in 2021 and in alignment with our policy, which is to comply with all applicable sanctions regulations in the jurisdictions in which we operate.
We also continued to make progress with several key financial crime risk management initiatives, including:
•We deployed a key component of our intelligence-led, dynamic risk assessment capabilities for customer account monitoring in the UK, and undertook important enhancements to our traditional transaction monitoring systems globally.
•We strengthened our anti-fraud capabilities, notably with respect to the early identification of first-party lending fraud and the development of new strategic detection tools.
•We continued the development of leading-edge surveillance technology and capabilities to identify potential market abuse, including testing machine learning capabilities to detect unauthorised trading.
•We invested in the use of AI and advanced analytics techniques to manage financial crime risk, notably new automated capabilities in name and transaction screening (for further details, see page 144).
•We implemented a gifts and entertainment recording and approval system, which, in combination with an expenses reconciliation tool, allows us to better manage our gifts and entertainment risk.
Governance and structure
We have continued to review the effectiveness of our governance framework to manage financial crime risk. The framework aims to enable us to comply with the letter and the spirit of applicable financial crime laws and regulations in the jurisdictions in which we operate, as well as our own policies, standards, and values relating to financial crime risks.
In 2021, the Group Risk and Compliance functions were integrated, allowing us to make better use of a broader range of perspectives from other risk disciplines.
Key risk management processes
We will not tolerate knowingly conducting business with individuals or entities believed to be engaged in illicit activity. We require everybody in HSBC to play their role in maintaining effective systems and controls to prevent and detect financial crime. Where we believe we have identified suspected illicit activity or vulnerabilities in our control framework, we will take appropriate mitigating action.
We continue to assess the effectiveness of our end-to-end financial crime risk management framework on an ongoing basis, and invest in enhancing our operational control capabilities and technology solutions to deter and detect criminal activity. We have simplified our framework by streamlining and de-duplicating policy requirements. We also strengthened our financial crime risk taxonomy and control libraries and our investigative and monitoring capabilities through technology deployments. We developed more targeted metrics, and have also enhanced our governance and reporting.
We are committed to working in partnership with the wider industry and the public sector in managing financial crime risk, protecting the integrity of the financial system and the communities we serve. We participate in numerous public-private partnerships and information-sharing initiatives around the world. In 2021, the UK, the EU, the US and Singapore, were particularly focused on anti-money laundering (‘AML’) reforms, to which we provided significant input. We played a key role in the industry responses to a number of consultation papers focused on the overall effectiveness of the global AML framework. We were also active participants in a key pilot undertaken by the Monetary Authority of Singapore, which establishes a framework to enable financial institutions to share information with each other when certain financial crime risk concerns have been identified. We took part in a number of roundtables organised by the Financial Action Task Force, supporting its strategic review. We also supported its work on digitisation and beneficial ownership registers. These align with our objectives of promoting a public policy and regulatory environment that embraces the use and harnessing of technology in building a financial crime framework for the future to ensure our organisation is more resilient and secure, while benefiting our customers.
Skilled Person/Independent Consultant
In December 2012, HSBC Holdings entered into a number of agreements, including an undertaking with the UK Financial Services Authority (replaced with a Direction issued by the UK Financial Conduct Authority (‘FCA’) in 2013 and again in 2020), as well as a cease-and-desist order with the US Federal Reserve Board (‘FRB’), both of which contained certain forward-looking AML and sanctions-related obligations. Over the past several years, HSBC has retained a Skilled Person under section 166 of the Financial Services and Markets Act and an Independent Consultant under the FRB cease-and-desist order to produce
periodic assessments of the Group’s AML and sanctions compliance programme.
The Skilled Person issued its final report in June 2021, which contained a number of limited recommendations. Following publication of the report, the FCA determined that no further Skilled Person work is required. The Group Risk Committee will continue to retain oversight of matters relating to AML, sanctions, terrorist financing and proliferation financing. Separately, the Independent Consultant carried out its eighth annual review for the FRB and, in November 2021, issued its report, which contained a limited number of recommendations.
Overview
Model risk is the risk of inappropriate or incorrect business decisions arising from the use of models that have been inadequately designed, implemented or used, or from models that do not perform in line with expectations and predictions.
Model risk arises in both financial and non-financial contexts whenever business decision making includes reliance on models.
Key developments in 2021
In 2021, we continued to make improvements in our model risk management processes amid regulatory changes in model requirements.
Initiatives during the year included:
•In response to regulatory capital charges, we redeveloped, validated and submitted to the PRA our models for the internal ratings-based (‘IRB’) approach for credit risk, internal model method (‘IMM’) for counterparty credit risk and internal model approach (‘IMA’) for market risk. These new models have been built to enhanced standards using improved data as a result of investment in processes and systems.
•We redeveloped and validated models impacted by changes to alternative rate setting mechanisms due to the Ibor transition.
•We made further enhancements to our control framework for our Sarbanes-Oxley models to address the control weaknesses that emerged as a result of significant increases in adjustments and overlays that were applied to compensate for the impact of the Covid-19 pandemic on models. We also introduced a requirement for the model risk stewards to approve material models prior to use.
•Our businesses and functions were more involved in the development and management of models, and hiring colleagues who had strong model risk skills. They also put an enhanced focus on key model risk drivers such as data quality and model methodology.
•Our model owners in businesses and functions fully embedded the requirements included in the model risk policy and standards introduced in 2020.
•We delivered a suite of training on model risk to front-line teams to improve their awareness of model risk and their adherence to the governance framework.
•We rolled out new model risk appetite measures, which are more forward looking and will help our businesses and functions manage model risk more effectively.
•We continued the transformation of the Model Risk Management team, with changes to the model validation processes, including new systems and processes. Key senior hires were made during the year to lead the business areas and regions to strengthen oversight and expertise within the function. We also made changes to the model inventory system to provide businesses and functions with improved functionality and more detailed information related to model risk.
•We initiated a programme of development related to climate risk and models using advanced analytics and machine learning, which have become critical areas of focus that will
grow in importance in 2022 and beyond. We also added qualified specialist skills to the model risk teams to manage the increased model risk in these areas.
Governance and structure
The new governance structure implemented in 2020 is fully operational. Model Risk Governance committees at the Group, business and functional levels provide oversight of model risk. The committees include senior leaders from the three global businesses and the Global Risk and Compliance function, and focus on model-related concerns and are supported by key model risk metrics. The Group-level Model Risk Committee is chaired by the Group Chief Risk and Compliance Officer and the heads of key businesses participate in those meetings.
Key risk management processes
We use a variety of modelling approaches, including regression, simulation, sampling, machine learning and judgemental scorecards for a range of business applications. These activities include customer selection, product pricing, financial crime transaction monitoring, creditworthiness evaluation and financial reporting. Global responsibility for managing model risk is delegated from the RMM to the Group Model Risk Committee, which is chaired by the Group Chief Risk and Compliance Officer. This committee regularly reviews our model risk management policies and procedures, and requires the first line of defence to demonstrate comprehensive and effective controls based on a library of model risk controls provided by Model Risk Management.
Model Risk Management also reports on model risk to senior management on a regular basis through the use of the risk map, risk appetite metrics and top and emerging risks.
We regularly review the effectiveness of these processes, including the model oversight committee structure, to help ensure appropriate understanding and ownership of model risk is embedded in the businesses and functions.
| | | | | |
| Insurance manufacturing operations risk |
| Page |
| Overview | |
| Insurance manufacturing operations risk management | |
| Insurance manufacturing operations risk in 2021 | |
| |
| Measurement | |
| |
| Key risk types | |
| – Market risk | |
| – Credit risk | |
| – Liquidity risk | |
| – Insurance underwriting risk | |
Overview
The key risks for our insurance manufacturing operations are market risks, in particular interest rate and equity, credit risks and insurance underwriting and operational risks. These have a direct impact on the financial results and capital positions of the insurance operations. Liquidity risk, while significant in other parts of the Group, is relatively minor for our insurance operations.
HSBC’s insurance business
We sell insurance products worldwide through a range of channels including our branches, direct channels and third-party distributors. The majority of sales are through an integrated bancassurance model that provides insurance products principally for customers with whom we have a banking relationship.
The insurance contracts we sell relate to the underlying needs of our customers, which we can identify from our point-of-sale contacts and customer knowledge. For the products we manufacture, the majority of sales are savings, universal life and protection contracts.
We choose to manufacture these insurance products in HSBC subsidiaries based on an assessment of operational scale and risk appetite. Manufacturing insurance allows us to retain the risks and rewards associated with writing insurance contracts by keeping
part of the underwriting profit and investment income within the Group.
We have life insurance manufacturing subsidiaries in eight markets, which are Hong Kong, Singapore, mainland China, France, the UK, Malta, Mexico and Argentina. We also have a life insurance manufacturing associate in India.
Where we do not have the risk appetite or operational scale to be an effective insurance manufacturer, we engage with a small number of leading external insurance companies in order to provide insurance products to our customers through our banking network and direct channels. These arrangements are generally structured with our exclusive strategic partners and earn the Group a combination of commissions, fees and a share of profits. We distribute insurance products in all of our geographical regions.
This section focuses only on the risks relating to the insurance products we manufacture.
Insurance manufacturing operations risk management
Key developments in 2021
The insurance manufacturing subsidiaries follow the Group’s risk management framework. In addition, there are specific policies and practices relating to the risk management of insurance contracts. There were no material changes to the policies and practices over 2021, although enhancements were made to the product pricing and profitability framework to allow for the transition to IFRS 17.
Governance and structure
(Audited)
Insurance manufacturing risks are managed to a defined risk appetite, which is aligned to the Group’s risk appetite and risk management framework, including its three lines of defence model. For details of the Group’s governance framework, see page 146. The Global Insurance Risk Management Meeting oversees the control framework globally and is accountable to the WPB Risk Management Meeting on risk matters relating to the insurance business.
The monitoring of the risks within our insurance operations is carried out by Insurance Risk teams. The Group’s risk stewardship functions support the Insurance Risk teams in their respective areas of expertise.
Stress and scenario testing
(Audited)
Stress testing forms a key part of the risk management framework for the insurance business. We participate in local and Group-wide regulatory stress tests, as well as internally developed stress and scenario tests, including Group internal stress test exercises.
The results of these stress tests and the adequacy of management action plans to mitigate these risks are considered in the Group’s ICAAP and the entities’ regulatory Own Risk and Solvency Assessments (‘ORSAs’).
Key risk management processes
Market risk
(Audited)
All our insurance manufacturing subsidiaries have market risk mandates and limits that specify the investment instruments in which they are permitted to invest and the maximum quantum of market risk that they may retain. They manage market risk by using, among others, some or all of the techniques listed below, depending on the nature of the contracts written:
•We are able to adjust bonus rates to manage the liabilities to policyholders for products with discretionary participating features (‘DPF’). The effect is that a significant portion of the market risk is borne by the policyholder.
•We use asset and liability matching where asset portfolios are structured to support projected liability cash flows. The Group
manages its assets using an approach that considers asset quality, diversification, cash flow matching, liquidity, volatility and target investment return. We use models to assess the effect of a range of future scenarios on the values of financial assets and associated liabilities, and ALCOs employ the outcomes in determining how best to structure asset holdings to support liabilities.
•We use derivatives to protect against adverse market movements.
•We design new products to mitigate market risk, such as changing the investment return sharing portion between policyholders and the shareholder.
•We exit, to the extent possible, investment portfolios whose risk is considered unacceptable.
Credit risk
(Audited)
Our insurance manufacturing subsidiaries also have credit risk mandates and limits within which they are permitted to operate, which consider the credit risk exposure, quality and performance of their investment portfolios. Our assessment of the creditworthiness of issuers and counterparties is based primarily upon internationally recognised credit ratings and other publicly available information.
Stress testing is performed on investment credit exposures using credit spread sensitivities and default probabilities.
We use a number of tools to manage and monitor credit risk. These include a credit report containing a watch-list of investments with current credit concerns, primarily investments that may be at risk of future impairment or where high concentrations to counterparties are present in the investment portfolio. Sensitivities to credit spread risk are assessed and monitored regularly.
Capital and liquidity risk
(Audited)
Capital risk for our insurance manufacturing subsidiaries is assessed in the Group’s ICAAP based on their financial capacity to support the risks to which they are exposed. Capital adequacy is
assessed on both the Group’s economic capital basis, and the relevant local insurance regulatory basis. The Group’s economic capital basis is largely aligned to European Solvency II regulations, other than in Hong Kong where this is based on the emerging Hong Kong risk based capital regulations.
Risk appetite buffers are set to ensure that the operations are able to remain solvent on both bases, allowing for business-as-usual volatility and extreme but plausible stress events.
Liquidity risk is managed by cash flow matching and maintaining sufficient cash resources, investing in high credit-quality investments with deep and liquid markets, monitoring investment concentrations and restricting them where appropriate, and establishing committed contingency borrowing facilities.
Insurance manufacturing subsidiaries complete quarterly liquidity risk reports and an annual review of the liquidity risks to which they are exposed.
Insurance underwriting risk
Our insurance manufacturing subsidiaries primarily use the following frameworks and processes to manage and mitigate insurance underwriting risks:
•a formal approval process for launching new products or making changes to products;
•a product pricing and profitability framework, which requires initial and ongoing assessment of the adequacy of premiums charged on new insurance contracts to meet the risks associated with them;
•a framework for customer underwriting;
•reinsurance, which cedes risks above our appetite thresholds to a third-party reinsurer thereby limiting our exposure; and
•oversight of expense and reserve risks by entity Actuarial Control Committees.
Insurance manufacturing operations risk in 2021
The following tables show the composition of assets and liabilities by contract type and by geographical region.
| | | | | | | | | | | | | | | | | |
Balance sheet of insurance manufacturing subsidiaries by type of contract1 |
| (Audited) | | | | | |
| With
DPF | Unit-linked | Other contracts2 | Shareholder
assets and liabilities | Total |
| $m | $m | $m | $m | $m |
| Financial assets | 88,969 | | 8,881 | | 19,856 | | 9,951 | | 127,657 | |
| – financial assets designated and otherwise mandatorily measured at fair value through profit or loss | 30,669 | | 8,605 | | 3,581 | | 1,827 | | 44,682 | |
| – derivatives | 129 | | 1 | | 15 | | 2 | | 147 | |
| – financial investments at amortised cost | 42,001 | | 61 | | 14,622 | | 4,909 | | 61,593 | |
| – financial investments at fair value through other comprehensive income | 10,858 | | — | | 459 | | 1,951 | | 13,268 | |
– other financial assets3 | 5,312 | | 214 | | 1,179 | | 1,262 | | 7,967 | |
| Reinsurance assets | 2,180 | | 72 | | 1,666 | | 3 | | 3,921 | |
PVIF4 | — | | — | | — | | 9,453 | | 9,453 | |
| Other assets and investment properties | 2,558 | | 1 | | 206 | | 820 | | 3,585 | |
| Total assets | 93,707 | | 8,954 | | 21,728 | | 20,227 | | 144,616 | |
| Liabilities under investment contracts designated at fair value | — | | 2,297 | | 3,641 | | — | | 5,938 | |
| Liabilities under insurance contracts | 89,492 | | 6,558 | | 16,757 | | — | | 112,807 | |
Deferred tax5 | 179 | | 9 | | 24 | | 1,418 | | 1,630 | |
| Other liabilities | — | | — | | — | | 7,269 | | 7,269 | |
| Total liabilities | 89,671 | | 8,864 | | 20,422 | | 8,687 | | 127,644 | |
| Total equity | — | | — | | — | | 16,972 | | 16,972 | |
| Total liabilities and equity at 31 Dec 2021 | 89,671 | | 8,864 | | 20,422 | | 25,659 | | 144,616 | |
| | | | | | | | | | | | | | | | | |
|
|
| | | | | |
| | | | | |
| | | | | |
| | | | | |
| | | | | |
| | | | | |
| | | | | |
| Financial assets | 84,478 | | 8,802 | | 18,932 | | 8,915 | | 121,127 | |
| – financial assets designated and otherwise mandatorily measured at fair value through profit or loss | 26,002 | | 8,558 | | 3,508 | | 1,485 | | 39,553 | |
| – derivatives | 262 | | 3 | | 13 | | 3 | | 281 | |
| – financial investments at amortised cost | 39,891 | | 30 | | 13,984 | | 4,521 | | 58,426 | |
| – financial investments at fair value through other comprehensive income | 12,531 | | — | | 459 | | 1,931 | | 14,921 | |
– other financial assets3 | 5,792 | | 211 | | 968 | | 975 | | 7,946 | |
| Reinsurance assets | 2,256 | | 65 | | 1,447 | | 2 | | 3,770 | |
PVIF4 | — | | — | | — | | 9,435 | | 9,435 | |
| Other assets and investment properties | 2,628 | | 1 | | 227 | | 721 | | 3,577 | |
| Total assets | 89,362 | | 8,868 | | 20,606 | | 19,073 | | 137,909 | |
| Liabilities under investment contracts designated at fair value | — | | 2,285 | | 4,100 | | — | | 6,385 | |
| Liabilities under insurance contracts | 84,931 | | 6,503 | | 15,827 | | — | | 107,261 | |
Deferred tax5 | 145 | | 5 | | 25 | | 1,400 | | 1,575 | |
| Other liabilities | — | | — | | — | | 7,244 | | 7,244 | |
| Total liabilities | 85,076 | | 8,793 | | 19,952 | | 8,644 | | 122,465 | |
| Total equity | — | | — | | — | | 15,444 | | 15,444 | |
| Total liabilities and equity at 31 Dec 2020 | 85,076 | | 8,793 | | 19,952 | | 24,088 | | 137,909 | |
1Balance sheet of insurance manufacturing operations is shown before elimination of inter-company transactions with HSBC non-insurance operations.
2‘Other contracts’ includes term insurance, credit life insurance, universal life insurance and investment contracts not included in the ‘Unit-linked’ or ‘With DPF’ columns.
3Comprise mainly loans and advances to banks, cash and inter-company balances with other non-insurance legal entities.
4Present value of in-force long-term insurance business.
5‘Deferred tax’ includes the deferred tax liabilities arising on recognition of PVIF.
| | | | | | | | | | | | | | | | |
Balance sheet of insurance manufacturing subsidiaries by geographical region1,2 | |
| (Audited) | |
| | Europe | Asia | Latin
America | Total | |
| | $m | $m | $m | $m | |
| Financial assets | | 34,264 | | 92,535 | | 858 | | 127,657 | | |
| – financial assets designated and otherwise mandatorily measured at fair value through profit or loss | | 19,030 | | 25,248 | | 404 | | 44,682 | | |
| – derivatives | | 65 | | 82 | | — | | 147 | | |
| – financial investments – at amortised cost | | 1,161 | | 60,389 | | 43 | | 61,593 | | |
| – financial investments – at fair value through other comprehensive income | | 12,073 | | 817 | | 378 | | 13,268 | | |
– other financial assets3 | | 1,935 | | 5,999 | | 33 | | 7,967 | | |
| Reinsurance assets | | 213 | | 3,703 | | 5 | | 3,921 | | |
PVIF4 | | 1,098 | | 8,177 | | 178 | | 9,453 | | |
| Other assets and investment properties | | 1,091 | | 2,431 | | 63 | | 3,585 | | |
| Total assets | | 36,666 | | 106,846 | | 1,104 | | 144,616 | | |
| Liabilities under investment contracts designated at fair value | | 1,396 | | 4,542 | | — | | 5,938 | | |
| Liabilities under insurance contracts | | 30,131 | | 81,840 | | 836 | | 112,807 | | |
Deferred tax5 | | 250 | | 1,357 | | 23 | | 1,630 | | |
| Other liabilities | | 2,711 | | 4,523 | | 35 | | 7,269 | | |
| Total liabilities | | 34,488 | | 92,262 | | 894 | | 127,644 | | |
| Total equity | | 2,178 | | 14,584 | | 210 | | 16,972 | | |
| Total liabilities and equity at 31 Dec 2021 | | 36,666 | | 106,846 | | 1,104 | | 144,616 | | |
| | | | | | |
| |
| |
| |
| | | | | | |
| | | | | | |
| | | | | | |
| | | | | | |
| | | | | | |
| | | | | | |
| | | | | | |
| Financial assets | | 34,768 | | 85,259 | | 1,100 | | 121,127 | | |
| – financial assets designated and otherwise mandatorily measured at fair value through profit or loss | | 17,184 | | 22,099 | | 270 | | 39,553 | | |
| – derivatives | | 107 | | 174 | | — | | 281 | | |
| – financial investments – at amortised cost | | 531 | | 57,420 | | 475 | | 58,426 | | |
| – financial investments – at fair value through other comprehensive income | | 13,894 | | 706 | | 321 | | 14,921 | | |
– other financial assets3 | | 3,052 | | 4,860 | | 34 | | 7,946 | | |
| Reinsurance assets | | 245 | | 3,521 | | 4 | | 3,770 | | |
PVIF4 | | 884 | | 8,390 | | 161 | | 9,435 | | |
| Other assets and investment properties | | 1,189 | | 2,332 | | 56 | | 3,577 | | |
| Total assets | | 37,086 | | 99,502 | | 1,321 | | 137,909 | | |
| Liabilities under investment contracts designated at fair value | | 1,288 | | 5,097 | | — | | 6,385 | | |
| Liabilities under insurance contracts | | 31,153 | | 74,994 | | 1,114 | | 107,261 | | |
Deferred tax5 | | 204 | | 1,348 | | 23 | | 1,575 | | |
| Other liabilities | | 2,426 | | 4,800 | | 18 | | 7,244 | | |
| Total liabilities | | 35,071 | | 86,239 | | 1,155 | | 122,465 | | |
| Total equity | | 2,015 | | 13,263 | | 166 | | 15,444 | | |
| Total liabilities and equity at 31 Dec 2020 | | 37,086 | | 99,502 | | 1,321 | | 137,909 | | |
1HSBC has no insurance manufacturing subsidiaries in the Middle East and North Africa or North America.
2Balance sheet of insurance manufacturing operations is shown before elimination of inter-company transactions with HSBC non-insurance operations.
3Comprise mainly loans and advances to banks, cash and inter-company balances with other non-insurance legal entities.
4Present value of in-force long-term insurance business.
5‘Deferred tax’ includes the deferred tax liabilities arising on recognition of PVIF.
Key risk types
Market risk
(Audited)
Description and exposure
Market risk is the risk of changes in market factors affecting HSBC’s capital or profit. Market factors include interest rates, equity and growth assets and foreign exchange rates.
Our exposure varies depending on the type of contract issued. Our most significant life insurance products are contracts with discretionary participating features (‘DPF’). These products typically include some form of capital guarantee or guaranteed return on the sums invested by the policyholders, to which discretionary bonuses are added if allowed by the overall performance of the funds. These funds are primarily invested in fixed interest, with a proportion allocated to other asset classes to provide customers with the potential for enhanced returns.
DPF products expose HSBC to the risk of variation in asset returns, which will impact our participation in the investment performance.
In addition, in some scenarios the asset returns can become insufficient to cover the policyholders’ financial guarantees, in which case the shortfall has to be met by HSBC. Amounts are held against the cost of such guarantees, calculated by stochastic modelling.
The cost of such guarantees is accounted for as a deduction from the present value of in-force ('PVIF') asset, unless the cost of such guarantees is already explicitly allowed for within the insurance contract liabilities.
The following table shows the total reserve held for the cost of guarantees, the range of investment returns on assets supporting these products and the implied investment return that would enable the business to meet the guarantees.
The cost of guarantees decreased to $938m (2020: $1,105m) primarily due to the increase in swap rates and positive equity performance in France and Hong Kong.
For unit-linked contracts, market risk is substantially borne by the policyholder, but some market risk exposure typically remains, as fees earned are related to the market value of the linked assets.
| | | | | | | | | | | | | | | | | | | | | | | |
| Financial return guarantees |
| (Audited) |
| | 2021 | 2020 |
| | Investment returns implied by guarantee | Long-term investment returns on relevant portfolios | Cost of guarantees | Investment returns implied by guarantee | Long-term investment returns on relevant portfolios | Cost of guarantees |
| | % | % | $m | % | % | $m |
| Capital | | 0.0 | | 0.7–3.2 | 220 | | 0.0 | | 0.7–3.2 | 277 | |
| Nominal annual return | | 0.1–1.9 | 2.3–3.6 | 423 | | 0.1–1.9 | 2.3–3.6 | 515 | |
| Nominal annual return | | 2.0-3.9 | 2.0–4.5 | 183 | | 2.0–3.9 | 2.0–4.5 | 180 | |
| Nominal annual return | | 4.0–5.0 | 2.0–4.2 | 112 | | 4.0–5.0 | 2.0–4.2 | 133 | |
| At 31 Dec | | | | 938 | | | | 1,105 | |
Sensitivities
Changes in financial market factors, from the economic assumptions in place at the start of the year, had a positive impact on reported profit before tax of $516m (2020: $102m). The following table illustrates the effects of selected interest rate, equity price and foreign exchange rate scenarios on our profit for the year and the total equity of our insurance manufacturing subsidiaries.
Where appropriate, the effects of the sensitivity tests on profit after tax and equity incorporate the impact of the stress on the PVIF.
Due in part to the impact of the cost of guarantees and hedging strategies, which may be in place, the relationship between the
profit and total equity and the risk factors is non-linear, particularly in a low interest-rate environment. Therefore, the results disclosed should not be extrapolated to measure sensitivities to different levels of stress. For the same reason, the impact of the stress is not necessarily symmetrical on the upside and downside. The sensitivities are stated before allowance for management actions, which may mitigate the effect of changes in the market environment. The sensitivities presented allow for adverse changes in policyholder behaviour that may arise in response to changes in market rates. The differences between the impacts on profit after tax and equity are driven by the changes in value of the bonds measured at fair value through other comprehensive income, which are only accounted for in equity.
| | | | | | | | | | | | | | |
| Sensitivity of HSBC’s insurance manufacturing subsidiaries to market risk factors |
| (Audited) |
| 2021 | 2020 |
| Effect on
profit after tax | Effect on
total equity | Effect on
profit after tax | Effect on
total equity |
| $m | $m | $m | $m |
| +100 basis point parallel shift in yield curves | (2) | | (142) | | (67) | | (188) | |
| -100 basis point parallel shift in yield curves | (154) | | (9) | | (68) | | 58 | |
| 10% increase in equity prices | 369 | | 369 | | 332 | | 332 | |
| 10% decrease in equity prices | (377) | | (377) | | (338) | | (338) | |
| 10% increase in US dollar exchange rate compared with all currencies | 80 | | 80 | | 84 | | 84 | |
| 10% decrease in US dollar exchange rate compared with all currencies | (80) | | (80) | | (84) | | (84) | |
Credit risk
(Audited)
Description and exposure
Credit risk is the risk of financial loss if a customer or counterparty fails to meet their obligation under a contract. It arises in two main areas for our insurance manufacturers:
•risk associated with credit spread volatility and default by debt security counterparties after investing premiums to generate a return for policyholders and shareholders; and
•risk of default by reinsurance counterparties and non-reimbursement for claims made after ceding insurance risk.
The amounts outstanding at the balance sheet date in respect of these items are shown in the table on page 248.
The credit quality of the reinsurers’ share of liabilities under insurance contracts is assessed as ‘satisfactory’ or higher (as defined on page 174), with 100% of the exposure being neither past due nor impaired (2020: 100%).
Credit risk on assets supporting unit-linked liabilities is predominantly borne by the policyholder. Therefore, our exposure is primarily related to liabilities under non-linked insurance and
investment contracts and shareholders’ funds. The credit quality of insurance financial assets is included in the table on page 191.
The risk associated with credit spread volatility is to a large extent mitigated by holding debt securities to maturity, and sharing a degree of credit spread experience with policyholders.
Liquidity risk
(Audited)
Description and exposure
Liquidity risk is the risk that an insurance operation, though solvent, either does not have sufficient financial resources available to meet its obligations when they fall due, or can secure them only at excessive cost.
The following table shows the expected undiscounted cash flows for insurance liabilities at 31 December 2021. The liquidity risk exposure is wholly borne by the policyholder in the case of unit-linked business and is shared with the policyholder for non-linked insurance.
The profile of the expected maturity of insurance contracts at 31 December 2021 remained comparable with 2020.
The remaining contractual maturity of investment contract liabilities is included in Note 29 on page 401.
| | | | | | | | | | | | | | | | | |
| Expected maturity of insurance contract liabilities |
| (Audited) |
| Expected cash flows (undiscounted) |
| Within 1 year | 1–5 years | 5–15 years | Over 15 years | Total |
| $m | $m | $m | $m | $m |
| Unit-linked | 1,346 | | 2,605 | | 3,159 | | 2,293 | | 9,403 | |
| With DPF and Other contracts | 8,803 | | 31,334 | | 51,891 | | 94,168 | | 186,196 | |
| At 31 Dec 2021 | 10,149 | | 33,939 | | 55,050 | | 96,461 | | 195,599 | |
| | | | | |
| Unit-linked | 1,407 | | 3,097 | | 2,976 | | 2,099 | | 9,579 | |
| With DPF and Other contracts | 8,427 | | 30,156 | | 51,383 | | 75,839 | | 165,805 | |
| At 31 Dec 2020 | 9,834 | | 33,253 | | 54,359 | | 77,938 | | 175,384 | |
Insurance underwriting risk
Description and exposure
Insurance underwriting risk is the risk of loss through adverse experience, in either timing or amount, of insurance underwriting parameters (non-economic assumptions). These parameters include mortality, morbidity, longevity, lapse and expense rates.
The principal risk we face is that, over time, the cost of the contract, including claims and benefits, may exceed the total amount of premiums and investment income received.
The tables on pages 248 and 249 analyse our life insurance risk exposures by type of contract and by geographical region.
The insurance risk profile and related exposures remain largely consistent with those observed at 31 December 2020.
Sensitivities
(Audited)
The following table shows the sensitivity of profit and total equity to reasonably possible changes in non-economic assumptions across all our insurance manufacturing subsidiaries.
Mortality and morbidity risk is typically associated with life insurance contracts. The effect on profit of an increase in mortality or morbidity depends on the type of business being written.
Sensitivity to lapse rates depends on the type of contracts being written. For a portfolio of term assurance, an increase in lapse rates typically has a negative effect on profit due to the loss of future income on the lapsed policies. However, some contract lapses have a positive effect on profit due to the existence of policy surrender charges. We are most sensitive to a change in lapse rates on unit-linked and universal life contracts.
Expense rate risk is the exposure to a change in the allocated cost of administering insurance contracts. To the extent that increased expenses cannot be passed on to policyholders, an increase in expense rates will have a negative effect on our profits. This risk is generally greatest for our smaller entities.
| | | | | | | | |
| Sensitivity analysis |
| (Audited) |
| 2021 | 2020 |
| $m | $m |
| Effect on profit after tax and total equity at 31 Dec | | |
| Effect on profit after tax and total equity at 10% increase in mortality and/or morbidity rates | (112) | | (93) | |
| Effect on profit after tax and total equity at 10% decrease in mortality and/or morbidity rates | 115 | | 98 | |
| Effect on profit after tax and total equity at 10% increase in lapse rates | (115) | | (111) | |
| Effect on profit after tax and total equity at 10% decrease in lapse rates | 129 | | 128 | |
| Effect on profit after tax and total equity at 10% increase in expense rates | (108) | | (117) | |
| Effect on profit after tax and total equity at 10% decrease in expense rates | 107 | | 115 | |
Financial statements
The financial statements provide detailed information and notes on our income, balance sheet, cash flows and changes in equity, alongside a report from our independent auditors.
334 Report of Independent Registered Public Accounting Firm to the Board of Directors and Shareholders of HSBC Holdings plc
336 Financial statements
346 Notes on the financial statements
Making our cards more sustainable and accessible
We are ending single-use plastic in our payment cards. By the end of 2026, the approximately 23 million cards we issue each year will be made from recycled PVC plastic. This action is expected to reduce CO2 emissions by 161 tonnes and save 73 tonnes of plastic waste per year as part of our net zero strategy. We rolled out recycled PVC cards for 13 markets in 2021, issuing them for customers needing new or replacement cards.
Our UK cards also feature a range of accessibility features as standard for all customers. Working with charities such as Alzheimer’s Society, the new features include considerations for people with dementia, visual impairments, learning difficulties, dyslexia and colour blindness. These include tactile raised dots to differentiate credit cards from debit cards, and retail cards from commercial ones.
Report of Independent Registered Public Accounting Firm
| | |
Report of Independent Registered Public Accounting Firm To the Board of Directors and Shareholders of HSBC Holdings plc |
Opinions on the Financial Statements and Internal Control over Financial Reporting
We have audited the accompanying consolidated balance sheets of HSBC Holdings plc and its subsidiaries (the “Company”) as of 31 December 2021 and 31 December 2020, and the related consolidated income statements, consolidated statements of comprehensive income, consolidated statements of cash flows, and consolidated statements of changes in equity for each of the three years in the period ended 31 December 2021, including the related notes (collectively referred to as the “consolidated financial statements”). We also have audited the Company's internal control over financial reporting as of 31 December 2021, based on criteria established in Internal Control - Integrated Framework (2013) issued by the Committee of Sponsoring Organizations of the Treadway Commission (COSO).
In our opinion, the consolidated financial statements referred to above present fairly, in all material respects, the financial position of the Company as of 31 December 2021 and 31 December 2020, and the results of its operations and its cash flows for each of the three years in the period ended 31 December 2021 as prepared in accordance with i) UK-adopted International Accounting Standards, ii) International Financial Reporting Standards adopted pursuant to Regulation (EC) No 1606/2002 as it applies in the European Union, and iii) International Financial Reporting Standards as issued by the International Accounting Standards Board. Also in our opinion, the Company maintained, in all material respects, effective internal control over financial reporting as of 31 December 2021, based on criteria established in Internal Control - Integrated Framework (2013) issued by the COSO.
Basis for Opinions
The Company's management is responsible for these consolidated financial statements, for maintaining effective internal control over financial reporting, and for its assessment of the effectiveness of internal control over financial reporting, included in Management’s assessment of internal controls over financial reporting on page 134 of the Form 20-F. Our responsibility is to express opinions on the Company’s consolidated financial statements and on the Company's internal control over financial reporting based on our audits. We are a public accounting firm registered with the Public Company Accounting Oversight Board (United States) (PCAOB) and are required to be independent with respect to the Company in accordance with the U.S. federal securities laws and the applicable rules and regulations of the Securities and Exchange Commission and the PCAOB.
We conducted our audits in accordance with the standards of the PCAOB. Those standards require that we plan and perform the audits to obtain reasonable assurance about whether the consolidated financial statements are free of material misstatement, whether due to error or fraud, and whether effective internal control over financial reporting was maintained in all material respects.
Our audits of the consolidated financial statements included performing procedures to assess the risks of material misstatement of the consolidated financial statements, whether due to error or fraud, and performing procedures that respond to those risks. Such procedures included examining, on a test basis, evidence regarding the amounts and disclosures in the consolidated financial statements. Our audits also included evaluating the accounting principles used and significant estimates made by management, as well as evaluating the overall presentation of the consolidated financial statements. Our audit of internal control over financial reporting included obtaining an understanding of internal control over financial reporting, assessing the risk that a material weakness exists, and testing and evaluating the design and operating effectiveness of internal control based on the assessed risk. Our audits also included performing such other procedures as we considered necessary in the circumstances. We believe that our audits provide a reasonable basis for our opinions.
Definition and Limitations of Internal Control over Financial Reporting
A company’s internal control over financial reporting is a process designed to provide reasonable assurance regarding the reliability of financial reporting and the preparation of financial statements for external purposes in accordance with generally accepted accounting principles. A company’s internal control over financial reporting includes those policies and procedures that (i) pertain to the maintenance of records that, in reasonable detail, accurately and fairly reflect the transactions and dispositions of the assets of the company; (ii) provide reasonable assurance that transactions are recorded as necessary to permit preparation of financial statements in accordance with generally accepted accounting principles, and that receipts and expenditures of the company are being made only in accordance with authorizations of management and directors of the company; and (iii) provide reasonable assurance regarding prevention or timely detection of unauthorized acquisition, use, or disposition of the company’s assets that could have a material effect on the financial statements.
Because of its inherent limitations, internal control over financial reporting may not prevent or detect misstatements. Also, projections of any evaluation of effectiveness to future periods are subject to the risk that controls may become inadequate because of changes in conditions, or that the degree of compliance with the policies or procedures may deteriorate.
Critical Audit Matters
The critical audit matters communicated below are matters arising from the current period audit of the consolidated financial statements that were communicated or required to be communicated to the audit committee and that (i) relate to accounts or disclosures that are material to the consolidated financial statements and (ii) involved especially challenging, subjective, or complex judgments. The communication of critical audit matters does not alter in any way our opinion on the consolidated financial statements, taken as a whole, and we are not, by communicating the critical audit matters below, providing separate opinions on the critical audit matters or on the accounts or disclosures to which they relate.
Measurement of expected credit losses
As described in Note 1.2(i) to the consolidated financial statements, expected credit losses are recognised for loans and advances to banks and customers, non-trading reverse repurchase agreements, other financial assets held at amortised cost, debt instruments measured at fair value through other comprehensive income and certain loan commitments and financial guarantee contracts. The assessment of credit risk and the estimation of expected credit losses are probability-weighted, and incorporate information about past events, current conditions and forecasts of future events and economic conditions at the reporting date. Management calculates expected credit losses using three main components: a probability of default (‘PD’), loss given default (‘LGD’) and exposure at default (‘EAD’). Management applies judgement when determining the severity and probability weighting of multiple forward-looking economic scenarios. As described by management, the level of estimation uncertainty and judgement has remained high during 2021 as a result of the ongoing economic effects of the Covid-19 pandemic and other sources of economic instability, including significant judgements relating to the selection and weighting of economic scenarios, and estimating the economic effects of those scenarios on expected credit losses. Modelled assumptions and linkages based on historical information alone do not produce relevant information under the
conditions experienced in 2021, and management judgemental adjustments are used to address late-breaking events, data and model limitations, credit risk dynamics not captured by models and sector specific risks. The Company’s expected credit losses total was US$12.2 billion as of 31 December 2021.
The principal considerations for our determination that performing procedures relating to measurement of expected credit losses is a critical audit matter are the estimate of expected credit losses involved significant judgement by management in developing the assumptions supporting the selection and weighting of economic scenarios, and the adjustments made to modelled expected credit losses. This led to a high degree of auditor judgement, subjectivity and effort in performing procedures and evaluating the models, inputs, significant assumptions and audit evidence. The audit effort involved the use of professionals with specialised skill and knowledge.
Addressing the matter involved performing procedures and evaluating audit evidence in connection with forming our overall opinion on the consolidated financial statements. These procedures included testing the effectiveness of controls relating to the measurement of expected credit losses. These procedures also included, among others, testing management’s process for estimating expected credit losses through (i) evaluating the appropriateness of the model methodologies applied by management, (ii) assessing the reasonableness of the selection and weighting of economic scenarios, (iii) evaluating management’s determination of the need for and measurement of management judgemental adjustments; and (iv) testing the completeness and accuracy of certain input data that is used to determine expected credit losses. We also evaluated the disclosures made in the consolidated financial statements in relation to the measurement of expected credit losses. Professionals with specialised skills and knowledge assisted in assessing the reasonableness of and testing model methodologies, management judgemental adjustments and selection and weighting of economic scenarios.
Impairment assessment of investment in Bank of Communications Co., Limited (‘BoCom’)
As described in Notes 1.2(a) and 18 to the consolidated financial statements, the carrying value of the Group’s investment in Bank of Communications Co., Limited is US$23.6billion at 31 December 2021. As disclosed by management, there is significant judgement in determining the value in use, and in particular estimating the present value of cash flows expected to arise from continuing to hold the investment, based on a number of management assumptions. The fair value of the Group’s investment in BoCom has been below the carrying amount for approximately 10 years. Management performed an impairment test by comparing the recoverable amount of BoCom, determined by a value-in-use (‘VIU’) calculation, with its carrying amount, which confirmed there was no impairment at 31 December 2021. The VIU calculation uses discounted cash flow projections based on management’s best estimates of future earnings available to ordinary shareholders. The recoverable amount as determined by a VIU calculation was higher than the carrying value. Significant management judgement was required in arriving at the estimate. The significant assumptions used were discount rate; short term assumptions for operating income growth rate, cost-income ratio, expected credit losses and effective tax rates; long term assumptions for profit and asset growth rates, expected credit losses, and effective tax rates; and capital related assumptions including risk-weighted assets, capital adequacy ratio and tier 1 capital adequacy ratio.
The principal considerations for our determination that performing procedures relating to the impairment assessment of the investment in BoCom is a critical audit matter are (i) the significant judgement by management when developing significant assumptions including discount rate; short term assumptions for operating income growth rate, cost-income ratio, expected credit losses and effective tax rates; long term assumptions for profit and asset growth rates, expected credit losses, and effective tax rates; and capital related assumptions including risk-weighted assets, capital adequacy ratio and tier 1 capital adequacy ratio; (ii) a high degree of auditor judgement and effort in performing procedures to evaluate the methodology used to calculate the VIU and assessing audit evidence; and (iii) the audit effort involved the use of professionals with specialised skill and knowledge.
Addressing the matter involved performing procedures and evaluating audit evidence in connection with forming our overall opinion on the financial statements. These procedures included testing the effectiveness of controls relating to management’s impairment assessment of the investment in BoCom, which included controls over the VIU model and significant assumptions including discount rate; short term assumptions for operating income growth rate, cost-income ratio, expected credit losses and effective tax rates; long term assumptions for profit and asset growth rates, expected credit losses, and effective tax rates; and capital related assumptions including risk-weighted assets, capital adequacy ratio and tier 1 capital adequacy ratio. These procedures also included, among others, i) evaluating management’s VIU determination and underlying significant assumptions; ii) developing an independent range for discount rates and evaluating the appropriateness of the methodology used to estimate the VIU; iii) testing inputs used in the determination of the significant assumptions; and iv) evaluating the disclosures made in the consolidated financial statements in relation to BoCom. Professionals with specialized skill and knowledge were used to assist in assessing the VIU methodology and developing an independent range for discount rates.
/s/PricewaterhouseCoopers LLP
London, United Kingdom
23 February 2022
We have served as the Company’s auditor since 2015
| | | | | | | | |
| Financial statements |
| Page |
| Consolidated income statement | |
| Consolidated statement of comprehensive income | |
| Consolidated balance sheet | |
| Consolidated statement of cash flows | |
| Consolidated statement of changes in equity | |
| HSBC Holdings income statement | |
| HSBC Holdings statement of comprehensive income | |
| HSBC Holdings balance sheet | |
| HSBC Holdings statement of cash flows | |
| HSBC Holdings statement of changes in equity | |
| | | | | | | | | | | | | | |
| Consolidated income statement |
| for the year ended 31 December |
| | 2021 | 2020 | 2019 |
| Notes* | $m | $m | $m |
| Net interest income | | 26,489 | | 27,578 | | 30,462 | |
– interest income1,2 | | 36,188 | | 41,756 | | 54,695 | |
– interest expense3 | | (9,699) | | (14,178) | | (24,233) | |
| Net fee income | 2 | 13,097 | | 11,874 | | 12,023 | |
| – fee income | | 16,788 | | 15,051 | | 15,439 | |
| – fee expense | | (3,691) | | (3,177) | | (3,416) | |
| Net income from financial instruments held for trading or managed on a fair value basis | 3 | 7,744 | | 9,582 | | 10,231 | |
| Net income/(expense) from assets and liabilities of insurance businesses, including related derivatives, measured at fair value through profit or loss | 3 | 4,053 | | 2,081 | | 3,478 | |
Changes in fair value of designated debt and related derivatives4 | 3 | (182) | | 231 | | 90 | |
| Changes in fair value of other financial instruments mandatorily measured at fair value through profit or loss | 3 | 798 | | 455 | | 812 | |
| Gains less losses from financial investments | | 569 | | 653 | | 335 | |
| | | | |
| Net insurance premium income | 4 | 10,870 | | 10,093 | | 10,636 | |
| Other operating income | | 502 | | 527 | | 2,957 | |
| Total operating income | | 63,940 | | 63,074 | | 71,024 | |
| Net insurance claims and benefits paid and movement in liabilities to policyholders | 4 | (14,388) | | (12,645) | | (14,926) | |
| Net operating income before change in expected credit losses and other credit impairment charges | | 49,552 | | 50,429 | | 56,098 | |
| Change in expected credit losses and other credit impairment charges | | 928 | | (8,817) | | (2,756) | |
| Net operating income | | 50,480 | | 41,612 | | 53,342 | |
| Employee compensation and benefits | 5 | (18,742) | | (18,076) | | (18,002) | |
| General and administrative expenses | | (11,592) | | (11,115) | | (13,828) | |
Depreciation and impairment of property, plant and equipment and right-of-use assets5 | | (2,261) | | (2,681) | | (2,100) | |
| Amortisation and impairment of intangible assets | | (1,438) | | (2,519) | | (1,070) | |
| Goodwill impairment | 21 | (587) | | (41) | | (7,349) | |
| Total operating expenses | | (34,620) | | (34,432) | | (42,349) | |
| Operating profit | | 15,860 | | 7,180 | | 10,993 | |
| Share of profit in associates and joint ventures | 19 | 3,046 | | 1,597 | | 2,354 | |
| Profit before tax | | 18,906 | | 8,777 | | 13,347 | |
| Tax expense | 7 | (4,213) | | (2,678) | | (4,639) | |
| Profit for the year | | 14,693 | | 6,099 | | 8,708 | |
| Attributable to: | | | | |
| – ordinary shareholders of the parent company | | 12,607 | | 3,898 | | 5,969 | |
| – preference shareholders of the parent company | | 7 | | 90 | | 90 | |
| – other equity holders | | 1,303 | | 1,241 | | 1,324 | |
| – non-controlling interests | | 776 | | 870 | | 1,325 | |
| Profit for the year | | 14,693 | | 6,099 | | 8,708 | |
| | $ | $ | $ |
| Basic earnings per ordinary share | 9 | 0.62 | | 0.19 | | 0.30 | |
| Diluted earnings per ordinary share | 9 | 0.62 | | 0.19 | | 0.30 | |
* For Notes on the financial statements, see page 346.
1 Interest income includes $30,916m (2020: $35,293m) of interest recognised on financial assets measured at amortised cost and $4,337m (2020: $5,614m) of interest recognised on financial assets measured at fair value through other comprehensive income.
2 Interest revenue calculated using the effective interest method comprises interest recognised on financial assets measured at either amortised cost or fair value through other comprehensive income.
3 Interest expense includes $8,227m (2020: $12,426m) of interest on financial instruments, excluding interest on financial liabilities held for trading or designated or otherwise mandatorily measured at fair value.
4 The debt instruments, issued for funding purposes, are designated under the fair value option to reduce an accounting mismatch.
5 Includes depreciation of the right-of-use assets of $878m (2020: $1,029m).
| | | | | | | | | | | |
| Consolidated statement of comprehensive income |
| for the year ended 31 December |
| 2021 | 2020 | 2019 |
| $m | $m | $m |
| Profit for the year | 14,693 | | 6,099 | | 8,708 | |
| Other comprehensive income/(expense) | | | |
| Items that will be reclassified subsequently to profit or loss when specific conditions are met: | | | |
| Debt instruments at fair value through other comprehensive income | (2,139) | | 1,750 | | 1,152 | |
| – fair value gains/(losses) | (2,270) | | 2,947 | | 1,793 | |
| – fair value gains transferred to the income statement on disposal | (464) | | (668) | | (365) | |
| – expected credit (recoveries)/losses recognised in the income statement | (49) | | 48 | | 109 | |
| – income taxes | 644 | | (577) | | (385) | |
| Cash flow hedges | (664) | | 471 | | 206 | |
| – fair value gains/(losses) | 595 | | (157) | | 551 | |
– fair value (gains)/losses reclassified to the income statement
| (1,514) | | 769 | | (286) | |
| – income taxes | 255 | | (141) | | (59) | |
| Share of other comprehensive income/(expense) of associates and joint ventures | 103 | | (73) | | 21 | |
| – share for the year | 103 | | (73) | | 21 | |
| | | |
| Exchange differences | (2,393) | | 4,855 | | 1,044 | |
| | | |
| | | |
| | | |
| Items that will not be reclassified subsequently to profit or loss: | | | |
| Remeasurement of defined benefit asset/liability | (274) | | 834 | | 13 | |
| – before income taxes | (107) | | 1,223 | | (17) | |
| – income taxes | (167) | | (389) | | 30 | |
Changes in fair value of financial liabilities designated at fair value upon initial recognition arising from changes in own credit risk
| 531 | | 167 | | (2,002) | |
– before income taxes
| 512 | | 190 | | (2,639) | |
– income taxes
| 19 | | (23) | | 637 | |
| Equity instruments designated at fair value through other comprehensive income | (446) | | 212 | | 366 | |
| – fair value gains/(losses) | (443) | | 212 | | 364 | |
| – income taxes | (3) | | — | | 2 | |
| Effects of hyperinflation | 315 | | 193 | | 217 | |
| Other comprehensive income/(expense) for the period, net of tax | (4,967) | | 8,409 | | 1,017 | |
| Total comprehensive income for the year | 9,726 | | 14,508 | | 9,725 | |
| Attributable to: | | | |
| – ordinary shareholders of the parent company | 7,765 | | 12,146 | | 6,838 | |
| – preference shareholders of the parent company | 7 | | 90 | | 90 | |
| – other equity holders | 1,303 | | 1,241 | | 1,324 | |
| – non-controlling interests | 651 | | 1,031 | | 1,473 | |
| Total comprehensive income for the year | 9,726 | | 14,508 | | 9,725 | |
| | | |
| | | |
| | | |
| | | |
| | | |
| | | | | | | | | | | |
| Consolidated balance sheet |
|
| | | At |
| | 31 Dec | 31 Dec |
| | 2021 | 2020 |
| Notes* | $m | $m |
| Assets | | | |
| Cash and balances at central banks | | 403,018 | | 304,481 | |
| Items in the course of collection from other banks | | 4,136 | | 4,094 | |
| Hong Kong Government certificates of indebtedness | | 42,578 | | 40,420 | |
| Trading assets | 11 | 248,842 | | 231,990 | |
| Financial assets designated and otherwise mandatorily measured at fair value through profit or loss | 14 | 49,804 | | 45,553 | |
| Derivatives | 15 | 196,882 | | 307,726 | |
| Loans and advances to banks | | 83,136 | | 81,616 | |
| Loans and advances to customers | | 1,045,814 | | 1,037,987 | |
| Reverse repurchase agreements – non-trading | | 241,648 | | 230,628 | |
| Financial investments | 16 | 446,274 | | 490,693 | |
| Prepayments, accrued income and other assets | 22 | 139,982 | | 156,412 | |
| Current tax assets | | 970 | | 954 | |
| Interests in associates and joint ventures | 18 | 29,609 | | 26,684 | |
| Goodwill and intangible assets | 21 | 20,622 | | 20,443 | |
| Deferred tax assets | 7 | 4,624 | | 4,483 | |
| Total assets | | 2,957,939 | | 2,984,164 | |
| Liabilities and equity | | | |
| Liabilities | | | |
| Hong Kong currency notes in circulation | | 42,578 | | 40,420 | |
| Deposits by banks | | 101,152 | | 82,080 | |
| Customer accounts | | 1,710,574 | | 1,642,780 | |
| Repurchase agreements – non-trading | | 126,670 | | 111,901 | |
| Items in the course of transmission to other banks | | 5,214 | | 4,343 | |
| Trading liabilities | 23 | 84,904 | | 75,266 | |
| Financial liabilities designated at fair value | 24 | 145,502 | | 157,439 | |
| Derivatives | 15 | 191,064 | | 303,001 | |
| Debt securities in issue | 25 | 78,557 | | 95,492 | |
| Accruals, deferred income and other liabilities | 26 | 123,778 | | 128,624 | |
| Current tax liabilities | | 698 | | 690 | |
| Liabilities under insurance contracts | 4 | 112,745 | | 107,191 | |
| Provisions | 27 | 2,566 | | 3,678 | |
| Deferred tax liabilities | 7 | 4,673 | | 4,313 | |
| Subordinated liabilities | 28 | 20,487 | | 21,951 | |
| Total liabilities | | 2,751,162 | | 2,779,169 | |
| Equity | | | |
| Called up share capital | 31 | 10,316 | | 10,347 | |
| Share premium account | 31 | 14,602 | | 14,277 | |
| Other equity instruments | | 22,414 | | 22,414 | |
| Other reserves | | 6,460 | | 8,833 | |
| Retained earnings | | 144,458 | | 140,572 | |
| Total shareholders’ equity | | 198,250 | | 196,443 | |
| Non-controlling interests | 19 | 8,527 | | 8,552 | |
| Total equity | | 206,777 | | 204,995 | |
| Total liabilities and equity | | 2,957,939 | | 2,984,164 | |
* For Notes on the financial statements, see page 346.
The accompanying notes on pages 346 to 424 and the audited sections in ‘Risk’ on pages 144 to 252 (including ‘Measurement uncertainty and sensitivity analysis of ECL estimates’ on pages 180 to 188), and ‘Directors’ remuneration report’ on pages 290 to 323 form an integral part of these financial statements.
These financial statements were approved by the Board of Directors on 22 February 2022 and signed on its behalf by:
| | | | | | | | |
| | |
| Mark E Tucker | | Ewen Stevenson |
| Group Chairman | | Group Chief Financial Officer |
| | | | | | | | | | | |
| Consolidated statement of cash flows |
| for the year ended 31 December |
| 2021 | 2020 | 2019 |
| $m | $m | $m |
| Profit before tax | 18,906 | | 8,777 | | 13,347 | |
| Adjustments for non-cash items: | | | |
| Depreciation, amortisation and impairment | 4,286 | | 5,241 | | 10,519 | |
| Net gain from investing activities | (647) | | (541) | | (399) | |
| Share of profits in associates and joint ventures | (3,046) | | (1,597) | | (2,354) | |
| Gain on disposal of subsidiaries, businesses, associates and joint ventures | — | | — | | (929) | |
| Change in expected credit losses gross of recoveries and other credit impairment charges | (519) | | 9,096 | | 3,012 | |
| Provisions including pensions | 1,063 | | 1,164 | | 2,423 | |
| Share-based payment expense | 467 | | 433 | | 478 | |
| Other non-cash items included in profit before tax | 510 | | (906) | | (2,297) | |
Elimination of exchange differences1 | 18,937 | | (25,749) | | (3,742) | |
| Changes in operating assets and liabilities | | | |
| Change in net trading securities and derivatives | (9,226) | | 13,150 | | (18,910) | |
| Change in loans and advances to banks and customers | (11,014) | | (14,131) | | (53,760) | |
| Change in reverse repurchase agreements – non-trading | 552 | | 9,950 | | (7,390) | |
| Change in financial assets designated and otherwise mandatorily measured at fair value | (4,254) | | (1,962) | | (2,308) | |
| Change in other assets | 19,899 | | (19,610) | | (21,863) | |
| Change in deposits by banks and customer accounts | 95,703 | | 226,723 | | 79,163 | |
| Change in repurchase agreements – non-trading | 14,769 | | (28,443) | | (25,540) | |
| Change in debt securities in issue | (16,936) | | (9,075) | | 19,268 | |
| Change in financial liabilities designated at fair value | (11,425) | | (6,630) | | 20,068 | |
| Change in other liabilities | (10,935) | | 20,323 | | 23,124 | |
| Dividends received from associates | 808 | | 761 | | 633 | |
| Contributions paid to defined benefit plans | (509) | | (495) | | (533) | |
| Tax paid | (3,077) | | (4,259) | | (2,267) | |
| Net cash from operating activities | 104,312 | | 182,220 | | 29,743 | |
| Purchase of financial investments | (493,042) | | (496,669) | | (445,907) | |
| Proceeds from the sale and maturity of financial investments | 521,190 | | 476,990 | | 413,186 | |
| Net cash flows from the purchase and sale of property, plant and equipment | (1,086) | | (1,446) | | (1,343) | |
| Net cash flows from purchase/(disposal) of customer and loan portfolios | 3,059 | | 1,362 | | 1,118 | |
| Net investment in intangible assets | (2,479) | | (2,064) | | (2,289) | |
| Net cash flow from acquisition and disposal of subsidiaries, businesses, associates and joint ventures | (106) | | (603) | | (83) | |
| Net cash from investing activities | 27,536 | | (22,430) | | (35,318) | |
| Issue of ordinary share capital and other equity instruments | 1,996 | | 1,497 | | — | |
| Cancellation of shares | (707) | | — | | (1,000) | |
| Net sales/(purchases) of own shares for market-making and investment purposes | (1,386) | | (181) | | 141 | |
| | | |
| Redemption of preference shares and other equity instruments | (3,450) | | (398) | | — | |
| | | |
Subordinated loan capital repaid2 | (864) | | (3,538) | | (4,210) | |
| Dividends paid to shareholders of the parent company and non-controlling interests | (6,383) | | (2,023) | | (9,773) | |
| Net cash from financing activities | (10,794) | | (4,643) | | (14,842) | |
| Net increase/(decrease) in cash and cash equivalents | 121,054 | | 155,147 | | (20,417) | |
| Cash and cash equivalents at 1 Jan | 468,323 | | 293,742 | | 312,911 | |
| Exchange differences in respect of cash and cash equivalents | (15,345) | | 19,434 | | 1,248 | |
Cash and cash equivalents at 31 Dec3 | 574,032 | | 468,323 | | 293,742 | |
| Cash and cash equivalents comprise: | | | |
| – cash and balances at central banks | 403,018 | | 304,481 | | 154,099 | |
| – items in the course of collection from other banks | 4,136 | | 4,094 | | 4,956 | |
| – loans and advances to banks of one month or less | 55,705 | | 51,788 | | 41,626 | |
| – reverse repurchase agreements with banks of one month or less | 76,658 | | 65,086 | | 65,370 | |
| – treasury bills, other bills and certificates of deposit less than three months | 28,488 | | 30,023 | | 20,132 | |
| – cash collateral and net settlement accounts | 11,241 | | 17,194 | | 12,376 | |
| – less: items in the course of transmission to other banks | (5,214) | | (4,343) | | (4,817) | |
Cash and cash equivalents at 31 Dec3 | 574,032 | | 468,323 | | 293,742 | |
Interest received was $40,175m (2020: $45,578m; 2019: $58,627m), interest paid was $12,695m (2020: $17,740m; 2019: $27,384m) and dividends received (excluding dividends received from associates, which are presented separately above) were $1,898m (2020: $1,158m; 2019: $2,369m).
1 Adjustment to bring changes between opening and closing balance sheet amounts to average rates. This is not done on a line-by-line basis, as details cannot be determined without unreasonable expense.
2 Subordinated liabilities changes during the year are attributable to repayments of $(0.9)bn (2020: $(3.5)bn; 2019: $(4.2)bn) of securities. Non-cash changes during the year included foreign exchange gains/(losses) of $(0.3)bn (2020: $0.5bn; 2019: $0.6bn) and fair value gains/(losses) of $(1.0)bn (2020: $1.1bn; 2019: $1.4bn).
3 At 31 December 2021 $33,634m (2020: $41,912m; 2019: $35,735m) was not available for use by HSBC, of which $15,357m (2020: $16,935m; 2019: $19,353m) related to mandatory deposits at central banks.
| | | | | | | | | | | | | | | | | | | | | | | | | | | | | | | | | | | | | | | | | |
| Consolidated statement of changes in equity | | | | | | | | | |
| for the year ended 31 December | | | | | | | | | |
| | | | Other reserves | | | | | | | | | | | | |
| Called up
share
capital
and
share
premium | Other
equity
instru-ments | Retained earnings3,4 | Financial
assets
at
FVOCI
reserve | Cash
flow
hedging
reserve | Foreign
exchange
reserve | Merger and other reserves4,5 | Total
share-
holders’
equity | Non-
controlling
interests | Total
equity | | | | | | | | | |
| $m | $m | $m | $m | $m | $m | $m | $m | $m | $m | | | | | | | | | |
| | | | | | | | | | | | | | | | | | | |
| | | | | | | | | | | | | | | | | | | |
| At 1 Jan 2021 | 24,624 | | 22,414 | | 140,572 | | 1,816 | | 457 | | (20,375) | | 26,935 | | 196,443 | | 8,552 | | 204,995 | | | | | | | | | | |
| Profit for the year | — | | — | | 13,917 | | — | | — | | — | | — | | 13,917 | | 776 | | 14,693 | | | | | | | | | | |
| Other comprehensive income (net of tax) | — | | — | | 661 | | (2,455) | | (654) | | (2,394) | | — | | (4,842) | | (125) | | (4,967) | | | | | | | | | | |
| – debt instruments at fair value through other comprehensive income | — | | — | | — | | (2,105) | | — | | — | | — | | (2,105) | | (34) | | (2,139) | | | | | | | | | | |
| – equity instruments designated at fair value through other comprehensive income | — | | — | | — | | (350) | | — | | — | | — | | (350) | | (96) | | (446) | | | | | | | | | | |
| – cash flow hedges | — | | — | | — | | — | | (654) | | — | | — | | (654) | | (10) | | (664) | | | | | | | | | | |
| – changes in fair value of financial liabilities designated at fair value upon initial recognition arising from changes in own credit risk | — | | — | | 531 | | — | | — | | — | | — | | 531 | | — | | 531 | | | | | | | | | | |
| – remeasurement of defined benefit asset/liability | — | | — | | (288) | | — | | — | | — | | — | | (288) | | 14 | | (274) | | | | | | | | | | |
| – share of other comprehensive income of associates and joint ventures | — | | — | | 103 | | — | | — | | — | | — | | 103 | | — | | 103 | | | | | | | | | | |
| | | | | | | | | | | | | | | | | | | |
| – effects of hyperinflation | — | | — | | 315 | | — | | — | | — | | — | | 315 | | — | | 315 | | | | | | | | | | |
| – exchange differences | — | | — | | — | | — | | — | | (2,394) | | — | | (2,394) | | 1 | | (2,393) | | | | | | | | | | |
| Total comprehensive income for the year | — | | — | | 14,578 | | (2,455) | | (654) | | (2,394) | | — | | 9,075 | | 651 | | 9,726 | | | | | | | | | | |
| Shares issued under employee remuneration and share plans | 354 | | — | | (336) | | — | | — | | — | | — | | 18 | | — | | 18 | | | | | | | | | | |
| | | | | | | | | | | | | | | | | | | |
| | | | | | | | | | | | | | | | | | | |
Capital securities issued1 | — | | 2,000 | | (4) | | — | | — | | — | | — | | 1,996 | | — | | 1,996 | | | | | | | | | | |
| Dividends to shareholders | — | | — | | (5,790) | | — | | — | | — | | — | | (5,790) | | (593) | | (6,383) | | | | | | | | | | |
Redemption of securities2 | — | | (2,000) | | — | | — | | — | | — | | — | | (2,000) | | — | | (2,000) | | | | | | | | | | |
Transfers6 | — | | — | | (3,065) | | — | | — | | — | | 3,065 | | — | | — | | — | | | | | | | | | | |
| Cost of share-based payment arrangements | — | | — | | 467 | | — | | — | | — | | — | | 467 | | — | | 467 | | | | | | | | | | |
Cancellation of shares7 | (60) | | — | | (2,004) | | — | | — | | — | | 60 | | (2,004) | | — | | (2,004) | | | | | | | | | | |
| | | | | | | | | | | | | | | | | | | |
| Other movements | — | | — | | 40 | | 5 | | — | | — | | — | | 45 | | (83) | | (38) | | | | | | | | | | |
| At 31 Dec 2021 | 24,918 | | 22,414 | | 144,458 | | (634) | | (197) | | (22,769) | | 30,060 | | 198,250 | | 8,527 | | 206,777 | | | | | | | | | | |
| | | | | | | | | | | | | | | | | | | |
| | | | | | | | | |
| | | | | | | | | | | | | | | | |
| | | | | | | | | | | | | | | | | | | |
| | | | | | | | | | | | | | | | | | | |
| | | | | | | | | | | | | | | | | | | |
| | | | | | | | | | | | | | | | | | | |
| | | | | | | | | |
| | | | | | | | | | | | | | | | |
| | | | | | | | | | | | | | | | | | | |
| | | | | | | | | | | | | | | | | | | |
| | | | | | | | | | | | | | | | | | | |
| | | | | | | | | | | | | | | | | | | |
| At 1 Jan 2020 | 24,278 | | 20,871 | | 136,679 | | (108) | | (2) | | (25,133) | | 27,370 | | 183,955 | | 8,713 | | 192,668 | | | | | | | | | | |
| Profit for the year | — | | — | | 5,229 | | — | | — | | — | | — | | 5,229 | | 870 | | 6,099 | | | | | | | | | | |
| Other comprehensive income (net of tax) | — | | — | | 1,118 | | 1,913 | | 459 | | 4,758 | | — | | 8,248 | | 161 | | 8,409 | | | | | | | | | | |
| – debt instruments at fair value through other comprehensive income | — | | — | | — | | 1,746 | | — | | — | | — | | 1,746 | | 4 | | 1,750 | | | | | | | | | | |
–equity instruments designated at fair value through other comprehensive income | — | | — | | — | | 167 | | | — | | — | | 167 | | 45 | | 212 | | | | | | | | | | |
| – cash flow hedges | — | | — | | — | | — | | 459 | | — | | — | | 459 | | 12 | | 471 | | | | | | | | | | |
| – changes in fair value of financial liabilities designated at fair value upon initial recognition arising from changes in own credit risk | — | | — | | 167 | | — | | — | | — | | — | | 167 | | — | | 167 | | | | | | | | | | |
| – remeasurement of defined benefit asset/liability | — | | — | | 831 | | — | | — | | — | | — | | 831 | | 3 | | 834 | | | | | | | | | | |
| – share of other comprehensive income of associates and joint ventures | — | | — | | (73) | | — | | — | | — | | — | | (73) | | — | | (73) | | | | | | | | | | |
| – effects of hyperinflation | — | | — | | 193 | | — | | — | | — | | — | | 193 | | — | | 193 | | | | | | | | | | |
| | | | | | | | | | | | | | | | | | | |
| – exchange differences | — | | — | | — | | — | | — | | 4,758 | | — | | 4,758 | | 97 | | 4,855 | | | | | | | | | | |
| Total comprehensive income for the year | — | | — | | 6,347 | | 1,913 | | 459 | | 4,758 | | — | | 13,477 | | 1,031 | | 14,508 | | | | | | | | | | |
| Shares issued under employee remuneration and share plans | 346 | | — | | (339) | | — | | — | | — | | — | | 7 | | — | | 7 | | | | | | | | | | |
| | | | | | | | | | | | | | | | | | | |
| | | | | | | | | | | | | | | | | | | |
Capital securities issued1 | — | | 1,500 | | (3) | | — | | — | | — | | — | | 1,497 | | — | | 1,497 | | | | | | | | | | |
| Dividends to shareholders | — | | — | | (1,331) | | — | | — | | — | | — | | (1,331) | | (692) | | (2,023) | | | | | | | | | | |
Redemption of securities2 | — | | — | | (1,450) | | — | | — | | — | | — | | (1,450) | | — | | (1,450) | | | | | | | | | | |
Transfers6 | — | | — | | 435 | | — | | — | | — | | (435) | | — | | — | | — | | | | | | | | | | |
| Cost of share-based payment arrangements | — | | — | | 434 | | — | | — | | — | | — | | 434 | | — | | 434 | | | | | | | | | | |
| | | | | | | | | | | | | | | | | | | |
| Other movements | — | | 43 | | (200) | | 11 | | — | | — | | — | | (146) | | (500) | | (646) | | | | | | | | | | |
| At 31 Dec 2020 | 24,624 | | 22,414 | | 140,572 | | 1,816 | | 457 | | (20,375) | | 26,935 | | 196,443 | | 8,552 | | 204,995 | | | | | | | | | | |
| | | | | | | | | | | | | | | | | | | |
| | | | | | | | | | | | | | | | | | | |
| | | | | | | | | | | | | | | | | | | | | | | | | | | | | | | | | | | | | | | | | |
| | | | | | | | | | | | | | | | | | | |
| Consolidated statement of changes in equity (continued) | | | | | | | | | |
| for the year ended 31 December | | | | | | | | | |
| | | | Other reserves | | | | | | | | | | | | |
| Called up
share
capital and
share
premium | Other
equity
instru-ments | Retained earnings3,4 | Financial
assets at
FVOCI
reserve | Cash
flow
hedging
reserve | Foreign
exchange
reserve | Merger and other reserves4,5 | Total
share-
holders’
equity | Non-
controlling
interests | Total
equity | | | | | | | | | |
| $m | $m | $m | $m | $m | $m | $m | $m | $m | $m | | | | | | | | | |
| At 1 Jan 2019 | 23,789 | | 22,367 | | 138,191 | | (1,532) | | (206) | | (26,133) | | 29,777 | | 186,253 | | 7,996 | | 194,249 | | | | | | | | | | |
| Profit for the year | — | | — | | 7,383 | | — | | — | | — | | — | | 7,383 | | 1,325 | | 8,708 | | | | | | | | | | |
| Other comprehensive income (net of tax) | — | | — | | (1,759) | | 1,424 | | 204 | | 1,000 | | — | | 869 | | 148 | | 1,017 | | | | | | | | | | |
| – debt instruments at fair value through other comprehensive income | — | | — | | — | | 1,146 | | — | | — | | — | | 1,146 | | 6 | | 1,152 | | | | | | | | | | |
| – equity instruments designated at fair value through other comprehensive income | — | | — | | — | | 278 | | — | | — | | — | | 278 | | 88 | | 366 | | | | | | | | | | |
| – cash flow hedges | — | | — | | — | | — | | 204 | | — | | — | | 204 | | 2 | | 206 | | | | | | | | | | |
| – changes in fair value of financial liabilities designated at fair value due to movement in own credit risk | — | | — | | (2,002) | | — | | — | | — | | — | | (2,002) | | — | | (2,002) | | | | | | | | | | |
| – remeasurement of defined benefit asset/liability | — | | — | | 5 | | — | | — | | — | | — | | 5 | | 8 | | 13 | | | | | | | | | | |
| – share of other comprehensive income of associates and joint ventures | — | | — | | 21 | | — | | — | | — | | — | | 21 | | — | | 21 | | | | | | | | | | |
| | | | | | | | | | | | | | | | | | | |
| – effects of hyperinflation | — | | — | | 217 | | — | | — | | — | | — | | 217 | | — | | 217 | | | | | | | | | | |
| – exchange differences | — | | — | | — | | — | | — | | 1,000 | | — | | 1,000 | | 44 | | 1,044 | | | | | | | | | | |
| Total comprehensive income for the year | — | | — | | 5,624 | | 1,424 | | 204 | | 1,000 | | — | | 8,252 | | 1,473 | | 9,725 | | | | | | | | | | |
| Shares issued under employee remuneration and share plans | 557 | | — | | (495) | | — | | — | | — | | — | | 62 | | — | | 62 | | | | | | | | | | |
| Shares issued in lieu of dividends and amounts arising thereon | — | | — | | 2,687 | | — | | — | | — | | — | | 2,687 | | — | | 2,687 | | | | | | | | | | |
| | | | | | | | | | | | | | | | | | | |
| | | | | | | | | | | | | | | | | | | |
| Dividends to shareholders | — | | — | | (11,683) | | — | | — | | — | | — | | (11,683) | | (777) | | (12,460) | | | | | | | | | | |
Redemption of securities2 | — | | (1,496) | | (12) | | — | | — | | — | | — | | (1,508) | | — | | (1,508) | | | | | | | | | | |
Transfers6 | — | | — | | 2,475 | | — | | — | | — | | (2,475) | | — | | — | | — | | | | | | | | | | |
| Cost of share-based payment arrangements | — | | — | | 478 | | — | | — | | — | | — | | 478 | | — | | 478 | | | | | | | | | | |
Cancellation of shares7 | (68) | | — | | (1,000) | | — | | — | | — | | 68 | | (1,000) | | — | | (1,000) | | | | | | | | | | |
| Other movements | — | | — | | 414 | | — | | — | | — | | — | | 414 | | 21 | | 435 | | | | | | | | | | |
| At 31 Dec 2019 | 24,278 | | 20,871 | | 136,679 | | (108) | | (2) | | (25,133) | | 27,370 | | 183,955 | | 8,713 | | 192,668 | | | | | | | | | | |
1 During 2021, HSBC Holdings issued $2,000m of additional tier 1 instruments on which there were $4m of external issue costs. In 2020, HSBC Holdings issued $1,500m of perpetual subordinated contingent convertible capital securities.
2 During 2021, HSBC Holdings redeemed $2,000m 6.875% perpetual subordinated contingent convertible capital securities. For further details, see Note 31 in the Annual Report and Accounts 2021. In 2020, HSBC Holdings called and later redeemed $1,450m 6.20% non-cumulative US dollar preference shares. In 2019, HSBC Holdings redeemed $1,500m 5.625% perpetual subordinated capital securities on which there were $12m of external issuance costs. Under IFRSs external issuance costs are classified as equity.
3 At 31 December 2021, retained earnings included 558,397,704 treasury shares (2020: 509,825,249; 2019: 432,108,782). In addition, treasury shares are also held within HSBC’s Insurance business retirement funds for the benefit of policyholders or beneficiaries within employee trusts for the settlement of shares expected to be delivered under employee share schemes or bonus plans, and the market-making activities in Markets and Security Services.
4 Cumulative goodwill amounting to $5,138m has been charged against reserves in respect of acquisitions of subsidiaries prior to 1 January 1998, including $3,469m charged against the merger reserve arising on the acquisition of HSBC Bank plc. The balance of $1,669m has been charged against retained earnings.
5 Statutory share premium relief under section 131 of the Companies Act 1985 (the ‘Act’) was taken in respect of the acquisition of HSBC Bank plc in 1992, HSBC Continental Europe in 2000 and HSBC Finance Corporation in 2003, and the shares issued were recorded at their nominal value only. In HSBC’s consolidated financial statements, the fair value differences of $8,290m in respect of HSBC Continental Europe and $12,768m in respect of HSBC Finance Corporation were recognised in the merger reserve. The merger reserve created on the acquisition of HSBC Finance Corporation subsequently became attached to HSBC Overseas Holdings (UK) Limited (‘HOHU’), following a number of intra-Group reorganisations. During 2009, pursuant to section 131 of the Companies Act 1985, statutory share premium relief was taken in respect of the rights issue and $15,796m was recognised in the merger reserve.
6 Permitted transfers from the merger reserve to retained earnings were made when the investment in HSBC Overseas Holdings (UK) Limited was previously impaired. In the comparative periods, impairments (2020: $435m; 2019: $2,475m) were recognised and a permitted transfer of these amounts was made from the merger reserve to retained earnings. During 2021, a part reversal of these impairments resulted in a transfer from retained earnings back to the merger reserve of $3,065m.
7 For further details, see Note 31 in the Annual Report and Accounts 2021. In October 2021, HSBC announced a share buy-back of up to $2.0bn, which will be completed no later than April 2022. At 31 December 2021, 120,366,714 ordinary shares had been purchased and cancelled representing a nominal value of $60m, which has been transferred from share capital to capital redemption reserve within merger and other reserves. In August 2019, HSBC announced a share buy-back of up to $1.0bn, which was completed in September 2019.
| | | | | | | | | | | | | | |
| HSBC Holdings income statement |
| for the year ended 31 December |
| | 2021 | 2020 | 2019 |
| Notes* | $m | $m | $m |
| Net interest expense | | (2,367) | | (2,632) | | (2,554) | |
| – interest income | | 380 | | 473 | | 1,249 | |
| – interest expense | | (2,747) | | (3,105) | | (3,803) | |
| Fee (expense)/income | | (5) | | (12) | | (2) | |
| Net income from financial instruments held for trading or managed on a fair value basis | 3 | 110 | | 801 | | 1,477 | |
Changes in fair value of designated debt and related derivatives1 | 3 | 349 | | (326) | | (360) | |
| Changes in fair value of other financial instruments mandatorily measured at fair value through profit or loss | 3 | (420) | | 1,141 | | 1,659 | |
| | | | |
| Dividend income from subsidiaries | | 11,404 | | 8,156 | | 15,117 | |
| Other operating income | | 230 | | 1,889 | | 1,293 | |
| Total operating income | | 9,301 | | 9,017 | | 16,630 | |
| Employee compensation and benefits | 5 | (30) | | (56) | | (37) | |
| General and administrative expenses | | (1,845) | | (4,276) | | (4,772) | |
| Impairment of subsidiaries | | 3,065 | | (435) | | (2,562) | |
| Total operating expenses | | 1,190 | | (4,767) | | (7,371) | |
| Profit before tax | | 10,491 | | 4,250 | | 9,259 | |
| Tax (charge)/credit | | 343 | | (165) | | (218) | |
| Profit for the year | | 10,834 | | 4,085 | | 9,041 | |
* For Notes on the financial statements, see page 346.
1 The debt instruments, issued for funding purposes, are designated under the fair value option to reduce an accounting mismatch.
| | | | | | | | | | | |
| HSBC Holdings statement of comprehensive income |
| for the year ended 31 December |
| 2021 | 2020 | 2019 |
| $m | $m | $m |
| Profit for the year | 10,834 | | 4,085 | | 9,041 | |
| Other comprehensive income/(expense) | | | |
| | | |
| Items that will not be reclassified subsequently to profit or loss: | | | |
| Changes in fair value of financial liabilities designated at fair value upon initial recognition arising from changes in own credit risk | 267 | | 176 | | (396) | |
| – before income taxes | 259 | | 176 | | (573) | |
| – income taxes | 8 | | — | | 177 | |
| Other comprehensive income/(expense) for the year, net of tax | 267 | | 176 | | (396) | |
| Total comprehensive income for the year | 11,101 | | 4,261 | | 8,645 | |
| | | | | | | | | | | |
| HSBC Holdings balance sheet |
|
| | 31 Dec 2021 | 31 Dec 2020 |
| Notes* | $m | $m |
| Assets | | | |
| Cash and balances with HSBC undertakings | | 2,590 | | 2,913 | |
| Financial assets with HSBC undertakings designated and otherwise mandatorily measured at fair value | | 51,408 | | 65,253 | |
| Derivatives | 15 | 2,811 | | 4,698 | |
| Loans and advances to HSBC undertakings | | 25,108 | | 10,443 | |
| Financial investments | | 26,194 | | 17,485 | |
| Prepayments, accrued income and other assets | | 1,513 | | 1,445 | |
| Current tax assets | | 122 | | — | |
| Investments in subsidiaries | | 163,211 | | 160,660 | |
| Intangible assets | | 215 | | 276 | |
| Total assets at 31 Dec | | 273,172 | | 263,173 | |
| Liabilities and equity | | | |
| Liabilities | | | |
| Amounts owed to HSBC undertakings | | 111 | | 330 | |
| Financial liabilities designated at fair value | 24 | 32,418 | | 25,664 | |
| Derivatives | 15 | 1,220 | | 3,060 | |
| Debt securities in issue | 25 | 67,483 | | 64,029 | |
| Accruals, deferred income and other liabilities | | 4,240 | | 4,865 | |
| Subordinated liabilities | 28 | 17,059 | | 17,916 | |
| Current tax liabilities | | — | | 71 | |
| Deferred tax liabilities | | 311 | | 438 | |
| Total liabilities | | 122,842 | | 116,373 | |
| Equity | | | |
| Called up share capital | 31 | 10,316 | | 10,347 | |
| Share premium account | | 14,602 | | 14,277 | |
| Other equity instruments | | 22,414 | | 22,414 | |
| Merger and other reserves | | 37,882 | | 34,757 | |
| Retained earnings | | 65,116 | | 65,005 | |
| Total equity | | 150,330 | | 146,800 | |
| Total liabilities and equity at 31 Dec | | 273,172 | | 263,173 | |
* For Notes on the financial statements, see page 346.
The accompanying notes on pages 346 to 424 and the audited sections in ‘Risk’ on pages 144 to 252 (including ‘Measurement uncertainty and sensitivity analysis of ECL estimates’ on pages 180 to 188), and ‘Directors’ remuneration report’ on pages 290 to 323 form an integral part of these financial statements.
These financial statements were approved by the Board of Directors on 22 February 2022 and signed on its behalf by:
| | | | | | | | |
| | |
| Mark E Tucker | | Ewen Stevenson |
| Group Chairman | | Group Chief Financial Officer |
| | | | | | | | | | | |
| HSBC Holdings statement of cash flows |
| for the year ended 31 December |
| 2021 | 2020 | 2019 |
| $m | $m | $m |
| Profit before tax | 10,491 | | 4,250 | | 9,259 | |
| Adjustments for non-cash items | (2,954) | | 442 | | 2,657 | |
| – depreciation, amortisation and impairment/expected credit losses | (2,976) | | 87 | | 72 | |
| – share-based payment expense | 2 | | 1 | | 1 | |
| – other non-cash items included in profit before tax | 20 | | 354 | | 2,584 | |
| Changes in operating assets and liabilities | | | |
| Change in loans to HSBC undertakings | 3,364 | | (327) | | 41,471 | |
| Change in financial assets with HSBC undertakings designated and otherwise mandatorily measured at fair value | (4,409) | | (3,289) | | (38,451) | |
| Change in net trading securities and net derivatives | 47 | | (1,657) | | (1,433) | |
| Change in other assets | (226) | | (633) | | (437) | |
| Change in financial investments | 20 | | 449 | | (70) | |
| Change in debt securities in issue | (2,833) | | 3,063 | | 1,899 | |
| Change in financial liabilities designated at fair value | (1,396) | | 1,258 | | 1,227 | |
| Change in other liabilities | (691) | | 1,366 | | 437 | |
| Tax received | 32 | | 270 | | 459 | |
| Net cash from operating activities | 1,445 | | 5,192 | | 17,018 | |
| Purchase of financial investments | (16,966) | | (11,652) | | (19,293) | |
| Proceeds from the sale and maturity of financial investments | 16,074 | | 9,342 | | 6,755 | |
| Net cash outflow from acquisition of or increase in stake of subsidiaries | (1,337) | | (2,558) | | (3,721) | |
| Repayment of capital from subsidiaries | 2,000 | | 1,516 | | — | |
| Net investment in intangible assets | (26) | | (33) | | (44) | |
| Net cash from investing activities | (255) | | (3,385) | | (16,303) | |
| Issue of ordinary share capital and other equity instruments | 2,334 | | 1,846 | | 500 | |
| Redemption of preference shares and other equity instruments | (3,450) | | — | | — | |
| Purchase of treasury shares | (28) | | — | | — | |
| Cancellation of shares | (707) | | — | | (1,006) | |
| Subordinated loan capital repaid | — | | (1,500) | | (4,107) | |
| Debt securities issued | 19,379 | | 15,951 | | 10,817 | |
| Debt securities repaid | (5,569) | | (16,577) | | — | |
| Dividends paid on ordinary shares | (4,480) | | — | | (7,582) | |
| Dividends paid to holders of other equity instruments | (1,310) | | (1,331) | | (1,414) | |
| Net cash from financing activities | 6,169 | | (1,611) | | (2,792) | |
| Net increase/(decrease) in cash and cash equivalents | 7,359 | | 196 | | (2,077) | |
| Cash and cash equivalents at 1 January | 6,176 | | 5,980 | | 8,057 | |
| Cash and cash equivalents at 31 Dec | 13,535 | | 6,176 | | 5,980 | |
| Cash and cash equivalents comprise: | | | |
| – cash at bank with HSBC undertakings | 2,590 | | 2,913 | | 2,382 | |
| – loans and advances to banks of one month or less | 93 | | 249 | | 102 | |
| – treasury and other eligible bills | 10,852 | | 3,014 | | 3,496 | |
Interest received was $1,636m (2020: $1,952m; 2019: $2,216m), interest paid was $2,724m (2020: $3,166m; 2019: $3,819m) and dividends received were $11,404m (2020: $8,156m; 2019: $15,117m).
| | | | | | | | | | | | | | | | | | | | | | | | |
| HSBC Holdings statement of changes in equity |
| for the year ended 31 December |
| | | | | | | | | | |
| | Called up
share
capital | Share
premium | Other
equity
instruments | Retained earnings1 | | | | Merger and other
reserves | Total
shareholders’
equity |
| | $m | $m | $m | $m | | | | $m | $m |
| At 1 Jan 2021 | | 10,347 | | 14,277 | | 22,414 | | 65,005 | | | | | 34,757 | | 146,800 | |
| Profit for the year | | — | | — | | — | | 10,834 | | | | | — | | 10,834 | |
| Other comprehensive income (net of tax) | | — | | — | | — | | 267 | | | | | — | | 267 | |
| – changes in fair value of financial liabilities designated at fair value due to movement in own credit risk | | — | | — | | — | | 267 | | | | | — | | 267 | |
| Total comprehensive income for the year | | — | | — | | — | | 11,101 | | | | | — | | 11,101 | |
| Shares issued under employee share plans | | 29 | | 325 | | — | | (103) | | | | | — | | 251 | |
| Capital securities issued | | — | | — | | 2,000 | | (20) | | | | | — | | 1,980 | |
Cancellation of shares2 | | (60) | | — | | — | | (2,004) | | | | | 60 | | (2,004) | |
| Dividends to shareholders | | — | | — | | — | | (5,790) | | | | | — | | (5,790) | |
| Redemption of capital securities | | — | | — | | (2,000) | | — | | | | | — | | (2,000) | |
Transfers3 | | — | | — | | — | | (3,065) | | | | | 3,065 | | — | |
| Other movements | | — | | — | | — | | (8) | | | | | — | | (8) | |
| At 31 Dec 2021 | | 10,316 | | 14,602 | | 22,414 | | 65,116 | | | | | 37,882 | | 150,330 | |
| | | | | | | | | | |
| | | | | | | | |
| | | | | | | | | | |
| | | | | | | | | | |
| | | | | | | | | | |
| | | | | | | | | | |
| At 1 Jan 2020 | | 10,319 | | 13,959 | | 20,743 | | 62,484 | | | | | 37,539 | | 145,044 | |
| Profit for the year | | — | | — | | — | | 4,085 | | | | | — | | 4,085 | |
| Other comprehensive income (net of tax) | | — | | — | | — | | 176 | | | | | — | | 176 | |
| – changes in fair value of financial liabilities designated at fair value due to movement in own credit risk | | — | | — | | — | | 176 | | | | | — | | 176 | |
| Total comprehensive income for the year | | — | | — | | — | | 4,261 | | | | | — | | 4,261 | |
| Shares issued under employee share plans | | 28 | | 318 | | — | | 2,540 | | | | | (2,347) | | 539 | |
| | | | | | | | | | |
| | | | | | | | | | |
| Capital securities issued | | — | | — | | 1,500 | | (15) | | | | | — | | 1,485 | |
| Dividends to shareholders | | — | | — | | — | | (1,331) | | | | | — | | (1,331) | |
| Redemption of capital securities | | — | | — | | — | | (1,450) | | | | | — | | (1,450) | |
Transfers3 | | — | | — | | — | | 435 | | | | | (435) | | — | |
Other movements4 | | — | | — | | 171 | | (1,919) | | | | | — | | (1,748) | |
| At 31 Dec 2020 | | 10,347 | | 14,277 | | 22,414 | | 65,005 | | | | | 34,757 | | 146,800 | |
| | | | | | | | | | |
| | | | | | | | | | |
| | | | | | | | | | |
| At 1 Jan 2019 | | 10,180 | | 13,609 | | 22,231 | | 61,434 | | | | | 39,899 | | 147,353 | |
| Profit for the year | | — | | — | | — | | 9,041 | | | | | — | | 9,041 | |
| Other comprehensive income (net of tax) | | — | | — | | — | | (396) | | | | | — | | (396) | |
| – changes in fair value of financial liabilities designated at fair value due to movement in own credit risk | | — | | — | | — | | (396) | | | | | — | | (396) | |
| Total comprehensive income for the year | | — | | — | | — | | 8,645 | | | | | — | | 8,645 | |
| Shares issued under employee share plans | | 36 | | 521 | | — | | (56) | | | | | — | | 501 | |
| Shares issued in lieu of dividends and amounts arising thereon | | 171 | | (171) | | — | | 2,687 | | | | | — | | 2,687 | |
| Cancellation of shares | | (68) | | — | | — | | (1,000) | | | | | 68 | | (1,000) | |
| Capital securities issued | | — | | — | | — | | — | | | | | — | | — | |
| Dividends to shareholders | | — | | — | | — | | (11,683) | | | | | — | | (11,683) | |
| Redemption of capital securities | | — | | — | | (1,488) | | (20) | | | | | — | | (1,508) | |
Transfers3 | | — | | — | | — | | 2,475 | | | | | (2,475) | | — | |
| Other movements | | — | | — | | — | | 2 | | | | | 47 | | 49 | |
| At 31 Dec 2019 | | 10,319 | | 13,959 | | 20,743 | | 62,484 | | | | | 37,539 | | 145,044 | |
Dividends per ordinary share at 31 December 2021 were $0.22 (2020: nil; 2019: $0.51).
1 At 31 December 2021, retained earnings included 329,871,829 ($2,542m) treasury shares (2020: 326,766,253 ($2,521m); 2019: 326,191,804 ($2,543m)).
2 On 26 October 2021, HSBC announced a share buy-back of up to $2.0bn, which is to be completed no later than 20 April 2022.
3 Permitted transfers from the merger reserve to retained earnings were made when the investment in HSBC Overseas Holdings (UK) Limited was previously impaired. In 2021, a part reversal of this impairment resulted in a transfer from retained earnings back to the merger reserve of $3,065m. At 31 December 2020, an additional impairment of $435m (2019: $2,475m) was recognised and a permitted transfer of this amount was made from the merger reserve to retained earnings.
4 Includes an adjustment to retained earnings for a repayment of capital by a subsidiary of $1,650m, which had been recognised as dividend income in 2019.
Notes on the financial statements
| | | | | | | | | | | | | | | | | | | | |
| Notes on the financial statements |
| | Page | | | | Page |
| 1 | Basis of preparation and significant accounting policies | | | 21 | Goodwill and intangible assets
| |
| 2 | Net fee income | | | 22 | Prepayments, accrued income and other assets | |
| 3 | Net income from financial instruments measured at fair value through profit or loss | | | 23 | Trading liabilities | |
| 24 | Financial liabilities designated at fair value | |
| 4 | Insurance business | | | 25 | Debt securities in issue | |
| 5 | Employee compensation and benefits | | | 26 | Accruals, deferred income and other liabilities | |
| 6 | Auditors’ remuneration | | | 27 | Provisions | |
| 7 | Tax | | | 28 | Subordinated liabilities | |
| 8 | Dividends | | | 29 | Maturity analysis of assets, liabilities and off-balance sheet commitments | |
| 9 | Earnings per share | | |
| 10 | Segmental analysis | | | 30 | Offsetting of financial assets and financial liabilities | |
| 11 | Trading assets | | | 31 | Called up share capital and other equity instruments | |
| 12 | Fair values of financial instruments carried at fair value | | | 32 | Contingent liabilities, contractual commitments and guarantees | |
| 13 | Fair values of financial instruments not carried at fair value | | | 33 | Finance lease receivables | |
| 14 | Financial assets designated and otherwise mandatorily measured at fair value through profit or loss | | | 34 | Legal proceedings and regulatory matters | |
| 35 | Related party transactions | |
| 15 | Derivatives | | | 36 | Business disposals | |
| 16 | Financial investments | | | 37 | Events after the balance sheet date | |
| 17 | Assets pledged, collateral received and assets transferred | | | 38 | HSBC Holdings’ subsidiaries, joint ventures and associates | |
| 18 | Interests in associates and joint ventures | | | 39 | Non-statutory accounts | |
| 19 | Investments in subsidiaries | | | | | |
| 20 | Structured entities | | | | | |
| | | | | |
| 1 | Basis of preparation and significant accounting policies |
1.1 Basis of preparation
(a) Compliance with International Financial Reporting Standards
The consolidated financial statements of HSBC and the separate financial statements of HSBC Holdings comply with UK-adopted international accounting standards and with the requirements of the Companies Act 2006, and have also applied international financial reporting standards adopted pursuant to Regulation (EC) No 1606/2002 as it applies in the European Union. These financial statements are also prepared in accordance with International Financial Reporting Standards (‘IFRSs’) as issued by the International Accounting Standards Board (‘IASB’), including interpretations issued by the IFRS Interpretations Committee, as there are no applicable differences from IFRSs as issued by the IASB for the periods presented. There were no unendorsed standards effective for the year ended
31 December 2021 affecting these consolidated and separate financial statements.
Standards adopted during the year ended 31 December 2021
There were no new accounting standards or interpretations that had a significant effect on HSBC in 2021. Accounting policies have been consistently applied.
(b) Differences between IFRSs and Hong Kong Financial Reporting Standards
There are no significant differences between IFRSs and Hong Kong Financial Reporting Standards in terms of their application to HSBC, and consequently there would be no significant differences had the financial statements been prepared in accordance with Hong Kong Financial Reporting Standards. The ‘Notes on the financial statements’, taken together with the ‘Report of the Directors’, include the aggregate of all disclosures necessary to satisfy IFRSs and Hong Kong reporting requirements.
(c) Future accounting developments
Minor amendments to IFRSs
The IASB has not published any minor amendments effective from 1 January 2021 that are applicable to HSBC. However, the IASB has published a number of minor amendments to IFRSs that are effective from 1 January 2022 and 1 January 2023. HSBC expects they will have an insignificant effect, when adopted, on the consolidated financial statements of HSBC and the separate financial statements of HSBC Holdings.
New IFRSs
IFRS 17 ‘Insurance Contracts’
IFRS 17 ‘Insurance Contracts’ was issued in May 2017, with amendments to the standard issued in June 2020. The standard sets out the requirements that an entity should apply in accounting for insurance contracts it issues and reinsurance contracts it holds. Following the amendments, IFRS 17 is effective from 1 January 2023. The standard has been endorsed for use in the EU but has not yet been endorsed for use in the UK. The Group is in the process of implementing IFRS 17. Industry practice and interpretation of the standard are still developing. Therefore, the likely financial impact of its implementation remains uncertain. However, we have the following expectations as to the impact compared with our current accounting policy for insurance contracts, which is set out in policy 1.2(j) below:
•Under IFRS 17, there will be no present value of in-force business (‘PVIF’) asset recognised. Instead the estimated future profit will be included in the measurement of the insurance contract liability as the contractual service margin (‘CSM’), representing unearned profit, and this will be gradually recognised in revenue as services are provided over the duration of the insurance contract. While the profit over the life of an individual contract will be unchanged, its emergence will be later under IFRS 17. The removal of the PVIF asset and the recognition of CSM, which is a liability, will reduce equity. The PVIF asset will be eliminated to equity on transition, together with other adjustments to assets and liabilities to reflect IFRS 17 measurement requirements and any consequential amendments to financial assets in the scope of IFRS 9.
•IFRS 17 requires increased use of current market values in the measurement of insurance liabilities. Changes in market conditions for certain products measured under the general measurement approach are immediately recognised in profit or loss, while changes in market conditions for other products measured under the variable fee approach are included in the measurement of CSM.
•In accordance with IFRS 17, directly attributable costs will be incorporated in the CSM and recognised in the results of insurance services as a reduction in reported revenue, as profit is recognised over the duration of insurance contracts. Costs that are not directly attributable will remain in operating expenses. This will result in a reduction in reported operating expenses compared with the current accounting policy.
•We intend to provide an update on the likely financial impacts at or around our 2022 interim results announcement, when we expect that this will be reasonably estimable.
(d) Foreign currencies
HSBC’s consolidated financial statements are presented in US dollars because the US dollar and currencies linked to it form the major currency bloc in which HSBC transacts and funds its business. The US dollar is also HSBC Holdings’ functional currency because the US dollar and currencies linked to it are the most significant currencies relevant to the underlying transactions, events and conditions of its subsidiaries, as well as representing a significant proportion of its funds generated from financing activities.
Transactions in foreign currencies are recorded at the rate of exchange on the date of the transaction. Assets and liabilities denominated in foreign currencies are translated at the rate of exchange at the balance sheet date, except non-monetary assets and liabilities measured at historical cost, which are translated using the rate of exchange at the initial transaction date. Exchange differences are included in other comprehensive income or in the income statement depending on where the gain or loss on the underlying item is recognised. In the consolidated financial statements, the assets and liabilities of branches, subsidiaries, joint ventures and associates whose functional currency is not US dollars are translated into the Group’s presentation currency at the rate of exchange at the balance sheet date, while their results are translated into US dollars at the average rates of exchange for the reporting period. Exchange differences arising are recognised in other comprehensive income. On disposal of a foreign operation, exchange differences previously recognised in other comprehensive income are reclassified to the income statement.
(e) Presentation of information
Certain disclosures required by IFRSs have been included in the sections marked as (‘Audited’) in the Annual Report and Accounts 2021 as follows:
•Disclosures concerning the nature and extent of risks relating to insurance contracts and financial instruments are included in the ‘Risk review’ on pages 144 to 252.
•The ‘Own funds disclosure’ is included in the ‘Risk review’ on page 229.
•Disclosures relating to HSBC’s securitisation activities and structured products are included in the ‘Risk review’ on pages 144 to 252.
HSBC follows the UK Finance Disclosure Code. The UK Finance Disclosure Code aims to increase the quality and comparability of UK banks’ disclosures and sets out five disclosure principles together with supporting guidance agreed in 2010. In line with the principles of the UK Finance Disclosure Code, HSBC assesses good practice recommendations issued from time to time by relevant regulators and standard setters, and will assess the applicability and relevance of such guidance, enhancing disclosures where appropriate.
(f) Critical accounting estimates and judgements
The preparation of financial information requires the use of estimates and judgements about future conditions. In view of the inherent uncertainties and the high level of subjectivity involved in the recognition or measurement of items, highlighted as the ‘critical accounting estimates and judgements’ in section 1.2 below, it is possible that the outcomes in the next financial year could differ from those on which management’s estimates are based. This could result in materially different estimates and judgements from those reached by management for the purposes of these financial statements. Management’s selection of HSBC’s accounting policies that contain critical estimates and judgements reflects the materiality of the items to which the policies are applied and the high degree of judgement and estimation uncertainty involved.
(g) Segmental analysis
HSBC’s Chief Operating Decision Maker is the Group Chief Executive, who is supported by the rest of the Group Executive Committee (‘GEC’), which operates as a general management committee under the direct authority of the Board. Operating segments are reported in a manner consistent with the internal reporting provided to the Group Chief Executive and the GEC.
Measurement of segmental assets, liabilities, income and expenses is in accordance with the Group’s accounting policies. Segmental income and expenses include transfers between segments, and these transfers are conducted at arm’s length. Shared costs are included in segments on the basis of the actual recharges made.
(h) Going concern
The financial statements are prepared on a going concern basis, as the Directors are satisfied that the Group and parent company have the resources to continue in business for the foreseeable future. In making this assessment, the Directors have considered a wide range of information relating to present and future conditions, including future projections of profitability, cash flows, capital requirements and capital resources. These considerations include stressed scenarios that reflect the uncertainty that the global Covid-19 pandemic has had on HSBC’s operations, as well as considering potential impacts from other top and emerging risks, and the related impact on profitability, capital and liquidity.
1.2 Summary of significant accounting policies
(a) Consolidation and related policies
Investments in subsidiaries
Where an entity is governed by voting rights, HSBC consolidates when it holds – directly or indirectly – the necessary voting rights to pass resolutions by the governing body. In all other cases, the assessment of control is more complex and requires judgement of other factors, including having exposure to variability of returns, power to direct relevant activities, and whether power is held as agent or principal.
Business combinations are accounted for using the acquisition method. The amount of non-controlling interest is measured either at fair value or at the non-controlling interest’s proportionate share of the acquiree’s identifiable net assets. This election is made for each business combination.
Notes on the financial statements
HSBC Holdings’ investments in subsidiaries are stated at cost less impairment losses.
Goodwill
Goodwill is allocated to cash-generating units (‘CGUs’) for the purpose of impairment testing, which is undertaken at the lowest level at which goodwill is monitored for internal management purposes. HSBC’s CGUs are based on geographical regions subdivided by global business, except for Global Banking and Markets, for which goodwill is monitored on a global basis.
Impairment testing is performed at least once a year, or whenever there is an indication of impairment, by comparing the recoverable amount of a CGU with its carrying amount.
Goodwill is included in a disposal group if the disposal group is a CGU to which goodwill has been allocated or it is an operation within such a CGU. The amount of goodwill included in a disposal group is measured on the basis of the relative values of the operation disposed of and the portion of the CGU retained.
Critical accounting estimates and judgements
| | | | | |
| The review of goodwill and non-financial assets (see Note 1.2(n)) for impairment reflects management’s best estimate of the future cash flows of the CGUs and the rates used to discount these cash flows, both of which are subject to uncertain factors as follows: |
| Judgements | Estimates |
•The accuracy of forecast cash flows is subject to a high degree of uncertainty in volatile market conditions. Where such circumstances are determined to exist, management re-tests goodwill for impairment more frequently than once a year when indicators of impairment exist. This ensures that the assumptions on which the cash flow forecasts are based continue to reflect current market conditions and management’s best estimate of future business prospects. | •The future cash flows of the CGUs are sensitive to the cash flows projected for the periods for which detailed forecasts are available and to assumptions regarding the long-term pattern of sustainable cash flows thereafter. Forecasts are compared with actual performance and verifiable economic data, but they reflect management’s view of future business prospects at the time of the assessment. •The rates used to discount future expected cash flows can have a significant effect on their valuation, and are based on the costs of equity assigned to individual CGUs. The cost of equity percentage is generally derived from a capital asset pricing model and market implied cost of equity, which incorporates inputs reflecting a number of financial and economic variables, including the risk-free interest rate in the country concerned and a premium for the risk of the business being evaluated. These variables are subject to fluctuations in external market rates and economic conditions beyond management’s control. •Key assumptions used in estimating goodwill and non-financial asset impairment are described in Note 21. |
HSBC sponsored structured entities
HSBC is considered to sponsor another entity if, in addition to ongoing involvement with the entity, it had a key role in establishing that entity or in bringing together relevant counterparties so the transaction that is the purpose of the entity could occur. HSBC is generally not considered a sponsor if the only involvement with the entity is merely administrative.
Interests in associates and joint arrangements
Joint arrangements are investments in which HSBC, together with one or more parties, has joint control. Depending on HSBC’s rights and obligations, the joint arrangement is classified as either a joint operation or a joint venture. HSBC classifies investments in entities over which it has significant influence, and that are neither subsidiaries nor joint arrangements, as associates.
HSBC recognises its share of the assets, liabilities and results in a joint operation. Investments in associates and interests in joint ventures are recognised using the equity method. The attributable share of the results and reserves of joint ventures and associates is included in the consolidated financial statements of HSBC based on either financial statements made up to 31 December or pro-rated amounts adjusted for any material transactions or events occurring between the date the financial statements are available and 31 December.
Investments in associates and joint ventures are assessed at each reporting date and tested for impairment when there is an indication that the investment may be impaired. Goodwill on acquisitions of interests in joint ventures and associates is not tested separately for impairment, but is assessed as part of the carrying amount of the investment.
Critical accounting estimates and judgements
| | | | | |
| The most significant critical accounting estimates relate to the assessment of impairment of our investment in Bank of Communications Co. Limited (‘BoCom’), which involves estimations of value in use: |
| Judgements | Estimates |
| •Management’s best estimate of BoCom’s earnings are based on management’s explicit forecasts over the short to medium term and the capital maintenance charge, which is management’s forecast of the earnings that need to be withheld in order for BoCom to meet capital requirements over the forecast period, both of which are subject to uncertain factors. •Key assumptions used in estimating BoCom’s value in use, the sensitivity of the value in use calculations to different assumptions and a sensitivity analysis that shows the changes in key assumptions that would reduce the excess of value in use over the carrying amount (the ‘headroom’) to nil are described in Note 18. |
(b) Income and expense
Operating income
Interest income and expense
Interest income and expense for all financial instruments, excluding those classified as held for trading or designated at fair value, are recognised in ‘Interest income’ and ‘Interest expense’ in the income statement using the effective interest method. However, as an exception to this, interest on debt instruments issued by HSBC for funding purposes that are designated under the fair value option to reduce an accounting mismatch and on derivatives managed in conjunction with those debt instruments is included in interest expense.
Interest on credit-impaired financial assets is recognised using the rate of interest used to discount the future cash flows for the purpose of measuring the impairment loss.
Non-interest income and expense
HSBC generates fee income from services provided at a fixed price over time, such as account service and card fees, or when HSBC delivers a specific transaction at a point in time, such as broking services and import/export services. With the exception of certain fund management and performance fees, all other fees are generated at a fixed price. Fund management and performance fees can be variable depending on the size of the customer portfolio and HSBC’s performance as fund manager. Variable fees are recognised when all uncertainties are resolved. Fee income is generally earned from short-term contracts with payment terms that do not include a significant financing component.
HSBC acts as principal in the majority of contracts with customers, with the exception of broking services. For most brokerage trades, HSBC acts as agent in the transaction and recognises broking income net of fees payable to other parties in the arrangement.
HSBC recognises fees earned on transaction-based arrangements at a point in time when it has fully provided the service to the customer. Where the contract requires services to be provided over time, income is recognised on a systematic basis over the life of the agreement.
Where HSBC offers a package of services that contains multiple non-distinct performance obligations, such as those included in account service packages, the promised services are treated as a single performance obligation. If a package of services contains distinct performance obligations, such as those including both account and insurance services, the corresponding transaction price is allocated to each performance obligation based on the estimated stand-alone selling prices.
Dividend income is recognised when the right to receive payment is established. This is the ex-dividend date for listed equity securities, and usually the date when shareholders approve the dividend for unlisted equity securities.
Net income/(expense) from financial instruments measured at fair value through profit or loss includes the following:
•‘Net income from financial instruments held for trading or managed on a fair value basis’: This comprises net trading income, which includes all gains and losses from changes in the fair value of financial assets and financial liabilities held for trading and other financial instruments managed on a fair value basis, together with the related interest income, expense and dividends, excluding the effect of changes in the credit risk of liabilities managed on a fair value basis. It also includes all gains and losses from changes in the fair value of derivatives that are managed in conjunction with financial assets and liabilities measured at fair value through profit or loss.
•‘Net income/(expense) from assets and liabilities of insurance businesses, including related derivatives, measured at fair value through profit or loss’: This includes interest income, interest expense and dividend income in respect of financial assets and liabilities measured at fair value through profit or loss; and those derivatives managed in conjunction with the above that can be separately identifiable from other trading derivatives.
•‘Changes in fair value of designated debt instruments and related derivatives’: Interest paid on debt instruments and interest cash flows on related derivatives is presented in interest expense where doing so reduces an accounting mismatch.
•‘Changes in fair value of other financial instruments mandatorily measured at fair value through profit or loss’: This includes interest on instruments that fail the solely payments of principal and interest test, see (d) below.
The accounting policies for insurance premium income are disclosed in Note 1.2(j).
(c) Valuation of financial instruments
All financial instruments are initially recognised at fair value. Fair value is the price that would be received to sell an asset or paid to transfer a liability in an orderly transaction between market participants at the measurement date. The fair value of a financial instrument on initial recognition is generally its transaction price (that is, the fair value of the consideration given or received). However, if there is a difference between the transaction price and the fair value of financial instruments whose fair value is based on a quoted price in an active market or a valuation technique that uses only data from observable markets, HSBC recognises the difference as a trading gain or loss at inception (a ‘day 1 gain or loss’). In all other cases, the entire day 1 gain or loss is deferred and recognised in the income statement over the life of the transaction until the transaction matures, is closed out, the valuation inputs become observable or HSBC enters into an offsetting transaction. The fair value of financial instruments is generally measured on an individual basis. However, in cases where HSBC manages a group of financial assets and liabilities according to its net market or credit risk exposure, the fair value of the group of financial instruments is measured on a net basis but the underlying financial assets and liabilities are presented separately in the financial statements, unless they satisfy the IFRS offsetting criteria.
Critical accounting estimates and judgements
| | | | | |
| The majority of valuation techniques employ only observable market data. However, certain financial instruments are classified on the basis of valuation techniques that feature one or more significant market inputs that are unobservable, and for them, the measurement of fair value is more judgemental: |
| Judgements | Estimates |
•An instrument in its entirety is classified as valued using significant unobservable inputs if, in the opinion of management, a significant proportion of the instrument’s inception profit or greater than 5% of the instrument’s valuation is driven by unobservable inputs. •‘Unobservable’ in this context means that there is little or no current market data available from which to determine the price at which an arm’s length transaction would be likely to occur. It generally does not mean that there is no data available at all upon which to base a determination of fair value (consensus pricing data may, for example, be used). | •Details on the Group’s level 3 financial instruments and the sensitivity of their valuation to the effect of applying reasonable possible alternative assumptions in determining their fair value are set out in Note 12. |
(d) Financial instruments measured at amortised cost
Financial assets that are held to collect the contractual cash flows and which contain contractual terms that give rise on specified dates to cash flows that are solely payments of principal and interest are measured at amortised cost. Such financial assets include most loans and advances to banks and customers and some debt securities. In addition, most financial liabilities are measured at amortised cost. HSBC accounts for regular way amortised cost financial instruments using trade date accounting. The carrying value of these financial assets at initial recognition includes any directly attributable transactions costs.
HSBC may commit to underwriting loans on fixed contractual terms for specified periods of time. When the loan arising from the lending commitment is expected to be held for trading, the commitment to lend is recorded as a derivative. When HSBC intends to hold the loan, the loan commitment is included in the impairment calculations set out below.
Notes on the financial statements
Non-trading reverse repurchase, repurchase and similar agreements
When debt securities are sold subject to a commitment to repurchase them at a predetermined price (‘repos’), they remain on the balance sheet and a liability is recorded in respect of the consideration received. Securities purchased under commitments to resell (‘reverse repos’) are not recognised on the balance sheet and an asset is recorded in respect of the initial consideration paid. Non-trading repos and reverse repos are measured at amortised cost. The difference between the sale and repurchase price or between the purchase and resale price is treated as interest and recognised in net interest income over the life of the agreement.
Contracts that are economically equivalent to reverse repo or repo agreements (such as sales or purchases of debt securities entered into together with total return swaps with the same counterparty) are accounted for similarly to, and presented together with, reverse repo or repo agreements.
(e) Financial assets measured at fair value through other comprehensive income
Financial assets held for a business model that is achieved by both collecting contractual cash flows and selling and which contain contractual terms that give rise on specified dates to cash flows that are solely payments of principal and interest are measured at fair value through other comprehensive income (‘FVOCI’). These comprise primarily debt securities. They are recognised on the trade date when HSBC enters into contractual arrangements to purchase and are normally derecognised when they are either sold or redeemed. They are subsequently remeasured at fair value and changes therein (except for those relating to impairment, interest income and foreign currency exchange gains and losses) are recognised in other comprehensive income until the assets are sold. Upon disposal, the cumulative gains or losses in other comprehensive income are recognised in the income statement as ‘Gains less losses from financial instruments’. Financial assets measured at FVOCI are included in the impairment calculations set out below and impairment is recognised in profit or loss.
(f) Equity securities measured at fair value with fair value movements presented in other comprehensive income
The equity securities for which fair value movements are shown in other comprehensive income are business facilitation and other similar investments where HSBC holds the investments other than to generate a capital return. Gains or losses on the derecognition of these equity securities are not transferred to profit or loss. Otherwise, equity securities are measured at fair value through profit or loss (except for dividend income, which is recognised in profit or loss).
(g) Financial instruments designated at fair value through profit or loss
Financial instruments, other than those held for trading, are classified in this category if they meet one or more of the criteria set out below and are so designated irrevocably at inception:
•The use of the designation removes or significantly reduces an accounting mismatch.
•A group of financial assets and liabilities or a group of financial liabilities is managed and its performance is evaluated on a fair value basis, in accordance with a documented risk management or investment strategy.
•The financial liability contains one or more non-closely related embedded derivatives.
Designated financial assets are recognised when HSBC enters into contracts with counterparties, which is generally on trade date, and are normally derecognised when the rights to the cash flows expire or are transferred. Designated financial liabilities are recognised when HSBC enters into contracts with counterparties, which is generally on settlement date, and are normally derecognised when extinguished. Subsequent changes in fair values are recognised in the income statement in ‘Net income from financial instruments held for trading or managed on a fair value basis’ or ‘Net income/(expense) from assets and liabilities of insurance businesses, including related derivatives, measured at fair value through profit or loss’ except for the effect of changes in the liabilities’ credit risk, which is presented in ‘Other comprehensive income’, unless that treatment would create or enlarge an accounting mismatch in profit or loss.
Under the above criterion, the main classes of financial instruments designated by HSBC are:
•Debt instruments for funding purposes that are designated to reduce an accounting mismatch: The interest and/or foreign exchange exposure on certain fixed-rate debt securities issued has been matched with the interest and/or foreign exchange exposure on certain swaps as part of a documented risk management strategy.
•Financial assets and financial liabilities under unit-linked and non-linked investment contracts: A contract under which HSBC does not accept significant insurance risk from another party is not classified as an insurance contract, other than investment contracts with discretionary participation features (‘DPF’), but is accounted for as a financial liability. Customer liabilities under linked and certain non-linked investment contracts issued by insurance subsidiaries are determined based on the fair value of the assets held in the linked funds. If no fair value designation was made for the related assets, at least some of the assets would otherwise be measured at either fair value through other comprehensive income or amortised cost. The related financial assets and liabilities are managed and reported to management on a fair value basis. Designation at fair value of the financial assets and related liabilities allows changes in fair values to be recorded in the income statement and presented in the same line.
•Financial liabilities that contain both deposit and derivative components: These financial liabilities are managed and their performance evaluated on a fair value basis.
(h) Derivatives
Derivatives are financial instruments that derive their value from the price of underlying items such as equities, interest rates or other indices. Derivatives are recognised initially and are subsequently measured at fair value through profit or loss. Derivatives are classified as assets when their fair value is positive or as liabilities when their fair value is negative. This includes embedded derivatives in financial liabilities, which are bifurcated from the host contract when they meet the definition of a derivative on a stand-alone basis.
Where the derivatives are managed with debt securities issued by HSBC that are designated at fair value, the contractual interest is shown in ‘Interest expense’ together with the interest payable on the issued debt.
Hedge accounting
When derivatives are not part of fair value designated relationships, if held for risk management purposes they are designated in hedge accounting relationships where the required criteria for documentation and hedge effectiveness are met. HSBC uses these derivatives or, where allowed, other non-derivative hedging instruments in fair value hedges, cash flow hedges or hedges of net investments in foreign operations as appropriate to the risk being hedged.
Fair value hedge
Fair value hedge accounting does not change the recording of gains and losses on derivatives and other hedging instruments, but results in recognising changes in the fair value of the hedged assets or liabilities attributable to the hedged risk that would not otherwise be recognised in the income statement. If a hedge relationship no longer meets the criteria for hedge accounting, hedge accounting is discontinued and the cumulative adjustment to the carrying amount of the hedged item is amortised to the income statement on a recalculated effective interest rate, unless the hedged item has been derecognised, in which case it is recognised in the income statement immediately.
Cash flow hedge
The effective portion of gains and losses on hedging instruments is recognised in other comprehensive income and the ineffective portion of the change in fair value of derivative hedging instruments that are part of a cash flow hedge relationship is recognised immediately in the income statement within ‘Net income from financial instruments held for trading or managed on a fair value basis’. The accumulated gains and losses recognised in other comprehensive income are reclassified to the income statement in the same periods in which the hedged item affects profit or loss. When a hedge relationship is discontinued, or partially discontinued, any cumulative gain or loss recognised in other comprehensive income remains in equity until the forecast transaction is recognised in the income statement. When a forecast transaction is no longer expected to occur, the cumulative gain or loss previously recognised in other comprehensive income is immediately reclassified to the income statement.
Net investment hedge
Hedges of net investments in foreign operations are accounted for in a similar way to cash flow hedges. The effective portion of gains and losses on the hedging instrument is recognised in other comprehensive income and other gains and losses are recognised immediately in the income statement. Gains and losses previously recognised in other comprehensive income are reclassified to the income statement on the disposal, or part disposal, of the foreign operation.
Derivatives that do not qualify for hedge accounting
Non-qualifying hedges are derivatives entered into as economic hedges of assets and liabilities for which hedge accounting was not applied.
(i) Impairment of amortised cost and FVOCI financial assets
Expected credit losses (‘ECL’) are recognised for loans and advances to banks and customers, non-trading reverse repurchase agreements, other financial assets held at amortised cost, debt instruments measured at FVOCI, and certain loan commitments and financial guarantee contracts. At initial recognition, allowance (or provision in the case of some loan commitments and financial guarantees) is required for ECL resulting from default events that are possible within the next 12 months, or less, where the remaining life is less than 12 months (’12-month ECL’). In the event of a significant increase in credit risk, allowance (or provision) is required for ECL resulting from all possible default events over the expected life of the financial instrument (‘lifetime ECL’). Financial assets where
12-month ECL is recognised are considered to be ‘stage 1’; financial assets that are considered to have experienced a significant increase in credit risk are in ‘stage 2’; and financial assets for which there is objective evidence of impairment so are considered to be in default or otherwise credit impaired are in ‘stage 3’. Purchased or originated credit-impaired financial assets (‘POCI’) are treated differently, as set out below.
Credit impaired (stage 3)
HSBC determines that a financial instrument is credit impaired and in stage 3 by considering relevant objective evidence, primarily whether:
•contractual payments of either principal or interest are past due for more than 90 days;
•there are other indications that the borrower is unlikely to pay, such as when a concession has been granted to the borrower for economic or legal reasons relating to the borrower’s financial condition; and
•the loan is otherwise considered to be in default.
If such unlikeliness to pay is not identified at an earlier stage, it is deemed to occur when an exposure is 90 days past due, even where regulatory rules permit default to be defined based on 180 days past due. Therefore, the definitions of credit impaired and default are aligned as far as possible so that stage 3 represents all loans that are considered defaulted or otherwise credit impaired.
Interest income is recognised by applying the effective interest rate to the amortised cost amount, i.e. gross carrying amount less ECL allowance.
Write-off
Financial assets (and the related impairment allowances) are normally written off, either partially or in full, when there is no realistic prospect of recovery. Where loans are secured, this is generally after receipt of any proceeds from the realisation of security. In circumstances where the net realisable value of any collateral has been determined and there is no reasonable expectation of further recovery, write-off may be earlier.
Renegotiation
Loans are identified as renegotiated and classified as credit impaired when we modify the contractual payment terms due to significant credit distress of the borrower. Renegotiated loans remain classified as credit impaired until there is sufficient evidence to demonstrate a significant reduction in the risk of non-payment of future cash flows and retain the designation of renegotiated until maturity or derecognition.
A loan that is renegotiated is derecognised if the existing agreement is cancelled and a new agreement is made on substantially different terms, or if the terms of an existing agreement are modified such that the renegotiated loan is a substantially different financial instrument. Any new loans that arise following derecognition events in these circumstances are considered to be POCI and will continue to be disclosed as renegotiated loans.
Other than originated credit-impaired loans, all other modified loans could be transferred out of stage 3 if they no longer exhibit any evidence of being credit impaired and, in the case of renegotiated loans, there is sufficient evidence to demonstrate a significant reduction in the risk of non-payment of future cash flows over the minimum observation period, and there are no other indicators of impairment. These loans could be transferred to stage 1 or 2 based on the mechanism as described below by comparing the risk of a default occurring
Notes on the financial statements
at the reporting date (based on the modified contractual terms) and the risk of a default occurring at initial recognition (based on the original, unmodified contractual terms). Any amount written off as a result of the modification of contractual terms would not be reversed.
Loan modifications other than renegotiated loans
Loan modifications that are not identified as renegotiated are considered to be commercial restructuring. Where a commercial restructuring results in a modification (whether legalised through an amendment to the existing terms or the issuance of a new loan contract) such that HSBC’s rights to the cash flows under the original contract have expired, the old loan is derecognised and the new loan is recognised at fair value. The rights to cash flows are generally considered to have expired if the commercial restructure is at market rates and no payment-related concession has been provided. Mandatory and general offer loan modifications that are not borrower-specific, for example market-wide customer relief programmes, have not been classified as renegotiated loans and generally have not resulted in derecognition, but their stage allocation is determined considering all available and supportable information under our ECL impairment policy. Changes made to these financial instruments that are economically equivalent and required by interest rate benchmark reform do not result in the derecognition or a change in the carrying amount of the financial instrument, but instead require the effective interest rate to be updated to reflect the change of the interest rate benchmark.
Significant increase in credit risk (stage 2)
An assessment of whether credit risk has increased significantly since initial recognition is performed at each reporting period by considering the change in the risk of default occurring over the remaining life of the financial instrument. The assessment explicitly or implicitly compares the risk of default occurring at the reporting date compared with that at initial recognition, taking into account reasonable and supportable information, including information about past events, current conditions and future economic conditions. The assessment is unbiased, probability-weighted, and to the extent relevant, uses forward-looking information consistent with that used in the measurement of ECL. The analysis of credit risk is multifactor. The determination of whether a specific factor is relevant and its weight compared with other factors depends on the type of product, the characteristics of the financial instrument and the borrower, and the geographical region. Therefore, it is not possible to provide a single set of criteria that will determine what is considered to be a significant increase in credit risk, and these criteria will differ for different types of lending, particularly between retail and wholesale. However, unless identified at an earlier stage, all financial assets are deemed to have suffered a significant increase in credit risk when 30 days past due. In addition, wholesale loans that are individually assessed, which are typically corporate and commercial customers, and included on a watch or worry list, are included in stage 2.
For wholesale portfolios, the quantitative comparison assesses default risk using a lifetime probability of default (‘PD’), which encompasses a wide range of information including the obligor’s customer risk rating (‘CRR’), macroeconomic condition forecasts and credit transition probabilities. For origination CRRs up to 3.3, significant increase in credit risk is measured by comparing the average PD for the remaining term estimated at origination with the equivalent estimation at the reporting date. The quantitative measure of significance varies depending on the credit quality at origination as follows:
| | | | | |
| Origination CRR | Significance trigger – PD to increase by |
| 0.1–1.2 | 15bps |
| 2.1–3.3 | 30bps |
For CRRs greater than 3.3 that are not impaired, a significant increase in credit risk is considered to have occurred when the origination PD has doubled. The significance of changes in PD was informed by expert credit risk judgement, referenced to historical credit migrations and to relative changes in external market rates.
For loans originated prior to the implementation of IFRS 9, the origination PD does not include adjustments to reflect expectations of future macroeconomic conditions since these are not available without the use of hindsight. In the absence of this data, origination PD must be approximated assuming through-the-cycle PDs and through-the-cycle migration probabilities, consistent with the instrument’s underlying modelling approach and the CRR at origination. For these loans, the quantitative comparison is supplemented with additional CRR deterioration-based thresholds, as set out in the table below:
| | | | | |
| Origination CRR | Additional significance criteria – number of CRR grade notches deterioration required to identify as significant credit deterioration (stage 2) (> or equal to) |
| 0.1 | 5 notches |
| 1.1–4.2 | 4 notches |
| 4.3–5.1 | 3 notches |
| 5.2–7.1 | 2 notches |
| 7.2–8.2 | 1 notch |
| 8.3 | 0 notch |
Further information about the 23-grade scale used for CRR can be found on page 174.
For certain portfolios of debt securities where external market ratings are available and credit ratings are not used in credit risk management, the debt securities will be in stage 2 if their credit risk increases to the extent they are no longer considered investment grade. Investment grade is where the financial instrument has a low risk of incurring losses, the structure has a strong capacity to meet its contractual cash flow obligations in the near term, and adverse changes in economic and business conditions in the longer term may, but will not necessarily, reduce the ability of the borrower to fulfil their contractual cash flow obligations.
For retail portfolios, default risk is assessed using a reporting date 12-month PD derived from credit scores, which incorporates all available information about the customer. This PD is adjusted for the effect of macroeconomic forecasts for periods longer than
12 months and is considered to be a reasonable approximation of a lifetime PD measure. Retail exposures are first segmented into homogeneous portfolios, generally by country, product and brand. Within each portfolio, the stage 2 accounts are defined as accounts with an adjusted 12-month PD greater than the average 12-month PD of loans in that portfolio 12 months before they become 30 days past due. The expert credit risk judgement is that no prior increase in credit risk is significant. This portfolio-specific threshold identifies loans with a PD higher than would be expected from loans that are performing as originally expected, and higher than what would have been acceptable at origination. It therefore approximates a comparison of origination to reporting date PDs.
Unimpaired and without significant increase in credit risk (stage 1)
ECL resulting from default events that are possible within the next 12 months (‘12-month ECL’) are recognised for financial instruments that remain in stage 1.
Purchased or originated credit impaired
Financial assets that are purchased or originated at a deep discount that reflects the incurred credit losses are considered to be POCI. This population includes the recognition of a new financial instrument following a renegotiation where concessions have been granted for economic or contractual reasons relating to the borrower’s financial difficulty that otherwise would not have been considered. The amount of change-in-lifetime ECL is recognised in profit or loss until the POCI is derecognised, even if the lifetime ECL are less than the amount of ECL included in the estimated cash flows on initial recognition.
Movement between stages
Financial assets can be transferred between the different categories (other than POCI) depending on their relative increase in credit risk since initial recognition. Financial instruments are transferred out of stage 2 if their credit risk is no longer considered to be significantly increased since initial recognition based on the assessments described above. Except for renegotiated loans, financial instruments are transferred out of stage 3 when they no longer exhibit any evidence of credit impairment as described above. Renegotiated loans that are not POCI will continue to be in stage 3 until there is sufficient evidence to demonstrate a significant reduction in the risk of non-payment of future cash flows, observed over a minimum one-year period and there are no other indicators of impairment. For loans that are assessed for impairment on a portfolio basis, the evidence typically comprises a history of payment performance against the original or revised terms, as appropriate to the circumstances. For loans that are assessed for impairment on an individual basis, all available evidence is assessed on a case-by-case basis.
Measurement of ECL
The assessment of credit risk and the estimation of ECL are unbiased and probability-weighted, and incorporate all available information that is relevant to the assessment including information about past events, current conditions and reasonable and supportable forecasts of future events and economic conditions at the reporting date. In addition, the estimation of ECL should take into account the time value of money.
In general, HSBC calculates ECL using three main components: a probability of default, a loss given default (’LGD’) and the exposure at default (‘EAD’).
The 12-month ECL is calculated by multiplying the 12-month PD, LGD and EAD. Lifetime ECL is calculated using the lifetime PD instead. The 12-month and lifetime PDs represent the probability of default occurring over the next 12 months and the remaining maturity of the instrument respectively.
The EAD represents the expected balance at default, taking into account the repayment of principal and interest from the balance sheet date to the default event together with any expected drawdowns of committed facilities. The LGD represents expected losses on the EAD given the event of default, taking into account, among other attributes, the mitigating effect of collateral value at the time it is expected to be realised and the time value of money.
HSBC makes use of the Basel II IRB framework where possible, with recalibration to meet the differing IFRS 9 requirements as set out in the following table:
| | | | | | | | |
| Model | Regulatory capital | IFRS 9 |
| PD | •Through the cycle (represents long-run average PD throughout a full economic cycle) •The definition of default includes a backstop of 90+ days past due, although this has been modified to 180+ days past due for some portfolios, particularly UK and US mortgages | •Point in time (based on current conditions, adjusted to take into account estimates of future conditions that will impact PD) •Default backstop of 90+ days past due for all portfolios |
| EAD | •Cannot be lower than current balance | •Amortisation captured for term products |
| LGD | •Downturn LGD (consistent losses expected to be suffered during a severe but plausible economic downturn) •Regulatory floors may apply to mitigate risk of underestimating downturn LGD due to lack of historical data •Discounted using cost of capital •All collection costs included | •Expected LGD (based on estimate of loss given default including the expected impact of future economic conditions such as changes in value of collateral) •No floors •Discounted using the original effective interest rate of the loan •Only costs associated with obtaining/selling collateral included |
| Other | | •Discounted back from point of default to balance sheet date |
While 12-month PDs are recalibrated from Basel II models where possible, the lifetime PDs are determined by projecting the 12-month PD using a term structure. For the wholesale methodology, the lifetime PD also takes into account credit migration, i.e. a customer migrating through the CRR bands over its life.
The ECL for wholesale stage 3 is determined on an individual basis using a discounted cash flow (‘DCF’) methodology. The expected future cash flows are based on the credit risk officer’s estimates as at the reporting date, reflecting reasonable and supportable assumptions and projections of future recoveries and expected future receipts of interest. Collateral is taken into account if it is likely that the recovery of the outstanding amount will include realisation of collateral based on the estimated fair value of collateral at the time of expected realisation, less costs for obtaining and selling the collateral. The cash flows are discounted at a reasonable approximation of the original effective interest rate. For significant cases, cash flows under four different scenarios are probability-weighted by reference to the economic scenarios applied more generally by the Group and the judgement of the credit risk officer in relation to the likelihood of the workout strategy succeeding or receivership being required. For less significant cases, the effect of different economic scenarios and work-out strategies is approximated and applied as an adjustment to the most likely outcome.
Period over which ECL is measured
Expected credit loss is measured from the initial recognition of the financial asset. The maximum period considered when measuring ECL (be it 12-month or lifetime ECL) is the maximum contractual period over which HSBC is exposed to credit risk. For wholesale overdrafts, credit risk management actions are taken no less frequently than on an annual basis and therefore this period is to the expected date of the next substantive credit review. The date of the substantive credit review also represents the initial recognition of the new facility. However, where the financial instrument includes both a drawn and undrawn commitment and the contractual ability to demand repayment and cancel the undrawn commitment does not serve to limit HSBC’s exposure to credit risk to the contractual notice period, the contractual period does not determine the maximum period considered. Instead, ECL is measured over the period HSBC remains exposed to credit risk that is not mitigated by credit risk management actions. This applies to retail overdrafts and credit cards, where the period is the average time taken for stage 2 exposures to default or close as performing accounts, determined on a portfolio basis and
Notes on the financial statements
ranging from between two and six years. In addition, for these facilities it is not possible to identify the ECL on the loan commitment component separately from the financial asset component. As a result, the total ECL is recognised in the loss allowance for the financial asset unless the total ECL exceeds the gross carrying amount of the financial asset, in which case the ECL is recognised as a provision.
Forward-looking economic inputs
HSBC applies multiple forward-looking global economic scenarios determined with reference to external forecast distributions representative of its view of forecast economic conditions. This approach is considered sufficient to calculate unbiased expected loss in most economic environments. In certain economic environments, additional analysis may be necessary and may result in additional scenarios or adjustments, to reflect a range of possible economic outcomes sufficient for an unbiased estimate. The detailed methodology is disclosed in ‘Measurement uncertainty and sensitivity analysis of ECL estimates’ on page 180.
Critical accounting estimates and judgements
| | | | | |
| The calculation of the Group’s ECL under IFRS 9 requires the Group to make a number of judgements, assumptions and estimates. The most significant are set out below: |
| Judgements | Estimates |
•Defining what is considered to be a significant increase in credit risk •Determining the lifetime and point of initial recognition of overdrafts and credit cards •Selecting and calibrating the PD, LGD and EAD models, which support the calculations, including making reasonable and supportable judgements about how models react to current and future economic conditions •Selecting model inputs and economic forecasts, including determining whether sufficient and appropriately weighted economic forecasts are incorporated to calculate unbiased expected loss •Making management adjustments to account for late breaking events, model and data limitations and deficiencies, and expert credit judgements | •The section ‘Measurement uncertainty and sensitivity analysis of ECL estimates’, marked as audited from page 180, sets out the assumptions used in determining ECL, and provides an indication of the sensitivity of the result to the application of different weightings being applied to different economic assumptions
|
(j) Insurance contracts
A contract is classified as an insurance contract where HSBC accepts significant insurance risk from another party by agreeing to compensate that party on the occurrence of a specified uncertain future event. An insurance contract may also transfer financial risk, but is accounted for as an insurance contract if the insurance risk is significant. In addition, HSBC issues investment contracts with discretionary participation features (‘DPF‘), which are also accounted for as insurance contracts as required by IFRS 4 ‘Insurance Contracts’.
Net insurance premium income
Premiums for life insurance contracts are accounted for when receivable, except in unit-linked insurance contracts where premiums are accounted for when liabilities are established. Reinsurance premiums are accounted for in the same accounting period as the premiums for the direct insurance contracts to which they relate.
Net insurance claims and benefits paid and movements in liabilities to policyholders
Gross insurance claims for life insurance contracts reflect the total cost of claims arising during the year, including claim handling costs and any policyholder bonuses allocated in anticipation of a bonus declaration.
Maturity claims are recognised when due for payment. Surrenders are recognised when paid or at an earlier date on which, following notification, the policy ceases to be included within the calculation of the related insurance liabilities. Death claims are recognised when notified.
Reinsurance recoveries are accounted for in the same period as the related claim.
Liabilities under insurance contracts
Liabilities under non-linked life insurance contracts are calculated by each life insurance operation based on local actuarial principles. Liabilities under unit-linked life insurance contracts are at least equivalent to the surrender or transfer value, which is calculated by reference to the value of the relevant underlying funds or indices.
Future profit participation on insurance contracts with DPF
Where contracts provide discretionary profit participation benefits to policyholders, liabilities for these contracts include provisions for the future discretionary benefits to policyholders. These provisions reflect the actual performance of the investment portfolio to date and management’s expectation of the future performance of the assets backing the contracts, as well as other experience factors such as mortality, lapses and operational efficiency, where appropriate. The benefits to policyholders may be determined by the contractual terms, regulation, or past distribution policy.
Investment contracts with DPF
While investment contracts with DPF are financial instruments, they continue to be treated as insurance contracts as required by IFRS 4. The Group therefore recognises the premiums for these contracts as revenue and recognises as an expense the resulting increase in the carrying amount of the liability.
In the case of net unrealised investment gains on these contracts, whose discretionary benefits principally reflect the actual performance of the investment portfolio, the corresponding increase in the liabilities is recognised in either the income statement or other comprehensive income, following the treatment of the unrealised gains on the relevant assets. In the case of net unrealised losses, a deferred participating asset is recognised only to the extent that its recoverability is highly probable. Movements in the liabilities arising from realised gains and losses on relevant assets are recognised in the income statement.
Present value of in-force long-term insurance business
HSBC recognises the value placed on insurance contracts and investment contracts with DPF, which are classified as long-term and in-force at the balance sheet date, as an asset. The asset represents the present value of the equity holders’ interest in the issuing insurance companies’ profits expected to emerge from these contracts written at the balance sheet date. The present value of in-force business (‘PVIF’) is determined by discounting those expected future profits using appropriate assumptions in assessing factors such as future mortality, lapse rates and levels of expenses, and a risk discount rate that reflects the risk premium attributable to the respective
contracts. The PVIF incorporates allowances for both non-market risk and the value of financial options and guarantees. The PVIF asset is presented gross of attributable tax in the balance sheet and movements in the PVIF asset are included in ‘Other operating income’ on a gross of tax basis.
(k) Employee compensation and benefits
Share-based payments
HSBC enters into both equity-settled and cash-settled share-based payment arrangements with its employees as compensation for the provision of their services.
The vesting period for these schemes may commence before the legal grant date if the employees have started to render services in respect of the award before the legal grant date, where there is a shared understanding of the terms and conditions of the arrangement. Expenses are recognised when the employee starts to render service to which the award relates.
Cancellations result from the failure to meet a non-vesting condition during the vesting period, and are treated as an acceleration of vesting recognised immediately in the income statement. Failure to meet a vesting condition by the employee is not treated as a cancellation, and the amount of expense recognised for the award is adjusted to reflect the number of awards expected to vest.
Post-employment benefit plans
HSBC operates a number of pension schemes including defined benefit, defined contribution and post-employment benefit schemes.
Payments to defined contribution schemes are charged as an expense as the employees render service.
Defined benefit pension obligations are calculated using the projected unit credit method. The net charge to the income statement mainly comprises the service cost and the net interest on the net defined benefit asset or liability, and is presented in operating expenses. Remeasurements of the net defined benefit asset or liability, which comprise actuarial gains and losses, return on plan assets excluding interest and the effect of the asset ceiling (if any, excluding interest), are recognised immediately in other comprehensive income. The net defined benefit asset or liability represents the present value of defined benefit obligations reduced by the fair value of plan assets (see policy (c)), after applying the asset ceiling test, where the net defined benefit surplus is limited to the present value of available refunds and reductions in future contributions to the plan.
The cost of obligations arising from other post-employment plans are accounted for on the same basis as defined benefit pension plans.
Critical accounting estimates and judgements
| | | | | |
| The most significant critical accounting estimates relate to the determination of key assumptions applied in calculating the defined benefit pension obligation for the principal plan. |
| Judgements | Estimates |
| •A range of assumptions could be applied, and different assumptions could significantly alter the defined benefit obligation and the amounts recognised in profit or loss or OCI. •The calculation of the defined benefit pension obligation includes assumptions with regard to the discount rate, inflation rate, pension payments and deferred pensions, pay and mortality. Management determines these assumptions in consultation with the plan’s actuaries. •Key assumptions used in calculating the defined benefit pension obligation for the principal plan and the sensitivity of the calculation to different assumptions are described in Note 5. |
(l) Tax
Income tax comprises current tax and deferred tax. Income tax is recognised in the income statement except to the extent that it relates to items recognised in other comprehensive income or directly in equity, in which case the tax is recognised in the same statement as the related item appears.
Current tax is the tax expected to be payable on the taxable profit for the year and on any adjustment to tax payable in respect of previous years. HSBC provides for potential current tax liabilities that may arise on the basis of the amounts expected to be paid to the tax authorities.
Deferred tax is recognised on temporary differences between the carrying amounts of assets and liabilities in the balance sheet, and the amounts attributed to such assets and liabilities for tax purposes. Deferred tax is calculated using the tax rates expected to apply in the periods in which the assets will be realised or the liabilities settled.
Current and deferred tax are calculated based on tax rates and laws enacted, or substantively enacted, by the balance sheet date.
Critical accounting estimates and judgements
| | | | | |
| The recognition of deferred tax assets depends on judgements and estimates. |
| Judgements | Estimates |
•In assessing the probability and sufficiency of future taxable profit, we consider the availability of evidence to support the recognition of deferred tax assets. taking into account the inherent risk in long-term forecasting and drivers of recent history of tax losses where applicable, taking into account the future reversal of existing taxable temporary differences and tax planning strategies including corporate reorganisations. Specific judgements supporting deferred tax assets are described in Note 7. | The recognition of deferred tax assets is sensitive to estimates of future cash flows projected for periods for which detailed forecasts are available and to assumptions regarding the long-term pattern of cash flows thereafter, on which forecasts of future taxable profit are based, and which affect the expected recovery periods and the pattern of utilisation of tax losses and tax credits. In particular there is estimation uncertainty relating to the recognition of deferred tax on the post-1 April 2017 tax losses of HSBC Holdings plc. See Note 7 for further detail. |
Notes on the financial statements
(m) Provisions, contingent liabilities and guarantees
Provisions
Provisions are recognised when it is probable that an outflow of economic benefits will be required to settle a present legal or constructive obligation that has arisen as a result of past events and for which a reliable estimate can be made.
Critical accounting estimates and judgements
| | | | | |
| The recognition and measurement of provisions requires the Group to make a number of judgements, assumptions and estimates. The most significant are set out below: |
| Judgements | Estimates |
•Determining whether a present obligation exists. Professional advice is taken on the assessment of litigation and similar obligations. •Provisions for legal proceedings and regulatory matters typically require a higher degree of judgement than other types of provisions. When matters are at an early stage, accounting judgements can be difficult because of the high degree of uncertainty associated with determining whether a present obligation exists, and estimating the probability and amount of any outflows that may arise. As matters progress, management and legal advisers evaluate on an ongoing basis whether provisions should be recognised, revising previous estimates as appropriate. At more advanced stages, it is typically easier to make estimates around a better defined set of possible outcomes. | •Provisions for legal proceedings and regulatory matters remain very sensitive to the assumptions used in the estimate. There could be a wider range of possible outcomes for any pending legal proceedings, investigations or inquiries. As a result it is often not practicable to quantify a range of possible outcomes for individual matters. It is also not practicable to meaningfully quantify ranges of potential outcomes in aggregate for these types of provisions because of the diverse nature and circumstances of such matters and the wide range of uncertainties involved. |
Contingent liabilities, contractual commitments and guarantees
Contingent liabilities
Contingent liabilities, which include certain guarantees and letters of credit pledged as collateral security, and contingent liabilities related to legal proceedings or regulatory matters, are not recognised in the financial statements but are disclosed unless the probability of settlement is remote.
Financial guarantee contracts
Liabilities under financial guarantee contracts that are not classified as insurance contracts are recorded initially at their fair value, which is generally the fee received or present value of the fee receivable.
HSBC Holdings has issued financial guarantees and similar contracts to other Group entities. HSBC elects to account for certain guarantees as insurance contracts in HSBC Holdings’ financial statements, in which case they are measured and recognised as insurance liabilities. This election is made on a contract-by-contract basis, and is irrevocable.
(n) Impairment of non-financial assets
Software under development is tested for impairment at least annually. Other non-financial assets are property, plant and equipment, intangible assets (excluding goodwill) and right-of-use assets. They are tested for impairment at the individual asset level when there is indication of impairment at that level, or at the CGU level for assets that do not have a recoverable amount at the individual asset level. In addition, impairment is also tested at the CGU level when there is indication of impairment at that level. For this purpose, CGUs are considered to be the principal operating legal entities divided by global business.
Impairment testing compares the carrying amount of the non-financial asset or CGU with its recoverable amount, which is the higher of the fair value less costs of disposal or the value in use. The carrying amount of a CGU comprises the carrying value of its assets and liabilities, including non-financial assets that are directly attributable to it and non-financial assets that can be allocated to it on a reasonable and consistent basis. Non-financial assets that cannot be allocated to an individual CGU are tested for impairment at an appropriate grouping of CGUs. The recoverable amount of the CGU is the higher of the fair value less costs of disposal of the CGU, which is determined by independent and qualified valuers where relevant, and the value in use, which is calculated based on appropriate inputs (see Note 21).
When the recoverable amount of a CGU is less than its carrying amount, an impairment loss is recognised in the income statement to the extent that the impairment can be allocated on a pro-rata basis to the non-financial assets by reducing their carrying amounts to the higher of their respective individual recoverable amount or nil. Impairment is not allocated to the financial assets in a CGU.
Impairment loss recognised in prior periods for non-financial assets is reversed when there has been a change in the estimate used to determine the recoverable amount. The impairment loss is reversed to the extent that the carrying amount of the non-financial assets would not exceed the amount that would have been determined (net of amortisation or depreciation) had no impairment loss been recognised in prior periods.
Critical accounting estimates and judgements
| | | | | |
| The review of goodwill and other non-financial assets for impairment reflects management’s best estimate of the future cash flows of the CGUs and the rates used to discount these cash flows, both of which are subject to uncertain factors as described in the Critical accounting estimates and judgements in Note 1.2(a). |
| | | | | | | | | | | | | | | | | | | | |
| Net fee income by global business | | |
| 2021 | | |
| Wealth and
Personal
Banking | Commercial
Banking | Global
Banking and
Markets | | Corporate
Centre | Total | | |
| $m | $m | $m | | $m | $m | | |
| Funds under management | 1,984 | | 126 | | 546 | | | — | | 2,656 | | | |
| Cards | 1,949 | | 240 | | 23 | | | 1 | | 2,213 | | | |
| Credit facilities | 103 | | 833 | | 690 | | | 1 | | 1,627 | | | |
| Broking income | 863 | | 69 | | 669 | | | — | | 1,601 | | | |
| Account services | 429 | | 677 | | 340 | | | 6 | | 1,452 | | | |
| Unit trusts | 1,065 | | 23 | | — | | | — | | 1,088 | | | |
| Underwriting | 4 | | 6 | | 1,009 | | | (2) | | 1,017 | | | |
| Global custody | 167 | | 24 | | 787 | | | — | | 978 | | | |
| Remittances | 75 | | 357 | | 343 | | | — | | 775 | | | |
| Imports/exports | 1 | | 474 | | 145 | | | — | | 620 | | | |
| Insurance agency commission | 324 | | 17 | | — | | | — | | 341 | | | |
| Other | 1,305 | | 1,077 | | 2,503 | | | (2,465) | | 2,420 | | | |
| Fee income | 8,269 | | 3,923 | | 7,055 | | | (2,459) | | 16,788 | | | |
| Less: fee expense | (2,375) | | (284) | | (3,452) | | | 2,420 | | (3,691) | | | |
| Net fee income | 5,894 | | 3,639 | | 3,603 | | | (39) | | 13,097 | | | |
| | | | | | | | | | | | | | | | | | | | | |
|
| | | | | | | |
| | | | | | | |
| 2020 | 2019 |
| Wealth and
Personal Banking | Commercial
Banking | Global
Banking and
Markets | | Corporate
Centre | Total | Total |
| $m | $m | $m | | $m | $m | $m |
| Funds under management | 1,686 | | 126 | | 477 | | | — | | 2,289 | | 2,177 | |
| Cards | 1,564 | | 360 | | 25 | | | — | | 1,949 | | 1,975 | |
| Credit facilities | 93 | | 740 | | 626 | | | — | | 1,459 | | 1,618 | |
| Broking income | 862 | | 61 | | 616 | | | — | | 1,539 | | 1,057 | |
| Account services | 431 | | 598 | | 264 | | | — | | 1,293 | | 2,003 | |
| Unit trusts | 881 | | 18 | | — | | | — | | 899 | | 1,035 | |
| Underwriting | 5 | | 9 | | 1,002 | | | (1) | | 1,015 | | 829 | |
| Global custody | 189 | | 22 | | 723 | | | — | | 934 | | 717 | |
| Remittances | 77 | | 313 | | 288 | | | (1) | | 677 | | 747 | |
| Imports/exports | — | | 417 | | 160 | | | — | | 577 | | 662 | |
| Insurance agency commission | 307 | | 17 | | 1 | | | — | | 325 | | 377 | |
| Other | 1,123 | | 893 | | 2,369 | | | (2,290) | | 2,095 | | 2,242 | |
| Fee income | 7,218 | | 3,574 | | 6,551 | | | (2,292) | | 15,051 | | 15,439 | |
| Less: fee expense | (1,810) | | (349) | | (3,284) | | | 2,266 | | (3,177) | | (3,416) | |
| Net fee income | 5,408 | | 3,225 | | 3,267 | | | (26) | | 11,874 | | 12,023 | |
Net fee income included $6,742m of fees earned on financial assets that were not at fair value through profit or loss, other than amounts included in determining the effective interest rate (2020: $5,858m; 2019: $6,647m), $1,520m of fees payable on financial liabilities that were not at fair value through profit or loss, other than amounts included in determining the effective interest rate (2020: $1,260m; 2019: $1,450m), $3,849m of fees earned on trust and other fiduciary activities (2020: $3,426m; 2019: $3,110m) and $305m of fees payable relating to trust and other fiduciary activities (2020: $267m; 2019: $237m).
| | | | | |
| 3 | Net income from financial instruments measured at fair value through profit or loss |
| | | | | | | | | | | |
| 2021 | 2020 | 2019 |
| $m | $m | $m |
| Net income/(expense) arising on: | | | |
| Net trading activities | 6,668 | | 11,074 | | 16,121 | |
| Other instruments managed on a fair value basis | 1,076 | | (1,492) | | (5,890) | |
| Net income from financial instruments held for trading or managed on a fair value basis | 7,744 | | 9,582 | | 10,231 | |
| Financial assets held to meet liabilities under insurance and investment contracts | 4,134 | | 2,481 | | 3,830 | |
| Liabilities to customers under investment contracts | (81) | | (400) | | (352) | |
| Net income from assets and liabilities of insurance businesses, including related derivatives, measured at fair value through profit or loss | 4,053 | | 2,081 | | 3,478 | |
| | | |
| Derivatives managed in conjunction with HSBC’s issued debt securities | (2,811) | | 2,619 | | 2,561 | |
| Other changes in fair value | 2,629 | | (2,388) | | (2,471) | |
Changes in fair value of designated debt and related derivatives1 | (182) | | 231 | | 90 | |
| Changes in fair value of other financial instruments mandatorily measured at fair value through profit or loss | 798 | | 455 | | 812 | |
| Year ended 31 Dec | 12,413 | | 12,349 | | 14,611 | |
1 The debt instruments, issued for funding purposes, are designated under the fair value option to reduce an accounting mismatch.
Notes on the financial statements
HSBC Holdings
| | | | | | | | | | | |
| 2021 | 2020 | 2019 |
| $m | $m | $m |
| Net income/(expense) arising on: | | | |
| – trading activities | 87 | | (336) | | (559) | |
| – other instruments managed on a fair value basis | 23 | | 1,137 | | 2,036 | |
| Net income from financial instruments held for trading or managed on a fair value basis | 110 | | 801 | | 1,477 | |
| Derivatives managed in conjunction with HSBC Holdings-issued debt securities | (625) | | 694 | | 764 | |
| Other changes in fair value | 974 | | (1,020) | | (1,124) | |
| Changes in fair value of designated debt and related derivatives | 349 | | (326) | | (360) | |
| Changes in fair value of other financial instruments mandatorily measured at fair value through profit or loss | (420) | | 1,141 | | 1,659 | |
| Year ended 31 Dec | 39 | | 1,616 | | 2,776 | |
| | | | | | | | | | | | | | |
| Net insurance premium income |
| Non-linked
insurance | Linked life
insurance | Investment contracts with DPF1 | Total |
| $m | $m | $m | $m |
| Gross insurance premium income | 8,529 | | 1,027 | | 1,873 | | 11,429 | |
| Reinsurers’ share of gross insurance premium income | (555) | | (4) | | — | | (559) | |
| Year ended 31 Dec 2021 | 7,974 | | 1,023 | | 1,873 | | 10,870 | |
| | | | |
| Gross insurance premium income | 8,321 | | 579 | | 1,563 | | 10,463 | |
| Reinsurers’ share of gross insurance premium income | (362) | | (8) | | — | | (370) | |
| Year ended 31 Dec 2020 | 7,959 | | 571 | | 1,563 | | 10,093 | |
| | | | |
| Gross insurance premium income | 9,353 | | 489 | | 2,266 | | 12,108 | |
| Reinsurers’ share of gross insurance premium income | (1,465) | | (7) | | — | | (1,472) | |
| Year ended 31 Dec 2019 | 7,888 | | 482 | | 2,266 | | 10,636 | |
1 Discretionary participation features.
| | | | | | | | | | | | | | |
| Net insurance claims and benefits paid and movement in liabilities to policyholders |
| Non-linked
insurance | Linked life
insurance | Investment contracts with DPF1 | Total |
| $m | $m | $m | $m |
| Gross claims and benefits paid and movement in liabilities | 10,474 | | 1,134 | | 3,332 | | 14,940 | |
| – claims, benefits and surrenders paid | 2,929 | | 1,023 | | 2,142 | | 6,094 | |
| – movement in liabilities | 7,545 | | 111 | | 1,190 | | 8,846 | |
| Reinsurers’ share of claims and benefits paid and movement in liabilities | (543) | | (9) | | — | | (552) | |
| – claims, benefits and surrenders paid | (343) | | (7) | | — | | (350) | |
| – movement in liabilities | (200) | | (2) | | — | | (202) | |
| Year ended 31 Dec 2021 | 9,931 | | 1,125 | | 3,332 | | 14,388 | |
| | | | |
| Gross claims and benefits paid and movement in liabilities | 10,050 | | 1,112 | | 1,853 | | 13,015 | |
| – claims, benefits and surrenders paid | 3,695 | | 900 | | 2,083 | | 6,678 | |
| – movement in liabilities | 6,355 | | 212 | | (230) | | 6,337 | |
| Reinsurers’ share of claims and benefits paid and movement in liabilities | (366) | | (4) | | — | | (370) | |
| – claims, benefits and surrenders paid | (430) | | (10) | | — | | (440) | |
| – movement in liabilities | 64 | | 6 | | — | | 70 | |
| Year ended 31 Dec 2020 | 9,684 | | 1,108 | | 1,853 | | 12,645 | |
| | | | |
| Gross claims and benefits paid and movement in liabilities | 11,305 | | 1,217 | | 3,810 | | 16,332 | |
| – claims, benefits and surrenders paid | 3,783 | | 900 | | 1,921 | | 6,604 | |
| – movement in liabilities | 7,522 | | 317 | | 1,889 | | 9,728 | |
| Reinsurers’ share of claims and benefits paid and movement in liabilities | (1,402) | | (4) | | — | | (1,406) | |
| – claims, benefits and surrenders paid | (411) | | (17) | | — | | (428) | |
| – movement in liabilities | (991) | | 13 | | — | | (978) | |
| Year ended 31 Dec 2019 | 9,903 | | 1,213 | | 3,810 | | 14,926 | |
1Discretionary participation features.
| | | | | | | | | | | | | | |
| Liabilities under insurance contracts |
| Non-linked
insurance | Linked life
insurance | Investment contracts with DPF1 | Total |
| $m | $m | $m | $m |
| Gross liabilities under insurance contracts at 1 Jan 2021 | 72,464 | | 6,449 | | 28,278 | | 107,191 | |
| Claims and benefits paid | (2,929) | | (1,023) | | (2,142) | | (6,094) | |
| Increase in liabilities to policyholders | 10,474 | | 1,134 | | 3,332 | | 14,940 | |
| | | | |
Exchange differences and other movements2 | (534) | | (47) | | (2,711) | | (3,292) | |
| Gross liabilities under insurance contracts at 31 Dec 2021 | 79,475 | | 6,513 | | 26,757 | | 112,745 | |
| Reinsurers’ share of liabilities under insurance contracts | (3,638) | | (30) | | — | | (3,668) | |
| Net liabilities under insurance contracts at 31 Dec 2021 | 75,837 | | 6,483 | | 26,757 | | 109,077 | |
| | | | |
| Gross liabilities under insurance contracts at 1 Jan 2020 | 65,324 | | 6,151 | | 25,964 | | 97,439 | |
| Claims and benefits paid | (3,695) | | (900) | | (2,083) | | (6,678) | |
| Increase in liabilities to policyholders | 10,050 | | 1,112 | | 1,853 | | 13,015 | |
| | | | |
Exchange differences and other movements2 | 785 | | 86 | | 2,544 | | 3,415 | |
| Gross liabilities under insurance contracts at 31 Dec 2020 | 72,464 | | 6,449 | | 28,278 | | 107,191 | |
| Reinsurers’ share of liabilities under insurance contracts | (3,434) | | (14) | | — | | (3,448) | |
| Net liabilities under insurance contracts at 31 Dec 2020 | 69,030 | | 6,435 | | 28,278 | | 103,743 | |
1Discretionary participation features.
2‘Exchange differences and other movements’ includes movements in liabilities arising from net unrealised investment gains recognised in other comprehensive income.
The key factors contributing to the movement in liabilities to policyholders included movements in the market value of assets supporting policyholder liabilities, death claims, surrenders, lapses, new business, the declaration of bonuses and other amounts attributable to policyholders.
| | | | | |
| 5 | Employee compensation and benefits |
| | | | | | | | | | | |
| | | |
| 2021 | 2020 | 2019 |
| $m | $m | $m |
| Employee compensation and benefits | 18,742 | | 18,076 | | 18,002 | |
| Capitalised wages and salaries | 870 | | 1,320 | | 1,475 | |
| Gross employee compensation and benefits for the year ended 31 Dec | 19,612 | | 19,396 | | 19,477 | |
| | | |
| Consists of: | | | |
| Wages and salaries | 17,072 | | 17,072 | | 17,056 | |
| Social security costs | 1,503 | | 1,378 | | 1,472 | |
| Post-employment benefits | 1,037 | | 946 | | 949 | |
| Year ended 31 Dec | 19,612 | | 19,396 | | 19,477 | |
| | | |
Employee compensation and benefits are presented net of software capitalisation costs in the income statement. During 2021, the allocation methodology for internally capitalised software costs between ‘employee compensation and benefits’ and ‘general administrative expenses’ has been updated to better reflect the underlying costs being capitalised.
| | | | | | | | | | | |
| Average number of persons employed by HSBC during the year by global business |
| 2021 | 2020 | 2019 |
| Wealth and Personal Banking | 138,026 | | 144,615 | | 148,680 | |
| Commercial Banking | 44,992 | | 45,631 | | 46,584 | |
| Global Banking and Markets | 48,179 | | 49,055 | | 51,313 | |
| Corporate Centre | 359 | | 411 | | 478 | |
| Year ended 31 Dec | 231,556 | | 239,712 | | 247,055 | |
| | | |
| | | | | | | | | | | |
| Average number of persons employed by HSBC during the year by geographical region |
| 2021 | 2020 | 2019 |
| Europe | 60,919 | | 64,886 | | 66,392 | |
| Asia | 127,673 | | 129,923 | | 133,624 | |
| Middle East and North Africa | 9,329 | | 9,550 | | 9,798 | |
| North America | 13,845 | | 15,430 | | 16,615 | |
| Latin America | 19,790 | | 19,923 | | 20,626 | |
| Year ended 31 Dec | 231,556 | | 239,712 | | 247,055 | |
| | | |
Notes on the financial statements
| | | | | | | | | | | |
| Reconciliation of total incentive awards granted to income statement charge |
| 2021 | 2020 | 2019 |
| $m | $m | $m |
| Total incentive awards approved for the current year | 3,495 | | 2,659 | | 3,341 | |
| Less: deferred bonuses awarded, expected to be recognised in future periods | (379) | | (239) | | (337) | |
| Total incentives awarded and recognised in the current year | 3,116 | | 2,420 | | 3,004 | |
| Add: current year charges for deferred bonuses from previous years | 270 | | 286 | | 327 | |
| Other | 4 | | 2 | | (55) | |
| Income statement charge for incentive awards | 3,390 | | 2,708 | | 3,276 | |
Share-based payments
‘Wages and salaries’ includes the effect of share-based payments arrangements, of which $467m was equity settled (2020: $434m; 2019: $478m), as follows:
| | | | | | | | | | | |
| 2021 | 2020 | 2019 |
| $m | $m | $m |
| Conditional share awards | 479 | 411 | 521 |
| Savings-related and other share award option plans | 27 | 51 | 30 |
| Year ended 31 Dec | 506 | 462 | 551 |
| | | | | | |
| HSBC share awards |
| Award | | Policy |
| Deferred share awards (including annual incentive awards, LTI awards delivered in shares) and Group Performance Share Plans (‘GPSP’) | | An assessment of performance over the relevant period ending on 31 December is used to determine the amount of the award to be granted. • Deferred awards generally require employees to remain in employment over the vesting period and are generally not subject to performance conditions after the grant date. An exception to these are the LTI awards, which are subject to performance conditions. • Deferred share awards generally vest over a period of three, five or seven years. • Vested shares may be subject to a retention requirement post-vesting. • Awards are subject to malus and clawback provisions. |
| International Employee Share Purchase Plan (‘ShareMatch’) | | The plan was first introduced in Hong Kong in 2013 and now includes employees based in 28 jurisdictions. • Shares are purchased in the market each quarter up to a maximum value of £750, or the equivalent in local currency. • Matching awards are added at a ratio of one free share for every three purchased (in mainland China matching awards are settled in cash). • Matching awards vest subject to continued employment and the retention of the purchased shares for a maximum period of two years and nine months. |
| | | | | | | | |
| Movement on HSBC share awards |
| 2021 | 2020 |
| Number | Number |
| (000s) | (000s) |
| Conditional share awards outstanding at 1 Jan | 103,473 | | 97,055 | |
| Additions during the year | 75,549 | | 72,443 | |
| Released in the year | (63,635) | | (60,673) | |
| Forfeited in the year | (6,023) | | (5,352) | |
| Conditional share awards outstanding at 31 Dec | 109,364 | | 103,473 | |
| Weighted average fair value of awards granted ($) | 6.49 | | 7.28 | |
| | |
| | | | | | |
| HSBC share option plans |
| Main plans | | Policy |
| Savings-related share option plans (‘Sharesave’) | | • From 2014, employees eligible for the UK plan could save up to £500 per month with the option to use the savings to acquire shares. •These are generally exercisable within six months following either the third or fifth anniversary of the commencement of a three-year or five-year contract, respectively. •The exercise price is set at a 20% (2020: 20%) discount to the market value immediately preceding the date of invitation. |
Calculation of fair values
The fair values of share options are calculated using a Black-Scholes model. The fair value of a share award is based on the share price at the date of the grant.
| | | | | | | | |
| Movement on HSBC share option plans |
| Savings-related
share option plans |
| Number | WAEP1 |
| (000s) | £ |
| Outstanding at 1 Jan 2021 | 130,953 | | 2.97 | |
Granted during the year2 | 15,410 | | 3.15 | |
Exercised during the year3 | (3,878) | | 3.80 | |
| Expired during the year | (11,502) | | 3.53 | |
| Forfeited during the year | (7,786) | | 3.97 | |
| Outstanding at 31 Dec 2021 | 123,197 | | 2.85 | |
| – of which exercisable | 4,949 | | 4.05 | |
| Weighted average remaining contractual life (years) | 3.02 | |
| | |
| Outstanding at 1 Jan 2020 | 65,060 | | 4.81 | |
Granted during the year2 | 111,469 | | 2.63 | |
Exercised during the year3 | (1,387) | | 4.48 | |
| Expired during the year | (43,032) | | 4.81 | |
| Forfeited during the year | (1,158) | | 4.88 | |
| Outstanding at 31 Dec 2020 | 130,953 | | 2.97 | |
| – of which exercisable | 8,170 | | 4.50 | |
| Weighted average remaining contractual life (years) | 3.68 | |
1 Weighted average exercise price.
2 The weighted average fair value of options granted during the year was $0.85 (2020: $0.47).
3 The weighted average share price at the date the options were exercised was $5.87 (2020: $7.08).
Post-employment benefit plans
The Group operates pension plans throughout the world for its employees. ‘Pension risk management processes’ on page 228 contains details of the policies and practices associated with these pension plans, some of which are defined benefit plans. The largest defined benefit plan is the HBUK section of the HSBC Bank (UK) Pension Scheme (‘the principal plan’), created as a result of the HSBC Bank (UK) Pension Scheme being fully sectionalised in 2018 to meet the requirements of the Banking Reform Act.
HSBC holds on its balance sheet the net surplus or deficit, which is the difference between the fair value of plan assets and the discounted value of scheme liabilities at the balance sheet date for each plan. Surpluses are only recognised to the extent that they are recoverable through reduced contributions in the future or through potential future refunds from the schemes. In assessing whether a surplus is recoverable, HSBC has considered its current right to obtain a future refund or a reduction in future contributions together with the rights of third parties such as trustees.
The principal plan
The principal plan has a defined benefit section and a defined contribution section. The defined benefit section was closed to future benefit accrual in 2015, with defined benefits earned by employees at that date continuing to be linked to their salary while they remain employed by HSBC. The plan is overseen by an independent corporate trustee, who has a fiduciary responsibility for the operation of the plan. Its assets are held separately from the assets of the Group.
The investment strategy of the plan is to hold the majority of assets in bonds, with the remainder in a diverse range of investments. It also includes some interest rate swaps to reduce interest rate risk, inflation swaps to reduce inflation risk and longevity swaps to reduce the impact of longer life expectancy.
The latest funding valuation of the plan at 31 December 2019 was carried out by Colin G Singer of Willis Towers Watson Limited, who is a Fellow of the UK Institute and Faculty of Actuaries, using the projected unit credit method. At that date, the market value of the plan’s assets was £31.1bn ($41.1bn) and this exceeded the value placed on its liabilities on an ongoing basis by £2.5bn ($3.3bn), giving a funding level of 109%. These figures include defined contribution assets amounting to £2.4bn ($3.2bn). The main differences between the assumptions used for assessing the defined benefit liabilities for this funding valuation and those used for IAS 19 are more prudent assumptions for discount rate, inflation rate and life expectancy. The next funding valuation will have an effective date of 31 December 2022.
Although the plan was in surplus at the valuation date, HSBC continued to make separately committed lump sum contributions and the final such contribution of £160m ($218m) was paid in 2021. The main employer of the principal plan is HSBC UK Bank plc, with additional support from HSBC Holdings plc. The HSBC Bank (UK) Pension Scheme is fully sectionalised and no entities outside the ring fence participate in the HBUK section.
The actuary also assessed the value of the liabilities if the plan were to have been stopped and an insurance company asked to secure all future pension payments. This is generally larger than the amount needed on the ongoing basis described above because an insurance company would use more prudent assumptions and include an explicit allowance for the future administrative expenses of the plan. Under this approach, the amount of assets needed was estimated to be £33bn ($44bn) at 31 December 2019.
Guaranteed minimum pension equalisation
Following a judgment issued by the High Court of Justice of England and Wales in 2018, we estimated the financial effect of equalising benefits in respect of guaranteed minimum pension (‘GMP’) equalisation, and any potential conversion of GMPs into non-GMP benefits, to be an approximate 0.9% increase in the principal plan’s liabilities, or £187m ($239m). This was recognised in the income statement in 2018. A further judgment by the High Court on 20 November 2020 ruled that GMPs should also be equalised for those who had previously transferred benefits from the principal plan to another arrangement, with £13m ($17m) consequently being recognised in 2020. We continue to assess the impact of GMP equalisation.
Notes on the financial statements
| | | | | | | | | | | |
| Income statement charge |
| 2021 | 2020 | 2019 |
| $m | $m | $m |
| Defined benefit pension plans | 243 | | 146 | | 176 | |
| Defined contribution pension plans | 767 | | 775 | | 758 | |
| Pension plans | 1,010 | | 921 | | 934 | |
| Defined benefit and contribution healthcare plans | 27 | | 25 | | 15 | |
| Year ended 31 Dec | 1,037 | | 946 | | 949 | |
| | | | | | | | | | | | | | |
| Net assets/(liabilities) recognised on the balance sheet in respect of defined benefit plans |
| Fair value of
plan assets | Present value of
defined benefit
obligations | Effect of
limit on plan
surpluses | Total |
| $m | $m | $m | $m |
| Defined benefit pension plans | 51,431 | | (42,277) | | (23) | | 9,131 | |
| Defined benefit healthcare plans | 103 | | (572) | | — | | (469) | |
| At 31 Dec 2021 | 51,534 | | (42,849) | | (23) | | 8,662 | |
| Total employee benefit liabilities (within Note 26 ‘Accruals, deferred income and other liabilities’) | | | | (1,607) | |
| Total employee benefit assets (within Note 22 ‘Prepayments, accrued income and other assets’) | | | | 10,269 | |
| | | | |
| Defined benefit pension plans | 52,990 | | (43,995) | | (44) | | 8,951 | |
| Defined benefit healthcare plans | 114 | | (639) | | — | | (525) | |
| At 31 Dec 2020 | 53,104 | | (44,634) | | (44) | | 8,426 | |
| Total employee benefit liabilities (within Note 26 ‘Accruals, deferred income and other liabilities’) | | | | (2,025) | |
| Total employee benefit assets (within Note 22 ‘Prepayments, accrued income and other assets’) | | | | 10,450 | |
HSBC Holdings
Employee compensation and benefit expense in respect of HSBC Holdings’ employees in 2021 amounted to $30m (2020: $56m). The average number of persons employed during 2021 was 54 (2020: 59). A small number of employees are members of defined benefit pension plans. These employees are members of the HSBC Bank (UK) Pension Scheme. HSBC Holdings pays contributions to such plan for its own employees in accordance with the schedules of contributions determined by the trustees of the plan and recognises these contributions as an expense as they fall due.
Defined benefit pension plans
| | | | | | | | | | | | | | | | | | | | | | | | | | |
| Net asset/(liability) under defined benefit pension plans |
| Fair value of plan assets | Present value of defined benefit obligations | Effect of the asset ceiling | Net defined benefit asset/(liability) |
| Principal1 plan | Other
plans | Principal1 plan | Other
plans | Principal1 plan | Other
plans | Principal1 plan | Other
plans |
| $m | $m | $m | $m | $m | $m | $m | $m |
| At 1 Jan 2021 | 42,505 | | 10,485 | | (33,005) | | (10,990) | | — | | (44) | | 9,500 | | (549) | |
| Service cost | — | | — | | (55) | | (276) | | — | | — | | (55) | | (276) | |
| – current service cost | �� | | — | | (14) | | (206) | | — | | — | | (14) | | (206) | |
| – past service cost and gains/(losses) from settlements | — | | — | | (41) | | (70) | | — | | — | | (41) | | (70) | |
| Net interest income/(cost) on the net defined benefit asset/(liability) | 613 | | 172 | | (473) | | (174) | | — | | (1) | | 140 | | (3) | |
| Remeasurement effects recognised in other comprehensive income | (377) | | 7 | | (271) | | 471 | | — | | 22 | | (648) | | 500 | |
| – return on plan assets (excluding interest income) | (377) | | 7 | | — | | — | | — | | — | | (377) | | 7 | |
| – actuarial gains/(losses) financial assumptions | — | | — | | 611 | | 315 | | — | | — | | 611 | | 315 | |
| – actuarial gains/(losses) demographic assumptions | — | | — | | (447) | | 64 | | — | | — | | (447) | | 64 | |
| – actuarial gains/(losses) experience adjustments | — | | — | | (435) | | 92 | | — | | — | | (435) | | 92 | |
| – other changes | — | | — | | — | | — | | — | | 22 | | — | | 22 | |
| Exchange differences | (361) | | (94) | | 283 | | 138 | | — | | — | | (78) | | 44 | |
| Benefits paid | (1,396) | | (645) | | 1,396 | | 712 | | — | | — | | — | | 67 | |
Other movements2 | 400 | | 122 | | (130) | | 97 | | — | | — | | 270 | | 219 | |
| At 31 Dec 2021 | 41,384 | | 10,047 | | (32,255) | | (10,022) | | — | | (23) | | 9,129 | | 2 | |
| | | | | | | | |
| At 1 Jan 2020 | 37,874 | | 9,693 | | (30,158) | | (10,424) | | — | | (16) | | 7,716 | | (747) | |
| Service cost | — | | — | | (68) | | (172) | | — | | — | | (68) | | (172) | |
| – current service cost | — | | — | | (28) | | (184) | | — | | — | | (28) | | (184) | |
| – past service cost and losses from settlements | — | | — | | (40) | | 12 | | — | | — | | (40) | | 12 | |
| Net interest income/(cost) on the net defined benefit asset/(liability) | 726 | | 233 | | (575) | | (245) | | — | | — | | 151 | | (12) | |
| Remeasurement effects recognised in other comprehensive income | 3,173 | | 879 | | (2,118) | | (547) | | — | | (26) | | 1,055 | | 306 | |
| – return on plan assets (excluding interest income) | 3,173 | | 692 | | — | | — | | — | | — | | 3,173 | | 692 | |
| – actuarial gains/(losses) financial assumptions | — | | — | | (3,179) | | (564) | | — | | — | | (3,179) | | (564) | |
| – actuarial gains/(losses) demographic assumptions | — | | — | | 86 | | 49 | | — | | — | | 86 | | 49 | |
| – actuarial gains/(losses) experience adjustments | — | | — | | 975 | | 87 | | — | | — | | 975 | | 87 | |
| – other changes | — | | 187 | | — | | (119) | | — | | (26) | | — | | 42 | |
| Exchange differences | 1,446 | | 249 | | (1,100) | | (387) | | — | | (2) | | 346 | | (140) | |
| Benefits paid | (1,148) | | (652) | | 1,148 | | 727 | | — | | — | | — | | 75 | |
Other movements2 | 434 | | 83 | | (134) | | 58 | | — | | — | | 300 | | 141 | |
| At 31 Dec 2020 | 42,505 | | 10,485 | | (33,005) | | (10,990) | | — | | (44) | | 9,500 | | (549) | |
1 For further details of the principal plan, see page 361.
2 Other movements include contributions by HSBC, contributions by employees, administrative costs and taxes paid by plan.
HSBC expects to make $145m of contributions to defined benefit pension plans during 2022. Benefits expected to be paid from the plans to retirees over each of the next five years, and in aggregate for the five years thereafter, are as follows:
| | | | | | | | | | | | | | | | | | | | |
| Benefits expected to be paid from plans |
| 2022 | 2023 | 2024 | 2025 | 2026 | 2027-2031 |
| $m | $m | $m | $m | $m | $m |
The principal plan1,2 | 1,444 | | 1,491 | | 1,542 | | 1,592 | | 1,644 | | 9,070 | |
Other plans1 | 474 | | 473 | | 460 | | 459 | | 453 | | 2,325 | |
1 The duration of the defined benefit obligation is 17.3 years for the principal plan under the disclosure assumptions adopted (2020: 17.4 years) and 12.7 years for all other plans combined (2020: 13.5 years).
2 For further details of the principal plan, see page 361.
Notes on the financial statements
| | | | | | | | | | | | | | | | | | | | | | | | | | | | | | | | |
| Fair value of plan assets by asset classes | | |
| 31 Dec 2021 | 31 Dec 2020 | | |
| Value | Quoted
market price
in active
market | No quoted
market price
in active
market | Thereof
HSBC1 | Value | Quoted
market price
in active
market | No quoted
market price
in active
market | Thereof
HSBC1 | | |
| $m | $m | $m | $m | $m | $m | $m | $m | | |
The principal plan2 | | | | | | | | | | |
| Fair value of plan assets | 41,384 | | 36,270 | | 5,114 | | 1,037 | | 42,505 | | 37,689 | | 4,816 | | 973 | | | |
– equities3 | 197 | | 5 | | 192 | | — | | 268 | | 7 | | 261 | | — | | | |
– bonds4 | 36,295 | | 35,612 | | 683 | | — | | 36,198 | | 35,479 | | 719 | | — | | | |
| – derivatives | 1,864 | | — | | 1,864 | | 1,037 | | 1,973 | | — | | 1,973 | | 973 | | | |
| – property | 1,094 | | — | | 1,094 | | — | | 1,106 | | — | | 1,106 | | — | | | |
– other5 | 1,934 | | 653 | | 1,281 | | — | | 2,960 | | 2,203 | | 757 | | — | | | |
| Other plans | | | | | | | | | | |
| Fair value of plan assets | 10,047 | | 8,248 | | 1,799 | | 52 | | 10,485 | | 9,512 | | 973 | | 54 | | | |
| – equities | 892 | | 668 | | 224 | | 5 | | 1,484 | | 1,069 | | 415 | | 3 | | | |
| – bonds | 7,080 | | 6,490 | | 590 | | 5 | | 7,624 | | 7,143 | | 481 | | 10 | | | |
| – derivatives | 7 | | (13) | | 20 | | — | | (57) | | — | | (57) | | — | | | |
| – property | 123 | | 119 | | 4 | | — | | 192 | | 157 | | 35 | | — | | | |
| – other | 1,945 | | 984 | | 961 | | 42 | | 1,242 | | 1,143 | | 99 | | 41 | | | |
1 The fair value of plan assets includes derivatives entered into with HSBC Bank plc as detailed in Note 35.
2 For further details on the principal plan, see page 361.
3 Includes $192m (2020: $261m) in relation to private equities.
4 Principal plan bonds includes fixed income bonds of $18,315m (2020: $17,730m) and index-linked bonds of $18,160m (2020: $18,468m).
5 Other includes $0m (2020: $696m) of pooled investment vehicles with quoted underlying assets and $1,281m (2020: $757m) of pooled investment vehicles with unquoted underlying assets.
Post-employment defined benefit plans’ principal actuarial financial assumptions
HSBC determines the discount rates to be applied to its obligations in consultation with the plans’ local actuaries, on the basis of current average yields of high-quality (AA-rated or equivalent) debt instruments with maturities consistent with those of the defined benefit obligations.
| | | | | | | | | | | | | | | | | |
Key actuarial assumptions for the principal plan1 |
| Discount rate | Inflation rate (RPI)2 | Inflation rate (CPI)2 | Rate of increase for pensions | Rate of pay increase |
| % | % | % | % | % |
| UK | | | | | |
| At 31 Dec 2021 | 1.90 | | 3.45 | | 3.20 | | 3.30 | | 3.45 | |
| At 31 Dec 2020 | 1.45 | | 3.05 | | 2.50 | | 3.00 | | 2.75 | |
| | | | | |
1 For further details on the principal plan, see page 361.
2 Due to the significant difference between short-term and long-term inflation expectations that has developed over 2021, HSBC UK has changed the methodology of setting inflation-related assumptions to fully and separately reflect how benefits are linked to RPI inflation and CPI inflation respectively. For example, the revaluation of deferred pensions is driven by CPI inflation expectations in the short to medium term, whereas increases to pensions in payment are driven by RPI inflation expectations over the long term.
| | | | | | | | | | | | | | | | | |
Mortality tables and average life expectancy at age 60 for the principal plan1 |
| Mortality
table | Life expectancy at age 60 for
a male member currently: | Life expectancy at age 60 for
a female member currently: |
| | Aged 60 | Aged 40 | Aged 60 | Aged 40 |
| UK | | | | | |
| At 31 Dec 2021 | SAPS S32 | 27.3 | 28.8 | 28.5 | 30.1 |
| At 31 Dec 2020 | SAPS S32 | 27.0 | 28.5 | 28.1 | 29.7 |
1 For further details of the principal plan, see page 361.
2 Self-administered pension scheme (‘SAPS’) S3 table, with different tables and multipliers adopted based on gender, pension amount and member status, reflecting the Scheme’s actual mortality experience. Improvements are projected in accordance with the Continuous Mortality Investigation’s CMI 2020 core projection model with an initial addition to improvement of 0.25% per annum and a long-term rate of improvement of 1.25% per annum.
| | | | | | | | | | | | | | |
The effect of changes in key assumptions on the principal plan1 |
| Impact on HBUK section of the HSBC Bank (UK) Pension Scheme obligation2 |
| Financial impact of increase | Financial impact of decrease |
| 2021 | 2020 | 2021 | 2020 |
| $m | $m | $m | $m |
| Discount rate – increase/decrease of 0.25% | (1,337) | | (1,383) | | 1,425 | | 1,475 | |
| Inflation rate (RPI and CPI) – increase/decrease of 0.25% | 1,211 | | 871 | | (980) | | (830) | |
| Pension payments and deferred pensions – increase/decrease of 0.25% | 1,267 | | 1,307 | | (1,177) | | (1,222) | |
| Pay – increase/decrease of 0.25% | 20 | | 60 | | (20) | | (59) | |
| Change in mortality – increase of 1 year | 1,387 | | 1,453 | | N/A | N/A |
1 For further details of the principal plan, see page 361.
2 Sensitivities allow for HSBC UK’s convention of rounding pension assumptions to the nearest 0.05%.
The above sensitivity analyses are based on a change in an assumption while holding all other assumptions constant. In practice, this in unlikely to occur, and changes in some of the assumptions may be correlated. When calculating the sensitivity of the defined benefit obligation to significant actuarial assumptions the same method (present value of the defined benefit obligation calculated with the projected unit credit method at the end of the reporting period) has been applied as when calculating the defined benefit asset recognised in the balance sheet. The methods and types of assumptions used in preparing the sensitivity analysis did not change compared with the prior period.
Directors’ emoluments
Details of Directors’ emoluments, pensions and their interests are disclosed in the Directors’ remuneration report on page 290.
| | | | | | | | | | | |
| 2021 | 2020 | 2019 |
| $m | $m | $m |
Audit fees payable to PwC1 | 88.1 | 92.9 | 85.2 |
| Other audit fees payable | 2.0 | 1.0 | 0.9 |
| Year ended 31 Dec | 90.1 | 93.9 | 86.1 |
| | | | | | | | | | | |
| Fees payable by HSBC to PwC |
| 2021 | 2020 | 2019 |
| $m | $m | $m |
Fees for HSBC Holdings’ statutory audit2 | 19.5 | | 21.9 | | 15.7 | |
| Fees for other services provided to HSBC | 109.9 | | 108.3 | | 95.0 | |
| – audit of HSBC’s subsidiaries | 68.6 | | 71.0 | | 69.5 | |
– audit-related assurance services3 | 18.7 | | 17.2 | | 10.0 | |
| | | |
– other assurance services4,5 | 22.6 | | 20.1 | | 12.2 | |
| – taxation compliance services | — | | — | | 1.6 | |
– other non-audit services4 | — | | — | | 1.7 | |
| Year ended 31 Dec | 129.4 | | 130.2 | | 110.7 | |
1Audit fees payable to PwC in the current year include adjustments made to the prior year audit fee after finalisation of the 2020 financial statements.
2Fees payable to PwC for the statutory audit of the consolidated financial statements of HSBC and the separate financial statements of HSBC Holdings. They include amounts payable for services relating to the consolidation returns of HSBC Holdings’ subsidiaries, which are clearly identifiable as being in support of the Group audit opinion.
3Including services for assurance and other services that relate to statutory and regulatory filings, including interim reviews.
4Including permitted services relating to attestation reports on internal controls of a service organisation primarily prepared for and used by third-party end user, including comfort letters.
5 Includes reviews of PRA regulatory reporting returns.
No fees were payable by HSBC to PwC as principal auditor for the following types of services: internal audit services and services related to litigation, recruitment and remuneration.
| | | | | | | | | | | | | | |
| Fees payable by HSBC’s associated pension schemes to PwC |
| | 2021 | 2020 | 2019 |
| | $000 | $000 | $000 |
| Audit of HSBC’s associated pension schemes | | 382 | | 316 | | 250 | |
| | | | |
| Year ended 31 Dec | | 382 | | 316 | | 250 | |
No fees were payable by HSBC’s associated pension schemes to PwC as principal auditor for the following types of services: internal audit services, other assurance services, services related to corporate finance transactions, valuation and actuarial services, litigation, recruitment and remuneration, and information technology.
In addition to the above, the estimated fees paid to PwC by third parties associated with HSBC amounted to $6.3m (2020: $12.3m; 2019: $17.2m). In these cases, HSBC was connected with the contracting party and may therefore have been involved in appointing PwC. These fees arose from services such as auditing mutual funds managed by HSBC and reviewing the financial position of corporate concerns that borrow from HSBC.
Fees payable for non-audit services for HSBC Holdings are not disclosed separately because such fees are disclosed on a consolidated basis for the Group.
Notes on the financial statements
| | | | | | | | | | | |
| Tax expense |
| 2021 | 2020 | 2019 |
| $m | $m | $m |
Current tax1 | 3,250 | | 2,700 | | 3,768 | |
| – for this year | 3,182 | | 2,883 | | 3,689 | |
| – adjustments in respect of prior years | 68 | | (183) | | 79 | |
| Deferred tax | 963 | | (22) | | 871 | |
| – origination and reversal of temporary differences | 874 | | (341) | | 684 | |
| – effect of changes in tax rates | 132 | | 58 | | (11) | |
| – adjustments in respect of prior years | (43) | | 261 | | 198 | |
Year ended 31 Dec2 | 4,213 | | 2,678 | | 4,639 | |
1 Current tax included Hong Kong profits tax of $813m (2020: $888m; 2019: $1,413m). The Hong Kong tax rate applying to the profits of subsidiaries assessable in Hong Kong was 16.5% (2020: 16.5%; 2019: 16.5%).
2 In addition to amounts recorded in the income statement, a tax charge of $7m (2020: charge of $7m) was recorded directly to equity.
Tax reconciliation
The tax charged to the income statement differs from the tax charge that would apply if all profits had been taxed at the UK corporation tax rate as follows:
| | | | | | | | | | | | | | | | | | | | | | | | | | |
| 2021 | 2020 | 2019 | | |
| $m | % | $m | % | $m | % | | |
| Profit before tax | 18,906 | | | 8,777 | | | 13,347 | | | | |
| Tax expense | | | | | | | | |
| Taxation at UK corporation tax rate of 19.00% | 3,592 | | 19.0 | | 1,668 | | 19.0 | | 2,536 | | 19.0 | | | |
| Impact of differently taxed overseas profits in overseas locations | 280 | | 1.5 | | 178 | | 2.0 | | 253 | | 1.9 | | | |
| UK banking surcharge | 332 | | 1.8 | | (113) | | (1.3) | | 29 | | 0.2 | | | |
| Items increasing tax charge in 2021: | | | | | | | | |
| – impact of differences between French tax basis and IFRSs | 434 | | 2.3 | | — | | — | | — | | — | | | |
| – local taxes and overseas withholding taxes | 360 | | 1.9 | | 228 | | 2.6 | | 484 | | 3.6 | | | |
| – UK tax losses not recognised | 294 | | 1.6 | | 444 | | 5.1 | | 364 | | 2.7 | | | |
| – other permanent disallowables | 254 | | 1.3 | | 322 | | 3.6 | | 481 | | 3.6 | | | |
| – non-deductible goodwill write-down | 178 | | 0.9 | | — | | — | | 1,421 | | 10.7 | | | |
| – impact of changes in tax rates | 132 | | 0.7 | | 58 | | 0.6 | | (11) | | (0.1) | | | |
| – bank levy | 93 | | 0.5 | | 202 | | 2.3 | | 184 | | 1.4 | | | |
| – impacts of hyperinflation | 68 | | 0.4 | | 65 | | 0.7 | | 29 | | 0.2 | | | |
| | | | | | | | |
| – adjustments in respect of prior period liabilities | 25 | | 0.1 | | 78 | | 0.9 | | 277 | | 2.1 | | | |
| – non-deductible regulatory settlements | 2 | | — | | 33 | | 0.4 | | 5 | | — | | | |
| Items reducing tax charge in 2021: | | | | | | | | |
| – non-taxable income and gains | (641) | | (3.4) | | (515) | | (5.8) | | (844) | | (6.3) | | | |
| – tax impact of planned sale of French retail banking business | (434) | | (2.3) | | — | | — | | — | | — | | | |
| – effect of profits in associates and joint ventures | (414) | | (2.2) | | (250) | | (2.8) | | (467) | | (3.5) | | | |
| – deductions for AT1 coupon payments | (270) | | (1.4) | | (310) | | (3.5) | | (263) | | (2.0) | | | |
| – non-UK movements in unrecognised deferred tax | (67) | | (0.4) | | 608 | | 6.9 | | 12 | | 0.1 | | | |
| | | | | | | | |
| – non-deductible UK customer compensation | (5) | | — | | (18) | | (0.2) | | 382 | | 2.9 | | | |
| – non-taxable gain on dilution of shareholding in SABB | — | | — | | — | | — | | (181) | | (1.3) | | | |
| | | | | | | | |
| | | | | | | | |
| – other items | — | | — | | — | | — | | (52) | | (0.4) | | | |
| Year ended 31 Dec | 4,213 | | 22.3 | | 2,678 | | 30.5 | | 4,639 | | 34.8 | | | |
The Group’s profits are taxed at different rates depending on the country or territory in which the profits arise. The key applicable tax rates for 2021 include Hong Kong (16.5%), the US (21%) and the UK (19%). If the Group’s profits were taxed at the statutory rates of the countries in which the profits arose, then the tax rate for the year would have been 22.3% (2020: 19.7%). The effective tax rate for the year of 22.3% was lower than in the previous year (2020: 30.5%). The impact of non-recognition of deferred tax was smaller in 2021 than in 2020, which decreased the effective tax rate by 10.8%. This was partly offset by changes in the geographical composition of profits, which resulted in tax at applicable local statutory rates being 2.5% greater for 2020 than for 2021.
The signing of a framework agreement for the planned sale of the French retail banking business resulted in a tax deduction (tax value of $434m) for a provision for loss on disposal, which was recorded in the French tax return. A deferred tax liability of the same amount arises as a consequence of the temporary difference between the French tax basis and IFRSs in respect of this provision.
During 2021, legislation to increase the main rate of UK corporation tax from 19% to 25% from 1 April 2023 was enacted, increasing the Group’s 2021 tax charge by $132m due to the remeasurement of deferred tax balances.
Accounting for taxes involves some estimation because tax law is uncertain and its application requires a degree of judgement, which authorities may dispute. Liabilities are recognised based on best estimates of the probable outcome, taking into account external advice where appropriate. We do not expect significant liabilities to arise in excess of the amounts provided. HSBC only recognises current and deferred tax assets where recovery is probable.
| | | | | | | | | | | | | | | | | | | | | | | | | | | | | |
| Movement of deferred tax assets and liabilities |
| Loan
impairment
provisions | Unused tax
losses and
tax credits | Derivatives, FVOD1 and other investments | Insurance
business | Expense
provisions | Fixed assets | Retirement obligations | Other | Total |
| $m | $m | $m | $m | $m | $m | $m | $m | $m |
| Assets | 1,242 | | 1,821 | | 548 | | — | | 565 | | 901 | | — | | 960 | | 6,037 | |
| Liabilities | — | | — | | (705) | | (1,622) | | — | | — | | (2,306) | | (1,234) | | (5,867) | |
| At 1 Jan 2021 | 1,242 | | 1,821 | | (157) | | (1,622) | | 565 | | 901 | | (2,306) | | (274) | | 170 | |
| Income statement | (89) | | 161 | | 22 | | (43) | | (333) | | (26) | | (336) | | (319) | | (963) | |
| Other comprehensive income | (5) | | 33 | | 149 | | — | | 74 | | 25 | | (205) | | 713 | | 784 | |
| | | | | | | | | |
| Foreign exchange and other adjustments | 14 | | (14) | | (5) | | 25 | | (10) | | 3 | | 28 | | (81) | | (40) | |
| At 31 Dec 2021 | 1,162 | | 2,001 | | 9 | | (1,640) | | 296 | | 903 | | (2,819) | | 39 | | (49) | |
Assets2 | 1,162 | | 2,001 | | 9 | | — | | 296 | | 903 | | 109 | | 742 | | 5,222 | |
Liabilities2 | — | | — | | — | | (1,640) | | — | | — | | (2,928) | | (703) | | (5,271) | |
| | | | | | | | | |
| Assets | 983 | | 1,414 | | 979 | | — | | 650 | | 1,002 | | — | | 422 | | 5,450 | |
| Liabilities | — | | — | | (558) | | (1,621) | | — | | — | | (1,613) | | (401) | | (4,193) | |
| At 1 Jan 2020 | 983 | | 1,414 | | 421 | | (1,621) | | 650 | | 1,002 | | (1,613) | | 21 | | 1,257 | |
| | | | | | | | | |
| Income statement | 295 | | 355 | | (274) | | (32) | | (81) | | (112) | | (190) | | 61 | | 22 | |
| Other comprehensive income | — | | — | | (23) | | — | | — | | — | | (387) | | (660) | | (1,070) | |
| | | | | | | | | |
| Foreign exchange and other adjustments | (36) | | 52 | | (281) | | 31 | | (4) | | 11 | | (116) | | 304 | | (39) | |
| At 31 Dec 2020 | 1,242 | | 1,821 | | (157) | | (1,622) | | 565 | | 901 | | (2,306) | | (274) | | 170 | |
Assets2 | 1,242 | | 1,821 | | 548 | | — | | 565 | | 901 | | — | | 960 | | 6,037 | |
Liabilities2 | — | | — | | (705) | | (1,622) | | — | | — | | (2,306) | | (1,234) | | (5,867) | |
1 Fair value of own debt.
2 After netting off balances within countries, the balances as disclosed in the accounts are as follows: deferred tax assets $4,624m (2020: $4,483m) and deferred tax liabilities $4,673m (2020: $4,313m).
In applying judgement in recognising deferred tax assets, management has critically assessed all available information, including future business profit projections and the track record of meeting forecasts. Management’s assessment of the likely availability of future taxable profits against which to recover deferred tax assets is based on the most recent financial forecasts approved by management, which cover a five-year period and are extrapolated where necessary, and takes into consideration the reversal of existing taxable temporary differences and past business performance.
The Group’s net deferred tax asset of $4.6bn (2020: $4.5bn) included $2.6bn (2020: $2.4bn) of deferred tax assets relating to the US and a net deferred asset of $0.0bn (2020: $0.00) in France.
The net US deferred tax asset of $2.6bn included $1.1bn related to US tax losses that expire in 13 to 17 years. Management expects the US deferred tax asset to be substantially recovered in seven to eight years, with the majority recovered in the first five years.
The net deferred tax asset in France of $0.0bn included $0.4bn related to tax losses which are expected to be substantially recovered within 10 years.
Following the signing of a framework agreement in 2021 for the planned sale of the French retail banking business, that business is now excluded from our deferred tax analysis as its sale is considered probable. Although the French consolidated tax group recorded a tax loss in both 2020 and 2021, this would have been taxable profit if the effects of the retail banking business and other non-recurring items, mainly related to the restructuring of the European business, were excluded. The French net deferred tax asset is supported by forecasts of taxable profit, also taking into consideration the history of profitability in the remaining businesses. No net deferred tax asset was recognised as at 31 December 2020 as management did not consider there to be convincing evidence of sufficient future taxable profits within the French consolidated tax group to support recognition.
The Group’s net deferred tax liability of $4.7bn (2020: $4.3bn) included a net UK deferred tax asset of $0.8bn (2020: $0.6bn), of which $0.2bn related to UK banking tax losses which are expected to be substantially recovered within one year. The net UK deferred tax asset of $0.8bn excludes a $3.0bn deferred tax liability arising on the UK pension scheme surplus, the reversal of which is not taken into account when estimating future taxable profits. The UK deferred tax assets are supported by forecasts of taxable profit, also taking into consideration the history of profitability in the relevant businesses.
Unrecognised deferred tax
The amount of gross temporary differences, unused tax losses and tax credits for which no deferred tax asset is recognised in the balance sheet was $16.9bn (2020: $15.6bn). This amount included unused UK tax losses of $10.5bn (2020: $9.3bn), of which $5.8bn (2020: $4.3bn) arose after 1 April 2017 and can be recovered against the future taxable profits of any of the Group’s UK tax resident subsidiaries. The remaining balance can only be recovered against future taxable profits of HSBC Holdings plc. No deferred tax was recognised on any of these losses due to the absence of convincing evidence regarding the availability of sufficient future taxable profits against which to recover them, taking into account the recent history of taxable losses within the UK group. Deferred tax asset recognition is reassessed at each balance sheet date based on the available evidence. Of the total amounts unrecognised, $10.9bn (2020: $11.5bn) had no expiry date, $0.7bn (2020: $0.7bn) was scheduled to expire within 10 years and the remaining balance is expected to expire after 10 years.
Deferred tax is not recognised in respect of the Group’s investments in subsidiaries and branches where HSBC is able to control the timing of remittance or other realisation and where remittance or realisation is not probable in the foreseeable future. The aggregate temporary differences relating to unrecognised deferred tax liabilities arising on investments in subsidiaries and branches is $12.7bn (2020: $12.1bn) and the corresponding unrecognised deferred tax liability was $0.8bn (2020: $0.7bn).
Notes on the financial statements
| | | | | | | | | | | | | | | | | | | | | | | | | | | | | |
| Dividends to shareholders of the parent company |
| 2021 | 2020 | 2019 |
| Per
share | Total | Settled
in scrip | Per
share | Total | Settled
in scrip | Per
share | Total | Settled
in scrip |
| $ | $m | $m | $ | $m | $m | $ | $m | $m |
| Dividends paid on ordinary shares | | | | | | | | | |
| In respect of previous year: | | | | | | | | | |
| – fourth interim dividend / interim dividend | 0.15 | | 3,059 | | — | | — | | — | | — | | 0.21 | | 4,206 | | 1,160 | |
| In respect of current year: | | | | | | | | | |
| – first interim dividend | 0.07 | | 1,421 | | — | | — | | — | | — | | 0.10 | | 2,013 | | 375 | |
| – second interim dividend | — | | — | | — | | — | | — | | — | | 0.10 | | 2,021 | | 795 | |
| – third interim dividend | — | | — | | — | | — | | — | | — | | 0.10 | | 2,029 | | 357 | |
| Total | 0.22 | | 4,480 | | — | | — | | — | | — | | 0.51 | | 10,269 | | 2,687 | |
Total dividends on preference shares classified as equity (paid quarterly)1 | 4.99 | | 7 | | | 62.00 | | 90 | | | 62.00 | | 90 | | |
| Total coupons on capital securities classified as equity | | 1,303 | | | | 1,241 | | | | 1,324 | | |
| Dividends to shareholders | | 5,790 | | | | 1,331 | | | | 11,683 | | |
1 HSBC Holdings called $1,450m 6.20% non-cumulative US dollar preference shares on 10 December 2020. The security was redeemed and cancelled on 13 January 2021.
| | | | | | | | | | | | | | | | | |
| Total coupons on capital securities classified as equity |
| | 2021 | 2020 | 2019 |
| | | Total | Total | Total |
| First call date | Per security | $m | $m | $m |
| | | | | |
| | | | | |
| | | | | |
Perpetual subordinated contingent convertible securities,1,2 | | | | | |
$1,500m issued at 5.625%2 | Nov 2019 | $56.250 | | — | | — | | 84 | |
$2,000m issued at 6.875%3 | Jun 2021 | $68.750 | | 69 | | 138 | | 138 | |
| $2,250m issued at 6.375% | Sep 2024 | $63.750 | | 143 | | 143 | | 143 | |
| $2,450m issued at 6.375% | Mar 2025 | $63.750 | | 156 | | 156 | | 156 | |
| $3,000m issued at 6.000% | May 2027 | $60.000 | | 180 | | 180 | | 180 | |
| $2,350m issued at 6.250% | Mar 2023 | $62.500 | | 147 | | 147 | | 147 | |
| $1,800m issued at 6.500% | Mar 2028 | $65.000 | | 117 | | 117 | | 117 | |
$1,500m issued at 4.600%4 | Jun 2031 | $46.000 | | 69 | | — | | — | |
$1,000m issued at 4.000%5 | Mar 2026 | $40.000 | | 20 | | — | | — | |
$1,000m issued at 4.700%6 | Mar 2031 | $47.000 | | 24 | | — | | — | |
| €1,500m issued at 5.250% | Sep 2022 | €52.500 | | 93 | | 90 | | 88 | |
| €1,000m issued at 6.000% | Sep 2023 | €60.000 | | 70 | | 67 | | 66 | |
| €1,250m issued at 4.750% | July 2029 | €47.500 | | 72 | | 67 | | 68 | |
| £1,000m issued at 5.875% | Sep 2026 | £58.750 | | 80 | | 74 | | 75 | |
| SGD1,000m issued at 4.700% | Jun 2022 | SGD47.000 | | 35 | | 35 | | 34 | |
| SGD750m issued at 5.000% | Sep 2023 | SGD50.000 | | 28 | | 27 | | 28 | |
| Total | | | 1,303 | | 1,241 | | 1,324 | |
1Discretionary coupons are paid semi-annually on the perpetual subordinated contingent convertible securities, in denominations of each security’s issuance currency 1,000 per security.
2This security was called by HSBC Holdings on 22 November 2019 and was redeemed and cancelled on 17 January 2020. Between the date of exercise of the call option and the redemption, this security was considered to be a subordinated liability. For further details on additional tier 1 securities, see Note 31.
3This security was called by HSBC Holdings on 15 April 2021 and was redeemed and cancelled on 1 June 2021.
4This security was issued by HSBC Holdings on 17 December 2020. The first call date commences six calendar months prior to the reset date of
17 June 2031.
5This security was issued by HSBC Holdings on 9 March 2021. The first call date commences six calendar months prior to the reset date of 9 September 2026.
6This security was issued by HSBC Holdings on 9 March 2021. The first call date commences six calendar months prior to the reset date of 9 September 2031.
After the end of the year, the Directors approved a second interim dividend in respect of the financial year ended 31 December 2021 of $0.18 per ordinary share, a distribution of approximately $3,649m. The second interim dividend for 2021 will be payable on 28 April 2022 to holders on the Principal Register in the UK, the Hong Kong Overseas Branch Register or the Bermuda Overseas Branch Register on
11 March 2022. No liability was recorded in the financial statements in respect of the second interim dividend for 2021.
On 4 January 2022, HSBC paid a coupon on its €1,250m subordinated capital securities, representing a total distribution of €30m ($34m). No liability was recorded in the balance sheet at 31 December 2021 in respect of this coupon payment.
Basic earnings per ordinary share is calculated by dividing the profit attributable to ordinary shareholders of the parent company by the weighted average number of ordinary shares outstanding, excluding own shares held. Diluted earnings per ordinary share is calculated by dividing the basic earnings, which require no adjustment for the effects of dilutive potential ordinary shares, by the weighted average number of ordinary shares outstanding, excluding own shares held, plus the weighted average number of ordinary shares that would be issued on conversion of dilutive potential ordinary shares.
| | | | | | | | | | | |
| Profit attributable to the ordinary shareholders of the parent company |
| 2021 | 2020 | 2019 |
| $m | $m | $m |
| Profit attributable to shareholders of the parent company | 13,917 | | 5,229 | | 7,383 | |
| Dividend payable on preference shares classified as equity | (7) | | (90) | | (90) | |
| Coupon payable on capital securities classified as equity | (1,303) | | (1,241) | | (1,324) | |
| Year ended 31 Dec | 12,607 | | 3,898 | | 5,969 | |
| | | | | | | | | | | | | | | | | | | | | | | | | | | | | |
| Basic and diluted earnings per share |
| 2021 | 2020 | 2019 |
| Profit | Number
of shares | Per
share | Profit | Number
of shares | Per
share | Profit | Number
of shares | Per
share |
| $m | (millions) | $ | $m | (millions) | $ | $m | (millions) | $ |
Basic1 | 12,607 | | 20,197 | | 0.62 | | 3,898 | | 20,169 | | 0.19 | | 5,969 | | 20,158 | | 0.30 | |
| Effect of dilutive potential ordinary shares | | 105 | | | | 73 | | | | 75 | | |
Diluted1 | 12,607 | | 20,302 | | 0.62 | | 3,898 | | 20,242 | | 0.19 | | 5,969 | | 20,233 | | 0.30 | |
1Weighted average number of ordinary shares outstanding (basic) or assuming dilution (diluted).
The number of anti-dilutive employee share options excluded from the weighted average number of dilutive potential ordinary shares is 8.6 million (2020: 14.6 million; 2019: 1.1 million).
The Group Chief Executive, supported by the rest of the Group Executive Committee (‘GEC’), is considered the Chief Operating Decision Maker (‘CODM’) for the purposes of identifying the Group’s reportable segments. Global business results are assessed by the CODM on the basis of adjusted performance that removes the effects of significant items and currency translation from reported results. Therefore, we present these results on an adjusted basis as required by IFRSs. The 2020 and 2019 adjusted performance information is presented on a constant currency basis. The 2020 and 2019 income statements are converted at the average rates of exchange for 2021, and the balance sheets at 31 December 2020 and 31 December 2019 at the prevailing rates of exchange on 31 December 2021.
Our operations are closely integrated and, accordingly, the presentation of data includes internal allocations of certain items of income and expense. These allocations include the costs of certain support services and global functions to the extent that they can be meaningfully attributed to global businesses. While such allocations have been made on a systematic and consistent basis, they necessarily involve a degree of subjectivity. Costs that are not allocated to global businesses are included in Corporate Centre.
Where relevant, income and expense amounts presented include the results of inter-segment funding along with inter-company and inter-business line transactions. All such transactions are undertaken on arm’s length terms. The intra-Group elimination items for the global businesses are presented in Corporate Centre.
Our global businesses
We provide a comprehensive range of banking and related financial services to our customers in our 3 global businesses. The products and services offered to customers are organised by these global businesses.
•Wealth and Personal Banking (‘WPB’) provides a full range of retail banking and wealth products to our customers from personal banking to ultra high net worth individuals. Typically, customer offerings include retail banking products, such as current and savings accounts, mortgages and personal loans, credit cards, debit cards and local and international payment services. We also provide wealth management services, including insurance and investment products, global asset management services, investment management and private wealth solutions for customers with more sophisticated and international requirements.
•Commercial Banking (‘CMB’) offers a broad range of products and services to serve the needs of our commercial customers, including small and medium-sized enterprises, mid-market enterprises and corporates. These include credit and lending, international trade and receivables finance, treasury management and liquidity solutions (payments and cash management and commercial cards), commercial insurance and investments. CMB also offers customers access to products and services offered by other global businesses, such as Global Banking and Markets, which include foreign exchange products, raising capital on debt and equity markets and advisory services.
•Global Banking and Markets (‘GBM’) provides tailored financial solutions to major government, corporate and institutional clients and private investors worldwide. The client-focused business lines deliver a full range of banking capabilities including financing, advisory and transaction services, a markets business that provides services in credit, rates, foreign exchange, equities, money markets and securities services, and principal investment activities.
Notes on the financial statements
| | | | | | | | | | | | | | | | | | |
| HSBC adjusted profit before tax and balance sheet data | |
| 2021 | |
| Wealth and Personal Banking | Commercial
Banking | Global
Banking and
Markets | Corporate Centre | Total | |
| $m | $m | $m | $m | $m | |
| | | | | | |
| | | | | | |
| | | | | | |
| | | | | | |
Net operating income/(expense) before change in expected credit losses and other credit impairment charges1 | 22,110 | | 13,415 | | 15,002 | | (437) | | 50,090 | | |
| – external | 21,753 | | 13,294 | | 16,558 | | (1,515) | | 50,090 | | |
| – inter-segment | 357 | | 121 | | (1,556) | | 1,078 | | — | | |
| of which: net interest income/(expense) | 14,198 | | 8,898 | | 4,122 | | (739) | | 26,479 | | |
| Change in expected credit losses and other credit impairment recoveries | 288 | | 300 | | 337 | | 3 | | 928 | | |
| Net operating income/(expense) | 22,398 | | 13,715 | | 15,339 | | (434) | | 51,018 | | |
| Total operating expenses | (15,384) | | (6,973) | | (10,006) | | 215 | | (32,148) | | |
| Operating profit/(loss) | 7,014 | | 6,742 | | 5,333 | | (219) | | 18,870 | | |
| Share of profit in associates and joint ventures | 34 | | 1 | | — | | 3,011 | | 3,046 | | |
| Adjusted profit before tax | 7,048 | | 6,743 | | 5,333 | | 2,792 | | 21,916 | | |
| % | % | % | % | % | |
| Share of HSBC’s adjusted profit before tax | 32.2 | | 30.8 | | 24.3 | | 12.7 | | 100.0 | | |
| Adjusted cost efficiency ratio | 69.6 | | 52.0 | | 66.7 | | 49.2 | | 64.2 | | |
| | | | | | |
| Adjusted balance sheet data | $m | $m | $m | $m | $m | |
| Loans and advances to customers (net) | 488,786 | | 349,126 | | 207,162 | | 740 | | 1,045,814 | | |
| Interests in associates and joint ventures | 499 | | 13 | | 126 | | 28,971 | | 29,609 | | |
| Total external assets | 932,582 | | 622,925 | | 1,229,820 | | 172,612 | | 2,957,939 | | |
| Customer accounts | 859,029 | | 506,688 | | 344,205 | | 652 | | 1,710,574 | | |
| | | | | | |
| | | | | | | | | | | | | | | | | | |
|
| | | | | | |
| 2020 |
| | | | | | |
| | | | | | |
| | | | | | |
| | | | | | |
| | | | | | |
| | | | | | |
Net operating income/(expense) before change in expected credit losses and other credit impairment charges1 | 22,571 | | 13,718 | | 15,768 | | (287) | | | 51,770 | |
| – external | 20,474 | | 14,114 | | 18,651 | | (1,469) | | | 51,770 | |
| – inter-segment | 2,097 | | (396) | | (2,883) | | 1,182 | | | — | |
| – of which: net interest income/(expense) | 15,470 | | 9,560 | | 4,580 | | (1,337) | | | 28,273 | |
| Change in expected credit losses and other credit impairment (charges)/recoveries | (3,005) | | (4,989) | | (1,289) | | 1 | | | (9,282) | |
| Net operating income/(expense) | 19,566 | | 8,729 | | 14,479 | | (286) | | | 42,488 | |
| Total operating expenses | (15,443) | | (6,897) | | (9,640) | | (429) | | | (32,409) | |
| Operating profit/(loss) | 4,123 | | 1,832 | | 4,839 | | (715) | | | 10,079 | |
| Share of profit in associates and joint ventures | 7 | | (1) | | — | | 2,186 | | | 2,192 | |
| Adjusted profit before tax | 4,130 | | 1,831 | | 4,839 | | 1,471 | | | 12,271 | |
| % | % | % | % | | % |
| Share of HSBC’s adjusted profit before tax | 33.7 | | 14.9 | | 39.4 | | 12.0 | | | 100.0 | |
| Adjusted cost efficiency ratio | 68.4 | | 50.3 | | 61.1 | | (149.5) | | | 62.6 | |
| | | | | | |
| Adjusted balance sheet data | $m | $m | $m | $m | | $m |
| Loans and advances to customers (net) | 462,286 | | 338,193 | | 220,692 | | 1,231 | | | 1,022,402 | |
| Interests in associates and joint ventures | 444 | | 13 | | 141 | | 26,472 | | | 27,070 | |
| Total external assets | 869,924 | | 562,125 | | 1,319,389 | | 187,189 | | | 2,938,627 | |
| Customer accounts | 823,991 | | 464,380 | | 331,164 | | 593 | | | 1,620,128 | |
| | | | | | | | | | | | | | | | | | |
|
|
| 2019 |
| | | | | | |
| | | | | | |
Net operating income/(expense) before change in expected credit losses and other credit impairment charges1 | 26,140 | | 15,594 | | 15,282 | | (581) | | | 56,435 | |
| – external | 21,777 | | 16,522 | | 20,782 | | (2,646) | | | 56,435 | |
| – inter-segment | 4,363 | | (928) | | (5,500) | | 2,065 | | | — | |
| – of which: net interest income/(expense) | 17,820 | | 11,242 | | 5,309 | | (3,338) | | | 31,033 | |
| Change in expected credit losses and other credit impairment (charges)/recoveries | (1,376) | | (1,194) | | (155) | | 38 | | | (2,687) | |
| Net operating income/(expense) | 24,764 | | 14,400 | | 15,127 | | (543) | | | 53,748 | |
| Total operating expenses | (15,823) | | (7,028) | | (9,891) | | (821) | | | (33,563) | |
| Operating profit/(loss) | 8,941 | | 7,372 | | 5,236 | | (1,364) | | | 20,185 | |
| Share of profit in associates and joint ventures | 54 | | 1 | | 1 | | 2,440 | | | 2,496 | |
| Adjusted profit before tax | 8,995 | | 7,373 | | 5,237 | | 1,076 | | | 22,681 | |
| % | % | % | % | | % |
| Share of HSBC’s adjusted profit before tax | 39.7 | | 32.5 | | 23.1 | | 4.7 | | | 100.0 | |
| Adjusted cost efficiency ratio | 60.5 | | 45.1 | | 64.7 | | (141.3) | | | 59.5 | |
| | | | | | |
| Adjusted balance sheet data | $m | $m | $m | $m | | $m |
| Loans and advances to customers (net) | 448,880 | | 348,716 | | 248,062 | | 1,141 | | | 1,046,799 | |
| Interests in associates and joint ventures | 445 | | 14 | | 16 | | 25,305 | | | 25,780 | |
| Total external assets | 780,456 | | 515,962 | | 1,283,597 | | 161,055 | | | 2,741,070 | |
| Customer accounts | 758,414 | | 392,133 | | 298,618 | | 760 | | | 1,449,925 | |
| | | | | | |
| | | | | | |
1 Net operating income before change in expected credit losses and other credit impairment charges, also referred to as revenue.
Reported external net operating income is attributed to countries and territories on the basis of the location of the branch responsible for reporting the results or advancing the funds:
| | | | | | | | | | | |
| 2021 | 2020 | 2019 |
| $m | $m | $m |
Reported external net operating income by country/territory1 | 49,552 | | 50,429 | | 56,098 | |
| – UK | 10,909 | | 9,163 | | 9,011 | |
| – Hong Kong | 14,245 | | 15,783 | | 18,449 | |
| – US | 3,795 | | 4,474 | | 4,471 | |
| – France | 2,179 | | 1,753 | | 1,942 | |
| – other countries | 18,424 | | 19,256 | | 22,225 | |
| | | |
1 Net operating income before change in expected credit losses and other credit impairment charges, also referred to as revenue.
| | | | | | | | | | | | | | | | | | | | | | | | | | | | | | | | | | | |
| Adjusted results reconciliation |
| 2021 | 2020 | 2019 |
| Adjusted | Significant
items | Reported | Adjusted | Currency
translation | Significant
items | Reported | Adjusted | Currency
translation | Significant
items | Reported |
| $m | $m | $m | $m | $m | $m | $m | $m | $m | $m | $m |
Revenue1 | 50,090 | | (538) | | 49,552 | | 51,770 | | (1,393) | | 52 | | 50,429 | | 56,435 | | (1,010) | | 673 | | 56,098 | |
| ECL | 928 | | — | | 928 | | (9,282) | | 465 | | — | | (8,817) | | (2,687) | | (69) | | — | | (2,756) | |
| Operating expenses | (32,148) | | (2,472) | | (34,620) | | (32,409) | | 1,072 | | (3,095) | | (34,432) | | (33,563) | | 981 | | (9,767) | | (42,349) | |
| Share of profit in associates and joint ventures | 3,046 | | — | | 3,046 | | 2,192 | | (133) | | (462) | | 1,597 | | 2,496 | | (142) | | — | | 2,354 | |
| Profit/(loss) before tax | 21,916 | | (3,010) | | 18,906 | | 12,271 | | 11 | | (3,505) | | 8,777 | | 22,681 | | (240) | | (9,094) | | 13,347 | |
1 Net operating income before change in expected credit losses and other credit impairment charges, also referred to as revenue.
| | | | | | | | | | | | | | | | | | | | | | | |
| Adjusted balance sheet reconciliation |
| 2021 | 2020 | 2019 |
| Reported and
adjusted | Adjusted | Currency translation | Reported | Adjusted | Currency translation | Reported |
| $m | $m | $m | $m | $m | $m | $m |
| Loans and advances to customers (net) | 1,045,814 | | 1,022,402 | | 15,585 | | 1,037,987 | | 1,046,799 | | (10,056) | | 1,036,743 | |
| Interests in associates and joint ventures | 29,609 | | 27,070 | | (386) | | 26,684 | | 25,780 | | (1,306) | | 24,474 | |
| Total external assets | 2,957,939 | | 2,938,627 | | 45,537 | | 2,984,164 | | 2,741,070 | | (25,918) | | 2,715,152 | |
| Customer accounts | 1,710,574 | | 1,620,128 | | 22,652 | | 1,642,780 | | 1,449,925 | | (10,810) | | 1,439,115 | |
| | | | | | | | | | | |
| Adjusted profit reconciliation |
| 2021 | 2020 | 2019 |
| $m | $m | $m |
| Year ended 31 Dec | | | |
| Adjusted profit before tax | 21,916 | | 12,271 | | 22,681 | |
| Significant items | (3,010) | | (3,505) | | (9,094) | |
| – customer redress programmes (revenue) | 11 | | (21) | | (163) | |
| – disposals, acquisitions and investment in new businesses (revenue) | — | | (10) | | 768 | |
– fair value movements on financial instruments1 | (242) | | 264 | | 84 | |
– restructuring and other related costs (revenue)2 | (307) | | (170) | | — | |
– costs of structural reform3 | — | | — | | (158) | |
| | | |
| – customer redress programmes (operating expenses) | (49) | | 54 | | (1,281) | |
| | | |
| | | |
| – impairment of goodwill and other intangible assets | (587) | | (1,090) | | (7,349) | |
| – past service costs of guaranteed minimum pension benefits equalisation | — | | (17) | | — | |
– restructuring and other related costs (operating expenses)4 | (1,836) | | (1,908) | | (827) | |
| – settlements and provisions in connection with legal and other regulatory matters | — | | (12) | | 61 | |
– impairment of goodwill (share of profit in associates and joint ventures)5 | — | | (462) | | — | |
| – currency translation on significant items | 0 | (133) | | (229) | |
| Currency translation | 0 | 11 | | (240) | |
| Reported profit before tax | 18,906 | | 8,777 | | 13,347 | |
1 Includes fair value movements on non-qualifying hedges and debt valuation adjustments on derivatives.
2 Comprises losses associated with the RWA reduction commitments and gains relating to the business update in February 2020.
3 Comprises costs associated with preparations for the UK’s exit from the European Union.
4 Includes impairment of software intangible assets of $189m (of the total software intangible asset impairment of $1,347m) and impairment of tangible assets of $197m in 2020.
5 During 2020, The Saudi British Bank ('SABB'), an associate of HSBC, impaired the goodwill that arose following the merger with Alawwal bank in 2019. HSBC's post-tax share of the goodwill impairment was $462m.
Notes on the financial statements
| | | | | | | | |
| 2021 | 2020 |
| $m | $m |
| Treasury and other eligible bills | 23,110 | | 24,035 | |
| Debt securities | 89,944 | | 102,846 | |
| Equity securities | 109,614 | | 77,643 | |
| Trading securities | 222,668 | | 204,524 | |
Loans and advances to banks1 | 7,767 | | 8,242 | |
Loans and advances to customers1 | 18,407 | | 19,224 | |
| Year ended 31 Dec | 248,842 | | 231,990 | |
1 Loans and advances to banks and customers include reverse repos, stock borrowing and other accounts.
| | | | | |
| 12 | Fair values of financial instruments carried at fair value |
Control framework
Fair values are subject to a control framework designed to ensure that they are either determined or validated by a function independent of the risk taker.
Where fair values are determined by reference to externally quoted prices or observable pricing inputs to models, independent price determination or validation is used. For inactive markets, HSBC sources alternative market information, with greater weight given to information that is considered to be more relevant and reliable. Examples of the factors considered are price observability, instrument comparability, consistency of data sources, underlying data accuracy and timing of prices.
For fair values determined using valuation models, the control framework includes development or validation by independent support functions of the model logic, inputs, model outputs and adjustments. Valuation models are subject to a process of due diligence before becoming operational and are calibrated against external market data on an ongoing basis.
Changes in fair value are generally subject to a profit and loss analysis process and are disaggregated into high-level categories including portfolio changes, market movements and other fair value adjustments.
The majority of financial instruments measured at fair value are in GBM. GBM’s fair value governance structure comprises its Finance function, Valuation Committees and a Valuation Committee Review Group. Finance is responsible for establishing procedures governing valuation and ensuring fair values are in compliance with accounting standards. The fair values are reviewed by the Valuation Committees, which consist of independent support functions. These committees are overseen by the Valuation Committee Review Group, which considers all material subjective valuations.
Financial liabilities measured at fair value
In certain circumstances, HSBC records its own debt in issue at fair value, based on quoted prices in an active market for the specific instrument. When quoted market prices are unavailable, the own debt in issue is valued using valuation techniques, the inputs for which are either based on quoted prices in an inactive market for the instrument or are estimated by comparison with quoted prices in an active market for similar instruments. In both cases, the fair value includes the effect of applying the credit spread that is appropriate to HSBC’s liabilities. The change in fair value of issued debt securities attributable to the Group’s own credit spread is computed as follows: for each security at each reporting date, an externally verifiable price is obtained or a price is derived using credit spreads for similar securities for the same issuer. Then, using discounted cash flow, each security is valued using an appropriate market discount curve. The difference in the valuations is attributable to the Group’s own credit spread. This methodology is applied consistently across all securities.
Structured notes issued and certain other hybrid instruments are included within trading liabilities and are measured at fair value. The credit spread applied to these instruments is derived from the spreads at which HSBC issues structured notes.
Gains and losses arising from changes in the credit spread of liabilities issued by HSBC, recorded in other comprehensive income, reverse over the contractual life of the debt, provided that the debt is not repaid at a premium or a discount.
Fair value hierarchy
Fair values of financial assets and liabilities are determined according to the following hierarchy:
•Level 1 – valuation technique using quoted market price. These are financial instruments with quoted prices for identical instruments in active markets that HSBC can access at the measurement date.
•Level 2 – valuation technique using observable inputs. These are financial instruments with quoted prices for similar instruments in active markets or quoted prices for identical or similar instruments in inactive markets and financial instruments valued using models where all significant inputs are observable.
•Level 3 – valuation technique with significant unobservable inputs. These are financial instruments valued using valuation techniques where one or more significant inputs are unobservable.
| | | | | | | | | | | | | | | | | | | | | | | | | | |
| Financial instruments carried at fair value and bases of valuation |
| 2021 | 2020 |
| Level 1 | Level 2 | Level 3 | Total | Level 1 | Level 2 | Level 3 | Total |
| $m | $m | $m | $m | $m | $m | $m | $m |
| Recurring fair value measurements at 31 Dec | | | | | | | | |
| Assets | | | | | | | | |
| Trading assets | 180,423 | | 65,757 | | 2,662 | | 248,842 | | 167,980 | | 61,511 | | 2,499 | | 231,990 | |
| Financial assets designated and otherwise mandatorily measured at fair value through profit or loss | 17,937 | | 17,629 | | 14,238 | | 49,804 | | 19,711 | | 14,365 | | 11,477 | | 45,553 | |
| Derivatives | 2,783 | | 191,621 | | 2,478 | | 196,882 | | 2,602 | | 302,454 | | 2,670 | | 307,726 | |
| Financial investments | 247,745 | | 97,838 | | 3,389 | | 348,972 | | 303,654 | | 94,746 | | 3,654 | | 402,054 | |
| Liabilities | | | | | | | | |
| Trading liabilities | 63,437 | | 20,682 | | 785 | | 84,904 | | 53,290 | | 21,814 | | 162 | | 75,266 | |
| Financial liabilities designated at fair value | 1,379 | | 136,243 | | 7,880 | | 145,502 | | 1,267 | | 150,866 | | 5,306 | | 157,439 | |
| Derivatives | 1,686 | | 186,290 | | 3,088 | | 191,064 | | 1,788 | | 297,025 | | 4,188 | | 303,001 | |
| | | | | | | | | | | | | | | | | | | | | | | |
| Transfers between Level 1 and Level 2 fair values |
| Assets | Liabilities |
| Financial
investments | Trading
assets | Designated and otherwise
mandatorily measured at fair value | Derivatives | Trading
liabilities | Designated
at fair value | Derivatives |
| $m | $m | $m | $m | $m | $m | $m |
| At 31 Dec 2021 | | | | | | | |
| Transfers from Level 1 to Level 2 | 8,477 | | 6,553 | | 1,277 | | 103 | | 181 | | — | | 212 | |
| Transfers from Level 2 to Level 1 | 6,007 | | 4,132 | | 768 | | — | | 638 | | — | | — | |
| | | | | | | |
| At 31 Dec 2020 | | | | | | | |
| Transfers from Level 1 to Level 2 | 4,514 | | 3,891 | | 245 | | — | | 155 | | 7,414 | | — | |
| Transfers from Level 2 to Level 1 | 7,764 | | 5,517 | | 328 | | 1 | | 433 | | — | | — | |
Transfers between levels of the fair value hierarchy are deemed to occur at the end of each quarterly reporting period. Transfers into and out of levels of the fair value hierarchy are primarily attributable to observability of valuation inputs and price transparency.
Fair value adjustments
We adopt the use of fair value adjustments when we take into consideration additional factors not incorporated within the valuation model that would otherwise be considered by a market participant. We classify fair value adjustments as either ‘risk-related’ or ‘model-related’. The majority of these adjustments relate to GBM. Movements in the level of fair value adjustments do not necessarily result in the recognition of profits or losses within the income statement. For example, as models are enhanced, fair value adjustments may no longer be required. Similarly, fair value adjustments will decrease when the related positions are unwound, but this may not result in profit or loss.
| | | | | | | | | | | | | | |
| Global Banking and Markets fair value adjustments | | | | |
| 2021 | 2020 |
| GBM | Corporate
Centre | GBM | Corporate
Centre |
| $m | $m | $m | $m |
| Type of adjustment | | | | |
| Risk-related | 868 | | 42 | | 1,170 | | 28 | |
| – bid-offer | 412 | | — | | 514 | | — | |
| – uncertainty | 66 | | 1 | | 106 | | 1 | |
| – credit valuation adjustment | 228 | | 35 | | 445 | | 27 | |
| – debt valuation adjustment | (92) | | — | | (120) | | — | |
| – funding fair value adjustment | 254 | | 6 | | 204 | | — | |
| – other | — | | — | | 21 | | — | |
| Model-related | 57 | | — | | 74 | | — | |
| – model limitation | 57 | | — | | 70 | | — | |
| – other | — | | — | | 4 | | — | |
| Inception profit (Day 1 P&L reserves) | 106 | | — | | 104 | | — | |
| At 31 Dec | 1,031 | | 42 | | 1,348 | | 28 | |
We continue to observe losses on the disposals of certain uncollateralised over-the-counter (‘OTC’) derivatives as part of our commitments to reduce RWAs in GBM, as set out in our business update in February 2020. Based on our analysis, these losses are not considered to give rise to an adjustment within the IFRS 13 ‘Fair Value Measurement’ framework.
The reduction in fair value adjustments was driven by increased liquidity, lower volatility and an improved credit environment. Movement in funding fair value adjustment included a change in measurement from Libor to a Libor replacement risk-free rate.
Bid-offer
IFRS 13 ‘Fair Value Measurement’ requires the use of the price within the bid-offer spread that is most representative of fair value. Valuation models will typically generate mid-market values. The bid-offer adjustment reflects the extent to which bid-offer costs would be incurred if substantially all residual net portfolio market risks were closed using available hedging instruments or by disposing of or unwinding the position.
Notes on the financial statements
Uncertainty
Certain model inputs may be less readily determinable from market data and/or the choice of model itself may be more subjective. In these circumstances, an adjustment may be necessary to reflect the likelihood that market participants would adopt more conservative values for uncertain parameters and/or model assumptions than those used in HSBC’s valuation model.
Credit and debt valuation adjustments
The credit valuation adjustment (‘CVA’) is an adjustment to the valuation of over-the-counter (‘OTC’) derivative contracts to reflect the possibility that the counterparty may default and that HSBC may not receive the full market value of the transactions.
The debt valuation adjustment (‘DVA’) is an adjustment to the valuation of OTC derivative contracts to reflect the possibility that HSBC may default, and that it may not pay the full market value of the transactions.
HSBC calculates a separate CVA and DVA for each legal entity, and for each counterparty to which the entity has exposure. With the exception of central clearing parties, all third-party counterparties are included in the CVA and DVA calculations, and these adjustments are not netted across Group entities.
HSBC calculates the CVA by applying the probability of default (‘PD’) of the counterparty, conditional on the non-default of HSBC, to HSBC’s expected positive exposure to the counterparty and multiplying the result by the loss expected in the event of default. Conversely, HSBC calculates the DVA by applying the PD of HSBC, conditional on the non-default of the counterparty, to the expected positive exposure of the counterparty to HSBC and multiplying the result by the loss expected in the event of default. Both calculations are performed over the life of the potential exposure.
For most products HSBC uses a simulation methodology, which incorporates a range of potential exposures over the life of the portfolio, to calculate the expected positive exposure to a counterparty. The simulation methodology includes credit mitigants, such as counterparty netting agreements and collateral agreements with the counterparty.
The methodologies do not, in general, account for ‘wrong-way risk’. Wrong-way risk is an adverse correlation between the counterparty’s probability of default and the mark-to-market value of the underlying transaction. The risk can either be general, perhaps related to the currency of the issuer country, or specific to the transaction concerned. When there is significant wrong-way risk, a trade-specific approach is applied to reflect this risk in the valuation.
Funding fair value adjustment
The funding fair value adjustment (‘FFVA’) is calculated by applying future market funding spreads to the expected future funding exposure of any uncollateralised component of the OTC derivative portfolio. The expected future funding exposure is calculated by a simulation methodology, where available, and is adjusted for events that may terminate the exposure, such as the default of HSBC or the counterparty. The FFVA and DVA are calculated independently.
Model limitation
Models used for portfolio valuation purposes may be based upon a simplified set of assumptions that do not capture all current and future material market characteristics. In these circumstances, model limitation adjustments are adopted.
Inception profit (Day 1 P&L reserves)
Inception profit adjustments are adopted when the fair value estimated by a valuation model is based on one or more significant unobservable inputs. The accounting for inception profit adjustments is discussed in Note 1.
Fair value valuation bases
| | | | | | | | | | | | | | | | | | | | | | | | | | | | | |
| Financial instruments measured at fair value using a valuation technique with significant unobservable inputs – Level 3 |
| Assets | Liabilities |
| Financial investments | Trading assets | Designated and otherwise mandatorily measured at fair value through profit or loss | Derivatives | Total | Trading liabilities | Designated at fair value | Derivatives | Total |
| $m | $m | $m | $m | $m | $m | $m | $m | $m |
| Private equity including strategic investments | 544 | | 2 | | 13,732 | | — | | 14,278 | | 9 | | — | | — | | 9 | |
| Asset-backed securities | 1,008 | | 132 | | 1 | | — | | 1,141 | | — | | — | | — | | — | |
| | | | | | | | | |
| Structured notes | — | | — | | — | | — | | — | | — | | 7,879 | | — | | 7,879 | |
| Derivatives with monolines | — | | — | | — | | — | | — | | — | | — | | — | | — | |
| Other derivatives | — | | — | | — | | 2,478 | | 2,478 | | — | | — | | 3,088 | | 3,088 | |
| Other portfolios | 1,837 | | 2,528 | | 505 | | — | | 4,870 | | 776 | | 1 | | — | | 777 | |
| At 31 Dec 2021 | 3,389 | | 2,662 | | 14,238 | | 2,478 | | 22,767 | | 785 | | 7,880 | | 3,088 | | 11,753 | |
| | | | | | | | | |
| | |
| | | | | | | | | |
| | | | | | | | | |
| Private equity including strategic investments | 930 | | 4 | | 10,971 | | — | | 11,905 | | 4 | | — | | — | | 4 | |
| Asset-backed securities | 1,286 | | 523 | | 25 | | — | | 1,834 | | — | | — | | — | | — | |
| | | | | | | | | |
| Structured notes | — | | — | | — | | — | | — | | 29 | | 5,301 | | — | | 5,330 | |
| Derivatives with monolines | — | | — | | — | | 68 | | 68 | | — | | — | | — | | — | |
| Other derivatives | — | | — | | — | | 2,602 | | 2,602 | | — | | — | | 4,187 | | 4,187 | |
| Other portfolios | 1,438 | | 1,972 | | 481 | | — | | 3,891 | | 129 | | 5 | | 1 | | 135 | |
| At 31 Dec 2020 | 3,654 | | 2,499 | | 11,477 | | 2,670 | | 20,300 | | 162 | | 5,306 | | 4,188 | | 9,656 | |
Level 3 instruments are present in both ongoing and legacy businesses. Loans held for securitisation, derivatives with monolines, certain ‘other derivatives’ and predominantly all Level 3 asset-backed securities are legacy positions. HSBC has the capability to hold these positions.
Private equity including strategic investments
The fair value of a private equity investment (including strategic investments) is estimated on the basis of an analysis of the investee’s financial position and results, risk profile, prospects and other factors; by reference to market valuations for similar entities quoted in an active market; the price at which similar companies have changed ownership; or from published net asset values (‘NAV’) received. If necessary, adjustments are made to the NAV of funds to obtain the best estimate of fair value.
Asset-backed securities
While quoted market prices are generally used to determine the fair value of the asset-backed securities (‘ABSs’), valuation models are used to substantiate the reliability of the limited market data available and to identify whether any adjustments to quoted market prices are required. For certain ABSs, such as residential mortgage-backed securities, the valuation uses an industry standard model with assumptions relating to prepayment speeds, default rates and loss severity based on collateral type, and performance, as appropriate. The valuations output is benchmarked for consistency against observable data for securities of a similar nature.
Structured notes
The fair value of Level 3 structured notes is derived from the fair value of the underlying debt security, and the fair value of the embedded derivative is determined as described in the paragraph below on derivatives. These structured notes comprise principally equity-linked notes issued by HSBC, which provide the counterparty with a return linked to the performance of equity securities and other portfolios.
Examples of the unobservable parameters include long-dated equity volatilities and correlations between equity prices, and interest and foreign exchange rates.
Derivatives
OTC derivative valuation models calculate the present value of expected future cash flows, based upon ‘no arbitrage’ principles. For many vanilla derivative products, the modelling approaches used are standard across the industry. For more complex derivative products, there may be some differences in market practice. Inputs to valuation models are determined from observable market data wherever possible, including prices available from exchanges, dealers, brokers or providers of consensus pricing. Certain inputs may not be observable in the market directly, but can be determined from observable prices via model calibration procedures or estimated from historical data or other sources.
Reconciliation of fair value measurements in Level 3 of the fair value hierarchy
| | | | | | | | | | | | | | | | | | | | | | | |
| Movement in Level 3 financial instruments |
| Assets | Liabilities |
| Financial investments | Trading assets | Designated and otherwise mandatorily measured at fair value through profit or loss | Derivatives | Trading liabilities | Designated at fair value | Derivatives |
| $m | $m | $m | $m | $m | $m | $m |
| At 1 Jan 2021 | 3,654 | | 2,499 | | 11,477 | | 2,670 | | 162 | | 5,306 | | 4,188 | |
| Total gains/(losses) recognised in profit or loss | (10) | | (378) | | 1,753 | | 2,237 | | 16 | | (836) | | 2,583 | |
| – net income/(losses) from financial instruments held for trading or managed on a fair value basis | — | | (378) | | — | | 2,237 | | 16 | | — | | 2,583 | |
| – changes in fair value of other financial instruments mandatorily measured at fair value through profit or loss | — | | — | | 1,753 | | — | | — | | (836) | | — | |
| – gains less losses from financial investments at fair value through other comprehensive income | (10) | | — | | — | | — | | — | | — | | — | |
| | | | | | | |
Total gains/(losses) recognised in other comprehensive income (‘OCI’)1 | (521) | | (18) | | (285) | | (27) | | (8) | | (61) | | (26) | |
| – financial investments: fair value gains | (428) | | — | | — | | — | | — | | — | | — | |
| | | | | | | |
| – exchange differences | (93) | | (18) | | (285) | | (27) | | (8) | | (61) | | (26) | |
| Purchases | 1,025 | | 1,988 | | 3,692 | | — | | 1,014 | | 1 | | — | |
| New issuances | — | | — | | — | | — | | 35 | | 5,969 | | — | |
| Sales | (580) | | (473) | | (1,216) | | — | | (4) | | (27) | | — | |
| Settlements | (336) | | (747) | | (1,049) | | (2,347) | | (681) | | (2,922) | | (3,962) | |
| Transfers out | (383) | | (1,027) | | (184) | | (418) | | (7) | | (704) | | (734) | |
| Transfers in | 540 | | 818 | | 50 | | 363 | | 258 | | 1,154 | | 1,039 | |
| At 31 Dec 2021 | 3,389 | | 2,662 | | 14,238 | | 2,478 | | 785 | | 7,880 | | 3,088 | |
| Unrealised gains/(losses) recognised in profit or loss relating to assets and liabilities held at 31 Dec 2020 | — | | (309) | | 1,509 | | 1,298 | | — | | 166 | | (969) | |
| – net income/(losses) from financial instruments held for trading or managed on a fair value basis | — | | (309) | | — | | 1,298 | | — | | — | | (969) | |
| – changes in fair value of other financial instruments mandatorily measured at fair value through profit or loss | — | | — | | 1,509 | | — | | — | | 166 | | — | |
| | | | | | | |
Notes on the financial statements
| | | | | | | | | | | | | | | | | | | | | | | |
| Movement in Level 3 financial instruments (continued) |
| Assets | Liabilities |
| Financial investments | Trading assets | Designated and otherwise mandatorily measured at fair value through profit or loss | Derivatives | Trading liabilities | Designated at fair value | Derivatives |
| $m | $m | $m | $m | $m | $m | $m |
| | | | | | | |
| At 1 Jan 2020 | 3,218 | | 4,979 | | 9,476 | | 2,136 | | 53 | | 5,016 | | 2,302 | |
| Total gains/(losses) recognised in profit or loss | 17 | | (6) | | 504 | | 2,281 | | 307 | | (59) | | 3,398 | |
| – net income/(losses) from financial instruments held for trading or managed on a fair value basis | — | | (6) | | — | | 2,281 | | 307 | | — | | 3,398 | |
| – changes in fair value of other financial instruments mandatorily measured at fair value through profit or loss | — | | — | | 504 | | — | | — | | (59) | | — | |
| – gains less losses from financial investments at fair value through other comprehensive income | 17 | | — | | — | | — | | — | | — | | — | |
| | | | | | | |
Total gains/(losses) recognised in other comprehensive income (‘OCI’)1 | 394 | | 115 | | 286 | | 143 | | 17 | | 204 | | 169 | |
| – financial investments: fair value gains | 270 | | — | | — | | — | | — | | — | | — | |
| | | | | | | |
| | | | | | | |
| – exchange differences | 124 | | 115 | | 286 | | 143 | | 17 | | 204 | | 169 | |
| Purchases | 671 | | 687 | | 3,701 | | — | | 66 | | — | | — | |
| New issuances | — | | — | | 1 | | — | | 6 | | 1,876 | | — | |
| Sales | (674) | | (1,579) | | (2,042) | | — | | (260) | | — | | — | |
| Settlements | (530) | | (1,122) | | (435) | | (1,542) | | (26) | | (1,531) | | (1,462) | |
| Transfers out | (101) | | (1,790) | | (140) | | (565) | | (9) | | (777) | | (528) | |
| Transfers in | 659 | | 1,215 | | 126 | | 217 | | 8 | | 577 | | 309 | |
| At 31 Dec 2020 | 3,654 | | 2,499 | | 11,477 | | 2,670 | | 162 | | 5,306 | | 4,188 | |
| Unrealised gains/(losses) recognised in profit or loss relating to assets and liabilities held at 31 Dec 2020 | — | | (32) | | 412 | | 707 | | 1 | | (91) | | (1,621) | |
| – net income/(losses) from financial instruments held for trading or managed on a fair value basis | — | | (32) | | — | | 707 | | 1 | | — | | (1,621) | |
| – changes in fair value of other financial instruments mandatorily measured at fair value through profit or loss | — | | — | | 412 | | — | | — | | (91) | | — | |
| | | | | | | |
1 Included in ‘financial investments: fair value gains/(losses)’ in the current year and ‘exchange differences’ in the consolidated statement of comprehensive income.
Transfers between levels of the fair value hierarchy are deemed to occur at the end of each quarterly reporting period. Transfers into and out of levels of the fair value hierarchy are primarily attributable to observability of valuation inputs and price transparency.
Effect of changes in significant unobservable assumptions to reasonably possible alternatives
| | | | | | | | | | | | | | | | | | | | | | | | | | |
| Sensitivity of fair values to reasonably possible alternative assumptions |
| 2021 | 2020 |
| Reflected in profit or loss | Reflected in OCI | Reflected in profit or loss | Reflected in OCI |
| Favourable
changes | Un-
favourable
changes | Favourable
changes | Un-
favourable
changes | Favourable
changes | Un-
favourable
changes | Favourable
changes | Un-
favourable
changes |
| $m | $m | $m | $m | $m | $m | $m | $m |
Derivatives, trading assets and trading liabilities1 | 143 | | (146) | | — | | — | | 229 | | (244) | | — | | — | |
| Financial assets and liabilities designated and otherwise mandatorily measured at fair value through profit or loss | 849 | | (868) | | — | | — | | 644 | | (643) | | — | | — | |
| Financial investments | 20 | | (20) | | 113 | | (112) | | 35 | | (35) | | 110 | | (110) | |
| At 31 Dec | 1,012 | | (1,034) | | 113 | | (112) | | 908 | | (922) | | 110 | | (110) | |
1 ‘Derivatives, trading assets and trading liabilities’ are presented as one category to reflect the manner in which these instruments are risk-managed.
The sensitivity analysis aims to measure a range of fair values consistent with the application of a 95% confidence interval. Methodologies take account of the nature of the valuation technique employed, as well as the availability and reliability of observable proxy and historical data.
When the fair value of a financial instrument is affected by more than one unobservable assumption, the above table reflects the most favourable or the most unfavourable change from varying the assumptions individually.
Key unobservable inputs to Level 3 financial instruments
The following table lists key unobservable inputs to Level 3 financial instruments and provides the range of those inputs at 31 December 2021.
| | | | | | | | | | | | | | | | | | | | | | | | | | |
| Quantitative information about significant unobservable inputs in Level 3 valuations |
| Fair value | | | 2021 | 2020 |
| Assets | Liabilities | Valuation
techniques | Key unobservable
inputs | Full range
of inputs | Full range
of inputs |
| $m | $m | Lower | Higher | Lower | Higher |
| Private equity including strategic investments | 14,278 | | 9 | | See below | See below | | | | |
| Asset-backed securities | 1,141 | | — | | | | | | | |
| – collateralised loan/debt obligation | 20 | — | | Market proxy | Prepayment rate | — | — | 0% | 9% |
| Market proxy | Bid quotes | 0 | 100 | 0 | 100 |
| – other ABSs | 1,121 | | — | | Market proxy | Bid quotes | 0 | 100 | 0 | 101 |
| | | | | | | | |
| Structured notes | — | | 7,879 | | | | | | | |
| – equity-linked notes | — | | 6,565 | | Model – Option model | Equity volatility | 6% | 124% | 6% | 115% |
| Model – Option model | Equity correlation | 22% | 99% | (4)% | 88% |
| – FX-linked notes | — | | 629 | | Model – Option model | FX volatility | 1% | 99% | 0% | 36% |
| – other | — | | 685 | | | | | | | |
| Derivatives with monolines | — | | — | | Model – Discounted cash flow | Credit spread | — | — | 2% | 2% |
| Other derivatives | 2,478 | | 3,088 | | | | | | | |
| – interest rate derivatives | 797 | | 990 | | | | | | | |
| securitisation swaps | 284 | | 595 | | Model – Discounted cash flow | Prepayment rate | 5% | 10% | 6% | 6% |
| long-dated swaptions | 36 | | 73 | | Model – Option model | IR volatility | 15% | 35% | 6% | 28% |
| other | 477 | | 322 | | | | | | | |
| – FX derivatives | 379 | | 403 | | | | | | | |
| FX options | 212 | | 270 | | Model – Option model | FX volatility | 1% | 99% | 0% | 43% |
| other | 167 | | 133 | | | | | | | |
| – equity derivatives | 1,143 | | 1,513 | | | | | | | |
| long-dated single stock options | 590 | | 895 | | Model – Option model | Equity volatility | 4% | 138% | 0% | 120% |
| other | 553 | | 618 | | | | | | | |
| – credit derivatives | 159 | | 182 | | | | | | | |
| other | 159 | | 182 | | | | | | | |
| Other portfolios | 4,870 | | 777 | | | | | | | |
| | | | | | | | |
| – repurchase agreements | 778 | | — | | Model – Discounted cash flow | IR curve | 1% | 5% | 0% | 5% |
– other1 | 4,092 | | 777 | | | | | | | |
| At 31 Dec 2021 | 22,767 | | 11,753 | | | | | | | |
1 ‘Other’ includes a range of smaller asset holdings.
Private equity including strategic investments
Given the bespoke nature of the analysis in respect of each private equity holding, it is not practical to quote a range of key unobservable inputs. The key unobservable inputs would be price and correlation. The valuation approach includes using a range of inputs that include company specific financials, traded comparable companies multiples, published net asset values and qualitative assumptions, which are not directly comparable or quantifiable.
Prepayment rates
Prepayment rates are a measure of the anticipated future speed at which a loan portfolio will be repaid in advance of the due date. They vary according to the nature of the loan portfolio and expectations of future market conditions, and may be estimated using a variety of evidence, such as prepayment rates implied from proxy observable security prices, current or historical prepayment rates and macroeconomic modelling.
Market proxy
Market proxy pricing may be used for an instrument when specific market pricing is not available but there is evidence from instruments with common characteristics. In some cases it might be possible to identify a specific proxy, but more generally evidence across a wider range of instruments will be used to understand the factors that influence current market pricing and the manner of that influence.
Volatility
Volatility is a measure of the anticipated future variability of a market price. It varies by underlying reference market price, and by strike and maturity of the option. Certain volatilities, typically those of a longer-dated nature, are unobservable and are estimated from observable data. The range of unobservable volatilities reflects the wide variation in volatility inputs by reference market price. The core range is significantly narrower than the full range because these examples with extreme volatilities occur relatively rarely within the HSBC portfolio.
Correlation
Correlation is a measure of the inter-relationship between two market prices and is expressed as a number between minus one and one. It is used to value more complex instruments where the payout is dependent upon more than one market price. There is a wide range of instruments for which correlation is an input, and consequently a wide range of both same-asset correlations and cross-asset correlations is used. In general, the range of same-asset correlations will be narrower than the range of cross-asset correlations.
Unobservable correlations may be estimated based upon a range of evidence, including consensus pricing services, HSBC trade prices, proxy correlations and examination of historical price relationships. The range of unobservable correlations quoted in the table reflects the wide variation in correlation inputs by market price pair.
Notes on the financial statements
Credit spread
Credit spread is the premium over a benchmark interest rate required by the market to accept lower credit quality. In a discounted cash flow model, the credit spread increases the discount factors applied to future cash flows, thereby reducing the value of an asset. Credit spreads may be implied from market prices and may not be observable in more illiquid markets.
Inter-relationships between key unobservable inputs
Key unobservable inputs to Level 3 financial instruments may not be independent of each other. As described above, market variables may be correlated. This correlation typically reflects the manner in which different markets tend to react to macroeconomic or other events. Furthermore, the effect of changing market variables on the HSBC portfolio will depend on HSBC’s net risk position in respect of each variable.
HSBC Holdings
| | | | | | | | |
| Basis of valuing HSBC Holdings’ financial assets and liabilities measured at fair value |
| 2021 | 2020 |
| $m | $m |
| Valuation technique using observable inputs: Level 2 | | |
| Assets at 31 Dec | | |
| – derivatives | 2,811 | | 4,698 | |
| – designated and otherwise mandatorily measured at fair value through profit or loss | 51,408 | | 65,253 | |
| Liabilities at 31 Dec | | |
| – designated at fair value | 32,418 | | 25,664 | |
| – derivatives | 1,220 | | 3,060 | |
| | | | | |
| 13 | Fair values of financial instruments not carried at fair value |
| | | | | | | | | | | | | | | | | |
| Fair values of financial instruments not carried at fair value and bases of valuation |
| | Fair value |
| Carrying
amount | Quoted market
price Level 1 | Observable
inputs Level 2 | Significant
unobservable
inputs Level 3 | Total |
| $m | $m | $m | $m | $m |
| At 31 Dec 2021 | | | | | |
| Assets | | | | | |
| Loans and advances to banks | 83,136 | | — | | 82,220 | | 1,073 | | 83,293 | |
| Loans and advances to customers | 1,045,814 | | — | | 10,287 | | 1,034,288 | | 1,044,575 | |
| Reverse repurchase agreements – non-trading | 241,648 | | — | | 241,531 | | 121 | | 241,652 | |
| Financial investments – at amortised cost | 97,302 | | 38,722 | | 63,022 | | 523 | | 102,267 | |
| | | | | |
| Liabilities | | | | | |
| Deposits by banks | 101,152 | | — | | 101,149 | | — | | 101,149 | |
| Customer accounts | 1,710,574 | | — | | 1,710,733 | | — | | 1,710,733 | |
| Repurchase agreements – non-trading | 126,670 | | — | | 126,670 | | — | | 126,670 | |
| Debt securities in issue | 78,557 | | — | | 78,754 | | 489 | | 79,243 | |
| Subordinated liabilities | 20,487 | | — | | 26,206 | | — | | 26,206 | |
| | | | | |
| At 31 Dec 2020 | | | | | |
| Assets | | | | | |
| Loans and advances to banks | 81,616 | | — | | 80,457 | | 1,339 | | 81,796 | |
| Loans and advances to customers | 1,037,987 | | — | | 9,888 | | 1,025,573 | | 1,035,461 | |
| Reverse repurchase agreements – non-trading | 230,628 | | — | | 230,330 | | 272 | | 230,602 | |
| Financial investments – at amortised cost | 88,639 | | 28,722 | | 67,572 | | 507 | | 96,801 | |
| | | | | |
| Liabilities | | | | | |
| Deposits by banks | 82,080 | | — | | 81,996 | | — | | 81,996 | |
| Customer accounts | 1,642,780 | | — | | 1,642,988 | | 143 | | 1,643,131 | |
| Repurchase agreements – non-trading | 111,901 | | 3 | | 111,898 | | — | | 111,901 | |
| Debt securities in issue | 95,492 | | — | | 96,371 | | 657 | | 97,028 | |
| Subordinated liabilities | 21,951 | | — | | 28,552 | | — | | 28,552 | |
| | | | | |
Other financial instruments not carried at fair value are typically short term in nature and reprice to current market rates frequently. Accordingly, their carrying amount is a reasonable approximation of fair value. They include cash and balances at central banks, items in the course of collection from and transmission to other banks, Hong Kong Government certificates of indebtedness and Hong Kong currency notes in circulation, all of which are measured at amortised cost.
Valuation
Fair value is an estimate of the price that would be received to sell an asset or paid to transfer a liability in an orderly transaction between market participants at the measurement date. It does not reflect the economic benefits and costs that HSBC expects to flow from an instrument’s cash flow over its expected future life. Our valuation methodologies and assumptions in determining fair values for which no observable market prices are available may differ from those of other companies.
Loans and advances to banks and customers
To determine the fair value of loans and advances to banks and customers, loans are segregated, as far as possible, into portfolios of similar characteristics. Fair values are based on observable market transactions, when available. When they are unavailable, fair values are estimated using valuation models incorporating a range of input assumptions. These assumptions may include: value estimates from third-party brokers reflecting over-the-counter trading activity; forward-looking discounted cash flow models, taking account of expected
customer prepayment rates, using assumptions that HSBC believes are consistent with those that would be used by market participants in valuing such loans; new business rates estimates for similar loans; and trading inputs from other market participants including observed primary and secondary trades. From time to time, we may engage a third-party valuation specialist to measure the fair value of a pool of loans.
The fair value of loans reflects expected credit losses at the balance sheet date and estimates of market participants’ expectations of credit losses over the life of the loans, and the fair value effect of repricing between origination and the balance sheet date. For credit-impaired loans, fair value is estimated by discounting the future cash flows over the time period they are expected to be recovered.
Financial investments
The fair values of listed financial investments are determined using bid market prices. The fair values of unlisted financial investments are determined using valuation techniques that incorporate the prices and future earnings streams of equivalent quoted securities.
Deposits by banks and customer accounts
The fair values of on-demand deposits are approximated by their carrying value. For deposits with longer-term maturities, fair values are estimated using discounted cash flows, applying current rates offered for deposits of similar remaining maturities.
Debt securities in issue and subordinated liabilities
Fair values in debt securities in issue and subordinated liabilities are determined using quoted market prices at the balance sheet date where available, or by reference to quoted market prices for similar instruments.
Repurchase and reverse repurchase agreements – non-trading
Fair values of repurchase and reverse repurchase agreements that are held on a non-trading basis provide approximate carrying amounts. This is due to the fact that balances are generally short dated.
HSBC Holdings
The methods used by HSBC Holdings to determine fair values of financial instruments for the purposes of measurement and disclosure are described above.
| | | | | | | | | | | | | | |
| Fair values of HSBC Holdings’ financial instruments not carried at fair value on the balance sheet |
| 2021 | 2020 |
| Carrying amount | Fair value1 | Carrying amount | Fair value1 |
| $m | $m | $m | $m |
| Assets at 31 Dec | | | | |
| Loans and advances to HSBC undertakings | 25,108 | | 25,671 | | 10,443 | | 10,702 | |
| Financial investments – at amortised cost | 26,194 | | 26,176 | | 17,485 | | 17,521 | |
| Liabilities at 31 Dec | | | | |
| Amounts owed to HSBC undertakings | 111 | | 111 | | 330 | | 330 | |
| Debt securities in issue | 67,483 | | 69,719 | | 64,029 | | 67,706 | |
| Subordinated liabilities | 17,059 | | 21,066 | | 17,916 | | 22,431 | |
1 Fair values (other than Level 1 financial investments) were determined using valuation techniques with observable inputs (Level 2).
| | | | | |
| 14 | Financial assets designated and otherwise mandatorily measured at fair value through profit or loss |
| | | | | | | | | | | | | | | | | | | | |
| 2021 | | 2020 | |
| Designated at fair value | Mandatorily measured at fair value | Total | Designated at fair value | Mandatorily measured at fair value | Total |
| $m | $m | $m | $m | $m | $m |
| Securities | 2,251 | | 42,062 | | 44,313 | | 2,492 | | 39,088 | | 41,580 | |
| – treasury and other eligible bills | 599 | | 31 | | 630 | | 635 | | 26 | | 661 | |
| – debt securities | 1,652 | | 5,177 | | 6,829 | | 1,857 | | 5,250 | | 7,107 | |
| – equity securities | — | | 36,854 | | 36,854 | | — | | 33,812 | | 33,812 | |
| Loans and advances to banks and customers | — | | 4,307 | | 4,307 | | — | | 2,988 | | 2,988 | |
| Other | — | | 1,184 | | 1,184 | | — | | 985 | | 985 | |
| At 31 Dec | 2,251 | | 47,553 | | 49,804 | | 2,492 | | 43,061 | | 45,553 | |
Notes on the financial statements
| | | | | | | | | | | | | | | | | | | | | | | | | | |
| Notional contract amounts and fair values of derivatives by product contract type held by HSBC |
| Notional contract amount | Fair value – Assets | Fair value – Liabilities |
| Trading | Hedging | Trading | Hedging | Total | Trading | Hedging | Total |
| $m | $m | $m | $m | $m | $m | $m | $m |
| Foreign exchange | 7,723,034 | | 43,839 | | 79,801 | | 1,062 | | 80,863 | | 77,670 | | 207 | | 77,877 | |
| Interest rate | 14,470,539 | | 162,921 | | 151,631 | | 1,749 | | 153,380 | | 146,808 | | 966 | | 147,774 | |
| Equities | 659,142 | | — | | 12,637 | | — | | 12,637 | | 14,379 | | — | | 14,379 | |
| Credit | 190,724 | | — | | 2,175 | | — | | 2,175 | | 3,151 | | — | | 3,151 | |
| Commodity and other | 74,159 | | — | | 1,205 | | — | | 1,205 | | 1,261 | | — | | 1,261 | |
| Gross total fair values | 23,117,598 | | 206,760 | | 247,449 | | 2,811 | | 250,260 | | 243,269 | | 1,173 | | 244,442 | |
| Offset (Note 30) | | | | | (53,378) | | | | (53,378) | |
| At 31 Dec 2021 | 23,117,598 | | 206,760 | | 247,449 | | 2,811 | | 196,882 | | 243,269 | | 1,173 | | 191,064 | |
| | | | | | | | |
| Foreign exchange | 7,606,446 | | 35,021 | | 106,696 | | 309 | | 107,005 | | 108,903 | | 1,182 | | 110,085 | |
| Interest rate | 15,240,867 | | 157,436 | | 249,204 | | 1,914 | | 251,118 | | 236,594 | | 2,887 | | 239,481 | |
| Equities | 652,288 | | — | | 14,043 | | — | | 14,043 | | 15,766 | | — | | 15,766 | |
| Credit | 269,401 | | — | | 2,590 | | — | | 2,590 | | 3,682 | | — | | 3,682 | |
| Commodity and other | 120,259 | | — | | 2,073 | | — | | 2,073 | | 3,090 | | — | | 3,090 | |
| Gross total fair values | 23,889,261 | | 192,457 | | 374,606 | | 2,223 | | 376,829 | | 368,035 | | 4,069 | | 372,104 | |
| Offset (Note 30) | | | | | (69,103) | | | | (69,103) | |
| At 31 Dec 2020 | 23,889,261 | | 192,457 | | 374,606 | | 2,223 | | 307,726 | | 368,035 | | 4,069 | | 303,001 | |
The notional contract amounts of derivatives held for trading purposes and derivatives designated in hedge accounting relationships indicate the nominal value of transactions outstanding at the balance sheet date. They do not represent amounts at risk.
Derivative assets and liabilities decreased during 2021, driven by yield curve movements and changes in foreign exchange rates.
| | | | | | | | | | | | | | | | | | | | | | | | | | |
| Notional contract amounts and fair values of derivatives by product contract type held by HSBC Holdings with subsidiaries |
| Notional contract amount | Assets | Liabilities |
| Trading | Hedging | Trading | Hedging | Total | Trading | Hedging | Total |
| $m | $m | $m | $m | $m | $m | $m | $m |
| Foreign exchange | 36,703 | | — | | 384 | | — | | 384 | | 377 | | — | | 377 | |
| Interest rate | 35,970 | | 45,358 | | 712 | | 1,715 | | 2,427 | | 769 | | 74 | | 843 | |
| At 31 Dec 2021 | 72,673 | | 45,358 | | 1,096 | | 1,715 | | 2,811 | | 1,146 | | 74 | | 1,220 | |
| | | | | | | | |
| Foreign exchange | 23,413 | | — | | 506 | | — | | 506 | | 870 | | — | | 870 | |
| Interest rate | 47,569 | | 34,006 | | 966 | | 3,221 | | 4,187 | | 2,176 | | 8 | | 2,184 | |
| At 31 Dec 2020 | 70,982 | | 34,006 | | 1,472 | | 3,221 | | 4,693 | | 3,046 | | 8 | | 3,054 | |
Use of derivatives
For details regarding the use of derivatives, see page 243 under ‘Market risk’.
Trading derivatives
Most of HSBC’s derivative transactions relate to sales and trading activities. Sales activities include the structuring and marketing of derivative products to customers to enable them to take, transfer, modify or reduce current or expected risks. Trading activities include market-making and risk management. Market-making entails quoting bid and offer prices to other market participants for the purpose of generating revenue based on spread and volume. Risk management activity is undertaken to manage the risk arising from client transactions, with the principal purpose of retaining client margin. Other derivatives classified as held for trading include non-qualifying hedging derivatives.
Substantially all of HSBC Holdings’ derivatives entered into with subsidiaries are managed in conjunction with financial liabilities designated at fair value.
Derivatives valued using models with unobservable inputs
The difference between the fair value at initial recognition (the transaction price) and the value that would have been derived had valuation techniques used for subsequent measurement been applied at initial recognition, less subsequent releases, is as shown in the following table:
| | | | | | | | |
| Unamortised balance of derivatives valued using models with significant unobservable inputs |
| 2021 | 2020 |
| $m | $m |
| Unamortised balance at 1 Jan | 104 | | 73 | |
| Deferral on new transactions | 311 | | 232 | |
| Recognised in the income statement during the year: | (308) | | (205) | |
| – amortisation | (177) | | (116) | |
| – subsequent to unobservable inputs becoming observable | (4) | | (4) | |
| – maturity, termination or offsetting derivative | (127) | | (85) | |
| | |
| Exchange differences | (1) | | 4 | |
| Other | — | | — | |
Unamortised balance at 31 Dec1 | 106 | | 104 | |
1This amount is yet to be recognised in the consolidated income statement.
Hedge accounting derivatives
HSBC applies hedge accounting to manage the following risks: interest rate and foreign exchange risks. Further details on how these risks arise and how they are managed by the Group can be found in the ‘Risk review’.
Fair value hedges
HSBC enters into fixed-for-floating-interest-rate swaps to manage the exposure to changes in fair value caused by movements in market interest rates on certain fixed-rate financial instruments that are not measured at fair value through profit or loss, including debt securities held and issued.
| | | | | | | | | | | | | | | | | |
| HSBC hedging instrument by hedged risk |
| Hedging instrument |
|
| Carrying amount | |
|
| Notional amount1 | Assets | Liabilities | Balance sheet presentation | Change in fair value2 |
| Hedged risk | $m | $m | $m | $m |
Interest rate3 | 90,556 | | 1,637 | | 1,410 | | Derivatives | 1,330 | |
| At 31 Dec 2021 | 90,556 | | 1,637 | | 1,410 | | | 1,330 | |
| | | | | | | | | | | | | | | | | |
|
| |
| | | | |
| | | | | |
| | | | | |
| | | | | |
Interest rate3 | 121,573 | | 1,675 | | 3,761 | | Derivatives | (1,894) | |
| At 31 Dec 2020 | 121,573 | | 1,675 | | 3,761 | | | (1,894) | |
1The notional contract amounts of derivatives designated in qualifying hedge accounting relationships indicate the nominal value of transactions outstanding at the balance sheet date. They do not represent amounts at risk.
2Used in effectiveness testing, which uses the full fair value change of the hedging instrument not excluding any component.
3The hedged risk ‘interest rate’ includes inflation risk.
| | | | | | | | | | | | | | | | | | | | | | | | | | |
| HSBC hedged item by hedged risk |
| Hedged item | Ineffectiveness |
| Carrying amount | Accumulated fair value hedge adjustments included in carrying amount2 | Change in fair value1 | Recognised in profit and loss | |
| Assets | Liabilities | Assets | Liabilities | Balance sheet presentation | Profit and loss presentation |
| Hedged risk | $m | $m | $m | $m | $m | $m |
Interest rate3 | 68,059 | | | 1,199 | | | Financial assets designated and otherwise mandatorily measured at fair value through other comprehensive income
| (1,932) | | (36) | | Net income from financial instruments held for trading or managed on a fair value basis
|
| 2 | | | (3) | | | Loans and advances to banks | (3) | |
| 3,066 | | | 9 | | | Loans and advances to customers | (41) | |
| 14,428 | | | 992 | | Debt securities in issue | 609 | |
| 86 | | | 1 | | Deposits by banks | 1 | |
| At 31 Dec 2021 | 71,127 | | 14,514 | | 1,205 | | 993 | | | (1,366) | | (36) | | |
| | | | | | | | | | | | | | | | | | | | | | | | | | |
|
| | |
| | | | | |
| | | | | | |
| | | | | | |
Interest rate3 | 102,260 | | | 3,392 | | | Financial assets designated and otherwise mandatorily measured at fair value through other comprehensive income | 2,456 | | (11) | | Net income from financial instruments held for trading or managed on a fair value basis |
| 6 | | | 3 | | | Loans and advances to banks | 1 | |
| 2,280 | | | 56 | | | Loans and advances to customers | 21 | |
| 12,148 | | | 1,620 | | Debt securities in issue | (613) | |
| 89 | | | 3 | | Deposits by banks | 18 | | |
| At 31 Dec 2020 | 104,546 | | 12,237 | | 3,451 | | 1,623 | | | 1,883 | | (11) | | |
1Used in effectiveness testing, which comprise an amount attributable to the designated hedged risk that can be a risk component.
2The accumulated amount of fair value adjustments remaining in the statement of financial position for hedged items that have ceased to be adjusted for hedging gains and losses were assets of $1,061m for FVOCI assets and assets of $15m for debt issued.
3The hedged risk ‘interest rate’ includes inflation risk.
Notes on the financial statements
| | | | | | | | | | | | | | | | | |
| HSBC Holdings hedging instrument by hedged risk |
| Hedging instrument |
| | Carrying amount | | |
| Notional amount1,4 | Assets | Liabilities | Balance sheet presentation | Change in fair value2 |
| Hedged risk | $m | $m | $m | $m |
Interest rate3 | 45,358 | | 1,715 | | 74 | | Derivatives | (1,515) | |
| At 31 Dec 2021 | 45,358 | | 1,715 | | 74 | | | (1,515) | |
| | | | | |
Interest rate3 | 34,006 | | 3,221 | | 8 | | Derivatives | 1,927 | |
| At 31 Dec 2020 | 34,006 | | 3,221 | | 8 | | | 1,927 | |
1The notional contract amounts of derivatives designated in qualifying hedge accounting relationships indicate the nominal value of transactions outstanding at the balance sheet date; they do not represent amounts at risk.
2Used in effectiveness testing; comprising the full fair value change of the hedging instrument not excluding any component.
3The hedged risk ‘interest rate’ includes foreign exchange risk.
4The notional amount of non-dynamic fair value hedges is equal to $45,358m, of which the weighted-average maturity date is January 2028 and the weighted-average swap rate is 1.30%. The majority of these hedges are internal to the Group.
| | | | | | | | | | | | | | | | | | | | | | | | | | |
| HSBC Holdings hedged item by hedged risk |
| Hedged item | Ineffectiveness |
| Carrying amount | Accumulated fair value hedge adjustments included in carrying amount2 | | Change in fair value1 | Recognised in
profit and loss | |
| Assets | Liabilities | Assets | Liabilities | Balance sheet presentation | Profit and loss
presentation |
| Hedged risk | $m | $m | $m | $m | $m | $m |
Interest rate3 | | 39,154 | | | 1,408 | | Debt securities in issue | 1,599 | | (21) | | Net income from financial instruments held for trading or managed on a fair value basis |
| 7,863 | | | (104) | | | Loans and Advances to banks | (104) | | |
| At 31 Dec 2021 | 7,863 | | 39,154 | | (104) | | 1,408 | | | 1,495 | | (21) | | |
| | | | | | | | |
Interest rate3 | | 37,338 | | | 3,027 | | Debt securities
in issue | (1,910) | | 17 | | Net income from financial instruments held for trading or managed on a fair value basis |
| | | | Loans and Advances to banks | | |
| At 31 Dec 2020 | — | | 37,338 | | — | | 3,027 | | | (1,910) | | 17 | | |
1Used in effectiveness testing; comprising amount attributable to the designated hedged risk that can be a risk component.
2The accumulated amount of fair value adjustments remaining in the statement of financial position for hedged items that have ceased to be adjusted for hedging gains and losses were liabilities of $54.4m for debt issued.
3The hedged risk ‘interest rate’ includes foreign exchange risk.
Sources of hedge ineffectiveness may arise from basis risk, including but not limited to the discount rates used for calculating the fair value of derivatives, hedges using instruments with a non-zero fair value, and notional and timing differences between the hedged items and hedging instruments.
For some debt securities held, HSBC manages interest rate risk in a dynamic risk management strategy. The assets in scope of this strategy are high-quality fixed-rate debt securities, which may be sold to meet liquidity and funding requirements.
The interest rate risk of the HSBC fixed-rate debt securities issued is managed in a non-dynamic risk management strategy.
Cash flow hedges
HSBC’s cash flow hedging instruments consist principally of interest rate swaps and cross-currency swaps that are used to manage the variability in future interest cash flows of non-trading financial assets and liabilities, arising due to changes in market interest rates and foreign-currency basis.
HSBC applies macro cash flow hedging for interest rate risk exposures on portfolios of replenishing current and forecasted issuances of non-trading assets and liabilities that bear interest at variable rates, including rolling such instruments. The amounts and timing of future cash flows, representing both principal and interest flows, are projected for each portfolio of financial assets and liabilities on the basis of their contractual terms and other relevant factors, including estimates of prepayments and defaults. The aggregate cash flows representing both principal balances and interest cash flows across all portfolios are used to determine the effectiveness and ineffectiveness. Macro cash flow hedges are considered to be dynamic hedges.
HSBC also hedges the variability in future cash flows on foreign-denominated financial assets and liabilities arising due to changes in foreign exchange market rates with cross-currency swaps, which are considered dynamic hedges.
| | | | | | | | | | | | | | | | | | | | | | | | | | |
| Hedging instrument by hedged risk | | | |
| Hedging instrument | Hedged item | Ineffectiveness |
| | Carrying amount | | Change in fair value2 | Change in fair value3 | Recognised in profit and loss | Profit and loss presentation |
| Notional amount1 | Assets | Liabilities | Balance sheet presentation |
| Hedged risk | $m | $m | $m | $m | $m | $m |
| Foreign currency | 17,930 | | 827 | | 207 | | Derivatives | 987 | | 987 | | — | | Net income from
financial instruments
held for trading or
managed on a fair
value basis |
| Interest rate | 72,365 | | 112 | | 217 | | Derivatives | (519) | | (500) | | (19) | |
| At 31 Dec 2021 | 90,295 | | 939 | | 424 | | | 468 | | 487 | | (19) | | |
| | | | | | | | | | | | | | | | | | | | | | | | | | |
|
| | | |
| | | | | |
| | | | |
| | | | | | |
| Foreign currency | 24,506 | | 309 | | 448 | | Derivatives | (630) | | (630) | | — | | Net income from financial instruments held for trading or managed on a fair value basis |
| Interest rate | 35,863 | | 239 | | 2 | | Derivatives | 519 | | 514 | | 5 | |
| At 31 Dec 2020 | 60,369 | | 548 | | 450 | | | (111) | | (116) | | 5 | | |
1The notional contract amounts of derivatives designated in qualifying hedge accounting relationships indicate the nominal value of transactions outstanding at the balance sheet date. They do not represent amounts at risk.
2Used in effectiveness testing; comprising the full fair value change of the hedging instrument not excluding any component.
3Used in effectiveness assessment; comprising amount attributable to the designated hedged risk that can be a risk component.
Sources of hedge ineffectiveness may arise from basis risk, including but not limited to timing differences between the hedged items and hedging instruments and hedges using instruments with a non-zero fair value.
| | | | | | | | | |
| Reconciliation of equity and analysis of other comprehensive income by risk type | |
| Interest rate | Foreign currency | |
| $m | $m | |
| Cash flow hedging reserve at 1 Jan 2021 | 495 | | (37) | | |
| Fair value gains/(losses) | (500) | | 987 | | |
| Fair value (gains)/losses reclassified from the cash flow hedge reserve to the income statement in respect of: | | | |
| Hedged items that have affected profit or loss | (217) | | (1,177) | | |
| | | |
| | | |
| Income taxes | 185 | | 25 | | |
| Others | 45 | | (3) | | |
| Cash flow hedging reserve at 31 Dec 2021 | 8 | | (205) | | |
| | | | | | | | |
|
| | |
| | |
| | |
| Cash flow hedging reserve at 1 Jan 2020 | 204 | | (205) | |
| Fair value gains/(losses) | 514 | | (630) | |
| Fair value (gains)/losses reclassified from the cash flow hedge reserve to the income statement in respect of: | | |
| Hedged items that have affected profit or loss | (107) | | 822 | |
| | |
| | |
| Income taxes | (79) | | (23) | |
| Others | (37) | | (1) | |
| Cash flow hedging reserve at 31 Dec 2020 | 495 | | (37) | |
Net investment hedges
The Group applies hedge accounting in respect of certain net investments in non-US dollar functional currency foreign operations for changes in spot exchange rates only. Hedging could be undertaken for Group structural exposure to changes in the US dollar to foreign currency exchange rates using forward foreign exchange contracts or by financing with foreign currency borrowings. The aggregate positions at the reporting date and the performance indicators of both live and de-designated hedges are summarised below. There were no amounts reclassified to the profit and loss account during the accounting periods presented.
| | | | | | | | | | | | | | | | | |
| Hedges of net investment in foreign operations |
| Carrying value | Nominal
amount | Amounts recognised in OCI | Hedge ineffectiveness recognised in income statement |
| Derivative
assets | Derivative liabilities |
| Description of hedged risk | $m | $m | $m | $m | $m |
| 2021 | | | | | |
| Pound sterling-denominated structural foreign exchange | 229 | | — | | 15,717 | | (126) | | — | |
| Swiss franc-denominated structural foreign exchange | — | | (8) | | 809 | | 101 | | — | |
| Hong Kong dollar-denominated structural foreign exchange | 7 | | — | | 4,992 | | 5 | | — | |
Other structural foreign exchange1 | 7 | | — | | 4,387 | | 6 | | — | |
| Total | 243 | | (8) | | 25,905 | | (14) | | — | |
| | | | | |
| 2020 | | | | | |
| Pound sterling-denominated structural foreign exchange | — | | 733 | | 10,500 | | (167) | | — | |
| Swiss franc-denominated structural foreign exchange | — | | — | | — | | 111 | | — | |
| Hong Kong dollar-denominated structural foreign exchange | — | | — | | — | | — | | — | |
Other structural foreign exchange1 | — | | — | | — | | — | | — | |
| Total | — | | 733 | | 10,500 | | (56) | | — | |
1 Other currencies include New Taiwan dollar, Singapore dollar, Canadian dollar, Omani rial, South Korean won and United Arab Emirates dirham.
Notes on the financial statements
Interest rate benchmark reform: Amendments to IFRS 9 and IAS 39 ‘Financial Instruments’
HSBC has applied both the first set of amendments (‘Phase 1’) and the second set of amendments (‘Phase 2’) to IFRS 9 and IAS 39 applicable to hedge accounting. The hedge accounting relationships that are affected by Phase 1 and Phase 2 amendments are presented in the balance sheet as ‘Financial assets designated and otherwise mandatorily measured at fair value through other comprehensive income’, ‘Loans and advances to customers’, ‘Debt securities in issue’ and ‘Deposits by banks’. The notional value of the derivatives impacted by the Ibor reform, including those designated in hedge accounting relationships, is disclosed on page 151 in the section ‘Financial instruments impacted by the Ibor reform’. For further details on Ibor transition, see 'Top and emerging risks' on page 150.
During 2021, the Group transitioned all of its hedging instruments referencing sterling Libor, European Overnight Index Average rate (‘Eonia’) and Japanese yen Libor. The Group also transitioned some of the hedging instruments referencing US dollar Libor. There is no significant judgement applied for these benchmarks to determine whether and when the transition uncertainty has been resolved.
The most significant Ibor benchmark in which the Group continues to have hedging instruments is US dollar Libor. It is expected that the transition out of US dollar Libor hedging derivatives will be largely completed by the end of 2022. These transitions do not necessitate new approaches compared with any of the mechanisms used so far for transition and it will not be necessary to change the transition risk management strategy.
For some of the Ibors included under the ‘Other’ header in the table below, judgement has been needed to establish whether a transition is required, since there are Ibor benchmarks that are subject to computation methodology improvements and insertion of fallback provisions without full clarity being provided by their administrators on whether these Ibor benchmarks will be demised.
The notional amounts of interest rate derivatives designated in hedge accounting relationships do not represent the extent of the risk exposure managed by the Group but they are expected to be directly affected by market-wide Ibor reform and in scope of Phase 1 amendments and are shown in the table below. The cross-currency swaps designated in hedge accounting relationships and affected by Ibor reform are not significant and have not been presented below.
| | | | | | | | | | | | | | | | | | | | | | | |
| Hedging instrument impacted by Ibor reform |
| Hedging instrument |
| Impacted by Ibor reform | Not impacted by Ibor reform | Notional amount1 |
| €2 | £ | $ | Other3 | Total |
| $m | $m | $m | $m | $m | $m | $m |
| Fair value hedges | 6,178 | | — | | 18,525 | | 6,615 | | 31,318 | | 59,238 | | 90,556 | |
| Cash flow hedges | 7,954 | | — | | 100 | | 8,632 | | 16,686 | | 55,679 | | 72,365 | |
| At 31 Dec 2021 | 14,132 | | — | | 18,625 | | 15,247 | | 48,004 | | 114,917 | | 162,921 | |
| | | | | | | |
| Fair value hedges | 17,792 | | 3,706 | | 32,789 | | 10,128 | | 64,415 | | 57,157 | | 121,572 | |
| Cash flow hedges | 8,344 | | 2,522 | | 8,705 | | 6,797 | | 26,368 | | 9,495 | | 35,863 | |
| At 31 Dec 2020 | 26,136 | | 6,228 | | 41,494 | | 16,925 | | 90,783 | | 66,652 | | 157,435 | |
1The notional contract amounts of interest rate derivatives designated in qualifying hedge accounting relationships indicate the nominal value of transactions outstanding at the balance sheet date and they do not represent amounts at risk.
2The notional contract amounts of euro interest rate derivatives impacted by Ibor reform mainly comprise hedges with a Euribor benchmark, which are ‘Fair value hedges’ of $6,178m (31 December 2020: $6,000m) and ‘Cash flow hedges’ of $7,954m (31 December 2020: $8,344m).
3Other benchmarks impacted by Ibor reform comprise mainly of Canadian dollar offered rate (‘CDOR’), Hong Kong interbank offered rate (‘HIBOR’) and Mexican interbank equilibrium interest rate (‘TIIE’) related derivatives.
| | | | | | | | | | | | | | | | | | | | | | | |
| Hedging instrument impacted by Ibor reform held by HSBC Holdings |
| Hedging instrument |
| Impacted by Ibor reform | Not impacted by Ibor reform | Notional amount |
| € | £ | $ | Other | Total |
| $m | $m | $m | $m | $m | $m | $m |
| Fair value hedges | 9,944 | | — | | 20,035 | | 1,458 | | 31,437 | | 13,921 | | 45,358 | |
| At 31 Dec 2021 | 9,944 | | — | | 20,035 | | 1,458 | | 31,437 | | 13,921 | | 45,358 | |
| | | | | | | |
| Fair value hedges | 4,290 | | 5,393 | | 21,081 | | 3,242 | | 34,006 | | — | | 34,006 | |
| At 31 Dec 2020 | 4,290 | | 5,393 | | 21,081 | | 3,242 | | 34,006 | | — | | 34,006 | |
| | | | | | | | |
| Carrying amount of financial investments |
| 2021 | 2020 |
| $m | $m |
| Financial investments measured at fair value through other comprehensive income | 348,972 | | 402,054 | |
| – treasury and other eligible bills | 100,158 | | 118,163 | |
| – debt securities | 246,998 | | 281,467 | |
| – equity securities | 1,770 | | 2,337 | |
| – other instruments | 46 | | 87 | |
| Debt instruments measured at amortised cost | 97,302 | | 88,639 | |
| – treasury and other eligible bills | 21,634 | | 11,757 | |
| – debt securities | 75,668 | | 76,882 | |
| At 31 Dec | 446,274 | | 490,693 | |
| | | | | | | | | | | |
| Equity instruments measured at fair value through other comprehensive income | | | |
| Fair value | Dividends recognised | | | |
| Type of equity instruments | $m | $m | | | |
| Investments required by central institutions | 766 | | 17 | | | | |
| Business facilitation | 954 | | 24 | | | | |
| | | | | |
| | | | | |
| Others | 50 | | 3 | | | | |
| At 31 Dec 2021 | 1,770 | | 44 | | | | |
| | | | | |
| Investments required by central institutions | 904 | | 22 | | | | |
| Business facilitation | 1,387 | | 22 | | | | |
| | | | | |
| | | | | |
| Others | 46 | | 3 | | | | |
| At 31 Dec 2020 | 2,337 | | 47 | | | | |
| | | | | | | | | | | | | | | | | | |
| Weighted average yields of investment debt securities |
| | Up to 1
year | | 1 to 5
years | | 5 to 10 years | | Over 10 years |
| | Yield | | Yield | | Yield | | Yield |
| | % | | % | | % | | % |
| Debt securities measured at fair value through other comprehensive income | | | | | | | | |
| US Treasury | | 1.2 | | | 1.5 | | | 1.3 | | | 2.1 | |
| US Government agencies | | 0.2 | | | 1.2 | | | 2.8 | | | 1.9 | |
| US Government-sponsored agencies | | 1.0 | | | 1.6 | | | 2.3 | | | 1.6 | |
| UK Government | | 2.5 | | | 0.5 | | | 0.7 | | | 2.6 | |
| Hong Kong Government | | 0.4 | | | 0.9 | | | 2.2 | | | — | |
| Other governments | | 2.0 | | | 2.5 | | | 2.2 | | | 3.7 | |
| Asset-backed securities | | 9.3 | | | 0.7 | | | 1.1 | | | 0.5 | |
| Corporate debt and other securities | | 2.3 | | | 1.3 | | | 2.4 | | | 3.1 | |
| | | | | | | | |
| | | | | | | | |
| Debt securities measured at amortised cost | | | | | | | | |
| US Treasury | | 0.7 | | | 1.3 | | | 5.9 | | | 2.9 | |
| US Government agencies | | 3.8 | | | 8.2 | | | 5.4 | | | 2.5 | |
| US Government-sponsored agencies | | 2.7 | | | 2.8 | | | 2.3 | | | 3.3 | |
| | | | | | | | |
| Hong Kong Government | | 2.0 | | | 3.8 | | | 2.1 | | | 4.8 | |
| Other governments | | 3.0 | | | 3.9 | | | 3.3 | | | 3.9 | |
| Asset-backed securities | | — | | | — | | | — | | | 7.5 | |
| Corporate debt and other securities | | 3.4 | | | 3.3 | | | 3.7 | | | 3.3 | |
| | | | | | | | |
| | | | | | | | |
The maturity distributions of ABSs are presented in the above table on the basis of contractual maturity dates. The weighted average yield for each range of maturities is calculated by dividing the annualised interest income for the year ended 31 December 2021 by the book amount of debt securities at that date. The yields do not include the effect of related derivatives.
HSBC Holdings
| | | | | | | | |
| HSBC Holdings carrying amount of financial investments |
| 2021 | 2020 |
| $m | $m |
| Debt instruments measured at amortised cost | | |
| – treasury and other eligible bills | 19,508 | | 10,941 | |
| – debt securities | 6,686 | | 6,544 | |
| At 31 Dec | 26,194 | | 17,485 | |
| | | | | | | | | | | | | | | | | | |
| Weighted average yields of investment debt securities |
| | Up to 1
year | | 1 to 5
years | | 5 to 10 years | | Over 10 years |
| | Yield | | Yield | | Yield | | Yield |
| | % | | % | | % | | % |
| Debt securities measured at amortised cost | | | | | | | | |
| US Treasury | | 0.3 | | | 0.3 | | | — | | | — | |
| | | | | | | | |
| | | | | | | | |
| | | | | | | | |
| | | | | | | | |
The weighted average yield for each range of maturities is calculated by dividing the annualised interest income for the year ended 31 December 2021 by the book amount of debt securities at that date. The yields do not include the effect of related derivatives.
Notes on the financial statements
| | | | | |
| 17 | Assets pledged, collateral received and assets transferred |
Assets pledged
| | | | | | | | |
| Financial assets pledged as collateral |
| 2021 | 2020 |
| $m | $m |
| Treasury bills and other eligible securities | 9,613 | | 12,774 | |
| Loans and advances to banks | 412 | | 236 | |
| Loans and advances to customers | 55,370 | | 43,168 | |
| Debt securities | 66,629 | | 67,312 | |
| Equity securities | 34,472 | | 26,101 | |
| Other | 45,396 | | 60,810 | |
| Assets pledged at 31 Dec | 211,892 | | 210,401 | |
Assets pledged as collateral include all assets categorised as encumbered in the disclosure on page 79 of the Pillar 3 Disclosures at 31 December 2021.
The amount of assets pledged to secure liabilities may be greater than the book value of assets utilised as collateral. For example, in the case of securitisations and covered bonds, the amount of liabilities issued plus mandatory over-collateralisation is less than the book value of the pool of assets available for use as collateral. This is also the case where assets are placed with a custodian or a settlement agent that has a floating charge over all the assets placed to secure any liabilities under settlement accounts.
These transactions are conducted under terms that are usual and customary for collateralised transactions including, where relevant, standard securities lending and borrowing, repurchase agreements and derivative margining. HSBC places both cash and non-cash collateral in relation to derivative transactions.
Hong Kong currency notes in circulation are secured by the deposit of funds in respect of which the Hong Kong Government certificates of indebtedness are held.
| | | | | | | | |
| Financial assets pledged as collateral which the counterparty has the right to sell or repledge |
| 2021 | 2020 |
| $m | $m |
| Trading assets | 69,719 | | 64,225 | |
| | |
| Financial investments | 12,416 | | 16,915 | |
| At 31 Dec | 82,135 | | 81,140 | |
Collateral received
The fair value of assets accepted as collateral relating primarily to standard securities lending, reverse repurchase agreements, swaps of securities and derivative margining that HSBC is permitted to sell or repledge in the absence of default was $476,455m (2020: $447,101m). The fair value of any such collateral sold or repledged was $271,582m (2020: $246,520m).
HSBC is obliged to return equivalent securities. These transactions are conducted under terms that are usual and customary to standard securities lending, reverse repurchase agreements and derivative margining.
Assets transferred
The assets pledged include transfers to third parties that do not qualify for derecognition, notably secured borrowings such as debt securities held by counterparties as collateral under repurchase agreements and equity securities lent under securities lending agreements, as well as swaps of equity and debt securities. For secured borrowings, the transferred asset collateral continues to be recognised in full while a related liability, reflecting the Group’s obligation to repurchase the assets for a fixed price at a future date, is also recognised on the balance sheet. Where securities are swapped, the transferred asset continues to be recognised in full. There is no associated liability as the non-cash collateral received is not recognised on the balance sheet. The Group is unable to use, sell or pledge the transferred assets for the duration of the transaction, and remains exposed to interest rate risk and credit risk on these pledged assets. With the exception of ‘Other sales’ in the following table, the counterparty’s recourse is not limited to the transferred assets.
| | | | | | | | | | | | | | | | | |
| Transferred financial assets not qualifying for full derecognition and associated financial liabilities |
| Carrying amount of: | Fair value of: | |
| Transferred
assets | Associated
liabilities | Transferred
assets | Associated
liabilities | Net
position |
| $m | $m | $m | $m | $m |
| At 31 Dec 2021 | | | | | |
| Repurchase agreements | 51,135 | | 48,180 | | 0 | 0 | 0 |
| Securities lending agreements | 43,644 | | 2,918 | | 0 | 0 | 0 |
| Other sales (recourse to transferred assets only) | 3,826 | | 3,826 | | 3,830 | | 3,842 | | (12) | |
| | | | | |
| At 31 Dec 2020 | | | | | |
| Repurchase agreements | 52,413 | | 51,092 | | 0 | 0 | 0 |
| Securities lending agreements | 38,364 | | 124 | | 0 | 0 | 0 |
| Other sales (recourse to transferred assets only) | 3,564 | | 3,478 | | 3,619 | | 3,564 | | 55 | |
| | | | | |
| 18 | Interests in associates and joint ventures |
| | | | | | | | |
| Carrying amount of HSBC’s interests in associates and joint ventures | | |
| 2021 | 2020 |
| $m | $m |
| Interests in associates | 29,515 | | 26,594 | |
| Interests in joint ventures | 94 | | 90 | |
| Interests in associates and joint ventures | 29,609 | | 26,684 | |
| | | | | | | | | | | | | | | | | |
| Principal associates of HSBC |
| | 2021 | 2020 |
| | Carrying amount | Fair value1 | Carrying amount | Fair value1 |
| | $m | $m | $m | $m |
| Bank of Communications Co., Limited | | 23,616 | | 8,537 | | 21,248 | | 7,457 | |
| The Saudi British Bank | | 4,426 | | 5,599 | | 4,215 | | 4,197 | |
1Principal associates are listed on recognised stock exchanges. The fair values are based on the quoted market prices of the shares held (Level 1 in the fair value hierarchy).
| | | | | | | | | | | |
| At 31 Dec 2021 |
| Country of incorporation
and principal place of
business | Principal
activity | HSBC’s
interest
% |
| Bank of Communications Co., Limited | People’s Republic of China | Banking services | 19.03 | |
| The Saudi British Bank | Saudi Arabia | Banking services | 31.00 | |
A list of all associates and joint ventures is set out in Note 38.
Bank of Communications Co., Limited
The Group’s investment in Bank of Communications Co., Limited (‘BoCom’) is classified as an associate. Significant influence in BoCom was established with consideration of all relevant factors, including representation on BoCom’s Board of Directors and participation in a resource and experience sharing agreement (‘RES’). Under the RES, HSBC staff have been seconded to assist in the maintenance of BoCom’s financial and operating policies. Investments in associates are recognised using the equity method of accounting in accordance with IAS 28, whereby the investment is initially recognised at cost and adjusted thereafter for the post-acquisition change in the Group’s share of BoCom’s net assets. An impairment test is required if there is any indication of impairment.
Impairment testing
At 31 December 2021, the fair value of the Group’s investment in BoCom had been below the carrying amount for approximately 10 years. As a result, the Group performed an impairment test on the carrying amount, which confirmed that there was no impairment at 31 December 2021 as the recoverable amount as determined by a value-in-use (‘VIU’) calculation was higher than the carrying value.
| | | | | | | | | | | | | | | | | | | | |
| At 31 Dec 2021 | At 31 Dec 2020 |
| VIU | Carrying value | Fair value | VIU | Carrying value | Fair value |
| $bn | $bn | $bn | $bn | $bn | $bn |
| BoCom | 24.8 | | 23.6 | | 8.5 | | 21.8 | | 21.2 | | 7.5 | |
Compared with 31 December 2020, the extent to which the VIU exceeds the carrying value (‘headroom’) increased by $0.6bn. The increase in headroom was principally due to the impact on the VIU from BoCom's actual performance, which was better than earlier estimates, revisions to management's best estimates of BoCom's future earnings in the short to medium term, and the net impact of revisions to certain long-term assumptions.
In future periods, the VIU may increase or decrease depending on the effect of changes to model inputs. The main model inputs are described below and are based on factors observed at period-end. The factors that could result in a change in the VIU and an impairment include a short-term underperformance by BoCom, a change in regulatory capital requirements or an increase in uncertainty regarding the future performance of BoCom resulting in a downgrade of the forecast of future asset growth or profitability. An increase in the discount rate could also result in a reduction of VIU and an impairment. At the point where the carrying value exceeds the VIU, impairment would be recognised.
If the Group did not have significant influence in BoCom, the investment would be carried at fair value rather than the current carrying value.
Basis of recoverable amount
The impairment test was performed by comparing the recoverable amount of BoCom, determined by a VIU calculation, with its carrying amount. The VIU calculation uses discounted cash flow projections based on management’s best estimates of future earnings available to ordinary shareholders prepared in accordance with IAS 36. Significant management judgement is required in arriving at the best estimate. There are two main components to the VIU calculation. The first component is management’s best estimate of BoCom’s earnings, which is based on explicit forecasts over the short to medium term. This results in forecast earnings growth that is lower than recent historical actual growth and also reflects the uncertainty arising from the current economic outlook. Reflecting management's intent to continue to retain its investment, earnings beyond the short to medium term are then extrapolated into perpetuity using a long-term growth rate to derive a terminal value, which comprises the majority of the VIU. The second component is the capital maintenance charge (‘CMC’), which is management’s forecast of the earnings that need to be withheld in order for BoCom to meet capital requirements over the forecast period, meaning that CMC is deducted when arriving at management’s estimate of future earnings available to ordinary shareholders. The principal inputs to the CMC calculation include estimates of asset growth, the ratio of risk-weighted assets to total assets and the expected capital requirements. An increase in the CMC as a result of a change to these principal inputs would reduce VIU. Additionally, management considers other qualitative factors, to ensure that the inputs to the VIU calculation remain appropriate.
Notes on the financial statements
Key assumptions in value-in-use calculation
We used a number of assumptions in our VIU calculation, in accordance with the requirements of IAS 36:
•Long-term profit growth rate: 3% (2020: 3%) for periods after 2025, which does not exceed forecast GDP growth in mainland China and is consistent with forecasts by external analysts.
•Long-term asset growth rate: 3% (2020: 3%) for periods after 2025, which is the rate that assets are expected to grow to achieve long-term profit growth of 3%.
•Discount rate: 10.03% (2020: 11.37%) based on a capital asset pricing model (‘CAPM’), using market data. The discount rate used is within the range of 8.7% to 10.1% (2020 equivalent range: 10.9% to 11.9%) indicated by the CAPM. The lower rate reflects the impact of a relative reduction in the volatility of Chinese banks’ equity prices and a decrease in mainland China’s credit risk due to its relatively quick recovery from the impact of the Covid-19 outbreak. While the CAPM range sits at the lower end of the range adopted by selected external analysts of 9.9% to 13.5% (2020: 10.3% to 15.0%), we continue to regard the CAPM range as the most appropriate basis for determining this assumption.
•Expected credit losses as a percentage of customer advances (‘ECL’): ranges from 0.98% to 1.12% (2020: 0.98% to 1.22%) in the short to medium term, reflecting reported credit experience through the ongoing Covid-19 pandemic in mainland China followed by an expected reversion to recent historical levels. For periods after 2025, the ratio is 0.97% (2020: 0.88%), which is higher than BoCom’s average ECL in recent years prior to the Covid-19 outbreak.
•Risk-weighted assets as a percentage of total assets: ranges from 61.0% to 62.4% (2020: 61.0% to 62.0%) in the short to medium term, reflecting reductions that may arise from a subsequent lowering of ECL and a continuation of the trend of strong retail loan growth. For periods after 2025, the ratio is 61.0% (2020: 61.0%). These rates are similar to BoCom’s actual results in recent years and forecasts disclosed by external analysts.
•Operating income growth rate: ranges from 5.1% to 6.2% (2020: 3.5% to 6.7%) in the short to medium term, and is lower than BoCom’s actual results in recent years and the forecasts disclosed by external analysts, reflecting BoCom’s most recent actual results, global trade tensions and industry developments in mainland China.
•Cost-income ratio: ranges from 35.5% to 36.1% (2020: 36.3% to 36.8%) in the short to medium term. These ratios are similar to BoCom's actual results in recent years and forecasts disclosed by external analysts.
•Effective tax rate (‘ETR’): ranges from 6.8% to 15.0% (2020: 7.8% to 16.5%) in the short to medium term, reflecting BoCom’s actual results and an expected increase towards the long-term assumption through the forecast period. For periods after 2025, the rate is 15.0% (2020: 16.8%), which is higher than the recent historical average, and aligned to the minimum tax rate as proposed by the OECD/G20 Inclusive Framework on Base Erosion and Profit Shifting.
•Capital requirements: capital adequacy ratio ('CAR') of 12.5% (2020: 11.5%) and tier 1 capital adequacy ratio of 9.5% (2020: 9.5%), based on BoCom’s capital risk appetite and capital requirements respectively. The CAR assumption was updated to 12.5% from 11.5% following the approval of BoCom's capital management plan in March 2021.
The following table shows the change to each key assumption in the VIU calculation that on its own would reduce the headroom to nil:
| | | | | |
| Key assumption | Changes to key assumption to reduce headroom to nil |
•Long-term profit growth rate | •Decrease by 28 basis points |
•Long-term asset growth rate | •Increase by 23 basis points |
•Discount rate | •Increase by 36 basis points |
•Expected credit losses as a percentage of customer advances | •Increase by 4 basis points |
•Risk-weighted assets as a percentage of total assets | •Increase by 194 basis points |
•Operating income growth rate | •Decrease by 39 basis points |
•Cost-income ratio | •Increase by 109 basis points |
•Long-term effective tax rate | •Increase by 322 basis points |
•Capital requirements – capital adequacy ratio | •Increase by 40 basis points |
•Capital requirements – tier 1 capital adequacy ratio | •Increase by 195 basis points |
The following table further illustrates the impact on VIU of reasonably possible changes to key assumptions. This reflects the sensitivity of the VIU to each key assumption on its own and it is possible that more than one favourable and/or unfavourable change may occur at the same time. The selected rates of reasonably possible changes to key assumptions are largely based on external analysts’ forecasts, which can change period to period.
| | | | | | | | | | | | | | | | | | | | |
| Sensitivity of VIU to reasonably possible changes in key assumptions |
| Favourable change | Unfavourable change |
| | Increase in VIU | VIU | | Decrease in VIU | VIU |
| bps | $bn | $bn | bps | $bn | $bn |
| At 31 Dec 2021 | | | | | | |
Long-term profit growth rate1 | 87 | | 4.2 | | 29.0 | | (69) | | (2.7) | | 22.1 | |
Long-term asset growth rate1 | (69) | | 2.9 | | 27.7 | | 87 | | (4.7) | | 20.1 | |
Discount rate2 | (133) | | 5.4 | | 30.2 | | 207 | | (5.3) | | 19.5 | |
Expected credit losses as a percentage
of customer advances | 2021 to 2025: 103 2026 onwards: 91 | 1.5 | | 26.3 | | 2021 to 2025: 121 2026 onwards: 105 | (2.7) | | 22.1 | |
| Risk-weighted assets as a percentage of total assets | (111) | | 0.2 | | 25.0 | | 280 | | (2.1) | | 22.7 | |
| Operating income growth rate | 37 | | 1.0 | | 25.8 | | (58) | | (1.8) | | 23.0 | |
| Cost-income ratio | (152) | | 1.7 | | 26.5 | | 174 | | (1.7) | | 23.1 | |
| Long-term effective tax rate | (104) | | 0.3 | | 25.1 | | 1,000 | | (3.6) | | 21.2 | |
| Capital requirements – capital adequacy ratio | — | | — | | 24.8 | | 325 | | (10.0) | | 14.8 | |
| Capital requirements – tier 1 capital adequacy ratio | — | | — | | 24.8 | | 364 | | (6.5) | | 18.3 | |
| At 31 Dec 2020 | | | | | | |
Long-term profit growth rate1 | — | | — | | 21.8 | | (50) | | (1.3) | | 20.5 | |
Long-term asset growth rate1 | (50) | | 1.4 | | 23.2 | | — | | — | | 21.8 | |
| Discount rate | (47) | | 1.2 | | 23.0 | | 53 | | (1.2) | | 20.6 | |
Expected credit losses as a percentage
of customer advances | 2020 to 2024: 96 2025 onwards: 76 | 2.3 | | 24.1 | | 2020 to 2024: 122 2025 onwards: 95 | (2.1) | | 19.7 | |
| Risk-weighted assets as a percentage of total assets | (40) | | 0.1 | | 21.9 | | 166 | | (0.8) | | 21.0 | |
| Operating income growth rate | 2 | | 0.2 | | 22.0 | | (69) | | (1.5) | | 20.3 | |
| Cost-income ratio | (149) | | 1.3 | | 23.1 | | 120 | | (1.2) | | 20.6 | |
| Long-term effective tax rate | (316) | | 0.9 | | 22.7 | | 820 | | (2.2) | | 19.6 | |
| | | | | | |
| Capital requirements – capital adequacy ratio | — | | — | | 21.8 | | 297 | | (7.8) | | 14.0 | |
| Capital requirements – tier 1 capital adequacy ratio | — | | — | | 21.8 | | 263 | | (5.3) | | 16.5 | |
1 The reasonably possible ranges of the long-term profit growth rate and long-term asset growth rate assumptions reflect the close relationship between these assumptions, which would result in offsetting changes to each assumption.
2 The unfavourable change in the reasonably possible ranges of the discount rate assumption reflects the impact of adopting the average of the rates adopted by selected external analysts.
Considering the interrelationship of the changes set out in the table above, management estimates that the reasonably possible range of VIU is $19.0bn to $29.3bn (2020 equivalent range: $17.2bn to $25.7bn). The range is based on impacts set out in the table above arising from the favourable/unfavourable change in the earnings in the short to medium term, the long-term expected credit losses as a percentage of customer advances, and a 50bps increase/decrease in the discount rate. The discount rate has been included this year, reflecting the relative materiality of movements in this assumption. All other long-term assumptions and the basis of the CMC have been kept unchanged when determining the reasonably possible range of the VIU.
Selected financial information of BoCom
The statutory accounting reference date of BoCom is 31 December. For the year ended 31 December 2021, HSBC included the associate’s results on the basis of the financial statements for the 12 months ended 30 September 2021, taking into account changes in the subsequent period from 1 October 2021 to 31 December 2021 that would have materially affected the results.
| | | | | | | | | | | |
| Selected balance sheet information of BoCom |
| | At 30 Sep |
| | 2021 | 2020 |
| | $m | $m |
| Cash and balances at central banks | | 123,194 | | 121,987 | |
| Loans and advances to banks and other financial institutions | | 98,932 | | 107,334 | |
| Loans and advances to customers | | 993,956 | | 870,728 | |
| Other financial assets | | 541,577 | | 508,328 | |
| Other assets | | 47,679 | | 44,622 | |
| Total assets | | 1,805,338 | | 1,652,999 | |
| Deposits by banks and other financial institutions | | 287,057 | | 273,708 | |
| Customer accounts | | 1,099,266 | | 1,012,732 | |
| Other financial liabilities | | 228,135 | | 207,110 | |
| Other liabilities | | 40,070 | | 31,105 | |
| Total liabilities | | 1,654,528 | | 1,524,655 | |
| Total equity | | 150,810 | | 128,344 | |
| | | | | | | | |
| Reconciliation of BoCom’s total shareholders’ equity to the carrying amount in HSBC’s consolidated financial statements |
| At 31 Dec |
| 2021 | 2020 |
| $m | $m |
| HSBC’s share of total shareholders’ equity | 23,097 | | 20,743 | |
| Goodwill and other intangible assets | 519 | | 505 | |
| Carrying amount | 23,616 | | 21,248 | |
Notes on the financial statements
| | | | | | | | |
| Selected income statement information of BoCom |
| For the 12 months ended 30 Sep |
| 2021 | 2020 |
| $m | $m |
| Net interest income | 24,582 | | 21,994 | |
| Net fee and commission income | 7,170 | | 6,398 | |
| Change in expected credit losses and other credit impairment charges | (9,701) | | (9,698) | |
| Depreciation and amortisation | (2,297) | | (2,072) | |
| Tax expense | (1,045) | | (858) | |
| Profit for the year | 14,199 | | 10,261 | |
| Other comprehensive income | (368) | | (769) | |
| Total comprehensive income | 13,831 | | 9,492 | |
| Dividends received from BoCom | 692 | | 633 | |
The Saudi British Bank
The Group’s investment in The Saudi British Bank (‘SABB’) is classified as an associate. HSBC is the largest shareholder in SABB with a shareholding of 31%. Significant influence in SABB is established via representation on the Board of Directors. Investments in associates are recognised using the equity method of accounting in accordance with IAS 28, as described previously for BoCom.
Impairment testing
There were no indicators of impairment at 31 December 2021. The fair value of the Group’s investment in SABB of $5.6bn was above the carrying amount of $4.4bn.
| | | | | |
| 19 | Investments in subsidiaries |
| | | | | | | | | | | |
| Main subsidiaries of HSBC Holdings |
| At 31 Dec 2021 |
| Place of incorporation or registration | HSBC’s interest % | |
| Share class |
| Europe | |
| |
| HSBC Bank plc | England and Wales | 100 | | £1 Ordinary, $0.01 Non-Cumulative Third Dollar Preference |
| HSBC UK Bank plc | England and Wales | 100 | | £1 Ordinary |
| HSBC Continental Europe | France | 99.99 | | €5 Actions |
| | | |
| | | |
| HSBC Trinkaus & Burkhardt AG | Germany | 100 | | Stückaktien no par value |
| Asia | |
| |
| Hang Seng Bank Limited | Hong Kong | 62.14 | | HK$5 Ordinary |
| | | |
| HSBC Bank (China) Company Limited | People’s Republic of China | 100 | | CNY1 Ordinary |
| HSBC Bank Malaysia Berhad | Malaysia | 100 | | RM0.5 Ordinary |
| | | |
| HSBC Life (International) Limited | Bermuda | 100 | | HK$1 Ordinary |
| The Hongkong and Shanghai Banking Corporation Limited | Hong Kong | 100 | | Ordinary no par value |
| | | |
| Middle East and North Africa | |
| |
| HSBC Bank Middle East Limited | United Arab Emirates | 100 | | $1 Ordinary and $1 Cumulative Redeemable Preference shares |
| North America | |
| |
| HSBC Bank Canada | Canada | 100 | | Common no par value and Preference no par value |
| HSBC Bank USA, N.A. | US | 100 | | $100 Common and $0.01 Preference |
| | | |
| | | |
| Latin America | |
| |
HSBC Mexico, S.A., Institución de Banca Múltiple,
Grupo Financiero HSBC | Mexico | 99.99 | | MXN2 Ordinary |
Details of the debt, subordinated debt and preference shares issued by the main subsidiaries to parties external to the Group are included in Note 25 ‘Debt securities in issue’ and Note 28 ‘Subordinated liabilities’, respectively.
A list of all related undertakings is set out in Note 38. The principal countries of operation are the same as the countries and territories of incorporation except for HSBC Life (International) Limited, which operates mainly in Hong Kong.
HSBC is structured as a network of regional banks and locally incorporated regulated banking entities. Each bank is separately capitalised in accordance with applicable prudential requirements and maintains a capital buffer consistent with the Group’s risk appetite for the relevant country or region. HSBC’s capital management process is incorporated in the annual operating plan, which is approved by the Board.
HSBC Holdings is the primary provider of equity capital to its subsidiaries and also provides them with non-equity capital where necessary. These investments are substantially funded by HSBC Holdings’ issuance of equity and non-equity capital, and by profit retention. The net increase in investments in subsidiaries was partly due to the reversal of impairment of HSBC Overseas Holdings (UK) Limited of $3.1bn. The cumulative impairment for HSBC Overseas Holdings (UK) Limited as at 31 December 2021 is $7.2bn. It is reasonably possible that outcomes in the future may be different from the assumptions made as at December 2021 that could require a material change to the carrying amount of HSBC Overseas Holdings (UK) Limited. The carrying value is $33.1bn as at 31 December 2021 (2020:$30.7bn).
As part of its capital management process, HSBC Holdings seeks to maintain a balance between the composition of its capital and its investment in subsidiaries. Subject to this, there is no current or foreseen impediment to HSBC Holdings’ ability to provide funding for such investments. During 2021, consistent with the Group’s capital plan, the Group’s subsidiaries did not experience any significant restrictions on paying dividends or repaying loans and advances. Also, there are no foreseen restrictions envisaged with regard to planned dividends or payments. However, the ability of subsidiaries to pay dividends or advance monies to HSBC Holdings depends on, among
other things, their respective local regulatory capital and banking requirements, exchange controls, statutory reserves, and financial and operating performance.
The amount of guarantees by HSBC Holdings in favour of other Group entities is set out in Note 32.
Information on structured entities consolidated by HSBC where HSBC owns less than 50% of the voting rights is included in Note 20 ‘Structured entities’. In each of these cases, HSBC controls and consolidates an entity when it is exposed, or has rights, to variable returns from its involvement with the entity and has the ability to affect those returns through its power over the entity.
| | | | | | | | |
| Subsidiaries with significant non-controlling interests |
| 2021 | 2020 |
| Hang Seng Bank Limited | | |
| Proportion of ownership interests and voting rights held by non-controlling interests | 37.86 | % | 37.86% |
| Place of business | Hong Kong | Hong Kong |
| $m | $m |
| Profit attributable to non-controlling interests | 708 | 843 | |
| Accumulated non-controlling interests of the subsidiary | 7,597 | 7,604 | |
| Dividends paid to non-controlling interests | 568 | 625 | |
| Summarised financial information: | | |
| – total assets | 230,866 | 224,483 | |
| – total liabilities | 209,315 | 202,907 | |
| – net operating income before changes in expected credit losses and other credit impairment charges | 4,280 | 4,568 | |
| – profit for the year | 1,872 | 2,230 | |
| – total comprehensive income for the year | 1,686 | 2,535 | |
HSBC is mainly involved with both consolidated and unconsolidated structured entities through the securitisation of financial assets, conduits and investment funds, established either by HSBC or a third party.
Consolidated structured entities
| | | | | | | | | | | | | | | | | |
| Total assets of HSBC’s consolidated structured entities, split by entity type |
| Conduits | Securitisations | HSBC
managed funds | Other | Total |
| $bn | $bn | $bn | $bn | $bn |
| At 31 Dec 2021 | 4.4 | | 10.0 | | 6.3 | | 8.4 | | 29.1 | |
| At 31 Dec 2020 | 6.9 | | 11.7 | | 5.3 | | 10.8 | | 34.7 | |
Conduits
HSBC has established and manages 2 types of conduits: securities investment conduits (‘SICs’) and multi-seller conduits.
Securities investment conduits
The SICs purchase highly rated ABSs to facilitate tailored investment opportunities.
•At 31 December 2021, Solitaire, HSBC’s principal SIC, held $1.6bn of ABSs (2020: $1.9bn). It is currently funded entirely by commercial paper (‘CP’) issued to HSBC. At 31 December 2021, HSBC held $1.8bn of CP (2020: $2.1bn).
Multi-seller conduit
HSBC’s multi-seller conduit was established to provide access to flexible market-based sources of finance for its clients. Currently, HSBC bears risk equal to the transaction-specific facility offered to the multi-seller conduit, amounting to $6.7bn at 31 December 2021 (2020: $9.6bn). First loss protection is provided by the originator of the assets, and not by HSBC, through transaction-specific credit enhancements. A layer of secondary loss protection is provided by HSBC in the form of programme-wide enhancement facilities.
Securitisations
HSBC uses structured entities to securitise customer loans and advances it originates in order to diversify its sources of funding for asset origination and capital efficiency purposes. The loans and advances are transferred by HSBC to the structured entities for cash or synthetically through credit default swaps, and the structured entities issue debt securities to investors.
HSBC managed funds
HSBC has established a number of money market and non-money market funds. Where it is deemed to be acting as principal rather than agent in its role as investment manager, HSBC controls these funds.
Other
HSBC has entered into a number of transactions in the normal course of business, which include asset and structured finance transactions where it has control of the structured entity. In addition, HSBC is deemed to control a number of third-party managed funds through its involvement as a principal in the funds.
Unconsolidated structured entities
The term ‘unconsolidated structured entities’ refers to all structured entities not controlled by HSBC. The Group enters into transactions with unconsolidated structured entities in the normal course of business to facilitate customer transactions and for specific investment opportunities.
Notes on the financial statements
| | | | | | | | | | | | | | | | | |
| Nature and risks associated with HSBC interests in unconsolidated structured entities |
| Securitisations | HSBC managed funds | Non-HSBC managed funds | Other | Total |
| Total asset values of the entities ($m) |
| 0–500 | 96 | | 294 | | 1,408 | | 37 | | 1,835 | |
| 500–2,000 | 11 | | 116 | | 911 | | 3 | | 1,041 | |
| 2,000–5,000 | — | | 33 | | 435 | | — | | 468 | |
| 5,000–25,000 | — | | 14 | | 197 | | — | | 211 | |
| 25,000+ | — | | 4 | | 11 | | — | | 15 | |
| Number of entities at 31 Dec 2021 | 107 | | 461 | | 2,962 | | 40 | | 3,570 | |
| $bn | $bn | $bn | $bn | $bn |
| Total assets in relation to HSBC’s interests in the unconsolidated structured entities | 4.8 | | 10.8 | | 18.6 | | 3.8 | | 38.0 | |
| – trading assets | — | | 0.2 | | 2.4 | | 0.1 | | 2.7 | |
| – financial assets designated and otherwise mandatorily measured at fair value | — | | 10.0 | | 15.5 | | — | | 25.5 | |
| | | | | |
| – loans and advances to customers | 4.8 | | — | | 0.1 | | 3.0 | | 7.9 | |
| – financial investments | — | | 0.6 | | 0.6 | | — | | 1.2 | |
| – other assets | — | | — | | — | | 0.7 | | 0.7 | |
| Total liabilities in relation to HSBC’s interests in the unconsolidated structured entities | — | | — | | — | | 0.4 | | 0.4 | |
| – other liabilities | — | | — | | — | | 0.4 | | 0.4 | |
| Other off-balance sheet commitments | 0.1 | | 0.9 | | 4.6 | | 1.2 | | 6.8 | |
| HSBC’s maximum exposure at 31 Dec 2021 | 4.9 | | 11.7 | | 23.2 | | 4.6 | | 44.4 | |
| | | | | |
| Total asset values of the entities ($m) | | | | | |
| 0–500 | 86 | | 292 | | 1,430 | | 47 | | 1,855 | |
| 500–2,000 | 9 | | 94 | | 733 | | 2 | | 838 | |
| 2,000–5,000 | — | | 32 | | 389 | | — | | 421 | |
| 5,000–25,000 | — | | 14 | | 311 | | — | | 325 | |
| 25,000+ | — | | 5 | | 41 | | — | | 46 | |
| Number of entities at 31 Dec 2020 | 95 | | 437 | | 2,904 | | 49 | | 3,485 | |
| $bn | $bn | $bn | $bn | $bn |
| Total assets in relation to HSBC’s interests in the unconsolidated structured entities | 4.4 | | 9.9 | | 17.5 | | 2.1 | | 33.9 | |
| – trading assets | — | | 0.3 | | 3.2 | | — | | 3.5 | |
| – financial assets designated and otherwise mandatorily measured at fair value | — | | 8.6 | | 13.8 | | — | | 22.4 | |
| | | | | |
| – loans and advances to customers | 4.4 | | — | | — | | 1.5 | | 5.9 | |
| – financial investments | — | | 1 | | 0.5 | | — | | 1.5 | |
| – other assets | — | | — | | — | | 0.6 | | 0.6 | |
| Total liabilities in relation to HSBC’s interests in the unconsolidated structured entities | — | | — | | — | | 0.3 | | 0.3 | |
| – other liabilities | — | | — | | — | | 0.3 | | 0.3 | |
| Other off-balance sheet commitments | 0.1 | | 0.5 | | 4.9 | | 1.2 | | 6.7 | |
| HSBC’s maximum exposure at 31 Dec 2020 | 4.5 | | 10.4 | | 22.4 | | 3.6 | | 40.9 | |
The maximum exposure to loss from HSBC’s interests in unconsolidated structured entities represents the maximum loss it could incur as a result of its involvement with these entities regardless of the probability of the loss being incurred.
•For commitments, guarantees and written credit default swaps, the maximum exposure to loss is the notional amount of potential future losses.
•For retained and purchased investments and loans to unconsolidated structured entities, the maximum exposure to loss is the carrying value of these interests at the balance sheet reporting date.
The maximum exposure to loss is stated gross of the effects of hedging and collateral arrangements that HSBC has entered into in order to mitigate the Group's exposure to loss.
Securitisations
HSBC has interests in unconsolidated securitisation vehicles through holding notes issued by these entities. In addition, HSBC has investments in ABSs issued by third-party structured entities.
HSBC managed funds
HSBC establishes and manages money market funds and non-money market investment funds to provide customers with investment opportunities. Further information on funds under management is provided on page 116.
HSBC, as fund manager, may be entitled to receive management and performance fees based on the assets under management. HSBC may also retain units in these funds.
Non-HSBC managed funds
HSBC purchases and holds units of third-party managed funds in order to facilitate business and meet customer needs.
Other
HSBC has established structured entities in the normal course of business, such as structured credit transactions for customers, to provide finance to public and private sector infrastructure projects, and for asset and structured finance transactions.
In addition to the interests disclosed above, HSBC enters into derivative contracts, reverse repos and stock borrowing transactions with structured entities. These interests arise in the normal course of business for the facilitation of third-party transactions and risk management solutions.
HSBC sponsored structured entities
The amount of assets transferred to and income received from such sponsored structured entities during 2021 and 2020 were not significant.
| | | | | |
| 21 | Goodwill and intangible assets |
| | | | | | | | |
| | |
| 2021 | 2020 |
| $m | $m |
| Goodwill | 5,033 | | 5,881 | |
| Present value of in-force long-term insurance business | 9,453 | | 9,435 | |
Other intangible assets1 | 6,136 | | 5,127 | |
| At 31 Dec | 20,622 | | 20,443 | |
1Included within other intangible assets is internally generated software with a net carrying value of $5,430m (2020: $4,452m). During the year, capitalisation of internally generated software was $2,373m (2020: $1,934m), impairment was $137m (2020: $1,322m) and amortisation was $1,183m (2020: $1,085m).
| | | | | | | | |
| Movement analysis of goodwill |
| 2021 | 2020 |
| $m | $m |
| Gross amount | | |
| At 1 Jan | 23,135 | | 22,084 | |
| Exchange differences | (905) | | 967 | |
| | |
| Other | (15) | | 84 | |
| At 31 Dec | 22,215 | | 23,135 | |
| Accumulated impairment losses | | |
| At 1 Jan | (17,254) | | (16,494) | |
| Impairment losses | (587) | | (41) | |
| Exchange differences | 659 | | (719) | |
| | |
| At 31 Dec | (17,182) | | (17,254) | |
| Net carrying amount at 31 Dec | 5,033 | | 5,881 | |
Goodwill
Impairment testing
The Group’s impairment test in respect of goodwill allocated to each cash-generating unit (‘CGU’) is performed at 1 October each year. A review for indicators of impairment is undertaken at each subsequent quarter-end and at 31 December 2021.
As a result of the 1 October 2021 annual impairment test, we recognised $0.6bn of goodwill impairment related to the Latin America – WPB CGU. Impairment resulted from a combination of factors, including our macroeconomic outlook and the impact of inflationary pressure on judgements made to estimate value in use (‘VIU’). Significant inputs to the VIU calculation are discussed in more detail within ‘Basis of the recoverable amount’ below. Management considered the sensitivity of certain assumptions, in particular the discount rate, and the outcome of reasonably possible alternative scenarios. This resulted in full impairment of goodwill allocated to Latin America – WPB.
| | | | | | | | | | | | | | | | | | | | | | | |
| Impairment results and key assumptions in VIU calculations – impaired CGU at 1 October 2021 |
| Carrying amount | of which goodwill | Value in use | Impairment | Discount
rate | Growth rate beyond initial cash flow projections |
| $bn | $bn | $bn | $bn | % | % |
| Latin America – WPB | 2.3 | | 0.6 | | 1.7 | | 0.6 | | 14.5 | | 4.8 | |
Basis of the recoverable amount
The recoverable amount of all CGUs to which goodwill has been allocated was equal to its value in use at each respective testing date. The VIU is calculated by discounting management’s cash flow projections for the CGU. The key assumptions used in the VIU calculation for each individually significant CGU that is not impaired are discussed below.
| | | | | | | | | | | | | | | | | | | | |
| Key assumptions in VIU calculation – significant CGUs at 1 October 2021 | | | |
| Goodwill at
1 Oct 2021 | Discount rate | Growth rate
beyond initial
cash flow | Goodwill at
1 Oct 2020 | Discount
rate | Growth rate beyond initial cash flow projections |
| $m | % | % | $m | % | % |
| | | | | | |
| | | | | | |
| Europe – WPB | 3,556 | | 9.2 | | 1.8 | | 3,582 | | 9.6 | | 1.9 | |
| | | | | | |
| | | | | | |
| | | | | | |
At 1 October 2021, aggregate goodwill of $2,108m (1 October 2020: $2,059m) had been allocated to CGUs that were not considered individually significant. The Group’s CGUs do not carry on their balance sheets any significant intangible assets with indefinite useful lives, other than goodwill.
Notes on the financial statements
Management’s judgement in estimating the cash flows of a CGU
The cash flow projections for each CGU are based on forecast profitability plans approved by the Board and minimum capital levels required to support the business operations of a CGU. The Board challenges and endorses planning assumptions in light of internal capital allocation decisions necessary to support our strategy, current market conditions and macroeconomic outlook including climate risk. For the 1 October 2021 impairment test, cash flow projections until the end of 2026 were considered, in line with our internal planning horizon. As required by IFRSs, estimates of future cash flows exclude estimated cash inflows or outflows that are expected to arise from restructuring initiatives before an entity has a constructive obligation to carry out the plan, and would therefore have recognised a provision for restructuring costs.
Discount rate
The rate used to discount the cash flows is based on the cost of equity assigned to each CGU, which is derived using a capital asset pricing model (‘CAPM’) and market implied cost of equity. CAPM depends on a number of inputs reflecting financial and economic variables, including the risk-free rate and a premium to reflect the inherent risk of the business being evaluated. These variables are based on the market’s assessment of the economic variables and management’s judgement. The discount rates for each CGU are refined to reflect the rates of inflation for the countries within which the CGU operates. In addition, for the purposes of testing goodwill for impairment, management supplements this process by comparing the discount rates derived using the internally generated CAPM, with the cost of equity rates produced by external sources for businesses operating in similar markets.
Long-term growth rate
The long-term growth rate is used to extrapolate the cash flows in perpetuity because of the long-term perspective within the Group of business units making up the CGUs. These growth rates reflect inflation for the countries within which the CGU operates or from which it derives revenue.
Sensitivities of key assumptions in calculating VIU
At 1 October 2021, Europe – WPB was sensitive to reasonably possible adverse changes in key assumptions supporting the recoverable amount. In making an estimate of reasonably possible changes to assumptions, management considers the available evidence in respect of each input to the VIU calculation, such as the external range of discount rates observable, historical performance against forecast and risks attaching to the key assumptions underlying cash flow projections. A reasonable change in a single key assumption may not result in impairment, although taken together a combination of reasonable changes in key assumptions could result in a recoverable amount that is lower than the CGU’s carrying amount.
| | | | | | | | | | | | | | |
| Input | Key assumptions | Associated risks | Reasonably possible change |
Cash-generating unit
| | | | |
| Europe – WPB | Forecast profitability | •Level of interest rates and yield curves. •Competitors’ position within the market. •Level and change in unemployment rates. | •Uncertain regulatory environment. •Customer remediation and regulatory actions.
| •Forecast profitability projections decrease by 30%. This does not result in an impairment. |
| Discount rate | Discount rate used is a reasonable estimate of a suitable market rate for the profile of the business. | •External evidence suggests that the rate used is not appropriate to the business. | •Discount rate increases by 100bps. This does not result in an impairment. |
| | | | | |
| Sensitivity of VIU to reasonably possible changes in key assumptions and changes to current assumptions to achieve nil headroom |
| In $bn (unless otherwise stated) | Europe – WPB |
|
| At 1 October 2021 | |
| Carrying amount | 18.8 | |
| VIU | 29.8 | |
| Impact on VIU | |
| 100bps increase in the discount rate – single variable | (3.7) | |
| 30% decrease in forecast profitability – single variable | (9.2) | |
| Cumulative impact of all changes | (11.7) | |
| Changes to key assumption to reduce headroom to nil – single variable | |
| Discount rate – bps | 409 | |
| Profit cash flows – % | 36 | |
Other intangible assets
Impairment testing
Impairment of other intangible assets is assessed in accordance with our policy explained in Note 1.2(n) by comparing the net carrying amount of CGUs containing intangible assets with their recoverable amounts. Recoverable amounts are determined by calculating an estimated VIU or fair value, as appropriate, for each CGU. No significant impairment was recognised during the year.
In 2020, having considered the pervasive macroeconomic deterioration caused by the outbreak of Covid-19, along with the impact of forecast profitability in some businesses, we recognised $1.3bn of capitalised software impairment related principally to businesses within HSBC Bank plc, our non-ring-fenced bank in Europe, and to a lesser degree businesses within HSBC USA Inc. This impairment reflected underperformance and deterioration in the future forecasts of these businesses, substantially relating to prior periods in HSBC Bank plc.
Key assumptions in VIU calculation
We used a number of assumptions in our VIU calculation, in accordance with the requirements of IAS 36:
•Management’s judgement in estimating future cash flows: We considered past business performance, current market conditions and our macroeconomic outlook to estimate future earnings. As required by IFRSs, estimates of future cash flows exclude estimated cash inflows or outflows that are expected to arise from restructuring initiatives before an entity has a constructive obligation to carry out
the plan, and would therefore have recognised a provision for restructuring costs. For some businesses, this means that the benefit of certain strategic actions may not be included in the impairment assessment, including capital releases.
•Long-term growth rates: The long-term growth rate is used to extrapolate the cash flows in perpetuity because of the long-term perspective of the businesses within the Group.
•Discount rates: Rates are based on a combination of CAPM and market-implied calculations considering market data for the businesses and geographies in which the Group operates.
Future software capitalisation
We will continue to invest in digital capabilities to meet our strategic objectives. However, software capitalisation within businesses where impairment was identified will not resume until the performance outlook for each business indicates future profits are sufficient to support capitalisation. The cost of additional software investment in these businesses will be recognised as an operating expense until such time.
Sensitivity of estimates relating to non-financial assets
As explained in Note 1.2(a), estimates of future cash flows for CGUs are made in the review of goodwill and non-financial assets for impairment. Non-financial assets include other intangible assets shown above, and owned property, plant and equipment and right-of-use assets (see Note 22). The most significant sources of estimation uncertainty are in respect of the goodwill balances disclosed above. There are no non-financial asset balances relating to individual CGUs which involve estimation uncertainty that represents a significant risk of resulting in a material adjustment to the results and financial position of the Group within the next financial year.
Non-financial assets are widely distributed across CGUs within the legal entities of the Group, including Corporate Centre assets that cannot be allocated to CGUs and are therefore tested for impairment at consolidated level. The recoverable amounts of other intangible assets, owned property, plant and equipment, and right-of-use assets cannot be lower than individual asset fair values less costs to dispose, where relevant. At 31 December 2021 none of the CGUs were sensitive to reasonably possible adverse changes in key assumptions supporting the recoverable amount. In making an estimate of reasonably possible changes to assumptions, management considers the available evidence in respect of each input to the VIU calculation, such as the external range of discount rates observable, historical performance against forecast and risks attaching to the key assumptions underlying cash flow projections.
Present value of in-force long-term insurance business
When calculating the present value of in-force long-term (‘PVIF’) insurance business, expected cash flows are projected after adjusting for a variety of assumptions made by each insurance operation to reflect local market conditions, and management’s judgement of future trends and uncertainty in the underlying assumptions is reflected by applying margins (as opposed to a cost of capital methodology) including valuing the cost of policyholder options and guarantees using stochastic techniques.
Actuarial Control Committees of each key insurance entity meet on a quarterly basis to review and approve PVIF assumptions. All changes to non-economic assumptions, economic assumptions that are not observable and model methodologies must be approved by the Actuarial Control Committee.
| | | | | | | | |
| Movements in PVIF |
| 2021 | 2020 |
| $m | $m |
| At 1 Jan | 9,435 | | 8,945 | |
| Change in PVIF of long-term insurance business | 130 | | 382 | |
| – value of new business written during the year | 1,090 | | 776 | |
– expected return1 | (903) | | (1,003) | |
| – assumption changes and experience variances (see below) | (105) | | 604 | |
| – other adjustments | 48 | | 5 | |
| | |
| Exchange differences and other movements | (112) | | 108 | |
| At 31 Dec | 9,453 | | 9,435 | |
1‘Expected return’ represents the unwinding of the discount rate and reversal of expected cash flows for the period.
Assumption changes and experience variances
Included within this line item are:
•$59m (2020: $132m), directly offsetting interest rate-driven changes to the valuation of liabilities under insurance contracts;
•$(324)m (2020: $247m), reflecting the future expected sharing of returns with policyholders on contracts with discretionary participation features (‘DPF’), to the extent this sharing is not already included in liabilities under insurance contracts; and
•$160m (2020: $225m), driven by other assumptions changes and experience variances.
Key assumptions used in the computation of PVIF for main life insurance operations
Economic assumptions are set in a way that is consistent with observable market values. The valuation of PVIF is sensitive to observed market movements and the impact of such changes is included in the sensitivities presented below.
| | | | | | | | | | | | | | |
| 2021 | 2020 |
| Hong Kong | France1 | Hong Kong | France1 |
| % | % | % | % |
| Weighted average risk-free rate | 1.40 | | 0.69 | | 0.71 | | 0.34 | |
| Weighted average risk discount rate | 5.20 | | 1.55 | | 4.96 | | 1.34 | |
| Expense inflation | 3.00 | | 1.80 | | 3.00 | | 1.60 | |
1For 2021, the calculation of France’s PVIF assumes a risk discount rate of 1.55% (2020: 1.34%) plus a risk margin of $215m (2020: $213m).
Notes on the financial statements
Sensitivity to changes in economic assumptions
The Group sets the risk discount rate applied to the PVIF calculation by starting from a risk-free rate curve and adding explicit allowances for risks not reflected in the best-estimate cash flow modelling. Where the insurance operations provide options and guarantees to policyholders, the cost of these options and guarantees is accounted for as a deduction from the PVIF asset, unless the cost of such guarantees is already allowed for as an explicit addition to liabilities under insurance contracts. For further details of these guarantees and the impact of changes in economic assumptions on our insurance manufacturing subsidiaries, see page 250.
Sensitivity to changes in non-economic assumptions
Policyholder liabilities and PVIF are determined by reference to non-economic assumptions, including mortality and/or morbidity, lapse rates and expense rates. For further details on the impact of changes in non-economic assumptions on our insurance manufacturing operations, see page 252.
| | | | | |
| 22 | Prepayments, accrued income and other assets |
| | | | | | | | |
| 2021 | 2020 |
| $m | $m |
| Prepayments and accrued income | 8,233 | | 8,114 | |
| Settlement accounts | 17,713 | | 17,316 | |
| Cash collateral and margin receivables | 42,171 | | 59,543 | |
Assets held for sale1 | 3,411 | | 299 | |
| Bullion | 15,283 | | 20,151 | |
| Endorsements and acceptances | 11,229 | | 10,278 | |
| Reinsurers’ share of liabilities under insurance contracts (Note 4) | 3,668 | | 3,448 | |
| Employee benefit assets (Note 5) | 10,269 | | 10,450 | |
| Right-of-use assets | 2,985 | | 4,002 | |
| Owned property, plant and equipment | 10,255 | | 10,412 | |
| Other accounts | 14,765 | | 12,399 | |
| At 31 Dec | 139,982 | | 156,412 | |
1 ‘Assets held for sale’ includes $2.6bn of loans and advances to customers that were classified as assets held for sale, reflecting our exit of mass market retail banking in the US.
Prepayments, accrued income and other assets include $91,045m (2020: $105,469m) of financial assets, the majority of which are measured at amortised cost.
| | | | | | | | |
| 2021 | 2020 |
| $m | $m |
Deposits by banks1 | 4,243 | | 6,689 | |
Customer accounts1 | 9,424 | | 10,681 | |
| Other debt securities in issue (Note 25) | 1,792 | | 1,582 | |
| Other liabilities – net short positions in securities | 69,445 | | 56,314 | |
| At 31 Dec | 84,904 | | 75,266 | |
1‘Deposits by banks’ and ‘Customer accounts’ include repos, stock lending and other amounts.
| | | | | |
| 24 | Financial liabilities designated at fair value |
| | | | | | | | |
| HSBC |
| 2021 | 2020 |
| $m | $m |
Deposits by banks and customer accounts1 | 16,703 | | 19,176 | |
| Liabilities to customers under investment contracts | 5,938 | | 6,385 | |
| Debt securities in issue (Note 25) | 112,761 | | 121,034 | |
| Subordinated liabilities (Note 28) | 10,100 | | 10,844 | |
| | |
| At 31 Dec | 145,502 | | 157,439 | |
1 Structured deposits placed at HSBC Bank USA are insured by the Federal Deposit Insurance Corporation, a US government agency, up to $250,000 per depositor.
The carrying amount of financial liabilities designated at fair value was $827m more than the contractual amount at maturity. The cumulative amount of change in fair value attributable to changes in credit risk was a loss of $2,084m (2020: loss of $2,542m).
| | | | | | | | |
| HSBC Holdings |
| 2021 | 2020 |
| $m | $m |
| Debt securities in issue (Note 25) | 26,818 | | 19,624 | |
| Subordinated liabilities (Note 28) | 5,600 | | 6,040 | |
| At 31 Dec | 32,418 | | 25,664 | |
The carrying amount of financial liabilities designated at fair value was $1,766m more than the contractual amount at maturity
(2020: $3,019m more). The cumulative amount of change in fair value attributable to changes in credit risk was a loss of $951m (2020: $1,210m).
| | | | | |
| 25 | Debt securities in issue |
| | | | | | | | | | | |
| HSBC |
|
| 2021 | 2020 |
| | $m | $m |
| Bonds and medium-term notes | | 166,537 | | 176,570 | |
| Other debt securities in issue | | 26,573 | | 41,538 | |
| Total debt securities in issue | | 193,110 | | 218,108 | |
| Included within: | | | |
| – trading liabilities (Note 23) | | (1,792) | | (1,582) | |
| – financial liabilities designated at fair value (Note 24) | | (112,761) | | (121,034) | |
| At 31 Dec | | 78,557 | | 95,492 | |
| | | | | | | | |
| HSBC Holdings |
| 2021 | 2020 |
| $m | $m |
| Debt securities | 94,301 | | 83,653 | |
| Included within: | | |
| – financial liabilities designated at fair value (Note 24) | (26,818) | | (19,624) | |
| At 31 Dec | 67,483 | | 64,029 | |
| | | | | |
| 26 | Accruals, deferred income and other liabilities |
| | | | | | | | |
| 2021 | 2020 |
| $m | $m |
| Accruals and deferred income | 10,466 | | 10,406 | |
| Settlement accounts | 15,226 | | 13,008 | |
| Cash collateral and margin payables | 50,226 | | 65,557 | |
| Endorsements and acceptances | 11,232 | | 10,293 | |
| Employee benefit liabilities (Note 5) | 1,607 | | 2,025 | |
Liabilities of disposal groups held for sale1 | 9,005 | | — | |
| Lease liabilities | 3,586 | | 4,614 | |
| Other liabilities | 22,430 | | 22,721 | |
| At 31 Dec | 123,778 | | 128,624 | |
1 Includes $8.8bn of customer accounts that were classified as liabilities of disposal groups held for sale, reflecting our exit of mass market retail banking in the US.
Accruals, deferred income and other liabilities include $111,887m (2020: $120,229m) of financial liabilities, the majority of which are measured at amortised cost.
| | | | | | | | | | | | | | | | | |
| Restructuring
costs | Legal proceedings
and regulatory
matters | Customer
remediation | Other
provisions | Total |
| $m | $m | $m | $m | $m |
| Provisions (excluding contractual commitments) | | | | | |
| At 1 Jan 2021 | 671 | | 756 | | 858 | | 305 | | 2,590 | |
| Additions | 347 | | 249 | | 192 | | 471 | | 1,259 | |
| Amounts utilised | (499) | | (316) | | (548) | | (58) | | (1,421) | |
| Unused amounts reversed | (170) | | (59) | | (113) | | (124) | | (466) | |
| | | | | |
| Exchange and other movements | 34 | | (11) | | (3) | | (36) | | (16) | |
| At 31 Dec 2021 | 383 | | 619 | | 386 | | 558 | | 1,946 | |
Contractual commitments1 | | | | | |
| At 1 Jan 2021 | | | | | 1,088 | |
| | | | | |
| Net change in expected credit loss provision and other movements | | | | | (468) | |
| At 31 Dec 2021 | | | | | 620 | |
| Total provisions | | | | | |
| At 31 Dec 2020 | | | | | 3,678 | |
| At 31 Dec 2021 | | | | | 2,566 | |
Notes on the financial statements
| | | | | | | | | | | | | | | | | |
| Restructuring
costs | Legal proceedings
and regulatory
matters | Customer
remediation | Other
provisions | Total |
| $m | $m | $m | $m | $m |
| | | | | |
| Provisions (excluding contractual commitments) | | | | | |
| At 1 Jan 2020 | 356 | | 605 | | 1,646 | | 280 | | 2,887 | |
| Additions | 698 | | 347 | | 189 | | 222 | | 1,456 | |
| Amounts utilised | (322) | | (177) | | (739) | | (125) | | (1,363) | |
| Unused amounts reversed | (74) | | (75) | | (240) | | (80) | | (469) | |
| | | | | |
| Exchange and other movements | 13 | | 56 | | 2 | | 8 | | 79 | |
| At 31 Dec 2020 | 671 | | 756 | | 858 | | 305 | | 2,590 | |
Contractual commitments1 | | | | | |
| At 1 Jan 2020 | | | | | 511 | |
| Net change in expected credit loss provision and other movements | | | | | 577 | |
| At 31 Dec 2020 | | | | | 1,088 | |
| Total provisions | | | | | |
| At 31 Dec 2019 | | | | | 3,398 | |
| At 31 Dec 2020 | | | | | 3,678 | |
1 Contractual commitments include the provision for contingent liabilities measured under IFRS 9 ‘Financial Instruments’ in respect of financial guarantees and the expected credit loss provision on off-balance sheet guarantees and commitments.
Further details of ‘Legal proceedings and regulatory matters’ are set out in Note 34. Legal proceedings include civil court, arbitration or tribunal proceedings brought against HSBC companies (whether by way of claim or counterclaim) or civil disputes that may, if not settled, result in court, arbitration or tribunal proceedings. Regulatory matters refer to investigations, reviews and other actions carried out by, or in response to the actions of, regulators or law enforcement agencies in connection with alleged wrongdoing by HSBC.
Customer remediation refers to HSBC’s activities to compensate customers for losses or damages associated with a failure to comply with regulations or to treat customers fairly. Customer remediation is often initiated by HSBC in response to customer complaints and/or industry developments in sales practices and is not necessarily initiated by regulatory action. Further details of customer remediation are set out in this note.
At 31 December 2021, $173m (2020: $328m) of the customer remediation provision related to the estimated liability for redress in respect of the possible mis-selling of payment protection insurance (‘PPI’) policies in previous years. Of the $328m balance at 31 December 2020, $192m was utilised during 2021 and the provision was increased by $37m.
At 31 December 2021, a provision of $87m (2020: $302m) was held relating to the estimated liability for redress payable to customers following a review of historical collections and recoveries practices in the UK. During 2021, redress payments and incurred operating costs totalled $197m, in addition to the net release of $18m of provision. This release reflect the actual number of customers impacted and cost of redress paid, which were lower than has been previously estimated.
For further details of the impact of IFRS 9 on undrawn loan commitments and financial guarantees, presented in ‘Contractual commitments’, see Note 32. This provision results from the adoption of IFRS 9 and has no comparatives. Further analysis of the movement in the expected credit loss provision is disclosed within the 'Reconciliation of allowances for loans and advances to banks and customers including loan commitments and financial guarantees' table on page 189.
| | | | | |
| 28 | Subordinated liabilities |
| | | | | | | | |
| HSBC’s subordinated liabilities |
| 2021 | 2020 |
| $m | $m |
| At amortised cost | 20,487 | | 21,951 | |
| – subordinated liabilities | 18,640 | | 20,095 | |
| – preferred securities | 1,847 | | 1,856 | |
| Designated at fair value (Note 24) | 10,100 | | 10,844 | |
| – subordinated liabilities | 10,100 | | 10,844 | |
| – preferred securities | — | | — | |
| At 31 Dec | 30,587 | | 32,795 | |
| Issued by HSBC subsidiaries | 9,112 | | 10,223 | |
| Issued by HSBC Holdings | 21,475 | | 22,572 | |
Subordinated liabilities rank behind senior obligations and generally count towards the capital base of HSBC. Capital securities may be called and redeemed by HSBC subject to prior notification to the PRA and, where relevant, the consent of the local banking regulator. If not redeemed at the first call date, coupons payable may reset or become floating rate based on relevant market rates. On subordinated liabilities other than floating rate notes, interest is payable at fixed rates of up to 10.176%.
The balance sheet amounts disclosed in the following table are presented on an IFRS basis and do not reflect the amount that the instruments contribute to regulatory capital, principally due to regulatory amortisation and regulatory eligibility limits.
| | | | | | | | | | | | | | | | | |
| HSBC’s subsidiaries subordinated liabilities in issue |
| | | 2021 | 2020 |
| First call date | Maturity date | $m | $m |
Additional tier 1 capital securities guaranteed by HSBC Holdings1 | | | | |
| $900m | 10.176% non-cumulative step-up perpetual preferred securities, series 22 | Jun 2030 | | 900 | | 900 | |
| | | | 900 | | 900 | |
Additional tier 1 capital securities guaranteed by HSBC Bank plc1 | | | | |
| £700m | 5.844% non-cumulative step-up perpetual preferred securities3 | Nov 2031 | | 947 | | 956 | |
| | | | 947 | | 956 | |
| Tier 2 securities issued by HSBC Bank plc | | | | |
| $750m | Undated floating rate primary capital notes | Jun 1990 | | 750 | | 750 | |
| $500m | Undated floating rate primary capital notes | Sep 1990 | | 500 | | 500 | |
| $300m | Undated floating rate primary capital notes, series 3 | Jun 1992 | | 300 | | 300 | |
| $300m | 7.65% subordinated notes | — | | May 2025 | 300 | | 300 | |
| | | | 1,850 | | 1,850 | |
| | | | | |
| £300m | 6.50% subordinated notes | — | | Jul 2023 | 406 | | 409 | |
| £350m | 5.375% callable subordinated step-up notes4 | Nov 2025 | Nov 2030 | 539 | | 583 | |
| £500m | 5.375% subordinated notes | — | | Aug 2033 | 900 | | 981 | |
| £225m | 6.25% subordinated notes | — | | Jan 2041 | 303 | | 306 | |
| £600m | 4.75% subordinated notes | — | | Mar 2046 | 805 | | 812 | |
| | | | 2,953 | | 3,091 | |
| | | | 4,803 | | 4,941 | |
| Tier 2 securities issued by The Hongkong and Shanghai Banking Corporation Limited | | | | |
| $400m | Primary capital undated floating rate notes (third series) | Jul 1991 | | 400 | | 400 | |
| | | | 400 | | 400 | |
| Tier 2 securities issued by HSBC Bank Malaysia Berhad | | | | |
| MYR500m | 5.05% subordinated bonds5,6 | Nov 2022 | Nov 2027 | 120 | | 124 | |
| | | | 120 | | 124 | |
| Tier 2 securities issued by HSBC USA Inc. | | | | |
| $250m | 7.20% subordinated debentures5 | — | | Jul 2097 | 222 | | 222 | |
| Other subordinated liabilities each less than $150m7 | | | — | | 200 | |
| | | | 222 | | 422 | |
| Tier 2 securities issued by HSBC Bank USA, N.A. | | | | |
| $1,000m | 5.875% subordinated notes8 | — | | Nov 2034 | 456 | | 497 | |
| $750m | 5.625% subordinated notes8 | — | | Aug 2035 | 489 | | 533 | |
| $700m | 7.00% subordinated notes | — | | Jan 2039 | 697 | | 700 | |
| | | | 1,642 | | 1,730 | |
| Tier 2 securities issued by HSBC Finance Corporation | | | | |
| $2,939m | 6.676% senior subordinated notes5,9 | — | | Jan 2021 | — | | 509 | |
| | | | — | | 509 | |
| Tier 2 securities issued by HSBC Bank Canada | | | | |
| Other subordinated liabilities each less than $150m5 | Oct 1996 | Nov 2083 | 9 | | 9 | |
| | | | 9 | | 9 | |
| Securities issued by other HSBC subsidiaries | | | | |
Other subordinated liabilities each less than $200m10 | | | 69 | | 232 | |
| Subordinated liabilities issued by HSBC subsidiaries at 31 Dec | | | 9,112 | | 10,223 | |
1See paragraph below, ‘Guaranteed by HSBC Holdings or HSBC Bank plc’.
2The interest rate payable after June 2030 is the sum of the three-month Libor plus 4.98%.
3 The interest rate payable after November 2031 is the sum of the compounded daily Sonia rate plus 2.0366%.
4 The interest rate payable after November 2025 is the sum of the compounded daily Sonia rate plus 1.6193%.
5 These securities are ineligible for inclusion in the capital base of HSBC.
6 The interest rate payable after November 2022 is 6.05%.
7 These securities matured in 2021 and were redeemed.
8 HSBC tendered for these securities in November 2019. The principal balance is $357m and $383m respectively. The original notional values of these securities are $1,000m and $750m respectively.
9 HSBC tendered for these securities in 2017. In January 2018, a further tender was conducted. The principal balance is $509m. The original notional of these securities is $2,939m. This instrument matured and settled in January 2021.
10 These securities are included in the capital base of HSBC, in accordance with the grandfathering provisions under CRR II. In 2021, securities of $49m matured and were redeemed, and in addition approximately $109m were redeemed in June 2021 in relation to securities that matured at 31 December 2020. The latter were no longer eligible for inclusion in the capital base of HSBC at the end of 2020.
| | | | | | | | |
| HSBC Holdings’ subordinated liabilities |
| 2021 | 2020 |
| $m | $m |
| At amortised cost | 17,059 | | 17,916 | |
| Designated at fair value (Note 24) | 5,600 | | 6,040 | |
| At 31 Dec | 22,659 | | 23,956 | |
Notes on the financial statements
| | | | | | | | | | | | | | | | | |
| HSBC Holdings’ subordinated liabilities in issue |
| First call | Maturity | 2021 | 2020 |
| date | date | $m | $m |
| Tier 2 securities issued by HSBC Holdings | | | | |
| Amounts owed to third parties | | | | |
| $2,000m | 4.25% subordinated notes2,3 | — | | Mar 2024 | 2,072 | | 2,151 | |
| $1,500m | 4.25% subordinated notes2 | — | | Aug 2025 | 1,615 | | 1,702 | |
| $1,500m | 4.375% subordinated notes2 | — | | Nov 2026 | 1,641 | | 1,736 | |
| $488m | 7.625% subordinated notes1 | — | | May 2032 | 536 | | 541 | |
| $222m | 7.35% subordinated notes1 | — | | Nov 2032 | 241 | | 243 | |
| $2,000m | 6.50% subordinated notes1 | — | | May 2036 | 2,032 | | 2,034 | |
| $2,500m | 6.50% subordinated notes1 | — | | Sep 2037 | 2,825 | | 3,033 | |
| $1,500m | 6.80% subordinated notes1 | — | | Jun 2038 | 1,491 | | 1,490 | |
| $1,500m | 5.25% subordinated notes2 | — | | Mar 2044 | 1,946 | | 2,092 | |
| | | | | |
| £650m | 5.75% subordinated notes2 | — | | Dec 2027 | 1,040 | | 1,130 | |
| £650m | 6.75% subordinated notes2 | — | | Sep 2028 | 877 | | 884 | |
| £750m | 7.00% subordinated notes2 | — | | Apr 2038 | 1,082 | | 1,157 | |
| £900m | 6.00% subordinated notes2 | — | | Mar 2040 | 1,320 | | 1,483 | |
| | | | | |
| €1,500m | 3.0% subordinated notes2 | — | | Jun 2025 | 1,737 | | 1,916 | |
| €1,000m | 3.125% subordinated notes2 | — | | Jun 2028 | 1,304 | | 1,472 | |
| | | | 21,759 | | 23,064 | |
| Amounts owed to HSBC undertakings | | | | |
| $900m | 10.176% subordinated step-up cumulative notes | Jun 2030 | Jun 2040 | 900 | | 892 | |
| | | | 900 | | 892 | |
| At 31 Dec | | | 22,659 | | 23,956 | |
1Amounts owed to third parties represent securities included in the capital base of HSBC as tier 2 securities in accordance with the grandfathering provisions under CRR II.
2These securities are included in the capital base of HSBC as fully CRR II-compliant tier 2 securities on an end point basis.
3 These subordinated notes are measured at amortised cost in HSBC Holdings, where the interest rate risk is hedged using a fair value hedge, while they are measured at fair value in the Group.
Guaranteed by HSBC Holdings or HSBC Bank plc
Capital securities guaranteed by HSBC Holdings or HSBC Bank plc were issued by the Jersey limited partnerships. The proceeds of these were lent to the respective guarantors by the limited partnerships in the form of subordinated notes. They qualified as additional tier 1 capital for HSBC under CRR II until 31 December 2021 by virtue of the application of grandfathering provisions. The capital security guaranteed by HSBC Bank plc also qualified as additional tier 1 capital for HSBC Bank plc (on a solo and a consolidated basis) under CRR II until 31 December 2021 by virtue of the same grandfathering process. Since 31 December 2021, these securities have no longer qualified as regulatory capital for HSBC or HSBC Bank plc.
These preferred securities, together with the guarantee, are intended to provide investors with rights to income and capital distributions and distributions upon liquidation of the relevant issuer that are equivalent to the rights that they would have had if they had purchased non-cumulative perpetual preference shares of the relevant issuer. There are limitations on the payment of distributions if such payments are prohibited under UK banking regulations or other requirements, if a payment would cause a breach of HSBC’s capital adequacy requirements, or if HSBC Holdings or HSBC Bank plc has insufficient distributable reserves (as defined).
HSBC Holdings and HSBC Bank plc have individually covenanted that, if prevented under certain circumstances from paying distributions on the preferred securities in full, they will not pay dividends or other distributions in respect of their ordinary shares, or repurchase or redeem their ordinary shares, until the distribution on the preferred securities has been paid in full.
If the consolidated total capital ratio of HSBC Holdings falls below the regulatory minimum required or if the Directors expect it to do so in the near term, provided that proceedings have not been commenced for the liquidation, dissolution or winding up of HSBC Holdings, the holders’ interests in the preferred securities guaranteed by HSBC Holdings will be exchanged for interests in preference shares issued by HSBC Holdings that have economic terms which are in all material respects equivalent to the preferred securities and their guarantee.
If the preferred securities guaranteed by HSBC Bank plc are outstanding in November 2048, or if the total capital ratio of HSBC Bank plc (on a solo or consolidated basis) falls below the regulatory minimum required, or if the Directors expect it to do so in the near term, provided that proceedings have not been commenced for the liquidation, dissolution or winding up of HSBC Bank plc, the holders’ interests in the preferred security guaranteed by HSBC Bank plc will be exchanged for interests in preference shares issued by HSBC Bank plc that have economic terms which are in all material respects equivalent to the preferred security and its guarantee.
Tier 2 securities
Tier 2 capital securities are either perpetual or dated subordinated securities on which there is an obligation to pay coupons. These capital securities are included within HSBC's regulatory capital base as tier 2 capital under CRR II, either as fully eligible capital or by virtue of the application of grandfathering provisions. In accordance with CRR II, the capital contribution of all tier 2 securities is amortised for regulatory purposes in their final five years before maturity.
| | | | | |
| 29 | Maturity analysis of assets, liabilities and off-balance sheet commitments |
The table on page 402 provides an analysis of consolidated total assets, liabilities and off-balance sheet commitments by residual contractual maturity at the balance sheet date. These balances are included in the maturity analysis as follows:
•Trading assets and liabilities (including trading derivatives but excluding reverse repos, repos and debt securities in issue) are included in the ‘Due not more than 1 month’ time bucket, because trading balances are typically held for short periods of time.
•Financial assets and liabilities with no contractual maturity (such as equity securities) are included in the ‘Due over 5 years’ time bucket. Undated or perpetual instruments are classified based on the contractual notice period, which the counterparty of the instrument is entitled to give. Where there is no contractual notice period, undated or perpetual contracts are included in the ‘Due over 5 years’ time bucket.
•Non-financial assets and liabilities with no contractual maturity are included in the ‘Due over 5 years’ time bucket.
•Financial instruments included within assets and liabilities of disposal groups held for sale are classified on the basis of the contractual maturity of the underlying instruments and not on the basis of the disposal transaction.
•Liabilities under insurance contracts are irrespective of contractual maturity included in the ‘Due over 5 years’ time bucket in the maturity table provided below. An analysis of the expected maturity of liabilities under insurance contracts based on undiscounted cash flows is provided on page 251. Liabilities under investment contracts are classified in accordance with their contractual maturity. Undated investment contracts are included in the ‘Due over 5 years’ time bucket, although such contracts are subject to surrender and transfer options by the policyholders.
•Loan and other credit-related commitments are classified on the basis of the earliest date they can be drawn down.
Notes on the financial statements
HSBC
| | | | | | | | | | | | | | | | | | | | | | | | | | | | | |
| Maturity analysis of assets, liabilities and off-balance sheet commitments |
| Due not
more than
1 month | Due over
1 month
but not
more than
3 months | Due over
3 months
but not
more than
6 months | Due over
6 months
but not
more than
9 months | Due over
9 months
but not
more than
1 year | Due over
1 year
but not
more than
2 years | Due over
2 years
but not
more than
5 years | Due over
5 years | Total |
| $m | $m | $m | $m | $m | $m | $m | $m | $m |
| Financial assets | | | | | | | | | |
| Cash and balances at central banks | 403,018 | | — | | — | | — | | — | | — | | — | | — | | 403,018 | |
| Items in the course of collection from other banks | 4,136 | | — | | — | | — | | — | | — | | — | | — | | 4,136 | |
| Hong Kong Government certificates of indebtedness | 42,578 | | — | | — | | — | | — | | — | | — | | — | | 42,578 | |
| Trading assets | 244,422 | | 2,403 | | 440 | | 194 | | 468 | | 621 | | 294 | | — | | 248,842 | |
| Financial assets designated or otherwise mandatorily measured at fair value | 4,968 | | 89 | | 585 | | 515 | | 224 | | 855 | | 1,852 | | 40,716 | | 49,804 | |
| Derivatives | 195,701 | | 164 | | 85 | | 110 | | 233 | | 91 | | 310 | | 188 | | 196,882 | |
| Loans and advances to banks | 55,572 | | 10,889 | | 5,469 | | 1,078 | | 1,512 | | 5,321 | | 3,134 | | 161 | | 83,136 | |
| Loans and advances to customers | 160,583 | | 82,531 | | 69,380 | | 42,459 | | 42,651 | | 107,393 | | 220,746 | | 320,071 | | 1,045,814 | |
| – personal | 50,573 | | 11,373 | | 8,934 | | 8,022 | | 7,766 | | 25,271 | | 78,373 | | 284,922 | | 475,234 | |
| – corporate and commercial | 97,554 | | 64,511 | | 52,548 | | 29,341 | | 28,749 | | 72,441 | | 127,527 | | 32,664 | | 505,335 | |
| – financial | 12,456 | | 6,647 | | 7,898 | | 5,096 | | 6,136 | | 9,681 | | 14,846 | | 2,485 | | 65,245 | |
| Reverse repurchase agreements – non-trading | 155,997 | | 49,392 | | 18,697 | | 9,386 | | 3,661 | | 2,672 | | 1,843 | | — | | 241,648 | |
| Financial investments | 47,084 | | 68,034 | | 33,233 | | 20,638 | | 21,779 | | 49,903 | | 80,367 | | 125,236 | | 446,274 | |
| Accrued income and other financial assets | 79,077 | | 5,932 | | 2,935 | | 536 | | 537 | | 265 | | 812 | | 3,722 | | 93,816 | |
| Financial assets at 31 Dec 2021 | 1,393,136 | | 219,434 | | 130,824 | | 74,916 | | 71,065 | | 167,121 | | 309,358 | | 490,094 | | 2,855,948 | |
| Non-financial assets | — | | — | | — | | — | | — | | — | | — | | 101,991 | | 101,991 | |
| Total assets at 31 Dec 2021 | 1,393,136 | | 219,434 | | 130,824 | | 74,916 | | 71,065 | | 167,121 | | 309,358 | | 592,085 | | 2,957,939 | |
| Off-balance sheet commitments received | | | | | | | | | |
| Loan and other credit-related commitments | 49,061 | | — | | — | | — | | — | | — | | — | | — | | 49,061 | |
| Financial liabilities | | | | | | | | | |
| Hong Kong currency notes in circulation | 42,578 | | — | | — | | — | | — | | — | | — | | — | | 42,578 | |
| Deposits by banks | 63,660 | | 2,695 | | 2,419 | | 238 | | 125 | | 14,653 | | 16,734 | | 628 | | 101,152 | |
| Customer accounts | 1,615,025 | | 51,835 | | 19,167 | | 8,007 | | 9,710 | | 3,143 | | 3,585 | | 102 | | 1,710,574 | |
| – personal | 802,777 | | 24,725 | | 12,038 | | 5,961 | | 5,255 | | 2,304 | | 2,242 | | 26 | | 855,328 | |
| – corporate and commercial | 623,459 | | 22,980 | | 5,654 | | 1,762 | | 3,402 | | 706 | | 1,167 | | 33 | | 659,163 | |
| – financial | 188,789 | | 4,130 | | 1,475 | | 284 | | 1,053 | | 133 | | 176 | | 43 | | 196,083 | |
| Repurchase agreements – non-trading | 117,625 | | 4,613 | | 1,716 | | 292 | | 142 | | 975 | | 377 | | 930 | | 126,670 | |
| Items in the course of transmission to other banks | 5,214 | | — | | — | | — | | — | | — | | — | | — | | 5,214 | |
| Trading liabilities | 79,789 | | 3,810 | | 346 | | 218 | | 223 | | 445 | | 73 | | — | | 84,904 | |
Financial liabilities designated at
fair value | 18,080 | | 9,437 | | 4,514 | | 3,287 | | 4,485 | | 17,422 | | 42,116 | | 46,161 | | 145,502 | |
| – debt securities in issue: covered bonds | — | | 1,137 | | — | | — | | — | | 1,481 | | 1,160 | | — | | 3,778 | |
| – debt securities in issue: unsecured | 9,916 | | 5,967 | | 2,823 | | 2,259 | | 3,462 | | 14,758 | | 34,515 | | 35,282 | | 108,982 | |
| – subordinated liabilities and preferred securities | — | | — | | — | | — | | — | | — | | 5,371 | | 4,729 | | 10,100 | |
| – other | 8,164 | | 2,333 | | 1,691 | | 1,028 | | 1,023 | | 1,183 | | 1,070 | | 6,150 | | 22,642 | |
| Derivatives | 190,233 | | 46 | | 11 | | 30 | | 25 | | 100 | | 288 | | 331 | | 191,064 | |
| Debt securities in issue | 7,053 | | 7,777 | | 5,664 | | 6,880 | | 1,703 | | 9,045 | | 20,254 | | 20,181 | | 78,557 | |
| – covered bonds | — | | — | | — | | 997 | | — | | 996 | | 860 | | — | | 2,853 | |
| – otherwise secured | 957 | | 164 | | 42 | | 31 | | 193 | | 896 | | 1,696 | | 1,207 | | 5,186 | |
| – unsecured | 6,096 | | 7,613 | | 5,622 | | 5,852 | | 1,510 | | 7,153 | | 17,698 | | 18,974 | | 70,518 | |
|
| | | | | | | | | |
| | | | | | | | | |
| Accruals and other financial liabilities | 91,749 | | 10,317 | | 5,630 | | 1,103 | | 1,072 | | 1,948 | | 2,407 | | 2,829 | | 117,055 | |
| Subordinated liabilities | — | | 1 | | 11 | | — | | — | | 417 | | 2,055 | | 18,003 | | 20,487 | |
| Total financial liabilities at 31 Dec 2021 | 2,231,006 | | 90,531 | | 39,478 | | 20,055 | | 17,485 | | 48,148 | | 87,889 | | 89,165 | | 2,623,757 | |
| Non-financial liabilities | — | | — | | — | | — | | — | | — | | — | | 127,405 | | 127,405 | |
| Total liabilities at 31 Dec 2021 | 2,231,006 | | 90,531 | | 39,478 | | 20,055 | | 17,485 | | 48,148 | | 87,889 | | 216,570 | | 2,751,162 | |
| Off-balance sheet commitments given | | | | | | | | | |
| Loan and other credit-related commitments | 813,491 | | 121 | | 133 | | 228 | | 254 | | 78 | | 931 | | 238 | | 815,474 | |
| – personal | 239,207 | | 34 | | 34 | | 54 | | 108 | | 32 | | 688 | | 238 | | 240,395 | |
| – corporate and commercial | 456,498 | | 76 | | 91 | | 168 | | 143 | | 46 | | 243 | | — | | 457,265 | |
| – financial | 117,786 | | 11 | | 8 | | 6 | | 3 | | — | | — | | — | | 117,814 | |
| | | | | | | | | | | | | | | | | | | | | | | | | | | | | |
| Maturity analysis of assets, liabilities and off-balance sheet commitments (continued) |
| Due not
more than
1 month | Due over
1 month
but not
more than
3 months | Due over
3 months
but not
more than
6 months | Due over
6 months
but not
more than
9 months | Due over
9 months
but not
more than
1 year | Due over
1 year
but not
more than
2 years | Due over
2 years
but not
more than
5 years | Due over
5 years | Total |
| $m | $m | $m | $m | $m | $m | $m | $m | $m |
| Financial assets | | | | | | | | | |
| Cash and balances at central banks | 304,481 | | — | | — | | — | | — | | — | | — | | — | | 304,481 | |
| Items in the course of collection from other banks | 4,094 | | — | | — | | — | | — | | — | | — | | — | | 4,094 | |
| Hong Kong Government certificates of indebtedness | 40,420 | | — | | — | | — | | — | | — | | — | | — | | 40,420 | |
| Trading assets | 228,434 | | 1,778 | | 458 | | 135 | | 67 | | 644 | | 474 | | — | | 231,990 | |
| Financial assets designated at fair value | 3,061 | | 240 | | 466 | | 262 | | 454 | | 1,424 | | 1,992 | | 37,654 | | 45,553 | |
| Derivatives | 306,561 | | 15 | | 12 | | 14 | | 14 | | 441 | | 424 | | 245 | | 307,726 | |
| Loans and advances to banks | 51,652 | | 11,283 | | 5,640 | | 3,068 | | 2,284 | | 4,059 | | 3,359 | | 271 | | 81,616 | |
| Loans and advances to customers | 172,306 | | 70,746 | | 65,838 | | 44,392 | | 38,606 | | 112,440 | | 206,448 | | 327,211 | | 1,037,987 | |
| – personal | 51,711 | | 9,645 | | 7,918 | | 7,270 | | 7,033 | | 26,318 | | 70,447 | | 275,736 | | 456,078 | |
| – corporate and commercial | 101,684 | | 55,009 | | 51,755 | | 31,529 | | 28,553 | | 76,225 | | 125,393 | | 47,446 | | 517,594 | |
| – financial | 18,911 | | 6,092 | | 6,165 | | 5,593 | | 3,020 | | 9,897 | | 10,608 | | 4,029 | | 64,315 | |
Reverse repurchase agreements
– non-trading | 157,234 | | 44,658 | | 16,655 | | 5,113 | | 1,324 | | 3,058 | | 2,586 | | — | | 230,628 | |
| Financial investments | 47,270 | | 77,450 | | 44,255 | | 14,523 | | 24,112 | | 48,741 | | 100,007 | | 134,335 | | 490,693 | |
| Accrued income and other financial assets | 93,118 | | 5,951 | | 2,743 | | 475 | | 458 | | 267 | | 444 | | 2,107 | | 105,563 | |
| Financial assets at 31 Dec 2020 | 1,408,631 | | 212,121 | | 136,067 | | 67,982 | | 67,319 | | 171,074 | | 315,734 | | 501,823 | | 2,880,751 | |
| Non-financial assets | — | | — | | — | | — | | — | | — | | — | | 103,413 | | 103,413 | |
| Total assets at 31 Dec 2020 | 1,408,631 | | 212,121 | | 136,067 | | 67,982 | | 67,319 | | 171,074 | | 315,734 | | 605,236 | | 2,984,164 | |
| Off-balance sheet commitments received | | | | | | | | | |
| Loan and other credit-related commitments | 60,849 | | — | | — | | — | | — | | — | | — | | — | | 60,849 | |
| | | | | | | | | |
| Financial liabilities | | | | | | | | | |
| Hong Kong currency notes in circulation | 40,420 | | — | | — | | — | | — | | — | | — | | — | | 40,420 | |
| Deposits by banks | 60,973 | | 1,396 | | 714 | | 695 | | 197 | | 718 | | 16,757 | | 630 | | 82,080 | |
| Customer accounts | 1,533,595 | | 61,376 | | 22,568 | | 9,375 | | 8,418 | | 4,467 | | 2,859 | | 122 | | 1,642,780 | |
| – personal | 766,631 | | 32,429 | | 15,511 | | 6,276 | | 5,825 | | 3,591 | | 1,976 | | 39 | | 832,278 | |
| – corporate and commercial | 588,887 | | 22,856 | | 5,963 | | 2,966 | | 2,058 | | 627 | | 777 | | 37 | | 624,171 | |
| – financial | 178,077 | | 6,091 | | 1,094 | | 133 | | 535 | | 249 | | 106 | | 46 | | 186,331 | |
| Repurchase agreements – non-trading | 102,633 | | 3,979 | | 2,165 | | 386 | | 675 | | 16 | | 1,035 | | 1,012 | | 111,901 | |
| Items in the course of transmission to other banks | 4,343 | | — | | — | | — | | — | | — | | — | | — | | 4,343 | |
| Trading liabilities | 70,799 | | 3,377 | | 400 | | 143 | | 185 | | 289 | | 72 | | 1 | | 75,266 | |
| Financial liabilities designated at fair value | 18,434 | | 7,333 | | 6,973 | | 6,775 | | 6,593 | | 14,182 | | 40,510 | | 56,639 | | 157,439 | |
| – debt securities in issue: covered bonds | — | | — | | — | | — | | — | | 1,239 | | 2,918 | | — | | 4,157 | |
| – debt securities in issue: unsecured | 10,762 | | 4,470 | | 5,522 | | 5,604 | | 5,530 | | 10,455 | | 31,710 | | 42,825 | | 116,878 | |
| – subordinated liabilities and preferred securities | — | | — | | — | | — | | — | | — | | 3,912 | | 6,932 | | 10,844 | |
| – other | 7,672 | | 2,863 | | 1,451 | | 1,171 | | 1,063 | | 2,488 | | 1,970 | | 6,882 | | 25,560 | |
| Derivatives | 300,902 | | 264 | | 198 | | 38 | | 55 | | 237 | | 726 | | 581 | | 303,001 | |
| Debt securities in issue | 6,552 | | 12,329 | | 14,964 | | 9,764 | | 3,878 | | 9,215 | | 16,618 | | 22,172 | | 95,492 | |
| – covered bonds | — | | — | | 28 | | — | | 750 | | 1,275 | | 999 | | — | | 3,052 | |
| – otherwise secured | 1,094 | | 1,585 | | 1,001 | | 1,000 | | — | | 274 | | 1,640 | | 1,590 | | 8,184 | |
| – unsecured | 5,458 | | 10,744 | | 13,935 | | 8,764 | | 3,128 | | 7,666 | | 13,979 | | 20,582 | | 84,256 | |
| Accruals and other financial liabilities | 96,821 | | 9,794 | | 3,886 | | 692 | | 1,174 | | 1,742 | | 3,179 | | 3,053 | | 120,341 | |
| Subordinated liabilities | 619 | | — | | 237 | | — | | 12 | | 12 | | 2,658 | | 18,413 | | 21,951 | |
| Total financial liabilities at 31 Dec 2020 | 2,236,091 | | 99,848 | | 52,105 | | 27,868 | | 21,187 | | 30,878 | | 84,414 | | 102,623 | | 2,655,014 | |
| Non-financial liabilities | — | | — | | — | | — | | — | | — | | — | | 124,155 | | 124,155 | |
| Total liabilities at 31 Dec 2020 | 2,236,091 | | 99,848 | | 52,105 | | 27,868 | | 21,187 | | 30,878 | | 84,414 | | 226,778 | | 2,779,169 | |
| Off-balance sheet commitments given | | | | | | | | | |
| Loan and other credit-related commitments | 842,974 | | 435 | | 172 | | 243 | | 296 | | 180 | | 299 | | 171 | | 844,770 | |
| – personal | 235,606 | | 172 | | 27 | | 47 | | 115 | | 125 | | 288 | | 171 | | 236,551 | |
| – corporate and commercial | 471,410 | | 250 | | 138 | | 194 | | 178 | | 37 | | 11 | | — | | 472,218 | |
| – financial | 135,958 | | 13 | | 7 | | 2 | | 3 | | 18 | | — | | — | | 136,001 | |
Notes on the financial statements
HSBC Holdings
| | | | | | | | | | | | | | | | | | | | | | | | | | | | | |
| Maturity analysis of assets, liabilities and off-balance sheet commitments (continued) |
| Due not
more than
1 month | Due over
1 month
but not
more than
3 months | Due over
3 months
but not
more than
6 months | Due over
6 months
but not
more than
9 months | Due over
9 months
but not
more than
1 year | Due over
1 year
but not
more than
2 years | Due over
2 years
but not
more than
5 years | Due over
5 years | Total |
| $m | $m | $m | $m | $m | $m | $m | $m | $m |
| Financial assets | | | | | | | | | |
| Cash at bank and in hand: | | | | | | | | | |
| – balances with HSBC undertakings | 2,590 | | — | | — | | — | | — | | — | | — | | — | | 2,590 | |
| Derivatives | 1,101 | | — | | — | | — | | — | | 23 | | 585 | | 1,102 | | 2,811 | |
| Loans and advances to HSBC undertakings | 120 | | 750 | | 341 | | — | | 3,017 | | 5,608 | | 13,333 | | 1,939 | | 25,108 | |
| Financial assets with HSBC undertakings designated and otherwise mandatorily measured at fair value | — | | 1,759 | | 250 | | 1,019 | | — | | 5,987 | | 19,455 | | 22,938 | | 51,408 | |
| Financial investments | 8,377 | | 7,166 | | 3,014 | | 1,346 | | 3,026 | | 3,265 | | — | | — | | 26,194 | |
| Accrued income and other financial assets | 129 | | 874 | | 108 | | 58 | | 4 | | — | | — | | — | | 1,173 | |
| Total financial assets at 31 Dec 2021 | 12,317 | | 10,549 | | 3,713 | | 2,423 | | 6,047 | | 14,883 | | 33,373 | | 25,979 | | 109,284 | |
| Non-financial assets | — | | — | | — | | — | | — | | — | | — | | 163,888 | | 163,888 | |
| Total assets at 31 Dec 2021 | 12,317 | | 10,549 | | 3,713 | | 2,423 | | 6,047 | | 14,883 | | 33,373 | | 189,867 | | 273,172 | |
| | | | | | | | | |
| Financial liabilities | | | | | | | | | |
| Amounts owed to HSBC undertakings | — | | 111 | | — | | — | | — | | — | | — | | — | | 111 | |
| Financial liabilities designated at fair value | 397 | | 2,484 | | — | | — | | — | | 1,364 | | 11,276 | | 16,897 | | 32,418 | |
| – debt securities in issue | 397 | | 2,484 | | — | | — | | — | | 1,364 | | 8,020 | | 14,553 | | 26,818 | |
| – subordinated liabilities and preferred securities | — | | — | | — | | — | | — | | — | | 3,256 | | 2,344 | | 5,600 | |
| Derivatives | 1,167 | | — | | — | | — | | — | | 5 | | 1 | | 47 | | 1,220 | |
| Debt securities in issue | 1,051 | | — | | — | | — | | — | | 8,525 | | 29,889 | | 28,018 | | 67,483 | |
| Accruals and other financial liabilities | 1,778 | | 730 | | 1,612 | | 68 | | 12 | | — | | — | | 40 | | 4,240 | |
| Subordinated liabilities | — | | — | | — | | — | | — | | — | | 3,809 | | 13,250 | | 17,059 | |
| Total financial liabilities 31 Dec 2021 | 4,393 | | 3,325 | | 1,612 | | 68 | | 12 | | 9,894 | | 44,975 | | 58,252 | | 122,531 | |
| Non-financial liabilities | — | | — | | — | | — | | — | | — | | — | | 311 | | 311 | |
| Total liabilities at 31 Dec 2021 | 4,393 | | 3,325 | | 1,612 | | 68 | | 12 | | 9,894 | | 44,975 | | 58,563 | | 122,842 | |
| | | | | | | | | |
| | | | | | | | | |
| | | | | | | | | |
| | | | | | | | | | | | | | | | | | | | | | | | | | | | | |
|
| | | | | | | | | |
| | | | | | | | | |
| Financial assets | | | | | | | | | |
| Cash at bank and in hand: | | | | | | | | | |
| – balances with HSBC undertakings | 2,913 | | — | | — | | — | | — | | — | | — | | — | | 2,913 | |
| Derivatives | 1,473 | | — | | 5 | | — | | — | | 9 | | 1,131 | | 2,080 | | 4,698 | |
| Loans and advances to HSBC undertakings | — | | 600 | | 120 | | — | | — | | 312 | | 6,027 | | 3,384 | | 10,443 | |
| Loans and advances to HSBC undertakings designated at fair value | — | | 451 | | — | | — | | — | | 4,320 | | 23,203 | | 37,279 | | 65,253 | |
| Financial investments in HSBC undertakings | 3,701 | | 3,769 | | 2,924 | | 799 | | 3,528 | | 2,764 | | — | | — | | 17,485 | |
| Accrued income and other financial assets | 1,015 | | 275 | | 100 | | 33 | | 22 | | — | | — | | — | | 1,445 | |
| Total financial assets at 31 Dec 2020 | 9,102 | | 5,095 | | 3,149 | | 832 | | 3,550 | | 7,405 | | 30,361 | | 42,743 | | 102,237 | |
| Non-financial assets | — | | — | | — | | — | | — | | — | | — | | 160,936 | | 160,936 | |
| Total assets at 31 Dec 2020 | 9,102 | | 5,095 | | 3,149 | | 832 | | 3,550 | | 7,405 | | 30,361 | | 203,679 | | 263,173 | |
| | | | | | | | | |
| Financial liabilities | | | | | | | | | |
| Amounts owed to HSBC undertakings | — | | 330 | | — | | — | | — | | — | | — | | — | | 330 | |
| Financial liabilities designated at fair value | — | | 984 | | 859 | | — | | — | | 3,088 | | 3,810 | | 16,923 | | 25,664 | |
| – debt securities in issue | — | | 984 | | 859 | | — | | — | | 3,088 | | 2,108 | | 12,585 | | 19,624 | |
| – subordinated liabilities and preferred securities | — | | — | | — | | — | | — | | — | | 1,702 | | 4,338 | | 6,040 | |
| Derivatives | 3,052 | | — | | — | | — | | — | | — | | — | | 8 | | 3,060 | |
| Debt securities in issue | — | | 503 | | 1,621 | | 563 | | — | | 2,186 | | 24,489 | | 34,667 | | 64,029 | |
| Accruals and other financial liabilities | 3,769 | | 689 | | 301 | | 57 | | 12 | | — | | 1 | | 36 | | 4,865 | |
| Subordinated liabilities | — | | — | | — | | — | | — | | — | | 4,067 | | 13,849 | | 17,916 | |
| Total financial liabilities at 31 Dec 2020 | 6,821 | | 2,506 | | 2,781 | | 620 | | 12 | | 5,274 | | 32,367 | | 65,483 | | 115,864 | |
| Non-financial liabilities | — | | — | | — | | — | | — | | — | | — | | 509 | | 509 | |
| Total liabilities at 31 Dec 2020 | 6,821 | | 2,506 | | 2,781 | | 620 | | 12 | | 5,274 | | 32,367 | | 65,992 | | 116,373 | |
| | | | | | | | | |
| | | | | | | | | |
| | | | | | | | | |
Contractual maturity of financial liabilities
The following table shows, on an undiscounted basis, all cash flows relating to principal and future coupon payments (except for trading liabilities and derivatives not treated as hedging derivatives). For this reason, balances in the following table do not agree directly with those in our consolidated balance sheet. Undiscounted cash flows payable in relation to hedging derivative liabilities are classified according to their contractual maturities. Trading liabilities and derivatives not treated as hedging derivatives are included in the ‘Due not more than 1 month’ time bucket and not by contractual maturity.
In addition, loans and other credit-related commitments and financial guarantees are generally not recognised on our balance sheet. The undiscounted cash flows potentially payable under loan and other credit-related commitments and financial guarantees are classified on the basis of the earliest date they can be called.
| | | | | | | | | | | | | | | | | | | | |
| Cash flows payable by HSBC under financial liabilities by remaining contractual maturities | |
| Due not more
than 1 month | Due over
1 month but
not more than
3 months | Due over
3 months but
not more than
1 year | Due over
1 year but not
more than
5 years | Due over 5 years | Total |
| $m | $m | $m | $m | $m | $m |
| Deposits by banks | 63,684 | | 2,712 | | 2,800 | | 31,294 | | 643 | | 101,133 | |
| Customer accounts | 1,613,065 | | 54,092 | | 37,219 | | 7,093 | | 138 | | 1,711,607 | |
| Repurchase agreements – non-trading | 117,643 | | 4,615 | | 2,157 | | 1,359 | | 935 | | 126,709 | |
| Trading liabilities | 84,904 | | — | | — | | — | | — | | 84,904 | |
| Financial liabilities designated at fair value | 18,335 | | 9,760 | | 13,606 | | 63,834 | | 50,953 | | 156,488 | |
| Derivatives | 190,354 | | 192 | | 190 | | 1,792 | | 1,332 | | 193,860 | |
| Debt securities in issue | 7,149 | | 7,958 | | 15,142 | | 32,651 | | 21,911 | | 84,811 | |
| Subordinated liabilities | 119 | | 168 | | 848 | | 6,741 | | 28,347 | | 36,223 | |
| Other financial liabilities | 129,706 | | 9,842 | | 7,664 | | 4,577 | | 2,697 | | 154,486 | |
| 2,224,959 | | 89,339 | | 79,626 | | 149,341 | | 106,956 | | 2,650,221 | |
| Loan and other credit-related commitments | 813,471 | | 121 | | 615 | | 1,029 | | 238 | | 815,474 | |
Financial guarantees1 | 27,774 | | 6 | | 9 | | 6 | | — | | 27,795 | |
| At 31 Dec 2021 | 3,066,204 | | 89,466 | | 80,250 | | 150,376 | | 107,194 | | 3,493,490 | |
| Proportion of cash flows payable in period | 88% | 3% | 2% | 4% | 3% | |
| | | | | | |
| Deposits by banks | 61,001 | | 1,442 | | 1,639 | | 17,352 | | 632 | | 82,066 | |
| Customer accounts | 1,530,584 | | 64,809 | | 40,755 | | 7,720 | | 153 | | 1,644,021 | |
| Repurchase agreements – non-trading | 102,664 | | 3,984 | | 3,257 | | 1,058 | | 1,017 | | 111,980 | |
| Trading liabilities | 75,266 | | — | | — | | — | | — | | 75,266 | |
| Financial liabilities designated at fair value | 18,815 | | 7,556 | | 19,243 | | 59,835 | | 55,475 | | 160,924 | |
| Derivatives | 300,158 | | 356 | | 579 | | 1,830 | | 2,128 | | 305,051 | |
| Debt securities in issue | 6,551 | | 12,709 | | 29,520 | | 28,787 | | 24,075 | | 101,642 | |
| Subordinated liabilities | 739 | | 170 | | 1,102 | | 7,024 | | 28,812 | | 37,847 | |
| Other financial liabilities | 140,094 | | 9,120 | | 5,113 | | 5,030 | | 2,887 | | 162,244 | |
| 2,235,872 | | 100,146 | | 101,208 | | 128,636 | | 115,179 | | 2,681,041 | |
| Loan and other credit-related commitments | 842,945 | | 434 | | 740 | | 480 | | 171 | | 844,770 | |
Financial guarantees1 | 18,200 | | 13 | | 93 | | 37 | | 41 | | 18,384 | |
| At 31 Dec 2020 | 3,097,017 | | 100,593 | | 102,041 | | 129,153 | | 115,391 | | 3,544,195 | |
| Proportion of cash flows payable in period | 87% | 3% | 3% | 4% | 3% | |
1 Excludes performance guarantee contracts to which the impairment requirements in IFRS 9 are not applied.
HSBC Holdings
HSBC Holdings’ primary sources of liquidity are dividends received from subsidiaries, interest on and repayment of intra-Group loans and securities, and interest earned on its own liquid funds. HSBC Holdings also raises funds in the debt capital markets to meet the Group’s minimum requirement for own funds and eligible liabilities. HSBC Holdings uses this liquidity to meet its obligations, including interest and principal repayments on external debt liabilities, operating expenses and collateral on derivative transactions.
HSBC Holdings is also subject to contingent liquidity risk by virtue of credit-related commitments and guarantees and similar contracts issued relating to its subsidiaries. Such commitments and guarantees are only issued after due consideration of HSBC Holdings’ ability to finance the commitments and guarantees and the likelihood of the need arising.
HSBC Holdings actively manages the cash flows from its subsidiaries to optimise the amount of cash held at the holding company level. During 2021, consistent with the Group’s capital plan, the Group’s subsidiaries did not experience any significant restrictions on paying dividends or repaying loans and advances. Also, there are no foreseen restrictions envisaged with regard to planned dividends or payments. However, the ability of subsidiaries to pay dividends or advance monies to HSBC Holdings depends on, among other things, their respective local regulatory capital and banking requirements, exchange controls, statutory reserves, and financial and operating performance.
HSBC Holdings currently has sufficient liquidity to meet its present requirements.
Liquidity risk in HSBC Holdings is overseen by Holdings ALCO. This risk arises because of HSBC Holdings’ obligation to make payments to debt holders as they fall due and to pay its operating expenses. The liquidity risk related to these cash flows is managed by matching external debt obligations with internal loan cash flows and by maintaining an appropriate liquidity buffer that is monitored by Holdings ALCO.
The balances in the following table are not directly comparable with those on the balance sheet of HSBC Holdings as the table incorporates, on an undiscounted basis, all cash flows relating to principal and future coupon payments (except for derivatives not treated as hedging derivatives). Undiscounted cash flows payable in relation to hedging derivative liabilities are classified according to their contractual maturities. Derivatives not treated as hedging derivatives are included in the ‘On demand’ time bucket.
In addition, loan commitments and financial guarantees and similar contracts are generally not recognised on our balance sheet. The undiscounted cash flows potentially payable under financial guarantees and similar contracts are classified on the basis of the earliest date on which they can be called.
Notes on the financial statements
| | | | | | | | | | | | | | | | | | | | |
| Cash flows payable by HSBC Holdings under financial liabilities by remaining contractual maturities | |
| Due not more
than 1 month | Due over 1
month but not
more than 3
months | Due over 3
months but
not more than
1 year | Due over 1
year but not
more than 5
years | Due over
5 years | Total |
| $m | $m | $m | $m | $m | $m |
| Amounts owed to HSBC undertakings | — | | 111 | | — | | — | | — | | 111 | |
| Financial liabilities designated at fair value | 473 | | 2,611 | | 621 | | 15,017 | | 17,557 | | 36,279 | |
| Derivatives | 1,223 | | 9 | | 51 | | 414 | | 585 | | 2,282 | |
| Debt securities in issue | 1,196 | | 276 | | 1,286 | | 43,360 | | 30,800 | | 76,918 | |
| Subordinated liabilities | 81 | | 155 | | 722 | | 7,222 | | 20,777 | | 28,957 | |
| Other financial liabilities | 1,778 | | 730 | | 1,692 | | — | | 40 | | 4,240 | |
| 4,751 | | 3,892 | | 4,372 | | 66,013 | | 69,759 | | 148,787 | |
| Loan commitments | — | | — | | — | | — | | — | | — | |
Financial guarantees1 | 13,746 | | — | | — | | — | | — | | 13,746 | |
| At 31 Dec 2021 | 18,497 | | 3,892 | | 4,372 | | 66,013 | | 69,759 | | 162,533 | |
| | | | | | |
| Amounts owed to HSBC undertakings | — | | 330 | | — | | — | | — | | 330 | |
| Financial liabilities designated at fair value | 70 | | 1,109 | | 1,412 | | 9,110 | | 16,104 | | 27,805 | |
| Derivatives | 3,085 | | — | | 2 | | — | | — | | 3,087 | |
| Debt securities in issue | 135 | | 760 | | 3,354 | | 31,567 | | 37,103 | | 72,919 | |
| Subordinated liabilities | 82 | | 156 | | 726 | | 7,513 | | 21,552 | | 30,029 | |
| Other financial liabilities | 3,769 | | 690 | | 370 | | — | | 36 | | 4,865 | |
| 7,141 | | 3,045 | | 5,864 | | 48,190 | | 74,795 | | 139,035 | |
| Loan commitments | — | | — | | — | | — | | — | | — | |
Financial guarantees1 | 13,787 | | — | | — | | — | | — | | 13,787 | |
| At 31 Dec 2020 | 20,928 | | 3,045 | | 5,864 | | 48,190 | | 74,795 | | 152,822 | |
1 Excludes performance guarantee contracts to which the impairment requirements in IFRS 9 are not applied.
| | | | | |
| 30 | Offsetting of financial assets and financial liabilities |
In the following table, the ‘Amounts not set off in the balance sheet’ include transactions where:
•the counterparty has an offsetting exposure with HSBC and a master netting or similar arrangement is in place with a right to set off only in the event of default, insolvency or bankruptcy, or the offset criteria are otherwise not satisfied; and
•in the case of derivatives and reverse repurchase/repurchase, stock borrowing/lending and similar agreements, cash and non-cash collateral has been received/pledged.
For risk management purposes, the net amounts of loans and advances to customers are subject to limits, which are monitored and the relevant customer agreements are subject to review and updated, as necessary, to ensure the legal right to set off remains appropriate.
| | | | | | | | | | | | | | | | | | | | | | | | | | | | | |
| Offsetting of financial assets and financial liabilities |
| Amounts subject to enforceable netting arrangements | Amounts not subject to enforceable netting arrangements5 | Total |
| | | | Amounts not set off in the
balance sheet | |
| Gross
amounts | Amounts
offset | Net
amounts in
the balance
sheet | Financial
instruments | Non-cash
collateral | Cash
collateral | Net
amount |
| $m | $m | $m | $m | $m | $m | $m | $m | $m |
| Financial assets | | | | | | | | | |
Derivatives (Note 15)1 | 244,694 | | (53,378) | | 191,316 | | (139,945) | | (11,359) | | (36,581) | | 3,431 | | 5,566 | | 196,882 | |
Reverse repos, stock borrowing and similar agreements classified as:2 | | | | | | | | | |
| – trading assets | 21,568 | | (222) | | 21,346 | | (359) | | (20,913) | | (71) | | 3 | | 1,729 | | 23,075 | |
| – non-trading assets | 353,066 | | (136,932) | | 216,134 | | (12,226) | | (203,543) | | (165) | | 200 | | 25,731 | | 241,865 | |
Loans and advances to customers3 | 27,045 | | (10,919) | | 16,126 | | (13,065) | | — | | — | | 3,061 | | 327 | | 16,453 | |
| At 31 Dec 2021 | 646,373 | | (201,451) | | 444,922 | | (165,595) | | (235,815) | | (36,817) | | 6,695 | | 33,353 | | 478,275 | |
| | | | | | | | | |
Derivatives (Note 15)1 | 368,057 | | (69,103) | | 298,954 | | (230,758) | | (13,766) | | (48,154) | | 6,276 | | 8,772 | | 307,726 | |
Reverse repos, stock borrowing and similar agreements classified as:2 | | | | | | | | | |
| – trading assets | 21,204 | | (461) | | 20,743 | | (709) | | (20,030) | | — | | 4 | | 1,534 | | 22,277 | |
| – non-trading assets | 318,424 | | (115,678) | | 202,746 | | (13,936) | | (188,646) | | (73) | | 91 | | 28,258 | | 231,004 | |
Loans and advances to customers3 | 30,983 | | (10,882) | | 20,101 | | (17,031) | | — | | — | | 3,070 | | 428 | | 20,529 | |
| At 31 Dec 2020 | 738,668 | | (196,124) | | 542,544 | | (262,434) | | (222,442) | | (48,227) | | 9,441 | | 38,992 | | 581,536 | |
| | | | | | | | | |
| Financial liabilities | | | | | | | | | |
Derivatives (Note 15)1 | 239,597 | | (53,378) | | 186,219 | | (139,945) | | (23,414) | | (18,225) | | 4,635 | | 4,845 | | 191,064 | |
Repos, stock lending and similar agreements classified as:2 | | | | | | | | | |
| – trading liabilities | 13,540 | | (222) | | 13,318 | | (359) | | (12,959) | | — | | — | | 17 | | 13,335 | |
| – non-trading liabilities | 235,042 | | (136,932) | | 98,110 | | (12,226) | | (85,590) | | (203) | | 91 | | 28,560 | | 126,670 | |
Customer accounts4 | 40,875 | | (10,919) | | 29,956 | | (13,065) | | — | | — | | 16,891 | | 17 | | 29,973 | |
| At 31 Dec 2021 | 529,054 | | (201,451) | | 327,603 | | (165,595) | | (121,963) | | (18,428) | | 21,617 | | 33,439 | | 361,042 | |
| | | | | | | | | |
Derivatives (Note 15)1 | 364,121 | | (69,103) | | 295,018 | | (230,758) | | (21,387) | | (37,343) | | 5,530 | | 7,983 | | 303,001 | |
Repos, stock lending and similar agreements classified as:2 | | | | | | | | | |
| – trading liabilities | 16,626 | | (461) | | 16,165 | | (709) | | (15,456) | | — | | — | | 159 | | 16,324 | |
| – non-trading liabilities | 200,999 | | (115,678) | | 85,321 | | (13,936) | | (71,142) | | (215) | | 28 | | 26,580 | | 111,901 | |
Customer accounts4 | 41,177 | | (10,882) | | 30,295 | | (17,031) | | — | | — | | 13,264 | | 13 | | 30,308 | |
| At 31 Dec 2020 | 622,923 | | (196,124) | | 426,799 | | (262,434) | | (107,985) | | (37,558) | | 18,822 | | 34,735 | | 461,534 | |
1 At 31 December 2021, the amount of cash margin received that had been offset against the gross derivatives assets was $4,469m (2020: $7,899m). The amount of cash margin paid that had been offset against the gross derivatives liabilities was $9,479m (2020: $17,955m).
2 For the amount of repos, reverse repos, stock lending, stock borrowing and similar agreements recognised on the balance sheet within ‘Trading assets’ $23,075m (2020: $22,277m) and ‘Trading liabilities’ $13,335m (2020: $16,324m), see the ‘Funding sources and uses’ table on page 233.
3 At 31 December 2021, the total amount of ‘Loans and advances to customers’ was $1,045,814m (2020: $1,037,987m), of which $16,126m (2020: $20,101m) was subject to offsetting.
4 At 31 December 2021, the total amount of ‘Customer accounts’ was $1,710,574m (2020: $1,642,780m), of which $29,956m (2020: $30,295m) was subject to offsetting.
5 These exposures continue to be secured by financial collateral, but we may not have sought or been able to obtain a legal opinion evidencing enforceability of the right of offset.
| | | | | |
| 31 | Called up share capital and other equity instruments |
Called up share capital and share premium
| | | | | | | | | | | | | | |
| HSBC Holdings ordinary shares of $0.50 each, issued and fully paid |
| 2021 | 2020 |
| Number | $m | Number | $m |
| At 1 Jan | 20,693,621,100 | | 10,347 | | 20,638,524,545 | | 10,319 | |
| Shares issued under HSBC employee share plans | 58,266,053 | | 29 | | 55,096,555 | | 28 | |
| Shares issued in lieu of dividends | — | | — | | — | | — | |
| Less: Shares repurchased and cancelled | 120,366,714 | | 60 | | — | | — | |
At 31 Dec1 | 20,631,520,439 | | 10,316 | | 20,693,621,100 | | 10,347 | |
Notes on the financial statements
| | | | | | | | | | | | | | |
| HSBC Holdings 6.2% non-cumulative US dollar preference shares, Series A | | | |
| 2021 | 2020 |
| Number | $m | Number | $m |
At 1 Jan and 31 Dec2 | — | | — | | 1,450,000 | | — | |
| | | | | | | | | |
| HSBC Holdings share premium | |
| 2021 | 2020 | |
| $m | $m | |
| At 31 Dec | 14,602 | | 14,277 | | |
| | | | | | | | |
| Total called up share capital and share premium |
| 2021 | 2020 |
| $m | $m |
| At 31 Dec | 24,918 | | 24,624 | |
1 All HSBC Holdings ordinary shares in issue, excluding 325,273,407 shares held in treasury, confer identical rights, including in respect of capital, dividends and voting.
2 In 2019 this security was included in the capital base of HSBC as additional tier 1 capital in accordance with the CRR II rules, by virtue of the application of grandfathering provisions. This security was called by HSBC Holdings on 10 December 2020 and was redeemed and cancelled on 13 January 2021. Between the date of exercise of the call option and the redemption, this security was considered as an other liability.
HSBC Holdings 6.20% non-cumulative US dollar preference shares, Series A of $0.01
The 6.20% non-cumulative US dollar preference shares, Series A of $0.01 each were redeemed on 13 January 2021.
HSBC Holdings non-cumulative preference share of £0.01
The one non-cumulative sterling preference share of £0.01 (‘sterling preference share’) has been in issue since 29 December 2010 and is held by a subsidiary of HSBC Holdings. Dividends are paid quarterly at the sole and absolute discretion of the Board. The sterling preference share carries no rights of conversion into ordinary shares of HSBC Holdings and no right to attend or vote at shareholder meetings of HSBC Holdings. These securities can be redeemed by HSBC Holdings at any time, subject to prior approval by the PRA.
Other equity instruments
HSBC Holdings has included three types of additional tier 1 capital securities in its tier 1 capital. Two are presented in this Note and they are the HSBC Holdings US dollar non-cumulative preference shares outlined above (which were redeemed in January 2021) and the contingent convertible securities described below. These are accounted for as equity because HSBC does not have an obligation to transfer cash or a variable number of its own ordinary shares to holders under any circumstances outside its control. See Note 28 for additional tier 1 securities accounted for as liabilities.
Additional tier 1 capital – contingent convertible securities
HSBC Holdings continues to issue contingent convertible securities that are included in its capital base as fully CRR II-compliant additional tier 1 capital securities on an end point basis. These securities are marketed principally and subsequently allotted to corporate investors and fund managers. The net proceeds of the issuances are typically used for HSBC Holdings’ general corporate purposes and to further strengthen its capital base to meet requirements under CRR II. These securities bear a fixed rate of interest until their initial call dates. After the initial call dates, if they are not redeemed, the securities will bear interest at rates fixed periodically in advance for five-year periods based on credit spreads, fixed at issuance, above prevailing market rates. Interest on the contingent convertible securities will be due and payable only at the sole discretion of HSBC Holdings, and HSBC Holdings has sole and absolute discretion at all times to cancel for any reason (in whole or part) any interest payment that would otherwise be payable on any payment date. Distributions will not be paid if they are prohibited under UK banking regulations or if the Group has insufficient reserves or fails to meet the solvency conditions defined in the securities’ terms.
The contingent convertible securities are undated and are repayable at the option of HSBC Holdings in whole typically at the initial call date or on any fifth anniversary after this date. In addition, the securities are repayable at the option of HSBC in whole for certain regulatory or tax reasons. Any repayments require the prior consent of the PRA. These securities rank pari passu with HSBC Holdings’ sterling preference shares and therefore rank ahead of ordinary shares. The contingent convertible securities will be converted into fully paid ordinary shares of HSBC Holdings at a predetermined price, should HSBC’s consolidated non-transitional CET1 ratio fall below 7.0%. Therefore, in accordance with the terms of the securities, if the non-transitional CET1 ratio breaches the 7.0% trigger, the securities will convert into ordinary shares at fixed contractual conversion prices in the issuance currencies of the relevant securities, subject to anti-dilution adjustments.
| | | | | | | | | | | | | | | |
| HSBC’s additional tier 1 capital – contingent convertible securities in issue which are accounted for in equity |
| | | First call
date | 2021 | 2020 |
| | | $m | $m |
| | | | | |
| $2,000m | 6.875% perpetual subordinated contingent convertible securities1 | | Jun 2021 | — | | 2,000 | |
| $2,250m | 6.375% perpetual subordinated contingent convertible securities | | Sep 2024 | 2,250 | | 2,250 | |
| $2,450m | 6.375% perpetual subordinated contingent convertible securities | | Mar 2025 | 2,450 | | 2,450 | |
| $3,000m | 6.000% perpetual subordinated contingent convertible securities | | May 2027 | 3,000 | | 3,000 | |
| $2,350m | 6.250% perpetual subordinated contingent convertible securities | | Mar 2023 | 2,350 | | 2,350 | |
| $1,800m | 6.500% perpetual subordinated contingent convertible securities | | Mar 2028 | 1,800 | | 1,800 | |
| $1,500m | 4.600% perpetual subordinated contingent convertible securities2 | | Dec 2030 | 1,500 | | 1,500 | |
| $1,000m | 4.000% perpetual subordinated contingent convertible securities3 | | Mar 2026 | 1,000 | | — | |
| $1,000m | 4.700% perpetual subordinated contingent convertible securities4 | | Mar 2031 | 1,000 | | — | |
| | | | | |
| €1,500m | 5.250% perpetual subordinated contingent convertible securities | | Sep 2022 | 1,945 | | 1,945 | |
| €1,000m | 6.000% perpetual subordinated contingent convertible securities | | Sep 2023 | 1,123 | | 1,123 | |
| €1,250m | 4.750% perpetual subordinated contingent convertible securities | | Jul 2029 | 1,422 | | 1,422 | |
| | | | | |
| £1,000 | 5.875% perpetual subordinated contingent convertible securities | | Sep 2026 | 1,301 | | 1,301 | |
| SGD1,000m | 4.700% perpetual subordinated contingent convertible securities | | Jun 2022 | 723 | | 723 | |
| SGD750m | 5.000% perpetual subordinated contingent convertible securities | | Sep 2023 | 550 | | 550 | |
| At 31 Dec | | | 22,414 | | 22,414 | |
1 This security was called by HSBC Holdings on 15 April 2021 and was redeemed and cancelled on 1 June 2021.
2 This security was issued by HSBC Holdings on 17 December 2020. The first call date commences six calendar months prior to the reset date of
17 June 2031.
3 This security was issued by HSBC Holdings on 9 March 2021. The first call date commences six calendar months prior to the reset date of
9 September 2026.
4 This security was issued by HSBC Holdings on 9 March 2021. The first call date commences six calendar months prior to the reset date of
9 September 2031.
Shares under option
For details of the options outstanding to subscribe for HSBC Holdings ordinary shares under the HSBC Holdings Savings-Related Share Option Plan (UK), see Note 5.
| | | | | | | | | | | | | | | | | |
| Aggregate options outstanding under these plans |
| 31 Dec 2021 | 31 Dec 2020 |
Number of HSBC Holdings ordinary shares | Usual period of exercise | Exercise price | Number of
HSBC Holdings
ordinary shares | Usual period of exercise | Exercise price |
| 123,196,850 | | 2020 to 2027 | £2.6270–£5.9640 | 130,952,539 | | 2019 to 2026 | £2.6270–£5.9640
|
Maximum obligation to deliver HSBC Holdings ordinary shares
At 31 December 2021, the maximum obligation to deliver HSBC Holdings ordinary shares under all of the above option arrangements and the HSBC International Employee Share Purchase Plan, together with long-term incentive awards and deferred share awards granted under the HSBC Share Plan 2011, was 224,974,433 (2020: 238,278,952). The total number of shares at 31 December 2021 held by employee benefit trusts that may be used to satisfy such obligations to deliver HSBC Holdings ordinary shares was 9,297,415 (2020: 5,179,531).
| | | | | |
| 32 | Contingent liabilities, contractual commitments and guarantees |
| | | | | | | | | | | | | | |
| HSBC | HSBC Holdings1 |
| 2021 | 2020 | 2021 | 2020 |
| $m | $m | $m | $m |
| Guarantees and other contingent liabilities: | | | | |
| – financial guarantees | 27,795 | | 18,384 | | 13,746 | | 13,787 |
| – performance and other guarantees | 85,534 | | 78,114 | | — | | — |
| – other contingent liabilities | 858 | | 1,219 | | 133 | | 119 | |
| At 31 Dec | 114,187 | | 97,717 | | 13,879 | | 13,906 |
Commitments:2 | | | | |
| – documentary credits and short-term trade-related transactions | 8,827 | | 7,178 | | — | | — | |
| – forward asset purchases and forward deposits placed | 47,184 | | 66,506 | | — | | — | |
| – standby facilities, credit lines and other commitments to lend | 759,463 | | 771,086 | | — | | — | |
| At 31 Dec | 815,474 | | 844,770 | | — | | — | |
1 Guarantees by HSBC Holdings are all in favour of other Group entities.
2 Includes $627,637m of commitments at 31 December 2021 (31 December 2020: $659,783m), to which the impairment requirements in IFRS 9 are applied where HSBC has become party to an irrevocable commitment.
The preceding table discloses the nominal principal amounts of off-balance sheet liabilities and commitments for the Group, which represent the maximum amounts at risk should the contracts be fully drawn upon and the clients default. As a significant portion of guarantees and commitments are expected to expire without being drawn upon, the total of the nominal principal amounts is not indicative of future liquidity requirements. The expected credit loss provision relating to guarantees and commitments under IFRS 9 is disclosed in Note 27.
Notes on the financial statements
The majority of the guarantees have a term of less than one year, while guarantees with terms of more than one year are subject to HSBC’s annual credit review process.
Contingent liabilities arising from legal proceedings, regulatory and other matters against Group companies are excluded from this note but are disclosed in Notes 27 and 34.
Financial Services Compensation Scheme
The Financial Services Compensation Scheme (‘FSCS’) provides compensation, up to certain limits, to eligible customers of financial
services firms that are unable, or likely to be unable, to pay claims against them. The FSCS may impose a further levy on HSBC UK to the
extent the industry levies imposed to date are not sufficient to cover the compensation due to customers in any future possible collapse.
The ultimate FSCS levy to the industry as a result of a collapse cannot be estimated reliably. It is dependent on various uncertain factors
including the potential recovery of assets by the FSCS, changes in the level of protected products (including deposits and investments)
and the population of FSCS members at the time.
Associates
HSBC’s share of associates’ contingent liabilities, contractual commitments and guarantees amounted to $63.5bn at 31 December 2021 (2020: $53.1bn). No matters arose where HSBC was severally liable.
| | | | | |
| 33 | Finance lease receivables |
HSBC leases a variety of assets to third parties under finance leases, including transport assets (such as aircraft), property and general plant and machinery. At the end of lease terms, assets may be sold to third parties or leased for further terms. Rentals are calculated to recover the cost of assets less their residual value, and earn finance income.
| | | | | | | | | | | | | | | | | | | | |
| 2021 | 2020 |
| Total future
minimum
payments | Unearned
finance
income | Present
value | Total future minimum payments | Unearned finance income | Present value |
| $m | $m | $m | $m | $m | $m |
| Lease receivables: | | | | | | |
| No later than one year | 3,298 | | (303) | | 2,995 | | 3,108 | | (257) | | 2,851 | |
| | | | | | |
| One to two years | 2,303 | | (242) | | 2,061 | | 2,476 | | (196) | | 2,280 | |
| Two to three years | 1,645 | | (192) | | 1,453 | | 2,055 | | (143) | | 1,912 | |
| Three to four years | 1,225 | | (146) | | 1,079 | | 1,380 | | (109) | | 1,271 | |
| Four to five years | 795 | | (113) | | 682 | | 787 | | (80) | | 707 | |
| Later than one year and no later than five years | 5,968 | | (693) | | 5,275 | | 6,698 | | (528) | | 6,170 | |
| Later than five years | 4,044 | | (528) | | 3,516 | | 4,221 | | (451) | | 3,770 | |
| At 31 Dec | 13,310 | | (1,524) | | 11,786 | | 14,027 | | (1,236) | | 12,791 | |
| | | | | |
| 34 | Legal proceedings and regulatory matters |
HSBC is party to legal proceedings and regulatory matters in a number of jurisdictions arising out of its normal business operations. Apart from the matters described below, HSBC considers that none of these matters are material. The recognition of provisions is determined in accordance with the accounting policies set out in Note 1. While the outcomes of legal proceedings and regulatory matters are inherently uncertain, management believes that, based on the information available to it, appropriate provisions have been made in respect of these matters as at 31 December 2021 (see Note 27). Where an individual provision is material, the fact that a provision has been made is stated and quantified, except to the extent that doing so would be seriously prejudicial. Any provision recognised does not constitute an admission of wrongdoing or legal liability. It is not practicable to provide an aggregate estimate of potential liability for our legal proceedings and regulatory matters as a class of contingent liabilities.
Bernard L. Madoff Investment Securities LLC
Various non-US HSBC companies provided custodial, administration and similar services to a number of funds incorporated outside the US whose assets were invested with Bernard L. Madoff Investment Securities LLC (‘Madoff Securities’). Based on information provided by Madoff Securities as at 30 November 2008, the purported aggregate value of these funds was $8.4bn, including fictitious profits reported by Madoff. Based on information available to HSBC, the funds’ actual transfers to Madoff Securities minus their actual withdrawals from Madoff Securities during the time HSBC serviced the funds are estimated to have totalled approximately $4bn. Various HSBC companies have been named as defendants in lawsuits arising out of Madoff Securities’ fraud.
US litigation: The Madoff Securities Trustee has brought lawsuits against various HSBC companies and others in the US Bankruptcy Court for the Southern District of New York (the ‘US Bankruptcy Court’), seeking recovery of transfers from Madoff Securities to HSBC in an amount not yet pleaded or determined. Following an initial dismissal of certain claims, which was later reversed on appeal, the cases were remanded to the US Bankruptcy Court, where they are now pending.
Fairfield Sentry Limited, Fairfield Sigma Limited and Fairfield Lambda Limited (together, ‘Fairfield’) (in liquidation since July 2009) have brought a lawsuit in the US against fund shareholders, including HSBC companies that acted as nominees for clients, seeking restitution of redemption payments. In December 2018, the US Bankruptcy Court dismissed certain claims by the Fairfield liquidators and granted a motion by the liquidators to file amended complaints. In May 2019, the liquidators appealed certain issues from the US Bankruptcy Court to the US District Court for the Southern District of New York (the ’New York District Court’), and these appeals remain pending.
In January 2020, the Fairfield liquidators filed amended complaints on the claims remaining in the US Bankruptcy Court. In December 2020, the US Bankruptcy Court dismissed the majority of those claims. In March 2021, the liquidators and defendants appealed the US Bankruptcy Court’s decision to the New York District Court, and these appeals are currently pending. Meanwhile, proceedings before the US Bankruptcy Court with respect to the remaining claims that were not dismissed are ongoing.
UK litigation: The Madoff Securities Trustee has filed a claim against various HSBC companies in the High Court of England and Wales, seeking recovery of transfers from Madoff Securities to HSBC in an amount not yet pleaded or determined. The deadline for service of the claim has been extended to September 2022 for UK-based defendants and November 2022 for all other defendants.
Cayman Islands litigation: In February 2013, Primeo Fund (‘Primeo’) (in liquidation since April 2009) brought an action against HSBC Securities Services Luxembourg (‘HSSL’) and Bank of Bermuda (Cayman) Limited (now known as HSBC Cayman Limited), alleging breach of contract and breach of fiduciary duty and claiming damages and equitable compensation. The trial concluded in February 2017 and, in August 2017, the court dismissed all claims against the defendants. In September 2017, Primeo appealed to the Court of Appeal of the Cayman Islands and, in June 2019, the Court of Appeal of the Cayman Islands dismissed Primeo’s appeal. In August 2019, Primeo filed a notice of appeal to the UK Privy Council. NaN hearings before the UK Privy Council took place during 2021. Judgment was given against HSBC in respect of the first hearing and judgment is pending in respect of the second hearing.
Luxembourg litigation: In April 2009, Herald Fund SPC (‘Herald’) (in liquidation since July 2013) brought an action against HSSL before the Luxembourg District Court, seeking restitution of cash and securities that Herald purportedly lost because of Madoff Securities’ fraud, or money damages. The Luxembourg District Court dismissed Herald’s securities restitution claim, but reserved Herald’s cash restitution and money damages claims. Herald has appealed this judgment to the Luxembourg Court of Appeal, where the matter is pending. In late 2018, Herald brought additional claims against HSSL and HSBC Bank plc before the Luxembourg District Court, seeking further restitution and damages.
In October 2009, Alpha Prime Fund Limited (‘Alpha Prime’) brought an action against HSSL before the Luxembourg District Court, seeking the restitution of securities, or the cash equivalent, or money damages. In December 2018, Alpha Prime brought additional claims before the Luxembourg District Court seeking damages against various HSBC companies. These matters are currently pending before the Luxembourg District Court.
In December 2014, Senator Fund SPC (‘Senator’) brought an action against HSSL before the Luxembourg District Court, seeking restitution of securities, or the cash equivalent, or money damages. In April 2015, Senator commenced a separate action against the Luxembourg branch of HSBC Bank plc asserting identical claims before the Luxembourg District Court. In December 2018, Senator brought additional claims against HSSL and HSBC Bank plc Luxembourg branch before the Luxembourg District Court, seeking restitution of Senator’s securities or money damages. These matters are currently pending before the Luxembourg District Court.
There are many factors that may affect the range of possible outcomes, and any resulting financial impact, of the various Madoff-related proceedings described above, including but not limited to the multiple jurisdictions in which the proceedings have been brought. Based upon the information currently available, management’s estimate of the possible aggregate damages that might arise as a result of all claims in the various Madoff-related proceedings is around $600m, excluding costs and interest. Due to uncertainties and limitations of this estimate, any possible damages that might ultimately arise could differ significantly from this amount.
Anti-money laundering and sanctions-related matters
In December 2012, HSBC Holdings entered into a number of agreements, including an undertaking with the UK Financial Services Authority (replaced with a Direction issued by the UK Financial Conduct Authority (‘FCA’) in 2013 and again in 2020) as well as a cease-and-desist order with the US Federal Reserve Board (‘FRB’), both of which contained certain forward-looking anti-money laundering (‘AML’) and sanctions-related obligations. Over the past several years, HSBC has retained a Skilled Person under section 166 of the Financial Services and Markets Act and an Independent Consultant under the FRB cease-and-desist order to produce periodic assessments of the Group’s AML and sanctions compliance programme. The Skilled Person completed its engagement in the second quarter of 2021, and the FCA has determined that no further Skilled Person work is required. Separately, the Independent Consultant continues to work pursuant to the FRB cease-and-desist order. The roles of each of the FCA Skilled Person and the FRB Independent Consultant are discussed on page 245.
In December 2021, the FCA concluded its investigation into HSBC’s compliance with UK money laundering regulations and financial crime systems and control requirements. The FCA imposed a fine on HSBC Bank plc, which has been paid.
Since November 2014, a number of lawsuits have been filed in federal courts in the US against various HSBC companies and others on behalf of plaintiffs who are, or are related to, victims of terrorist attacks in the Middle East. In each case, it is alleged that the defendants aided and abetted the unlawful conduct of various sanctioned parties in violation of the US Anti-Terrorism Act. Currently, 9 actions remain pending in federal courts in New York or the District of Columbia. The courts have granted HSBC’s motions to dismiss in 5 of these cases; appeals remain pending in 2 cases, and the remaining 3 dismissals are also subject to appeal. The 4 remaining actions are at an early stage.
Based on the facts currently known, it is not practicable to predict the resolution of these matters, including the timing or any possible impact on HSBC, which could be significant.
London interbank offered rates, European interbank offered rates and other benchmark interest rate investigations and litigation
Euro interest rate derivatives: In December 2016, the European Commission (‘EC’) issued a decision finding that HSBC, among other banks, engaged in anti-competitive practices in connection with the pricing of euro interest rate derivatives in early 2007. The EC imposed a fine on HSBC based on a one-month infringement. In September 2019, the General Court of the European Union (the ‘General Court’) issued a decision largely upholding the EC’s findings on liability but annulling the fine. HSBC and the EC both appealed the General Court’s decision to the European Court of Justice (the ‘Court of Justice’). In June 2021, the EC adopted a new fining decision for an amount that was 5% less than the previously annulled fine, and it subsequently withdrew its appeal to the Court of Justice. HSBC has appealed the EC’s June 2021 fining decision to the General Court, and its appeal to the Court of Justice on liability also remains pending.
US dollar Libor: Beginning in 2011, HSBC and other panel banks have been named as defendants in a number of private lawsuits filed in the US with respect to the setting of US dollar Libor. The complaints assert claims under various US laws, including US antitrust and racketeering laws, the US Commodity Exchange Act (‘US CEA’) and state law. The lawsuits include individual and putative class actions, most of which have been transferred and/or consolidated for pre-trial purposes before the New York District Court. HSBC has reached class settlements with 5 groups of plaintiffs, and the court has approved these settlements. HSBC has also resolved several of the individual actions, although a number of other US dollar Libor-related actions remain pending against HSBC in the New York District Court.
Intercontinental Exchange (‘ICE’) Libor: Between January and March 2019, HSBC and other panel banks were named as defendants in 3 putative class actions filed in the New York District Court on behalf of persons and entities who purchased instruments paying interest indexed to US dollar ICE Libor from a panel bank. The complaints allege, among other things, misconduct related to the suppression of this benchmark rate in violation of US antitrust and state law. In July 2019, the 3 putative class actions were consolidated, and the plaintiffs filed a consolidated amended complaint. In March 2020, the court granted the defendants’ motion to dismiss in its entirety and, in February 2022, the US Court of Appeals for the Second Circuit dismissed the plaintiffs’ appeal.
Notes on the financial statements
Singapore interbank offered rate (‘Sibor’), Singapore swap offer rate (‘SOR’) and Australia bank bill swap rate (‘BBSW’):
In July and August 2016, HSBC and other panel banks were named as defendants in 2 putative class actions filed in the New York District Court on behalf of persons who transacted in products related to the Sibor, SOR and BBSW benchmark rates. The complaints allege, among other things, misconduct related to these benchmark rates in violation of US antitrust, commodities and racketeering laws, and state law.
In the Sibor/SOR litigation, in October 2021, The Hongkong and Shanghai Banking Corporation Limited reached a settlement in principle with the plaintiffs to resolve this action. The settlement remains subject to court approval.
In the BBSW litigation, in November 2018, the court dismissed all foreign defendants, including all HSBC entities, on personal jurisdiction grounds. In April 2019, the plaintiffs filed an amended complaint, which the defendants moved to dismiss. In February 2020, the court again dismissed the plaintiffs’ amended complaint against all HSBC entities.
There are many factors that may affect the range of outcomes, and the resulting financial impact, of these matters, which could be significant.
Foreign exchange-related investigations and litigation
In December 2021, the EC issued a settlement decision finding that a number of banks, including HSBC, had engaged in anti-competitive practices in an online chatroom between 2011 and 2012 in the foreign exchange spot market. The EC imposed a €174.3m fine on HSBC in connection with this matter, which is fully provisioned.
In January 2018, following the conclusion of the US Department of Justice’s (‘DoJ’) investigation into HSBC’s historical foreign exchange activities, HSBC Holdings entered into a three-year deferred prosecution agreement with the Criminal Division of the DoJ (the ‘FX DPA’), regarding fraudulent conduct in connection with 2 particular transactions in 2010 and 2011. In January 2021, the FX DPA expired and, in August 2021, the charges deferred by the FX DPA were dismissed.
In December 2016, Brazil’s Administrative Council of Economic Defense initiated an investigation into the onshore foreign exchange market and identified a number of banks, including HSBC, as subjects of its investigation.
In June 2020, the Competition Commission of South Africa, having initially referred a complaint for proceedings before the South African Competition Tribunal in February 2017, filed a revised complaint against 28 financial institutions, including HSBC Bank plc and HSBC Bank USA, for alleged anti-competitive behaviour in the South African foreign exchange market. In December 2021, a hearing on HSBC Bank plc’s and HSBC Bank USA’s applications to dismiss the revised complaint took place before the South African Competition Tribunal, where a decision remains pending.
Beginning in 2013, various HSBC companies and other banks have been named as defendants in a number of putative class actions filed in, or transferred to, the New York District Court arising from allegations that the defendants conspired to manipulate foreign exchange rates. HSBC has reached class settlements with 2 groups of plaintiffs, including direct and indirect purchasers of foreign exchange products, and the court has granted final approval of these settlements. A putative class action by a group of retail customers of foreign exchange products remains pending.
In November and December 2018, complaints alleging foreign exchange-related misconduct were filed in the New York District Court and the High Court of England and Wales against HSBC and other defendants by certain plaintiffs that opted out of the direct purchaser class action settlement in the US. These matters remain pending. Additionally, lawsuits alleging foreign exchange-related misconduct remain pending against HSBC and other banks in courts in Brazil and Israel. It is possible that additional civil actions will be initiated against HSBC in relation to its historical foreign exchange activities.
There are many factors that may affect the range of outcomes, and the resulting financial impact, of these matters, which could be significant.
Precious metals fix-related litigation
Gold: Beginning in March 2014, numerous putative class actions were filed in the New York District Court and the US District Courts for the District of New Jersey and the Northern District of California, naming HSBC and other members of The London Gold Market Fixing Limited as defendants. The complaints, which were consolidated in the New York District Court, allege that, from January 2004 to June 2013, the defendants conspired to manipulate the price of gold and gold derivatives for their collective benefit in violation of US antitrust laws, the US CEA and New York state law. In October 2020, HSBC reached a settlement in principle with the plaintiffs to resolve the consolidated action. The settlement remains subject to court approval.
Beginning in December 2015, numerous putative class actions under Canadian law were filed in the Ontario and Quebec Superior Courts of Justice against various HSBC companies and other financial institutions. The plaintiffs allege that, among other things, from January 2004 to March 2014, the defendants conspired to manipulate the price of gold and gold derivatives in violation of the Canadian Competition Act and common law. These actions are ongoing.
Silver: Beginning in July 2014, numerous putative class actions were filed in federal district courts in New York, naming HSBC and other members of The London Silver Market Fixing Limited as defendants. The complaints allege that, from January 2007 to December 2013, the defendants conspired to manipulate the price of silver and silver derivatives for their collective benefit in violation of US antitrust laws, the US CEA and New York state law. The actions were consolidated in the New York District Court and remain pending, following the conclusion of pre-class certification discovery.
In April 2016, 2 putative class actions under Canadian law were filed in the Ontario and Quebec Superior Courts of Justice against various HSBC companies and other financial institutions. The plaintiffs in both actions allege that, from January 1999 to August 2014, the defendants conspired to manipulate the price of silver and silver derivatives in violation of the Canadian Competition Act and common law. These actions are ongoing.
Platinum and palladium: Between late 2014 and early 2015, numerous putative class actions were filed in the New York District Court, naming HSBC and other members of The London Platinum and Palladium Fixing Company Limited as defendants. The complaints allege that, from January 2008 to November 2014, the defendants conspired to manipulate the price of platinum group metals (‘PGM’) and PGM-based financial products for their collective benefit in violation of US antitrust laws and the US CEA. In March 2020, the court granted the defendants' motion to dismiss the plaintiffs’ third amended complaint but granted the plaintiffs leave to re-plead certain claims. The plaintiffs have filed an appeal.
Based on the facts currently known, it is not practicable at this time for HSBC to predict the resolution of these matters, including the timing or any possible impact on HSBC, which could be significant.
Film finance litigation
In July and November 2015, 2 actions were brought by individuals against HSBC Private Bank (UK) Limited (‘PBGB’) in the High Court of England and Wales seeking damages on various alleged grounds, including breach of duty to the claimants, in connection with their participation in certain Ingenious film finance schemes. In December 2018 and June 2019, 2 further actions were brought against PBGB in the High Court of England and Wales by multiple claimants in connection with lending provided by PBGB to third parties in respect of certain Ingenious film finance schemes in which the claimants participated. In January 2022, HSBC UK Bank plc (as successor to PBGB) reached a settlement in principle with the claimant group to resolve these actions. The settlement remains subject to the negotiation of definitive documentation.
In June 2020, 2 separate claims were issued against HSBC UK Bank plc (as successor to PBGB) in the High Court of England and Wales by 2 separate groups of investors in Eclipse film finance schemes in connection with PBGB’s role in the development of such schemes. These actions are ongoing.
In April 2021, HSBC UK Bank plc (as successor to PBGB) was served with a claim issued in the High Court of England and Wales in connection with PBGB’s role in the development of the Zeus film finance schemes. This action is at an early stage.
It is possible that additional actions or investigations will be initiated against HSBC UK Bank plc as a result of PBGB’s historical involvement in the provision of certain film finance-related services.
There are many factors that may affect the range of outcomes, and the resulting financial impact, of these matters, which could be significant.
Other regulatory investigations, reviews and litigation
HSBC Holdings and/or certain of its affiliates are subject to a number of other investigations and reviews by various regulators and competition and law enforcement authorities, as well as litigation, in connection with various matters relating to the firm’s businesses and operations, including:
•investigations by tax administration, regulatory and law enforcement authorities in Argentina, India and elsewhere in connection with allegations of tax evasion or tax fraud, money laundering and unlawful cross-border banking solicitation;
•an investigation by the US Commodity Futures Trading Commission regarding interest rate swap transactions related to bond issuances, among other things, as well as the use of non-HSBC approved messaging platforms for business communications;
•an investigation by the PRA in connection with depositor protection arrangements in the UK;
•an investigation by the FCA in connection with collections and recoveries operations in the UK;
•an investigation by the UK Competition and Markets Authority concerning the financial services sector;
•a putative class action brought in the New York District Court relating to the Mexican government bond market;
•2 group actions pending in the US courts and a claim issued in the High Court of England and Wales in connection with HSBC Bank plc’s role as a correspondent bank to Stanford International Bank Ltd from 2003 to 2009; and
•litigation brought against various HSBC companies in the US courts relating to residential mortgage-backed securities, based primarily on (a) claims brought against HSBC Bank USA in connection with its role as trustee on behalf of various securitisation trusts; and (b) claims against several HSBC companies seeking that the defendants repurchase various mortgage loans.
There are many factors that may affect the range of outcomes, and the resulting financial impact, of these matters, which could be significant.
| | | | | |
| 35 | Related party transactions |
Related parties of the Group and HSBC Holdings include subsidiaries, associates, joint ventures, post-employment benefit plans for HSBC employees, Key Management Personnel (‘KMP’) as defined by IAS 24, close family members of KMP and entities that are controlled or jointly controlled by KMP or their close family members. KMP are defined as those persons having authority and responsibility for planning, directing and controlling the activities of HSBC Holdings. These individuals also constitute ‘senior management’ for the purposes of the Hong Kong Listing Rules. In applying IAS 24, it was determined that for this financial reporting period all KMP included Directors, former Directors and senior management listed on pages 256 to 262 except for the roles of Group Chief Legal Officer, Group Head of Internal Audit, Group Chief Human Resources Officer, Group Chief Sustainability Officer, Group Head of Strategy, Group Chief Communications Officer and Group Company Secretary and Chief Governance Officer who do not meet the criteria for KMP as provided for in the standard.
Particulars of transactions with related parties are tabulated below. The disclosure of the year-end balance and the highest amounts outstanding during the year is considered to be the most meaningful information to represent the amount of the transactions and outstanding balances during the year.
Notes on the financial statements
Key Management Personnel
Details of Directors’ remuneration and interests in shares are disclosed in the ‘Directors’ remuneration report’ on pages 290 to 323. IAS 24 ‘Related Party Disclosures’ requires the following additional information for key management compensation.
| | | | | | | | | | | |
| Compensation of Key Management Personnel |
| 2021 | 2020 | 2019 |
| $m | $m | $m |
| Short-term employee benefits | 50 | | 39 | | 64 | |
| | | |
| Other long-term employee benefits | 6 | | 5 | | 8 | |
| Share-based payments | 27 | | 20 | | 27 | |
| Year ended 31 Dec | 83 | | 64 | | 99 | |
| | | | | | | | |
| Shareholdings, options and other securities of Key Management Personnel |
| 2021 | 2020 |
| (000s) | (000s) |
| Number of options held over HSBC Holdings ordinary shares under employee share plans | 35 | | 27 | |
| Number of HSBC Holdings ordinary shares held beneficially and non-beneficially | 13,529 | | 11,916 | |
Number of other HSBC securities held1 | 228 | | 228 | |
| At 31 Dec | 13,792 | | 12,171 | |
1 The disclosure includes other HSBC securities held by Key Management Personnel and comparatives for 2020 have now been presented.
| | | | | | | | | | | | | | |
| Advances and credits, guarantees and deposit balances during the year with Key Management Personnel |
| 2021 | 2020 |
| Balance at
31 Dec | Highest amounts
outstanding
during year | Balance at 31 Dec | Highest amounts outstanding during year |
| $m | $m | $m | $m |
| Key Management Personnel | | | | |
Advances and credits1 | 373 | | 401 | | 221 | | 357 | |
| Guarantees | 25 | | 45 | | 30 | | 55 | |
| Deposits | 284 | | 3,190 | | 281 | | 874 | |
1 Advances and credits entered into by subsidiaries of HSBC Holdings plc during 2021 with Directors and former Directors, disclosed pursuant to section 413 of the Companies Act 2006, totalled $2.8m (2020: $4.7m).
Some of the transactions were connected transactions as defined by the Rules Governing The Listing of Securities on The Stock Exchange of Hong Kong Limited, but were exempt from any disclosure requirements under the provisions of those rules. The above transactions were made in the ordinary course of business and on substantially the same terms, including interest rates and security, as for comparable transactions with persons of a similar standing or, where applicable, with other employees. The transactions did not involve more than the normal risk of repayment or present other unfavourable features.
Associates and joint ventures
The Group provides certain banking and financial services to associates and joint ventures including loans, overdrafts, interest and non-interest bearing deposits and current accounts. Details of the interests in associates and joint ventures are given in Note 19.
| | | | | | | | | | | | | | |
| Transactions and balances during the year with associates and joint ventures |
| 2021 | 2020 |
| Highest balance
during the year | Balance at
31 Dec | Highest balance
during the year | Balance at
31 Dec |
| $m | $m | $m | $m |
| Unsubordinated amounts due from joint ventures | 160 | | 96 | | 147 | | 147 | |
| Unsubordinated amounts due from associates | 4,527 | | 4,188 | | 4,330 | | 2,942 | |
| | | | |
| Amounts due to associates | 3,397 | | 1,070 | | 5,466 | | 2,226 | |
| Amounts due to joint ventures | 102 | | 44 | | 102 | | 102 | |
| Guarantees and commitments | 1,016 | | 347 | | 433 | | 283 | |
The above outstanding balances arose in the ordinary course of business and on substantially the same terms, including interest rates and security, as for comparable transactions with third-party counterparties.
Post-employment benefit plans
At 31 December 2021, $3.4bn (2020: $3.5bn) of HSBC post-employment benefit plan assets were under management by HSBC companies, earning management fees of $14m in 2021 (2020: $13m). At 31 December 2021, HSBC’s post-employment benefit plans had placed deposits of $476m (2020: $452m) with its banking subsidiaries, earning interest payable to the schemes of nil (2020: NaN). The above outstanding balances arose from the ordinary course of business and on substantially the same terms, including interest rates and security, as for comparable transactions with third-party counterparties.
The combined HSBC Bank (UK) Pension Scheme enters into swap transactions with HSBC to manage inflation and interest rate sensitivity of its liabilities and selected assets. At 31 December 2021, the gross notional value of the swaps was $7.4bn (2020: $7.7bn). These swaps had a positive fair value to the scheme of $1.0bn (2020: $1.0bn); and HSBC had delivered collateral of $1.0bn (2020: $1.0bn) to the scheme in respect of these arrangements. All swaps were executed at prevailing market rates and within standard market bid/offer spreads.
HSBC Holdings
Details of HSBC Holdings’ subsidiaries are shown in Note 38.
| | | | | | | | | | | | | | |
| Transactions and balances during the year with subsidiaries |
| 2021 | 2020 |
| Highest balance during the year | Balance at
31 Dec | Highest balance
during the year | Balance at
31 Dec |
| $m | $m | $m | $m |
| Assets | | | | |
| Cash and balances with HSBC undertakings | 3,397 | | 2,590 | | 5,476 | | 2,913 | |
| Financial assets with HSBC undertakings designated and otherwise mandatorily measured at fair value | 64,686 | | 51,408 | | 65,253 | | 65,253 | |
| Derivatives | 4,187 | | 2,811 | | 5,784 | | 4,698 | |
| Loans and advances to HSBC undertakings | 27,142 | | 25,108 | | 10,785 | | 10,443 | |
| | | | |
| Prepayments, accrued income and other assets | 1,555 | | 1,135 | | 1,838 | | 1,363 | |
| Investments in subsidiaries | 163,211 | | 163,211 | | 161,546 | | 160,660 | |
| Total related party assets at 31 Dec | 264,178 | | 246,263 | | 250,682 | | 245,330 | |
| | | | |
| Liabilities | | | | |
| Amounts owed to HSBC undertakings | 340 | | 111 | | 581 | | 330 | |
| Derivatives | 2,872 | | 1,220 | | 3,376 | | 3,060 | |
| Accruals, deferred income and other liabilities | 2,036 | | 1,732 | | 2,737 | | 1,936 | |
| Subordinated liabilities | 900 | | 900 | | 892 | | 892 | |
| Total related party liabilities at 31 Dec | 6,148 | | 3,963 | | 7,586 | | 6,218 | |
| | | | |
| Guarantees and commitments | 16,477 | | 13,746 | | 15,661 | | 13,787 | |
The above outstanding balances arose in the ordinary course of business and on substantially the same terms, including interest rates and security, as for comparable transactions with third-party counterparties.
Some employees of HSBC Holdings are members of the HSBC Bank (UK) Pension Scheme, which is sponsored by a separate Group company. HSBC Holdings incurs a charge for these employees equal to the contributions paid into the scheme on their behalf. Disclosure in relation to the scheme is made in Note 5.
In 2021, we accelerated the pace of execution on our strategic ambition to be the preferred international financial partner for our clients with the announcements of the planned sale of our retail banking businesses in France, as well as the exit of domestic mass market retail banking in the US.
Planned sale of the retail banking business in France
On 25 November 2021, HSBC Continental Europe signed a framework agreement with Promontoria MMB SAS (‘My Money Group’) and its subsidiary Banque des Caraïbes SA, regarding the planned sale of HSBC Continental Europe’s retail banking business in France. This followed the signing of a Memorandum of Understanding on 18 June 2021 and the conclusion of the information and consultation processes of the parties with their respective works councils.
In parallel, several other agreements have been entered into aiming to ensure continuity of service for HSBC Continental Europe's retail banking customers who hold asset management products with HSBC Global Asset Management (France) and HSBC REIM (France), and protection and/or life-wrapped insurance products with HSBC Assurances Vie (France).
The sale, which is subject to regulatory approvals and the satisfaction of other relevant conditions, includes: HSBC Continental Europe’s French retail banking business; the Crédit Commercial de France (‘CCF’) brand; and HSBC Continental Europe’s 100% ownership interest in HSBC SFH (France) and its 3% ownership interest in Crédit Logement. The sale would generate an estimated loss before tax including related transaction costs for the Group of $2.3bn, together with an additional $0.7bn impairment of goodwill.
The signing of the framework agreement for the planned sale of the French retail banking business resulted in a tax deduction (tax value of $0.4bn) for a provision for loss on disposal, which was recorded in the French tax return. A deferred tax liability of the same amount arises as a consequence of the temporary difference between the French tax return and IFRS in respect of this provision. There was no tax impact in respect of goodwill impairment recognised in the Group financial statements for the year ended 31 December 2021. The vast majority of the estimated loss for the write-down of the disposal group to fair value less costs to sell will be recognised when it is classified as held for sale in accordance with IFRS 5, which is currently anticipated to be in 2022. Subsequently, the disposal group classified as held for sale will be remeasured at the lower of carrying amount and fair value less costs to sell at each reporting period. Any remaining gain or loss not previously recognised will be recognised at the date of derecognition, which is currently anticipated to be in 2023.
At 31 December 2021, the value of the total assets of the business to be sold was $27.4bn, including $24.9bn of loans and advances to customers, and the value of customer accounts was $22.6bn.
US retail banking business
On 26 May 2021, we announced that we will exit our US mass market retail banking business, including our Personal and Advance propositions, as well as retail business banking, and will rebrand approximately 20 to 25 of our retail branches into international wealth centres to serve our Premier and Jade customers. In conjunction with the execution of this strategy, HSBC Bank USA, N.A. entered into definitive sale agreements with Citizens Bank and Cathay Bank to sell approximately 90 of our retail branches along with substantially all residential mortgage, unsecured and retail business banking loans and all deposits in our branch network not associated with our Premier, Jade and Private Banking customers. Certain assets under management associated with our mass market retail banking business were also transferred. The sale agreement with Cathay Bank completed on 4 February 2022 and the sale agreement with Citizens Bank completed on 18 February 2022. The remaining branches not sold or rebranded will be closed.
At 31 December 2021, loans and advances to customers of $2.4bn and customer accounts of $8.8bn related to these transactions met the criteria to be classified as held for sale.
Notes on the financial statements
| | | | | |
| 37 | Events after the balance sheet date |
The following recently announced acquisitions form part of our strategy to grow our insurance business, helping to deliver on our strategic priority to become a market leader in Asian wealth management.
•On 11 February 2022, following the completion of all regulatory approvals, HSBC Insurance (Asia-Pacific) Holdings Limited, a wholly-owned subsidiary of the Group, acquired 100% of the issued share capital of AXA Insurance Pte Limited for $529m, subject to adjustment for closing items. This will be reflected in our 2022 results by which time determination of the initial acquisition accounting will have been completed.
•On 30 December 2021, approval was received from the China Banking and Insurance Regulatory Commission for HSBC Insurance (Asia) Limited, a wholly-owned subsidiary of the Group, to acquire the remaining 50% equity interest in HSBC Life Insurance Company Limited (HSBC Life China). Completion is expected to occur during the first half of 2022. Headquartered in Shanghai, HSBC Life China offers a comprehensive range of insurance solutions covering annuity, whole life, critical illness and unit-linked insurance products and in 2021 reported gross written premiums of approximately $0.4bn (2020: $0.3bn).
•On 28 January 2022, HSBC Insurance (Asia-Pacific) Holdings Limited notified the shareholders of Canara HSBC Oriental Bank of Commerce Life Insurance Company Limited (‘CHOICe’) of its intention to increase its shareholding in CHOICe up to 49%. HSBC currently has a 26% shareholding which is accounted for as an associate. Any increase in shareholding is subject to agreement with other shareholders in CHOICe, as well as internal and regulatory approvals. Established in 2008, CHOICe is a life insurance company based in India with reported gross written premiums of approximately $0.7bn for the year to 31 March 2021 (31 March 2020: $0.5bn).
In 2021 HSBC Bank USA, N.A. entered into definitive sale agreements with Citizens Bank and Cathay Bank to sell approximately 90 of our retail branches along with substantially all residential mortgage, unsecured and retail business banking loans and all deposits in our branch network not associated with our Premier, Jade and Private Banking customers. The sale agreement with Cathay Bank completed on 4 February 2022 and the sale agreement with Citizens Bank completed on 18 February 2022. For further information on the transactions refer to Note 36: Business disposals on page 415.
A second interim dividend for 2021 of $0.18 per ordinary share (a distribution of approximately $3,649m) was approved by the Directors after 31 December 2021. HSBC Holdings called $2,500m 3.262% Fixed to Floating Rate Senior Unsecured Notes due March 2023 on
8 February 2022. The security will be redeemed and cancelled on 13 March 2022. These accounts were approved by the Board of Directors on 22 February 2022 and authorised for issue.
| | | | | |
| 38 | HSBC Holdings’ subsidiaries, joint ventures and associates |
In accordance with section 409 of the Companies Act 2006 a list of HSBC Holdings plc subsidiaries, joint ventures and associates, the registered office addresses and the effective percentages of equity owned at 31 December 2021 are disclosed below.
Unless otherwise stated, the share capital comprises ordinary or common shares that are held by Group subsidiaries. The ownership percentage is provided for each undertaking. The undertakings below are consolidated by HSBC unless otherwise indicated.
Subsidiaries
| | | | | | | | | | | |
| Subsidiaries | % of share class held by immediate parent company (or by the Group where this varies) | Footnotes |
| 452 TALF Plus ABS Opportunities SPV LLC | 100.00 | | 15 |
| 452 TALF SPV LLC | 100.00 | | 15 |
| Almacenadora Banpacifico S.A. (In Liquidation) | 99.99 | | 16 |
| Arcadia Financial Services (Asia) Limited | 100.00 | | 17 |
| Assetfinance December (F) Limited | 100.00 | | 18 |
| Assetfinance December (H) Limited | 100.00 | | 19 |
| Assetfinance December (P) Limited | 100.00 | | 19 |
| Assetfinance December (R) Limited | 100.00 | | 19 |
| Assetfinance June (A) Limited | 100.00 | | 19 |
| Assetfinance June (D) Limited | 100.00 | | 18 |
| Assetfinance Limited | 100.00 | | 19 |
| Assetfinance March (B) Limited | 100.00 | | 20 |
| Assetfinance March (D) Limited | 100.00 | | 18 |
| Assetfinance March (F) Limited | 100.00 | | 19 |
| Assetfinance September (F) Limited | 100.00 | | 19 |
| Assetfinance September (G) Limited | 100.00 | | 18 |
| B&Q Financial Services Limited | 100.00 | | 19 |
| Banco HSBC S.A. | 100.00 | | 21 |
| Banco Nominees (Guernsey) Limited | 100.00 | | 22 |
| Banco Nominees 2 (Guernsey) Limited | 100.00 | | 22 |
| Banco Nominees Limited | 100.00 | | 21 |
| Beau Soleil Limited Partnership | N/A | | 0, 24 |
| Beijing Miyun HSBC Rural Bank Company Limited | 100.00 | | 12, 25 |
| BentallGreenOak China Real Estate Investments LP | N/A | | 0, 145 |
| Billingsgate Nominees Limited (In Liquidation) | 100.00 | | 26 |
| Canada Crescent Nominees (UK) Limited | 100.00 | | 19 |
| Canada Square Nominees (UK) Limited | 100.00 | | 19 |
| Capco/Cove, Inc. | 100.00 | | 27 |
| Card-Flo #1, Inc. | 100.00 | | 15 |
| Card-Flo #3, Inc. | 100.00 | | 15 |
| CC&H Holdings LLC | 100.00 | | 28 |
| CCF HOLDING (LIBAN) S.A.L. (In Liquidation) | 74.99 | | 29 |
| CCF & Partners Asset Management Limited | 100.00 | (99.99) | 19 |
| Charterhouse Administrators (D.T.) Limited | 100.00 | (99.99) | 19 |
| Charterhouse Management Services Limited | 100.00 | (99.99) | 19 |
| Charterhouse Pensions Limited | 100.00 | | 19 |
| Chongqing Dazu HSBC Rural Bank Company Limited | 100.00 | | 12, 30 |
| Chongqing Fengdu HSBC Rural Bank Company Limited | 100.00 | | 12, 30 |
| Chongqing Rongchang HSBC Rural Bank Company Limited | 100.00 | | 12, 32 |
| COIF Nominees Limited | N/A | | 0, 19 |
| Cordico Management AG (In Liquidation) | 100.00 | | 33 |
| Corsair IV Financial Services Capital Partners-B, LP | N/A | | 0, 34 |
| Dalian Pulandian HSBC Rural Bank Company Limited | 100.00 | | 12, 35 |
| Decision One Mortgage Company, LLC | N/A | | 0, 36 |
| Dem 9 | 100.00 | (99.99) | 4, 37 |
| Dempar 1 | 100.00 | (99.99) | 4, 37 |
| Desarrollo Turistico, S.A. de C.V. (In Liquidation) | 100.00 | (99.99) | 16 |
| Electronic Data Process México, S.A. de C.V. | 100.00 | | 16 |
| Eton Corporate Services Limited | 100.00 | | 22 |
| Far East Leasing SA (In Dissolution) | 100.00 | | 38 |
| Flandres Contentieux S.A. | 100.00 | (99.99) | 37 |
| Foncière Elysées | 100.00 | (99.99) | 37 |
| Fujian Yongan HSBC Rural Bank Company Limited | 100.00 | | 12, 39 |
| Fulcher Enterprises Company Limited | 100.00 | (62.14) | 40 |
| Fundacion HSBC, A.C. | 100.00 | (99.99) | 11, 16 |
| Giller Ltd. | 100.00 | | 27 |
| GPIF Co-Investment, LLC | N/A | | 0, 15 |
| Griffin International Limited | 100.00 | | 19 |
| | | | | | | | | | | |
| Subsidiaries | % of share class held by immediate parent company (or by the Group where this varies) | Footnotes |
| | | |
| | | |
| Grundstuecksgesellschaft Trinkausstrasse Kommanditgesellschaft | N/A | | 0, 41 |
| Grupo Financiero HSBC, S. A. de C. V. | 99.99 | | 16 |
| Guangdong Enping HSBC Rural Bank Company Limited | 100.00 | | 12, 42 |
| Guangzhou HSBC Real Estate Company Ltd | 100.00 | | 12, 43 |
| Hang Seng (Nominee) Limited | 100.00 | (62.14) | 40 |
| Hang Seng Bank (China) Limited | 100.00 | (62.14) | 44 |
| Hang Seng Bank (Trustee) Limited | 100.00 | (62.14) | 40 |
| Hang Seng Bank Limited | 62.14 | | 40 |
| Hang Seng Bullion Company Limited | 100.00 | (62.14) | 40 |
| Hang Seng Credit Limited | 100.00 | (62.14) | 40 |
| Hang Seng Data Services Limited | 100.00 | (62.14) | 40 |
| Hang Seng Finance Limited | 100.00 | (62.14) | 40 |
| Hang Seng Financial Information Limited | 100.00 | (62.14) | 40 |
| Hang Seng Indexes (Netherlands) B.V. | 100.00 | (62.14) | 45 |
| Hang Seng Indexes Company Limited | 100.00 | (62.14) | 40 |
| Hang Seng Insurance Company Limited | 100.00 | (62.14) | 40 |
| Hang Seng Investment Management Limited | 100.00 | (62.14) | 40 |
| Hang Seng Investment Services Limited | 100.00 | (62.14) | 40 |
| Hang Seng Life Limited | 100.00 | (62.14) | 40 |
| Hang Seng Qianhai Fund Management Company Limited | 70.00 | (43.49) | 1, 12, 46 |
| Hang Seng Real Estate Management Limited | 100.00 | (62.14) | 40 |
| Hang Seng Securities Limited | 100.00 | (62.14) | 40 |
| Hang Seng Security Management Limited | 100.00 | (62.14) | 40 |
| HASE Wealth Limited | 100.00 | (62.14) | 40 |
| Haseba Investment Company Limited | 100.00 | (62.14) | 40 |
| HFC Bank Limited (In Liquidation) | 100.00 | | 26 |
| High Time Investments Limited | 100.00 | (62.14) | 40 |
| Honey Blue Enterprises Limited | 100.00 | | 47 |
| Honey Green Enterprises Ltd. | 100.00 | | 48 |
| Honey Grey Enterprises Limited | 100.00 | | 49 |
| Honey Silver Enterprises Limited | 100.00 | | 49 |
| Household International Europe Limited (In Liquidation) | 100.00 | | 50 |
| Household Pooling Corporation | 100.00 | | 51 |
| Housing (USA) LLP | N/A | | 0, 52 |
| HSBC (BGF) Investments Limited | 100.00 | | 19 |
| HSBC (General Partner) Limited | 100.00 | | 2, 53 |
| HSBC (Guernsey) GP PCC Limited | 100.00 | | 22 |
| HSBC (Kuala Lumpur) Nominees Sdn Bhd | 100.00 | | 54 |
| HSBC (Malaysia) Trustee Berhad | 100.00 | | 55 |
| HSBC (Singapore) Nominees Pte Ltd | 100.00 | | 56 |
| HSBC Agency (India) Private Limited | 100.00 | | 57 |
| HSBC Alternative Credit Strategies General Partner S.a r.l. | N/A | | 0, 58 |
| HSBC Alternative Investments Limited | 100.00 | | 19 |
| HSBC Amanah Malaysia Berhad | 100.00 | | 54 |
| HSBC Americas Corporation (Delaware) | 100.00 | | 15 |
| HSBC Argentina Holdings S.A. | 100.00 | | 59 |
| HSBC Asia Holdings B.V. | 100.00 | | 19 |
| HSBC Asia Holdings Limited | 100.00 | | 2, 49 |
| HSBC Asia Pacific Holdings (UK) Limited | 100.00 | | 19 |
| HSBC Asset Finance (UK) Limited | 100.00 | | 19 |
| HSBC Asset Finance M.O.G. Holdings (UK) Limited | 100.00 | | 19 |
| HSBC Asset Management (Fund Services UK) Limited | 100.00 | | 19 |
| HSBC Asset Management (Japan) Limited | 100.00 | | 61 |
| HSBC Asset Management (India) Private Limited | 100.00 | | 60 |
| HSBC Assurances Vie (France) | 100.00 | (99.99) | 62 |
| HSBC Australia Holdings Pty Limited | 100.00 | | 63 |
| HSBC BANK (CHILE) | 100.00 | | 64 |
| HSBC Bank (China) Company Limited | 100.00 | | 12, 65 |
| HSBC Bank (General Partner) Limited | 100.00 | | 53 |
| HSBC Bank (Mauritius) Limited | 100.00 | | 66 |
Notes on the financial statements
| | | | | | | | | | | |
| Subsidiaries | % of share class held by immediate parent company (or by the Group where this varies) | Footnotes |
| HSBC Bank (RR) (Limited Liability Company) | N/A | | 0, 13, 67 |
| HSBC Bank (Singapore) Limited | 100.00 | | 56 |
| HSBC Bank (Taiwan) Limited | 100.00 | | 68 |
| HSBC Bank (Uruguay) S.A. | 100.00 | | 69 |
| HSBC Bank (Vietnam) Ltd. | 100.00 | | 70 |
| HSBC Bank A.S. | 100.00 | | 71 |
| HSBC Bank Argentina S.A. | 99.99 | | 59 |
| HSBC Bank Armenia cjsc | 100.00 | | 72 |
| HSBC Bank Australia Limited | 100.00 | | 63 |
| HSBC Bank Bermuda Limited | 100.00 | | 23 |
| HSBC Bank Canada | 100.00 | | 73 |
| HSBC Bank Capital Funding (Sterling 1) LP | N/A | | 0, 53 |
| HSBC Bank Capital Funding (Sterling 2) LP | N/A | | 0, 53 |
| HSBC Bank Egypt S.A.E | 94.54 | | 74 |
| HSBC Bank Malaysia Berhad | 100.00 | | 54 |
| HSBC Bank Malta p.l.c. | 70.03 | | 75 |
| HSBC Bank Middle East Limited | 100.00 | | 5, 76 |
| HSBC Bank Middle East Limited Representative Office Morocco SARL (In Liquidation) | 100.00 | | 77 |
| HSBC Bank Oman S.A.O.G. | 51.00 | | 78 |
| HSBC Bank Pension Trust (UK) Limited | 100.00 | | 19 |
| HSBC Bank plc | 100.00 | | 2, 19 |
| HSBC Bank USA, National Association | 100.00 | | 3, 79 |
| HSBC Branch Nominee (UK) Limited | 100.00 | | 18 |
| HSBC Brasil Holding S.A. | 100.00 | | 21 |
| HSBC Broking Forex (Asia) Limited | 100.00 | | 49 |
| HSBC Broking Futures (Asia) Limited | 100.00 | | 49 |
| HSBC Broking Futures (Hong Kong) Limited | 100.00 | | 49 |
| HSBC Broking Securities (Asia) Limited | 100.00 | | 49 |
| HSBC Broking Securities (Hong Kong) Limited | 100.00 | | 49 |
| HSBC Broking Services (Asia) Limited | 100.00 | | 49 |
| HSBC Canadian Covered Bond (Legislative) GP Inc. | 100.00 | | 80 |
| HSBC Canadian Covered Bond (Legislative) Guarantor Limited Partnership | N/A | | 0, 80 |
| HSBC Capital (USA), Inc. | 100.00 | | 15 |
| HSBC Capital Funding (Dollar 1) L.P. | N/A | | 0, 53 |
| HSBC Card Services Inc. | 100.00 | | 15 |
| HSBC Casa de Bolsa, S.A. de C.V., Grupo Financiero HSBC | 100.00 | (99.99) | | 16 |
| HSBC Cayman Limited | 100.00 | | 81 |
| HSBC Cayman Services Limited | 100.00 | | 81 |
| HSBC City Funding Holdings | 100.00 | | 19 |
| HSBC Client Holdings Nominee (UK) Limited | 100.00 | | 19 |
| HSBC Client Nominee (Jersey) Limited | 100.00 | | 82 |
| HSBC Columbia Funding, LLC | N/A | | 0, 15 |
| HSBC Continental Europe | 99.99 | | 37 |
| HSBC Corporate Advisory (Malaysia) Sdn Bhd | 100.00 | | 54 |
| HSBC Corporate Finance (Hong Kong) Limited | 100.00 | | 49 |
| HSBC Corporate Secretary (UK) Limited | 100.00 | | 2, 83 |
| HSBC Corporate Trustee Company (UK) Limited | 100.00 | | 19 |
| HSBC Custody Nominees (Australia) Limited | 100.00 | | 63 |
| HSBC Custody Services (Guernsey) Limited | 100.00 | | 22 |
| HSBC Daisy Investments (Mauritius) Limited | 100.00 | | 84 |
| HSBC Diversified Loan Fund General Partner Sarl | N/A | | 0, 85 |
| HSBC Electronic Data Processing (Guangdong) Limited | 100.00 | | 12, 86 |
| HSBC Electronic Data Processing (Malaysia) Sdn Bhd | 100.00 | | 87 |
| HSBC Electronic Data Processing (Philippines), Inc. | 99.99 | | 88 |
| HSBC Electronic Data Processing India Private Limited | 100.00 | | 89 |
| HSBC Electronic Data Processing Lanka (Private) Limited | 100.00 | | 90 |
| HSBC Electronic Data Service Delivery (Egypt) S.A.E. | 100.00 | | 91 |
| | | | | | | | | | | |
| Subsidiaries | % of share class held by immediate parent company (or by the Group where this varies) | Footnotes |
| HSBC Epargne Entreprise (France) | 100.00 | (99.99) | | 62 |
| HSBC Equipment Finance (UK) Limited | 100.00 | | 18 |
| HSBC Equity (UK) Limited | 100.00 | | 19 |
| HSBC Europe B.V. | 100.00 | | 19 |
| HSBC Executor & Trustee Company (UK) Limited | 100.00 | | 18 |
| HSBC Factoring (France) | 100.00 | (99.99) | 37 |
| HSBC Finance (Netherlands) | 100.00 | | 2, 19 |
| HSBC Finance Corporation | 100.00 | | 15 |
| HSBC Finance Limited | 100.00 | | 19 |
| HSBC Finance Mortgages Inc. | 100.00 | | 92 |
| HSBC Finance Transformation (UK) Limited | 100.00 | | 19 |
| HSBC Financial Advisors Singapore Pte. Ltd. | 100.00 | | 56 |
| HSBC Financial Services (Lebanon) s.a.l. | 99.65 | | 93 |
| HSBC Financial Services (Uruguay) S.A. (In Liquidation) | 100.00 | | 94 |
| HSBC FinTech Services (Shanghai) Company Limited | 100.00 | | 95 |
| HSBC Germany Holdings GmbH | 100.00 | | 41 |
| HSBC Global Asset Management (Bermuda) Limited | 100.00 | | 3, 23 |
| HSBC Global Asset Management (Canada) Limited | 100.00 | | 73 |
| HSBC Global Asset Management (Deutschland) GmbH | 100.00 | | 41 |
| HSBC Global Asset Management (France) | 100.00 | (99.99) | 62 |
| HSBC Global Asset Management (Hong Kong) Limited | 100.00 | | 24 |
| HSBC Global Asset Management (International) Limited (In Liquidation) | 100.00 | | 96 |
| HSBC Global Asset Management (Malta) Limited | 100.00 | (70.03) | 97 |
| HSBC Global Asset Management (México), S.A. de C.V., Sociedad Operadora de Fondos de Inversión, Grupo Financiero HSBC | 100.00 | (99.99) | 16 |
| HSBC Global Asset Management (Oesterreich) GmbH (In Liquidation) | 100.00 | (99.33) | 6, 98 |
| HSBC Global Asset Management (Singapore) Limited | 100.00 | | 56 |
| HSBC Global Asset Management (Switzerland) AG | 100.00 | (99.66) | 4, 99 |
| HSBC Global Asset Management (Taiwan) Limited | 100.00 | | 100 |
| HSBC Global Asset Management (UK) Limited | 100.00 | | 19 |
| HSBC Global Asset Management (USA) Inc. | 100.00 | | 101 |
| HSBC Global Asset Management Argentina S.A. Sociedad Gerente de Fondos Comunes de Inversión | 100.00 | (99.99) | 102 |
| HSBC Global Asset Management Holdings (Bahamas) Limited | 100.00 | | 103 |
| HSBC Global Asset Management Limited | 100.00 | | 2, 19 |
| HSBC Global Custody Nominee (UK) Limited | 100.00 | | 19 |
| HSBC Global Custody Proprietary Nominee (UK) Limited | 100.00 | | 1, 19 |
| HSBC Global Services (Canada) Limited | 100.00 | | 92 |
| HSBC Global Services (China) Holdings Limited | 100.00 | | 19 |
| HSBC Global Services (Hong Kong) Limited | 100.00 | | 49 |
| HSBC Global Services (UK) Limited | 100.00 | | 19 |
| HSBC Global Services Limited | 100.00 | | 2, 19 |
| HSBC Global Shared Services (India) Private Limited (In Liquidation) | 99.99 | | 1, 57 |
| HSBC Group Management Services Limited | 100.00 | | 19 |
| HSBC Group Nominees UK Limited | 100.00 | | 2, 19 |
| HSBC Holdings B.V. | 100.00 | | 19 |
| HSBC IM Pension Trust Limited | 100.00 | | 19 |
| HSBC Infrastructure Debt GP 1 S.à r.l. | N/A | | 0, 58 |
| HSBC Infrastructure Debt GP 2 S.à r.l. | N/A | | 0, 58 |
| HSBC Infrastructure Limited | 100.00 | | 19 |
| HSBC INKA Investment-AG TGV | 100.00 | (99.33) | 14, 41 |
| HSBC Institutional Trust Services (Asia) Limited | 100.00 | | 49 |
| HSBC Institutional Trust Services (Bermuda) Limited | 100.00 | | 23 |
| | | | | | | | | | | |
| Subsidiaries | % of share class held by immediate parent company (or by the Group where this varies) | Footnotes |
| HSBC Institutional Trust Services (Mauritius) Limited | 100.00 | | 66 |
| HSBC Institutional Trust Services (Singapore) Limited | 100.00 | | 56 |
| HSBC Insurance (Asia) Limited | 100.00 | | 104 |
| HSBC Insurance (Asia-Pacific) Holdings Limited | 100.00 | | 105 |
| HSBC Insurance (Bermuda) Limited | 100.00 | | 23 |
| HSBC Insurance (Singapore) Pte. Limited | 100.00 | | 56 |
| HSBC Insurance Agency (USA) Inc. | 100.00 | | 101 |
| HSBC Insurance Brokers (Philippines) Inc | 99.99 | | 106 |
| HSBC Insurance Holdings Limited | 100.00 | | 2, 19 |
| HSBC Insurance SAC 1 (Bermuda) Limited | 100.00 | | 23 |
| HSBC Insurance SAC 2 (Bermuda) Limited | 100.00 | | 23 |
| HSBC Insurance Services (Lebanon) S.A.L. (In Liquidation) | 99.99 | | 107 |
| HSBC Insurance Services Holdings Limited | 100.00 | | 19 |
| HSBC International Finance Corporation (Delaware) | 100.00 | | 108 |
| HSBC International Trustee (BVI) Limited | 100.00 | | 109 |
| HSBC International Trustee (Holdings) Pte. Limited | 100.00 | | 56 |
| HSBC International Trustee Limited | 100.00 | | 110 |
| HSBC Inversiones S.A. | 100.00 | | 64 |
| HSBC InvestDirect (India) Private Limited | 100.00 | (99.98) | 60 |
| HSBC InvestDirect Financial Services (India) Limited | 99.99 | (99.98) | 60 |
| HSBC InvestDirect Sales & Marketing (India) Limited | 98.99 | (98.98) | 57 |
| HSBC InvestDirect Securities (India) Private Limited | 99.99 | | 60 |
| HSBC Investment Bank Holdings B.V. | 100.00 | | 19 |
| HSBC Investment Bank Holdings Limited | 100.00 | | 19 |
| HSBC Investment Company Limited | 100.00 | | 2, 19 |
| HSBC Investment Funds (Canada) Inc. | 100.00 | | 111 |
| HSBC Investment Funds (Hong Kong) Limited | 100.00 | | 24 |
| HSBC Investment Funds (Luxembourg) SA | 100.00 | | 58 |
| HSBC Invoice Finance (UK) Limited | 100.00 | | 112 |
| HSBC Issuer Services Common Depositary Nominee (UK) Limited | 100.00 | | 19 |
| HSBC Issuer Services Depositary Nominee (UK) Limited | 100.00 | | 19 |
| HSBC Latin America B.V. | 100.00 | | 19 |
| HSBC Latin America Holdings (UK) Limited | 100.00 | | 2, 19 |
| HSBC Leasing (Asia) Limited | 100.00 | | 49 |
| HSBC Leasing (France) | 100.00 | (99.99) | 37 |
| HSBC Life (Cornell Centre) Limited | 100.00 | | 104 |
| HSBC Life (Edwick Centre) Limited | 100.00 | | 104 |
| HSBC Life (International) Limited | 100.00 | | 23 |
| HSBC Life (Property) Limited | 100.00 | | 104 |
| HSBC Life (Tsing Yi Industrial) Limited | 100.00 | | 104 |
| HSBC Life (UK) Limited | 100.00 | | 19 |
| HSBC Life Assurance (Malta) Limited | 100.00 | (70.03) | 97 |
HSBC Life Insurance Company Limited
| 50.00 | | 113 |
| HSBC LU Nominees Limited | 100.00 | | 19 |
| HSBC Management (Guernsey) Limited | 100.00 | | 114 |
| HSBC Markets (USA) Inc. | 100.00 | | 15 |
| HSBC Marking Name Nominee (UK) Limited | 100.00 | | 19 |
| HSBC Master Trust Trustee Limited | 100.00 | | 19 |
| HSBC Mexico, S.A., Institucion de Banca Multiple, Grupo Financiero HSBC | 99.99 | | 16 |
| HSBC Middle East Asset Co. LLC | 100.00 | | 115 |
| HSBC Middle East Holdings B.V. | 100.00 | | 2, 116 |
| HSBC Middle East Leasing Partnership | N/A | | 0, 117 |
| HSBC Middle East Securities L.L.C | 100.00 | | 118 |
| HSBC Mortgage Corporation (Canada) | 100.00 | | 119 |
| HSBC Mortgage Corporation (USA) | 100.00 | | 15 |
| HSBC Nominees (Asing) Sdn Bhd | 100.00 | | 54 |
| HSBC Nominees (Hong Kong) Limited | 100.00 | | 49 |
| HSBC Nominees (New Zealand) Limited | 100.00 | | 120 |
| HSBC Nominees (Tempatan) Sdn Bhd | 100.00 | | 54 |
| | | | | | | | | | | |
| Subsidiaries | % of share class held by immediate parent company (or by the Group where this varies) | Footnotes |
| HSBC North America Holdings Inc. | 100.00 | | 3, 15 |
| HSBC Operational Services GmbH | 80.00 | | 41 |
| HSBC Overseas Holdings (UK) Limited | 100.00 | | 2, 19 |
| HSBC Overseas Investments Corporation (New York) | 100.00 | | 121 |
| HSBC Overseas Nominee (UK) Limited | 100.00 | | 19 |
| HSBC Participaciones (Argentina) S.A. | 100.00 | (99.99) | 59 |
| HSBC PB Corporate Services 1 Limited | 100.00 | | 122 |
| HSBC PB Services (Suisse) SA | 100.00 | | 123 |
| HSBC Pension Trust (Ireland) DAC | 100.00 | | 124 |
| HSBC Pensiones, S.A. | 100.00 | (99.99) | 16 |
| HSBC PI Holdings (Mauritius) Limited | 100.00 | | 66 |
| HSBC Portfoy Yonetimi A.S. | 100.00 | | 125 |
| HSBC Preferential LP (UK) | 100.00 | | 19 |
| HSBC Private Bank (Luxembourg) S.A. | 100.00 | | 58 |
| HSBC Private Bank (Suisse) SA | 100.00 | | 126 |
| HSBC Private Bank (UK) Limited | 100.00 | | 19 |
| HSBC Private Banking Holdings (Suisse) SA | 100.00 | | 123 |
| HSBC Private Banking Nominee 3 (Jersey) Limited | 100.00 | | 127 |
| HSBC Private Equity Investments (UK) Limited | 100.00 | | 19 |
| HSBC Private Trustee (Hong Kong) Limited | 100.00 | | 49 |
| HSBC Private Investment Counsel (Canada) Inc. | 100.00 | | 111 |
| HSBC Private Markets Management SARL | N/A | | 0, 128 |
| HSBC Professional Services (India) Private Limited | 100.00 | | 129 |
| HSBC Property (UK) Limited | 100.00 | | 19 |
| HSBC Property Funds (Holding) Limited | 100.00 | | 19 |
| HSBC Provident Fund Trustee (Hong Kong) Limited | 100.00 | | 49 |
| HSBC Qianhai Securities Limited | 51.00 | | 12, 130 |
| HSBC Real Estate Leasing (France) | 100.00 | (99.99) | 37 |
| HSBC Realty Credit Corporation (USA) | 100.00 | | 15 |
| HSBC REGIO Fund General Partner S.à r.l. | 100.00 | | 58 |
| HSBC REIM (France) | 100.00 | (99.99) | 62 |
| HSBC Retirement Benefits Trustee (UK) Limited | 100.00 | | 1, 2, 19 |
| HSBC Retirement Services Limited | 100.00 | | 1, 19 |
| HSBC Saudi Arabia, a Saudi closed Joint Stock Company | 66.19 | | 131 |
| HSBC Savings Bank (Philippines) Inc. | 99.99 | | 132 |
| HSBC Securities (Canada) Inc. | 100.00 | | 92 |
| HSBC Securities (Egypt) S.A.E. (In Liquidation) | 100.00 | (94.65) | 74 |
| HSBC Securities (Japan) Limited | 100.00 | | 19 |
| HSBC Securities (Singapore) Pte Limited | 100.00 | | 56 |
| HSBC Securities (South Africa) (Pty) Limited | 100.00 | | 133 |
| HSBC Securities (Taiwan) Corporation Limited | 100.00 | | 134 |
| HSBC Securities (USA) Inc. | 100.00 | | 15 |
| HSBC Securities and Capital Markets (India) Private Limited | 99.99 | | 57 |
| HSBC Securities Brokers (Asia) Limited | 100.00 | | 49 |
| HSBC Securities Investments (Asia) Limited | 100.00 | | 49 |
| HSBC Securities Preparatory (Japan) Co., Ltd. | 100.00 | | 61 |
| HSBC Securities Services (Bermuda) Limited | 100.00 | | 23 |
| HSBC Securities Services (Guernsey) Limited | 100.00 | | 22 |
| HSBC Securities Services (Ireland) DAC | 100.00 | | 124 |
| HSBC Securities Services (Luxembourg) S.A. | 100.00 | | 58 |
| HSBC Securities Services Holdings (Ireland) DAC | 100.00 | | 124 |
| HSBC Securities Services Nominees Limited | 100.00 | | 49 |
| HSBC Seguros de Retiro (Argentina) S.A. | 100.00 | (99.99) | 59 |
| HSBC Seguros de Vida (Argentina) S.A. | 100.00 | (99.99) | 59 |
| HSBC Seguros, S.A de C.V., Grupo Financiero HSBC | 100.00 | (99.99) | 3, 16 |
| HSBC Service Company Germany GmbH | 100.00 | | 41 |
| HSBC Service Delivery (Polska) Sp. z o.o. | 100.00 | | 135 |
| HSBC Services (France) | 100.00 | (99.99) | 37 |
| HSBC Services Japan Limited | 100.00 | | 136 |
| HSBC Services USA Inc. | 100.00 | | 137 |
| HSBC Servicios Financieros, S.A. de C.V | 100.00 | (99.99) | 16 |
Notes on the financial statements
| | | | | | | | | | | |
| Subsidiaries | % of share class held by immediate parent company (or by the Group where this varies) | Footnotes |
| HSBC Servicios, S.A. DE C.V., Grupo Financiero HSBC | 100.00 | (99.99) | 16 |
| HSBC SFH (France) | 100.00 | (99.99) | 4, 62 |
| HSBC SFT (C.I.) Limited | 100.00 | | 22 |
| HSBC Software Development (Guangdong) Limited | 100.00 | | 138 |
| HSBC Software Development (India) Private Limited | 100.00 | | 187 |
| HSBC Software Development (Malaysia) Sdn Bhd | 100.00 | | 87 |
| HSBC Specialist Investments Limited | 100.00 | | 19 |
| HSBC Technology & Services (China) Limited | 100.00 | | 139 |
| HSBC Technology & Services (USA) Inc. | 100.00 | | 15 |
| HSBC Transaction Services GmbH | 100.00 | | 6, 41 |
| HSBC Trinkaus & Burkhardt (International) S.A. | 100.00 | | 58 |
| HSBC Trinkaus & Burkhardt AG | 100.00 | | 41 |
| HSBC Trinkaus & Burkhardt Gesellschaft fur Bankbeteiligungen mbH | 100.00 | | 41 |
| HSBC Trinkaus Europa Immobilien-Fonds Nr. 5 GmbH | 100.00 | | 41 |
| HSBC Trinkaus Family Office GmbH | 100.00 | | 6, 41 |
| HSBC Trinkaus Real Estate GmbH | 100.00 | | 6, 41 |
| HSBC Trust Company (Canada) | 100.00 | | 119 |
| HSBC Trust Company (Delaware), National Association | 100.00 | | 108 |
| HSBC Trust Company (UK) Limited | 100.00 | | 19 |
| HSBC Trust Company AG (In Liquidation) | 100.00 | | 33 |
| HSBC Trustee (C.I.) Limited | 100.00 | | 127 |
| HSBC Trustee (Cayman) Limited | 100.00 | | 140 |
| HSBC Trustee (Guernsey) Limited | 100.00 | | 22 |
| HSBC Trustee (Hong Kong) Limited | 100.00 | | 49 |
| HSBC Trustee (Singapore) Limited | 100.00 | | 56 |
| HSBC UK Bank plc | 100.00 | | 2, 18 |
| HSBC UK Client Nominee Limited | 100.00 | | 18 |
| HSBC UK Holdings Limited | 100.00 | | 2, 19 |
| HSBC USA Inc. | 100.00 | | 121 |
| HSBC Ventures USA Inc. | 100.00 | | 15 |
| HSBC Violet Investments (Mauritius) Limited | 100.00 | | 84 |
| HSBC Wealth Client Nominee Limited | 100.00 | | 1, 18 |
| HSBC Yatirim Menkul Degerler A.S. | 100.00 | | 125 |
| HSI Asset Securitization Corporation | 100.00 | | 15 |
| HSI International Limited | 100.00 | (62.14) | 40 |
| HSIL Investments Limited | 100.00 | | 19 |
| Hubei Macheng HSBC Rural Bank Company Limited | 100.00 | | 141 |
| Hubei Suizhou Cengdu HSBC Rural Bank Company Limited | 100.00 | | 12, 142 |
| Hubei Tianmen HSBC Rural Bank Company Limited | 100.00 | | 143 |
| Hunan Pingjiang HSBC Rural Bank Company Limited | 100.00 | | 12, 144 |
| Imenson Limited | 100.00 | (62.14) | 40 |
| INKA Internationale Kapitalanlagegesellschaft mbH | 100.00 | | 41 |
| Inmobiliaria Banci, S.A. de C.V. | 100.00 | (99.68) | 16 |
| Inmobiliaria Bisa, S.A. de C.V. | 99.98 | | 16 |
| Inmobiliaria Grufin, S.A. de C.V. | 100.00 | (99.99) | 16 |
| Inmobiliaria Guatusi, S.A. de C.V. | 100.00 | (99.99) | 16 |
| James Capel & Co. Limited (In Liquidation) | 100.00 | | 19 |
| James Capel (Nominees) Limited | 100.00 | | 19 |
| James Capel (Taiwan) Nominees Limited | 100.00 | | 19 |
| John Lewis Financial Services Limited | 100.00 | | 19 |
| Keyser Ullmann Limited | 100.00 | (99.99) | 19 |
| Lion Corporate Services Limited | 100.00 | | 49 |
| Lion International Corporate Services Limited | 100.00 | | 1, 110 |
| Lion International Management Limited | 100.00 | | 110 |
| Lion Management (Hong Kong) Limited | 100.00 | | 1, 49 |
| Lyndholme Limited | 100.00 | | 49 |
| Marks and Spencer Financial Services plc | 100.00 | | 146 |
| | | | | | | | | | | |
| Subsidiaries | % of share class held by immediate parent company (or by the Group where this varies) | Footnotes |
| Marks and Spencer Unit Trust Management Limited | 100.00 | | 146 |
| Maxima S.A. AFJP (In Liquidation) | 99.98 | | 59 |
| Mexicana de Fomento, S.A. de C.V. | 100.00 | (99.90) | 16 |
| Midcorp Limited | 100.00 | | 19 |
| Midland Bank (Branch Nominees) Limited | 100.00 | | 18 |
| Midland Nominees Limited | 100.00 | | 18 |
| MIL (Cayman) Limited | 100.00 | | 81 |
| MW Gestion SA | 100.00 | | 59 |
| Promocion en Bienes Raices, S.A. de C.V. | 100.00 | (99.99) | 16 |
| Prudential Client HSBC GIS Nominee (UK) Limited | 100.00 | | 19 |
| PT Bank HSBC Indonesia | 99.99 | (98.93) | 147 |
| PT HSBC Sekuritas Indonesia | 85.00 | | 148 |
| R/CLIP Corp. | 100.00 | | 15 |
| Real Estate Collateral Management Company | 100.00 | | 15 |
| Republic Nominees Limited | 100.00 | | 22 |
| Republic Overseas Capital Corporation | 100.00 | | 101 |
| RLUKREF Nominees (UK) One Limited | 100.00 | | 1, 19 |
| RLUKREF Nominees (UK) Two Limited | 100.00 | | 1, 19 |
| S.A.P.C. - Ufipro Recouvrement | 99.99 | | 37 |
| Saf Baiyun | 100.00 | (99.99) | 4, 37 |
| Saf Guangzhou | 100.00 | (99.99) | 4, 37 |
| SCI HSBC Assurances Immo | 100.00 | (99.99) | 62 |
| Serai Limited | 100.00 | | 1, 49 |
| Serai Technology Development (Shanghai) Limited | 100.00 | | 12, 149 |
| SFM | 100.00 | (99.99) | 37 |
| SFSS Nominees (Pty) Limited | 100.00 | | 133 |
| Shandong Rongcheng HSBC Rural Bank Company Limited | 100.00 | | 12, 150 |
| Shenzhen HSBC Development Company Ltd | 100.00 | | 12, 151 |
| Sico Limited | 100.00 | | 152 |
| SNC Dorique | 99.99 | | 1, 11, 153 |
| SNC Les Oliviers D'Antibes | 60.00 | | 62 |
| SNCB/M6 - 2008 A | 100.00 | (99.99) | 37 |
| SNCB/M6-2007 A | 100.00 | (99.99) | 4, 37 |
| SNCB/M6-2007 B | 100.00 | (99.99) | 4, 37 |
| Société Française et Suisse | 100.00 | (99.99) | 37 |
| Somers Dublin DAC | 100.00 | (99.99) | 124 |
| Somers Nominees (Far East) Limited | 100.00 | | 23 |
| Sopingest | 100.00 | (99.99) | 37 |
| South Yorkshire Light Rail Limited | 100.00 | | 19 |
| St Cross Trustees Limited | 100.00 | | 18 |
| Sun Hung Kai Development (Lujiazui III) Limited | 100.00 | | 12, 154 |
| Swan National Limited | 100.00 | | 19 |
| Tasfiye Halinde HSBC Odeme Sistemleri Bilgisayar Teknolojileri Basin Yayin Ve Musteri Hizmetleri (In Liquidation) | 100.00 | | 71 |
| The Hongkong and Shanghai Banking Corporation Limited | 100.00 | | 49 |
| The Venture Catalysts Limited | 100.00 | | 19 |
| Tooley Street View Limited | 100.00 | | 2, 19 |
| Tower Investment Management | 100.00 | | 155 |
| Trinkaus Australien Immobilien Fonds Nr. 1 Brisbane GmbH & Co. KG | 100.00 | | 41 |
| Trinkaus Australien Immobilien-Fonds Nr. 1 Treuhand-GmbH | 100.00 | | 6, 41 |
| Trinkaus Europa Immobilien-Fonds Nr.3 Objekt Utrecht Verwaltungs-GmbH | 100.00 | | 41 |
| Trinkaus Immobilien-Fonds Geschaeftsfuehrungs-GmbH | 100.00 | | 6, 41 |
| Trinkaus Immobilien-Fonds Verwaltungs-GmbH | 100.00 | | 6, 41 |
| Trinkaus Private Equity Management GmbH | 100.00 | | 41 |
| Trinkaus Private Equity Verwaltungs GmbH | 100.00 | | 6, 41 |
| Tropical Nominees Limited | 100.00 | | 81 |
| Turnsonic (Nominees) Limited | 100.00 | | 18 |
| Valeurs Mobilières Elysées | 100.00 | (99.99) | 37 |
| Wardley Limited | 100.00 | | 49 |
| | | | | | | | | | | |
| Subsidiaries | % of share class held by immediate parent company (or by the Group where this varies) | Footnotes |
| Wayfoong Nominees Limited | 100.00 | | 49 |
| Wayhong (Bahamas) Limited (In Liquidation) | 100.00 | | 103 |
| Westminster House, LLC | N/A | | 0, 15 |
| Woodex Limited | 100.00 | | 23 |
| Yan Nin Development Company Limited | 100.00 | (62.14) | 40 |
| | | |
| | | |
| | | |
| | | |
| | | |
| | | |
| | | |
| | | |
| | | |
| | | |
| | | |
| | | |
| | | |
| | | |
| | | |
| | | |
| | | |
| | | |
| | | |
| | | |
| | | |
| | | |
| | | |
| | | |
| | | |
| | | |
| | | |
| | | |
| | | |
| | | |
| | | |
| | | |
| | | |
| | | |
| | | |
| | | |
| | | |
| | | |
| | | |
| | | |
| | | |
| | | |
| | | |
| | | |
| | | |
| | | |
| | | |
| | | |
| | | |
| | | |
| | | |
| | | |
| | | |
| | | |
| | | |
| | | |
| | | |
| | | |
| | | |
| | | |
| | | |
| | | |
| | | |
| | | |
| | | |
| | | |
| | | |
| | | |
| | | |
| | | |
| | | |
| | | |
| | | |
| | | |
| | | |
| | | |
| | | |
| | | |
| | | |
| | | |
| | | |
| | | |
| | | |
| | | |
| | | |
| | | |
| | | |
| | | |
| | | |
| | | |
| | | |
| | | |
| | | |
| | | |
| | | |
| | | |
| | | |
| | | |
| | | |
| | | |
| | | |
| | | |
| | | |
| | | |
| | | |
| | | |
| | | |
| | | |
| | | |
| | | |
| | | |
| | | |
| | | |
| | | |
| | | |
| | | |
| | | |
| | | |
| | | |
| | | |
| | | |
| | | |
| | | |
| | | |
| | | |
| | | |
| | | |
| | | |
| | | |
| | | |
| | | |
| | | |
| | | |
| | | |
| | | |
| | | |
| | | |
| | | |
| | | |
| | | |
| | | |
| | | |
| | | |
| | | |
| | | |
| | | |
| | | |
| | | |
| | | |
| | | |
| | | |
| | | |
| | | |
| | | |
| | | |
| | | |
| | | |
| | | |
| | | |
| | | |
| | | |
| | | |
| | | |
| | | |
| | | |
| | | |
| | | |
| | | |
| | | |
| | | |
| | | |
| | | |
| | | |
| | | |
| | | |
| | | |
| | | |
| | | |
| | | |
| | | |
| | | |
| | | |
| | | |
| | | |
| | | |
| | | |
| | | |
| | | |
| | | |
| | | |
| | | |
| | | |
| | | |
| | | |
| | | |
| | | |
| | | |
| | | |
| | | |
| | | |
| | | |
| | | |
| | | |
| | | |
| | | |
| | | |
| | | |
| | | |
| | | |
| | | |
| | | |
| | | |
| | | |
| | | |
| | | |
| | | |
| | | |
| | | |
| | | |
| | | |
| | | |
| | | |
| | | |
| | | |
| | | |
| | | |
| | | |
| | | |
| | | |
| | | |
| | | |
| | | |
| | | |
| | | |
| | | |
| | | |
| | | |
| | | |
| | | |
| | | |
| | | |
| | | |
| | | |
| | | |
| | | |
| | | |
| | | |
| | | |
| | | |
| | | |
| | | |
| | | |
| | | |
| | | |
| | | |
| | | |
| | | |
| | | |
| | | |
| | | |
| | | |
| | | |
| | | |
| | | |
| | | |
| | | |
| | | |
| | | |
| | | |
| | | |
| | | |
| | | |
| | | |
| | | |
| | | |
| | | |
| | | |
| | | |
| | | |
| | | |
| | | |
| | | |
| | | |
| | | |
| | | |
| | | |
| | | |
| | | |
| | | |
| | | |
| | | |
| | | |
| | | |
| | | |
| | | |
| | | |
| | | |
| | | |
| | | |
| | | |
| | | |
| | | |
| | | |
| | | |
| | | |
| | | |
| | | |
| | | |
| | | |
| | | |
| | | |
| | | |
| | | |
| | | |
| | | |
| | | |
| | | |
| | | |
| | | |
| | | |
| | | |
| | | |
| | | |
| | | |
| | | |
| | | |
| | | |
| | | |
| | | |
| | | |
| | | |
| | | |
| | | |
| | | |
| | | |
| | | |
| | | |
| | | |
| | | |
| | | |
| | | |
| | | |
| | | |
| | | |
Joint ventures
The undertakings below are joint ventures and equity accounted.
| | | | | | | | | | | |
| Joint ventures | % of share class held by immediate parent company (or by the Group where this varies) | Footnotes |
| Global Payments Technology Mexico S.A. De C.V. | 50.00 | | 16 |
| HCM Holdings Limited (In Liquidation) | 50.99 | | 28 |
| House Network Sdn Bhd (In Liquidation) | 25.00 | | 156 |
| HSBC Pollination Climate Asset Management Limited | 40.00 | | 157 |
| ProServe Bermuda Limited | 50.00 | | 158 |
| The London Silver Market Fixing Limited | N/A | | 0, 1, 159 |
| Vaultex UK Limited | 50.00 | | 160 |
Associates
The undertakings below are associates and equity accounted.
| | | | | | | | | | | |
| Associates | % of share class held by immediate parent company (or by the Group where this varies) | Footnotes |
| Bank of Communications Co., Ltd. | 19.03 | | 161 |
| Barrowgate Limited | 15.31 | | 162 |
| BGF Group PLC | 24.61 | | 163 |
| Bud Financial Limited | 10.89 | | 1, 164 |
| Canara HSBC Oriental Bank of Commerce Life Insurance Company Limited | 26.00 | | 165 |
| CFAC Payment Scheme Limited (In Liquidation) | 33.33 | | 166 |
| Contour Pte Ltd | 12.60 | | 167 |
Divido Financial Services Limited
| 5.60 | | 168 |
| Episode Six Limited | 8.09 | | 169 |
| EPS Company (Hong Kong) Limited | 38.66 | | 49 |
| EURO Secured Notes Issuer | 16.66 | | 170 |
| GZHS Research Co Ltd | 20.50 | | 171 |
| HSBC Jintrust Fund Management Company Limited | 49.00 | | 172 |
| HSBC UK Covered Bonds (LM) Limited | 20.00 | | 173 |
| HSBC UK Covered Bonds LLP | N/A | | 0, 18 |
| Icon Brickell LLC (In Liquidation) | N/A | | 0, 174 |
| Liquidity Match LLC | N/A | | 0, 175 |
| London Precious Metals Clearing Limited | 25.00 | | 176 |
| MENA Infrastructure Fund (GP) Ltd | 33.33 | | 177 |
| Quantexa Ltd | 10.10 | | 178 |
| Services Epargne Entreprise | 14.18 | | 179 |
| Simon Group LLC | N/A | | 0, 180 |
| sino AG | 24.94 | | 181 |
| The London Gold Market Fixing Limited | 25.00 | | 159 |
| The Saudi British Bank | 31.00 | | 182 |
| Trade Information Network Limited | 16.67 | | 183 |
| Trinkaus Europa Immobilien-Fonds Nr. 7 Frankfurt Mertonviertel KG | N/A | | 0, 41 |
| Vizolution Limited | 17.95 | | 1, 184 |
| We Trade Innovation Designated Activity Company | 9.88 | | 1, 185 |
Threadneedle Software Holdings Limited
| 6.60 | | 186 |
Notes on the financial statements
| | | | | |
| Footnotes for Note 38 |
| Description of Shares |
| 0 | Where an entity is governed by voting rights, HSBC consolidates when it holds – directly or indirectly – the necessary voting rights to pass resolutions by the governing body. In all other cases, the assessment of control is more complex and requires judgement of other factors, including having exposure to variability of returns, power to direct relevant activities, and whether power is held as an agent or principal. HSBC’s consolidation policy is described in Note 1.2(a). |
| 1 | Management has determined that these undertakings are excluded from consolidation in the Group accounts as these entities do not meet the definition of subsidiaries in accordance with IFRS. HSBC’s consolidation policy is described in Note 1.2(a). |
| 2 | Directly held by HSBC Holdings plc |
| 3 | Preference Shares |
| 4 | Actions |
| 5 | Redeemable Preference Shares |
| 6 | GmbH Anteil |
| 7 | Limited and Unlimited Liability Shares |
| 8 | Liquidating Share Class |
| 9 | Nominal Shares |
| 10 | Non-Participating Voting Shares |
| 11 | Parts |
| 12 | Registered Capital Shares |
| 13 | Russian Limited Liability Company Shares |
| 14 | Stückaktien |
| | | | | |
| Registered offices |
| |
| |
| |
| 15 | c/o The Corporation Trust Company 1209 Orange Street, Wilmington, Delaware, United States of America, 19801 |
| 16 | Paseo de la Reforma 347 Col. Cuauhtemoc, Mexico, 06500 |
| 17 | Unit 232 & 233, Solo Offices, 343-347 King’s Road, North Point, Hong Kong |
| 18 | 1 Centenary Square, Birmingham, United Kingdom, B1 1HQ |
| 19 | 8 Canada Square, London, United Kingdom, E14 5HQ |
| 20 | 5 Donegal Square South, Northern Ireland, Belfast, United Kingdom, BT1 5JP |
| 21 | 1909 Avenida Presidente Juscelino Kubitschek, 19° andar, Torre Norte, São Paulo Corporate Towers, São Paulo, Brazil, 04551-903 |
| 22 | Arnold House St Julians Avenue, St Peter Port, Guernsey, GY1 3NF |
| 23 | 37 Front Street, Hamilton, Bermuda, HM 11 |
| 24 | HSBC Main Building 1 Queen's Road Central, Hong Kong |
| 25 | First Floor, Xinhua Bookstore Xindong Road (SE of roundabout), Miyun District, Beijing, China |
| 26 | 156 Great Charles Street, Queensway, Birmingham, West Midlands, United Kingdom, B3 3HN |
| 27 | 95 Washington Street Buffalo, New York, United States of America, 14203 |
| 28 | Corporation Service Company 251 Little Falls Drive, Wilmington, Delaware, United States of America, 19808 |
| 29 | Solidere - Rue Saad Zaghloul Immeuble - 170 Marfaa, P.O. Box 17 5476 Mar Michael, Beyrouth, Lebanon, 11042040 |
| 30 | No 1, Bei Huan East Road Dazu County, Chongqing, China |
| 31 | No 107 Ping Du Avenue (E), Sanhe Town, Fengdu County, Chongqing, China |
| 32 | No. 3, 5, 7, Haitang Erzhi Road Changyuan, Rongchang, Chongqing, China, 402460 |
| 33 | Bederstrasse 49, Zurich, Switzerland, CH-8002 |
| 34 | c/o Walkers Corporate Services Limited Walker House, 87 Mary Street, George Town, Grand Cayman, Cayman Islands, KY1-9005 |
| 35 | First & Second Floor, No.3 Nanshan Road, Pulandian , Dalian, Liaoning, China |
| | | | | |
| Registered offices |
| 36 | 160 Mine Lake CT, Ste 200, Raleigh, North Carolina, United States Of America, 27615-6417 |
| 37 | 38 avenue Kléber, Paris, France, 75116 |
| 38 | MMG Tower, 23 floor Ave. Paseo del Mar Urbanizacion Costa del Este, Panama |
| 39 | No. 1 1211 Yanjiang Zhong Road, Yongan, Fujian, China |
| 40 | 83 Des Voeux Road Central, Hong Kong |
| 41 | Hansaallee 3, Düsseldorf, Germany, 40549 |
| 42 | No.44 Xin Ping Road Central, Encheng, Enping, Guangdong, China, 529400 |
| 43 | Room 1701-010 Heung Kong Building, 37 Jin Long Rd, Nansha District, Guangzhou, China |
| 44 | 34/F and 36/F, Hang Seng Bank Tower 1000 Lujiazui Ring Road, Pilot Free Trade Zone, Shanghai, Shanghai, China, 200120 |
| 45 | Claude Debussylaan 10 Office Suite 20, 1082MD, Amsterdam, Netherlands |
| 46 | Claude Debussylaan 10 Office Suite 20, 1082MD, Amsterdam, Netherlands |
| 47 | 1001, T2 Office Building, Qianhai Kerry Business Center, Qianhai Avenue, Nanshan Street, Qianhai Shenzhen-Hong Kong Cooperation Zone,, Shenzhen, Guangdong, China |
| 48 | Commerce House, Wickhams Cay 1, P.O. Box 3140, Road Town, Tortola, British Virgin Islands, VG1110 |
| 49 | 1 Queen's Road Central, Hong Kong |
| 50 | Hill House 1 Little New Street, London, United Kingdom, EC4A 3TR |
| 51 | The Corporation Trust Company of Nevada 311 S. Division Street, Carson City, Nevada, United States of America, 89703 |
| 52 | Corporation Service Company 2711 Centerville Road, Suite 400, Wilmington, Delaware, United States of America, 19808 |
| 53 | HSBC House Esplanade, St. Helier, Jersey, JE4 8UB |
| 54 | Level 21 Menara IQ, Lingkaran TRX, Tun Razak Exchange, Kuala Lumpur, Malaysia, 55188 |
| 55 | 13th Floor, South Tower 2 Leboh Ampang, Kuala Lumpur, Malaysia, 50100 |
| 56 | 10 Marina Boulevard #48-01 Marina Bay Financial Centre, Singapore, 018983 |
| 57 | 52/60 M G Road Fort, Mumbai, India, 400 001 |
| 58 | 16 Boulevard d'Avranches, Luxembourg, Luxembourg, L-1160 |
| 59 | 557 Bouchard Level 20, Ciudad de Buenos Aires, Capital federal, Argentina, C1106ABG |
| 60 | 9-11 Floors, NESCO IT Park Building No. 3 Western Express Highway, Goregaon (East), Mumbai, India, 400063 |
| 61 | Level 21 Menara IQ, Lingkaran TRX, Tun Razak Exchange, Kuala Lumpur, Malaysia, 55188 |
| 62 | Immeuble Cœur Défense 110 esplanade du Général de Gaulle, Courbevoie, France, 92400 |
| 63 | Level 36 Tower 1 International Towers Sydney, 100 Barangaroo Avenue, Sydney, New South Wales, Australia, 2000 |
| 64 | Isidora Goyenechea 2800 23rd floor, Las Condes, Santiago, Chile, 7550647 |
| 65 | HSBC Building Shanghai ifc, 8 Century Avenue, Pudong, Shanghai, China, 200120 |
| 66 | 6th floor HSBC Centre 18, Cybercity, Ebene, Mauritius, 72201 |
| 67 | 2 Paveletskaya square building 2, Moscow, Russian Federation, 115054 |
| 68 | 13F-14F, 333 Keelung Road, Sec.1, Taipei, 110, Taiwan |
| 69 | Rincón 391 Montevideo, CP 11.000, Uruguay, 11000 |
| 70 | The Metropolitan 235 Dong Khoi Street, District 1, Ho Chi Minh City, Viet Nam |
| 71 | Esentepe mah. Büyükdere Caddesi No.128, Istanbul, Turkey, 34394 |
| 72 | 66 Teryan street, Yerevan, Armenia, 0009 |
| | | | | |
| Registered offices |
| 73 | 885 West Georgia Street 3rd Floor, Vancouver, British Columbia, Canada, V6C 3E9 |
| 74 | 306 Corniche El Nil, P.O. Box 124, Maadi, Egypt, 11728 |
| 75 | 116 Archbishop Street, Valletta, Malta |
| 76 | Level 1, Building No. 8, Gate Village Dubai International Financial Centre, United Arab Emirates, P.O. Box 30444 |
| 77 | Majer Consulting, Office 54/44, Building A1, Residence Ryad Anfa, Boulevard Omar El Khayam, Casa Finance City (CFC), Casablanca, Morocco |
| 78 | Al Khuwair Office PO Box 1727 PC111 CPO Seeb, Muscat, Oman |
| 79 | 1800 Tysons Boulevard Suite 50, Tysons, Virginia, United States of America, 22102 |
| 80 | 66 Wellington Street West, Suite 5300, Toronto, Ontario, Canada, M5K 1E6 |
| 81 | P.O. Box 1109, Strathvale House, Ground floor, 90 North Church Street, George Town, Grand Cayman, Cayman Islands, KY1-1102 |
| 82 | HSBC House Esplanade, St. Helier, Jersey, JE1 1HS |
| 83 | 8 Canada Square, London, United Kingdom, E14 5HQ |
| 84 | c/o Rogers Capital St. Louis Business Centre, Cnr Desroches & St Louis Streets, Port Louis, Mauritius |
| 85 | 49 avenue J.F. Kennedy, Luxembourg, Luxembourg,
1855 |
| 86 | 4-17/F, Office Tower 2 TaiKoo Hui, No. 381 Tian He Road, Tian He District, Guangzhou, Guangdong, China |
| 87 | Suite 1005, 10th Floor, Wisma Hamzah Kwong, Hing No. 1, Leboh Ampang, Kuala Lumpur, Malaysia, 50100 |
| 88 | HSBC, Filinvest One Bldg Northgate Cyberzone, Filinvest Corporate City, Alabang, Muntinlupa City, Philippines, 1781 |
| 89 | HSBC House Plot No.8 Survey No.64 (Part), Hightec City Layout Madhapur, Hyderabad, India, 500081 |
| 90 | 439, Sri Jayawardenapura Mawatha Welikada, Rajagiriya, Colombo, Sri Lanka |
| 91 | Smart Village 28th Km Cairo- Alexandria Desert Road Building, Cairo, Egypt |
| 92 | 16 York Street, 6th Floor, Toronto, Ontario, Canada, M5J 0E6 |
| 93 | Centre Ville 1341 Building - 4th Floor Patriarche Howayek Street (facing Beirut Souks), PO Box Riad El Solh, Lebanon, 9597 |
| 94 | World Trade Center Montevideo Avenida Luis Alberto de Herrera 1248, Torre 1, Piso 15, Oficina 1502, Montevideo, Uruguay, CP 11300 |
| 95 | Room 655, Building A, No. 888, Huan Hu West Two Road, Lin Gang New Area of Shanghai (Pilot) Free Trade Zone, China, Shanghai, Shanghai, China |
| 96 | HSBC House Esplanade, St. Helier, Jersey, JE4 8WP |
| 97 | 80 Mill Street, Qormi, Malta, QRM 3101 |
| 98 | Herrengasse 1-3, Wien, Austria, 1010 |
| 99 | 26 Gartenstrasse, Zurich, Switzerland, 8002 |
| 100 | 24th Fl. 97-99, Sec.2, Tunhwa S. Rd., Taipei, Taiwan, R.O.C., Taiwan |
| 101 | 452 Fifth Avenue, New York, United States of America, NY10018 |
| 102 | Bouchard 557, Piso 18°, Cdad. Autónoma de Buenos Aires, Argentina, 1106 |
| 103 | Mareva House 4 George Street, Nassau, Bahamas |
| 104 | 18th Floor, Tower 1, HSBC Centre 1 Sham Mong Road, Kowloon, Hong Kong |
| 105 | Level 32, HSBC Main Building 1 Queen's Road Central, Hong Kong SAR, Hong Kong |
| 106 | 7/F HSBC Centre 3058 Fifth Ave West, Bonifacio Global City, Taguig City, Philippines |
| 107 | HSBC Building Minet El Hosn, Riad el Solh, Beirut 1107-2080, Lebanon, P.O. Box 11-1380 |
| 108 | 300 Delaware Avenue Suite 1401, Wilmington, Delaware, United States Of America, 19801 |
| | | | | |
| Registered offices |
| 109 | Woodbourne Hall, Road Town, Tortola, British Virgin Islands, P.O. Box 916 |
| 110 | Craigmuir Chambers, PO Box 71, Road Town, Tortola, British Virgin Islands |
| 111 | 300-885 West Georgia Street, Vancouver, British Columbia, Canada, V6C 3E9 |
| 112 | 21 Farncombe Road Worthing, United Kingdom, BN11 2BW |
| 113 | Unit 1602 of 16/F,18/F, Unit 2101, 2113, 2113A, 2115 and 2116 of 21/F, HSBC Building, 8 Century Avenue, China (Shanghai) Pilot Free Trade Zone, China |
| 114 | Arnold House St Julians Avenue, St Peter Port, Guernsey, GY1 1WA |
| 115 | Plot No.312-878 Mezzanine Floor, Bldg. of Sheikh Hamdan Bin Rashid, Dubai Creek, Dubai, United Arab Emirates |
| 116 | Level 1, Building No. 8, Gate Village Dubai International Financial Centre, PO Box 30444, United Arab Emirates |
| 117 | Unit 101 Level 1, Gate Village Building No. 8 Dubai International Financial Centre (DIFC), Dubai, United Arab Emirates, PO Box 506553 |
| 118 | Office No.16 Owned by HSBC Bank Middle East Limited, Dubai Branch, Bur Dubai, Burj Khalifa, Dubai, United Arab Emirates |
| 119 | 885 West Georgia Street Suite 300, Vancouver, British Columbia, Canada, V6C 3E9 |
| 120 | HSBC Tower, Level 21, 188 Quay Street, Auckland, New Zealand, 1010 |
| 121 | The Corporation Trust Incorporated, 2405 York Road, Suite 201, Lutherville Timonium, Maryland, United States of America |
| 122 | HSBC House Esplanade, St. Helier, Jersey, JE1 1GT |
| 123 | Quai des Bergues 9-17, Geneva, Switzerland, 1201 |
| 124 | 1 Grand Canal Square, Grand Canal Harbour, Dublin 2, Ireland, D02 P820 |
| 125 | Büyükdere Caddesi No.128, Istanbul, Turkey, 34394 |
| 126 | Quai des Bergues 9-17, Geneva, Switzerland, 1201 |
| 127 | HSBC House Esplanade, St Helier, Jersey, JE1 1GT |
| 128 | 5 rue Heienhaff, Senningerberg, Luxembourg, 1736 |
| 129 | 52/60 M G Road, Fort, Mumbai, India, 400 001 |
| 130 | Block 27 A&B, Qianhai Enterprise Dream Park No. 63 Qianwan Yi Road, Shenzhen-Hong Kong Cooperation Zone, Shenzhen, China, 518052 |
| 131 | HSBC Building 7267 Olaya - Al Murrooj , Riyadh, Saudi Arabia, 12283 - 2255 |
| 132 | Unit 1 GF The Commerical Complex Madrigal Avenue, Ayala Alabang Village, Muntinlupa City, Philippines, 17 |
| 133 | 1 Mutual Place 107 Rivonia Road, Sandton, Sandton, Gauteng, South Africa, 2196 |
| 134 | 13F 333 Keelung Road, Sec.1, Taipei, Taiwan, 110 |
| 135 | Kapelanka 42A, Krakow, Poland, 30-347 |
| 136 | MB&H Corporate Services Ltd Mareva House, 4 George Street, Nassau, Bahamas |
| 137 | C T Corporation System 820 Bear Tavern Road, West Trenton, New Jersey, United States Of America, 08628 |
| 138 | L22, Office Tower 2, Taikoo Hui, 381 Tianhe Road, Tianhe District, Guangzhou, Guangdong, China |
| 139 | Level 19, HSBC Building, Shanghai ifc 8 Century Avenue Pudong, Shanghai, China |
| 140 | P.O. Box 309 Ugland House, Grand Cayman, Cayman Islands, KY1-1104 |
| 141 | No. 56 Yu Rong Street, Macheng, China, 438300 |
| 142 | No. 205 Lie Shan Road Suizhou, Hubei, China |
| 143 | Building 3, Yin Zuo Di Jing Wan Tianmen New City, Tianmen, Hubei Province, China |
| 144 | RM101, 102 & 106 Sunshine Fairview, Sunshine Garden, Pedestrian Walkway, Pingjiang, China |
| 145 | Oak House Hirzel Street, St Peter Port, Guernsey, GY1 2NP |
| 146 | Kings Meadow Chester Business Park, Chester, United Kingdom, CH99 9FB |
Notes on the financial statements
| | | | | |
| Registered offices |
| 147 | World Trade Center 1, Floor 8-9 Jalan Jenderal Sudirman Kavling 29 - 31, Jakarta, Indonesia, 12920 |
| 148 | 5th Floor, World Trade Center 1, Jl. Jend. Sudirman Kav. 29-31, Jakarta, Indonesia, 12920 |
| 149 | Unit B02 20/F No. 168 Yin Cheng Zhong Road, Pilot Free Trade Zone, Shanghai, China, 200120 |
| 150 | No.198-2 Chengshan Avenue (E), Rongcheng, China, 264300 |
| 151 | Room 1303-13062 Marine Center Main Tower, 59 Linhai Rd, Nanshan District, Shenzhen, China |
| 152 | Woodbourne Hall, Road Town, Tortola, British Virgin Islands, P.O. Box 3162 |
| 153 | 43 rue de Paris, Saint Denis, France, 97400 |
| 154 | RM 2112, HSBC Building, Shanghai ifc No. 8 Century Road, Pudong, Shanghai, China, 200120 |
| 155 | 25 Main St. P.O. Box 69, Grand Cayman, Cayman Islands, KY1-1107 |
| 156 | No 5 Jalan Prof Khoo Kay Kim, Seksyen 13, Petaling Jaya, Selangor, Malaysia, 46200 |
| 157 | Office 1.01 21 Gloucester Place, London, United Kingdom, W1U 8HR |
| 158 | c/o MUFG Fund Services (Bermuda) Limited The Belvedere Building, 69 Pitts Bay Road, Pembroke, Bermuda, HM |
| 159 | c/o Hackwood Secretaries Limited One Silk Street, London, United Kingdom, EC2Y 8HQ |
| 160 | All Saints Triangle Caledonian road, London, United Kingdom, N19UT |
| 161 | No.188, Yin Cheng Zhong Road China (Shanghai), Pilot Free Trade Zone, Shanghai, China |
| 162 | 49/F The Lee Gardens, 33 Hysan Avenue, Hong Kong |
| 163 | 13-15 York Buildings, London, United Kingdom, WC2N 6JU |
| 164 | Ground Floor, 25b Vyner Street, London, United Kingdom, E2 9DG |
| 165 | Unit No. 208, 2nd Floor, Kanchenjunga Building 18, Barakhamba Road, New Delhi, India, 110001 |
| 166 | 65 Gresham Street 6th Floor, London, United Kingdom, EC2V 7NQ |
| 167 | 50 Raffles Place, #32-01 Singapore Land Tower, Singapore, 048623 |
| | | | | |
| Registered offices |
| 168 | Office 7, 35-37 Ludgate Hill, London, United Kingdom, EC4M 7JN |
| 169 | 9/F Amtel Bldg, 148 des Voeux Rd Central,, Central, Hong Kong |
| 170 | 3 avenue de l'Opera, Paris, France, 75001 |
| 171 | Room 1303, 106 Feng Ze Dong Road, Nansha District, Guangzhou, Guangdong, China |
| 172 | 17F, HSBC Building, Shanghai ifc 8 Century Avenue, Pudong, Shanghai, China |
| 173 | 10th Floor 5 Churchill Place, London, England, London, United Kingdom, E14 5HU |
| 174 | C T Corporation System 1200 South Pine Island Road Plantation, Florida, United States of America, 33324 |
| 175 | 100 Town Square Place, Suite 201, Jersey City, NJ , United States of America, 07310 |
| 176 | 1-2 Royal Exchange Buildings Royal Exchange, London, United Kingdom, EC3V 3LF |
| 177 | Precinct Building 4, Level 3, Dubai International Financial Centre, Dubai, United Arab Emirates, P.O. BOX 506553 |
| 178 | 75 Park Lane, Croydon, Surrey, United Kingdom, CR9 1XS |
| 179 | 32 rue du Champ de Tir, Nantes, France, 44300 |
| 180 | 125 W 25th St. New York, New York, United States of America, 10001 |
| 181 | Ernst-Schneider-Platz 1, Duesseldorf, Germany, 40212 |
| 182 | Al Amir Abdulaziz Ibn Mossaad Ibn Jalawi Street, Riyadh, Saudi Arabia |
| 183 | 3 More London Riverside, London, United Kingdom, SE1 2AQ |
| 184 | Office Block A, Bay Studios Business Park, Fabian Way, Swansea, Wales, United Kingdom, SA1 8QB |
| 185 | 10 Earlsfort Terrace, Dublin, Ireland, D02 T380 |
| 186 | 34 Copse Wood Way, Northwood, Middlesex, United Kingdom, HA6 2UA |
| 187 | Business Bay, Wing 2, Tower B, Survey no 103, Hissa no. 2, Airport road, Yerwada Pune India 411006 |
The information set out in these accounts does not constitute the Company’s statutory accounts for the years ended 31 December 2021 or 2020. Those accounts have been reported on by the Company’s auditors: their reports were unqualified and did not contain a statement under Section 498(2) or (3) of the Companies Act 2006.
The accounts for 2020 have been delivered to the Registrar of Companies and those for 2021 will be delivered in due course.
| | | | | | | | | | | | | | |
| Shareholder information |
| Page | | | Page |
| Second Interim dividend for 2021 | | | Exchange controls and other limitations affecting equity security holders | |
| Interim dividends for 2022 | | | Dividends on the ordinary shares of HSBC Holdings | |
| Other equity instruments | | | American Depository Shares | |
| 2021 Annual General Meeting | | | Nature of trading market | |
| Earnings releases and interim results | | | Memorandum and Articles of Association | |
| Shareholder enquiries and communications | | | Differences in HSBC Holdings/New York Stock Exchange corporate governance practices | |
| Stock symbols | | |
| Investor relations | | | Glossary of accounting terms and US equivalents | |
| Where more information about HSBC is available | | | Reconciliations | |
| Taxation of shares and dividends | | | Abbreviations | |
| Information made about the enforceability of judgments made in the US | | | | |
| | | | |
| | | | |
| | | | |
| | | | |
| | | | |
| | | | |
| | | | |
This section gives important information for our shareholders, including contact information. It also includes an overview of key abbreviations and terminology used throughout the Annual Report and Accounts.
A glossary of terms used in the Annual Report and Accounts can be found in the Investors section of www.hsbc.com.
| | |
| Second interim dividend for 2021 |
The Directors have approved a second interim dividend for 2021 of $0.18 per ordinary share. Information on the currencies in which shareholders may elect to have the cash dividend paid will be sent to shareholders on or about 25 March 2022. The interim dividend will be paid in cash. The timetable for the interim dividend is:
| | | | | | |
| | |
| Announcement | | 22 February 2022 |
Shares quoted ex-dividend in London, Hong Kong and Bermuda and American Depositary Shares (‘ADS’) quoted ex-dividend
in New York | | 10 March 2022 |
Record date – London, Hong Kong, New York, Bermuda1 | | 11 March 2022 |
Mailing of Annual Report and Accounts 2021 and/or Strategic Report 2021 and dividend documentation | | 25 March 2022 |
| Final date for receipt by registrars of forms of election, Investor Centre electronic instructions and revocations of standing instructions for dividend elections | | 13 April 2022 |
| Exchange rate determined for payment of dividends in sterling and Hong Kong dollars | | 19 April 2022 |
| Payment date | | 28 April 2022 |
1Removals to and from the Overseas Branch register of shareholders in Hong Kong will not be permitted on this date.
| | |
| Interim dividends for 2022 |
The Group has reviewed whether it will revert to paying quarterly dividends and is currently not intending to pay quarterly dividends during 2022. The Group will continue to review whether to revert to paying quarterly dividends in future years, and a further update will be given at or ahead of the 2022 results announcement in February 2023.
For the financial year 2021, we are at the lower end of our target dividend payout ratio range of between 40% and 55% of reported earnings per ordinary share (‘EPS’), driven by ECL releases and higher restructure costs. The dividend policy has the flexibility to adjust EPS for non-cash significant items such as goodwill or intangibles impairments and may be supplemented from time to time by buy-backs or special dividends, should the Group find itself in an excess capital position absent compelling investment opportunities to deploy that excess.
Dividends are declared in US dollars and, at the election of the shareholder, paid in cash in one of, or in a combination of, US dollars, pounds sterling and Hong Kong dollars.
Additional tier 1 capital – contingent convertible securities
HSBC continues to issue contingent convertible securities that are included in its capital base as fully CRR II-compliant additional tier 1 capital securities. For further details on these securities, please refer to Note 31 on the financial statements.
HSBC issued $1,000m 4.000% and $1,000m 4.700% Perpetual Contingent Convertible Securities on 9 March 2021.
| | |
| 2021 Annual General Meeting |
With the exception of the shareholder requisitioned Resolution 16, which the Board recommended that shareholders vote against, all resolutions considered at the 2021 Annual General Meeting held at 11:00am on 28 May 2021 at Queen Elizabeth Hall, Southbank Centre, Belvedere Road, London SE1 8XX, UK were passed on a poll.
| | |
| Earnings releases and interim results |
First and third quarter results for 2022 will be released on 26 April 2022 and 25 October 2022 respectively. The interim results for the six months to 30 June 2022 will be issued on 1 August 2022.
| | |
| Shareholder enquiries and communications |
Enquiries
Any enquiries relating to shareholdings on the share register (for example, transfers of shares, changes of name or address, lost share certificates or dividend cheques) should be sent to the Registrars at the address given below. The Registrars offer an online facility, Investor Centre, which enables shareholders to manage their shareholding electronically.
| | | | | | | | | | | | | | |
| Principal Register: | | Hong Kong Overseas Branch Register: | | Bermuda Overseas Branch Register: |
| | | | |
| Computershare Investor Services PLC | | Computershare Hong Kong Investor | | Investor Relations Team |
| The Pavilions | | Services Limited | | HSBC Bank Bermuda Limited |
| Bridgwater Road | | Rooms 1712-1716, 17th Floor | | 37 Front Street |
| Bristol BS99 6ZZ | | Hopewell Centre | | Hamilton HM 11 |
| United Kingdom | | 183 Queen’s Road East | | Bermuda |
| Telephone: +44 (0) 370 702 0137 | | Hong Kong | | Telephone: +1 441 299 6737 |
| Email via website: | | Telephone: +852 2862 8555 | | Email: hbbm.shareholder.services@hsbc.bm |
| www.investorcentre.co.uk/contactus | | Email: hsbc.ecom@computershare.com.hk | | |
| | | | |
| Investor Centre: | | Investor Centre: | | Investor Centre: |
| www.investorcentre.co.uk | | www.investorcentre.com/hk | | www.investorcentre.com/bm |
Any enquiries relating to ADSs should be sent to the depositary:
| | |
| The Bank of New York Mellon |
| Shareowner Services |
| PO Box 505000 |
| Louisville, KY 40233-5000 |
| USA |
| Telephone (US): +1 877 283 5786 |
| Telephone (International): +1 201 680 6825 |
| Email: shrrelations@cpushareownerservices.com |
| Website: www.mybnymdr.com |
If you have elected to receive general shareholder communications directly from HSBC Holdings, it is important to remember that your main contact for all matters relating to your investment remains the registered shareholder, or custodian or broker, who administers the investment on your behalf. Therefore, any changes or queries relating to your personal details and holding (including any administration of it) must continue to be directed to your existing contact at your investment manager or custodian or broker. HSBC Holdings cannot guarantee dealing with matters directed to it in error.
Shareholders who wish to receive a hard copy of the Annual Report and Accounts 2021 should contact HSBC’s Registrars. Please visit www.hsbc.com/investors/investor-contacts for further information. You can also download an online version of the report from www.hsbc.com.
Electronic communications
Shareholders may at any time choose to receive corporate communications in printed form or to receive notifications of their availability on HSBC’s website. To receive notifications of the availability of a corporate communication on HSBC’s website by email, or revoke or amend an instruction to receive such notifications by email, go to www.hsbc.com/investors/shareholder-information/manage-your-shareholding. If you provide an email address to receive electronic communications from HSBC, we will also send notifications of your dividend entitlements by email. If you received a notification of the availability of this document on HSBC’s website and would like to receive a printed copy, or if you would like to receive future corporate communications in printed form, please write or send an email (quoting your shareholder reference number) to the appropriate Registrars at the address given above. Printed copies will be provided without charge.
Chinese translation
A Chinese translation of the Annual Report and Accounts 2021 will be available upon request after 25 March 2022 from the Registrars:
| | | | | | | | |
| Computershare Hong Kong Investor Services Limited | | Computershare Investor Services PLC |
| Rooms 1712-1716, 17th Floor | | The Pavilions |
| Hopewell Centre | | Bridgwater Road |
| 183 Queen’s Road East | | Bristol BS99 6ZZ |
| Hong Kong | | United Kingdom |
Please also contact the Registrars if you wish to receive Chinese translations of future documents, or if you have received a Chinese translation of this document and do not wish to receive them in future.
HSBC Holdings ordinary shares trade under the following stock symbols:
| | | | | | | | | | | |
| London Stock Exchange | HSBA* | New York Stock Exchange (ADS) | HSBC |
| Hong Kong Stock Exchange | 5 | Bermuda Stock Exchange | HSBC.BH |
*HSBC’s Primary market | | | |
| | | |
Enquiries relating to HSBC’s strategy or operations may be directed to:
| | | | | |
| Richard O’Connor, Global Head of Investor Relations | Mark Phin, Head of Investor Relations, Asia-Pacific |
| HSBC Holdings plc | The Hongkong and Shanghai Banking |
| 8 Canada Square | Corporation Limited |
| London E14 5HQ | 1 Queen’s Road Central |
| United Kingdom | Hong Kong |
| Telephone: +44 (0) 20 7991 6590 | Telephone: 852 2822 4908 |
| Email: investorrelations@hsbc.com | Email: investorrelations@hsbc.com.hk |
| | |
| Where more information about HSBC is available |
The Annual Report and Accounts 2021 and other information on HSBC may be downloaded from HSBC’s website: www.hsbc.com.
Reports, statements and information that HSBC Holdings files with the Securities and Exchange Commission are available at www.sec.gov. Investors can also request hard copies of these documents upon payment of a duplicating fee by writing to the SEC at the Office of Investor Education and Advocacy, 100 F Street N.E., Washington, DC 20549-0213 or by emailing PublicInfo@sec.gov. Investors should call the Commission at (1) 202 551 8090 if they require further assistance. Investors may also obtain the reports and other information that HSBC Holdings files at www.nyse.com (telephone number (1) 212 656 3000).
HM Treasury has transposed the requirements set out under CRD IV and issued the Capital Requirements Country-by-Country Reporting Regulations 2013. The legislation requires HSBC Holdings to publish additional information in respect of the year ended 31 December 2021 by 31 December 2022. This information will be available on HSBC’s website: www.hsbc.com/tax.
| | |
| Taxation of shares and dividends |
Taxation – UK residents
The following is a summary, under current law and the current published practice of HM Revenue and Customs (‘HMRC’), of certain UK tax considerations that are likely to be material to the ownership and disposition of HSBC Holdings ordinary shares. The summary does not purport to be a comprehensive description of all the tax considerations that may be relevant to a holder of shares. In particular, the summary deals with shareholders who are resident solely in the UK for UK tax purposes and only with holders who hold the shares as investments and who are the beneficial owners of the shares, and does not address the tax treatment of certain classes of holders such as dealers in securities. Holders and prospective purchasers should consult their own advisers regarding the tax consequences of an investment in shares in light of their particular circumstances, including the effect of any national, state or local laws.
Taxation of dividends
Currently, no tax is withheld from dividends paid by HSBC Holdings.
UK resident individuals
UK resident individuals are generally entitled to a tax-free annual allowance in respect of dividends received. The amount of the allowance for the tax year beginning 6 April 2021 is £2,000. To the extent that dividend income received by an individual in the relevant tax year does not exceed the allowance, a nil tax rate will apply. Dividend income in excess of this allowance will be taxed at 7.5% for basic rate taxpayers, 32.5% for higher rate taxpayers and 38.1% for additional rate taxpayers. From 6 April 2022, these rates will each be increased by 1.25% to 8.75%, 33.75% and 39.35% respectively.
UK resident companies
Shareholders that are within the charge to UK corporation tax should generally be entitled to an exemption from UK corporation tax on any dividends received from HSBC Holdings. However, the exemptions are not comprehensive and are subject to anti-avoidance rules.
If the conditions for exemption are not met or cease to be satisfied, or a shareholder within the charge to UK corporation tax elects for an otherwise exempt dividend to be taxable, the shareholder will be subject to UK corporation tax on dividends received from HSBC Holdings at the rate of corporation tax applicable to that shareholder.
Scrip dividends
There were no scrip dividends issued during the year. As announced on 23 February 2021, the Group has decided to discontinue the scrip dividend option.
Taxation of capital gains
The computation of the capital gains tax liability arising on disposals of shares in HSBC Holdings by shareholders subject to UK tax on capital gains can be complex, partly depending on whether, for example, the shares were purchased since April 1991, acquired in 1991 in exchange for shares in The Hongkong and Shanghai Banking Corporation Limited, or acquired subsequent to 1991 in exchange for shares in other companies.
For capital gains tax purposes, the acquisition cost for ordinary shares is adjusted to take account of subsequent rights and capitalisation issues. Any capital gain arising on a disposal of shares in HSBC Holdings by a UK company may also be adjusted to take account of indexation allowance if the shares were acquired before 1 January 2018, although the level of indexation allowance that is given in calculating the gain would be frozen at the value that would be applied to a disposal of those shares in December 2017. If in doubt, shareholders are recommended to consult their professional advisers.
Stamp duty and stamp duty reserve tax
Transfers of shares by a written instrument of transfer generally will be subject to UK stamp duty at the rate of 0.5% of the consideration paid for the transfer (rounded up to the next £5), and such stamp duty is generally payable by the transferee. An agreement to transfer shares, or any interest therein, normally will give rise to a charge to stamp duty reserve tax at the rate of 0.5% of the consideration. However, provided an instrument of transfer of the shares is executed pursuant to the agreement and duly stamped before the date on which the stamp duty reserve tax becomes payable, under the current published practice of HMRC it will not be necessary to pay the stamp duty reserve tax, nor to apply for such tax to be cancelled. Stamp duty reserve tax is generally payable by the transferee.
Paperless transfers of shares within CREST, the UK’s paperless share transfer system, are liable to stamp duty reserve tax at the rate of 0.5% of the consideration. In CREST transactions, the tax is calculated and payment made automatically. Deposits of shares into CREST generally will not be subject to stamp duty reserve tax, unless the transfer into CREST is itself for consideration. Following the case HSBC pursued before the European Court of Justice (Case C-569/07 HSBC Holdings plc and Vidacos Nominees Ltd v The Commissioners for HM Revenue and Customs) and a subsequent case in relation to depositary receipts, HMRC accepted that the charge to stamp duty reserve tax at 1.5% on the issue of shares (and transfers integral to capital raising) to a depositary receipt issuer or a clearance service was incompatible with European Union law, and would not be imposed.
Following the UK’s departure from the European Union and the expiry of the transition period, the 1.5% stamp duty reserve tax charge on issues of shares to overseas clearance services and depositary receipt issuers is still disapplied, but no assurance can be given that legislation will not be amended in the future to reintroduce the charge.
Taxation – US residents
The following is a summary, under current law, of the principal UK tax and US federal income tax considerations that are likely to be material to the ownership and disposition of shares or American Depositary Shares (‘ADSs’) by a holder that is a US holder, as defined below, and who is not resident in the UK for UK tax purposes.
The summary does not purport to be a comprehensive description of all of the tax considerations that may be relevant to a holder of shares or ADSs. In particular, the summary deals only with US holders that hold shares or ADSs as capital assets, and does not address the tax treatment of holders that are subject to special tax rules. These include banks, tax-exempt entities, insurance companies, dealers in securities or currencies, persons that hold shares or ADSs as part of an integrated investment (including a ‘straddle’ or ‘hedge’) comprised of a share or ADS and one or more other positions, and persons that own directly or indirectly 10% or more (by vote or value) of the stock of HSBC Holdings. This discussion is based on laws, treaties, judicial decisions and regulatory interpretations in effect on the date hereof, all of which are subject to change.
For the purposes of this discussion, a ‘US holder’ is a beneficial holder that is a citizen or resident of the United States, a US domestic corporation or otherwise is subject to US federal income taxes on a net income basis in respect thereof.
Holders and prospective purchasers should consult their own advisers regarding the tax consequences of an investment in shares or ADSs in light of their particular circumstances, including the effect of any national, state or local laws.
Any US federal tax advice included in the Annual Report and Accounts 2021 is for informational purposes only. It was not intended or written to be used, and cannot be used, for the purpose of avoiding US federal tax penalties.
Taxation of dividends
Currently, no tax is withheld from dividends paid by HSBC Holdings. For US tax purposes, a US holder must include cash dividends paid on the shares or ADSs in ordinary income on the date that such holder or the ADS depositary receives them, translating dividends paid in UK pounds sterling into US dollars using the exchange rate in effect on the date of receipt. A US holder that elects to receive shares in lieu of a cash dividend must include in ordinary income the fair market value of such shares on the dividend payment date, and the tax basis of those shares will equal such fair market value.
Subject to certain exceptions for positions that are held for less than 61 days, and subject to a foreign corporation being considered a ‘qualified foreign corporation’ (which includes not being classified for US federal income tax purposes as a passive foreign investment company), certain dividends (‘qualified dividends’) received by an individual US holder generally will be subject to US taxation at preferential rates. Based on the company’s audited financial statements and relevant market and shareholder data, HSBC Holdings was not and does not anticipate being classified as a passive foreign investment company. Accordingly, dividends paid on the shares or ADSs generally should be treated as qualified dividends.
Taxation of capital gains
Gains realised by a US holder on the sale or other disposition of shares or ADSs normally will not be subject to UK taxation unless at the time of the sale or other disposition the holder carries on a trade, profession or vocation in the UK through a branch or agency or permanent establishment and the shares or ADSs are or have been used, held or acquired for the purposes of such trade, profession, vocation, branch or agency or permanent establishment. Such gains will be included in income for US tax purposes, and will be long-term capital gains if the shares or ADSs were held for more than one year. A long-term capital gain realised by an individual US holder generally will be subject to US tax at preferential rates.
Inheritance tax
Shares or ADSs held by an individual whose domicile is determined to be the US for the purposes of the United States –United Kingdom Double Taxation Convention relating to estate and gift taxes (the ‘Estate Tax Treaty’) and who is not for such purposes a national of the UK will not, provided any US federal estate or gift tax chargeable has been paid, be subject to UK inheritance tax on the individual’s death or on a lifetime transfer of shares or ADSs except in certain cases where the shares or ADSs (i) are comprised in a settlement (unless, at the time of the settlement, the settlor was domiciled in the US and was not a national of the UK), (ii) are part of the business property of a UK permanent establishment of an enterprise, or (iii) pertain to a UK fixed base of an individual used for the performance of independent personal services. In such cases, the Estate Tax Treaty generally provides a credit against US federal tax liability for the amount of any tax paid in the UK in a case where the shares or ADSs are subject to both UK inheritance tax and to US federal estate or gift tax.
Stamp duty and stamp duty reserve tax – ADSs
If shares are transferred to a clearance service or American Depositary Receipt (‘ADR’) issuer (which will include a transfer of shares to the depositary) under the current published HMRC practice, UK stamp duty and/or stamp duty reserve tax will be payable. The stamp duty or stamp duty reserve tax is generally payable on the consideration for the transfer and is payable at the aggregate rate of 1.5%.
The amount of stamp duty reserve tax payable on such a transfer will be reduced by any stamp duty paid in connection with the same transfer.
No stamp duty will be payable on the transfer of, or agreement to transfer, an ADS, provided that the ADR and any separate instrument of transfer or written agreement to transfer remain at all times outside the UK, and provided further that any such
transfer or written agreement to transfer is not executed in the UK. No stamp duty reserve tax will be payable on a transfer of, or agreement to transfer, an ADS effected by the transfer of an ADR.
US information reporting and backup withholding tax
Distributions made on shares or ADSs and proceeds from the sale of shares or ADSs that are paid within the US, or through certain financial intermediaries to US holders, are subject to US information reporting and may be subject to a US ‘backup’ withholding tax. General exceptions to this rule happen when the US holder: establishes that it is a corporation (other than an S corporation) or other exempt holder; or provides a correct taxpayer identification number, certifies that no loss of exemption from backup withholding has occurred and otherwise complies with the applicable requirements of the backup withholding rules. Holders that are not US taxpayers generally are not subject to US information reporting or backup withholding tax, but may be required to comply with applicable certification procedures to establish that they are not US taxpayers in order to avoid the application of such US information reporting requirements or backup withholding tax to payments received within the US or through certain financial intermediaries.
| | |
| Information about the enforceability of judgments made in the US |
HSBC Holdings is a public limited company incorporated in England and Wales.
Most of the Directors and executive officers live outside the US. As a result, it may not be possible to serve process on such persons or HSBC Holdings in the US or to enforce judgments obtained in US courts against them or HSBC Holdings based on civil liability provisions of the securities laws of the US.
There is doubt as to whether English courts would enforce:
•civil liabilities under US securities laws in original actions; or
•judgments of US courts based upon these civil liability provisions.
In addition, awards of punitive damages in actions brought in the US or elsewhere may be unenforceable in the UK.
The enforceability of any judgment in the UK will depend on the particular facts of the case as well as the laws and treaties in effect at the time.
| | |
| Exchange controls and other limitations affecting equity security holders |
Other than certain economic sanctions that may be in force from time to time, there are currently no UK laws, decrees or regulations that would prevent the import or export of capital or remittance of distributable profits by way of dividends and other payments to holders of HSBC Holdings’ equity securities who are not residents of the UK. There are also no restrictions under the laws of the UK or the terms of the Memorandum and Articles of Association concerning the right of non-resident or foreign owners to hold HSBC Holdings’ equity securities or, when entitled to vote, to do so.
| | |
| Dividends on the ordinary shares of HSBC Holdings |
The HSBC Holdings dividends approved, per ordinary share, in respect of each of the last five years were:
| | | | | | | | | | | | | | | | | | | | |
| | First interim | Second interim1 | Third interim | Fourth interim | Total2 |
| 2021 | $ | 0.070 | | 0.180 | – | – | 0.250 |
| £ | 0.051 | | 0.133 | – | – | 0.184 |
| HK$ | 0.545 | | 1.404 | – | – | 1.949 |
| 2020 | $ | – | – | – | 0.150 | | 0.150 |
| £ | – | – | – | 0.108 | | 0.108 |
| HK$ | – | – | – | 1.165 | | 1.165 |
| 2019 | $ | 0.100 | | 0.100 | | 0.100 | | – | 0.300 |
| £ | 0.078 | | 0.080 | | 0.078 | | – | 0.236 |
| HK$ | 0.781 | | 0.782 | | 0.783 | | – | 2.346 |
| 2018 | $ | 0.100 | | 0.100 | | 0.100 | | 0.210 | | 0.510 |
| £ | 0.076 | | 0.076 | | 0.078 | | 0.159 | | 0.389 |
| HK$ | 0.785 | | 0.785 | | 0.783 | | 1.648 | | 4.000 |
| 2017 | $ | 0.100 | | 0.100 | | 0.100 | | 0.210 | | 0.510 |
| £ | 0.079 | | 0.076 | | 0.076 | | 0.148 | | 0.379 |
| HK$ | 0.780 | | 0.781 | | 0.780 | | 1.647 | | 3.988 |
1The second interim dividend for 2021 of $0.18 per ordinary share will be paid on 28 April 2022. The second interim dividend for 2021 has been translated into pounds sterling and Hong Kong dollars at the closing rate on 31 December 2021.
2The above dividends approved are accounted for as disclosed in Note 8 on the Financial Statements.
| | |
| American Depositary Shares |
A holder of HSBC Holdings’ American Depositary Shares (‘ADSs’) may have to pay, either directly or indirectly (via the intermediary through whom their ADSs are held) fees to the Bank of New York Mellon as depositary.
Fees may be paid or recovered in several ways: by deduction from amounts distributed; by selling a portion of distributable property; by deduction from dividend distributions; by directly invoicing the holder; or by charging the intermediaries who act for them.
Fees for the holders of the HSBC ADSs include:
| | | | | |
| For: | HSBC ADS holders must pay: |
| Each issuance of HSBC ADSs, including as a result of a distribution of shares (including through a stock dividend, stock split or distribution of rights or other property) | $5.00 (or less) per 100 HSBC ADSs or portion thereof |
| Each cancellation of HSBC ADSs, including if the deposit agreement terminates | $5.00 (or less) per 100 HSBC ADSs or portion thereof |
| Transfer and registration of shares on our share register to/from the holder’s name to/from the name of The Bank of New York Mellon or its agent when the holder deposits or withdraws shares | Registration or transfer fees (of which there currently are none) |
| Conversion of non-US currency to US dollars | Charges and expenses incurred by The Bank of New York Mellon with respect to the conversion |
| Each cash distribution to HSBC ADS holders | $0.02 or less per ADS |
| Transfers of HSBC ordinary shares to the depositary in exchange for HSBC ADSs | Any applicable taxes and/or other governmental charges |
| Distribution of securities by the depository to HSBC ADS holders | A fee equivalent to the fee that would be payable if securities distributed to you had been shares and those shares had been deposited for issuance of ADSs |
| Any other charges incurred by the depositary or its agents for servicing shares or other securities deposited | As applicable |
The depositary may generally refuse to provide fee-attracting services until its fees for those services are paid.
The depositary has agreed to reimburse us for expenses we incur, and to pay certain out-of-pocket expenses and waive certain fees, in connection with the administration, servicing and maintenance of our ADS programme. There are limits on the amount of expenses for which the depositary will reimburse us. During the year ended 31 December 2021, the depositary reimbursed, paid and/or waived fees and expenses totalling $2,939,452 in connection with the administration, servicing and maintenance of the programme.
HSBC Holdings ordinary shares are listed or admitted to trading on the London Stock Exchange (‘LSE’), the Hong Kong Stock Exchange (‘HKSE’), the Bermuda Stock Exchange and on the New York Stock Exchange (‘NYSE’) in the form of ADSs. HSBC Holdings maintains its principal share register in England and overseas branch share registers in Hong Kong and Bermuda (collectively, the ‘share register’).
As at 31 December 2021, there were a total of 187,002 holders of record of HSBC Holdings ordinary shares on the share register.
As at 31 December 2021, a total of 19,321,366 of the HSBC Holdings ordinary shares were registered in the HSBC Holdings’ share register in the name of 14,178 holders of record with addresses in the US. These shares represented 0.09% of the total HSBC Holdings ordinary shares in issue.
As at 31 December 2021, there were 5,087 holders of record of ADSs holding approximately 88.02m ADSs, representing approximately 440.1m HSBC Holdings ordinary shares, 4,993 of these holders had addresses in the US, holding approximately 87.99m ADSs, representing approximately 439.97m HSBC Holdings ordinary shares. As at 31 December 2021, approximately 2.13% of the HSBC Holdings ordinary shares were represented by ADSs held by holders of record with addresses in the US.
| | |
| Memorandum and Articles of Association |
The disclosure under the caption ‘Memorandum and Articles of Association’ contained in Form 20-F for the years ended
31 December 2000, 2001, 2014 and 2018 is incorporated by reference herein.
| | |
| Differences in HSBC Holdings/New York Stock Exchange corporate governance practices |
Under the NYSE’s corporate governance rules for listed companies and the applicable rules of the SEC, as a NYSE-listed foreign private issuer, HSBC Holdings must disclose any significant ways in which its corporate governance practices differ from those followed by US companies subject to NYSE listing standards. HSBC Holdings believes the following to be the significant differences between its corporate governance practices and NYSE corporate governance rules applicable to US companies.
US companies listed on the NYSE are required to adopt and disclose corporate governance guidelines. The Listing Rules of the FCA require each listed company incorporated in the UK to include in its annual report and accounts a statement of how it has applied the principles of The UK Corporate Governance Code issued by the Financial Reporting Council and a statement as to whether or not it has complied with the code provisions of The UK Corporate Governance Code throughout the accounting period covered by the annual report and accounts. A company that has not complied with the code provisions, or complied with only some of the code provisions or (in the case of provisions whose requirements are of a continuing nature) complied for only part of an accounting period covered by the report, must specify the code provisions with which it has not complied, and (where relevant) for which part of the reporting period such non-compliance continued, and give reasons for any non-compliance. As stated above, HSBC Holdings complied throughout 2021 with the applicable code provisions of The UK Corporate Governance Code. The UK Corporate Governance Code does not require HSBC Holdings to disclose the full range of corporate governance guidelines with which it complies.
Under NYSE standards, companies are required to have a nominating/corporate governance committee composed entirely of directors determined to be independent in accordance with the NYSE’s corporate governance rules. All of the members of the Nomination Committee during 2021 were independent
non-executive Directors, as determined in accordance with the UK Corporate Governance Code. The terms of reference of our Nomination Committee, which comply with the UK Corporate Governance Code, require a majority of members to be independent non-executive Directors. In addition to identifying individuals qualified to become Board members, a nominating/corporate governance committee must develop and recommend to the Board a set of corporate governance principles.
The Nomination Committee’s terms of reference do not require it to develop and recommend corporate governance principles for HSBC Holdings, as HSBC Holdings is subject to the corporate governance principles of the UK Corporate Governance Code.
The Board of Directors is responsible under its terms of reference for the development and review of Group policies and practices on corporate governance.
Under the NYSE standards, companies are required to have a compensation committee composed entirely of directors determined to be independent in accordance with the NYSE’s corporate governance rules. All of the members of the Group Remuneration Committee during 2021 were independent non-executive Directors, as determined in accordance with the UK Corporate Governance Code. The terms of reference of our Group Remuneration Committee, which comply with the UK Corporate Governance Code, require at least three members to be independent non-executive Directors. A compensation committee must review and approve corporate goals and objectives relevant to chief executive officer compensation and evaluate a chief executive officer’s performance in light of these goals and objectives. The Group Remuneration Committee’s terms of reference require it to review and approve performance-based remuneration of the executive Directors by reference to corporate goals and objectives that are set by the Board of Directors.
Pursuant to NYSE listing standards, non-management directors must meet on a regular basis without management present and independent directors must meet separately at least once per year.
The Group Chairman meets with the independent non-executive Directors without the executive Directors in attendance after each Board meeting and otherwise, as necessary. HSBC Holdings’ practice, in this regard, complies with the UK Corporate Governance Code.
In accordance with the requirements of the UK Corporate Governance Code, HSBC Holdings discloses in its Annual Report and Accounts how the Board, its committees and the Directors are evaluated (on page 332) and provides extensive information regarding Directors’ compensation in the Directors’ remuneration report (on page 290). The terms of reference of HSBC Holdings’ Group Audit, Group Nomination, Group Remuneration and Group Risk Committees are available at www.hsbc.com/who-we-are/leadership-and-governance/board-committees.
NYSE listing standards require US companies to adopt a code of business conduct and ethics for directors, officers and employees, and promptly disclose any waivers of the code for directors or executive officers.
In 2021, the Board endorsed the Statement of Business Principles and Code of Conduct, which, pursuant to the requirements of the Sarbanes-Oxley Act, incorporates the Sarbanes-Oxley code of ethics (the “Sarbanes-Oxley Principles”) applicable to the Group Chief Executive, as the principal executive officer, and to the Group Chief Financial Officer and Global Financial Controller. The Statement of Business Principles and Code of Conduct applies to the employees of all our companies. The Statement of Business Principles and Code of Conduct is available on www.hsbc.com/who-we-are/esg-and-responsible-business/our-conduct or from the Group Company Secretary and Chief Governance Officer at
8 Canada Square, London E14 5HQ. During 2021, HSBC Holdings granted no waivers from its code of ethics.
Under NYSE listing rules applicable to US companies, independent directors must comprise a majority of the board of directors. Currently, more than three-quarters of HSBC Holdings’ Directors are independent.
Under the UK Corporate Governance Code, the HSBC Holdings Board determines whether a Director is independent in character and judgement and whether there are relationships or circumstances that are likely to affect, or could appear to affect, the Director’s judgement. Under the NYSE rules, a director cannot qualify as independent unless the board affirmatively determines that the director has no material relationship with the listed company; in addition, the NYSE rules prescribe a list of circumstances in which a director cannot be independent. The UK Corporate Governance Code requires a company’s board to assess director independence by affirmatively concluding that the director is independent of management and free from any business or other relationship that could materially interfere with the exercise of independent judgement. Lastly, a chief executive officer of a US company listed on the NYSE must annually certify that he or she is not aware of any violation by the company of NYSE corporate governance standards. In accordance with NYSE listing rules applicable to foreign private issuers, HSBC Holdings’ Group Chief Executive is not required to provide the NYSE with this annual compliance certification. However, in accordance with rules applicable to both US companies and foreign private issuers, the Group Chief Executive is required promptly to notify the NYSE in writing after any executive officer becomes aware of any material non-compliance with the NYSE corporate governance standards applicable to HSBC Holdings.
HSBC Holdings is required to submit annual and interim written affirmations of compliance with applicable NYSE corporate governance standards, similar to the affirmations required of NYSE-listed US companies.
| | |
| Glossary of accounting terms and US equivalents |
| | | | | |
| Accounting term | US equivalent or brief description |
| Accounts | Financial Statements |
| Articles of Association | Articles of incorporation |
| Called up share capital | Shares issued and fully paid |
| Creditors | Payables |
| Debtors | Receivables |
| Deferred tax | Deferred income tax |
| Finance lease | Capital lease |
| Freehold | Ownership with absolute rights in perpetuity |
Interests in associates and joint
ventures | Interests in entities over which we have significant influence or joint control, which are accounted for using the equity method |
| Loans and advances | Loans |
| Loan capital | Long-term debt |
| Nominal value | Par value |
| One-off | Non-recurring |
| Ordinary shares | Common stock |
| Overdraft | A line of credit, contractually repayable on demand unless a fixed-term has been agreed, established through a customer’s current account |
| Preference shares | Preferred stock |
| Premises | Property |
| Provisions | Liabilities of uncertain timing or amount |
| Share premium account | Additional paid-in capital |
| Shares in issue | Shares outstanding |
| Write-offs | Charge-offs |
| | | | | | | | |
| Reconciliations | | |
| Form 20-F Item Number and Caption | Location | Page |
| PART1 | | |
| 1. Identity of Directors, Senior Management and Advisers | Not required for Annual Report | — |
| 2. Offer statistics and Expected Timetable | Not required for Annual Report | — |
| 3. Key information | | |
| A. [Reserved] | | |
| | |
| | |
| | |
| B. Capitalisation and Indebtedness | Not required for Annual Report | — |
| C. Reasons for the Offer and use of Proceeds | Not required for Annual Report | — |
| D. Risk Factors | Risk Review | 155-166 |
| 4. Information on the Company | | |
| A. History and Development of the Company | Shareholder information | 427,437 |
| Strategic Report | 2-41 |
| ESG Review | 42-88 |
| Financial Review | 89-143 |
| Risk Review | 144-252 |
| Report of the Directors: Corporate Governance Report | 253-332 |
| B. Business review | Strategic Report | 2-41 |
| Financial Review | 89-143 |
| Note 10 on the Financial Statements - Segmental analysis | 369-371 |
| C. Organisational Structure | Strategic Report | 2-41 |
| Report of the Directors: Corporate Governance Report - Principal subsidiaries | 267 |
| Note 19 on the Financial Statements - Investments in subsidiaries | 390 |
| Note 38 on the Financial Statements - HSBC Holdings’ subsidiaries, joint ventures and associates | 416 |
| D. Property, Plants and Equipment | Not Applicable | — |
| 4 A..Unresolved Staff Comments | Not Applicable | — |
| 5. Operating and Financial Review and Prospects | | |
| A. Operating Results | Strategic Report | 2-41 |
| Financial Review | 89-143 |
| Risk Review | 144-252 |
| Note 15 on the Financial Statements - Derivatives | 380-384 |
| B. Liquidity and Capital Resources | Financial Review - Loan maturity and interest sensitivity analysis | 107 |
| Risk Review - Capital and Liquidity Risk | 225-239 |
| Risk Review - Insurance Manufacturing Operations Risk | 246-252 |
| Note 29 on the Financial Statements - Maturity analysis of assets, liabilities and off-balance sheet commitments | 401-406 |
| Note 32 on the Financial Statements - Contingent liabilities, contractual commitments and guarantees | 409-410 |
| C. Research and Development, Patents and Licences, etc. | Not Applicable | — |
| D. Trend Information | Strategic Report | 2-41 |
| Financial Review | 89-143 |
| Risk Review | 144-252 |
| E. Critical Accounting Estimates | Not Applicable | — |
| 6. Directors, Senior Management and Employees | | |
| A. Directors and Senior Management | Report of the Directors: Corporate Governance Report | 253-332 |
| B. Compensation | Report of the Directors: Corporate Governance Report - Directors’ Remuneration Report | 290-323 |
| Note 5 on the Financial Statements - Employee compensation and benefits | 359-365 |
| Note 35 on the Financial Statements - Related party transactions | 413-415 |
| C. Board Practices | Report of the Directors: Corporate Governance Report | 253-332 |
| Report of the Directors: Corporate Governance Report - Directors’ Remuneration Report | 290-323 |
| D. Employees | Report of the Directors: Corporate Governance Report | 253-332 |
| Strategic Report | 2-41 |
| ESG Review - Employees | 70-78 |
| Note 5 on the Financial Statements - Employee compensation and benefits | 359-365 |
| Note 35 on the Financial Statements - Related party transactions | 413-415 |
| E. Share Ownership | Report of the Directors: Corporate Governance Report | 253-332 |
| Report of the Directors: Corporate Governance Report - Directors’ Remuneration Report | 290-323 |
| Note 5 on the Financial Statements - Employee compensation and benefits | 359-365 |
| Note 31 on the Financial Statements - Called up share capital and other equity instruments | 407-409 |
| | | | | | | | |
| | |
| Form 20-F Item Number and Caption | Location | Page |
| | |
| 7. Major Shareholders and Related Party Transactions | | |
| A. Major Shareholders | Report of the Directors: Corporate Governance Report | 253-332 |
| B. Related Party Transactions | Note 35 on the Financial Statements - Related party transactions | 413-415 |
| C. Interests of Experts and Counsel | Not required for Annual Report | — |
| 8. Financial Information | | |
| A. Consolidated Statements and Other Financial Information | Financial Statements | 336-424 |
| Report of the Independent Registered Public Accounting Firm to the Board of Directors and Shareholders of HSBC Holdings plc | 334-335 |
| Shareholder Information | 425 |
| B. Significant Changes | Note 37 on the Financial Statements - Events after the Balance Sheet date | 416 |
| 9. The Offer and Listing | | |
| A. Offer and Listing Details | Not required for Annual Report | — |
| B. Plan of Dlstribution | Not required for Annual Report | — |
| C. Markets | Shareholder Information | 430 |
| D. Exchange Controls | Not required for Annual Report | — |
| E. Taxation | Not required for Annual Report | — |
| F. Dividends and Paying Agents | Not required for Annual Report | — |
| 10. Additional Information | | |
| A. Share Capital | Not required for Annual Report | — |
| B. Memorandum and Articles of Association | Shareholder Information | 430 |
| C. Material Contracts | Report of the Directors: Corporate Governance Report - Directors’ Remuneration Report | 301 |
| Note 34 on the Financial Statements - Legal proceedings and regulatory matters | 391-395 |
| D. Exchange Controls | Shareholder Information | 429 |
| E. Taxation | Shareholder Information | 428-429 |
| F. Dividends and Paying Agents | Not required for Annual Report | — |
| G. Statements by Experts | Not required for Annual Report | — |
| H. Documents on Display | Shareholder Information | 426-427 |
| I. Subsidiary Information | Not applicable | — |
| 11. Quantitative and Qualitative Disclosures About Market Risk | Risk Review - Market risk | 239-243 |
| Note 15 on the Financial Statements - Derivatives | 380-384 |
| Note 16 on the Financial Statements - Financial investments | 384-385 |
| 12. Description of Securities Other than Equity Securities | | |
| A. Debt Securities | Not required for Annual Report | — |
| B. Warrants and Rights | Not required for Annual Report | — |
| C. Other Securities | Not required for Annual Report | — |
| D. American Depository Shares | Taxation of shares and dividends | 428-429 |
| Shareholder information | 426-427 |
| PART II | | |
| 13. Defaults, Dividends Arrearages and Delinquencies | Not applicable | — |
| 14. Material Modifications to the Rights of Securities Holders and Use of Proceeds | Not applicable | — |
| 15. Controls and Procedures | Report of Independent Registered Public Accounting Firm to the Board of Directors and Shareholders of HSBC Holdings plc | 334-335 |
| Financial Review: Other Information | 134-143 |
| 16A. Audit Committee Financial Expert | Report of the Directors: Corporate Governance | 323-325 |
| 16B. Code of Ethics | Shareholder Information | 430-431 |
| 16C. Principal Accountant Fees and Services | Report of the Directors: Corporate Governance | 276-280 |
| 16D. Exemptions from the Listing Standards for Audit Committees | Not applicable | — |
| 16E. Purchases of Equity Securities by the Issuer and Affiliated Purchasers | Report of the Directors: Corporate Governance | 323-325 |
| 16F. Change in Registrant’s Certifying Accountant | Not applicable | — |
| 16G. Corporate Governance | Shareholder Information | 430-431 |
| PART III | | |
| 17. Financial Statements | Not applicable | — |
| 18. Financial Statements | Financial Statements | 336-424 |
| 19. Exhibits (including Certifications) | | * |
| | |
| | | | | |
| Currencies | |
| £ | British pound sterling |
| CA$ | Canadian dollar |
| € | Euro |
| HK$ | Hong Kong dollar |
| MXN | Mexican peso |
| RMB | Chinese renminbi |
| SGD | Singapore dollar |
| $ | United States dollar |
| A | |
| ABS¹ | Asset-backed security |
| ADR | American Depositary Receipt |
| ADS | American Depositary Share |
| AGM | Annual General Meeting |
| AI | Artificial intelligence |
| AIEA | Average interest-earning assets |
| ALCO | Asset and Liability Management Committee |
| AML | Anti-money laundering |
| AML DPA | Five-year deferred prosecution agreement with the US Department of Justice, entered into in December 2012 |
| ASEAN | Association of Southeast Asian Nations |
| AT1 | Additional tier 1 |
| B | |
| Basel Committee | Basel Committee on Banking Supervision |
| Basel II¹ | 2006 Basel Capital Accord |
| Basel III¹ | Basel Committee’s reforms to strengthen global capital and liquidity rules |
| BGF | Business Growth Fund, an investment firm that provides growth capital for small and mid-sized businesses in the UK and Ireland |
| BoCom | Bank of Communications Co., Limited, one of China’s largest banks |
| BoE | Bank of England |
| Bps¹ | Basis points. One basis point is equal to one-hundredth of a percentage point |
| BVI | British Virgin Islands |
| C | |
| CAPM | Capital asset pricing model |
| CDS¹ | Credit default swap |
| CEA | Commodity Exchange Act (US) |
| CET1¹ | Common equity tier 1 |
| CGUs | Cash-generating units |
| CMB | Commercial Banking, a global business |
| CMC | Capital maintenance charge |
| CODM | Chief Operating Decision Maker |
| COSO | 2013 Committee of the Sponsors of the Treadway Commission (US) |
| CP¹ | Commercial paper |
| |
| CRD IV¹ | Capital Requirements Regulation and Directive |
| CRR¹ | Customer risk rating |
| CRR II¹ | Revised Capital Requirements Regulation and Directive, as implemented |
| CSA | Credit support annex |
| CSM | Contractual service margin |
| CVA¹ | Credit valuation adjustment |
| D | |
| Deferred Shares | Awards of deferred shares define the number of HSBC Holdings ordinary shares to which the employee will become entitled, generally between one and seven years from the date of the award, and normally subject to the individual remaining in employment |
| Dodd-Frank | Dodd-Frank Wall Street Reform and Consumer Protection Act (US) |
| DoJ | US Department of Justice |
| DPD | Days past due |
| DPF | Discretionary participation feature of insurance and investment contracts |
| DVA¹ | Debt valuation adjustment |
| | | | | |
| E | |
| EAD¹ | Exposure at default |
| EBA | European Banking Authority |
| |
| |
| |
| |
| EC | European Commission |
| ECB | European Central Bank |
| |
| ECL | Expected credit losses. In the income statement, ECL is recorded as a change in expected credit losses and other credit impairment charges. In the balance sheet, ECL is recorded as an allowance for financial instruments to which only the impairment requirements in IFRS 9 are applied |
| EEA | European Economic Area |
| Eonia | Euro Overnight Index Average |
| EPC | Energy performance certificate |
| EPS | Earnings per ordinary share |
| ESG | Environmental, social and governance |
| EU | European Union |
| Euribor | Euro interbank offered rate |
| EVE | Economic value of equity |
| F | |
| FAST-Infra | Finance to Accelerate the Sustainable Transition-Infrastructure |
| FCA | Financial Conduct Authority (UK) |
| FFVA | Funding fair value adjustment estimation methodology on derivative contracts |
| FPA | Fixed pay allowance |
| FRB | Federal Reserve Board (US) |
| FRC | Financial Reporting Council |
| FSB | Financial Stability Board |
| FSCS | Financial Services Compensation Scheme |
| FTE | Full-time equivalent staff |
| FTSE | Financial Times Stock Exchange index |
| FVOCI¹ | Fair value through other comprehensive income |
| FVPL¹ | Fair value through profit or loss |
| FX | Foreign exchange |
| FX DPA | Three-year deferred prosecution agreement with the US Department of Justice, entered into in January 2018 |
| G | |
| GAAP | Generally accepted accounting principles |
| GAC | Group Audit Committee |
| GBM | Global Banking and Markets, a global business |
| GDP | Gross domestic product |
| GEC | Group Executive Committee |
| GLCM | Global Liquidity and Cash Management |
| GMP | Guaranteed minimum pension |
| GPSP | Group Performance Share Plan |
| GRC | Group Risk Committee |
| Group | HSBC Holdings together with its subsidiary undertakings |
| GTRF | Global Trade and Receivables Finance |
| H | |
| Hang Seng Bank | Hang Seng Bank Limited, one of Hong Kong’s largest banks |
| HKEx | The Stock Exchange of Hong Kong Limited |
| HKMA | Hong Kong Monetary Authority |
| HMRC | HM Revenue and Customs |
| HNAH | HSBC North America Holdings Inc. |
| Holdings ALCO | HSBC Holdings Asset and Liability Management Committee |
| Hong Kong | Hong Kong Special Administrative Region of the People’s Republic of China |
| |
| HQLA | High-quality liquid assets |
| HSBC | HSBC Holdings together with its subsidiary undertakings |
| HSBC Bank | HSBC Bank plc, also known as the non-ring-fenced bank |
| HSBC Bank Middle East | HSBC Bank Middle East Limited |
| HSBC Bank USA | HSBC Bank USA, N.A., HSBC’s retail bank in the US |
| HSBC Canada | The sub-group, HSBC Bank Canada, HSBC Trust Company Canada, HSBC Mortgage Corporation Canada and HSBC Securities Canada, consolidated for liquidity purposes |
| HSBC Continental Europe | HSBC Continental Europe |
| | | | | |
| HSBC Finance | HSBC Finance Corporation, the US consumer finance company (formerly Household International, Inc.) |
| HSBC Holdings | HSBC Holdings plc, the parent company of HSBC |
| HSBC Private Bank (Suisse) | HSBC Private Bank (Suisse) SA, HSBC’s private bank in Switzerland |
| HSBC UK | HSBC UK Bank plc, also known as the ring-fenced bank |
| HSBC USA | The sub-group, HSBC USA Inc (the holding company of HSBC Bank USA) and HSBC Bank USA, consolidated for liquidity purposes |
| HSI | HSBC Securities (USA) Inc. |
| HSSL | HSBC Securities Services (Luxembourg) |
| HTIE | HSBC International Trust Services (Ireland) Limited |
| I | |
| IAS | International Accounting Standards |
| IASB | International Accounting Standards Board |
| IBA | ICE Benchmark Administration |
| Ibor | Interbank offered rate |
| ICAAP | Internal capital adequacy assessment process |
| IEA | International Energy Agency |
| IFRSs | International Financial Reporting Standards |
| ILAAP | Internal liquidity adequacy assessment process |
| IMA | Internal model approach |
| IMM | Internal model method |
| IRB¹ | Internal ratings-based |
| ISDA | International Swaps and Derivatives Association |
| J | |
| JV | Joint venture |
| K | |
| KMP | Key Management Personnel |
| L | |
| LCR | Liquidity coverage ratio |
| LGBT+ | Lesbian, gay, bisexual and transgender. The plus sign denotes other non-mainstream groups on the spectrums of sexual orientation and gender identity |
| LGD¹ | Loss given default |
| Libor | London interbank offered rate |
| Long term | For our strategic goals, we define long term as five to six years, commencing 1 January 2020 |
| LTI | Long-term incentive |
| LTV¹ | Loan to value |
| M | |
| Mainland China | People’s Republic of China excluding Hong Kong and Macau |
| Medium term | For our strategic goals, we define medium term as three to five years, commencing 1 January 2020 |
| MENA | Middle East and North Africa |
| MREL | Minimum requirement for own funds and eligible liabilities |
| MRT¹ | Material Risk Taker |
| MSS | Markets and Securities Services, HSBC’s capital markets and securities services businesses in Global Banking and Markets |
| N | |
| Net operating income | Net operating income before change in expected credit losses and other credit impairment charges/Loan impairment charges and other credit provisions, also referred to as revenue |
| NGO | Non-governmental organisation |
| NII | Net interest income |
| NIM | Net interest margin |
| NPS | Net promoter score |
| NSFR | Net stable funding ratio |
| NYSE | New York Stock Exchange |
| NZBA | Net-Zero Banking Alliance |
| O | |
| OCI | Other comprehensive income |
| OECD | Organisation of Economic Co-operation and Development |
| OTC¹ | Over-the-counter |
| P | |
| PACTA | Paris Agreement Capital Transition Assessment |
| PBT | Profit before tax |
| PCAF | Partnership for Carbon Accounting Financials |
| PD¹ | Probability of default |
| | | | | |
| Performance shares¹ | Awards of HSBC Holdings ordinary shares under employee share plans that are subject to corporate performance conditions |
| Ping An | Ping An Insurance (Group) Company of China, Ltd, the second-largest life insurer in the PRC |
| |
| |
| POCI | Purchased or originated credit-impaired financial assets |
| PPI | Payment protection insurance |
| PRA | Prudential Regulation Authority (UK) |
| PRC | People’s Republic of China |
| Principal plan | HSBC Bank (UK) Pension Scheme |
| PVIF | Present value of in-force long-term insurance business and long-term investment contracts with DPF |
| PwC | The member firms of the PwC network, including PricewaterhouseCoopers LLP |
| R | |
| RAS | Risk appetite statement |
| Repo¹ | Sale and repurchase transaction |
| Reverse repo | Security purchased under commitments to sell |
| RFR | Risk-free rate |
| RMM | Group Risk Management Meeting |
| RNIV | Risk not in VaR |
| RoE | Return on average ordinary shareholders’ equity |
| RoTE | Return on average tangible equity |
| RWA¹ | Risk-weighted asset |
| S | |
| SABB | The Saudi British Bank |
| SAPS | Self-administered pension scheme |
| SASB | Sustainability Accounting Standards Board |
| SBTi | Science Based Targets initiative |
| SDG | United Nation’s Sustainable Development Goals |
| SEC | Securities and Exchange Commission (US) |
| ServCo group | Separately incorporated group of service companies established in response to UK ring-fencing requirements |
| Sibor | Singapore interbank offered rate |
| SIC | Securities investment conduit |
| SME | Small and medium-sized enterprise |
| SOFR | Secured Overnight Financing Rate |
| Solitaire | Solitaire Funding Limited, a special purpose entity managed by HSBC |
| Sonia | Sterling Overnight Index Average |
| SPE¹ | Special purpose entity |
| |
| T | |
| TCFD¹ | Task Force on Climate-related Financial Disclosures |
| THBFIX | Thai Baht Interest Rate Fixing |
| TNFD | Taskforce on Nature-related Financial Disclosures |
| TSR¹ | Total shareholder return |
| U | |
| UAE | United Arab Emirates |
| UK | United Kingdom |
| UN | United Nations |
| US | United States of America |
| V | |
| VaR¹ | Value at risk |
| VIU | Value in use |
| W | |
| WEF | World Economic Forum |
| WPB | Wealth and Personal Banking, a global business |
1 A full definition is included in the glossary to the Annual Report and Accounts 2021 which is available at www.hsbc.com/investors.
HSBC Holdings plc
Incorporated in England on 1 January 1959 with
limited liability under the UK Companies Act
Registered in England: number 617987
| | |
| Registered Office and Group Head Office |
|
8 Canada Square London E14 5HQ United Kingdom |
|
|
| Telephone: 44 020 7991 8888 |
| Facsimile: 44 020 7992 4880 |
| Web: www.hsbc.com |
| | |
| Registrars |
|
| Principal Register |
| Computershare Investor Services PLC |
| The Pavilions |
| Bridgwater Road |
| Bristol BS99 6ZZ |
| United Kingdom |
| Telephone: 44 0370 702 0137 |
| Email: via website |
| Web: www.investorcentre.co.uk/contactus |
|
| Hong Kong Overseas Branch Register |
| Computershare Hong Kong Investor Services |
| Limited |
| Rooms 1712-1716, 17th floor |
| Hopewell Centre |
| 183 Queen’s Road East |
| Hong Kong |
| Telephone: 852 2862 8555 |
| Email: hsbc.ecom@computershare.com.hk |
| Web: www.investorcentre.com/hk |
|
| Bermuda Overseas Branch Register |
| Investor Relations Team |
| HSBC Bank Bermuda Limited |
| 37 Front Street |
| Hamilton HM11 |
| Bermuda |
| Telephone: 1 441 299 6737 |
| Email: hbbm.shareholder.services@hsbc.bm |
| Web: www.investorcentre.com/bm |
|
| | |
| ADR Depositary |
| The Bank of New York Mellon |
| Shareowner Services |
| PO Box 505000 |
| Louisville, KY 40233-5000 |
| USA |
| Telephone (US): 1 877 283 5786 |
| Telephone (International): 1 201 680 6825 |
| Email: shrrelations@cpushareownerservices.com |
| Web: www.mybnymdr.com |
| | |
| Corporate Brokers |
|
| Morgan Stanley & Co. International plc |
| 25 Cabot Square |
| London E14 4QA |
| United Kingdom |
|
| Bank of America Securities |
| 2 King Edward Street |
| London EC1A 1HQ |
| United Kingdom |
|
| HSBC Bank plc |
| 8 Canada Square |
| London E14 5HQ |
| United Kingdom |
© Copyright HSBC Holdings plc 2022
All rights reserved
No part of this publication may be reproduced, stored in a retrieval system, or transmitted, in any form or by any means, electronic, mechanical, photocopying, recording, or otherwise, without the prior written permission of HSBC Holdings plc
Published by Global Finance, HSBC Holdings plc, London
Designed by Superunion, London (Strategic Report and ESG review) and by Global Finance with Superunion (rest of Annual Report and Accounts)
Item 19. Exhibits
Documents filed as exhibits to this Form 20-F:
Exhibit Number Description
8.1 Subsidiaries of HSBC Holdings plc (set forth in Note 38 to the consolidated financial statements included in this Form 20-F).
SIGNATURES
The registrant hereby certifies that it meets all of the requirements for filing on Form 20-F and that it has duly caused and authorized the undersigned to sign this annual report on its behalf.
| | | | | |
HSBC Holdings plc
|
| By: | /s/ E J Stevenson |
| Name: | E J Stevenson |
| Title: | Group Chief Financial Officer |
Date: 23 February 2022