Table of Contents
As filed with the Securities and Exchange Commission on February 25, 2016.
SECURITIES AND EXCHANGE COMMISSION
WASHINGTON, D.C. 20549
FORM 20-F
| ¨ | REGISTRATION STATEMENT PURSUANT TO SECTION 12(b) OR 12(g) OF THE SECURITIES EXCHANGE ACT OF 1934 |
Or
| þ | ANNUAL REPORT PURSUANT TO SECTION 13 OR 15(d) OF THE SECURITIES EXCHANGE ACT OF 1934 |
For the fiscal year ended December 31, 2015
Or
| ¨ | TRANSITION REPORT PURSUANT TO SECTION 13 OR 15(d) OF THE SECURITIES EXCHANGE ACT OF 1934 |
Or
| ¨ | SHELL COMPANY REPORT PURSUANT TO SECTION 13 OR 15(d) OF THE SECURITIES EXCHANGE ACT OF 1934 |
Date of event requiring this shell company report
For the transition period from N/A to N/A
Commission file number: 001-14930
HSBC Holdings plc
(Exact name of Registrant as specified in its charter)
| N/A | United Kingdom | |
| (Translation of Registrant’s name into English) | (Jurisdiction of incorporation or organisation) |
8 Canada Square
London E14 5HQ
United Kingdom
(Address of principal executive offices)
Russell C Picot
8 Canada Square
London E14 5HQ
United Kingdom
Tel +44 (0) 20 7991 8888
Fax +44 (0) 20 7992 4880
(Name, Telephone, Email and/or Facsimile number and Address of Company Contact Person)
Securities registered or to be registered pursuant to Section 12(b) of the Securities Exchange Act of 1934:
Title of each class | Name of each exchange on which registered | |
| Ordinary Shares, nominal value US$0.50 each. | London Stock Exchange | |
| Hong Kong Stock Exchange | ||
| Euronext Paris | ||
| Bermuda Stock Exchange | ||
| New York Stock Exchange* | ||
American Depository Shares, each representing 5 Ordinary Shares of nominal value US$0.50 each. | New York Stock Exchange | |
6.20% Non-Cumulative Dollar Preference Shares, Series A | New York Stock Exchange* | |
American Depositary Shares evidenced by American Depositary receipts, each representing one- fortieth of a Share of 6.20% Non-Cumulative Dollar Preference Shares, Series A | New York Stock Exchange | |
| 5.10% Senior Unsecured Notes Due 2021 | New York Stock Exchange | |
| 4.00% Senior Unsecured Notes Due 2022 | New York Stock Exchange | |
| 4.875% Senior Unsecured Notes Due 2022 | New York Stock Exchange | |
| 7.625% Subordinated Notes due 2032 | New York Stock Exchange | |
| 7.35% Subordinated Notes due 2032 | New York Stock Exchange | |
| 6.5% Subordinated Notes 2036 | New York Stock Exchange | |
| 6.5% Subordinated Notes 2037 | New York Stock Exchange | |
| 6.8% Subordinated Notes Due 2038 | New York Stock Exchange | |
| 6.100% Senior Unsecured Notes due 2042 | New York Stock Exchange | |
8.125% Perpetual Subordinated Capital Securities Exchangeable at the Issuer’s Option into Non- Cumulative Dollar Preference Shares | New York Stock Exchange | |
8.00% Perpetual Subordinated Capital Securities Exchangeable at the Issuer’s Option into Non- Cumulative Dollar Preference Shares, Series 2 | New York Stock Exchange | |
4.250% Subordinated Notes due 2024 | New York Stock Exchange | |
5.250% Subordinated Notes due 2044 | New York Stock Exchange | |
| 4.250% Subordinated Notes due 2025 | New York Stock Exchange |
Securities registered or to be registered pursuant to Section 12(g) of the Securities Exchange Act of 1934: None
Securities for which there is a reporting obligation pursuant to Section 15(d) of the Securities Exchange Act of 1934: None
Indicate the number of outstanding shares of each of the issuer’s classes of capital or common stock as of the close of the period covered by the annual report:
Ordinary Shares, nominal value US$0.50 each 19,685,096,934
Indicate by check mark if the registrant is a well-known seasoned issuer, as defined in Rule 405 of the Securities Act.
¨ Yesþ No
If this report is an annual or transition report, indicate by check mark if the registrant is not required to file reports pursuant to Section 13 or 15(d) of the Securities Exchange Act of 1934.
¨ Yesþ No.
Indicate by check mark whether the registrant (1) has filed all reports required to be filed by Section 13 or 15(d) of the Securities Exchange Act of 1934 during the preceding 12 months (or for such shorter period that the registrant was required to file such reports), and (2) has been subject to such filing requirements for the past 90 days.
þ Yes¨ No
Indicate by check mark whether the registrant has submitted electronically and posted on its corporate Web site, if any, every Interactive Data File required to be submitted and posted pursuant to Rule 405 of Regulation S-T (§232.405 of this chapter) during the preceding 12 months (or for such shorter period that the registrant was required to submit and post such files).
¨ Yes¨ No
Indicate by check mark whether the registrant is a large accelerated filer, an accelerated filer, or a non-accelerated filer. See definition of “accelerated filer and large accelerated filer” in Rule 12b-2 of the Exchange Act. (Check one):
| Large accelerated filerþ | Accelerated filer¨ | Non-accelerated filer¨ |
Indicate by check mark which basis of accounting the registrant has used to prepare the financial statements included in this filing:
| U.S. GAAP ¨ | International Financial Reporting Standards as issued by the International Accounting Standards Boardþ | Other ¨ |
If “Other” has been checked in response to the previous question indicate by check mark which financial statement item the registrant has elected to follow.
¨ Item 17 ¨ Item 18
If this is an annual report, indicate by check mark whether the registrant is a shell company (as defined in Rule 12b-2 of the Exchange Act).
¨ Yesþ No
| * | Not for trading, but only in connection with the registration of American Depositary Shares. |
Table of Contents

Table of Contents
| ||||
Strategic Report
An overview of how we are structured, what we do and where, our strategic actions, the principal risks we face, and high-level performance information. The section is introduced by both the Group Chairman and Group Chief Executive, and also explains the role of the Board.
ThisStrategic Report was approved by the Board on 22 February 2016. Douglas Flint, Group Chairman | 01a | Cautionary statement regarding forward-looking statements | ||
| 01b | Certain defined terms | |||
| 02 | HSBC at a glance | |||
| 04 | Who we are | |||
| 06 | Group Chairman’s Statement | |||
| 10 | Group Chief Executive’s Review | |||
| 12 | Our strategy | |||
| 14 | Value of the network | |||
| 16 | Delivering our network to customers | |||
| 20 | Progress on selected strategic actions | |||
| 22 | Financial overview | |||
| 28 | Global businesses | |||
| 32 | Regions | |||
| 34 | How we do business | |||
| 39 | Our approach to tax | |||
| 40 | Our conduct | |||
| 42 | Risk overview | |||
| 44
|
| |||
| ||||
Financial Review
Detailed reporting of our financial performance, at Group level as well as within our matrix structure. It also includes our full risk report and reporting on how we manage capital. | 47 | Detailed financial performance | ||
| – 48 Financial summary | ||||
| – 65 Global businesses | ||||
| ||||
| 100b | Regulation and supervision | |||
100j | Disclosures pursuant to Section 13(r) of the Securities Exchange Act | |||
101 | Risk | |||
227 |
| |||
| ||||
Corporate Governance
Details of our Board of Directors and senior management, and our approach to corporate governance and remuneration. | 249 | Corporate Governance Report | ||
| 249 | Biographies of Directors and senior management | |||
| 256 | Board of Directors | |||
| 262 | Board committees | |||
| 275 | Internal control | |||
| 278 | Employees | |||
| 285 | Directors’ Remuneration Report
| |||
| ||||
Financial Statements
Our financial statements and related notes and reports. | 323 | Report of Independent Registered Public Accounting Firm to the Board of Directors and Shareholders of HSBC Holdings plc only | ||
| – 323 31 December 2015 | ||||
– 335 31 December 2014
| ||||
| 336 | Financial Statements | |||
| 347 | Notes on the Financial Statements
| |||
| ||||
Other Information
Important information for our shareholders, including contact information. Like any industry and company, we have our set of abbreviations and terminology. Accordingly, we provide an explanation of the abbreviations used and a glossary of key terms.
| 470 | Shareholder information | ||
| 478g | Glossary of accounting terms and US equivalents | |||
| 479 | Abbreviations | |||
| 483 | Glossary | |||
| 491 |
| |||
HSBC HOLDINGS PLC 1 |
Table of Contents
Strategic Report
Cautionary statement regarding forward-looking statements
This Form 20-F contains certain forward-looking statements with respect to HSBC’s financial condition, results of operations, capital position and business.
Statements that are not historical facts, including statements about HSBC’s beliefs and expectations, are forward-looking statements. Words such as ‘expects’, ‘anticipates’, ‘intends’, ‘plans’, ‘believes’, ‘seeks’, ‘estimates’, ‘potential’ and ‘reasonably possible’, variations of these words and similar expressions are intended to identify forward-looking statements. These statements are based on current plans, estimates and projections, and therefore undue reliance should not be placed on them. Forward-looking statements speak only as of the date they are made. HSBC makes no commitment to revise or update any forward-looking statements to reflect events or circumstances occurring or existing after the date of any forward-looking statements.
Written and/or oral forward-looking statements may also be made in the periodic reports to the US Securities and Exchange Commission, summary financial statements to shareholders, proxy statements, offering circulars and prospectuses, press releases and other written materials, and in oral statements made by HSBC’s Directors, officers or employees to third parties, including financial analysts.
Forward-looking statements involve inherent risks and uncertainties. Readers are cautioned that a number of factors could cause actual results to differ, in some instances materially, from those anticipated or implied in any forward-looking statement. These include, but are not limited to:
| – | changes in general economic conditions in the markets in which we operate, such as continuing or deepening recessions and fluctuations in employment beyond those factored into consensus forecasts; changes in foreign exchange rates and interest rates; volatility in equity markets; lack of liquidity in wholesale funding markets; illiquidity and downward price pressure in national real estate markets; adverse changes in central banks’ policies with respect to the provision of liquidity support to financial markets; heightened market concerns over sovereign creditworthiness in over-indebted countries; adverse changes in the funding status of public or private defined benefit pensions; and consumer perception as to the continuing availability of credit and price competition in the market segments we serve; |
| – | changes in government policy and regulation, including the monetary, interest rate and other policies of central banks and other regulatory authorities; initiatives to change the size, scope of activities and interconnectedness of financial institutions in connection with the implementation of stricter regulation of financial institutions in key markets worldwide; revised capital and liquidity benchmarks which could serve to deleverage bank balance sheets and lower returns available from the current business model and portfolio mix; imposition of levies or taxes designed to change business mix and risk appetite; the practices, pricing or responsibilities of financial institutions serving their consumer markets; expropriation, nationalisation, |
confiscation of assets and changes in legislation relating to foreign ownership; changes in bankruptcy legislation in the principal markets in which we operate and the consequences thereof; general changes in government policy that may significantly influence investor decisions; extraordinary government actions as a result of current market turmoil; other unfavourable political or diplomatic developments producing social instability or legal uncertainty which in turn may affect demand for our products and services; the costs, effects and outcomes of product regulatory reviews, actions or litigation, including any additional compliance requirements; and the effects of competition in the markets where we operate including increased competition from non bank financial services companies, including securities firms; and |
| – | factors specific to HSBC, including discretionary RWA growth and our success in adequately identifying the risks we face, such as the incidence of loan losses or delinquency, and managing those risks (through account management, hedging and other techniques). Effective risk management depends on, among other things, our ability through stress testing and other techniques to prepare for events that cannot be captured by the statistical models it uses; and our success in addressing operational, legal and regulatory, and litigation challenges, notably compliance with the DPA. |
HSBC HOLDINGS PLC
1a
Table of Contents
Certain defined terms
Unless the context requires otherwise, ‘HSBC Holdings’ means HSBC Holdings plc and ‘HSBC’, the ‘Group’, ‘we’, ‘us’ and ‘our’ refer to HSBC Holdings together with its subsidiaries. Within this document the Hong Kong Special
Administrative Region of the People’s Republic of China is referred to as ‘Hong Kong’. When used in the terms ‘shareholders’ equity’ and ‘total shareholders’ equity’, ‘shareholders’ means holders of HSBC Holdings
ordinary shares and those preference shares and capital securities issued by HSBC Holdings classified as equity. The abbreviations ‘$m’ and ‘$bn’ represent millions and billions (thousands of millions) of US dollars, respectively.
HSBC HOLDINGS PLC
1b
Table of Contents
Strategic Report
We are one of the most international banking
and financial services organisations in the world.
Group
Our operating model consists of four global businesses and five geographical regions supported by 11 global functions.
Reported profit before tax
(2014: $18.7bn)
$18.9bn
Reported revenue
(2014: $61.2bn)
$59.8bn
Key highlights
| – | We grew adjusted revenue by 1%, primarily in client-facing GB&M, CMB and Principal RBWM. |
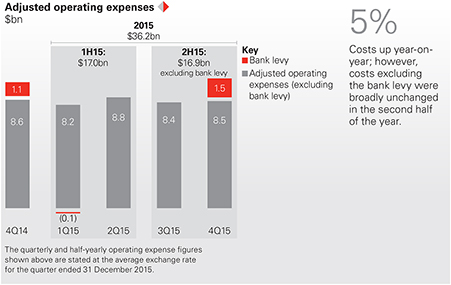
| – | Adjusted operating expenses increased by 5% from 2014. However, costs in the second half of the year were in line with the first half as our cost saving initiatives began to take effect. |
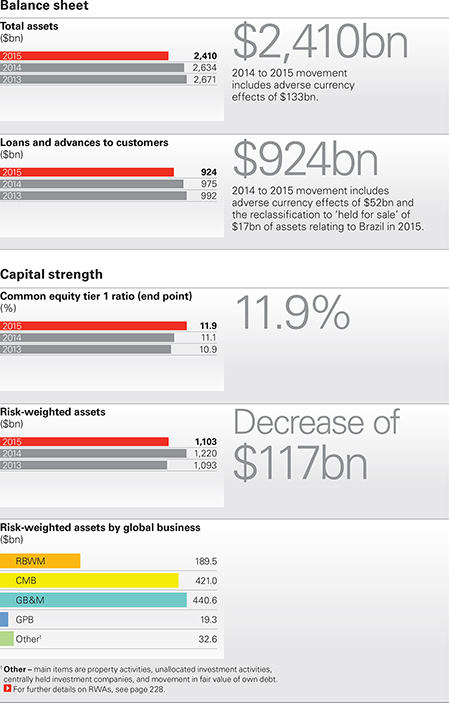
| – | Through management initiatives, we were able to reduce risk-weighted assets (‘RWAs’) by $124bn in 2015 and therefore also the amount of capital we are required to hold. |
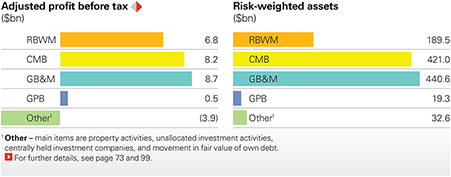
Adjusted profit before tax 
(2014: $22.0bn)
$20.4bn
Risk-weighted assets
(2014: $1,220bn)
$1,103bn
Global businesses
Our global businesses set globally consistent
business strategies and operating models.
They manage the products and business
propositions offered to our customers.
Retail Banking and Wealth Management (‘RBWM’)
|
Commercial Banking (‘CMB’)
|
Global Banking and Markets (‘GB&M’)
|
Global Private Banking (‘GPB’)
| |||
We help millions of people across the world to manage their finances, buy their homes, and save and invest for the future. Our Insurance and Asset Management businesses support all our global businesses in meeting their customers’ needs.
Further details on page 30 | We support more than two million business customers in 55 countries with banking products and services to help them operate and grow. Our customers range from small enterprises focused primarily on their domestic markets, through to large companies operating globally.
Further details on page 28 | We provide financial services and products to companies, governments and institutions. Our comprehensive range of products and solutions, across capital financing, advisory and transaction banking services, can be combined and customised to meet our clients’ specific objectives.
Further details on page 29
| We help high net worth individuals and their families to grow, manage and preserve their wealth.
Further details on page 31 | |||
Reported profit before tax |
|
|
| |||
| $5.0bn | $8.0bn | $7.9bn | $0.3bn |
HSBC HOLDINGS PLC
2
Table of Contents
HSBC at a glance
Key metrics

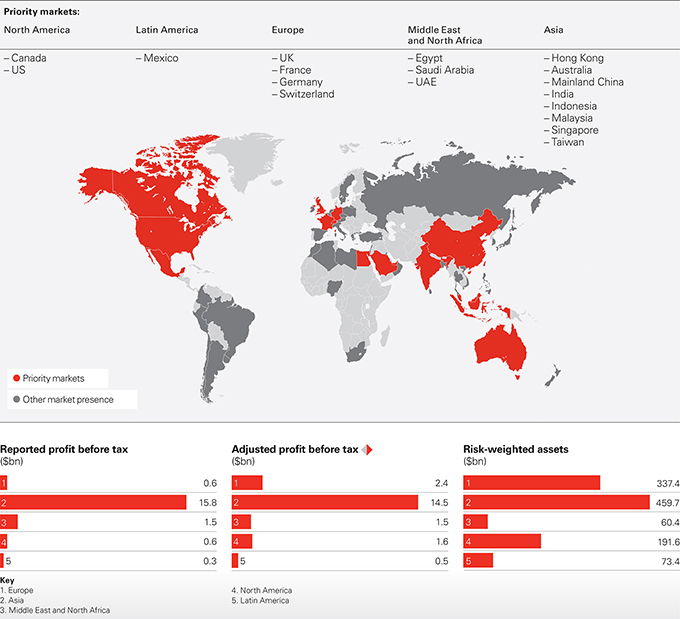
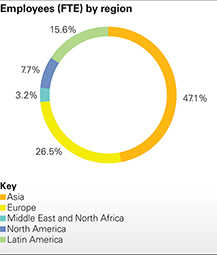
Geographical regions
We operate in 71 countries and territories around the world. Our operating entities represent HSBC to customers, regulators, employees and other stakeholders. |  For further For furtherdetails on our regions, see page 32. | |
Market presence
HSBC HOLDINGS PLC
3
Table of Contents

Table of Contents

Table of Contents
Strategic Report
Statement
We enter 2016 with a clear strategy and with
a plan for its implementation already well
under way. Our diversified business model
and balance sheet strength form the foundation
for our future progress, and position HSBC
well to deal with today’s challenging economic
and financial conditions.
 | 2015 was marked by some seismic shifts in global economic conditions, most notably the continuation of a sharp decline in commodity and oil prices, in part attributable to growing concerns over China’s slowing economic growth. As a consequence, monetary policy remained accommodative throughout the major developed economies and key currency interest rates remained at historically low levels. Fiscal priorities continued to focus on controlling spending, an emphasis replicated in the private sector as weak revenue growth persisted in many industries.
Against this backdrop, the Group’s financial performance in 2015 was broadly satisfactory, with reported profit before tax rising 1% to $18.9bn. On the adjusted basis used to measure management and business performance, profit before tax of $20.4bn was 7% lower than that achieved in 2014, driven by higher costs and credit charges.
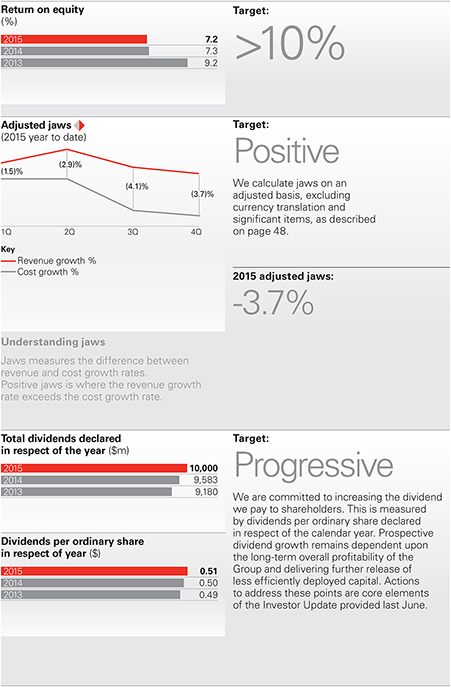
Earnings per share of $0.65 compared with $0.69 in 2014. Sound management of capital, accelerated run-off of legacy books and shrinking the balance sheet in areas that can no longer support the expanded capital requirements now in force, contributed to the common equity tier 1 ratio increasing by 0.8 percentage points to 11.9%. This capital released from managing the asset base, together with that generated from operations, allowed the Board to approve a fourth interim dividend in respect of 2015 of $0.21 per ordinary share. This took dividends per ordinary share in respect of the year to $0.51, $0.01 higher than 2014. Total dividends in respect of 2015 amounted to $10.0bn, $0.4bn higher than in respect of 2014.
In approving the dividend increase, the Board noted that prospective dividend growth remained dependent upon the long-term overall profitability of the Group and delivering further release of less efficiently deployed capital. Actions to address these points are core elements of the Investor Update provided last June. |
HSBC HOLDINGS PLC
6
Table of Contents
Group Chairman’s Statement
Sound progress on strategic initiatives
TheStrategic Report highlights delivery to date against the strategic objectives laid out in last June’s Investor Update.
When assessing management performance during 2015, outside of the financial results, the Board took particular account of the following aspects.
The successful negotiation of a majority stake in a new nationally licensed securities joint-venture in mainland China is the culmination of more than a decade of seeking out an appropriate platform through which to participate in the country’s fast-developing securities markets. Once final approvals have been received, we believe this will establish a landmark opportunity for HSBC to contribute to the development of China’s capital markets.
‘Our three major businesses generated higher revenue, notwithstanding the uncertain economic environment and the considerable reshaping necessitated by regulatory changes’
During 2015, the Group maintained, reinforced and broadened its leadership position in all aspects of the internationalisation of the renminbi. This position has been built over the past five years to establish a highly competitive platform to service China’s international trade and investment flows as it pursues the financial liberalisation and outgoing investment priorities laid out in the recent 13th five-year plan. The recent highly successful State visit to the UK, following an equally successful Economic and Financial dialogue in China, served to illustrate the huge potential for mutually beneficial cooperation between the UK and China from which HSBC is uniquely positioned to benefit in the realm of financial services.
The disposal of our Brazilian operations, which is expected to complete shortly, was both timely and well executed. This divestment was a key element of the Board’s desire to simplify the Group and redeploy capital to geographic areas where we have greater competitive strength, most particularly in Asia.
Our three major businesses generated higher revenue, notwithstanding the uncertain economic
environment and the considerable reshaping necessitated by regulatory changes. Global Banking and Markets and Retail Banking and Wealth Management, in particular, have made significant changes to their business models and are now beginning to see the benefits. Commercial Banking continued to leverage the value of the Group’s international network and product capabilities. Global Private Banking, chastened by the exposure of historical failings in Switzerland, accelerated disposal of a number of customer portfolios as it refocused its business model on core customer segments within a fully transparent operating model.
Across all businesses, the Board recognised a heightened emphasis on customer focus, which permeated recruitment, training, product design and incentives. This is essential to the restoration of trust.
Finally, and underpinning the above, we made further progress embedding the standards now expected to protect customers and the financial system from bad actors and financial crime. We are, however, not yet where we need to be. There is still more investment to make with ever greater urgency as more and more activity takes place digitally through multiple channels and via increasingly sophisticated mobile devices. HSBC’s determination to address emerging risks and identify bad actors remains resolute. The Board has made it one of its top priorities to oversee and ensure management’s delivery of the necessary enhancements to customer and transaction screening systems.
The regulatory landscape has
become clearer
The second half of 2015 saw completion of some of the most important and complex initiatives undertaken to repair the fault lines that contributed to the global financial crisis. International agreement was reached on the amount of total loss-absorbing capacity that global systemically important banks, such as HSBC, need for orderly resolution, without risks to public funds. This allowed the Financial Stability Board to report to G20 leaders that they had finalised the tools needed to end ‘too big to fail’ in the banking sector. There is still much to do to build these tools into national legislative and regulatory frameworks; however, this international agreement is an important step forward towards finally settling the capital base against which we can assess our target returns.
HSBC HOLDINGS PLC
7
Table of Contents
Strategic Report |Group Chairman’s Statement
There is now broad agreement that the implementation of the suite of regulatory reforms introduced post-crisis has made the financial system more resilient. Accordingly, public policy priorities are now focusing on harnessing this greater strength and resilience to support economic growth, which we welcome.
Concentration within the current regulatory agenda is increasingly on new and emerging risks and vulnerabilities. There is growing industry participation in dialogue around these emerging threats, most notably regarding cyber risk, the changing liquidity dynamics resulting from more market-based finance and financial exclusion stemming from excessive risk aversion.
Likewise, addressing the root causes of the misconduct issues that have bedevilled our industry in recent years has led to growing cooperation arising out of the multiplicity of joint working groups and enquiries that have examined the most serious failings. 2016 sees the introduction of the new Senior Managers’ Regime in the UK, which will reinforce individual responsibility and accountability, which we welcome.
Also in the UK, 2015 saw further clarity given to the operation of the ‘ring-fenced’ bank structure and a welcome announcement of a reduction in the scope and rate of the bank levy going forward.
It is too early to say whether this amounts to a new understanding between the industry and the public, but it is encouraging that the industry is once again gaining a voice at a time of great economic and geopolitical uncertainty. We can only fulfil our essential role if we have regained trust, a fact that is now fully understood.
Review of headquarters’ location
As we announced last week, the Board concluded its review of domicile alternatives and decided unanimously to remain headquartered in the UK. As we evaluated jurisdictions against the specified criteria, it became clear that the combination of our strategic focus on Asia and maintaining our hub in one of the world’s leading international financial centres, London, was not only compatible, but offered the best outcome for our customers and shareholders. This decision was taken after some 10 months of careful analysis and assessment of geopolitical, economic, regulatory and financial factors. Advice was taken from internationally respected experts and from leading financial advisers. After considering all the relevant factors, the Board concluded that having our headquarters in the UK and our significant business in Asia Pacific led from Hong Kong, delivers the best of both worlds to our stakeholders. The completion of this review closes out one of the 10 strategic actions set out at our Investor Update last June. | Board changes
Subsequent to the changes announced with our interim results, we have made further changes to the Board. Safra Catz stepped down from the Board at the end of 2015 and Sir Simon Robertson, our Deputy Chairman, and Rona Fairhead will retire at the forthcoming Annual General Meeting.
| |||||
‘There is now broad agreement that the implementation of the suite of regulatory reforms introduced post-crisis has made the financial system more resilient’
| ||||||
Safra served on the Board for nearly eight years while Simon and Rona are HSBC’s longest serving non-executive Directors, having served for close to 10 and 12 years, respectively. Over their respective periods of service, they have made invaluable contributions to the Group, not least during the global financial crisis, for which the Board is extremely grateful. Their combined expertise and experience in matters of governance, audit and risk, remuneration, technology, and international business affairs has been invaluable to HSBC and they will, upon their retirement, be sorely missed. On behalf of shareholders and the Board, I want to take this further opportunity to recognise their immense contributions to HSBC.
The Board was delighted to announce the appointments of Paul Walsh and Henri de Castries as independent non-executive Directors. Paul joined the Board on 1 January 2016 and Henri’s appointment takes effect from 1 March 2016.
Paul Walsh was Group CEO of Diageo plc between 2000 and 2013. Under his leadership, Diageo was refocused from a diversified food, beverage and hotels conglomerate into one of the world’s leading global alcoholic beverage businesses. In building this position, Paul took Diageo from a largely European and US business into emerging markets and to global leadership through the acquisition of many of the world’s leading brands.
Henri de Castries has more than 25 years of international experience in the finance industry. Henri has been Chairman and Chief Executive Officer of AXA, one of the world’s leading global insurance and asset management companies since April 2010 after serving as Chairman of its Management Board from May 2000.
Their international experience and track record in leading the reshaping of growing businesses, including undertaking business portfolio realignments, will be of great value to the Board as we address the opportunities and challenges ahead. | ||||||
HSBC HOLDINGS PLC
8
Table of Contents
Group Chairman’s Statement
Looking back – our 150th anniversary
In 2015, HSBC marked its 150th anniversary by recognising its staff for their essential contributions through the ages, and its customers for their shared commitment and loyalty. As we enter the next period of our history, I want to reiterate these messages of gratitude and underline our recognition that such commitment and loyalty have to be earned.
HSBC has also always recognised its responsibilities to the communities it serves and so in this special year committed $150m of additional funding to community projects around the world over three years.
We also wanted to identify a distinctive cause with global significance to mark our special anniversary.
‘We enter 2016 with a clear strategy and with much of the Group’s required reshaping completed or under way’
We were delighted, therefore, to announce a partnership with Cancer Research UK to support the scientific leaders of tomorrow through a $25m contribution towards the development and construction of the Francis Crick Institute. This state-of-the-art biomedical research facility will open in the heart of London in 2016 and support more than 1,200 scientists, collaborating to tackle the diseases that pose the greatest threat to humanity – cancer, heart disease, lung disease and infectious diseases, including HIV and malaria.
To mark HSBC’s support, 150 PhD students, selected from across the world, will have the opportunity to conduct vital research at the new institute.
Looking ahead
Current market conditions are inevitably concentrating attention on the risks that exist within the global economy. It is, however, important also to recognise again the resilience that our diversified business model and balance sheet strength provide, as well as noting the many counterbalances that should help to underpin the global economy.
China’s slower economic growth will undoubtedly contribute to a bumpier financial environment, but it is still expected to be the largest contributor to global growth as its economy transitions to higher added value manufacturing and services and becomes more consumer driven. This transition is driving our focus on the Pearl River Delta as a priority growth opportunity given its concentration of high tech, research focused and digital businesses.
There is a real possibility of meaningful stimulus for the global economy to come from further trade liberalisation initiatives such as the Trans-Pacific Partnership agreement, which was signed earlier this month.
The global focus on infrastructure development, most notably the Belt and Road initiative in China and the Juncker plan in Europe will expand public/ private financing opportunities.
Similarly, the agreements reached on climate change at the recent COP21 conference in Paris will require further significant infrastructure renewal. They will also greatly expand the market for sustainable financing options such as green bonds where HSBC is a leading participant. Reinforcing this position, the Group recently committed $1bn to a green bond portfolio to fund projects in sectors such as renewable energy, energy efficiency, clean transportation and climate change adaption as well as SME financing in sectors such as public transport, education and healthcare.
Technology advancements in financial services are broadening access, improving customer service and lowering the costs of service delivery. At the same time, the amount of data held digitally is exploding, reinforcing the need to bolster cyber security. There is an urgent public policy need to clarify how responsibility is to be shared, given the growing number of routes through which customers can authorise movement of money from their accounts or the sharing of data within these accounts.
We enter 2016 with a clear strategy and with much of the Group’s required reshaping completed or under way. Our 264,000 staff, like their predecessors, went the extra mile consistently throughout 2015 to meet the demands placed on them by our customers, regulators and the public. I want to place on the record the Board’s appreciation of that commitment and our gratitude for what they have achieved to make HSBC fit for the next 150 years.

Douglas Flint
Group Chairman
22 February 2016
HSBC HOLDINGS PLC
9
Table of Contents
Strategic Report
Group Chief Executive’s Review
HSBC is better balanced, better connected and better placed to capitalise on higher return businesses than it was 12 months ago.

Business performance
Our performance in 2015 again demonstrated the fundamental strength of our business. Targeted investment, prudent lending and our diversified, universal banking business model helped us achieve revenue growth in a difficult market environment whilst also reducing risk-weighted assets.
We also started to implement the actions that we announced at our Investor Update in June to adapt HSBC to new operating conditions. Completing these plans will refocus the business to achieve stronger, sustainable growth and we are acting on them quickly and efficiently.
On an adjusted basis, we grew revenue over the course of the year. Global Banking and Markets performed strongly and Commercial Banking grew steadily in spite of slower trade. Principal Retail Banking and Wealth Management also grew following a strong Wealth Management performance in the first half. Global Private Banking grew in Asia, but was down overall due to the impact of the continued repositioning of the business.
Our adjusted operating expenses increased as we continued to strengthen our compliance capability whilst also investing for growth. However, a combination of strict cost management and the cost reduction programmes that we started in the middle of the year helped us keep second half costs flat relative to the first half, excluding the bank levy.
Loan impairment charges remained generally low despite an increase in provisions towards the end of the year. This demonstrates again our prudent approach to lending and the benefit of our de-risking measures since 2011.
In total, we generated $11.3bn of capital in 2015, which enabled us to increase the dividend and strengthen the common equity tier 1 ratio.
HSBC HOLDINGS PLC
10
Table of Contents
Group Chief Executive’s Review
Adapting HSBC
The plans that we announced at our Investor Update are designed to grow income, reduce costs and thereby increase our return on equity. There is a lot to do to achieve our targets but we have made a good start.
Reducing our risk-weighted assets (‘RWAs’) is vital to achieving a better return for shareholders. In 2015, management action reduced RWAs by $124bn, which takes us nearly half-way towards our target to be achieved by the end of 2017. Much of this reduction came from Global Banking and Markets, although a large proportion also came from Commercial Banking, accelerated asset sales in our US Consumer and Mortgage Lending portfolio and the sale of our investment in Industrial Bank. We expect to deliver further RWA reductions in 2016, in addition to a decrease of around $33bn from the sale of our business in Brazil.
‘The plans that we announced at our Investor Update are designed to grow income, reduce costs and increase our return on equity. There is a lot to do to achieve our targets but we have made a good start’
We have received a number of offers for our business in Turkey since June, none of which were deemed to be in the best interests of shareholders. We have therefore decided to retain and restructure our Turkish operations, maintaining our wholesale banking business and refocusing our retail banking network. This will provide better value for shareholders and continue to allow our clients to capitalise on HSBC’s international footprint.
Our cost-reduction measures are already having an impact on our cost base and HSBC is now a leaner business than at the half-year. All of our initiatives to reduce costs are under way and we expect further progress in 2016.
We continued to redevelop our businesses in the US and Mexico over the course of 2015. These are important businesses in the context of the wider Group and we are committed to turning them around. An increase in cross-border business across the NAFTA area and improved collaboration between global businesses helped to generate increased revenue. They remain works in progress.
We are investing in areas of the business that extract the greatest gain from our international network and market-leading strength in Asia.
Investment in flagship transaction banking products helped to increase our market share, particularly in Payments and Cash Management, Foreign Exchange and Securities Services.
The development of our Asia businesses is gaining momentum and we achieved growth in excess of GDP in seven out of eight of our priority Asia markets.
We continue to expand our business in the Pearl River Delta and reached a number of milestones in 2015, including the signing of an agreement to form the first majority foreign-owned securities company in mainland China. When approved, this will allow us to engage in the full spectrum of securities business in the country.
We remain the world’s number one bank for offshore renminbi services and increased revenue by 3% year-on-year in this vitally important growth market.
Summary and outlook
HSBC is better balanced, better connected and better placed to capitalise on higher return businesses than it was 12 months ago. Our universal banking model is generating higher income from collaboration between businesses and our operating expenses and capital ratio are trending in the right direction. Maintaining these trends while boosting revenue will be the principal challenge in the year ahead.
The current economic environment is uncertain, but our diversified banking model, low earnings volatility and strong capital generation give us strength and resilience that will stand us in good stead.
We remain focused on delivering our nine remaining strategic actions by the end of 2017.

Stuart Gulliver
Group Chief Executive
22 February 2016
HSBC HOLDINGS PLC
11
Table of Contents
Table of Contents
Table of Contents
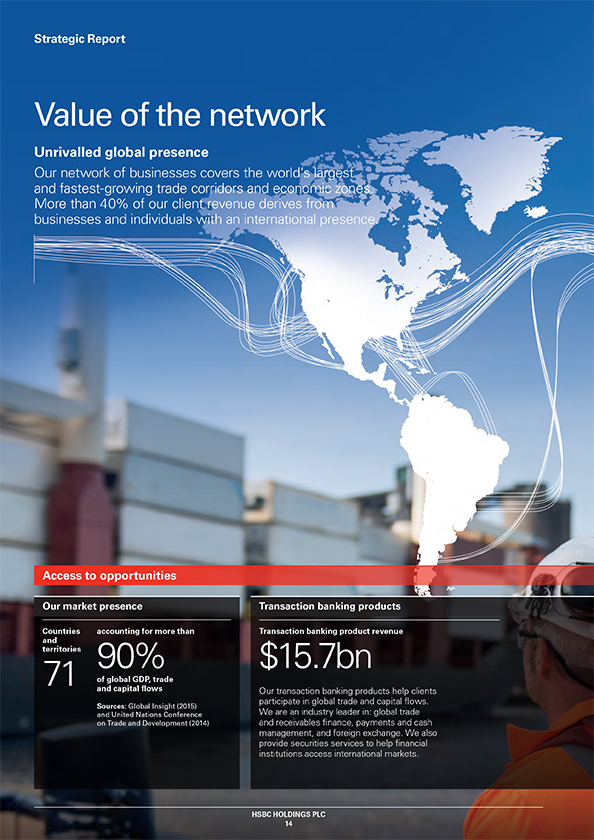
Table of Contents

Table of Contents
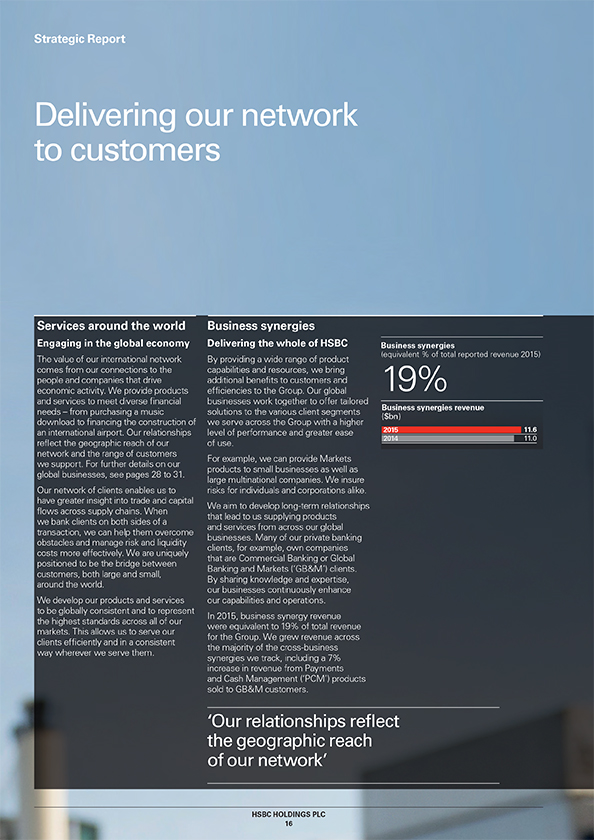
Table of Contents

Table of Contents
Strategic Report
This page is intentionally left blank
HSBC HOLDINGS PLC
18
Table of Contents
This page is intentionally left blank
HSBC HOLDINGS PLC
19
Table of Contents
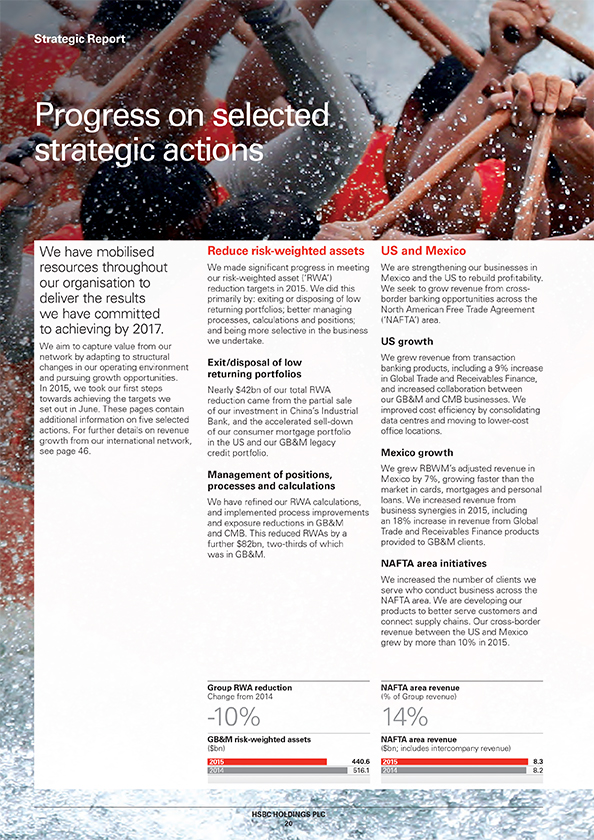
Table of Contents

Table of Contents
Strategic Report
Reported results
This table shows our reported results for | Reported results | 2015 | 2014 | 2013 | ||||||||||
| $m | $m | $m | ||||||||||||
| Net interest income | 32,531 | 34,705 | 35,539 | |||||||||||
| Net fee income | 14,705 | 15,957 | 16,434 | |||||||||||
| Net trading income | 8,723 | 6,760 | 8,690 | |||||||||||
| Other income | 3,841 | 3,826 | 3,982 | |||||||||||
| Net operating income before loan impairment charges and other credit risk provisions (revenue) | 59,800 | 61,248 | 64,645 | |||||||||||
Loan impairment charges and other credit risk provisions (‘LICs’) | (3,721 | ) | (3,851 | ) | (5,849 | ) | ||||||||
| Net operating income | 56,079 | 57,397 | 58,796 | |||||||||||
Total operating expenses | (39,768 | ) | (41,249 | ) | (38,556 | ) | ||||||||
| Operating profit | 16,311 | 16,148 | 20,240 | |||||||||||
Share of profit in associates and joint ventures | 2,556 | 2,532 | 2,325 | |||||||||||
| Profit before tax | 18,867 | 18,680 | 22,565 | |||||||||||
Reported profit before tax
Reported profit before tax was $18.9bn, up by $0.2bn or 1% from 2014. This was driven by a favourable movement in significant items of $2.6bn partly offset by $0.9bn of adverse effects of foreign currency translation between the years. The favourable movement in significant items included lower fines, settlements, UK customer redress and associated provisions (down by $1.3bn in total) and a gain on the partial disposal of Industrial Bank ($1.4bn).
Excluding the effects of significant items and currency translation, profit before tax was down by 7% from 2014. We describe the drivers of our performance under ‘Adjusted performance’ on page 23.
Reported revenue
Revenue of $59.8bn was $1.4bn or 2% lower than in 2014. Revenue benefited from a favourable movement in significant items but this was more than offset by the adverse effect of currency translation of $4.8bn between the years.
Significant items affecting revenue in 2015 included:
| – | a $1.4bn gain on the partial sale of our shareholding in Industrial Bank; |
| – | lower provisions and charges relating to the ongoing review of compliance with the Consumer Credit Act in the UK ($0.6bn lower than in 2014); and |
| – | an increase in favourable movements on our own debt designated at fair value from changes in credit spreads of $0.6bn. |
Reported LICs
Loan impairment charges and other credit risk provisions (‘LICs’) of $3.7bn were $0.1bn or 3% lower than in 2014, reflecting the favourable impact of currency translation between the years.
Reported operating expenses
Operating expenses of $39.8bn were $1.5bn or 4% lower than in 2014. This reduction primarily reflected the favourable effect of currency translation of $3.3bn between the years.
The total of significant items was broadly in line with 2014, although there were notable movements as follows:
| – | lower provisions and charges relating to UK customer redress ($0.7bn lower than in 2014); and |
| – | the non-recurrence of a charge of $0.6bn in 2014 relating to a settlement with the US Federal Housing Finance Agency; broadly offset by |
| – | settlements and provisions in connection with legal matters ($0.5bn higher than in 2014); and |
| – | costs-to-achieve relating to business transformation of $0.9bn in 2015 (for further details, see page 58). |
Reported income from associates
Income from associates of $2.6bn was in line with 2014.
HSBC HOLDINGS PLC
22
Table of Contents
Financial overview
Adjusted performance
Our reported results are prepared in accordance with IFRSs as detailed in the Financial Statements on page 347. We also present adjusted performance measures as we believe these help explain our performance and these are highlighted with the following symbol:
To arrive at adjusted performance, we adjust for:
| – | the year-on-year effects of foreign currency translation; and |
| – | the effect of significant items that distort year-on-year comparisons and are excluded in order to understand better the underlying trends in the business. |
For reconciliations of our reported results to an adjusted basis, including lists of significant items, see pages 66–67 and 77–78.
Adjusted results
This table shows our adjusted results for 2015. | Adjusted results | 2015 | 2014 | |||||||
| $m | $m | |||||||||
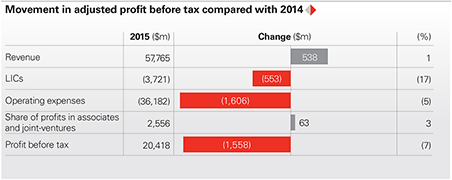
| Net operating income before loan income charges and other credit risk provisions (revenue) | 57,765 | 57,227 | ||||||||
| Loan impairment charges and other credit risk provisions (‘LICs’) | (3,721 | ) | (3,168 | ) | ||||||
| Total operating expenses | (36,182 | ) | (34,576 | ) | ||||||
| Operating profit | 17,862 | 19,483 | ||||||||
| Share of profit in associates and joint ventures | 2,556 | 2,493 | ||||||||
| Profit before tax | 20,418 | 21,976 | ||||||||
Adjusted profit before tax
| – | Our adjusted profit before tax fell by $1.6bn or 7%. |
| – | We grew adjusted revenue by $0.5bn or 1%, notably in GB&M (up by $1.2bn or 7%), CMB (up by $0.4bn or 3%) and Principal RBWM, which is our RBWM business excluding the US run-off |
| portfolio (up by $0.4bn or 2%). These increases were partly offset in GPB (down by $0.1bn or 6%) and Other (down by $0.3bn). |
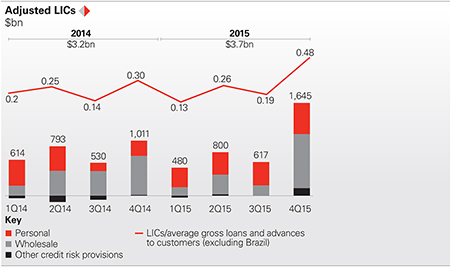
| – | Our LICs were $0.6bn or 17% higher than in 2014, primarily due to increases in CMB ($0.5bn) and RBWM ($0.3bn), partly offset by a reduction in GB&M ($0.3bn). |
| – | Our adjusted operating expenses increased by $1.6bn or 5%. Excluding the bank levy, operating expenses in the second half of 2015 were broadly in line with the first half of the year. This was despite investment and inflationary pressures, and partly reflects the initial effect of our cost saving initiatives as well as a strong focus on cost management. |
HSBC HOLDINGS PLC
23
Table of Contents
Strategic Report | Financial overview
| Adjusted performance (continued) | ||||
Adjusted revenue
Adjusted revenue rose by 1% in part due to growth in GB&M, CMB and Principal RBWM reflecting the following:
– GB&M: Revenue of $18.0bn was $1.2bn or 7% higher than in 2014. This was driven by higher revenue in all client-facing businesses except Principal Investments. In Equities, revenue increased by $0.5bn, reflecting higher client flows and increased market volatility. Revenue from transaction banking products rose $0.4bn as volatility drove higher client flows in Foreign Exchange, as assets under custody in Asia rose in Securities Services, and as deposits rose in Payments and Cash Management (‘PCM’). Revenue was also higher in Balance Sheet Management (‘BSM’), rising $0.1bn. | 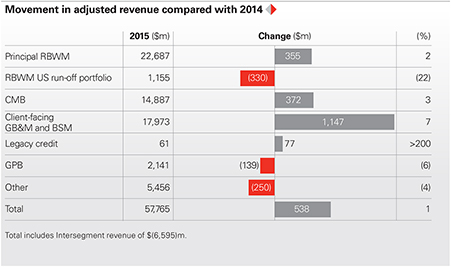 | |||
– CMB: We grew revenue by $0.4bn or 3%, in particular in Credit and Lending (up by $0.4bn) and PCM (up by $0.1bn). This growth was mainly in Hong Kong and the UK, reflecting average balance sheet growth. In Hong Kong, lending balance growth was primarily in 2014 and the first half of 2015. Balances were broadly unchanged for the remainder of 2015 reflecting subdued demand for credit. In Global Trade and Receivables Finance, performance was resilient (revenue down $44m or 2%) despite a significant decline in commodity prices (approximately 40%) and stagnant world trade.
– RBWM: Our revenue was broadly unchanged from 2014. We continued to reduce the size of the balances in our US Consumer and Mortgage Lending (‘CML’) run-off portfolio, resulting in a fall in revenue of $0.3bn. However, in our Principal RBWM | business, revenue was higher (up by $0.4bn or 2%). This was driven by increased Wealth Management revenue in Asia (up by $0.2bn) in the first half of 2015, from growth in investment distribution, which more than offset weaker investor sentiment in the second half of 2015. There was also growth in Europe (up by $0.3bn), notably from insurance manufacturing. We also increased our current account, savings and deposit revenue by $0.1bn, notably in Hong Kong and the UK, from an increase in customer deposit balances of $32bn. This was partly offset by a decrease in Personal Lending revenue of $0.3bn, primarily from lower overdraft fees in the UK after the introduction of a text message alert service in late 2014. | – GPB: Our revenue fell by $0.1bn or 6% reflecting lower brokerage and account services fee income from a managed reduction in client assets. However, revenue increased in Asia, notably in the first half of 2015, due to higher client activity as a result of stock market performance.
– Other: Revenue was $0.3bn or 4% lower, reflecting adverse hedging ineffectiveness movements compared with favourable movements in 2014 (a net adverse movement of $0.2bn), together with the non-recurrence of a gain on the external hedging of an intra-Group financing transaction of $0.2bn. In addition, dividend income was $0.1bn lower following the partial sale of our shareholding in Industrial Bank. | ||
HSBC HOLDINGS PLC
24
Table of Contents
Financial overview
| Adjusted performance (continued) | ||||
Adjusted LICs
– Our LICs were $0.6bn or 17% higher than in 2014, mainly in CMB ($0.5bn). This included a fourth quarter increase in specific LICs in a small number of countries, largely reflecting local factors, as well as LICs related to oil and gas.
– LICs increased in RBWM by $0.3bn, mainly in Brazil as delinquency rates increased; while in the UAE, impairments on mortgages rose, following a review of the quality and value of collateral.
– In GB&M, there was a reduction of $0.3bn in specific impairments as 2014 included a small number of significant charges, notably in Brazil and Hong Kong.
Adjusted operating expenses
– Our adjusted operating expenses in 2015 were up $1.6bn or 5% on 2014.
– Run-the-bank costs rose by $0.8bn or 2%. This was mainly due to wage inflation in Latin America and Asia. We also recruited additional staff across the Group to support business growth.
– Change-the-bank costs rose by $0.5bn or 16% on 2014. This reflected investment in regulatory programmes and compliance, including infrastructure and systems.
– The bank levy of $1.4bn was $0.4bn or 34% higher than in 2014. Excluding the bank levy, adjusted operating expenses in the second half of 2015 were broadly in line with the first half of the year. This was despite investment and inflation, and reflected the initial effect of our cost-saving initiatives and a strong focus on cost management. This included a reduction in full-time equivalent staff in the second half of the year of 4,585 and lower travel costs. |
| |||
|
Adjusted income from associates
– Our share of profit from associates and joint-ventures was broadly unchanged in 2015. The majority of this profit was from our investments in Bank of Communications Co. (‘BoCom’) and The Saudi British Bank. | |||

HSBC HOLDINGS PLC
25
Table of Contents
Strategic Report | Financial overview
Balance sheet and capital strength
 | Balance sheet strength
Total reported assets were $2.4 trillion, 8.5% lower than at 31 December 2014. On a constant currency basis, total assets were $91bn or 4% lower. This reduction in part reflects the efficient use of our balance sheet to maximise shareholder returns.
We are focused on reducing our use of the balance sheet in areas that are capital intensive relative to returns. This provides capacity for growth in higher returning business areas and regions. For example, in GB&M, we have reduced trading assets by decreasing holdings of debt securities in our Rates business in Europe and North America.
Capital strength
We manage our capital in an effort to ensure we exceed current regulatory requirements and are well placed to meet those expected in the future.
We monitor our position by using capital ratios. These measure capital relative to a regulatory assessment of risks taken. We quantify how these risks relate to our businesses using risk-weighted assets. Details of these risks are included on page 227.
Our common equity tier 1 (‘CET1’) ratio at 31 December 2015 was 11.9%, up from 11.1% at 31 December 2014.
Distributable reserves
The distributable reserves of HSBC Holdings plc at 31 December 2015 were $47bn, and at 31 December 2014 were $49bn. |
HSBC HOLDINGS PLC
26
Table of Contents
Financial overview
|
Delivering on our Group financial targets
| Return on equity
Our medium-term target is to achieve a return on equity (‘RoE’) of more than 10%. This target is modelled on a CET1 ratio in the range of 12% to 13%.
In 2015, we achieved an RoE of 7.2% compared with 7.3% in 2014. The bank levy and significant items, such as fines, penalties, customer redress and associated provisions, had a significant effect on our 2015 RoE, reducing the return achieved by 190 basis points.
Adjusted jaws
Our target is to grow revenue faster than operating expenses on an adjusted basis. This is referred to as positive jaws. In 2015, we grew adjusted revenue by 0.9% whilst our adjusted operating expenses rose by 4.6%.
Jaws was therefore negative 3.7%. Jaws for 2015 was affected by the revenue performance in the second half of the year. Adjusted revenue growth in the first half of 2015 was 4.5% but fell in the second half of 2015, reflecting the economic environment, including slowing GDP growth in China. This resulted in overall revenue growth of 0.9% for 2015.
The increase in adjusted operating expenses in 2015 included a $0.4bn rise in the bank levy (to $1.4bn). Excluding this increase, jaws in 2015 would have been negative 2.8%. During the second half of 2015, we made progress on our cost saving plans set out at our Investor Update. We reduced the growth rate in adjusted operating expenses, down from 7.3% in the first half of 2015 to 4.7% for the year.
Progressive dividend
In 2015, we increased the dividends per ordinary share in respect of the year to $0.51 from $0.50 in 2014. |
HSBC HOLDINGS PLC
27
Table of Contents
Strategic Report
We manage our products and services
globally through four global businesses.
For further details on the financial performance
of our global businesses, see pages 68 to 73.
Commercial Banking (‘CMB’)
Customers
CMB serves more than two million customers in 55 countries and territories. Our customers range from small enterprises focused primarily on their domestic markets through to corporates operating globally.
We have been simplifying our product range and services to meet clients’ needs better. Since 2013, we have reduced the number of products we offer around the world from 975 to fewer than 410. We have also completed role-specific conduct training for more than 20,000 employees to help ensure that products are sold appropriately.
Products and services
We support our customers with tailored financial products and services to allow them to operate efficiently and to grow. This includes providing them with working capital, term loans, payment services and international trade facilitation, among other services. We offer expertise in mergers and acquisitions, and provide access to financial markets. | In 2015, the quality of our service was recognised by several leading awards. For the fourth consecutive year, we were recognised as the Best Global Cash Manager (for Non-Financial Institutions) in theEuromoney Cash Management survey. We were also recognised as the Best Overall Global Trade Finance Bank, among other awards, in theTrade Finance Awards for Excellence.
Business synergies
CMB is at the centre of business synergies within the Group, enabling nearly $6bn of business synergy revenue in 2015. For example, it provides trade finance, working capital and liquidity management solutions to GB&M clients. It also provides Capital Finance expertise, and Insurance and Asset Management capabilities from across the Group to benefit customers.
Areas of focus
We are focused on creating value from our network, which covers 90% of global trade and capital flows. We are therefore investing in digital and technology aspects of our core Payments and Cash Management (‘PCM’), and Global Trade and Receivables Finance propositions, as well as in the Pearl River Delta, ASEAN and NAFTA growth areas.
We achieved significant risk-weighted asset efficiencies through management initiatives in 2015 and continue to ensure our capital is deployed effectively. | Continued revenue growth in Hong Kong and the UK
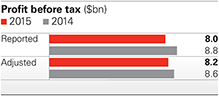
– Adjusted profit before tax of $8.2bn was $0.4bn or 5% lower than in 2014, as revenue growth was more than offset by a rise in LICs and higher costs.
– We grew revenue by $0.4bn or 3%, in particular in Credit and Lending, and PCM. This was mainly in Hong Kong and the UK, reflecting average balance sheet growth, although demand for credit in Hong Kong was subdued in the second half of 2015, with balances remaining broadly unchanged.
– LICs were $0.5bn or 36% higher, reflecting enhanced credit risk in the oil and gas sector, notably in North America, Asia, and Middle East and North Africa. In addition, we raised LICs against a small number of specific clients in Indonesia, the UAE and the UK.
– Costs increased by $0.4bn or 6%, notably in Asia and the US, due to wage inflation and investment in growth initiatives, regulatory programmes and compliance.
– Management initiatives set out in our Investor Update in June 2015 contributed a reduction in risk-weighted assets (‘RWAs’) of $23.0bn or more than 75% of our 2015–2017 target.
Adjustedprofit before tax -5% | ||

HSBC HOLDINGS PLC
28
Table of Contents
Global businesses

Global Banking and Markets (‘GB&M’)
Customers
GB&M supports major government, corporate and institutional clients worldwide in achieving their long-term strategic goals through tailored and innovative solutions. Our deep sector expertise extends across transaction banking, financing, advisory, capital markets and risk management. We serve nearly 4,000 clients in more than 50 countries and territories, helping them to realise opportunities in the markets that matter to them.
We continue to strengthen the services we provide and our relationships with clients. We regularly assess these relationships, using benchmarking and internal programmes. As a result, in 2015 we improved the on-boarding experience for clients and enabled relationship bankers to spend more time understanding clients’ needs. Customer feedback allows us to identify opportunities to further improve our business and the wider client experience.
Products and services
Our product specialists continue to deliver a comprehensive range of transaction banking, financing, advisory, capital markets and risk management services. In 2015, our product strengths were recognised by numerous | accolades, including Most Innovative Investment Bank and Best Bank for Securities Services inThe Banker awards. We were ranked number one Bank for Corporates (Global Market Share) in theEuromoney FX Survey, and for the third consecutive year we were voted Best Bond House in Asia byFinanceAsia.
In addition, we provide award-winning research to investors with an emphasis on emerging markets.
Business synergies
In 2015, GB&M enabled business synergies of $8.4bn, supporting growth in a number of areas. For example, we provide Markets products to CMB and RBWM customers, Capital Financing products to CMB customers, and also use CMB and Asset Management products to serve GB&M clients.
Areas of focus
Deepening relationships with clients in both event and transaction banking products remains a priority. We will focus on regions where we see the greatest growth opportunities such as NAFTA, ASEAN and the Pearl River Delta. We also plan to grow our business from the internationalisation of China’s renminbi currency and by investing in digital capabilities.
We made significant progress towards reducing RWAs in 2015. This will remain a focus as we continue to exit legacy credit, manage our Markets and Capital Financing businesses and employ a disciplined approach to new client business.
Our continued focus on cost discipline will result in further simplification of the business from streamlining of our business lines, operations and technology. | Adjusted profit growth of 14% compared with 2014
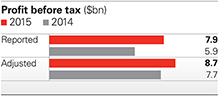
– Adjusted profit before tax was higher by $1.1bn due to higher revenue and lower LICs, partly offset by increased costs.
– Our revenue increased by $1.2bn or 7%, with higher revenue in all businesses except Principal Investments. In client-facing GB&M, revenue rose due to increased client flows and volatility in Equities (up by $0.5bn) and in transaction banking products (up by $0.4bn). Revenue was also higher in Balance Sheet Management (up $0.1bn).
– LICs were $0.3bn lower. This reflected minimal impairments in 2015 compared with a net charge in 2014 in client-facing GB&M. However, in 2015 we had lower net releases of credit risk provisions, primarily on available-for-sale asset-backed securities in legacy credit.
– Our operating expenses increased by $0.4bn or 5%, mainly from higher performance-related costs and higher staff costs reflecting wage inflation. In addition, we continued to invest in our PCM and Foreign Exchange businesses, as well as in regulatory programmes and compliance.
– Management initiatives identified in our Investor Update in June 2015 contributed to an overall reduction in RWAs of $72bn this year. This is 54% of our target of $134bn (stated at December 2015 exchange rates).
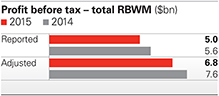
– The graph below shows reported and adjusted profit before tax. The difference between these figures primarily reflects fines, penalties and charges in relation to legal matters, which totalled $1.9bn and $0.9bn in 2014 and 2015, respectively. Significant items are detailed on page 66.
Adjustedprofit before tax +14% | ||

HSBC HOLDINGS PLC
29
Table of Contents
Strategic Report |Global businesses

Retail Banking and Wealth Management (‘RBWM’)
Customers
RBWM serves close to 45 million customers worldwide through four main business areas: Retail Banking, Wealth Management, Asset Management and Insurance.
Since 2012, we have taken numerous actions to improve the way we conduct our business. We have removed the formulaic link between product sales and remuneration, paying all staff on a discretionary basis, which includes assessment of their behaviour and the satisfaction of our customers. We have simplified our product range, reviewed the fairness of our product features and pricing, and enhanced the way we monitor the quality of our sales.
Products and services
RBWM provides services to individuals under the HSBC Premier and Advance propositions aimed at mass affluent and emerging affluent customers who value international connectivity and benefit from our global reach and scale. For customers who have simpler everyday banking needs, RBWM offers a full range of banking products and services reflecting local requirements. | Asset Management and Insurance We operate our own Asset Management and Insurance businesses. By owning these businesses directly, we can tailor their products to the needs of customers and maintain end-to-end control over their quality. We are investing for growth in these businesses, leveraging our network and strong client relationships.
Business synergies
RBWM makes a significant contribution to the overall success of the Group. In 2015, Insurance Manufacturing (within Wealth Management) and Asset Management generated revenue of $1.7bn and $1.1bn, respectively, from the provision of services to clients across all of our global businesses. In addition, the foreign exchange and wealth management needs of our RBWM clients create opportunities for GB&M.
RBWM’s strong deposit franchise supports a stable and diversified core funding base for the Group, and the branch network supports the needs of other global business clients while enhancing the visibility of the HSBC brand.
Areas of focus
RBWM’s focus is on growing the business through relationship-led personal lending and wealth management, while transforming our customer experience and cost base through investment in digital infrastructure. | Despite a challenging second half of 2015, Wealth Management revenue grew by 8%
Total RBWM – Total RBWM adjusted profit before tax fell by $0.7bn or 10%, with a decrease in profit before tax in both Principal RBWM and from the continued reduction in our US run-off portfolio.
The graph below shows reported and adjusted profit before tax. The difference between them primarily reflects fines, penalties and charges in relation to legal matters, which totalled $1.6bn and $1.3bn in 2014 and 2015, respectively. Significant items are detailed on page 66.
Principal RBWM– In our Principal RBWM business, profit before tax was down by $0.5bn or 7%, reflecting higher costs and LICs. Revenue grew.
– Revenue rose $0.4bn in Wealth Management in Asia in the first half of the year from investment distribution, offsetting weaker investor sentiment in the second half of 2015. Wealth Management income in Europe also grew as insurance manufacturing increased. Deposit and savings income grew in Asia and the UK as deposits increased by $32bn. This was partly offset by lower overdraft fees in the UK.
– LICs increased by $0.3bn or 20%, mainly in Brazil from increased impairment charges following the economic slowdown, and the UAE following a review of collateral in the mortgage book.
– Costs rose by $0.5bn or 4%, driven by inflation in Asia and Latin America. Our marketing costs also increased as we relaunched our Global Advance account proposition with notable investment in the UK, and we continued to invest in regulatory programmes and compliance.
Adjustedprofit before tax – total RBWM -10% |

HSBC HOLDINGS PLC
30
Table of Contents
Global businesses

Global Private Banking (‘GPB’)
Customers
GPB serves high net worth individuals and families, including those with international banking needs, through 18 booking centres covering our priority markets.
Since 2011, GPB has taken significant steps to simplify and improve the way it conducts its business. We have reduced the number of booking centres to refocus resources on a smaller number of locations where we have the scale to support our new client service model and enhanced sales quality standards.
We have also reduced the number of offshore markets we cover to ensure appropriate focus is given to key growth areas.
GPB remains committed to implementing the most effective global standards, including customer due diligence, a tax transparency framework and financial crime compliance measures. | Products and services
We work closely with our clients to provide solutions to grow, manage and preserve wealth. Our products and services include: Investment Management, incorporating advisory, discretionary and brokerage services; Private Wealth Solutions, comprising trusts and estate planning, designed to protect wealth and preserve it for future generations; and a full range of Private Banking services.
Business synergies
GPB aims to bring the best of the Group’s research, product and service capabilities to GPB clients.
To achieve this, we have three client service groups: the Corporate Client Group, enhancing connectivity with CMB and GB&M; the Wealth Client Group, delivering a seamless transition across the RBWM and GPB wealth franchises; and the Global Solutions Group, delivering non-traditional wealth management solutions.
Wherever possible, GPB uses product capabilities within GB&M, CMB and RBWM, including asset management, research, insurance, trade finance and capital financing, to offer a unique proposition to our clients.
Areas of focus
GPB aspires to build on HSBC’s commercial banking heritage and be the leading private bank for high net worth business owners and principals. We work closely and systematically with CMB and GB&M to deliver a coordinated private and corporate coverage model for our clients. | Continued repositioning of our GPB business
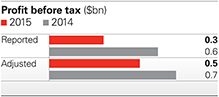
– Adjusted profit before tax fell by 26% to $0.5bn, mainly because revenue fell by 6% as we continued to reposition the GPB business.
– However, revenue increased in Asia, notably in the first half of 2015, due to higher client activity as a result of a strong stock market performance, which more than offset the weaker investor sentiment in the second half of the year.
– We attracted positive net new money of $14bn in 2015 in the parts of the business that fit our target model, mainly in Hong Kong, the UK, Singapore and the US.
Adjustedprofit before tax -26% | ||

HSBC HOLDINGS PLC
31
Table of Contents
Table of Contents

Table of Contents

Table of Contents

Table of Contents
Strategic Report |How we do business
Building lasting business relationships
Ensuring fair outcomes
We recognise that delivering fair outcomes for customers and upholding financial market integrity is critical to a sustainable business model.
We continue to enhance our product governance processes to further ensure products are designed to meet customers’ needs and are sold appropriately. In the UK, for example, we have started to alert customers by text message when they are about to go into overdraft. As a result, customer complaints in this area have declined by 67% and customers have saved more than $129.9m in fees.
For further details on the steps we have taken to strengthen conduct across the Group, see page 40. For further details on compliance risk and for further details on conduct-related costs included in significant items, see pages 178 and 97, respectively.
Increasing quality of service
We seek feedback from customers in order to assess how well we are doing and what we can do better. In 2015, we improved our processes for responding to customer complaints and tools for understanding their causes. For example, in India our analysis of customer complaints led us to improve customer communication regarding minimum balances and change our fee structure. Complaints in this area subsequently reduced by 62%.
Through our commercial banking research programmes, we have spoken to more than 50,000 businesses to gather feedback on our products and services from existing and potential customers. We use competitor benchmarking, brand tracking and customer surveys to evaluate our performance. In RBWM, we conducted more than 350,000 individual customer surveys.
Developing long-term opportunities
Technology and climate change are two areas that present both challenges and opportunities to us and our customers.
Investing in technology
We are investing in innovation and digital capabilities to serve customers better, and enhancing security around financial transactions and customer data.
In 2015, we enabled the Apple Pay mobile payment service for customers in the UK and the US, and launched live-chat online customer service in six markets including the UK, Hong Kong and France. We made digital secure keys available in the UK to simplify the customer login experience. In Argentina and the Philippines, we launched our new online banking platform, which will be deployed in additional countries in 2016.
Facilitating a low-carbon economy
Reducing global carbon dioxide emissions is a critical challenge for society. We see the potential for financial services to facilitate investment that can help the world transition to a low-carbon economy.
In 2015, our Global Research team was ranked number one for Integrated Climate Change for the second year running in the Extel Survey. Furthermore, our Asset Management business joined the Montreal Pledge to disclose the carbon intensity of its portfolio.
For more information about our climate business, see page 37.
HSBC Global Research
1st
for integrated climate
change research, ranked
by Extel Survey 2015.
HSBC HOLDINGS PLC
36
Table of Contents
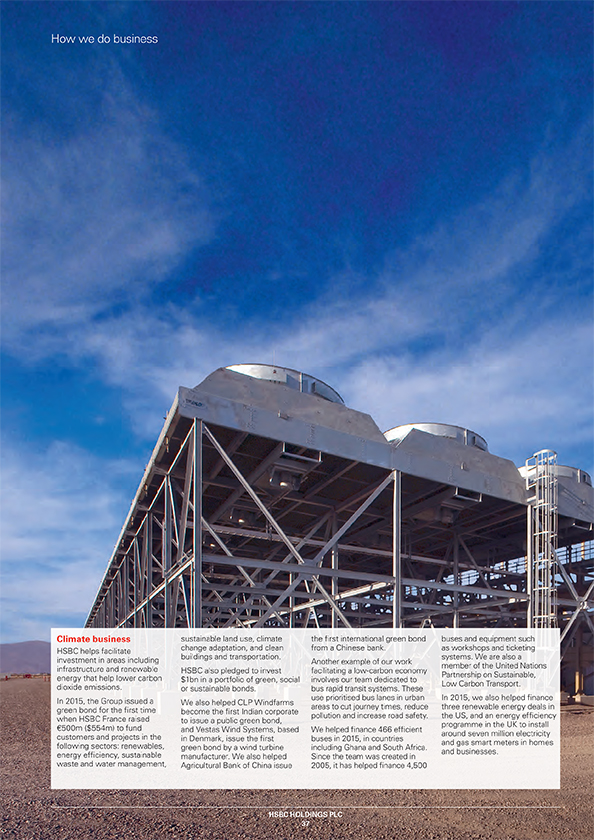
Table of Contents
Strategic Report |How we do business

Empowering people
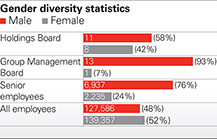
Valuing diversity
We are proud to provide an open, supportive and inclusive workplace where people can grow and achieve their potential. Our commitment to diversity and inclusion helps us attract, develop and retain employees. We are also committed to reflecting the communities we serve.
Our employees lead and organise seven global employee networks to promote diversity. They focus on gender, age, ethnicity, sexual orientation, religion, working parents and disability.
To help managers address bias in hiring, promotion and talent identification, we use education programmes and have expanded mentoring initiatives for under-represented groups.
In 2015, we won Diversity Team of the Year at the European Diversity Awards. We were also one of 10 companies recognised as a Top Global Employer in Stonewall’s Global Workplace Equality Index.
We continue to address gender representation, particularly at senior levels, with additional focus on promotions and hiring. We also continue to expand support and flexible working programmes for parents returning to work.
Our award-winning Balance employee network aims to address gender diversity across HSBC, encouraging dialogue and a better understanding of the challenges and opportunities in promoting a gender-balanced workforce throughout the Group. It is available to staff of all genders, and had active groups in more than 30 offices around the world in 2015.
Encouraging ownership
We promote individual ownership and responsibility, and have created forums to encourage dialogue. In 2015, we continued to facilitate agenda-free exchange meetings across the Group for employees to collaborate on ideas and initiatives to improve our work. We also held 14 webcasts with senior executives to promote understanding of our strategic actions and allow employees to ask questions.
Equipping employees
Our training programmes reinforce a culture grounded in our values. In 2015, we completed a three-year programme of values-led leadership training for all employees.
We are building employee training centres in Birmingham, Dubai and mainland China. These will operate alongside HSBC University, our online training service.
In 2015, we also launched HSBC Confidential, which brought together all our existing whistleblowing channels on to a global platform that allows employees to raise concerns confidentially without fear of personal repercussions. The global channel can be accessed by telephone, email, web or mail. For further details, see ‘Whistleblowing’ on page 179.
Rewarding positive behaviours
We have embedded behaviour ratings in our performance review processes, which are factored into variable pay considerations.
In 2015, we introduced an At Our Best online recognition tool for all employees. It allows them to recognise colleagues’ actions by awarding points that are redeemed for gifts and benefits.
Exchange meeting participation
(% of employees that attended a 2015 meeting)
53%
Employee retention
84.1%
HSBC HOLDINGS PLC
38
Table of Contents

|
| |||||
| Ensuring sustainable outcomes | Tax | |||||
Managing environmental
and social impacts
We continue to reduce the environmental impact of our operations and have robust policies and processes to manage sustainability risks in our business activities.
We are reducing the amount of energy we consume, and increasing the proportion from renewable sources. We have signed agreements to increase the percentage of our electricity from new wind and solar sources to 9%, and have a target of 25% by 2020. We report on our carbon dioxide emissions for the year in the Report of the Directors on page 98.
Our sustainability risk policies cover a number of sensitive industries and themes. After we issued new standards in our forestry and agricultural commodities policies in 2014, we took the decision to stop banking more than 160 customers as soon as possible because they did not comply. In 2015, HSBC was recognised as a leader in the Forest 500 ranking of 150 investors’ policies on the sustainability of forest commodity supply chains.
We also support a transition to certified, sustainable palm oil. Our standards require our palm oil customers to have all their operations certified as sustainable by the end of 2018, and we continue to support them in meeting this goal.
In 2015, there were more than 2,300 attendances by relationship and risk managers of training on our sustainability risk policies to help ensure their implementation is robust.
Details on our sustainability risk framework and policies are available online at www.hsbc.com/citizenship/ sustainability/finance.
Respecting human rights
We apply human rights considerations directly as they affect our employees and indirectly through our suppliers and customers, and through our action to prevent bribery and corruption. For example, our code of conduct for suppliers includes elements related to human rights, as do our project finance lending and sustainability risk policies. Our Statement on Human Rights, issued in 2015, explains how we do this and is available on our website. We will integrate the provisions of the Modern Slavery Act 2015 into our business and supply chain, and will report in line with the guidelines published by the UK government.
We are guided by the International Bill of Human Rights, and support the UN Declaration of Human Rights and the principles concerning fundamental rights set out in the International Labour Organisation’s Declaration on Fundamental Principles and Rights at Work.
Investing in our communities
We believe that education and the environment are essential to resilient communities and thriving economies. For more than 10 years, we focused our community investment activities on these two areas. In 2015, following survey responses from employees, we decided to add medical charities to the causes we support.
In 2015, we contributed a total of $205m to charitable programmes and our employees volunteered 304,555 hours in community activities during the working day.
We marked our 150th year by setting up an additional fund of $150m to support causes selected by our employees. It will support 140 charities across the world over three years. We also made a one-off $62m donation to charities in Hong Kong from the sale of commemorative HK$150 bank notes.
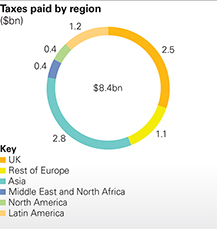
Our approach to tax
We apply the spirit as well as the letter of the law in all territories where we operate, and have adopted the UK Code of Practice for the Taxation of Banks. As a consequence, we pay our fair share of tax in the countries in which we operate. We continue to strengthen our processes to help ensure our banking services are not associated with any arrangements known or suspected to be designed to facilitate tax evasion.
HSBC continued to support global initiatives to improve tax transparency such as:
| – | the US Foreign Account Tax Compliance Act (‘FATCA’); |
| – | the OECD Standard for Automatic Exchange of Financial Account Information (also known as the Common Reporting Standard); |
| – | the Capital Requirements Directive IV (‘CRD IV’) Country by Country Reporting; and |
| – | the OECD Base Erosion and Profit Shifting (‘BEPS’) initiative. |
We do not expect the BEPS initiative or similar initiatives adopted by national governments to adversely impact HSBC’s results.
HSBC HOLDINGS PLC
39
Table of Contents
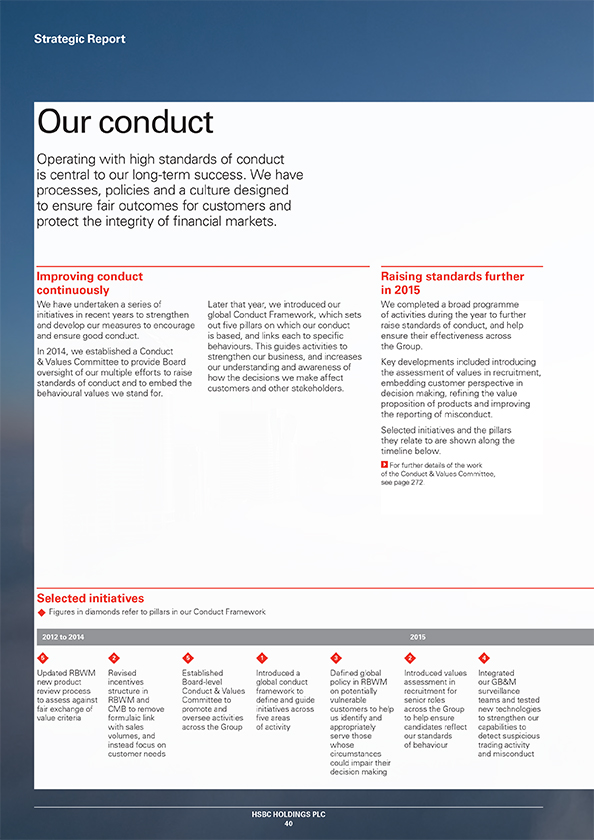
Table of Contents

Table of Contents
Strategic Report
We actively manage risk to protect
and enable the business.
Managing risk
As a provider of banking and financial services, managing risk is part of our core day-to-day activities. Our success in doing so is due to our clear risk appetite, which is aligned to our strategy. We set out the aggregate level and types of risk that we are willing to accept in order to achieve our medium- and long-term strategic objectives in our risk appetite statement, which is approved by the Board, covering:
| – | risks that we accept as part of doing business, such as credit risk and market risk; |
| – | risks that we incur to generate income, such as operational risk and capital and liquidity risk, which are managed to remain below an acceptable tolerance; and |
| – | risks that we have zero tolerance for, such as reputational risk. |
Our risk management framework and its key components, and our exposure to risks arising from the business activities of the global businesses are shown on pages 101 and 109.
The strategic actions designed to increase our return on equity are described on page 18.
To ensure that risks are managed in a consistent way across the Group, we employ a risk management framework that is applicable to all levels of the organisation and across all risk types. It sets out governance and structures,
responsibilities and processes. Global Risk, led by the Group Chief Risk Officer, who is an executive Director, is responsible for enterprise-wide risk oversight and is independent from the sales and trading functions of the Group’s businesses. This independence ensures the necessary balance in risk/ return decisions.
| Key risk appetite metrics | ||||||||||
| Component | Measure | Risk appetite | 2015 | |||||||
Returns |
Return on average ordinary shareholders’ equity in excess of our estimated cost of equity of 9%
|
|
>10% |
|
|
7.2% |
| |||
| ||||||||||
Capital
|
Common equity tier 1 ratio – CRD IV end point basis
|
|
>10% |
|
|
11.9% |
| |||
| ||||||||||
Liquidity |
HSBC consolidated balance sheet advances-to- deposits ratio
|
|
£90%
|
|
|
72% |
| |||
| ||||||||||
Loan impairment charges | RBWM loan impairment charges as % of advances1
|
|
<0.65% |
|
|
0.58% |
| |||
| ||||||||||
Wholesale loan impairment charges as % of advances
|
|
<0.45% |
|
|
0.26% |
| ||||
1Including the loans of the Brazilian operations held for sale. |
| |||||||||
Risk management and stress testing
Stress testing is an integral component of our risk management framework. It is an important tool for us to assess potential vulnerabilities in our businesses, business model or portfolios. It allows us to understand the sensitivities of the core assumptions in our strategic and capital plans, and improve decision-making through balancing risk and return.
Internal stress test scenarios are closely aligned to our assessment of top and emerging risks. The potential impact from these scenarios, were they to occur, may prompt pre-emptory management actions including a reduction in limits or direct exposures, or closer monitoring of exposures sensitive to stress.
Our approach to stress testing and the results of regulatory stress testing programmes are discussed on pages 103 and 116, respectively.
We also participate in regulatory stress test exercises in a number of jurisdictions. The primary Group-wide exercise is requested by the Bank of England. The 2015 scenario incorporated a synchronised global downturn affecting Asia, Brazil and the eurozone in particular, a reduction in global risk appetite and market liquidity, and a recession in the UK.
The results were published by the Bank of England on 1 December 2015 and are summarised below. Our CET1 ratio remained well above the regulatory minimum despite our significant presence in the countries and regions affected by the scenario, demonstrating our resilience to a severe stress situation in our core markets.
2015 Bank of England Stress Test Results | ||||||
Group Common Equity Tier 1 Ratio | ||||||
31 December 2014 actual (end point)
|
| 11.1%
|
| |||
| ||||||
Minimum stressed ratio before management actions
|
| 7.0%
|
| |||
| ||||||
Minimum stressed ratio after management actions
|
| 7.7%
|
| |||
| ||||||
Bank of England minimum ratio
|
| 4.5%
|
| |||
| ||||||
31 December 2015 actual (end point)
|
| 11.9%
|
| |||
HSBC HOLDINGS PLC
42
Table of Contents
Risk overview
Top and emerging risks
We employ a top and emerging risks framework at all levels of the organisation to identify current and forward-looking risks so that we may take action that either prevents them materialising or limits their effect.
Top risks are those that may have a material impact on the financial results, reputation or business model of the Group in the year ahead. Emerging risks are those that have large unknown components and may form beyond a one-year horizon. If these risks were to occur, they could have a material effect on HSBC.
Our current top and emerging risks are summarised below.
During 2015, we made two changes to our top and emerging risks to reflect our assessment of their effect on the Group. ‘Turning of the credit cycle’ was added as a new risk, reflecting the risk of deterioration in the credit environment. ‘Internet crime and fraud’ was removed as mitigating actions taken have reduced credit and fraud losses through digital channels.
In addition, four risks were renamed to better reflect the issues facing HSBC. We use the new names below.

Our top and emerging risks
are discussed in more detail
on page 110.
Risk
| Trend
| Mitigants
| ||||||
| Externally driven | ||||||||
Economic outlook and capital flows
|  | We closely monitor economic developments in key markets, undertaking business or portfolio reviews or stress tests as required, and take appropriate action as circumstances evolve.
| ||||||
| ||||||||
| Geopolitical risk |  | We continuously assess the impact of the geopolitical outlook on our country limits and exposures to ensure we remain within our risk appetite.
| ||||||
| ||||||||
| Turning of the credit cycle | | We undertook portfolio and limit reviews and conducted stress tests on the sectors and portfolios that are most sensitive to the credit cycle.
| ||||||
| ||||||||
Regulatory developments affecting our business model and profitability
| | We actively assess the effect of relevant developments and engage closely with governments and regulators, seeking to ensure that requirements are considered properly and implemented in an effective manner.
| ||||||
| ||||||||
US DPA and related agreements and consent orders
| | We are continuing to take concerted action to remedy anti-money laundering and sanctions compliance deficiencies and to implement Global Standards.
| ||||||
| ||||||||
Regulatory focus on conduct of business and financial crime
| | We are enhancing our financial crime and regulatory compliance controls and resources and are implementing significant programmes to enhance the management of conduct and financial crime risks.
| ||||||
| ||||||||
| Dispute risk | | We continue to focus on identifying emerging regulatory and judicial trends, and sharing lessons learned globally in an effort to avoid or limit future litigation exposure.
| ||||||
| ||||||||
Cyber threat and unauthorised access to systems
| | We continue to improve our governance and controls framework to protect HSBC’s information and technical infrastructure against ever-increasing and sophisticated cyber threats.
| ||||||
| ||||||||
Internally driven
| ||||||||
| ||||||||
| People risk | | We continue to focus on attracting and retaining key talent and are implementing a number of initiatives to improve employee capability, collaboration and engagement.
| ||||||
| ||||||||
| Execution risk | | We have strengthened our prioritisation and governance processes for significant strategic, regulatory and compliance projects. Risks related to the disposals of our operations in Brazil and Turkey were subject to close management oversight.
| ||||||
| ||||||||
Third-party risk management
| | We are enhancing our third-party risk management governance, processes and procedures and have conducted enhanced risk assessments of our most critical third parties.
| ||||||
| ||||||||
| Model risk | | We have strengthened our governance framework, created centralised global analytical functions and recruited additional subject matter experts in our modelling and independent model review teams.
| ||||||
| ||||||||
| Data management | | A number of key initiatives and projects are in progress to implement our data strategy to enable consistent data aggregation, reporting and management.
| ||||||
| ||||||||
| ||||||||
HSBC HOLDINGS PLC
43
Table of Contents
Strategic Report
Our remuneration policy supports the
achievement of our strategic objectives
through balancing reward for both short-term
and long-term sustainable performance.
Remuneration principles
The remuneration strategy for our employees is based on a series of key principles.
What we do – Focus on total compensation with a strong link between pay and performance
– Judge not only what is achieved but how it is achieved in line with HSBC Values
– Operate a thorough performance management and HSBC Values assessment process
– Recognise and reward our employees for outstanding positive behaviour
– Design our policy to align compensation with long-term shareholder interests
– Apply consequence management to strengthen the alignment between risk and reward |
What we don’t do – Reward inappropriate or excessive risk taking or short-term performance at the expense of long-term company sustainability
– Use only a formulaic approach to determine bonuses for our executives
– Award discretionary bonuses to employees rated unacceptable against our HSBC Values and behaviours
– Allow our employees to hedge against their unvested or retained awards
– Offer employment contracts with a notice period of more than 12 months
– Have pre-arranged individual severance agreements | 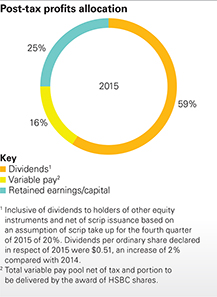 |


Single figure of remuneration for our executive Directors
(£000)
| ||||||||||||||||||||||||||||||||||
How much our executive Directors earned in 2015(£000) | ||||||||||||||||||||||||||||||||||
| Douglas Flint | Stuart Gulliver | Iain Mackay | Marc Moses | |||||||||||||||||||||||||||||||
| Group Chairman | Group Chief | Group Finance | Group Chief | |||||||||||||||||||||||||||||||
| Executive | Director | Risk Officer | ||||||||||||||||||||||||||||||||
|
| |||||||||||||||||||||||||||||||||
| 2015 | 2014 | 2015 | 2014 | 2015 | 2014 | 2015 | 2014 | |||||||||||||||||||||||||||
| Fixed pay | ||||||||||||||||||||||||||||||||||
| ||||||||||||||||||||||||||||||||||
| Base salary | 1,500 | 1,500 | 1,250 | 1,250 | 700 | 700 | 700 | 700 | ||||||||||||||||||||||||||
| ||||||||||||||||||||||||||||||||||
| Fixed pay allowance | – | – | 1,700 | 1,700 | 950 | 950 | 950 | 950 | ||||||||||||||||||||||||||
| ||||||||||||||||||||||||||||||||||
| Pension | 750 | 750 | 625 | 625 | 350 | 350 | 350 | 350 | ||||||||||||||||||||||||||
| ||||||||||||||||||||||||||||||||||
| Total fixed pay | 2,250 | 2,250 | 3,575 | 3,575 | 2,000 | 2,000 | 2,000 | 2,000 | ||||||||||||||||||||||||||
| ||||||||||||||||||||||||||||||||||
| Variable pay | ||||||||||||||||||||||||||||||||||
| ||||||||||||||||||||||||||||||||||
| Annual incentive | – | – | 1,072 | 1,290 | 1,068 | 867 | 827 | 1,033 | ||||||||||||||||||||||||||
| ||||||||||||||||||||||||||||||||||
| GPSP | – | – | 1,969 | 2,112 | 1,101 | 1,131 | 1,101 | 1,131 | ||||||||||||||||||||||||||
| ||||||||||||||||||||||||||||||||||
| Total variable pay | – | – | 3,041 | 3,402 | 2,169 | 1,998 | 1,928 | 2,164 | ||||||||||||||||||||||||||
| ||||||||||||||||||||||||||||||||||
| Total fixed and variable pay | 2,250 | 2,250 | 6,616 | 6,977 | 4,169 | 3,998 | 3,928 | 4,164 | ||||||||||||||||||||||||||
| ||||||||||||||||||||||||||||||||||
| Benefits | 151 | 136 | 662 | 589 | 54 | 43 | 6 | 6 | ||||||||||||||||||||||||||
| ||||||||||||||||||||||||||||||||||
| Non-taxable benefits | 95 | 105 | 53 | 53 | 28 | 28 | 29 | 33 | ||||||||||||||||||||||||||
| ||||||||||||||||||||||||||||||||||
| Notional return on deferred cash | – | 41 | 9 | – | 5 | 11 | 5 | 36 | ||||||||||||||||||||||||||
| ||||||||||||||||||||||||||||||||||
| Total single figure of remuneration | 2,496 | 2,532 | 7,340 | 7,619 | 4,256 | 4,080 | 3,968 | 4,239 | ||||||||||||||||||||||||||
| ||||||||||||||||||||||||||||||||||
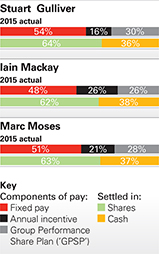
HSBC HOLDINGS PLC
44
Table of Contents
Remuneration
Policy for executive Directors
We are making changes to our Directors’ remuneration policy
Our current remuneration policy was approved by shareholders at the 2014 Annual General Meeting (‘AGM’) and was applied for 2015. Due to increased
regulatory requirements, we are putting forward a new remuneration policy for shareholder approval at the AGM this year. For further details, see page 288.
The table below summarises how each element of pay was implemented in 2015 and how it will change for 2016 if the new policy is approved.
For full details of the current Directors’ remuneration policy, see page 381 of the 2013 Directors’ Remuneration Report.
Pay
| Element | Implementation in 2015 | Proposed changes to policy for 2016 | |||
| Fixed | Base salary | – Benchmarked on an annual basis | No change to policy: | |||
– Increases will not exceed more than 15% of base salary levels as at 2013 during the term of the policy | – Increase will not exceed more than 15% of base salary levels as at 2016 during the term of the policy | |||||
– Amounts have not changed since 2010
| ||||||
| ||||||
| Fixed pay allowance | – Fixed pay allowances introduced in 2014 to ensure the total compensation package remains competitive as a consequence of new regulatory requirements in 2013 | – Maximum fixed pay allowance for each executive Director is 150% of base salary – Granted in immediately vested shares, subject to a retention period released pro-rata over a period of five years | ||||
– Granted in immediately vested shares, subject to a retention period with 20% released after one year and the remainder after five years
| ||||||
| ||||||
| Pension | – Cash allowance in lieu of pension of up to 50% of base salary
| – Reduced to a maximum of 30% of base salary | ||||
| ||||||
| Benefits | – Takes account of local market practice, including but not limited to medical and income protection insurance | – No change to current provided benefits – Post-departure benefits introduced for up to seven years from date of departure
| ||||
| ||||||
| Variable | Annual incentive | – Maximum is 67% of fixed pay (equal to approximately 181% of base salary) | – Maximum is 215% of base salary – 100% delivered in shares subject to a retention period, with the Remuneration Committee to have discretion to defer a portion of the awards or apply a longer retention period | |||
– Measured against an annual scorecard | ||||||
– A minimum of 60% will be deferred and vest over a three-year period | ||||||
– Delivered in cash and shares, with a minimum of 50% delivered in shares
| ||||||
| ||||||
Long-term incentive | – Group Performance Share Plan | – New long-term incentive plan | ||||
– Maximum of 133% of fixed pay (equal to approximately 381% of base salary) | – Maximum is 320% of base salary – Performance targets set annually for each three-year forward-looking performance period – Introduction of relative total shareholder return as a performance measure | |||||
– Measured against 2014 long-term scorecard | ||||||
– Delivered in shares with a five-year vesting period | ||||||
– Required to hold shares until retirement | ||||||
– Delivered in shares, subject to the outcome of the performance conditions at the end of the three-year performance period, in equal instalments between the third and seventh anniversary of the grant date | ||||||
– A retention period may be applied to ensure compliance with regulatory requirements
| ||||||
HSBC HOLDINGS PLC
45
Table of Contents
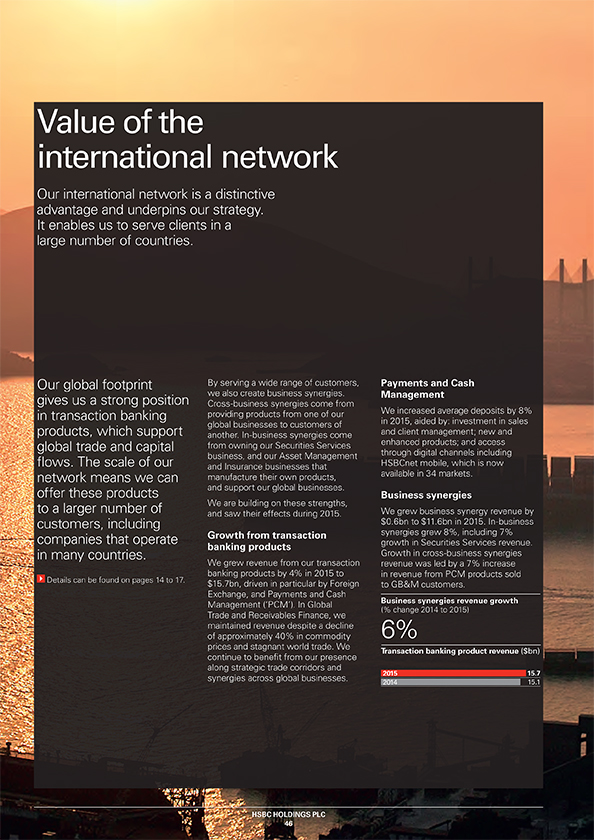
Table of Contents
Financial review
| All disclosures in the Financial Review section are unaudited unless otherwise stated. | ||
| Disclosures marked as audited should be considered audited in the context of financial statements taken as a whole. | ||
HSBC HOLDINGS PLC
47 |
Table of Contents
Report of the Directors: Financial summary
Use of non-GAAP financial measures
| 48 | ||
| 49 | ||
| 49a | ||
| 49b | ||
| 50 | ||
| 51 | ||
| 51 | ||
| 53 | ||
| 54 | ||
Net income from financial instruments designated at fair value | 54 | |
| 55 | ||
| 56 | ||
| 56 | ||
Net insurance claims and benefits paid and movement in liabilities to policyholders | 57 | |
| 57 | ||
| 58 | ||
| 60 | ||
| 60 | ||
| 60a | ||
| 61 | ||
| 62 | ||
| 63a | ||
| 63a | ||
Analysis of changes in net interest income and net interest expense | 63g | |
| 63j | ||
| 63k | ||
| 63l | ||
| 63o | ||
| 64 | ||
| 64 |
The management commentary included in the Strategic Report, the Report of the Directors: ‘Financial Review’, together with the ‘Employees’ and ‘Corporate sustainability’ sections of ‘Corporate Governance’ and the ‘Directors’ Remuneration Report’ is presented in compliance with the IFRSs Practice Statement‘Management Commentary’ issued by the IASB.
Use of non-GAAP financial measures
Our reported results are prepared in accordance with IFRSs as detailed in the Financial Statements starting on page 336. In measuring our performance, the financial measures that we use include those which have been derived from our reported results in order to eliminate factors which distort year-on-year comparisons. These are considered non-GAAP financial measures.
The primary non-GAAP financial measure we use is ‘adjusted performance’. Other non-GAAP financial measures are described and reconciled to the most relevant reported financial measure when used.
Adjusted performance
Adjusted performance is computed by adjusting reported results for the year-on-year effects of foreign currency translation differences and significant items that distort year-on-year comparisons. ‘Significant items’ are excluded from adjusted performance because management and investors would ordinarily identify and consider them separately in order to better understand the underlying trends in a business.
These items, which are detailed in the tables starting on pages 66 and 77, include:
| • | gains or losses on the disposal or reclassification of subsidiaries, associates and joint ventures; |
| • | fines, penalties, customer redress and associated provisions, together with settlements and provisions relating to legal matters when their size or historical nature mean they warrant separate consideration; |
| • | costs incurred to achieve the productivity and cost reduction targets outlined in the Investor Update of June 2015; and |
| • | credit spread movements on our long-term debt designated at fair value. |
We consider adjusted performance provides useful information for investors by aligning internal and external reporting, identifying and quantifying items management believe to be significant and providing insight into how management assesses year-on-year performance.
Foreign currency translation differences
Foreign currency translation differences reflect the movements of the US dollar against most major currencies during 2015. We exclude the translation differences when deriving constant currency data because using this data allows us to assess balance sheet and income statement performance on a like-for-like basis to better understand the underlying trends in the business.
Foreign currency translation differences
Foreign currency translation differences for 2015 are computed by retranslating into US dollars for non-US dollar branches, subsidiaries, joint ventures and associates:
• the income statements for 2014 at the average rates of exchange for 2015; and
• the balance sheet at 31 December 2014 at the prevailing rates of exchange on 31 December 2015.
No adjustment has been made to the exchange rates used to translate foreign currency denominated assets and liabilities into the functional currencies of any HSBC branches, subsidiaries, joint ventures or associates. When reference is made to foreign currency translation differences in tables or commentaries, comparative data reported in the functional currencies of HSBC’s operations have been translated at the appropriate exchange rates applied in the current year on the basis described above.
|
HSBC HOLDINGS PLC
48 |
Table of Contents
Significant items
The tables starting on pages 66 and 77, detail the effect of significant items on each of our geographical segments and global businesses in 2015 and 2014.
The following table reconciles selected reported items for 2015 and 2014 to adjusted items at a Group level.
Reconciliation of 2015 and 2014 reported and adjusted items
Reconciliation of reported and adjusted items
| 2015 | 2014 | Change | ||||||||||||||||
| $m | $m | % | ||||||||||||||||
Revenue1 | ||||||||||||||||||
Reported | 59,800 | 61,248 | (2 | ) | ||||||||||||||
Currency translation | (4,775 | ) | ||||||||||||||||
Own credit spread2 | (1,002 | ) | (417 | ) | ||||||||||||||
Acquisitions, disposals and dilutions | – | (9 | ) | |||||||||||||||
Other significant items | (1,033 | ) | 1,180 | |||||||||||||||
Adjusted | 57,765 | 57,227 | 1 | |||||||||||||||
Loan impairment charges and other credit risk provisions | ||||||||||||||||||
Reported | (3,721 | ) | (3,851 | ) | 3 | |||||||||||||
Currency translation | 683 | |||||||||||||||||
Acquisitions, disposals and dilutions | – | – | ||||||||||||||||
Other significant items | – | – | ||||||||||||||||
Adjusted | (3,721 | ) | (3,168 | ) | (17 | ) | ||||||||||||
Total operating expenses | ||||||||||||||||||
Reported | (39,768 | ) | (41,249 | ) | 4 | |||||||||||||
Currency translation | 3,278 | |||||||||||||||||
Acquisitions, disposals and dilutions | – | 40 | ||||||||||||||||
Other significant items | 3,586 | 3,355 | ||||||||||||||||
Adjusted | (36,182 | ) | (34,576 | ) | (5 | ) | ||||||||||||
Adjusted cost efficiency ratio | 62.6% | 60.4% | ||||||||||||||||
Share of profit in associates and joint ventures | ||||||||||||||||||
Reported | 2,556 | 2,532 | 1 | |||||||||||||||
Currency translation | (39 | ) | ||||||||||||||||
Acquisitions, disposals and dilutions | – | – | ||||||||||||||||
Other significant items | – | – | ||||||||||||||||
Adjusted | 2,556 | 2,493 | 3 | |||||||||||||||
Profit before tax | ||||||||||||||||||
Reported | 18,867 | 18,680 | 1 | |||||||||||||||
Currency translation | (853 | ) | ||||||||||||||||
Own credit spread2 | (1,002 | ) | (417 | ) | ||||||||||||||
Acquisitions, disposals and dilutions | – | 31 | ||||||||||||||||
Other significant items | 2,553 | 4,535 | ||||||||||||||||
Adjusted | 20,418 | 21,976 | (7 | ) | ||||||||||||||
For footnotes, see page 99.
HSBC HOLDINGS PLC
49 |
Table of Contents
Reconciliation of 2014 and 2013 reported and adjusted items
Reconciliation of reported and adjusted items
| 2014 | 2013 | Change | ||||||||||||||||
| $m | $m | % | ||||||||||||||||
Revenue1 | ||||||||||||||||||
Reported | 61,248 | 64,645 | (5 | ) | ||||||||||||||
Currency translation | (686 | ) | ||||||||||||||||
Own credit spread2 | (417 | ) | 1,246 | |||||||||||||||
Acquisitions, disposals and dilutions | (9 | ) | (2,757 | ) | ||||||||||||||
Other significant items | 1,180 | (594 | ) | |||||||||||||||
Adjusted | 62,002 | 61,854 | – | |||||||||||||||
Loan impairment charges and other credit risk provisions | ||||||||||||||||||
Reported | (3,851 | ) | (5,849 | ) | 34 | |||||||||||||
Currency translation | 168 | |||||||||||||||||
Acquisitions, disposals and dilutions | – | 67 | ||||||||||||||||
Other significant items | – | – | ||||||||||||||||
Adjusted | (3,851 | ) | (5,614 | ) | 31 | |||||||||||||
Total operating expenses | ||||||||||||||||||
Reported | (41,249 | ) | (38,556 | ) | (7 | ) | ||||||||||||
Currency translation | 348 | |||||||||||||||||
Acquisitions, disposals and dilutions | 40 | 488 | ||||||||||||||||
Other significant items | 3,355 | 2,038 | ||||||||||||||||
Adjusted | (37,854 | ) | (35,682 | ) | (6 | ) | ||||||||||||
Adjusted cost efficiency ratio | 61.1% | 57.7% | ||||||||||||||||
Share of profit in associates and joint ventures | ||||||||||||||||||
Reported | 2,532 | 2,325 | 9 | |||||||||||||||
Currency translation | 11 | |||||||||||||||||
Acquisitions, disposals and dilutions | – | 87 | ||||||||||||||||
Other significant items | – | – | ||||||||||||||||
Adjusted | 2,532 | 2,423 | 4 | |||||||||||||||
Profit before tax | ||||||||||||||||||
Reported | 18,680 | 22,565 | (17 | ) | ||||||||||||||
Currency translation | (159 | ) | ||||||||||||||||
Own credit spread2 | (417 | ) | 1,246 | |||||||||||||||
Acquisitions, disposals and dilutions | 31 | (2,115 | ) | |||||||||||||||
Other significant items | 4,535 | 1,444 | ||||||||||||||||
Adjusted | 22,829 | 22,981 | (1 | ) | ||||||||||||||
For footnotes, see page 100a.
Negative percentage change numbers are favourable:
positive numbers are unfavourable.
HSBC HOLDINGS PLC
49a
Table of Contents
Return on equity and Return on tangible equity
Return on tangible equity (‘ROTE’) is computed by adjusting reported results for the movements in the present value of in-force long-term insurance business (‘PVIF’), impairments of goodwill, and adjusting the reported equity for goodwill, intangibles and PVIF. The
adjustment to reported results and reported equity excludes amounts attributable to non-controlling interests.
We provide ROTE as an additional measure to ROE to provide a way to look at our performance which is closely aligned to our capital position.
The following table details the adjustments made to the reported results and equity:
| 2015 | 2014 | 2013 | ||||||||||||||||
| $m | $m | $m | ||||||||||||||||
Profit | ||||||||||||||||||
Profit attributable to the ordinary shareholders of the parent company | 12,572 | 13,115 | 15,631 | |||||||||||||||
Goodwill impairment (net of tax) | – | – | 279 | |||||||||||||||
Increase in PVIF (net of tax) | (494 | ) | (213 | ) | (397 | ) | ||||||||||||
Profit attributable to the ordinary shareholders, excl. goodwill impairment and PVIF | 12,078 | 12,902 | 15,513 | |||||||||||||||
Equity | ||||||||||||||||||
Average ordinary shareholders’ equity | 174,627 | 178,898 | 169,260 | |||||||||||||||
Effect of Goodwill, PVIF and other intangibles (net of deferred tax) | (25,012 | ) | (27,740 | ) | (28,024 | ) | ||||||||||||
Average tangible equity | 149,615 | 151,158 | 141,236 | |||||||||||||||
| % | % | % | ||||||||||||||||
Ratio | ||||||||||||||||||
Return on equity | 7.2 | 7.3 | 9.2 | |||||||||||||||
Return on tangible equity | 8.1 | 8.5 | 11.0 | |||||||||||||||
HSBC HOLDINGS PLC
49b
Table of Contents
Report of the Directors: Financial summary(continued)
Consolidated income statement / Group performance by income and expense item
Five-year summary consolidated income statement
2015 $m | 2014 $m | 2013 $m | 2012 $m | 2011 $m | ||||||||||||||||||||||||||
Net interest income | 32,531 | 34,705 | 35,539 | 37,672 | 40,662 | |||||||||||||||||||||||||
Net fee income | 14,705 | 15,957 | 16,434 | 16,430 | 17,160 | |||||||||||||||||||||||||
Net trading income | 8,723 | 6,760 | 8,690 | 7,091 | 6,506 | |||||||||||||||||||||||||
Net income/(expense) from financial instruments designated at fair value | 1,532 | 2,473 | 768 | (2,226 | ) | 3,439 | ||||||||||||||||||||||||
Gains less losses from financial investments | 2,068 | 1,335 | 2,012 | 1,189 | 907 | |||||||||||||||||||||||||
Dividend income | 123 | 311 | 322 | 221 | 149 | |||||||||||||||||||||||||
Net insurance premium income | 10,355 | 11,921 | 11,940 | 13,044 | 12,872 | |||||||||||||||||||||||||
Gains on disposal of US branch network, US cards business and Ping An Insurance (Group) Company of China, Ltd | – | – | – | 7,024 | – | |||||||||||||||||||||||||
Other operating income | 1,055 | 1,131 | 2,632 | 2,100 | 1,766 | |||||||||||||||||||||||||
Total operating income | 71,092 | 74,593 | 78,337 | 82,545 | 83,461 | |||||||||||||||||||||||||
Net insurance claims and benefits paid and movement in liabilities to policyholders | (11,292 | ) | (13,345 | ) | (13,692 | ) | (14,215 | ) | (11,181 | ) | ||||||||||||||||||||
Net operating income before loan impairment charges and other credit risk provisions | 59,800 | 61,248 | 64,645 | 68,330 | 72,280 | |||||||||||||||||||||||||
Loan impairment charges and other credit risk provisions | (3,721 | ) | (3,851 | ) | (5,849 | ) | (8,311 | ) | (12,127 | ) | ||||||||||||||||||||
Net operating income | 56,079 | 57,397 | 58,796 | 60,019 | 60,153 | |||||||||||||||||||||||||
Total operating expenses | (39,768 | ) | (41,249 | ) | (38,556 | ) | (42,927 | ) | (41,545 | ) | ||||||||||||||||||||
Operating profit | 16,311 | 16,148 | 20,240 | 17,092 | 18,608 | |||||||||||||||||||||||||
Share of profit in associates and joint ventures | 2,556 | 2,532 | 2,325 | 3,557 | 3,264 | |||||||||||||||||||||||||
Profit before tax | 18,867 | 18,680 | 22,565 | 20,649 | 21,872 | |||||||||||||||||||||||||
Tax expense | (3,771 | ) | (3,975 | ) | (4,765 | ) | (5,315 | ) | (3,928 | ) | ||||||||||||||||||||
Profit for the year | 15,096 | 14,705 | 17,800 | 15,334 | 17,944 | |||||||||||||||||||||||||
Profit attributable to shareholders of the parent company | 13,522 | 13,688 | 16,204 | 14,027 | 16,797 | |||||||||||||||||||||||||
Profit attributable to non-controlling interests | 1,574 | 1,017 | 1,596 | 1,307 | 1,147 | |||||||||||||||||||||||||
Five-year financial information
|
| |||||||||||||||||||||||||||||
2015 $ | 2014 $ | 2013 $ | 2012 $ | 2011 $ | ||||||||||||||||||||||||||
Basic earnings per share | 0.65 | 0.69 | 0.84 | 0.74 | 0.92 | |||||||||||||||||||||||||
Diluted earnings per share | 0.64 | 0.69 | 0.84 | 0.74 | 0.91 | |||||||||||||||||||||||||
Dividends per ordinary share3 | 0.50 | 0.49 | 0.48 | 0.41 | 0.39 | |||||||||||||||||||||||||
| % | % | % | % | % | ||||||||||||||||||||||||||
Dividend payout ratio4 | 76.5 | 71.0 | 57.1 | 55.4 | 42.4 | |||||||||||||||||||||||||
Post-tax return on average total assets | 0.6 | 0.5 | 0.7 | 0.6 | 0.6 | |||||||||||||||||||||||||
Return on average ordinary shareholders’ equity | 7.2 | 7.3 | 9.2 | 8.4 | 10.9 | |||||||||||||||||||||||||
Average foreign exchange translation rates to $: | ||||||||||||||||||||||||||||||
$1: £ | 0.654 | 0.607 | 0.639 | 0.631 | 0.624 | |||||||||||||||||||||||||
$1:€ | 0.902 | 0.754 | 0.753 | 0.778 | 0.719 | |||||||||||||||||||||||||
For footnotes, see page 99.
Unless stated otherwise, all tables in the Annual Report and Accounts 2015 are presented on a reported basis.
For a summary of our financial performance in 2015, see page 22.
HSBC HOLDINGS PLC
50
Table of Contents
Group performance by income and expense item
| 2015 | 2014 | 2013 | ||||||||||||||||
| $m | $m | $m | ||||||||||||||||
Interest income | 47,189 | 50,955 | 51,192 | |||||||||||||||
Interest expense | (14,658 | ) | (16,250 | ) | (15,653 | ) | ||||||||||||
Net interest income5 | 32,531 | 34,705 | 35,539 | |||||||||||||||
Average interest-earning assets | 1,726,949 | 1,786,536 | 1,669,368 | |||||||||||||||
Gross interest yield6 | 2.73% | 2.85% | 3.07% | |||||||||||||||
Less: cost of funds | (1.00% | ) | (1.05% | ) | (1.10% | ) | ||||||||||||
Net interest spread7 | 1.73% | 1.80% | 1.97% | |||||||||||||||
Net interest margin8 | 1.88% | 1.94% | 2.13% | |||||||||||||||
For footnotes, see page 99.
Summary of interest income by type of asset
| 2015 | 2014 | 2013 | ||||||||||||||||||||||||||||||||||||||||||||||||||||
Average balance | Interest income | Yield | Average balance | Interest income | Yield | Average balance | Interest income | Yield | ||||||||||||||||||||||||||||||||||||||||||||||
| $m | $m | % | $m | $m | % | $m | $m | % | ||||||||||||||||||||||||||||||||||||||||||||||
Short-term funds and loans and advances to banks | 221,924 | 2,277 | 1.03 | 237,148 | 3,068 | 1.29 | 236,377 | 2,851 | 1.21 | |||||||||||||||||||||||||||||||||||||||||||||
Loans and advances to customers | 909,707 | 33,104 | 3.64 | 931,311 | 37,429 | 4.02 | 897,322 | 38,529 | 4.29 | |||||||||||||||||||||||||||||||||||||||||||||
Reverse repurchase agreements –non-trading | 162,308 | 1,301 | 0.80 | 198,273 | 1,800 | 0.91 | 114,324 | 995 | 0.87 | |||||||||||||||||||||||||||||||||||||||||||||
Financial investments | 396,113 | 7,508 | 1.90 | 399,816 | 8,323 | 2.08 | 393,309 | 8,002 | 2.03 | |||||||||||||||||||||||||||||||||||||||||||||
Other interest-earning assets | 36,897 | 2,999 | 8.13 | 19,988 | 335 | 1.68 | 28,036 | 815 | 2.91 | |||||||||||||||||||||||||||||||||||||||||||||
Total interest-earning assets | 1,726,949 | 47,189 | 2.73 | 1,786,536 | 50,955 | 2.85 | 1,669,368 | 51,192 | 3.07 | |||||||||||||||||||||||||||||||||||||||||||||
Trading assets and financial assets designated at fair value9,10 | 195,285 | 4,626 | 2.37 | 238,958 | 5,596 | 2.34 | 354,817 | 5,763 | 1.62 | |||||||||||||||||||||||||||||||||||||||||||||
Impairment allowances | (10,606 | ) | (14,015 | ) | (15,954 | ) | ||||||||||||||||||||||||||||||||||||||||||||||||
Non-interest-earning assets | 682,143 | 668,564 | 683,785 | |||||||||||||||||||||||||||||||||||||||||||||||||||
Year ended 31 December | 2,593,771 | 51,815 | 2.00 | 2,680,043 | 56,551 | 2.11 | 2,692,016 | 56,955 | 2.12 | |||||||||||||||||||||||||||||||||||||||||||||
For footnotes, see page99.
Summary of interest expense by type of liability and equity
| ||||||||||||||||||||||||||||||||||||||||||||||||||||||
| 2015 | 2014 | 2013 | ||||||||||||||||||||||||||||||||||||||||||||||||||||
Average balance | Interest expense | Cost | Average balance | Interest expense | Cost | Average balance | Interest expense | Cost | ||||||||||||||||||||||||||||||||||||||||||||||
| $m | $m | % | $m | $m | % | $m | $m | % | ||||||||||||||||||||||||||||||||||||||||||||||
Deposits by banks11 | 55,863 | 378 | 0.68 | 61,217 | 481 | 0.79 | 61,616 | 555 | 0.90 | |||||||||||||||||||||||||||||||||||||||||||||
Financial liabilities designated at fair value – own debt issued12 | 58,489 | 717 | 1.23 | 66,374 | 837 | 1.26 | 72,333 | 967 | 1.34 | |||||||||||||||||||||||||||||||||||||||||||||
Customer accounts13 | 1,075,901 | 7,401 | 0.69 | 1,088,493 | 9,131 | 0.84 | 1,035,500 | 8,794 | 0.85 | |||||||||||||||||||||||||||||||||||||||||||||
Repurchase agreements – non-trading | 117,947 | 355 | 0.30 | 190,705 | 652 | 0.34 | 94,410 | 405 | 0.43 | |||||||||||||||||||||||||||||||||||||||||||||
Debt securities in issue | 129,039 | 3,521 | 2.73 | 129,724 | 4,554 | 3.51 | 150,976 | 4,182 | 2.77 | |||||||||||||||||||||||||||||||||||||||||||||
Other interest-bearing liabilities | 28,396 | 2,286 | 8.05 | 10,120 | 595 | 5.88 | 11,345 | 750 | 6.61 | |||||||||||||||||||||||||||||||||||||||||||||
Total interest-bearing liabilities | 1,465,635 | 14,658 | 1.00 | 1,546,633 | 16,250 | 1.05 | 1,426,180 | 15,653 | 1.10 | |||||||||||||||||||||||||||||||||||||||||||||
Trading liabilities and financial liabilities designated at fair value (excluding own debt issued) | 151,294 | 2,071 | 1.37 | 178,518 | 2,856 | 1.60 | 301,353 | 3,027 | 1.00 | |||||||||||||||||||||||||||||||||||||||||||||
Non-interest bearing current accounts | �� | 190,914 | 185,990 | 184,370 | ||||||||||||||||||||||||||||||||||||||||||||||||||
Total equity and other non-interest bearing liabilities | 785,928 | 768,902 | 780,113 | |||||||||||||||||||||||||||||||||||||||||||||||||||
Year ended 31 December | 2,593,771 | 16,729 | 0.64 | 2,680,043 | 19,106 | 0.71 | 2,692,016 | 18,680 | 0.69 | |||||||||||||||||||||||||||||||||||||||||||||
For footnotes, see page 99.
HSBC HOLDINGS PLC
51
Table of Contents
Report of the Directors: Financial summary(continued)
Group performance by income and expense item
Reported net interest income of $32.5bn decreased by $2.2bn or 6% compared with 2014. This included the
significant items and currency translation summarised in the table below.
Significant items and currency translation
2015 $m | 2014 $m | |||||||||||
Significant items | ||||||||||||
Provisions arising from the ongoing review of compliance with the Consumer Credit Act in the UK | (10 | ) | (632 | ) | ||||||||
Acquisitions, disposals and dilutions | – | 38 | ||||||||||
| (10 | ) | (594 | ) | |||||||||
Currency translation | 2,890 | |||||||||||
Year ended 31 December | (10 | ) | 2,296 | |||||||||
Excluding the significant items and currency translation tabulated above, net interest income was broadly unchanged compared with 2014, as increases in Asia and Latin America were offset by a reduction in North America.
On a reported basis, net interest spread and margin both fell, mainly due to adverse foreign exchange movements in Latin America and Europe, partly offset by a reduction in significant items, namely lower provisions arising from the ongoing review of compliance with the Consumer Credit Act (‘CCA’) in the UK. Excluding these factors, net interest spread and margin were marginally lower due to reduced yields on customer lending in Europe and North America. However, during the year, we changed the mix of our overall portfolio towards higher yielding customer lending balances. This was through a managed reduction in the average balances of lower yielding short-term funds, reverse repos and financial investments, notably in Europe, reflecting our continued focus on the efficient use of our balance sheet.
Interest income by type of asset and interest expense by type of liability, and the associated average balances as set out in the summary tables above, were affected by the reclassification in June 2015, of our operations in Brazil to ‘Assets held for sale’ in ‘Other interest-earning assets’ and liabilities of disposal groups held for sale in ‘Other interest-bearing liabilities’, respectively.
Interest income
Reported interest income decreased by $3.8bn compared with 2014 driven by currency translation, notably in Latin America and Europe, although this was partly offset in Europe as 2014 included higher provisions arising from the on-going review of compliance with the CCA.
Excluding these factors, interest income was broadly unchanged compared with 2014.
Interest income on loans and advances to customers was broadly unchanged as lower interest income in Europe and North America was offset by increases in Asia and Latin America.
In Europe, the reduction in interest income was driven by lower yields on mortgages in the UK in line with competitive pricing, and the effect of downward movements in market interest rates in the eurozone. Interest income also fell in North America as the CML portfolio continued to decrease from run-off and sales. In addition, new lending to customers in RBWM and CMB was at reduced yields in the current low interest rate
environment, although the effect of this was partly offset by an increase in average term lending balances.
By contrast, in Asia, the rise in interest income was driven by growth in average term lending balances, primarily in Hong Kong and mainland China. This was partly offset by compressed yields on customer lending, notably in mainland China and Australia due to central bank rate reductions, although yields in Hong Kong marginally increased. In Latin America, the increase was primarily in Argentina, driven by growth in average balances.
Interest income on short-term funds and financial investments in Balance Sheet Management marginally decreased. This was driven by lower interest income in Europe, due to a managed reduction in average balances, and in Asia, reflecting movement in central bank interest rates in mainland China and India. These factors were partly offset in North America by a change in product mix towards higher yielding mortgage backed securities in order to maximise the effectiveness of the portfolio.
Interest income from other interest-earning assets rose due to the reclassification of our operations in Brazil to ‘Assets held for sale’ in June 2015. In Brazil, excluding the impact of currency translation, interest income rose due to growth in average term lending balances and financial investments, together with higher yields reflecting successive increases in central bank interest rates in 2014 and 2015.
Interest expense
Reported interest expense decreased by $1.6bn compared with 2014 driven by currency translation, primarily in Latin America and Europe.
Excluding this, interest expense fell driven by a lower cost of customer accounts, debt issued and repos.
Interest expense on customer accounts fell marginally despite growth in average balances. This reflected central bank rate reductions in a number of markets, notably Mexico, mainland China, Australia and India. Europe was affected by downward movements in market rates in the eurozone. This was partly offset by rising costs in North America, in line with promotional deposit offerings.
Interest expense on debt issued also fell, primarily in Europe as new debt was issued at lower prevailing rates and average outstanding balances fell as a result of net redemptions. Interest expense also fell on repos, notably in Europe, reflecting the managed reduction in average balances.
HSBC HOLDINGS PLC
52
Table of Contents
Interest expense on other interest-bearing liabilities increased due to the reclassification of our operations in Brazil. In Brazil, excluding currency translation, interest expense rose, primarily on debt securities in issue and also
on customer accounts driven by successive increases in central bank rates. Other interest expense also increased in North America, as 2014 benefited from the release of accrued interest associated with uncertain tax positions.
| 2015 $m | 2014 $m | 2013 $m | ||||||||||||||||
Account services | 2,745 | 3,407 | 3,581 | |||||||||||||||
Funds under management | 2,570 | 2,658 | 2,673 | |||||||||||||||
Cards | 2,281 | 2,460 | 2,455 | |||||||||||||||
Credit facilities | 1,919 | 1,890 | 1,907 | |||||||||||||||
Broking income | 1,441 | 1,371 | 1,388 | |||||||||||||||
Unit trusts | 1,007 | 1,005 | 891 | |||||||||||||||
Imports/exports | 971 | 1,115 | 1,157 | |||||||||||||||
Remittances | 772 | 833 | 849 | |||||||||||||||
Underwriting | 762 | 872 | 866 | |||||||||||||||
Global custody | 721 | 726 | 698 | |||||||||||||||
Insurance agency commission | 519 | 516 | 551 | |||||||||||||||
Other | 2,308 | 2,692 | 2,957 | |||||||||||||||
Fee income | 18,016 | 19,545 | 19,973 | |||||||||||||||
Less: fee expense | (3,311 | ) | (3,588 | ) | (3,539 | ) | ||||||||||||
Year ended 31 December | 14,705 | 15,957 | 16,434 | |||||||||||||||
Reported net fee income fell by $1.3bn compared with 2014, primarily reflecting the adverse effects of currency translation
between the years of $1.2bn, notably in Europe and Latin America, as tabulated below.
Significant items and currency translation
2015 $m | 2014 $m | |||||||||||
Significant items | ||||||||||||
Acquisitions, disposals and dilutions | – | 10 | ||||||||||
Currency translation | 1,204 | |||||||||||
Year ended 31 December | – | 1,214 | ||||||||||
On an adjusted basis, net fee income decreased by $38m. This reflected a reduction in Europe, primarily within RBWM and GB&M, largely offset by increases in Asia in RBWM and North America in GB&M.
Account services fee income fell significantly by $348m, mainly in the UK in RBWM where lower overdraft fees reflected re-pricing and fewer overdrawn balances following the introduction in November 2014 of a text-alert service for customers. Account services fees also fell in Switzerland due to the continuing repositioning of our GPB business.
Import and export fees fell too (by $79m), mainly in Asia reflecting a reduction in trade activity. In addition, our underwriting fee income fell by $65m, mainly in Hong Kong in GB&M, where there was reduced activity in equity capital markets, although this was partly offset by higher debt issuances in the US.
By contrast, our credit facilities fee income grew strongly (by $190m) in North America and, to a lesser extent, in Asia, reflecting continued growth in average lending
balances, although balances were broadly unchanged in Asia in the second half of the year.
Our fee income from broking and unit trusts also grew (up by $182m), mainly in Hong Kong, driven by higher sales of equities and mutual funds in RBWM. This was from increased stock market turnover, in part facilitated by the Shanghai-Hong Kong Stock Connect platform and greater investor appetite following improvements in Asian equity markets in the first half of the year, however there was weaker investor sentiment in the second half of the year.
Fees from funds under management increased by $157m. In our Global Asset Management business, this was notably in France and the US due to volume growth from fixed income products. In addition, fee income from funds under management also increased in Germany from growth in Securities Services in GB&M, and in Hong Kong from increased funds under management in GPB.
Fee expenses were marginally higher by $101m due to a rise in brokerage fees, notably in Germany.
HSBC HOLDINGS PLC
53
Table of Contents
Report of the Directors: Financial summary(continued)
Group performance by income and expense item
2015 $m | 2014 $m | 2013 $m | ||||||||||||||||
Trading activities | 7,285 | 5,419 | 6,921 | |||||||||||||||
Ping An contingent forward sale contract | – | – | (682 | ) | ||||||||||||||
Net interest income on trading activities | 1,775 | 1,907 | 2,047 | |||||||||||||||
Gain/(loss) on termination of hedges | (11 | ) | 1 | (194 | ) | |||||||||||||
Other trading income – hedge ineffectiveness: | ||||||||||||||||||
– on cash flow hedges | 15 | 34 | 22 | |||||||||||||||
– on fair value hedges | (11 | ) | 19 | 65 | ||||||||||||||
Fair value movement on non-qualifying hedges14 | (330 | ) | (620 | ) | 511 | |||||||||||||
Year ended 31 December | 8,723 | 6,760 | 8,690 | |||||||||||||||
For footnote, see page 99.
Reported net trading income of $8.7bn was $2.0bn higher than in 2014, predominantly in Europe. The movement in net trading income in part reflected the favourable
significant items and currency translation summarised in the table below.
Significant items and currency translation
2015 $m | 2014 $m | |||||||||||
Significant items | ||||||||||||
Included within trading activities: | 230 | (332 | ) | |||||||||
– favourable/(adverse) debit valuation adjustment on derivative contracts | 230 | (332 | ) | |||||||||
Included in other net trading income: | (327 | ) | (539 | ) | ||||||||
– fair value movement on non-qualifying hedges | (327 | ) | (541 | ) | ||||||||
– acquisitions, disposals and dilutions | – | 2 | ||||||||||
| (97 | ) | (871 | ) | |||||||||
Currency translation | 520 | |||||||||||
Year ended 31 December | (97 | ) | (351 | ) | ||||||||
On an adjusted basis, net trading income from trading activities increased by $1.7bn compared with 2014, driven by our client-facing GB&M businesses, notably Equities, Foreign Exchange and Credit. This was primarily in the UK following an increase in volatility and client activity.
Net trading income from trading activities also rose due to a number of other valuation movements. In 2014, we revised our estimation methodology for valuing
uncollateralised derivative portfolios by introducing the funding fair value adjustment (‘FFVA’) which resulted in a charge of $263m. In addition, the Equities and Rates businesses benefited from favourable movements on own credit spreads compared with minimal movements in 2014.
These movements contributed to an increase in net trading income from trading activities in Rates, although client activity remained subdued.
Net income from financial instruments designated at fair value
2015 $m | 2014 $m | 2013 $m | ||||||||||||||||
Net income/(expense) arising from: | ||||||||||||||||||
– financial assets held to meet liabilities under insurance and investment contracts | 531 | 2,300 | 3,170 | |||||||||||||||
– liabilities to customers under investment contracts | 34 | (435 | ) | (1,237 | ) | |||||||||||||
– HSBC’s long-term debt issued and related derivatives | 863 | 508 | (1,228 | ) | ||||||||||||||
– change in own credit spread on long-term debt (significant item) | 1,002 | 417 | (1,246 | ) | ||||||||||||||
– other changes in fair value | (139 | ) | 91 | 18 | ||||||||||||||
– other instruments designated at fair value and related derivatives | 104 | 100 | 63 | |||||||||||||||
Year ended 31 December | 1,532 | 2,473 | 768 | |||||||||||||||
Assets and liabilities from which net income from financial instruments designated at fair value arose
2015 $m | 2014 $m | 2013 $m | ||||||||||||||||
Financial assets designated at fair value at 31 December | 23,852 | 29,037 | 38,430 | |||||||||||||||
Financial liabilities designated at fair value at 31 December | 66,408 | 76,153 | 89,084 | |||||||||||||||
Including: | ||||||||||||||||||
Financial assets held to meet liabilities under: | ||||||||||||||||||
– insurance and investment contracts with DPF | 11,119 | 10,650 | 10,717 | |||||||||||||||
– unit-linked insurance and other insurance and investment contracts | 11,153 | 16,333 | 25,423 | |||||||||||||||
Long-term debt issues designated at fair value | 60,188 | 69,681 | 75,278 | |||||||||||||||
HSBC HOLDINGS PLC
54
Table of Contents
The majority of the financial liabilities designated at fair value are fixed-rate long-term debt issuances and are managed in conjunction with interest rate swaps as part of our interest rate management strategy.
Reported net income from financial instruments designated at fair value was $1.5bn in 2015, compared with $2.5bn in 2014. The former included favourable movements in the fair value of our own long-term debt of $1.0bn due to changes in credit spread, compared with favourable movements of $417m in 2014.
Significant items and currency translation
2015 $m | 2014 $m | |||||||||||
Significant items | ||||||||||||
Own credit spread | 1,002 | 417 | ||||||||||
Currency translation | 303 | |||||||||||
Year ended 31 December | 1,002 | 720 | ||||||||||
On an adjusted basis, which excludes changes in our own credit spread and the net adverse effect of currency translation shown above, net income from financial instruments at fair value decreased by $1.2bn.
Net income from financial assets held to meet liabilities under insurance and investment contracts of $531m was $1.8bn lower than in 2014. This was primarily driven by weaker equity markets in Hong Kong and the UK, notably in the second half of the year. The fair value movement in
2015 included gains in Brazil and France, partly offset by losses in Hong Kong. These gains and losses are broadly offset by ‘Net insurance claims and benefits paid and movements in liabilities to policyholders’ and ‘Liabilities to customers under investment contracts’.
Other changes in fair value reflected a net adverse movement due to interest and exchange rate hedging ineffectiveness.
Gains less losses from financial investments
2015 $m | 2014 $m | 2013 $m | ||||||||||||||||
Net gains/(losses) from disposal of: | ||||||||||||||||||
– debt securities | 345 | 665 | 491 | |||||||||||||||
– equity securities | 1,829 | 1,037 | 1,697 | |||||||||||||||
– other financial investments | 5 | 6 | (1 | ) | ||||||||||||||
| 2,179 | 1,708 | 2,187 | ||||||||||||||||
Impairment of available-for-sale equity securities | (111 | ) | (373 | ) | (175 | ) | ||||||||||||
Year ended 31 December | 2,068 | 1,335 | 2,012 | |||||||||||||||
In 2015, gains less losses from financial investments increased by $733m on a reported basis compared with 2014. This was driven by the significant items and currency
translation tabulated below, notably the gain on the partial sale of our shareholding in Industrial Bank Co. Ltd (‘Industrial Bank’) of $1.4bn.
Significant items and currency translation
2015 $m | 2014 $m | |||||||||||
Significant items | ||||||||||||
Gain on sale of shareholding in Bank of Shanghai | – | 428 | ||||||||||
Gain on the partial sale of shareholding in Industrial Bank | 1,372 | – | ||||||||||
Impairment of our investment in Industrial Bank | – | (271 | ) | |||||||||
| 1,372 | 157 | |||||||||||
Currency translation | 95 | |||||||||||
Year ended 31 December | 1,372 | 252 | ||||||||||
On an adjusted basis, excluding all significant items and currency translation tabulated above, gains less losses from financial investments decreased by $387m. This was primarily in our GB&M business, driven by lower gains on disposals of available-for-sale debt securities, notably in the UK and US and lower gains on equity securities in Principal Investments in the UK.
In addition, we recorded minor losses on disposals from our legacy credit portfolio compared with gains in 2014. The disposal of these assets reflects our continued efforts to manage down low-returning assets to maximise returns.
HSBC HOLDINGS PLC
55
Table of Contents
Report of the Directors: Financial summary(continued)
Group performance by income and expense item
2015 $m | 2014 $m | 2013 $m | ||||||||||||||||
Gross insurance premium income | 11,012 | 12,370 | 12,398 | |||||||||||||||
Reinsurance premiums | (657 | ) | (449 | ) | (458 | ) | ||||||||||||
Year ended 31 December | 10,355 | 11,921 | 11,940 | |||||||||||||||
Reported net insurance premium income was $1.6bn lower, largely from the adverse effects of currency translation of $930m.
Significant items and currency translation
2015 $m | 2014 $m | |||||||||||
Significant items | – | – | ||||||||||
Currency translation | 930 | |||||||||||
Year ended 31 December | – | 930 | ||||||||||
On an adjusted basis, excluding the effect of currency translation, net insurance premium income fell by $636m or 6%, driven by Asia, primarily in Hong Kong where it declined because of lower unit-linked contract premiums and new reinsurance agreements.
In Europe, premium income fell mainly in the UK, reflecting a decision to exit the commercial pensions market in 2014.
2015 $m | 2014 $m | 2013 $m | ||||||||||||||||
Rent received | 171 | 162 | 155 | |||||||||||||||
Gains/(losses) recognised on assets held for sale | (244 | ) | 220 | (729 | ) | |||||||||||||
Gains on investment properties | 61 | 120 | 113 | |||||||||||||||
Gain on disposal of property, plant and equipment, intangible assets and non-financial investments | 53 | 32 | 178 | |||||||||||||||
Gains/(losses) arising from dilution of interest in Industrial Bank and other associates and joint ventures | – | (32 | ) | 1,051 | ||||||||||||||
Gain on disposal of HSBC Bank (Panama) S.A. | – | – | 1,107 | |||||||||||||||
Change in present value of in-force long-term insurance business | 799 | 261 | 525 | |||||||||||||||
Other | 215 | 368 | 232 | |||||||||||||||
Year ended 31 December | 1,055 | 1,131 | 2,632 | |||||||||||||||
Change in present value of in-force long-term insurance business
2015 $m | 2014 $m | 2013 $m | ||||||||||||||||
Value of new business | 809 | 870 | 924 | |||||||||||||||
Expected return | (552 | ) | (545 | ) | (505 | ) | ||||||||||||
Assumption changes and experience variances | 504 | (116 | ) | 88 | ||||||||||||||
Other adjustments | 38 | 52 | 18 | |||||||||||||||
Year ended 31 December | 799 | 261 | 525 | |||||||||||||||
Reported other operating income decreased by $76m from 2014. This was partly due to the significant items recorded in the table below.
Significant items and currency translation
2015 $m | 2014 $m | |||||||||||
Significant items | ||||||||||||
Included within gains/(losses) recognised on assets held for sale: | (232 | ) | 168 | |||||||||
– disposal costs of our Brazilian operation | (18 | ) | – | |||||||||
– gain/(loss) on sale of several tranches of real estate secured accounts in the US | (214 | ) | 168 | |||||||||
Included within the remaining line items: | – | (41 | ) | |||||||||
– acquisitions, disposals and dilutions | – | (41 | ) | |||||||||
Currency translation | (64 | ) | ||||||||||
Year ended 31 December | (232 | ) | 63 | |||||||||
HSBC HOLDINGS PLC
56
Table of Contents
Excluding the significant items and currency translation tabulated above, other operating income increased by $219m compared with 2014. This was primarily from higher favourable movements in present value of in-force (‘PVIF’) long-term insurance business, partly offset by lower
disposal and revaluation gains on investment properties, mainly in Asia.
The higher favourable movement in the PVIF balance was driven by changes in interest rates and investment return assumptions, notably in France and Hong Kong.
Net insurance claims and benefits paid and movement in liabilities to policyholders
2015 $m | 2014 $m | 2013 $m | ||||||||||||||||
Net insurance claims and benefits paid and movement in liabilities to policyholders: | ||||||||||||||||||
– gross | 11,872 | 13,723 | 13,948 | |||||||||||||||
– less reinsurers’ share | (580 | ) | (378 | ) | (256 | ) | ||||||||||||
Year ended 31 December15 | 11,292 | 13,345 | 13,692 | |||||||||||||||
For footnote, see page 99.
Reported net insurance claims and benefits paid and movement in liabilities to policyholders were $2.1bn lower
than in 2014, in part reflecting the effect of currency translation of $1.1bn.
Significant items and currency translation
2015 $m | 2014 $m | |||||||||||
Significant items | – | – | ||||||||||
Currency translation | 1,109 | |||||||||||
Year ended 31 December | – | 1,109 | ||||||||||
Excluding the effects of currency translation, net insurance claims and benefits paid and movements in liabilities to policyholders were $0.9bn lower.
This was primarily driven by a decrease in returns on financial assets supporting liabilities to policyholders, where the policyholder shares in the investment risk. This decrease in returns reflected a weaker equity market performance in Hong Kong in the second half of the year.
The gains or losses recognised on the financial assets designated at fair value that are held to support these insurance contract liabilities are reported in ‘Net income from financial instruments designated at fair value’.
In addition, movements in liabilities to policyholders were lower due to a decrease in premiums written in Asia, as explained in ‘Net earned insurance premiums’.
Loan impairment charges and other credit risk provisions
2015 $m | 2014 $m | 2013 $m | ||||||||||||||||
Loan impairment charges: | ||||||||||||||||||
– new allowances net of allowance releases | 4,400 | 5,010 | 7,344 | |||||||||||||||
– recoveries of amounts previously written off | (808 | ) | (955 | ) | (1,296 | ) | ||||||||||||
| 3,592 | 4,055 | 6,048 | ||||||||||||||||
Individually assessed allowances | 1,505 | 1,780 | 2,320 | |||||||||||||||
Collectively assessed allowances | 2,087 | 2,275 | 3,728 | |||||||||||||||
Releases of impairment on available-for-sale debt securities | (17 | ) | (319 | ) | (211 | ) | ||||||||||||
Other credit risk provisions | 146 | 115 | 12 | |||||||||||||||
Year ended 31 December | 3,721 | 3,851 | 5,849 | |||||||||||||||
Impairment charges on loans and advances to customers as a percentage of average gross loans and advances to customers | 0.39% | 0.43% | 0.67% | |||||||||||||||
Reported loan impairment charges and other credit risk provisions (‘LICs’) of $3.7bn were $0.1bn lower than in 2014, primarily due to favourable currency translation of $683m.
Excluding the effects of currency translation, LICs were $0.6bn higher than in 2014.
Significant items and currency translation
2015 $m | 2014 $m | |||||||||||
Significant items | – | – | ||||||||||
Currency translation | 683 | |||||||||||
Year ended 31 December | – | 683 | ||||||||||
HSBC HOLDINGS PLC
57
Table of Contents
Report of the Directors: Financial summary(continued)
Group performance by income and expense item
In the fourth quarter of 2015, our LICs increased compared with the third quarter following a rise in individually assessed LICs in a small number of countries. This was reflective of specific circumstances associated with those countries with no common underlying theme. In addition, we increased our collectively assessed LICs on exposures related to the oil and gas industry by $0.2bn, notably in North America, Middle East and North Africa, and Asia. For more information on our exposure to the oil and gas sector, see page 117.
The following paragraphs set out in more detail the factors that have contributed to movements in our collectively and individually assessed LICs compared with 2014.
On an adjusted basis,collectively assessed LICs rose by $221m, mainly in Middle East and North Africa, North America and Asia, partly offset in Europe. It arose from the following:
| • | in Middle East and North Africa (up by $167m), this was mainly in the UAE in RBWM, where we increased the impairment allowances on our mortgage book following a review of the quality and value of collateral. In addition, LICs grew in our CMB business, notably relating to the oil and foodstuffs industries; |
| • | in North America (up by $132m) and Asia (up by $108m), this reflected an increase in allowances against our oil and gas exposures. In our US CML portfolio, LICs were higher than in 2014 reflecting lower favourable market value adjustments of underlying properties as improvements in the housing market conditions were less pronounced in 2015. This was partly offset by a fall in LICs from lower levels of newly impaired loans and |
reduced lending balances from continued run-off and sales. Additionally, collectively assessed LICs rose in Indonesia following credit deterioration; and |
| • | in Europe, collectively assessed LICs were $192m lower, most notably in our GB&M business in the UK, as 2014 included additional impairment charges from revisions to certain estimates used in our corporate collective loan impairment calculation. |
Individually assessed LICs were broadly unchanged from 2014 on an adjusted basis. This reflected decreases in Latin America, Europe and Asia which were offset by increases in Middle East and North Africa and in North America. This included the following:
| • | in Latin America (down by $95m), Europe (down by $44m) and Asia (down by $44m), we saw reductions in individually assessed LICs in our GB&M business as 2014 included significant impairment charges related to corporate clients in our respective regions. In Asia, the reduction was partly offset by an increase in LICs against a small number of CMB customers in Indonesia; and |
| • | in Middle East and North Africa (up by $134m) and North America (up by $47m), individually assessed LICs increased in our CMB business. In the former, this primarily related to higher LICs on food wholesalers, while in North America LICs rose in the oil and gas sector. |
In 2015, there were lower net releases of credit risk provisions than in 2014, down by $0.3bn, mainly on available-for-sale asset-backed securities (‘ABS’s) in our UK GB&M business.
In addition to detailing operating expense items by category, as set out in the table below, we also categorise adjusted expenses as follows:
• ‘run-the-bank’ costs comprise business-as-usual running costs that keep operations functioning at the required quality and standard year-on-year, maintain IT infrastructure and support revenue growth. Run-the-bank costs are split between front office and back office, reflecting the way the Group is organised into four global businesses (‘front office’) supported by global functions (‘back office’);
• ‘change-the-bank’ costs comprise expenses relating to the implementation of mandatory regulatory changes and other | investment costs incurred relating to projects to change business-as-usual activity to enhance future operating capabilities;
• ‘costs-to-achieve’ comprise those specific costs relating to the achievement of the strategic actions set out in the Investor Update in June 2015. They comprise costs incurred between 1 July 2015 and 31 December 2017 and do not include ongoing initiatives such as Global Standards. Any costs arising within this category have been incurred as part of a significant transformation programme. Costs-to-achieve are included within significant items and incorporate restructuring costs which were identified as a separate significant item prior to 1 July 2015; and
• the UK bank levy is reported as a separate category. |
Operating expenses
| 2015 | 2014 | 2013 | ||||||||||||||||
| $m | $m | $m | ||||||||||||||||
By expense category | ||||||||||||||||||
Employee compensation and benefits | 19,900 | 20,366 | 19,196 | |||||||||||||||
Premises and equipment (excluding depreciation and impairment) | 3,830 | 4,204 | 4,183 | |||||||||||||||
General and administrative expenses | 13,832 | 14,361 | 12,882 | |||||||||||||||
Administrative expenses | 37,562 | 38,931 | 36,261 | |||||||||||||||
Depreciation and impairment of property, plant and equipment | 1,269 | 1,382 | 1,364 | |||||||||||||||
Amortisation and impairment of intangible assets | 937 | 936 | 931 | |||||||||||||||
Year ended 31 December | 39,768 | 41,249 | 38,556 | |||||||||||||||
HSBC HOLDINGS PLC
58
Table of Contents
| 2015 | 2014 | |||||||||||
| $m | $m | |||||||||||
By expense group | ||||||||||||
Run-the-bank – front office | 15,482 | 14,879 | ||||||||||
Run-the-bank – back office | 15,784 | 15,631 | ||||||||||
Change-the-bank | 3,494 | 3,002 | ||||||||||
Bank levy | 1,421 | 1,063 | ||||||||||
Significant items | 3,586 | 3,396 | ||||||||||
Currency translation | – | 3,278 | ||||||||||
Year ended 31 December | 39,768 | 41,249 | ||||||||||
Reported operating expenses for 2015 of $39.8bn were $1.5bn or 4% lower than in 2014. The reduction in reported expenses was driven by the favourable effects of currency translation between the years. Significant items increased by $0.2bn, with a reduction in fines, penalties, redress and associated provisions of $0.7bn, more than offset by transformation costs (costs-to-achieve) of $0.9bn.
Costs-to-achieve, which relate to specific programmes
aimed at achieving the cost reduction and productivity outcomes outlined in the Investor Update, comprise:
| • | severance costs of $0.4bn across a number of areas including CMB ($147m), RBWM ($49m), Risk ($44m) and GB&M ($45m); |
| • | staff costs for the transformation programme in progress of $0.1bn in the second half of 2015; and |
| • | other costs of $0.4bn, including software write-offs, US portfolio run-off costs and consultancy costs. |
Significant items and currency translation
| 2015 | 2014 | |||||||||||
| $m | $m | |||||||||||
Significant items | ||||||||||||
Disposal costs of our Brazilian operations | 110 | – | ||||||||||
Charge in relation to settlement agreement with Federal Housing Finance Authority | – | 550 | ||||||||||
Costs-to-achieve | 908 | – | ||||||||||
Cost to establish UK ring-fenced bank | 89 | – | ||||||||||
Regulatory provisions in GPB | 172 | 65 | ||||||||||
Restructuring and other related costs | 117 | 278 | ||||||||||
Settlements and provisions in connection with legal matters | 1,649 | 1,187 | ||||||||||
UK customer redress programmes | 541 | 1,275 | ||||||||||
Acquisitions, disposals and dilutions | – | 40 | ||||||||||
| 3,586 | 3,395 | |||||||||||
Currency translation | 3,278 | |||||||||||
Year ended 31 December | 3,586 | 6,673 | ||||||||||
On an adjusted basis, operating expenses of $36.2bn were $1.6bn or 5% higher than in 2014, reflecting increases in both run-the-bank and change-the-bank costs.
Run-the-bank costs totalled $31.3bn for 2015, an increase of $0.8bn or 2% on 2014. This was primarily driven by targeted investment in Latin America, Asia and Europe. We recruited new staff to support growth in targeted areas as follows:
| • | in GB&M we invested in Payments and Cash Management (‘PCM’) mainly in Europe; |
| • | in CMB, we invested in PCM revenue-generating full time equivalent staff (‘FTEs’) in North America and Asia; and |
| • | in RBWM, we invested in additional FTEs in Asia in our branch network to support revenue growth. |
Our total expenditure on regulatory programmes and compliance in 2015, including both run-the-bank andchange-the-bank elements, was $2.9bn, up by $0.7bn or 33% from 2014.
Run-the-bank costs associated with regulatory programmes and compliance increased by $0.2bn reflecting the continued implementation of our Global Standards programme to enhance our financial crime risk controls and capabilities, and to meet our external commitments.
Change-the-bank costs totalled $3.5bn in 2015, an increase of $0.5bn or 16% on 2014, primarily driven by regulatory programmes and compliance costs. This reflected investment in strategic IT infrastructure including systems enhancements for customer due diligence, transaction monitoring and sanctions screening as part of the Global Standards programme. These actions were in line with our strategic target to complete the implementation of Global Standards in 2017. There was also further investment in stress testing and other programmes to meet legal and regulatory requirements.
The bank levy totalled $1.4bn, up by $0.4bn or 34% from 2014. Excluding the bank levy, operating expenses in the second half of 2015 were broadly in line with the first half of the year. Investment in regulatory programmes and compliance and inflationary pressures were offset by cost saving initiatives mainly driven by reduced staff costs. This reflected a reduction in FTEs of 4,585 from 30 June 2015 to 31 December 2015. In addition we reduced travel and entertainment costs through a strong focus on cost management.
Excluding investment in regulatory programmes and compliance, and the bank levy, adjusted operating expenses grew by 2% compared with 2014.
HSBC HOLDINGS PLC
59
Table of Contents
Report of the Directors: Financial summary(continued)
Group performance by income and expense item / Consolidated balance sheet
Staff numbers (full-time equivalents)
| 2015 | 2014 | 2013 | ||||||||||||||||
Geographical regions | ||||||||||||||||||
Europe | 67,509 | 69,363 | 68,334 | |||||||||||||||
Asia | 120,144 | 118,322 | 113,701 | |||||||||||||||
Middle East and North Africa | 8,066 | 8,305 | 8,618 | |||||||||||||||
North America | 19,656 | 20,412 | 20,871 | |||||||||||||||
Latin America | 39,828 | 41,201 | 42,542 | |||||||||||||||
At 31 December | 255,203 | 257,603 | 254,066 | |||||||||||||||
The number of employees, expressed in FTEs, at 31 December 2015 was 255,203, a decrease of 4,585 from 30 June 2015 reflecting the initial impact of cost saving initiatives. Compared with 31 December 2014, FTEs decreased by 2,400. This was driven by reductions in global businesses and global functions, offset by an increase in compliance of 2,419 FTEs.
The average number of FTEs adjusted for business disposals increased by 1.2% compared with 2014 due to additional FTE requirements for regulatory programmes and compliance, and investment in growth areas.
Reported cost efficiency ratios16
2015 % | 2014 % | 2013 % | ||||||||||||||||
HSBC | 66.5 | 67.3 | 59.6 | |||||||||||||||
Geographical regions | ||||||||||||||||||
Europe | 93.7 | 93.7 | 84.0 | |||||||||||||||
Asia | 43.0 | 44.0 | 40.7 | |||||||||||||||
Middle East and North Africa | 48.1 | 47.7 | 51.5 | |||||||||||||||
North America | 84.9 | 78.9 | 72.9 | |||||||||||||||
Latin America | 72.6 | 71.7 | 56.1 | |||||||||||||||
Global businesses | ||||||||||||||||||
Retail Banking and Wealth Management | 72.4 | 71.7 | 64.7 | |||||||||||||||
Commercial Banking | 45.4 | 44.3 | 41.7 | |||||||||||||||
Global Banking and Markets | 59.4 | 67.7 | 51.9 | |||||||||||||||
Global Private Banking | 84.3 | 74.8 | 91.4 | |||||||||||||||
For footnote, see page 99.
Share of profit in associates and joint ventures
2015 $m | 2014 $m | 2013 $m | ||||||||||||||||
Associates | ||||||||||||||||||
Bank of Communications Co., Limited | 2,011 | 1,974 | 1,878 | |||||||||||||||
The Saudi British Bank | 462 | 455 | 403 | |||||||||||||||
Other | 45 | 64 | 5 | |||||||||||||||
Share of profit in associates | 2,518 | 2,493 | 2,286 | |||||||||||||||
Share of profit in joint ventures | 38 | 39 | 39 | |||||||||||||||
Year ended 31 December | 2,556 | 2,532 | 2,325 | |||||||||||||||
Our reported share of profit in associates and joint ventures was $2.6bn, an increase of $24m or 1%, driven by higher contributions from Bank of Communications Co., Limited (‘BoCom’) and The Saudi British Bank.
Our share of profit from BoCom rose as a result of balance sheet growth, partly offset by higher operating expenses.
Profits from The Saudi British Bank also rose, by $7m, reflecting strong balance sheet growth.
2015 $m | 2014 $m | 2013 $m | ||||||||||||||||
Profit before tax | 18,867 | 18,680 | 22,565 | |||||||||||||||
Tax expense | (3,771 | ) | (3,975 | ) | (4,765 | ) | ||||||||||||
Profit after tax for the year ended 31 December | 15,096 | 14,705 | 17,800 | |||||||||||||||
Effective tax rate | 20.0% | 21.3% | 21.1% | |||||||||||||||
The effective tax rate for the year was 20.0% (2014: 21.3%) and was in line with expectations.
We expect the effective rate of tax to increase due to the introduction of the 8% surcharge on UK banking profits in 2016.
HSBC HOLDINGS PLC
60
Table of Contents
Report of the Directors: Financial summary(continued)
Net interest income
Reported net interest income of $35bn decreased by $834m or 2% compared with 2013. This included the significant items and currency translation summarised in the table below.
Significant items and currency translation
2014 $m | 2013 $m | |||||||||||
Significant items | ||||||||||||
Provisions arising from the ongoing review of compliance with the Consumer Credit Act in the UK | (632 | ) | – | |||||||||
Acquisitions, disposals and dilutions | 38 | 386 | ||||||||||
| (594 | ) | 386 | ||||||||||
Currency translation | 518 | |||||||||||
Year ended 31 December | (594 | ) | 904 | |||||||||
On a reported basis, net interest spread and margin both fell, reflecting lower yields on customer lending in North America and Europe. In North America, this was due to changes in the composition of the lending portfolios towards lower yielding secured assets and to the run-off of the CML portfolio. In Europe, it was principally due to a significant item, namely provisions arising from the ongoing review of compliance with the Consumer Credit Act (‘CCA’) in the UK. These factors were partially offset by a lower cost of funds.
Excluding the significant items and currency translation tabulated above, net interest income rose by $664m or 2% from 2013, driven by increases in Asia, partly reflecting growth in customer lending volumes.
Interest income
Reported interest income was broadly unchanged, as decreases in interest income from customer lending (which included the effect of the CCA provisions) were offset by increases in income from short-term funds, as well as a rise due to the change in the management of reverse repo transactions (see page 60b).
Interest income on loans and advances to customers decreased, principally in North America and Latin America, partially offset by increases in Asia. In North America, this was a consequence of the disposal of the higher yielding non-real estate loan portfolio and the reduction in the CML portfolio from run-off and sales. In addition, new lending to customers in RBWM and CMB was at lower yields, reflecting a shift in the portfolio towards higher levels of lower yielding first lien real estate secured loans. In Latin America, interest income on customer lending also decreased, reflecting a fall in yields in both Brazil and Mexico, despite the rise in average balances in term lending in both countries. In Brazil, the falling yield reflected the shift in product and client mix to more secured, relationship-led lending while, in Mexico, it was driven by reductions in Central Bank interest rates. The region was also affected by the disposal of non-strategic businesses.
By contrast, we recorded increased interest income on customer lending in Asia, driven by growth in term lending volumes and, to a lesser extent, residential
mortgages during the year. This increase in balances was partially offset by compressed yields. In Europe, excluding the effect of the CCA provisions noted above, interest income on customer lending rose due to increases in mortgage and term lending balances.
Interest income on short-term funds and financial investments increased both in Latin America and Asia, as interest rates rose in certain countries in these regions (notably in Brazil, Argentina and mainland China) and average balances grew. However, in Europe, interest income on short-term funds and financial investments fell as maturing positions were replaced by longer-term but lower-yielding bonds.
Interest expense
Reported interest expense increased in the year. We recorded increased interest expense on customer accounts in Asia and Latin America, partly offset by a reduction in North America. In Asia, the growth was principally from an increase in the average balances of customer accounts. In Latin America, interest expense on customer accounts rose as reductions in average balances were more than offset by the increase in the cost of funds due to interest rate rises, notably in Brazil. However, the effects of this were partly offset by a fall in the cost of funds in Mexico as Central Bank rates fell, and the disposal of non-strategic businesses. Conversely, in North America, interest expense on customer deposits declined as a result of a strategic decision to re-price deposits downwards. In addition, other interest expense decreased due to a release of accrued interest associated with an uncertain tax position.
Interest expense on debt issued rose. We recorded an increase in the cost of funds which was partly offset by decreased overall balances. Interest expense rose in Latin America, notably in Brazil, in line with interest rate rises and increased medium-term loan note balances. By contrast, in North America the business disposals led to a decline in our funding requirements. The cost of funds also fell as higher coupon debt matured and was repaid. In Europe, interest expense on debt also decreased, as average outstanding balances fell as a result of net redemptions and the cost of funds reduced.
HSBC HOLDINGS PLC
60a
Table of Contents
Report of the Directors: Financial Review(continued)
Repos and reverse repos
During the final quarter of 2013, GB&M changed the way it managed reverse repurchase (‘reverse repo’) and repurchase (‘repo’) activities. This had the effect of reducing the net interest margin as average interest earning assets and interest bearing liabilities increased significantly. These reverse repo and repo agreements have a lower gross yield and cost of funds, respectively, than the remainder of our portfolio.
‘Net interest income’ includes the expense of internally funded trading assets, while related revenue is reported in ‘Net trading income’. The internal cost of funding these assets decreased, as average trading asset balances fell to a greater extent than trading liabilities. In reporting our global business results, this cost is included within ‘Net trading income’.
Net fee income
Reported net fee income fell by $477m, primarily in Latin America and North America. In Latin America, the decrease included the effect of currency translation and the continued repositioning and disposal of businesses, notably the sale of our Panama operations in 2013. In North America, net fee income was lower following the expiry of the Transition Servicing Agreements we entered into with the buyer of the Card and Retail Services (‘CRS’) business, and adverse adjustments to mortgage servicing rights valuations.
Net trading income
Account services fee income decreased, notably in Latin America and Europe. In Latin America, the fall was due to a reduction in customer numbers in Mexico, as we continued to reposition the business, and in Brazil, due to strong market competition. In Europe, account services fees were lower, primarily in Switzerland due to the repositioning of our GPB business, and in the UK, in part reflecting the implementation of the Retail Distribution Review in 2013.
By contrast, unit trust fees rose, primarily in Asia, due to increased sales of equity funds in Hong Kong.
Other fee income declined in North America due to the expiry of the Transition Servicing Agreements and in Latin America following the sale of our operations in Panama in 2013 and the continued repositioning of the business in Mexico.
In addition, fee expenses were higher due to adverse adjustments to mortgage servicing rights valuations in North America, reflecting mortgage interest rate decreases in 2014 which compared with increases in 2013.
Reported net trading income of $6.8bn was $1.9bn lower, predominantly in Europe. The reduction in net trading income was partly driven by the significant items summarised in the table below.
Significant items and currency translation
2014 $m | 2013 $m | |||||||||||
Significant items | ||||||||||||
Included within trading activities: | (332 | ) | 548 | |||||||||
– Debit valuation adjustment on derivative contracts | (332 | ) | 106 | |||||||||
– FX gains relating to sterling debt issued by HSBC Holdings | – | 442 | ||||||||||
Included in other net trading income: | (539 | ) | (346 | ) | ||||||||
– Ping An contingent forward sale contract51 | – | (682 | ) | |||||||||
– Loss on early termination of cash flow hedges in the US run-off portfolio | – | (199 | ) | |||||||||
– Fair value movement on non-qualifying hedges | (541 | ) | 511 | |||||||||
– Acquisitions, disposals and dilutions | 2 | 24 | ||||||||||
| (871 | ) | 202 | ||||||||||
Currency translation | (11 | ) | ||||||||||
Year ended 31 December | (871 | ) | 191 | |||||||||
For footnote, see page 100a.
Excluding the significant items and currency translation tabulated above, net trading income from trading activities decreased by $0.6bn, notably in Markets within GB&M. This was predominantly driven by our Foreign Exchange business, which was affected by lower volatility and reduced client flows. In Equities, revenue decreased, as 2013 benefited from higher revaluation gains which more than offset a rise in 2014 in revenue from increased client flows and higher derivatives income.
In 2014, we revised our estimation methodology for valuing uncollateralised derivative portfolios by introducing the funding fair value adjustment (‘FFVA’), resulting in a reduction in net trading income of $263m, primarily in Rates ($164m) and Credit ($97m). Excluding the FFVA, Credit was also affected by adverse movements
on credit spreads and a reduction in revenue in Legacy Credit. By contrast, Rates was affected by favourable market movements, notably in Asia, along with minimal fair value movements on our own credit spread on structured liabilities compared with adverse movements in 2013. These factors were partly offset by a fall in Rates in Europe.
Included within net trading income from trading activities, there were favourable foreign exchange movements on assets held as economic hedges of foreign currency debt designated at fair value, compared with adverse movements in 2013. These movements offset fair value movements on the foreign currency debt which are reported in ‘Net income/(expense) from financial instruments designated at fair value’.
HSBC HOLDINGS PLC
60b
Table of Contents
Report of the Directors: Financial Review(continued)
In addition, net interest income from trading activities fell due to lower average balances, notably relating to reverse repo and repo agreements, in line with the change in the way GB&M manages these agreements. The net interest income from these activities is now recorded in ‘Net interest income’.
Net income/(expense) from financial instruments designated at fair value
The accounting policies for the designation of financial instruments at fair value and the treatment of the associated income and expenses are described in Note 2 on the Financial Statements.
The majority of the financial liabilities designated at fair value are fixed-rate long-term debt issues, the interest rate profile of which has been changed to floating through swaps as part of a documented interest rate management strategy. The movement in fair value of these long-term debt issues and the related hedges includes the effect of our credit spread changes and any ineffectiveness in the economic relationship between the related swaps and own debt. The size and direction of the changes in the credit spread on our debt and ineffectiveness, which are recognised in the income statement, can be volatile from year to year, but do not alter the cash flows expected as part of the documented interest rate management strategy. As a consequence, fair value movements arising from changes in our own credit spread on long-term debt and other fair value movements on the debt and related derivatives are not regarded internally as part of managed performance and are therefore not allocated to global businesses, but are reported in ‘Other’. Credit spread movements on own debt designated at fair value are excluded from adjusted results, and related fair value movements are not included in the calculation of regulatory capital.
Reported net income from financial instruments designated at fair value was $2.5bn in 2014, compared with $768m in 2013. The former included favourable movements in the fair value of our own long-term debt of
$417m due to changes in credit spread, compared with adverse movements of $1.2bn in 2013. Excluding this significant item, net income from financial instruments designated at fair value increased by $42m.
Net income arising from financial assets held to meet liabilities under insurance and investment contracts of $2.3bn was $870m lower than in 2013. This was driven by weaker equity market performance in the UK and France, partly offset by improved equity market performance in Hong Kong and higher net income on the bonds portfolio in Brazil.
Investment gains or losses arising from equity markets result in a corresponding movement in liabilities to customers, reflecting the extent to which unit-linked policyholders, in particular, participate in the investment performance of the associated asset portfolio. Where these relate to assets held to back investment contracts, the corresponding movement in liabilities to customers is also recorded under ‘Net income/(expense) from financial instruments designated at fair value’. This is in contrast to gains or losses related to assets held to back insurance contracts or investment contracts with discretionary participation features (‘DPF’), where the corresponding movement in liabilities to customers is recorded under ‘Net insurance claims and benefits paid and movement in liabilities to policyholders’.
Other changes in fair value reflected a net favourable movement due to interest and exchange rate hedging ineffectiveness. This was partly offset by net adverse foreign exchange movements on foreign currency debt designated at fair value and issued as part of our overall funding strategy (offset from assets held as economic hedges in ‘Net trading income’).
Gains less losses from financial investments
Reported gains less losses from financial investments were $1.3bn, a decrease of $677m from 2013. The decrease primarily reflected the significant items summarised below.
Significant items and currency translation
2014 $m | 2013 $m | |||||||||||
Significant items | ||||||||||||
Gain on sale of shareholding in Bank of Shanghai | 428 | – | ||||||||||
Impairment on our investment in Industrial Bank | (271 | ) | – | |||||||||
Net gain on completion of Ping An disposal51 | – | 1,235 | ||||||||||
Acquisitions, disposals and dilutions | – | 5 | ||||||||||
| 157 | 1,240 | |||||||||||
Currency translation | (10 | ) | ||||||||||
Year ended 31 December | 157 | 1,230 | ||||||||||
For footnote, see page 100a.
Excluding the significant items and currency translation noted above, gains less losses from financial investments increased by $396m, primarily driven by higher net gains on the disposal of debt securities as we actively managed the Legacy Credit portfolio. In addition, we reported higher gains on sale of available-for-sale equity securities and lower impairments on available-for-sale equity securities
from improved market conditions and business performance of the underlying portfolio.
HSBC HOLDINGS PLC
60c
Table of Contents
Report of the Directors: Financial Review(continued)
Net insurance premium income
Reported net insurance premium income was broadly unchanged, with reductions in Europe and Latin America largely offset by higher premium income in Asia.
In Asia, premium income rose, primarily in Hong Kong, due to increased new business from deferred annuity, universal life and endowment contracts. This was partly offset by lower new business from unit-linked contracts.
In Europe, premium income decreased, mainly in the UK, reflecting lower sales following the withdrawal of external independent financial adviser distribution channels for
certain linked insurance contracts in the second half of 2013. This was partly offset by increases in France, mainly reflecting higher sales of investment contracts with DPF.
Net insurance premium income also fell in Latin America, primarily in Brazil, reflecting lower sales, in part due to changes in our distribution channel.
Other operating income
Reported other operating income of $1.1bn decreased by $1.5bn from 2013. This was largely due to the significant items summarised in the table below.
Significant items and currency translation
2014 $m | 2013 $m | |||||||||||
Significant items | ||||||||||||
Included within gains/(losses) recognised on assets held for sale: | 168 | (772 | ) | |||||||||
– write-off of allocated goodwill relating to the GPB Monaco business | – | (279 | ) | |||||||||
– loss on sale of the non-real estate portfolio in the US | – | (271 | ) | |||||||||
– gain/(loss) on sale of several tranches of real estate secured accounts in the US | 168 | (123 | ) | |||||||||
– Household Insurance Group Holding company’s disposal of its insurance manufacturing business52 | – | (99 | ) | |||||||||
Included within the remaining line items: | (41 | ) | 2,193 | |||||||||
– reclassification gain in respect of our holding in Industrial Bank Co., Limited following the issue of additional share capital to third parties52 | – | 1,089 | ||||||||||
– HSBC Latin America Holdings UK Limited’s disposal of HSBC Bank (Panama) S.A.53 | – | 1,107 | ||||||||||
– HSBC Insurance (Asia-Pacific) Holdings Limited’s disposal of its shareholding in Bao Viet Holdings52 | – | 104 | ||||||||||
– loss on sale of an HFC Bank UK secured loan portfolio | – | (146 | ) | |||||||||
– acquisitions, disposals and dilutions | (41 | ) | 39 | |||||||||
Currency translation | (18 | ) | ||||||||||
Year ended 31 December | 127 | 1,403 | ||||||||||
For footnotes, see page 100a.
Excluding the significant items and currency translation tabulated above, other operating income decreased by $0.2bn compared with 2013. This was primarily from lower favourable movements in 2014 in present value of in-force (‘PVIF’) long-term insurance business, and lower disposal and revaluation gains on investment properties, mainly in Hong Kong. The decrease was partly offset by gains reported in Legacy Credit in GB&M in the UK as we actively managed the portfolio.
Lower favourable movements in the PVIF long-term insurance business asset in 2014 were mainly due to the following factors:
| • | a reduction in the value of new business, mainly in Brazil, due to higher interest rates and lower volumes; and |
| • | adverse assumption changes and experience variances in 2014 compared with favourable movements in 2013. This was mainly driven by falling interest rates in France and adverse actuarial assumption updates in Hong Kong, partly offset by the favourable effects of interest rate fluctuations, mainly in Asia and Brazil. |
Net insurance claims and benefits paid and movement in liabilities to policyholders
Reported net insurance claims and benefits paid and movement in liabilities to policyholders were $347m lower than in 2013.
Movements in claims resulting from investment returns on the assets held to support policyholder contracts, where
the policyholder bears investment risk, decreased. This reflected weaker equity market performance in the UK and France, partly offset by improved equity market performance in Hong Kong and higher net income on the bonds portfolio in Brazil. The gains or losses recognised on the financial assets designated at fair value held to support these insurance and investment contract liabilities are reported in ‘Net income from financial instruments designated at fair value’.
Loan impairment charges and other credit risk provisions
Reductions in claims resulting from a decrease in new business written in Europe and Latin America were mostly offset by increases in Hong Kong as explained under ‘Net earned insurance premiums’.
Reported loan impairment charges and other credit risk provisions (‘LICs’) of $3.9bn were $2.0bn lower than in 2013, primarily in North America, Europe and Latin America. The percentage of impairment charges to average gross loans and advances fell to 0.4% at 31 December 2014 from 0.7% at 31 December 2013.
Individually assessed charges decreased by $540m, primarily in Europe, partly offset by an increase in Asia and the Middle East and North Africa. In Europe, they were lower, mainly in CMB in the UK, reflecting improved quality in the portfolio and the economic environment, as well as in GB&M. In Asia, the increase was on a small number of exposures in Hong Kong and in mainland China, primarily in CMB and GB&M, while in the Middle East and North Africa we recorded net charges compared with net releases in 2013, mainly due to lower releases on a particular UAE-related exposure in GB&M.
HSBC HOLDINGS PLC
60d
Table of Contents
Report of the Directors: Financial Review(continued)
Collectively assessed charges declined by $1.5bn, primarily due to decreases in North America and Latin America. In North America, the reduction was mainly in RBWM, reflecting reduced levels of delinquency and new impaired loans in the CML portfolio. A decrease in lending balances from continued portfolio run-off and loan sales was partly offset by an increase relating to less favourable market value adjustments of underlying properties as improvements in housing market conditions were less pronounced in 2014 than in 2013. In Latin America, the reduction in collectively assessed charges was driven by the adverse effect of changes to the impairment model and assumption revisions for restructured loan portfolios in Brazil which occurred in 2013, both in RBWM and CMB. Charges were also lower due to reduced Business Banking
provisions reflecting improved delinquency rates and the effect of the disposal of non-strategic businesses.
Net releases of credit risk provisions of $204m were broadly unchanged, as higher releases on available-for-sale ABSs in GB&M in Europe were offset by provisions in Latin America and North America. In Latin America, a provision was made in Brazil against a guarantee in GB&M. In North America we recorded provisions in Canada, compared with releases in 2013, and in the US reflecting a deterioration in the underlying asset values of a specific GB&M exposure.
Operating expenses
Reported operating expenses of $41bn were $2.7bn or 7% higher than in 2013. The increase in operating expenses was partly driven by the significant items noted in the table below, including settlements and provisions in connection with foreign exchange investigations, of which $809m was recorded in the fourth quarter of 2014 (see Note 40 on the Financial Statements for further details).
Significant items and currency translation
2014 $m | 2013 $m | |||||||||||
Significant items | ||||||||||||
Accounting gain arising from change in basis of delivering ill-health benefits in the UK | – | (430 | ) | |||||||||
Charge in relation to settlement agreement with Federal Housing Finance Authority | 550 | – | ||||||||||
Madoff-related litigation costs | – | 298 | ||||||||||
Settlements and provisions in connection with foreign exchange investigations | 1,187 | – | ||||||||||
Regulatory provisions in GPB | 65 | 352 | ||||||||||
UK customer redress programmes | 1,275 | 1,235 | ||||||||||
US customer remediation provision relating to CRS | – | 100 | ||||||||||
Restructuring and other related costs | 278 | 483 | ||||||||||
Acquisitions, disposals and dilutions | 40 | 488 | ||||||||||
| 3,395 | 2,526 | |||||||||||
Currency translation | 348 | |||||||||||
Year ended 31 December | 3,395 | 2,874 | ||||||||||
Excluding significant items and currency translation, operating expenses were $2.2bn or 6% higher than in 2013.
Regulatory Programmes and Compliance costs increased as a result of the continued focus on Global Standards and the broader regulatory reform programme being implemented by the industry to build the necessary infrastructure to meet today’s enhanced compliance standards, along with implementation costs to meet obligations such as stress tests in different jurisdictions and structural reform.
During 2014, we accelerated the deployment of Global Standards throughout the Group. Our global businesses and Compliance function have developed operating procedures to meet our new global AML and sanctions policies and these are now being implemented in every country, encompassing local requirements as necessary. During 2014, we invested in developing our financial crime compliance expertise and building strategic infrastructure solutions for customer due diligence, transaction monitoring and sanctions screening.
We continued to invest in strategic initiatives in support of organically growing our business, primarily in CMB in both Asia, in Business Banking and Global Trade and Receivables Finance and, to a lesser extent, in Europe. We also increased expenditure on marketing and advertising to
support revenue generating initiatives, primarily in RBWM’s core propositions of Premier and Advance and personal lending products.
The increase in costs also reflected:
| • | inflationary pressures, including wage inflation, primarily in Asia and Latin America; |
| • | the UK bank levy charge, which increased to $1.1bn in 2014 from $904m in 2013, mainly due to an increase in the rate of the levy. Both years also included adjustments relating to the previous year’s bank levy charge (2014: $45m favourable adjustment; 2013: $12m adverse adjustment); and |
| • | the Financial Services Compensation Scheme levy in the UK, as a result of the timing of the recognition. |
During 2014, we generated further sustainable savings of $1.3bn, primarily driven by re-engineering our back office processes, which in part offset the investments and inflation noted above.
The average number of FTEs was broadly unchanged as reductions through sustainable savings programmes were broadly offset by the initiatives related to Regulatory Programmes and Compliance and business growth.
HSBC HOLDINGS PLC
60e
Table of Contents
Report of the Directors: Financial Review(continued)
Share of profit in associates and joint ventures
HSBC’s reported share of profit in associates and joint ventures was $2.5bn, an increase of $207m or 9%, in part due to the non-recurrence of an impairment charge of $106m on our banking associate in Vietnam in 2013. Excluding this, our share of profit in associates and joint ventures increased, driven by higher contributions from BoCom and The Saudi British Bank.
Our share of profit from BoCom rose as a result of balance sheet growth and increased trading income, partly offset by higher operating expenses and a rise in loan impairment charges.
At 31 December 2014, we performed an impairment review of our investment in BoCom and concluded that it was not impaired, based on our value in use calculation (see Note 19 on the Financial Statements for further details).
In future periods, the value in use may increase or decrease depending on the effect of changes to model inputs. It is expected that the carrying amount will increase in 2015 due to retained profits earned by BoCom. At the point where the carrying amount exceeds the value in use, HSBC would continue to recognise its share of BoCom’s profit or loss, but the carrying amount would be reduced to equal
the value in use, with a corresponding reduction in income, unless the market value has increased to a level above the carrying amount.
Profits from The Saudi British Bank rose, reflecting strong balance sheet growth.
The effective tax rate for 2014 of 21.3% was lower than the blended UK corporation tax rate for the year of 21.5%.
Tax expense
The effective tax rate in the year reflected the following recurring benefits: tax exempt income from government bonds and equities held by a number of Group entities and recognition of the Group’s share of post-tax profits of associates and joint ventures within our pre-tax income. In addition, the effective tax rate reflected a current tax credit for prior periods. This was partly offset by non-tax deductible settlements and provisions in connection with foreign exchange investigations.
The tax expense decreased by $0.8bn to $4.0bn for 2014, primarily due to a reduction in accounting profits and the benefit of the current tax credit for previous years.
In 2014, the tax borne and paid by the Group to the relevant tax authorities, including tax on profits, bank levy and employer-related taxes, was $7.9bn (2013: $8.6bn). The amount differs from the tax charge reported in the income statement due to indirect taxes such as VAT and the bank levy which are included inpre-tax profit, and the timing of payments.
We also play a major role as tax collector for governments in the jurisdictions in which we operate. Such taxes include employee-related taxes and taxes withheld from payments to deposit holders. In 2014, we collected $9.1bn (2013: $8.8bn).
HSBC HOLDINGS PLC
60f
Table of Contents
Five-year summary consolidated balance sheet
2015 $m | 2014 $m | 2013 $m | 2012 $m | 2011 $m | ||||||||||||||||||||||||||
ASSETS | ||||||||||||||||||||||||||||||
Cash and balances at central banks | 98,934 | 129,957 | 166,599 | 141,532 | 129,902 | |||||||||||||||||||||||||
Trading assets | 224,837 | 304,193 | 303,192 | 408,811 | 330,451 | |||||||||||||||||||||||||
Financial assets designated at fair value | 23,852 | 29,037 | 38,430 | 33,582 | 30,856 | |||||||||||||||||||||||||
Derivatives | 288,476 | 345,008 | 282,265 | 357,450 | 346,379 | |||||||||||||||||||||||||
Loans and advances to banks | 90,401 | 112,149 | 120,046 | 117,085 | 139,078 | |||||||||||||||||||||||||
Loans and advances to customers17 | 924,454 | 974,660 | 992,089 | 962,972 | 899,010 | |||||||||||||||||||||||||
Reverse repurchase agreements – non-trading | 146,255 | 161,713 | 179,690 | 70,112 | 83,328 | |||||||||||||||||||||||||
Financial investments | 428,955 | 415,467 | 425,925 | 421,101 | 400,044 | |||||||||||||||||||||||||
Assets held for sale | 43,900 | 7,647 | 4,050 | 19,269 | 39,558 | |||||||||||||||||||||||||
Other assets | 139,592 | 154,308 | 159,032 | 160,624 | 156,973 | |||||||||||||||||||||||||
Total assets at 31 December | 2,409,656 | 2,634,139 | 2,671,318 | 2,692,538 | 2,555,579 | |||||||||||||||||||||||||
LIABILITIES AND EQUITY | ||||||||||||||||||||||||||||||
Liabilities | ||||||||||||||||||||||||||||||
Deposits by banks | 54,371 | 77,426 | 86,507 | 95,480 | 95,205 | |||||||||||||||||||||||||
Customer accounts | 1,289,586 | 1,350,642 | 1,361,297 | 1,311,396 | 1,223,140 | |||||||||||||||||||||||||
Repurchase agreements – non-trading | 80,400 | 107,432 | 164,220 | 40,567 | 48,402 | |||||||||||||||||||||||||
Trading liabilities | 141,614 | 190,572 | 207,025 | 304,563 | 265,192 | |||||||||||||||||||||||||
Financial liabilities designated at fair value | 66,408 | 76,153 | 89,084 | 87,720 | 85,724 | |||||||||||||||||||||||||
Derivatives | 281,071 | 340,669 | 274,284 | 358,886 | 345,380 | |||||||||||||||||||||||||
Debt securities in issue | 88,949 | 95,947 | 104,080 | 119,461 | 131,013 | |||||||||||||||||||||||||
Liabilities under insurance contracts | 69,938 | 73,861 | 74,181 | 68,195 | 61,259 | |||||||||||||||||||||||||
Liabilities of disposal groups held for sale | 36,840 | 6,934 | 2,804 | 5,018 | 22,200 | |||||||||||||||||||||||||
Other liabilities | 102,961 | 114,525 | 117,377 | 118,123 | 111,971 | |||||||||||||||||||||||||
Total liabilities at 31 December | 2,212,138 | 2,434,161 | 2,480,859 | 2,509,409 | 2,389,486 | |||||||||||||||||||||||||
Equity | ||||||||||||||||||||||||||||||
Total shareholders’ equity | 188,460 | 190,447 | 181,871 | 175,242 | 158,725 | |||||||||||||||||||||||||
Non-controlling interests | 9,058 | 9,531 | 8,588 | 7,887 | 7,368 | |||||||||||||||||||||||||
Total equity at 31 December | 197,518 | 199,978 | 190,459 | 183,129 | 166,093 | |||||||||||||||||||||||||
Total liabilities and equity at 31 December | 2,409,656 | 2,634,139 | 2,671,318 | 2,692,538 | 2,555,579 | |||||||||||||||||||||||||
Five-year selected financial information
2015 $m | 2014 $m | 2013 $m | 2012 $m | 2011 $m | ||||||||||||||||||||||||||
Called up share capital | 9,842 | 9,609 | 9,415 | 9,238 | 8,934 | |||||||||||||||||||||||||
Capital resources18,19 | 189,833 | 190,730 | 194,009 | 180,806 | 170,334 | |||||||||||||||||||||||||
Undated subordinated loan capital | 2,368 | 2,773 | 2,777 | 2,778 | 2,779 | |||||||||||||||||||||||||
Preferred securities and dated subordinated loan capital20 | 42,844 | 47,208 | 48,114 | 48,260 | 49,438 | |||||||||||||||||||||||||
Risk-weighted assets18 | 1,102,995 | 1,219,765 | 1,092,653 | 1,123,943 | 1,209,514 | |||||||||||||||||||||||||
Financial statistics | ||||||||||||||||||||||||||||||
Loans and advances to customers as a percentage of customer accounts | 71.7 | 72.2 | 72.9 | 73.4 | 73.5 | |||||||||||||||||||||||||
Average total shareholders’ equity to average total assets | 7.31 | 7.01 | 6.55 | 6.16 | 5.64 | |||||||||||||||||||||||||
Net asset value per ordinary share at year-end21 ($) | 8.73 | 9.28 | 9.27 | 9.09 | 8.48 | |||||||||||||||||||||||||
Number of $0.50 ordinary shares in issue (millions) | 19,685 | 19,218 | 18,830 | 18,476 | 17,868 | |||||||||||||||||||||||||
Closing foreign exchange translation rates to $: | ||||||||||||||||||||||||||||||
$1: £ | 0.675 | 0.642 | 0.605 | 0.619 | 0.646 | |||||||||||||||||||||||||
$1:€ | 0.919 | 0.823 | 0.726 | 0.758 | 0.773 | |||||||||||||||||||||||||
For footnotes, see page 99.
A more detailed consolidated balance sheet is contained in the Financial Statements on page 339.
HSBC HOLDINGS PLC
61
Table of Contents
Report of the Directors: Financial summary(continued)
Consolidated balance sheet
Combined view of customer lending and customer deposits
2015 $m | 2014 $m | |||||||||||
Combined customer lending | ||||||||||||
Loans and advances to customers | 924,454 | 974,660 | ||||||||||
Loans and advances to customers reported in ‘Assets held for sale’ | 19,021 | 577 | ||||||||||
– Brazil22 | 17,001 | – | ||||||||||
– other | 2,020 | 577 | ||||||||||
At 31 December | 943,475 | 975,237 | ||||||||||
Combined customer deposits | ||||||||||||
Customer accounts | 1,289,586 | 1,350,642 | ||||||||||
Customer accounts reported in ‘Liabilities of disposal groups held for sale’ | 16,682 | 145 | ||||||||||
– Brazil22 | 15,094 | – | ||||||||||
– other | 1,588 | 145 | ||||||||||
At 31 December | 1,306,268 | 1,350,787 | ||||||||||
For footnote, see page 99.
Total reported assets of $2.4 trillion were 9% lower than at 31 December 2014 on a reported basis and 4% lower on a constant currency basis. One of the main drivers for this reduction was a fall in trading assets which reflects our ongoing focus on the efficient use of the balance sheet in the context of new prudential regulations.
Our ratio of customer advances to customer accounts was 71.7%. Both customer loans and customer accounts fell on a reported basis with these movements including:
| • | adverse currency translation movements of $52bn and $65bn, respectively; |
| • | the transfer to ‘Assets held for sale’ and ‘Liabilities of disposal groups held for sale’ of balances relating to the planned disposal of our operations in Brazil of $17bn and $15bn, respectively; and |
| • | a $13bn reduction in corporate overdraft and current account balances relating to a small number of clients in our PCM business in the UK who settled their overdraft and deposit balances on a net basis, with customers increasing the frequency with which they settled their positions. |
Excluding these movements, customer lending grew by $32bn (or 4%) driven by Europe, and customer accounts grew by $32bn (or 3%), notably in Asia.
Assets
Cash and balances at central banks fell by $31bn, primarily in North America as we managed the balance of our liquid asset portfolio to maximise investment returns.
Trading assets decreased by $79bn, of which $16bn was driven by adverse currency translation, as we continued our reduction in trading inventory in the context of the prudential regulation. This resulted in reductions in holdings of debt securities by the Rates business, notably in Europe and North America. In addition, lower settlement balances also reflected our actions to improve efficiency of balance sheet usage.
Derivative assets decreased by $57bn or 16%, driven by valuation movements in interest rate contracts, reflecting shifts in major yield curves, notably in France and the UK.
Loans and advances to customers decreased by $50bn on a reported basis, driven by Latin America and Europe. This included the following items:
| • | adverse currency translation movements of $52bn; |
| • | reclassification of $17bn to ‘Assets held for sale’ relating to our operations in Brazil; and |
| • | a $13bn reduction in corporate overdraft balances in Europe, with a corresponding fall in corporate customer accounts. |
Excluding these factors, customer lending balances grew by $32bn, largely from growth in Europe of $20bn, North America of $5bn and Asia of $4bn.
In Europe, the growth was from increased term lending to CMB customers, notably in the UK and Germany and higher balances in GB&M. In North America, the growth in balances was driven by increased term lending to corporate and commercial customers in CMB and GB&M, partly offset by a decline in RBWM from the continued reduction in the US run-off portfolio and the transfer to ‘Assets held for sale’ of US first lien mortgage balances. In Asia, balances rose largely from residential mortgage lending in Hong Kong and mainland China. CMB lending balances also rose, although GB&M lending fell. Both of these businesses were affected by weakening demand for trade lending, while GB&M’s reduction also reflected our active management of overall client returns.
Liabilities
Repurchase agreements decreased by $27bn or 25%, driven by falls in Europe, notably in the UK, and in North America. We continued to closely manage these balances, as we reassessed the overall returns on these activities in light of the evolving regulatory landscape and overall client returns.
Customer accounts decreased by $61bn and included the following items:
| • | adverse currency translation movements of $65bn; |
| • | reclassification of over $15bn to ‘Liabilities of disposal groups held for sale’ relating to our operations in Brazil; and |
| • | a $13bn reduction in corporate current account balances, in line with the fall in corporate overdraft positions. |
Excluding these factors, customer accounts grew by $32bn, notably in Asia in the first half of the year, reflecting growth in RBWM from increased savings balances by new and existing Premier customers, together with a rise in our PCM business in CMB.
Balances in Europe were broadly unchanged. Growth in our PCM business in CMB and a rise in RBWM balances reflecting customers’ continued preference for holding balances in current and savings accounts were broadly offset by a fall in GB&M.
HSBC HOLDINGS PLC
62
Table of Contents
Trading liabilities fell by $49bn, mainly in North America and Europe reflecting the reduction in trading assets and our focus on optimising the funding of trading assets.
The decrease inderivative liabilities was in line with that of derivative assets as the underlying risk was broadly matched.
Equity
Total shareholders’ equity fell by $2.0bn or 1%. The effects of profits generated in the year and the issue of new contingent convertible securities were more than offset by the combined effect of dividends paid and an increase in accumulated foreign exchange losses, which reflected the marked appreciation in the US dollar against a number of currencies, notably sterling and the euro. We recorded fair value gains in our available-for-sale reserve relating to our equity interest in Visa Europe of $432m. These were more than offset by fair value gains transferred to the income statement and fair value losses on debt securities during the year. The gains on Visa Europe were assessed against the expected consideration to be received from the proposed sale to Visa Inc. This transaction is expected to complete in 2016, at which point we will transfer the fair value gains to the income statement.
Risk-weighted assets
Risk-weighted assets (‘RWA’s) totalled $1,103bn at 31 December 2015, a decrease of $117bn during 2015. After foreign currency translation differences, RWAs reduced by $65bn in 2015, driven by targeted RWA initiatives of $124bn, partly offset by business growth of $35bn, and from growth in our associates of $14bn. The RWA initiatives included:
| • | the accelerated sell-down of our consumer mortgage portfolio in the US and the GB&M legacy book, together contributing $30bn to the reduction; and |
| • | exposure reductions, process improvements and refined calculations, which reduced RWAs by $93bn, 61% of which were in GB&M. |
The business growth of $35bn was from higher term lending to corporate customers in CMB and from higher general lending to corporates in GB&M. There was an increase of $14bn in our associates, BoCom and The Saudi British Bank.
Customer accounts by country
2015 $m | 2014 $m | |||||||||||
Europe | 497,876 | 545,959 | ||||||||||
– UK | 404,084 | 439,313 | ||||||||||
– France23 | 35,635 | 40,750 | ||||||||||
– Germany | 13,873 | 15,757 | ||||||||||
– Switzerland | 10,448 | 11,058 | ||||||||||
– other | 33,836 | 39,081 | ||||||||||
Asia | 598,620 | 577,491 | ||||||||||
– Hong Kong | 421,538 | 389,094 | ||||||||||
– Australia | 17,703 | 19,312 | ||||||||||
– India | 11,795 | 11,678 | ||||||||||
– Indonesia | 5,366 | 5,788 | ||||||||||
– Mainland China | 46,177 | 46,588 | ||||||||||
– Malaysia | 14,114 | 16,292 | ||||||||||
– Singapore | 41,307 | 43,731 | ||||||||||
– Taiwan | 11,812 | 14,901 | ||||||||||
– other | 28,808 | 30,107 | ||||||||||
Middle East and North Africa (excluding Saudi Arabia) | 36,468 | 39,720 | ||||||||||
– Egypt | 6,602 | 7,663 | ||||||||||
– United Arab Emirates | 18,281 | 19,771 | ||||||||||
– other | 11,585 | 12,286 | ||||||||||
North America | 135,152 | 138,884 | ||||||||||
– US | 86,322 | 84,894 | ||||||||||
– Canada | 39,727 | 43,871 | ||||||||||
– other | 9,103 | 10,119 | ||||||||||
Latin America | 21,470 | 48,588 | ||||||||||
– Mexico | 15,798 | 18,360 | ||||||||||
– other | 5,672 | 30,228 | ||||||||||
included in other: Brazil22 | – | 23,204 | ||||||||||
At 31 December | 1,289,586 | 1,350,642 | ||||||||||
For footnotes, see page 99.
HSBC HOLDINGS PLC
63
Table of Contents
Report of the Directors: Financial Review(continued)
Average balance sheet and net interest income
Average balances and related interest are shown for the domestic operations of our principal commercial banks by geographical region. ‘Other operations’ comprise the operations of our principal commercial banking and consumer finance entities outside their domestic markets and all other banking operations, including investment banking balances and transactions.
Average balances are based on daily averages for the principal areas of our banking activities with monthly or less frequent averages used elsewhere. Balances and transactions with fellow subsidiaries are reported gross in the principal commercial banking and consumer finance
entities and the elimination entries are included within ‘Other operations’.
Net interest margin numbers are calculated by dividing net interest income as reported in the income statement by the average interest-earning assets from which interest income is reported within the ‘Net interest income’ line of the income statement. Total interest-earning assets include loans where the carrying amount has been adjusted as a result of impairment allowances. In accordance with IFRSs, we recognise interest income on assets after the carrying amount has been adjusted as a result of impairment. Fee income which forms an integral part of the effective interest rate of a financial instrument is recognised as an adjustment to the effective interest rate and recorded in ‘Interest income’.
Assets
| 2015 | 2014 | 2013 | ||||||||||||||||||||||||||||||||||||||||||||||||||||||
Average balance | Interest income | Yield | Average balance | Interest income | Yield | Average balance | Interest income | Yield | ||||||||||||||||||||||||||||||||||||||||||||||||
| $m | $m | % | $m | $m | % | $m | $m | % | ||||||||||||||||||||||||||||||||||||||||||||||||
Summary | ||||||||||||||||||||||||||||||||||||||||||||||||||||||||
Interest-earning assets measured at amortised cost (itemised below) | 1,726,949 | 47,189 | 2.73 | 1,786,536 | 50,955 | 2.85 | 1,669,368 | 51,192 | 3.07 | |||||||||||||||||||||||||||||||||||||||||||||||
Trading assets and financial assets designated at fair value54,55 | 195,285 | 4,626 | 2.37 | 238,958 | 5,596 | 2.34 | 354,817 | 5,763 | 1.62 | |||||||||||||||||||||||||||||||||||||||||||||||
Impairment allowances | (10,606 | ) | (14,015 | ) | (15,954 | ) | ||||||||||||||||||||||||||||||||||||||||||||||||||
Non-interest-earning assets | 682,143 | 668,564 | 683,785 | |||||||||||||||||||||||||||||||||||||||||||||||||||||
Total assets and interest income | 2,593,771 | 51,815 | 2.00 | 2,680,043 | 56,551 | 2.11 | 2,692,016 | 56,955 | 2.12 | |||||||||||||||||||||||||||||||||||||||||||||||
Average yield on all interest-earning assets | 2.70 | 2.79 | 2.81 | |||||||||||||||||||||||||||||||||||||||||||||||||||||
Short-term funds and loans and advances to banks | ||||||||||||||||||||||||||||||||||||||||||||||||||||||||
Europe | HSBC Bank | 79,101 | 827 | 1.05 | 96,638 | 997 | 1.03 | 89,921 | 880 | 0.98 | ||||||||||||||||||||||||||||||||||||||||||||||
HSBC Private Banking Holdings (Suisse) | 11,498 | 4 | 0.03 | 9,704 | 10 | 0.10 | 15,400 | 10 | 0.06 | |||||||||||||||||||||||||||||||||||||||||||||||
HSBC France | 5,242 | 40 | 0.76 | 7,055 | 66 | 0.94 | 10,603 | 93 | 0.88 | |||||||||||||||||||||||||||||||||||||||||||||||
Asia | Hang Seng Bank | 14,379 | 210 | 1.46 | 15,374 | 279 | 1.81 | 16,496 | 251 | 1.52 | ||||||||||||||||||||||||||||||||||||||||||||||
The Hongkong and Shanghai Banking Corporation | 55,951 | 536 | 0.96 | 57,141 | 822 | 1.44 | 53,372 | 809 | 1.52 | |||||||||||||||||||||||||||||||||||||||||||||||
HSBC Bank Malaysia | 3,994 | 121 | 3.03 | 5,060 | 158 | 3.12 | 5,487 | 162 | 2.95 | |||||||||||||||||||||||||||||||||||||||||||||||
MENA | HSBC Bank Middle East | 5,038 | 30 | 0.60 | 4,678 | 29 | 0.62 | 5,018 | 27 | 0.54 | ||||||||||||||||||||||||||||||||||||||||||||||
North America | HSBC Bank USA | 35,271 | 134 | 0.38 | 28,148 | 105 | 0.37 | 24,907 | 84 | 0.34 | ||||||||||||||||||||||||||||||||||||||||||||||
HSBC Bank Canada | 767 | 2 | 0.26 | 606 | 4 | 0.66 | 425 | 3 | 0.71 | |||||||||||||||||||||||||||||||||||||||||||||||
Latin America | HSBC Mexico | 2,463 | 76 | 3.09 | 2,675 | 86 | 3.21 | 2,846 | 109 | 3.83 | ||||||||||||||||||||||||||||||||||||||||||||||
Brazilian operations | 1,717 | 193 | 11.24 | 5,416 | 498 | 9.19 | 5,579 | 388 | 6.95 | |||||||||||||||||||||||||||||||||||||||||||||||
HSBC Bank Argentina | 1,050 | 4 | 0.38 | 1,083 | 12 | 1.11 | 1,199 | 18 | 1.50 | |||||||||||||||||||||||||||||||||||||||||||||||
Other operations | 5,453 | 100 | 1.83 | 3,570 | 2 | 0.06 | 5,124 | 17 | 0.33 | |||||||||||||||||||||||||||||||||||||||||||||||
| 221,924 | 2,277 | 1.03 | 237,148 | 3,068 | 1.29 | 236,377 | 2,851 | 1.21 | ||||||||||||||||||||||||||||||||||||||||||||||||
HSBC HOLDINGS PLC
63a
Table of Contents
Report of the Directors: Financial Review(continued)
Assets(continued)
| 2015 | 2014 | 2013 | ||||||||||||||||||||||||||||||||||||||||||||||||||||||
Average balance | Interest income | Yield | Average balance | Interest income | Yield | Average balance | Interest income | Yield | ||||||||||||||||||||||||||||||||||||||||||||||||
| $m | $m | % | $m | $m | % | $m | $m | % | ||||||||||||||||||||||||||||||||||||||||||||||||
Loans and advances to customers | ||||||||||||||||||||||||||||||||||||||||||||||||||||||||
Europe | HSBC Bank | 291,311 | 9,916 | 3.40 | 302,817 | 10,423 | 3.44 | 292,200 | 10,631 | 3.64 | ||||||||||||||||||||||||||||||||||||||||||||||
HSBC Private Banking Holdings (Suisse) | 12,006 | 136 | 1.13 | 13,026 | 159 | 1.22 | 15,235 | 194 | 1.27 | |||||||||||||||||||||||||||||||||||||||||||||||
HSBC France | 41,257 | 1,252 | 3.03 | 43,736 | 1,626 | 3.72 | 47,404 | 1,656 | 3.49 | |||||||||||||||||||||||||||||||||||||||||||||||
HSBC Finance | – | – | – | – | – | – | 173 | 10 | 5.78 | |||||||||||||||||||||||||||||||||||||||||||||||
Asia | Hang Seng Bank | 86,149 | 2,579 | 2.99 | 79,586 | 2,410 | 3.03 | 72,537 | 2,179 | 3.00 | ||||||||||||||||||||||||||||||||||||||||||||||
The Hongkong and Shanghai Banking Corporation | 261,705 | 8,082 | 3.09 | 263,732 | 8,517 | 3.23 | 237,915 | 8,022 | 3.37 | |||||||||||||||||||||||||||||||||||||||||||||||
HSBC Bank Malaysia | 12,517 | 589 | 4.71 | 13,548 | 672 | 4.96 | 13,928 | 683 | 4.90 | |||||||||||||||||||||||||||||||||||||||||||||||
MENA | HSBC Bank Middle East | 27,240 | 1,041 | 3.82 | 26,618 | 1,133 | 4.26 | 25,537 | 1,124 | 4.40 | ||||||||||||||||||||||||||||||||||||||||||||||
North America | HSBC Bank USA | 74,013 | 1,981 | 2.68 | 63,770 | 1,791 | 2.81 | 56,538 | 1,776 | 3.14 | ||||||||||||||||||||||||||||||||||||||||||||||
HSBC Finance | 21,529 | 1,705 | 7.92 | 26,446 | 2,171 | 8.21 | 34,146 | 3,064 | 8.97 | |||||||||||||||||||||||||||||||||||||||||||||||
HSBC Bank Canada | 33,280 | 1,086 | 3.26 | 37,472 | 1,371 | 3.66 | 39,199 | 1,431 | 3.65 | |||||||||||||||||||||||||||||||||||||||||||||||
Latin America | HSBC Mexico | 14,304 | 1,319 | 9.22 | 15,770 | 1,542 | 9.78 | 15,335 | 1,658 | 10.81 | ||||||||||||||||||||||||||||||||||||||||||||||
Brazilian operations | 10,388 | 1,915 | 18.43 | 27,275 | 4,579 | 16.79 | 25,688 | 4,604 | 17.92 | |||||||||||||||||||||||||||||||||||||||||||||||
HSBC Bank Argentina | 3,381 | 880 | 26.03 | 3,078 | 798 | 25.93 | 3,615 | 799 | 22.10 | |||||||||||||||||||||||||||||||||||||||||||||||
Other operations | 20,627 | 623 | 3.02 | 14,437 | 237 | 1.64 | 17,872 | 698 | 3.91 | |||||||||||||||||||||||||||||||||||||||||||||||
| 909,707 | 33,104 | 3.64 | 931,311 | 37,429 | 4.02 | 897,322 | 38,529 | 4.29 | ||||||||||||||||||||||||||||||||||||||||||||||||
Reverse repurchase agreements – non-trading | ||||||||||||||||||||||||||||||||||||||||||||||||||||||||
Europe | HSBC Bank | 53,036 | 354 | 0.67 | 66,360 | 450 | 0.68 | 28,131 | 113 | 0.40 | ||||||||||||||||||||||||||||||||||||||||||||||
HSBC France | 12,986 | 7 | 0.05 | 29,703 | 62 | 0.21 | 45,929 | 48 | 0.10 | |||||||||||||||||||||||||||||||||||||||||||||||
Asia | The Hongkong and Shanghai Banking Corporation | 26,714 | 273 | 1.02 | 23,562 | 333 | 1.41 | 11,722 | 272 | 2.32 | ||||||||||||||||||||||||||||||||||||||||||||||
HSBC Bank Malaysia | 1,001 | 32 | 3.20 | 991 | 31 | 3.13 | 378 | 11 | 2.91 | |||||||||||||||||||||||||||||||||||||||||||||||
MENA | HSBC Bank Middle East | 272 | 2 | 0.74 | 18 | 2 | 11.11 | 620 | 7 | 1.13 | ||||||||||||||||||||||||||||||||||||||||||||||
North America | HSBC Bank USA | 4,589 | 23 | 0.50 | 1,196 | 10 | 0.84 | 1,837 | 13 | 0.71 | ||||||||||||||||||||||||||||||||||||||||||||||
HSBC Finance | – | – | – | – | – | – | – | – | – | |||||||||||||||||||||||||||||||||||||||||||||||
HSBC Bank Canada | 5,814 | 40 | 0.69 | 7,169 | 84 | 1.17 | 9,196 | 93 | 1.01 | |||||||||||||||||||||||||||||||||||||||||||||||
Latin America | HSBC Mexico | 877 | 27 | 3.08 | 90 | 3 | 3.33 | 133 | 5 | 3.76 | ||||||||||||||||||||||||||||||||||||||||||||||
Brazilian operations | 3,248 | 421 | 12.96 | 7,241 | 753 | 10.40 | 5,541 | 404 | 7.29 | |||||||||||||||||||||||||||||||||||||||||||||||
HSBC Bank Argentina | 42 | 7 | 16.67 | 88 | 10 | 11.36 | 138 | 13 | 9.42 | |||||||||||||||||||||||||||||||||||||||||||||||
Other operations | 53,729 | 115 | 0.21 | 61,855 | 62 | 0.10 | 10,699 | 16 | 0.15 | |||||||||||||||||||||||||||||||||||||||||||||||
| 162,308 | 1,301 | 0.80 | 198,273 | 1,800 | 0.91 | 114,324 | 995 | 0.87 | ||||||||||||||||||||||||||||||||||||||||||||||||
Financial investments | ||||||||||||||||||||||||||||||||||||||||||||||||||||||||
Europe | HSBC Bank | 73,043 | 753 | 1.03 | 100,609 | 867 | 0.86 | 88,406 | 1,223 | 1.38 | ||||||||||||||||||||||||||||||||||||||||||||||
HSBC Private Banking Holdings (Suisse) | 7,479 | 75 | 1.00 | 10,890 | 114 | 1.05 | 13,509 | 183 | 1.35 | |||||||||||||||||||||||||||||||||||||||||||||||
HSBC France | 13,608 | 17 | 0.12 | 12,685 | 113 | 0.89 | 13,733 | 94 | 0.68 | |||||||||||||||||||||||||||||||||||||||||||||||
Asia | Hang Seng Bank | 39,891 | 647 | 1.62 | 33,246 | 655 | 1.97 | 31,502 | 601 | 1.91 | ||||||||||||||||||||||||||||||||||||||||||||||
The Hongkong and Shanghai Banking Corporation | 128,922 | 1,909 | 1.48 | 118,096 | 2,109 | 1.79 | 104,740 | 1,781 | 1.70 | |||||||||||||||||||||||||||||||||||||||||||||||
HSBC Bank Malaysia | 2,864 | 104 | 3.63 | 2,749 | 94 | 3.42 | 2,197 | 72 | 3.28 | |||||||||||||||||||||||||||||||||||||||||||||||
MENA | HSBC Bank Middle East | 8,186 | 70 | 0.86 | 10,515 | 104 | 0.99 | 11,838 | 113 | 0.95 | ||||||||||||||||||||||||||||||||||||||||||||||
North America | HSBC Bank USA | 49,268 | 893 | 1.81 | 47,963 | 774 | 1.61 | 56,302 | 884 | 1.57 | ||||||||||||||||||||||||||||||||||||||||||||||
HSBC Finance | – | – | – | – | – | – | – | – | – | |||||||||||||||||||||||||||||||||||||||||||||||
HSBC Bank Canada | 17,486 | 199 | 1.14 | 17,970 | 246 | 1.37 | 20,364 | 279 | 1.37 | |||||||||||||||||||||||||||||||||||||||||||||||
Latin America | HSBC Mexico | 6,301 | 286 | 4.54 | 9,914 | 409 | 4.13 | 7,782 | 351 | 4.51 | ||||||||||||||||||||||||||||||||||||||||||||||
Brazilian operations | 3,520 | 515 | 14.63 | 8,350 | 1,003 | 12.01 | 7,404 | 740 | 9.99 | |||||||||||||||||||||||||||||||||||||||||||||||
HSBC Bank Argentina | 650 | 149 | 22.92 | 518 | 130 | 25.10 | 451 | 71 | 15.74 | |||||||||||||||||||||||||||||||||||||||||||||||
Other operations | 44,895 | 1,891 | 4.21 | 26,311 | 1,705 | 6.48 | 35,081 | 1,610 | 4.59 | |||||||||||||||||||||||||||||||||||||||||||||||
| 396,113 | 7,508 | 1.90 | 399,816 | 8,323 | 2.08 | 393,309 | 8,002 | 2.03 | ||||||||||||||||||||||||||||||||||||||||||||||||
HSBC HOLDINGS PLC
63b
Table of Contents
Report of the Directors: Financial Review(continued)
Assets(continued)
| 2015 | 2014 | 2013 | ||||||||||||||||||||||||||||||||||||||||||||||||||||||
Average balance | Interest income | Yield | Average balance | Interest income | Yield | Average balance | Interest income | Yield | ||||||||||||||||||||||||||||||||||||||||||||||||
| $m | $m | % | $m | $m | % | $m | $m | % | ||||||||||||||||||||||||||||||||||||||||||||||||
Other interest-earning assets | ||||||||||||||||||||||||||||||||||||||||||||||||||||||||
Europe | HSBC Bank | 61,355 | 100 | 0.16 | 85,604 | 25 | 0.03 | 73,607 | 64 | 0.09 | ||||||||||||||||||||||||||||||||||||||||||||||
HSBC Private Banking Holdings (Suisse) | 2,200 | 24 | 1.09 | 5,220 | 32 | 0.61 | 7,441 | 69 | 0.93 | |||||||||||||||||||||||||||||||||||||||||||||||
HSBC France | 2,818 | 61 | 2.16 | 6,016 | 97 | 1.61 | 14,294 | 111 | 0.78 | |||||||||||||||||||||||||||||||||||||||||||||||
Asia | Hang Seng Bank | 3,551 | 14 | 0.39 | 2,504 | 14 | 0.56 | 2,088 | 14 | 0.67 | ||||||||||||||||||||||||||||||||||||||||||||||
The Hongkong and Shanghai Banking Corporation | 82,422 | 451 | 0.55 | 86,361 | 583 | 0.68 | 62,369 | 498 | 0.80 | |||||||||||||||||||||||||||||||||||||||||||||||
HSBC Bank Malaysia | 92 | – | – | 152 | – | – | 456 | 2 | 0.44 | |||||||||||||||||||||||||||||||||||||||||||||||
MENA | HSBC Bank Middle East | 1,263 | 37 | 2.93 | 2,221 | 32 | 1.44 | 1,888 | 87 | 4.61 | ||||||||||||||||||||||||||||||||||||||||||||||
North America | HSBC Bank USA | 4,012 | 132 | 3.29 | 6,936 | 123 | 1.77 | 6,386 | 103 | 1.61 | ||||||||||||||||||||||||||||||||||||||||||||||
HSBC Finance | 5,538 | 7 | 0.13 | 6,081 | 5 | 0.08 | 6,821 | 19 | 0.28 | |||||||||||||||||||||||||||||||||||||||||||||||
HSBC Bank Canada | 249 | 5 | 2.01 | 292 | 5 | 1.71 | 1,691 | 42 | 2.48 | |||||||||||||||||||||||||||||||||||||||||||||||
Latin America | HSBC Mexico | 517 | 1 | 0.19 | 324 | – | – | 265 | 6 | 2.26 | ||||||||||||||||||||||||||||||||||||||||||||||
Brazilian operations | 20,972 | 2,744 | 13.08 | 1,215 | 136 | 11.19 | 2,394 | 107 | 4.47 | |||||||||||||||||||||||||||||||||||||||||||||||
HSBC Bank Argentina | 69 | – | – | 61 | – | – | 93 | – | – | |||||||||||||||||||||||||||||||||||||||||||||||
Other operations | (148,161 | ) | (577 | ) | (182,999 | ) | (717 | ) | (151,757 | ) | (307 | ) | ||||||||||||||||||||||||||||||||||||||||||||
| 36,897 | 2,999 | 8.13 | 19,988 | 335 | 1.68 | 28,036 | 815 | 2.91 | ||||||||||||||||||||||||||||||||||||||||||||||||
Total interest-earning assets | ||||||||||||||||||||||||||||||||||||||||||||||||||||||||
Europe | HSBC Bank | 557,846 | 11,950 | 2.14 | 652,028 | 12,762 | 1.96 | 572,265 | 12,911 | 2.26 | ||||||||||||||||||||||||||||||||||||||||||||||
HSBC Private Banking Holdings (Suisse) | 33,183 | 239 | 0.72 | 38,840 | 315 | 0.81 | 51,585 | 456 | 0.88 | |||||||||||||||||||||||||||||||||||||||||||||||
HSBC France | 75,911 | 1,377 | 1.81 | 99,195 | 1,964 | 1.98 | 131,963 | 2,002 | 1.52 | |||||||||||||||||||||||||||||||||||||||||||||||
Asia | Hang Seng Bank | 143,970 | 3,450 | 2.40 | 130,710 | 3,358 | 2.57 | 122,623 | 3,045 | 2.48 | ||||||||||||||||||||||||||||||||||||||||||||||
The Hongkong and Shanghai Banking Corporation | 555,714 | 11,251 | 2.02 | 548,892 | 12,364 | 2.25 | 470,118 | 11,382 | 2.42 | |||||||||||||||||||||||||||||||||||||||||||||||
HSBC Bank Malaysia | 20,468 | 846 | 4.13 | 22,500 | 955 | 4.24 | 22,446 | 930 | 4.14 | |||||||||||||||||||||||||||||||||||||||||||||||
MENA | HSBC Bank Middle East | 41,999 | 1,180 | 2.81 | 44,050 | 1,300 | 2.95 | 44,901 | 1,358 | 3.02 | ||||||||||||||||||||||||||||||||||||||||||||||
North America | HSBC Bank USA | 167,153 | 3,163 | 1.89 | 148,013 | 2,803 | 1.89 | 145,970 | 2,860 | 1.96 | ||||||||||||||||||||||||||||||||||||||||||||||
HSBC Finance | 27,067 | 1,712 | 6.33 | 32,527 | 2,176 | 6.69 | 40,967 | 3,083 | 7.53 | |||||||||||||||||||||||||||||||||||||||||||||||
HSBC Bank Canada | 57,596 | 1,332 | 2.31 | 63,509 | 1,710 | 2.69 | 70,875 | 1,848 | 2.61 | |||||||||||||||||||||||||||||||||||||||||||||||
Latin America | HSBC Mexico | 24,462 | 1,709 | 6.99 | 28,773 | 2,040 | 7.09 | 26,361 | 2,129 | 8.08 | ||||||||||||||||||||||||||||||||||||||||||||||
Brazilian operations | 39,845 | 5,788 | 14.53 | 49,497 | 6,969 | 14.08 | 46,606 | 6,243 | 13.40 | |||||||||||||||||||||||||||||||||||||||||||||||
HSBC Bank Argentina | 5,192 | 1,040 | 20.03 | 4,828 | 950 | 19.68 | 5,496 | 901 | 16.39 | |||||||||||||||||||||||||||||||||||||||||||||||
Other operations | (23,457 | ) | 2,152 | (76,826 | ) | 1,289 | (82,808 | ) | 2,044 | |||||||||||||||||||||||||||||||||||||||||||||||
| 1,726,949 | 47,189 | 2.73 | 1,786,536 | 50,955 | 2.85 | 1,669,368 | 51,192 | 3.07 | ||||||||||||||||||||||||||||||||||||||||||||||||
For footnotes, see page 100a.
Equity and liabilities
|
| |||||||||||||||||||||||||||||||||||||||||||||||||||||||
| 2015 | 2014 | 2013 | ||||||||||||||||||||||||||||||||||||||||||||||||||||||
Average balance | Interest expense | Cost | Average balance | Interest expense | Cost | Average balance | Interest expense | Cost | ||||||||||||||||||||||||||||||||||||||||||||||||
| $m | $m | % | $m | $m | % | $m | $m | % | ||||||||||||||||||||||||||||||||||||||||||||||||
Summary | ||||||||||||||||||||||||||||||||||||||||||||||||||||||||
Interest-bearing liabilities measured at amortised cost (itemised below) | 1,465,635 | 14,658 | 1.00 | 1,546,633 | 16,250 | 1.05 | 1,426,180 | 15,653 | 1.10 | |||||||||||||||||||||||||||||||||||||||||||||||
Trading liabilities and financial liabilities designated at fair value (excluding own debt issued) | 151,294 | 2,071 | 1.37 | 178,518 | 2,856 | 1.60 | 301,353 | 3,027 | 1.00 | |||||||||||||||||||||||||||||||||||||||||||||||
Non-interest bearing current accounts | 190,914 | 185,990 | 184,370 | |||||||||||||||||||||||||||||||||||||||||||||||||||||
Total equity and other non-interest bearing liabilities | 785,928 | 768,902 | 780,113 | |||||||||||||||||||||||||||||||||||||||||||||||||||||
Total equity and liabilities | 2,593,771 | 16,729 | 0.64 | 2,680,043 | 19,106 | 0.71 | 2,692,016 | 18,680 | 0.69 | |||||||||||||||||||||||||||||||||||||||||||||||
Average cost on all interest-bearing liabilities | 1.03 | 1.11 | 1.08 | |||||||||||||||||||||||||||||||||||||||||||||||||||||
HSBC HOLDINGS PLC
63c
Table of Contents
Report of the Directors: Financial Review(continued)
Equity and liabilities(continued)
| 2015 | 2014 | 2013 | ||||||||||||||||||||||||||||||||||||||||||||||||||||||
Average balance | Interest expense | Cost | Average balance | Interest expense | Cost | Average balance | Interest expense | Cost | ||||||||||||||||||||||||||||||||||||||||||||||||
| $m | $m | % | $m | $m | % | $m | $m | % | ||||||||||||||||||||||||||||||||||||||||||||||||
Deposits by banks56 | ||||||||||||||||||||||||||||||||||||||||||||||||||||||||
Europe | HSBC Bank | 16,333 | 75 | 0.46 | 20,508 | 139 | 0.68 | 21,230 | 165 | 0.78 | ||||||||||||||||||||||||||||||||||||||||||||||
HSBC Private Banking Holdings (Suisse) | 400 | 1 | 0.25 | 354 | 1 | 0.28 | 351 | 1 | 0.28 | |||||||||||||||||||||||||||||||||||||||||||||||
HSBC France | 7,323 | 41 | 0.56 | 6,191 | 53 | 0.86 | 7,747 | 69 | 0.89 | |||||||||||||||||||||||||||||||||||||||||||||||
Asia | Hang Seng Bank | 1,098 | 19 | 1.73 | 960 | 9 | 0.94 | 1,095 | 15 | 1.37 | ||||||||||||||||||||||||||||||||||||||||||||||
The Hongkong and Shanghai Banking Corporation | 19,426 | 80 | 0.41 | 19,589 | 79 | 0.40 | 15,663 | 90 | 0.57 | |||||||||||||||||||||||||||||||||||||||||||||||
HSBC Bank Malaysia | 974 | 26 | 2.67 | 1,095 | 26 | 2.37 | 864 | 20 | 2.31 | |||||||||||||||||||||||||||||||||||||||||||||||
MENA | HSBC Bank Middle East | 737 | 3 | 0.41 | 982 | 3 | 0.31 | 1,471 | 3 | 0.20 | ||||||||||||||||||||||||||||||||||||||||||||||
North America | HSBC Bank USA | 5,503 | 17 | 0.31 | 6,436 | 12 | 0.19 | 8,131 | 16 | 0.20 | ||||||||||||||||||||||||||||||||||||||||||||||
HSBC Bank Canada | 319 | 1 | 0.31 | 371 | 1 | 0.27 | 607 | 2 | 0.33 | |||||||||||||||||||||||||||||||||||||||||||||||
Latin America | HSBC Mexico | 1,506 | 55 | 3.65 | 2,078 | 73 | 3.51 | 1,018 | 46 | 4.52 | ||||||||||||||||||||||||||||||||||||||||||||||
Brazilian operations | 1,024 | 49 | 4.79 | 2,309 | 84 | 3.64 | 3,356 | 94 | 2.80 | |||||||||||||||||||||||||||||||||||||||||||||||
HSBC Bank Argentina | 10 | 2 | 20.00 | 10 | 1 | 10.00 | 20 | 2 | 10.00 | |||||||||||||||||||||||||||||||||||||||||||||||
Other operations | 1,210 | 9 | 0.74 | 334 | – | – | 63 | 32 | 50.79 | |||||||||||||||||||||||||||||||||||||||||||||||
| 55,863 | 378 | 0.68 | 61,217 | 481 | 0.79 | 61,616 | 555 | 0.90 | ||||||||||||||||||||||||||||||||||||||||||||||||
Financial liabilities designated at fair value – own debt issued57 | ||||||||||||||||||||||||||||||||||||||||||||||||||||||||
Europe | HSBC Holdings | 18,816 | 263 | 1.40 | 18,745 | 234 | 1.25 | 19,719 | 366 | 1.86 | ||||||||||||||||||||||||||||||||||||||||||||||
HSBC Bank | 20,758 | 316 | 1.52 | 27,762 | 421 | 1.52 | 28,969 | 443 | 1.53 | |||||||||||||||||||||||||||||||||||||||||||||||
HSBC France | 8,472 | 31 | 0.37 | 8,232 | 66 | 0.80 | 9,173 | 67 | 0.73 | |||||||||||||||||||||||||||||||||||||||||||||||
North America | HSBC Bank USA | 2,100 | 32 | 1.52 | 2,032 | 33 | 1.62 | 1,933 | 35 | 1.81 | ||||||||||||||||||||||||||||||||||||||||||||||
HSBC Finance | 5,169 | 47 | 0.91 | 7,195 | 58 | 0.81 | 8,878 | 80 | 0.90 | |||||||||||||||||||||||||||||||||||||||||||||||
Other operations | 3,174 | 28 | 0.88 | 2,408 | 25 | 1.04 | 3,661 | (24 | ) | (0.66 | ) | |||||||||||||||||||||||||||||||||||||||||||||
| 58,489 | 717 | 1.23 | 66,374 | 837 | 1.26 | 72,333 | 967 | 1.34 | ||||||||||||||||||||||||||||||||||||||||||||||||
Customer accounts58 | ||||||||||||||||||||||||||||||||||||||||||||||||||||||||
Europe | HSBC Bank | 364,503 | 2,051 | 0.56 | 372,151 | 2,268 | 0.61 | 329,867 | 2,229 | 0.68 | ||||||||||||||||||||||||||||||||||||||||||||||
HSBC Private Banking Holdings (Suisse) | 7,201 | 29 | 0.40 | 8,165 | 31 | 0.38 | 16,414 | 70 | 0.43 | |||||||||||||||||||||||||||||||||||||||||||||||
HSBC France | 15,900 | 116 | 0.73 | 20,988 | 189 | 0.90 | 24,519 | 237 | 0.97 | |||||||||||||||||||||||||||||||||||||||||||||||
Asia | Hang Seng Bank | 106,783 | 464 | 0.43 | 98,794 | 472 | 0.48 | 91,778 | 360 | 0.39 | ||||||||||||||||||||||||||||||||||||||||||||||
The Hongkong and Shanghai Banking Corporation | 394,313 | 2,446 | 0.62 | 377,748 | 2,743 | 0.73 | 344,968 | 2,548 | 0.74 | |||||||||||||||||||||||||||||||||||||||||||||||
HSBC Bank Malaysia | 11,865 | 264 | 2.23 | 13,457 | 291 | 2.16 | 13,673 | 295 | 2.16 | |||||||||||||||||||||||||||||||||||||||||||||||
MENA | HSBC Bank Middle East | 14,360 | 53 | 0.37 | 16,533 | 75 | 0.45 | 18,387 | 106 | 0.58 | ||||||||||||||||||||||||||||||||||||||||||||||
North America | HSBC Bank USA | 61,314 | 147 | 0.24 | 57,015 | 78 | 0.14 | 56,411 | 104 | 0.18 | ||||||||||||||||||||||||||||||||||||||||||||||
HSBC Bank Canada | 35,998 | 197 | 0.55 | 40,682 | 319 | 0.78 | 41,905 | 330 | 0.79 | |||||||||||||||||||||||||||||||||||||||||||||||
Latin America | HSBC Mexico | 12,568 | 201 | 1.60 | 15,050 | 300 | 1.99 | 15,316 | 383 | 2.50 | ||||||||||||||||||||||||||||||||||||||||||||||
Brazilian operations | 6,938 | 830 | 11.96 | 18,542 | 1,828 | 9.86 | 20,602 | 1,467 | 7.12 | |||||||||||||||||||||||||||||||||||||||||||||||
HSBC Bank Argentina | 2,989 | 436 | 14.59 | 2,758 | 373 | 13.52 | 3,318 | 343 | 10.34 | |||||||||||||||||||||||||||||||||||||||||||||||
Other operations | 41,169 | 167 | 0.41 | 46,610 | 164 | 0.35 | 58,342 | 322 | 0.55 | |||||||||||||||||||||||||||||||||||||||||||||||
| 1,075,901 | 7,401 | 0.69 | 1,088,493 | 9,131 | 0.84 | 1,035,500 | 8,794 | 0.85 | ||||||||||||||||||||||||||||||||||||||||||||||||
Repurchase agreements – non-trading | ||||||||||||||||||||||||||||||||||||||||||||||||||||||||
Europe | HSBC Bank | 31,782 | 119 | 0.37 | 72,481 | 213 | 0.29 | 29,019 | 111 | 0.38 | ||||||||||||||||||||||||||||||||||||||||||||||
HSBC Private Banking Holdings (Suisse) | – | – | – | 74 | – | – | 67 | – | 0.14 | |||||||||||||||||||||||||||||||||||||||||||||||
HSBC France | 8,965 | 2 | 0.02 | 29,539 | 59 | 0.20 | 37,554 | 34 | 0.09 | |||||||||||||||||||||||||||||||||||||||||||||||
Asia | Hang Seng Bank | 203 | 4 | 1.97 | 11 | – | – | 6 | – | 4.24 | ||||||||||||||||||||||||||||||||||||||||||||||
The Hongkong and Shanghai Banking Corporation | 3,022 | 70 | 2.32 | 1,760 | 56 | 3.18 | 779 | 32 | 4.11 | |||||||||||||||||||||||||||||||||||||||||||||||
HSBC Bank Malaysia | 43 | 1 | 2.33 | 35 | 1 | 2.86 | 65 | 1 | 1.54 | |||||||||||||||||||||||||||||||||||||||||||||||
MENA | HSBC Bank Middle East | – | – | – | 2 | – | – | 17 | 1 | 5.88 | ||||||||||||||||||||||||||||||||||||||||||||||
North America | HSBC Bank USA | 6,828 | 26 | 0.38 | 11,485 | 20 | 0.17 | 9,269 | 12 | 0.13 | ||||||||||||||||||||||||||||||||||||||||||||||
HSBC Bank Canada | 2,534 | 17 | 0.67 | 2,167 | 25 | 1.15 | 2,996 | 30 | 1.00 | |||||||||||||||||||||||||||||||||||||||||||||||
Latin America | HSBC Mexico | 2,127 | 62 | 2.91 | 4,748 | 152 | 3.20 | 1,842 | 90 | 4.89 | ||||||||||||||||||||||||||||||||||||||||||||||
Brazilian operations | 334 | 6 | 1.80 | 910 | 96 | 10.55 | 1,104 | 87 | 7.88 | |||||||||||||||||||||||||||||||||||||||||||||||
HSBC Bank Argentina | 5 | – | – | 3 | – | – | – | – | – | |||||||||||||||||||||||||||||||||||||||||||||||
Other operations | 62,104 | 48 | 0.08 | 67,490 | 30 | 0.04 | 11,692 | 7 | 0.06 | |||||||||||||||||||||||||||||||||||||||||||||||
| 117,947 | 355 | 0.30 | 190,705 | 652 | 0.34 | 94,410 | 405 | 0.43 | ||||||||||||||||||||||||||||||||||||||||||||||||
HSBC HOLDINGS PLC
63d
Table of Contents
Report of the Directors: Financial Review(continued)
Equity and liabilities(continued)
| 2015 | 2014 | 2013 | ||||||||||||||||||||||||||||||||||||||||||||||||||||||
Average balance | Interest expense | Cost | Average balance | Interest expense | Cost | Average balance | Interest expense | Cost | ||||||||||||||||||||||||||||||||||||||||||||||||
| $m | $m | % | $m | $m | % | $m | $m | % | ||||||||||||||||||||||||||||||||||||||||||||||||
Debt securities in issue | ||||||||||||||||||||||||||||||||||||||||||||||||||||||||
Europe | HSBC Holdings | 16,230 | 904 | 5.57 | 16,781 | 945 | 5.63 | 13,405 | 807 | 6.02 | ||||||||||||||||||||||||||||||||||||||||||||||
HSBC Bank | 41,413 | 359 | 0.87 | 56,949 | 589 | 1.03 | 64,528 | 768 | 1.19 | |||||||||||||||||||||||||||||||||||||||||||||||
HSBC France | 12,379 | 40 | 0.32 | 10,846 | 52 | 0.48 | 13,365 | 54 | 0.40 | |||||||||||||||||||||||||||||||||||||||||||||||
Asia | Hang Seng Bank | 428 | 7 | 1.64 | 1,155 | 8 | 0.69 | 1,393 | 12 | 0.86 | ||||||||||||||||||||||||||||||||||||||||||||||
The Hongkong and Shanghai Banking Corporation | 5,520 | 123 | 2.23 | 6,365 | 176 | 2.77 | 7,586 | 186 | 2.45 | |||||||||||||||||||||||||||||||||||||||||||||||
HSBC Bank Malaysia | 385 | 17 | 4.42 | 461 | 19 | 4.12 | 967 | 26 | 2.69 | |||||||||||||||||||||||||||||||||||||||||||||||
MENA | HSBC Bank Middle East | 2,199 | 33 | 1.50 | 2,262 | 45 | 1.99 | 3,057 | 64 | 2.09 | ||||||||||||||||||||||||||||||||||||||||||||||
North America | HSBC Bank USA | 31,089 | 542 | 1.74 | 15,935 | 414 | 2.60 | 14,012 | 415 | 2.96 | ||||||||||||||||||||||||||||||||||||||||||||||
HSBC Finance | 8,961 | 407 | 4.54 | 13,045 | 483 | 3.70 | 19,888 | 739 | 3.72 | |||||||||||||||||||||||||||||||||||||||||||||||
HSBC Bank Canada | 8,718 | 211 | 2.42 | 10,232 | 257 | 2.51 | 13,158 | 342 | 2.60 | |||||||||||||||||||||||||||||||||||||||||||||||
Latin America | HSBC Mexico | 2,005 | 90 | 4.49 | 1,061 | 57 | 5.37 | 813 | 41 | 5.04 | ||||||||||||||||||||||||||||||||||||||||||||||
Brazilian operations | 4,795 | 782 | 16.31 | 12,707 | 1,565 | 12.32 | 10,963 | 863 | 7.87 | |||||||||||||||||||||||||||||||||||||||||||||||
HSBC Bank Argentina | – | – | – | 1 | – | – | 52 | 10 | 19.23 | |||||||||||||||||||||||||||||||||||||||||||||||
Other operations | (5,083 | ) | 6 | – | (18,076 | ) | (56 | ) | – | (12,211 | ) | (145 | ) | – | ||||||||||||||||||||||||||||||||||||||||||
| 129,039 | 3,521 | 2.73 | 129,724 | 4,554 | 3.51 | 150,976 | 4,182 | 2.77 | ||||||||||||||||||||||||||||||||||||||||||||||||
Other interest-bearing liabilities | ||||||||||||||||||||||||||||||||||||||||||||||||||||||||
Europe | HSBC Bank | 77,583 | 471 | 0.61 | 103,819 | 646 | 0.62 | 96,464 | 659 | 0.68 | ||||||||||||||||||||||||||||||||||||||||||||||
HSBC Private Banking Holdings (Suisse) | 8,347 | 94 | 1.13 | 7,903 | 23 | 0.29 | 7,869 | 13 | 0.17 | |||||||||||||||||||||||||||||||||||||||||||||||
HSBC France | 10,481 | 112 | 1.07 | 12,838 | 34 | 0.26 | 26,159 | 77 | 0.29 | |||||||||||||||||||||||||||||||||||||||||||||||
HSBC Finance | – | – | – | – | – | – | 23 | – | – | |||||||||||||||||||||||||||||||||||||||||||||||
Asia | Hang Seng Bank | 1,899 | 35 | 1.84 | 1,918 | 45 | 2.35 | 2,021 | 48 | 2.38 | ||||||||||||||||||||||||||||||||||||||||||||||
The Hongkong and Shanghai Banking Corporation | 78,630 | 412 | 0.52 | 91,468 | 635 | 0.69 | 60,056 | 490 | 0.82 | |||||||||||||||||||||||||||||||||||||||||||||||
HSBC Bank Malaysia | 1,158 | 15 | 1.30 | 1,342 | 14 | 1.04 | 1,339 | 8 | 0.60 | |||||||||||||||||||||||||||||||||||||||||||||||
MENA | HSBC Bank Middle East | 2,429 | 46 | 1.89 | 2,617 | 57 | 2.18 | 2,557 | 58 | 2.27 | ||||||||||||||||||||||||||||||||||||||||||||||
North America | HSBC Bank USA | 16,250 | 81 | 0.50 | 17,632 | 11 | 0.06 | 17,793 | 176 | 0.99 | ||||||||||||||||||||||||||||||||||||||||||||||
HSBC Finance | 5,807 | 241 | 4.15 | 5,817 | 258 | 4.44 | 5,265 | 220 | 4.18 | |||||||||||||||||||||||||||||||||||||||||||||||
HSBC Bank Canada | 2,539 | 7 | 0.28 | 599 | 4 | 0.67 | 3,007 | 25 | 0.83 | |||||||||||||||||||||||||||||||||||||||||||||||
Latin America | HSBC Mexico | 837 | 16 | 1.91 | 1,031 | 13 | 1.26 | 1,658 | 19 | 1.15 | ||||||||||||||||||||||||||||||||||||||||||||||
Brazilian operations | 16,943 | 1,897 | 11.20 | 3,927 | 357 | 9.09 | 3,497 | 189 | 5.40 | |||||||||||||||||||||||||||||||||||||||||||||||
HSBC Bank Argentina | 22 | 4 | 18.18 | 40 | 7 | 17.50 | 29 | 3 | 10.34 | |||||||||||||||||||||||||||||||||||||||||||||||
Other operations | (194,529 | ) | (1,145 | ) | (240,831 | ) | (1,509 | ) | (216,392 | ) | (1,235 | ) | ||||||||||||||||||||||||||||||||||||||||||||
| 28,396 | 2,286 | 8.05 | 10,120 | 595 | 5.88 | 11,345 | 750 | 6.61 | ||||||||||||||||||||||||||||||||||||||||||||||||
Total interest-bearing liabilities | ||||||||||||||||||||||||||||||||||||||||||||||||||||||||
Europe | HSBC Holdings | 35,046 | 1,167 | 3.33 | 35,526 | 1,179 | 3.32 | 33,125 | 1,173 | 3.54 | ||||||||||||||||||||||||||||||||||||||||||||||
HSBC Bank | 552,372 | 3,391 | 0.61 | 653,670 | 4,276 | 0.65 | 570,077 | 4,375 | 0.77 | |||||||||||||||||||||||||||||||||||||||||||||||
HSBC Private Banking Holdings (Suisse) | 15,948 | 124 | 0.78 | 16,496 | 55 | 0.33 | 24,701 | 84 | 0.34 | |||||||||||||||||||||||||||||||||||||||||||||||
HSBC France | 63,520 | 342 | 0.54 | 88,634 | 453 | 0.51 | 118,517 | 538 | 0.45 | |||||||||||||||||||||||||||||||||||||||||||||||
HSBC Finance | – | – | – | – | – | – | 23 | – | – | |||||||||||||||||||||||||||||||||||||||||||||||
Asia | Hang Seng Bank | 110,411 | 533 | 0.48 | 102,927 | 535 | 0.52 | 96,293 | 435 | 0.45 | ||||||||||||||||||||||||||||||||||||||||||||||
The Hongkong and Shanghai Banking Corporation | 500,911 | 3,131 | 0.63 | 496,930 | 3,689 | 0.74 | 428,959 | 3,346 | 0.78 | |||||||||||||||||||||||||||||||||||||||||||||||
HSBC Bank Malaysia | 14,425 | 323 | 2.24 | 16,390 | 351 | 2.14 | 16,908 | 350 | 2.07 | |||||||||||||||||||||||||||||||||||||||||||||||
MENA | HSBC Bank Middle East | 20,580 | 148 | 0.72 | 22,994 | 190 | 0.83 | 25,489 | 232 | 0.91 | ||||||||||||||||||||||||||||||||||||||||||||||
North America | HSBC Bank USA | 123,084 | 845 | 0.69 | 110,535 | 568 | 0.51 | 107,549 | 758 | 0.70 | ||||||||||||||||||||||||||||||||||||||||||||||
HSBC Finance | 19,937 | 695 | 3.49 | 26,057 | 799 | 3.07 | 34,031 | 1,039 | 3.05 | |||||||||||||||||||||||||||||||||||||||||||||||
HSBC Bank Canada | 50,108 | 433 | 0.86 | 54,051 | 606 | 1.12 | 61,673 | 729 | 1.18 | |||||||||||||||||||||||||||||||||||||||||||||||
Latin America | HSBC Mexico | 19,043 | 424 | 2.23 | 23,968 | 595 | 2.48 | 20,647 | 579 | 2.80 | ||||||||||||||||||||||||||||||||||||||||||||||
Brazilian operations | 30,034 | 3,564 | 11.87 | 38,395 | 3,930 | 10.24 | 39,522 | 2,700 | 6.83 | |||||||||||||||||||||||||||||||||||||||||||||||
HSBC Bank Argentina | 3,026 | 442 | 14.61 | 2,812 | 381 | 13.55 | 3,419 | 358 | 10.47 | |||||||||||||||||||||||||||||||||||||||||||||||
Other operations | (92,810 | ) | (904 | ) | (142,752 | ) | (1,357 | ) | (154,753 | ) | (1,043 | ) | ||||||||||||||||||||||||||||||||||||||||||||
| 1,465,635 | 14,658 | 1.00 | 1,546,633 | 16,250 | 1.05 | 1,426,180 | 15,653 | 1.10 | ||||||||||||||||||||||||||||||||||||||||||||||||
For footnotes, see page 100a.
HSBC HOLDINGS PLC
63e
Table of Contents
Report of the Directors: Financial Review(continued)
Net interest margin59
| 2015 | 2014 | 2013 | ||||||||||||||||||
| % | % | % | ||||||||||||||||||
Total | 1.88 | 1.94 | 2.13 | |||||||||||||||||
Europe | HSBC Bank | 1.53 | 1.30 | 1.49 | ||||||||||||||||
| HSBC Private Banking Holdings (Suisse) | 0.35 | 0.67 | 0.72 | |||||||||||||||||
| HSBC France | 1.36 | 1.52 | 1.11 | |||||||||||||||||
| HSBC Finance | – | – | 5.78 | |||||||||||||||||
Asia | Hang Seng Bank | 2.03 | 2.16 | 2.13 | ||||||||||||||||
| The Hongkong and Shanghai Banking Corporation | 1.46 | 1.58 | 1.70 | |||||||||||||||||
| HSBC Bank Malaysia | 2.56 | 2.68 | 2.58 | |||||||||||||||||
MENA | HSBC Bank Middle East | 2.46 | 2.52 | 2.51 | ||||||||||||||||
North America | HSBC Bank USA | 1.39 | 1.51 | 1.44 | ||||||||||||||||
| HSBC Finance | 3.76 | 4.23 | 4.99 | |||||||||||||||||
| HSBC Bank Canada | 1.56 | 1.74 | 1.58 | |||||||||||||||||
Latin America | HSBC Mexico | 5.25 | 5.02 | 5.88 | ||||||||||||||||
| Brazilian operations | 5.58 | 6.14 | 7.60 | |||||||||||||||||
| HSBC Bank Argentina | 11.52 | 11.79 | 9.88 | |||||||||||||||||
Distribution of average total assets
| ||||||||||||||||||||
| 2015 | 2014 | 2013 | ||||||||||||||||||
| % | % | % | ||||||||||||||||||
Europe | HSBC Bank | 37.0 | 39.2 | 40.1 | ||||||||||||||||
| HSBC Private Banking Holdings (Suisse) | 1.4 | 1.5 | 2.0 | |||||||||||||||||
| HSBC France | 7.4 | 9.0 | 11.4 | |||||||||||||||||
Asia | Hang Seng Bank | 6.5 | 5.7 | 5.3 | ||||||||||||||||
| The Hongkong and Shanghai Banking Corporation | 30.0 | 26.3 | 25.0 | |||||||||||||||||
| HSBC Bank Malaysia | 0.9 | 0.9 | 1.0 | |||||||||||||||||
MENA | HSBC Bank Middle East | 1.9 | 1.9 | 2.0 | ||||||||||||||||
North America | HSBC Bank USA | 9.6 | 8.5 | 8.7 | ||||||||||||||||
| HSBC Finance | 1.2 | 1.3 | 1.7 | |||||||||||||||||
| HSBC Bank Canada | 2.8 | 3.0 | 3.2 | |||||||||||||||||
Latin America | HSBC Mexico | 1.4 | 1.5 | 1.5 | ||||||||||||||||
| Brazilian operations | 2.0 | 2.4 | 2.3 | |||||||||||||||||
| HSBC Bank Argentina | – | – | – | |||||||||||||||||
Other operations (including consolidation adjustments) | (2.1 | ) | (1.2 | ) | (4.2 | ) | ||||||||||||||
| 100.0 | 100.0 | 100.0 | ||||||||||||||||||
For footnote, see page 100a.
HSBC HOLDINGS PLC
63f
Table of Contents
Report of the Directors: Financial Summary(continued)
Analysis of changes in net interest income and net interest expense
The following tables allocate changes in net interest income and net interest expense between volume and rate for 2015 compared with 2014, and for 2014 compared with 2013. We isolate volume variances and allocate any change arising from both volume and rate to rate.
Interest income
Increase/(decrease) in 2015 compared with 2014 | Increase/(decrease) in 2014 compared with 2013 | |||||||||||||||||||||||||||||||||||||||||||
| 2015 | Volume | Rate | 2014 | Volume | Rate | 2013 | ||||||||||||||||||||||||||||||||||||||
| $m | $m | $m | $m | $m | $m | $m | ||||||||||||||||||||||||||||||||||||||
Short-term funds and loans and advances to banks | ||||||||||||||||||||||||||||||||||||||||||||
Europe | HSBC Bank | 827 | (181 | ) | 11 | 997 | 66 | 51 | 880 | |||||||||||||||||||||||||||||||||||
| HSBC Private Banking Holdings (Suisse) | 4 | 2 | (8 | ) | 10 | (4 | ) | 4 | 10 | |||||||||||||||||||||||||||||||||||
| HSBC France | 40 | (17 | ) | (9 | ) | 66 | (31 | ) | 4 | 93 | ||||||||||||||||||||||||||||||||||
Asia | Hang Seng Bank | 210 | (18 | ) | (51 | ) | 279 | (17 | ) | 45 | 251 | |||||||||||||||||||||||||||||||||
The Hongkong and Shanghai Banking Corporation | 536 | (17 | ) | (269 | ) | 822 | 57 | (44 | ) | 809 | ||||||||||||||||||||||||||||||||||
| HSBC Bank Malaysia | 121 | (33 | ) | (4 | ) | 158 | (13 | ) | 9 | 162 | ||||||||||||||||||||||||||||||||||
MENA | HSBC Bank Middle East | 30 | 2 | (1 | ) | 29 | (2 | ) | 4 | 27 | ||||||||||||||||||||||||||||||||||
North America | HSBC Bank USA | 134 | 26 | 3 | 105 | 11 | 10 | 84 | ||||||||||||||||||||||||||||||||||||
| HSBC Bank Canada | 2 | 1 | (3 | ) | 4 | 1 | – | 3 | ||||||||||||||||||||||||||||||||||||
Latin America | HSBC Mexico | 76 | (7 | ) | (3 | ) | 86 | (7 | ) | (16 | ) | 109 | ||||||||||||||||||||||||||||||||
| Brazilian operations | 193 | (340 | ) | 35 | 498 | (11 | ) | 121 | 388 | |||||||||||||||||||||||||||||||||||
| HSBC Bank Argentina | 4 | – | (8 | ) | 12 | (2 | ) | (4 | ) | 18 | ||||||||||||||||||||||||||||||||||
Other operations | 100 | 1 | 97 | 2 | (5 | ) | (10 | ) | 17 | |||||||||||||||||||||||||||||||||||
| 2,277 | (196 | ) | (595 | ) | 3,068 | 9 | 208 | 2,851 | ||||||||||||||||||||||||||||||||||||
Loans and advances to customers | ||||||||||||||||||||||||||||||||||||||||||||
Europe | HSBC Bank | 9,916 | (396 | ) | (111 | ) | 10,423 | 386 | (594 | ) | 10,631 | |||||||||||||||||||||||||||||||||
| HSBC Private Banking Holdings (Suisse) | 136 | (12 | ) | (11 | ) | 159 | (28 | ) | (7 | ) | 194 | |||||||||||||||||||||||||||||||||
| HSBC France | 1,252 | (92 | ) | (282 | ) | 1,626 | (128 | ) | 98 | 1,656 | ||||||||||||||||||||||||||||||||||
| HSBC Finance | – | – | – | – | (10 | ) | – | 10 | ||||||||||||||||||||||||||||||||||||
Asia | Hang Seng Bank | 2,579 | 199 | (30 | ) | 2,410 | 211 | 20 | 2,179 | |||||||||||||||||||||||||||||||||||
The Hongkong and Shanghai Banking Corporation | 8,082 | (65 | ) | (370 | ) | 8,517 | 870 | (375 | ) | 8,022 | ||||||||||||||||||||||||||||||||||
| HSBC Bank Malaysia | 589 | (51 | ) | (32 | ) | 672 | (19 | ) | 8 | 683 | ||||||||||||||||||||||||||||||||||
MENA | HSBC Bank Middle East | 1,041 | 26 | (118 | ) | 1,133 | 48 | (39 | ) | 1,124 | ||||||||||||||||||||||||||||||||||
North America | HSBC Bank USA | 1,981 | 288 | (98 | ) | 1,791 | 227 | (212 | ) | 1,776 | ||||||||||||||||||||||||||||||||||
| HSBC Finance | 1,705 | (404 | ) | (62 | ) | 2,171 | (691 | ) | (202 | ) | 3,064 | |||||||||||||||||||||||||||||||||
| HSBC Bank Canada | 1,086 | (153 | ) | (132 | ) | 1,371 | (63 | ) | 3 | 1,431 | ||||||||||||||||||||||||||||||||||
Latin America | HSBC Mexico | 1,319 | (143 | ) | (80 | ) | 1,542 | 47 | (163 | ) | 1,658 | |||||||||||||||||||||||||||||||||
| Brazilian operations | 1,915 | (2,835 | ) | 171 | 4,579 | 284 | (309 | ) | 4,604 | |||||||||||||||||||||||||||||||||||
| HSBC Bank Argentina | 880 | 79 | 3 | 798 | (119 | ) | 118 | 799 | ||||||||||||||||||||||||||||||||||||
Other operations | 623 | 102 | 284 | 237 | (134 | ) | (327 | ) | 698 | |||||||||||||||||||||||||||||||||||
| 33,104 | (868 | ) | (3,457 | ) | 37,429 | 1,458 | (2,558 | ) | 38,529 | |||||||||||||||||||||||||||||||||||
Reverse repurchase agreements – non-trading | ||||||||||||||||||||||||||||||||||||||||||||
Europe | HSBC Bank | 354 | (91 | ) | (5 | ) | 450 | 153 | 184 | 113 | ||||||||||||||||||||||||||||||||||
| HSBC France | 7 | (35 | ) | (20 | ) | 62 | (16 | ) | 30 | 48 | ||||||||||||||||||||||||||||||||||
Asia | The Hongkong and Shanghai Banking Corporation | 273 | 44 | (104 | ) | 333 | 275 | (214 | ) | 272 | ||||||||||||||||||||||||||||||||||
| HSBC Bank Malaysia | 32 | – | 1 | 31 | 18 | 2 | 11 | |||||||||||||||||||||||||||||||||||||
MENA | HSBC Bank Middle East | 2 | 28 | (28 | ) | 2 | (7 | ) | 2 | 7 | ||||||||||||||||||||||||||||||||||
North America | HSBC Bank USA | 23 | 29 | (16 | ) | 10 | (5 | ) | 2 | 13 | ||||||||||||||||||||||||||||||||||
| HSBC Finance | – | – | – | – | – | – | – | |||||||||||||||||||||||||||||||||||||
| HSBC Bank Canada | 40 | (16 | ) | (28 | ) | 84 | (20 | ) | 11 | 93 | ||||||||||||||||||||||||||||||||||
Latin America | HSBC Mexico | 27 | 26 | (2 | ) | 3 | (2 | ) | – | 5 | ||||||||||||||||||||||||||||||||||
| Brazilian operations | 421 | (415 | ) | 83 | 753 | 124 | 225 | 404 | ||||||||||||||||||||||||||||||||||||
| HSBC Bank Argentina | 7 | (5 | ) | 2 | 10 | (5 | ) | 2 | 13 | |||||||||||||||||||||||||||||||||||
Other operations | 115 | (8 | ) | 61 | 62 | 77 | (31 | ) | 16 | |||||||||||||||||||||||||||||||||||
| 1,301 | (327 | ) | (172 | ) | 1,800 | 730 | 75 | 995 | ||||||||||||||||||||||||||||||||||||
HSBC HOLDINGS PLC
63g
Table of Contents
Report of the Directors: Financial Summary(continued)
Interest income(continued)
Increase/(decrease) in 2015 compared with 2014 | Increase/(decrease) in 2014 compared with 2013 | |||||||||||||||||||||||||||||||||||||||||||
| 2015 | Volume | Rate | 2014 | Volume | Rate | 2013 | ||||||||||||||||||||||||||||||||||||||
| $m | $m | $m | $m | $m | $m | $m | ||||||||||||||||||||||||||||||||||||||
Financial investments | ||||||||||||||||||||||||||||||||||||||||||||
Europe | HSBC Bank | 753 | (237 | ) | 123 | 867 | 168 | (524 | ) | 1,223 | ||||||||||||||||||||||||||||||||||
| HSBC Private Banking Holdings (Suisse) | 75 | (36 | ) | (3 | ) | 114 | (35 | ) | (34 | ) | 183 | |||||||||||||||||||||||||||||||||
| HSBC France | 17 | 8 | (104 | ) | 113 | (7 | ) | 26 | 94 | |||||||||||||||||||||||||||||||||||
Asia | Hang Seng Bank | 647 | 131 | (139 | ) | 655 | 33 | 21 | 601 | |||||||||||||||||||||||||||||||||||
| The Hongkong and Shanghai Banking Corporation | 1,909 | 194 | (394 | ) | 2,109 | 227 | 101 | 1,781 | ||||||||||||||||||||||||||||||||||||
| HSBC Bank Malaysia | 104 | 4 | 6 | 94 | 18 | 4 | 72 | |||||||||||||||||||||||||||||||||||||
MENA | HSBC Bank Middle East | 70 | (23 | ) | (11 | ) | 104 | (13 | ) | 4 | 113 | |||||||||||||||||||||||||||||||||
North America | HSBC Bank USA | 893 | 21 | 98 | 774 | (131 | ) | 21 | 884 | |||||||||||||||||||||||||||||||||||
| HSBC Finance | – | – | – | – | – | – | – | |||||||||||||||||||||||||||||||||||||
| HSBC Bank Canada | 199 | (7 | ) | (40 | ) | 246 | (33 | ) | – | 279 | ||||||||||||||||||||||||||||||||||
Latin America | HSBC Mexico | 286 | (149 | ) | 26 | 409 | 96 | (38 | ) | 351 | ||||||||||||||||||||||||||||||||||
| Brazilian operations | 515 | (580 | ) | 92 | 1,003 | 94 | 169 | 740 | ||||||||||||||||||||||||||||||||||||
| HSBC Bank Argentina | 149 | 33 | (14 | ) | 130 | 11 | 48 | 71 | ||||||||||||||||||||||||||||||||||||
Other operations | 1,891 | 1,204 | (1,018 | ) | 1,705 | (403 | ) | 498 | 1,610 | |||||||||||||||||||||||||||||||||||
| 7,508 | (77 | ) | (738 | ) | 8,323 | 132 | 189 | 8,002 | ||||||||||||||||||||||||||||||||||||
Interest expense
|
| |||||||||||||||||||||||||||||||||||||||||||
Increase/(decrease) in 2015 compared with 2014 | Increase/(decrease) in 2014 compared with 2013 | |||||||||||||||||||||||||||||||||||||||||||
| 2015 | Volume | Rate | 2014 | Volume | Rate | 2013 | ||||||||||||||||||||||||||||||||||||||
| $m | $m | $m | $m | $m | $m | $m | ||||||||||||||||||||||||||||||||||||||
Deposits by banks | ||||||||||||||||||||||||||||||||||||||||||||
Europe | HSBC Bank | 75 | (19 | ) | (45 | ) | 139 | (6 | ) | (20 | ) | 165 | ||||||||||||||||||||||||||||||||
| HSBC Private Banking Holdings (Suisse) | 1 | – | – | 1 | – | – | 1 | |||||||||||||||||||||||||||||||||||||
| HSBC France | 41 | 10 | (22 | ) | 53 | (14 | ) | (2 | ) | 69 | ||||||||||||||||||||||||||||||||||
Asia | Hang Seng Bank | 19 | 1 | 9 | 9 | (2 | ) | (4 | ) | 15 | ||||||||||||||||||||||||||||||||||
| The Hongkong and Shanghai Banking Corporation | 80 | (1 | ) | 2 | 79 | 22 | (33 | ) | 90 | |||||||||||||||||||||||||||||||||||
| HSBC Bank Malaysia | 26 | (3 | ) | 3 | 26 | 5 | 1 | 20 | ||||||||||||||||||||||||||||||||||||
MENA | HSBC Bank Middle East | 3 | (1 | ) | 1 | 3 | (1 | ) | 1 | 3 | ||||||||||||||||||||||||||||||||||
North America | HSBC Bank USA | 17 | (2 | ) | 7 | 12 | (3 | ) | (1 | ) | 16 | |||||||||||||||||||||||||||||||||
| HSBC Bank Canada | 1 | – | – | 1 | (1 | ) | – | 2 | ||||||||||||||||||||||||||||||||||||
Latin America | HSBC Mexico | 55 | (20 | ) | 2 | 73 | 48 | (21 | ) | 46 | ||||||||||||||||||||||||||||||||||
| Brazilian operations | 49 | (47 | ) | 12 | 84 | (29 | ) | 19 | 94 | |||||||||||||||||||||||||||||||||||
| HSBC Bank Argentina | 2 | – | 1 | 1 | (1 | ) | – | 2 | ||||||||||||||||||||||||||||||||||||
Other operations | 9 | – | 9 | – | 138 | (170 | ) | 32 | ||||||||||||||||||||||||||||||||||||
| 378 | (47 | ) | (170 | ) | 481 | (4 | ) | (70 | ) | 555 | ||||||||||||||||||||||||||||||||||
Customer accounts | ||||||||||||||||||||||||||||||||||||||||||||
Europe | HSBC Bank | 2,051 | (46 | ) | (171 | ) | 2,268 | 288 | (249 | ) | 2,229 | |||||||||||||||||||||||||||||||||
| HSBC Private Banking Holdings (Suisse) | 29 | (4 | ) | 2 | 31 | (35 | ) | (4 | ) | 70 | ||||||||||||||||||||||||||||||||||
| HSBC France | 116 | (46 | ) | (27 | ) | 189 | (34 | ) | (14 | ) | 237 | |||||||||||||||||||||||||||||||||
Asia | Hang Seng Bank | 464 | 38 | (46 | ) | 472 | 27 | 85 | 360 | |||||||||||||||||||||||||||||||||||
| The Hongkong and Shanghai Banking Corporation | 2,446 | 121 | (418 | ) | 2,743 | 243 | (48 | ) | 2,548 | |||||||||||||||||||||||||||||||||||
| HSBC Bank Malaysia | 264 | (34 | ) | 7 | 291 | (5 | ) | 1 | 295 | |||||||||||||||||||||||||||||||||||
MENA | HSBC Bank Middle East | 53 | (10 | ) | (12 | ) | 75 | (11 | ) | (20 | ) | 106 | ||||||||||||||||||||||||||||||||
North America | HSBC Bank USA | 147 | 6 | 63 | 78 | 1 | (27 | ) | 104 | |||||||||||||||||||||||||||||||||||
| HSBC Bank Canada | 197 | (37 | ) | (85 | ) | 319 | (10 | ) | (1 | ) | 330 | |||||||||||||||||||||||||||||||||
Latin America | HSBC Mexico | 201 | (49 | ) | (50 | ) | 300 | (7 | ) | (76 | ) | 383 | ||||||||||||||||||||||||||||||||
| Brazilian operations | 830 | (1,144 | ) | 146 | 1,828 | (147 | ) | 508 | 1,467 | |||||||||||||||||||||||||||||||||||
| HSBC Bank Argentina | 436 | 31 | 32 | 373 | (58 | ) | 88 | 343 | ||||||||||||||||||||||||||||||||||||
Other operations | 167 | (19 | ) | 22 | 164 | (65 | ) | (93 | ) | 322 | ||||||||||||||||||||||||||||||||||
| 7,401 | (106 | ) | (1,624 | ) | 9,131 | 450 | (113 | ) | 8,794 | |||||||||||||||||||||||||||||||||||
HSBC HOLDINGS PLC
63h
Table of Contents
Report of the Directors: Financial Summary(continued)
Interest expense(continued)
Increase/(decrease) in 2015 compared with 2014 | Increase/(decrease) in 2014 compared with 2013 | |||||||||||||||||||||||||||||||||||||||||||
| 2015 | Volume | Rate | 2014 | Volume | Rate | 2013 | ||||||||||||||||||||||||||||||||||||||
| $m | $m | $m | $m | $m | $m | $m | ||||||||||||||||||||||||||||||||||||||
Repurchase agreements – non-trading | ||||||||||||||||||||||||||||||||||||||||||||
Europe | HSBC Bank | 119 | (118 | ) | 24 | 213 | 165 | (63 | ) | 111 | ||||||||||||||||||||||||||||||||||
| HSBC France | 2 | (41 | ) | (16 | ) | 59 | (7 | ) | 32 | 34 | ||||||||||||||||||||||||||||||||||
Asia | Hang Seng Bank | 4 | – | 4 | – | – | – | – | ||||||||||||||||||||||||||||||||||||
| The Hongkong and Shanghai Banking Corporation | 70 | 40 | (26 | ) | 56 | 40 | (16 | ) | 32 | |||||||||||||||||||||||||||||||||||
| HSBC Bank Malaysia | 1 | – | – | 1 | (1 | ) | 1 | 1 | ||||||||||||||||||||||||||||||||||||
MENA | HSBC Bank Middle East | – | – | – | – | (1 | ) | – | 1 | |||||||||||||||||||||||||||||||||||
North America | HSBC Bank USA | 26 | (8 | ) | 14 | 20 | 3 | 5 | 12 | |||||||||||||||||||||||||||||||||||
| HSBC Bank Canada | 17 | 4 | (12 | ) | 25 | (8 | ) | 3 | 30 | |||||||||||||||||||||||||||||||||||
Latin America | HSBC Mexico | 62 | (84 | ) | (6 | ) | 152 | 141 | (79 | ) | 90 | |||||||||||||||||||||||||||||||||
| Brazilian operations | 6 | (61 | ) | (29 | ) | 96 | (15 | ) | 24 | 87 | ||||||||||||||||||||||||||||||||||
| HSBC Bank Argentina | – | – | – | – | – | – | – | |||||||||||||||||||||||||||||||||||||
Other operations | 48 | (2 | ) | 20 | 30 | 33 | (10 | ) | 7 | |||||||||||||||||||||||||||||||||||
| 355 | (247 | ) | (50 | ) | 652 | 414 | (167 | ) | 405 | |||||||||||||||||||||||||||||||||||
Financial liabilities designated at fair value – own debt issued | ||||||||||||||||||||||||||||||||||||||||||||
| Debt securities in issue | ||||||||||||||||||||||||||||||||||||||||||||
Europe | HSBC Holdings | 904 | (31 | ) | (10 | ) | 945 | 203 | (65 | ) | 807 | |||||||||||||||||||||||||||||||||
| HSBC Bank | 359 | (160 | ) | (70 | ) | 589 | (90 | ) | (89 | ) | 768 | |||||||||||||||||||||||||||||||||
| HSBC France | 40 | 7 | (19 | ) | 52 | (10 | ) | 8 | 54 | |||||||||||||||||||||||||||||||||||
Asia | Hang Seng Bank | 7 | (5 | ) | 4 | 8 | (2 | ) | (2 | ) | 12 | |||||||||||||||||||||||||||||||||
| The Hongkong and Shanghai Banking Corporation | 123 | (23 | ) | (30 | ) | 176 | (28 | ) | 18 | 186 | ||||||||||||||||||||||||||||||||||
| HSBC Bank Malaysia | 17 | (3 | ) | 1 | 19 | (14 | ) | 7 | 26 | |||||||||||||||||||||||||||||||||||
MENA | HSBC Bank Middle East | 33 | (1 | ) | (11 | ) | 45 | (17 | ) | (2 | ) | 64 | ||||||||||||||||||||||||||||||||
North America | HSBC Bank USA | 542 | 394 | (266 | ) | 414 | 57 | (58 | ) | 415 | ||||||||||||||||||||||||||||||||||
| HSBC Finance | 407 | (151 | ) | 75 | 483 | (255 | ) | (1 | ) | 739 | ||||||||||||||||||||||||||||||||||
| HSBC Bank Canada | 211 | (38 | ) | (8 | ) | 257 | (76 | ) | (9 | ) | 342 | |||||||||||||||||||||||||||||||||
Latin America | HSBC Mexico | 90 | 51 | (18 | ) | 57 | 12 | 4 | 41 | |||||||||||||||||||||||||||||||||||
| Brazilian operations | 782 | (975 | ) | 192 | 1,565 | 137 | 565 | 863 | ||||||||||||||||||||||||||||||||||||
| HSBC Bank Argentina | – | – | – | – | (10 | ) | – | 10 | ||||||||||||||||||||||||||||||||||||
Other operations | 6 | – | 62 | (56 | ) | – | 89 | (145 | ) | |||||||||||||||||||||||||||||||||||
| 3,521 | (24 | ) | (1,009 | ) | 4,554 | (589 | ) | 961 | 4,182 | |||||||||||||||||||||||||||||||||||
HSBC HOLDINGS PLC
63i
Table of Contents
Report of the Directors: Financial Review(continued)
Short-term borrowings in the form of repurchase agreements are shown separately on the face of the balance sheet. Other forms of short-term borrowings are included within customer accounts, deposits by banks, debt securities in issue and trading liabilities. Short-term borrowings are defined by the US Securities and Exchange Commission as Federal funds purchased and securities sold under agreements to repurchase, commercial paper and other short-term borrowings.
Our only significant short-term borrowings are securities sold under agreements to repurchase and certain debt securities in issue. For securities sold under agreements to repurchase, we run matched repo and reverse repo trading books. We generally observe lower year-end demand in our reverse repo lending business which results in lower repo balances at the balance sheet date. Additional information on these is provided in the table below.
Repos and short-term bonds
| 2015 | 2014 | 2013 | ||||||||||||||||
| $m | $m | $m | ||||||||||||||||
Securities sold under agreements to repurchase | ||||||||||||||||||
Outstanding at 31 December | 80,842 | 111,230 | 181,641 | |||||||||||||||
Average amount outstanding during the year | 120,241 | 195,482 | 218,580 | |||||||||||||||
Maximum quarter-end balance outstanding during the year | 120,141 | 227,637 | 210,452 | |||||||||||||||
Weighted average interest rate during the year | 0.4% | 0.3% | 0.3% | |||||||||||||||
Weighted average interest rate at the year-end | 0.8% | 0.6% | 0.5% | |||||||||||||||
Short-term bonds | ||||||||||||||||||
Outstanding at 31 December | 36,614 | 38,868 | 40,667 | |||||||||||||||
Average amount outstanding during the year | 40,449 | 39,547 | 46,455 | |||||||||||||||
Maximum quarter-end balance outstanding during the year | 42,483 | 41,117 | 54,933 | |||||||||||||||
Weighted average interest rate during the year | 1.3% | 1.7% | 1.4% | |||||||||||||||
Weighted average interest rate at the year-end | 1.2% | 1.6% | 0.7% | |||||||||||||||
Contractual obligations
The table below provides details of our material contractual obligations as at 31 December 2015.
| Payments due by period | ||||||||||||||||||||||||||||||
| Total | Less than 1 year | 1–3 years | 3–5 years | More than 5 years | ||||||||||||||||||||||||||
| $m | $m | $m | $m | $m | ||||||||||||||||||||||||||
Long-term debt obligations | 178,557 | 47,244 | 43,141 | 27,214 | 60,958 | |||||||||||||||||||||||||
Term deposits and certificates of deposit | 97,591 | 89,701 | 6,958 | 594 | 338 | |||||||||||||||||||||||||
Capital (finance) lease obligations | 48 | 17 | 10 | 4 | 17 | |||||||||||||||||||||||||
Operating lease obligations | 5,333 | 980 | 1,543 | 1,085 | 1,725 | |||||||||||||||||||||||||
Purchase obligations | 468 | 377 | 5 | 34 | 52 | |||||||||||||||||||||||||
Short positions in debt securities and equity shares | 43,828 | 28,677 | 5,093 | 1,565 | 8,493 | |||||||||||||||||||||||||
Current tax liability | 783 | 783 | – | – | – | |||||||||||||||||||||||||
Pension/healthcare obligation | 17,016 | 1,488 | 3,057 | 3,354 | 9,117 | |||||||||||||||||||||||||
| 343,624 | 169,267 | 59,807 | 33,850 | 80,700 | ||||||||||||||||||||||||||
HSBC HOLDINGS PLC
63j
Table of Contents
Report of the Directors: Financial Review(continued)
Loan maturity and interest sensitivity analysis
At 31 December 2015, the geographical analysis of loan maturity and interest sensitivity by loan type on a contractual repayment basis was as follows:
| Europe | Asia | MENA | North America | Latin America | Total | |||||||||||||||||||||||||||||||
| $m | $m | $m | $m | $m | $m | |||||||||||||||||||||||||||||||
Maturity of 1 year or less | ||||||||||||||||||||||||||||||||||||
Loans and advances to banks | 14,045 | 50,016 | 7,271 | 5,726 | 3,312 | 80,370 | ||||||||||||||||||||||||||||||
Commercial loans to customers | ||||||||||||||||||||||||||||||||||||
Manufacturing and international trade and services | 60,605 | 83,210 | 9,049 | 10,904 | 3,285 | 167,053 | ||||||||||||||||||||||||||||||
Real estate and other property related | 10,833 | 22,548 | 1,537 | 4,469 | 719 | 40,106 | ||||||||||||||||||||||||||||||
Non-bank financial institutions | 16,121 | 11,078 | 216 | 6,636 | 411 | 34,462 | ||||||||||||||||||||||||||||||
Governments | 1,550 | 329 | 1,445 | 20 | 286 | 3,630 | ||||||||||||||||||||||||||||||
Other commercial | 28,929 | 17,458 | 2,986 | 6,324 | 974 | 56,671 | ||||||||||||||||||||||||||||||
| 118,038 | 134,623 | 15,233 | 28,353 | 5,675 | 301,922 | |||||||||||||||||||||||||||||||
Maturity after 1 year but within 5 years | ||||||||||||||||||||||||||||||||||||
Loans and advances to banks | 4,000 | 3,104 | 648 | 654 | 2 | 8,408 | ||||||||||||||||||||||||||||||
Commercial loans to customers | ||||||||||||||||||||||||||||||||||||
Manufacturing and international trade and services | 31,424 | 21,834 | 2,386 | 15,576 | 1,956 | 73,176 | ||||||||||||||||||||||||||||||
Real estate and other property related | 18,694 | 36,206 | 900 | 8,312 | 260 | 64,372 | ||||||||||||||||||||||||||||||
Non-bank financial institutions | 13,713 | 2,885 | 1,747 | 3,023 | 250 | 21,618 | ||||||||||||||||||||||||||||||
Governments | 1,064 | 286 | 250 | 90 | 106 | 1,796 | ||||||||||||||||||||||||||||||
Other commercial | 16,871 | 14,233 | 1,807 | 8,936 | 1,198 | 43,045 | ||||||||||||||||||||||||||||||
| 81,766 | 75,444 | 7,090 | 35,937 | 3,770 | 204,007 | |||||||||||||||||||||||||||||||
Interest rate sensitivity of loans and advances to banks and commercial loans to customers | ||||||||||||||||||||||||||||||||||||
Fixed interest rate | 16,908 | 2,182 | 1,027 | 4,003 | 898 | 25,018 | ||||||||||||||||||||||||||||||
Variable interest rate | 68,858 | 76,366 | 6,711 | 32,588 | 2,874 | 187,397 | ||||||||||||||||||||||||||||||
| 85,766 | 78,548 | 7,738 | 36,591 | 3,772 | 212,415 | |||||||||||||||||||||||||||||||
Maturity after 5 years | ||||||||||||||||||||||||||||||||||||
Loans and advances to banks | 303 | 1,233 | – | 105 | – | 1,641 | ||||||||||||||||||||||||||||||
Commercial loans to customers | ||||||||||||||||||||||||||||||||||||
Manufacturing and international trade and services | 9,641 | 1,427 | 621 | 2,532 | 427 | 14,648 | ||||||||||||||||||||||||||||||
Real estate and other property related | 4,052 | 8,823 | 161 | 3,233 | 643 | 16,912 | ||||||||||||||||||||||||||||||
Non-bank financial institutions | 3,785 | 7 | 357 | 163 | 20 | 4,332 | ||||||||||||||||||||||||||||||
Governments | 1,039 | 517 | – | 93 | 380 | 2,029 | ||||||||||||||||||||||||||||||
Other commercial | 7,063 | 4,353 | 1,126 | 2,393 | 1,140 | 16,075 | ||||||||||||||||||||||||||||||
| 25,580 | 15,127 | 2,265 | 8,414 | 2,610 | 53,996 | |||||||||||||||||||||||||||||||
Interest rate sensitivity of loans and advances to banks and commercial loans to customers | ||||||||||||||||||||||||||||||||||||
Fixed interest rate | 6,020 | 1,230 | 530 | 1,063 | 345 | 9,188 | ||||||||||||||||||||||||||||||
Variable interest rate | 19,863 | 15,130 | 1,735 | 7,456 | 2,265 | 46,449 | ||||||||||||||||||||||||||||||
| 25,883 | 16,360 | 2,265 | 8,519 | 2,610 | 55,637 | |||||||||||||||||||||||||||||||
HSBC HOLDINGS PLC
63k
Table of Contents
Report of the Directors: Financial Review(continued)
The following tables summarise the average amount of bank deposits, customer deposits and certificates of deposit (‘CD’s) and other money market instruments (which are included within ‘Debt securities in issue’ in
the balance sheet), together with the average interest rates paid thereon for each of the past three years. The geographical analysis of average deposits is based on the location of the office in which the deposits are recorded and excludes balances with HSBC companies.
Deposits by banks
| 2015 | 2014 | 2013 | ||||||||||||||||||||||||||||||||||
Average balance | Average rate | Average balance | Average rate | Average balance | Average rate | |||||||||||||||||||||||||||||||
| $m | % | $m | % | $m | % | |||||||||||||||||||||||||||||||
Europe | 32,367 | 36,427 | 42,687 | |||||||||||||||||||||||||||||||||
Demand and other – non-interest bearing | 8,094 | – | 8,819 | – | 13,198 | – | ||||||||||||||||||||||||||||||
Demand – interest bearing | 5,412 | 0.3 | 5,778 | 0.4 | 5,154 | 0.5 | ||||||||||||||||||||||||||||||
Time | 9,885 | 0.9 | 14,191 | 1.0 | 17,465 | 1.1 | ||||||||||||||||||||||||||||||
Other | 8,976 | 0.2 | 7,639 | 0.4 | 6,870 | 0.7 | ||||||||||||||||||||||||||||||
Asia | 27,618 | 26,524 | 26,928 | |||||||||||||||||||||||||||||||||
Demand and other – non-interest bearing | 6,114 | – | 5,189 | – | 9,606 | – | ||||||||||||||||||||||||||||||
Demand – interest bearing | 16,107 | 0.5 | 13,828 | 0.5 | 12,181 | 0.6 | ||||||||||||||||||||||||||||||
Time | 2,209 | 1.5 | 3,581 | 0.7 | 4,282 | 0.8 | ||||||||||||||||||||||||||||||
Other | 3,188 | 0.5 | 3,926 | 0.3 | 859 | 1.6 | ||||||||||||||||||||||||||||||
Middle East and North Africa | 1,478 | 1,546 | 2,529 | |||||||||||||||||||||||||||||||||
Demand and other – non-interest bearing | 730 | – | 563 | – | 1,058 | – | ||||||||||||||||||||||||||||||
Demand – interest bearing | 3 | – | 3 | – | 12 | – | ||||||||||||||||||||||||||||||
Time | 723 | 0.4 | 938 | 0.2 | 1,422 | 0.2 | ||||||||||||||||||||||||||||||
Other | 22 | – | 42 | – | 37 | – | ||||||||||||||||||||||||||||||
North America | 9,327 | 10,497 | 12,237 | |||||||||||||||||||||||||||||||||
Demand and other – non-interest bearing | 3,499 | – | 3,686 | – | 3,488 | – | ||||||||||||||||||||||||||||||
Demand – interest bearing | 1,956 | 0.2 | 2,557 | 0.1 | 2,787 | 0.1 | ||||||||||||||||||||||||||||||
Time | 3,746 | 0.4 | 3,308 | 0.3 | 5,110 | 0.3 | ||||||||||||||||||||||||||||||
Other | 126 | – | 946 | 0.1 | 852 | – | ||||||||||||||||||||||||||||||
Latin America | 2,719 | 4,642 | 4,703 | |||||||||||||||||||||||||||||||||
Demand and other – non-interest bearing | 88 | – | 162 | – | 118 | – | ||||||||||||||||||||||||||||||
Demand – interest bearing | 205 | 7.8 | 837 | 3.8 | 333 | 4.5 | ||||||||||||||||||||||||||||||
Time | 1,905 | 4.5 | 2,244 | 3.0 | 2,783 | 3.1 | ||||||||||||||||||||||||||||||
Other | 521 | 10.4 | 1,399 | 4.4 | 1,469 | 4.4 | ||||||||||||||||||||||||||||||
Total | 73,509 | 79,636 | 89,084 | |||||||||||||||||||||||||||||||||
Demand and other – non-interest bearing | 18,525 | – | 18,419 | – | 27,467 | – | ||||||||||||||||||||||||||||||
Demand – interest bearing | 23,683 | 0.5 | 23,003 | 0.6 | 20,468 | 0.5 | ||||||||||||||||||||||||||||||
Time | 18,468 | 1.2 | 24,262 | 1.0 | 31,062 | 1.1 | ||||||||||||||||||||||||||||||
Other | 12,833 | 0.6 | 13,952 | 0.7 | 10,087 | 1.2 | ||||||||||||||||||||||||||||||
HSBC HOLDINGS PLC
63l
Table of Contents
Report of the Directors: Financial Review(continued)
Customer accounts
| 2015 | 2014 | 2013 | ||||||||||||||||||||||||||||||||||
Average balance | Average rate | Average balance | Average rate | Average balance | Average rate | |||||||||||||||||||||||||||||||
| $m | % | $m | % | $m | % | |||||||||||||||||||||||||||||||
Europe | 476,749 | 490,511 | 462,669 | |||||||||||||||||||||||||||||||||
Demand and other – non-interest bearing | 73,834 | – | 73,088 | – | 75,480 | – | ||||||||||||||||||||||||||||||
Demand – interest bearing | 316,349 | 0.4 | 314,374 | 0.4 | 272,973 | 0.4 | ||||||||||||||||||||||||||||||
Savings | 49,068 | 1.2 | 57,464 | 1.4 | 63,585 | 1.4 | ||||||||||||||||||||||||||||||
Time | 35,803 | 0.9 | 43,760 | 1.0 | 50,010 | 1.1 | ||||||||||||||||||||||||||||||
Other | 1,695 | 2.4 | 1,825 | 2.6 | 621 | 8.2 | ||||||||||||||||||||||||||||||
Asia | 590,436 | 566,595 | 533,002 | |||||||||||||||||||||||||||||||||
Demand and other – non-interest bearing | 67,460 | – | 62,988 | – | 59,023 | – | ||||||||||||||||||||||||||||||
Demand – interest bearing | 399,209 | 0.2 | 374,026 | 0.2 | 347,526 | 0.2 | ||||||||||||||||||||||||||||||
Savings | 100,801 | 2.3 | 108,074 | 2.3 | 104,099 | 2.2 | ||||||||||||||||||||||||||||||
Time | 22,035 | 0.9 | 21,381 | 0.9 | 20,978 | 0.7 | ||||||||||||||||||||||||||||||
Other | 931 | 0.4 | 126 | 2.4 | 1,376 | 0.4 | ||||||||||||||||||||||||||||||
Middle East and North Africa | 37,876 | 39,076 | 40,451 | |||||||||||||||||||||||||||||||||
Demand and other – non-interest bearing | 18,996 | – | 18,410 | – | 16,801 | – | ||||||||||||||||||||||||||||||
Demand – interest bearing | 11,009 | 0.3 | 11,587 | 0.4 | 13,248 | 0.4 | ||||||||||||||||||||||||||||||
Savings | 7,120 | 1.9 | 7,974 | 2.1 | 9,981 | 2.6 | ||||||||||||||||||||||||||||||
Time | 751 | 1.2 | 1,074 | 1.2 | 357 | 1.4 | ||||||||||||||||||||||||||||||
Other | – | – | 31 | – | 64 | – | ||||||||||||||||||||||||||||||
North America | 136,773 | 135,692 | 137,181 | |||||||||||||||||||||||||||||||||
Demand and other – non-interest bearing | 29,390 | – | 27,361 | – | 27,992 | – | ||||||||||||||||||||||||||||||
Demand – interest bearing | 37,234 | 0.2 | 38,843 | 0.3 | 37,837 | 0.3 | ||||||||||||||||||||||||||||||
Savings | 60,157 | 0.4 | 60,075 | 0.5 | 63,565 | 0.6 | ||||||||||||||||||||||||||||||
Time | 9,927 | 0.4 | 9,290 | 0.2 | 7,673 | 0.3 | ||||||||||||||||||||||||||||||
Other | 65 | – | 123 | 0.8 | 114 | 1.8 | ||||||||||||||||||||||||||||||
Latin America | 32,097 | 50,918 | 54,585 | |||||||||||||||||||||||||||||||||
Demand and other – non-interest bearing | 8,349 | – | 12,452 | – | 13,092 | – | ||||||||||||||||||||||||||||||
Demand – interest bearing | 6,848 | 0.9 | 7,412 | 1.2 | 7,237 | 1.8 | ||||||||||||||||||||||||||||||
Savings | 10,896 | 18.3 | 22,062 | 10.0 | 24,652 | 7.4 | ||||||||||||||||||||||||||||||
Time | 5,952 | 2.5 | 8,850 | 2.8 | 9,459 | 4.4 | ||||||||||||||||||||||||||||||
Other | 52 | 9.6 | 142 | 5.6 | 145 | 9.7 | ||||||||||||||||||||||||||||||
Total | 1,273,931 | 1,282,792 | 1,227,888 | |||||||||||||||||||||||||||||||||
Demand and other – non-interest bearing | 198,029 | – | 194,299 | – | 192,388 | – | ||||||||||||||||||||||||||||||
Demand – interest bearing | 770,649 | 0.3 | 746,242 | 0.3 | 678,821 | 0.3 | ||||||||||||||||||||||||||||||
Savings | 228,042 | 2.3 | 255,649 | 2.3 | 265,882 | 2.1 | ||||||||||||||||||||||||||||||
Time | 74,468 | 0.9 | 84,355 | 1.1 | 88,477 | 1.3 | ||||||||||||||||||||||||||||||
Other | 2,743 | 1.9 | 2,247 | 2.6 | 2,320 | 3.1 | ||||||||||||||||||||||||||||||
HSBC HOLDINGS PLC
63m
Table of Contents
Report of the Directors: Financial Review(continued)
Certificates of deposit and other money market instruments
| 2015 | 2014 | 2013 | ||||||||||||||||||||||||||||||||||
Average balance | Average rate | Average balance | Average rate | Average balance | Average rate | |||||||||||||||||||||||||||||||
| $m | % | $m | % | $m | % | |||||||||||||||||||||||||||||||
Europe | 22,539 | 0.5 | 20,970 | 0.4 | 28,680 | 0.5 | ||||||||||||||||||||||||||||||
Asia | 1,275 | 2.4 | 2,441 | 1.6 | 3,199 | 2.0 | ||||||||||||||||||||||||||||||
North America | 11,336 | 0.4 | 5,406 | 0.3 | 5,583 | 0.6 | ||||||||||||||||||||||||||||||
Latin America | 6,971 | 22.1 | 12,035 | 12.1 | 9,335 | 8.3 | ||||||||||||||||||||||||||||||
| 42,121 | 4.1 | 40,852 | 3.9 | 46,797 | 2.3 | |||||||||||||||||||||||||||||||
Certificates of deposit and other time deposits
The maturity analysis of certificates of deposit (‘CD’s) and other wholesale time deposits is expressed by remaining maturity. The majority of CDs and time deposits are in amounts of $100,000 and over or the equivalent in other currencies.
| At 31 December 2015 | ||||||||||||||||||||||||||||||
3 months or less | After 3 months but within 6 months | After 6 months 12 months | After 12 months | Total | ||||||||||||||||||||||||||
| $m | $m | $m | $m | $m | ||||||||||||||||||||||||||
Europe | 29,727 | 5,668 | 5,728 | 5,303 | 46,426 | |||||||||||||||||||||||||
Certificates of deposit | 2,085 | 2,715 | 2,445 | – | 7,245 | |||||||||||||||||||||||||
Time deposits: | ||||||||||||||||||||||||||||||
– banks | 4,402 | 334 | 337 | 3,379 | 8,452 | |||||||||||||||||||||||||
– customers | 23,240 | 2,619 | 2,946 | 1,924 | 30,729 | |||||||||||||||||||||||||
Asia | 21,079 | 1,504 | 936 | 751 | 24,270 | |||||||||||||||||||||||||
Certificates of deposit | 590 | 101 | 181 | 605 | 1,477 | |||||||||||||||||||||||||
Time deposits: | ||||||||||||||||||||||||||||||
– banks | 355 | 76 | 1 | – | 432 | |||||||||||||||||||||||||
– customers | 20,134 | 1,327 | 754 | 146 | 22,361 | |||||||||||||||||||||||||
Middle East and North Africa | 327 | 19 | 7 | 202 | 555 | |||||||||||||||||||||||||
Time deposits: | ||||||||||||||||||||||||||||||
– banks | 265 | 15 | – | – | 280 | |||||||||||||||||||||||||
– customers | 62 | 4 | 7 | 202 | 275 | |||||||||||||||||||||||||
North America | 13,826 | 2,435 | 1,187 | 1,367 | 18,815 | |||||||||||||||||||||||||
Certificates of deposit | 5,372 | 2,071 | 566 | 444 | 8,453 | |||||||||||||||||||||||||
Time deposits: | ||||||||||||||||||||||||||||||
– banks | 2,735 | 107 | – | – | 2,842 | |||||||||||||||||||||||||
– customers | 5,719 | 257 | 621 | 923 | 7,520 | |||||||||||||||||||||||||
Latin America | 6,317 | 852 | 89 | 267 | 7,525 | |||||||||||||||||||||||||
Certificates of deposit | 779 | 103 | 20 | 89 | 991 | |||||||||||||||||||||||||
Time deposits: | ||||||||||||||||||||||||||||||
– banks | 574 | 323 | 22 | 177 | 1,096 | |||||||||||||||||||||||||
– customers | 4,964 | 426 | 47 | 1 | 5,438 | |||||||||||||||||||||||||
Total | 71,276 | 10,478 | 7,947 | 7,890 | 97,591 | |||||||||||||||||||||||||
Certificates of deposit | 8,826 | 4,990 | 3,212 | 1,138 | 18,166 | |||||||||||||||||||||||||
Time deposits: | ||||||||||||||||||||||||||||||
– banks | 8,331 | 855 | 360 | 3,556 | 13,102 | |||||||||||||||||||||||||
– customers | 54,119 | 4,633 | 4,375 | 3,196 | 66,323 | |||||||||||||||||||||||||
HSBC HOLDINGS PLC
63n
Table of Contents
Report of the Directors: Financial Review(continued)
Ratio of earnings to fixed charges60
| 2015 | 2014 | 2013 | 2012 | 2011 | ||||||||||||||||||||||||||
Ratio of earnings to fixed charges | ||||||||||||||||||||||||||||||
– excluding interest on deposits | 3.68 | 3.39 | 3.84 | 3.03 | 2.82 | |||||||||||||||||||||||||
– including interest on deposits | 2.00 | 1.86 | 2.09 | 1.76 | 1.68 | |||||||||||||||||||||||||
Ratio of earnings to combined fixed charges and preference share dividends | ||||||||||||||||||||||||||||||
– excluding interest on deposits | 3.05 | 3.07 | 3.50 | 2.79 | 2.64 | |||||||||||||||||||||||||
– including interest on deposits | 1.85 | 1.79 | 2.01 | 1.71 | 1.64 | |||||||||||||||||||||||||
For footnote, see page 100a.
HSBC HOLDINGS PLC
63o
Table of Contents
Report of the Directors: Financial summary / Global businesses
Reconciliation of RoRWA / Critical estimates and judgements / Summary
Reconciliation of RoRWA measures
Performance Management
During 2015, we targeted a return on average ordinary shareholders’ equity of 10%. For internal management purposes we monitor global businesses and geographical regions by pre-tax return on average risk-weighted assets. This metric is calibrated against return on equity (‘RoE’) and capital requirements to ensure that we are best placed to achieve capital strength and business profitability combined with regulatory capital efficiency objectives. We targeted a return on average RWAs of 2.3% in 2015. |
In addition to the return on average risk-weighted assets (‘RoRWA’) we measure our performance internally using the non-GAAP measure of adjusted RoRWA, which is adjusted profit before tax as a percentage of average risk-weighted assets adjusted for the effects of foreign currency translation differences and significant items. Excluded from adjusted RoRWA are certain items which distort year-on-year performance as explained on page 48.
We also present the non-GAAP measure of adjusted RoRWA excluding run-off portfolios.
Reconciliation of adjusted RoRWA (excluding run-off portfolios)
| 2015 | 2014 | |||||||||||||||||||||||||||||||||||
|
| Pre-tax return |
|
| Average RWAs | 25 | RoRWA | 24 |
| Pre-tax return |
|
| Average RWAs | 25 | RoRWA | 24 | |||||||||||||||||||||
| $m | $bn | % | $m | $bn | % | |||||||||||||||||||||||||||||||
Reported | 18,867 | 1,174 | 1.6 | 18,680 | 1,209 | 1.5 | ||||||||||||||||||||||||||||||
Adjusted | 20,418 | 1,171 | 1.7 | 21,976 | 1,150 | 1.9 | ||||||||||||||||||||||||||||||
Run-off portfolios | 447 | 84 | 0.5 | 847 | 115 | 0.7 | ||||||||||||||||||||||||||||||
Legacy credit in GB&M | (5 | ) | 35 | – | 149 | 48 | 0.3 | |||||||||||||||||||||||||||||
US CML and other26 | 452 | 49 | 0.9 | 698 | 67 | 1.0 | ||||||||||||||||||||||||||||||
Adjusted (excluding run-off portfolios) | 19,971 | 1,087 | 1.8 | 21,129 | 1,035 | 2.0 | ||||||||||||||||||||||||||||||
Reconciliation of reported and adjusted average risk-weighted assets
| Year ended 31 December | ||||||||||||||||||
| 2015 | 2014 | Change | ||||||||||||||||
| $bn | $bn | % | ||||||||||||||||
Average reported RWAs25 | 1,174 | 1,209 | (2.9 | ) | ||||||||||||||
Currency translation adjustment27 | – | (50 | ) | |||||||||||||||
Significant items | (3 | ) | (9 | ) | ||||||||||||||
Average adjusted RWAs25 | 1,171 | 1,150 | 1.8 | |||||||||||||||
For footnotes, see page 99.
Critical accounting estimates and judgements
The results of HSBC reflect the choice of accounting policies, assumptions and estimates that underlie the preparation of HSBC’s consolidated financial statements. The significant accounting policies, including the policies which include critical accounting estimates and judgements, are described in Note 1 and in the individual Notes on the Financial Statements. The accounting policies listed below are highlighted as they involve a high degree of judgement and estimation uncertainty and have a material impact on the financial statements:
| • | Impairment of loans and advances: Note 1(j) on page 354; |
| • | Deferred tax assets: Note 8 on page 370; |
| • | Valuation of financial instruments: Note 13 on page 378; |
| • | Impairment of interests in associates: Note 19 on page 402; |
| • | Goodwill impairment: Note 20 on page 406; and |
| • | Provisions: Note 29 on page 421. |
In view of the inherent uncertainties and the high level of subjectivity involved in the recognition or measurement of the items above, it is possible that the outcomes in the next financial year could differ from those on which management’s estimates are based, resulting in the recognition and measurement of materially different amounts from those estimated by management in the 2015 Financial Statements.
HSBC HOLDINGS PLC
64
Table of Contents
| ||||
| 65 | ||||
Reconciliation of 2015 and 2014 reported and adjusted items for global businesses | 66 | |||
Reconciliation of 2014 and 2013 reported and adjusted items for global businesses | 67a | |||
| 68 | ||||
| 70 | ||||
| 71 | ||||
| 72 | ||||
| 73 | ||||
| 74 | ||||
HSBC reviews operating activity on a number of bases, including by geographical region and by global business.
The tables and charts below present global businesses followed by geographical regions (page 76). Performance is analysed in this order because certain strategic themes, business initiatives and trends affect more than one
geographical region. All tables are on a reported basis unless stated otherwise.
Basis of preparation
The results of global businesses are presented in accordance with the accounting policies used in the preparation of HSBC’s consolidated financial statements. Our operations are closely integrated and, accordingly, the presentation of global business data includes internal allocations of certain items of income and expense. These allocations include the costs of certain support services and global functions to the extent that they can be meaningfully attributed to operational business lines. While such allocations have been made on a systematic and consistent basis, they necessarily involve a degree of subjectivity. Those costs which are not allocated to global businesses are included in ‘Other’.
Where relevant, income and expense amounts presented include the results of inter-segment funding along with inter-company and inter-business line transactions. All such transactions are undertaken on arm’s length terms.
The expense of the UK bank levy is included in the Europe geographical region as HSBC regards the levy as a cost of being headquartered in the UK. For the purposes of the presentation by global business, the cost of the levy is included in ‘Other’. |
Profit/(loss) before tax
| 2015 | 2014 | 2013 | ||||||||||||||||||||||||||||||||||
| $m | % | $m | % | $m | % | |||||||||||||||||||||||||||||||
Retail Banking and Wealth Management28 | 4,967 | 26.3 | 5,581 | 29.9 | 6,553 | 29.1 | ||||||||||||||||||||||||||||||
Commercial Banking28 | 7,973 | 42.3 | 8,814 | 47.2 | 8,537 | 37.8 | ||||||||||||||||||||||||||||||
Global Banking and Markets | 7,910 | 41.9 | 5,889 | 31.5 | 9,441 | 41.8 | ||||||||||||||||||||||||||||||
Global Private Banking | 344 | 1.8 | 626 | 3.4 | 193 | 0.9 | ||||||||||||||||||||||||||||||
Other29 | (2,327 | ) | (12.3 | ) | (2,230 | ) | (12.0 | ) | (2,159 | ) | (9.6 | ) | ||||||||||||||||||||||||
Year ended 31 December | 18,867 | 100.0 | 18,680 | 100.0 | 22,565 | 100.0 | ||||||||||||||||||||||||||||||
Total assets30
| 2015 | 2014 | |||||||||||||||||||||||
| $m | % | $m | % | |||||||||||||||||||||
Retail Banking and Wealth Management | 473,284 | 19.6 | 500,864 | 19.0 | ||||||||||||||||||||
Commercial Banking | 365,290 | 15.2 | 370,958 | 14.1 | ||||||||||||||||||||
Global Banking and Markets | 1,616,704 | 67.1 | 1,839,644 | 69.8 | ||||||||||||||||||||
Global Private Banking | 81,448 | 3.4 | 88,342 | 3.4 | ||||||||||||||||||||
Other | 147,417 | 6.1 | 164,537 | 6.2 | ||||||||||||||||||||
Intra-HSBC items | (274,487 | ) | (11.4 | ) | (330,206 | ) | (12.5 | ) | ||||||||||||||||
At 31 December | 2,409,656 | 100.0 | 2,634,139 | 100.0 | ||||||||||||||||||||
| Risk-weighted assets | ||||||||||||||||||||||||
| 2015 | 2014 | |||||||||||||||||||||||
| $bn | % | $bn | % | |||||||||||||||||||||
Retail Banking and Wealth Management | 189.5 | 17.2 | 207.2 | 17.0 | ||||||||||||||||||||
Commercial Banking | 421.0 | 38.2 | 430.3 | 35.3 | ||||||||||||||||||||
Global Banking and Markets | 440.6 | 39.9 | 516.1 | 42.3 | ||||||||||||||||||||
Global Private Banking | 19.3 | 1.7 | 20.8 | 1.7 | ||||||||||||||||||||
Other | 32.6 | 3.0 | 45.4 | 3.7 | ||||||||||||||||||||
At 31 December | 1,103.0 | 100.0 | 1,219.8 | 100.0 | ||||||||||||||||||||
For footnotes, see page 99.
HSBC HOLDINGS PLC
65
Table of Contents
Report of the Directors: Global businesses(continued)
Reconciliations
Reconciliation of reported and adjusted items –
global businesses
2015 compared with 2014
| 2015 | ||||||||||||||||||||||||||||||||||||
| RBWM | CMB | GB&M | GPB | Other | Total | |||||||||||||||||||||||||||||||
| $m | $m | $m | $m | $m | $m | |||||||||||||||||||||||||||||||
Revenue1 | ||||||||||||||||||||||||||||||||||||
Reported31 | 23,516 | 14,870 | 18,233 | 2,172 | 7,604 | 59,800 | ||||||||||||||||||||||||||||||
Significant items | 326 | 17 | (199 | ) | (31 | ) | (2,148 | ) | (2,035 | ) | ||||||||||||||||||||||||||
– disposal costs of Brazilian operations | – | – | – | – | 18 | 18 | ||||||||||||||||||||||||||||||
– DVA on derivative contracts | – | – | (230 | ) | – | – | (230 | ) | ||||||||||||||||||||||||||||
– fair value movements on non-qualifying hedges32 | 90 | (1 | ) | 31 | (1 | ) | 208 | 327 | ||||||||||||||||||||||||||||
– gain on the partial sale of shareholding in Industrial Bank | – | – | – | – | (1,372 | ) | (1,372 | ) | ||||||||||||||||||||||||||||
– loss on sale of several tranches of real estate secured accounts in the US | 214 | – | – | – | – | 214 | ||||||||||||||||||||||||||||||
– own credit spread2 | – | – | – | – | (1,002 | ) | (1,002 | ) | ||||||||||||||||||||||||||||
– provisions/(releases) arising from the ongoing review of compliance with the Consumer Credit Act in the UK | 22 | 18 | – | (30 | ) | – | 10 | |||||||||||||||||||||||||||||
Adjusted31 | 23,842 | 14,887 | 18,034 | 2,141 | 5,456 | 57,765 | ||||||||||||||||||||||||||||||
LICs | ||||||||||||||||||||||||||||||||||||
Reported | (1,939 | ) | (1,770 | ) | – | (12 | ) | – | (3,721 | ) | ||||||||||||||||||||||||||
Adjusted | (1,939 | ) | (1,770 | ) | – | (12 | ) | – | (3,721 | ) | ||||||||||||||||||||||||||
Operating expenses | ||||||||||||||||||||||||||||||||||||
Reported31 | (17,020 | ) | (6,744 | ) | (10,834 | ) | (1,832 | ) | (9,933 | ) | (39,768 | ) | ||||||||||||||||||||||||
Significant items | 1,537 | 202 | 1,035 | 206 | 606 | 3,586 | ||||||||||||||||||||||||||||||
– disposal costs of Brazilian operations | 66 | 16 | 14 | 1 | 13 | 110 | ||||||||||||||||||||||||||||||
– costs-to-achieve | 198 | 163 | 69 | 16 | 462 | 908 | ||||||||||||||||||||||||||||||
– costs to establish UK ring-fenced bank | – | – | – | – | 89 | 89 | ||||||||||||||||||||||||||||||
– regulatory provisions in GPB | – | – | – | 171 | 1 | 172 | ||||||||||||||||||||||||||||||
– restructuring and other related costs | 32 | 5 | 22 | 18 | 40 | 117 | ||||||||||||||||||||||||||||||
– settlements and provisions in connection with legal matters | 700 | – | 949 | – | – | 1,649 | ||||||||||||||||||||||||||||||
– UK customer redress programmes | 541 | 18 | (19 | ) | – | 1 | 541 | |||||||||||||||||||||||||||||
Adjusted31 | (15,483 | ) | (6,542 | ) | (9,799 | ) | (1,626 | ) | (9,327 | ) | (36,182 | ) | ||||||||||||||||||||||||
Share of profit in associates and joint ventures | ||||||||||||||||||||||||||||||||||||
Reported | 410 | 1,617 | 511 | 16 | 2 | 2,556 | ||||||||||||||||||||||||||||||
Adjusted | 410 | 1,617 | 511 | 16 | 2 | 2,556 | ||||||||||||||||||||||||||||||
Profit/(loss) before tax | ||||||||||||||||||||||||||||||||||||
Reported | 4,967 | 7,973 | 7,910 | 344 | (2,327 | ) | 18,867 | |||||||||||||||||||||||||||||
Significant items | 1,863 | 219 | 836 | 175 | (1,542 | ) | 1,551 | |||||||||||||||||||||||||||||
– revenue | 326 | 17 | (199 | ) | (31 | ) | (2,148 | ) | (2,035 | ) | ||||||||||||||||||||||||||
– operating expenses | 1,537 | 202 | 1,035 | 206 | 606 | 3,586 | ||||||||||||||||||||||||||||||
Adjusted | 6,830 | 8,192 | 8,746 | 519 | (3,869 | ) | 20,418 | |||||||||||||||||||||||||||||
HSBC HOLDINGS PLC
66
Table of Contents
| 2014 | ||||||||||||||||||||||||||||||||||||
| RBWM | CMB | GB&M | GPB | Other | Total | |||||||||||||||||||||||||||||||
| $m | $m | $m | $m | $m | $m | |||||||||||||||||||||||||||||||
Revenue1 | ||||||||||||||||||||||||||||||||||||
Reported31 | 25,149 | 15,748 | 17,778 | 2,377 | 6,365 | 61,248 | ||||||||||||||||||||||||||||||
Currency translation31 | (2,209 | ) | (1,242 | ) | (1,296 | ) | (138 | ) | (158 | ) | (4,775 | ) | ||||||||||||||||||||||||
Significant items | 877 | 9 | 328 | 41 | (501 | ) | 754 | |||||||||||||||||||||||||||||
– DVA on derivative contracts | – | – | 332 | – | – | 332 | ||||||||||||||||||||||||||||||
– fair value movements on non-qualifying hedges32 | 493 | (1 | ) | 8 | 1 | 40 | 541 | |||||||||||||||||||||||||||||
– gain on sale of several tranches of real estate secured accounts in the US | (168 | ) | – | – | – | – | (168 | ) | ||||||||||||||||||||||||||||
– gain on sale of shareholding in Bank of Shanghai | – | – | – | – | (428 | ) | (428 | ) | ||||||||||||||||||||||||||||
– impairment of our investment in Industrial Bank | – | – | – | – | 271 | 271 | ||||||||||||||||||||||||||||||
– own credit spread2 | – | – | – | – | (417 | ) | (417 | ) | ||||||||||||||||||||||||||||
– provisions arising from the ongoing review of compliance with the Consumer Credit Act in the UK | 568 | 24 | – | 40 | – | 632 | ||||||||||||||||||||||||||||||
– (gain)/loss and trading results from disposals and changes in ownership levels | (16 | ) | (14 | ) | (12 | ) | – | 33 | (9 | ) | ||||||||||||||||||||||||||
Adjusted31 | 23,817 | 14,515 | 16,810 | 2,280 | 5,706 | 57,227 | ||||||||||||||||||||||||||||||
LICs | ||||||||||||||||||||||||||||||||||||
Reported | (1,936 | ) | (1,558 | ) | (365 | ) | 8 | – | (3,851 | ) | ||||||||||||||||||||||||||
Currency translation | 340 | 256 | 86 | 3 | (2 | ) | 683 | |||||||||||||||||||||||||||||
Significant items | 2 | (2 | ) | – | – | – | – | |||||||||||||||||||||||||||||
– trading results from disposals and changes in ownership levels | 2 | (2 | ) | – | – | – | – | |||||||||||||||||||||||||||||
Adjusted | (1,594 | ) | (1,304 | ) | (279 | ) | 11 | (2 | ) | (3,168 | ) | |||||||||||||||||||||||||
Operating expenses | ||||||||||||||||||||||||||||||||||||
Reported31 | (18,030 | ) | (6,981 | ) | (12,028 | ) | (1,778 | ) | (8,601 | ) | (41,249 | ) | ||||||||||||||||||||||||
Currency translation31 | 1,851 | 627 | 782 | 100 | 186 | 3,278 | ||||||||||||||||||||||||||||||
Significant items | 1,118 | 189 | 1,896 | 71 | 121 | 3,395 | ||||||||||||||||||||||||||||||
– charge in relation to the settlement agreement with the Federal Housing Finance Authority | 17 | – | 533 | – | – | 550 | ||||||||||||||||||||||||||||||
– regulatory provisions in GPB | – | – | – | 65 | – | 65 | ||||||||||||||||||||||||||||||
– restructuring and other related costs | 88 | 37 | 27 | 6 | 120 | 278 | ||||||||||||||||||||||||||||||
– settlements and provisions in connection with legal matters | – | – | 1,187 | – | – | 1,187 | ||||||||||||||||||||||||||||||
– UK customer redress programmes | 992 | 138 | 145 | – | – | 1,275 | ||||||||||||||||||||||||||||||
– trading results from disposals and changes in ownership levels | 21 | 14 | 4 | – | 1 | 40 | ||||||||||||||||||||||||||||||
Adjusted31 | (15,061 | ) | (6,165 | ) | (9,350 | ) | (1,607 | ) | (8,294 | ) | (34,576 | ) | ||||||||||||||||||||||||
Share of profit in associates and joint ventures | ||||||||||||||||||||||||||||||||||||
Reported | 398 | 1,605 | 504 | 19 | 6 | 2,532 | ||||||||||||||||||||||||||||||
Currency translation | (5 | ) | (28 | ) | (7 | ) | – | 1 | (39 | ) | ||||||||||||||||||||||||||
Adjusted | 393 | 1,577 | 497 | 19 | 7 | 2,493 | ||||||||||||||||||||||||||||||
Profit/(loss) before tax | ||||||||||||||||||||||||||||||||||||
Reported | 5,581 | 8,814 | 5,889 | 626 | (2,230 | ) | 18,680 | |||||||||||||||||||||||||||||
Currency translation | (23 | ) | (387 | ) | (435 | ) | (35 | ) | 27 | (853 | ) | |||||||||||||||||||||||||
Significant items | 1,997 | 196 | 2,224 | 112 | (380 | ) | 4,149 | |||||||||||||||||||||||||||||
– revenue | 877 | 9 | 328 | 41 | (501 | ) | 754 | |||||||||||||||||||||||||||||
– LICs | 2 | (2 | ) | – | – | – | – | |||||||||||||||||||||||||||||
– operating expenses | 1,118 | 189 | 1,896 | 71 | 121 | 3,395 | ||||||||||||||||||||||||||||||
Adjusted | 7,555 | 8,623 | 7,678 | 703 | (2,583 | ) | 21,976 | |||||||||||||||||||||||||||||
For footnotes, see page 99.
HSBC HOLDINGS PLC
67
Table of Contents
Reconciliation of reported and adjusted items –
global businesses
2014 compared with 2013
| 2014 | ||||||||||||||||||||||||||||||||||||
| RBWM | CMB | GB&M | GPB | Other | Total | |||||||||||||||||||||||||||||||
| $m | $m | $m | $m | $m | $m | |||||||||||||||||||||||||||||||
Revenue1 | ||||||||||||||||||||||||||||||||||||
Reported31 | 25,149 | 15,748 | 17,778 | 2,377 | 6,365 | 61,248 | ||||||||||||||||||||||||||||||
Significant items | 877 | 9 | 328 | 41 | (501 | ) | 754 | |||||||||||||||||||||||||||||
– DVA on derivative contracts | – | – | 332 | – | – | 332 | ||||||||||||||||||||||||||||||
– fair value movements on non-qualifying hedges32 | 493 | (1 | ) | 8 | 1 | 40 | 541 | |||||||||||||||||||||||||||||
– gain on sale of several tranches of real estate secured accounts in the US | (168 | ) | – | – | – | – | (168 | ) | ||||||||||||||||||||||||||||
– gain on sale of shareholding in Bank of Shanghai | – | – | – | – | (428 | ) | (428 | ) | ||||||||||||||||||||||||||||
– impairment of our investment in Industrial Bank | – | – | – | – | 271 | 271 | ||||||||||||||||||||||||||||||
– own credit spread2 | – | – | – | – | (417 | ) | (417 | ) | ||||||||||||||||||||||||||||
– provisions arising from the ongoing review of compliance with the Consumer Credit Act in the UK | 568 | 24 | – | 40 | – | 632 | ||||||||||||||||||||||||||||||
– (gain)/loss and trading results from disposals and changes in ownership levels | (16 | ) | (14 | ) | (12 | ) | – | 33 | (9 | ) | ||||||||||||||||||||||||||
Adjusted31 | 26,026 | 15,757 | 18,106 | 2,418 | 5,864 | 62,002 | ||||||||||||||||||||||||||||||
LICs | ||||||||||||||||||||||||||||||||||||
Reported | (1,936 | ) | (1,558 | ) | (365 | ) | 8 | – | (3,851 | ) | ||||||||||||||||||||||||||
Significant items | 2 | (2 | ) | – | – | – | – | |||||||||||||||||||||||||||||
– trading results from disposals and changes in ownership levels | 2 | (2 | ) | – | – | – | – | |||||||||||||||||||||||||||||
Adjusted | (1,934 | ) | (1,560 | ) | (365 | ) | 8 | – | (3,851 | ) | ||||||||||||||||||||||||||
Operating expenses | ||||||||||||||||||||||||||||||||||||
Reported31 | (18,030 | ) | (6,981 | ) | (12,028 | ) | (1,778 | ) | (8,601 | ) | (41,249 | ) | ||||||||||||||||||||||||
Significant items | 1,118 | 189 | 1,896 | 71 | 121 | 3,395 | ||||||||||||||||||||||||||||||
– charge in relation to the settlement agreement with the Federal Housing Finance Authority | 17 | – | 533 | – | – | 550 | ||||||||||||||||||||||||||||||
– regulatory provisions in GPB | – | – | – | 65 | – | 65 | ||||||||||||||||||||||||||||||
– restructuring and other related costs | 88 | 37 | 27 | 6 | 120 | 278 | ||||||||||||||||||||||||||||||
– settlements and provisions in connection with legal matters | – | – | 1,187 | – | – | 1,187 | ||||||||||||||||||||||||||||||
– UK customer redress programmes | 992 | 138 | 145 | – | – | 1,275 | ||||||||||||||||||||||||||||||
– trading results from disposals and changes in ownership levels | 21 | 14 | 4 | – | 1 | 40 | ||||||||||||||||||||||||||||||
Adjusted31 | 16,912 | (6,792 | ) | (10,132 | ) | (1,707 | ) | (8,480 | ) | (37,854 | ) | |||||||||||||||||||||||||
Share of profit in associates and joint ventures | ||||||||||||||||||||||||||||||||||||
Reported | 398 | 1,605 | 504 | 19 | 6 | 2,532 | ||||||||||||||||||||||||||||||
Adjusted | 398 | 1,605 | 504 | 19 | 6 | 2,532 | ||||||||||||||||||||||||||||||
Profit before tax | ||||||||||||||||||||||||||||||||||||
Reported | 5,581 | 8,814 | 5,889 | 626 | (2,230 | ) | 18,680 | |||||||||||||||||||||||||||||
Significant items | 1,997 | 196 | 2,224 | 112 | (380 | ) | 4,149 | |||||||||||||||||||||||||||||
– revenue | 877 | 9 | 328 | 41 | (501 | ) | 754 | |||||||||||||||||||||||||||||
– LICs | 2 | (2 | ) | – | – | – | – | |||||||||||||||||||||||||||||
– operating expenses | 1,118 | 189 | 1,896 | 71 | 121 | 3,395 | ||||||||||||||||||||||||||||||
Adjusted | 7,578 | 9,010 | 8,113 | 738 | (2,610 | ) | 22,829 | |||||||||||||||||||||||||||||
HSBC HOLDINGS PLC
67a
Table of Contents
Report of the Directors: Financial summary
Reconciliation of reported and adjusted items – global businesses (continued)
| 2013 | ||||||||||||||||||||||||||||||||||||
| RBWM | CMB | GB&M | GPB | Other | Total | |||||||||||||||||||||||||||||||
| $m | $m | $m | $m | $m | $m | |||||||||||||||||||||||||||||||
Revenue1 | ||||||||||||||||||||||||||||||||||||
Reported31 | 27,453 | 15,652 | 19,176 | 2,439 | 5,651 | 64,645 | ||||||||||||||||||||||||||||||
Currency translation31 | (460 | ) | (176 | ) | (62 | ) | 12 | (60 | ) | (686 | ) | |||||||||||||||||||||||||
Significant items | (95 | ) | (643 | ) | (582 | ) | 274 | (1,059 | ) | (2,105 | ) | |||||||||||||||||||||||||
– debit valuation adjustment on derivative contracts | – | – | (106 | ) | – | – | (106 | ) | ||||||||||||||||||||||||||||
– fair value movements on non-qualifying hedges32 | (262 | ) | – | 18 | – | (267 | ) | (511 | ) | |||||||||||||||||||||||||||
– FX gains relating to sterling debt issued by HSBC Holdings | – | – | – | – | (442 | ) | (442 | ) | ||||||||||||||||||||||||||||
– write-off of allocated goodwill relating to the GPB Monaco business | – | – | – | 279 | – | 279 | ||||||||||||||||||||||||||||||
– HSBC Insurance (Asia-Pacific) Holdings Limited’s disposal of its shareholding in Bao Viet Holdings | (104 | ) | – | – | – | – | (104 | ) | ||||||||||||||||||||||||||||
– HSBC Latin America Holdings UK Limited’s disposal of HSBC Bank (Panama) S.A. | (310 | ) | (479 | ) | (317 | ) | (1 | ) | – | (1,107 | ) | |||||||||||||||||||||||||
– loss on early termination of cash flow hedges in the US run-off portfolio | 199 | – | – | – | – | 199 | ||||||||||||||||||||||||||||||
– loss on sale of an HFC Bank UK secured loan portfolio | 146 | – | – | – | – | 146 | ||||||||||||||||||||||||||||||
– loss on sale of non-real estate secured accounts in the US | 271 | – | – | – | – | 271 | ||||||||||||||||||||||||||||||
– loss on sale of several tranches of real estate secured accounts in the US | 123 | – | – | – | – | 123 | ||||||||||||||||||||||||||||||
– net gain on completion of Ping An disposal | – | – | – | – | (553 | ) | (553 | ) | ||||||||||||||||||||||||||||
– own credit spread2 | – | – | – | – | 1,246 | 1,246 | ||||||||||||||||||||||||||||||
– reclassification gain in respect of our holdings in Industrial Bank Co., Limited following the issue of additional share capital to third parties | – | – | – | – | (1,089 | ) | (1,089 | ) | ||||||||||||||||||||||||||||
– other (gain)/loss and trading results from disposals and changes in ownership levels | (158 | ) | (164 | ) | (177 | ) | (4 | ) | 46 | (457 | ) | |||||||||||||||||||||||||
Adjusted31 | 26,898 | 14,833 | 18,532 | 2,725 | 4,532 | 61,854 | ||||||||||||||||||||||||||||||
LICs | ||||||||||||||||||||||||||||||||||||
Reported | (3,510 | ) | (2,101 | ) | (207 | ) | (31 | ) | – | (5,849 | ) | |||||||||||||||||||||||||
Currency translation | 175 | 19 | (23 | ) | (2 | ) | (1 | ) | 168 | |||||||||||||||||||||||||||
Significant items | 65 | 2 | – | – | – | 67 | ||||||||||||||||||||||||||||||
– other trading results from disposals and changes in ownership levels | 65 | 2 | – | – | – | 67 | ||||||||||||||||||||||||||||||
Adjusted | (3,270 | ) | (2,080 | ) | (230 | ) | (33 | ) | (1 | ) | (5,614 | ) | ||||||||||||||||||||||||
Operating expenses | ||||||||||||||||||||||||||||||||||||
Reported31 | (17,774 | ) | (6,523 | ) | (9,960 | ) | (2,229 | ) | (7,796 | ) | (38,556 | ) | ||||||||||||||||||||||||
Currency translation31 | 309 | 117 | (44 | ) | (6 | ) | 32 | 348 | ||||||||||||||||||||||||||||
Significant items | 1,306 | 120 | 442 | 429 | 229 | 2,526 | ||||||||||||||||||||||||||||||
– accounting gain arising from change in basis of delivering ill-health benefits in the UK | (189 | ) | (160 | ) | (81 | ) | – | – | (430 | ) | ||||||||||||||||||||||||||
– Madoff-related litigation costs | – | – | 298 | – | – | 298 | ||||||||||||||||||||||||||||||
– regulatory provisions in GPB | – | – | – | 352 | – | 352 | ||||||||||||||||||||||||||||||
– restructuring and other related costs | 167 | 31 | 13 | 73 | 199 | 483 | ||||||||||||||||||||||||||||||
– UK customer redress programmes | 953 | 148 | 134 | – | – | 1,235 | ||||||||||||||||||||||||||||||
– US customer remediation provisions relating to CRS | 100 | – | – | – | – | 100 | ||||||||||||||||||||||||||||||
– other trading results from disposals and changes in ownership levels | 275 | 101 | 78 | 4 | 30 | 488 | ||||||||||||||||||||||||||||||
| �� | ||||||||||||||||||||||||||||||||||||
Adjusted31 | (16,159 | ) | (6,286 | ) | (9,562 | ) | (1,806 | ) | (7,535 | ) | (35,682 | ) | ||||||||||||||||||||||||
Share of profit in associates and joint ventures | ||||||||||||||||||||||||||||||||||||
Reported | 384 | 1,509 | 432 | 14 | (14 | ) | 2,325 | |||||||||||||||||||||||||||||
Currency translation | – | 8 | 2 | – | 1 | 11 | ||||||||||||||||||||||||||||||
Significant items | 13 | 19 | 34 | – | 21 | 87 | ||||||||||||||||||||||||||||||
– other trading results from disposals and changes in ownership levels | 13 | 19 | 34 | – | 21 | 87 | ||||||||||||||||||||||||||||||
Adjusted | 397 | 1,536 | 468 | 14 | 8 | 2,423 | ||||||||||||||||||||||||||||||
HSBC HOLDINGS PLC
67b
Table of Contents
| 2013 | ||||||||||||||||||||||||||||||||||||||
| RBWM | CMB | GB&M | GPB | Other | Total | |||||||||||||||||||||||||||||||||
| $m | $m | $m | $m | $m | $m | |||||||||||||||||||||||||||||||||
Profit before tax | ||||||||||||||||||||||||||||||||||||||
Reported | 6,553 | 8,537 | 9,441 | 193 | (2,159 | ) | 22,565 | |||||||||||||||||||||||||||||||
Currency translation | 24 | (32 | ) | (127 | ) | 4 | (28 | ) | (159 | ) | ||||||||||||||||||||||||||||
Significant items | 1,289 | (502 | ) | (106 | ) | 703 | (809 | ) | 575 | |||||||||||||||||||||||||||||
– revenue | (95 | ) | (643 | ) | (582 | ) | 274 | (1,059 | ) | (2,105 | ) | |||||||||||||||||||||||||||
– LICs | 65 | 2 | – | – | – | 67 | ||||||||||||||||||||||||||||||||
– operating expenses | 1,306 | 120 | 442 | 429 | 229 | 2,526 | ||||||||||||||||||||||||||||||||
– share of profit in associates and joint ventures | 13 | 19 | 34 | – | 21 | 87 | ||||||||||||||||||||||||||||||||
Adjusted | 7,866 | 8,003 | 9,208 | 900 | (2,996 | ) | 22,981 | |||||||||||||||||||||||||||||||
For footnotes, see page 100a.
HSBC HOLDINGS PLC
67c |
Table of Contents
Report of the Directors: Global businesses(continued)
RBWM
Retail Banking and Wealth Management
RBWM provides banking and wealth
management services for our personal
customers to help them secure their future
prosperity and realise their ambitions.
| Principal RBWM consists of | ||||||||||||||||||||||||||||||||||||
|
| Total RBWM | 28 | | US run-off portfolio | | | Principal RBWM | | | Banking operations | |
| Insurance manufacturing |
| | Asset management | | |||||||||||||||||||
| $m | $m | $m | $m | $m | $m | |||||||||||||||||||||||||||||||
2015 | ||||||||||||||||||||||||||||||||||||
Net interest income | 15,926 | 1,033 | 14,893 | 13,127 | 1,757 | 9 | ||||||||||||||||||||||||||||||
Net fee income/(expense) | 6,218 | (4 | ) | 6,222 | 5,726 | (560 | ) | 1,056 | ||||||||||||||||||||||||||||
Other income/(expense)33 | 1,372 | (203 | ) | 1,575 | 876 | 680 | 19 | |||||||||||||||||||||||||||||
Net operating income1 | 23,516 | 826 | 22,690 | �� | 19,729 | 1,877 | 1,084 | |||||||||||||||||||||||||||||
LICs34 | (1,939 | ) | (62 | ) | (1,877 | ) | (1,877 | ) | – | – | ||||||||||||||||||||||||||
Net operating income | 21,577 | 764 | 20,813 | 17,852 | 1,877 | 1,084 | ||||||||||||||||||||||||||||||
Total operating expenses | (17,020 | ) | (1,384 | ) | (15,636 | ) | (14,459 | ) | (432 | ) | (745 | ) | ||||||||||||||||||||||||
Operating profit/(loss) | 4,557 | (620 | ) | 5,177 | 3,393 | 1,445 | 339 | |||||||||||||||||||||||||||||
Income from associates35 | 410 | – | 410 | 357 | 24 | 29 | ||||||||||||||||||||||||||||||
Profit/(loss) before tax | 4,967 | (620 | ) | 5,587 | 3,750 | 1,469 | 368 | |||||||||||||||||||||||||||||
RoRWA24 | 2.5 | % | (1.3 | %) | 3.7 | % | ||||||||||||||||||||||||||||||
2014 | ||||||||||||||||||||||||||||||||||||
Net interest income | 17,130 | 1,390 | 15,740 | 13,983 | 1,746 | 11 | ||||||||||||||||||||||||||||||
Net fee income/(expense) | 6,836 | (4 | ) | 6,840 | 6,264 | (534 | ) | 1,110 | ||||||||||||||||||||||||||||
Other income/(expense)33 | 1,183 | (49 | ) | 1,232 | 602 | 608 | 22 | |||||||||||||||||||||||||||||
Net operating income1 | 25,149 | 1,337 | 23,812 | 20,849 | 1,820 | 1,143 | ||||||||||||||||||||||||||||||
LICs34 | (1,936 | ) | (30 | ) | (1,906 | ) | (1,906 | ) | – | – | ||||||||||||||||||||||||||
Net operating income | 23,213 | 1,307 | 21,906 | 18,943 | 1,820 | 1,143 | ||||||||||||||||||||||||||||||
Total operating expenses | (18,030 | ) | (738 | ) | (17,292 | ) | (16,060 | ) | (453 | ) | (779 | ) | ||||||||||||||||||||||||
Operating profit | 5,183 | 569 | 4,614 | 2,883 | 1,367 | 364 | ||||||||||||||||||||||||||||||
Income from associates35 | 398 | – | 398 | 323 | 40 | 35 | ||||||||||||||||||||||||||||||
Profit before tax | 5,581 | 569 | 5,012 | 3,206 | 1,407 | 399 | ||||||||||||||||||||||||||||||
RoRWA24 | 2.5 | % | 0.8 | % | 3.2 | % | ||||||||||||||||||||||||||||||
2013 | ||||||||||||||||||||||||||||||||||||
Net interest income | 18,808 | 2,061 | 16,747 | 15,003 | 1,725 | 19 | ||||||||||||||||||||||||||||||
Net fee income/(expense) | 7,211 | 11 | 7,200 | 6,786 | (625 | ) | 1,039 | |||||||||||||||||||||||||||||
Other income/(expense)33 | 1,434 | (400 | ) | 1,834 | 1,014 | 779 | 41 | |||||||||||||||||||||||||||||
Net operating income1 | 27,453 | 1,672 | 25,781 | 22,803 | 1,879 | 1,099 | ||||||||||||||||||||||||||||||
LICs34 | (3,510 | ) | (705 | ) | (2,805 | ) | (2,806 | ) | – | 1 | ||||||||||||||||||||||||||
Net operating income | 23,943 | 967 | 22,976 | 19,997 | 1,879 | 1,100 | ||||||||||||||||||||||||||||||
Total operating expenses | (17,774 | ) | (1,166 | ) | (16,608 | ) | (15,307 | ) | (554 | ) | (747 | ) | ||||||||||||||||||||||||
Operating profit/(loss) | 6,169 | (199 | ) | 6,368 | 4,690 | �� | 1,325 | 353 | ||||||||||||||||||||||||||||
Income/(expense) from associates35 | 384 | (1 | ) | 385 | 299 | 62 | 24 | |||||||||||||||||||||||||||||
Profit/(loss) before tax | 6,553 | (200 | ) | 6,753 | 4,989 | 1,387 | 377 | |||||||||||||||||||||||||||||
RoRWA24 | 2.6 | % | (0.2 | %) | 4.2 | % | ||||||||||||||||||||||||||||||
For footnotes, see page 99.
RBWM comprises the Principal RBWM business and the US run-off portfolio. We believe that highlighting Principal RBWM (and its constituent business streams, Banking Operations, Insurance Manufacturing and Asset Management) allows management to identify more readily the causes of material changes from year-to-year in the ongoing business and assess the factors and trends that are expected to have a material effect on the business in future years.
Insurance manufacturing for RBWM excluded other global businesses which contributed net operating income of $286m (2014: $358m, 2013: $397m) and profit before tax of $201m (2014: $263m, 2013: $266m) to overall insurance manufacturing. In 2015 insurance manufacturing net operating income for RBWM included $1,686m within Wealth Management (2014: $1,529m) and $191m within other products (2014: $350m).
HSBC HOLDINGS PLC
68
Table of Contents
Principal RBWM performance
Principal RBWM:management view of adjusted revenue
| 2015 | 2014 | |||||||||||
| $m | $m | |||||||||||
Net operating income1 | ||||||||||||
Current accounts, savings and deposits | 5,602 | 5,530 | ||||||||||
Wealth management products | 6,282 | 5,825 | ||||||||||
– investment distribution36 | 3,512 | 3,271 | ||||||||||
– life insurance manufacturing | 1,686 | 1,529 | ||||||||||
– asset management | 1,084 | 1,025 | ||||||||||
Personal lending | 9,962 | 10,218 | ||||||||||
– mortgages | 2,873 | 2,956 | ||||||||||
– credit cards | 3,868 | 3,961 | ||||||||||
– other personal lending37 | 3,221 | 3,301 | ||||||||||
Other38 | 841 | 759 | ||||||||||
Year ended 31 December | 22,687 | 22,332 | ||||||||||
For footnotes, see page 99.
Profit before tax ($m)
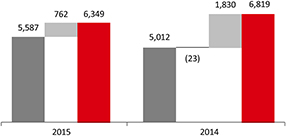
Revenue ($m)
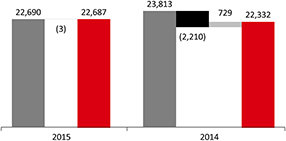
Operating expenses ($m)
|
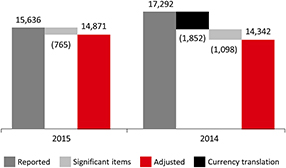
For details of significant items, see page 66.
HSBC HOLDINGS PLC
69
Table of Contents
Report of the Directors: Global businesses(continued)
CMB / GB&M
CMB serves more than two million
customers in 55 countries and
territories. Our customers range from
small enterprises focused primarily
on their domestic markets through to
corporates operating globally.
| 2015 | 2014 | 2013 | ||||||||||||||
| $m | $m | $m | ||||||||||||||
Net interest income | 9,859 | 10,158 | 9,731 | |||||||||||||
Net fee income | 4,190 | 4,570 | 4,527 | |||||||||||||
Other income33 | 821 | 1,020 | 1,394 | |||||||||||||
Net operating income1 | 14,870 | 15,748 | 15,652 | |||||||||||||
LICs34 | (1,770 | ) | (1,558 | ) | (2,101 | ) | ||||||||||
Net operating income | 13,100 | 14,190 | 13,551 | |||||||||||||
Total operating expenses | (6,744 | ) | (6,981 | ) | (6,523 | ) | ||||||||||
Operating profit | 6,356 | 7,209 | 7,028 | |||||||||||||
Income from associates35 | 1,617 | 1,605 | 1,509 | |||||||||||||
Profit before tax | 7,973 | 8,814 | 8,537 | |||||||||||||
RoRWA24 | 1.9% | 2.1% | 2.2% | |||||||||||||
For footnotes, see page 99.
Management view of adjusted revenue
| 2015 | 2014 | |||||||||||
| $m | $m | |||||||||||
Net operating income1 | ||||||||||||
Global Trade and Receivables Finance | 2,403 | 2,447 | ||||||||||
Credit and Lending | 6,002 | 5,609 | ||||||||||
Payments and Cash Management, current accounts and savings deposits | 4,568 | 4,423 | ||||||||||
Markets products, Insurance and Investments and Other39 | 1,914 | 2,036 | ||||||||||
Year ended 31 December | 14,887 | 14,515 | ||||||||||
For footnotes, see page 99.
Profit before tax ($m)
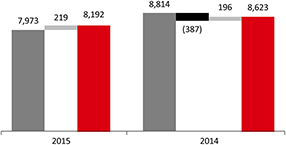
Revenue ($m)
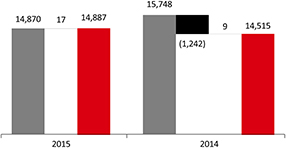
Operating expenses($m)
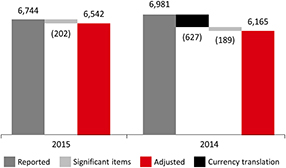
For details of significant items, seepage 66.
HSBC HOLDINGS PLC
70
Table of Contents
GB&M supports major government,
corporate and institutional clients worldwide
in achieving their long-term strategic goals
through tailored and innovative solutions.
| GB&M client- | ||||||||||||||||
Total GB&M | Legacy | facing and BSM | ||||||||||||||
| $m | $m | $m | ||||||||||||||
2015 | ||||||||||||||||
Net interest income | 6,931 | 127 | 6,804 | |||||||||||||
Net fee income/(expense) | 3,375 | (11 | ) | 3,386 | ||||||||||||
Net trading income40 | 7,169 | 9 | 7,160 | |||||||||||||
Other income/(expense)33 | 758 | (64 | ) | 822 | ||||||||||||
Net operating income1 | 18,233 | 61 | 18,172 | |||||||||||||
LICs34 | – | 37 | (37 | ) | ||||||||||||
Net operating income | 18,233 | 98 | 18,135 | |||||||||||||
Total operating expenses | (10,834 | ) | (103 | ) | (10,731 | ) | ||||||||||
Operating profit/(loss) | 7,399 | (5 | ) | 7,404 | ||||||||||||
Income from associates35 | 511 | |||||||||||||||
Profit/(loss) before tax | 7,910 | |||||||||||||||
RoRWA24 | 1.6% | – | 1.8% | |||||||||||||
2014 | ||||||||||||||||
Net interest income/(expense) | 7,022 | (172 | ) | 7,194 | ||||||||||||
Net fee income/(expense) | 3,560 | (7 | ) | 3,567 | ||||||||||||
Net trading income/(expense)40 | 5,861 | (55 | ) | 5,916 | ||||||||||||
Other income33 | 1,335 | 232 | 1,103 | |||||||||||||
Net operating income/ | 17,778 | (2 | ) | 17,780 | ||||||||||||
LICs34 | (365 | ) | 349 | (714 | ) | |||||||||||
Net operating income | 17,413 | 347 | 17,066 | |||||||||||||
Total operating expenses | (12,028 | ) | (708 | ) | (11,320 | ) | ||||||||||
Operating profit/(loss) | 5,385 | (361 | ) | 5,746 | ||||||||||||
Income from associates35 | 504 | |||||||||||||||
Profit/(loss) before tax | 5,889 | |||||||||||||||
RoRWA24 | 1.2% | (0.8% | ) | 1.3% | ||||||||||||
2013 | ||||||||||||||||
Net interest income | 6,766 | 38 | 6,728 | |||||||||||||
Net fee income/(expense) | 3,482 | (7 | ) | 3,489 | ||||||||||||
Net trading income40 | 6,780 | 198 | 6,582 | |||||||||||||
Other income/(expense)33 | 2,148 | (80 | ) | 2,228 | ||||||||||||
Net operating income1 | 19,176 | 149 | 19,027 | |||||||||||||
LICs34 | (207 | ) | 206 | (413 | ) | |||||||||||
Net operating income | 18,969 | 355 | 18,614 | |||||||||||||
Total operating expenses | (9,960 | ) | (170 | ) | (9,790 | ) | ||||||||||
Operating profit | 9,009 | 185 | 8,824 | |||||||||||||
Income from associates35 | 432 | |||||||||||||||
Profit before tax | 9,441 | |||||||||||||||
RoRWA24 | 2.3% | 0.6% | 2.5% | |||||||||||||
For footnotes, see page 99.
The GB&M client-facing and Balance Sheet Management (‘BSM’) businesses measure excludes the effects of the legacy credit portfolio and income from associates. This allows GB&M management to identify more readily the cause of material changes from year to year in the ongoing businesses and assess the factors and trends that are expected to have a material effect on the businesses in future years.
Management view of adjusted revenue
2015 $m | 2014 $m | |||||||||||
Total operating income1 | ||||||||||||
Markets41 | 6,882 | 5,775 | ||||||||||
– Legacy credit | 61 | (16 | ) | |||||||||
– Credit | 659 | 532 | ||||||||||
– Rates | 1,638 | 1,419 | ||||||||||
– Foreign Exchange | 2,918 | 2,722 | ||||||||||
– Equities | 1,606 | 1,118 | ||||||||||
| 1,606 | 1,118 | |||||||||||
Capital Financing | 3,789 | 3,777 | ||||||||||
Payments and Cash Management | 1,801 | 1,680 | ||||||||||
Securities Services | 1,698 | 1,589 | ||||||||||
Global Trade and Receivables Finance | 718 | 701 | ||||||||||
Balance Sheet Management | 2,943 | 2,845 | ||||||||||
Principal Investments | 243 | 498 | ||||||||||
Other42 | (40 | ) | (55 | ) | ||||||||
Year ended 31 December | 18,034 | 16,810 | ||||||||||
For footnotes, see page 99.
Profit before tax ($m)
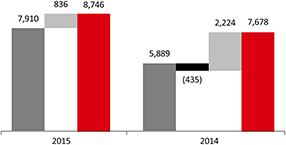
Revenue ($m)
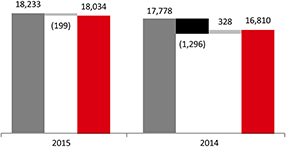
Operating expenses ($m)
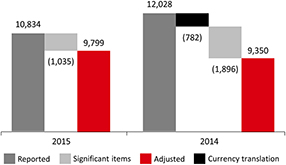
For details of significant items, see page 66.
HSBC HOLDINGS PLC
71
Table of Contents
Report of the Directors: Global businesses(continued)
GPB / Other
GPB serves high net worth individuals and
families with complex and international
needs within the Group’s priority markets.
| 2015 | 2014 | 2013 | ||||||||||||||
| $m | $m | $m | ||||||||||||||
Net interest income | 870 | 994 | 1,146 | |||||||||||||
Net fee income | 959 | 1,056 | 1,150 | |||||||||||||
Other income33 | 343 | 327 | 143 | |||||||||||||
Net operating income1 | 2,172 | 2,377 | 2,439 | |||||||||||||
LICs34 | (12 | ) | 8 | (31 | ) | |||||||||||
Net operating income | 2,160 | 2,385 | 2,408 | |||||||||||||
Total operating expenses | (1,832 | ) | (1,778 | ) | (2,229 | ) | ||||||||||
Operating profit | 328 | 607 | 179 | |||||||||||||
Income from associates35 | 16 | 19 | 14 | |||||||||||||
Profit before tax | 344 | 626 | 193 | |||||||||||||
RoRWA24 | 1.7% | 2.9% | 0.9% | |||||||||||||
Reportedclient assets43
| 2015 | 2014 | |||||||||||
| $bn | $bn | |||||||||||
At 1 January | 365 | 382 | ||||||||||
Net new money | 1 | (3 | ) | |||||||||
Of which: areas targeted for growth | 14 | 14 | ||||||||||
Value change | 1 | 8 | ||||||||||
Disposals | – | (11 | ) | |||||||||
Exchange and other | (18 | ) | (11 | ) | ||||||||
At 31 December | 349 | 365 | ||||||||||
Reported client assets by geography
| 2015 | 2014 | |||||||||||
| $bn | $bn | |||||||||||
Europe | 168 | 179 | ||||||||||
Asia | 112 | 112 | ||||||||||
North America | 61 | 63 | ||||||||||
Latin America | 8 | 11 | ||||||||||
At 31 December | 349 | 365 | ||||||||||
For footnotes, see page 99.
Profit before tax ($m)
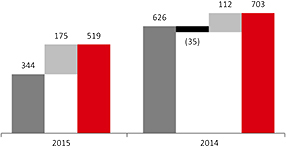
Revenue ($m)
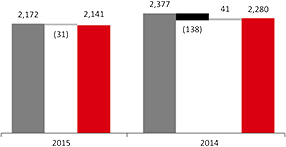
Operating expenses ($m)
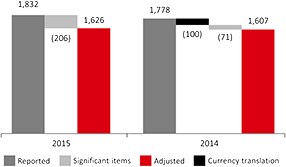
For details of significant items, see page 66.
HSBC HOLDINGS PLC
72
Table of Contents
‘Other’ contains the results of HSBC’s holding company and financing operations, central support and functional costs with associated recoveries, unallocated investment activities, centrally held investment companies, certain property transactions and movements in fair value of own debt.
| 2015 | 2014 | 2013 | ||||||||||||||
| $m | $m | $m | ||||||||||||||
Net interest expense | (710 | ) | (501 | ) | (737 | ) | ||||||||||
Net fee income/(expense) | (37 | ) | (65 | ) | 64 | |||||||||||
Net trading income/(expense) | (192 | ) | (92 | ) | 6 | |||||||||||
Changes in fair value of long-term debt issued and related derivatives | 863 | 508 | (1,228 | ) | ||||||||||||
Changes in other financial instruments designated at fair value | 61 | (9 | ) | (576 | ) | |||||||||||
Net income/(expense) from financial instruments designated at fair value | 924 | 499 | (1,804 | ) | ||||||||||||
Other income | 7,619 | 6,524 | 8,122 | |||||||||||||
Net operating income1 | 7,604 | 6,365 | 5,651 | |||||||||||||
LICs34 | – | – | – | |||||||||||||
Net operating income | 7,604 | 6,365 | 5,651 | |||||||||||||
Total operating expenses | (9,933 | ) | (8,601 | ) | (7,796 | ) | ||||||||||
Operating loss | (2,329 | ) | (2,236 | ) | (2,145 | ) | ||||||||||
Income/(expense) from associates35 | 2 | 6 | (14 | ) | ||||||||||||
Loss before tax | (2,327 | ) | (2,230 | ) | (2,159 | ) | ||||||||||
For footnotes, see page 99.
Loss before tax ($m)
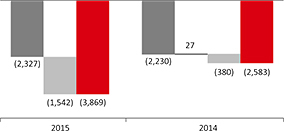
Revenue ($m)
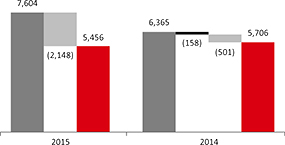
Operating expenses ($m)
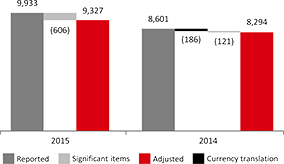
For details of significant items, see page 66.
HSBC HOLDINGS PLC
73
Table of Contents
Report of the Directors: Group businesses(continued)
Analysis by global business
HSBC profit/(loss) before tax and balance sheet data
| 2015 | ||||||||||||||||||||||||||||||||||||||||||
|
| Retail Banking and Wealth Management $m |
|
| Commercial Banking $m |
|
| Global Banking and Markets $m |
|
| Global Private Banking $m |
|
| Other $m | 29
|
| Inter- segment elimination $m |
44
|
| Total $m |
| ||||||||||||||||||||||
Profit/(loss) before tax | ||||||||||||||||||||||||||||||||||||||||||
Net interest income/(expense) | 15,926 | 9,859 | 6,931 | 870 | (710 | ) | (345 | ) | 32,531 | |||||||||||||||||||||||||||||||||
Net fee income/(expense) | 6,218 | 4,190 | 3,375 | 959 | (37 | ) | – | 14,705 | ||||||||||||||||||||||||||||||||||
Trading income/(expense) excluding net interest income | 540 | 571 | 5,714 | 327 | (204 | ) | – | 6,948 | ||||||||||||||||||||||||||||||||||
Net interest income/(expense) on trading activities | (19 | ) | (16 | ) | 1,455 | (2 | ) | 12 | 345 | 1,775 | ||||||||||||||||||||||||||||||||
Net trading income/(expense)40 | 521 | 555 | 7,169 | 325 | (192 | ) | 345 | 8,723 | ||||||||||||||||||||||||||||||||||
Changes in fair value of long-term debt issued and related derivatives | – | – | – | – | 863 | – | 863 | |||||||||||||||||||||||||||||||||||
Net income/(expense) from other financial instruments designated at fair value | 556 | 110 | (58 | ) | – | 61 | – | 669 | ||||||||||||||||||||||||||||||||||
Net income/(expense) from financial instruments designated at fair value | 556 | 110 | (58 | ) | – | 924 | – | 1,532 | ||||||||||||||||||||||||||||||||||
Gains less losses from financial investments | 68 | 37 | 598 | 23 | 1,342 | – | 2,068 | |||||||||||||||||||||||||||||||||||
Dividend income | 23 | 16 | 40 | 11 | 33 | – | 123 | |||||||||||||||||||||||||||||||||||
Net insurance premium income | 9,204 | 1,106 | 5 | 42 | (2 | ) | – | 10,355 | ||||||||||||||||||||||||||||||||||
Other operating income | 972 | 252 | 177 | 3 | 6,246 | (6,595 | ) | 1,055 | ||||||||||||||||||||||||||||||||||
Total operating income | 33,488 | 16,125 | 18,237 | 2,233 | 7,604 | (6,595 | ) | 71,092 | ||||||||||||||||||||||||||||||||||
Net insurance claims45 | (9,972 | ) | (1,255 | ) | (4 | ) | (61 | ) | – | – | (11,292 | ) | ||||||||||||||||||||||||||||||
Net operating income1 | 23,516 | 14,870 | 18,233 | 2,172 | 7,604 | (6,595 | ) | 59,800 | ||||||||||||||||||||||||||||||||||
Loan impairment charges and other credit risk provisions | (1,939 | ) | (1,770 | ) | – | (12 | ) | – | – | (3,721 | ) | |||||||||||||||||||||||||||||||
Net operating income | 21,577 | 13,100 | 18,233 | 2,160 | 7,604 | (6,595 | ) | 56,079 | ||||||||||||||||||||||||||||||||||
Employee expenses46 | (4,966 | ) | (2,443 | ) | (3,735 | ) | (654 | ) | (8,102 | ) | – | (19,900 | ) | |||||||||||||||||||||||||||||
Other operating expenses | (12,054 | ) | (4,301 | ) | (7,099 | ) | (1,178 | ) | (1,831 | ) | 6,595 | (19,868 | ) | |||||||||||||||||||||||||||||
Total operating expenses | (17,020 | ) | (6,744 | ) | (10,834 | ) | (1,832 | ) | (9,933 | ) | 6,595 | (39,768 | ) | |||||||||||||||||||||||||||||
Operating profit/(loss) | 4,557 | 6,356 | 7,399 | 328 | (2,329 | ) | – | 16,311 | ||||||||||||||||||||||||||||||||||
Share of profit in associates and joint ventures | 410 | 1,617 | 511 | 16 | 2 | – | 2,556 | |||||||||||||||||||||||||||||||||||
Profit/(loss) before tax | 4,967 | 7,973 | 7,910 | 344 | (2,327 | ) | – | 18,867 | ||||||||||||||||||||||||||||||||||
| % | % | % | % | % | % | |||||||||||||||||||||||||||||||||||||
Share of HSBC’s profit before tax | 26.3 | 42.3 | 41.9 | 1.8 | (12.3 | ) | 100.0 | |||||||||||||||||||||||||||||||||||
Cost efficiency ratio | 72.4 | 45.4 | 59.4 | 84.3 | 130.6 | 66.5 | ||||||||||||||||||||||||||||||||||||
Balance sheet data22,30 | ||||||||||||||||||||||||||||||||||||||||||
| $m | $m | $m | $m | $m | $m | |||||||||||||||||||||||||||||||||||||
Loans and advances to customers (net) | 340,009 | 302,240 | 236,932 | 42,942 | 2,331 | 924,454 | ||||||||||||||||||||||||||||||||||||
– reported in held for sale | 5,258 | 8,010 | 3,689 | 85 | 1,979 | 19,021 | ||||||||||||||||||||||||||||||||||||
Total assets | 473,284 | 365,290 | 1,616,704 | 81,448 | 147,417 | (274,487 | ) | 2,409,656 | ||||||||||||||||||||||||||||||||||
Customer accounts | 584,872 | 361,701 | 261,728 | 80,404 | 881 | 1,289,586 | ||||||||||||||||||||||||||||||||||||
– reported in held for sale | 7,758 | 3,363 | 2,551 | 3,010 | – | 16,682 | ||||||||||||||||||||||||||||||||||||
HSBC HOLDINGS PLC
74
Table of Contents
| 2014 | ||||||||||||||||||||||||||||||||||||||||||
|
| Retail Banking and Wealth Management $m |
28
|
| Commercial Banking $m | 28
|
| Global Banking and Markets $m |
| | Global Private Banking $m | |
| Other $m | 29
|
| Inter- segment elimination $m |
44
|
| Total $m |
| ||||||||||||||||||||||
Profit/(loss) before tax | ||||||||||||||||||||||||||||||||||||||||||
Net interest income/(expense) | 17,130 | 10,158 | 7,022 | 994 | (501 | ) | (98 | ) | 34,705 | |||||||||||||||||||||||||||||||||
Net fee income/(expense) | 6,836 | 4,570 | 3,560 | 1,056 | (65 | ) | – | 15,957 | ||||||||||||||||||||||||||||||||||
Trading income/(expense) excluding net interest income | (26 | ) | 618 | 4,063 | 298 | (100 | ) | – | 4,853 | |||||||||||||||||||||||||||||||||
Net interest income/(expense) on trading activities | 9 | (2 | ) | 1,798 | (4 | ) | 8 | 98 | 1,907 | |||||||||||||||||||||||||||||||||
Net trading income/(expense)40 | (17 | ) | 616 | 5,861 | 294 | (92 | ) | 98 | 6,760 | |||||||||||||||||||||||||||||||||
Changes in fair value of long-term debt issued and related derivatives | – | – | – | – | 508 | – | 508 | |||||||||||||||||||||||||||||||||||
Net income/(expense) from other financial instruments designated at fair value | 1,684 | 279 | 12 | (1 | ) | (9 | ) | – | 1,965 | |||||||||||||||||||||||||||||||||
Net income/(expense) from financial instruments designated at fair value | 1,684 | 279 | 12 | (1 | ) | 499 | – | 2,473 | ||||||||||||||||||||||||||||||||||
Gains less losses from financial investments | 14 | 31 | 1,117 | 9 | 164 | – | 1,335 | |||||||||||||||||||||||||||||||||||
Dividend income | 24 | 18 | 80 | 5 | 184 | – | 311 | |||||||||||||||||||||||||||||||||||
Net insurance premium income | 10,609 | 1,257 | 5 | 50 | – | – | 11,921 | |||||||||||||||||||||||||||||||||||
Other operating income | 726 | 241 | 124 | 33 | 6,176 | (6,169 | ) | 1,131 | ||||||||||||||||||||||||||||||||||
Total operating income | 37,006 | 17,170 | 17,781 | 2,440 | 6,365 | (6,169 | ) | 74,593 | ||||||||||||||||||||||||||||||||||
Net insurance claims45 | (11,857 | ) | (1,422 | ) | (3 | ) | (63 | ) | – | – | (13,345 | ) | ||||||||||||||||||||||||||||||
Net operating income1 | 25,149 | 15,748 | 17,778 | 2,377 | 6,365 | (6,169 | ) | 61,248 | ||||||||||||||||||||||||||||||||||
Loan impairment (charges)/recoveries and other credit risk provisions | (1,936 | ) | (1,558 | ) | (365 | ) | 8 | – | – | (3,851 | ) | |||||||||||||||||||||||||||||||
Net operating income | 23,213 | 14,190 | 17,413 | 2,385 | 6,365 | (6,169 | ) | 57,397 | ||||||||||||||||||||||||||||||||||
Employee expenses46 | (5,126 | ) | (2,351 | ) | (3,655 | ) | (732 | ) | (8,502 | ) | – | (20,366 | ) | |||||||||||||||||||||||||||||
Other operating expenses | (12,904 | ) | (4,630 | ) | (8,373 | ) | (1,046 | ) | (99 | ) | 6,169 | (20,883 | ) | |||||||||||||||||||||||||||||
Total operating expenses | (18,030 | ) | (6,981 | ) | (12,028 | ) | (1,778 | ) | (8,601 | ) | 6,169 | (41,249 | ) | |||||||||||||||||||||||||||||
Operating profit/(loss) | 5,183 | 7,209 | 5,385 | 607 | (2,236 | ) | – | 16,148 | ||||||||||||||||||||||||||||||||||
Share of profit in associates and joint ventures | 398 | 1,605 | 504 | 19 | 6 | – | 2,532 | |||||||||||||||||||||||||||||||||||
Profit/(loss) before tax | 5,581 | 8,814 | 5,889 | 626 | (2,230 | ) | – | 18,680 | ||||||||||||||||||||||||||||||||||
| % | % | % | % | % | % | |||||||||||||||||||||||||||||||||||||
Share of HSBC’s profit before tax | 29.9 | 47.2 | 31.5 | 3.4 | (12.0 | ) | 100.0 | |||||||||||||||||||||||||||||||||||
Cost efficiency ratio | 71.7 | 44.3 | 67.7 | 74.8 | 135.1 | 67.3 | ||||||||||||||||||||||||||||||||||||
Balance sheet data30 | ||||||||||||||||||||||||||||||||||||||||||
| $m | $m | $m | $m | $m | $m | |||||||||||||||||||||||||||||||||||||
Loans and advances to customers (net) | 360,704 | 313,039 | 254,463 | 44,102 | 2,352 | 974,660 | ||||||||||||||||||||||||||||||||||||
– reported in held for sale | 198 | – | 288 | 91 | – | 577 | ||||||||||||||||||||||||||||||||||||
Total assets | 500,864 | 370,958 | 1,839,644 | 88,342 | 164,537 | (330,206 | ) | 2,634,139 | ||||||||||||||||||||||||||||||||||
Customer accounts | 583,757 | 361,318 | 319,121 | 85,465 | 981 | 1,350,642 | ||||||||||||||||||||||||||||||||||||
– reported in held for sale | – | – | – | 145 | – | 145 | ||||||||||||||||||||||||||||||||||||
For footnotes, see page 99.
HSBC HOLDINGS PLC
75
Table of Contents
Report of the Directors: Financial Review(continued)
Profit/(loss) before tax and balance sheet data (continued)
| 2013 | ||||||||||||||||||||||||||||||||||||||||||
|
| Retail Banking and Wealth Management $m |
28
|
| Commercial Banking $m | 28
|
| Global Banking and Markets $m |
| | Global Private Banking $m | |
| Other $m | 29
|
| Inter- segment elimination $m |
44
|
| Total $m |
| ||||||||||||||||||||||
Profit/(loss) before tax | ||||||||||||||||||||||||||||||||||||||||||
Net interest income/(expense) | 18,808 | 9,731 | 6,766 | 1,146 | (737 | ) | (175 | ) | 35,539 | |||||||||||||||||||||||||||||||||
Net fee income | 7,211 | 4,527 | 3,482 | 1,150 | 64 | – | 16,434 | |||||||||||||||||||||||||||||||||||
Trading income/(expense) excluding net interest income | 695 | 643 | 4,953 | 390 | (38 | ) | – | 6,643 | ||||||||||||||||||||||||||||||||||
Net interest income/(expense) on trading activities | (4 | ) | 1 | 1,827 | 4 | 44 | 175 | 2,047 | ||||||||||||||||||||||||||||||||||
Net trading income40 | 691 | 644 | 6,780 | 394 | 6 | 175 | 8,690 | |||||||||||||||||||||||||||||||||||
Changes in fair value of long-term debt issued and related derivatives | – | – | – | – | (1,228 | ) | – | (1,228 | ) | |||||||||||||||||||||||||||||||||
Net income/(expense) from financial instruments designated at fair value | 1,643 | 327 | 599 | 4 | (576 | ) | (1 | ) | 1,996 | |||||||||||||||||||||||||||||||||
Net income/(expense) from financial instruments designated at fair value | 1,643 | 327 | 599 | 4 | (1,804 | ) | (1 | ) | 768 | |||||||||||||||||||||||||||||||||
Gains less losses from financial investments | 55 | 1 | 747 | (3 | ) | 1,212 | – | 2,012 | ||||||||||||||||||||||||||||||||||
Dividend income | 22 | 14 | 129 | 8 | 149 | – | 322 | |||||||||||||||||||||||||||||||||||
Net insurance premium income | 10,598 | 1,320 | 6 | 16 | – | – | 11,940 | |||||||||||||||||||||||||||||||||||
Other operating income/(expense) | 554 | 611 | 670 | (239 | ) | 6,761 | (5,725 | ) | 2,632 | |||||||||||||||||||||||||||||||||
Total operating income | 39,582 | 17,175 | 19,179 | 2,476 | 5,651 | (5,726 | ) | 78,337 | ||||||||||||||||||||||||||||||||||
Net insurance claims45 | (12,129 | ) | (1,523 | ) | (3 | ) | (37 | ) | – | – | (13,692 | ) | ||||||||||||||||||||||||||||||
Net operating income1 | 27,453 | 15,652 | 19,176 | 2,439 | 5,651 | (5,726 | ) | 64,645 | ||||||||||||||||||||||||||||||||||
Loan impairment charges and other credit risk provisions | (3,510 | ) | (2,101 | ) | (207 | ) | (31 | ) | – | – | (5,849 | ) | ||||||||||||||||||||||||||||||
Net operating income | 23,943 | 13,551 | 18,969 | 2,408 | 5,651 | (5,726 | ) | 58,796 | ||||||||||||||||||||||||||||||||||
Employee expenses46 | (5,308 | ) | (2,238 | ) | (3,549 | ) | (776 | ) | (7,325 | ) | – | (19,196 | ) | |||||||||||||||||||||||||||||
Other operating expenses | (12,466 | ) | (4,285 | ) | (6,411 | ) | (1,453 | ) | (471 | ) | 5,726 | (19,360 | ) | |||||||||||||||||||||||||||||
Total operating expenses | (17,774 | ) | (6,523 | ) | (9,960 | ) | (2,229 | ) | (7,796 | ) | 5,726 | (38,556 | ) | |||||||||||||||||||||||||||||
Operating profit/(loss) | 6,169 | 7,028 | 9,009 | 179 | (2,145 | ) | – | 20,240 | ||||||||||||||||||||||||||||||||||
Share of profit/(loss) in associates and joint ventures | 384 | 1,509 | 432 | 14 | (14 | ) | – | 2,325 | ||||||||||||||||||||||||||||||||||
Profit/(loss) before tax | 6,553 | 8,537 | 9,441 | 193 | (2,159 | ) | – | 22,565 | ||||||||||||||||||||||||||||||||||
| % | % | % | % | % | % | |||||||||||||||||||||||||||||||||||||
Share of HSBC’s profit before tax | 29.1 | 37.8 | 41.8 | 0.9 | (9.6 | ) | 100.0 | |||||||||||||||||||||||||||||||||||
Cost efficiency ratio | 64.7 | 41.7 | 51.9 | 91.4 | 138.0 | 59.6 | ||||||||||||||||||||||||||||||||||||
Balance sheet data30 | ||||||||||||||||||||||||||||||||||||||||||
| $m | $m | $m | $m | $m | $m | |||||||||||||||||||||||||||||||||||||
Loans and advances to customers (net) | 376,463 | 296,475 | 272,473 | 44,224 | 2,454 | 992,089 | ||||||||||||||||||||||||||||||||||||
Total assets | 518,718 | 358,990 | 1,975,509 | 97,655 | 171,812 | (451,366 | ) | 2,671,318 | ||||||||||||||||||||||||||||||||||
Customer accounts | 583,140 | 351,152 | 328,800 | 96,770 | 1,435 | 1,361,297 | ||||||||||||||||||||||||||||||||||||
For footnotes, see page 99.
HSBC HOLDINGS PLC
75a
Table of Contents
Report of the Directors: Geographical regions
Summary / Reconciliations
| ||||
|
| 76
|
| |
Reconciliation of 2015 and 2014 reported and adjusted items for geographical regions
|
| 77
|
| |
Reconciliation of 2014 and 2013 reported and adjusted items for geographical regions
|
| 78a
|
| |
|
| 79
|
| |
|
| 82
|
| |
|
| 86
|
| |
|
| 89
|
| |
|
| 92
|
| |
Additional information on results in 2015 may be found in the Financial Summary on pages 48 to 64.
In the analysis of profit and loss by geographical regions that follows, operating income and operating expenses includeintra-HSBC items of $3,375m (2014: $2,972m; 2013: $2,628m).
All tables are on a reported basis unless otherwise stated.
Basis of preparation
The results of the geographical regions are presented in accordance with the accounting policies used in the preparation of HSBC’s consolidated financial statements. Our operations are closely integrated, and accordingly, the presentation of the geographical data includes internal allocation of certain items of income and expense. These allocations include the costs of certain support services and global functions to the extent that they can be meaningfully attributed to geographical regions. While such allocations have been done on a systematic and consistent basis, they necessarily involve a degree of subjectivity.
Where relevant, income and expense amounts presented include the results of inter-segment funding along with inter-company transactions. All such transactions are undertaken on an arm’s length basis.
The expense of the UK bank levy is included in the Europe geographical region as HSBC regards the levy as a cost of being headquartered in the UK.
|
Profit/(loss) before tax
| 2015 | 2014 | 2013 | ||||||||||||||||||||||||||||||||||
| $m | % | $m | % | $m | % | |||||||||||||||||||||||||||||||
Europe | 643 | 3.4 | 596 | 3.2 | 1,825 | 8.1 | ||||||||||||||||||||||||||||||
Asia | 15,763 | 83.5 | 14,625 | 78.3 | 15,853 | 70.3 | ||||||||||||||||||||||||||||||
Middle East and North Africa | 1,537 | 8.1 | 1,826 | 9.8 | 1,694 | 7.5 | ||||||||||||||||||||||||||||||
North America | 614 | 3.3 | 1,417 | 7.6 | 1,221 | 5.4 | ||||||||||||||||||||||||||||||
Latin America | 310 | 1.7 | 216 | 1.1 | 1,972 | 8.7 | ||||||||||||||||||||||||||||||
Year ended 31 December | 18,867 | 100.0 | 18,680 | 100.0 | 22,565 | 100.0 | ||||||||||||||||||||||||||||||
Total assets30
|
| |||||||||||||||||||||||||||||||||||
| 2015 | 2014 | |||||||||||||||||||||||||||||||||||
| $m | % | $m | % | |||||||||||||||||||||||||||||||||
Europe |
| 1,129,365 | 46.9 | 1,290,926 | 49.0 | |||||||||||||||||||||||||||||||
Asia |
| 889,747 | 36.9 | 878,723 | 33.4 | |||||||||||||||||||||||||||||||
Middle East and North Africa |
| 59,236 | 2.5 | 62,417 | 2.4 | |||||||||||||||||||||||||||||||
North America |
| 393,960 | 16.3 | 436,859 | 16.6 | |||||||||||||||||||||||||||||||
Latin America |
| 86,262 | 3.6 | 115,354 | 4.4 | |||||||||||||||||||||||||||||||
Intra-HSBC items |
| (148,914 | ) | (6.2 | ) | (150,140 | ) | (5.8 | ) | |||||||||||||||||||||||||||
At 31 December |
| 2,409,656 | 100.0 | 2,634,139 | 100.0 | |||||||||||||||||||||||||||||||
Risk-weighted assets47
|
| |||||||||||||||||||||||||||||||||||
| 2015 | 2014 | |||||||||||||||||||||||||||||||||||
| $bn | % | $bn | % | |||||||||||||||||||||||||||||||||
At 31 December |
| 1,103.0 | 100.0 | 1,219.8 | 100.0 | |||||||||||||||||||||||||||||||
Europe |
| 337.4 | 30.6 | 375.4 | 30.1 | |||||||||||||||||||||||||||||||
Asia |
| 459.7 | 41.7 | 499.8 | 40.0 | |||||||||||||||||||||||||||||||
Middle East and North Africa |
| 60.4 | 5.5 | 63.0 | 5.0 | |||||||||||||||||||||||||||||||
North America |
| 191.6 | 17.4 | 221.4 | 17.8 | |||||||||||||||||||||||||||||||
Latin America |
| 73.4 | 6.7 | 88.8 | 7.1 | |||||||||||||||||||||||||||||||
For footnotes, see page 99.
HSBC HOLDINGS PLC
76
Table of Contents
Reconciliation of reported and adjusted items – geographical regions
2015 compared with 2014
| 2015 | ||||||||||||||||||||||||||||||||||||||||||||||||
| Europe | Asia | MENA | North America | Latin America | Total | UK | Hong Kong | |||||||||||||||||||||||||||||||||||||||||
| $m | $m | $m | $m | $m | $m | $m | $m | |||||||||||||||||||||||||||||||||||||||||
Revenue1 | ||||||||||||||||||||||||||||||||||||||||||||||||
Reported31 | 21,058 | 25,303 | 2,565 | 7,657 | 6,592 | 59,800 | 15,493 | 15,616 | ||||||||||||||||||||||||||||||||||||||||
Significant items | (656 | ) | (1,431 | ) | (10 | ) | 98 | (36 | ) | (2,035 | ) | (595 | ) | (1,383 | ) | |||||||||||||||||||||||||||||||||
– disposal costs of Brazilian operations | – | – | – | – | 18 | 18 | – | – | ||||||||||||||||||||||||||||||||||||||||
– debit valuation adjustment (‘DVA’) on derivative contracts | (95 | ) | (58 | ) | (1 | ) | (21 | ) | (55 | ) | (230 | ) | (78 | ) | (13 | ) | ||||||||||||||||||||||||||||||||
– fair value movements on non-qualifying hedges32 | 200 | 2 | – | 124 | 1 | 327 | 204 | 6 | ||||||||||||||||||||||||||||||||||||||||
– gain on the partial sale of shareholding in Industrial Bank | – | (1,372 | ) | – | – | – | (1,372 | ) | – | (1,372 | ) | |||||||||||||||||||||||||||||||||||||
– loss on sale of several tranches of real estate secured accounts in the US | – | – | – | 214 | – | 214 | – | – | ||||||||||||||||||||||||||||||||||||||||
– own credit spread2 | (771 | ) | (3 | ) | (9 | ) | (219 | ) | – | (1,002 | ) | (731 | ) | (4 | ) | |||||||||||||||||||||||||||||||||
– provisions arising from the ongoing review of compliance with the Consumer Credit Act in the UK | 10 | – | – | – | – | 10 | 10 | – | ||||||||||||||||||||||||||||||||||||||||
Adjusted31 | 20,402 | 23,872 | 2,555 | 7,755 | 6,556 | 57,765 | 14,898 | 14,233 | ||||||||||||||||||||||||||||||||||||||||
Loan impairment charges and other credit risk provisions (‘LIC’s) | ||||||||||||||||||||||||||||||||||||||||||||||||
Reported | (690 | ) | (693 | ) | (299 | ) | (544 | ) | (1,495 | ) | (3,721 | ) | (248 | ) | (155 | ) | ||||||||||||||||||||||||||||||||
Adjusted | (690 | ) | (693 | ) | (299 | ) | (544 | ) | (1,495 | ) | (3,721 | ) | (248 | ) | (155 | ) | ||||||||||||||||||||||||||||||||
Operating expenses | ||||||||||||||||||||||||||||||||||||||||||||||||
Reported31 | (19,733 | ) | (10,889 | ) | (1,234 | ) | (6,501 | ) | (4,786 | ) | (39,768 | ) | (15,555 | ) | (5,686 | ) | ||||||||||||||||||||||||||||||||
Significant items | 2,405 | 130 | 15 | 851 | 185 | 3,586 | 2,151 | 49 | ||||||||||||||||||||||||||||||||||||||||
– disposal costs of Brazilian operations | – | – | – | – | 110 | 110 | – | – | ||||||||||||||||||||||||||||||||||||||||
– costs-to-achieve | 600 | 122 | 14 | 103 | 69 | 908 | 536 | 43 | ||||||||||||||||||||||||||||||||||||||||
– costs to establish UK ring-fenced bank | 89 | – | – | – | – | 89 | 89 | – | ||||||||||||||||||||||||||||||||||||||||
– regulatory provisions in GPB | 172 | – | – | – | – | 172 | – | – | ||||||||||||||||||||||||||||||||||||||||
– restructuring and other related costs | 68 | 8 | 1 | 34 | 6 | 117 | 50 | 6 | ||||||||||||||||||||||||||||||||||||||||
– settlements and provisions in connection with legal matters | 935 | – | – | 714 | – | 1,649 | 935 | – | ||||||||||||||||||||||||||||||||||||||||
– UK customer redress programmes | 541 | – | – | – | – | 541 | 541 | – | ||||||||||||||||||||||||||||||||||||||||
Adjusted31 | (17,328 | ) | (10,759 | ) | (1,219 | ) | (5,650 | ) | (4,601 | ) | (36,182 | ) | (13,404 | ) | (5,637 | ) | ||||||||||||||||||||||||||||||||
Share of profit in associates and joint ventures | ||||||||||||||||||||||||||||||||||||||||||||||||
Reported | 8 | 2,042 | 505 | 2 | (1 | ) | 2,556 | 10 | 31 | |||||||||||||||||||||||||||||||||||||||
Adjusted | 8 | 2,042 | 505 | 2 | (1 | ) | 2,556 | 10 | 31 | |||||||||||||||||||||||||||||||||||||||
Profit/(loss) before tax | ||||||||||||||||||||||||||||||||||||||||||||||||
Reported | 643 | 15,763 | 1,537 | 614 | 310 | 18,867 | (300 | ) | 9,806 | |||||||||||||||||||||||||||||||||||||||
Significant items | 1,749 | (1,301 | ) | 5 | 949 | 149 | 1,551 | 1,556 | (1,334 | ) | ||||||||||||||||||||||||||||||||||||||
– revenue | (656 | ) | (1,431 | ) | (10 | ) | 98 | (36 | ) | (2,035 | ) | (595 | ) | (1,383 | ) | |||||||||||||||||||||||||||||||||
– operating expenses | 2,405 | 130 | 15 | 851 | 185 | 3,586 | 2,151 | 49 | ||||||||||||||||||||||||||||||||||||||||
Adjusted | 2,392 | 14,462 | 1,542 | 1,563 | 459 | 20,418 | 1,256 | 8,472 | ||||||||||||||||||||||||||||||||||||||||
HSBC HOLDINGS PLC
77
Table of Contents
Report of the Directors: Geographical regions(continued)
Reconciliations / Europe
Reconciliation of reported and adjusted items (continued)
| 2014 | ||||||||||||||||||||||||||||||||||||||||||||||||||
| Europe $m | Asia $m | MENA $m | North America | Latin America | Total $m | UK $m | Hong Kong $m | |||||||||||||||||||||||||||||||||||||||||||
Revenue1 | ||||||||||||||||||||||||||||||||||||||||||||||||||
Reported31 | 21,571 | 23,677 | 2,548 | 8,152 | 8,272 | 61,248 | 15,727 | 13,844 | ||||||||||||||||||||||||||||||||||||||||||
Currency translation31 | (2,013 | ) | (680 | ) | (50 | ) | (252 | ) | (1,871 | ) | (4,775 | ) | (1,058 | ) | 4 | |||||||||||||||||||||||||||||||||||
Significant items | 708 | (48 | ) | (3 | ) | 116 | (19 | ) | 754 | 353 | (119 | ) | ||||||||||||||||||||||||||||||||||||||
– DVA on derivative contracts | 234 | 69 | 5 | 16 | 8 | 332 | 203 | 26 | ||||||||||||||||||||||||||||||||||||||||||
– fair value movements on non-qualifying hedges32 | 235 | 4 | – | 302 | – | 541 | (8 | ) | 11 | |||||||||||||||||||||||||||||||||||||||||
– gain on sale of several tranches of real estate secured accounts in the US | – | – | – | (168 | ) | – | (168 | ) | – | – | ||||||||||||||||||||||||||||||||||||||||
– gain on sale of shareholding in Bank of Shanghai | – | (428 | ) | – | – | – | (428 | ) | – | (428 | ) | |||||||||||||||||||||||||||||||||||||||
– impairment of our investment in Industrial Bank | – | 271 | – | – | – | 271 | – | 271 | ||||||||||||||||||||||||||||||||||||||||||
– own credit spread4 | (393 | ) | 4 | 6 | (34 | ) | – | (417 | ) | (474 | ) | 1 | ||||||||||||||||||||||||||||||||||||||
– provisions arising from the ongoing review of compliance with the Consumer Credit Act in the UK | 632 | – | – | – | – | 632 | 632 | – | ||||||||||||||||||||||||||||||||||||||||||
– (gain)/loss and trading results from disposals and changes in ownership levels | – | 32 | (14 | ) | – | (27 | ) | (9 | ) | – | – | |||||||||||||||||||||||||||||||||||||||
Adjusted31 | 20,266 | 22,949 | 2,495 | 8,016 | 6,382 | 57,227 | 15,022 | 13,729 | ||||||||||||||||||||||||||||||||||||||||||
LICs | ||||||||||||||||||||||||||||||||||||||||||||||||||
Reported | (764 | ) | (647 | ) | 6 | (322 | ) | (2,124 | ) | (3,851 | ) | (214 | ) | (320 | ) | |||||||||||||||||||||||||||||||||||
Currency translation | 104 | 26 | – | 13 | 540 | 683 | 4 | – | ||||||||||||||||||||||||||||||||||||||||||
Significant items | – | – | (2 | ) | – | 2 | – | – | – | |||||||||||||||||||||||||||||||||||||||||
– trading results from disposals and changes in ownership levels | – | – | (2 | ) | – | 2 | – | – | – | |||||||||||||||||||||||||||||||||||||||||
Adjusted | (660 | ) | (621 | ) | 4 | (309 | ) | (1,582 | ) | (3,168 | ) | (210 | ) | (320 | ) | |||||||||||||||||||||||||||||||||||
Operating expenses | ||||||||||||||||||||||||||||||||||||||||||||||||||
Reported31 | (20,217 | ) | (10,427 | ) | (1,216 | ) | (6,429 | ) | (5,932 | ) | (41,249 | ) | (15,576 | ) | (5,424 | ) | ||||||||||||||||||||||||||||||||||
Currency translation31 | 1,499 | 352 | 16 | 129 | 1,373 | 3,278 | 809 | (1 | ) | |||||||||||||||||||||||||||||||||||||||||
Significant items | 2,601 | 58 | 33 | 578 | 125 | 3,395 | 2,553 | 56 | ||||||||||||||||||||||||||||||||||||||||||
– charge in relation to the settlement agreement with the Federal Housing Finance Authority | – | – | – | 550 | – | 550 | – | – | ||||||||||||||||||||||||||||||||||||||||||
– regulatory provisions in GPB | 16 | 49 | – | – | – | 65 | – | 49 | ||||||||||||||||||||||||||||||||||||||||||
– restructuring and other related costs | 123 | 9 | 2 | 28 | 116 | 278 | 91 | 7 | ||||||||||||||||||||||||||||||||||||||||||
– settlements and provisions in connection with legal matters | 1,187 | – | – | – | – | 1,187 | 1,187 | – | ||||||||||||||||||||||||||||||||||||||||||
– UK customer redress programmes | 1,275 | – | – | – | – | 1,275 | 1,275 | – | ||||||||||||||||||||||||||||||||||||||||||
– trading results from disposals and changes in ownership levels | – | – | 31 | – | 9 | 40 | – | – | ||||||||||||||||||||||||||||||||||||||||||
Adjusted31 | (16,117 | ) | (10,017 | ) | (1,167 | ) | (5,722 | ) | (4,434 | ) | (34,576 | ) | (12,214 | ) | (5,369 | ) | ||||||||||||||||||||||||||||||||||
Share of profit in associates and joint ventures | ||||||||||||||||||||||||||||||||||||||||||||||||||
Reported | 6 | 2,022 | 488 | 16 | – | 2,532 | 7 | 42 | ||||||||||||||||||||||||||||||||||||||||||
Currency translation | 1 | (38 | ) | – | (2 | ) | – | (39 | ) | (1 | ) | (1 | ) | |||||||||||||||||||||||||||||||||||||
Adjusted | 7 | 1,984 | 488 | 14 | – | 2,493 | 6 | 41 | ||||||||||||||||||||||||||||||||||||||||||
Profit/(loss) before tax | ||||||||||||||||||||||||||||||||||||||||||||||||||
Reported | 596 | 14,625 | 1,826 | 1,417 | 216 | 18,680 | (56 | ) | 8,142 | |||||||||||||||||||||||||||||||||||||||||
Currency translation | (409 | ) | (340 | ) | (34 | ) | (112 | ) | 42 | (853 | ) | (246 | ) | 2 | ||||||||||||||||||||||||||||||||||||
Significant items | 3,309 | 10 | 28 | 694 | 108 | 4,149 | 2,906 | (63 | ) | |||||||||||||||||||||||||||||||||||||||||
– revenue | 708 | (48 | ) | (3 | ) | 116 | (19 | ) | 754 | 353 | (119 | ) | ||||||||||||||||||||||||||||||||||||||
– LICs | – | – | (2 | ) | – | 2 | – | – | – | |||||||||||||||||||||||||||||||||||||||||
– operating expenses | 2,601 | 58 | 33 | 578 | 125 | 3,395 | 2,553 | 56 | ||||||||||||||||||||||||||||||||||||||||||
Adjusted | 3,496 | 14,295 | 1,820 | 1,999 | 366 | 21,976 | 2,604 | 8,081 | ||||||||||||||||||||||||||||||||||||||||||
For footnotes, see page 99.
HSBC HOLDINGS PLC
78
Table of Contents
Reconciliation of reported and adjusted items – geographical regions
2014 compared with 2013
| 2014 | ||||||||||||||||||||||||||||||||||||||||||||||||||
| Europe $m | Asia $m | MENA $m | North America | Latin America | Total $m | UK $m | Hong Kong $m | |||||||||||||||||||||||||||||||||||||||||||
Revenue1 | ||||||||||||||||||||||||||||||||||||||||||||||||||
Reported31 | 21,571 | 23,677 | 2,548 | 8,152 | 8,272 | 61,248 | 15,727 | 13,844 | ||||||||||||||||||||||||||||||||||||||||||
Significant items | 708 | (48 | ) | (3 | ) | 116 | (19 | ) | 754 | 353 | (119 | ) | ||||||||||||||||||||||||||||||||||||||
– DVA on derivative contracts | 234 | 69 | 5 | 16 | 8 | 332 | 203 | 26 | ||||||||||||||||||||||||||||||||||||||||||
– fair value movements on non-qualifying hedges32 | 235 | 4 | – | 302 | – | 541 | (8 | ) | 11 | |||||||||||||||||||||||||||||||||||||||||
– gain on sale of several tranches of real estate secured accounts in the US | – | – | – | (168 | ) | – | (168 | ) | – | – | ||||||||||||||||||||||||||||||||||||||||
– gain on sale of shareholding in Bank of Shanghai | – | (428 | ) | – | – | – | (428 | ) | – | (428 | ) | |||||||||||||||||||||||||||||||||||||||
– impairment of our investment in Industrial Bank | – | 271 | – | – | – | 271 | – | 271 | ||||||||||||||||||||||||||||||||||||||||||
– own credit spread2 | (393 | ) | 4 | 6 | (34 | ) | – | (417 | ) | (474 | ) | 1 | ||||||||||||||||||||||||||||||||||||||
– provisions arising from the ongoing review of compliance with the Consumer Credit Act in the UK | 632 | – | – | – | – | 632 | 632 | – | ||||||||||||||||||||||||||||||||||||||||||
– (gain)/loss and trading results from disposals and changes in ownership levels | – | 32 | (14 | ) | – | (27 | ) | (9 | ) | – | – | |||||||||||||||||||||||||||||||||||||||
Adjusted31 | 22,279 | 23,629 | 2,545 | 8,268 | 8,253 | 62,002 | 16,080 | 13,725 | ||||||||||||||||||||||||||||||||||||||||||
LICs | ||||||||||||||||||||||||||||||||||||||||||||||||||
Reported | (764 | ) | (647 | ) | 6 | (322 | ) | (2,124 | ) | (3,851 | ) | (214 | ) | (320 | ) | |||||||||||||||||||||||||||||||||||
Significant items | – | – | (2 | ) | – | 2 | – | – | – | |||||||||||||||||||||||||||||||||||||||||
– trading results from disposals and changes in ownership levels | – | – | (2 | ) | – | 2 | – | – | – | |||||||||||||||||||||||||||||||||||||||||
Adjusted | (764 | ) | (647 | ) | 4 | (322 | ) | (2,122 | ) | (3,851 | ) | (214 | ) | (320 | ) | |||||||||||||||||||||||||||||||||||
Operating expenses | ||||||||||||||||||||||||||||||||||||||||||||||||||
Reported31 | (20,217 | ) | (10,427 | ) | (1,216 | ) | (6,429 | ) | (5,932 | ) | (41,249 | ) | (15,576 | ) | (5,424 | ) | ||||||||||||||||||||||||||||||||||
Significant items | 2,601 | 58 | 33 | 578 | 125 | 3,395 | 2,553 | 56 | ||||||||||||||||||||||||||||||||||||||||||
– charge in relation to the settlement agreement with the Federal Housing Finance Authority | – | – | – | 550 | – | 550 | – | – | ||||||||||||||||||||||||||||||||||||||||||
– restructuring and other related costs | 123 | 9 | 2 | 28 | 116 | 278 | 91 | 7 | ||||||||||||||||||||||||||||||||||||||||||
– regulatory provisions in GPB | 16 | 49 | – | – | – | 65 | – | 49 | ||||||||||||||||||||||||||||||||||||||||||
– settlements and provisions in connection with legal matters | 1,187 | – | – | – | – | 1,187 | 1,187 | – | ||||||||||||||||||||||||||||||||||||||||||
– UK customer redress programmes | 1,275 | – | – | – | – | 1,275 | 1,275 | – | ||||||||||||||||||||||||||||||||||||||||||
– trading results from disposals and changes in ownership levels | – | – | 31 | – | 9 | 40 | – | – | ||||||||||||||||||||||||||||||||||||||||||
Adjusted31 | (17,616 | ) | (10,369 | ) | (1,183 | ) | (5,851 | ) | (5,807 | ) | (37,854 | ) | (13,023 | ) | (5,368 | ) | ||||||||||||||||||||||||||||||||||
Share of profit in associates and joint ventures | ||||||||||||||||||||||||||||||||||||||||||||||||||
Reported | 6 | 2,022 | 488 | 16 | – | 2,532 | 7 | 42 | ||||||||||||||||||||||||||||||||||||||||||
Adjusted | 6 | 2,022 | 488 | 16 | – | 2,532 | 7 | 42 | ||||||||||||||||||||||||||||||||||||||||||
Profit before tax | ||||||||||||||||||||||||||||||||||||||||||||||||||
Reported | 596 | 14,625 | 1,826 | 1,417 | 216 | 18,680 | (56 | ) | 8,142 | |||||||||||||||||||||||||||||||||||||||||
Significant items | 3,309 | 10 | 28 | 694 | 108 | 4,149 | 2,906 | (63 | ) | |||||||||||||||||||||||||||||||||||||||||
– revenue | 708 | (48 | ) | (3 | ) | 116 | (19 | ) | 754 | 353 | (119 | ) | ||||||||||||||||||||||||||||||||||||||
– LICs | – | – | (2 | ) | – | 2 | – | – | – | |||||||||||||||||||||||||||||||||||||||||
– operating expenses | 2,601 | 58 | 33 | 578 | 125 | 3,395 | 2,553 | 56 | ||||||||||||||||||||||||||||||||||||||||||
Adjusted | 3,905 | 14,635 | 1,854 | 2,111 | 324 | 22,829 | 2,850 | 8,079 | ||||||||||||||||||||||||||||||||||||||||||
HSBC HOLDINGS PLC
78a
Table of Contents
Reconciliation of reported and adjusted items – geographical regions (continued)
| 2013 | ||||||||||||||||||||||||||||||||||||||||||||||||||
| Europe $m | Asia $m | MENA $m | North America | Latin America | Total $m | UK $m | Hong Kong $m | |||||||||||||||||||||||||||||||||||||||||||
Revenue1 | ||||||||||||||||||||||||||||||||||||||||||||||||||
Reported31 | 20,967 | 24,432 | 2,503 | 8,803 | 10,568 | 64,645 | 14,253 | 13,203 | ||||||||||||||||||||||||||||||||||||||||||
Currency translation31 | 651 | (280 | ) | (13 | ) | (139 | ) | (914 | ) | (686 | ) | 789 | 5 | |||||||||||||||||||||||||||||||||||||
Significant items | 585 | (1,698 | ) | (88 | ) | 675 | (1,579 | ) | (2,105 | ) | 323 | 3 | ||||||||||||||||||||||||||||||||||||||
– debit valuation adjustment on derivative contracts | (65 | ) | (40 | ) | (2 | ) | 14 | (13 | ) | (106 | ) | (78 | ) | (12 | ) | |||||||||||||||||||||||||||||||||||
– fair value movements on non-qualifying hedges32 | (297 | ) | 32 | – | (246 | ) | – | (511 | ) | (263 | ) | 14 | ||||||||||||||||||||||||||||||||||||||
– FX gains relating to sterling debt issued by HSBC Holdings | (442 | ) | – | – | – | – | (442 | ) | (442 | ) | – | |||||||||||||||||||||||||||||||||||||||
– HSBC Insurance (Asia-Pacific) Holdings Limited’s disposal of its shareholding in Bao Viet Holdings | – | (104 | ) | – | – | – | (104 | ) | – | – | ||||||||||||||||||||||||||||||||||||||||
– HSBC Latin America Holdings UK Limited’s disposal of HSBC Bank (Panama) S.A. | – | – | – | – | (1,107 | ) | (1,107 | ) | – | – | ||||||||||||||||||||||||||||||||||||||||
– loss on early termination of cash flow hedges in the US run-off portfolio | – | – | – | 199 | – | 199 | – | – | ||||||||||||||||||||||||||||||||||||||||||
– loss on sale of an HFC Bank UK secured loan portfolio | 146 | – | – | – | – | 146 | 146 | – | ||||||||||||||||||||||||||||||||||||||||||
– loss on sale of non-real estate secured accounts in the US | – | – | – | 271 | – | 271 | – | – | ||||||||||||||||||||||||||||||||||||||||||
– loss on sale of several tranches of real estate secured accounts in the US | – | – | – | 123 | – | 123 | – | – | ||||||||||||||||||||||||||||||||||||||||||
– net gain on completion of Ping An disposal | – | (553 | ) | – | – | – | (553 | ) | – | – | ||||||||||||||||||||||||||||||||||||||||
– own credit spread2 | 1,015 | 2 | 4 | 225 | 1,246 | 1,011 | 1 | |||||||||||||||||||||||||||||||||||||||||||
– reclassification gain in respect of our holdings in Industrial Bank Co., Limited following the issue of additional share capital to third parties | – | (1,089 | ) | – | – | – | (1,089 | ) | – | – | ||||||||||||||||||||||||||||||||||||||||
– write-off of allocated goodwill relating to the GPB Monaco business | 279 | – | – | – | – | 279 | – | – | ||||||||||||||||||||||||||||||||||||||||||
– other (gain)/loss and trading results from disposals and changes in ownership levels | (51 | ) | 54 | (90 | ) | 89 | (459 | ) | (457 | ) | (51 | ) | – | |||||||||||||||||||||||||||||||||||||
Adjusted31 | 22,203 | 22,454 | 2,402 | 9,339 | 8,075 | 61,854 | 15,365 | 13,211 | ||||||||||||||||||||||||||||||||||||||||||
LICs | ||||||||||||||||||||||||||||||||||||||||||||||||||
Reported | (1,530 | ) | (498 | ) | 42 | (1,197 | ) | (2,666 | ) | (5,849 | ) | (1,003 | ) | (137 | ) | |||||||||||||||||||||||||||||||||||
Currency translation | (54 | ) | 18 | – | 13 | 191 | 168 | (83 | ) | – | ||||||||||||||||||||||||||||||||||||||||
Significant items | – | – | 6 | – | 61 | 67 | – | – | ||||||||||||||||||||||||||||||||||||||||||
– other trading results from disposals and changes in ownership levels | – | – | 6 | – | 61 | 67 | – | – | ||||||||||||||||||||||||||||||||||||||||||
Adjusted | (1,584 | ) | (480 | ) | 48 | (1,184 | ) | (2,414 | ) | (5,614 | ) | (1,086 | ) | (137 | ) | |||||||||||||||||||||||||||||||||||
HSBC HOLDINGS PLC
78b
Table of Contents
Reconciliation of reported and adjusted items – geographical regions (continued)
| 2013 | ||||||||||||||||||||||||||||||||||||||||||||||||||
Europe $m | Asia $m | MENA $m | North America | Latin America | Total $m | UK $m | Hong Kong $m | |||||||||||||||||||||||||||||||||||||||||||
Operating expenses | ||||||||||||||||||||||||||||||||||||||||||||||||||
Reported31 | (17,613 | ) | (9,936 | ) | (1,289 | ) | (6,416 | ) | (5,930 | ) | (38,556 | ) | (12,096 | ) | (5,045 | ) | ||||||||||||||||||||||||||||||||||
Currency translation31 | (376 | ) | 127 | 6 | 65 | 535 | 348 | (455 | ) | (1 | ) | |||||||||||||||||||||||||||||||||||||||
Significant items | 1,665 | 193 | 69 | 215 | 384 | 2,526 | 937 | 41 | ||||||||||||||||||||||||||||||||||||||||||
– accounting gain arising from change in basis of delivering ill-health benefits in the UK | (430 | ) | – | – | – | – | (430 | ) | (430 | ) | – | |||||||||||||||||||||||||||||||||||||||
– Madoff-related litigation costs | 298 | – | – | – | – | 298 | – | – | ||||||||||||||||||||||||||||||||||||||||||
– regulatory provisions in GPB | 317 | 35 | – | – | – | 352 | – | 35 | ||||||||||||||||||||||||||||||||||||||||||
– restructuring and other related costs | 217 | 86 | 4 | 101 | 75 | 483 | 104 | 6 | ||||||||||||||||||||||||||||||||||||||||||
– UK customer redress programmes | 1,235 | – | – | – | – | 1,235 | 1,235 | – | ||||||||||||||||||||||||||||||||||||||||||
– US customer remediation provisions relating to CRS | – | – | – | 100 | – | 100 | – | – | ||||||||||||||||||||||||||||||||||||||||||
– other trading results from disposals and changes in ownership levels | 28 | 72 | 65 | 14 | 309 | 488 | 28 | – | ||||||||||||||||||||||||||||||||||||||||||
Adjusted31 | (16,324 | ) | (9,616 | ) | (1,214 | ) | (6,136 | ) | (5,011 | ) | (35,682 | ) | (11,614 | ) | (5,005 | ) | ||||||||||||||||||||||||||||||||||
Share of profit in associates and joint ventures | ||||||||||||||||||||||||||||||||||||||||||||||||||
Reported | 1 | 1,855 | 438 | 31 | – | 2,325 | 6 | 68 | ||||||||||||||||||||||||||||||||||||||||||
Currency translation | – | 14 | (1 | ) | (2 | ) | – | 11 | – | (1 | ) | |||||||||||||||||||||||||||||||||||||||
Significant items | 5 | 82 | – | – | – | 87 | 5 | – | ||||||||||||||||||||||||||||||||||||||||||
– other trading results from disposals and changes in ownership levels | 5 | 82 | – | – | – | 87 | 5 | – | ||||||||||||||||||||||||||||||||||||||||||
Adjusted | 6 | 1,951 | 437 | 29 | – | 2,423 | 11 | 67 | ||||||||||||||||||||||||||||||||||||||||||
Profit before tax | ||||||||||||||||||||||||||||||||||||||||||||||||||
Reported | 1,825 | 15,853 | 1,694 | 1,221 | 1,972 | 22,565 | 1,160 | 8,089 | ||||||||||||||||||||||||||||||||||||||||||
Currency translation | 221 | (121 | ) | (8 | ) | (63 | ) | (188 | ) | (159 | ) | 251 | 3 | |||||||||||||||||||||||||||||||||||||
Significant items | 2,255 | (1,423 | ) | (13 | ) | 890 | (1,134 | ) | 575 | 1,265 | 44 | |||||||||||||||||||||||||||||||||||||||
– revenue | 585 | (1,698 | ) | (88 | ) | 675 | (1,579 | ) | (2,105 | ) | 323 | 3 | ||||||||||||||||||||||||||||||||||||||
– LICs | – | – | 6 | – | 61 | 67 | – | – | ||||||||||||||||||||||||||||||||||||||||||
– operating expenses | 1,665 | 193 | 69 | 215 | 384 | 2,526 | 937 | 41 | ||||||||||||||||||||||||||||||||||||||||||
– share of profit in associates and joint ventures | 5 | 82 | – | – | – | 87 | 5 | – | ||||||||||||||||||||||||||||||||||||||||||
Adjusted | 4,301 | 14,309 | 1,673 | 2,048 | 650 | 22,981 | 2,676 | 8,136 | ||||||||||||||||||||||||||||||||||||||||||
For footnotes, see page 99.
HSBC HOLDINGS PLC
78c
Table of Contents
Our principal banking operations in Europe are HSBC Bank plc in the UK, HSBC France, HSBC Private Bank (Suisse) SA and HSBC Trinkaus & Burkhardt AG. Through these operations we provide a wide range of banking, treasury and financial services to personal, commercial and corporate customers across Europe.
| 2015 | 2014 | 2013 | ||||||||||||||||
| $m | $m | $m | ||||||||||||||||
Net interest income | 10,005 | 10,611 | 10,693 | |||||||||||||||
Net fee income | 4,891 | 6,042 | 6,032 | |||||||||||||||
Net trading income | 4,060 | 2,534 | 4,423 | |||||||||||||||
Other income/(expense) | 2,102 | 2,384 | (181 | ) | ||||||||||||||
Net operating income1 | 21,058 | 21,571 | 20,967 | |||||||||||||||
LICs34 | (690 | ) | (764 | ) | (1,530 | ) | ||||||||||||
Net operating income | 20,368 | 20,807 | 19,437 | |||||||||||||||
Total operating expenses | (19,733 | ) | (20,217 | ) | (17,613 | ) | ||||||||||||
Operating profit | 635 | 590 | 1,824 | |||||||||||||||
Income from associates35 | 8 | 6 | 1 | |||||||||||||||
Profit before tax | 643 | 596 | 1,825 | |||||||||||||||
Cost efficiency ratio | 93.7% | 93.7% | 84.0% | |||||||||||||||
RoRWA24 | 0.2% | 0.2% | 0.6% | |||||||||||||||
Year-end staff numbers | 67,509 | 69,363 | 68,334 | |||||||||||||||
For footnotes, see page 99.
Country view of adjusted revenue
| 2015 | 2014 | |||||||||||
| $m | $m | |||||||||||
UK | 14,898 | 15,022 | ||||||||||
France | 2,619 | 2,487 | ||||||||||
Germany | 827 | 788 | ||||||||||
Switzerland | 631 | 698 | ||||||||||
Other | 1,427 | 1,271 | ||||||||||
Year ended 31 December | 20,402 | 20,266 | ||||||||||
Profit beforetax ($m)
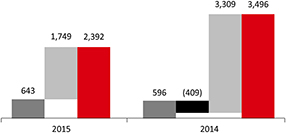
Revenue ($m)
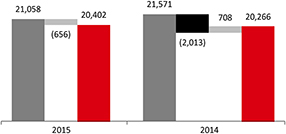
Operatingexpenses ($m)
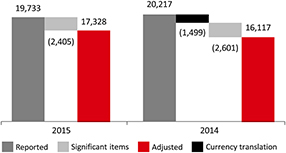
For details of significant items, see page 77.
Profit/(loss) before tax by country within global businesses
Retail Banking and Wealth Management $m | Commercial Banking $m | Global Markets $m | Global Private Banking $m | Other $m | Total $m | |||||||||||||||||||||||||||||||
UK | 964 | 2,040 | 384 | 169 | (3,857 | ) | (300 | ) | ||||||||||||||||||||||||||||
France23 | 388 | 152 | 112 | 14 | (27 | ) | 639 | |||||||||||||||||||||||||||||
Germany | 23 | 66 | 157 | 20 | (27 | ) | 239 | |||||||||||||||||||||||||||||
Switzerland | – | 8 | – | (220 | ) | (4 | ) | (216 | ) | |||||||||||||||||||||||||||
Other | (181 | ) | 53 | 395 | 31 | (17 | ) | 281 | ||||||||||||||||||||||||||||
Year ended 31 December 2015 | 1,194 | 2,319 | 1,048 | 14 | (3,932 | ) | 643 | |||||||||||||||||||||||||||||
UK | 589 | 2,193 | (801 | ) | 191 | (2,228 | ) | (56 | ) | |||||||||||||||||||||||||||
France23 | (181 | ) | 240 | 354 | – | (199 | ) | 214 | ||||||||||||||||||||||||||||
Germany | 28 | 71 | 162 | 27 | (10 | ) | 278 | |||||||||||||||||||||||||||||
Switzerland | – | 5 | 2 | 38 | (3 | ) | 42 | |||||||||||||||||||||||||||||
Other | (122 | ) | 39 | 332 | 59 | (190 | ) | 118 | ||||||||||||||||||||||||||||
Year ended 31 December 2014 | 314 | 2,548 | 49 | 315 | (2,630 | ) | 596 | |||||||||||||||||||||||||||||
UK | 1,471 | 1,684 | 1,246 | 252 | (3,493 | ) | 1,160 | |||||||||||||||||||||||||||||
France23 | 285 | 255 | 351 | 21 | (162 | ) | 750 | |||||||||||||||||||||||||||||
Germany | 30 | 70 | 183 | 44 | (25 | ) | 302 | |||||||||||||||||||||||||||||
Switzerland | – | 2 | 2 | (291 | ) | – | (287 | ) | ||||||||||||||||||||||||||||
Other | (33 | ) | 77 | 19 | (191 | ) | 28 | (100 | ) | |||||||||||||||||||||||||||
Year ended 31 December 2013 | 1,753 | 2,088 | 1,801 | (165 | )�� | (3,652 | ) | 1,825 | ||||||||||||||||||||||||||||
HSBC HOLDINGS PLC
79
Table of Contents
Report of the Directors: Financial Review(continued)
2015 compared with 2014
In Europe, our operations reported a profit before tax of $643m in 2015, an increase of 8% compared with 2014. This was driven by a favourable movement in significant items of $1.6bn partly offset by $0.4bn of adverse effects of foreign currency translation between the years. The favourable movement in significant items included lower fines, settlements, UK redress and associated provisions. These were partly offset by costs-to-achieve relating to business transformation of $0.6bn.
Adjusted profit before tax decreased by 32% to $2.4bn.
Our adjustedrevenue rose by $136m to $20.4bn. In our GB&M business we increased revenue by $651m, with growth in both our client facing businesses and in Balance Sheet Management. In the former, this was notably in Equities, Credit and Foreign Exchange reflecting higher volatility and client flows. Revenue also increased in Rates, partly offset by reductions in Principal investments and Capital Financing. In CMB, we increased revenue by $69m, primarily from Credit and Lending following balance sheet growth, although overdraft fees fell. These increases were partly offset in GPB where revenue continued to fall (down $157m) reflecting the repositioning we are undertaking in this business.
In 2015, revenue was also affected by adverse fair value movements from interest and exchange rate ineffectiveness in the hedging of our long-term debt. This compared with favourable movements in 2014. The prior year period also included a gain arising from the external hedging of an intra-Group financing transaction.
AdjustedLICs of $690m were marginally higher ($30m) than in 2014. LICs increased in RBWM, primarily from lower recoveries, while in our CMB business, LICs increased reflecting an increase in individually assessed LICs, notably in the UK and Spain. By contrast, LICs declined in our GB&M business due to lower individually assessed LICs and lower collective provisions, as 2014 included an increase due to a revision to certain estimates used in our corporate loan impairment calculation. This was partly offset by lower net releases on available-for-sale assets compared with 2014.
Adjustedoperating expenses rose by $1.2bn or 8% to $17.3bn. The increase was mainly in the UK as we continued our investment in regulatory programmes and compliance, as well as in growth initiatives. The UK bank levy charge was $1.4bn. This was $0.4bn higher than in 2014.
2014 compared with 2013
Our European operations reported a profit before tax of $596m in 2014 compared with $1.8bn in 2013. The decrease in reported profit before tax was driven by a number of significant items including charges relating to UK customer redress ($1.3bn), settlements and provisions in relation to regulatory investigations into foreign exchange ($1.2bn) and provisions arising from the ongoing review of compliance with the CCA in the UK ($632m).
Adjusted profit before tax decreased by $396m or 9%.
Adjusted revenue increased by $76m, as growth in the UK was partly offset by a reduction in France.
In the UK, revenue increased by $715m. This was driven by favourable fair value movements of $222m from ineffectiveness in the hedging of long-term debt issued principally by HSBC Holdings in 2014, compared with adverse movements of $480m in 2013, and a gain arising from external hedging of an intra-Group financing transaction.
In our CMB business in the UK, revenue increased from deposit balance growth in Payments and Cash Management and wider spreads and higher fees in term lending. By contrast, in our GB&M in the UK business revenue decreased. This included the introduction of the FFVA on certain derivative contracts which resulted in a charge affecting Rates and Credit. Revenue also fell in Foreign Exchange, reflecting lower volatility and reduced client flows. In RBWM, lower revenue reflected spread compression, notably on mortgages, and lower fee income from investment products and overdrafts as well as higher fees payable under partnership agreements.
In France revenue was $160m lower, principally in RBWM in the Insurance business due to adverse movements of $203m in the PVIF asset, compared with favourable movements of $48m in 2013.
Revenue in Switzerland also decreased reflecting the repositioning of the GPB business and reduction in client assets.
Adjusted LICs reduced as individually assessed provisions fell in both CMB and GB&M. The latter also recorded higher net releases on available or sale ABSs, although these factors were partly offset by a revision in certain estimates in our corporate collective loan impairment calculation.
Adjusted operating expenses rose by $1.3bn, mainly in the UK, reflecting growth in regulatory programmes and compliance costs in all businesses and increased staff costs. In addition, the UK bank levy charge of $1.1bn in respect of 2014 was $0.2bn higher than in 2013, primarily due to an increase in the rate of the levy. Expenses also increased due to the timing of the recognition of the Financial Services Compensation Scheme levy in the UK. These increases were partly offset by sustainable cost savings of over $330m.
HSBC HOLDINGS PLC
79a
Table of Contents
Report of the Directors: Geographical regions(continued)
Europe
Profit/(loss) before tax and balance sheet data – Europe
| 2015 | ||||||||||||||||||||||||||||||||||||||||||
|
| Retail Banking and Wealth $m |
|
| Commercial Banking $m |
|
| Global Banking and Markets $m |
|
| Global Private Banking $m |
|
| Other $m |
|
| Inter- segment elimination $m |
44
|
| Total $m |
| ||||||||||||||||||||||
Profit/(loss) before tax | ||||||||||||||||||||||||||||||||||||||||||
Net interest income/(expense) | 5,128 | 3,433 | 1,848 | 471 | (689 | ) | (186 | ) | 10,005 | |||||||||||||||||||||||||||||||||
Net fee income/(expense) | 1,880 | 1,683 | 849 | 509 | (30 | ) | – | 4,891 | ||||||||||||||||||||||||||||||||||
Trading income/(expense) excluding net interest income | 103 | 35 | 3,270 | 186 | (203 | ) | – | 3,391 | ||||||||||||||||||||||||||||||||||
Net interest income/(expense) on trading activities | (3 | ) | (6 | ) | 493 | (3 | ) | 2 | 186 | 669 | ||||||||||||||||||||||||||||||||
Net trading income/(expense)40 | 100 | 29 | 3,763 | 183 | (201 | ) | 186 | 4,060 | ||||||||||||||||||||||||||||||||||
Changes in fair value of long-term debt issued and related derivatives | – | – | – | – | 671 | – | 671 | |||||||||||||||||||||||||||||||||||
Net income/(expense) from other financial instruments designated at fair value | 446 | 6 | (70 | ) | – | 47 | – | 429 | ||||||||||||||||||||||||||||||||||
Net income/(expense) from financial instruments designated at fair value | 446 | 6 | (70 | ) | – | 718 | – | 1,100 | ||||||||||||||||||||||||||||||||||
Gains less losses from financial investments | 12 | 8 | 231 | 23 | – | – | 274 | |||||||||||||||||||||||||||||||||||
Dividend income | – | 1 | 12 | 7 | 2 | – | 22 | |||||||||||||||||||||||||||||||||||
Net insurance premium income | 2,295 | 135 | – | 42 | – | – | 2,472 | |||||||||||||||||||||||||||||||||||
Other operating income | 360 | 7 | 61 | 7 | 1,229 | (312 | ) | 1,352 | ||||||||||||||||||||||||||||||||||
Total operating income | 10,221 | 5,302 | 6,694 | 1,242 | 1,029 | (312 | ) | 24,176 | ||||||||||||||||||||||||||||||||||
Net insurance claims45 | (2,918 | ) | (139 | ) | – | (61 | ) | – | – | (3,118 | ) | |||||||||||||||||||||||||||||||
Net operating income1 | 7,303 | 5,163 | 6,694 | 1,181 | 1,029 | (312 | ) | 21,058 | ||||||||||||||||||||||||||||||||||
Loan impairment (charges)/recoveries and other credit risk provisions | (260 | ) | (475 | ) | 62 | (18 | ) | 1 | – | (690 | ) | |||||||||||||||||||||||||||||||
Net operating income | 7,043 | 4,688 | 6,756 | 1,163 | 1,030 | (312 | ) | 20,368 | ||||||||||||||||||||||||||||||||||
Total operating expenses | (5,851 | ) | (2,368 | ) | (5,715 | ) | (1,149 | ) | (4,962 | ) | 312 | (19,733 | ) | |||||||||||||||||||||||||||||
Operating profit/(loss) | 1,192 | 2,320 | 1,041 | 14 | (3,932 | ) | – | 635 | ||||||||||||||||||||||||||||||||||
Share of profit/(loss) in associates and joint ventures | 2 | (1 | ) | 7 | – | – | – | 8 | ||||||||||||||||||||||||||||||||||
Profit/(loss) before tax | 1,194 | 2,319 | 1,048 | 14 | (3,932 | ) | – | 643 | ||||||||||||||||||||||||||||||||||
| % | % | % | % | % | % | |||||||||||||||||||||||||||||||||||||
Share of HSBC’s profit before tax | 6.3 | 12.3 | 5.6 | 0.1 | (20.9 | ) | 3.4 | |||||||||||||||||||||||||||||||||||
Cost efficiency ratio | 80.1 | 45.9 | 85.4 | 97.3 | 482.2 | 93.7 | ||||||||||||||||||||||||||||||||||||
Balance sheet data30 | ||||||||||||||||||||||||||||||||||||||||||
| $m | $m | $m | $m | $m | $m | |||||||||||||||||||||||||||||||||||||
Loans and advances to customers (net) | 156,156 | 110,617 | 101,568 | 23,273 | 427 | 392,041 | ||||||||||||||||||||||||||||||||||||
Total assets | 205,866 | 124,105 | 804,373 | 56,470 | 57,943 | (119,392 | ) | 1,129,365 | ||||||||||||||||||||||||||||||||||
Customer accounts | 200,437 | 132,928 | 126,225 | 37,810 | 476 | 497,876 | ||||||||||||||||||||||||||||||||||||
HSBC HOLDINGS PLC
80
Table of Contents
| 2014 | ||||||||||||||||||||||||||||||||||||||||||
| | Retail Banking and Wealth | |
| Commercial Banking $m |
|
| Global Banking and Markets $m |
| | Global Private Banking $m | |
| Other $m |
|
| Inter- segment elimination $m | 44
|
| Total $m |
| ||||||||||||||||||||||
Profit/(loss) before tax | ||||||||||||||||||||||||||||||||||||||||||
Net interest income/(expense) | 5,196 | 3,616 | 1,956 | 594 | (654 | ) | (97 | ) | 10,611 | |||||||||||||||||||||||||||||||||
Net fee income/(expense) | 2,456 | 1,900 | 1,087 | 626 | (27 | ) | – | 6,042 | ||||||||||||||||||||||||||||||||||
Trading income/(expense) excluding net interest income | (260 | ) | 33 | 1,943 | 140 | (92 | ) | – | 1,764 | |||||||||||||||||||||||||||||||||
Net interest income/(expense) on trading activities | 14 | 2 | 660 | (4 | ) | 1 | 97 | 770 | ||||||||||||||||||||||||||||||||||
Net trading income/(expense)40 | (246 | ) | 35 | 2,603 | 136 | (91 | ) | 97 | 2,534 | |||||||||||||||||||||||||||||||||
Changes in fair value of long-term debt issued and related derivatives | – | – | – | – | 614 | – | 614 | |||||||||||||||||||||||||||||||||||
Net income/(expense) from other financial instruments designated at fair value | 616 | 119 | 14 | (1 | ) | (11 | ) | – | 737 | |||||||||||||||||||||||||||||||||
Net income/(expense) from financial instruments designated at fair value | 616 | 119 | 14 | (1 | ) | 603 | – | 1,351 | ||||||||||||||||||||||||||||||||||
Gains less losses from financial investments | 12 | 10 | 730 | 9 | 11 | – | 772 | |||||||||||||||||||||||||||||||||||
Dividend income | 3 | 7 | 50 | 2 | 3 | – | 65 | |||||||||||||||||||||||||||||||||||
Net insurance premium income | 2,741 | 217 | – | 50 | – | – | 3,008 | |||||||||||||||||||||||||||||||||||
Other operating income/(expense) | (127 | ) | 45 | (3 | ) | 29 | 1,249 | (186 | ) | 1,007 | ||||||||||||||||||||||||||||||||
Total operating income | 10,651 | 5,949 | 6,437 | 1,445 | 1,094 | (186 | ) | 25,390 | ||||||||||||||||||||||||||||||||||
Net insurance claims45 | (3,450 | ) | (306 | ) | – | (63 | ) | – | – | (3,819 | ) | |||||||||||||||||||||||||||||||
Net operating income1 | 7,201 | 5,643 | 6,437 | 1,382 | 1,094 | (186 | ) | 21,571 | ||||||||||||||||||||||||||||||||||
Loan impairment (charges)/recoveries and other credit risk provisions | (268 | ) | (502 | ) | – | 4 | 2 | – | (764 | ) | ||||||||||||||||||||||||||||||||
Net operating income | 6,933 | 5,141 | 6,437 | 1,386 | 1,096 | (186 | ) | 20,807 | ||||||||||||||||||||||||||||||||||
Total operating expenses | (6,621 | ) | (2,594 | ) | (6,391 | ) | (1,071 | ) | (3,726 | ) | 186 | (20,217 | ) | |||||||||||||||||||||||||||||
Operating profit/(loss) | 312 | 2,547 | 46 | 315 | (2,630 | ) | – | 590 | ||||||||||||||||||||||||||||||||||
Share of profit in associates and joint ventures | 2 | 1 | 3 | – | – | – | 6 | |||||||||||||||||||||||||||||||||||
Profit/(loss) before tax | 314 | 2,548 | 49 | 315 | (2,630 | ) | – | 596 | ||||||||||||||||||||||||||||||||||
| % | % | % | % | % | % | |||||||||||||||||||||||||||||||||||||
Share of HSBC’s profit before tax | 1.7 | 13.6 | 0.3 | 1.7 | (14.1 | ) | 3.2 | |||||||||||||||||||||||||||||||||||
Cost efficiency ratio | 91.9 | 46.0 | 99.3 | 77.5 | 340.6 | 93.7 | ||||||||||||||||||||||||||||||||||||
Balance sheet data30 | ||||||||||||||||||||||||||||||||||||||||||
| $m | $m | $m | $m | $m | $m | |||||||||||||||||||||||||||||||||||||
Loans and advances to customers (net) | 165,112 | 106,342 | 113,136 | 24,766 | 377 | 409,733 | ||||||||||||||||||||||||||||||||||||
Total assets | 221,679 | 120,819 | 948,951 | 64,676 | 64,182 | (129,381 | ) | 1,290,926 | ||||||||||||||||||||||||||||||||||
Customer accounts | 202,413 | 135,837 | 166,075 | 41,380 | 254 | 545,959 | ||||||||||||||||||||||||||||||||||||
For footnotes, see page 99.
HSBC HOLDINGS PLC
81
Table of Contents
Report of the Directors: Financial Review(continued)
Profit/(loss) before tax and balance sheet data – Europe (continued)
| 2013 | ||||||||||||||||||||||||||||||||||||||||||
| | Retail Banking and Wealth Management $m | |
| Commercial Banking $m |
|
| Global Banking and Markets $m |
|
| Global Private Banking $m |
|
| Other $m |
|
| Inter- segment elimination $m | 44
|
| Total $m |
| ||||||||||||||||||||||
Profit/(loss) before tax | ||||||||||||||||||||||||||||||||||||||||||
Net interest income/(expense) | 5,600 | 3,353 | 1,774 | 722 | (694 | ) | (62 | ) | 10,693 | |||||||||||||||||||||||||||||||||
Net fee income/(expense) | 2,545 | 1,789 | 957 | 744 | (3 | ) | – | 6,032 | ||||||||||||||||||||||||||||||||||
Trading income excluding net interest income | 206 | 30 | 2,181 | 192 | 698 | – | 3,307 | |||||||||||||||||||||||||||||||||||
Net interest income on trading activities | 2 | 5 | 1,013 | 4 | 30 | 62 | 1,116 | |||||||||||||||||||||||||||||||||||
Net trading income40 | 208 | 35 | 3,194 | 196 | 728 | 62 | 4,423 | |||||||||||||||||||||||||||||||||||
Changes in fair value of long-term debt issued and related derivatives | – | – | – | – | (936 | ) | – | (936 | ) | |||||||||||||||||||||||||||||||||
Net income/(expense) from other financial instruments designated at fair value | 1,059 | 271 | 591 | 4 | (570 | ) | (1 | ) | 1,354 | |||||||||||||||||||||||||||||||||
Net income/(expense) from financial instruments designated at fair value | 1,059 | 271 | 591 | 4 | (1,506 | ) | (1 | ) | 418 | |||||||||||||||||||||||||||||||||
Gains less losses from financial investments | 52 | – | 344 | (17 | ) | – | – | 379 | ||||||||||||||||||||||||||||||||||
Dividend income | 4 | 2 | 65 | 4 | – | – | 75 | |||||||||||||||||||||||||||||||||||
Net insurance premium income/(expense) | 2,782 | 361 | (1 | ) | 16 | – | – | 3,158 | ||||||||||||||||||||||||||||||||||
Other operating income/(expense) | (103 | ) | 9 | 110 | (253 | ) | 766 | – | 529 | |||||||||||||||||||||||||||||||||
Total operating income/(expense) | 12,147 | 5,820 | 7,034 | 1,416 | (709 | ) | (1 | ) | 25,707 | |||||||||||||||||||||||||||||||||
Net insurance claims45 | (4,136 | ) | (567 | ) | – | (37 | ) | – | – | (4,740 | ) | |||||||||||||||||||||||||||||||
Net operating income/(expense)1 | 8,011 | 5,253 | 7,034 | 1,379 | (709 | ) | (1 | ) | 20,967 | |||||||||||||||||||||||||||||||||
Loan impairment charges and other credit risk provisions | (329 | ) | (935 | ) | (242 | ) | (24 | ) | – | – | (1,530 | ) | ||||||||||||||||||||||||||||||
Net operating income/(expense) | 7,682 | 4,318 | 6,792 | 1,355 | (709 | ) | (1 | ) | 19,437 | |||||||||||||||||||||||||||||||||
Total operating expenses | (5,934 | ) | (2,231 | ) | (4,987 | ) | (1,519 | ) | (2,943 | ) | 1 | (17,613 | ) | |||||||||||||||||||||||||||||
Operating profit/(loss) | 1,748 | 2,087 | 1,805 | (164 | ) | (3,652 | ) | – | 1,824 | |||||||||||||||||||||||||||||||||
Share of profit/(loss) in associates and joint ventures | 5 | 1 | (4 | ) | (1 | ) | – | – | 1 | |||||||||||||||||||||||||||||||||
Profit/(loss) before tax | 1,753 | 2,088 | 1,801 | (165 | ) | (3,652 | ) | – | 1,825 | |||||||||||||||||||||||||||||||||
| % | % | % | % | % | % | |||||||||||||||||||||||||||||||||||||
Share of HSBC’s profit before tax | 7.8 | 9.2 | 8.0 | (0.7 | ) | (16.2 | ) | 8.1 | ||||||||||||||||||||||||||||||||||
Cost efficiency ratio | 74.1 | 42.5 | 70.9 | 110.2 | (415.1 | ) | 84.0 | |||||||||||||||||||||||||||||||||||
Balance sheet data30 | ||||||||||||||||||||||||||||||||||||||||||
| $m | $m | $m | $m | $m | $m | |||||||||||||||||||||||||||||||||||||
Loans and advances to customers (net) | 177,357 | 105,498 | 145,136 | 27,289 | 830 | 456,110 | ||||||||||||||||||||||||||||||||||||
Total assets | 238,499 | 124,242 | 1,054,506 | 75,718 | 72,174 | (172,180 | ) | 1,392,959 | ||||||||||||||||||||||||||||||||||
Customer accounts | 205,288 | 134,120 | 191,715 | 49,789 | 1,021 | 581,933 | ||||||||||||||||||||||||||||||||||||
For footnotes, see page 99.
HSBC HOLDINGS PLC
81a
Table of Contents
Report of the Directors: Geographical regions(continued)
Asia
Our principal banking subsidiaries in Hong Kong are The Hongkong and Shanghai Banking Corporation Limited and Hang Seng Bank Limited. The former is the largest bank incorporated in Hong Kong and is our flagship bank in Asia.
We offer a wide range of banking and financial services in mainland China through our local subsidiaries, HSBC Bank (China) Company Limited and Hang Seng Bank (China) Limited. We also participate indirectly in mainland China through our associate, Bank of Communications Co., Ltd.
Outside Hong Kong and mainland China in Asia, we conduct business in 18 countries and territories, with particularly strong coverage in Australia, India, Indonesia, Malaysia, Singapore and Taiwan.
| 2015 | 2014 | 2013 | ||||||||||||||||
| $m | $m | $m | ||||||||||||||||
Net interest income | 12,184 | 12,273 | 11,432 | |||||||||||||||
Net fee income | 6,032 | 5,910 | 5,936 | |||||||||||||||
Net trading income | 3,090 | 2,622 | 2,026 | |||||||||||||||
Other income | 3,997 | 2,872 | 5,038 | |||||||||||||||
Net operating income1 | 25,303 | 23,677 | 24,432 | |||||||||||||||
LICs34 | (693 | ) | (647 | ) | (498 | ) | ||||||||||||
Net operating income | 24,610 | 23,030 | 23,934 | |||||||||||||||
Total operating expenses | (10,889 | ) | (10,427 | ) | (9,936 | ) | ||||||||||||
Operating profit | 13,721 | 12,603 | 13,998 | |||||||||||||||
Income from associates35 | 2,042 | 2,022 | 1,855 | |||||||||||||||
Profit before tax | 15,763 | 14,625 | 15,853 | |||||||||||||||
Cost efficiency ratio | 43.0% | 44.0% | 40.7% | |||||||||||||||
RoRWA24 | 3.3% | 3.1% | 3.8% | |||||||||||||||
Year-end staff numbers | 120,144 | 118,322 | 113,701 | |||||||||||||||
For footnotes, see page 99.
Country view of adjusted revenue
| 2015 | 2014 | |||||||||||
| $m | $m | |||||||||||
Hong Kong | 14,233 | 13,729 | ||||||||||
Australia | 847 | 814 | ||||||||||
India | 1,845 | 1,738 | ||||||||||
Indonesia | 536 | 497 | ||||||||||
Mainland China | 2,606 | 2,429 | ||||||||||
Malaysia | 984 | 899 | ||||||||||
Singapore | 1,288 | 1,234 | ||||||||||
Taiwan | 417 | 469 | ||||||||||
Other | 1,116 | 1,140 | ||||||||||
Year ended 31 December | 23,872 | 22,949 | ||||||||||
Profit before tax ($m)
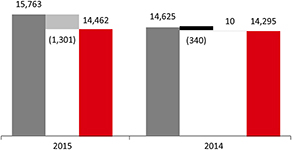
Revenue ($m)
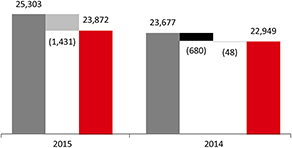
Operating expenses ($m)
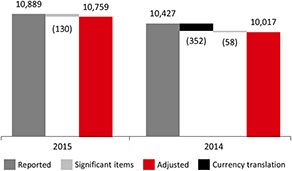
For details of significant items, see page 77.
HSBC HOLDINGS PLC
82
Table of Contents
Profit/(loss) before tax by country within global businesses
Retail Banking and Wealth Management $m | Commercial Banking $m | Global Markets $m | Global Private Banking $m | Other $m | Total $m | |||||||||||||||||||||||||||||||
Hong Kong | 3,799 | 2,384 | 2,119 | 177 | 1,327 | 9,806 | ||||||||||||||||||||||||||||||
Australia | 61 | 79 | 238 | – | (5 | ) | 373 | |||||||||||||||||||||||||||||
India | (25 | ) | 97 | 379 | 14 | 141 | 606 | |||||||||||||||||||||||||||||
Indonesia | (6 | ) | (112 | ) | 80 | – | 31 | (7 | ) | |||||||||||||||||||||||||||
Mainland China | 297 | 1,569 | 1,062 | (3 | ) | 135 | 3,060 | |||||||||||||||||||||||||||||
Malaysia | 119 | 95 | 215 | – | 13 | 442 | ||||||||||||||||||||||||||||||
Singapore | 80 | 122 | 259 | 65 | (19 | ) | 507 | |||||||||||||||||||||||||||||
Taiwan | 11 | 24 | 133 | – | (13 | ) | 155 | |||||||||||||||||||||||||||||
Other | 50 | 250 | 449 | (1 | ) | 73 | 821 | |||||||||||||||||||||||||||||
Year ended 31 December 2015 | 4,386 | 4,508 | 4,934 | 252 | 1,683 | 15,763 | ||||||||||||||||||||||||||||||
Hong Kong | 3,727 | 2,264 | 1,807 | 146 | 198 | 8,142 | ||||||||||||||||||||||||||||||
Australia | 78 | 126 | 232 | – | (4 | ) | 432 | |||||||||||||||||||||||||||||
India | 4 | 121 | 442 | 11 | 122 | 700 | ||||||||||||||||||||||||||||||
Indonesia | 10 | 53 | 110 | – | 25 | 198 | ||||||||||||||||||||||||||||||
Mainland China | 292 | 1,533 | 954 | (3 | ) | 175 | 2,951 | |||||||||||||||||||||||||||||
Malaysia | 156 | 122 | 190 | – | 28 | 496 | ||||||||||||||||||||||||||||||
Singapore | 129 | 168 | 243 | 57 | (8 | ) | 589 | |||||||||||||||||||||||||||||
Taiwan | 19 | 35 | 166 | – | 1 | 221 | ||||||||||||||||||||||||||||||
Other | 57 | 320 | 432 | – | 87 | 896 | ||||||||||||||||||||||||||||||
Year ended 31 December 2014 | 4,472 | 4,742 | 4,576 | 211 | 624 | 14,625 | ||||||||||||||||||||||||||||||
Hong Kong | 3,742 | 2,110 | 1,971 | 208 | 58 | 8,089 | ||||||||||||||||||||||||||||||
Australia | 100 | 131 | 189 | – | 26 | 446 | ||||||||||||||||||||||||||||||
India | (21 | ) | 113 | 418 | 7 | 136 | 653 | |||||||||||||||||||||||||||||
Indonesia | 12 | 106 | 126 | – | 36 | 280 | ||||||||||||||||||||||||||||||
Mainland China | 223 | 1,536 | 842 | (4 | ) | 1,644 | 4,241 | |||||||||||||||||||||||||||||
Malaysia | 148 | 105 | 236 | – | 25 | 514 | ||||||||||||||||||||||||||||||
Singapore | 147 | 120 | 262 | 74 | 22 | 625 | ||||||||||||||||||||||||||||||
Taiwan | 7 | 30 | 158 | – | 5 | 200 | ||||||||||||||||||||||||||||||
Other | 61 | 207 | 473 | (1 | ) | 65 | 805 | |||||||||||||||||||||||||||||
Year ended 31 December 2013 | 4,419 | 4,458 | 4,675 | 284 | 2,017 | 15,853 | ||||||||||||||||||||||||||||||
Analysis of mainland China profit/(loss) before tax
Retail Banking and Wealth Management $m | Commercial $m | Global Markets $m | Global Private Banking | Other $m | Total $m | |||||||||||||||||||||||||||||||
BoCom and other associates | 260 | 1,448 | 301 | – | – | 2,009 | ||||||||||||||||||||||||||||||
Mainland China operations | 37 | 121 | 761 | (3 | ) | 135 | 1,051 | |||||||||||||||||||||||||||||
Year ended 31 December 2015 | 297 | 1,569 | 1,062 | (3 | ) | 135 | 3,060 | |||||||||||||||||||||||||||||
BoCom and other associates | 255 | 1,421 | 296 | – | 1 | 1,973 | ||||||||||||||||||||||||||||||
Mainland China operations | 37 | 112 | 658 | (3 | ) | 174 | 978 | |||||||||||||||||||||||||||||
Year ended 31 December 2014 | 292 | 1,533 | 954 | (3 | ) | 175 | 2,951 | |||||||||||||||||||||||||||||
BoCom and other associates | 247 | 1,360 | 284 | – | (38 | ) | 1,853 | |||||||||||||||||||||||||||||
Mainland China operations | (24 | ) | 176 | 558 | (4 | ) | 40 | 746 | ||||||||||||||||||||||||||||
Industrial Bank | – | – | – | – | 1,089 | 1,089 | ||||||||||||||||||||||||||||||
Ping An | – | – | – | – | 553 | 553 | ||||||||||||||||||||||||||||||
Year ended 31 December 2013 | 223 | 1,536 | 842 | (4 | ) | 1,644 | 4,241 | |||||||||||||||||||||||||||||
HSBC HOLDINGS PLC
83
Table of Contents
Report of the Directors: Financial Review(continued)
2015 compared with 2014
Our operations in Asia reported a profit before tax of $15.8bn in 2015 compared with $14.6bn in 2014, an increase of 8%. This was mainly driven by a favourable movement in significant items of $1.3bn partly offset by $0.3bn of adverse effects of foreign currency translation between the years. In 2015, significant items included a gain on the partial sale of our shareholding in Industrial Bank ($1.4bn). By contrast, significant items in 2014 included the gain on sale of our investment in Bank of Shanghai ($428m) and an impairment of our investment in Industrial Bank ($271m).
On an adjusted basis, profit before tax of $14.5bn was $167m or 1% higher than in 2014.
Adjustedrevenue was $24bn. This was $923m or 4% higher than in 2014. The increase was primarily in GB&M from Foreign Exchange and Equities, mainly in Hong Kong. We increased revenue in our RBWM business from growth in lending and deposit balances, as well as higher sales of Wealth Management products. This was primarily due to growth in Investment Distribution revenue, notably in the first half of 2015 following high levels of stock market turnover which more than offset weaker investor sentiment experienced in the second half. CMB also recorded revenue growth, mainly in Hong Kong from a rise in average lending and deposit balances, coupled with wider spreads on deposit and trade-related lending. However, there was a notable slowing of demand for credit in the second half of 2015.
AdjustedLICs of $693m were 12% higher. In CMB, our LICs increased from a rise in specific LICs, notably in Indonesia. This was partly offset by a decrease in GB&M in Hong Kong as 2014 included a significant impairment charge, which was partially released in 2015.
Our adjustedoperating expenses rose by $742m or 7% to $10.8bn, with increases in all of our businesses. This was primarily due to higher staff costs following wage inflation, and growth in average FTEs, mainly in RBWM to support business growth. In addition, cost growth reflected our continued investment in regulatory programmes and compliance.
Adjustedshare of profit from associates and joint ventures rose by $58m, mainly from BoCom.
2014 compared with 2013
Our operations in Asia reported a profit before tax of $14.6bn in 2014 compared with $15.9bn in 2013, a decrease of 8%. The reduction was due to the effect of a number of significant items. In 2013, these included an accounting gain arising from the reclassification of Industrial Bank as a financial investment ($1.1bn) and the net gain on completion of the Ping An disposal ($553m). In 2014, significant items included the gain on sale of our investment in Bank of Shanghai ($428m) and an impairment of our investment in Industrial Bank ($271m).
On an adjusted basis, profit before tax rose by $326m or 2%.
Adjusted revenue was $1.2bn or 5% higher. The increase was primarily in Hong Kong and mainland China, mainly in our CMB and RBWM businesses from balance sheet growth. In addition, we grew revenue in GB&M from portfolio growth in Balance Sheet Management and increased term lending. Revenue was also higher in India and Australia.
Adjusted LICs rose by $167m or 35%, principally in our GB&M and CMB businesses from a rise in individually assessed impairment charges against a small number of customers in Hong Kong and mainland China. This was partly offset by a reduction in individually assessed LICs in CMB in New Zealand, Malaysia and Vietnam.
Operating expenses rose by $753m following investment in the region, notably in regulatory programmes and compliance. In addition, we incurred higher costs at our Global Service Centres following migration of activities from other areas of the Group. Cost growth also reflected wage inflation and additional headcount, notably in Hong Kong and mainland China to support business growth, mainly in CMB, and increased marketing activity. These factors were partly offset by around $270m of sustainable cost savings achieved in 2014.
Adjusted share of profit from associates and joint ventures rose by $71m, mainly from BoCom.
HSBC HOLDINGS PLC
83a
Table of Contents
Report of the Directors: Geographical regions(continued)
Asia
Profit before tax and balance sheet data – Asia
| 2015 | ||||||||||||||||||||||||||||||||||||||||||
| | Retail Banking and Wealth Management $m | |
| Commercial Banking $m |
|
| Global Banking and Markets $m |
|
| Global Private Banking $m |
|
| Other $m |
|
| Inter- segment elimination $m | 44
|
| Total $m |
| ||||||||||||||||||||||
Profit before tax | ||||||||||||||||||||||||||||||||||||||||||
Net interest income/(expense) | 5,132 | 3,613 | 3,373 | 175 | (70 | ) | (39 | ) | 12,184 | |||||||||||||||||||||||||||||||||
Net fee income | 2,939 | 1,466 | 1,304 | 310 | 13 | – | 6,032 | |||||||||||||||||||||||||||||||||||
Trading income excluding net interest income | 225 | 352 | 1,801 | 127 | 13 | – | 2,518 | |||||||||||||||||||||||||||||||||||
Net interest income/(expense) on trading activities | (23 | ) | (11 | ) | 559 | 1 | 7 | 39 | 572 | |||||||||||||||||||||||||||||||||
Net trading income40 | 202 | 341 | 2,360 | 128 | 20 | 39 | 3,090 | |||||||||||||||||||||||||||||||||||
Changes in fair value of long-term debt issued and related derivatives | – | – | – | – | 5 | – | 5 | |||||||||||||||||||||||||||||||||||
Net income/(expense) from other financial instruments designated at fair value | (329 | ) | (30 | ) | 10 | – | 14 | – | (335 | ) | ||||||||||||||||||||||||||||||||
Net income/(expense) from financial instruments designated at fair value | (329 | ) | (30 | ) | 10 | – | 19 | – | (330 | ) | ||||||||||||||||||||||||||||||||
Gains less losses from financial investments | 35 | 23 | 117 | – | 1,384 | – | 1,559 | |||||||||||||||||||||||||||||||||||
Dividend income | 2 | – | 1 | – | 25 | – | 28 | |||||||||||||||||||||||||||||||||||
Net insurance premium income /(expense) | 6,006 | 780 | – | – | (2 | ) | – | 6,784 | ||||||||||||||||||||||||||||||||||
Other operating income | 659 | 149 | 146 | 2 | 2,878 | (1,116 | ) | 2,718 | ||||||||||||||||||||||||||||||||||
Total operating income | 14,646 | 6,342 | 7,311 | 615 | 4,267 | (1,116 | ) | 32,065 | ||||||||||||||||||||||||||||||||||
Net insurance claims45 | (5,925 | ) | (837 | ) | – | – | – | – | (6,762 | ) | ||||||||||||||||||||||||||||||||
Net operating income1 | 8,721 | 5,505 | 7,311 | 615 | 4,267 | (1,116 | ) | 25,303 | ||||||||||||||||||||||||||||||||||
Loan impairment (charges)/recoveries and other credit risk provisions | (307 | ) | (425 | ) | 40 | – | (1 | ) | – | (693 | ) | |||||||||||||||||||||||||||||||
Net operating income | 8,414 | 5,080 | 7,351 | 615 | 4,266 | (1,116 | ) | 24,610 | ||||||||||||||||||||||||||||||||||
Total operating expenses | (4,320 | ) | (2,020 | ) | (2,719 | ) | (363 | ) | (2,583 | ) | 1,116 | (10,889 | ) | |||||||||||||||||||||||||||||
Operating profit | 4,094 | 3,060 | 4,632 | 252 | 1,683 | – | 13,721 | |||||||||||||||||||||||||||||||||||
Share of profit in associates and joint ventures | 292 | 1,448 | 302 | – | – | – | 2,042 | |||||||||||||||||||||||||||||||||||
Profit before tax | 4,386 | 4,508 | 4,934 | 252 | 1,683 | – | 15,763 | |||||||||||||||||||||||||||||||||||
| % | % | % | % | % | % | |||||||||||||||||||||||||||||||||||||
Share of HSBC’s profit before tax | 23.2 | 23.9 | 26.2 | 1.3 | 8.9 | 83.5 | ||||||||||||||||||||||||||||||||||||
Cost efficiency ratio | 49.5 | 36.7 | 37.2 | 59.0 | 60.5 | 43.0 | ||||||||||||||||||||||||||||||||||||
Balance sheet data30 | ||||||||||||||||||||||||||||||||||||||||||
| $m | $m | $m | $m | $m | $m | |||||||||||||||||||||||||||||||||||||
Loans and advances to customers (net) | 117,807 | 130,513 | 93,007 | 13,144 | 1,904 | 356,375 | ||||||||||||||||||||||||||||||||||||
Total assets | 172,719 | 157,838 | 540,404 | 14,488 | 69,080 | (64,782 | ) | 889,747 | ||||||||||||||||||||||||||||||||||
Customer accounts | 303,536 | 165,202 | 100,998 | 28,685 | 199 | 598,620 | ||||||||||||||||||||||||||||||||||||
HSBC HOLDINGS PLC
84
Table of Contents
| 2014 | ||||||||||||||||||||||||||||||||||||||||||
|
| Retail Banking and Wealth Management $m |
|
| Commercial Banking $m |
|
| Global Banking and Markets $m |
|
| Global Private Banking $m |
|
| Other $m |
|
| Inter- segment elimination $m | 44
|
| Total $m |
| ||||||||||||||||||||||
Profit before tax | ||||||||||||||||||||||||||||||||||||||||||
Net interest income/(expense) | 5,003 | 3,439 | 3,579 | 177 | (16 | ) | 91 | 12,273 | ||||||||||||||||||||||||||||||||||
Net fee income | 2,792 | 1,529 | 1,311 | 272 | 6 | – | 5,910 | |||||||||||||||||||||||||||||||||||
Trading income/(expense) excluding net interest income | 216 | 382 | 1,220 | 142 | (5 | ) | – | 1,955 | ||||||||||||||||||||||||||||||||||
Net interest income/(expense) on trading activities | �� | (13 | ) | (9 | ) | 771 | – | 9 | (91 | ) | 667 | |||||||||||||||||||||||||||||||
Net trading income40 | 203 | 373 | 1,991 | 142 | 4 | (91 | ) | 2,622 | ||||||||||||||||||||||||||||||||||
Changes in fair value of long-term debt issued and related derivatives | – | – | – | – | (4 | ) | – | (4 | ) | |||||||||||||||||||||||||||||||||
Net income/(expense) from other financial instruments designated at fair value | 543 | (6 | ) | (2 | ) | – | 2 | – | 537 | |||||||||||||||||||||||||||||||||
Net income/(expense) from financial instruments designated at fair value | 543 | (6 | ) | (2 | ) | – | (2 | ) | – | 533 | ||||||||||||||||||||||||||||||||
Gains less losses from financial investments | 1 | 5 | 46 | – | 148 | – | 200 | |||||||||||||||||||||||||||||||||||
Dividend income | 1 | – | 1 | – | 177 | – | 179 | |||||||||||||||||||||||||||||||||||
Net insurance premium income | 6,596 | 794 | – | – | – | – | 7,390 | |||||||||||||||||||||||||||||||||||
Other operating income | 516 | 95 | 141 | 3 | 2,734 | (1,158 | ) | 2,331 | ||||||||||||||||||||||||||||||||||
Total operating income | 15,655 | 6,229 | 7,067 | 594 | 3,051 | (1,158 | ) | 31,438 | ||||||||||||||||||||||||||||||||||
Net insurance claims45 | (6,979 | ) | (782 | ) | – | – | – | – | (7,761 | ) | ||||||||||||||||||||||||||||||||
Net operating income1 | 8,676 | 5,447 | 7,067 | 594 | 3,051 | (1,158 | ) | 23,677 | ||||||||||||||||||||||||||||||||||
Loan impairment (charges)/recoveries and other credit risk provisions | (317 | ) | (228 | ) | (103 | ) | 1 | – | – | (647 | ) | |||||||||||||||||||||||||||||||
Net operating income | 8,359 | 5,219 | 6,964 | 595 | 3,051 | (1,158 | ) | 23,030 | ||||||||||||||||||||||||||||||||||
Total operating expenses | (4,191 | ) | (1,897 | ) | (2,686 | ) | (384 | ) | (2,427 | ) | 1,158 | (10,427 | ) | |||||||||||||||||||||||||||||
Operating profit | 4,168 | 3,322 | 4,278 | 211 | 624 | – | 12,603 | |||||||||||||||||||||||||||||||||||
Share of profit in associates and joint ventures | 304 | 1,420 | 298 | – | – | – | 2,022 | |||||||||||||||||||||||||||||||||||
Profit before tax | 4,472 | 4,742 | 4,576 | 211 | 624 | – | 14,625 | |||||||||||||||||||||||||||||||||||
| % | % | % | % | % | % | |||||||||||||||||||||||||||||||||||||
Share of HSBC’s profit before tax | 23.9 | 25.4 | 24.5 | 1.1 | 3.4 | 78.3 | ||||||||||||||||||||||||||||||||||||
Cost efficiency ratio | 48.3 | 34.8 | 38.0 | 64.6 | 79.5 | 44.0 | ||||||||||||||||||||||||||||||||||||
Balance sheet data30 | ||||||||||||||||||||||||||||||||||||||||||
| $m | $m | $m | $m | $m | $m | |||||||||||||||||||||||||||||||||||||
Loans and advances to customers (net) | 115,643 | 132,509 | 99,934 | 12,894 | 1,975 | 362,955 | ||||||||||||||||||||||||||||||||||||
Total assets | 166,577 | 158,747 | 548,865 | 14,905 | 79,477 | (89,848 | ) | 878,723 | ||||||||||||||||||||||||||||||||||
Customer accounts | 286,670 | 155,608 | 104,896 | 29,847 | 470 | 577,491 | ||||||||||||||||||||||||||||||||||||
For footnotes, see page 99.
HSBC HOLDINGS PLC
85
Table of Contents
Report of the Directors: Financial Review(continued)
Profit before tax and balance sheet data – Asia (continued)
| 2013 | ||||||||||||||||||||||||||||||||||||||||||
|
| Retail Banking and Wealth Management $m |
|
| Commercial Banking $m |
|
| Global Banking and Markets $m |
|
| Global Private Banking $m |
|
| Other $m |
|
| Inter- segment elimination $m | 44
|
| Total $m |
| ||||||||||||||||||||||
Profit before tax | ||||||||||||||||||||||||||||||||||||||||||
Net interest income/(expense) | 4,895 | 3,103 | 3,245 | 205 | (124 | ) | 108 | 11,432 | ||||||||||||||||||||||||||||||||||
Net fee income/(expense) | 2,758 | 1,518 | 1,419 | 249 | (8 | ) | – | 5,936 | ||||||||||||||||||||||||||||||||||
Trading income/(expense) excluding net interest income | 238 | 377 | 1,483 | 175 | (739 | ) | – | 1,534 | ||||||||||||||||||||||||||||||||||
Net interest income/(expense) on trading activities | (16 | ) | (6 | ) | 608 | – | 14 | (108 | ) | 492 | ||||||||||||||||||||||||||||||||
Net trading income/(expense)40 | 222 | 371 | 2,091 | 175 | (725 | ) | (108 | ) | 2,026 | |||||||||||||||||||||||||||||||||
Changes in fair value of long-term debt issued and related derivatives | – | – | – | – | (1 | ) | – | (1 | ) | |||||||||||||||||||||||||||||||||
Net income/(expense) from other financial instruments designated at fair value | 315 | – | 7 | – | (7 | ) | – | 315 | ||||||||||||||||||||||||||||||||||
Net income/(expense) from financial instruments designated at fair value | 315 | – | 7 | – | (8 | ) | – | 314 | ||||||||||||||||||||||||||||||||||
Gains less losses from financial investments | (1 | ) | – | 58 | 14 | 1,204 | – | 1,275 | ||||||||||||||||||||||||||||||||||
Dividend income | – | 1 | 6 | – | 145 | – | 152 | |||||||||||||||||||||||||||||||||||
Net insurance premium income | 6,263 | 654 | 1 | – | – | – | 6,918 | |||||||||||||||||||||||||||||||||||
Other operating income | 764 | 97 | 163 | 12 | 3,871 | (1,232 | ) | 3,675 | ||||||||||||||||||||||||||||||||||
Total operating income | 15,216 | 5,744 | 6,990 | 655 | 4,355 | (1,232 | ) | 31,728 | ||||||||||||||||||||||||||||||||||
Net insurance claims45 | (6,609 | ) | (687 | ) | – | – | – | – | (7,296 | ) | ||||||||||||||||||||||||||||||||
Net operating income1 | 8,607 | 5,057 | 6,990 | 655 | 4,355 | (1,232 | ) | 24,432 | ||||||||||||||||||||||||||||||||||
Loan impairment charges and other credit risk provisions | (347 | ) | (144 | ) | (3 | ) | (4 | ) | – | – | (498 | ) | ||||||||||||||||||||||||||||||
Net operating income | 8,260 | 4,913 | 6,987 | 651 | 4,355 | (1,232 | ) | 23,934 | ||||||||||||||||||||||||||||||||||
Total operating expenses | (4,138 | ) | (1,786 | ) | (2,560 | ) | (367 | ) | (2,317 | ) | 1,232 | (9,936 | ) | |||||||||||||||||||||||||||||
Operating profit | 4,122 | 3,127 | 4,427 | 284 | 2,038 | – | 13,998 | |||||||||||||||||||||||||||||||||||
Share of profit/(loss) in associates and joint ventures | 297 | 1,331 | 248 | – | (21 | ) | – | 1,855 | ||||||||||||||||||||||||||||||||||
Profit before tax | 4,419 | 4,458 | 4,675 | 284 | 2,017 | – | 15,853 | |||||||||||||||||||||||||||||||||||
| % | % | % | % | % | % | |||||||||||||||||||||||||||||||||||||
Share of HSBC’s profit before tax | 19.6 | 19.8 | 20.7 | 1.3 | 8.9 | 70.3 | ||||||||||||||||||||||||||||||||||||
Cost efficiency ratio | 48.1 | 35.3 | 36.6 | 56.0 | 53.2 | 40.7 | ||||||||||||||||||||||||||||||||||||
Balance sheet data30 | ||||||||||||||||||||||||||||||||||||||||||
| $m | $m | $m | $m | $m | $m | |||||||||||||||||||||||||||||||||||||
Loans and advances to customers (net) | 111,769 | 122,882 | 89,722 | 10,904 | 1,620 | 336,897 | ||||||||||||||||||||||||||||||||||||
Total assets | 158,456 | 146,898 | 515,023 | 12,994 | 82,453 | (84,033 | ) | 831,791 | ||||||||||||||||||||||||||||||||||
Customer accounts | 278,392 | 141,958 | 96,546 | 31,250 | 337 | 548,483 | ||||||||||||||||||||||||||||||||||||
For footnotes, see page 99.
HSBC HOLDINGS PLC
85a
Table of Contents
Report of the Directors: Geographical regions(continued)
Middle East and North Africa
The network of branches of HSBC Bank Middle East Limited, together with HSBC’s subsidiaries and associates, gives us wide coverage in the region. Our associate in Saudi Arabia, The Saudi British Bank (40% owned), is the Kingdom’s fifth largest bank by total assets.
| 2015 | 2014 | 2013 | ||||||||||||||||
| $m | $m | $m | ||||||||||||||||
Net interest income | 1,531 | 1,519 | 1,486 | |||||||||||||||
Net fee income | 633 | 650 | 622 | |||||||||||||||
Net trading income | 325 | 314 | 357 | |||||||||||||||
Other income | 76 | 65 | 38 | |||||||||||||||
Net operating income1 | 2,565 | 2,548 | 2,503 | |||||||||||||||
LICs34 | (299 | ) | 6 | 42 | ||||||||||||||
Net operating income | 2,266 | 2,554 | 2,545 | |||||||||||||||
Total operating expenses | (1,234 | ) | (1,216 | ) | (1,289 | ) | ||||||||||||
Operating profit | 1,032 | 1,338 | 1,256 | |||||||||||||||
Income from associates35 | 505 | 488 | 438 | |||||||||||||||
Profit before tax | 1,537 | 1,826 | 1,694 | |||||||||||||||
Cost efficiency ratio | 48.1% | 47.7% | 51.5% | |||||||||||||||
RoRWA24 | 2.5% | 2.9% | 2.7% | |||||||||||||||
Year-end staff numbers | 8,066 | 8,305 | 8,618 | |||||||||||||||
For footnotes, see page 99.
Country view of adjusted revenue
| 2015 | 2014 | |||||||||||
| $m | $m | |||||||||||
Egypt | 610 | 493 | ||||||||||
United Arab Emirates | 1,407 | 1,446 | ||||||||||
Other | 538 | 556 | ||||||||||
Year ended 31 December | 2,555 | 2,495 | ||||||||||
Profit before tax ($m)
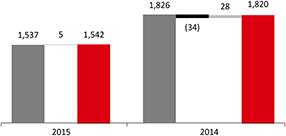
Revenue ($m)
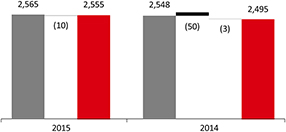
Operating expenses ($m)
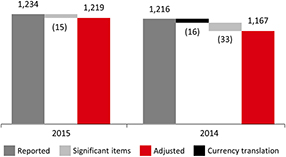
For details of significant items, see page 77.
Profit/(loss) before tax by country within global businesses
Retail and Wealth Management $m | Commercial Banking $m | Global Banking and Markets $m | Global Private Banking $m | Other $m | Total $m | |||||||||||||||||||||||||||||||||
Egypt | 50 | 101 | 256 | – | 3 | 410 | ||||||||||||||||||||||||||||||||
United Arab Emirates | 91 | 19 | 292 | – | (35 | ) | 367 | |||||||||||||||||||||||||||||||
Saudi Arabia | 112 | 169 | 202 | 16 | 1 | 500 | ||||||||||||||||||||||||||||||||
Other | 19 | 119 | 123 | – | (1 | ) | 260 | |||||||||||||||||||||||||||||||
Year ended 31 December 2015 | 272 | 408 | 873 | 16 | (32 | ) | 1,537 | |||||||||||||||||||||||||||||||
Egypt | 64 | 94 | 177 | – | – | 335 | ||||||||||||||||||||||||||||||||
United Arab Emirates | 154 | 190 | 364 | – | (46 | ) | 662 | |||||||||||||||||||||||||||||||
Saudi Arabia | 91 | 168 | 203 | 19 | 5 | 486 | ||||||||||||||||||||||||||||||||
Other | 14 | 152 | 182 | – | (5 | ) | 343 | |||||||||||||||||||||||||||||||
Year ended 31 December 2014 | 323 | 604 | 926 | 19 | (46 | ) | 1,826 | |||||||||||||||||||||||||||||||
Egypt | 31 | 37 | 166 | – | (29 | ) | 205 | |||||||||||||||||||||||||||||||
United Arab Emirates | 142 | 290 | 275 | 1 | (72 | ) | 636 | |||||||||||||||||||||||||||||||
Saudi Arabia | 82 | 146 | 188 | 15 | 7 | 438 | ||||||||||||||||||||||||||||||||
Other | 3 | 172 | 240 | – | – | 415 | ||||||||||||||||||||||||||||||||
Year ended 31 December 2013 | 258 | 645 | 869 | 16 | (94 | ) | 1,694 | |||||||||||||||||||||||||||||||
HSBC HOLDINGS PLC
86
Table of Contents
Report of the Directors: Financial Review(continued)
2015 compared with 2014
Our operations in Middle East and North Africa reported a profit before tax of $1.5bn in 2015, a decrease of $0.3bn or 16% compared with 2014.
On an adjusted basis, profit before tax of $1.5bn was $0.3bn or 15% lower than in 2014.
Adjustedrevenue of $2.6bn was $60m or 2% higher than in 2014. This was mainly from revenue growth in our GB&M business in Egypt from growth in lending and investments, and in RBWM in the UAE from higher fee income on cards and wealth products.
AdjustedLICs of $299m compared with a net release of $4m in 2014. In 2015, LICs included higher impairment charges in our CMB business against specific exposures in the oil and foodstuff industries. LICs also increased in our RBWM business in the UAE from higher collective impairment charges on our mortgage book which included the effect of a review of portfolio collateral. By contrast, 2014 included releases in GB&M.
Operating expenses of $1.2bn were $52m or 5% higher than in 2014. This was mainly from higher staff costs, in part reflecting continued investment in Global Standards and wage inflation. In addition, FTEs increased primarily reflecting a rise in customer-facing staff in RBWM.
Adjustedshare of profits from associates and joint ventures increased by $17m or 3%, mainly from The Saudi British Bank.
2014 compared with 2013
Our operations in Middle East and North Africa reported a profit before tax of $1.8bn, an increase of 8% on a reported basis, despite the effects of business disposals, including the loss on sale of our Pakistan business.
On an adjusted basis, profit before tax grew by 11%.
Adjusted revenue was $143m or 6% higher. The growth was primarily in Egypt from improved deposit spreads in our RBWM business from re-pricing, as well as from the non-recurrence of losses on disposal of available-for-sale debt securities in GB&M in 2013. In addition, the Egyptian Central Bank resumed interest payments on overnight placements during 2014, which contributed to the rise in revenue in all global businesses.
In the UAE, we increased revenue by $47m, primarily in our GB&M businesses from a rise in Capital Financing due to increased advisory mandates in Project and Export Finance and a gain on restructuring a specific loan in Credit and Lending. In addition, we grew revenue in our Equities and Securities Services businesses from increased customer flows.
Adjusted net loan impairment releases were lower by $44m, primarily due to lower releases from a particular UAE-related exposure in GB&M.
Operating expenses of $1,183m decreased by $31m on an adjusted basis. In Egypt, expenses fell following charges recorded in 2013 relating to changes in the interpretation of tax regulations. In the UAE, expenses reduced due to the non-recurrence of charges incurred in 2013 on customer redress programmes in RBWM relating to fees charged on overseas credit card transactions. This was partly offset by wage inflation, investment in regulatory programmes and compliance, growth in customer-facing staff in RBWM and increased service and product support staff in CMB.
Adjusted share of profits from associates and joint ventures increased by 12%, mainly from The Saudi British Bank.
HSBC HOLDINGS PLC
86a
Table of Contents
Profit/(loss) before tax and balance sheet data – Middle East and North Africa
| 2015 | ||||||||||||||||||||||||||||||||||||||||||
| | Retail Banking and Wealth | |
| Commercial Banking $m |
|
| Global Banking and Markets $m |
|
| Global Private Banking $m |
|
| Other $m |
|
| Inter- segment elimination $m |
44
|
| Total $m |
| ||||||||||||||||||||||
Profit/(loss) before tax | ||||||||||||||||||||||||||||||||||||||||||
Net interest income | 587 | 451 | 478 | – | 3 | 12 | 1,531 | |||||||||||||||||||||||||||||||||||
Net fee income/(expense) | 176 | 249 | 213 | – | (5 | ) | – | 633 | ||||||||||||||||||||||||||||||||||
Trading income excluding net interest income | 51 | 62 | 216 | – | – | – | 329 | |||||||||||||||||||||||||||||||||||
Net interest income/(expense) on trading activities | – | – | 8 | – | – | (12 | ) | (4 | ) | |||||||||||||||||||||||||||||||||
Net trading income40 | 51 | 62 | 224 | – | – | (12 | ) | 325 | ||||||||||||||||||||||||||||||||||
Net expense from financial instruments designated at fair value | – | – | – | – | 6 | – | 6 | |||||||||||||||||||||||||||||||||||
Gains less losses from financial investments | 7 | 5 | 5 | – | – | – | 17 | |||||||||||||||||||||||||||||||||||
Dividend income | 1 | 1 | 7 | – | – | – | 9 | |||||||||||||||||||||||||||||||||||
Other operating income | 12 | 11 | 25 | – | 99 | (103 | ) | 44 | ||||||||||||||||||||||||||||||||||
Total operating income | 834 | 779 | 952 | – | 103 | (103 | ) | 2,565 | ||||||||||||||||||||||||||||||||||
Net insurance claims45 | – | – | – | – | – | – | – | |||||||||||||||||||||||||||||||||||
Net operating income1 | 834 | 779 | 952 | – | 103 | (103 | ) | 2,565 | ||||||||||||||||||||||||||||||||||
Loan impairment (charges)/recoveries and other credit risk provisions | (121 | ) | (183 | ) | 5 | – | – | – | (299 | ) | ||||||||||||||||||||||||||||||||
Net operating income | 713 | 596 | 957 | – | 103 | (103 | ) | 2,266 | ||||||||||||||||||||||||||||||||||
Total operating expenses | (557 | ) | (357 | ) | (286 | ) | – | (137 | ) | 103 | (1,234 | ) | ||||||||||||||||||||||||||||||
Operating profit/(loss) | 156 | 239 | 671 | – | (34 | ) | – | 1,032 | ||||||||||||||||||||||||||||||||||
Share of profit in associates and joint ventures | 116 | 169 | 202 | 16 | 2 | – | 505 | |||||||||||||||||||||||||||||||||||
Profit/(loss) before tax | 272 | 408 | 873 | 16 | (32 | ) | – | 1,537 | ||||||||||||||||||||||||||||||||||
| % | % | % | % | % | % | |||||||||||||||||||||||||||||||||||||
Share of HSBC’s profit before tax | 1.4 | 2.2 | 4.6 | 0.1 | (0.2 | ) | 8.1 | |||||||||||||||||||||||||||||||||||
Cost efficiency ratio | 66.8 | 45.8 | 30.0 | – | 133.0 | 48.1 | ||||||||||||||||||||||||||||||||||||
Balance sheet data30 | ||||||||||||||||||||||||||||||||||||||||||
| $m | $m | $m | $m | $m | $m | |||||||||||||||||||||||||||||||||||||
Loans and advances to customers (net) | 6,374 | 13,695 | 9,825 | – | – | 29,894 | ||||||||||||||||||||||||||||||||||||
Total assets | 7,194 | 15,546 | 35,929 | 92 | 3,067 | (2,592 | ) | 59,236 | ||||||||||||||||||||||||||||||||||
Customer accounts | 17,172 | 12,192 | 6,901 | – | 203 | 36,468 | ||||||||||||||||||||||||||||||||||||
HSBC HOLDINGS PLC
87
Table of Contents
Report of the Directors: Geographical regions(continued)
Middle East and North Africa / North America
| 2014 | ||||||||||||||||||||||||||||||||||||||||||
|
| Retail Banking and Wealth Management $m |
|
| Commercial Banking $m |
|
| Global Banking and Markets $m |
|
| Global Private Banking $m |
|
| Other $m |
|
| Inter- segment elimination $m |
44
|
| Total $m |
| ||||||||||||||||||||||
Profit/(loss) before tax | ||||||||||||||||||||||||||||||||||||||||||
Net interest income | 615 | 467 | 410 | – | 3 | 24 | 1,519 | |||||||||||||||||||||||||||||||||||
Net fee income/(expense) | 152 | 268 | 240 | – | (10 | ) | – | 650 | ||||||||||||||||||||||||||||||||||
Trading income/(expense) excluding net interest income | 58 | 68 | 207 | – | (5 | ) | – | 328 | ||||||||||||||||||||||||||||||||||
Net interest income/(expenses) on trading activities | – | – | 10 | – | – | (24 | ) | (14 | ) | |||||||||||||||||||||||||||||||||
Net trading income/(expense)40 | 58 | 68 | 217 | – | (5 | ) | (24 | ) | 314 | |||||||||||||||||||||||||||||||||
Net expense from financial instruments designated at fair value | – | – | – | – | (3 | ) | – | (3 | ) | |||||||||||||||||||||||||||||||||
Gains less losses from financial investments | 1 | 1 | 20 | – | – | – | 22 | |||||||||||||||||||||||||||||||||||
Dividend income | 1 | 1 | 12 | – | – | – | 14 | |||||||||||||||||||||||||||||||||||
Other operating income | 8 | – | 27 | – | 108 | (111 | ) | 32 | ||||||||||||||||||||||||||||||||||
Total operating income | 835 | 805 | 926 | – | 93 | (111 | ) | 2,548 | ||||||||||||||||||||||||||||||||||
Net insurance claims45 | – | – | – | – | – | – | – | |||||||||||||||||||||||||||||||||||
Net operating income1 | 835 | 805 | 926 | – | 93 | (111 | ) | 2,548 | ||||||||||||||||||||||||||||||||||
Loan impairment (charges)/recoveries and other credit risk provisions | (26 | ) | (21 | ) | 53 | – | – | – | 6 | |||||||||||||||||||||||||||||||||
Net operating income | 809 | 784 | 979 | – | 93 | (111 | ) | 2,554 | ||||||||||||||||||||||||||||||||||
Total operating expenses | (578 | ) | (348 | ) | (256 | ) | – | (145 | ) | 111 | (1,216 | ) | ||||||||||||||||||||||||||||||
Operating profit/(loss) | 231 | 436 | 723 | – | (52 | ) | – | 1,338 | ||||||||||||||||||||||||||||||||||
Share of profit in associates and joint ventures | 92 | 168 | 203 | 19 | 6 | – | 488 | |||||||||||||||||||||||||||||||||||
Profit/(loss) before tax | 323 | 604 | 926 | 19 | (46 | ) | – | 1,826 | ||||||||||||||||||||||||||||||||||
| % | % | % | % | % | % | |||||||||||||||||||||||||||||||||||||
Share of HSBC’s profit before tax | 1.7 | 3.2 | 5.0 | 0.1 | (0.2 | ) | 9.8 | |||||||||||||||||||||||||||||||||||
Cost efficiency ratio | 69.2 | 43.2 | 27.6 | – | 155.9 | 47.7 | ||||||||||||||||||||||||||||||||||||
Balance sheet data30 | ||||||||||||||||||||||||||||||||||||||||||
| $m | $m | $m | $m | $m | $m | |||||||||||||||||||||||||||||||||||||
Loans and advances to customers (net) | 6,318 | 13,104 | 9,641 | – | – | 29,063 | ||||||||||||||||||||||||||||||||||||
Total assets | 7,073 | 14,911 | 39,229 | 77 | 2,900 | (1,773 | ) | 62,417 | ||||||||||||||||||||||||||||||||||
Customer accounts | 18,024 | 11,809 | 9,630 | – | 257 | 39,720 | ||||||||||||||||||||||||||||||||||||
For footnotes, see page 99.
HSBC HOLDINGS PLC
88
Table of Contents
Report of the Directors: Financial Review(continued)
Profit/(loss) before tax and balance sheet data – Middle East and North Africa (continued)
| 2013 | ||||||||||||||||||||||||||||||||||||||||||
|
| Retail Banking and Wealth Management $m |
|
| Commercial Banking $m |
|
| Global Banking and Markets $m |
|
| Global Private Banking $m |
|
| Other $m |
|
| Inter- segment elimination $m | 44
|
| Total $m |
| ||||||||||||||||||||||
Profit/(loss) before tax | ||||||||||||||||||||||||||||||||||||||||||
Net interest income | 585 | 486 | 390 | – | 4 | 21 | 1,486 | |||||||||||||||||||||||||||||||||||
Net fee income/(expense) | 161 | 269 | 197 | – | (5 | ) | – | 622 | ||||||||||||||||||||||||||||||||||
Trading income excluding net interest income | 59 | 85 | 220 | – | – | – | 364 | |||||||||||||||||||||||||||||||||||
Net interest income on trading activities | – | – | 14 | – | – | (21 | ) | (7 | ) | |||||||||||||||||||||||||||||||||
Net trading income40 | 59 | 85 | 234 | – | – | (21 | ) | 357 | ||||||||||||||||||||||||||||||||||
Net expense from financial instruments designated at fair value | – | – | – | – | (2 | ) | – | (2 | ) | |||||||||||||||||||||||||||||||||
Gains less losses from financial investments | – | – | (18 | ) | – | – | – | (18 | ) | |||||||||||||||||||||||||||||||||
Dividend income | – | – | 9 | – | – | – | 9 | |||||||||||||||||||||||||||||||||||
Other operating income | 25 | 30 | 15 | – | 99 | (120 | ) | 49 | ||||||||||||||||||||||||||||||||||
Total operating income | 830 | 870 | 827 | – | 96 | (120 | ) | 2,503 | ||||||||||||||||||||||||||||||||||
Net insurance claims45 | – | – | – | – | – | – | – | |||||||||||||||||||||||||||||||||||
Net operating income1 | 830 | 870 | 827 | – | 96 | (120 | ) | 2,503 | ||||||||||||||||||||||||||||||||||
Loan impairment (charges)/recoveries and other credit risk provisions | (49 | ) | (20 | ) | 110 | 1 | – | – | 42 | |||||||||||||||||||||||||||||||||
Net operating income | 781 | 850 | 937 | 1 | 96 | (120 | ) | 2,545 | ||||||||||||||||||||||||||||||||||
Total operating expenses | (606 | ) | (350 | ) | (256 | ) | – | (197 | ) | 120 | (1,289 | ) | ||||||||||||||||||||||||||||||
Operating profit/(loss) | 175 | 500 | 681 | 1 | (101 | ) | – | 1,256 | ||||||||||||||||||||||||||||||||||
Share of profit in associates and joint ventures | 83 | 145 | 188 | 15 | 7 | – | 438 | |||||||||||||||||||||||||||||||||||
Profit/(loss) before tax | 258 | 645 | 869 | 16 | (94 | ) | – | 1,694 | ||||||||||||||||||||||||||||||||||
| % | % | % | % | % | % | |||||||||||||||||||||||||||||||||||||
Share of HSBC’s profit before tax | 1.1 | 2.9 | 3.8 | 0.1 | (0.4 | ) | 7.5 | |||||||||||||||||||||||||||||||||||
Cost efficiency ratio | 73.0 | 40.2 | 31.0 | – | 205.2 | 51.5 | ||||||||||||||||||||||||||||||||||||
Balance sheet data30 | ||||||||||||||||||||||||||||||||||||||||||
| $m | $m | $m | $m | $m | $m | |||||||||||||||||||||||||||||||||||||
Loans and advances to customers (net) | 6,152 | 11,814 | 9,241 | – | 4 | 27,211 | ||||||||||||||||||||||||||||||||||||
Total assets | 7,016 | 13,776 | 39,302 | 64 | 3,340 | (2,688 | ) | 60,810 | ||||||||||||||||||||||||||||||||||
Customer accounts | 18,771 | 12,402 | 7,432 | 1 | 77 | 38,683 | ||||||||||||||||||||||||||||||||||||
For footnotes, see page 99.
HSBC HOLDINGS PLC
88a
Table of Contents
Our principal North American businesses are located in the US and Canada. Operations in the US are primarily conducted through HSBC Bank USA, N.A., and HSBC Finance, a national consumer finance company. HSBC Markets (USA) Inc. is the intermediate holding company of,inter alia, HSBC Securities (USA) Inc. Canadian operations are conducted through HSBC Bank Canada.
| 2015 | 2014 | 2013 | ||||||||||||||||
| $m | $m | $m | ||||||||||||||||
Net interest income | 4,532 | 5,015 | 5,742 | |||||||||||||||
Net fee income | 2,018 | 1,940 | 2,143 | |||||||||||||||
Net trading income | 545 | 411 | 948 | |||||||||||||||
Other income/(expense) | 562 | 786 | (30 | ) | ||||||||||||||
Net operating income1 | 7,657 | 8,152 | 8,803 | |||||||||||||||
LICs34 | (544 | ) | (322 | ) | (1,197 | ) | ||||||||||||
Net operating income | 7,113 | 7,830 | 7,606 | |||||||||||||||
Total operating expenses | (6,501 | ) | (6,429 | ) | (6,416 | ) | ||||||||||||
Operating profit | 612 | 1,401 | 1,190 | |||||||||||||||
Income from associates35 | 2 | 16 | 31 | |||||||||||||||
Profit before tax | 614 | 1,417 | 1,221 | |||||||||||||||
Cost efficiency ratio | 84.9% | 78.9% | 72.9% | |||||||||||||||
RoRWA24 | 0.3% | 0.6% | 0.5% | |||||||||||||||
Year-end staff numbers | 19,656 | 20,412 | 20,871 | |||||||||||||||
For footnotes, see page 99.
Country view of adjusted revenue
| 2015 | 2014 | |||||||||||
| $m | $m | |||||||||||
US | 5,926 | 6,083 | ||||||||||
Canada | 1,585 | 1,663 | ||||||||||
Other | 244 | 270 | ||||||||||
Year ended 31 December | 7,755 | 8,016 | ||||||||||
Profit before tax ($m)
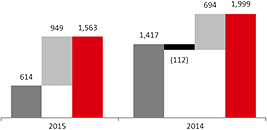
Revenue ($m)
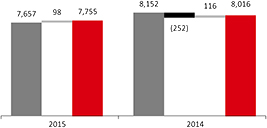
Operating expenses ($m)
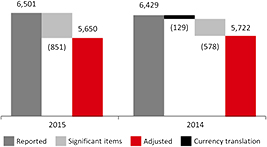
For details of significant items, see page 77.
Profit/(loss) before tax by country within global businesses
Retail Management $m | Commercial Banking $m | Global Markets $m | Global Private | Other $m | Total $m | |||||||||||||||||||||||||||||||
US | (736 | ) | 302 | 355 | 65 | 55 | 41 | |||||||||||||||||||||||||||||
Canada | 58 | 259 | 189 | – | (21 | ) | 485 | |||||||||||||||||||||||||||||
Other | 33 | 12 | 49 | (6 | ) | – | 88 | |||||||||||||||||||||||||||||
Year ended 31 December 2015 | (645 | ) | 573 | 593 | 59 | 34 | 614 | |||||||||||||||||||||||||||||
US | 513 | 400 | (403 | ) | 82 | (60 | ) | 532 | ||||||||||||||||||||||||||||
Canada | 96 | 514 | 242 | – | (23 | ) | 829 | |||||||||||||||||||||||||||||
Other | 23 | (1 | ) | 49 | 3 | (18 | ) | 56 | ||||||||||||||||||||||||||||
Year ended 31 December 2014 | 632 | 913 | (112 | ) | 85 | (101 | ) | 1,417 | ||||||||||||||||||||||||||||
US | (358 | ) | 296 | 633 | 53 | (350 | ) | 274 | ||||||||||||||||||||||||||||
Canada | 131 | 506 | 280 | – | (3 | ) | 914 | |||||||||||||||||||||||||||||
Other | 20 | (16 | ) | 16 | 4 | 9 | 33 | |||||||||||||||||||||||||||||
Year ended 31 December 2013 | (207 | ) | 786 | 929 | 57 | (344 | ) | 1,221 | ||||||||||||||||||||||||||||
HSBC HOLDINGS PLC
89
Table of Contents
Report of the Directors: Financial Review(continued)
2015 compared with 2014
In North America, our operations reported a profit before tax of $614m in 2015 compared with $1.4bn in 2014. The effect of currency translation between years and net movement in significant items together had an adverse effect of $0.4bn on the reported profit before tax. The movement in significant items included the effect of fines, penalties and charges in relation to legal matters, as well as a net loss on the sale of several tranches of real estate secured loans in our US CML portfolio.
Adjusted profit before tax was $1.6bn or 22% lower than in 2014.
Adjustedrevenue fell by $261m or 3%. The reduction was mainly in our CML portfolio in RBWM and reflected lower average lending balances as we continued with our programme to run-off and sell tranches of the portfolio. Lower revenue was in part offset by growth in our GB&M business. This was mainly from an increase in income in Markets and Balance Sheet Management and in Capital Finance from volume growth.
AdjustedLICs increased by $235m or 76%. This was mainly in our CMB business in the US and Canada and reflected an increase in both collectively and individually assessed allowances against our oil and gas exposures. In our US CML portfolio LICs were also higher than in 2014. This reflected lower favourable market value adjustments on underlying properties as improvements in housing market conditions were less pronounced in 2015. This was partly offset by a reduction in LICs from lower levels of newly impaired loans and lower lending balances from continued run-off and sales.
Adjustedoperating expenses were $72m or 1% lower. In RBWM, our costs fell reflecting the reduced size of our CML portfolio which resulted in lower support services, project and staff costs. In addition, 2014 included certain legal costs which did not recur. This reduction was offset by cost growth in our CMB businesses, primarily staff costs to support the expansion of our franchise.
2014 compared with 2013
Our operations in North America reported a profit before tax of $1.4bn in 2014 compared with $1.2bn in 2013. The effect of currency translation between years and net movement in significant items together contributed $247m of the increase in reported profit before tax. The movement in significant items included a charge in relation to the settlement agreement with the Federal Housing Finance Authority.
Adjusted profit before tax was $63m or 3% higher.
Adjusted revenue fell by $1.1bn or 12%. This was primarily in our CML portfolio in RBWM and reflected lower average lending balances driven by the continued run-off and loan sales. In addition, our loan yields fell as we sold our higher yielding CML non-real estate personal loan portfolio. Revenue was also lower in our GB&M business, driven by a reduction in Balance Sheet Management income as we reported lower gains on sales of available-for-sale debt, and the adverse performance of economic hedges used to manage interest rate risk. Credit revenue also reduced, primarily in our legacy credit portfolio.
Adjusted LICs fell by 73% to $322m. This was mainly in our CML portfolio in RBWM reflecting reduced levels of delinquency, new impaired loans and lower lending balances from the continued run-off and loan sales. This was partly offset by less favourable market value adjustments to underlying property prices because improvements in housing market conditions were less pronounced in 2014 than in 2013. LICs also fell in our Principal RBWM business due to lower levels of delinquency, and in Canada in CMB from lower individually and collectively assessed LICs.
Adjusted operating expenses decreased by $285m. This reflected lower divestiture costs, as our former Cards business reached the end of the data separation process, and lower costs following continued run-off and loan sales in our CML portfolio. In addition, we achieved over $185m of sustainable cost savings, primarily reflecting organisational effectiveness initiatives. Partly offsetting these reductions were higher legal costs and the growth in costs associated with regulatory programmes and compliance as we continued our investment in Global Standards.
HSBC HOLDINGS PLC
89a
Table of Contents
Report of the Directors: Geographical regions(continued)
North America
Profit/(loss) before tax and balance sheet data – North America
| 2015 | ||||||||||||||||||||||||||||||||||||||||||
| | Retail Banking and Wealth Management $m | |
| Commercial Banking $m |
|
| Global Banking and Markets $m |
| | Global Private | |
| Other $m |
|
| Inter- segment elimination $m | 44
|
| Total $m |
| ||||||||||||||||||||||
Profit/(loss) before tax | ||||||||||||||||||||||||||||||||||||||||||
Net interest income | 2,188 | 1,365 | 771 | 206 | 31 | (29 | ) | 4,532 | ||||||||||||||||||||||||||||||||||
Net fee income/(expense) | 499 | 539 | 876 | 117 | (13 | ) | – | 2,018 | ||||||||||||||||||||||||||||||||||
Trading income/(expense) excluding net interest income | 12 | 33 | 188 | 11 |
| (7 | ) | – | 237 | |||||||||||||||||||||||||||||||||
Net interest income on trading activities | 7 | 1 | 271 | – | – | 29 | 308 | |||||||||||||||||||||||||||||||||||
Net trading income/(expense)40 | 19 | 34 | 459 | 11 | (7 | ) | 29 | 545 | ||||||||||||||||||||||||||||||||||
Changes in fair value of long-term debt issued and related derivatives | – | – | – | – | 181 | – | 181 | |||||||||||||||||||||||||||||||||||
Net income from other financial instruments designated at fair value | – | – | – | – | – | – | – | |||||||||||||||||||||||||||||||||||
Net expense from financial instruments designated at fair value | – | – | – | – | 181 | – | 181 | |||||||||||||||||||||||||||||||||||
Gains less losses from financial investments | – | – | 189 | – | (42 | ) | – | 147 | ||||||||||||||||||||||||||||||||||
Dividend income | 16 | 12 | 19 | 4 | 6 | – | 57 | |||||||||||||||||||||||||||||||||||
Net insurance premium income | – | – | – | – | – | – | – | |||||||||||||||||||||||||||||||||||
Other operating income | (142 | ) | 53 | 76 | (6 | ) | 1,804 | (1,608 | ) | 177 | ||||||||||||||||||||||||||||||||
Total operating income | 2,580 | 2,003 | 2,390 | 332 | 1,960 | (1,608 | ) | 7,657 | ||||||||||||||||||||||||||||||||||
Net insurance claims45 | – | – | – | – | – | – | – | |||||||||||||||||||||||||||||||||||
Net operating income1 | 2,580 | 2,003 | 2,390 | 332 | 1,960 | (1,608 | ) | 7,657 | ||||||||||||||||||||||||||||||||||
Loan impairment (charges)/recoveries and other credit risk provisions | (159 | ) | (323 | ) | (68 | ) | 6 | – | – | (544 | ) | |||||||||||||||||||||||||||||||
Net operating income | 2,421 | 1,680 | 2,322 | 338 | 1,960 | (1,608 | ) | 7,113 | ||||||||||||||||||||||||||||||||||
Total operating expenses | (3,066 | ) | (1,109 | ) | (1,729 | ) | (279 | ) | (1,926 | ) | 1,608 | (6,501 | ) | |||||||||||||||||||||||||||||
Operating profit/(loss) | (645 | ) | 571 | 593 | 59 | 34 | – | 612 | ||||||||||||||||||||||||||||||||||
Share of profit in associates and joint ventures | – | 2 | – | – | – | – | 2 | |||||||||||||||||||||||||||||||||||
Profit/(loss) before tax | (645 | ) | 573 | 593 | 59 | 34 | – | 614 | ||||||||||||||||||||||||||||||||||
| % | % | % | % | % | % | |||||||||||||||||||||||||||||||||||||
Share of HSBC’s profit before tax | (3.4 | ) | 3.0 | 3.1 | 0.3 | 0.3 | 3.3 | |||||||||||||||||||||||||||||||||||
Cost efficiency ratio | 118.8 | 55.4 | 72.3 | 84.0 | 98.3 | 84.9 | ||||||||||||||||||||||||||||||||||||
Balance sheet data30 | ||||||||||||||||||||||||||||||||||||||||||
| $m | $m | $m | $m | $m | $m | |||||||||||||||||||||||||||||||||||||
Loans and advances to customers (net) | 53,737 | 40,696 | 27,940 | 6,478 | – | 128,851 | ||||||||||||||||||||||||||||||||||||
Total assets | 62,127 | 47,009 | 282,201 | 8,629 | 14,489 | (20,495 | ) | 393,960 | ||||||||||||||||||||||||||||||||||
Customer accounts | 51,685 | 45,475 | 24,182 | 13,807 | 3 | 135,152 | ||||||||||||||||||||||||||||||||||||
HSBC HOLDINGS PLC
90
Table of Contents
| 2014 | ||||||||||||||||||||||||||||||||||||||||||
| | Retail Banking and Wealth | |
| Commercial Banking $m |
|
| Global Banking and Markets $m |
| | Global Private | |
| Other $m |
|
| Inter- segment elimination $m | 44
| | Total $m | | ||||||||||||||||||||||
Profit/(loss) before tax | ||||||||||||||||||||||||||||||||||||||||||
Net interest income | 2,645 | 1,455 | 587 | 204 | 157 | (33 | ) | 5,015 | ||||||||||||||||||||||||||||||||||
Net fee income/(expense) | 497 | 572 | 775 | 130 | (34 | ) | – | 1,940 | ||||||||||||||||||||||||||||||||||
Trading income/(expense) excluding net interest income | (165 | ) | 34 | 302 | 13 | 3 | – | 187 | ||||||||||||||||||||||||||||||||||
Net interest income on trading activities | 7 | 1 | 183 | – | – | 33 | 224 | |||||||||||||||||||||||||||||||||||
Net trading income/(expense)40 | (158 | ) | 35 | 485 | 13 | 3 | 33 | 411 | ||||||||||||||||||||||||||||||||||
Changes in fair value of long-term debt issued and related derivatives | – | – | – | – | (99 | ) | – | (99 | ) | |||||||||||||||||||||||||||||||||
Net income from other financial instruments designated at fair value | – | – | – | – | – | – | – | |||||||||||||||||||||||||||||||||||
Net expense from financial instruments designated at fair value | – | – | – | – | (99 | ) | – | (99 | ) | |||||||||||||||||||||||||||||||||
Gains less losses from financial investments | – | 15 | 237 | – | 5 | – | 257 | |||||||||||||||||||||||||||||||||||
Dividend income | 13 | 8 | 16 | 3 | 4 | – | 44 | |||||||||||||||||||||||||||||||||||
Net insurance premium income | – | – | – | – | – | – | – | |||||||||||||||||||||||||||||||||||
Other operating income | 268 | 61 | 101 | 1 | 1,872 | (1,719 | ) | 584 | ||||||||||||||||||||||||||||||||||
Total operating income | 3,265 | 2,146 | 2,201 | 351 | 1,908 | (1,719 | ) | 8,152 | ||||||||||||||||||||||||||||||||||
Net insurance claims45 | – | – | – | – | – | – | – | |||||||||||||||||||||||||||||||||||
Net operating income1 | 3,265 | 2,146 | 2,201 | 351 | 1,908 | (1,719 | ) | 8,152 | ||||||||||||||||||||||||||||||||||
Loan impairment (charges)/recoveries and other credit risk provisions | (117 | ) | (148 | ) | (63 | ) | 8 | (2 | ) | – | (322 | ) | ||||||||||||||||||||||||||||||
Net operating income | 3,148 | 1,998 | 2,138 | 359 | 1,906 | (1,719 | ) | 7,830 | ||||||||||||||||||||||||||||||||||
Total operating expenses | (2,516 | ) | (1,101 | ) | (2,250 | ) | (274 | ) | (2,007 | ) | 1,719 | (6,429 | ) | |||||||||||||||||||||||||||||
Operating profit/(loss) | 632 | 897 | (112 | ) | 85 | (101 | ) | – | 1,401 | |||||||||||||||||||||||||||||||||
Share of profit in associates and joint ventures | – | 16 | – | – | – | – | 16 | |||||||||||||||||||||||||||||||||||
Profit/(loss) before tax | 632 | 913 | (112 | ) | 85 | (101 | ) | – | 1,417 | |||||||||||||||||||||||||||||||||
| % | % | % | % | % | % | |||||||||||||||||||||||||||||||||||||
Share of HSBC’s profit before tax | 3.4 | 4.9 | (0.6 | ) | 0.5 | (0.5 | ) | 7.6 | ||||||||||||||||||||||||||||||||||
Cost efficiency ratio | 77.1 | 51.3 | 102.2 | 78.1 | 105.2 | 78.9 | ||||||||||||||||||||||||||||||||||||
Balance sheet data30 | ||||||||||||||||||||||||||||||||||||||||||
| $m | $m | $m | $m | $m | $m | |||||||||||||||||||||||||||||||||||||
Loans and advances to customers (net) | 60,365 | 41,966 | 21,110 | 6,346 | – | 129,787 | ||||||||||||||||||||||||||||||||||||
Total assets | 74,680 | 48,411 | 319,819 | 8,386 | 16,823 | (31,260 | ) | 436,859 | ||||||||||||||||||||||||||||||||||
Customer accounts | 51,258 | 45,275 | 30,301 | 12,050 | – | 138,884 | ||||||||||||||||||||||||||||||||||||
For footnotes, see page 99.
HSBC HOLDINGS PLC
91
Table of Contents
Report of the Directors: Financial Review(continued)
Profit/(loss) before tax and balance sheet data – North America (continued)
| 2013 | ||||||||||||||||||||||||||||||||||||||||||
| | Retail Banking and Wealth Management $m | |
| Commercial Banking $m |
|
| Global Banking and Markets $m |
| | Global Private | |
| Other $m |
|
| Inter- segment elimination $m | 44
| | Total $m | | ||||||||||||||||||||||
Profit/(loss) before tax | ||||||||||||||||||||||||||||||||||||||||||
Net interest income | 3,483 | 1,430 | 582 | 195 | 89 | (37 | ) | 5,742 | ||||||||||||||||||||||||||||||||||
Net fee income | 605 | 593 | 741 | 125 | 79 | – | 2,143 | |||||||||||||||||||||||||||||||||||
Trading income excluding net interest income | 48 | 40 | 613 | 19 | 7 | – | 727 | |||||||||||||||||||||||||||||||||||
Net interest income on trading activities | 11 | 1 | 172 | – | – | 37 | 221 | |||||||||||||||||||||||||||||||||||
Net trading income40 | 59 | 41 | 785 | 19 | 7 | 37 | 948 | |||||||||||||||||||||||||||||||||||
Changes in fair value of long-term debt issued and related derivatives | – | – | – | – | (288 | ) | – | (288 | ) | |||||||||||||||||||||||||||||||||
Net income from other financial instruments designated at fair value | – | – | – | – | – | – | – | |||||||||||||||||||||||||||||||||||
Net expense from financial instruments designated at fair value | – | – | – | – | (288 | ) | – | (288 | ) | |||||||||||||||||||||||||||||||||
Gains less losses from financial investments | 4 | – | 282 | – | 8 | – | 294 | |||||||||||||||||||||||||||||||||||
Dividend income | 12 | 9 | 48 | 4 | 4 | – | 77 | |||||||||||||||||||||||||||||||||||
Net insurance premium income | 34 | – | – | – | – | – | 34 | |||||||||||||||||||||||||||||||||||
Other operating income/ (expense) | (454 | ) | – | 229 | 1 | 1,829 | (1,713 | ) | (108 | ) | ||||||||||||||||||||||||||||||||
Total operating income | 3,743 | 2,073 | 2,667 | 344 | 1,728 | (1,713 | ) | 8,842 | ||||||||||||||||||||||||||||||||||
Net insurance claims45 | (39 | ) | – | – | – | – | – | (39 | ) | |||||||||||||||||||||||||||||||||
Net operating income1 | 3,704 | 2,073 | 2,667 | 344 | 1,728 | (1,713 | ) | 8,803 | ||||||||||||||||||||||||||||||||||
Loan impairment charges and other credit risk provisions | (950 | ) | (223 | ) | (20 | ) | (4 | ) | – | – | (1,197 | ) | ||||||||||||||||||||||||||||||
Net operating income | 2,754 | 1,850 | 2,647 | 340 | 1,728 | (1,713 | ) | 7,606 | ||||||||||||||||||||||||||||||||||
Total operating expenses | (2,960 | ) | (1,096 | ) | (1,718 | ) | (283 | ) | (2,072 | ) | 1,713 | (6,416 | ) | |||||||||||||||||||||||||||||
Operating profit/(loss) | (206 | ) | 754 | 929 | 57 | (344 | ) | – | 1,190 | |||||||||||||||||||||||||||||||||
Share of profit/(loss) in associates and joint ventures | (1 | ) | 32 | – | – | – | – | 31 | ||||||||||||||||||||||||||||||||||
Profit/(loss) before tax | (207 | ) | 786 | 929 | 57 | (344 | ) | – | 1,221 | |||||||||||||||||||||||||||||||||
| % | % | % | % | % | % | |||||||||||||||||||||||||||||||||||||
Share of HSBC’s profit before tax | (0.9 | ) | 3.5 | 4.1 | 0.3 | (1.6 | ) | 5.4 | ||||||||||||||||||||||||||||||||||
Cost efficiency ratio | 79.9 | 52.9 | 64.4 | 82.3 | 119.9 | 72.9 | ||||||||||||||||||||||||||||||||||||
Balance sheet data30 | ||||||||||||||||||||||||||||||||||||||||||
| $m | $m | $m | $m | $m | $m | |||||||||||||||||||||||||||||||||||||
Loans and advances to customers (net) | 66,192 | 37,735 | 18,070 | 5,956 | – | 127,953 | ||||||||||||||||||||||||||||||||||||
Total assets | 82,530 | 45,706 | 313,701 | 8,542 | 13,211 | (31,655 | ) | 432,035 | ||||||||||||||||||||||||||||||||||
Customer accounts | 53,600 | 49,225 | 24,113 | 13,871 | – | 140,809 | ||||||||||||||||||||||||||||||||||||
For footnotes, see page 99.
HSBC HOLDINGS PLC
91a
Table of Contents
Report of the Directors: Geographical regions(continued)
Latin America
Our operations in Latin America principally comprise HSBC Bank Brasil S.A.-Banco Múltiplo and HSBC México, S.A. In addition to banking services, we operate insurance
businesses in Brazil, Mexico and Argentina. During the year our operations in Brazil were classified as held for sale.
| 2015 | 2014 | 2013 | ||||||||||||||||||||||||||||||||||||||||||||||||||||
Total Latin America | Brazil | Other Latin America | Total Latin America | Brazil | Other Latin America | Total Latin America | Brazil | Other Latin America | ||||||||||||||||||||||||||||||||||||||||||||||
| $m | $m | $m | $m | $m | $m | $m | $m | $m | ||||||||||||||||||||||||||||||||||||||||||||||
Net interest income | 4,318 | 2,225 | 2,093 | 5,310 | 3,040 | 2,270 | 6,186 | 3,542 | 2,644 | |||||||||||||||||||||||||||||||||||||||||||||
Net fee income | 1,131 | 560 | 571 | 1,415 | 741 | 674 | 1,701 | 862 | 839 | |||||||||||||||||||||||||||||||||||||||||||||
Net trading income | 664 | 370 | 294 | 856 | 452 | 404 | 936 | 469 | 467 | |||||||||||||||||||||||||||||||||||||||||||||
Other income | 479 | 429 | 50 | 691 | 584 | 107 | 1,745 | 491 | 1,254 | |||||||||||||||||||||||||||||||||||||||||||||
Net operating income1 | 6,592 | 3,584 | 3,008 | 8,272 | 4,817 | 3,455 | 10,568 | 5,364 | 5,204 | |||||||||||||||||||||||||||||||||||||||||||||
LICs34 | (1,495 | ) | (965 | ) | (530 | ) | (2,124 | ) | (1,500 | ) | (624 | ) | (2,666 | ) | (1,712 | ) | (954 | ) | ||||||||||||||||||||||||||||||||||||
Net operating income | 5,097 | 2,619 | 2,478 | 6,148 | 3,317 | 2,831 | 7,902 | 3,652 | 4,250 | |||||||||||||||||||||||||||||||||||||||||||||
Total operating expenses | (4,786 | ) | (2,613 | ) | (2,173 | ) | (5,932 | ) | (3,564 | ) | (2,368 | ) | (5,930 | ) | (3,301 | ) | (2,629 | ) | ||||||||||||||||||||||||||||||||||||
Operating profit/(loss) | 311 | 6 | 305 | 216 | (247 | ) | 463 | 1,972 | 351 | 1,621 | ||||||||||||||||||||||||||||||||||||||||||||
Income from associates35 | (1 | ) | (1 | ) | – | – | – | – | – | – | – | |||||||||||||||||||||||||||||||||||||||||||
Profit/(loss) before tax | 310 | 5 | 305 | 216 | (247 | ) | 463 | 1,972 | 351 | 1,621 | ||||||||||||||||||||||||||||||||||||||||||||
Loans and advances to customers (net) | 17,293 | – | 17,293 | 43,122 | 23,749 | 19,373 | 43,918 | 24,924 | 18,994 | |||||||||||||||||||||||||||||||||||||||||||||
– reported in held for sale22 | 17,001 | 17,001 | – | – | – | – | – | – | – | |||||||||||||||||||||||||||||||||||||||||||||
Customer accounts | 21,470 | – | 21,470 | 48,588 | 23,204 | 25,384 | 51,389 | 23,999 | 27,390 | |||||||||||||||||||||||||||||||||||||||||||||
– reported in held for sale22 | 15,094 | 15,094 | – | – | – | – | – | – | – | |||||||||||||||||||||||||||||||||||||||||||||
Cost efficiency ratio | 72.6% | 72.9% | 72.2% | 71.7% | 74.0% | 68.5% | 56.1% | 61.5% | 50.5% | |||||||||||||||||||||||||||||||||||||||||||||
RoRWA24 | 0.4% | – | 0.8% | 0.2% | (0.5% | ) | 1.2% | 2.0% | 0.7% | 3.7% | ||||||||||||||||||||||||||||||||||||||||||||
Year-end staff numbers | 39,828 | 19,145 | 20,683 | 41,201 | 19,564 | 21,637 | 42,542 | 19,869 | 22,673 | |||||||||||||||||||||||||||||||||||||||||||||
For footnotes, see page 99.
Country view of adjusted revenue
| 2015 | 2014 | |||||||||||
| $m | $m | |||||||||||
Argentina | 1,036 | 940 | ||||||||||
Mexico | 1,968 | 1,931 | ||||||||||
Other | 3,552 | 3,511 | ||||||||||
– included in Other: Brazil | 3,550 | 3,443 | ||||||||||
Year ended 31 December | 6,556 | 6,382 | ||||||||||
Profit before tax ($m)
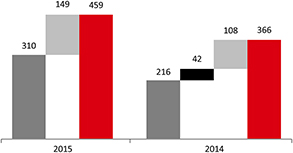
Revenue ($m)
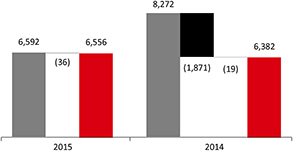
Operating expenses ($m)
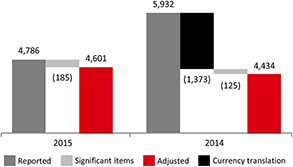
For details of significant items, see page 49.
HSBC HOLDINGS PLC
92
Table of Contents
Profit/(loss) before tax by country within global businesses
|
| Retail Banking and Wealth Management |
28 |
| Commercial Banking | 28 | | Global Banking and Markets | | | Global Private | | Other | Total | |||||||||||||||||||||||
| $m | $m | $m | $m | $m | $m | |||||||||||||||||||||||||||||||
Argentina | 43 | 152 | 125 | – | (3 | ) | 317 | |||||||||||||||||||||||||||||
Brazil | (344 | ) | 11 | 336 | 6 | (4 | ) | 5 | ||||||||||||||||||||||||||||
Mexico | 73 | (5 | ) | (15 | ) | (3 | ) | (18 | ) | 32 | ||||||||||||||||||||||||||
Other | (12 | ) | 7 | 16 | – | (55 | ) | (44 | ) | |||||||||||||||||||||||||||
Year ended 31 December 2015 | (240 | ) | 165 | 462 | 3 | (80 | ) | 310 | ||||||||||||||||||||||||||||
Argentina | 68 | 119 | 219 | – | (22 | ) | 384 | |||||||||||||||||||||||||||||
Brazil | (230 | ) | (97 | ) | 115 | (2 | ) | (33 | ) | (247 | ) | |||||||||||||||||||||||||
Mexico | 7 | (23 | ) | 89 | (2 | ) | (20 | ) | 51 | |||||||||||||||||||||||||||
Other | (5 | ) | 8 | 27 | – | (2 | ) | 28 | ||||||||||||||||||||||||||||
Year ended 31 December 2014 | (160 | ) | 7 | 450 | (4 | ) | (77 | ) | 216 | |||||||||||||||||||||||||||
Argentina | 112 | 127 | 170 | – | (1 | ) | 408 | |||||||||||||||||||||||||||||
Brazil | (209 | ) | 52 | 514 | 5 | (11 | ) | 351 | ||||||||||||||||||||||||||||
Mexico | 138 | (144 | ) | 115 | (3 | ) | 11 | 117 | ||||||||||||||||||||||||||||
Other | 289 | 525 | 368 | (1 | ) | (85 | ) | 1,096 | ||||||||||||||||||||||||||||
Year ended 31 December 2013 | 330 | 560 | 1,167 | 1 | (86 | ) | 1,972 | |||||||||||||||||||||||||||||
For footnote, see page 99.
HSBC HOLDINGS PLC
93
Table of Contents
Report of the Directors: Financial Review(continued)
2015 compared with 2014
In Latin America we reported a profit before tax of $310m in 2015, an increase of $94m or 44% compared with 2014. Reported profit before tax was reduced by restructuring costs of $116m in 2014 and costs relating to the planned disposal of our operations in Brazil of $110m in addition to costs-to-achieve of $69m in 2015.
On an adjusted basis, profit before tax of $0.5bn was $0.1bn or 25% higher than in 2014.
Adjustedrevenue of $6.6bn was $174m or 3% higher than in 2014, primarily from growth in our RBWM and CMB businesses. Revenue growth in RBWM was mainly in Mexico as our sales campaigns contributed to higher revenue across all core products, and in Argentina from higher deposit balances and wider spreads. In CMB, we increased revenue in Argentina from wider deposit spreads, growth in our deposit balances and higher fees in Payments and Cash Management. Growth in lending balances in Brazil also contributed. These increases were partly offset by lower revenue in GB&M. In Argentina, this reflected lower foreign exchange revenue as 2014 included a notably strong performance, while in Mexico our revenue from Rates decreased from valuation adjustments due to higher counterparty credit risk and wider spreads.
Our adjustedLICs of $1.5bn were $87m or 5% lower than in 2014. This was mainly due to lower individually assessed LICs in GB&M as 2014 included a significant charge related to a single exposure in Brazil. In addition, LICs decreased in our CMB business in Brazil and Mexico. By contrast, LICs in our RBWM business rose as delinquency rates increased in Brazil as the economy slowed.
Adjustedoperating expenses of $4.6bn were $167m or 4% higher than in 2014. This was largely due to union-agreed salary increases and inflationary pressures in Brazil and Argentina. Notably, costs in Brazil were largely unchanged overall as the increases mentioned above were broadly offset by the cessation of amortisation costs following the classification of the business to held for sale.
2014 compared with 2013
In Latin America we reported a profit before tax of $216m in 2014 compared with $2.0bn in 2013. The reduction included the adverse effect of currency translation between the years and an adverse movement in significant items, which together reduced 2014 reported profit before tax by $1.4bn. Significant items included the non-recurrence of a $1.1bn gain on sale of our operations in Panama in 2013.
Adjusted profit before tax decreased by $326m to $324m.
Adjusted revenue increased by 2% to $8.3bn. This was mainly in Argentina in our GB&M business from favourable trading results and higher revenue in Balance Sheet Management, and from higher insurance income in our RBWM business. In addition, RBWM and CMB revenue benefited from wider spreads as interest rates increased, and we grew our lending and deposit balances. By contrast, revenue in both Mexico and Brazil declined. In Mexico, this was primarily in our RBWM businesses from lower insurance sales volumes and continued repositioning. In Brazil, lower revenue reflected a change in the portfolio mix in our CMB business to reflect an increase in lower-yielding MMEs while, in GB&M, revenue reduced in Balance Sheet Management.
Adjusted LICs fell by 12% to $2.1bn. This was primarily in Mexico and, to a lesser extent, in Brazil. In Mexico, our LICs improved due to lower individually assessed charges in CMB, in particular relating to certain homebuilders following a change in the public housing policy in 2013, and in GB&M due to the non-recurrence of a large specific provision booked in 2013.
In Brazil, the fall was driven by changes to the impairment model and assumption revisions for restructured loan account portfolios which occurred in 2013 in both RBWM and CMB. In addition, collectively assessed impairments reduced in CMB, notably in Business Banking, reflecting improved delinquency rates. This was partly offset by an increase in GB&M driven by an individually assessed impairment and a provision made against a guarantee.
Adjusted operating expenses increased by $796m. This was largely due to union-agreed salary increases and inflationary pressures in Brazil and Argentina. In addition, we incurred higher transactional taxes in Argentina, and an accelerated depreciation charge and impairment of an intangible asset in RBWM in Brazil. Despite these factors, we generated sustainable cost savings of over $155m.
HSBC HOLDINGS PLC
93a
Table of Contents
Report of the Directors: Geographical regions(continued)
Latin America
Profit/(loss) before tax and balance sheet data – Latin America
| 2015 | ||||||||||||||||||||||||||||||||||||||||||
|
| Retail Banking and Wealth Management $m |
28
|
| Commercial Banking $m | 28
|
| Global Banking and Markets $m |
|
| Global Private Banking |
|
| Other $m |
|
| Inter- segment elimination $m |
44
| | Total $m | | ||||||||||||||||||||||
Profit/(loss) before tax | ||||||||||||||||||||||||||||||||||||||||||
Net interest income | 2,891 | 997 | 461 | 18 | 15 | (64 | ) | 4,318 | ||||||||||||||||||||||||||||||||||
Net fee income/(expense) | 724 | 253 | 133 | 23 | (2 | ) | – | 1,131 | ||||||||||||||||||||||||||||||||||
Trading income/(expense) excluding net interest income | 149 | 89 | 239 | 3 | (7 | ) | – | 473 | ||||||||||||||||||||||||||||||||||
Net interest income on trading activities | – | – | 124 | – | 3 | 64 | 191 | |||||||||||||||||||||||||||||||||||
Net trading income/(expense)40 | 149 | 89 | 363 | 3 | (4 | ) | 64 | 664 | ||||||||||||||||||||||||||||||||||
Changes in fair value of long-term debt issued and related derivatives | – | – | – | – | – | – | – | |||||||||||||||||||||||||||||||||||
Net income from other financial instruments designated at fair value | 439 | 134 | 2 | – | – | – | 575 | |||||||||||||||||||||||||||||||||||
Net income from financial instruments designated at fair value | 439 | 134 | 2 | – | – | – | 575 | |||||||||||||||||||||||||||||||||||
Gains less losses from financial investments | 14 | 1 | 56 | – | – | – | 71 | |||||||||||||||||||||||||||||||||||
Dividend income | 4 | 2 | 1 | – | – | – | 7 | |||||||||||||||||||||||||||||||||||
Net insurance premium income | 903 | 191 | 5 | – | – | – | 1,099 | |||||||||||||||||||||||||||||||||||
Other operating income | 83 | 32 | 12 | – | 236 | (224 | ) | 139 | ||||||||||||||||||||||||||||||||||
Total operating income | 5,207 | 1,699 | 1,033 | 44 | 245 | (224 | ) | 8,004 | ||||||||||||||||||||||||||||||||||
Net insurance claims45 | (1,129 | ) | (279 | ) | (4 | ) | – | – | – | (1,412 | ) | |||||||||||||||||||||||||||||||
Net operating income1 | 4,078 | 1,420 | 1,029 | 44 | 245 | (224 | ) | 6,592 | ||||||||||||||||||||||||||||||||||
Loan impairment charges and other credit risk provisions | (1,092 | ) | (364 | ) | (39 | ) | – | – | – | (1,495 | ) | |||||||||||||||||||||||||||||||
Net operating income | 2,986 | 1,056 | 990 | 44 | 245 | (224 | ) | 5,097 | ||||||||||||||||||||||||||||||||||
Total operating expenses | (3,226 | ) | (890 | ) | (528 | ) | (41 | ) | (325 | ) | 224 | (4,786 | ) | |||||||||||||||||||||||||||||
Operating profit/(loss) | (240 | ) | 166 | 462 | 3 | (80 | ) | – | 311 | |||||||||||||||||||||||||||||||||
Share of loss in associates and joint ventures | – | (1 | ) | – | – | – | – | (1 | ) | |||||||||||||||||||||||||||||||||
Profit/(loss) before tax | (240 | ) | 165 | 462 | 3 | (80 | ) | – | 310 | |||||||||||||||||||||||||||||||||
| % | % | % | % | % | % | |||||||||||||||||||||||||||||||||||||
Share of HSBC’s profit before tax | (1.3 | ) | 0.9 | 2.4 | – | (0.3 | ) | 1.7 | ||||||||||||||||||||||||||||||||||
Cost efficiency ratio | 79.1 | 62.7 | 51.3 | 93.2 | 132.7 | 72.6 | ||||||||||||||||||||||||||||||||||||
Balance sheet data22,30 | ||||||||||||||||||||||||||||||||||||||||||
| $m | $m | $m | $m | $m | $m | |||||||||||||||||||||||||||||||||||||
Loans and advances to customers (net) | 5,935 | 6,719 | 4,592 | 47 | – | 17,293 | ||||||||||||||||||||||||||||||||||||
Total assets | 25,378 | 20,792 | 36,953 | 1,769 | 2,838 | (1,468 | ) | 86,262 | ||||||||||||||||||||||||||||||||||
Customer accounts | 12,042 | 5,904 | 3,422 | 102 | – | 21,470 | ||||||||||||||||||||||||||||||||||||
HSBC HOLDINGS PLC
94
Table of Contents
| 2014 | ||||||||||||||||||||||||||||||||||||||||||
|
| Retail Banking and Wealth Managemen $m |
t28
|
| Commercial Banking $m | 28
|
| Global Banking and Markets $m |
| | Global Private | |
| Other $m |
|
| Inter- segment elimination $m |
44
| | Total $m | | ||||||||||||||||||||||
Profit/(loss) before tax | ||||||||||||||||||||||||||||||||||||||||||
Net interest income | 3,671 | 1,181 | 490 | 19 | 9 | (60 | ) | 5,310 | ||||||||||||||||||||||||||||||||||
Net fee income | 939 | 301 | 147 | 28 | – | – | 1,415 | |||||||||||||||||||||||||||||||||||
Trading income/(expense) excluding net interest income | 125 | 101 | 391 | 3 | (1 | ) | – | 619 | ||||||||||||||||||||||||||||||||||
Net interest income/(expense) on trading activities | 1 | 4 | 174 | – | (2 | ) | 60 | 237 | ||||||||||||||||||||||||||||||||||
Net trading income/(expense)40 | 126 | 105 | 565 | 3 | (3 | ) | 60 | 856 | ||||||||||||||||||||||||||||||||||
Changes in fair value of long-term debt issued and related derivatives | – | – | – | – | – | – | – | |||||||||||||||||||||||||||||||||||
Net income from other financial instruments designated at fair value | 525 | 166 | – | – | – | – | 691 | |||||||||||||||||||||||||||||||||||
Net income from financial instruments designated at fair value | 525 | 166 | – | – | – | – | 691 | |||||||||||||||||||||||||||||||||||
Gains less losses from financial investments | – | – | 84 | – | – | – | 84 | |||||||||||||||||||||||||||||||||||
Dividend income | 6 | 2 | 1 | – | – | – | 9 | |||||||||||||||||||||||||||||||||||
Net insurance premium income | 1,272 | 246 | 5 | – | – | – | 1,523 | |||||||||||||||||||||||||||||||||||
Other operating income | 61 | 40 | 19 | – | 213 | (184 | ) | 149 | ||||||||||||||||||||||||||||||||||
Total operating income | 6,600 | 2,041 | 1,311 | 50 | 219 | (184 | ) | 10,037 | ||||||||||||||||||||||||||||||||||
Net insurance claims45 | (1,428 | ) | (334 | ) | (3 | ) | – | – | – | (1,765 | ) | |||||||||||||||||||||||||||||||
Net operating income1 | 5,172 | 1,707 | 1,308 | 50 | 219 | (184 | ) | 8,272 | ||||||||||||||||||||||||||||||||||
Loan impairment charges and other credit risk provisions | (1,208 | ) | (659 | ) | (252 | ) | (5 | ) | – | – | (2,124 | ) | ||||||||||||||||||||||||||||||
Net operating income | 3,964 | 1,048 | 1,056 | 45 | 219 | (184 | ) | 6,148 | ||||||||||||||||||||||||||||||||||
Total operating expenses | (4,124 | ) | (1,041 | ) | (606 | ) | (49 | ) | (296 | ) | 184 | (5,932 | ) | |||||||||||||||||||||||||||||
Operating profit/(loss) | (160 | ) | 7 | 450 | (4 | ) | (77 | ) | – | 216 | ||||||||||||||||||||||||||||||||
Share of profit in associates and joint ventures | – | – | – | – | – | – | – | |||||||||||||||||||||||||||||||||||
Profit/(loss) before tax | (160 | ) | 7 | 450 | (4 | ) | (77 | ) | – | 216 | ||||||||||||||||||||||||||||||||
| % | % | % | % | % | % | |||||||||||||||||||||||||||||||||||||
Share of HSBC’s profit before tax | (0.8 | ) | – | 2.4 | – | (0.5 | ) | 1.1 | ||||||||||||||||||||||||||||||||||
Cost efficiency ratio | 79.7 | 61.0 | 46.3 | 98.0 | 135.2 | 71.7 | ||||||||||||||||||||||||||||||||||||
Balance sheet data30 | ||||||||||||||||||||||||||||||||||||||||||
| $m | $m | $m | $m | $m | $m | |||||||||||||||||||||||||||||||||||||
Loans and advances to customers (net) | 13,266 | 19,118 | 10,642 | 96 | – | 43,122 | ||||||||||||||||||||||||||||||||||||
Total assets | 30,855 | 28,070 | 55,827 | 298 | 1,155 | (851 | ) | 115,354 | ||||||||||||||||||||||||||||||||||
Customer accounts | 25,392 | 12,789 | 8,219 | 2,188 | – | 48,588 | ||||||||||||||||||||||||||||||||||||
For footnotes, see page 99.
HSBC HOLDINGS PLC
95
Table of Contents
Report of the Directors: Financial Review(continued)
Profit/(loss) before tax and balance sheet data – Latin America (continued)
| 2013 | ||||||||||||||||||||||||||||||||||||||||||
| | Retail Banking and Wealth | |
| Commercial Banking $m |
|
| Global Banking and Markets $m |
| | Global Private | |
| Other $m |
|
| Inter- segment elimination $m | 44
| | Total $m | | ||||||||||||||||||||||
Profit/(loss) before tax | ||||||||||||||||||||||||||||||||||||||||||
Net interest income/(expense) | 4,245 | 1,359 | 775 | 24 | (12 | ) | (205 | ) | 6,186 | |||||||||||||||||||||||||||||||||
Net fee income | 1,142 | 358 | 168 | 32 | 1 | – | 1,701 | |||||||||||||||||||||||||||||||||||
Trading income/(expense) excluding net interest income | 144 | 111 | 456 | 4 | (4 | ) | – | 711 | ||||||||||||||||||||||||||||||||||
Net interest income/(expense) on trading activities | (1 | ) | 1 | 20 | – | – | 205 | 225 | ||||||||||||||||||||||||||||||||||
Net trading income/(expense)40 | 143 | 112 | 476 | 4 | (4 | ) | 205 | 936 | ||||||||||||||||||||||||||||||||||
Changes in fair value of long-term debt issued and related derivatives | – | – | – | – | – | – | – | |||||||||||||||||||||||||||||||||||
Net income from other financial instruments designated at fair value | 269 | 56 | 1 | – | – | – | 326 | |||||||||||||||||||||||||||||||||||
Net income from financial instruments designated at fair value | 269 | 56 | 1 | – | – | – | 326 | |||||||||||||||||||||||||||||||||||
Gains less losses from financial investments | – | 1 | 81 | – | – | – | 82 | |||||||||||||||||||||||||||||||||||
Dividend income | 6 | 2 | 1 | – | – | – | 9 | |||||||||||||||||||||||||||||||||||
Net insurance premium income | 1,519 | 305 | 6 | – | – | – | 1,830 | |||||||||||||||||||||||||||||||||||
Other operating income | 322 | 475 | 310 | 1 | 196 | (189 | ) | 1,115 | ||||||||||||||||||||||||||||||||||
Total operating income | 7,646 | 2,668 | 1,818 | 61 | 181 | (189 | ) | 12,185 | ||||||||||||||||||||||||||||||||||
Net insurance claims45 | (1,345 | ) | (269 | ) | (3 | ) | – | – | – | (1,617 | ) | |||||||||||||||||||||||||||||||
Net operating income1 | 6,301 | 2,399 | 1,815 | 61 | 181 | (189 | ) | 10,568 | ||||||||||||||||||||||||||||||||||
Loan impairment charges and other credit risk provisions | (1,835 | ) | (779 | ) | (52 | ) | – | – | – | (2,666 | ) | |||||||||||||||||||||||||||||||
Net operating income | 4,466 | 1,620 | 1,763 | 61 | 181 | (189 | ) | 7,902 | ||||||||||||||||||||||||||||||||||
Total operating expenses | (4,136 | ) | (1,060 | ) | (596 | ) | (60 | ) | (267 | ) | 189 | (5,930 | ) | |||||||||||||||||||||||||||||
Operating profit/(loss) | 330 | 560 | 1,167 | 1 | (86 | ) | – | 1,972 | ||||||||||||||||||||||||||||||||||
Share of profit in associates and joint ventures | – | – | – | – | – | – | – | |||||||||||||||||||||||||||||||||||
Profit/(loss) before tax | 330 | 560 | 1,167 | 1 | (86 | ) | – | 1,972 | ||||||||||||||||||||||||||||||||||
| % | % | % | % | % | % | |||||||||||||||||||||||||||||||||||||
Share of HSBC’s profit before tax | 1.4 | 2.5 | 5.2 | – | (0.4 | ) | 8.7 | |||||||||||||||||||||||||||||||||||
Cost efficiency ratio | 65.6 | 44.2 | 32.8 | 98.4 | 147.5 | 56.1 | ||||||||||||||||||||||||||||||||||||
Balance sheet data30 | ||||||||||||||||||||||||||||||||||||||||||
| $m | $m | $m | $m | $m | $m | |||||||||||||||||||||||||||||||||||||
Loans and advances to customers (net) | 14,993 | 18,546 | 10,304 | 75 | – | 43,918 | ||||||||||||||||||||||||||||||||||||
Total assets | 32,217 | 28,368 | 52,977 | 337 | 634 | (534 | ) | 113,999 | ||||||||||||||||||||||||||||||||||
Customer account | 27,089 | 13,447 | 8,994 | 1,859 | – | 51,389 | ||||||||||||||||||||||||||||||||||||
For footnotes, see page 99.
HSBC HOLDINGS PLC
95a
Table of Contents
Report of the Directors: Other information
FuM / Disclosure philosophy / Taxes paid / Conduct-related matters
| Other information | ||||
Funds under management and assets held in custody
|
| 96
|
| |
|
| 96
|
| |
Taxes paid by region and country
|
| 97
|
| |
|
| 97
|
| |
|
| 98
|
| |
|
| 98
|
| |
|
| 98a
|
| |
Management’s assessment of internal controls over financial reporting
|
| 98a
|
| |
Change in registrant’s certifying accountant
|
| 98a
|
| |
Funds under management
and assets held in custody
Funds under management48
| 2015 | 2014 | |||||||||||
| $bn | $bn | |||||||||||
Funds under management | ||||||||||||
At 1 January | 954 | 921 | ||||||||||
Net new money | (3 | ) | 38 | |||||||||
Value change | 2 | 40 | ||||||||||
Exchange and other | (57 | ) | (45 | ) | ||||||||
At 31 December | 896 | 954 | ||||||||||
Funds under management by business | ||||||||||||
Global Asset Management | 419 | 445 | ||||||||||
Global Private Banking | 261 | 275 | ||||||||||
Affiliates | 4 | 5 | ||||||||||
Other | 212 | 229 | ||||||||||
At 31 December | 896 | 954 | ||||||||||
For footnote, see page 99.
Funds under management (‘FuM’) represents assets managed, either actively or passively, on behalf of our customers. At 31 December 2015, FuM amounted to $896bn, a decrease of 6% primarily due to adverse foreign exchange movements as the US dollar strengthened against all major currencies. Excluding currency translation, FuM was broadly unchanged compared with 31 December 2014 as a reduction in GPB and other FuM was broadly offset by an increase in Global Asset Management FuM.
Global Asset Management FuM decreased by 6% to $419bn compared with 31 December 2014. Excluding currency translation, FuM increased by 2% as we attracted $8bn of net new money, notably in fixed income products from our customers in Asia and net inflows into liquidity funds in North America and Europe.
GPB FuM decreased by 5% to $261bn compared with 31 December 2014. Excluding currency translation, FuM decreased by 1%, reflecting the ongoing repositioning of our client base. This was partly offset by favourable market movements, principally in Europe, and from positive net new money in areas targeted for growth.
Other FuM, of which the main element is a corporate trust business in Asia, decreased by 7% to $212bn, primarily due to net outflows.
Assets held in custody48 and under administration
Custody is the safekeeping and servicing of securities and other financial assets on behalf of clients. At 31 December 2015, we held assets as custodian of $6.2 trillion, 3% lower than the $6.4 trillion held at 31 December 2014. This decrease was driven by adverse foreign exchange movements, primarily in Europe and Asia. Excluding this, assets held as custodian increased by 2% compared with 31 December 2014, due to incremental net asset inflows in Asia and Europe, partly offset by adverse market movements, particularly in the second half of 2015.
Our Assets Under Administration business, which includes the provision of bond and loan administration services and the valuation of portfolios of securities and other financial assets on behalf of clients, complements the Custody business. At 31 December 2015, the value of assets held under administration by the Group amounted to $3.2 trillion. This was broadly unchanged compared with 31 December 2014, which included adverse foreign exchange movements, primarily in Europe. Excluding the impact of currency translation, assets held under administration increased by 4% driven by net asset inflows in Europe and Asia.
HSBC strives to maintain the highest standards of disclosure in our reporting.
It has long been our policy to provide disclosures that help investors and other stakeholders understand the Group’s performance, financial position and changes thereto.
In accordance with this policy, the information provided in the ‘Notes on the Financial Statements’ and the ‘Report of the Directors’ goes beyond the minimum levels required by accounting standards, statutory and regulatory requirements and listing rules. In particular, we provide additional disclosures having regard to the recommendations of two Enhanced Disclosures Task Force reports.Enhancing the Risk Disclosures of Banks, issued in October 2012, aims to help financial institutions identify areas that investors had highlighted as needing better and more transparent information about banks’ risks, and how these risks relate to performance measurement and reporting. We have complied with all 32 recommendations in this report and in our Pillar 3 Disclosures 2015 document. The ‘Risk’, ‘Capital’ and ‘Corporate Governance’ sections of this report and the financial statements are accompanied by detailed tables of contents to assist the reader to navigate through the disclosures.Impact of Expected Credit Loss Approaches on Bank Risk Disclosures,issued in December 2015, provides further guidance on the application of the existing recommendations in the context of an Expected Credit Loss (‘ECL’) framework which we have considered in developing the commentary under ‘Future accounting developments’ on page 347. In addition, we continue to enhance our disclosures in line with good practice recommendations issued by relevant regulators and standard setters and in response to feedback received from users of our financial statements.
HSBC HOLDINGS PLC
96 |
Table of Contents
Taxes paid by region and country
The following tables reflect a geographical view of HSBC’s operations.
Breakdown of tax paid by region49
| 2015 | 2014 | |||||||||||
| $bn | $bn | |||||||||||
Region | ||||||||||||
UK | 2.5 | 2.4 | ||||||||||
Rest of Europe | 1.1 | 1.2 | ||||||||||
Asia | 2.8 | 2.7 | ||||||||||
Middle East and North Africa | 0.4 | 0.3 | ||||||||||
North America | 0.4 | (0.1 | ) | |||||||||
Latin America | 1.2 | 1.4 | ||||||||||
Total | 8.4 | 7.9 | ||||||||||
For footnote, see page 99.
Taxes paid by country49
| 2015 | 2014 | 2013 | ||||||||||||||||
| $m | $m | $m | ||||||||||||||||
Asia | 2,780 | 2,687 | 2,536 | |||||||||||||||
Home and priority markets | 2,445 | 2,399 | 2,185 | |||||||||||||||
– Hong Kong | 1,415 | 1,273 | 1,248 | |||||||||||||||
– Mainland China | 277 | 278 | 207 | |||||||||||||||
– India | 285 | 290 | 318 | |||||||||||||||
– Australia | 173 | 204 | 105 | |||||||||||||||
– Malaysia | 92 | 133 | 106 | |||||||||||||||
– Indonesia | 70 | 76 | 74 | |||||||||||||||
– Singapore | 80 | 101 | 88 | |||||||||||||||
– Taiwan | 53 | 44 | 39 | |||||||||||||||
Other markets | 335 | 288 | 351 | |||||||||||||||
Europe | 3,660 | 3,625 | 3,500 | |||||||||||||||
Home and priority markets | 3,346 | 3,391 | 3,244 | |||||||||||||||
– UK | 2,526 | 2,363 | 2,107 | |||||||||||||||
– France | 620 | 790 | 844 | |||||||||||||||
– Germany | 108 | 131 | 151 | |||||||||||||||
– Switzerland | 92 | 107 | 142 | |||||||||||||||
Turkey | 16 | 75 | 82 | |||||||||||||||
Other markets | 298 | 159 | 174 | |||||||||||||||
Middle East and North Africa | 433 | 294 | 321 | |||||||||||||||
Priority markets | 407 | 246 | 283 | |||||||||||||||
– Saudi Arabia | 151 | 84 | 70 | |||||||||||||||
– UAE | 120 | 102 | 98 | |||||||||||||||
– Egypt | 136 | 60 | 115 | |||||||||||||||
Other markets | 26 | 48 | 38 | |||||||||||||||
North America | 353 | (108 | ) | 414 | ||||||||||||||
Priority markets | 353 | (108 | ) | 410 | ||||||||||||||
– US | 127 | (377 | ) | 125 | ||||||||||||||
– Canada | 226 | 269 | 285 | |||||||||||||||
Other markets | – | – | 4 | |||||||||||||||
Latin America | 1,184 | 1,384 | 1,836 | |||||||||||||||
Priority markets | 431 | 534 | 643 | |||||||||||||||
– Argentina | 340 | 333 | 318 | |||||||||||||||
– Mexico | 91 | 201 | 325 | |||||||||||||||
Brazil | 735 | 804 | 1,002 | |||||||||||||||
Other markets | 18 | 46 | 191 | |||||||||||||||
Total | 8,410 | 7,882 | 8,607 | |||||||||||||||
For footnote, see page 99.
Conduct-related costs included in significant items
| 2015 | 2014 | 2013 | ||||||||||||||||
| $m | $m | $m | ||||||||||||||||
Income statement | ||||||||||||||||||
Net interest income | 10 | 632 | – | |||||||||||||||
Provisions arising from the ongoing review of compliance with the Consumer Credit Act in the UK | 10 | 632 | – | |||||||||||||||
Operating expenses | 2,362 | 3,077 | 1,687 | |||||||||||||||
Comprising: | ||||||||||||||||||
Legal proceedings and regulatory matters | 1,821 | 1,802 | 352 | |||||||||||||||
– charge in relation to the settlement agreement with the Federal Housing Finance Authority | – | 550 | – | |||||||||||||||
– regulatory provisions in GPB | 172 | 65 | 352 | |||||||||||||||
– settlements and provisions in connection with legal matters | 1,649 | 1,187 | – | |||||||||||||||
Customer remediation | 541 | 1,275 | 1,335 | |||||||||||||||
– UK customer redress programmes | 541 | 1,275 | 1,235 | |||||||||||||||
– US customer remediation provisions relating to Card and Retail Services | – | – | 100 | |||||||||||||||
Total charge for the year relating to significant items | 2,372 | 3,709 | 1,687 | |||||||||||||||
Of which: | ||||||||||||||||||
Total provisions charge for the year | 2,362 | 2,500 | 1,687 | |||||||||||||||
Total provisions utilised during the year | 1,021 | 2,503 | 1,238 | |||||||||||||||
Balance sheet at 31 December | ||||||||||||||||||
Total provisions | 3,926 | 2,545 | 2,793 | |||||||||||||||
– legal proceedings and regulatory matters | 2,729 | 1,154 | 657 | |||||||||||||||
– customer remediation | 1,197 | 1,391 | 2,136 | |||||||||||||||
Accruals, deferred income and other liabilities | 168 | 379 | – | |||||||||||||||
The table above provides a summary of conduct-related costs incurred and included within significant items (see pages 66 and 77).
HSBC defines ‘conduct’ as ensuring that we deliver fair outcomes for our customers and that we do not disrupt the orderly and transparent operation of financial markets. The Board places a strong emphasis on conduct, requiring adherence to high behavioural standards and doing the right thing. This includes ensuring that the lessons of unexpected outcomes, mistakes and control failings are both acknowledged and responded to in a timely and effective manner.
Board oversight of conduct matters is provided by the Conduct & Values Committee, which oversees the promotion and embedding of HSBC Values and our required global conduct outcomes, and the Remuneration Committee, which
HSBC HOLDINGS PLC
97 |
Table of Contents
Report of the Directors: Other information(continued)
Carbon dioxide emissions / Property / Footnotes
considers conduct and compliance-related matters relevant to remuneration. The reports of these committees may be found on pages 270 to 273.
An overview of our conduct framework is set out in page 41. The management of conduct of business and the steps taken to raise standards and deal with historical incidents are described on page 178.
‘Regulatory focus on conduct of business and financial crime’ is one of the Group’s top and emerging risks which is discussed on page 112.
Total conduct-related costs within significant items were $2.4bn, a decrease of $1.3bn compared with 2014. Provisions raised in 2015 resulted from the on-going consequences of a small number of significant historical events.
Operating expenses included significant items related to conduct matters of $2.4bn, including $1.8bn in respect of legal proceedings and regulatory matters, of which $0.2bn related to regulatory matters in our private banking operations and $1.6bn was in respect of settlements and provisions in connection with legal matters. These are discussed in Note 40 on the Financial Statements.
Customer remediation costs charged to operating expenses included $0.5bn in respect of the mis-selling of payment protection insurance (‘PPI’). Cumulative PPI provisions made since the Judicial Review ruling in the first half of 2011 totalled $4.7bn, of which $3.6bn had been paid as at 31 December 2015 (see Note 29 on the Financial Statements).
HSBC’s carbon dioxide emissions are calculated on the basis of the energy used in our buildings and employee business travel from over 28 countries (covering about 91% of our operations by FTE).
The data, gathered on energy consumption and distance travelled, are converted to carbon dioxide emissions using conversion factors from the following sources, if available, in order of preference:
| 1. | electricity attribute certificates or equivalent instruments; |
| 2. | contracts for electricity, such as Power Purchase Agreements; |
| 3. | supplier/utility emission rates; |
| 4. | residual mix (sub-national or national); |
| 5. | other grid-average emission factors (sub-national or national); and |
| 6. | for other types of energy than electricity and travel, if no specific factors can be obtained, we use the latest available factors provided by the UK Department for Environment, Food and Rural Affairs and/or the Department of Energy and Climate Change in the UK. |
This is the market-based methodology recommended by the revised guidelines of the Greenhouse Gas Protocol for 2015 disclosure onwards.
To incorporate all of the operations over which we have financial (management) control, the calculated carbon dioxide emissions are scaled up on the basis of the FTE coverage rate to account for any missing data (typically less than 10% of FTEs). In addition, emission uplift rates are applied to allow for uncertainty on the quality and coverage of emission measurement and estimation. The rates are 4% for electricity, 10% for other energy and 6% for business travel, based on theIntergovernmental Panel on Climate Change Good Practice GuidanceandUncertainty Management in National Greenhouse Gas Inventories, and our internal analysis of data coverage and quality.
Carbon dioxide emissions in tonnes
| 2015 | 2014 | 50 | ||||||||||
Total | 771,000 | 795,000 | ||||||||||
From energy | 662,000 | 676,000 | ||||||||||
From travel | 109,000 | 119,000 | ||||||||||
Carbon dioxide emissions in tonnes per FTE
| 2015 | 2014 | 50 | ||||||||||
Total | 2.97 | 3.08 | ||||||||||
From energy | 2.54 | 2.62 | ||||||||||
From travel | 0.42 | 0.46 | ||||||||||
For footnote, see page 99.
Our greenhouse gas reporting year runs from October to September. For the year from 1 October 2014 to 30 September 2015, carbon dioxide emissions from our global operations were 771,000 tonnes.
Independent assurance of our carbon dioxide emissions will be available in the first half of 2016 on our website.
At 31 December 2015, we operated from some 6,860 operational properties worldwide.
Approximately 1,840 were located in Europe, 1,760 in Asia, 430 in North America, 2,590 in Latin America and 240 in Middle East and North Africa. These properties had an area of approximately 51.9m square feet (2014: 54.3m square feet).
Our freehold and long leasehold properties, together with all our leasehold land in Hong Kong, were valued in 2015. The value of these properties was $11.3bn (2014: $10.8bn) in excess of their carrying amount in the consolidated balance sheet on an historical cost based measure. In addition, properties with a net book value of $1.4bn (2014: $1.6bn) were held for investment purposes.
Our operational properties are stated at cost, being historical cost or fair value at the date of transition to IFRSs (their deemed cost) less any impairment losses, and are depreciated on a basis calculated to write off the assets over their estimated useful lives. Properties owned as a consequence of an acquisition are recognised initially at fair value.
HSBC HOLDINGS PLC
98 |
Table of Contents
Report of the Directors: Financial Review(continued)
The Group Chief Executive and Group Finance Director, with the assistance of other members of management, carried out an evaluation of the effectiveness of the design and operation of HSBC Holdings’ disclosure controls and procedures as at 31 December 2015. Based upon that evaluation, the Group Chief Executive and Group Finance Director concluded that our disclosure controls and procedures as at 31 December 2015 were effective to provide reasonable assurance that information required to be disclosed in the reports which the company files and submits under the US Securities Exchange Act of 1934, as amended, is recorded, processed, summarised and reported as and when required. There are inherent limitations to the effectiveness of any system of disclosure controls and procedures, including the possibility of human error and the circumvention or overriding of the controls and procedures. Accordingly, even effective disclosure controls and procedures can only provide reasonable assurance of achieving their control objectives.
During the year it was determined that the control environment associated with IT privileged access required significant improvement. Deficiencies were noted in the design and operation of controls for the granting, release and monitoring of privileged access in a number of systems. For the identified deficiencies, management responded by implementing a programme to determine the scale and nature of the deficiencies, remediate identified control deficiencies and determine if privileged access had been misused during 2015. Management also identified and assessed the effectiveness of relevant IT, business, monitoring and period-end mitigating controls. Please see ‘Effectiveness of Internal Controls’ on page 277.
There have been no changes in HSBC Holdings’ internal control over financial reporting during the year ended 31 December 2015, that have materially affected, or are reasonably likely to materially affect, HSBC Holdings’ internal control over financial reporting.
Management’s assessment of internal controls over financial reporting
Management is responsible for establishing and maintaining an adequate internal control structure and procedures for financial reporting, and has completed an assessment of the effectiveness of the Group’s internal controls over financial reporting for the year ended 31 December 2015. In making the assessment, management used the framework for internal control evaluation contained in the Financial Reporting Council’s Guidance on Risk Management, Internal Control and Related Financial and Business Reporting (September 2014), as well as the criteria established by the Committee of Sponsoring Organisations of the Treadway Commission (‘COSO’) in ‘Internal Control-Integrated Framework (2013)’.
Based on the assessment performed, management concluded that for the year ended 31 December 2015, the Group’s internal controls over financial reporting were effective.
PricewaterhouseCoopers LLP, which has audited the consolidated financial statements of the Group for the year ended 31 December 2015, has also audited the effectiveness of the Group’s internal control over financial reporting under Auditing Standard No. 5 of the Public Company Accounting Oversight Board (United States) as stated in their report on pages 323 and 335.
Change in registrant’s certifying accountant
In line with corporate governance practices and regulatory changes in Europe and elsewhere, in 2013 we conducted a tender process for HSBC Holdings plc and its subsidiaries’ (the ‘Group’) statutory audit contract. Following the tender in 2015 the engagement of KPMG Audit Plc (‘KPMG’), HSBC’s previous auditor, was not renewed, and PricewaterhouseCoopers LLP (‘PwC’) became the Group’s statutory auditor for the financial year ended 31 December 2015. This decision was taken by the Board of Directors on the recommendation of the Group Audit Committee, itself advised by a selection panel chaired by the Group Finance Director and including, among others, two members of the Group Audit Committee. The appointment of PwC was approved by the shareholders at the 2015 Annual General Meeting of the Company. KPMG resigned as the Group’s auditor effective 31 March 2015, and PwC was formally engaged on 31 March 2015.
During the two years prior to 31 December 2014, (i) KPMG did not issue any reports on the financial statements of the Group or on the effectiveness of internal control over financial reporting that contained an adverse opinion or a disclaimer of opinion, nor were the auditors’ reports of KPMG qualified or modified as to uncertainty, audit scope, or accounting principles, (ii) there was not any disagreement over any matter of accounting principles or practices, financial statement disclosure, or auditing scope or procedures, which disagreements if not resolved to KPMG’s satisfaction, would have caused it to make reference to the subject matter of the disagreement in connection with its auditors’ reports, or any ‘reportable event’ as described in Item 16F(a)(1)(v) of Form 20-F.
Further, in the two years prior to 31 December 2014 we did not consult with PwC regarding either (i) the application of accounting principles to a specified transaction, either completed or proposed, or the type of audit opinion that might be rendered with respect to the consolidated financial statements of the Group; or (ii) any matter that was the subject of a disagreement as that term is used in Item 16F(a)(1)(iv) of Form 20-F or a ‘reportable event’ as described in Item 16F(a)(1)(v) of Form 20-F.
HSBC HOLDINGS PLC
98a |
Table of Contents
Report of the Directors: Financial Review(continued)
HSBC has agreed to indemnify and hold KPMG harmless against and from any and all legal costs and expenses incurred by KPMG in successful defence of any legal action or proceeding that arises as a result of KPMG’s consent to the inclusion (or incorporation by reference) of its audit report on the Company’s past financial statements included (or incorporated by reference) herein or in any registration statement of HSBC Holdings on Form F-3 or Form S-8.
HSBC HOLDINGS PLC
98b |
Table of Contents
Footnotes to pages 48 to 98
Use of non-GAAP financial measures
| 1 | Net operating income before loan impairment charges and other credit risk provisions, also referred to as revenue. |
| 2 | ‘Own credit spread’ includes the fair value movements on our long-term debt attributable to credit spread where the net result of such movements will be zero upon maturity of the debt. This does not include fair value changes due to own credit risk in respect of trading liabilities or derivative liabilities. |
Consolidated income statement/Group performance by income and expense item
| 3 | Dividends recorded in the financial statements are dividends per ordinary share declared in a year and are not dividends in respect of, or for, that year. |
| 4 | Dividends per ordinary share expressed as a percentage of basic earnings per share. |
| 5 | Net interest income includes the cost of internally funding trading assets, while the related external revenues are reported in ‘Trading income’. In our global business results, the cost of funding trading assets is included with Global Banking and Market’s net trading income as interest expense. |
| 6 | Gross interest yield is the average annualised interest rate earned on average interest-earning assets (‘AIEA’). |
| 7 | Net interest spread is the difference between the average annualised interest rate earned on AIEA, net of amortised premiums and loan fees, and the average annualised interest rate paid on average interest-bearing funds. |
| 8 | Net interest margin is net interest income expressed as an annualised percentage of AIEA. |
| 9 | Interest income on trading assets is reported as ‘Net trading income’ in the consolidated income statement. |
| 10 | Interest income on financial assets designated at fair value is reported as ‘Net income from financial instruments designated at fair value’ in the consolidated income statement. |
| 11 | Including interest-bearing bank deposits only. |
| 12 | Interest expense on financial liabilities designated at fair value is reported as ‘Net income on financial instruments designated at fair value’ in the consolidated income statement, other than interest on own debt which is reported in ‘Interest expense’. |
| 13 | Including interest-bearing customer accounts only. |
| 14 | Trading income also includes movements on non-qualifying hedges. These hedges are derivatives entered into as part of a documented interest rate management strategy for which hedge accounting was not, nor could be, applied. They are principally cross-currency and interest rate swaps used to economically hedge fixed rate debt issued by HSBC Holdings and floating rate debt issued by HSBC Finance. The size and direction of the changes in the fair value of non-qualifying hedges that are recognised in the income statement can be volatile from year-to-year, but do not alter the cash flows expected as part of the documented interest rate management strategy for both the instruments and the underlying economically hedged assets and liabilities if the derivative is held to maturity. |
| 15 | Net insurance claims and benefits paid and movement in liabilities to policyholders arise from both life and non-life insurance business. For non-life business, amounts reported represent the cost of claims paid during the year and the estimated cost of incurred claims. For life business, the main element of claims is the liability to policyholders created on the initial underwriting of the policy and any subsequent movement in the liability that arises, primarily from the attribution of investment performance to savings-related policies. Consequently, claims rise in line with increases in sales of savings-related business and with investment market growth. |
| 16 | The cost efficiency ratio is defined as total operating expenses divided by net operating income before loan impairment charges and other credit risk provisions. |
Consolidated balance sheet
| 17 | Net of impairment allowances. |
| 18 | On 1 January 2014, CRD IV came into force and the calculation of capital resources and risk-weighted assets for 2014 and 2015 are calculated and presented on this basis. 2011 to 2013 comparatives are on a Basel 2.5 basis. |
| 19 | Capital resources are total regulatory capital, the calculation of which is set out on page 234. |
| 20 | Including perpetual preferred securities, details of which can be found in Note 30 on the Financial Statements. |
| 21 | The definition of net asset value per ordinary share is total shareholders’ equity, less non-cumulative preference shares and capital securities, divided by the number of ordinary shares in issue excluding shares the company has purchased and are held in treasury. |
| 22 | In the first half of 2015 our operations in Brazil were classified as held for sale. As a result, balance sheet accounts have been classified to ‘Assets held for sale’ and ‘Liabilities of disposal groups held for sale’. There is no separate income statement classification. |
| 23 | France primarily comprises the domestic operations of HSBC Finance, HSBC Assurances Vie and the Paris branch of HSBC Bank plc. |
Reconciliation of RoRWA measures
| 24 | Pre-tax return on average risk-weighted assets (‘RoRWA’) is calculated using pre-tax return and reported average RWAs. Adjusted RoRWA is calculated using adjusted pre-tax return and adjusted average RWAs. |
| 25 | Reported average risk-weighted assets (‘average RWAs’) are calculated using an average of RWAs at quarter-ends on a Basel 2.5 basis for 31 December 2013 and a CRD IV end point basis from all periods from 1 January 2014. Adjusted average RWAs are calculated using reported average RWAs adjusted for the effects of currency translation differences and significant items. |
| 26 | ‘Other’ includes treasury services related to the US Consumer and Mortgage Lending business and commercial operations in run-off. US CML includes loan portfolios within the run-off business that are designated held for sale. |
| 27 | ‘Currency translation adjustment’ is the effect of translating the assets and liabilities of subsidiaries and associates for the previous year-end at the rates of exchange applicable at the current year-end. |
Global businesses and geographical regions
| 28 | In the first half of 2015, a portfolio of customers was transferred from CMB to RBWM in Latin America in order to better align the combined banking needs of the customers with our established global businesses. Comparative data have been re-presented accordingly. |
| 29 | The main items reported under ‘Other’ are the results of HSBC’s holding company and financing operations, which includes net interest earned on free capital held centrally, operating costs incurred by the head office operations in providing stewardship and central management services to HSBC, along with the costs incurred by the Group Service Centres and Shared Service Organisations and associated recoveries. The results also include fines and penalties as part of the settlement of investigations into past inadequate compliance with anti-money laundering and sanctions laws, the UK bank levy together with unallocated investment activities, centrally held investment companies, gains arising from the dilution of interests in associates and joint ventures and certain property transactions. In addition, ‘Other’ also includes part of the movement in the fair value of long-term debt designated at fair value (the remainder of the Group’s movement on own debt is included in GB&M). |
HSBC HOLDINGS PLC
99 |
Table of Contents
Report of the Directors: Other information / Risk
Footnotes / Managing risk
| 30 | Assets by geographical region and global businesses include intra-HSBC items. These items are eliminated, where appropriate, under the heading ‘Intra-HSBC items’ or ‘Inter-segment elimination’, as appropriate. |
| 31 | Amounts are non-additive across geographical regions and global businesses due to inter-company transactions within the Group. |
| 32 | Excludes items where there are substantial offsets in the income statement for the same year. |
| 33 | Other income in this context comprises where applicable net trading income, net income/(expense) from other financial instruments designated at fair value, gains less losses from financial investments, dividend income, net insurance premium income and other operating income less net insurance claims and benefits paid and movement in liabilities to policyholders. |
| 34 | Loan impairment charges and other credit risk provisions. |
| 35 | Share of profit in associates and joint ventures. |
| 36 | ‘Investment distribution’ includes Investments, which comprises mutual funds (HSBC manufactured and third party), structured products and securities trading, and Wealth Insurance distribution, consisting of HSBC manufactured and third-party life, pension and investment insurance products. |
| 37 | ‘Other personal lending’ includes personal non-residential closed-end loans and personal overdrafts. |
| 38 | ‘Other’ mainly includes the distribution and manufacturing (where applicable) of retail and credit protection insurance. |
| 39 | ‘Markets products, Insurance and Investments and Other’ includes revenue from Foreign Exchange, insurance manufacturing and distribution, interest rate management and GCF products. |
| 40 | Net interest income includes the cost of internally funding trading assets, while the related revenues are reported in net trading income. In our global business results, the total cost of funding trading assets is included within GB&M’s net trading income as an interest expense. In the statutory presentation, internal interest income and expense are eliminated. |
| 41 | In 2015, Markets included a favourable fair value movement of $202m on the widening of credit spreads on structured liabilities (2014: adverse fair value movement of $15m; 2013: adverse fair value movement of $66m). |
| 42 | ‘Other’ in GB&M includes net interest earned on free capital held in the global business not assigned to products, allocated funding costs and gains resulting from business disposals. Within the management view of total operating income, notional tax credits are allocated to the businesses to reflect the economic benefit generated by certain activities which is not reflected within operating income, for example notional credits on income earned from tax-exempt investments where the economic benefit of the activity is reflected in tax expense. In order to reflect the total operating income on an IFRSs basis, the offset to these tax credits are included within ‘Other’. |
| 43 | ‘Client assets’ are translated at the rates of exchange applicable for their respective period-ends, with the effects of currency translation reported separately. The main components of client assets were funds under management ($261bn at 31 December 2015) which were not reported on the Group’s balance sheet, and customer deposits ($88bn at 31 December 2015), of which $80bn was reported on the Group’s balance sheet and $8bn were off-balance sheet deposits. |
| 44 | Inter-segment elimination comprises (i) the costs of shared services and Group Service Centres included within ‘Other’ which are recovered from global businesses, and (ii) the intra-segment funding costs of trading activities undertaken within GB&M. HSBC’s Balance Sheet Management business, reported within GB&M, provides funding to the trading businesses. To report GB&M’s ‘Net trading income’ on a fully funded basis, ‘Net interest income’ and ‘Net interest income/(expense) on trading activities’ are grossed up to reflect internal funding transactions prior to their elimination in the inter-segment column. |
| 45 | Net insurance claims and benefits paid and movement in liabilities to policyholders. |
| 46 | ‘Employee expenses’ comprises costs directly incurred by each global business. The reallocation and recharging of employee and other expenses directly incurred in the ‘Other’ category is shown in ‘Other operating expenses’. |
| 47 | RWAs are non-additive across geographical regions due to market risk diversification effects within the Group. |
| 48 | Funds under management and assets held in custody are not reported on the Group’s balance sheet, except where it is deemed that we are acting as principal rather than agent in our role as investment manager, and these assets are consolidated as Structured entities (see Note 39 on the Financial Statements). |
| 49 | Taxes paid by HSBC relate to HSBC’s own tax liabilities including tax on profits earned, employer taxes, bank levy and other duties/levies such as stamp duty. Numbers are reported on a cash flow basis. |
| 50 | Following the release of the newGHG Protocol Scope 2 Guidance, we decided to use the state-specific eGRID emission factors for our US operations until such time as we obtain supplier-specific emission factors. For 2014, therefore, our reported total carbon dioxide emissions have increased by 43,000 tonnes and our carbon dioxide emissions per FTE have increased by 0.16 tonnes. |
HSBC HOLDINGS PLC
100 |
Table of Contents
Report of the Directors: Financial Review(continued)
2014 compared with 2013
| 51 | In 2013, we recorded a net gain on $553m on the completion of the Ping An disposal. This represented the net effect of $1,235m gain on derecognition of equity securities classified as available for sale and recorded in ‘Gains less losses from financial investments’, partly offset by $682m on a contingent forward sale contract, recorded in ‘Net trading income’. |
| 52 | The operating results of these disposals and acquisitions were not removed from adjusted results as they were not significant. |
| 53 | Excludes items where there are substantial offsets in the income statement for the same year. |
Average balance sheet
| 54 | Interest income on trading assets is reported as ‘Net trading income’ in the consolidated income statement. |
| 55 | Interest income on financial assets designated at fair value is reported as ‘Net income from financial instruments designated at fair value’ in the consolidated income statement. |
| 56 | This includes interest-bearing bank deposits only. See page 63i for an analysis of all bank deposits. |
| 57 | Interest expense on financial liabilities designated at fair value is reported as ‘Net income on financial instruments designated at fair value’ in the consolidated income statement, other than interest on own debt which is reported in ‘Interest Expense’. |
| 58 | This includes interest-bearing customer accounts only. See page 63m for an analysis of all customer accounts. |
| 59 | Net interest margin is calculated as net interest income divided by average interest earning assets. |
Ratio of earnings to fixed charges
| 60 | For the purpose of calculating the ratios, earnings consist of income from continuing operations before taxation and non-controlling interests, plus fixed charges, and after deduction of the unremitted pre-tax income of associated undertakings. Fixed charges consist of total interest expense, including or excluding interest on deposits, as appropriate, dividends on preference shares and other equity instruments, as applicable, and the proportion of rental expense deemed representative of the interest factor. |
HSBC HOLDINGS PLC
100a |
Table of Contents
Report of the Directors: Financial Review(continued)
| Regulation and supervision |
With listings of its ordinary shares in London, Hong Kong, New York, Paris and Bermuda, HSBC Holdings complies with the relevant requirements for listing and trading on each of these exchanges. In the UK, these are the Listing Rules of the Financial Conduct Authority (‘FCA’) in its role as the UK Listing Authority; in Hong Kong, The Rules Governing the Listing of Securities on The Stock Exchange of Hong Kong Limited (‘HKSE’); in the US, where the shares are traded in the form of ADS, HSBC Holdings’ shares are registered with the US Securities and Exchange Commission (‘SEC’). As a consequence of its US listing, HSBC Holdings is also subject to the reporting and other requirements of the US Securities Act of 1933, as amended, the Securities Exchange Act of 1934, as amended, and the New York Stock Exchange’s (‘NYSE’) Listed Company Manual, in each case as applied to foreign private issuers. In France and Bermuda, HSBC Holdings is subject to the listing rules of Euronext, Paris and the Bermuda Stock Exchange respectively, applicable to companies with secondary listings.
A statement of our compliance with the provisions of the UK Corporate Governance Code issued by the Financial Reporting Council and with the Hong Kong Corporate Governance Code set out in Appendix 14 to the Rules Governing the Listing of Securities on The Stock Exchange of Hong Kong Limited can be found in the ‘Report of the Directors: Corporate Governance Codes’ on page 256.
Our operations throughout the world are regulated and supervised by over 400 different central banks and other regulatory authorities in those jurisdictions in which we have offices, branches or subsidiaries. These authorities impose a variety of requirements and controls designed to provide financial stability, transparency in financial markets and a contribution to economic growth. The regulations include capital requirements, disclosure standards and restrictions on certain types of products or transaction structures, requirements on recovery and resolutions, market liquidity, governance standards and financial crime.
The Prudential Regulation Authority (‘PRA’) is the HSBC Group’s consolidated lead regulator. The other UK regulator, the FCA, supervises 11 HSBC regulated entities in the UK, including six where the PRA is responsible for prudential supervision. The FCA also supervises the Group globally in relation to financial crime matters. Additionally, both the PRA and FCA have certain limited direct supervisory powers over our unregulated qualifying parent company HSBC Holdings, including (in the FCA’s case) pursuant to the FCA Direction in connection with HSBC Holdings and HSBC North America Holdings, Inc. having entered into agreements as part of a global settlement with a number of US authorities in relation to the Group’s failure to comply with anti-money laundering (‘AML’) rules, US sanctions requirements and related matters. In addition, each operating bank, finance company or insurance operation within HSBC is regulated by local supervisors.
The Group’s primary regulatory authorities are those in the UK, Hong Kong and the US, our principal jurisdictions of operation. However, and in addition, with the implementation of the EU’s Single Supervisory Mechanism (‘SSM’) in 2014, the European Central Bank (‘ECB’) assumed direct supervisory responsibility for HSBC France and HSBC Malta as ‘significant supervised entities’ within the eurozone for the purposes of the EU’s SSM Regulation. Under the SSM, the ECB increasingly engages with the relevant ‘National Competent Authorities’ in relation to HSBC’s businesses in other eurozone countries and more widely with other HSBC regulators. It is therefore expected that we will continue to see changes in how the Group is regulated and supervised on a day-to-day basis in the eurozone and more generally as the ECB and other of our regulators develop their powers having regard to some of the regulatory initiatives highlighted in this report.
The UK financial services regulatory structure is comprised of three regulatory bodies: the Financial Policy Committee (‘FPC’), a committee of the Bank of England (‘BoE’), the PRA, a subsidiary of the BoE, and the FCA.
The FPC is responsible for macro-prudential supervision, focusing on systemic risk that may affect the UK’s financial stability. The PRA and the FCA are micro-prudential supervisors. The Group’s banking subsidiaries such as HSBC Bank plc (our principal authorised institution in the UK) are ‘dual-regulated’ firms, subject to prudential regulation by the PRA and to conduct regulation by the FCA. Other (generally smaller, non-bank) UK-based Group subsidiaries are ‘solo regulated’ by the FCA (i.e. the FCA is responsible for both prudential and conduct regulation of those subsidiaries). HSBC Group is subject to consolidated supervision by the PRA.
UK banking and financial services institutions are subject to multiple regulations. The primary UK statute in this context is the Financial Services and Markets Act 2000 (‘FSMA’), as amended by subsequent legislation. Other UK financial services legislation includes that derived from EU directives and regulations relating to banking, securities, insurance, investments and sales of personal financial services.
The PRA and FCA are together responsible for authorising and supervising all our operating businesses in the UK which require authorisation under FSMA. These include deposit-taking, retail banking, consumer credit, life and general insurance, pensions, investments, mortgages, custody and share-dealing businesses and treasury and capital markets activity. The FCA is also responsible for promoting effective competition in the interests of consumers and an independent subsidiary of the FCA, The Payment Systems Regulator, regulates payment systems in the UK.
PRA and FCA rules establish the minimum criteria for the authorisation of banks and other financial sector entities that carry out regulated activities. In the UK, the PRA and FCA have the right to object, on prudential grounds, to persons who hold, or intend to hold, 10% or more of the voting power or shares of a financial institution that it regulates, or of its parent undertaking. In its capacity as our
HSBC HOLDINGS PLC
100b |
Table of Contents
Report of the Directors: Financial Review(continued)
supervisor on a consolidated basis, the PRA receives information on the capital adequacy of, and sets requirements for, the Group as a whole as well as conducting stress tests both on HSBC’s UK entities and more widely on the Group, including in conjunction with other regulators. Individual banking subsidiaries in the Group are directly regulated by their local banking supervisors, who set and monitor,inter alia, their capital adequacy requirements.
The Group is subject to capital requirements as set out in CRD IV and implemented by the PRA. The regulatory capital framework has been, and continues to be, significantly enhanced. It is also envisaged that existing Pillar 1 and Pillar 2 capital requirements will be complemented by a specification of total loss absorbing capacity (‘TLAC’). TLAC parallels European requirements for entities in the EU to meet minimum requirements for eligible liabilities, which can absorb losses in the event of a failure of a bank or be bailed in to provide additional capital resources.
On 29 January 2016, the FPC published a consultation on its proposed framework for the systemic risk buffer. It is proposed that it will apply to ring-fenced banks and large building societies and will be implemented from 1 January 2019. The buffer to be applied to HSBC’s ring-fenced bank has yet to be determined. Details on the capital framework and regulatory developments on capital requirements can be found in the ‘Capital’ section on page 239.
The PRA and FCA monitor authorised institutions through ongoing supervision and the review of routine andad hoc reports relating to financial, prudential and conduct of business matters. They may also obtain independent reports from a skilled person on the adequacy of procedures and systems covering internal control and governing records and accounting. The PRA meet regularly with the Group’s senior executives to discuss our adherence to the PRA’s prudential guidelines. In addition, both the PRA and FCA regularly discuss fundamental matters relating to our business in the UK and internationally with relevant management, including areas such as strategic and operating plans, risk control, loan portfolio composition and organisational changes, including succession planning and recovery and resolution arrangements.
There are a substantial number of other ongoing regulatory initiatives affecting the Group driven by or from the UK. These include further changes to the UK bank levy, ongoing implementation of requirements regarding recovery and resolution plans (see further details outlined below under ‘Recovery and resolution’) and of the recommendations of the UK Independent Commission on Banking (‘ICB’) and the Parliamentary Commission on Banking Standards (‘PCBS’) in relation to the ring-fencing of retail banking activities.
We have started making changes to our corporate structure to mitigate or remove critical inter-dependencies to further facilitate the resolution of the Group. In particular, in order to remove operational dependencies (where one subsidiary bank provides critical services to another), we are in the process of transferring critical services from our subsidiary banks to a separately incorporated group of service companies (‘ServCo group’).
The Group presented a ring-fencing project plan to regulators in January 2016. The plan provides for the transfer into a separate subsidiary of the HSBC Group, the qualifying components of HSBC Bank plc’s UK RBWM, CMB and GPB businesses. The plan remains subject to the approval of the PRA, the FCA and other applicable regulators. Further reforms currently in the process of implementation as a result of ICB and PCBS proposals include the introduction of a new framework for individuals aimed at strengthening accountability in banking (including a new ‘Senior Managers and Certification Regime’) and remuneration rules intended to strengthen the alignment between risk and reward. In October 2015, HM Treasury announced that the Senior Managers and Certification Regime would be extended to all authorised firms by 2018. HSBC is actively engaged in the preparation for these new regimes.
Other relevant regulatory initiatives include a continued high level of focus by the FCA on the management of conduct of business and on customer outcomes.
The FCA is also involved (along with HM Treasury) in the implementation of the recommendations coming from the Fair and Effective Financial Markets Review. These were published in June 2015 and include recommendations to raise standards, professionalism and accountability of individuals, improve the quality, clarity and market-wide understanding of FICC trading practices, strengthen regulation of FICC markets in the UK and raise standards in global FICC markets, and promote fairer FICC market structures and forward-looking conduct risk identification and mitigation. The Review’s Chairs will provide an implementation report by June 2016. During 2015, HM Treasury also launched the Financial Advice Market Review to examine how financial advice could work better for consumers. This review is being undertaken with the FCA and following a call for inputs in October 2015, is expected to report during the second quarter of 2016. In a similar vein, the UK Competition and Markets Authority (‘CMA’) investigation into the supply of retail banking services to personal current account and to SME customers in the UK continues. The investigation is based on the CMA concerns that there are features of both sectors that (alone or in combination) it suspects prevent, restrict or distort competition. The CMA published provisional findings and possible remedies in October 2015 and the statutory deadline for the CMA’s final report is 5 May 2016.
The FCA also continues to apply close scrutiny to the Group’s financial crime control framework both generally in conjunction with the exercise of its wider powers under FSMA and more specifically under the FCA Direction as described above. This includes ongoing consideration of the Group’s progress in meeting its obligations under the US DPA and other commitments outlined below.
Hong Kong regulation and supervision
Banking in Hong Kong is subject to the provisions of the Banking Ordinance and to the powers, functions and duties ascribed by the Banking Ordinance to the Hong Kong Monetary Authority (the ‘HKMA’). The HKMA is the government authority in Hong Kong responsible for
HSBC HOLDINGS PLC
100c |
Table of Contents
Report of the Directors: Financial Review(continued)
maintaining monetary and banking stability. One of the principal functions of the HKMA is to promote the stability and integrity of the financial system, including the banking system in Hong Kong. The HKMA is responsible for regulating and supervising banking business and the business of taking deposits in Hong Kong. Under the Banking Ordinance, the HKMA is the licensing authority responsible for the authorisation, suspension and revocation of authorised institutions. To provide checks and balances, the HKMA is required under the Ordinance to consult with the Financial Secretary on important authorisation decisions, such as suspension and revocation.
The HKMA follows international practices as recommended by the Basel Committee on Banking Supervision (‘Basel Committee’) to supervise authorised institutions. The HKMA adopts a risk-based supervisory approach based on a policy of ‘continuous supervision’, through on-site examinations, off-site reviews, prudential meetings, co-operation with external auditors and sharing information with other supervisors. The HKMA requires all authorised institutions to have adequate systems of internal control and requires the institutions’ external auditors, upon request, to report on those systems and other matters such as the accuracy of information provided to the HKMA. In addition, the HKMA may from time to time conduct tripartite discussions with banks and their external auditors.
The HKMA has the power to serve a notice of objection on persons if they are no longer deemed to be fit and proper to be controllers of the bank, if they may otherwise threaten the interests of depositors or potential depositors, or if they have contravened any conditions specified by the HKMA. The HKMA may revoke authorisation in the event of an institution’snon-compliance with the provisions of the Banking Ordinance. These provisions require, among other things, the furnishing of accurate reports.
To enhance the exchange of supervisory information and co-operation, the HKMA has entered into Memoranda of Understanding or other formal arrangements with a number of banking supervisory authorities within and outside Hong Kong.
The marketing of, dealing in and provision of advice and asset management services in relation to securities and futures in Hong Kong are subject to the provisions of the Securities and Futures Ordinance of Hong Kong. Entities engaging in activities regulated by the Ordinance are required to be licensed or registered with the Securities and Futures Commission (‘SFC’). The HKMA is the frontline regulator for banks involved in the securities and futures business. Amongst other functions, the Securities and Futures Ordinance vested the SFC with powers to set and enforce market regulations, including investigating breaches of rules and market misconduct and taking appropriate enforcement action. The SFC is responsible for licensing and supervising intermediaries conducting SFC regulated activities, for example investment advisors, fund managers and brokers. Additionally, the SFC sets standards for the authorisation and regulation of investment products and reviews and authorises offering documents of retail investment products to be marketed to the public.
In November 2015, the Hong Kong Government gazetted the Financial Institutions (Resolution) Bill (the ‘FIR Bill’). If passed by the Legislative Council in its gazetted form, the FIR Bill would establish a cross-sector resolution regime to allow authorities in Hong Kong to resolve an in-scope financial institution.
The FIR Bill contains five stabilisation options that may be exercised in respect of an in-scope financial institution: (i) transfer of all or part of the business of the entity, or its securities, to a private sector purchaser; (ii) transfer of all or part of the business of the entity, or its securities, to a ‘bridge institution’ wholly or partially owned by the Hong Kong Government; (iii) transfer of all or part of the business of the entity to an ‘asset management vehicle’ wholly or partially owned by the Hong Kong Government; (iv) bail-in; and (v) temporary public ownership of the entity. The exercise of the stabilisation options is subject to certain safeguards to which the relevant authorities must have regard.
US regulation and supervision
The Group is subject to extensive federal and state supervision and regulation in the US. Banking laws and regulations of the Federal Reserve Board (‘FRB’), the Office of the Comptroller of the Currency (the ‘OCC’) and the Federal Deposit Insurance Corporation (the ‘FDIC’) (collectively, the ‘US banking regulators’) govern many aspects of our US business. Furthermore, since we have substantial operations outside the US which conduct many of their day-to-day transactions with the US, HSBC entities’ operations outside the US are also subject to the extra-territorial effects of US regulation in many respects. The requirements of the US DPA entered into by HSBC in December 2012 and described in this section under ‘Anti-money laundering and related regulation’ should also be noted in this context.
HSBC and its US operations are subject to supervision, regulation and examination by the FRB because HSBC is a ‘bank holding company’ under the US Bank Holding Company Act of 1956, as a result of its control of HSBC Bank USA, N.A., McLean, Virginia (‘HSBC Bank USA’); and HSBC Trust Company (Delaware), N.A., Wilmington, Delaware (‘HTCD’). HSBC North America Holdings Inc. (‘HNAH’) is also a ‘bank holding company’. Both HSBC and HNAH have elected to be financial holding companies pursuant to the provisions of the Gramm-Leach-Bliley Act (the ‘GLB Act’) and, accordingly, may affiliate with securities firms and insurance companies and engage in other activities that are financial in nature or incidental or complementary to activities that are financial in nature.
Under regulations implemented by the FRB, if any financial holding company, or any depository institution controlled by a financial holding company, ceases to meet certain capital or management standards, the FRB may impose corrective capital and/or managerial requirements on the financial holding company and place limitations on its ability to conduct the broader financial activities permissible for financial holding companies. In addition, the FRB may require divestiture of the holding company’s depository institutions or its affiliates engaged in broader
HSBC HOLDINGS PLC
100d |
Table of Contents
Report of the Directors: Financial Review(continued)
financial activities in reliance on financial holding company status under the GLB Act if the deficiencies persist. The regulations also provide that if any depository institution controlled by a financial holding company fails to maintain a satisfactory rating under the Community Reinvestment Act of 1977, the FRB must prohibit the financial holding company and its subsidiaries from engaging in any additional activities other than those permissible for bank holding companies that are not financial holding companies. See page 113 for further information on the regulatory consent orders with which HSBC Bank USA must comply in accordance with the agreement entered into with the OCC in December 2012 (the ‘GLBA’ Agreement).
The two US banks, HSBC Bank USA and HTCD, are subject to regulation and examination primarily by the OCC. HSBC Bank USA and HTCD are subject to additional regulation and supervision, secondly by the FDIC, and by the FRB and the Consumer Financial Protection Bureau (‘CFPB’). Banking laws and regulations restrict many aspects of their operations and administration, including the establishment and maintenance of branch offices, capital and reserve requirements, deposits and borrowings, investment and lending activities, payment of dividends and numerous other matters.
In July 2010, the US enacted the Dodd-Frank Wall Street Reform and Consumer Protection Act (‘Dodd-Frank’), which provided a broad framework for significant regulatory changes extending to many areas of US financial regulation. The implementation of Dodd-Frank has required further detailed rulemakings by different US regulators, including the Department of the Treasury, the FRB, the FDIC, the SEC, the Commodity Futures Trading Commission (‘CFTC’) and the CFPB. Although there remains some rule drafting to be completed, most of the extra-territorial provisions of Dodd Frank have been enacted through rulemakings. The FRB, in consultation with the Financial Stability Oversight Council (‘FSOC’) may take certain actions, including preventing mergers, restricting financial products offered, restricting or terminating activities, imposing conditions on activities or requiring the sale or transfer of assets, against any bank holding company with assets greater than $50bn that is found to pose a grave threat to financial stability. The FSOC is supported by the Office of Financial Research (‘OFR’) which may impose data reporting requirements on financial institutions. The cost of operating both the FSOC and OFR is paid for through an assessment on large bank holding companies.
In the US, parent company insolvencies are governed by the US Bankruptcy Code, 11 U.S.C. § 101 et seq. (the ‘Bankruptcy Code’). Chapter 7 of the Bankruptcy Code sets forth the procedures for liquidation of a debtor company’s assets for distribution to creditors, whereas Chapter 11 permits the operation of the debtor’s business while either negotiating a plan of reorganisation with the company’s creditors or liquidating the business. Subsidiary banks are subject to the Federal Deposit Insurance Act (the ‘FDIA’). Under the FDIA, the FDIC has the authority as receiver to liquidate and wind-up a bank’s affairs and to succeed to all rights, titles, powers, and privileges of the bank and relevant associated persons.
Under a special regime introduced by Title II of Dodd-Frank, the US Secretary of the Treasury has the authority to appoint the FDIC as receiver of certain qualifying parent companies and their subsidiaries under specified conditions. The FDIC’s powers under what is referred to as the Orderly Liquidation Authority (‘OLA’) incorporate elements of both the FDIA and the Bankruptcy Code and are intended to minimise the adverse effects of a complex financial group’s failure on the financial stability of the US. In respect of a banking group with a parent company not organised under the laws of the US, any actions under the OLA would likely be directed at the US-based intermediate holding company.
In January 2014, the FRB implemented the Basel III capital framework for bank holding companies such as HNAH, which will be required to phase in many of the requirements, including a minimum supplementary leverage ratio of 3% and an effective minimum total risk-based capital ratio of 10.5% over a transition period from 2014 to 2019. The 10.5% ratio includes the capital conservation buffer which is not a minimum requirement, per se, but rather a necessary condition to allow capital distributions. A counter-cyclical capital buffer requirement, applicable to banking organisations that meet the advanced approaches thresholds, also applies to HNAH and HBUS, and the buffer has been currently set at 0%. Additionally, failure to maintain minimum regulatory ratios in simulated stress conditions, as required by the FRB’s Comprehensive Capital Analysis and Review (‘CCAR’) programme, would restrict HNAH from engaging in capital distributions such as dividends or share repurchases. In addition to the CCAR stress testing requirements, the Dodd-Frank Act Stress Test (‘DFAST’) requires HNAH and HSBC Bank USA to undergo regulatory stress tests conducted by the FRB annually, and to conduct and publish the results of its own internal stress tests semi-annually.
Under the CCAR process, the FRB evaluates bank holding companies annually on their capital adequacy, internal capital adequacy assessment process and plans for capital distributions, and will provide a non-objection in relation to capital distributions only for companies that can demonstrate sufficient capital strength after making the capital distributions. HNAH submitted its latest CCAR capital plan and annual company-run DFAST results in January 2015. In July 2015, HNAH submitted its latest mid-cycle company-run DFAST results. HSBC Bank USA is subject to the OCC’s DFAST requirements, which require certain banks to conduct annual company-run DFAST, and submitted its latest annual DFAST results in January 2015. The company run stress tests are forward looking exercises to assess the impact of hypothetical macroeconomic baseline, adverse and severely adverse scenarios provided by the FRB and the OCC for the annual exercise, and internally developed scenarios for both the annual and mid-cycle exercises, on the financial condition and capital adequacy of a bank-holding company or bank over a nine quarter planning horizon.
In late 2014, the FRB and OCC revised aspects of their rules pertaining to CCAR and DFAST. These revisions included, among other changes, a forward shift of the timeline for the submission of capital plans and stress tests for bank
HSBC HOLDINGS PLC
100e |
Table of Contents
Report of the Directors: Financial Review(continued)
holding companies subject to CCAR and the company run stress tests for national banks subject to DFAST. Under these rules, for the 2016 capital plan cycle and going forward, bank holding companies will be required to submit their capital plans and stress testing results to the FRB one quarter later than in past years. National banks are similarly required to submit the results of their company-run stress tests to the OCC by 5 April. The final rule made certain other substantive changes to the capital plan and stress test regulations, including limiting a bank holding company’s ability to make capital distributions (subject to certain exceptions) if its actual capital issuances in that quarter were less than the amount indicated in the capital plan. HNAH plans to submit its 2016 capital plan to the FRB, and HSBC Bank USA plans to submit the results of its company-run stress tests to the OCC, on or before 5 April 2016.
On 11 March 2015, the FRB informed HNAH that it did not object to HNAH’s capital plan or the planned capital distributions included in its 2015 CCAR submission.
Large international banks, such as HSBC Holdings generally with regard to its US operations, are also required to file resolution plans describing what strategy would be followed to resolve the institution. If the FRB and the FDIC both determine that these resolution plans are not ‘credible’ (which, although not defined, is generally believed to mean the regulators do not believe the plans are feasible or would otherwise allow for the rapid and orderly resolution of the US businesses in a way that protects systematically important functions without severe systematic disruption and without exposing taxpayers to loss), our failure to cure deficiencies in a resolution plan required by Dodd-Frank to be filed by HSBC Holdings would enable the FRB and the FIDC, acting jointly, to impose more stringent prudential limits or require the divestiture of assets or operations.
In March 2015, the FRB and the FDIC announced the completion of their reviews of the second round of resolution plans submitted in 2014 by three foreign banking organisations, including the HSBC Holdings resolution submitted in 2014 (the ‘2014 Plan’). Although the agencies noted some improvements in the 2014 Plan, they jointly identified specific shortcomings that were to be addressed with the 2015 annual submission. In addition, the FDIC board of directors stated in a press release that the 2014 resolution plans submitted by these filers are not credible and do not facilitate an orderly resolution under the US Bankruptcy Code (although the FRB did not make such a determination or join in this public statement). In August 2014, the FRB and FDIC made these same determinations with respect to the plans filed in 2013 by the nine largest financial institutions required to submit resolution plans under Dodd-Frank. The FRB and FDIC requested that these filers reflect the requested improvements in their 2015 submissions. HSBC and HSBC Bank USA submitted their 2015 resolution plans to the FDIC and the FRB in December 2015.
In February 2014, the FRB finalised its rule requiring enhanced supervision of the US operations of non-US banks such as HSBC Holdings. The rule requires certain
large non-US banks with significant operations in the United States to establish a single intermediate holding company (‘IHC’) to hold their US bank and non-bank subsidiaries. HSBC currently operates in the US through an IHC structure and HNAH will be designated its IHC. The implementation of this rule, from 1 July 2016, will not have a significant impact on HSBC’s US operations. HNAH submitted its IHC implementation plan to the FRB on 31 December 2014, as required.
An IHC may calculate its capital requirements under the US standardised approach, even if it meets the asset thresholds that would require a bank holding company to use advanced approaches. HNAH received approval from the FRB to opt out of the advanced approaches in 2014, and HSBC Bank USA received approval from the OCC to opt out of the advanced approach in 2015. HNAH and HSBC Bank USA will, however, remain subject to the other capital requirements applicable to advanced approaches banking organisations such as: the supplementary leverage ratio, the countercyclical capital buffer, stress testing requirements, enhanced risk management standards, enhanced governance and stress testing requirements for liquidity management, and other applicable prudential standards. Most of these requirements will become effective on 1 July 2016.
The US banking regulators adopted a final rule in September 2014 that implements a quantitative liquidity requirement consistent with the liquidity coverage ratio standard established by the Basel Committee. The final rule establishes a liquidity coverage ratio (‘LCR’), which is designed to ensure that a banking organisation maintains an adequate level of unencumbered high-quality liquid assets equal to the entity’s expected net cash outflow for a 30-day time horizon under an acute liquidity stress scenario. The rule, which applies to HNAH, is more stringent than the Basel III LCR in several respects. Starting on 1 January 2015, covered companies, including HNAH and HSBC Bank USA, were required to maintain an LCR of 80%, increasing annually by 10% increments and reaching 100% on 1 January 2017.
In November 2015, the FSB issued final standards for TLAC requirements for global systemically important banks (‘G-SIB’s), which will apply to HSBC Holdings once implemented in the UK. The new standards also permit authorities in host jurisdictions to require ‘internal’ TLAC to be prepositioned (issued by local entities to either parent entities or third parties). The purpose of these new standards is to ensure that G-SIBs have sufficient loss absorbing and recapitalisation capacity available to implement an orderly resolution with continuity of critical functions and minimal impact on financial stability and to ensure cooperation between home and host authorities during resolution. The new standards call for all G-SIBs to be subject to TLAC requirements starting 1 January 2019, to be fully phased in by 1 January 2022. In the US, the FRB published proposed rules on 30 November 2015 for implementing the FSB’s TLAC standard in the US. The proposed rules require, among other things, the US intermediate holding companies of non US G-SIBs, including HNAH, to maintain minimum amounts of ‘internal’ TLAC which would include minimum levels of tier
HSBC HOLDINGS PLC
100f |
Table of Contents
Report of the Directors: Financial Review(continued)
1 capital and long-term debt satisfying certain eligibility criteria, and a related TLAC buffer commencing 1 January 2019. The TLAC proposal also includes ‘clean holding company requirements’ that impose limitations on the types of financial transactions HSBC’s US intermediate holding company, HNAH, could engage in. The FSB’s TLAC standard and the FRB’s TLAC proposal represent a significant expansion of the current regulatory capital framework that may, if adopted as proposed, require both HNAH and HSBC to make material modifications to the terms of outstanding debt instruments or to issue additional long-term debt.
HSBC Bank USA and HTCD are subject to risk-based assessments from the FDIC, which insures deposits generally to a maximum of $250,000 per depositor for domestic deposits. Dodd-Frank changes the FDIC’s risk-based deposit insurance assessment framework primarily by basing assessments on an FDIC-insured institution’s total assets less tangible equity rather than US domestic deposits, which is expected to shift a greater portion of the aggregate assessments to large FDIC-insured institutions. In October 2015, the FDIC proposed an additional surcharge on the quarterly assessments of insured depository institutions with total consolidated assets of $10bn or more, including HSBC Bank USA. The new large bank pricing system will result in higher assessment rates for banks with high-risk asset concentrations, less stable balance sheet liquidity, or potentially higher loss severity in the event of failure.
HSBC’s US consumer finance operations are subject to extensive state-by-state regulation in the US, and to laws relating to consumer protection (both in general, and in respect of sub-prime lending operations, which have been subject to enhanced regulatory scrutiny); discrimination in extending credit; use of credit reports; privacy matters; disclosure of credit terms; and correction of billing errors. These operations are subject to regulations and legislation that limit operations in certain jurisdictions.
In December 2013, US regulators finalised the ‘Volcker Rule’, which limits the ability of banking entities to sponsor or invest in certain private equity or hedge funds or to engage in certain types of proprietary trading. During 2015, the Group implemented its conformance plans related to its businesses and risk management and control frameworks both in the US and elsewhere, including establishing a defined Volcker compliance programme and related CEO attestation processes to ensure compliance with the final rule by the relevant effective dates.
Title VII of Dodd-Frank provides for an extensive framework for the regulation of over-the-counter (‘OTC’) derivatives by the CFTC and the SEC, including mandatory clearing, exchange trading and public and regulatory transaction reporting of certain OTC derivatives, as well as rules regarding the registration of swap dealers and major swap participants, and related capital, margin, business conduct, record keeping and other requirements applicable to such entities.
The CFTC has adopted many of the most significant provisions of Title VII, which came into effect in 2013 and 2014. In particular, HSBC Bank USA and HSBC Bank plc are
provisionally registered as swap dealers with the CFTC. Because HSBC Bank plc is a non-US swap dealer, the CFTC generally limits its direct regulation of HSBC Bank plc to swaps with US persons and certain affiliates of US persons. However, the CFTC continues to consider whether to apply mandatory clearing, exchange trading, public transaction reporting, margin and business conduct rules to swaps with non-US persons arranged, negotiated or executed by US personnel or agents. The CFTC is also considering whether to apply regulatory transaction reporting requirements on all swaps entered into by a non-US swap dealer or instead to permit reliance on transaction reporting under comparable EU rules. The application of CFTC rules to HSBC Bank plc’s swaps with non-US persons could have an adverse effect on the willingness of non-US counterparties to trade swaps with HSBC Bank plc and we continue to assess how developments in these areas will affect our business.
In June 2014, the SEC finalised rules regarding the cross-border application of the security-based swap dealer and major security-based swap participant definitions. These rules share many similarities with parallel guidance finalised by the CFTC in July 2013. In January 2015, the SEC also finalised rules regarding reporting and public dissemination requirements for security-based swap transaction data. In August 2015, the SEC also finalised rules for the registration of security-based swap dealers and major security-based swap participants. The SEC has not yet finalised the implementation dates for these rules or finalised several related Title VII rules. Because our equity and credit derivatives businesses are also subject to the CFTC’s jurisdiction under Title VII, material differences between the final SEC rules and existing CFTC rules could materially increase our costs of compliance with Title VII by requiring the implementation of significant additional policies, procedures, documentation, systems and controls for those businesses.
In November 2015, the OCC, jointly with other US banking regulators, adopted final rules establishing margin requirements. The final margin rules will require HSBC Bank USA and HSBC Bank plc to collect and post initial and variation margin for certain non-cleared swaps and security-based swaps entered into with other swap dealers and financial end-users that exceed a minimum threshold of transactional activity. For certain non-cleared swaps and security-based swaps entered into with financial end-users that do not meet the minimum transactional activity threshold, HSBC Bank USA and HSBC Bank plc will only be required to collect and post variation margin (but not initial margin). The US banking regulators’ final rules do not impose margin requirements for non-cleared swaps and security-based swaps entered into with non-financial end-users, certain sovereigns and multilateral development banks or qualifying hedging transactions with certain small depository institutions.
The final margin rules also limit the types of assets that are eligible to satisfy initial and variation margin requirements, require initial margin to be segregated at a third-party custodian, impose requirements on internal models used to calculate initial margin requirements and contain specific provisions for cross-border transactions and inter-
HSBC HOLDINGS PLC
100g |
Table of Contents
Report of the Directors: Financial Review(continued)
affiliate transactions. The final margin rules follow a phased implementation schedule, with variation margin requirements coming into effect in September 2016 and March 2017 and initial margin requirements phased in on an annual basis from September 2016 through September 2020, with the relevant compliance dates depending on the transactional volume of the parties and their affiliates. These final rules, as well as parallel margin rules from the CFTC, the SEC, and certain non-US regulators will increase the costs and liquidity burden associated with trading non-cleared swaps and security-based swaps and may adversely affect our business in such products. In particular, the imposition of initial margin requirements on inter-affiliate transactions will significantly increase the cost of certain consolidated risk management activities and may adversely affect HSBC to a greater extent than some of our competitors.
Dodd-Frank also included a ‘swaps push-out’ provision that would have effectively limited the range of OTC derivatives activities in which an insured depository institution, including HSBC Bank USA, could engage. The scope of this provision was significantly reduced in December 2014 and now effectively only restricts HSBC Bank USA’s ability to enter into certain ‘structured finance swaps’ after 16 July 2015 that are not entered into for hedging or risk mitigation purposes.
Dodd-Frank grants the SEC discretionary rule-making authority to modify the standard of care that applies to brokers, dealers and investment advisers when providing personalised investment advice to retail customers and to harmonise other rules applying to these regulated entities. Dodd-Frank also expands the extra-territorial jurisdiction of US courts over actions brought by the SEC or the US with respect to violations of the anti-fraud provisions in the Securities Act, the Securities Exchange Act of 1934 and the Investment Advisers Act of 1940. In addition, regulations which the FSOC, the CFPB or other regulators may adopt could affect the nature of the activities which our FDIC-insured depository institution subsidiaries may conduct, and may impose restrictions and limitations on the conduct of such activities.
The implementation of the remaining Dodd-Frank provisions, including those related to the recommended imposition of the fiduciary standard on broker-dealers, could result in additional costs or limit or restrict the way we conduct our business in the US.
Global and regional prudential and other regulatory developments
The Group is subject to regulation and supervision by a large number of regulatory bodies and other agencies. In addition to changes being pursued at a country level, changes are also being pursued globally through the actions of bodies such as theG-20, the FSB and Basel Committee, as well as regionally through the EU. Key areas include the work of the FSB on G-SIBs, the Basel Committee’s ongoing consultations on revised standardised approaches across a number of risk areas, and the FSB’s final standard for requirements for total loss
absorbing capacity. See further details in the Capital section on page 239.
We are also subject to regulatory stress testing in many jurisdictions. These have increased both in frequency and in the granularity of information required by supervisors. They include the programmes of the Bank of England, the FRB (as explained in the ‘US regulation and supervision’ section), the OCC, the EBA, the ECB, the HKMA and other regulators. For further details, see ‘Regulatory stress tests’ on page 116.
There are a number of consultations which have been issued by the Basel Committee and are yet to be finalised. These are likely to have an impact on the standardised approach for credit risk and operational risk and will determine whether the capital floor will be included in the Basel capital framework.
In January 2016, the Basel Committee published the final rules arising from the Fundamental Review of the Trading Book. The new regime includes amendments to the trading book boundary and new market risk capital calculations for both the modelled and standardised approaches. Basel implementation is planned for 2019. See further details in the Capital section on page 239.
In October 2014, the Basel Committee finalised their recommendations for the calculation of the net stable funding ratio (‘NSFR’). The NSFR is a significant component of the Basel III reforms. It requires banks to maintain a stable funding profile in relation to their on- and off-balance sheet activities, thus reducing the likelihood that disruptions to a bank’s regular sources of funding will erode its liquidity position in a way that could increase the risk of its failure and potentially lead to broader systemic stress. Further details on NSFR can be found on page 155.
In January 2016, the Basel Committee finalised its Fundamental Review of the Trading Book (‘FRTB’) which is expected to increase market risk capital requirements once implemented by national regulators. Further details on the FRTB can be found on page 241.
All finalised Basel Committee proposals would need to be transposed into EU requirements before coming into effect.
Recovery and resolution
Globally there have been a number of developments relating to banking structural reform and the introduction of recovery and resolution regimes.
As recovery and resolution planning has developed, some regulators and national authorities have also required changes to the corporate structures of banks. These include requiring the local incorporation of banks or ring-fencing of certain businesses.
We are working with our primary regulators to develop and agree a resolution strategy for HSBC. It is our view that a strategy by which the Group breaks up at a subsidiary bank level at the point of resolution (referred to as a multiple point of entry) is the optimal approach, as it is aligned to our existing legal and business structure. Similarly to allG-SIBs, we are working with our regulators to mitigate or remove critical inter-dependencies between our
HSBC HOLDINGS PLC
100h |
Table of Contents
Report of the Directors: Financial Review(continued)
subsidiaries to further facilitate the resolution of the Group. In particular, in order to remove operational dependencies (where one subsidiary bank provides critical services to another), we are in the process of transferring critical services from our subsidiary banks to a separate internal ServCo group.
During 2015, more than 18,000 employees performing shared services in the UK were transferred to the ServCo group. Further transfers of employees, critical shared services and assets in the UK, Hong Kong and other jurisdictions will occur in due course.
European regulation
Through the UK’s membership of the EU, HSBC is both directly and indirectly subject to European financial services regulation.
CRD IV implemented Basel III in the EU and, in the UK, the ‘PRA rulebook CRR Firms Instrument 2013’ transposed the various national discretions under CRD IV into UK law. CRD IV and the PRA requirements came into force on 1 January 2014.
Additionally, the EU is implementing its ‘Banking Union’ to increase integration in the eurozone banking system. As part of this, in November 2014, the Single Supervisory Mechanism (‘SSM’) established the ECB as the single supervisor for all banks in the eurozone with direct supervisory responsibility for larger and systemically important banks, including HSBC France and HSBC Malta. A Single Resolution Mechanism (‘SRM’) was also established to apply to all banks covered by the SSM. This is intended to ensure that bank resolution is managed effectively through a Single Resolution Board and a Single Resolution Fund, financed by the banking sector. Non-eurozone countries within the EU may opt to join the Banking Union, but the UK has indicated that it will not do so.
In January 2014, the European Commission published legislative proposals on the structural reform of the European banking sector which would prohibit proprietary trading in financial instruments and commodities, and enable supervisors, at their discretion, to require trading activities such as market-making, complex derivatives and securitisation operations to be undertaken in a separate subsidiary from deposit taking activities. In June 2015, the European Council published its negotiating position on the regulation which will need to be agreed with the European Parliament before being finalised.
In the EU, BRRD was finalised and published in June 2014. This came into effect from 1 January 2015, with the option to delay implementation of bail-in provisions until 1 January 2016. Regardless of this, the UK introduced bail-in powers from 1 January 2015. The UK transposition of the BRRD builds on the resolution framework already in place in the UK. In January 2015, the PRA published a policy statement containing updated requirements for recovery and resolution planning which revises PRA rules that have been in force since 1 January 2014. In addition, the EBA has produced a number of Regulatory Technical Standards, some of which are yet to be finalised, that will further inform the BRRD requirements.
The BRRD also introduces requirements for banks to maintain at all times a sufficient aggregate amount of own funds and ‘eligible liabilities’ (that is, liabilities that may be bailed in using the bail-in tool) known as the minimum requirements for eligible liabilities (‘MREL’). In December 2015, the Bank of England issued a consultation paper on its approach to MREL for all UK banks, building societies and certain investment firms. Alongside the Bank of England’s MREL consultation paper, the PRA published consultation paper on the interaction between MREL and capital buffers and how it would treat a breach of MREL.
The EU also continues to pursue the development of markets, and conduct-related EU regulations. This includes completing implementation of measures such as the European Markets Infrastructure Regulation. Additionally, a number of other EU market-related regulations have moved through the legislative process in 2015 and will be subject to significant implementation work in 2016. This includes the Markets in Financial Instrument Regulation/Directive (‘MiFID II’), the Market Abuse Regulation, EU’s Framework for Benchmarks and Indices, the Mortgage Credit Directive, the Packaged Retail Investment and Insurance Products Regulation, the Second Payment Services Directive, Money Markets Fund Regulation, the Payment Accounts Directive, and the Fourth Money Laundering Directive are all expected to progress further towards implementation during 2016. The Group continues to enhance and strengthen its governance and resourcing more generally around regulatory change management and the implementation of required measures, actively to address this ongoing and significant agenda of regulatory change.
Anti-money laundering and sanctions regulation
HSBC places a high priority on its obligations to deter money laundering and terrorist financing and to enforce global sanctions. The European Commission has published a Fourth Directive on the prevention of the use of the financial system for the purpose of money laundering and terrorist financing. Member States are required to incorporate the Fourth Directive into national laws by 26 June 2017 and financial institutions are required to comply with these laws from this date. HSBC policy requires that all Group companies must adhere to the letter and spirit of all applicable laws and regulations and we have policies, procedures and training intended to ensure that our employees know and understand our criteria for deciding when a client relationship or business should be evaluated as higher risk.
Risk mitigation measures aimed at deterring money laundering, terrorist and proliferation (weapons) financing (collectively referred to as ‘AML’) and enforcing sanctions have been focused in three key areas:
| • | managing risk; |
| • | transitioning to a new operating and governance model; and |
| • | meeting HSBC’s regulatory obligations. |
HSBC HOLDINGS PLC
100i |
Table of Contents
Report of the Directors: Financial Review(continued)
Revised global AML and sanctions policies were approved in 2014. During 2015, global businesses and countries introduced new AML and sanctions procedures arising from the new policies and focused on embedding the procedures required to effect these policies in ourday-to-day business operations globally. This supported our ongoing effort to address the US DPA requirements. These actions were in line with our strategic target to implement the highest or most effective standards globally. The work of the Monitor, who was appointed to assess the effectiveness of our AML and sanctions compliance programme is discussed on page 116 and our progress on implementing Global Standards is detailed on page 21.
Conducting customer due diligence (‘CDD’) is one of the fundamental ways in which we know our customers and understand and manage financial crime risk. Enhanced minimum standards for customer due diligence, including, as applicable, standards to determine beneficial ownership information, are continuing to be deployed across the four global businesses.
The AML and sanctions programmes are being better aligned to the three lines of defence model (described on page 177) with roles and accountability across all three lines clearly set out and embedded through employee awareness initiatives.
As part of our continuing evaluation of AML and sanctions risk, we also monitor activities relating to the countries subject to US economic sanctions programmes administered by OFAC, as well as those subject to United Nations, UK and EU sanctions, as well as complying with local lists as required in the jurisdictions in which we operate. HSBC policy requires all Group companies to comply to the extent applicable with US sanctions laws. This means that not only must US subsidiaries and US nationals comply with US sanctions, but that HSBC subsidiaries outside the US which are not US persons must not participate in transactions within US jurisdictions (including most US dollar transactions) that would contravene US sanctions. We do not consider that our business activities with counterparties with whom transactions are restricted or prohibited under US sanctions are material to our business, and such activities represented a very small part of the Group’s total assets at 31 December 2015 and total revenues for the year ended 31 December 2015.
Other
HSBC Bank USA entered into a Consent Cease and Desist Order with the OCC, and HNAH entered into a Consent Cease and Desist Order with the FRB in October 2010. These Orders require improvement of our compliance risk management programme, including AML controls across our US businesses. Steps continue to be taken to address the requirements of these Orders and to ensure that compliance and effective policies and procedures are maintained.
Disclosures pursuant to Section 13(r) of the
Securities Exchange Act
Section 13(r) of the Securities Exchange Act requires each issuer registered with the SEC to disclose in its annual or quarterly reports whether it or any of its affiliates have knowingly engaged in specified activities or transactions with persons or entities targeted by US sanctions programmes relating to Iran, terrorism, or the proliferation of weapons of mass destruction, even if those activities are not prohibited by US law and are conducted outside the US by non-US affiliates in compliance with local laws and regulations.
To comply with this requirement, HSBC Holdings plc (together with its affiliates, ‘HSBC’) has requested relevant information from its affiliates globally. The following activities conducted by HSBC are disclosed in response to Section 13(r).
Loans in repayment
Between 2001 and 2005, the Project and Export Finance division of HSBC arranged or participated in a portfolio of loans to Iranian energy companies and banks. All of these loans were guaranteed by European and Asian export credit agencies and have varied maturity dates with final maturity in 2018. For those loans that remain outstanding, we continue to seek repayment in accordance with our obligations to the supporting export credit agencies. Details of these loans follow.
At 31 December 2015, we had 10 loans outstanding to an Iranian petrochemical company. These loans were supported by the official export credit agencies of the following countries: the UK, France, Germany, Spain, South Korea and Japan. We continue to seek repayments from the Iranian company under the outstanding loans in accordance with their original maturity profiles. Two repayments have been made under each of the ten loans in 2015.
Bank Melli acted as a sub-participant in two of the aforementioned loans to the Iranian petrochemical company. One repayment was made into a frozen account during the first quarter of 2015, and no further payments were made in 2015. One of the loans to the Iranian petrochemical company, supported by the Spanish Export Credit Agency, was fully repaid in 2015. Bank Saderat acted as a sub-participant on the loan and the final repayment due to the bank was paid into a frozen account.
We held a sub-participation in a loan provided by another international bank to Bank Tejarat with a guarantee from the Government of Iran, supported by the Italian Export Credit Agency. The facility matured in 2014 and the final claim for non-payment was paid by the Italian Export Credit Agency in the first quarter of 2015.
Estimated gross revenue to HSBC generated by the loans in repayment for 2015, which includes interest and fees, was approximately $702,000 and net estimated profit was approximately $545,000. While we intend to continue to seek repayment under the existing loans, all of which were
HSBC HOLDINGS PLC
100j |
Table of Contents
Report of the Directors: Financial Review(continued)
entered into before the petrochemical sector of Iran became a target of US sanctions, we do not currently intend to extend any new loans.
Legacy contractual obligations related to guarantees
Between 1996 and 2007, we provided guarantees to a number of its non-Iranian customers in Europe and the Middle East for various business activities in Iran. In a number of cases, we issued counter indemnities in support of guarantees issued by Iranian banks as the Iranian beneficiaries of the guarantees required that they be backed directly by Iranian banks. The Iranian banks to which we provided counter indemnities included Bank Tejarat, Bank Melli, and the Bank of Industry and Mine.
We have worked with relevant regulatory authorities to obtain licences where required and ensure compliance with laws and regulations.
There was no measurable gross revenue in 2015 under those guarantees and counter indemnities. We do not allocate direct costs to fees and commissions and, therefore, have not disclosed a separate net profit measure. We are seeking to cancel all relevant guarantees and counter indemnities and do not currently intend to provide any new guarantees or counter indemnities involving Iran. Two were cancelled in 2015 and approximately 20 remain outstanding.
Other relationships with Iranian banks
Activity related to US-sanctioned Iranian banks not covered elsewhere in this disclosure includes the following:
| • | We maintain several frozen accounts in the UK for an Iranian-owned, UK-regulated financial institution. In April 2007, the UK government issued a licence authorising us to handle certain transactions (operational payments and settlement of pre-sanction transactions) for this institution. In December 2013, the UK government issued a new licence allowing HSBC to deposit certain cheque payments. There was some licensed activity in 2015. Estimated counter revenue in 2015 for this financial institution, which includes fees and/or commissions, was approximately $56,900. This customer relationship has generated negative revenue, given the European Central Bank’s negative interest rate. In the second quarter of 2015, the UK government issued a licence to HSBC to collect the negative interest rate from this institution, and we commenced the collection of the negative interest rate in the fourth quarter of 2015. |
| • | We acted as the trustee and administrator for a pension scheme involving two employees of a US-sanctioned Iranian bank in Hong Kong. Under the rules of this scheme, we accepted contributions from the Iranian bank each month and allocated the funds into the pension accounts of the Iranian bank’s employees. We ran and operated this pension scheme in accordance with Hong Kong laws and regulations. Estimated gross revenue, which includes fees and/or commissions, generated by the pension scheme in 2015 was approximately $3,100. |
For the Iranian bank related-activity discussed in this section, we do not allocate direct costs to fees and commissions and, therefore, have not disclosed a separate net profit measure. We currently intend to continue to wind down this activity, to the extent legally permissible, and not enter into any new such activity.
Activity related to US Executive Order 13224
We maintain a frozen personal account for an individual customer who was sanctioned under US Executive Order 13224, and by the UK and the UN Security Council. Activity in 2015 was permitted by a licence issued by the UK Government. We are in the process of exiting the customer relationship.
We maintained an account for an individual customer that was sanctioned under US Executive Order 13224 in the second quarter of 2015. We settled the outstanding credit balance due from the customer and closed the account in the second quarter of 2015.
We maintain an account for an individual customer sanctioned under US Executive Order 13224 in 2015. The account was frozen in the third quarter of 2015.
For activity related to US Executive Order 13224, there was no measurable gross revenue or net profit generated to HSBC in 2015.
Activity related to US Executive Order 13382
In the second quarter of 2015, we maintained non-US currency accounts for an individual customer sanctioned under Executive Order 13382. We exited the customer relationship in the second quarter of 2015. There was no measurable gross revenue or net profit to HSBC in 2015.
Other activity
We held a lease of branch premises in London which we entered into in 2005 and was due to expire in 2020. The landlord of the premises is owned by the Iranian government and is a specially designated national under US Sanctions programmes. We have exercised a break clause in the lease and have exited the property. We closed the branch in the third quarter of 2014 and terminated the relationship with the lessor in 2015.
We maintained an account for a corporate customer in Armenia for whom we received funds from an account at Bank Mellat CJSC Armenia for the sale of computer equipment during the first quarter of 2015.
We maintained an account for a corporate customer in Oman during the first quarter of 2015 for whom we processed a cheque payment drawn on an account at Bank Melli in Oman for the sale of carpet-related products and services.
We maintain an account for a corporate customer in France that made a payment to the Iranian Civil Aviation Authority to settle flight-related expenses during the second quarter of 2015. This activity was permitted by a licence issued by France.
We maintain an account for a corporate customer in the UAE for whom we processed a cheque payment from a hospital owned by the Government of Iran for the purchase of medical equipment in the first quarter of 2015.
HSBC HOLDINGS PLC
100k |
Table of Contents
Report of the Directors: Financial Review(continued)
We maintain a corporate customer in the UK for whom we received a cheque payment in the second quarter of 2015 from Bank Saderat in London, UK for health and safety services.
For the activity in this section, there was no measurable gross revenue or net profit to HSBC in 2015.
Frozen accounts and transactions
We maintain several accounts that are frozen under relevant sanctions programmes and on which no activity, except as licensed or otherwise authorised, took place during 2015. In 2015, we also froze payments where required under relevant sanctions programmes. There was no gross revenue or net profit to HSBC in 2015 relating to these frozen accounts.
HSBC HOLDINGS PLC
100l |
Table of Contents
| Risk | Page | App1 | ||||||
|
| 101
|
| |||||
|
| 101
|
| |||||
|
| 102
|
| |||||
|
| 104
|
| |||||
|
| 105
|
| |||||
|
| 108
|
| |||||
|
| 193
|
| |||||
|
| 194
|
| |||||
|
| 109
| a
| |||||
|
| 110
|
| |||||
|
| 110
|
| |||||
|
| 114
|
| |||||
|
| 116
|
| |||||
Financial crime compliance and regulatory compliance
|
| 116
|
| |||||
|
| 116
|
| |||||
|
| 116
|
| |||||
|
| 117
|
| |||||
|
| 117
|
| |||||
|
| 117
|
| |||||
|
| 118
|
| | 195 | | ||
|
| 154
|
| | 204 | | ||
|
| 166
|
| | 210 | | ||
|
| 176
|
| | 217 | | ||
|
| 178
|
|
| 217
|
| ||
|
| 218
|
| |||||
Global security and fraud risk
|
| 218
|
| |||||
|
| 219
|
| |||||
|
| 219
|
| |||||
Risk management of insurance operations
|
| 180
|
|
| 219
|
| ||
|
| 189
|
| |||||
|
| 189
|
|
| 224
|
| ||
|
| 189
|
|
| 224
|
| ||
|
| 189
|
|
| 225
|
| ||
|
| 190
|
|
| 226
|
| ||
1Appendix to Risk – risk policies and practices.
| ||||||||
For details of HSBC’s policies and practices regarding risk management and governance see the Appendix to Risk on page 193.
All of our activities involve, to varying degrees, the measurement, evaluation and management of risk or combinations of risks.
Our conservative risk profile
We maintain a conservative risk profile which encompasses the following:
Financial position
| • | Strong capital position, defined by regulatory and internal capital ratios. |
| • | Liquidity and funding management for each operating entity, on a stand-alone basis. |
Operating model
| • | Returns generated in line with risk taken. |
| • | Sustainable and diversified earnings mix, delivering consistent returns for shareholders. |
Business practice
| • | Zero tolerance for knowingly engaging in any business, activity or association where foreseeable reputational risk or damage has not been considered and/or mitigated. |
| • | No appetite for deliberately or knowingly causing detriment to consumers arising from our products and services or incurring a breach of the letter or spirit of regulatory requirements. |
| • | No appetite for inappropriate market conduct by a member of staff or by any Group business. |
Managing risk effectively is fundamental to the delivery of our strategic priorities. In doing so, we employ a risk management framework at all levels of the organisation and across all risk types. It fosters the continuous monitoring of the risk environment and an integrated evaluation of risks and their interactions. It also ensures that we have a consistent approach to risk management across the Group.
Our enterprise risk management framework is underpinned by our risk culture and is reinforced by the HSBC Values and our Global Standards. These are instrumental in aligning the behaviours of individuals with the Group’s attitude to assuming and managing risk and helping to ensure that our risk profile remains in line with our risk appetite.
Our enterprise risk management framework is set out overleaf.
HSBC HOLDINGS PLC
101 |
Table of Contents
Report of the Directors: Risk(continued)
Managing risk
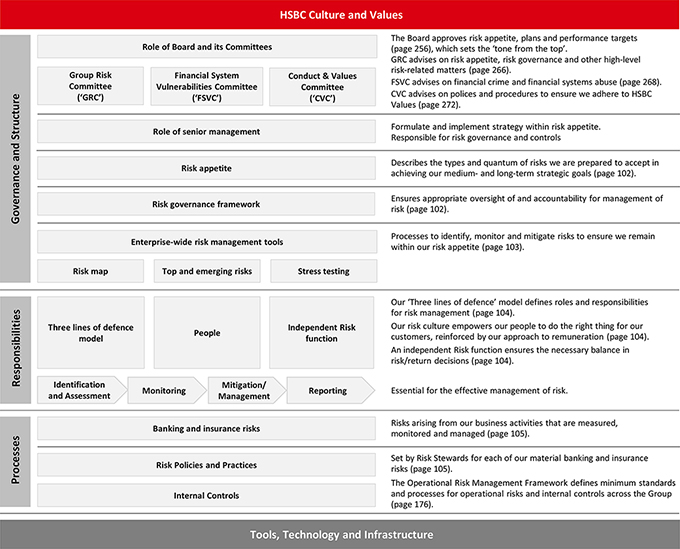
Corporate and risk governance
Robust risk governance and accountability are embedded throughout the Group through an established framework that ensures appropriate oversight of and accountability for the effective management of risk.
The Board has ultimate responsibility for the effective management of risk and approves HSBC’s risk appetite. The Board is advised on risk-related matters by the following committees:
| • | The Group Risk Committee advises the Board on risk appetite and its alignment with strategy, risk governance and internal controls, and high-level risk related matters. |
| • | The Financial System Vulnerabilities Committee reports to the Board on matters relating to financial crime and financial system abuse and provides a forward-looking perspective on financial crime risk. |
| • | The Conduct & Values Committee oversees the design and application of HSBC’s policies, procedures and standards to ensure that we conduct business responsibly and consistently adhere to HSBC Values, and advises the Board accordingly. |
Executive accountability for the ongoing monitoring, assessment and management of the risk environment and the effectiveness of our risk management policies resides with the RMM, the Risk Management Meeting of the Group Management Board (‘GMB’). Day-to-day risk management activities are the responsibility of senior managers of individual businesses, supported by global functions as described under ‘Three lines of defence’ below.
The consistency of governance structures across HSBC is enforced through risk management committees, as set out in our enterprise risk management framework, and adherence to consistent standards and risk management policies.
The executive and non-executive risk governance structures and their interactions are set out on page 193, with similar arrangements in place for major operating subsidiaries.
The report of the Group Risk Committee is on page 266, of the Financial System Vulnerabilities Committee is on page 268, and of the Conduct & Values Committee is on page 272.
Risk appetite
The Group’s Risk Appetite Statement (‘RAS’) is the written articulation of the aggregated level and types of risk that we are willing to accept in our business activities in order
HSBC HOLDINGS PLC
102 |
Table of Contents
to achieve our medium to long-term business objectives. It is a key component of our management of risk and is reviewed on an ongoing basis, with formal approval from the Board every six months on the recommendation of the Group Risk Committee.
The Group’s actual risk appetite profile is reported to the RMM on a monthly basis to enable senior management to monitor the risk profile and guide business activity in order to balance risk and return, allowing risks to be promptly identified and mitigated, and inform risk-adjusted remuneration to drive a strong risk culture across the Group.
The RAS is established and monitored as part of the Global Risk Appetite Framework, which provides a globally consistent and structured approach to the management, measurement and control of risk by detailing the processes, governance and other features of how risk appetite is cascaded to drive day-to-day decision-making through policies, limits and the control framework.
Risk appetite informs the strategic and financial planning process, defining the desired forward-looking risk profile of the Group. It is also embedded in other enterprise risk tools such as top and emerging risks and stress testing, to ensure consistency in risk management.
Global businesses, geographical regions and strategic countries are required to have their own RASs, which are subject to assurance to ensure they remain directionally aligned to the Group’s. All RASs and business activities are guided and underpinned by a set of qualitative principles, outlined in the Appendix to Risk on page 194. Additionally, quantitative metrics are defined along with appetite and tolerance thresholds for 10 risk areas.
Enterprise-wide risk management tools
The following processes to identify, manage and mitigate risks are integral to risk management at HSBC, helping to ensure that we remain within our risk appetite.
Risk map
The risk map process provides a point-in-time view of the risk profile of the Group across a suite of risk categories including our material banking risks and insurance risks (see page 105). It assesses the potential for these risks to materially affect our financial results, reputation or business sustainability on current and projected bases.
The risk categories presented on the risk map are regularly assessed through our risk appetite profile, are stress tested and, where thematic issues arise, are considered for classification as top or emerging risks.
Top and emerging risks
Identifying, managing and monitoring risks are integral to our approach to risk management. Our top and emerging risks process provides a forward-looking view of those risks which have the potential to threaten the execution of our strategy and our global operations. Top and emerging risks are generally described thematically, and may have an impact across multiple risk map categories, global businesses or regions.
We define a ‘top risk’ as a thematic issue arising across any combination of risk map categories, regions or global businesses which has the potential to have a material effect on the Group’s financial results, reputation or long-term business model, and which may form and crystallise between six months and one year. The risk impact may be well understood by senior management, with some mitigating actions already in place. Stress tests of varying granularity may also have been carried out to assess the effect.
An ‘emerging risk’ is defined as a thematic issue that has large unknown components which may form and crystallise beyond a one-year time horizon. If it were to materialise, it could have a significant material effect on a combination of the Group’s long-term strategy, profitability and reputation. Existing management action plans are likely to be minimal, reflecting the uncertain nature of these risks at this stage. Some high-level analysis and/or stress testing may have been carried out to assess the impact.
Our top and emerging risk framework enables us to identify and manage current and forward-looking risks to ensure our risk appetite remains appropriate. The ongoing assessment of our top and emerging risks is informed by a comprehensive suite of risk factors (see page 108) and the results of our stress testing programme. When our top and emerging risks result in our risk appetite being exceeded, or have the potential to exceed, we take steps to mitigate them, including reducing our exposure to areas of stress.
Our current top and emerging risks are discussed on page 110.
Stress testing
Our stress testing and scenario analysis programme examines the sensitivities of our capital plans and unplanned demand for regulatory capital under a number of scenarios and ensures that top and emerging risks are appropriately considered. These scenarios include, but are not limited to, adverse macroeconomic events, failures at country, sector and counterparty levels, geopolitical occurrences and a variety of projected major operational risk events.
At Board level, the Group Chief Risk Officer and the Group Finance Director are the two executive Directors jointly accountable for oversight of stress testing in HSBC. The Stress Testing Management Board, which is chaired by the Group Finance Director, is responsible for stress testing strategy and stewardship. Updates on stress testing are provided regularly to the RMM. The Group Risk Committee is informed and consulted on the bank’s stress testing activities, as appropriate, and approves the key elements of the Bank of England concurrent stress test, including final results.
The development of macroeconomic scenarios is a critical part of the process. Potential scenarios are defined and generated by a panel of economic experts from various global teams, including Risk and Finance. Scenarios are translated into financial impacts, such as on our forecast profitability and RWAs, using a suite of stress testing models and methodologies. Models are subject to independent model review and go through a process of validation and approval. Model overlays may be considered where necessary.
HSBC HOLDINGS PLC
103 |
Table of Contents
Report of the Directors: Risk(continued)
Managing risk
Stress testing results are subject to a review and challenge process at regional, global business and Group levels and action plans are developed to mitigate identified risks. The extent to which these action plans would be implemented in the event of particular scenarios occurring depends on senior management’s evaluation of the risks and their potential consequences, taking into account HSBC’s risk appetite.
In addition to the Group-wide risk scenarios, each major HSBC subsidiary conducts regular macroeconomic and event-driven scenario analyses specific to their region. They also participate in local regulatory stress testing programmes, where required.
Stress testing is applied to risks such as operational risk, including market risk, liquidity and funding risk, credit risk and conduct to evaluate the potential effects of stress scenarios on portfolio values, structural long-term funding positions, income or capital.
Reverse stress testing is run annually on both Group and, where required, subsidiary entity bases. This stress test is conducted by assuming the business model is non-viable and works backwards to identify a range of occurrences that could bring that event about. Non-viability might occur before the bank’s capital is depleted, and could result from a variety of events, including idiosyncratic or systemic events or combinations thereof. It could imply failure of the Group’s holding company or one of its major subsidiaries. Reverse stress testing is used to strengthen our resilience by identifying potential stresses and vulnerabilities which the Group might face and helping to inform early-warning triggers, management actions and contingency plans designed to mitigate their effect, were they to occur.
HSBC participated in regulatory stress testing programmes in a number of jurisdictions during 2015, as outlined on page 116. In addition, we have conducted an internal stress test, incorporating the latest portfolio developments and business plan. For this exercise management considers that the Bank of England 2015 scenario reflects key risks which merit examination at this time. The results of this exercise are used for internal risk and capital management processes, including the Internal Capital Adequacy Assessment Process (‘ICAAP’).
Three lines of defence
We use the three lines of defence model to underpin our approach to strong risk management. It defines responsibilities for: identifying, assessing, measuring, managing, monitoring and mitigating risks; encouraging collaboration; and enabling efficient coordination of risk and control activities.
For details of the three lines of defence model, see page 177.
People
All employees are required to identify, assess and manage risk within the scope of their assigned responsibilities and, as such, they are critical to the effectiveness of the three lines of defence.
Clear and consistent employee communication on risk conveys strategic messages and sets the tone from senior leadership. We deploy a suite of mandatory training on critical risk and compliance topics to embed skills and understanding and strengthen the risk culture within HSBC. It reinforces the attitude to risk in the behaviour expected of employees, as described in our risk policies. The training is updated regularly, describing technical aspects of the various risks assumed by the Group and how they should be managed effectively. A confidential disclosure line enables staff to raise concerns (see page 179).
Our risk culture is reinforced by our approach to remuneration. Individual awards, including those for executives, are based on compliance with HSBC Values and the achievement of financial and non-financial objectives which are aligned to our risk appetite and global strategy.
For further information on risk and remuneration, see the Report of the Group Remuneration Committee on page 270.
Independent Risk function
Global Risk, headed by the Group Chief Risk Officer, is responsible for the enterprise risk management framework. This includes establishing global policy, monitoring risk profiles and forward-looking risk identification and management. Global Risk also has functional responsibility for risk management in support of HSBC’s global businesses and regions through its Risk sub-functions, which are independent from the sales and trading functions of the Group’s businesses. This independence ensures the necessary balance in risk/return decisions.
HSBC HOLDINGS PLC
104 |
Table of Contents
Banking and insurance risks
The material risk types associated with our banking and insurance manufacturing operations are described in the tables below.
Description of risks – banking operations
| Risks | Arising from | Measurement, monitoring and management of risk | ||||
| Credit risk(page 118) | ||||||
| The risk of financial loss if a customer or counterparty fails to meet an obligation under a contract. | Credit risk arises principally from direct lending, trade finance and leasing business, but also from certain other products such as guarantees and derivatives. | Credit risk is: • measured as the amount which could be lost if a customer or counterparty fails to make repayments. In the case of derivatives, the measurement of exposure takes into account the current mark-to-market value to HSBC of the contract and the expected potential change in that value over time caused by movements in market rates; • monitored within limits approved by individuals within a framework of delegated authorities. These limits represent the peak exposure or loss to which HSBC could be subjected should the customer or counterparty fail to perform its contractual obligations; and • managed through a robust risk control framework which outlines clear and consistent policies, principles and guidance for risk managers. | ||||
| Liquidity and funding risk(page 154) | ||||||
| The risk that we do not have sufficient financial resources to meet our obligations as they fall due or that we can only do so at excessive cost. | Liquidity risk arises from mismatches in the timing of cash flows.
Funding risk arises when the liquidity needed to fund illiquid asset positions cannot be obtained at the expected terms and when required. | Liquidity and funding risk is: • measured using internal metrics including stressed operational cash flow projections, coverage ratios and advances to core funding ratios; • monitored against the Group’s liquidity and funding risk framework and overseen by regional Asset and Liability Management Committees (‘ALCO’s), Group ALCO and the RMM; and • managed on a stand-alone basis with no reliance on any Group entity (unless pre-committed) or central bank unless this represents routine established business-as-usual market practice. | ||||
| Market risk(page 166) | ||||||
| The risk that movements in market factors, including foreign exchange rates and commodity prices, interest rates, credit spreads and equity prices, will reduce our income or the value of our portfolios. | Exposure to market risk is separated into two portfolios: • trading portfolios comprise positions arising from market-making and warehousing of customer-derived positions. • non-trading portfolios comprise positions that primarily arise from the interest rate management of our retail and commercial banking assets and liabilities, financial investments designated as available for sale and held to maturity, and exposures arising from our insurance operations (page 180). | Market risk is: • measured in terms of value at risk, which is used to estimate potential losses on risk positions as a result of movements in market rates and prices over a specified time horizon and to a given level of confidence, augmented with stress testing to evaluate the potential impact on portfolio values of more extreme, though plausible, events or movements in a set of financial variables; • monitored using measures including the sensitivity of net interest income and the sensitivity of structural foreign exchange which are applied to the market risk positions within each risk type; and • managed using risk limits approved by the GMB for HSBC Holdings and our various global businesses. These units are allocated across business lines and to the Group’s legal entities. | ||||
HSBC HOLDINGS PLC
105 |
Table of Contents
Report of the Directors: Risk(continued)
Managing risk
| Risks | Arising from | Measurement, monitoring and management of risk | ||||
| Operational risk(page 176) | ||||||
| The risk of loss resulting from inadequate or failed internal processes, people and systems or from external events, including legal risk. | Operational risk arises from day to day operations or external events, and is relevant to every aspect of our business.
Compliance risk and Fiduciary risk are discussed below. Other operational risks are covered in the Appendix to Risk (page 217). | Operational risk is:
• measured using both the top risk analysis process and the risk and control assessment process, which assess the level of risk and effectiveness of controls;
• monitored using key indicators and other internal control activities; and
• managedprimarily by global business and functional managers. They identify and assess risks, implement controls to manage them and monitor the effectiveness of these controls utilising the operational risk management framework. Global Operational Risk is responsible for the framework and for overseeing the management of operational risks within global businesses and global functions. | ||||
| Compliance risk(page 178) | ||||||
| The risk that we fail to observe the letter and spirit of all relevant laws, codes, rules, regulations and standards of good market practice, and incur fines and penalties and suffer damage to our business as a consequence. | Compliance risk is part of operational risk, and arises from rules, regulations, other standards and Group policies, including those relating to anti-money laundering, anti-bribery and corruption, counter-terrorist and proliferation financing, sanctions compliance and conduct of business.
The US DPA is discussed on page 113 and the Monitor on page 116. | Compliance risk is:
• measured by reference to identified metrics, incident assessments (whether affecting HSBC or the wider industry), regulatory feedback and the judgement and assessment of compliance officers in our global businesses, regions and functions;
�� monitored against our compliance risk assessments and metrics, the results of the monitoring and control activities of the second line of defence functions, including the Financial Crime Compliance and Regulatory Compliance sub-functions, and the results of internal and external audits and regulatory inspections; and
• managed by establishing and communicating appropriate policies and procedures, training employees in them, and monitoring activity to assure their observance. Proactive risk control and/or remediation work is undertaken where required. | ||||
| Other material risks | ||||||
| Reputational risk(page 189) | ||||||
| The risk of failure to meet stakeholder expectations as a result of any event, behaviour, action or inaction, either by HSBC itself, our employees or those with whom we are associated, that might cause stakeholders to form a negative view of the Group. This may result in financial or non-financial impacts, loss of confidence, or other consequences. | Primary reputational risks arise directly from an action or inaction by HSBC, its employees or associated parties that are not the consequence of another type of risk. Secondary reputational risks are those arising indirectly and are a result of another risk caused either by HSBC, its employees or associated third parties. | Reputational risk is:
• measured by reference to our reputation as indicated by our dealings with all relevant stakeholders, including media, regulators, customers and employees;
• monitored through a reputational risk management framework that is integrated into the Group’s broader risk taxonomy; and
• managed by every member of staff and is covered by a number of policies and guidelines. There is a clear structure of committees and individuals charged with mitigating reputational risk, including the Group Reputational Risk Policy Committee, the Global Risk Resolution Committee and reputational risk committees in the regions and global businesses. | ||||
| Fiduciary risk(page 189) | ||||||
| The risk of breaching our fiduciary duties, defined as any duty where HSBC holds, manages, oversees or has responsibilities for assets for a third party that involves a legal and/or regulatory duty to act with the highest standard of care and with utmost good faith. | Fiduciary risk is part of operational risk, and arises from our business activities where we act in a fiduciary capacity (‘designated businesses’) as Trustee, Investment Manager or as mandated by law or regulation. | Fiduciary risk is:
• measured by each designated business monitoring against their own risk appetite statements and by the operational risk and control assessment process, which assesses the level of risk and the effectiveness of the key controls;
• monitored through a combination of testing, key indicators and other metrics such as client and regulatory feedback; and
• managed within the designated businesses via established governance frameworks, and comprehensive policies, procedures and training programmes. | ||||
HSBC HOLDINGS PLC
106 |
Table of Contents
| Risks | Arising from | Measurement, monitoring and management of risk | ||||
| Pension risk(page 189) | ||||||
| The risk that contributions from Group companies and members fail to generate sufficient funds to meet the cost of accruing benefits for the future service of active members, and the risk that the performance of assets held in pension funds is insufficient to cover existing pension liabilities. | Pension risk arises from investments delivering an inadequate return, economic conditions leading to corporate failures, adverse changes in interest rates or inflation, or members living longer than expected (longevity risk). Pension risk includes operational risks listed above. | Pension risk is:
• measured in terms of the schemes’ ability to generate sufficient funds to meet the cost of their accrued benefits;
• monitored through the specific risk appetite that has been developed at both Group and regional levels; and
• managed locally through the appropriate pension risk governance structure and globally through the RMM. | ||||
| Sustainability risk(page 190) | ||||||
| The risk that financial services provided to customers by the Group indirectly result in unacceptable impacts on people or on the environment. | Sustainability risk arises from the provision of financial services to companies or projects which indirectly result in unacceptable impacts on people or on the environment. | Sustainability risk is:
• measured by assessing the potential sustainability effect of a customer’s activities and assigning a Sustainability Risk Rating to all high risk transactions;
• monitored quarterly by the RMM and monthly by Group Sustainability Risk; and
• managed using sustainability risk policies covering project finance lending and sector-based sustainability policies for sectors and themes with potentially high environmental or social impacts. | ||||
Our insurance manufacturing subsidiaries are separately regulated from our banking operations. Risks in the insurance entities are managed using methodologies and processes appropriate to insurance activities, but remain subject to oversight at Group level. Our insurance
operations are also subject to the operational risks and the other material risk types presented above in relation to the banking operations, and these are covered by the Group’s risk management processes.
Description of risks – insurance manufacturing operations
| Risks | Arising from | Measurement, monitoring and management of risk | ||||
| Financial risks(page 183) | ||||||
Our ability to effectively match the liabilities arising under insurance contracts with the asset portfolios that back them is contingent on the management of financial risks such as market, credit and liquidity risks, and the extent to which these risks are borne by the policyholders.
Liabilities to policyholders under unit-linked contracts move in line with the value of the underlying assets, and as such the policyholder bears the majority of the financial risks.
Contracts with DPF share the performance of the underlying assets between policyholders and the shareholder in line with the type of contract and the specific contract terms. | Exposure to financial risks arises from:
• market risk of changes in the fair values of financial assets or their future cash flows from fluctuations in variables such as interest rates, foreign exchange rates and equity prices;
• credit risk and the potential for financial loss following the default of third parties in meeting their obligations; and
• liquidity risk of entities not being able to make payments to policyholders as they fall due as there are insufficient assets that can be realised as cash. | Financial risks are:
• measured separately for each type of risk:
– market risk is measured in terms of exposure to fluctuations in key financial variables;
– credit risk is measured as the amount which could be lost if a customer or counterparty fails to make repayments; and
– liquidity risk is measured using internal metrics including stressed operational cash flow projections.
• monitored within limits approved by individuals within a framework of delegated authorities; and
• managed through a robust risk control framework which outlines clear and consistent policies, principles and guidance for risk managers. Subsidiaries manufacturing products with guarantees are usually exposed to falls in market interest rates and equity prices to the extent that the market exposure cannot be managed by utilising any discretionary participation (or bonus) features within the policy contracts they issue. | ||||
HSBC HOLDINGS PLC
107 |
Table of Contents
Report of the Directors: Risk(continued)
Risks managed by HSBC
| Risks | Arising from | Measurement, monitoring and management of risk | ||||
| Insurance risk(page 188) | ||||||
| The risk that, over time, the cost of the contract, including claims and benefits may exceed the total amount of premiums and investment income received. | The cost of claims and benefits can be influenced by many factors, including mortality and morbidity experience, lapse and surrender rates. | Insurance risk is:
• measured in terms of life insurance liabilities;
• monitored by the RBWM Risk Management Committee, which checks the risk profile of the insurance operations against a risk appetite for insurance business agreed by the GMB; and
• managed both centrally and locally using product design, underwriting, reinsurance and claims-handling procedures. | ||||
Risks incurred in our business activities
The chart below provides a high level guide to how our business activities are reflected in our risk measures and in the Group’s balance sheet. The third-party assets and
liabilities indicate the contribution each business makes to the balance sheet, while RWAs illustrate the relative size of the risks incurred in respect of each business.
Exposure to risks arising from the business activities of global businesses
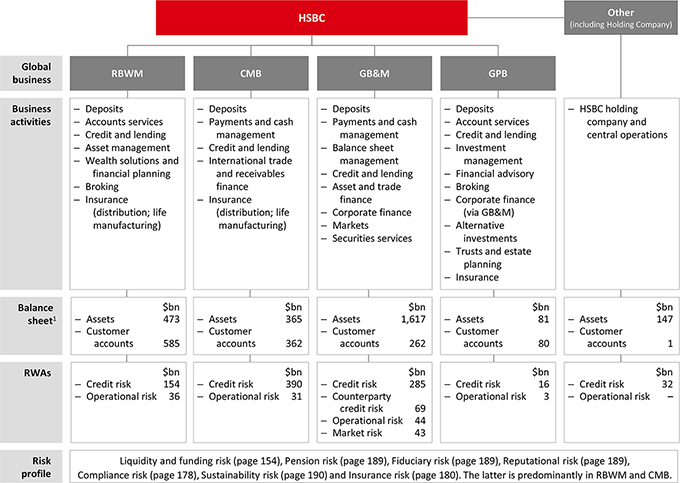
For footnote, see page 191.
We have identified a comprehensive suite of risk factors which covers the broad range of risks our businesses are exposed to.
A number of the risk factors have the potential to affect the results of our operations or financial condition, but may not necessarily be deemed as top or emerging risks. However, they inform the ongoing assessment of our top and emerging risks. The risk factors are:
Macroeconomic and geopolitical risk
| • | Current economic and market conditions may adversely affect our results. |
| • | We are subject to political and economic risks in the countries in which we operate, including the risk of government intervention. |
| • | We may suffer adverse effects as a result of the interaction between market perceptions surrounding mainland China’s slowdown, the course of global monetary policies, economic conditions in the eurozone and damage from plummeting oil prices, all of which may result in further capital outflows from emerging markets. |
HSBC HOLDINGS PLC
108 |
Table of Contents
| • | Changes in foreign currency exchange rates may affect our results. |
Macro-prudential, regulatory and legal risks to our business model
| • | Failure to implement and adhere to our obligations under the deferred prosecution agreements could have a material adverse effect on our results and operations. |
| • | We may fail to effectively manage affiliate risk. |
| • | Failure to comply with certain regulatory requirements could have a material adverse effect on our results and operations. |
| • | We may fail to meet the requirements of regulatory stress tests. |
| • | We are subject to a number of legal and regulatory actions and investigations, the outcomes of which are inherently difficult to predict. |
| • | We are subject to unfavourable legislative or regulatory developments and changes in the policy of regulators or governments. |
| • | We may fail to comply with all applicable regulations, particularly any changes thereto. |
| • | We and our UK subsidiaries may become subject to stabilisation provisions under the Banking Act 2009, as amended, in certain significant stress situations. |
| • | Structural separation of banking and trading activities proposed or enacted in a number of jurisdictions could have a material adverse effect on us. |
| • | We are subject to tax-related risks in the countries in which we operate. |
Risks related to our business, business operations, governance and internal control systems
| • | The delivery of our strategic actions is subject to execution risk. |
| • | We may not achieve any of the expected benefits of our strategic initiatives. |
| • | We may fail to increase the cross-selling and/or business synergies required to achieve our growth strategy. |
| • | We operate in markets that are highly competitive. |
| • | Our risk management measures may not be successful. |
| • | Operational risks are inherent in our business. |
| • | Our operations are subject to the threat of fraudulent activity. |
| • | Our operations are subject to disruption from the external environment. |
| • | Our operations utilise third-party suppliers and service providers. |
| • | Our operations are highly dependent on our information technology systems. |
| • | We may not be able to meet regulatory requests for data. |
| • | Our operations have inherent reputational risk. |
| • | We may suffer losses due to employee misconduct. |
| • | We rely on recruiting, retaining and developing appropriate senior management and skilled personnel. |
| • | Our financial statements are based in part on judgements, estimates and assumptions which are subject to uncertainty. |
| • | We could incur losses or be required to hold additional capital as a result of model limitations or failure. |
| • | Third parties may use us as a conduit for illegal activities without our knowledge. |
| • | We have significant exposure to counterparty risk. |
| • | Market fluctuations may reduce our income or the value of our portfolios. |
| • | Liquidity, or ready access to funds, is essential to our businesses. |
| • | Any reduction in the credit rating assigned to HSBC Holdings, any subsidiaries of HSBC Holdings or any of their respective debt securities could increase the cost or decrease the availability of our funding and adversely affect our liquidity position and interest margin. |
| • | Risks concerning borrower credit quality are inherent in our businesses. |
| • | Our insurance businesses are subject to risks relating to insurance claim rates and changes in insurance customer behaviour. |
| • | HSBC Holdings is a holding company and, as a result, is dependent on loan payments and dividends from its subsidiaries to meet its obligations, including obligations with respect to its debt securities, and to provide profits for payment of future dividends to shareholders. |
| • | We may be required to make substantial contributions to our pension plans. |
HSBC HOLDINGS PLC
109 |
Table of Contents
Report of the Directors: Financial Review(continued)
Macroeconomic and geopolitical risk
Current economic and market conditions may adversely affect our results
Our earnings are affected by global and local economic and market conditions. Economic growth remained weak in 2015, with a number of headwinds adversely affecting both developed and emerging market countries. Oil and gas prices continued to fall sharply in 2015 and in early 2016 while the slowdown of the mainland Chinese economy dampened global trade and caused volatility in currency and global stock markets. Uncertainties remain concerning the outlook and the future economic environment and there can be no assurance that the global economy as a whole will improve significantly or at all.
The uncertain and at times volatile economic conditions continue to create a challenging operating environment for financial services companies such as HSBC. In particular, we may face the following challenges to our operations and operating model in connection with these factors:
| • | the demand for borrowing from creditworthy customers may diminish if economic activity slows or remains subdued; |
| • | as capital flows are increasingly disrupted, some emerging markets have imposed protectionist measures that could affect financial institutions and their clients, and others may be tempted to follow suit; |
| • | European banks may come under renewed stress as subdued economic conditions raise asset quality worries, particularly in the EU, and uncertainties about the new EU bank resolution regime raise funding costs; |
| • | geopolitical risks, which remain elevated in many parts of the world, directly affect the economies of the countries in which we operate and present a clear risk of disruption to the global economy due to links to the global resources supply chain; |
| • | the prolonged period of low, or negative, interest rates constrains, for example, through margin compression and low returns on assets, the net interest income we earn from investing our excess deposits; |
| • | our ability to borrow from other financial institutions or to engage in funding transactions may be adversely affected by market disruption, for example, in the event of contagion from stress in the eurozone sovereign and financial sectors; and |
| • | market developments may depress consumer and business confidence beyond expected levels. If economic growth remains subdued, for example, asset prices and payment patterns may be adversely affected, leading to greater than expected increases in our delinquencies, default rates, write-offs and loan impairment charges. |
The occurrence of any of these events or circumstances could have a material adverse effect on our business prospects, financial condition, customers and results of operations.
We are subject to political and economic risks in the countries in which we operate, including the risk of government intervention
We operate through an international network of subsidiaries and affiliates in over 70 countries and territories around the world. Our results are, therefore, subject to the risks of loss from unfavourable political developments, currency fluctuations, social instability and changes in government policies. These may take the form of expropriation, restrictions on international ownership, interest-rate caps, limits on dividend flows and tax in the jurisdictions in which we operate.
In the Middle East, the intervention of Russia and the rise of the terrorist group, Daesh, has added to an already complex and divisive civil war in Syria and further destabilised Iraq. The lifting of sanctions following a deal between Iran and the five permanent members of the UN Security Council on the country’s nuclear programme has done little to calm regional tensions. Conflict in Ukraine has continued, despite a ceasefire agreement being signed in early 2015.
European states are experiencing heightened political tension, reflecting concerns over migration, fears of terrorism and the possibility that the UK may vote to exit the EU following a referendum expected to occur within the lifetime of the current Parliament, and as early as mid-2016. An exit could have a significant impact on UK, European and global macroeconomic conditions, as well as substantial political ramifications.
In Asia, territorial disputes between Japan and mainland China and other states have strained diplomatic relations and are testing the resolve of the US to defend freedom of navigation.
Continued unfavourable political developments could have a material adverse effect on our business, prospects, financial condition and results of operations.
We may suffer adverse effects as a result of the interaction between market perceptions surrounding mainland China’s slowdown, the course of global monetary policies, economic conditions in the eurozone and damage from plummeting oil prices, all of which may result in further capital outflows from emerging markets
Market confidence in mainland Chinese growth and the adequacy of policymaking is waning, causing heightened volatility. The authorities have to find a difficult balance between socio-economic stability and the pursuit of financial system liberalisation. A scenario where the government includes a sharp devaluation in a package of measures to stimulate the economy could prompt large capital outflows and have a negative knock-on impact on the world economy.
With regard to the FRB’s monetary policy, the prevailing market view is that a course of gradually tightening economic conditions will be pursued against the backdrop of subdued inflation. Should the FRB instead tighten monetary policy more quickly, the consequent realignment of market expectations would likely accelerate capital outflows from emerging markets. Alternatively, the FRB could be forced by poor economic performance into a policy reversal, which would increase market volatility.
HSBC HOLDINGS PLC
109a |
Table of Contents
Report of the Directors: Financial Review(continued)
Oil prices have fallen precipitously since mid-2014 as a result of increasing uncertainty surrounding the mainland Chinese economy as well as the backdrop of an oversupplied oil market. Consequently, any recovery in oil prices may be gradual. This may complicate policymakers’ tasks of raising inflation, and could potentially threaten the stability of some oil-exporting countries.
Economic conditions in the eurozone continue to be uncertain. Any default on the sovereign debt of Greece or any eurozone nation and the resulting impact on other eurozone countries could have a material adverse effect on us, including (a) significant market dislocation, (b) heightened counterparty risk and (c) an adverse effect on the management of market risk.
Moreover, a significant number of financial institutions throughout Europe have substantial exposures to sovereign debt issued by eurozone nations that are under severe financial stress. Should any of those nations default on their debt or experience a significant widening of credit spreads, major financial institutions and banking systems throughout Europe could be destabilised, resulting in, among other things, significant disruptions in financial activities.
Any significant changes in UK government policies or political structure could have an impact on our business. Uncertainty over the forthcoming EU referendum, which must be held in the UK before 31 December 2017, could worsen global market conditions. The outcome of this referendum, or any other major UK political developments, could affect the fiscal, monetary and regulatory landscape to which we are subject.
Unfavourable market conditions and global monetary policies could have a material adverse effect on our business, prospects, financial condition and results of operations.
Changes in foreign currency exchange rates may affect our results
We prepare our accounts in US dollars because the US dollar and currencies linked to it form the major currency bloc in which we transact and fund our business. A substantial portion of our assets, liabilities, assets under management, revenues and expenses are denominated in other currencies. Changes in foreign exchange rates, including those which may result from a currency becoming de-pegged from the US dollar, have an effect on our reported income, cash flows and shareholders’ equity and could have a material adverse effect on our business, prospects, financial condition and results of operations.
Macro-prudential, regulatory and legal risks to our business model
Failure to implement and adhere to our obligations under the deferred prosecution agreement could have a material adverse effect on our results and operations
An independent compliance monitor (‘the Monitor’) was appointed in 2013 under the 2012 agreements entered into with the US DoJ and the UK FCA to produce annual
assessments of the effectiveness of our AML and sanctions compliance programme. Additionally, the Monitor is serving as HSBC’s independent consultant under the consent order of the US FRB. HSBC Bank USA is also subject to an agreement entered into with the OCC in December 2012, the Gramm-Leach-Bliley Act (‘GLBA’) Agreement and other consent orders. In January 2016, the Monitor delivered has second annual follow-up review report as required by the US DPA. The Monitor’s report is discussed on page 116 of theAnnual Report and Accounts 2015.
The design and execution of AML and sanctions remediation plans are complex and require major investments in people, systems and other infrastructure. This complexity creates significant execution risk, which could affect our ability to effectively identify and manage financial crime risk and remedy AML and sanctions compliance deficiencies in a timely manner. This could, in turn, impact our ability to satisfy the Monitor or comply with the terms of the US DPA and related agreements and consent orders, and may require us to take additional remedial measures in the future.
Under the terms of the US DPA, upon notice and an opportunity to be heard, the DoJ has sole discretion to determine whether HSBC has breached the US DPA. Potential consequences of breaching the US DPA could include the imposition of additional terms and conditions on HSBC, an extension of the agreement, including its monitorship, or the criminal prosecution of HSBC, which could, in turn, entail further financial penalties and collateral consequences.
Breach of the US DPA or related agreements and consent orders could have a material adverse effect on our business, financial condition and results of operations, including loss of business and withdrawal of funding, restrictions on performing dollar-clearing functions through HSBC Bank USA or revocation of bank licences. Even if we are not determined to have breached these agreements, but the agreements are amended or their terms extended, our business, reputation and brand could suffer materially.
We may fail to effectively manage affiliate risk
HSBC Bank USA, as the primary US dollar correspondent bank for the Group, is subject to heightened financial crime risk arising from business conducted on behalf of clients as well as its non-US HSBC affiliates. If HSBC Bank USA fails to conduct adequate due diligence on clients, including its affiliates, or otherwise inappropriately processes US dollar payments on behalf of non-US HSBC affiliates, it could be in breach of applicable US AML and sanctions laws and regulations, become subject to legal or regulatory enforcement actions by OFAC or other US agencies and be required to pay substantial fines or penalties. In addition, any such breaches of US legislation would likely constitute a breach of the US DPA, leading to the potential consequences
HSBC HOLDINGS PLC
109b |
Table of Contents
Report of the Directors: Financial Review(continued)
described under ‘Failure to implement and adhere to our obligations under the deferred prosecution agreement could have a material adverse effect on our results and operations’. In particular, any such breaches could result in legal judgements that may compel HSBC to restructure its operations or cease to offer certain products or services, which could potentially include a suspension or restriction of HSBC Bank USA’s ability to process US dollar payment transactions, all of which would have a material adverse effect on our business, financial condition, results of operations and prospects.
Failure to comply with certain regulatory requirements would have a material adverse effect on our results and operations
As reflected in the agreement entered into with the OCC in December 2012 (‘the GLBA Agreement’), the OCC has determined that HSBC Bank USA is not in compliance with the requirements that a national bank, and each depository institution affiliate of the national bank, must be both well capitalised and well managed in order to own or control a financial subsidiary. As a result, HSBC Bank USA and its parent holding companies, including HSBC Holdings, do not meet the qualification requirements for financial holding company status. If all of our affiliate depositary institutions are not in compliance with these requirements within the time periods specified in the GLBA Agreement, as they may be extended, HSBC could be required either to divest HSBC Bank USA or to divest or terminate any financial activities conducted in reliance on financial holding company status under the GLBA. Similar consequences could result for financial subsidiaries of HSBC Bank USA that engage in activities in reliance on expanded powers provided for in the GLBA. Any such divestiture or termination of activities would have a material adverse effect on our business, prospects, financial condition and results of operation.
We may fail to meet the requirements of regulatory stress tests
We are subject to regulatory stress testing in many jurisdictions. These exercises are designed to assess the resilience of banks to adverse economic or financial developments and ensure that they have robust, forward-looking capital planning processes that account for the risks associated with their business profile. Assessment by regulators is on both a quantitative and qualitative basis, the latter focusing on our data provision, stress testing capability and internal management processes and controls.
During 2015, we participated in the regulatory stress test programmes of the PRA, the FRB and the OCC among others, which are described on page 116 of theAnnual Report and Accounts 2015.
Failure to meet quantitative or qualitative requirements of regulatory stress test programmes, or the failure by regulators to approve our stress results and capital plans, could have a material adverse effect on our prospects, financial condition and results of operations.
We are subject to a number of legal and regulatory actions and investigations, the outcomes of which are inherently difficult to predict
We face significant legal and regulatory risks in our business. The volume and amount of damages claimed in litigation, regulatory proceedings and other adversarial proceedings against financial institutions are increasing for many reasons, including a substantial increase in the number of regulatory changes taking place globally, increased media attention and higher expectations from regulators and the public. In addition, criminal prosecutions of financial institutions for, among other things, alleged conduct, breaches of AML and sanctions regulations, antitrust violations, market manipulation, aiding and abetting tax evasion and providing unlicensed cross-border banking services, have become more commonplace and may increase in frequency due to increased media attention and higher expectations from prosecutors and the public. Any such prosecution of HSBC or one or more of its subsidiaries could result in substantial fines, penalties and/or forfeitures and could have a material adverse effect on our business, financial condition, results of operations, prospects and reputation, including the potential loss of key licences, requirement to exit certain businesses and withdrawal of funding from depositors and other stakeholders.
Additionally, we continue to be subject to a number of material legal proceedings, regulatory actions and investigations (including criminal) as described in Note 40 on the Financial Statements. It is inherently difficult to predict the outcome of many of the legal, regulatory and other adversarial proceedings involving our businesses, particularly those cases in which the matters are brought on behalf of various classes of claimants, seek damages of unspecified or indeterminate amounts or involve novel legal claims. Moreover, we may face additional legal proceedings, investigations or regulatory actions in the future, including in other jurisdictions and/or with respect to matters similar to, or broader than, the existing legal proceedings, investigations or regulatory actions. An unfavourable result in one or more of these proceedings could have a material adverse effect on our business, prospects, financial condition, reputation and/or results of operations.
We are subject to unfavourable legislative or regulatory developments and changes in the policy of regulators or governments
Our businesses are subject to ongoing regulation and associated regulatory risks, including the effects of changes in the laws, regulations, policies, voluntary codes of practice and interpretations in the UK, the US, Hong Kong, the EU and the other markets in which we operate. This is particularly so in the current environment, where we expect government and regulatory intervention in the banking sector to continue to remain high for the foreseeable future. Additionally, many of these changes increasingly have an effect beyond the country in which they are enacted as regulators either deliberately enact
HSBC HOLDINGS PLC
109c |
Table of Contents
Report of the Directors: Financial Review(continued)
regulation with extra-territorial impact or our operations mean that the Group is obliged to give effect to ‘local’ laws and regulations on a wider basis.
In recent years, regulators and governments have focused on reforming both the prudential regulation of the financial services industry to improve financial stability, and the ways in which business is conducted. Measures include enhanced capital, liquidity and funding requirements, the separation or prohibition of certain activities by banks, changes in the operation of capital markets activities, the introduction of tax levies and transaction taxes, changes in compensation practices and adjustments to how business is conducted. The US Government, the UK Government, our regulators in the UK, US, Hong Kong, the EU or elsewhere may intervene further in relation to areas of industry risk already identified, or in new areas, which could adversely affect us.
HSBC has been classified by the Financial Stability Board (‘FSB’) as a global systemically important bank (‘G-SIB’) and therefore is subject to what the FSB refers to as a ‘multi-pronged and integrated set of policies’. These include proposals that would place additional capital and total loss absorbing capacity (‘TLAC’) requirements on the Group and require enhanced reporting. In December 2015, the PRA reconfirmed that HSBC is a designated global systemically important institution (‘G-SII’), the EU equivalent of G-SIB, subject to a 2.5% CET1 buffer requirement from 2019. The FRB’s rules implementing the G-SIB surcharge in the US would only apply to US G-SIBs and would not impose additional capital requirements on HNAH. For further details on the FRB’s TLAC proposal in the US, see page 100f.
Separately, the Bank Recovery Resolution Directive (‘BRRD’) introduces requirements for European banks to maintain at all times a sufficient aggregate amount of own funds and ‘eligible liabilities’ (that is, liabilities that may be bailed in using the bail-in tool), known as the minimum requirements for eligible liabilities (‘MREL’). The TLAC proposals from the FSB address many of the same issues. The PRA is consulting on the application of MREL regulations as required by the EU, whilst at the same time considering their compatibility with the TLAC proposals. The extent to which the detail of the implementation may create issues remains uncertain.
More stringent regulatory requirements, including enhanced capital, liquidity and funding requirements and those governing the development of parameters applied in, and controls around, models used for measuring risk can give rise to changes that may adversely affect our business, including increases in capital requirements.
There may be changes in laws, rules or regulations, or in their interpretation or enforcement, or in how new laws, rules or regulations are implemented. Further, there may be uncertainty and lack of international regulatory coordination as enhanced supervisory standards are developed and implemented. These developments are expected to continue to change the way in which we are regulated and supervised and could affect the manner in which we conduct our business activities, capital requirements, risk management or how the Group is structured; which could
have a material adverse effect on our business, prospects, financial condition, reputation and results of operations.
We may fail to comply with all applicable regulations, particularly any changes thereto.
Authorities in many jurisdictions have the power to bring administrative or judicial proceedings against us which could result in, among other things, the suspension or revocation of our licences, cease and desist orders, fines, civil penalties, criminal penalties or other disciplinary action.
Areas where changes could have an adverse effect on our business, prospects, financial condition or results of operations include, but are not limited to:
| • | general changes in government, central bank or regulatory or competition policy, or changes in regulatory regimes that may influence investor decisions in particular markets in which we operate; |
| • | the structural separation of banking and trading activities proposed or enacted in a number of jurisdictions (see above); |
| • | requirements flowing from arrangements for the resolution strategy of the Group and its individual operating entities, which may have different effects in different countries; |
| • | the implementation of extra-territorial laws, including initiatives to share tax information such as the Common Reporting Standard introduced by the OECD; |
| • | the implementation of CRD IV, notably the UK application of the capital buffer framework and its interaction with Pillar 2 and the PRA buffer; |
| • | the implementation of the BRRD’s minimum requirements for eligible liabilities, MREL, by the Bank of England and its interaction with TLAC requirements for G-SIBs in other jurisdictions; |
| • | the international developments on non-modelled, standardised requirements for credit and operational risk, and the use of capital floors; |
| • | the implementation, particularly in the US and Hong Kong, of TLAC requirements established by the FSB which require G-SIBs to hold minimum levels of capital and TLAC at the level of each resolution entity and material subgroup. Under the FSB Standard, G-SIBs are required to meet the TLAC requirement alongside the minimum regulatory capital requirements set out in the Basel III framework. Specifically, they will be required to meet a minimum TLAC requirement of at least 16% of the resolution group’s risk-weighted assets (TLAC RWA minimum) from 1 January 2019 and at least 18% from 1 January 2022. Minimum TLAC must also be at least 6% of the Basel III leverage ratio denominator from 1 January 2019 and at least 6.75% from 1 January 2022; |
| • | the increasing focus by regulators on how institutions conduct business, particularly with regard to the delivery of fair outcomes for customers and |
HSBC HOLDINGS PLC
109d |
Table of Contents
Report of the Directors: Financial Review(continued)
| orderly/transparent markets, promoting effective competition in the interests of consumers and ensuring the orderly and transparent operation of global financial markets; |
| • | restrictions on the structure of remuneration and increasing requirements to detail management accountability within the Group (e.g. the requirements of the Senior Managers and Certification Regime in the UK); |
| • | the continued focus in the UK on matters relating to institutional ‘culture’, employee conduct and obligations more generally such as whistleblowing; |
| • | the implementation of any measures as a result of regulators’ increased focus on ‘conduct’ matters, including measures resulting from ongoing thematic work into the workings of the retail, SME and wholesale banking sectors and the provision of financial advice to consumers; |
| • | external bodies applying or interpreting standards or laws differently to us; |
| • | further requirements relating to financial reporting, corporate governance and employee compensation; and |
| • | expropriation, nationalisation, confiscation of assets and changes in legislation or regulations relating to foreign ownership. |
We and our UK subsidiaries may become subject to stabilisation provisions under the Banking Act 2009, as amended, in certain significant stress situations
The Banking Act 2009, as amended (the ‘Banking Act’) implements Directive 2014/59/EU establishing the framework for the recovery and resolution of credit institutions and investment firms (the ‘BRRD’) in the UK and creates a special resolution regime (the ‘SRR’). Under the SRR, the HM Treasury, the Bank of England and the PRA and FCA (together, the ‘Authorities’) are granted substantial powers to resolve and stabilise UK-incorporated institutions with permission to accept deposits pursuant to Part 4A of the FSMA that are failing or are likely to fail to satisfy the threshold conditions (within the meaning of section 55B of the FSMA) where it is in the public interest to do so. The SRR presently consists of five stabilisation options: (i) transfer of all of the business of a relevant entity or the shares of the relevant entity to a private sector purchaser; (ii) transfer of all or part of the business of the relevant entity to a ‘bridge bank’ wholly-owned by the Bank of England; (iii) transfer of part of the assets, rights or liabilities of the relevant entity to one or more asset management vehicles for management of the transferor’s assets, rights or liabilities; (iv) the write down and conversation of the relevant entity’s equity, capital
instruments and liabilities; and (v) temporary public ownership of the relevant entity. These tools may also be applied to a parent company or affiliate of a relevant entity where certain conditions are met. The SRR provides for modified insolvency and administration procedures for relevant entities too. It also confers ancillary powers on the Authorities, including the power to modify or override certain contractual arrangements in certain circumstances. The Authorities are also empowered by order to amend the law for the purpose of enabling the powers under the SRR to be used effectively. An order may make provision which has retrospective effect.
In general, the Banking Act requires the Authorities to have regard to specified objectives in exercising the powers provided for by the Banking Act. One of the objectives (which is required to be balanced as appropriate with the other specified objectives) refers to the protection and enhancement of the stability of the financial system of the UK. The Banking Act includes provisions related to compensation in respect of transfer instruments and orders made under it.
There is considerable uncertainty about how the Authorities may exercise the powers granted to them under the Banking Act. However, if we are at or approaching the point of non-viability such as to require regulatory intervention, any exercise of any resolution regime powers by the Authorities may result in holders of our ordinary shares losing all or a part of their shareholdings and/or in the rights of holders of our ordinary shares being adversely affected, including by the dilution of their percentage ownership of our share capital, and/or could have a material adverse effect on the market price of our ordinary shares and/or holders of other instruments being adversely affected.
Structural separation of banking and trading activities proposed or enacted in a number of jurisdictions could have a material adverse effect on us
In December 2013, the UK Financial Services (Banking Reform) Act 2013 received Royal Assent. It implements the recommendations of the Independent Commission on Banking which, among other things, establish a framework for ‘ring-fencing’ UK retail banking in separately incorporated banking entities (‘ring-fenced banks’) from trading activities. Secondary legislation has also been finalised. The PRA has finalised the first phase of the rules on UK ring-fenced banks, covering legal structures, governance and operations. The PRA has also published a consultation on the second phase of ring-fencing rules in relation to prudential requirements, intra-group arrangements and use of financial market infrastructure. Finalised rules are expected to be published in the second half of 2016, with the implementation of ring-fencing in 2019.
The proposed separation of retail and SME banking in the UK would be a material change to the structure of HSBC Bank plc. Considerable uncertainty remains over the likely cost of implementing structural separation at this time, although we expect it to be material.
HSBC HOLDINGS PLC
109e |
Table of Contents
Report of the Directors: Financial Review(continued)
In January 2014, the European Commission published legislative proposals on the structural reform of the European banking sector which would prohibit proprietary trading in financial instruments and commodities, and enable supervisors to require trading activities such as market-making, complex derivatives and securitisation operations to be undertaken in a separate subsidiary from deposit taking activities. The proposals are currently subject to discussion in the European Parliament and the Council. The implementation date for any separation under the final rules would depend upon the date on which the final legislation is agreed.
We are subject to tax-related risks in the countries in which we operate
HSBC is subject to the substance and interpretation of tax laws in all countries in which we operate and is subject to routine review and audit by tax authorities in relation thereto. We provide for potential tax liabilities that may arise on the basis of the amounts expected to be paid to the tax authorities. The amounts ultimately paid may differ materially from the amounts provided depending on the ultimate resolution of such matters. Changes to tax law, tax rates and penalties for failure to comply could have a material adverse effect on our business, prospects, financial condition and results of operations.
Risks related to our business, business operations, governance and internal control systems
The delivery of our strategic actions is subject to execution risk
At our Investor Update in June 2015, HSBC set out 10 strategic actions to be completed by 2017. Nine of these are business-led initiatives, while one is expected to be completed by the Board of Directors. The work required to execute these actions is substantial. Alongside the strategic actions, we continue to implement a number of externally driven regulatory programmes. The magnitude and complexity of the projects required to meet these demands has resulted in heightened execution risk. The cumulative impact of the collective change initiatives underway within the Group is significant and has direct implications on resourcing and our people. A failure to successfully complete our ten strategic actions or other regulatory programmes could have a significant impact on financial condition, profitability, prospects and share price, as well as wider reputational and regulatory implications.
There also remains heightened risk around the execution of a number of disposals across the Group in line with our strategy. The potential risks of disposals include regulatory breaches, industrial action, loss of key personnel and interruption to systems and processes during business transformation. They can have both financial and reputational implications and could also adversely affect the successful delivery of our strategic priorities.
We may not achieve any of the expected benefits of our strategic initiatives
The Group’s strategy (see pages 12 to 13), is built around two trends, the continued growth of international trade
and capital flows, and wealth creation, particularly in faster-growing markets. We have analysed those trends, and have developed criteria to help us better deploy capital in response thereto. The development and implementation of our strategy requires difficult, subjective and complex judgements, including forecasts of economic conditions in various parts of the world. We may fail to correctly identify the trends we seek to exploit and the relevant factors in making decisions as to capital deployment and cost reduction.
Our ability to execute our strategy may also be limited by our operational capacity and the increasing complexity of the regulatory environment in which we operate. We continue to pursue our cost management initiatives, though they may not be as effective as expected and we may be unable to meet our cost saving targets. In addition, factors beyond our control, including but not limited to, the economic and market conditions and other challenges discussed in detail above, could limit our ability to achieve any of the expected benefits of these initiatives.
Failure to achieve any of the expected benefits of our strategic initiatives could have a material adverse effect on our business, prospects, financial condition and results of operations.
We may fail to increase the cross-selling and/or business synergies required to achieve our growth strategy
Increasing the number of HSBC products held by our customers through cross-selling and driving business synergies across our global businesses is key to our ability to grow revenue and earnings, particularly in the current environment of slow economic growth and regulatory reform initiatives. In RBWM many of our competitors also focus on cross-selling, notably in retail banking and investment products and mortgage lending. A key opportunity to drive business synergies arises between CMB and GB&M, which is an area where many of our competitors also focus. In both instances, this may limit our ability to cross-sell additional products to our customers or may influence us to sell our products at lower prices, reducing our net interest income and revenue from our fee-based products. It could also affect our ability to retain existing customers. Failure to deliver cross-selling and/or business synergies required to achieve our growth strategy could have a material adverse effect on our business, prospects, financial condition and results of operations.
We operate in markets that are highly competitive
We compete with other financial institutions in a highly competitive industry that is undergoing significant changes as a result of financial regulatory reform and increased public scrutiny stemming from the financial crisis and continued challenging economic conditions.
We target internationally mobile clients who need sophisticated global solutions and generally compete on the basis of the quality of our customer service, the wide variety of products and services that we can offer our customers and the ability of those products and services to satisfy our customers’ needs, the extensive distribution channels available for our customers, our innovation, and
HSBC HOLDINGS PLC
109f |
Table of Contents
Report of the Directors: Financial Review(continued)
our reputation. Continued and increased competition in any one or all of these areas may negatively affect our market share and/or cause us to increase our capital investment in our businesses in order to remain competitive. Additionally, our products and services may not be accepted by our targeted clients.
In many markets, there is increased competitive pressure to provide products and services at current or lower prices. Consequently, our ability to reposition or reprice our products and services from time to time may be limited and could be influenced significantly by the actions of our competitors who may or may not charge similar fees for their products and services. Any changes in the types of products and services that we offer our customers and/or the pricing for those products and services could result in a loss of customers and market share.
Further, new entrants to the market or new technologies could require us to spend more to modify or adapt our products to attract and retain customers. We may not respond effectively to these competitive threats from existing and new competitors and may be forced to increase our investment in our business to modify or adapt our existing products and services or develop new products and services to respond to our customers’ needs.
Any of these factors may have a material adverse effect on our business, prospects, financial condition and results of operations.
Our risk management measures may not be successful
The management of risk is an integral part of all our activities. Risk constitutes our exposure to uncertainty and the consequent variability of return. Specifically, risk equates to the adverse effect on profitability or financial condition arising from different sources of uncertainty including retail and wholesale credit risk, market risk, operational risk, non-traded market risk, insurance risk, concentration risk, liquidity and funding risk, litigation risk, reputational risk, strategic risk, pension obligation risk and regulatory risk. While we employ a broad and diversified set of risk monitoring and risk mitigation techniques, such techniques and the judgements that accompany their application cannot anticipate every unfavourable event or the specifics and timing of every outcome. Failure to manage risks appropriately could have a significant effect on our business prospects, financial condition and results of operations.
Operational risks are inherent in our business
We are exposed to many types of operational risk that are inherent in banking operations including fraudulent and other criminal activities (both internal and external),
breakdowns in processes or procedures and systems failure or non-availability. These risks apply equally when we rely on outside suppliers or vendors to provide services to us and our customers. These operational risks could have a material adverse effect on our business, prospects, financial condition and results of operations.
Our operations are subject to the threat of fraudulent activity
Fraudsters may target any of our products, services and delivery channels including lending, internet banking, payments, bank accounts and cards. This may result in financial loss to the bank, an adverse customer experience, reputational damage and potential regulatory action depending on the circumstances of the event which could have a material adverse effect on our business, prospects, financial condition and results of operations.
Our operations are subject to disruption from the external environment
HSBC operates in many geographical locations, which are subject to events that are outside our control. These events may be acts of God, such as natural disasters and epidemics, geopolitical risks, including acts of terrorism and social unrest, and infrastructure issues such as transport or power failure. These risk events may give rise to disruption to our services, result in physical damage and/or loss of life, which and could have a material adverse effect on our business, prospects, financial condition and results of operations.
Our operations utilise third-party suppliers and service providers
HSBC relies on third parties to supply goods and services. Global regulators have increased their scrutiny of the use of third-party service providers by financial institutions, including with respect to how outsourcing decisions are made and how key relationships are managed. Risks arising from the use of third-parties may be less transparent and therefore more challenging to manage. The inadequate management of third-party risk could impact our ability to meet strategic, regulatory and client expectations. This may lead to a range of effects, including regulatory censure, civil penalties, or damage both to shareholder value and to our reputation, which could have a material adverse effect on our business, prospects, financial condition and results of operations.
Our operations are highly dependent on our information technology systems
The reliability and security of our information and technology infrastructure and our customer databases are crucial to maintaining the service availability of banking applications and processes and to protecting the HSBC brand. The proper functioning of our payment systems, financial control, risk management, credit analysis and reporting, accounting, customer service and other information technology systems, as well as the communication networks between our branches and main data processing centres, are critical to our operations.
HSBC HOLDINGS PLC
109g |
Table of Contents
Report of the Directors: Financial Review(continued)
Critical system failure, any prolonged loss of service availability or any material breach of data security, particularly involving confidential customer data, could cause serious damage to our ability to service our clients, could breach regulations under which we operate and could cause long-term damage to our business and brand that could have a material adverse effect on our business, prospects, financial condition and results of operations.
Cyber and information security incidents are routinely monitored for and investigated. In most instances these are not significant and are managed within normal operating processes.
However, HSBC remains susceptible to a wide range of cyber risks that impact and/or are facilitated by technology. The threat from cyber attacks is a concern for our organisation and failure to protect our operations from internet crime or cyber attacks may result in financial loss and/or loss of customer data or other sensitive information which could undermine our reputation and our ability to attract and keep customers.
For example, in 2015 a case was detected in which a former HSBC employee exposed online details of 86,000 US consumer mortgage customers, and pay details for 2,000 current and former HSBC employees. The regulators were notified, and customers contacted and offered credit protection services.
Moreover, during 2015, we were subjected to 23 ‘denial of service’ attacks on our external facing websites across the Group. A denial of service attack is the attempt to intentionally disrupt, paralyse and potentially extract data from a computer network by flooding it with data sent simultaneously from many individual computers.
Although the cyber-attacks in 2015 had a negligible effect on our customers, services or firm, future cyber attacks could have a material adverse effect on our business, prospects, financial condition, reputation and results of operations.
We may not be able to meet regulatory requests for data
The volume, granularity, frequency and scale of regulatory and other reporting requirements necessitate a clear data strategy to enable consistent data aggregation, reporting and management. Inadequate management information systems or processes, including those relating to risk data aggregation and risk reporting, could lead to a failure to meet regulatory reporting requirements or other internal or external information demands. Financial institutions that fail to comply with the principles for effective risk data aggregation and risk reporting as set out by the Basel Committee by the required deadline may face supervisory measures. Any of these failures could have a material adverse effect on our business, prospects, financial condition and results of operations.
Our operations have inherent reputational risk
Reputational risk is the risk of failure to meet stakeholder expectations as a result of any event, behaviour, action or inaction, either by HSBC, our employees or those with whom we are associated, that might cause stakeholders
to form a negative view of the Group. This may result in financial or non-financial impacts, loss of confidence or other consequences.
Modern technologies, in particular online social media channels and other broadcast tools which facilitate communication with large audiences in short time frames and with minimal costs, may significantly enhance and accelerate the effect of damaging information and allegations. It could also arise from negative public opinion about the actual, or perceived, manner in which we conduct our business activities, or financial performance, as well as actual or perceived practices in banking and the financial services industry generally. Negative public opinion may adversely affect our ability to retain and attract customers, in particular, corporate and retail depositors, and retain and motivate staff, and could have a material adverse effect on our business, prospects, financial condition, reputation and results of operations.
We may suffer losses due to employee misconduct
Our businesses are exposed to risk from potential non-compliance with policies, including HSBC Values and related behaviours, and employee misconduct such as fraud or negligence, all of which could result in regulatory sanctions or reputational or financial harm. In recent years, a number of multinational financial institutions have suffered material losses due to the actions of ‘rogue traders’ or other employees. It is not always possible to deter employee misconduct and the precautions we take to prevent and detect this activity may not always be effective. Employee misconduct could have a material adverse effect on our business, prospects, financial condition and results of operations.
We rely on recruiting, retaining and developing appropriate senior management and skilled personnel
The demands being placed on the human capital of the Group are unprecedented. The cumulative workload arising from a regulatory reform programme that is often extra-territorial and still evolving consumes significant human resources, placing increasingly complex and conflicting demands on a workforce where the required expert capabilities are in short supply and globally mobile.
Our continued success depends in part on the retention of key members of our management team and wider employee base. The ability to continue to attract, train, motivate and retain highly qualified professionals is a key element of our strategy. The successful implementation of our growth strategy depends on the availability and skilled management in each of our global businesses and global functions. If global businesses or global functions fail to staff their operations appropriately or lose one or more
HSBC HOLDINGS PLC
109h |
Table of Contents
Report of the Directors: Financial Review(continued)
of their key senior executives and fail to replace them in a satisfactory and timely manner, or fail to implement successfully the organisational changes required to support the Group’s strategy, our business prospects, financial condition and results of operations, including control and operational risks, could be materially adversely affected.
Our financial statements are based in part on judgements, estimates and assumptions which are subject to uncertainty
The preparation of financial statements requires management to make judgements, estimates and assumptions that affect the reported amounts of assets, liabilities, income and expenses. Due to the inherent uncertainty in making estimates, particularly those involving the use of complex models, actual results reported in future periods may be based upon amounts which differ from those estimates. Estimates, judgements, assumptions and models are continually evaluated and are based on historical experience and other factors, including expectations of future events that are believed to be reasonable under the circumstances. Revisions to accounting estimates are recognised in the period in which the estimate is revised and in any future periods affected. The accounting policies deemed critical to our results and financial position, based upon materiality and significant judgements and estimates, include impairment of loans and advances, goodwill impairment, valuation of financial instruments, deferred tax assets, provisions and interests in associates, which are discussed in detail in ‘Critical accounting estimates and judgements’ on page 64.
The valuation of financial instruments measured at fair value can be subjective, in particular where models are used which include unobservable inputs. Given the uncertainty and subjectivity associated with valuing such instruments, future outcomes may differ materially from those assumed using information available at the reporting date. The effect of these differences on the future results of operations and the future financial position of the Group may be material. For further details, see ‘Critical accounting estimates and judgements’ on page 64.
If the judgement, estimates and assumptions we use in preparing our consolidated financial statements are subsequently found to be materially different from those assumed using information available at the reporting date, this could affect our business, prospects, financial condition, prospects and results of operations.
We could incur losses or be required to hold additional capital as a result of model limitations or failure
HSBC uses models for a range of purposes in managing our business, including regulatory and economic capital calculations, stress testing, granting credit, pricing and financial reporting, including the valuation of financial instruments measured at fair value, as explained above. HSBC could face adverse consequences as a result of decisions, which may lead to actions by management based on models that are poorly developed, implemented or used, or as a result of the modelled outcome being misunderstood or the use of such information for purposes for which it was not designed. In addition, supervisory
concerns over the internal models and assumptions used by banks in the calculation of regulatory capital have led to the imposition of risk weight and loss given default floors, which have the potential to increase our capital requirement. Risks arising from the use of models could have a material adverse effect on our business, prospects, financial condition, results of operations, minimum capital requirements and reputation.
Third parties may use us as a conduit for illegal activities without our knowledge
We are required to comply with applicable AML laws and regulations and have adopted various policies and procedures, including internal control and ‘know your customer’ procedures, aimed at preventing use of HSBC products and services for the purpose of committing or concealing financial crime. A major focus of US and UK government policy relating to financial institutions in recent years has been combating money laundering and enforcing compliance with US and EU economic sanctions, and this prioritisation is evidenced by our agreements with US and UK authorities relating to various investigations regarding past inadequate compliance with AML and sanctions laws. Certain US subsidiaries of HSBC Holdings have entered into a consent cease and desist order with the OCC and a similar consent order with the FRB which require the implementation of improvements to compliance procedures regarding obligations under the US Bank Secrecy Act (the ‘BSA’), FCA Direction and AML rules. These consent orders do not preclude additional enforcement actions by bank regulatory, governmental or law enforcement agencies or private litigation.
A number of the remedial actions taken or being taken as a result of the matters to which the US DPA relates are intended to ensure that the Group’s businesses are better protected in respect of these risks. However, there can be no assurance that the steps that continue to be taken to address the requirements of the US DPA will be completely effective. Breach of the US DPA or related agreements and consent orders could have a material adverse effect on our business, financial condition and results of operations, including loss of business and withdrawal of funding, restrictions on performing dollar-clearing functions through HSBC Bank USA or revocation of bank licences.
In relevant situations, and where permitted by regulation, we may rely upon certain counterparties to maintain and properly apply their own appropriate AML procedures. While permitted by regulation, such reliance may not be effective in preventing third parties from using us (and our relevant counterparties) as a conduit for money laundering including illegal cash operations without our knowledge (and that of our relevant counterparties). Becoming a party to money laundering, association with, or even accusations of being associated with, money laundering will damage our reputation and could make us subject to fines, sanctions and/or legal enforcement (including being added to ‘blacklists’ that would prohibit certain parties from engaging in transactions with us). Any one of these outcomes could have a material adverse effect on our business, prospects, financial condition and results of operations.
HSBC HOLDINGS PLC
109i |
Table of Contents
Report of the Directors: Financial Review(continued)
We have significant exposure to counterparty risk
We are exposed to counterparties that are involved in virtually all major industries, and we routinely execute transactions with counterparties in financial services, including brokers and dealers, central clearing counterparties, commercial banks, investment banks, mutual and hedge funds, and other institutional clients. Many of these transactions expose us to credit risk in the event of default by our counterparty or client. Our ability to engage in routine transactions to fund our operations and manage our risks could be materially adversely affected by the actions and commercial soundness of other financial services institutions. Financial institutions are necessarily interdependent because of trading, clearing, counterparty or other relationships. As a consequence, a default by, or decline in market confidence in, individual institutions, or anxiety about the financial services industry generally, can lead to further individual and/or systemic difficulties, defaults and losses.
Mandatory central clearing of OTC derivatives, including under Dodd-Frank and the EU’s European Market Infrastructure Regulation, brings risks to HSBC. As a clearing member, we will be required to underwrite losses incurred at Central Counterparty (‘CCP’) by the default of other clearing members and their clients. Hence central clearing brings with it a new element of interconnectedness between clearing members and clients which we believe may increase rather than reduce our exposure to systemic risk. At the same time, our ability to manage such risk ourselves will be reduced because control has been largely outsourced to CCPs and it is unclear at present how, at a time of stress, regulators and resolution authorities will intervene.
Where bilateral counterparty risk has been mitigated by taking collateral, our credit risk may remain high if the collateral we hold cannot be realised or has to be liquidated at prices which are insufficient to recover the full amount of our loan or derivative exposure. There is a risk that collateral cannot be realised, including situations where this arises by change of law that may influence our ability to foreclose on collateral or otherwise enforce contractual rights.
The Group also has credit exposure arising from mitigants such as credit default swaps (‘CDSs’), and other credit derivatives, each of which is carried at fair value. The risk of default by counterparties to CDSs and other credit derivatives used as mitigants affects the fair value of these instruments depending on the valuation and the perceived credit risk of the underlying instrument against which protection has been purchased. Any such adjustments or fair value changes may have a material adverse effect on our financial condition and results of operations.
Market fluctuations may reduce our income or the value of our portfolios
Our businesses are inherently subject to risks in financial markets and in the wider economy, including changes in, and increased volatility of, interest rates, inflation rates, credit spreads, foreign exchange rates, commodity, equity, bond and property prices, and the risk that our customers
act in a manner inconsistent with our business, pricing and hedging assumptions.
Market movements will continue to significantly affect us in a number of key areas. For example, banking and trading activities are subject to interest rate risk, foreign exchange risk, inflation risk and credit spread risk. Changes in interest rate levels, interbank spreads over official rates, yield curves and spreads affect the interest rate spread realised between lending and borrowing costs. A declining interest rate environment could increase prepayment activity which reduces the weighted average lives of our interest-earning assets and could have a material adverse effect on us. The potential for future volatility and margin changes remains. Competitive pressures on fixed rates or product terms in existing loans and deposits sometimes restrict our ability to change interest rates applying to customers in response to changes in official and wholesale market rates. Our pension scheme assets include equity and debt securities, the cash flows of which change as equity prices and interest rates vary.
Our insurance businesses are exposed to the risk that market fluctuations will cause mismatches to occur between product liabilities and the investment assets which back them. Market risks can affect our insurance products in a number of ways depending upon the product and associated contract. For example, mismatches between assets and liability yields and maturities give rise to interest rate risk. Some of these risks are borne directly by the customer and some are borne by the insurance businesses, with their excess capital invested in the markets. Some insurance contracts involve guarantees and options that increase in value in adverse investment markets. There is a risk that the insurance businesses will bear some of the cost of such guarantees and options. The performance of the investment markets will thus have a direct effect upon the value embedded in the insurance and investment contracts and our operating results, financial condition and prospects.
It is difficult to predict with any accuracy changes in market conditions, and such changes may have a material adverse effect on our business, prospects, financial condition and results of operations.
Liquidity, or ready access to funds, is essential to our businesses
Our ability to borrow on a secured or unsecured basis and the cost of so doing can be affected by increases in interest rates or credit spreads, the availability of credit, regulatory requirements relating to liquidity or the market perceptions of risk relating to HSBC or the banking sector, including our perceived or actual creditworthiness.
Current accounts and savings deposits payable on demand or at short notice form a significant part of our funding, and we place considerable importance on maintaining their stability. For deposits, stability depends upon preserving investor confidence in our capital strength and liquidity, and on comparable and transparent pricing. Although deposits have been, over time, a stable source of funding, this may not continue.
HSBC HOLDINGS PLC
109j |
Table of Contents
Report of the Directors: Financial Review(continued)
We also access wholesale markets in order to provide funding for entities that do not accept deposits, to align asset and liability maturities and currencies and to maintain a presence in local markets. In 2015, we issued the equivalent of $22bn of debt securities in the public capital markets in a range of currencies and maturities from a number of Group entities, including $7bn of subordinated securities issued by HSBC Holdings. An inability to obtain financing in the unsecured long-term or short-term debt capital markets, or to access the secured lending markets, could have a substantial adverse effect on our liquidity. Unfavourable macroeconomic developments, market disruptions or regulatory developments may increase our funding costs or challenge our ability to raise funds to support or expand our businesses.
If we are unable to raise funds through deposits and/or in the capital markets, our liquidity position could be adversely affected and we might be unable to meet deposit withdrawals on demand or at their contractual maturity, to repay borrowings as they mature, to meet our obligations under committed financing facilities and insurance contracts, or to fund new loans, investments and businesses. We may need to liquidate unencumbered assets to meet our liabilities. In a time of reduced liquidity, we may be unable to sell some of our assets, or we may need to sell assets at depressed prices, which in either case could materially adversely affect our business, prospects, financial condition and results of operations.
Any reduction in the credit rating assigned to HSBC Holdings, any subsidiaries of HSBC Holdings or any of their respective debt securities could increase the cost or decrease the availability of our funding and adversely affect our liquidity position and net interest margin
Credit ratings affect the cost and other terms upon which we are able to obtain market funding. Rating agencies regularly evaluate HSBC Holdings and certain of its subsidiaries, as well as their respective debt securities. Their ratings are based on a number of factors, including their assessment of the relative financial strength of HSBC or of the relevant entity, as well as conditions affecting the financial services industry generally. There can be no assurance that the rating agencies will maintain HSBC’s or the relevant entity’s current ratings or outlook, particularly given the rating agencies’ current review of their bank rating methodologies and the potential impact on HSBC’s or its subsidiaries’ ratings.
At the date hereof, HSBC Holdings’ long-term debt was rated AA-, A and A1 by Fitch, Standard & Poor’s (‘S&P’) and Moody’s, respectively. Ratings outlooks by Fitch, S&P and Moody’s were stable. Any reductions in these ratings and outlook could increase the cost of our funding, limit access to capital markets and require additional collateral to be placed and, consequently, materially adversely affect our interest margins and our liquidity position.
Under the terms of our current collateral obligations under derivative contracts, we could be required to post additional collateral as a result of a downgrade in HSBC’s
credit rating as described on page 164 of theAnnual Report and Accounts 2015.
Risks concerning borrower credit quality are inherent in our businesses
Risks arising from changes in credit quality and the recoverability of loans and amounts due from borrowers and counterparties (e.g. reinsurers and counterparties in derivative transactions) are inherent in a wide range of our businesses. Adverse changes in the credit quality of our borrowers and counterparties arising from a general deterioration in economic conditions or systemic risks in the financial systems could reduce the recoverability and value of our assets and require an increase in our loan impairment charges.
We estimate and recognise impairment allowances for credit losses inherent in our credit exposure. This process, which is critical to our results and financial condition, requires difficult, subjective and complex judgements, including forecasts of how the economic conditions might impair the ability of our borrowers to repay their loans and the ability of other counterparties to meet their obligations. As is the case with any such assessments, we may fail to estimate accurately the effect of factors that we identify or fail to identify relevant factors. Further, the information we use to assess the creditworthiness of our counterparties may be inaccurate or incorrect. Any failure by us to accurately estimate the ability of our counterparties to meet their obligations may have a material adverse effect on our business, prospects, financial conditions and results of operations.
Our insurance businesses are subject to risks relating to insurance claim rates and changes in insurance customer behaviour
We provide various insurance products for customers with whom we have a banking relationship, including several types of life insurance products. The cost of claims and benefits can be influenced by many factors, including mortality and morbidity rates, lapse and surrender rates and, if the policy has a savings element, the performance of assets to support the liabilities. Adverse developments in any of these factors may materially adversely affect our financial condition and results of operations.
HSBC Holdings is a holding company and, as a result, is dependent on loan payments and dividends from its subsidiaries to meet its obligations, including obligations with respect to its debt securities, and to provide profits for payment of future dividends to shareholders
HSBC Holdings is a non-operating holding company and, as such, its principal source of income is from operating subsidiaries which hold the principal assets of HSBC. As a separate legal entity, HSBC Holdings relies on remittance of its subsidiaries’ loan interest payments and dividends in order to be able to pay obligations to debt holders as they fall due and to pay dividends to its shareholders. The ability of HSBC Holdings subsidiaries and affiliates to pay dividends could be restricted by changes in regulation, exchange controls and other requirements.
HSBC HOLDINGS PLC
109k |
Table of Contents
Report of the Directors: Financial Review(continued)
We may be required to make substantial contributions to our pension plans
We operate a number of pension plans throughout the world, including defined benefit plans. Pension scheme obligations fluctuate with changes in long-term interest rates, inflation, salary levels and the longevity of scheme members. The level of contributions we make to our pension plans has a direct effect on our cash flow. To the extent plan assets are insufficient to cover existing liabilities, higher levels of contributions will be required. As a result, deficits in those pension plans may have a material adverse effect on our business, prospects, financial condition and results of operations.
HSBC HOLDINGS PLC
109l |
Table of Contents
Report of the Directors: Risk(continued)
Top and emerging risks
Our approach to identifying and monitoring top and emerging risks is described on page 103. Our current top and emerging risks are as follows:
• Economic outlook and capital flows |
• Geopolitical risk |
• Turning of the credit cycle |
• Regulatory developments with adverse impact on business model and profitability |
• Regulatory focus on conduct of business and financial crime |
• Dispute risk |
• Regulatory commitments and consent orders |
• Cyber threat and unauthorised access to systems
|
Economic outlook and capital flows
Economic growth remained subdued in 2015, with a number of headwinds adversely affecting both developed and emerging market countries.
The slowdown of the mainland Chinese economy has dampened global trade flows and caused volatility in currency and global stock markets. Market concerns persist as to the scale of the slowdown and the potential for further depreciation of the renminbi and emerging market currencies.
Oil and gas prices fell further during 2015 and early 2016 as a result of continuing global supply and demand imbalances, raising the risk that any recovery in oil prices over the medium term will be even more gradual than currently expected. Although oil importers benefit from low prices, low oil prices increase fiscal and financing challenges for exporters and accentuate deflationary risks.
Emerging market economies have been affected by falling commodity prices, the economic slowdown in mainland China and a vulnerability to monetary policy normalisation in the US. This has led to steep depreciation in several key emerging market currencies against the US dollar and substantial capital outflows.
The economic recovery in the eurozone remains fragile, driven by a combination of low oil prices, a weak euro, slowing growth and loose monetary policy. Populist parties are in the ascendancy in several EU countries, helped by the subdued economic backdrop as well as other issues such as migration. A referendum on the UK’s EU membership is expected to occur within the lifetime of the current Parliament, and may be held as early as mid-2016 (see ‘Geopolitical risk’ below). While the risk of Greece exiting the EU has faded, the implementation of required structural reforms could prove politically challenging.
Potential impact on HSBC
| • | We earn a significant proportion of our profits from our operations in Asia. Our results could be adversely |
affected by a prolonged or severe slowdown in regional economic growth or contraction in global trade and capital flows as a consequence. |
| • | HSBC’s results could be impacted by a prolonged period of low oil prices, particularly in conjunction with a low inflation environment and/or low or negative interest rates. |
| • | The intensification of fragmentation risks in the EU could have both political and economic consequences for Europe. |
Mitigating actions
| • | We closely monitor economic developments in key markets and sectors with the aim of ensuring trends are identified, the implications for specific customers, customer segments or portfolios are assessed, and appropriate mitigating action – which may include revising key risk appetite metrics or limits – is taken as circumstances evolve. |
| • | We use internal stress testing and scenario analysis as well as regulatory stress test programmes to evaluate the impact of macroeconomic shocks on our businesses and portfolios. Analyses undertaken on our oil and gas portfolio and mainland China exposures are discussed on page 117. |
Geopolitical risk
Our operations and portfolios are exposed to risks arising from political instability, civil unrest and military conflict in many parts of the world.
In the Middle East, the intervention of Russia and the rise of the terrorist group, Daesh, have added to an already complex civil war in Syria and further destabilised Iraq. These are conflicts which show few signs of resolution. Daesh has proved capable of carrying out attacks in neighbouring countries and further afield. The lifting of sanctions following a deal between Iran and the five permanent members of the UN Security Council on the country’s nuclear programme has done little to calm regional tensions.
Violence in Ukraine has abated but the conflict in the east of the country has not been resolved. Sanctions imposed by the US and EU against the Russian government, institutions and individuals have damaged the Russian economy.
European states are experiencing heightened political tension, reflecting concerns over migration, fears of terrorism and the possibility that the UK may vote to exit the EU following a referendum. An exit could have a significant impact on UK, European and global macroeconomic conditions, as well as substantial political ramifications.
In Asia, territorial disputes between Japan and China and other states have strained diplomatic relations and are testing the resolve of the US to defend freedom of navigation.
Potential impact on HSBC
| • | Our results are subject to the risk of loss from physical conflicts or terrorist attacks, unfavourable political developments, currency fluctuations, social instability and changes in government policies in the jurisdictions in which we operate. |
HSBC HOLDINGS PLC
110 |
Table of Contents
| • | Physical conflicts or terrorist attacks could expose our staff to physical risk and/or result in physical damage to our assets and disruption to our operations. |
| • | The effect of a UK exit from the EU on HSBC would depend on the manner in which the exit occurs. A disorderly exit could force changes to HSBC’s operating model, affect our ability to access ECB and high value euro payments, and affect our transaction volumes due to possible disruption to global trade flows. |
Mitigating actions
| • | We continuously monitor the geopolitical outlook, in particular in countries where we have material exposures and/or a physical presence. |
| • | Our internal credit risk ratings of sovereign counterparties take geopolitical factors into account and drive our appetite for conducting business in those countries. Where necessary, we adjust our country limits and exposures to reflect our risk appetite and mitigate risks as appropriate. |
| • | We run internal stress tests and scenario analyses, including reverse stress tests, on our portfolios that take into account geopolitical scenarios, such as conflicts in countries where we have a significant presence, or political developments that could disrupt our operations, including the potential effect of a UK exit on our business model. |
Turning of the credit cycle
The long-anticipated move by the US Federal Reserve Board (‘FRB’) to raise interest rates and the slowdown in mainland China’s economy, which is expected to continue, have increased risk aversion in global markets. This tendency has deepened since the turn of 2016, with market volatility increasing. In 2015, emerging markets experienced net capital outflows for the first time since 1988, with several major currencies at decade-plus lows against the US dollar and global corporate defaults rose to the highest since 2009. 2016 could see an intensification of these trends and the appearance of stress in a wide array of credit segments, particularly if monetary policy is tightened quickly, sentiment regarding China worsens and oil prices fail to recover. The combination of these factors with substantial amounts of external refinancing being due in emerging markets in2016-18 increases the risk of sharper and more protracted volatility.
Potential impact on HSBC
| • | Impairment allowances or losses could begin to rise from their historical lows in 2014 and 2015 if the credit quality of our customers is affected by less favourable global economic conditions in some markets. |
| • | There may be impacts on the delinquency and losses in some portfolios which may be impacted by worsening macroeconomic conditions and their possible effects on particular geographies or industry sectors. |
| • | Particular portfolios such as oil and gas may come under particular strain which is partly cyclical and partly driven by geopolitical concerns. |
Mitigating actions
| • | We closely monitor economic developments in key markets and sectors, taking portfolio actions where necessary including enhanced monitoring or reducing limits and exposures. |
| • | We stress test those portfolios of particular concern to identify sensitivity to loss, with management actions taken to control appetite where necessary. |
| • | Where customers are either individually or collectively assessed, regular portfolio reviews are undertaken for sensitive portfolios to ensure that individual customer or portfolio risks are understood and that the level of facilities offered and our ability to manage through any downturn are appropriate. |
Regulatory developments with adverse impact on business model and profitability
Financial service providers continue to face stringent and costly regulatory and supervisory requirements, particularly in the areas of capital and liquidity management, conduct of business, financial crime, operational structures and the integrity of financial services delivery. Government intervention and control over financial institutions both on a sector-wide basis and individually, together with measures to reduce systemic risk, may significantly affect the competitive landscape locally, regionally and/or globally for some or all of the Group’s businesses. These measures may be introduced with different, potentially conflicting requirements and to differing timetables by different regulatory regimes. Regulatory changes may affect our activities, both of the Group as a whole and of some or all of our principal subsidiaries. These changes include:
| • | the UK’s Financial Services (Banking Reform) Act 2013, which requires the ring-fencing of our UK retail banking activities from wholesale banking, together with the structural separation of other activities required by US legislation and rules (including the Volcker Rule implemented in December 2013 under the Dodd-Frank Act), and potential further changes under the European Commission’s Banking Structural Reform Regulation which proposes similar structural reform for larger EU banks as well as structural changes in other jurisdictions; |
| • | revisions in the regime for the operation of capital markets, notably mandatory central clearing of over the counter (‘OTC’) derivatives and mandatory margin requirements for non-cleared derivatives under the Dodd-Frank Act, the EU’s European Market Infrastructure Regulation (‘EMIR’) and similar local measures being progressed in Hong Kong, Singapore and Canada; |
HSBC HOLDINGS PLC
111 |
Table of Contents
Report of the Directors: Risk(continued)
Top and emerging risks
| • | those arising from the Markets in Financial Instruments Regulation/Directive (‘MiFID II’), which includes mandatory trading of derivatives on organised venues, enhanced transparency and reporting requirements, controls on high frequency and algorithmic trading, changes to the use of dealing commissions and potential future restrictions on the ability of non-EU Group companies to provide certain services to EU based clients. Aspects of MiFID II also further enhance protections for investors in line with many regulators’ focus on the wider conduct of business and delivery of fair outcomes for customers; |
| • | changes aimed at promoting effective competition in the interests of consumers, including investigations ordered by the UK Competition and Markets Authority and work to increase competition more generally; |
| • | the recommendations arising out of theFinal Report on the Fair and Effective Financial Markets Review undertaken by the Bank of England, which include changes to market conduct rules and forward looking supervision in the operation of wholesale financial markets in the UK; |
| • | continued focus in the UK and elsewhere on matters relating to management accountability, institutional culture, employee conduct and increased obligations on market abuse and whistleblowing. In the UK, this includes implementing the individual accountability regime and wider recommendations made by the Parliamentary Commission on Banking Standards and the activities of the Banking Standards Board; |
| • | the Basel Committee on Banking Supervision (‘Basel Committee’) initiatives to enhance the risk sensitivity and robustness of the standardised approaches, to minimise reliance on internal models, and to incorporate capital floors in the Basel capital framework; |
| • | the implementation of the Capital Requirements Directive (‘CRD IV’), notably the UK application of the capital framework and its interaction with Pillar 2; |
| • | proposals from the Financial Stability Board for global systemically important banks (‘G-SIB’s) to hold minimum levels of capital and debt as total loss absorbing capacity (‘TLAC’), together with the Bank of England’s consultation on UK implementation of MREL (for further details, see ‘Capital’ on page 239); |
| • | requirements flowing from arrangements for the resolution strategy of the Group and its individual operating entities, which may have different effects in different countries; and |
| • | the continued risk of further changes to regulation relating to taxes affecting financial service providers, including financial transaction taxes and ongoing implementation of initiatives to share tax information such as the Common Reporting Standard introduced by the Organisation for Economic Co-operation and Development (‘OECD’). |
Potential impact on HSBC
| • | Proposed changes in and/or the implementation of regulations including mandatory central clearing of OTC derivatives, EMIR, ring-fencing and similar requirements, MiFID II, the Volcker Rule, recovery and resolution plans, tax information sharing initiatives and findings from competition orientated enquiries and investigations may affect the manner in which we conduct our activities and how the Group is structured. |
| • | Requirements for higher levels of capital or TLAC may increase the funding costs for the Group and reduce our return on equity. |
| • | Mandatory central clearing of OTC derivatives also brings new risks to HSBC in its role as a clearing member, as we will be required to underwrite losses incurred by central clearing counterparties from the default of other clearing members and their clients. Hence central clearing brings with it a new element of interconnectedness between clearing members and clients which we believe may increase rather than reduce our exposure to systemic risk. |
| • | Increased regulatory scrutiny of conduct of business and management accountability may affect the industry in areas such as employee recruitment and retention, product pricing and profitability in both retail and wholesale markets. HSBC’s businesses may be affected by these developments. |
| • | These measures have the potential to increase our cost of doing business and curtail the types of business we can carry out, which may adversely affect future profitability. |
Mitigating actions
| • | We are engaged closely with governments and regulators in the countries in which we operate to help ensure that the new requirements are considered properly and can be implemented in an effective manner. |
| • | We have enhanced our governance around central clearing counterparties and appointed specialists to manage the associated liquidity and collateral risks. |
| • | We continue to enhance and strengthen governance and resourcing more generally around regulatory change management and the implementation of required measures to actively address this ongoing and significant agenda of regulatory change. |
Regulatory focus on conduct of business and financial crime
Financial service providers are at risk of regulatory sanctions or fines related to conduct of business and financial crime. The incidence of regulatory proceedings against financial service firms has become more common-place and may increase in frequency due to increased media attention and higher expectations from prosecutors and the public, with a consequent increase also in civil litigation arising from or relating to issues which are subject to regulatory investigation, sanction or fine.
HSBC HOLDINGS PLC
112 |
Table of Contents
Regulators in the UK and other countries have continued to increase their focus on conduct matters relating to fair outcomes for customers and orderly and transparent operations in financial markets. For further details, see ‘Compliance risk’ on page 178.
Potential impact on HSBC
| • | HSBC may face regulatory censure or sanctions including fines and/or be exposed to legal proceedings and litigation. |
| • | Regulators in the UK and other countries may identify future industry-wide mis-selling, market conduct or other issues that could affect the Group. This may lead from time to time to significant direct costs or liabilities and/or changes in the practices of such businesses. Also, decisions taken by the Financial Ombudsman Service in the UK (or similar overseas bodies) could, if applied to a wider class or grouping of customers, have a material adverse effect on the operating results, financial condition and prospects of the Group. |
Mitigating actions
| • | We have taken a number of steps including introduction of new global policies, enhancement to the product governance processes, establishment of a global conduct programme and review of sale processes and incentive schemes (see ‘Compliance risk’ on page 178). |
US deferred prosecution agreement and related agreements and consent orders
An independent compliance monitor (‘the Monitor’) was appointed in 2013 under the 2012 agreements entered into with the US Department of Justice (‘DoJ’) and the UK Financial Conduct Authority (‘FCA’) to produce annual assessments of the effectiveness of our AML and sanctions compliance programme. Additionally, the Monitor is serving as HSBC’s independent consultant under the consent order of the FRB. HSBC Bank USA is also subject to an agreement entered into with the Office of the Comptroller of the Currency (‘OCC’) in December 2012, the Gramm-Leach-Bliley Act Agreement and other consent orders. In January 2016, the Monitor delivered his second annual follow-up review report as required by the US DPA. The Monitor’s report is discussed on page 116.
Potential impact on HSBC
| • | The design and execution of AML and sanctions remediation plans are complex and require major investments in people, systems and other infrastructure. This complexity creates significant execution risk, which could affect our ability to effectively identify and manage financial crime risk and remedy AML and sanctions compliance deficiencies in a timely manner. This could, in turn, impact our ability to satisfy the Monitor or comply with the terms of the US DPA and related agreements and consent orders, and may require us to take additional remedial measures in the future. |
| • | Under the terms of the US DPA, upon notice and an opportunity to be heard, the DoJ has sole discretion to determine whether HSBC has breached the US DPA. Potential consequences of breaching the US DPA could include the imposition of additional terms and conditions on HSBC, an extension of the agreement, including its monitorship, or the criminal prosecution of HSBC, which could, in turn, entail further financial penalties and collateral consequences. |
| • | Breach of the US DPA or related agreements and consent orders could have a material adverse effect on our business, financial condition and results of operations, including loss of business and withdrawal of funding, restrictions on performing dollar-clearing functions through HSBC Bank USA or revocation of bank licences. Even if we are not determined to have breached these agreements, but the agreements are amended or their terms extended, our business, reputation and brand could suffer materially. |
Mitigating actions
| • | We are continuing to take concerted action to remedy AML and sanctions compliance deficiencies and to implement Global Standards. We are also working to implement the agreed recommendations flowing from the Monitor’s 2013 and 2014 reviews, and will implement the agreed recommendations from the 2015 review. |
| • | During 2015, we continued to make progress toward putting in place a robust and sustainable AML and sanctions compliance programme, including continuing to build a strong Financial Crime Compliance sub-function, rolling out improved systems and infrastructure to manage financial crime risk and improve transaction monitoring and enhancing internal audits. |
Dispute risk
HSBC is party to legal proceedings and regulatory matters in a number of jurisdictions arising out of its normal business operations. Further details are provided in Note 40 on the Financial Statements.
Potential impact on HSBC
| • | Dispute risk may give rise to potential financial loss as well as significant reputational damage. This in turn could adversely affect customer, investor and other stakeholder confidence. |
Mitigating actions
| • | We continue to focus on identifying emerging regulatory and judicial trends, and sharing globally lessons learned in an effort to avoid or limit future litigation exposure and regulatory enforcement action. |
| • | We continue to review and enhance our financial crime and regulatory compliance controls and resources. |
HSBC HOLDINGS PLC
113 |
Table of Contents
Report of the Directors: Risk(continued)
Top and emerging risks
Cyber threat and unauthorised access to systems
Like other public and private organisations, we continue to be a target of cyber attacks which, in some cases, disrupt services including the availability of our external facing websites, compromise organisational and customer information or expose security weaknesses. Management of cyber risks is coming under increased regulatory scrutiny.
Potential impact on HSBC
| • | A major cyber attack, which could result from unauthorised access to our systems, may result in financial loss as well as significant reputational damage which could adversely affect customer and investor confidence in HSBC. Any loss of customer data would also trigger regulatory breaches which could result in fines and penalties being incurred. |
Mitigating actions
| • | The security of our information and technology infrastructure is crucial for maintaining our banking applications and processes and protecting our customers and the HSBC brand. We continue to strengthen our ability to prevent, detect and respond to the ever-increasing and sophisticated threat of cyber attacks by enhancing our governance and controls framework and technology infrastructure, processes and controls. |
| • | We took part in the PRA‘s Cyber Vulnerability Testing exercise during 2015 and are making further enhancements to improve our resilience to, and ability to recover from, cyber attacks. |
| • | We have realigned the responsibilities and accountabilities for cyber and information risk management to align with the operational risk lines of defence operational model and instigated a number of security improvement programmes within IT. |
• People risk |
• Execution risk |
• Third-party risk management |
• Model risk |
• Data management |
People risk
Significant demands continue to be placed on our staff. The cumulative workload arising from regulatory reform and remediation programmes together with those related to the delivery of our strategy is hugely consumptive of human resources, placing increasingly complex and conflicting demands on a workforce in a world where expertise is often in short supply and globally mobile.
Potential impact on HSBC
| • | Changes in remuneration policy and practice resulting from CRD IV regulations, European Banking Authority (‘EBA’) Guidelines and PRA remuneration rules apply on a Group-wide basis for any material risk takers. This |
presents significant challenges for HSBC because a significant number of our material risk takers are based outside the EU. |
| • | The Senior Managers and Certification regimes and the related Rules of Conduct, which come into force in 2017 for other employees, set clear expectations of the accountabilities and behaviour of both senior and more junior employees. |
| • | Organisational changes to support the Group’s strategy and/or implement regulatory reform programmes have the potential to lead to increased staff turnover. |
Mitigating actions
| • | The changes in remuneration under the CRD IV regulations, EBA guidelines and PRA remuneration rules have necessitated a review of our remuneration policy, especially the balance between fixed and variable pay, to ensure we can remain globally competitive on a total compensation basis and retain our key talent. |
| • | We continue to increase the level of specialist resource in key areas, and to engage with our regulators as they finalise new regulations. |
| • | Risks related to organisational change and disposals are subject to close management oversight, especially in those countries where staff turnover is particularly high. |
Execution risk
Execution risk heightened during 2015 due to a number of factors. Significant programmes are under way to deliver nine business actions to capture value from our global presence, announced at the Investor Update in June 2015. These, along with the regulatory reform agenda and our commitments under the US DPA require the management of complex projects that are resource demanding and time sensitive. In addition, the risks arising from the disposal of our business in Brazil require careful management.
Potential impact on HSBC
| • | Risks arising from the number, magnitude and complexity of projects underway to meet these demands may include financial losses, reputational damage or regulatory censure. |
| • | The potential risks of disposals include regulatory breaches, industrial action, loss of key personnel and interruption to systems and processes during business transformation. They can have both financial and reputational implications. |
Mitigating actions
| • | We have strengthened our prioritisation and governance processes for significant projects, which are monitored by the GMB. |
| • | We have invested in our project implementation and IT capabilities and increased our focus on resource management. |
| • | Risks relating to disposals are carefully assessed and monitored and are subject to close management oversight. |
HSBC HOLDINGS PLC
114 |
Table of Contents
Third-party risk management
HSBC, in common with peers in the financial services industry, utilises third parties for the provision of a range of goods and services. Global regulators have raised concerns regarding the dependency on third parties, and expect firms to be able to demonstrate adequate control over the selection, governance and oversight of their third parties (including affiliates). Risks arising from the use of third-party service providers may be less transparent and therefore more challenging to manage or influence.
Potential impact on HSBC
| • | Any deficiency in the management of third-party risk could affect our ability to meet strategic, regulatory and client expectations. This may lead to a range of consequences including regulatory censure, civil penalties or reputational damage. |
Mitigating actions
| • | HSBC is undertaking a multi-year strategic plan to enhance its third-party risk management capability. We are implementing a programme that will provide a holistic view of third-party risks. This will enable the consistent risk assessment of any third-party service against key criteria, along with the associated control monitoring, testing and assurance throughout the third-party lifecycle. |
| • | The Group’s most critical third parties were identified and subjected to enhanced risk assessment, with remediation plans agreed where necessary. Plans are in place to extend the assessment to a broader group of third parties. |
| • | In addition, the highest priority third-party vendors in the US went through enhanced risk assessment with findings remediated in 2015. A risk monitoring solution was implemented for all vendors and a due diligence solution is in the process of being implemented. |
Model risk
We use models for a range of purposes in managing our business, including regulatory and economic capital calculations, stress testing, credit approvals, pricing, financial crime and fraud risk management and financial reporting. Model risk is the potential for adverse consequences as a result of decisions based on incorrect model outputs and reports or the use of such information for purposes for which it was not designed. This risk can arise from models that are poorly developed, implemented or used, or from the modelled outcome being misunderstood and acted upon inappropriately by management. The regulatory environment and supervisory concerns over banks’ use of internal models to determine regulatory capital is also considerable, and further contributes to model risk.
Potential impact on HSBC
| • | HSBC could incur losses, be required to hold additional capital, fail to meet regulatory standards or incur higher operating expenses due to the use of inappropriate models or poor model risk management. |
| • | Supervisory concerns over the internal models and assumptions used by banks in the calculation of regulatory capital have led to the imposition of floors in risk weight and model parameters such as the loss given default. Such changes have the potential to increase our capital requirement and/or make it more volatile. |
| • | Our reputation may be questioned due to our inability to comply with specific modelling and model risk management requirements. |
Mitigating actions
| • | We have strengthened our model risk governance framework by establishing global model oversight committees and implementing policies and standards in accordance with key regulatory requirements. |
| • | We have strengthened our governance over the development, usage and validation of models including the creation of centralised global analytical functions with necessary subject-matter expertise. |
| • | We have hired additional subject matter experts as part of our independent model review function and empowered the function to ensure appropriate challenge and feedback are given to models prior to and as part of their ongoing use. |
Data management
Regulators require more frequent and granular data submissions, which must be produced on a consistent, accurate and timely basis. As a G-SIB, HSBC must comply with the principles for effective risk data aggregation and risk reporting set out by the Basel Committee.
Potential impact on HSBC
| • | Ineffective data management capabilities could impact our ability to aggregate and report complete, accurate and consistent data to regulators, investors and senior management on a timely basis. |
| • | Financial institutions that fail to meet their Basel Committee data obligations by the required deadline may face supervisory measures. |
Mitigating actions
| • | We have set a data strategy for the Group and defined Group-level principles, standards and policies to enable consistent data aggregation, reporting and management. We continue to focus on enhancing data governance, quality and architecture to support our objectives of ensuring reliability of information used in support of internal controls and external financial reporting. |
| • | A number of key initiatives and projects to implement our data strategy and work towards meeting our Basel Committee data obligations are in progress. |
HSBC HOLDINGS PLC
115 |
Table of Contents
Report of the Directors: Risk(continued)
Areas of special interest
During 2015, we considered a number of particular areas because of the effect they may have on the Group. Whilst these areas may already have been identified in top and emerging risks, further details of the actions taken during the year are provided below.
Financial crime compliance and regulatory compliance
We continued to experience increased levels of compliance risk as regulators and other agencies pursued investigations into historical activities. Examples include continued engagement with respect to compliance with AML and sanctions law (historical investigations gave rise to the US DPA and related FCA Direction), on-going interaction with regulators relating to mis-selling of the PPI policies and allegations of pressure selling in the UK, investigations in relation to conduct in the foreign exchange market, and benchmark interest rate and commodity price setting. Details of these investigations and legal proceedings may be found in Note 40 on the Financial Statements. The work of the Monitor, who was appointed to assess the effectiveness of our AML and sanctions compliance programme, is discussed below.
The level of inherent compliance risk remained high in 2015 as the industry continued to experience greater regulatory scrutiny and heightened levels of regulatory oversight and supervision.
For further information about the Group’s compliance risk management, see page 178.
Under the agreements entered into with the DoJ and the FCA in 2012, including the five-year US DPA, the Monitor was appointed to produce annual assessments of the effectiveness of the Group’s AML and sanctions compliance programme.
In January 2016, the Monitor delivered his second annual follow-up review report based on various thematic and country reviews he had conducted over the course of 2015. In his report, the Monitor concluded that, in 2015, HSBC made progress in developing an effective and sustainable financial crime compliance programme. However, he expressed significant concerns about the pace of that progress, instances of potential financial crime and systems and controls deficiencies, whether HSBC is on track to meet its goal to the Monitor’s satisfaction within the five-year period of the US DPA and, pending further review and discussion with HSBC, did not certify as to HSBC’s implementation of and adherence to remedial measures specified in the US DPA. The ‘US deferred prosecution agreement and related agreements and consent orders’ are discussed in top and emerging risks on page 113.
Stress testing is an important tool for regulators to assess vulnerabilities in the banking sector and in individual banks, the results of which could have a significant effect on minimum capital requirements, risk and capital management
practices and planned capital actions, including the payment of dividends, going forward.
We are subject to regulatory stress testing in many jurisdictions. These have increased both in frequency and in the granularity of information required by supervisors. They include the programmes of the Bank of England (‘BoE’), the FRB, the OCC, the EBA and the Hong Kong Monetary Authority and other regulators. Assessment by regulators is on both quantitative and qualitative bases, the latter focusing on portfolio quality, data provision, stress testing capability, forward-looking capital management processes and internal management processes.
In 2015, the Group took part in the BoE’s concurrent stress test exercise involving major UK banks. The 2015 stress scenario incorporates a global recession in which disinflationary pressures and weakening expectations of growth lead to diminished risk appetite, falling commodity prices and lower market liquidity. Several emerging economies are adversely affected, as is the eurozone, where the rate of deflation increases. The UK experiences a downturn as the global recession affects exports and as financial linkages and weaker confidence affects other parts of the economy.
Selected key economic variables for the BoE 2015 concurrent stress test, as specified by the BoE
|
| GDP growth | 1 |
| Unemploy- ment | 2 | | House Price Index | |
| Equity prices | 3 | |||||||
| % | % | % | % | |||||||||||||||
Hong Kong | (5.6 | ) | 5.8 | 40 | 65 | |||||||||||||
China | 1.7 | – | 35 | – | ||||||||||||||
UK | (3.1 | ) | 9.2 | 20 | 36 | |||||||||||||
| 1 | Worst quarter (percentage quarter on quarter – year earlier). |
| 2 | Peak percentage. |
| 3 | Price fall percentage (start to trough). |
The results were published by the BoE alongside theFinancial Stability Report on 1 December 2015. The stressed CET1 capital ratio of HSBC was deemed by the BoE to fall to a minimum of 7.7%, taking into account management mitigating actions accepted by the BoE for this exercise. This was above the hurdle ratio of 4.5% set for this exercise. The leverage ratio fell to a minimum of 3.7% after management actions, also above the minimum hurdle ratio of 3%.
HSBC North America Holdings Inc. (‘HNAH’) participated in the 2015 Comprehensive Capital Analysis and Review (‘CCAR’) and the annual Dodd-Frank Act Stress Test (‘DFAST’) programmes as required by the FRB. In addition, HSBC Bank USA N.A. (‘HSBC Bank USA’) participated in the OCC’s 2015 DFAST programme. The CCAR and DFAST submissions were made on 5 January 2015 and their results publically disclosed on 5 March 2015. On 11 March 2015, HNAH received notice that the FRB did not object to its 2015 Capital Plan – a key component of the CCAR submission. Under DFAST, HNAH is also required to conduct a company-run mid-cycle stress test, the results of which were disclosed on 16 July 2015. Under this test HNAH maintained capital levels in excess of regulatory minimums; specifically, the stressed common equity tier 1 ratio fell to a minimum of 7.5% compared with a required level of 4.5%.
HSBC HOLDINGS PLC
116 |
Table of Contents
Other entities in the Group, including The Hongkong and Shanghai Banking Corporation Limited and HSBC Bank plc, continue to participate in regulatory stress tests conducted at a subsidiary level by local regulators.
In October 2015, the BoE published details of its medium-term approach to stress testing the UK banking system. Key features of the approach include an annual cyclical stress test and a biennial exploratory stress test, starting in 2017.
The EBA plan to conduct stress tests in 2016. Details of their proposed approach were published by them in November 2015.
Oil and commodity prices have remained low since the middle of 2014 as a result of existing global supply and demand imbalances, with significant price declines in late 2015 and early 2016. Continued lower oil prices cause increased credit risks within oil-related industries together with fiscal and financing challenges for energy exporters.
The overall portfolio of exposures directly exposed to oil and gas companies had drawn risk exposures amounting to about $29bn (2014: $34bn) with sub-sectoral distributions as follows: integrated producers 48%, service companies 28%, pure producers 17% and infrastructure companies 7%.
The credit quality distribution of the oil and gas portfolio was as follows: ‘strong’ and ‘good’ categories made up 56% of the portfolio, ‘satisfactory’ 35%, ‘sub-standard’ 7% and ‘impaired’ 2%. The majority of the exposures were located in North America, Asia and Europe.
Oil and gas related counterparties have responded rapidly to the changing economic outlook, cutting back on capital expenditure as well as reducing operating expenses in order to manage cash flows and sustain profitability.
Large integrated producers remained resilient. Within the pure producers sector, the higher cost entities such as shale and oil sands producers showed more evidence of stress, resulting in credit grade deterioration. Similarly, service companies continued to be more vulnerable as producers curtailed capital expenditures.
Individually assessed loan impairment charges in 2015 remained contained at approximately $0.3bn. Oil prices are now predicted to remain lower for longer and the oil price recovery is dependent on the removal of the excess supply that currently exists in the market. In view of these factors collective allowances for exposures related to oil and gas were increased by $0.2bn at the end of the year. Total allowances in respect of the oil and gas portfolio were $0.6bn.
The sector remains under enhanced monitoring with risk appetite and new lending has been significantly curtailed.
Metals prices declined during 2015 although the pace and extent of the price decline was more gradual than for oil and gas.
Precious metals, copper, nickel and zinc prices are generally forecast to improve slightly in 2016. The outlook for steel, aluminium and bulk metals is more negative due to a combination of oversupply and reduction in demand. The low oil and gas prices benefit most metals and mining customers given that they are large consumers of energy.
Our total drawn risk exposure to metals and mining was $18bn (steel and aluminium $9bn, copper, nickel and zinc $4bn, iron ore and metallurgical coal $3bn, precious metals $2bn). Individually assessed loan impairments were $0.1bn.
Given the pressures in metals prices the metals and mining sector is under heightened management review.
Mainland China’s economic growth rate slowed in 2014 and 2015 with a gross domestic product of 6.9% in 2015 compared with 7.3% in 2014 (2013: 7.7%). China’s economic growth rate remains very strong when compared with developed western economies. Although the largest foreign bank in China, HSBC’s overall lending market share is very small at about 0.2%. This allows us to be selective in our lending to mainland China-related exposures, targeting high quality lending centred around specific priority sectors. The portfolio has continued to perform well with loan impairment charges remaining at their existing low levels.
The total mainland China portfolio had drawn risk exposures of $143bn, of which $77bn was booked onshore, with the remainder mainly booked in Hong Kong. Retail lending amounted to $8bn, focused primarily on residential mortgages in selected geographical areas. Wholesale lending amounted to $135bn. 51% of the wholesale portfolio was corporate lending with 26% to banks and the remainder to China sovereign. The lending to banks was 99% investment grade. The corporate portfolio was also of high quality with 62% of the portfolio of investment grade. Only 2% of the corporate portfolio was rated substandard which compares favourably with the Group as a whole. The corporate portfolio was well diversified with less than 40% of lending to state owned enterprises. The corporate real estate portfolio amounted to about $15bn. This portfolio which is primarily focused on tier 1 and tier 2 cities and the Pearl River Delta, was managed carefully under a series of caps ensuring that the lending to this sector remained within our risk appetite.
Our resultant ability to be selective in our lending and apply our traditionally strong underwriting standards means we have a high quality portfolio which we would expect to be resilient even in a situation where mainland China’s growth rate slows further.
HSBC HOLDINGS PLC
117 |
Table of Contents
Report of the Directors: Risk(continued)
Credit risk
HSBC HOLDINGS PLC
118 |
Table of Contents
| Page | App1 | Tables | Page | |||||||||||
| 141 | ||||||||||||||
| 141 | Notional contract amounts and fair values of derivatives by product type | 142 | ||||||||||||
| 142 | ||||||||||||||
| 143 | 143 | |||||||||||||
| 202 | ||||||||||||||
| 143 | 143 | |||||||||||||
| 144 | 145 | |||||||||||||
| 145 | HSBC Finance US Consumer and Mortgage Lending residential mortgages | 145 | ||||||||||||
Trends in two months and over contractual delinquency in the US | 146 | |||||||||||||
Gross loan portfolio of HSBC Finance real estate secured balances | 146 | |||||||||||||
Number of renegotiated real estate secured accounts remaining in HSBC Finance’s portfolio | 146 | |||||||||||||
| 146 | ||||||||||||||
| 147 | Residential mortgage loans including loan commitments by level of collateral | 147 | ||||||||||||
| 148 | 148 | |||||||||||||
| 149 | ||||||||||||||
Reconciliation of reported and constant currency loan impairment charges to the income statement | 149 | |||||||||||||
| 150 | ||||||||||||||
Charge for impairment losses as a percentage of average gross loans and advances to customers | 150 | |||||||||||||
| 150 | ||||||||||||||
| 151 | ||||||||||||||
| 203 | ||||||||||||||
| 152 | 152 | |||||||||||||
| 152 | 203 | 153 | ||||||||||||
| 203 | ||||||||||||||
1Appendix to Risk – risk policies and practices. | ||||||||||||||
HSBC HOLDINGS PLC
119 |
Table of Contents
Report of the Directors: Risk(continued)
Credit risk
Credit risk is the risk of financial loss if a customer or counterparty fails to meet an obligation under a contract. It arises principally from direct lending, trade finance and leasing business, but also from other products such as guarantees and credit derivatives and from holding assets in the form of debt securities.
There have been no material changes to the policies and practices for the management of credit risk in 2015.
A summary of our current policies and practices regarding credit risk is provided in the Appendix to Risk on page 193.
Our maximum exposure to credit risk is presented on page 122 and credit quality on page 125. While credit risk arises across most of our balance sheet, losses have typically been incurred on loans and advances and securitisation exposures and other structured products. As a result, our disclosures focus primarily on these two areas.
Our exposures to mainland China and the effects of the decline in ‘metals and mining’ and ‘oil and gas’ prices are provided in ‘Areas of special interest’ on page 116.
In 2015, reported gross loans and advances declined by $75bn, mainly due to foreign exchange effects reducing balances by $51bn and the reclassification of Brazilian assets as ‘Assets held for sale’ reducing balances by a further $31bn. Additional details relating to the Brazilian reclassification are provided on page 121. Excluding foreign exchange movements and the reclassification, both wholesale and personal lending grew.
Loan impairment charges reduced by $0.5bn or 11% compared with 2014 with notable decreases in Latin America from favourable foreign exchange effects.
Information on constant currency movements is provided on page 148. While tables are presented on a reported basis, the commentary that follows in this summary section excludes the effects of the Brazilian reclassification and is on a constant currency basis.
| 2015 | 2014 | Page | ||||||||||||||||
| $bn | $bn | |||||||||||||||||
At year-end | ||||||||||||||||||
Maximum exposure to credit risk | ||||||||||||||||||
– total assets subject to credit risk | 2,234 | 2,434 | ||||||||||||||||
– off-balance sheet commitments subject to credit risk2 | 713 | 699 | ||||||||||||||||
| 2,947 | 3,133 | 123 | ||||||||||||||||
Gross loans and advances | ||||||||||||||||||
– personal lending | 374 | 393 | 143 | |||||||||||||||
– wholesale lending | 650 | 706 | 136 | |||||||||||||||
| 1,024 | 1,099 | 124 | ||||||||||||||||
Impaired loans | ||||||||||||||||||
– personal lending | 12 | 15 | 128 | |||||||||||||||
– wholesale lending | 12 | 14 | 128 | |||||||||||||||
| 24 | 29 | 128 | ||||||||||||||||
Impaired loans as a % of gross loans and advances | ||||||||||||||||||
– personal lending | 3.1% | 3.9% | ||||||||||||||||
– wholesale lending | 1.9% | 2.0% | ||||||||||||||||
– total | 2.3% | 2.7% | ||||||||||||||||
| $bn | $bn | |||||||||||||||||
Impairment allowances | ||||||||||||||||||
– personal lending | 2.9 | 4.6 | 135 | |||||||||||||||
– wholesale lending | 6.7 | 7.8 | 136 | |||||||||||||||
| 9.6 | 12.4 | 134 | ||||||||||||||||
Loans and advances net of impairment allowances | 1,015 | 1,087 | ||||||||||||||||
For year ended 31 December | ||||||||||||||||||
Loan impairment charge | 3.6 | 4.1 | 133 | |||||||||||||||
– personal lending | 1.8 | 1.8 | 132 | |||||||||||||||
– wholesale lending | 1.8 | 2.3 | 132 | |||||||||||||||
Other credit risk provisions | 0.1 | (0.2 | ) | |||||||||||||||
| 3.7 | 3.9 | |||||||||||||||||
For footnote, see page 191.
In 2015, wholesale and personal gross loans and advances grew by $0.5bn and $7bn, respectively.
In wholesale lending, Asia balances decreased by $9.6bn and were partly offset by an increase of $7.5bn in North America and $3.2bn in Europe. Middle East and North Africa decreased $1.2bn and Latin America remained relatively unchanged.
In personal lending, Asia balances grew by $7.4bn across both its mortgage and other personal lending, and there was a $1.9bn increase in the Premier mortgage portfolio in the US and Canada. The increase was partly offset by a $5.0bn reduction in the US CML portfolio as a result of the ongoing run-off of the portfolio and continued loan sales.
Loan impairment charges increased by $0.2bn compared with 2014, notably in Middle East and North Africa and North America.
HSBC HOLDINGS PLC
120 |
Table of Contents
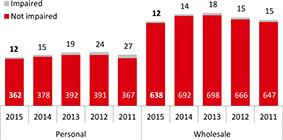
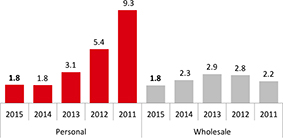
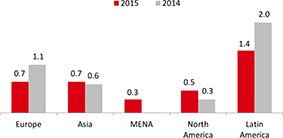
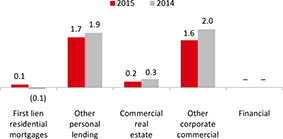
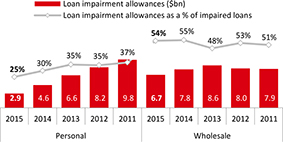
(Audited)
During 2015, gross loans and advances and related impairment allowances arising in our Brazilian operations were reclassified from ‘Loans and advances to customers’ and ‘Loans and advances to banks’ to ‘Assets held for sale’ in the balance sheet.
Disclosures relating to assets held for sale are provided in the following credit risk management tables, primarily where the disclosure is relevant to the measurement of these financial assets:
| • | Maximum exposure to credit risk (page 122); |
| • | Distribution of financial instruments by credit quality (page 125); |
| • | Past due but not impaired gross financial instruments by geographical region (page 127); and |
| • | Ageing analysis of days past due but not impaired gross financial instruments (page 127). |
Although there was a reclassification on the balance sheet, there was no separate income statement reclassification. As a result, charges for loan impairment losses shown in the credit risk disclosures include loan impairment charges relating to financial assets classified as ‘Assets held for sale’.
Loans and advances to customers and banks measured at amortised cost
(Audited)
| Total gross loans and advances | Impairment allowances on loans and advances | |||||||||||
| $m | $m | |||||||||||
As reported | 1,024,428 | (9,573 | ) | |||||||||
Reported in ‘Assets held for sale’ | 24,544 | (1,454 | ) | |||||||||
At 31 December 2015 | 1,048,972 | (11,027 | ) | |||||||||
At 31 December 2014, the gross loans and advances and related impairment allowances of our Brazilian operations were $31bn and $1.7bn, respectively. Gross loans and advances reduced by $8.5bn, mainly as a result of foreign exchange movements.
Lending balances held for sale continue to be measured at amortised cost less allowances for impairment; such carrying amounts may differ from fair value. Any difference between the carrying amount and the sales price, which is the fair value at the time of sale, would be recognised as a gain or loss at the time of sale.
See Note 23 on the Financial Statements for the carrying amount and the fair value at 31 December 2015 of loans and advances to banks and customers classified as held for sale.
HSBC HOLDINGS PLC
121 |
Table of Contents
Report of the Directors: Risk(continued)
Credit risk
Gross loans and impairment allowances on loans and advances to customers and banks reported in ‘Assets held for sale’
(Audited)
| Brazil | Other | Total | ||||||||||||||||||
| $m | $m | $m | ||||||||||||||||||
Gross loans | ||||||||||||||||||||
Loans and advances to customers | 18,103 | 2,042 | 20,145 | |||||||||||||||||
– personal | 5,571 | 40 | 5,611 | |||||||||||||||||
– corporate and commercial | 12,532 | 2,002 | 14,534 | |||||||||||||||||
Financial | 4,399 | – | 4,399 | |||||||||||||||||
– non-bank financial institutions | 331 | – | 331 | |||||||||||||||||
– banks | 4,068 | – | 4,068 | |||||||||||||||||
At 31 December 2015 | 22,502 | 2,042 | 24,544 | |||||||||||||||||
Impairment allowances | ||||||||||||||||||||
Loans and advances to customers | (1,433 | ) | (21 | ) | (1,454 | ) | ||||||||||||||
– personal | (664 | ) | – | (664 | ) | |||||||||||||||
– corporate and commercial | (769 | ) | (21 | ) | (790 | ) | ||||||||||||||
Financial | – | – | – | |||||||||||||||||
– non-bank financial institutions | – | – | – | |||||||||||||||||
– banks | – | – | – | |||||||||||||||||
At 31 December 2015 | (1,433 | ) | (21 | ) | (1,454 | ) | ||||||||||||||
The table below analyses the amount of LICs arising from assets held for sale. The held for sale assets primarily relate to the Brazilian operations.
Loan impairment charges and other credit risk provisions
(Audited)
| 2015 | ||||||
| $m | ||||||
LICs arising from: | ||||||
– assets held for sale | 965 | |||||
– assets not held for sale | 2,757 | |||||
Year ended 31 December | 3,722 | |||||
Maximum exposure to credit risk
(Audited)
The table on page 123 provides information on balance sheet items, offsets and loan and other credit-related commitments. Commentary on balance sheet movements is provided on page 62.
The offset in derivatives decreased in line with the decrease in maximum exposure amounts.
The offset on corporate and commercial loans to customers decreased by $15bn. This reduction was mainly related to corporate overdraft balances where a small number of clients benefited from the use of net interest arrangements across overdrafts and deposits. As a result, while net risk exposures are generally stable, gross balances can be volatile.
‘Maximum exposure to credit risk’ table (page 123)
The table presents our maximum exposure to credit risk from balance sheet and off-balance sheet financial instruments before taking account of any collateral held or other credit enhancements (unless such enhancements meet accounting offsetting requirements). For financial assets recognised on the balance sheet, the maximum exposure to credit risk equals their carrying amount; for financial guarantees and similar contracts granted, it is the maximum amount that we would have to pay if the guarantees were called upon. For loan commitments and other credit-related commitments, it is generally the full amount of the committed facilities.
The offset in the table relates to amounts where there is a legally enforceable right of offset in the event of counterparty default and where, as a result, there is a net exposure for credit risk purposes. However, as there is no intention to settle these balances on a net basis under normal circumstances, they do not qualify for net presentation for accounting purposes. No offset has been applied to off-balance sheet collateral. In the case of derivatives the offset column also includes collateral received in cash and other financial assets.
|
While not disclosed as an offset in the ‘Maximum exposure to credit risk’ table, other arrangements are in place which reduce our maximum exposure to credit risk. These include a charge over collateral over borrowers’ specific assets such as residential properties. Other credit risk mitigants include short positions in securities and financial assets held as part of linked insurance/investment contracts where the risk is predominantly borne by the policyholder. In addition, we hold collateral in the form of financial instruments that are not recognised on the balance sheet.
See Note 32 and from page 139 and page 147 respectively on the Financial Statements for further details on collateral in respect of certain loans and advances and derivatives.
HSBC HOLDINGS PLC
122 |
Table of Contents
Maximum exposure to credit risk
(Audited)
| 2015 | 2014 | |||||||||||||||||||||||||||||||||||
| Maximum exposure | Offset | Net | Maximum exposure | Offset | Net | |||||||||||||||||||||||||||||||
| $m | $m | $m | $m | $m | $m | |||||||||||||||||||||||||||||||
Cash and balances at central banks | 98,934 | – | 98,934 | 129,957 | – | 129,957 | ||||||||||||||||||||||||||||||
Items in the course of collection from other banks | 5,768 | – | 5,768 | 4,927 | – | 4,927 | ||||||||||||||||||||||||||||||
Hong Kong Government certificates of indebtedness | 28,410 | – | 28,410 | 27,674 | – | 27,674 | ||||||||||||||||||||||||||||||
Trading assets | 158,346 | – | 158,346 | 228,944 | – | 228,944 | ||||||||||||||||||||||||||||||
– Treasury and other eligible bills | 7,829 | – | 7,829 | 16,170 | – | 16,170 | ||||||||||||||||||||||||||||||
– debt securities | 99,038 | – | 99,038 | 141,532 | – | 141,532 | ||||||||||||||||||||||||||||||
– loans and advances to banks | 22,303 | – | 22,303 | 27,581 | – | 27,581 | ||||||||||||||||||||||||||||||
– loans and advances to customers | 29,176 | – | 29,176 | 43,661 | – | 43,661 | ||||||||||||||||||||||||||||||
Financial assets designated at fair value | 4,857 | – | 4,857 | 9,031 | – | 9,031 | ||||||||||||||||||||||||||||||
– Treasury and other eligible bills | 396 | – | 396 | 56 | – | 56 | ||||||||||||||||||||||||||||||
– debt securities | 4,341 | – | 4,341 | 8,891 | – | 8,891 | ||||||||||||||||||||||||||||||
– loans and advances to banks | 120 | – | 120 | 84 | – | 84 | ||||||||||||||||||||||||||||||
– loans and advances to customers | – | – | – | – | – | – | ||||||||||||||||||||||||||||||
Derivatives | 288,476 | (258,755 | ) | 29,721 | 345,008 | (313,300 | ) | 31,708 | ||||||||||||||||||||||||||||
Loans and advances to customers held at amortised cost | 924,454 | (52,190 | ) | 872,264 | 974,660 | (67,094 | ) | 907,566 | ||||||||||||||||||||||||||||
– personal | 371,203 | (5,373 | ) | 365,830 | 388,954 | (4,412 | ) | 384,542 | ||||||||||||||||||||||||||||
– corporate and commercial | 493,078 | (44,260 | ) | 448,818 | 535,184 | (59,197 | ) | 475,987 | ||||||||||||||||||||||||||||
– non-bank financial institutions | 60,173 | (2,557 | ) | 57,616 | 50,522 | (3,485 | ) | 47,037 | ||||||||||||||||||||||||||||
Loans and advances to banks held at amortised cost | 90,401 | (53 | ) | 90,348 | 112,149 | (258 | ) | 111,891 | ||||||||||||||||||||||||||||
Reverse repurchase agreements – non-trading | 146,255 | (900 | ) | 145,355 | 161,713 | (5,750 | ) | 155,963 | ||||||||||||||||||||||||||||
Financial investments | 423,120 | – | 423,120 | 404,773 | – | 404,773 | ||||||||||||||||||||||||||||||
– Treasury and other similar bills | 104,551 | – | 104,551 | 81,517 | – | 81,517 | ||||||||||||||||||||||||||||||
– debt securities | 318,569 | – | 318,569 | 323,256 | – | 323,256 | ||||||||||||||||||||||||||||||
Assets held for sale | 40,078 | – | 40,078 | 1,375 | – | 1,375 | ||||||||||||||||||||||||||||||
– disposal groups | 38,097 | – | 38,097 | 889 | – | 889 | ||||||||||||||||||||||||||||||
– non-current assets held for sale | 1,981 | – | 1,981 | 486 | – | 486 | ||||||||||||||||||||||||||||||
Other assets | 25,310 | – | 25,310 | 33,889 | – | 33,889 | ||||||||||||||||||||||||||||||
– endorsements and acceptances | 9,149 | – | 9,149 | 10,775 | – | 10,775 | ||||||||||||||||||||||||||||||
– other | 16,161 | – | 16,161 | 23,114 | – | 23,114 | ||||||||||||||||||||||||||||||
Total balance sheet exposure to credit risk | 2,234,409 | (311,898 | ) | 1,922,511 | 2,434,100 | (386,402 | ) | 2,047,698 | ||||||||||||||||||||||||||||
Total off-balance sheet2 | 712,546 | – | 712,546 | 698,458 | – | 698,458 | ||||||||||||||||||||||||||||||
– financial guarantees and similar contracts | 46,116 | – | 46,116 | 47,078 | – | 47,078 | ||||||||||||||||||||||||||||||
– loan and other credit-related commitments2 | 666,430 | – | 666,430 | 651,380 | – | 651,380 | ||||||||||||||||||||||||||||||
At 31 December | 2,946,955 | (311,898 | ) | 2,635,057 | 3,132,558 | (386,402 | ) | 2,746,156 | ||||||||||||||||||||||||||||
For footnote, see page 191
Loan and other credit-related commitments2
| Europe | Asia | MENA | North America | Latin America | Total | |||||||||||||||||||||||||||||||
| $m | $m | $m | $m | $m | $m | |||||||||||||||||||||||||||||||
Personal | 70,013 | 103,153 | 3,092 | 14,510 | 12,175 | 202,943 | ||||||||||||||||||||||||||||||
Corporate and commercial | 105,303 | 159,947 | 20,139 | 102,369 | 18,155 | 405,913 | ||||||||||||||||||||||||||||||
Financial | 20,230 | 11,619 | 186 | 24,543 | 996 | 57,574 | ||||||||||||||||||||||||||||||
At 31 December 2015 | 195,546 | 274,719 | 23,417 | 141,422 | 31,326 | 666,430 | ||||||||||||||||||||||||||||||
Personal | 86,247 | 96,497 | 2,995 | 15,636 | 11,679 | 213,054 | ||||||||||||||||||||||||||||||
Corporate and commercial | 98,045 | 138,366 | 20,141 | 102,911 | 17,540 | 377,003 | ||||||||||||||||||||||||||||||
Financial | 26,605 | 9,355 | 711 | 23,559 | 1,093 | 61,323 | ||||||||||||||||||||||||||||||
At 31 December 2014 | 210,897 | 244,218 | 23,847 | 142,106 | 30,312 | 651,380 | ||||||||||||||||||||||||||||||
For footnote, see page 191.
The geographical diversification of our lending portfolio and our broad range of global businesses and products ensured that we did not overly depend on a few markets to generate growth in 2015. This diversification also supported our strategy for growth in faster-growing markets and those with international connectivity.
Our holdings of available-for-sale government and government agency debt securities, corporate debt securities, ABSs and other securities were spread across a wide range of issuers and geographical regions in 2015, with 14% invested in securities issued by banks and other financial institutions and 75% in government or government agency debt securities. We also held assets backing insurance and investment contracts.
HSBC HOLDINGS PLC
123 |
Table of Contents
Report of the Directors: Risk(continued)
Credit risk
For an analysis of financial investments, see Note 17 on the Financial Statements.
Trading securities remained the largest concentration within trading assets at 77% in 2015 and 2014. The largest concentration within the trading securities portfolio was in government and government agency debt securities. We had significant exposures to US Treasury and government agency debt securities ($15bn) and UK ($10bn) and Hong Kong ($6.5bn) government debt securities.
For an analysis of debt and equity securities held for trading, see Note 12 on the Financial Statements.
Derivative assets were $288bn at 31 December 2015 (2014: $345bn). Details of derivative amounts cleared through an exchange, central counterparty and non-central counterparty are shown on page 142.
For an analysis of derivatives, see page 141 and Note 16 on the Financial Statements.
The following tables analyse loans by industry sector and by the location of the principal operations of the lending subsidiary or, in the case of the operations of The Hongkong and Shanghai Banking Corporation, HSBC Bank, HSBC Bank Middle East Limited and HSBC Bank USA, by the location of the lending branch. Excluding the effect of the classification of Brazilian assets as ‘Assets held for sale’, the distribution of loans across geographical regions and industries remained similar to last year.
For an analysis of loans and advances by country see page 151.
Gross loans and advances by industry sector and by geographical region
(Audited)
| Europe | Asia | MENA | North America | Latin America | Total | As a % of total | ||||||||||||||||||||||||||||||||||||
| $m | $m | $m | $m | $m | $m | gross loans | ||||||||||||||||||||||||||||||||||||
Personal | 170,526 | 132,707 | 6,705 | 58,186 | 5,958 | 374,082 | 36.5 | |||||||||||||||||||||||||||||||||||
– first lien residential mortgages | 125,544 | 94,606 | 2,258 | 50,117 | 1,986 | 274,511 | 26.8 | |||||||||||||||||||||||||||||||||||
– other personal3 | 44,982 | 38,101 | 4,447 | 8,069 | 3,972 | 99,571 | 9.7 | |||||||||||||||||||||||||||||||||||
Wholesale | ||||||||||||||||||||||||||||||||||||||||||
Corporate and commercial | 191,765 | 211,224 | 22,268 | 62,882 | 11,374 | 499,513 | 48.8 | |||||||||||||||||||||||||||||||||||
– manufacturing | 39,003 | 34,272 | 2,504 | 17,507 | 2,572 | 95,858 | 9.4 | |||||||||||||||||||||||||||||||||||
– international trade and services | 62,667 | 72,199 | 9,552 | 11,505 | 3,096 | 159,019 | 15.5 | |||||||||||||||||||||||||||||||||||
– commercial real estate | 26,256 | 32,371 | 690 | 7,032 | 1,577 | 67,926 | 6.7 | |||||||||||||||||||||||||||||||||||
– other property-related | 7,323 | 35,206 | 1,908 | 8,982 | 45 | 53,464 | 5.2 | |||||||||||||||||||||||||||||||||||
– government | 3,653 | 1,132 | 1,695 | 203 | 772 | 7,455 | 0.7 | |||||||||||||||||||||||||||||||||||
– other commercial4 | 52,863 | 36,044 | 5,919 | 17,653 | 3,312 | 115,791 | 11.3 | |||||||||||||||||||||||||||||||||||
Financial | 51,969 | 68,321 | 10,239 | 16,308 | 3,996 | 150,833 | 14.7 | |||||||||||||||||||||||||||||||||||
– non-bank financial institutions | 33,621 | 13,969 | 2,321 | 9,822 | 681 | 60,414 | 5.9 | |||||||||||||||||||||||||||||||||||
– banks | 18,348 | 54,352 | 7,918 | 6,486 | 3,315 | 90,419 | 8.8 | |||||||||||||||||||||||||||||||||||
Total wholesale | 243,734 | 279,545 | 32,507 | 79,190 | 15,370 | 650,346 | 63.5 | |||||||||||||||||||||||||||||||||||
Total gross loans and advances at 31 December 2015 | 414,260 | 412,252 | 39,212 | 137,376 | 21,328 | 1,024,428 | 100.0 | |||||||||||||||||||||||||||||||||||
Percentage of total gross loans and advances | 40.4% | 40.3% | 3.8% | 13.4% | 2.1% | 100.0% | ||||||||||||||||||||||||||||||||||||
Personal | 178,531 | 129,515 | 6,571 | 65,400 | 13,537 | 393,554 | 35.8 | |||||||||||||||||||||||||||||||||||
– first lien residential mortgages | 131,000 | 93,147 | 2,647 | 55,577 | 4,153 | 286,524 | 26.0 | |||||||||||||||||||||||||||||||||||
– other personal3 | 47,531 | 36,368 | 3,924 | 9,823 | 9,384 | 107,030 | 9.8 | |||||||||||||||||||||||||||||||||||
Wholesale | ||||||||||||||||||||||||||||||||||||||||||
Corporate and commercial | 212,523 | 220,799 | 20,588 | 57,993 | 30,722 | 542,625 | 49.4 | |||||||||||||||||||||||||||||||||||
– manufacturing | 39,456 | 37,767 | 2,413 | 15,299 | 12,051 | 106,986 | 9.7 | |||||||||||||||||||||||||||||||||||
– international trade and services | 76,629 | 72,814 | 9,675 | 13,484 | 8,189 | 180,791 | 16.4 | |||||||||||||||||||||||||||||||||||
– commercial real estate | 28,187 | 35,678 | 579 | 6,558 | 2,291 | 73,293 | 6.7 | |||||||||||||||||||||||||||||||||||
– other property-related | 7,126 | 34,379 | 1,667 | 8,934 | 281 | 52,387 | 4.8 | |||||||||||||||||||||||||||||||||||
– government | 2,264 | 1,195 | 1,552 | 164 | 968 | 6,143 | 0.6 | |||||||||||||||||||||||||||||||||||
– other commercial4 | 58,861 | 38,966 | 4,702 | 13,554 | 6,942 | 123,025 | 11.2 | |||||||||||||||||||||||||||||||||||
Financial | 45,081 | 76,957 | 13,786 | 16,439 | 10,753 | 163,016 | 14.8 | |||||||||||||||||||||||||||||||||||
– non-bank financial institutions | 23,103 | 13,997 | 3,291 | 9,034 | 1,393 | 50,818 | 4.6 | |||||||||||||||||||||||||||||||||||
– banks | 21,978 | 62,960 | 10,495 | 7,405 | 9,360 | 112,198 | 10.2 | |||||||||||||||||||||||||||||||||||
Total wholesale | 257,604 | 297,756 | 34,374 | 74,432 | 41,475 | 705,641 | 64.2 | |||||||||||||||||||||||||||||||||||
Total gross loans and advances at 31 December 2014 | 436,135 | 427,271 | 40,945 | 139,832 | 55,012 | 1,099,195 | 100.0 | |||||||||||||||||||||||||||||||||||
Percentage of total gross loans and advances | 39.7% | 38.9% | 3.7% | 12.7% | 5.0% | 100.0% | ||||||||||||||||||||||||||||||||||||
For footnotes, see page 191.
HSBC HOLDINGS PLC
124 |
Table of Contents
Credit quality of financial instruments
(Audited)
We assess credit quality on all financial instruments which are subject to credit risk. Additional credit quality information in respect of our consolidated holdings of ABSs is provided on page 153.
For the purpose of the following disclosure, retail loans which are past due up to 90 days and are not otherwise classified as impaired in accordance with our disclosure convention are not disclosed within the expected loss grade to which they relate, but are separately classified as past due but not impaired.
Distribution of financial instruments by credit quality
(Audited)
| Neither past due nor impaired | Past due | Total | ||||||||||||||||||||||||||||||||||||||||||||||||||||
| Strong | Good | Satisfactory |
| Sub- standard |
|
| but not impaired |
| Impaired |
| gross amount |
|
| Impairment allowances | 5 | Total | ||||||||||||||||||||||||||||||||||||||
| $m | $m | $m | $m | $m | $m | $m | $m | $m | ||||||||||||||||||||||||||||||||||||||||||||||
Cash and balances at central banks | 97,365 | 583 | 939 | 47 | – | – | 98,934 | 98,934 | ||||||||||||||||||||||||||||||||||||||||||||||
Items in the course of collection from other banks | 5,318 | 32 | 416 | 2 | – | – | 5,768 | 5,768 | ||||||||||||||||||||||||||||||||||||||||||||||
Hong Kong Government certificates of indebtedness | 28,410 | – | – | – | – | – | 28,410 | 28,410 | ||||||||||||||||||||||||||||||||||||||||||||||
Trading assets6 | 116,633 | 21,243 | 19,894 | 576 | 158,346 | 158,346 | ||||||||||||||||||||||||||||||||||||||||||||||||
– treasury and other eligible bills | 6,749 | 790 | 190 | 100 | 7,829 | 7,829 | ||||||||||||||||||||||||||||||||||||||||||||||||
– debt securities | 77,088 | 10,995 | 10,656 | 299 | 99,038 | 99,038 | ||||||||||||||||||||||||||||||||||||||||||||||||
– loans and advances: | ||||||||||||||||||||||||||||||||||||||||||||||||||||||
to banks | 14,546 | 4,391 | 3,239 | 127 | 22,303 | 22,303 | ||||||||||||||||||||||||||||||||||||||||||||||||
to customers | 18,250 | 5,067 | 5,809 | 50 | 29,176 | 29,176 | ||||||||||||||||||||||||||||||||||||||||||||||||
Financial assets designated at fair value6 | 3,037 | 701 | 736 | 383 | 4,857 | 4,857 | ||||||||||||||||||||||||||||||||||||||||||||||||
– treasury and other eligible bills | 139 | 193 | – | 64 | 396 | 396 | ||||||||||||||||||||||||||||||||||||||||||||||||
– debt securities | 2,898 | 508 | 616 | 319 | 4,341 | 4,341 | ||||||||||||||||||||||||||||||||||||||||||||||||
– loans and advances: | ||||||||||||||||||||||||||||||||||||||||||||||||||||||
to banks | – | – | 120 | – | 120 | 120 | ||||||||||||||||||||||||||||||||||||||||||||||||
to customers | – | – | – | – | – | – | ||||||||||||||||||||||||||||||||||||||||||||||||
Derivatives6 | 248,101 | 32,056 | 7,209 | 1,110 | 288,476 | 288,476 | ||||||||||||||||||||||||||||||||||||||||||||||||
Loans and advances to customers held at amortised cost7 | 472,691 | 214,152 | 194,393 | 16,836 | 12,179 | 23,758 | 934,009 | (9,555 | ) | 924,454 | ||||||||||||||||||||||||||||||||||||||||||||
– personal | 309,720 | 29,322 | 15,021 | 944 | 7,568 | 11,507 | 374,082 | (2,879 | ) | 371,203 | ||||||||||||||||||||||||||||||||||||||||||||
– corporate and commercial | 127,673 | 168,772 | 171,466 | 15,379 | 4,274 | 11,949 | 499,513 | (6,435 | ) | 493,078 | ||||||||||||||||||||||||||||||||||||||||||||
– non-bank financial institutions | 35,298 | 16,058 | 7,906 | 513 | 337 | 302 | 60,414 | (241 | ) | 60,173 | ||||||||||||||||||||||||||||||||||||||||||||
Loans and advances to banks held at amortised cost | 73,226 | 11,929 | 4,836 | 407 | 1 | 20 | 90,419 | (18 | ) | 90,401 | ||||||||||||||||||||||||||||||||||||||||||||
Reverse repurchase agreements | 108,238 | 16,552 | 20,931 | 46 | – | 488 | 146,255 | – | 146,255 | |||||||||||||||||||||||||||||||||||||||||||||
Financial investments | 382,328 | 18,600 | 16,341 | 4,525 | – | 1,326 | 423,120 | 423,120 | ||||||||||||||||||||||||||||||||||||||||||||||
– treasury and other similar bills | 93,562 | 3,963 | 4,756 | 2,270 | – | – | 104,551 | 104,551 | ||||||||||||||||||||||||||||||||||||||||||||||
– debt securities | 288,766 | 14,637 | 11,585 | 2,255 | – | 1,326 | 318,569 | 318,569 | ||||||||||||||||||||||||||||||||||||||||||||||
Assets held for sale | 10,177 | 9,605 | 17,279 | 1,635 | 703 | 2,133 | 41,532 | (1,454 | ) | 40,078 | ||||||||||||||||||||||||||||||||||||||||||||
– disposal groups | 10,149 | 8,815 | 16,213 | 1,567 | 701 | 2,085 | 39,530 | (1,433 | ) | 38,097 | ||||||||||||||||||||||||||||||||||||||||||||
– non-current assets held for sale | 28 | 790 | 1,066 | 68 | 2 | 48 | 2,002 | (21 | ) | 1,981 | ||||||||||||||||||||||||||||||||||||||||||||
Other assets | 8,306 | 5,688 | 10,204 | 632 | 147 | 333 | 25,310 | – | 25,310 | |||||||||||||||||||||||||||||||||||||||||||||
– endorsements and acceptances | 1,084 | 3,850 | 3,798 | 343 | 22 | 52 | 9,149 | 9,149 | ||||||||||||||||||||||||||||||||||||||||||||||
– accrued income and other | 7,222 | 1,838 | 6,406 | 289 | 125 | 281 | 16,161 | 16,161 | ||||||||||||||||||||||||||||||||||||||||||||||
At 31 December 2015 | 1,553,830 | 331,141 | 293,178 | 26,199 | 13,030 | 28,058 | 2,245,436 | (11,027 | ) | 2,234,409 | ||||||||||||||||||||||||||||||||||||||||||||
| % | % | % | % | % | % | % | ||||||||||||||||||||||||||||||||||||||||||||||||
Percentage of total gross amount | 69.2 | 14.7 | 13.1 | 1.2 | 0.6 | 1.2 | 100.0 | |||||||||||||||||||||||||||||||||||||||||||||||
HSBC HOLDINGS PLC
125 |
Table of Contents
Report of the Directors: Risk(continued)
Credit risk
Distribution of financial instruments by credit quality (continued)
| Neither past due nor impaired | Past due | Total | ||||||||||||||||||||||||||||||||||||||||||||||||||||
| Strong | Good | Satisfactory |
| Sub- standard |
|
| but not impaired |
| Impaired |
| gross amount |
|
| Impairment allowances | 5 | Total | ||||||||||||||||||||||||||||||||||||||
| $m | $m | $m | $m | $m | $m | $m | $m | $m | ||||||||||||||||||||||||||||||||||||||||||||||
Cash and balances at central banks | 127,971 | 1,438 | 195 | 353 | 129,957 | 129,957 | ||||||||||||||||||||||||||||||||||||||||||||||||
Items in the course of collection from other banks | 4,515 | 46 | 365 | 1 | 4,927 | 4,927 | ||||||||||||||||||||||||||||||||||||||||||||||||
Hong Kong Government certificates of indebtedness | 27,674 | – | – | – | 27,674 | 27,674 | ||||||||||||||||||||||||||||||||||||||||||||||||
Trading assets6 | 168,521 | 35,042 | 24,740 | 641 | 228,944 | 228,944 | ||||||||||||||||||||||||||||||||||||||||||||||||
– treasury and other eligible bills | 13,938 | 1,641 | 559 | 32 | 16,170 | 16,170 | ||||||||||||||||||||||||||||||||||||||||||||||||
– debt securities | 111,138 | 17,786 | 12,305 | 303 | 141,532 | 141,532 | ||||||||||||||||||||||||||||||||||||||||||||||||
– loans and advances: | ||||||||||||||||||||||||||||||||||||||||||||||||||||||
to banks | 17,492 | 4,961 | 5,016 | 112 | 27,581 | 27,581 | ||||||||||||||||||||||||||||||||||||||||||||||||
to customers | 25,953 | 10,654 | 6,860 | 194 | 43,661 | 43,661 | ||||||||||||||||||||||||||||||||||||||||||||||||
Financial assets designated at fair value6 | 3,017 | 4,476 | 1,207 | 331 | 9,031 | 9,031 | ||||||||||||||||||||||||||||||||||||||||||||||||
– treasury and other eligible bills | 5 | – | – | 51 | 56 | 56 | ||||||||||||||||||||||||||||||||||||||||||||||||
– debt securities | 3,011 | 4,476 | 1,124 | 280 | 8,891 | 8,891 | ||||||||||||||||||||||||||||||||||||||||||||||||
– loans and advances: | ||||||||||||||||||||||||||||||||||||||||||||||||||||||
to banks | 1 | – | 83 | – | 84 | 84 | ||||||||||||||||||||||||||||||||||||||||||||||||
to customers | – | – | – | – | – | – | ||||||||||||||||||||||||||||||||||||||||||||||||
Derivatives6 | 269,490 | 58,596 | 15,962 | 960 | 345,008 | 345,008 | ||||||||||||||||||||||||||||||||||||||||||||||||
Loans and advances to customers held at amortised cost7 | 487,734 | 239,136 | 196,685 | 20,802 | 13,357 | 29,283 | 986,997 | (12,337 | ) | 974,660 | ||||||||||||||||||||||||||||||||||||||||||||
– personal | 320,678 | 32,601 | 15,109 | 1,130 | 8,876 | 15,160 | 393,554 | (4,600 | ) | 388,954 | ||||||||||||||||||||||||||||||||||||||||||||
– corporate and commercial | 141,375 | 192,799 | 171,748 | 18,986 | 3,922 | 13,795 | 542,625 | (7,441 | ) | 535,184 | ||||||||||||||||||||||||||||||||||||||||||||
– non-bank financial institutions | 25,681 | 13,736 | 9,828 | 686 | 559 | 328 | 50,818 | (296 | ) | 50,522 | ||||||||||||||||||||||||||||||||||||||||||||
Loans and advances to banks held at amortised cost | 83,766 | 19,525 | 7,945 | 914 | 1 | 47 | 112,198 | (49 | ) | 112,149 | ||||||||||||||||||||||||||||||||||||||||||||
Reverse repurchase agreements | 98,470 | 28,367 | 33,283 | 1,593 | – | – | 161,713 | – | 161,713 | |||||||||||||||||||||||||||||||||||||||||||||
Financial investments | 347,218 | 27,373 | 22,600 | 5,304 | – | 2,278 | 404,773 | 404,773 | ||||||||||||||||||||||||||||||||||||||||||||||
– treasury and other similar bills | 68,966 | 6,294 | 4,431 | 1,826 | – | – | 81,517 | 81,517 | ||||||||||||||||||||||||||||||||||||||||||||||
– debt securities | 278,252 | 21,079 | 18,169 | 3,478 | – | 2,278 | 323,256 | 323,256 | ||||||||||||||||||||||||||||||||||||||||||||||
Assets held for sale | 802 | 43 | 79 | – | 2 | 465 | 1,391 | (16 | ) | 1,375 | ||||||||||||||||||||||||||||||||||||||||||||
– disposal groups | 768 | 43 | 79 | – | – | – | 890 | – | 890 | |||||||||||||||||||||||||||||||||||||||||||||
– non-current assets held for sale | 34 | – | – | – | 2 | 465 | 501 | (16 | ) | 485 | ||||||||||||||||||||||||||||||||||||||||||||
Other assets | 12,213 | 7,521 | 12,897 | 631 | 208 | 419 | 33,889 | 33,889 | ||||||||||||||||||||||||||||||||||||||||||||||
– endorsements and acceptances | 1,507 | 4,644 | 4,281 | 298 | 34 | 11 | 10,775 | 10,775 | ||||||||||||||||||||||||||||||||||||||||||||||
– accrued income and other | 10,706 | 2,877 | 8,616 | 333 | 174 | 408 | 23,114 | 23,114 | ||||||||||||||||||||||||||||||||||||||||||||||
At 31 December 2014 | 1,631,391 | 421,563 | 315,958 | 31,530 | 13,568 | 32,492 | 2,446,502 | (12,402 | ) | 2,434,100 | ||||||||||||||||||||||||||||||||||||||||||||
| % | % | % | % | % | % | % | ||||||||||||||||||||||||||||||||||||||||||||||||
Percentage of total gross amount | 66.7 | 17.2 | 12.9 | 1.3 | 0.6 | 1.3 | 100.0 | |||||||||||||||||||||||||||||||||||||||||||||||
For footnotes, see page 191.
HSBC HOLDINGS PLC
126 |
Table of Contents
Past due but not impaired gross financial instruments
(Audited)
Past due but not impaired gross financial instruments are those loans where, although customers have failed to make payments in accordance with the contractual terms of their
facilities, they have not met the impaired loan criteria described on page 128.
In personal lending, past due but not impaired balances decreased, mainly due to the Brazilian reclassification and the continued run-off and loan sales in the CML portfolio.
Past due but not impaired gross financial instruments by geographical region
(Audited)
| Europe | Asia | MENA | North America | Latin America | Total | |||||||||||||||||||||||||||||||
| $m | $m | $m | $m | $m | $m | |||||||||||||||||||||||||||||||
Loans and advances to customers held at amortised cost | 1,928 | 3,405 | 909 | 5,392 | 545 | 12,179 | ||||||||||||||||||||||||||||||
– personal | 1,152 | 2,573 | 180 | 3,287 | 376 | 7,568 | ||||||||||||||||||||||||||||||
– corporate and commercial | 762 | 790 | 710 | 1,843 | 169 | 4,274 | ||||||||||||||||||||||||||||||
– non-bank financial institutions | 14 | 42 | 19 | 262 | – | 337 | ||||||||||||||||||||||||||||||
Assets held for sale | – | – | – | 2 | 701 | 703 | ||||||||||||||||||||||||||||||
– disposal group | – | – | – | – | 701 | 701 | ||||||||||||||||||||||||||||||
– non-current assets held for sale | – | – | – | 2 | – | 2 | ||||||||||||||||||||||||||||||
Other financial instruments | 10 | 39 | 15 | 80 | 4 | 148 | ||||||||||||||||||||||||||||||
At 31 December 2015 | 1,938 | 3,444 | 924 | 5,474 | 1,250 | 13,030 | ||||||||||||||||||||||||||||||
Loans and advances to customers held at amortised cost | 2,409 | 4,260 | 704 | 4,634 | 1,350 | 13,357 | ||||||||||||||||||||||||||||||
– personal | 1,159 | 2,880 | 182 | 3,759 | 896 | 8,876 | ||||||||||||||||||||||||||||||
– corporate and commercial | 1,244 | 1,102 | 508 | 623 | 445 | 3,922 | ||||||||||||||||||||||||||||||
– non-bank financial institutions | 6 | 278 | 14 | 252 | 9 | 559 | ||||||||||||||||||||||||||||||
Assets held for sale | – | – | – | 2 | – | 2 | ||||||||||||||||||||||||||||||
– disposal group | – | – | – | – | – | – | ||||||||||||||||||||||||||||||
– non-current assets held for sale | – | – | – | 2 | – | 2 | ||||||||||||||||||||||||||||||
Other financial instruments | 6 | 52 | 31 | 95 | 25 | 209 | ||||||||||||||||||||||||||||||
At 31 December 2014 | 2,415 | 4,312 | 735 | 4,731 | 1,375 | 13,568 | ||||||||||||||||||||||||||||||
Ageing analysis of days for past due but not impaired gross financial instruments
(Audited)
Up to 29 days | 30-59 days | 60-89 days | 90-179 days | 180 days and over | Total | |||||||||||||||||||||||||||||||
| $m | $m | $m | $m | $m | $m | |||||||||||||||||||||||||||||||
Loans and advances to customers held at amortised cost | 9,403 | 1,917 | 727 | 111 | 21 | 12,179 | ||||||||||||||||||||||||||||||
– personal | 5,665 | 1,401 | 502 | – | – | 7,568 | ||||||||||||||||||||||||||||||
– corporate and commercial | 3,432 | 505 | 225 | 93 | 19 | 4,274 | ||||||||||||||||||||||||||||||
– non-bank financial institutions | 306 | 11 | – | 18 | 2 | 337 | ||||||||||||||||||||||||||||||
Assets held for sale | 476 | 137 | 90 | – | – | 703 | ||||||||||||||||||||||||||||||
– disposal group | 476 | 136 | 89 | – | – | 701 | ||||||||||||||||||||||||||||||
– non-current assets held for sale | – | 1 | 1 | – | – | 2 | ||||||||||||||||||||||||||||||
Other financial instruments | 80 | 35 | 14 | 10 | 9 | 148 | ||||||||||||||||||||||||||||||
At 31 December 2015 | 9,959 | 2,089 | 831 | 121 | 30 | 13,030 | ||||||||||||||||||||||||||||||
Loans and advances to customers held at amortised cost | 10,427 | 2,057 | 801 | 54 | 18 | 13,357 | ||||||||||||||||||||||||||||||
– personal | 6,477 | 1,717 | 676 | 5 | 1 | 8,876 | ||||||||||||||||||||||||||||||
– corporate and commercial | 3,417 | 328 | 114 | 48 | 15 | 3,922 | ||||||||||||||||||||||||||||||
– non-bank financial institutions | 533 | 12 | 11 | 1 | 2 | 559 | ||||||||||||||||||||||||||||||
Assets held for sale | – | – | – | 1 | 1 | 2 | ||||||||||||||||||||||||||||||
– disposal group | – | – | – | – | – | – | ||||||||||||||||||||||||||||||
– non-current assets held for sale | – | – | – | 1 | 1 | 2 | ||||||||||||||||||||||||||||||
Other financial instruments | 130 | 33 | 18 | 11 | 17 | 209 | ||||||||||||||||||||||||||||||
At 31 December 2014 | 10,557 | 2,090 | 819 | 66 | 36 | 13,568 | ||||||||||||||||||||||||||||||
HSBC HOLDINGS PLC
127 |
Table of Contents
Report of the Directors: Risk(continued)
Credit risk
(Audited)
Impaired loans and advances are those that meet any of the following criteria:
| • | wholesale loans and advances classified as Customer Risk Rating (‘CRR’) 9 or CRR 10. These grades are assigned when the bank considers that either the customer is unlikely to pay their credit obligations in full without recourse to security, or when the customer is more than 90 days past due on any material credit obligation to HSBC. |
| • | retail loans and advances classified as Expected Loss (‘EL’) 9 or EL 10. These grades are typically assigned to retail loans and advances more than 90 days past due |
unless individually they have been assessed as not impaired. |
| • | renegotiated loans and advances that have been subject to a change in contractual cash flows as a result of a concession which the lender would not otherwise consider, and where it is probable that without the concession the borrower would be unable to meet the contractual payment obligations in full, unless the concession is insignificant and there are no other indicators of impairment. Renegotiated loans remain classified as impaired until there is sufficient evidence to demonstrate a significant reduction in the risk of non-payment of future cash flows, and there are no other indicators of impairment. |
Movement in impaired loans by geographical region
| Europe | Asia | MENA | North America | Latin America | Total | |||||||||||||||||||||||||||||||
| $m | $m | $m | $m | $m | $m | |||||||||||||||||||||||||||||||
Impaired loans at 1 January 2015 | 10,242 | 2,048 | 1,981 | 11,694 | 3,365 | 29,330 | ||||||||||||||||||||||||||||||
– personal | 2,544 | 491 | 242 | 10,826 | 1,057 | 15,160 | ||||||||||||||||||||||||||||||
– corporate and commercial | 7,385 | 1,545 | 1,696 | 862 | 2,307 | 13,795 | ||||||||||||||||||||||||||||||
– financial | 313 | 12 | 43 | 6 | 1 | 375 | ||||||||||||||||||||||||||||||
Classified as impaired during the year | 3,909 | 1,893 | 338 | 2,986 | 2,434 | 11,560 | ||||||||||||||||||||||||||||||
– personal | 1,257 | 813 | 178 | 2,245 | 1,502 | 5,995 | ||||||||||||||||||||||||||||||
– corporate and commercial | 2,567 | 1,079 | 159 | 740 | 924 | 5,469 | ||||||||||||||||||||||||||||||
– financial | 85 | 1 | 1 | 1 | 8 | 96 | ||||||||||||||||||||||||||||||
Transferred from impaired to unimpaired during the year | (964 | ) | (204 | ) | (107 | ) | (1,786 | ) | (245 | ) | (3,306 | ) | ||||||||||||||||||||||||
– personal | (211 | ) | (169 | ) | (82 | ) | (1,699 | ) | (185 | ) | (2,346 | ) | ||||||||||||||||||||||||
– corporate and commercial | (734 | ) | (35 | ) | (6 | ) | (87 | ) | (60 | ) | (922 | ) | ||||||||||||||||||||||||
– financial | (19 | ) | – | (19 | ) | – | – | (38 | ) | |||||||||||||||||||||||||||
Amounts written off | (870 | ) | (595 | ) | (335 | ) | (589 | ) | (1,312 | ) | (3,701 | ) | ||||||||||||||||||||||||
– personal | (280 | ) | (416 | ) | (113 | ) | (493 | ) | (961 | ) | (2,263 | ) | ||||||||||||||||||||||||
– corporate and commercial | (577 | ) | (179 | ) | (222 | ) | (95 | ) | (351 | ) | (1,424 | ) | ||||||||||||||||||||||||
– financial | (13 | ) | – | – | (1 | ) | – | (14 | ) | |||||||||||||||||||||||||||
Net repayments and other | (2,640 | ) | (767 | ) | (111 | ) | (3,375 | ) | (3,212 | ) | (10,105 | ) | ||||||||||||||||||||||||
– personal | (780 | ) | (203 | ) | – | (2,885 | ) | (1,171 | ) | (5,039 | ) | |||||||||||||||||||||||||
– corporate and commercial | (1,778 | ) | (562 | ) | (110 | ) | (486 | ) | (2,033 | ) | (4,969 | ) | ||||||||||||||||||||||||
– financial | (82 | ) | (2 | ) | (1 | ) | (4 | ) | (8 | ) | (97 | ) | ||||||||||||||||||||||||
Impaired loans at 31 December 2015 | 9,677 | 2,375 | 1,766 | 8,930 | 1,030 | 23,778 | ||||||||||||||||||||||||||||||
– personal | 2,530 | 516 | 225 | 7,994 | 242 | 11,507 | ||||||||||||||||||||||||||||||
– corporate and commercial | 6,863 | 1,848 | 1,517 | 934 | 787 | 11,949 | ||||||||||||||||||||||||||||||
– financial | 284 | 11 | 24 | 2 | 1 | 322 | ||||||||||||||||||||||||||||||
| % | % | % | % | % | % | |||||||||||||||||||||||||||||||
Impaired loans as a percentage of gross loans | 2.3 | 0.6 | 4.5 | 6.5 | 4.8 | 2.3 | ||||||||||||||||||||||||||||||
– personal | 1.5 | 0.4 | 3.4 | 13.7 | 4.1 | 3.1 | ||||||||||||||||||||||||||||||
– corporate and commercial | 3.6 | 0.9 | 6.8 | 1.5 | 6.9 | 2.4 | ||||||||||||||||||||||||||||||
– financial | 0.5 | 0.0 | 0.2 | 0.0 | 0.0 | 0.2 | ||||||||||||||||||||||||||||||
HSBC HOLDINGS PLC
128 |
Table of Contents
| Europe | Asia | MENA | North America | Latin America | Total | |||||||||||||||||||||||||||||||
| $m | $m | $m | $m | $m | $m | |||||||||||||||||||||||||||||||
Impaired loans at 1 January 2014 | 13,228 | 1,623 | 2,285 | 15,123 | 4,244 | 36,503 | ||||||||||||||||||||||||||||||
– personal | 2,938 | 526 | 317 | 13,669 | 1,348 | 18,798 | ||||||||||||||||||||||||||||||
– corporate and commercial | 9,714 | 1,082 | 1,765 | 1,427 | 2,889 | 16,877 | ||||||||||||||||||||||||||||||
– financial | 576 | 15 | 203 | 27 | 7 | 828 | ||||||||||||||||||||||||||||||
Classified as impaired during the year | 3,367 | 1,970 | 346 | 4,724 | 3,342 | 13,749 | ||||||||||||||||||||||||||||||
– personal | 1,168 | 857 | 193 | 4,360 | 1,958 | 8,536 | ||||||||||||||||||||||||||||||
– corporate and commercial | 2,166 | 1,113 | 153 | 354 | 1,383 | 5,169 | ||||||||||||||||||||||||||||||
– financial | 33 | – | – | 10 | 1 | 44 | ||||||||||||||||||||||||||||||
Transferred from impaired to unimpaired during the year | (1,661 | ) | (230 | ) | (320 | ) | (2,609 | ) | (730 | ) | (5,550 | ) | ||||||||||||||||||||||||
– personal | (282 | ) | (184 | ) | (178 | ) | (2,551 | ) | (364 | ) | (3,559 | ) | ||||||||||||||||||||||||
– corporate and commercial | (1,319 | ) | (46 | ) | (53 | ) | (57 | ) | (366 | ) | (1,841 | ) | ||||||||||||||||||||||||
– financial | (60 | ) | – | (89 | ) | (1 | ) | – | (150 | ) | ||||||||||||||||||||||||||
Amounts written off | (2,037 | ) | (617 | ) | (111 | ) | (1,369 | ) | (2,048 | ) | (6,182 | ) | ||||||||||||||||||||||||
– personal | (631 | ) | (470 | ) | (77 | ) | (1,007 | ) | (1,371 | ) | (3,556 | ) | ||||||||||||||||||||||||
– corporate and commercial | (1,201 | ) | (147 | ) | (29 | ) | (356 | ) | (673 | ) | (2,406 | ) | ||||||||||||||||||||||||
– financial | (205 | ) | – | (5 | ) | (6 | ) | (4 | ) | (220 | ) | |||||||||||||||||||||||||
Net repayments and other | (2,655 | ) | (698 | ) | (219 | ) | (4,175 | ) | (1,443 | ) | (9,190 | ) | ||||||||||||||||||||||||
– personal | (649 | ) | (238 | ) | (13 | ) | (3,645 | ) | (514 | ) | (5,059 | ) | ||||||||||||||||||||||||
– corporate and commercial | (1,975 | ) | (457 | ) | (140 | ) | (506 | ) | (926 | ) | (4,004 | ) | ||||||||||||||||||||||||
– financial | (31 | ) | (3 | ) | (66 | ) | (24 | ) | (3 | ) | (127 | ) | ||||||||||||||||||||||||
Impaired loans at 31 December 2014 | 10,242 | 2,048 | 1,981 | 11,694 | 3,365 | 29,330 | ||||||||||||||||||||||||||||||
– personal | 2,544 | 491 | 242 | 10,826 | 1,057 | 15,160 | ||||||||||||||||||||||||||||||
– corporate and commercial | 7,385 | 1,545 | 1,696 | 862 | 2,307 | 13,795 | ||||||||||||||||||||||||||||||
– financial | 313 | 12 | 43 | 6 | 1 | 375 | ||||||||||||||||||||||||||||||
| % | % | % | % | % | % | |||||||||||||||||||||||||||||||
Impaired loans as a percentage of gross loans | 2.3 | 0.5 | 4.8 | 8.4 | 6.1 | 2.7 | ||||||||||||||||||||||||||||||
– personal | 1.4 | 0.4 | 3.7 | 16.6 | 7.8 | 3.9 | ||||||||||||||||||||||||||||||
– corporate and commercial | 3.5 | 0.7 | 8.2 | 1.5 | 7.5 | 2.5 | ||||||||||||||||||||||||||||||
– financial | 0.7 | 0.0 | 0.3 | 0.0 | 0.0 | 0.2 | ||||||||||||||||||||||||||||||
At 31 December 2014, our Brazilian impaired loans were $1.4bn in corporate and commercial and $0.8bn in personal.
Excluding the Brazilian reclassification to ‘Assets held for sale’, corporate and commercial impaired loans decreased $0.4bn including the favourable effects of a $0.8bn foreign exchange reduction. In personal, the continued run-off of the US CML portfolio reduced collectively assessed impaired loan balances by a further $2.7bn. ‘Net repayments and other’ included $2.1bn of CML portfolio assets that were reclassified as held for sale or sold during the year. Whilst there was a reduction in total personal impaired loans, there was a marginal increase in the UK resulting from improved identification of impaired residential mortgages.
Renegotiated loans and forbearance
The contractual terms of a loan may be modified for a number of reasons, including changes in market conditions, customer retention and other factors not related to the current or potential credit deterioration of a customer. ‘Forbearance’ describes concessions made on the contractual terms of a loan in response to an obligor’s financial difficulties. We classify and report loans on which concessions have been granted under conditions of credit distress as ‘renegotiated loans’ when their contractual payment terms have been modified because we have
significant concerns about the borrowers’ ability to meet contractual payments when due. On renegotiation, where the existing agreement is cancelled and a new agreement is made on substantially different terms, or if the terms of an existing agreement are modified such that the renegotiated loan is substantially a different financial instrument, the loan would be derecognised and recognised as a new loan for accounting purposes. However, the newly recognised financial asset will retain the renegotiated loan classification. Concessions on loans made to customers which do not affect the payment structure or basis of repayment, such as waivers of financial or security covenants, do not directly provide concessionary relief to customers in terms of their ability to service obligations as they fall due and are therefore not included in this classification.
The most significant portfolio of renegotiated loans remained in North America, substantially all of which were retail loans held by HSBC Finance Corporation (‘HSBC Finance’).
The following tables show the gross carrying amounts of the Group’s holdings of renegotiated loans and advances to customers by industry sector, geography, credit quality classification and by arrangement type.
HSBC HOLDINGS PLC
129 |
Table of Contents
Report of the Directors: Risk(continued)
Credit risk
Renegotiated loans and advances to customers by geographical region
| Europe | Asia | MENA | North America | Latin America | Total | |||||||||||||||||||||||||||||||
| $m | $m | $m | $m | $m | $m | |||||||||||||||||||||||||||||||
First lien residential mortgages | 1,461 | 68 | 36 | 10,680 | 37 | 12,282 | ||||||||||||||||||||||||||||||
– neither past due nor impaired | 512 | 47 | 11 | 3,376 | 27 | 3,973 | ||||||||||||||||||||||||||||||
– past due but not impaired | 174 | 5 | 4 | 1,567 | 3 | 1,753 | ||||||||||||||||||||||||||||||
– impaired | 775 | 16 | 21 | 5,737 | 7 | 6,556 | ||||||||||||||||||||||||||||||
Other personal lending3 | 298 | 272 | 33 | 1,054 | 35 | 1,692 | ||||||||||||||||||||||||||||||
– neither past due nor impaired | 131 | 141 | 24 | 410 | 10 | 716 | ||||||||||||||||||||||||||||||
– past due but not impaired | 51 | 16 | 2 | 173 | 1 | 243 | ||||||||||||||||||||||||||||||
– impaired | 116 | 115 | 7 | 471 | 24 | 733 | ||||||||||||||||||||||||||||||
Corporate and commercial | 5,215 | 599 | 1,411 | 638 | 506 | 8,369 | ||||||||||||||||||||||||||||||
– neither past due nor impaired | 1,467 | 119 | 343 | 93 | 130 | 2,152 | ||||||||||||||||||||||||||||||
– past due but not impaired | 109 | – | 14 | – | – | 123 | ||||||||||||||||||||||||||||||
– impaired | 3,639 | 480 | 1,054 | 545 | 376 | 6,094 | ||||||||||||||||||||||||||||||
Non-bank financial institutions | 340 | 4 | 272 | – | – | 616 | ||||||||||||||||||||||||||||||
– neither past due nor impaired | 143 | – | 248 | – | – | 391 | ||||||||||||||||||||||||||||||
– past due but not impaired | – | – | 24 | – | – | 24 | ||||||||||||||||||||||||||||||
– impaired | 197 | 4 | – | – | – | 201 | ||||||||||||||||||||||||||||||
Renegotiated loans at 31 December 2015 | 7,314 | 943 | 1,752 | 12,372 | 578 | 22,959 | ||||||||||||||||||||||||||||||
– neither past due nor impaired | 2,253 | 307 | 626 | 3,879 | 167 | 7,232 | ||||||||||||||||||||||||||||||
– past due but not impaired | 334 | 21 | 44 | 1,740 | 4 | 2,143 | ||||||||||||||||||||||||||||||
– impaired | 4,727 | 615 | 1,082 | 6,753 | 407 | 13,584 | ||||||||||||||||||||||||||||||
Impairment allowances on renegotiated loans | 1,402 | 193 | 575 | 1,014 | 155 | 3,339 | ||||||||||||||||||||||||||||||
– renegotiated loans as % of total gross loans | 1.8% | 0.3% | 5.6% | 9.5% | 3.2% | 2.5% | ||||||||||||||||||||||||||||||
First lien residential mortgages | 1,605 | 94 | 58 | 13,540 | 60 | 15,357 | ||||||||||||||||||||||||||||||
– neither past due nor impaired | 529 | 63 | 19 | 3,695 | 32 | 4,338 | ||||||||||||||||||||||||||||||
– past due but not impaired | 221 | 8 | 1 | 1,894 | 5 | 2,129 | ||||||||||||||||||||||||||||||
– impaired | 855 | 23 | 38 | 7,951 | 23 | 8,890 | ||||||||||||||||||||||||||||||
Other personal lending3 | 324 | 292 | 27 | 1,267 | 326 | 2,236 | ||||||||||||||||||||||||||||||
– neither past due nor impaired | 184 | 173 | 16 | 453 | 14 | 840 | ||||||||||||||||||||||||||||||
– past due but not impaired | 40 | 22 | 5 | 214 | 1 | 282 | ||||||||||||||||||||||||||||||
– impaired | 100 | 97 | 6 | 600 | 311 | 1,114 | ||||||||||||||||||||||||||||||
Corporate and commercial | 5,469 | 501 | 1,439 | 427 | 1,324 | 9,160 | ||||||||||||||||||||||||||||||
– neither past due nor impaired | 1,383 | 102 | 483 | 36 | 303 | 2,307 | ||||||||||||||||||||||||||||||
– past due but not impaired | 68 | – | 31 | 1 | 1 | 101 | ||||||||||||||||||||||||||||||
– impaired | 4,018 | 399 | 925 | 390 | 1,020 | 6,752 | ||||||||||||||||||||||||||||||
Non-bank financial institutions | 413 | 4 | 323 | 1 | 1 | 742 | ||||||||||||||||||||||||||||||
– neither past due nor impaired | 219 | – | 305 | – | – | 524 | ||||||||||||||||||||||||||||||
– past due but not impaired | – | – | – | – | – | – | ||||||||||||||||||||||||||||||
– impaired | 194 | 4 | 18 | 1 | 1 | 218 | ||||||||||||||||||||||||||||||
Renegotiated loans at 31 December 2014 | 7,811 | 891 | 1,847 | 15,235 | 1,711 | 27,495 | ||||||||||||||||||||||||||||||
– neither past due nor impaired | 2,315 | 338 | 823 | 4,184 | 349 | 8,009 | ||||||||||||||||||||||||||||||
– past due but not impaired | 329 | 30 | 37 | 2,109 | 7 | 2,512 | ||||||||||||||||||||||||||||||
– impaired | 5,167 | 523 | 987 | 8,942 | 1,355 | 16,974 | ||||||||||||||||||||||||||||||
Impairment allowances on renegotiated loans | 1,458 | 170 | 458 | 1,499 | 704 | 4,289 | ||||||||||||||||||||||||||||||
– renegotiated loans as % of total gross loans | 1.9% | 0.2% | 6.1% | 11.5% | 3.7% | 2.8% | ||||||||||||||||||||||||||||||
For footnote, see page 191.
The following table shows movements in renegotiated loans during the year. Renegotiated loans decreased by $4.5bn to $23bn in 2015, partly due to the Brazilian reclassification of $1bn. Renegotiated loans in personal lending reduced by $3.6bn. Included within ‘other’
movements is $2.1bn of CML portfolio assets that were transferred to ‘Assets held for sale’. Write-offs reduced as a result of improvements in US economic conditions and housing market.
HSBC HOLDINGS PLC
130 |
Table of Contents
Movement in renegotiated loans and advances to customers by geographical region
| Europe | Asia | MENA | North America | Latin America | Total | |||||||||||||||||||||||||||||||
| $m | $m | $m | $m | $m | $m | |||||||||||||||||||||||||||||||
Renegotiated loans at 1 January 2015 | 7,811 | 891 | 1,847 | 15,235 | 1,711 | 27,495 | ||||||||||||||||||||||||||||||
– personal | 1,929 | 386 | 85 | 14,807 | 386 | 17,593 | ||||||||||||||||||||||||||||||
– corporate and commercial | 5,469 | 501 | 1,439 | 427 | 1,324 | 9,160 | ||||||||||||||||||||||||||||||
– non-bank financial institutions | 413 | 4 | 323 | 1 | 1 | 742 | ||||||||||||||||||||||||||||||
Loans renegotiated in the year without derecognition | 1,970 | 421 | 115 | 999 | 553 | 4,058 | ||||||||||||||||||||||||||||||
– personal | 471 | 87 | 7 | 625 | 250 | 1,440 | ||||||||||||||||||||||||||||||
– corporate and commercial | 1,494 | 334 | 89 | 374 | 303 | 2,594 | ||||||||||||||||||||||||||||||
– non-bank financial institutions | 5 | – | 19 | – | – | 24 | ||||||||||||||||||||||||||||||
Loans renegotiated in the year resulting in recognition of a new loan | 222 | 16 | 196 | (1 | ) | 175 | 608 | |||||||||||||||||||||||||||||
– personal | 57 | – | – | (1 | ) | 18 | 74 | |||||||||||||||||||||||||||||
– corporate and commercial | 156 | 16 | 4 | – | 157 | 333 | ||||||||||||||||||||||||||||||
– non-bank financial institutions | 9 | – | 192 | – | – | 201 | ||||||||||||||||||||||||||||||
Repayments | (1,675 | ) | (351 | ) | (276 | ) | (1,304 | ) | (467 | ) | (4,073 | ) | ||||||||||||||||||||||||
– personal | (574 | ) | (88 | ) | (32 | ) | (1,166 | ) | (185 | ) | (2,045 | ) | ||||||||||||||||||||||||
– corporate and commercial | (1,054 | ) | (263 | ) | (159 | ) | (138 | ) | (282 | ) | (1,896 | ) | ||||||||||||||||||||||||
– non-bank financial institutions | (47 | ) | – | (85 | ) | – | – | (132 | ) | |||||||||||||||||||||||||||
Amounts written off | (294 | ) | (52 | ) | (11 | ) | (254 | ) | (290 | ) | (901 | ) | ||||||||||||||||||||||||
– personal | (45 | ) | (24 | ) | (5 | ) | (241 | ) | (139 | ) | (454 | ) | ||||||||||||||||||||||||
– corporate and commercial | (249 | ) | (28 | ) | (6 | ) | (12 | ) | (150 | ) | (445 | ) | ||||||||||||||||||||||||
– non-bank financial institutions | – | – | – | (1 | ) | (1 | ) | (2 | ) | |||||||||||||||||||||||||||
Other | (720 | ) | 18 | (119 | ) | (2,303 | ) | (1,104 | ) | (4,228 | ) | |||||||||||||||||||||||||
– personal | (79 | ) | (21 | ) | 14 | (2,290 | ) | (258 | ) | (2,634 | ) | |||||||||||||||||||||||||
– corporate and commercial | (601 | ) | 39 | 44 | (13 | ) | (846 | ) | (1,377 | ) | ||||||||||||||||||||||||||
– non-bank financial institutions | (40 | ) | – | (177 | ) | – | – | (217 | ) | |||||||||||||||||||||||||||
At 31 December 2015 | 7,314 | 943 | 1,752 | 12,372 | 578 | 22,959 | ||||||||||||||||||||||||||||||
– personal | 1,759 | 340 | 69 | 11,734 | 72 | 13,974 | ||||||||||||||||||||||||||||||
– corporate and commercial | 5,215 | 599 | 1,411 | 638 | 506 | 8,369 | ||||||||||||||||||||||||||||||
– non-bank financial institutions | 340 | 4 | 272 | – | – | 616 | ||||||||||||||||||||||||||||||
Renegotiated loans at 1 January 2014 | 9,756 | 767 | 2,094 | 18,789 | 2,769 | 34,175 | ||||||||||||||||||||||||||||||
– personal | 2,251 | 435 | 149 | 18,130 | 607 | 21,572 | ||||||||||||||||||||||||||||||
– corporate and commercial | 7,270 | 330 | 1,583 | 658 | 2,161 | 12,002 | ||||||||||||||||||||||||||||||
– non-bank financial institutions | 235 | 2 | 362 | 1 | 1 | 601 | ||||||||||||||||||||||||||||||
Loans renegotiated in the year without derecognition | 1,543 | 371 | 296 | 862 | 725 | 3,797 | ||||||||||||||||||||||||||||||
– personal | 433 | 83 | 10 | 774 | 310 | 1,610 | ||||||||||||||||||||||||||||||
– corporate and commercial | 939 | 288 | 286 | 78 | 415 | 2,006 | ||||||||||||||||||||||||||||||
– non-bank financial institutions | 171 | – | – | 10 | – | 181 | ||||||||||||||||||||||||||||||
Loans renegotiated in the year resulting in recognition of a new loan | 500 | 5 | 79 | – | 92 | 676 | ||||||||||||||||||||||||||||||
– personal | 69 | 2 | – | – | 28 | 99 | ||||||||||||||||||||||||||||||
– corporate and commercial | 381 | – | 61 | – | 64 | 506 | ||||||||||||||||||||||||||||||
– non-bank financial institutions | 50 | 3 | 18 | – | – | 71 | ||||||||||||||||||||||||||||||
Repayments | (2,416 | ) | (246 | ) | (562 | ) | (1,518 | ) | (1,036 | ) | (5,778 | ) | ||||||||||||||||||||||||
– personal | (635 | ) | (96 | ) | (47 | ) | (1,319 | ) | (288 | ) | (2,385 | ) | ||||||||||||||||||||||||
– corporate and commercial | (1,757 | ) | (149 | ) | (445 | ) | (189 | ) | (747 | ) | (3,287 | ) | ||||||||||||||||||||||||
– non-bank financial institutions | (24 | ) | (1 | ) | (70 | ) | (10 | ) | (1 | ) | (106 | ) | ||||||||||||||||||||||||
Amounts written off | (828 | ) | (42 | ) | (23 | ) | (640 | ) | (510 | ) | (2,043 | ) | ||||||||||||||||||||||||
– personal | (88 | ) | (28 | ) | (7 | ) | (568 | ) | (223 | ) | (914 | ) | ||||||||||||||||||||||||
– corporate and commercial | (740 | ) | (14 | ) | (16 | ) | (72 | ) | (286 | ) | (1,128 | ) | ||||||||||||||||||||||||
– non-bank financial institutions | – | – | – | – | (1 | ) | (1 | ) | ||||||||||||||||||||||||||||
Other | (744 | ) | 36 | (37 | ) | (2,258 | ) | (329 | ) | (3,332 | ) | |||||||||||||||||||||||||
– personal | (101 | ) | (10 | ) | (20 | ) | (2,210 | ) | (48 | ) | (2,389 | ) | ||||||||||||||||||||||||
– corporate and commercial | (624 | ) | 46 | (30 | ) | (48 | ) | (283 | ) | (939 | ) | |||||||||||||||||||||||||
– non-bank financial institutions | (19 | ) | – | 13 | – | 2 | (4 | ) | ||||||||||||||||||||||||||||
At 31 December 2014 | 7,811 | 891 | 1,847 | 15,235 | 1,711 | 27,495 | ||||||||||||||||||||||||||||||
– personal | 1,929 | 386 | 85 | 14,807 | 386 | 17,593 | ||||||||||||||||||||||||||||||
– corporate and commercial | 5,469 | 501 | 1,439 | 427 | 1,324 | 9,160 | ||||||||||||||||||||||||||||||
– non-bank financial institutions | 413 | 4 | 323 | 1 | 1 | 742 | ||||||||||||||||||||||||||||||
A range of forbearance strategies are employed in order to improve the management of customer relationships, maximise collection opportunities and, if possible, avoid default, foreclosure or repossession.
The table below shows the arrangement type as a percentage of the total value of arrangements offered. Corporate renegotiated loans often require the granting of more than one arrangement type as part of an effective strategy. The percentages reported in the table below includes the effect of loans being reported in more than one arrangement type.
HSBC HOLDINGS PLC
131 |
Table of Contents
Report of the Directors: Risk(continued)
Credit risk
Renegotiated loans by arrangement type: corporate and commercial and financial
| % | ||||||
Maturity term extensions | 42.4 | |||||
Reductions in margin, principal forgiveness, debt equity swaps and interest, fees or penalty payment forgiveness | 19.6 | |||||
Other changes to repayment profile | 14.1 | |||||
Interest only conversion | 13.9 | |||||
Other | 10.0 | |||||
At 31 December 2015 | 100.0 | |||||
In personal lending, renegotiated loans have been allocated to the single most dominant arrangement type.
Renegotiated loans by arrangement type: personal lending
| % | ||||||
Personal | ||||||
– interest rate and terms modifications | 11.4 | |||||
– payment concessions | 6.0 | |||||
– collection re-age8 | 35.0 | |||||
– modification re-age9 | 42.9 | |||||
– other | 4.7 | |||||
At 31 December 2015 | 100.0 | |||||
For footnotes, see page 191.
Impairment of loans and advances
(Audited)
For an analysis of loan impairment charges and other credit risk provisions by global business, see page 65.
The tables below analyse the loan impairment charges for the year by industry sector, for impaired loans and advances that are either individually or collectively assessed, and collective impairment allowances on loans and advances that are classified as not impaired.
Loan impairment charge to the income statement by industry sector
| Europe | Asia | MENA | North America | Latin America | Total | |||||||||||||||||||||||||||||||
| $m | $m | $m | $m | $m | $m | |||||||||||||||||||||||||||||||
Personal | 263 | 309 | 122 | 157 | 983 | 1,834 | ||||||||||||||||||||||||||||||
– first lien residential mortgages | (7 | ) | (1 | ) | 49 | 70 | 41 | 152 | ||||||||||||||||||||||||||||
– other personal3 | 270 | 310 | 73 | 87 | 942 | 1,682 | ||||||||||||||||||||||||||||||
Corporate and commercial | 432 | 372 | 195 | 319 | 451 | 1,769 | ||||||||||||||||||||||||||||||
– manufacturing and international trade and services | 158 | 250 | 107 | 26 | 305 | 846 | ||||||||||||||||||||||||||||||
– commercial real estate and other property-related | 33 | 18 | 49 | 24 | 47 | 171 | ||||||||||||||||||||||||||||||
– other commercial4 | 241 | 104 | 39 | 269 | 99 | 752 | ||||||||||||||||||||||||||||||
Financial | 14 | – | (18 | ) | (7 | ) | – | (11 | ) | |||||||||||||||||||||||||||
Total loan impairment charge for the year ended 31 December 2015 | 709 | 681 | 299 | 469 | 1,434 | 3,592 | ||||||||||||||||||||||||||||||
Personal | 245 | 321 | 25 | 117 | 1,095 | 1,803 | ||||||||||||||||||||||||||||||
– first lien residential mortgages | (75 | ) | 6 | (24 | ) | 26 | 15 | (52 | ) | |||||||||||||||||||||||||||
– other personal3 | 320 | 315 | 49 | 91 | 1,080 | 1,855 | ||||||||||||||||||||||||||||||
Corporate and commercial | 790 | 327 | 6 | 196 | 937 | 2,256 | ||||||||||||||||||||||||||||||
– manufacturing and international trade and services | 520 | 197 | 36 | 116 | 382 | 1,251 | ||||||||||||||||||||||||||||||
– commercial real estate and other property-related | 78 | 29 | (28 | ) | 27 | 176 | 282 | |||||||||||||||||||||||||||||
– other commercial4 | 192 | 101 | (2 | ) | 53 | 379 | 723 | |||||||||||||||||||||||||||||
Financial | 44 | (4 | ) | (32 | ) | (13 | ) | 1 | (4 | ) | ||||||||||||||||||||||||||
Total loan impairment charge for the year ended 31 December 2014 | 1,079 | 644 | (1 | ) | 300 | 2,033 | 4,055 | |||||||||||||||||||||||||||||
For footnotes, see page 191.
Loan impairment charge to the income statement by assessment type
| Europe | Asia | MENA | North America | Latin America | Total | |||||||||||||||||||||||||||||||
| $m | $m | $m | $m | $m | $m | |||||||||||||||||||||||||||||||
Individually assessed impairment allowances | 495 | 300 | 161 | 227 | 322 | 1,505 | ||||||||||||||||||||||||||||||
– new allowances | 991 | 518 | 216 | 290 | 401 | 2,416 | ||||||||||||||||||||||||||||||
– release of allowances no longer required | (455 | ) | (179 | ) | (52 | ) | (46 | ) | (93 | ) | (825 | ) | ||||||||||||||||||||||||
– recoveries of amounts previously written off | (41 | ) | (39 | ) | (3 | ) | (17 | ) | 14 | (86 | ) | |||||||||||||||||||||||||
Collectively assessed impairment allowances10 | 214 | 381 | 138 | 242 | 1,112 | 2,087 | ||||||||||||||||||||||||||||||
– new allowances net of allowance releases | 561 | 507 | 168 | 301 | 1,272 | 2,809 | ||||||||||||||||||||||||||||||
– recoveries of amounts previously written off | (347 | ) | (126 | ) | (30 | ) | (59 | ) | (160 | ) | (722 | ) | ||||||||||||||||||||||||
Total loan impairment charge for the year ended 31 December 2015 | 709 | 681 | 299 | 469 | 1,434 | 3,592 | ||||||||||||||||||||||||||||||
For footnote, see page 99.
HSBC HOLDINGS PLC
132 |
Table of Contents
| Europe | Asia | MENA | North America | Latin America | Total | |||||||||||||||||||||||||||||||
| $m | $m | $m | $m | $m | $m | |||||||||||||||||||||||||||||||
Individually assessed impairment allowances | 617 | 351 | 32 | 190 | 590 | 1,780 | ||||||||||||||||||||||||||||||
– new allowances | 1,112 | 542 | 134 | 298 | 738 | 2,824 | ||||||||||||||||||||||||||||||
– release of allowances no longer required | (486 | ) | (171 | ) | (95 | ) | (88 | ) | (90 | ) | (930 | ) | ||||||||||||||||||||||||
– recoveries of amounts previously written off | (9 | ) | (20 | ) | (7 | ) | (20 | ) | (58 | ) | (114 | ) | ||||||||||||||||||||||||
Collectively assessed impairment allowances10 | 462 | 293 | (33 | ) | 110 | 1,443 | 2,275 | |||||||||||||||||||||||||||||
– new allowances net of allowance releases | 757 | 426 | 2 | 205 | 1,726 | 3,116 | ||||||||||||||||||||||||||||||
– recoveries of amounts previously written off | (295 | ) | (133 | ) | (35 | ) | (95 | ) | (283 | ) | (841 | ) | ||||||||||||||||||||||||
Total loan impairment charge for the year ended 31 December 2014 | 1,079 | 644 | (1 | ) | 300 | 2,033 | 4,055 | |||||||||||||||||||||||||||||
For footnote, see page 191.
On a reported basis, loan impairment charges of $3.6bn were $0.5bn lower than in 2014, primarily due to favourable currency translation in Latin America and Europe.
The commentary that follows is on a constant currency basis, while tables are presented on a reported basis.
Loan impairment charges increased by $219m compared with 2014. Notably, in the fourth quarter of 2015, our loan impairment charges increased compared with the third quarter following a rise in individually assessed loan impairment charges in a small number of countries. This was reflective of specific circumstances associated with those countries with no common underlying theme. In addition, we increased our collectively assessed loan impairment allowances on exposures related to the oil and gas industry by $0.2bn. This was primarily in North America, Middle East and North Africa, and Asia.
The commentary that follows sets out in more detail the factors that have contributed to movements in loan impairment charges compared with 2014.
Collectively assessed loan impairment allowances rose by $221m, mainly in Middle East and North Africa, North America and Asia, partly offset in Europe. It arose from the following:
| • | in Middle East and North Africa (up by $167m), this was mainly in the UAE and reflected increased impairment allowances on our residential mortgage book following a review of the quality and value of collateral. In addition, loan impairment allowances increased on our corporate and commercial exposures, notably in the oil and foodstuffs industries; |
| • | in North America (up by $132m) and Asia (up by $108m), the increase was in the ‘other commercial’ sector. This |
reflected an increase in allowances against our oil and gas exposures in the regions. In our US CML portfolio, loan impairment allowances on residential mortgages were higher than in 2014 following lower favourable market value adjustments of underlying properties as improvements in housing market conditions were less pronounced in 2015. |
| • | in Europe, collectively assessed loan impairment allowances were $192m lower as 2014 included additional impairment charges from revisions to certain estimates used in our corporate collective loan impairment calculation. |
Individually assessed loan impairment allowances were broadly unchanged from 2014. This reflected decreases in Latin America, Europe and Asia which were offset by increases in Middle East and North Africa and in North America. This included the following:
| • | in Latin America (down by $95m), Europe (down by $44m) and Asia (down by $44m), we saw reductions in individually assessed loan impairment allowances as 2014 included significant impairment charges related to corporate and commercial exposures in our respective regions. In Asia, the reduction was partly offset by an increase in loan impairment allowances against a small number of customers in Indonesia; and |
| • | in Middle East and North Africa (up by $134m) and North America (up by $47m), individually assessed loan impairment allowances increased. In the former, this primarily related to higher loan impairment allowances on food wholesalers, while in North America the rise was in the oil and gas sector. |
Charge for impairment losses as a percentage of average gross loans and advances to customers by geographical region
| Europe | Asia | MENA | North America | Latin America | Total | |||||||||||||||||||||||||||||||
| % | % | % | % | % | % | |||||||||||||||||||||||||||||||
New allowances net of allowance releases | 0.31 | 0.23 | 1.07 | 0.41 | 5.37 | 0.48 | ||||||||||||||||||||||||||||||
Recoveries | (0.11 | ) | (0.05 | ) | (0.11 | ) | (0.06 | ) | (0.50 | ) | (0.09 | ) | ||||||||||||||||||||||||
Total charge for impairment losses at 31 December 2015 | 0.20 | 0.18 | 0.96 | 0.35 | 4.87 | 0.39 | ||||||||||||||||||||||||||||||
Amount written off net of recoveries | 0.25 | 0.12 | 0.97 | 0.45 | 3.94 | 0.37 | ||||||||||||||||||||||||||||||
New allowances net of allowance releases | 0.37 | 0.22 | 0.14 | 0.32 | 5.00 | 0.53 | ||||||||||||||||||||||||||||||
Recoveries | (0.08 | ) | (0.04 | ) | (0.14 | ) | (0.09 | ) | (0.72 | ) | (0.10 | ) | ||||||||||||||||||||||||
Total charge for impairment losses at 31 December 2014 | 0.29 | 0.18 | – | 0.23 | 4.28 | 0.43 | ||||||||||||||||||||||||||||||
Amount written off net of recoveries | 0.49 | 0.13 | 0.58 | 0.97 | 3.59 | 0.58 | ||||||||||||||||||||||||||||||
HSBC HOLDINGS PLC
133 |
Table of Contents
Report of the Directors: Risk(continued)
Credit risk
Movement in impairment allowances by industry sector and by geographical region
| Europe | Asia | MENA | North America | Latin America | Total | |||||||||||||||||||||||||||||||
| $m | $m | $m | $m | $m | $m | |||||||||||||||||||||||||||||||
Impairment allowances at 1 January 2015 | 4,455 | 1,356 | 1,406 | 2,640 | 2,529 | 12,386 | ||||||||||||||||||||||||||||||
Amounts written off | (627 | ) | (416 | ) | (114 | ) | (554 | ) | (996 | ) | (2,707 | ) | ||||||||||||||||||||||||
– first lien residential mortgages | (12 | ) | (6 | ) | (1 | ) | (344 | ) | (24 | ) | (387 | ) | ||||||||||||||||||||||||
– other personal3 | (615 | ) | (410 | ) | (113 | ) | (210 | ) | (972 | ) | (2,320 | ) | ||||||||||||||||||||||||
Corporate and commercial | (657 | ) | (179 | ) | (222 | ) | (106 | ) | (309 | ) | (1,473 | ) | ||||||||||||||||||||||||
– manufacturing and international trade and services | (234 | ) | (149 | ) | (214 | ) | (28 | ) | (213 | ) | (838 | ) | ||||||||||||||||||||||||
– commercial real estate and other property-related | (244 | ) | (5 | ) | (8 | ) | (57 | ) | (30 | ) | (344 | ) | ||||||||||||||||||||||||
– other commercial4 | (179 | ) | (25 | ) | – | (21 | ) | (66 | ) | (291 | ) | |||||||||||||||||||||||||
Financial | (12 | ) | – | – | (2 | ) | – | (14 | ) | |||||||||||||||||||||||||||
Total amounts written off | (1,296 | ) | (595 | ) | (336 | ) | (662 | ) | (1,305 | ) | (4,194 | ) | ||||||||||||||||||||||||
Recoveries of amounts written off in previous years | 340 | 135 | 30 | 57 | 119 | 681 | ||||||||||||||||||||||||||||||
– first lien residential mortgages | 6 | 4 | – | 26 | (17 | ) | 19 | |||||||||||||||||||||||||||||
– other personal3 | 334 | 131 | 30 | 31 | 136 | 662 | ||||||||||||||||||||||||||||||
Corporate and commercial | 46 | 30 | 3 | 18 | 27 | 124 | ||||||||||||||||||||||||||||||
– manufacturing and international trade and services | 16 | 20 | 2 | 8 | 15 | 61 | ||||||||||||||||||||||||||||||
– commercial real estate and other property-related | 24 | 5 | – | 5 | 2 | 36 | ||||||||||||||||||||||||||||||
– other commercial4 | 6 | 5 | 1 | 5 | 10 | 27 | ||||||||||||||||||||||||||||||
Financial | 2 | – | – | 1 | – | 3 | ||||||||||||||||||||||||||||||
Total recoveries of amounts written off in previous years | 388 | 165 | 33 | 76 | 146 | 808 | ||||||||||||||||||||||||||||||
Charge to income statement | 709 | 681 | 299 | 469 | 1,434 | 3,592 | ||||||||||||||||||||||||||||||
Exchange and other movements11 | (387 | ) | (82 | ) | 16 | (482 | ) | (2,084 | ) | (3,019 | ) | |||||||||||||||||||||||||
Impairment allowances at 31 December 2015 | 3,869 | 1,525 | 1,418 | 2,041 | 720 | 9,573 | ||||||||||||||||||||||||||||||
Impairment allowances against banks: | ||||||||||||||||||||||||||||||||||||
– individually assessed | – | – | 18 | – | – | 18 | ||||||||||||||||||||||||||||||
Impairment allowances against customers: | ||||||||||||||||||||||||||||||||||||
– individually assessed | 2,661 | 908 | 1,068 | 327 | 438 | 5,402 | ||||||||||||||||||||||||||||||
– collectively assessed10 | 1,208 | 617 | 332 | 1,714 | 282 | 4,153 | ||||||||||||||||||||||||||||||
Impairment allowances at 31 December 2015 | 3,869 | 1,525 | 1,418 | 2,041 | 720 | 9,573 | ||||||||||||||||||||||||||||||
Impairment allowances at 1 January 2014 | 5,598 | 1,214 | 1,583 | 4,242 | 2,564 | 15,201 | ||||||||||||||||||||||||||||||
Amounts written off | (724 | ) | (463 | ) | (157 | ) | (1,030 | ) | (1,359 | ) | (3,733 | ) | ||||||||||||||||||||||||
– first lien residential mortgages | (21 | ) | (17 | ) | (4 | ) | (731 | ) | (40 | ) | (813 | ) | ||||||||||||||||||||||||
– other personal3 | (703 | ) | (446 | ) | (153 | ) | (299 | ) | (1,319 | ) | (2,920 | ) | ||||||||||||||||||||||||
Corporate and commercial | (1,202 | ) | (146 | ) | (47 | ) | (346 | ) | (684 | ) | (2,425 | ) | ||||||||||||||||||||||||
– manufacturing and international trade and services | (732 | ) | (86 | ) | (41 | ) | (81 | ) | (428 | ) | (1,368 | ) | ||||||||||||||||||||||||
– commercial real estate and other property-related | (342 | ) | (53 | ) | (6 | ) | (153 | ) | (39 | ) | (593 | ) | ||||||||||||||||||||||||
– other commercial4 | (128 | ) | (7 | ) | – | (112 | ) | (217 | ) | (464 | ) | |||||||||||||||||||||||||
Financial | (203 | ) | – | (8 | ) | (6 | ) | (4 | ) | (221 | ) | |||||||||||||||||||||||||
Total amounts written off | (2,129 | ) | (609 | ) | (212 | ) | (1,382 | ) | (2,047 | ) | (6,379 | ) | ||||||||||||||||||||||||
Recoveries of amounts written off in previous years | 271 | 143 | 35 | 86 | 283 | 818 | ||||||||||||||||||||||||||||||
– first lien residential mortgages | 3 | 3 | – | 40 | 33 | 79 | ||||||||||||||||||||||||||||||
– other personal3 | 268 | 140 | 35 | 46 | 250 | 739 | ||||||||||||||||||||||||||||||
Corporate and commercial | 29 | 9 | 7 | 25 | 58 | 128 | ||||||||||||||||||||||||||||||
– manufacturing and international trade and services | 19 | 7 | 7 | 6 | 46 | 85 | ||||||||||||||||||||||||||||||
– commercial real estate and other property-related | 11 | – | – | 3 | 1 | 15 | ||||||||||||||||||||||||||||||
– other commercial4 | (1 | ) | 2 | – | 16 | 11 | 28 | |||||||||||||||||||||||||||||
Financial | 4 | 1 | – | 4 | – | 9 | ||||||||||||||||||||||||||||||
Total recoveries of amounts written off in previous years | 304 | 153 | 42 | 115 | 341 | 955 | ||||||||||||||||||||||||||||||
Charge to income statement | 1,079 | 644 | (1 | ) | 300 | 2,033 | 4,055 | |||||||||||||||||||||||||||||
Exchange and other movements11 | (397 | ) | (46 | ) | (6 | ) | (635 | ) | (362 | ) | (1,446 | ) | ||||||||||||||||||||||||
Impairment allowances at 31 December 2014 | 4,455 | 1,356 | 1,406 | 2,640 | 2,529 | 12,386 | ||||||||||||||||||||||||||||||
Impairment allowances against banks: | ||||||||||||||||||||||||||||||||||||
– individually assessed | 31 | – | 18 | – | – | 49 | ||||||||||||||||||||||||||||||
Impairment allowances against customers: | ||||||||||||||||||||||||||||||||||||
– individually assessed | 2,981 | 812 | 1,110 | 276 | 1,016 | 6,195 | ||||||||||||||||||||||||||||||
– collectively assessed10 | 1,443 | 544 | 278 | 2,364 | 1,513 | 6,142 | ||||||||||||||||||||||||||||||
Impairment allowances at 31 December 2014 | 4,455 | 1,356 | 1,406 | 2,640 | 2,529 | 12,386 | ||||||||||||||||||||||||||||||
For footnotes, see page 191.
HSBC HOLDINGS PLC
134 |
Table of Contents
Movement in impairment allowances on loans and advances to customers and banks
(Audited)
| Banks | Customers | |||||||||||||||||||||||
|
| individually assessed |
| | Individually assessed | |
| Collectively assessed | 10 | Total | |||||||||||||||
| $m | $m | $m | $m | |||||||||||||||||||||
At 1 January 2015 | 49 | 6,195 | 6,142 | 12,386 | ||||||||||||||||||||
Amounts written off | – | (1,368 | ) | (2,826 | ) | (4,194 | ) | |||||||||||||||||
Recoveries of loans and advances previously written off | – | 86 | 722 | 808 | ||||||||||||||||||||
Charge to income statement | (11 | ) | 1,516 | 2,087 | 3,592 | |||||||||||||||||||
Exchange and other movements11 | (20 | ) | (1,027 | ) | (1,972 | ) | (3,019 | ) | ||||||||||||||||
At 31 December 2015 | 18 | 5,402 | 4,153 | 9,573 | ||||||||||||||||||||
Impairment allowances: | ||||||||||||||||||||||||
on loans and advances to customers | 5,402 | 4,153 | 9,555 | |||||||||||||||||||||
– personal | 426 | 2,453 | 2,879 | |||||||||||||||||||||
– corporate and commercial | 4,800 | 1,635 | 6,435 | |||||||||||||||||||||
– non-bank financial institutions | 176 | 65 | 241 | |||||||||||||||||||||
| % | % | % | % | |||||||||||||||||||||
as a percentage of loans and advances | – | 0.6 | 0.4 | 0.9 | ||||||||||||||||||||
| $m | $m | $m | $m | |||||||||||||||||||||
At 1 January 2014 | 58 | 7,072 | 8,071 | 15,201 | ||||||||||||||||||||
Amounts written off | (6 | ) | (2,313 | ) | (4,060 | ) | (6,379 | ) | ||||||||||||||||
Recoveries of loans and advances previously written off | – | 114 | 841 | 955 | ||||||||||||||||||||
Charge to income statement | 4 | 1,776 | 2,275 | 4,055 | ||||||||||||||||||||
Exchange and other movements11 | (7 | ) | (454 | ) | (985 | ) | (1,446 | ) | ||||||||||||||||
At 31 December 2014 | 49 | 6,195 | 6,142 | 12,386 | ||||||||||||||||||||
Impairment allowances: | ||||||||||||||||||||||||
on loans and advances to customers | 6,195 | 6,142 | 12,337 | |||||||||||||||||||||
– personal | 468 | 4,132 | 4,600 | |||||||||||||||||||||
– corporate and commercial | 5,532 | 1,909 | 7,441 | |||||||||||||||||||||
– non-bank financial institutions | 195 | 101 | 296 | |||||||||||||||||||||
| % | % | % | % | |||||||||||||||||||||
as a percentage of loans and advances | – | 0.6 | 0.6 | 1.1 | ||||||||||||||||||||
For footnotes, see page 191.
On a reported basis and excluding the effects of the Brazilian reclassification of loans and advances to ‘Assets held for sale’, gross loans decreased by $32bn, mainly due to adverse foreign exchange effects.
The commentary that follows is on a constant currency basis, while tables are presented on a reported basis.
Wholesale lending increased by $0.5bn in the year. However, in Asia it fell by $9.6bn, mainly in Hong Kong and, to a lesser extent, mainland China and Taiwan. In Asia, the fourth quarter of 2015 saw lower than expected credit growth with a continuation of the slowdown in trade, the repayment of some existing corporate loans and slower demand for new lending.
In Europe, lending increased by $3.2bn, mainly in the UK and Germany. In the UK it rose by $1.9bn with increases in ‘financial’ partly offset by decreases in ‘corporate and commercial’, mainly relating to corporate overdraft
balances where a small number of clients benefit from the use of net interest arrangements between overdrafts and deposits.
In Middle East and North Africa, overall lending reduced by $1.2bn with decreases of $3.2bn in ‘financial’ offset by increases of $2.0bn in ‘corporate and commercial’.
In North America, lending increased by $7.5bn, mainly comprising $3.7bn in the US and $4.9bn in Canada. The increase in Canada included: $3.8bn following a change in balance sheet presentation where certain bankers’ acceptances previously disclosed under ‘Trading assets’ were included in ‘Loans and advances’; and $1.0bn relating to corporate overdraft balances and the use of net interest arrangements between overdraft and deposits. Comparatives have not been restated.
Excluding the effects of the Brazilian reclassification, lending in Latin America increased by $0.6bn, mainly in Argentina.
HSBC HOLDINGS PLC
135 |
Table of Contents
Report of the Directors: Risk(continued)
Credit risk
| Europe | Asia | MENA | North America | Latin America | Total | |||||||||||||||||||||||||||||||
| $m | $m | $m | $m | $m | $m | |||||||||||||||||||||||||||||||
Corporate and commercial (A) | 191,765 | 211,224 | 22,268 | 62,882 | 11,374 | 499,513 | ||||||||||||||||||||||||||||||
– manufacturing | 39,003 | 34,272 | 2,504 | 17,507 | 2,572 | 95,858 | ||||||||||||||||||||||||||||||
– international trade and services | 62,667 | 72,199 | 9,552 | 11,505 | 3,096 | 159,019 | ||||||||||||||||||||||||||||||
– commercial real estate | 26,256 | 32,371 | 690 | 7,032 | 1,577 | 67,926 | ||||||||||||||||||||||||||||||
– other property-related | 7,323 | 35,206 | 1,908 | 8,982 | 45 | 53,464 | ||||||||||||||||||||||||||||||
– government | 3,653 | 1,132 | 1,695 | 203 | 772 | 7,455 | ||||||||||||||||||||||||||||||
– other commercial4 | 52,863 | 36,044 | 5,919 | 17,653 | 3,312 | 115,791 | ||||||||||||||||||||||||||||||
Financial | 51,969 | 68,321 | 10,239 | 16,308 | 3,996 | 150,833 | ||||||||||||||||||||||||||||||
– non-bank financial institutions (B) | 33,621 | 13,969 | 2,321 | 9,822 | 681 | 60,414 | ||||||||||||||||||||||||||||||
– banks (C) | 18,348 | 54,352 | 7,918 | 6,486 | 3,315 | 90,419 | ||||||||||||||||||||||||||||||
Gross loans at 31 December 2015 (D) | 243,734 | 279,545 | 32,507 | 79,190 | 15,370 | 650,346 | ||||||||||||||||||||||||||||||
Impairment allowances on wholesale lending Corporate and commercial (a) | 2,735 | 1,256 | 1,157 | 777 | 510 | 6,435 | ||||||||||||||||||||||||||||||
– manufacturing | 528 | 254 | 135 | 140 | 49 | 1,106 | ||||||||||||||||||||||||||||||
– international trade and services | 813 | 599 | 439 | 123 | 48 | 2,022 | ||||||||||||||||||||||||||||||
– commercial real estate | 613 | 35 | 145 | 76 | 343 | 1,212 | ||||||||||||||||||||||||||||||
– other property-related | 237 | 72 | 267 | 55 | 1 | 632 | ||||||||||||||||||||||||||||||
– government | 6 | – | – | – | 2 | 8 | ||||||||||||||||||||||||||||||
– other commercial | 538 | 296 | 171 | 383 | 67 | 1,455 | ||||||||||||||||||||||||||||||
Financial | 194 | 13 | 22 | 30 | – | 259 | ||||||||||||||||||||||||||||||
– non-bank financial institutions (b) | 194 | 13 | 4 | 30 | – | 241 | ||||||||||||||||||||||||||||||
– banks (c) | – | – | 18 | – | – | 18 | ||||||||||||||||||||||||||||||
Impairment allowances at 31 December 2015 (d) | 2,929 | 1,269 | 1,179 | 807 | 510 | 6,694 | ||||||||||||||||||||||||||||||
| % | % | % | % | % | % | |||||||||||||||||||||||||||||||
(a) as a percentage of (A) | 1.4 | 0.6 | 5.2 | 1.2 | 4.5 | 1.3 | ||||||||||||||||||||||||||||||
(b) as a percentage of (B) | 0.6 | 0.1 | 0.2 | 0.3 | – | 0.4 | ||||||||||||||||||||||||||||||
(c) as a percentage of (C) | – | – | 0.2 | – | – | – | ||||||||||||||||||||||||||||||
(d) as a percentage of (D) | 1.2 | 0.5 | 3.6 | 1.0 | 3.3 | 1.0 | ||||||||||||||||||||||||||||||
| $m | $m | $m | $m | $m | $m | |||||||||||||||||||||||||||||||
Corporate and commercial (E) | 212,523 | 220,799 | 20,588 | 57,993 | 30,722 | 542,625 | ||||||||||||||||||||||||||||||
– manufacturing | 39,456 | 37,767 | 2,413 | 15,299 | 12,051 | 106,986 | ||||||||||||||||||||||||||||||
– international trade and services | 76,629 | 72,814 | 9,675 | 13,484 | 8,189 | 180,791 | ||||||||||||||||||||||||||||||
– commercial real estate | 28,187 | 35,678 | 579 | 6,558 | 2,291 | 73,293 | ||||||||||||||||||||||||||||||
– other property-related | 7,126 | 34,379 | 1,667 | 8,934 | 281 | 52,387 | ||||||||||||||||||||||||||||||
– government | 2,264 | 1,195 | 1,552 | 164 | 968 | 6,143 | ||||||||||||||||||||||||||||||
– other commercial4 | 58,861 | 38,966 | 4,702 | 13,554 | 6,942 | 123,025 | ||||||||||||||||||||||||||||||
Financial | 45,081 | 76,957 | 13,786 | 16,439 | 10,753 | 163,016 | ||||||||||||||||||||||||||||||
– non-bank financial institutions (F) | 23,103 | 13,997 | 3,291 | 9,034 | 1,393 | 50,818 | ||||||||||||||||||||||||||||||
– banks (G) | 21,978 | 62,960 | 10,495 | 7,405 | 9,360 | 112,198 | ||||||||||||||||||||||||||||||
Gross loans at 31 December 2014 (H) | 257,604 | 297,756 | 34,374 | 74,432 | 41,475 | 705,641 | ||||||||||||||||||||||||||||||
Impairment allowances on wholesale lending Corporate and commercial (e) | 3,112 | 1,089 | 1,171 | 608 | 1,461 | 7,441 | ||||||||||||||||||||||||||||||
– manufacturing | 529 | 242 | 141 | 152 | 348 | 1,412 | ||||||||||||||||||||||||||||||
– international trade and services | 877 | 533 | 536 | 157 | 237 | 2,340 | ||||||||||||||||||||||||||||||
– commercial real estate | 909 | 44 | 147 | 101 | 476 | 1,677 | ||||||||||||||||||||||||||||||
– other property-related | 203 | 55 | 219 | 57 | 12 | 546 | ||||||||||||||||||||||||||||||
– government | 4 | – | 1 | – | – | 5 | ||||||||||||||||||||||||||||||
– other commercial | 590 | 215 | 127 | 141 | 388 | 1,461 | ||||||||||||||||||||||||||||||
Financial | 252 | 13 | 39 | 39 | 2 | 345 | ||||||||||||||||||||||||||||||
– non-bank financial institutions (f) | 221 | 13 | 21 | 39 | 2 | 296 | ||||||||||||||||||||||||||||||
– banks (g) | 31 | – | 18 | – | – | 49 | ||||||||||||||||||||||||||||||
Impairment allowances at 31 December 2014 (h) | 3,364 | 1,102 | 1,210 | 647 | 1,463 | 7,786 | ||||||||||||||||||||||||||||||
| % | % | % | % | % | % | |||||||||||||||||||||||||||||||
(e) as a percentage of (E) | 1.5 | 0.5 | 5.7 | 1.0 | 4.8 | 1.4 | ||||||||||||||||||||||||||||||
(f) as a percentage of (F) | 0.9 | 0.1 | 0.6 | 0.4 | 0.1 | 0.6 | ||||||||||||||||||||||||||||||
(g) as a percentage of (G) | 0.1 | – | 0.2 | – | – | – | ||||||||||||||||||||||||||||||
(h) as a percentage of (H) | 1.3 | 0.4 | 3.5 | 0.9 | 3.5 | 1.1 | ||||||||||||||||||||||||||||||
For footnote, see page 191.
HSBC HOLDINGS PLC
136 |
Table of Contents
Commercial real estate lending
| Europe | Asia | MENA | North America | Latin America | Total | |||||||||||||||||||||||||||||||
| $m | $m | $m | $m | $m | $m | |||||||||||||||||||||||||||||||
Neither past due nor impaired | 24,533 | 32,182 | 466 | 6,659 | 1,086 | 64,926 | ||||||||||||||||||||||||||||||
Past due but not impaired | 89 | 119 | 25 | 212 | 9 | 454 | ||||||||||||||||||||||||||||||
Impaired loans | 1,634 | 70 | 199 | 161 | 482 | 2,546 | ||||||||||||||||||||||||||||||
Total gross loans and advances at 31 December 2015 | 26,256 | 32,371 | 690 | 7,032 | 1,577 | 67,926 | ||||||||||||||||||||||||||||||
Of which: | ||||||||||||||||||||||||||||||||||||
– renegotiated loans12 | 1,586 | 6 | 182 | 150 | 210 | 2,134 | ||||||||||||||||||||||||||||||
Impairment allowances | 613 | 35 | 145 | 76 | 343 | 1,212 | ||||||||||||||||||||||||||||||
Neither past due nor impaired | 25,860 | 35,430 | 333 | 6,136 | 1,535 | 69,294 | ||||||||||||||||||||||||||||||
Past due but not impaired | 18 | 170 | 47 | 100 | 28 | 363 | ||||||||||||||||||||||||||||||
Impaired loans | 2,309 | 78 | 199 | 322 | 728 | 3,636 | ||||||||||||||||||||||||||||||
Total gross loans and advances at 31 December 2014 | 28,187 | 35,678 | 579 | 6,558 | 2,291 | 73,293 | ||||||||||||||||||||||||||||||
Of which: | ||||||||||||||||||||||||||||||||||||
– renegotiated loans12 | 1,954 | 19 | 183 | 191 | 377 | 2,724 | ||||||||||||||||||||||||||||||
Impairment allowances | 909 | 44 | 147 | 101 | 476 | 1,677 | ||||||||||||||||||||||||||||||
For footnote, see page 191.
Commercial real estate lending includes the financing of corporate, institutional and high net worth individuals who are investing primarily in income-producing assets and, to a lesser extent, in their construction and development. The business focuses mainly on traditional core asset classes such as retail, offices, light industrial and residential building projects. The portfolio is globally diversified with larger concentrations in Hong Kong, the UK, the US and Canada.
In more developed markets, our exposure mainly comprises the financing of investment assets, the redevelopment of existing stock and the augmentation of both commercial and residential markets to support economic and population growth. In lesser developed commercial real estate markets our exposures comprise lending for development assets on relatively short tenors with a particular focus on supporting the larger, better capitalised developers involved in residential construction or in assets supporting economic expansion.
Our global exposure is centred largely on cities representing key locations of economic, political or cultural significance. In many lesser developed markets, industry is evolving to move away from the development and rapid construction of recent years to increasingly focus on investment stock consistent with more developed markets.
Excluding the effects of the Brazilian reclassification, commercial real estate lending was lower by $4.5bn including decreases of $3.2bn relating to adverse foreign exchange movements.
The commentary that follows is on a constant currency basis, while tables are presented on a reported basis.
The commercial real estate lending was lower by $1.3bn, largely due to a decrease of $2.6bn in Asia, mainly in Hong Kong and, to a lesser extent, mainland China and Singapore. The decrease in Asia was mainly due to the repayment and maturity of loans and was partly offset by increases of $1.0bn in North America and $0.4bn in Mexico. Europe and Middle East and Africa remained largely unchanged.
Refinance risk in commercial real estate
Commercial real estate lending tends to require the repayment of a significant proportion of the principal at maturity. Typically, a customer will arrange repayment through the acquisition of a new loan to settle the existing debt. Refinance risk is the risk that a customer, being unable to repay the debt on maturity, fails to refinance it at commercial rates. We monitor our commercial real estate portfolio closely, assessing those drivers that may indicate potential issues with refinancing. The principal driver is the vintage of the loan, when origination reflected previous market norms which do not apply in the current market. Examples might be higher loan-to-value (‘LTV’) ratios and/or lower interest cover ratios. The range of refinancing sources in the local market is also an important consideration, with risk increasing when lenders are restricted to banks and when bank liquidity is limited. In addition, underlying fundamentals such as the reliability of tenants, the ability to let and the condition of the property are important as they influence property values.
HSBC HOLDINGS PLC
137 |
Table of Contents
Report of the Directors: Risk(continued)
Credit risk
Commercial real estate loans and advances maturity analysis
| Europe | Asia | MENA | North America | Latin America | Total | |||||||||||||||||||||||||||||||
| $m | $m | $m | $m | $m | $m | |||||||||||||||||||||||||||||||
On demand, overdrafts or revolving | ||||||||||||||||||||||||||||||||||||
< 1 year13 | 6,830 | 8,811 | 252 | 2,992 | 694 | 19,579 | ||||||||||||||||||||||||||||||
1-2 years | 4,367 | 5,934 | 66 | 939 | 102 | 11,408 | ||||||||||||||||||||||||||||||
2-5 years | 11,459 | 11,399 | 235 | 2,037 | 138 | 25,268 | ||||||||||||||||||||||||||||||
> 5 years | 3,600 | 6,227 | 137 | 1,064 | 643 | 11,671 | ||||||||||||||||||||||||||||||
At 31 December 2015 | 26,256 | 32,371 | 690 | 7,032 | 1,577 | 67,926 | ||||||||||||||||||||||||||||||
On demand, overdrafts or revolving | ||||||||||||||||||||||||||||||||||||
< 1 year13 | 7,382 | 9,810 | 264 | 1,855 | 1,325 | 20,636 | ||||||||||||||||||||||||||||||
1-2 years | 4,643 | 6,689 | 24 | 1,158 | 205 | 12,719 | ||||||||||||||||||||||||||||||
2-5 years | 11,686 | 12,156 | 156 | 2,131 | 320 | 26,449 | ||||||||||||||||||||||||||||||
> 5 years | 4,476 | 7,023 | 135 | 1,414 | 441 | 13,489 | ||||||||||||||||||||||||||||||
At 31 December 2014 | 28,187 | 35,678 | 579 | 6,558 | 2,291 | 73,293 | ||||||||||||||||||||||||||||||
For footnote, see page 191.
Collateral on loans and advances
Collateral held is analysed separately below for commercial real estate and for other corporate, commercial and financial (non-bank) lending. This reflects the greater correlation between collateral performance and principal repayment in the commercial real estate sector than applies to other lending. In each case, the analysis includesoff-balance sheet loan commitments, primarily undrawn credit lines.
The collateral measured in the tables below consists of fixed first charges on real estate and charges over cash and marketable financial instruments. The values in the tables represent the expected market value on an open market basis; no adjustment has been made to the collateral for any expected costs of recovery. Cash is valued at its nominal value and marketable securities at their fair value. The LTV ratios presented are calculated by directly associating loans and advances with the collateral that individually and uniquely supports each facility. When collateral assets are shared by multiple loans and advances, whether specifically or, more generally, by way of an all monies charge, the collateral value is pro-rated across the loans and advances protected by the collateral.
Other types of collateral which are commonly taken for corporate and commercial lending such as unsupported guarantees and floating charges over the assets of a customer’s business are not measured in the tables below. While such mitigants have value, often providing rights in insolvency, their assignable value is not sufficiently certain and they are therefore assigned no value for disclosure purposes.
For impaired loans the collateral values cannot be directly compared with impairment allowances recognised. The LTV tables below use open market values with no adjustments. Impairment allowances are calculated on a different basis, by considering other cash flows and adjusting collateral values for costs of realising collateral as explained further on page 202.
Commercial real estate loans and advances
The value of commercial real estate collateral is determined by using a combination of professional and internal valuations and physical inspections. Due to the complexity of valuing collateral for commercial real estate, local valuation policies determine the frequency of review on the basis of local market conditions. Revaluations are sought with greater frequency as concerns over the performance of the collateral or the direct obligor increase. Revaluations may also be sought where customers amend their banking requirements, resulting in the Group extending further funds or other significant rearrangements of exposure or collateral, which may change the customer risk profile. As a result, the real estate collateral values used for CRR1-7 might date back to the last point at which such considerations applied. For CRR 8 and 9-10 almost all collateral would have been revalued within the last three years.
In Hong Kong, market practice is typically for lending to major property companies to be either secured by guarantees or unsecured. In Europe, facilities of a working capital nature are generally not secured by a first fixed charge and are therefore disclosed as not collateralised.
HSBC HOLDINGS PLC
138 |
Table of Contents
Commercial real estate loans and advances including loan commitments by level of collateral
(Audited)
| Europe | Asia | MENA | North America | Latin America | Total | |||||||||||||||||||||||||||||||
| $m | $m | $m | $m | $m | $m | |||||||||||||||||||||||||||||||
Rated CRR/EL 1 to 7 | ||||||||||||||||||||||||||||||||||||
Not collateralised | 4,498 | 12,329 | 499 | 8 | 500 | 17,834 | ||||||||||||||||||||||||||||||
Fully collateralised | 25,773 | 26,270 | 36 | 9,997 | 542 | 62,618 | ||||||||||||||||||||||||||||||
Partially collateralised (A) | 3,025 | 1,924 | – | 1,264 | 52 | 6,265 | ||||||||||||||||||||||||||||||
– collateral value on A | 2,106 | 1,175 | – | 981 | 8 | 4,270 | ||||||||||||||||||||||||||||||
| 33,296 | 40,523 | 535 | 11,269 | 1,094 | 86,717 | |||||||||||||||||||||||||||||||
Rated CRR/EL 8 | ||||||||||||||||||||||||||||||||||||
Not collateralised | 28 | – | – | – | – | 28 | ||||||||||||||||||||||||||||||
Fully collateralised | 668 | 4 | – | 9 | 1 | 682 | ||||||||||||||||||||||||||||||
LTV ratio: | ||||||||||||||||||||||||||||||||||||
– less than 50% | 86 | – | – | 5 | 1 | 92 | ||||||||||||||||||||||||||||||
– 51% to 75% | 377 | 4 | – | 4 | – | 385 | ||||||||||||||||||||||||||||||
– 76% to 90% | 174 | – | – | – | – | 174 | ||||||||||||||||||||||||||||||
– 91% to 100% | 31 | – | – | – | – | 31 | ||||||||||||||||||||||||||||||
Partially collateralised (B) | 120 | 1 | – | 1 | – | 122 | ||||||||||||||||||||||||||||||
– collateral value on B | 87 | – | – | – | – | 87 | ||||||||||||||||||||||||||||||
| 816 | 5 | – | 10 | 1 | 832 | |||||||||||||||||||||||||||||||
Rated CRR/EL 9 to 10 | ||||||||||||||||||||||||||||||||||||
Not collateralised | 65 | 51 | 5 | 2 | 299 | 422 | ||||||||||||||||||||||||||||||
Fully collateralised | 900 | 18 | 7 | 76 | 123 | 1,124 | ||||||||||||||||||||||||||||||
LTV ratio: | ||||||||||||||||||||||||||||||||||||
– less than 50% | 174 | 10 | 7 | 15 | 15 | 221 | ||||||||||||||||||||||||||||||
– 51% to 75% | 425 | 2 | – | 27 | 59 | 513 | ||||||||||||||||||||||||||||||
– 76% to 90% | 140 | 2 | – | 10 | 4 | 156 | ||||||||||||||||||||||||||||||
– 91% to 100% | 161 | 4 | – | 24 | 45 | 234 | ||||||||||||||||||||||||||||||
Partially collateralised (C) | 716 | 5 | 181 | 66 | 64 | 1,032 | ||||||||||||||||||||||||||||||
– collateral value on C | 397 | 3 | 89 | 35 | �� | 31 | 555 | |||||||||||||||||||||||||||||
| 1,681 | 74 | 193 | 144 | 486 | 2,578 | |||||||||||||||||||||||||||||||
At 31 December 2015 | 35,793 | 40,602 | 728 | 11,423 | 1,581 | 90,127 | ||||||||||||||||||||||||||||||
Rated CRR/EL 1 to 7 | ||||||||||||||||||||||||||||||||||||
Not collateralised | 5,351 | 16,132 | 361 | 87 | 1,719 | 23,650 | ||||||||||||||||||||||||||||||
Fully collateralised | 25,873 | 26,323 | 23 | 9,093 | 556 | 61,868 | ||||||||||||||||||||||||||||||
Partially collateralised (D) | 1,384 | 1,599 | – | 1,819 | 152 | 4,954 | ||||||||||||||||||||||||||||||
– collateral value on D | 1,032 | 901 | – | 1,199 | 47 | 3,179 | ||||||||||||||||||||||||||||||
| 32,608 | 44,054 | 384 | 10,999 | 2,427 | 90,472 | |||||||||||||||||||||||||||||||
Rated CRR/EL 8 | ||||||||||||||||||||||||||||||||||||
Not collateralised | 34 | 7 | – | 9 | 2 | 52 | ||||||||||||||||||||||||||||||
Fully collateralised | 568 | 23 | – | 30 | 1 | 622 | ||||||||||||||||||||||||||||||
LTV ratio: | ||||||||||||||||||||||||||||||||||||
– less than 50% | 64 | – | – | 16 | 1 | 81 | ||||||||||||||||||||||||||||||
– 51% to 75% | 222 | 11 | – | 10 | – | 243 | ||||||||||||||||||||||||||||||
– 76% to 90% | 132 | 9 | – | 4 | – | 145 | ||||||||||||||||||||||||||||||
– 91% to 100% | 150 | 3 | – | – | – | 153 | ||||||||||||||||||||||||||||||
Partially collateralised (E) | 365 | – | – | 7 | – | 372 | ||||||||||||||||||||||||||||||
– collateral value on E | 296 | – | – | 2 | – | 298 | ||||||||||||||||||||||||||||||
| 967 | 30 | – | 46 | 3 | 1,046 | |||||||||||||||||||||||||||||||
Rated CRR/EL 9 to 10 | ||||||||||||||||||||||||||||||||||||
Not collateralised | 369 | 48 | 6 | 1 | 499 | 923 | ||||||||||||||||||||||||||||||
Fully collateralised | 992 | 15 | 7 | 166 | 178 | 1,358 | ||||||||||||||||||||||||||||||
LTV ratio: | ||||||||||||||||||||||||||||||||||||
– less than 50% | 78 | 6 | 7 | 28 | 10 | 129 | ||||||||||||||||||||||||||||||
– 51% to 75% | 593 | 2 | – | 91 | 43 | 729 | ||||||||||||||||||||||||||||||
– 76% to 90% | 167 | 2 | – | 17 | 53 | 239 | ||||||||||||||||||||||||||||||
– 91% to 100% | 154 | 5 | – | 30 | 72 | 261 | ||||||||||||||||||||||||||||||
Partially collateralised (F) | 1,085 | 15 | 181 | 37 | 50 | 1,368 | ||||||||||||||||||||||||||||||
– collateral value on F | 664 | 5 | 89 | 30 | 13 | 801 | ||||||||||||||||||||||||||||||
| 2,446 | 78 | 194 | 204 | 727 | 3,649 | |||||||||||||||||||||||||||||||
At 31 December 2014 | 36,021 | 44,162 | 578 | 11,249 | 3,157 | 95,167 | ||||||||||||||||||||||||||||||
HSBC HOLDINGS PLC
139 |
Table of Contents
Report of the Directors: Risk(continued)
Credit risk
Other corporate, commercial and financial (non-bank) loans are analysed separately below. For financing activities in other corporate and commercial lending, collateral value is not strongly correlated to principal repayment performance. Collateral values are generally refreshed when an obligor’s general credit performance deteriorates and we have to
assess the likely performance of secondary sources of repayment should it prove necessary to rely on them.
Accordingly, the table below reports values only for customers with CRR 8 to 10, recognising that these loans and advances generally have valuations which are comparatively recent.
Other corporate, commercial and non-bank financial institutions loans and advances including loan commitments by level of collateral rated CRR/EL 8 to 10 only
(Audited)
| Europe | Asia | MENA | North America | Latin America | Total | |||||||||||||||||||||||||||||||
| $m | $m | $m | $m | $m | $m | |||||||||||||||||||||||||||||||
Rated CRR/EL 8 | ||||||||||||||||||||||||||||||||||||
Not collateralised | 1,618 | 164 | 36 | 609 | 102 | 2,529 | ||||||||||||||||||||||||||||||
Fully collateralised | 434 | 41 | – | 454 | 1 | 930 | ||||||||||||||||||||||||||||||
LTV ratio: | ||||||||||||||||||||||||||||||||||||
– less than 50% | 65 | 13 | – | 95 | 1 | 174 | ||||||||||||||||||||||||||||||
– 51% to 75% | 337 | 8 | – | 85 | – | 430 | ||||||||||||||||||||||||||||||
– 76% to 90% | 28 | 18 | – | 168 | – | 214 | ||||||||||||||||||||||||||||||
– 91% to 100% | 4 | 2 | – | 106 | – | 112 | ||||||||||||||||||||||||||||||
Partially collateralised (A) | 109 | 47 | 1 | 179 | – | 336 | ||||||||||||||||||||||||||||||
– collateral value on A | 73 | 17 | – | 58 | – | 148 | ||||||||||||||||||||||||||||||
| 2,161 | 252 | 37 | 1,242 | 103 | 3,795 | |||||||||||||||||||||||||||||||
Rated CRR/EL 9 to 10 | ||||||||||||||||||||||||||||||||||||
Not collateralised | 2,850 | 889 | 814 | 80 | 244 | 4,877 | ||||||||||||||||||||||||||||||
Fully collateralised | 824 | 440 | 188 | 323 | 78 | 1,853 | ||||||||||||||||||||||||||||||
LTV ratio: | ||||||||||||||||||||||||||||||||||||
– less than 50% | 283 | 94 | 46 | 47 | 44 | 514 | ||||||||||||||||||||||||||||||
– 51% to 75% | 346 | 149 | 3 | 47 | 8 | 553 | ||||||||||||||||||||||||||||||
– 76% to 90% | 96 | 74 | 25 | 27 | 9 | 231 | ||||||||||||||||||||||||||||||
– 91% to 100% | 99 | 123 | 114 | 202 | 17 | 555 | ||||||||||||||||||||||||||||||
Partially collateralised (B) | 1,702 | 506 | 441 | 423 | 7 | 3,079 | ||||||||||||||||||||||||||||||
– collateral value on B | 795 | 236 | 55 | 283 | 5 | 1,374 | ||||||||||||||||||||||||||||||
| 5,376 | 1,835 | 1,443 | 826 | 329 | 9,809 | |||||||||||||||||||||||||||||||
At 31 December 2015 | 7,537 | 2,087 | 1,480 | 2,068 | 432 | 13,604 | ||||||||||||||||||||||||||||||
Rated CRR/EL 8 | ||||||||||||||||||||||||||||||||||||
Not collateralised | 2,051 | 237 | 15 | 320 | 227 | 2,850 | ||||||||||||||||||||||||||||||
Fully collateralised | 629 | 56 | 72 | 331 | 11 | 1,099 | ||||||||||||||||||||||||||||||
LTV ratio: | ||||||||||||||||||||||||||||||||||||
– less than 50% | 120 | 13 | – | 186 | 5 | 324 | ||||||||||||||||||||||||||||||
– 51% to 75% | 293 | – | – | 72 | 6 | 371 | ||||||||||||||||||||||||||||||
– 76% to 90% | 51 | 9 | 69 | 46 | – | 175 | ||||||||||||||||||||||||||||||
– 91% to 100% | 165 | 34 | 3 | 27 | – | 229 | ||||||||||||||||||||||||||||||
Partially collateralised (C) | 105 | 44 | 1 | 148 | 6 | 304 | ||||||||||||||||||||||||||||||
– collateral value on C | 46 | 17 | 1 | 68 | 4 | 136 | ||||||||||||||||||||||||||||||
| 2,785 | 337 | 88 | 799 | 244 | 4,253 | |||||||||||||||||||||||||||||||
Rated CRR/EL 9 to 10 | ||||||||||||||||||||||||||||||||||||
Not collateralised | 4,185 | 939 | 813 | 62 | 1,420 | 7,419 | ||||||||||||||||||||||||||||||
Fully collateralised | 615 | 143 | 147 | 231 | 124 | 1,260 | ||||||||||||||||||||||||||||||
LTV ratio: | ||||||||||||||||||||||||||||||||||||
– less than 50% | 169 | 68 | 25 | 48 | 48 | 358 | ||||||||||||||||||||||||||||||
– 51% to 75% | 136 | 27 | 19 | 39 | 35 | 256 | ||||||||||||||||||||||||||||||
– 76% to 90% | 168 | 16 | 6 | 35 | 26 | 251 | ||||||||||||||||||||||||||||||
– 91% to 100% | 142 | 32 | 97 | 109 | 15 | 395 | ||||||||||||||||||||||||||||||
Partially collateralised (D) | 624 | 364 | 547 | 251 | 140 | 1,926 | ||||||||||||||||||||||||||||||
– collateral value on D | 341 | 169 | 92 | 141 | 46 | 789 | ||||||||||||||||||||||||||||||
| 5,424 | 1,446 | 1,507 | 544 | 1,684 | 10,605 | |||||||||||||||||||||||||||||||
At 31 December 2014 | 8,209 | 1,783 | 1,595 | 1,343 | 1,928 | 14,858 | ||||||||||||||||||||||||||||||
HSBC HOLDINGS PLC
140 |
Table of Contents
In addition to collateralised lending, other credit enhancements are employed and methods used to mitigate credit risk arising from financial assets. These are described in more detail below:
| • | some securities issued by governments, banks and other financial institutions benefit from additional credit enhancement provided by government guarantees that cover the assets. |
| • | debt securities issued by banks and financial institutions include ABSs and similar instruments which are supported by underlying pools of financial assets. Credit risk associated with ABSs is reduced through the purchase of credit default swap (‘CDS’) protection. |
Disclosure of the Group’s holdings of ABSs and associated CDS protection is provided on page 153.
| • | trading assets include loans and advances held with trading intent. These mainly consist of cash collateral posted to satisfy margin requirements on derivatives, settlement accounts, reverse repos and stock borrowing. There is limited credit risk on cash collateral posted since in the event of default of the counterparty these would be set-off against the related liability. Reverse repos and stock borrowing are by their nature collateralised. |
Collateral accepted as security that the Group is permitted to sell or repledge under these arrangements is described on page 162 on the Financial Statements.
| • | the Group’s maximum exposure to credit risk includes financial guarantees and similar contracts granted, as well as loan and other credit-related commitments. Depending on the terms of the arrangement, we may have recourse to additional credit mitigation in the event that a guarantee is called upon or a loan commitment is drawn and subsequently defaults. |
For further information on these arrangements, see Note 37 on the Financial Statements.
HSBC participates in transactions exposing us to counterparty credit risk. Counterparty credit risk is the risk of financial loss if the counterparty to a transaction defaults before satisfactorily settling it. It arises principally from OTC derivatives and securities financing transactions and is calculated in both the trading and non-trading books. Transactions vary in value by reference to a market factor such as interest rate, exchange rate or asset price.
The counterparty risk from derivative transactions is taken into account when reporting the fair value of derivative positions. The adjustment to the fair value is known as the credit value adjustment (‘CVA’).
For an analysis of CVA, see Note 13 on the Financial Statements.
The table below reflects by risk type the fair values and gross notional contract amounts of derivatives cleared through an exchange, central counterparty and non-central counterparty.
HSBC HOLDINGS PLC
141 |
Table of Contents
Report of the Directors: Risk(continued)
Credit risk
Notional contract amounts and fair values of derivatives by product type
| 2015 | 2014 | |||||||||||||||||||||||||||||||||||
| Notional | Fair value | Notional | Fair value | |||||||||||||||||||||||||||||||||
| amount | Assets | Liabilities | amount | Assets | Liabilities | |||||||||||||||||||||||||||||||
| $m | $m | $m | $m | $m | $m | |||||||||||||||||||||||||||||||
Foreign exchange | 5,690,354 | 96,341 | 95,598 | 5,573,415 | 97,312 | 95,759 | ||||||||||||||||||||||||||||||
– exchange traded | 195,612 | 167 | 76 | 81,785 | 229 | 369 | ||||||||||||||||||||||||||||||
– central counterparty cleared OTC | 29,263 | 406 | 443 | 18,567 | 321 | 349 | ||||||||||||||||||||||||||||||
– non-central counterparty cleared OTC | 5,465,479 | 95,768 | 95,079 | 5,473,063 | 96,762 | 95,041 | ||||||||||||||||||||||||||||||
Interest rate | 14,675,036 | 279,154 | 271,367 | 22,328,518 | 473,243 | 468,152 | ||||||||||||||||||||||||||||||
– exchange traded | 1,259,888 | 49 | 8 | 1,432,333 | 112 | 161 | ||||||||||||||||||||||||||||||
– central counterparty cleared OTC | 8,774,674 | 117,877 | 117,695 | 15,039,001 | 261,880 | 264,509 | ||||||||||||||||||||||||||||||
– non-central counterparty cleared OTC | 4,640,474 | 161,228 | 153,664 | 5,857,184 | 211,251 | 203,482 | ||||||||||||||||||||||||||||||
Equity | 501,834 | 8,732 | 10,383 | 568,932 | 11,694 | 13,654 | ||||||||||||||||||||||||||||||
– exchange traded | 265,129 | 1,888 | 2,601 | 289,140 | 2,318 | 3,201 | ||||||||||||||||||||||||||||||
– non-central counterparty cleared OTC | 236,705 | 6,844 | 7,782 | 279,792 | 9,376 | 10,453 | ||||||||||||||||||||||||||||||
Credit | 463,344 | 6,961 | 6,884 | 550,197 | 9,340 | 10,061 | ||||||||||||||||||||||||||||||
– central counterparty cleared OTC | 90,863 | 1,779 | 2,069 | 126,115 | 1,999 | 2,111 | ||||||||||||||||||||||||||||||
– non-central counterparty cleared OTC | 372,481 | 5,182 | 4,815 | 424,082 | 7,341 | 7,950 | ||||||||||||||||||||||||||||||
Commodity and other | 51,683 | 3,148 | 2,699 | 77,565 | 3,884 | 3,508 | ||||||||||||||||||||||||||||||
– exchange traded | 8,136 | 38 | – | 7,015 | 80 | 23 | ||||||||||||||||||||||||||||||
– non-central counterparty cleared OTC | 43,547 | 3,110 | 2,699 | 70,550 | 3,804 | 3,485 | ||||||||||||||||||||||||||||||
Total OTC derivatives | 19,653,486 | 392,194 | 384,246 | 27,288,354 | 592,735 | 587,379 | ||||||||||||||||||||||||||||||
– total OTC derivatives cleared by central counterparties | 8,894,800 | 120,062 | 120,207 | 15,183,683 | 264,200 | 266,968 | ||||||||||||||||||||||||||||||
– total OTC derivatives not cleared by central counterparties | 10,758,686 | 272,132 | 264,039 | 12,104,671 | 328,535 | 320,411 | ||||||||||||||||||||||||||||||
Total exchange traded derivatives | 1,728,765 | 2,142 | 2,685 | 1,810,273 | 2,739 | 3,755 | ||||||||||||||||||||||||||||||
Gross | 21,382,251 | 394,336 | 386,931 | 29,098,627 | 595,473 | 591,134 | ||||||||||||||||||||||||||||||
Offset | (105,860 | ) | (105,860 | ) | (250,465 | ) | (250,465 | ) | ||||||||||||||||||||||||||||
Total at 31 December | 288,476 | 281,071 | 345,008 | 340,669 | ||||||||||||||||||||||||||||||||
The purposes for which HSBC uses derivatives are described in Note 16 on the Financial Statements.
The International Swaps and Derivatives Association (‘ISDA’) Master Agreement is our preferred agreement for documenting derivatives activity. It provides the contractual framework within which dealing activity across a full range of OTC products is conducted, and contractually binds both parties to apply close-out netting across all outstanding transactions covered by an agreement if either party defaults or another pre-agreed termination event occurs. It is common, and our preferred practice, for the parties to execute a Credit Support Annex (‘CSA’) in conjunction with the ISDA Master Agreement. Under a CSA, collateral is passed between the parties to mitigate the counterparty risk inherent in outstanding positions.
We manage the counterparty exposure arising from market risk on our OTC derivative contracts by using collateral agreements with counterparties and netting agreements. Currently, we do not actively manage our general OTC derivative counterparty exposure in the credit markets, although we may manage individual exposures in certain circumstances.
We place strict policy restrictions on collateral types and as a consequence the types of collateral received and pledged are, by value, highly liquid and of a strong quality, being predominantly cash.
Where a collateral type is required to be approved outside the collateral policy (which includes collateral that includes
wrong way risks), a submission to one of three regional Documentation Approval Committees (‘DAC’s) for approval is required. These DACs require the participation and sign-off of senior representatives from regional Markets Chief Operating Officers, Legal and Risk.
The majority of our CSAs are with financial institutional clients.
As a consequence of our policy, the type of agreement we enter into is predominately ISDA CSAs, the majority of which are written under English law. The table below provides a breakdown of OTC collateral agreements by agreement type:
OTC collateral agreements by type
| Number of agreements | ||||||
ISDA CSA (English law) | 2,670 | |||||
ISDA CSA (New York law) | 1,702 | |||||
ISDA CSA (Japanese law) | 17 | |||||
French Master Agreement and CSA equivalent14 | 223 | |||||
German Master Agreement and CSA equivalent15 | 93 | |||||
Others | 395 | |||||
At 31 December 2015 | 5,100 | |||||
For footnotes, see page 191.
HSBC HOLDINGS PLC
142 |
Table of Contents
See page 122 and Note 32 on the Financial Statements for details regarding legally enforceable right of offset in the event of counterparty default and collateral received in respect of derivatives.
Reverse repos – non-trading by geographical region
The amount of non-trading reverse repos include transactions with customers and banks and is set out below.
Reverse repos – non-trading by geographical region
(Audited)
| Europe | Asia | MENA | North America | Latin America | Total | |||||||||||||||||||||||||||||||
| $m | $m | $m | $m | $m | $m | |||||||||||||||||||||||||||||||
With customers | 28,366 | 5,650 | – | 40,316 | – | 74,332 | ||||||||||||||||||||||||||||||
With banks | 15,824 | 21,804 | 779 | 32,034 | 1,482 | 71,923 | ||||||||||||||||||||||||||||||
At 31 December 2015 | 44,190 | 27,454 | 779 | 72,350 | 1,482 | 146,255 | ||||||||||||||||||||||||||||||
With customers | 25,841 | 5,409 | – | 35,060 | – | 66,310 | ||||||||||||||||||||||||||||||
With banks | 34,748 | 22,813 | 19 | 29,008 | 8,815 | 95,403 | ||||||||||||||||||||||||||||||
At 31 December 2014 | 60,589 | 28,222 | 19 | 64,068 | 8,815 | 161,713 | ||||||||||||||||||||||||||||||
We provide a broad range of secured and unsecured personal lending products to meet customer needs. Personal lending includes advances to customers for asset purchases such as residential property where the
loans are secured by the assets being acquired. We also offer loans secured on existing assets, such as first liens on residential property, and unsecured lending products such as overdrafts, credit cards and payroll loans.
| Europe | Asia | MENA | North America | Latin America | Total | |||||||||||||||||||||||||||||||
| $m | $m | $m | $m | $m | $m | |||||||||||||||||||||||||||||||
First lien residential mortgages (A) | 125,544 | 94,606 | 2,258 | 50,117 | 1,986 | 274,511 | ||||||||||||||||||||||||||||||
Of which: | ||||||||||||||||||||||||||||||||||||
– interest only (including offset) | 40,906 | 936 | – | 180 | – | 42,022 | ||||||||||||||||||||||||||||||
– affordability including ARMs | 356 | 3,966 | – | 17,041 | – | 21,363 | ||||||||||||||||||||||||||||||
Other personal lending (B) | 44,982 | 38,101 | 4,447 | 8,069 | 3,972 | 99,571 | ||||||||||||||||||||||||||||||
– other | 32,862 | 27,682 | 3,147 | 3,284 | 1,816 | 68,791 | ||||||||||||||||||||||||||||||
– credit cards | 12,115 | 10,189 | 929 | 996 | 1,780 | 26,009 | ||||||||||||||||||||||||||||||
– second lien residential mortgages | – | 33 | 2 | 3,762 | – | 3,797 | ||||||||||||||||||||||||||||||
– motor vehicle finance | 5 | 197 | 369 | 27 | 376 | 974 | ||||||||||||||||||||||||||||||
Total gross loans at 31 December 2015 (C) | 170,526 | 132,707 | 6,705 | 58,186 | 5,958 | 374,082 | ||||||||||||||||||||||||||||||
Impairment allowances on personal lending | ||||||||||||||||||||||||||||||||||||
First lien residential mortgages (a) | 278 | 29 | 24 | 991 | 22 | 1,344 | ||||||||||||||||||||||||||||||
Other personal lending (b) | 667 | 227 | 214 | 241 | 186 | 1,535 | ||||||||||||||||||||||||||||||
– other | 401 | 104 | 180 | 31 | 80 | 796 | ||||||||||||||||||||||||||||||
– credit cards | 265 | 122 | 29 | 30 | 102 | 548 | ||||||||||||||||||||||||||||||
– second lien residential mortgages | – | – | – | 180 | – | 180 | ||||||||||||||||||||||||||||||
– motor vehicle finance | 1 | 1 | 5 | – | 4 | 11 | ||||||||||||||||||||||||||||||
Total impairment allowances at 31 December 2015 (c) | 945 | 256 | 238 | 1,232 | 208 | 2,879 | ||||||||||||||||||||||||||||||
| % | % | % | % | % | % | |||||||||||||||||||||||||||||||
(a) as a percentage of A | 0.2 | 0.0 | 1.1 | 2.0 | 1.1 | 0.5 | ||||||||||||||||||||||||||||||
(b) as a percentage of B | 1.5 | 0.6 | 4.8 | 3.0 | 4.7 | 1.5 | ||||||||||||||||||||||||||||||
(c) as a percentage of C | 0.6 | 0.2 | 3.5 | 2.1 | 3.5 | 0.8 | ||||||||||||||||||||||||||||||
HSBC HOLDINGS PLC
143 |
Table of Contents
Report of the Directors: Risk(continued)
Credit risk
Total personal lending (continued)
| Europe | Asia | MENA | North America | Latin America | Total | |||||||||||||||||||||||||||||||
| $m | $m | $m | $m | $m | $m | |||||||||||||||||||||||||||||||
First lien residential mortgages (D) | 131,000 | 93,147 | 2,647 | 55,577 | 4,153 | 286,524 | ||||||||||||||||||||||||||||||
Of which: | ||||||||||||||||||||||||||||||||||||
– interest only (including offset) | 44,163 | 956 | – | 276 | – | 45,395 | ||||||||||||||||||||||||||||||
– affordability including ARMs | 337 | 5,248 | – | 16,452 | – | 22,037 | ||||||||||||||||||||||||||||||
Other personal lending (E) | 47,531 | 36,368 | 3,924 | 9,823 | 9,384 | 107,030 | ||||||||||||||||||||||||||||||
– other | 34,567 | 25,695 | 2,633 | 4,328 | 4,846 | 72,069 | ||||||||||||||||||||||||||||||
– credit cards | 12,959 | 10,289 | 897 | 1,050 | 3,322 | 28,517 | ||||||||||||||||||||||||||||||
– second lien residential mortgages | – | 56 | 2 | 4,433 | – | 4,491 | ||||||||||||||||||||||||||||||
– motor vehicle finance | 5 | 328 | 392 | 12 | 1,216 | 1,953 | ||||||||||||||||||||||||||||||
Total gross loans at 31 December 2014 (F) | 178,531 | 129,515 | 6,571 | 65,400 | 13,537 | 393,554 | ||||||||||||||||||||||||||||||
Impairment allowances on personal lending | ||||||||||||||||||||||||||||||||||||
First lien residential mortgages (d) | 306 | 46 | 97 | 1,644 | 36 | 2,129 | ||||||||||||||||||||||||||||||
Other personal lending (e) | 786 | 208 | 97 | 350 | 1,030 | 2,471 | ||||||||||||||||||||||||||||||
– other | 438 | 87 | 59 | 43 | 672 | 1,299 | ||||||||||||||||||||||||||||||
– credit cards | 347 | 119 | 33 | 36 | 298 | 833 | ||||||||||||||||||||||||||||||
– second lien residential mortgages | – | – | – | 271 | – | 271 | ||||||||||||||||||||||||||||||
– motor vehicle finance | 1 | 2 | 5 | – | 60 | 68 | ||||||||||||||||||||||||||||||
Total impairment allowances at 31 December 2014 (f) | 1,092 | 254 | 194 | 1,994 | 1,066 | 4,600 | ||||||||||||||||||||||||||||||
| % | % | % | % | % | % | |||||||||||||||||||||||||||||||
(d) as a percentage of D | 0.2 | – | 3.7 | 3.0 | 0.9 | 0.7 | ||||||||||||||||||||||||||||||
(e) as a percentage of E | 1.7 | 0.6 | 2.5 | 3.6 | 11.0 | 2.3 | ||||||||||||||||||||||||||||||
(f) as a percentage of F | 0.6 | 0.2 | 3.0 | 3.0 | 7.9 | 1.2 | ||||||||||||||||||||||||||||||
On a reported basis, total personal lending was $374bn at 31 December 2015, down from $394bn at the end of 2014. The reduction of $20bn was mainly due to adverse foreign exchange movements of $19bn, the reclassification of $7.6bn of assets of our Brazilian operations as ‘Assets held for sale’ and the run-off of our CML portfolio in North America of $5bn during the year. Excluding these factors, personal lending balances grew by $12bn in 2015. This was primarily driven by increased mortgage and other lending in Asia.
Loan impairment allowances reduced by $1.7bn on a reported basis, mainly due to the Brazilian reclassification ($0.8bn) and the run-off of the US CML portfolio ($0.7bn).
Personal lending loan impairment charges were largely unchanged at $1.8bn on a reported basis. On a constant currency basis, they were $0.3bn higher than in 2014, reflecting increased write-offs in the UAE following a review of the quality and value of residential mortgage collateral and the effects of adverse macroeconomic conditions in Brazil.
We offer a wide range of mortgage products designed to meet customer needs, including capital repayment, interest-only, affordability and offset mortgages.
Group credit policy prescribes the range of acceptable residential property LTV thresholds with the maximum upper limit for new loans set at between 75% and 95%.
Specific LTV thresholds and debt-to-income ratios are managed at regional and country levels and, although the parameters must comply with Group policy, strategy and risk appetite, they differ in the various locations in which we operate to reflect the local economic and housing market conditions, regulations, portfolio performance, pricing and other product features.
Reported gross mortgage lending balances declined by $12bn. Adverse foreign exchange differences and the Brazilian reclassification reduced the gross mortgage lending balances by further $13bn and $2.1bn respectively.
The commentary that follows is on a constant currency basis, while tables are presented on a reported basis.
Excluding the effect of the Brazilian reclassification and the US CML run-off portfolio, mortgage lending balances increased by $7.7bn during the year.
Mortgage lending in Asia, excluding the reclassification to other personal lending discussed on page 145, grew by $6.4bn. The increases were primarily attributable to continued growth in Hong Kong ($4.2bn), mainland China ($1.7bn) and Australia ($1.1bn) as a result of strong demand and our competitive customer offerings. During the year, mortgage lending in Singapore fell by $1.1bn due to a business decision to constrain the level of our mortgage portfolio, coupled with the effect of a range of personal lending regulations. The quality of our Asian mortgage book remained high with negligible defaults and impairment allowances. The average LTV ratio on new mortgage lending in Hong Kong was 43% compared with an estimated 29% for the overall portfolio.
In North America, the US CML portfolio, including second lien mortgages, declined by $5.2bn in 2015 as we continued to run it off. The US Premier mortgage portfolio increased by $1.1bn during 2015 as we focused on growth in our core portfolios of higher quality mortgages. Our Canadian mortgage lending balances also grew by $0.8bn during the year. Collectively assessed impairment allowances reduced during the year due to continued improvements in the credit quality of the mortgage portfolio and continued loan sales.
In Europe, UK mortgage balances were unchanged and our products remained competitive in the prolonged low interest rate market environment. In the UK, the credit
HSBC HOLDINGS PLC
144 |
Table of Contents
quality of our mortgage portfolio remained high, the LTV ratio on new lending was 57.8% compared with an average of 42.6% for the overall portfolio.
Exposure to UK interest-only mortgage loans
Interest-only mortgage products made up $40bn of total UK mortgage lending, including $16bn of offset mortgages in First Direct and $1.7bn of endowment mortgages.
The following information is presented for HSBC Bank plc’s UK interest-only mortgage loans with balances of $18bn at the end of 2015. $0.2bn of interest-only mortgages matured during 2015. Of these, 2,636 loans with total balances of $0.1bn were repaid in full, 164 loans with balances of $0.03bn have agreed future repayment plans and 550 loans with balances of $0.1bn are subject to ongoing individual assessments.
The profile of expiring UK interest-only loans was as follows:
UK interest-only mortgage loans
| $m | ||||||
2015 expired interest-only mortgage loans | 266 | |||||
Interest-only mortgage loans by maturity | ||||||
–2016 | 314 | |||||
–2017 | 384 | |||||
–2018 | 723 | |||||
–2019 | 801 | |||||
–2020 | 805 | |||||
–2021-2025 | 3,997 | |||||
– Post 2025 | 10,390 | |||||
Total at 31 December 2015 | 17,680 | |||||
Reported other personal lending balances declined by $7.5bn during the year, mainly due to adverse foreign exchange movements of $5.8bn and the Brazilian reclassification of $5.5bn. The reduction was offset by the growth in other personal lending in Hong Kong.
The commentary that follows is on a constant currency basis, while tables are presented on a reported basis.
Excluding the Brazilian reclassification, other personal lending increased by $4bn in 2015. This was driven by strong growth in personal loans and overdrafts in Hong Kong ($1.5bn), other unsecured personal lending portfolio in UK ($0.7bn) and other personal lending in France
($0.6bn). In Mexico, other unsecured personal lending grew by $0.6bn mainly in payroll and personal loans as a result of various sales and credit initiatives. In addition, we reclassified a total of $1.8bn of loans in Malaysia and India, and $0.4bn in the UAE, from residential mortgages to other personal lending following a review of the supporting collateral.
HSBC Finance
HSBC Finance US Consumer and Mortgage Lending – residential mortgages16
| 2015 | 2014 | |||||||||||
| $m | $m | |||||||||||
Residential mortgages: | ||||||||||||
– first lien | 17,157 | 21,915 | ||||||||||
Other personal lending: | ||||||||||||
– second lien | 2,089 | 2,509 | ||||||||||
Total (A) at 31 December | 19,246 | 24,424 | ||||||||||
Impairment allowances | 986 | 1,679 | ||||||||||
– as a percentage of A | 5.1% | 6.9% | ||||||||||
For footnote, see page 191.
Mortgage lending balances in HSBC Finance declined by $5.2bn or 21% during 2015. In addition to the continued loan sales in the CML portfolio, we transferred a further $2.4bn to ‘Assets held for sale’ during the year, and these loans were sold in May, August and November 2015.
There was a decrease in impairment allowances reflecting reduced levels of delinquency, and lower levels of both new impaired loans and loan balances outstanding as a result of continued liquidation of the portfolio.
Among the first and second lien residential mortgages in our CML portfolio, two months and over delinquent balances halved to $1.2bn during 2015.
At 31 December 2015, renegotiated real estate secured accounts in HSBC Finance represented 91% (2014: 93%) of North America’s total renegotiated loans. $5.1bn of renegotiated real estate secured loans was classified as impaired (2014: $7.6bn).
HSBC Bank USA
In HSBC Bank USA, mortgage balances grew by $1.1bn to $18bn at 31 December 2015 as we continued to implement our strategy to grow the HSBC Premier and Advance customer base. We continued to sell all agency-eligible new originations in the secondary market.
HSBC HOLDINGS PLC
145 |
Table of Contents
Report of the Directors: Risk(continued)
Credit risk
Trends in two months and over contractual delinquency in the US
| 2015 | 2014 | |||||||||||
| $m | $m | |||||||||||
In personal lending in the US | ||||||||||||
First lien residential mortgages | 1,954 | 3,271 | ||||||||||
– Consumer and Mortgage Lending | 1,049 | 2,210 | ||||||||||
– other mortgage lending | 905 | 1,061 | ||||||||||
Second lien residential mortgages | 161 | 216 | ||||||||||
– Consumer and Mortgage Lending | 106 | 154 | ||||||||||
– other mortgage lending | 55 | 62 | ||||||||||
Credit card | 16 | 17 | ||||||||||
Personal non-credit card | 3 | 7 | ||||||||||
Total at 31 December | 2,134 | 3,511 | ||||||||||
| % | % | |||||||||||
As a percentage of the equivalent loans and receivables balances | ||||||||||||
First lien residential mortgages | 5.7 | 8.6 | ||||||||||
Second lien residential mortgages | 4.4 | 5.0 | ||||||||||
Credit card | 2.3 | 2.4 | ||||||||||
Personal non-credit card | 0.7 | 1.4 | ||||||||||
Total at 31 December | 5.4 | 8.1 | ||||||||||
Gross loan portfolio of HSBC Finance real estate secured balances
| Re-aged | 17 |
| Modified and re-aged |
| Modified |
| Total renegotiated loans |
|
| Total non- renegotiated loans |
|
| Total gross loans |
|
| Total impairment allowances |
|
| Impairment allowances/ gross loans |
| ||||||||||||||
| $m | $m | $m | $m | $m | $m | $m | % | |||||||||||||||||||||||||||
At 31 December 2015 | 4,858 | 5,257 | 519 | 10,634 | 8,612 | 19,246 | 986 | 5.1 | ||||||||||||||||||||||||||
At 31 December 2014 | 6,637 | 6,581 | 587 | 13,805 | 10,619 | 24,424 | 1,679 | 6.9 | ||||||||||||||||||||||||||
For footnote, see page 191.
Number of renegotiated real estate secured accounts remaining in HSBC Finance’s portfolio
| Number of renegotiated loans (000s) | Total number | |||||||||||||||||||||||
| Re-aged | Modified and re-aged | Modified | Total | of loans (000s) | ||||||||||||||||||||
At 31 December 2015 | 66 | 54 | 6 | 126 | 240 | |||||||||||||||||||
At 31 December 2014 | 85 | 64 | 6 | 155 | 297 | |||||||||||||||||||
HSBC Finance loan modifications and re-age programmes
HSBC Finance maintains loan modification andre-age (‘loan renegotiation’) programmes in order to manage customer relationships, improve collection opportunities and, if possible, avoid foreclosure.
Qualifying criteria
For an account to qualify for renegotiation it must meet certain criteria, and HSBC Finance retains the right to decline a renegotiation.
Renegotiated real estate secured loans are not eligible for a subsequent renegotiation for six or 12 months depending upon the action, with a maximum of five renegotiations permitted within a five-year period. Borrowers must be approved for a modification and, to activate it, must generally make two minimum qualifying monthly payments within 60 days. In certain circumstances where the debt has been restructured in bankruptcy proceedings, fewer or no payments may be required. Real estate secured loans
involving a bankruptcy and accounts whose borrowers are subject to a Chapter 13 plan filed with a bankruptcy court generally may be considered current upon receipt of one qualifying payment, while accounts whose borrowers have filed for Chapter 7 bankruptcy protection may be re-aged upon receipt of a signed reaffirmation agreement. In addition, any account may be re-aged without receipt of a payment in certain special circumstances (for example, in the event of a natural disaster or a hardship programme).
Within the constraints of our Group credit policy, we allow for multiple renegotiations under certain circumstances. Consequently, a significant proportion of loans included in the table above have undergone multiple re-ages or modifications. In this regard, multiple modifications have remained consistent at 70% to 75% of total modifications.
The accounts that received second or subsequent renegotiations during the year do not appear in the statistics presented. These statistics treat a loan as an addition to the volume of renegotiated loans on its first renegotiation only.
HSBC HOLDINGS PLC
146 |
Table of Contents
Types of loan renegotiation programmes in HSBC Finance
• A temporary modification is a change to the contractual terms of a loan that results in HSBC Finance giving up a right to contractual cash flows over a pre-defined period, typically two years. With a temporary modification the loan is expected to revert back to the original contractual terms, including the interest rate charged, after the modification period. An example is reduced interest payments.
A substantial number of HSBC Finance modifications involve interest rate reductions, which lower the amount of interest income HSBC Finance is contractually entitled to receive in future periods. Historically, modifications were granted for terms as low as six months, although more recent modifications have a minimum term of two years.
• A permanent modification is a change to the contractual terms of a loan that results in HSBC Finance giving up a right to contractual cash flows over the life of the loan.
An example is a permanent reduction in the interest rate charged.
| HSBC Finance also offers a ‘re-age’ renegotiation programme, which results in the resetting of an account’s contractual delinquency status to current (non-delinquent) upon fulfilment of certain requirements and without additional concessions. The overdue principal and/or interest is deferred and paid at a later date. Loan re-ageing enables customers who have been unable to make a small number of payments to have their loan delinquency status reset to current so that their credit score is not affected by the overdue balances. Re-aging may be offered to customers either without any modification of original loan terms, or as part of a loan modification transaction.
All renegotiation transactions described above with the exception of first time re-ages on accounts that are less than 60 days past due are classified as impaired. These remain classified as impaired until they have demonstrated a history of payment performance against their original contracted terms for at least 12 months, with the exception of permanent modifications. All modified loans with terms over two years are considered to be permanently impaired. | |
Collateral and other credit enhancements held
(Audited)
The tables below provide a quantification of the value of fixed charges we hold over specific assets where we have a history of enforcing, and are able to enforce, collateral in satisfying a debt in the event of the borrower failing to meet its contractual obligations, and where
the collateral is cash or can be realised by sale in an established market. The collateral valuation excludes any adjustments for obtaining and selling the collateral and, in particular, loans shown as not collateralised or partially collateralised may also benefit from other forms of credit mitigants. UK and Hong Kong are shown, both within regional figures and separately, due to the size of their portfolios.
Residential mortgage loans including loan commitments by level of collateral
(Audited)
| Europe | Asia | MENA | North America | Latin America | Total | UK | Hong Kong | |||||||||||||||||||||||||||||||||||||||||
| $m | $m | $m | $m | $m | $m | $m | $m | |||||||||||||||||||||||||||||||||||||||||
Non-impaired loans and advances | ||||||||||||||||||||||||||||||||||||||||||||||||
Fully collateralised | 128,113 | 100,102 | 2,144 | 41,567 | 1,869 | 273,795 | 122,221 | 61,784 | ||||||||||||||||||||||||||||||||||||||||
LTV ratio: | ||||||||||||||||||||||||||||||||||||||||||||||||
– less than 50% | 70,851 | 59,212 | 595 | 12,369 | 710 | 143,737 | 68,362 | 42,589 | ||||||||||||||||||||||||||||||||||||||||
– 51% to 75% | 47,933 | 33,237 | 985 | 22,071 | 903 | 105,129 | 45,762 | 15,961 | ||||||||||||||||||||||||||||||||||||||||
– 76% to 90% | 8,322 | 6,522 | 535 | 5,502 | 222 | 21,103 | 7,584 | 2,254 | ||||||||||||||||||||||||||||||||||||||||
– 91% to 100% | 1,007 | 1,131 | 29 | 1,625 | 34 | 3,826 | 513 | 980 | ||||||||||||||||||||||||||||||||||||||||
Partially collateralised: | ||||||||||||||||||||||||||||||||||||||||||||||||
– greater than 100% LTV (A) | 540 | 168 | 46 | 1,208 | 13 | 1,975 | 321 | 97 | ||||||||||||||||||||||||||||||||||||||||
– collateral value on A | 434 | 155 | 37 | 1,147 | 11 | 1,784 | 221 | 95 | ||||||||||||||||||||||||||||||||||||||||
| 128,653 | 100,270 | 2,190 | 42,775 | 1,882 | 275,770 | 122,542 | 61,881 | |||||||||||||||||||||||||||||||||||||||||
Impaired loans and advances | ||||||||||||||||||||||||||||||||||||||||||||||||
Fully collateralised | 1,407 | 222 | 44 | 6,713 | 109 | 8,495 | 1,191 | 46 | ||||||||||||||||||||||||||||||||||||||||
LTV ratio: | ||||||||||||||||||||||||||||||||||||||||||||||||
– less than 50% | 518 | 105 | 18 | 1,247 | 90 | 1,978 | 469 | 42 | ||||||||||||||||||||||||||||||||||||||||
– 51% to 75% | 619 | 76 | 13 | 2,819 | 14 | 3,541 | 540 | 3 | ||||||||||||||||||||||||||||||||||||||||
– 76% to 90% | 183 | 34 | 8 | 1,811 | 4 | 2,040 | 133 | 1 | ||||||||||||||||||||||||||||||||||||||||
– 91% to 100% | 87 | 7 | 5 | 836 | 1 | 936 | 49 | – | ||||||||||||||||||||||||||||||||||||||||
Partially collateralised: | ||||||||||||||||||||||||||||||||||||||||||||||||
– greater than 100% LTV (B) | 178 | 8 | 18 | 628 | 1 | 833 | 49 | – | ||||||||||||||||||||||||||||||||||||||||
– collateral value on B | 160 | 6 | 13 | 547 | – | 726 | 36 | – | ||||||||||||||||||||||||||||||||||||||||
| 1,585 | 230 | 62 | 7,341 | 110 | 9,328 | 1,240 | 46 | |||||||||||||||||||||||||||||||||||||||||
At 31 December 2015 | 130,238 | 100,500 | 2,252 | 50,116 | 1,992 | 285,098 | 123,782 | 61,927 | ||||||||||||||||||||||||||||||||||||||||
HSBC HOLDINGS PLC
147 |
Table of Contents
Report of the Directors: Risk(continued)
Credit risk
Residential mortgage loans including loan commitments by level of collateral (continued)
| Europe | Asia | MENA | North America | Latin America | Total | UK | Hong Kong | |||||||||||||||||||||||||||||||||||||||||
| $m | $m | $m | $m | $m | $m | $m | $m | |||||||||||||||||||||||||||||||||||||||||
Non-impaired loans and advances | ||||||||||||||||||||||||||||||||||||||||||||||||
Fully collateralised | 135,875 | 99,257 | 2,431 | 43,317 | 3,759 | 284,639 | 130,333 | 57,703 | ||||||||||||||||||||||||||||||||||||||||
LTV ratio: | ||||||||||||||||||||||||||||||||||||||||||||||||
– less than 50% | 66,075 | 60,315 | 1,324 | 14,003 | 1,454 | 143,171 | 63,533 | 42,894 | ||||||||||||||||||||||||||||||||||||||||
– 51% to 75% | 56,178 | 31,142 | 856 | 20,872 | 1,777 | 110,825 | 54,095 | 12,135 | ||||||||||||||||||||||||||||||||||||||||
– 76% to 90% | 11,856 | 6,906 | 212 | 5,994 | 480 | 25,448 | 11,141 | 2,298 | ||||||||||||||||||||||||||||||||||||||||
– 91% to 100% | 1,766 | 894 | 39 | 2,448 | 48 | 5,195 | 1,564 | 376 | ||||||||||||||||||||||||||||||||||||||||
Partially collateralised: | ||||||||||||||||||||||||||||||||||||||||||||||||
– greater than 100% LTV (C) | 537 | 99 | 60 | 2,209 | 167 | 3,072 | 388 | – | ||||||||||||||||||||||||||||||||||||||||
– collateral value on C | 532 | 81 | 44 | 1,999 | 24 | 2,680 | 415 | – | ||||||||||||||||||||||||||||||||||||||||
| 136,412 | 99,356 | 2,491 | 45,526 | 3,926 | 287,711 | 130,721 | 57,703 | |||||||||||||||||||||||||||||||||||||||||
Impaired loans and advances | ||||||||||||||||||||||||||||||||||||||||||||||||
Fully collateralised | 906 | 256 | 122 | 8,618 | 154 | 10,056 | 781 | 48 | ||||||||||||||||||||||||||||||||||||||||
LTV ratio: | ||||||||||||||||||||||||||||||||||||||||||||||||
– less than 50% | 232 | 130 | 53 | 1,291 | 103 | 1,809 | 197 | 45 | ||||||||||||||||||||||||||||||||||||||||
– 51% to 75% | 417 | 90 | 29 | 3,462 | 35 | 4,033 | 376 | 3 | ||||||||||||||||||||||||||||||||||||||||
– 76% to 90% | 163 | 32 | 19 | 2,471 | 10 | 2,695 | 131 | – | ||||||||||||||||||||||||||||||||||||||||
– 91% to 100% | 94 | 4 | 21 | 1,394 | 6 | 1,519 | 77 | – | ||||||||||||||||||||||||||||||||||||||||
Partially collateralised: | ||||||||||||||||||||||||||||||||||||||||||||||||
– greater than 100% LTV (D) | 55 | 7 | 31 | 1,395 | 2 | 1,490 | 44 | – | ||||||||||||||||||||||||||||||||||||||||
– collateral value on D | 40 | 5 | 23 | 1,181 | 1 | 1,250 | 30 | – | ||||||||||||||||||||||||||||||||||||||||
| 961 | 263 | 153 | 10,013 | 156 | 11,546 | 825 | 48 | |||||||||||||||||||||||||||||||||||||||||
At 31 December 2014 | 137,373 | 99,619 | 2,644 | 55,539 | 4,082 | 299,257 | 131,546 | 57,751 | ||||||||||||||||||||||||||||||||||||||||
Gross loans and advances by industry sector over five years
| 2015 | | Currency translation adjustment | 18 | Movement | 2014 | 2013 | 2012 | 2011 | ||||||||||||||||||||||||||||||||||
| $m | $m | $m | $m | $m | $m | $m | ||||||||||||||||||||||||||||||||||||
Personal | 374,082 | (20,232 | ) | 760 | 393,554 | 410,728 | 415,093 | 393,625 | ||||||||||||||||||||||||||||||||||
– first lien residential mortgages | 274,511 | (13,697 | ) | 1,684 | 286,524 | 299,875 | 301,862 | 278,963 | ||||||||||||||||||||||||||||||||||
– other personal3 | 99,571 | (6,535 | ) | (924 | ) | 107,030 | 110,853 | 113,231 | 114,662 | |||||||||||||||||||||||||||||||||
Corporate and commercial | 499,513 | (30,496 | ) | (12,616 | ) | 542,625 | 545,981 | 517,120 | 478,064 | |||||||||||||||||||||||||||||||||
– manufacturing | 95,858 | (8,043 | ) | (3,085 | ) | 106,986 | 113,850 | 112,149 | 96,054 | |||||||||||||||||||||||||||||||||
– international trade and services | 159,019 | (10,148 | ) | (11,624 | ) | 180,791 | 184,668 | 169,389 | 152,709 | |||||||||||||||||||||||||||||||||
– commercial real estate | 67,926 | (3,483 | ) | (1,884 | ) | 73,293 | 74,846 | 76,760 | 73,941 | |||||||||||||||||||||||||||||||||
– other property-related | 53,464 | (1,256 | ) | 2,333 | 52,387 | 44,832 | 40,532 | 39,539 | ||||||||||||||||||||||||||||||||||
– government | 7,455 | (354 | ) | 1,666 | 6,143 | 7,277 | 10,785 | 11,079 | ||||||||||||||||||||||||||||||||||
– other commercial4 | 115,791 | (7,212 | ) | (22 | ) | 123,025 | 120,508 | 107,505 | 104,742 | |||||||||||||||||||||||||||||||||
Financial | 150,833 | (9,577 | ) | (2,606 | ) | 163,016 | 170,627 | 164,013 | 184,035 | |||||||||||||||||||||||||||||||||
– non-bank financial institutions | 60,414 | (2,210 | ) | 11,806 | 50,818 | 50,523 | 46,871 | 44,832 | ||||||||||||||||||||||||||||||||||
– banks | 90,419 | (7,367 | ) | (14,412 | ) | 112,198 | 120,104 | 117,142 | 139,203 | |||||||||||||||||||||||||||||||||
Total gross loans and advances | 1,024,428 | (60,305 | ) | (14,462 | ) | 1,099,195 | 1,127,336 | 1,096,226 | 1,055,724 | |||||||||||||||||||||||||||||||||
Impaired loans and advances to customers | 23,758 | (1,868 | ) | (3,657 | ) | 29,283 | 36,428 | 38,671 | 41,584 | |||||||||||||||||||||||||||||||||
Impairment allowances on loans and advances to customers | 9,555 | (1,189 | ) | (1,593 | ) | 12,337 | 15,143 | 16,112 | 17,511 | |||||||||||||||||||||||||||||||||
Loan impairment charge | 3,592 | (682 | ) | 219 | 4,055 | 6,048 | 8,160 | 11,505 | ||||||||||||||||||||||||||||||||||
– new allowances net of allowance releases | 4,400 | (821 | ) | 211 | 5,010 | 7,344 | 9,306 | 12,931 | ||||||||||||||||||||||||||||||||||
– recoveries | (808 | ) | 139 | 8 | (955 | ) | (1,296 | ) | (1,146 | ) | (1,426 | ) | ||||||||||||||||||||||||||||||
For footnotes, see page 191.
The personal lending currency effect on gross loans and advances of $20bn was made up as follows: Europe $10bn, Asia $4.2bn, Latin America $2.5bn and North America $3.3bn. The wholesale lending currency effect on gross loans and advances of $40bn was made up as follows:
Europe $17bn, Asia $8.7bn, Latin America $11bn, North America $2.7bn and Middle East and North Africa $0.7bn.
In the following two tables, negative percentage numbers are favourable, positive numbers are unfavourable.
HSBC HOLDINGS PLC
148 |
Table of Contents
Reconciliation of reported and constant currency impaired loans, allowances and charges by geographical region
|
| 31 December 2014 as reported |
|
| Currency translation adjustment |
18 | | 31 December 2014 at 31 December | | | Movement – constant currency basis | |
| 31 December 2015 as reported |
|
| Reported change |
|
| Constant currency change |
| ||||||||||||||||||||||
| $m | $m | $m | $m | $m | % | % | ||||||||||||||||||||||||||||||||||||
Impaired loans | ||||||||||||||||||||||||||||||||||||||||||
Europe | 10,242 | (748 | ) | 9,494 | 183 | 9,677 | (5.5 | ) | 1.9 | |||||||||||||||||||||||||||||||||
Asia | 2,048 | (118 | ) | 1,930 | 445 | 2,375 | 16.0 | 23.1 | ||||||||||||||||||||||||||||||||||
Middle East and North Africa | 1,981 | (19 | ) | 1,962 | (196 | ) | 1,766 | (10.9 | ) | (10.0 | ) | |||||||||||||||||||||||||||||||
North America | 11,694 | (71 | ) | 11,623 | (2,693 | ) | 8,930 | (23.6 | ) | (23.2 | ) | |||||||||||||||||||||||||||||||
Latin America | 3,365 | (913 | ) | 2,452 | (1,422 | ) | 1,030 | (69.4 | ) | (58.0 | ) | |||||||||||||||||||||||||||||||
| 29,330 | (1,869 | ) | 27,461 | (3,683 | ) | 23,778 | (18.9 | ) | (13.4 | ) | ||||||||||||||||||||||||||||||||
Impairment allowances | ||||||||||||||||||||||||||||||||||||||||||
Europe | 4,455 | (364 | ) | 4,091 | (222 | ) | 3,869 | (13.2 | ) | (5.4 | ) | |||||||||||||||||||||||||||||||
Asia | 1,356 | (64 | ) | 1,292 | 233 | 1,525 | 12.5 | 18.0 | ||||||||||||||||||||||||||||||||||
Middle East and North Africa | 1,406 | (11 | ) | 1,395 | 23 | 1,418 | 0.9 | 1.6 | ||||||||||||||||||||||||||||||||||
North America | 2,640 | (51 | ) | 2,589 | (548 | ) | 2,041 | (22.7 | ) | (21.2 | ) | |||||||||||||||||||||||||||||||
Latin America | 2,529 | (702 | ) | 1,827 | (1,107 | ) | 720 | (71.5 | ) | (60.6 | ) | |||||||||||||||||||||||||||||||
| 12,386 | (1,192 | ) | 11,194 | (1,621 | ) | 9,573 | (22.7 | ) | (14.5 | ) | ||||||||||||||||||||||||||||||||
Loan impairment charge | ||||||||||||||||||||||||||||||||||||||||||
Europe | 1,079 | (134 | ) | 945 | (236 | ) | 709 | (34.3 | ) | (25.0 | ) | |||||||||||||||||||||||||||||||
Asia | 644 | (27 | ) | 617 | 64 | 681 | 5.7 | 10.4 | ||||||||||||||||||||||||||||||||||
Middle East and North Africa | (1 | ) | (1 | ) | (2 | ) | 301 | 299 | – | – | ||||||||||||||||||||||||||||||||
North America | 300 | (10 | ) | 290 | 179 | 469 | 56.3 | 61.7 | ||||||||||||||||||||||||||||||||||
Latin America | 2,033 | (510 | ) | 1,523 | (89 | ) | 1,434 | (29.5 | ) | (5.8 | ) | |||||||||||||||||||||||||||||||
| 4,055 | (682 | ) | 3,373 | 219 | 3,592 | (11.4 | ) | 6.5 | ||||||||||||||||||||||||||||||||||
For footnote, see page 191.
Reconciliation of reported and constant currency loan impairment charges to the income statement
|
| 31 December 2014 as reported |
|
| Currency translation adjustment |
18 | | 31 December 2014 at 31 December | | | Movement – constant currency basis | |
| 31 December 2015 as reported |
|
| Reported change |
|
| Constant currency change |
| ||||||||||||||||||||||
| $m | $m | $m | $m | $m | % | % | ||||||||||||||||||||||||||||||||||||
Loan impairment charge | ||||||||||||||||||||||||||||||||||||||||||
Europe | 1,079 | (134 | ) | 945 | (236 | ) | 709 | (34.3 | ) | (25.0 | ) | |||||||||||||||||||||||||||||||
– new allowances | 2,445 | (303 | ) | 2,142 | (97 | ) | 2,045 | (16.4 | ) | (4.5 | ) | |||||||||||||||||||||||||||||||
– releases | (1,062 | ) | 140 | (922 | ) | (26 | ) | (948 | ) | (10.7 | ) | 2.8 | ||||||||||||||||||||||||||||||
– recoveries | (304 | ) | 29 | (275 | ) | (113 | ) | (388 | ) | 27.6 | 41.1 | |||||||||||||||||||||||||||||||
Asia | 644 | (27 | ) | 617 | 64 | 681 | 5.7 | 10.4 | ||||||||||||||||||||||||||||||||||
– new allowances | 1,115 | (61 | ) | 1,054 | 224 | 1,278 | 14.6 | 21.3 | ||||||||||||||||||||||||||||||||||
– releases | (318 | ) | 21 | (297 | ) | (135 | ) | (432 | ) | 35.8 | 45.5 | |||||||||||||||||||||||||||||||
– recoveries | (153 | ) | 13 | (140 | ) | (25 | ) | (165 | ) | 7.8 | 17.9 | |||||||||||||||||||||||||||||||
Middle East and North Africa | (1 | ) | (1 | ) | (2 | ) | 301 | 299 | – | – | ||||||||||||||||||||||||||||||||
– new allowances | 355 | (7 | ) | 348 | 144 | 492 | 38.6 | 41.4 | ||||||||||||||||||||||||||||||||||
– releases | (314 | ) | 6 | (308 | ) | 148 | (160 | ) | (49.0 | ) | (48.1 | ) | ||||||||||||||||||||||||||||||
– recoveries | (42 | ) | – | (42 | ) | 9 | (33 | ) | (21.4 | ) | (21.4 | ) | ||||||||||||||||||||||||||||||
North America | 300 | (10 | ) | 290 | 179 | 469 | 56.3 | 61.7 | ||||||||||||||||||||||||||||||||||
– new allowances | 908 | (20 | ) | 888 | (157 | ) | 731 | (19.5 | ) | (17.7 | ) | |||||||||||||||||||||||||||||||
– releases | (493 | ) | 8 | (485 | ) | 299 | (186 | ) | (62.3 | ) | (61.6 | ) | ||||||||||||||||||||||||||||||
– recoveries | (115 | ) | 2 | (113 | ) | 37 | (76 | ) | (33.9 | ) | (32.7 | ) | ||||||||||||||||||||||||||||||
Latin America | 2,033 | (510 | ) | 1,523 | (89 | ) | 1,434 | (29.5 | ) | (5.8 | ) | |||||||||||||||||||||||||||||||
– new allowances | 2,707 | (674 | ) | 2,033 | (239 | ) | 1,794 | (33.7 | ) | (11.8 | ) | |||||||||||||||||||||||||||||||
– releases | (333 | ) | 69 | (264 | ) | 50 | (214 | ) | (35.7 | ) | (18.9 | ) | ||||||||||||||||||||||||||||||
– recoveries | (341 | ) | 95 | (246 | ) | 100 | (146 | ) | (57.2 | ) | (40.7 | ) | ||||||||||||||||||||||||||||||
Total | 4,055 | (682 | ) | 3,373 | 219 | 3,592 | (11.4 | ) | 6.5 | |||||||||||||||||||||||||||||||||
– new allowances | 7,530 | (1,065 | ) | 6,465 | (125 | ) | 6,340 | (15.8 | ) | (1.9 | ) | |||||||||||||||||||||||||||||||
– releases | (2,520 | ) | 244 | (2,276 | ) | 336 | (1,940 | ) | (23.0 | ) | (14.8 | ) | ||||||||||||||||||||||||||||||
– recoveries | (955 | ) | 139 | (816 | ) | 8 | (808 | ) | (15.4 | ) | (1.0 | ) | ||||||||||||||||||||||||||||||
For footnote, see page 191.
HSBC HOLDINGS PLC
149 |
Table of Contents
Report of the Directors: Risk(continued)
Credit risk
Loan impairment charges by industry sector over five years
For footnote, see page 191.
HSBC HOLDINGS PLC
150 |
Table of Contents
Gross loans and advances to customers by country
|
| First lien residential mortgages $m |
|
| Other personal $m | 3
|
| Property- related $m |
|
| Commercial, international trade and other $m |
|
| Total $m |
| ||||||||||||||||
Europe | 125,544 | 44,982 | 33,579 | 191,807 | 395,912 | |||||||||||||||||||||||||
UK | 117,346 | 20,797 | 25,700 | 149,327 | 313,170 | |||||||||||||||||||||||||
France | 3,606 | 12,130 | 6,070 | 20,380 | 42,186 | |||||||||||||||||||||||||
Germany | 4 | 203 | 347 | 7,941 | 8,495 | |||||||||||||||||||||||||
Switzerland | 511 | 8,045 | 224 | 834 | 9,614 | |||||||||||||||||||||||||
Other | 4,077 | 3,807 | 1,238 | 13,325 | 22,447 | |||||||||||||||||||||||||
Asia | 94,606 | 38,101 | 67,577 | 157,616 | 357,900 | |||||||||||||||||||||||||
Hong Kong | 60,943 | 24,389 | 50,825 | 80,609 | 216,766 | |||||||||||||||||||||||||
Australia | 9,297 | 726 | 1,592 | 6,448 | 18,063 | |||||||||||||||||||||||||
India | 1,248 | 431 | 637 | 5,728 | 8,044 | |||||||||||||||||||||||||
Indonesia | 56 | 346 | 71 | 4,965 | 5,438 | |||||||||||||||||||||||||
Mainland China | 5,716 | 1,645 | 6,185 | 23,703 | 37,249 | |||||||||||||||||||||||||
Malaysia | 2,792 | 3,113 | 1,993 | 4,947 | 12,845 | |||||||||||||||||||||||||
Singapore | 7,743 | 5,392 | 3,334 | 11,021 | 27,490 | |||||||||||||||||||||||||
Taiwan | 3,866 | 629 | 126 | 5,291 | 9,912 | |||||||||||||||||||||||||
Other | 2,945 | 1,430 | 2,814 | 14,904 | 22,093 | |||||||||||||||||||||||||
Middle East and North Africa (excluding Saudi Arabia) | 2,258 | 4,447 | 2,598 | 21,991 | 31,294 | |||||||||||||||||||||||||
Egypt | 1 | 549 | 104 | 2,097 | 2,751 | |||||||||||||||||||||||||
UAE | 1,854 | 2,286 | 1,833 | 14,199 | 20,172 | |||||||||||||||||||||||||
Other | 403 | 1,612 | 661 | 5,695 | 8,371 | |||||||||||||||||||||||||
North America | 50,117 | 8,069 | 16,014 | 56,690 | 130,890 | |||||||||||||||||||||||||
US | 34,382 | 4,813 | 11,435 | 42,439 | 93,069 | |||||||||||||||||||||||||
Canada | 14,418 | 3,029 | 4,315 | 13,490 | 35,252 | |||||||||||||||||||||||||
Other | 1,317 | 227 | 264 | 761 | 2,569 | |||||||||||||||||||||||||
Latin America | 1,986 | 3,972 | 1,622 | 10,433 | 18,013 | |||||||||||||||||||||||||
Mexico | 1,881 | 2,828 | 1,498 | 7,844 | 14,051 | |||||||||||||||||||||||||
Other | 105 | 1,144 | 124 | 2,589 | 3,962 | |||||||||||||||||||||||||
At 31 December 2015 | 274,511 | 99,571 | 121,390 | 438,537 | 934,009 | |||||||||||||||||||||||||
Europe | 131,000 | 47,531 | 35,313 | 200,313 | 414,157 | |||||||||||||||||||||||||
UK | 123,239 | 21,023 | 25,927 | 156,577 | 326,766 | |||||||||||||||||||||||||
France | 2,914 | 12,820 | 7,341 | 21,834 | 44,909 | |||||||||||||||||||||||||
Germany | 6 | 212 | 304 | 7,275 | 7,797 | |||||||||||||||||||||||||
Switzerland | 298 | 8,149 | 225 | 614 | 9,286 | |||||||||||||||||||||||||
Other | 4,543 | 5,327 | 1,516 | 14,013 | 25,399 | |||||||||||||||||||||||||
Asia | 93,147 | 36,368 | 70,057 | 164,739 | 364,311 | |||||||||||||||||||||||||
Hong Kong | 56,656 | 22,891 | 52,208 | 82,362 | 214,117 | |||||||||||||||||||||||||
Australia | 9,154 | 815 | 2,130 | 6,360 | 18,459 | |||||||||||||||||||||||||
India | 1,235 | 285 | 613 | 5,099 | 7,232 | |||||||||||||||||||||||||
Indonesia | 64 | 469 | 202 | 5,476 | 6,211 | |||||||||||||||||||||||||
Mainland China | 4,238 | 1,981 | 6,606 | 24,875 | 37,700 | |||||||||||||||||||||||||
Malaysia | 5,201 | 1,750 | 1,988 | 5,217 | 14,156 | |||||||||||||||||||||||||
Singapore | 9,521 | 5,878 | 4,210 | 11,951 | 31,560 | |||||||||||||||||||||||||
Taiwan | 3,920 | 626 | 118 | 7,057 | 11,721 | |||||||||||||||||||||||||
Other | 3,158 | 1,673 | 1,982 | 16,342 | 23,155 | |||||||||||||||||||||||||
Middle East and North Africa (excluding Saudi Arabia) | 2,647 | 3,924 | 2,246 | 21,633 | 30,450 | |||||||||||||||||||||||||
Egypt | 1 | 510 | 98 | 2,272 | 2,881 | |||||||||||||||||||||||||
UAE | 2,263 | 1,782 | 1,545 | 13,814 | 19,404 | |||||||||||||||||||||||||
Other | 383 | 1,632 | 603 | 5,547 | 8,165 | |||||||||||||||||||||||||
North America | 55,577 | 9,823 | 15,492 | 51,535 | 132,427 | |||||||||||||||||||||||||
US | 37,937 | 5,482 | 11,461 | 38,632 | 93,512 | |||||||||||||||||||||||||
Canada | 16,236 | 4,085 | 3,708 | 11,825 | 35,854 | |||||||||||||||||||||||||
Other | 1,404 | 256 | 323 | 1,078 | 3,061 | |||||||||||||||||||||||||
Latin America | 4,153 | 9,384 | 2,572 | 29,543 | 45,652 | |||||||||||||||||||||||||
Mexico | 1,967 | 2,642 | 1,336 | 9,503 | 15,448 | |||||||||||||||||||||||||
Other | 2,186 | 6,742 | 1,236 | 20,040 | 30,204 | |||||||||||||||||||||||||
Included in Other: Brazil | 2,067 | 5,531 | 1,077 | 16,814 | 25,489 | |||||||||||||||||||||||||
At 31 December 2014 | 286,524 | 107,030 | 125,680 | 467,763 | 986,997 | |||||||||||||||||||||||||
For footnote, see page 191.
HSBC HOLDINGS PLC
151 |
Table of Contents
Report of the Directors: Risk(continued)
Credit risk
The above tables analyse loans and advances by industry sector and by the location of the principal operations of the lending subsidiary or, in the case of the operations of The Hongkong and Shanghai Banking Corporation, HSBC Bank, HSBC Bank Middle East and HSBC Bank USA, by the location of the lending branch.
(Audited)
Risk in HSBC Holdings is overseen by the HSBC Holdings Asset and Liability Management Committee (‘HALCO’). The major risks faced by HSBC Holdings are credit risk, liquidity risk and market risk (in the form of interest rate risk and foreign exchange risk), of which the most significant is credit risk.
Credit risk in HSBC Holdings primarily arises from transactions with Group subsidiaries and from guarantees issued in support of obligations assumed by certain Group
operations in the normal conduct of their business. It is reviewed and managed within regulatory and internal limits for exposures by our Global Risk function, which provides high-level centralised oversight and management of credit risks worldwide.
HSBC Holdings’ maximum exposure to credit risk at 31 December 2015 is shown below. Its financial assets principally represent claims on Group subsidiaries in Europe and North America.
All the derivative transactions are with HSBC undertakings that are banking counterparties (2014: 100%) and for which HSBC Holdings has in place master netting arrangements. Since 2012, the credit risk exposure has been managed on a net basis and the remaining net exposure is specifically collateralised in the form of cash.
HSBC Holdings – maximum exposure to credit risk
(Audited)
| 2015 | 2014 | |||||||||||||||||||||||||||||||||||
| Maximum exposure | Offset | Exposure to credit risk (net) | Maximum exposure | Offset | Exposure to credit risk (net) | |||||||||||||||||||||||||||||||
| $m | $m | $m | $m | $m | $m | |||||||||||||||||||||||||||||||
Cash at bank and in hand: | ||||||||||||||||||||||||||||||||||||
– balances with HSBC undertakings | 242 | – | 242 | 249 | – | 249 | ||||||||||||||||||||||||||||||
Derivatives | 2,467 | (2,467 | ) | – | 2,771 | (2,610 | ) | 161 | ||||||||||||||||||||||||||||
Loans and advances to HSBC undertakings | 44,350 | – | 44,350 | 43,910 | – | 43,910 | ||||||||||||||||||||||||||||||
Financial investments in HSBC undertakings | 4,285 | – | 4,285 | 4,073 | – | 4,073 | ||||||||||||||||||||||||||||||
Other assets | 109 | – | 109 | |||||||||||||||||||||||||||||||||
Financial guarantees and similar contracts | 68,333 | – | 68,333 | 52,023 | – | 52,023 | ||||||||||||||||||||||||||||||
Loan and other credit-related commitments | – | – | – | 16 | – | 16 | ||||||||||||||||||||||||||||||
At 31 December | 119,786 | (2,467 | ) | 117,319 | 103,042 | (2,610 | ) | 100,432 | ||||||||||||||||||||||||||||
The credit quality of loans and advances and financial investments, both of which consist of intra-Group lending, is assessed as ‘strong’ or ‘good’, with 100% of the exposure being neither past due nor impaired (2014: 100%).
Securitisation exposures and other structured products
The following table summarises the carrying amount of our ABS exposure by categories of collateral and includes assets held in the GB&M legacy credit portfolio with a carrying value of $15bn (2014: $23bn).
At 31 December 2015, the available-for-sale reserve in respect of ABSs was a deficit of $1,021m (2014: deficit of $777m). For 2015, the impairment write-back in respect of ABSs was $85m (2014: write-back of $276m).
HSBC HOLDINGS PLC
152 |
Table of Contents
Carrying amount of HSBC’s consolidated holdings of ABSs
| Trading | Available for sale | Held to maturity | Designated at fair value through profit or loss | Loans and receivables | Total | Of which held through consolidated SEs | ||||||||||||||||||||||||||||||||||||
| $m | $m | $m | $m | $m | $m | $m | ||||||||||||||||||||||||||||||||||||
Mortgage-related assets: | ||||||||||||||||||||||||||||||||||||||||||
Sub-prime residential | 73 | 2,247 | – | 1 | 132 | 2,453 | 1,075 | |||||||||||||||||||||||||||||||||||
US Alt-A residential | – | 1,989 | 7 | – | 55 | 2,051 | 1,796 | |||||||||||||||||||||||||||||||||||
US Government agency and sponsored enterprises: | ||||||||||||||||||||||||||||||||||||||||||
MBSs | 166 | 15,082 | 13,997 | – | – | 29,245 | – | |||||||||||||||||||||||||||||||||||
Other residential | 812 | 780 | – | – | 108 | 1,700 | 253 | |||||||||||||||||||||||||||||||||||
Commercial property | 590 | 2,308 | – | – | 201 | 3,099 | 1,656 | |||||||||||||||||||||||||||||||||||
Leveraged finance-related assets | 240 | 2,294 | – | – | 149 | 2,683 | 1,310 | |||||||||||||||||||||||||||||||||||
Student loan-related assets | 236 | 2,991 | – | – | 25 | 3,252 | 2,679 | |||||||||||||||||||||||||||||||||||
Other assets | 1,184 | 880 | – | 23 | 128 | 2,215 | 565 | |||||||||||||||||||||||||||||||||||
At 31 December 2015 | 3,301 | 28,571 | 14,004 | 24 | 798 | 46,698 | 9,334 | |||||||||||||||||||||||||||||||||||
Mortgage-related assets: | ||||||||||||||||||||||||||||||||||||||||||
Sub-prime residential | 122 | 3,081 | – | – | 308 | 3,511 | 2,075 | |||||||||||||||||||||||||||||||||||
US Alt-A residential | 96 | 3,022 | 11 | – | 110 | 3,239 | 2,411 | |||||||||||||||||||||||||||||||||||
US Government agency and sponsored enterprises: | ||||||||||||||||||||||||||||||||||||||||||
MBSs | 82 | 10,401 | 13,436 | – | – | 23,919 | – | |||||||||||||||||||||||||||||||||||
Other residential | 928 | 1,220 | – | – | 330 | 2,478 | 652 | |||||||||||||||||||||||||||||||||||
Commercial property | 654 | 3,627 | – | – | 516 | 4,797 | 2,854 | |||||||||||||||||||||||||||||||||||
Leveraged finance-related assets | 172 | 3,660 | – | – | 218 | 4,050 | 2,526 | |||||||||||||||||||||||||||||||||||
Student loan-related assets | 242 | 3,545 | – | – | 119 | 3,906 | 3,284 | |||||||||||||||||||||||||||||||||||
Other assets | 1,264 | 1,114 | – | 19 | 646 | 3,043 | 758 | |||||||||||||||||||||||||||||||||||
At 31 December 2014 | 3,560 | 29,670 | 13,447 | 19 | 2,247 | 48,943 | 14,560 | |||||||||||||||||||||||||||||||||||
HSBC HOLDINGS PLC
153 |
Table of Contents
Risk elements in the loan portfolio
The disclosure of credit risk elements in this section reflects US accounting practice and classifications. The purpose of the disclosure is to present within the US disclosure framework those elements of the loan portfolios with a greater risk of loss. The three main classifications of credit risk elements presented are:
| • | impaired loans; |
| • | unimpaired loans contractually more than 90 days past due as to interest or principal; and |
| • | troubled debt restructurings not included in the above. |
Interest foregone on impaired and restructured loans
Interest income that would have been recognised under the original terms of impaired and restructured loans amounted to approximately $2.1bn in 2015 (2014: $2.2bn). The table below analyses this by geographic region.
| 2015 | 2014 | |||||||||||
| $m | $m | |||||||||||
Europe | 276 | 218 | ||||||||||
Asia | 164 | 113 | ||||||||||
Middle East and North Africa | 138 | 135 | ||||||||||
North America | 1,097 | 1,350 | ||||||||||
Latin America | 409 | 411 | ||||||||||
Year ended 31 December | 2,084 | 2,227 | ||||||||||
Interest recognised on impaired and restructured loans
Interest income from such loans of approximately $1.3bn was recorded in 2015 (2014: $1.5bn). The table below analyses this by geographical region.
| 2015 | 2014 | |||||||||||
| $m | $m | |||||||||||
Europe | 92 | 112 | ||||||||||
Asia | 57 | 38 | ||||||||||
Middle East and North Africa | 27 | 40 | ||||||||||
North America | 832 | 995 | ||||||||||
Latin America | 248 | 284 | ||||||||||
Year ended 31 December | 1,256 | 1,469 | ||||||||||
Impaired loans
In the following tables we present information on our impaired loans and advances in accordance with the classification approach described on page 128.
A loan is impaired, and an impairment allowance is recognised, when there is objective evidence of a loss event that has an effect on the cash flows of the loan which can be reliably estimated. In accordance with IFRSs, we recognise interest income on assets after they have been written down as a result of an impairment loss.
The balance of impaired loans at 31 December 2015 was $5.6bn lower than at 31 December 2014. This reduction was largely due to the reclassification of the assets of our Brazilian operations as ‘Assets held for sale’, and a combination of the continued run-off of the CML portfolio and reductions in corporate individually assessed impaired loans in Europe.
Unimpaired loans more than 90 days past due
Examples of unimpaired loans more than 90 days past due include individually assessed mortgages that are in arrears more than 90 days where there are no other indicators of impairment, but where the value of collateral is sufficient to repay both the principal debt and all potential interest for at least one year; and short-term trade facilities past due more than 90 days for technical reasons such as delays in documentation, but where there is no concern over the creditworthiness of the counterparty.
The amount of unimpaired loans contractually more than 90 days past due as to principal or interest at 31 December 2015 was $132m, $60m higher than at 31 December 2014. The increase was primarily in Middle East and North Africa.
Troubled debt restructurings
Under US GAAP, a troubled debt restructuring (‘TDR’) is a loan the terms of which have been modified for economic or legal reasons related to the borrower’s financial difficulties to grant a concession to the borrower that the lender would not otherwise consider. A modification which results in a delay in payment that is considered insignificant is not regarded as a concession for the purposes of this disclosure. The SEC requires separate disclosure of any loans which meet the definition of a TDR that are not included in the previous two loan categories. These are classified as TDRs in the table on page 153c. Loans that have been identified as a TDR under the US guidance retain this designation until maturity or derecognition. This treatment differs from the Group’s impaired loans disclosure convention under IFRSs under which a loan may return to unimpaired status after demonstrating a significant reduction in the risk of non-payment of future cash flows. As a result, reported TDRs include those loans that have returned to unimpaired status under the Group’s disclosure convention for renegotiated loans.
The balance of TDRs not included as impaired loans at 31 December 2015 was $6.2bn, $0.8bn lower than 2014 due to a reduction across all regions except Asia.
Potential problem loans
Potential problem loans are loans where information on possible credit problems among borrowers causes management to seriously doubt their ability to comply with the loan repayment terms. The following concentrations of credit risk have a higher risk of containing potential problem loans.
‘Mortgage lending’ on page 144 includes disclosure about certain homogeneous groups of loans which are collectively assessed for impairment, which may represent exposures to potential problem loans, including interest-only mortgages and affordability mortgages including ARMs (adjustable rate mortgages). Collectively assessed loans and advances, although not classified as impaired until more than 90 days past due, are assessed collectively
HSBC HOLDINGS PLC
153a |
Table of Contents
Report of the Directors: Financial Review(continued)
for losses that have been incurred but have not yet been individually identified. This policy is further described on page 201 and page 356.
‘Renegotiated loans and forbearance’ on page 129 includes disclosure about the credit quality of loans whose contractual terms have been changed at some point in the life of the loan because of significant concerns about the borrower’s ability to make contractual payments when due. Renegotiated loans are classified as impaired when:
| • | there has been a change in contractual cash flow as a result of a concession which the lender would otherwise not consider; and |
| • | it is probable that without the concession, the borrower would be unable to meet contractual payment obligations in full. |
This presentation applies unless the concession is insignificant and there are no other indicators of impairment. The renegotiated loan will continue to be disclosed as impaired until there is sufficient evidence to demonstrate a significant reduction in the risk of non-repayment of future cash flows, and there are no other indicators of impairment.
Renegotiated loans that are not classified as impaired may have a higher risk of becoming delinquent in the future, and may therefore be potential problem loans. Further information regarding the credit quality classification of renegotiated loans can be found on page 198.
‘Areas of special interest’ on page 117 includes information on metals and mining, oil and gas and mainland China. Refinancing risk in the commercial real estate sector is a separate area of focus and is covered on page 137.
HSBC HOLDINGS PLC
153b |
Table of Contents
Analysis of risk elements in the loan portfolio by geographical region
The analysis below sets out the amount of risk elements in loan portfolios included within loans and advances to customers and banks in the consolidated balance sheet, trading loans classified as in default and assets obtained by taking possession of security. The table excludes the
amount of risk elements in loan portfolios classified as ‘Assets held for sale’ in the consolidated balance sheet, which is set out in footnote 56 on page 192a.
During 2015, our Brazilian operations were reclassified to ‘Assets held for sale’. Further information can be found on page 121.
2015 $m | 2014 $m | 2013 $m | 2012 $m | 2011 $m | ||||||||||||||||||||||||||
Impaired loans | ||||||||||||||||||||||||||||||
Europe | 9,677 | 10,242 | 13,228 | 11,145 | 11,819 | |||||||||||||||||||||||||
Asia | 2,375 | 2,048 | 1,623 | 1,624 | 1,678 | |||||||||||||||||||||||||
Middle East and North Africa | 1,766 | 1,981 | 2,285 | 2,474 | 2,445 | |||||||||||||||||||||||||
North America | 8,930 | 11,694 | 15,123 | 20,345 | 22,758 | |||||||||||||||||||||||||
Latin America | 1,030 | 3,365 | 4,244 | 3,188 | 3,039 | |||||||||||||||||||||||||
| 23,778 | 29,330 | 36,503 | 38,776 | 41,739 | ||||||||||||||||||||||||||
Unimpaired loans contractually more than 90 days past due as to principal or interest | ||||||||||||||||||||||||||||||
Europe | 7 | 6 | 25 | 33 | 41 | |||||||||||||||||||||||||
Asia | 2 | 1 | 33 | 14 | 24 | |||||||||||||||||||||||||
Middle East and North Africa | 96 | 59 | 56 | 108 | 214 | |||||||||||||||||||||||||
North America | 27 | 3 | 13 | 69 | 74 | |||||||||||||||||||||||||
Latin America | – | 3 | – | – | 10 | |||||||||||||||||||||||||
| 132 | 72 | 127 | 224 | 363 | ||||||||||||||||||||||||||
Troubled debt restructurings (not included in the classifications above) | ||||||||||||||||||||||||||||||
Europe | 1,495 | 1,652 | 1,427 | 1,306 | 753 | |||||||||||||||||||||||||
Asia | 284 | 267 | 277 | 236 | 230 | |||||||||||||||||||||||||
Middle East and North Africa | 584 | 778 | 406 | 593 | 444 | |||||||||||||||||||||||||
North America | 3,698 | 3,932 | 4,643 | 3,813 | 2,300 | |||||||||||||||||||||||||
Latin America | 164 | 353 | 482 | 1,001 | 1,037 | |||||||||||||||||||||||||
| 6,225 | 6,982 | 7,235 | 6,949 | 4,764 | ||||||||||||||||||||||||||
Trading loans classified as in default | ||||||||||||||||||||||||||||||
North America | – | 4 | 133 | 166 | 230 | |||||||||||||||||||||||||
Risk elements on loans57 | ||||||||||||||||||||||||||||||
Europe | 11,179 | 11,900 | 14,680 | 12,484 | 12,613 | |||||||||||||||||||||||||
Asia | 2,661 | 2,316 | 1,933 | 1,874 | 1,932 | |||||||||||||||||||||||||
Middle East and North Africa | 2,446 | 2,818 | 2,747 | 3,175 | 3,103 | |||||||||||||||||||||||||
North America | 12,655 | 15,633 | 19,912 | 24,393 | 25,362 | |||||||||||||||||||||||||
Latin America | 1,194 | 3,721 | 4,726 | 4,189 | 4,086 | |||||||||||||||||||||||||
| 30,135 | 36,388 | 43,998 | 46,115 | 47,096 | ||||||||||||||||||||||||||
Assets held for resale57 | ||||||||||||||||||||||||||||||
Europe | 24 | 29 | 46 | 51 | 60 | |||||||||||||||||||||||||
Asia | 19 | 14 | 10 | 19 | 14 | |||||||||||||||||||||||||
Middle East and North Africa | – | – | – | – | – | |||||||||||||||||||||||||
North America | 116 | 186 | 370 | 319 | 359 | |||||||||||||||||||||||||
Latin America | 20 | 16 | 27 | 55 | 69 | |||||||||||||||||||||||||
| 179 | 245 | 453 | 444 | 502 | ||||||||||||||||||||||||||
Total risk elements56 | ||||||||||||||||||||||||||||||
Europe | 11,203 | 11,929 | 14,726 | 12,535 | 12,673 | |||||||||||||||||||||||||
Asia | 2,680 | 2,330 | 1,943 | 1,893 | 1,946 | |||||||||||||||||||||||||
Middle East and North Africa | 2,446 | 2,818 | 2,747 | 3,175 | 3,103 | |||||||||||||||||||||||||
North America | 12,771 | 15,819 | 20,282 | 24,712 | 25,721 | |||||||||||||||||||||||||
Latin America | 1,214 | 3,737 | 4,753 | 4,244 | 4,155 | |||||||||||||||||||||||||
At 31 December | 30,314 | 36,633 | 44,451 | 46,559 | 47,598 | |||||||||||||||||||||||||
| % | % | % | % | % | ||||||||||||||||||||||||||
Loan impairment allowances as a percentage of risk elements on loans58 | 31.8 | 34.0 | 34.7 | 35.2 | 37.6 | |||||||||||||||||||||||||
For footnotes, see page 192a.
HSBC HOLDINGS PLC
153c |
Table of Contents
Report of the Directors: Financial Review(continued)
Country distribution of outstandings and cross-border exposures
We control the risk associated with cross-border lending through a centralised structure of internal country limits. Exposures to individual countries and cross-border exposure in the aggregate are kept under continual review.
The following table summarises the aggregate of our in-country foreign currency and cross-border outstandings by type of borrower to countries which individually
represent in excess of 0.75% of our total assets. The classification is based on the country of residence of the borrower but also recognises the transfer of country risk in respect of third-party guarantees, eligible collateral held and residence of the head office when the borrower is a branch. In accordance with the Bank of England Country Exposure Report (Form CE) guidelines, outstandings comprise loans and advances (excluding settlement accounts), amounts receivable under finance leases, acceptances, commercial bills, certificates of deposit and debt and equity securities (net of short positions), and exclude accrued interest andintra-HSBC exposures.
In-country foreign currency and cross-border amounts outstanding
| Banks | Government and official institutions | Other | Total | |||||||||||||||||||||||
| $bn | $bn | $bn | $bn | |||||||||||||||||||||||
At 31 December 2015 | ||||||||||||||||||||||||||
US | 4.7 | 51.3 | 24.7 | 80.7 | ||||||||||||||||||||||
Mainland China | 21.2 | 6.8 | 26.0 | 54.0 | ||||||||||||||||||||||
UK | 23.1 | 9.2 | 25.3 | 57.6 | ||||||||||||||||||||||
Germany | 7.0 | 23.1 | 6.9 | 37.0 | ||||||||||||||||||||||
Hong Kong | 3.1 | 0.5 | 30.0 | 33.6 | ||||||||||||||||||||||
Japan | 7.6 | 19.4 | 14.4 | 41.4 | ||||||||||||||||||||||
France60 | 4.2 | 7.1 | 13.0 | 24.3 | ||||||||||||||||||||||
Canada60 | 6.2 | 8.3 | 7.5 | 22.0 | ||||||||||||||||||||||
At 31 December 2014 | ||||||||||||||||||||||||||
US | 6.8 | 30.3 | 32.4 | 69.5 | ||||||||||||||||||||||
Mainland China | 26.5 | 5.7 | 28.5 | 60.7 | ||||||||||||||||||||||
UK | 24.0 | 8.3 | 41.8 | 74.2 | ||||||||||||||||||||||
Germany | 7.7 | 26.6 | 6.7 | 41.0 | ||||||||||||||||||||||
Hong Kong | 8.1 | 0.4 | 29.0 | 37.5 | ||||||||||||||||||||||
Japan | 9.0 | 15.7 | 12.2 | 36.9 | ||||||||||||||||||||||
France | 7.3 | 3.1 | 11.6 | 22.1 | ||||||||||||||||||||||
At 31 December 2013 | ||||||||||||||||||||||||||
US | 10.0 | 2.3 | 42.5 | 54.8 | ||||||||||||||||||||||
UK | 5.9 | 34.3 | 24.5 | 64.7 | ||||||||||||||||||||||
Mainland China | 28.8 | 6.9 | 19.3 | 55.0 | ||||||||||||||||||||||
Germany | 10.0 | 12.9 | 31.9 | 54.8 | ||||||||||||||||||||||
France | 12.8 | 21.1 | 5.6 | 39.5 | ||||||||||||||||||||||
Hong Kong | 10.9 | 0.7 | 26.5 | 38.1 | ||||||||||||||||||||||
Japan | 7.2 | 14.8 | 7.0 | 29.0 | ||||||||||||||||||||||
Ireland | 6.2 | 8.7 | 11.2 | 26.1 | ||||||||||||||||||||||
For footnote, see page 192a.
HSBC HOLDINGS PLC
153d |
Table of Contents
Report of the Directors: Risk(continued)
Liquidity and funding
| Page | App | 1 | Tables | Page | ||||||||||
| 155 | 204 | |||||||||||||
| 204 | ||||||||||||||
| 155 | ||||||||||||||
| 155 | ||||||||||||||
| 155 | ||||||||||||||
| 155 | 156 | |||||||||||||
| 156 | 204 | |||||||||||||
| 156 | ||||||||||||||
| 156 | ||||||||||||||
| 204 | ||||||||||||||
| 204 | ||||||||||||||
| 156 | 205 | 157 | ||||||||||||
| 157 | 205 | 157 | ||||||||||||
| 205 | ||||||||||||||
| 157 | 206 | 158 | ||||||||||||
| 158 | 206 | 159 | ||||||||||||
| 207 | ||||||||||||||
| 207 | ||||||||||||||
| 207 | ||||||||||||||
Contingent liquidity risk arising from committed lending facilities | 159 | 159 | ||||||||||||
| 159 | ||||||||||||||
| 208 | 160 | |||||||||||||
Cross-border intra-Group and cross-currency liquidity and funding risk | 160 | 160 | ||||||||||||
| 162 | 161 | |||||||||||||
Analysis of on-balance sheet encumbered and unencumbered assets and off-balance sheet collateral | 162 | 209 | ||||||||||||
| 162 | ||||||||||||||
| 162 | Analysis of on-balance sheet encumbered and unencumbered assets | 163 | ||||||||||||
| 164 | ||||||||||||||
| 164 | Cash flows payable by HSBC under financial liabilities by remaining contractual maturities | 164 | ||||||||||||
| 210 | ||||||||||||||
| 165 | 210 | Cash flows payable by HSBC Holdings under financial liabilities by remaining contractual maturities | 165 | |||||||||||
1Appendix to Risk – risk policies and practices.
| ||||||||||||||
HSBC HOLDINGS PLC
154 |
Table of Contents
Liquidity risk is the risk that the Group will not have sufficient financial resources to meet its obligations as they fall due, or will have to do so at an excessive cost. The risk arises from mismatches in the timing of cash flows.
The risk arises when the funding needed for illiquid asset positions cannot be obtained at the expected terms and when required.
A summary of our current policies and practices regarding liquidity and funding is provided in the Appendix to Risk on page 204.
Liquidity and funding risk management framework
The objective of our liquidity framework is to allow us to withstand very severe liquidity stresses. It is designed to be adaptable to changing business models, markets and regulations.
Our Liquidity and Funding Risk Management Framework (‘LFRF’) requires:
| • | liquidity to be managed by operating entities on a stand-alone basis with no implicit reliance on the Group or central banks; |
| • | all operating entities to comply with their limits for the advances to core funding ratio; and |
| • | all operating entities to maintain a positive stressed cash flow position out to three months under prescribed Group stress scenarios. |
The liquidity position of the Group remained strong in 2015. Our ratio of customer advances to customer deposits was 72% (2014: 72%). Both customer loans and customer accounts fell on a reported basis with these movements including:
| • | the transfer to ‘Assets held for sale’ and ‘Liabilities of disposal groups held for sale’ of balances relating to the planned disposal of our operations in Brazil; |
| • | a reduction in corporate overdraft and current account balances relating to a small number of clients in our Payments and Cash Management business in the UK who settled their overdraft and deposit balances on a net basis, with customers increasing the frequency with which they settled their positions; and |
| • | movements in currency markets, which changed the value of our customer loans and customer accounts when translated from their local currency into US dollars. |
The HSBC UK liquidity group recorded an increase in its advances to core funding (‘ACF’) ratio to 101% at 31 December 2015 (2014: 97%), mainly because of higher wholesale lending while core funding remained unchanged.
The Hongkong and Shanghai Banking Corporation recorded a decrease in its ACF ratio to 69% at 31 December 2015 (2014: 75%), mainly because of an increase in core deposits coupled with a decrease in corporate loans.
HSBC USA recorded a decrease in its ACF ratio to 89% at 31 December 2015 (2014: 100%), mainly because of growth in core funding, which was partially offset by higher loans to customers.
The HSBC UK liquidity group, The Hongkong and Shanghai Banking Corporation and HSBC USA are defined in footnotes 19 to 21 on page 191. The ACF ratio is discussed on page 205.
Wholesale senior funding markets
Conditions in the bank wholesale debt markets were generally positive in 2015. Periods of volatility remained, however, particularly during the latter months of the year when concerns over the decline in oil prices and economic growth in Europe and mainland China combined with a variety of other factors to leave the outlook uncertain, affecting market confidence.
In 2015, a number of Group entities issued the equivalent of $22bn (2014: $20bn) of long-term debt securities in the public capital markets in a range of currencies and maturities.
Under European Commission (‘EC’) Delegated Regulation 2015/61, the consolidated liquidity coverage ratio (‘LCR’) became a minimum regulatory standard from 1 October 2015.
The European calibration of the net stable funding ratio (‘NSFR’) is still pending following the Basel Committee’s final recommendation in October 2014, and therefore external disclosure of this metric is currently on hold.
Non-EU regulators are expected to apply the LCR and NSFR reporting requirement locally and there is the potential for local requirements to diverge from the rules applicable to the Group.
Liquidity coverage ratio – EC LCR Delegated Regulation
The calculation of the EC LCR metric involves two key assumptions: the definition of operational deposits and the ability to transfer liquidity from non-EU legal entities.
| • | We define operational deposits as transactional (current) accounts arising from the provision of custody services by HSBC Security Services or Payments and Cash Management services, where the operational component is assessed to be the lower of the current balance and the separate notional values of debits and credits across the account in the previous calculation period. |
| • | No transferability of liquidity from non-EU entities is assumed other than to the extent currently permitted. This results in $94bn of high-quality liquid assets (‘HQLA’) being excluded from the Group’s LCR. |
On the basis of these assumptions, we reported to the PRA a Group EC LCR at 31 December 2015 (on the basis of the Delegated Regulation) of 116%.
The ratio of total consolidated HQLAs to the EC LCR denominator at 31 December 2015 was 142%, reflecting the additional $94bn of HQLAs excluded from the Group LCR.
HSBC HOLDINGS PLC
155 |
Table of Contents
Report of the Directors: Risk(continued)
Liquidity and funding
The liquidity position of the Group can also be represented by the stand-alone ratios of each of our principal operating entities. The table below displays the individual LCR levels for the principal HSBC operating entities on an EC LCR Delegated Regulation basis. The ratios shown for operating entities in non-EU jurisdictions can vary from their local LCR measures due to differences in the way non-EU regulators have implemented the Basel III recommendations.
At 31 December | ||||||
| 2015 | ||||||
| % | ||||||
HSBC UK liquidity group19 | 107 | |||||
The Hongkong and Shanghai Banking Corporation – Hong Kong Branch20 | 150 | |||||
The Hongkong and Shanghai Banking Corporation – Singapore Branch20 | 189 | |||||
HSBC Bank USA21 | 116 | |||||
HSBC France22 | 127 | |||||
Hang Seng Bank | 199 | |||||
HSBC Canada22 | 142 | |||||
HSBC Bank China | 183 | |||||
For footnotes, see page 191.
At 31 December 2015, all the Group’s operating entities were individually within the risk tolerance level established by the Board and applicable under the new internal framework which took effect from 1 January 2016.
Management of liquidity and funding risk
From 1 January 2016, the Group implemented a new internal LFRF, using the external LCR and NSFR regulatory framework as a foundation, but adding extra metrics/limits and overlays to address the risks that we consider are not adequately reflected by the external regulatory framework.
The key aspects of the new internal LFRF are:
| i. | stand-alone management of liquidity and funding by operating entity; |
| ii. | operating entity classification by inherent liquidity risk (‘ILR’) categorisation; |
| iii. | minimum operating entity EC LCR requirement depending on ILR categorisation (EC LCR Delegated Regulation basis); |
| iv. | minimum operating entity NSFR requirement depending on ILR categorisation (on the basis of the Basel 295 publication, pending finalisation of the EC NSFR delegated regulation); |
| v. | legal entity depositor concentration limit; |
| vi. | operating entity three-month and twelve-month cumulative rolling term contractual maturity limits covering deposits from banks, deposits from non-bank financials and securities issued; |
| vii. | annual individual liquidity adequacy assessment (‘ILAA’) by operating entity; and |
| viii. | during 2016, we will also introduce a minimum operating entity LCR requirement by currency. |
The new internal LFRF and the risk tolerance (limits) were approved by the RMM and the Board on the basis of recommendations made by the Group Risk Committee.
Our ILAA process has been designed to identify risks that are not reflected in the Group framework and where additional limits are assessed to be required locally, and to validate the risk tolerance at the operating entity level.
The decision to create an internal framework modelled around the external regulatory framework was driven by the need to ensure that the external and internal frameworks are directionally aligned and that the Group’s internal funds transfer pricing framework incentivises the global businesses within each operating entity to collectively comply with both the external (regulatory) and the internal risk tolerance.
The 2015, LFRF employed two key measures to define, monitor and control the liquidity and funding risk of each of our operating entities. The ACF ratio was used to monitor the structural long-term funding position, and the stressed coverage ratio, incorporating Group-defined stress scenarios, was used to monitor the resilience to severe liquidity stresses. Although in place before and during 2015, this framework and its accompanying metrics will be demised as the new framework outlined above is implemented.
The three principal entities listed in the tables below represented 65% (2014: 66%) of the Group’s customer accounts. Including the other principal entities, the percentage was 88% (2014: 88%).
Advances to core funding ratio
The table overleaf shows the extent to which loans and advances to customers in our principal banking entities were financed by reliable and stable sources of funding.
ACF limits set for principal operating entities at 31 December 2015 ranged between 80% and 120%.
Core funding represents the core component of customer deposits and any term professional funding with a residual contractual maturity beyond one year. Capital is excluded from our definition of core funding.
HSBC HOLDINGS PLC
156 |
Table of Contents
Advances to core funding ratios23
| At 31 December | ||||||||||
| 2015 | 2014 | |||||||||
| % | % | |||||||||
HSBC UK liquidity group19 | ||||||||||
Year-end | 101 | 97 | ||||||||
Maximum | 101 | 102 | ||||||||
Minimum | 96 | 97 | ||||||||
Average | 98 | 100 | ||||||||
The Hongkong and Shanghai Banking Corporation20 | ||||||||||
Year-end | 69 | 75 | ||||||||
Maximum | 75 | 75 | ||||||||
Minimum | 69 | 72 | ||||||||
Average | 72 | 74 | ||||||||
HSBC USA21 | ||||||||||
Year-end | 89 | 100 | ||||||||
Maximum | 100 | 100 | ||||||||
Minimum | 89 | 85 | ||||||||
Average | 94 | 95 | ||||||||
Total of HSBC’s other principal entities24 | ||||||||||
Year-end | 91 | 92 | ||||||||
Maximum | 95 | 94 | ||||||||
Minimum | 91 | 92 | ||||||||
Average | 93 | 93 | ||||||||
For footnotes, see page 191.
The ratios tabulated below express stressed cash inflows as a percentage of stressed cash outflows over both one-month and three-month time horizons. Operating entities are required to maintain a ratio of 100% or more out to three months.
Inflows included in the numerator of the stressed coverage ratio are generated from liquid assets (net of assumed haircuts) and cash inflows relating to assets contractually maturing within the time period.
In general, customer loans and advances are assumed to be renewed on maturity and as a result do not generate a cash inflow.
The stressed coverage ratios for The Hongkong and Shanghai Banking Corporation increased due to higher deposits and lower advances year-on-year. The ratios for HSBC USA increased due to a growth in core funding.
The stressed coverage ratios for the other entities remained broadly unchanged.
Stressed one-month and three-month coverage ratios23
Stressed one-month coverage ratios at 31 December | Stressed three-month coverage ratios at 31 December | |||||||||||||||||
| 2015 | 2014 | 2015 | 2014 | |||||||||||||||
| % | % | % | % | |||||||||||||||
HSBC UK liquidity group19 | ||||||||||||||||||
Year-end | 113 | 117 | 105 | 109 | ||||||||||||||
Maximum | 127 | 117 | 114 | 109 | ||||||||||||||
Minimum | 112 | 102 | 105 | 103 | ||||||||||||||
Average | 117 | 107 | 108 | 104 | ||||||||||||||
The Hongkong and Shanghai Banking Corporation20 | ||||||||||||||||||
Year-end | 129 | 117 | 120 | 112 | ||||||||||||||
Maximum | 129 | 119 | 120 | 114 | ||||||||||||||
Minimum | 113 | 114 | 111 | 111 | ||||||||||||||
Average | 119 | 116 | 115 | 112 | ||||||||||||||
HSBC USA21 | ||||||||||||||||||
Year-end | 126 | 111 | 116 | 104 | ||||||||||||||
Maximum | 126 | 122 | 116 | 111 | ||||||||||||||
Minimum | 109 | 108 | 101 | 104 | ||||||||||||||
Average | 117 | 115 | 108 | 107 | ||||||||||||||
Total of HSBC’s other principal entities24 | ||||||||||||||||||
Year-end | 126 | 122 | 111 | 108 | ||||||||||||||
Maximum | 126 | 126 | 111 | 120 | ||||||||||||||
Minimum | 110 | 114 | 105 | 108 | ||||||||||||||
Average | 116 | 118 | 108 | 111 | ||||||||||||||
For footnotes, see page 191.
Liquid assets of HSBC’s principal operating entities
The table below shows the estimated liquidity value (before assumed haircuts) of assets categorised as liquid and used for the purposes of calculating the three-month stressed coverage ratios, as defined under the LFRF.
The level of liquid assets reported reflects the stock of unencumbered liquid assets at the reporting date adjusted for the effect of reverse repo, repo and collateral swaps maturing within three months as the liquidity value of these transactions is reflected as a contractual cash flow reported in the net contractual cash flow table. Repos are sale and repurchase transactions while reverse repos are transactions under which securities are purchased under commitments to sell.
Like reverse repo transactions with residual contractual maturities within three months, unsecured interbank loans
maturing within three months are not included in liquid assets, but are treated as contractual cash inflows.
Liquid assets are held and managed on a stand-alone operating entity basis. Most of the liquid assets shown are held directly by each operating entity’s Balance Sheet Management (‘BSM’) department, primarily for the purpose of managing liquidity risk, in line with the LFRF.
The liquid asset buffer may also include securities held in held-to-maturity portfolios. In order to qualify as part of the liquid asset buffer, all held-to-maturity portfolios must have a deep and liquid repo market in the underlying security.
HSBC HOLDINGS PLC
157 |
Table of Contents
Report of the Directors: Risk(continued)
Liquidity and funding
Liquid assets also include any unencumbered liquid assets held outside BSM for any other purpose. The LFRF gives ultimate control of all unencumbered assets and sources of liquidity to BSM.
For a summary of our liquid asset policy and definitions of the classifications shown in the table below, see the Appendix to Risk on page 206.
Liquid assets of HSBC’s principal entities
| Estimated liquidity value25 | ||||||||||||
| 31 December 2015 | 31 December 2014 | |||||||||||
| $m | $m | |||||||||||
HSBC UK liquidity group19 | ||||||||||||
Level 1 | 118,193 | 131,756 | ||||||||||
Level 2 | 4,722 | 4,688 | ||||||||||
Level 3 | 59,378 | 66,011 | ||||||||||
| 182,293 | 202,455 | |||||||||||
The Hongkong and Shanghai Banking Corporation20 | ||||||||||||
Level 1 | 132,870 | 109,683 | ||||||||||
Level 2 | 6,029 | 4,854 | ||||||||||
Level 3 | 7,346 | 7,043 | ||||||||||
| 146,245 | 121,580 | |||||||||||
HSBC USA21 | ||||||||||||
Level 1 | 42,596 | 51,969 | ||||||||||
Level 2 | 11,798 | 15,184 | ||||||||||
Level 3 | 9 | 197 | ||||||||||
Other | 5,557 | 9,492 | ||||||||||
| 59,960 | 76,842 | |||||||||||
Total of HSBC’s other principal entities24 | ||||||||||||
Level 1 | 108,789 | 115,770 | ||||||||||
Level 2 | 10,764 | 7,940 | ||||||||||
Level 3 | 5,486 | 9,360 | ||||||||||
| 125,039 | 133,070 | |||||||||||
For footnotes, see page 191.
All assets held within the liquid asset portfolio are unencumbered.
| • | The quantum of liquid assets held by the HSBC UK liquidity group on a constant currency basis was broadly unchanged. |
| • | Liquid assets held by The Hongkong and Shanghai Banking Corporation increased due to added holdings of government securities and higher regulatory reserves. This was driven by the investment of surplus deposits. |
| • | Liquid assets held by HSBC USA decreased, mainly due to a switch from regulatory reserves to reverse repo placements. A corresponding improvement can be seen in HSBC USA’s net repo cash flow shown in the net contractual cash flow table. |
The following table quantifies the contractual cash flows from interbank and intra-Group loans and deposits, and reverse repo, repo (including intra-Group transactions) and short positions for the principal entities shown. These contractual cash inflows and outflows are reflected gross in the numerator and denominator, respectively, of the one and three-month stressed coverage ratios and should be considered alongside the level of liquid assets.
Outflows included in the denominator of the stressed coverage ratios include the principal outflows associated with the contractual maturity of wholesale debt securities reported in the table headed ‘Wholesale funding cash flows payable by HSBC under financial liabilities by remaining contractual maturities’ on page 161.
For a summary of our policy and definitions of the classifications shown in the table on page 159, see the Appendix to Risk on page 206.
HSBC HOLDINGS PLC
158 |
Table of Contents
Net cash inflows/(outflows) for interbank and intra-Group loans and deposits and reverse repo, repo and short positions
| At 31 December 2015 | At 31 December 2014 | |||||||||||||||||||
Cash flows within 1 month | Cash flows from 1 to 3 months | Cash flows within 1 month | Cash flows from 1 to 3 months | |||||||||||||||||
| $m | $m | $m | $m | |||||||||||||||||
Interbank and intra-Group loans and deposits | ||||||||||||||||||||
HSBC UK liquidity group19 | (18,534 | ) | (3,712 | ) | (14,110 | ) | (2,846 | ) | ||||||||||||
The Hongkong and Shanghai Banking Corporation20 | 3,702 | 6,027 | (1,277 | ) | 6,862 | |||||||||||||||
HSBC USA21 | (12,432 | ) | 937 | (18,353 | ) | 1,648 | ||||||||||||||
Total of HSBC’s other principal entities24 | 2,875 | 6,123 | (1,522 | ) | 7,310 | |||||||||||||||
Reverse repo, repo, stock borrowing, stock lending and outright short positions (including intra-Group) | ||||||||||||||||||||
HSBC UK liquidity group19 | (16,861 | ) | 1,313 | (16,070 | ) | 11,551 | ||||||||||||||
The Hongkong and Shanghai Banking Corporation20 | 15,068 | 12,326 | 8,139 | 8,189 | ||||||||||||||||
HSBC USA21 | 19,431 | – | (4,928 | ) | – | |||||||||||||||
Total of HSBC’s other principal entities24 | (22,571 | ) | 5,240 | (33,235 | ) | (11,528 | ) | |||||||||||||
For footnotes, see page 191.
Contingent liquidity risk arising from committed lending facilities
The Group’s operating entities provide commitments to various counterparties. The most significant liquidity risk relates to committed lending facilities which, whilst undrawn, give rise to contingent liquidity risk as they could be drawn during a period of liquidity stress. Commitments are given to customers and committed lending facilities are provided to consolidated multi-seller conduits established to enable clients to access flexible market-based sources of finance (see page 442), consolidated securities investment conduits and third-party sponsored conduits.
The consolidated securities investment conduits include Solitaire Funding Limited (‘Solitaire’) and Mazarin Funding Limited (‘Mazarin’). They issue asset-backed commercial paper secured against the portfolio of securities held by them. At 31 December 2015, the HSBC UK liquidity group had undrawn committed lending facilities to these conduits of $8.2bn (2014: $11bn), of which Solitaire represented $7.7bn (2014: $9.5bn) and the remaining $0.5bn (2014: $1.6bn) pertained to Mazarin. Although the HSBC UK liquidity
group provides a liquidity facility, Solitaire and Mazarin have no need to draw on it so long as HSBC purchases the commercial paper issued, which it intends to do for the foreseeable future. At 31 December 2015, the commercial paper issued by Solitaire and Mazarin was entirely held by the HSBC UK liquidity group. Since HSBC controls the size of the portfolio of securities held by these conduits, no contingent liquidity risk exposure arises as a result of these undrawn committed lending facilities.
The table below shows the level of undrawn commitments to customers outstanding for the five largest single facilities and the largest market sector, and the extent to which they are undrawn.
The Group’s contractual undrawn exposures at 31 December monitored under the contingent liquidity risk limit structure
(Audited)
| HSBC UK liquidity group19 | HSBC USA21 | HSBC Canada22 | The Hongkong and Shanghai Banking Corporation20 | |||||||||||||||||||||||||||||||||||||
| 2015 | 2014 | 2015 | 2014 | 2015 | 2014 | 2015 | 2014 | |||||||||||||||||||||||||||||||||
| $bn | $bn | $bn | $bn | $bn | $bn | $bn | $bn | |||||||||||||||||||||||||||||||||
Commitments to conduits | ||||||||||||||||||||||||||||||||||||||||
Consolidated multi-seller conduits | ||||||||||||||||||||||||||||||||||||||||
– total lines | 13.4 | 9.8 | 3.3 | 2.3 | 0.2 | 0.2 | – | – | ||||||||||||||||||||||||||||||||
– largest individual lines | 0.4 | 0.9 | 0.5 | 0.5 | 0.1 | 0.2 | – | – | ||||||||||||||||||||||||||||||||
Consolidated securities investment conduits – total lines | 8.2 | 11.1 | – | – | – | – | – | – | ||||||||||||||||||||||||||||||||
Third-party conduits – total lines | – | – | 0.1 | 0.1 | – | – | – | – | ||||||||||||||||||||||||||||||||
Commitments to customers | ||||||||||||||||||||||||||||||||||||||||
– five largest26 | 4.9 | 2.6 | 6.4 | 7.1 | 1.4 | 1.7 | 1.7 | 1.5 | ||||||||||||||||||||||||||||||||
– largest market sector27 | 17.9 | 16.6 | 9.7 | 10.0 | 3.4 | 3.5 | 3.4 | 3.2 | ||||||||||||||||||||||||||||||||
For footnotes, see page 191.
(Audited)
Our primary sources of funding are customer current accounts and customer savings deposits payable on demand or at short notice. We issue wholesale securities (secured and unsecured) to supplement our customer deposits and change the currency mix, maturity profile or location of our liabilities.
The ‘Funding sources and uses’ table below, which provides a consolidated view of how our balance sheet is funded, should be read in light of the LFRF, which requires operating entities to manage liquidity and funding risk on a stand-alone basis.
The table analyses our consolidated balance sheet according to the assets that primarily arise from operating activities and the sources of funding primarily supporting these activities. The assets and liabilities that do not arise from operating activities are presented as a net balancing source or deployment of funds.
HSBC HOLDINGS PLC
159 |
Table of Contents
Report of the Directors: Risk(continued)
Liquidity and funding
The level of customer accounts continued to exceed the level of loans and advances to customers. The positive funding gap was predominantly deployed in liquid assets (cash and balances with central banks and financial investments) as required by the LFRF.
Loans and other receivables due from banks continued to exceed deposits taken from banks. The Group remained a net unsecured lender to the banking sector.
For a summary of sources and utilisation of repos and stock lending, see the Appendix to Risk on page 208.
| 2015 | 2014 | |||||||||||
| $m | $m | |||||||||||
Sources | ||||||||||||
Customer accounts | 1,289,586 | 1,350,642 | ||||||||||
Deposits by banks | 54,371 | 77,426 | ||||||||||
Repurchase agreements – non-trading | 80,400 | 107,432 | ||||||||||
Debt securities issued | 88,949 | 95,947 | ||||||||||
Liabilities of disposal groups held for sale | 36,840 | 6,934 | ||||||||||
Subordinated liabilities | 22,702 | 26,664 | ||||||||||
Financial liabilities designated at fair value | 66,408 | 76,153 | ||||||||||
Liabilities under insurance contracts | 69,938 | 73,861 | ||||||||||
Trading liabilities | 141,614 | 190,572 | ||||||||||
– repos | 442 | 3,798 | ||||||||||
– stock lending | 8,859 | 12,032 | ||||||||||
– settlement accounts | 10,530 | 17,454 | ||||||||||
– other trading liabilities | 121,783 | 157,288 | ||||||||||
Total equity | 197,518 | 199,978 | ||||||||||
At 31 December | 2,048,326 | 2,205,609 | ||||||||||
Uses | ||||||||||||
Loans and advances to customers | 924,454 | 974,660 | ||||||||||
Loans and advances to banks | 90,401 | 112,149 | ||||||||||
Repurchase agreements – non-trading | 146,255 | 161,713 | ||||||||||
Assets held for sale | 43,900 | 7,647 | ||||||||||
Trading assets | 224,837 | 304,193 | ||||||||||
– reverse repos | 438 | 1,297 | ||||||||||
– stock borrowing | 7,118 | 7,969 | ||||||||||
– settlement accounts | 12,127 | 21,327 | ||||||||||
– other trading assets | 205,154 | 273,600 | ||||||||||
Financial investments | 428,955 | 415,467 | ||||||||||
Cash and balances with central banks | 98,934 | 129,957 | ||||||||||
Net deployment in other balance sheet assets and liabilities | 90,590 | 99,823 | ||||||||||
At 31 December | 2,048,326 | 2,205,609 | ||||||||||
For footnote, see page 191.
Cross-border, intra-Group and cross-currency liquidity and funding risk
The stand-alone operating entity approach to liquidity and funding mandated by the LFRF restricts the exposure of our operating entities to the risks that can arise from extensive reliance on cross-border funding. Operating entities manage their funding sources locally, focusing predominantly on the local customer deposit base. The RBWM, CMB and GPB customer relationships that give rise to core deposits within an operating entity generally reflect a local customer relationship with that operating entity. Access to public debt markets is coordinated globally by the Global Head of Balance Sheet Management and the Group Treasurer with
Group ALCO monitoring all planned public debt issuance on a monthly basis. As a general principle, operating entities are only permitted to issue in their local currency and are encouraged to focus on local private placements. The public issuance of debt instruments in foreign currency is tightly controlled and generally restricted to HSBC Holdings plc and HSBC Bank plc.
A central principle of our stand-alone approach to LFRF is that operating entities place no future reliance on other Group entities. However, operating entities may, at their discretion, utilise their respective committed facilities from other Group entities if necessary. In addition, intra-Group large exposure limits are applied by national regulators to individual legal entities locally, which restricts the unsecured exposures of legal entities to the rest of the Group to a percentage of the lender’s regulatory capital.
Our LFRF also considers the ability of each entity to continue to access foreign exchange markets under stress when a surplus in one currency is used to meet a deficit in another currency, for example, by using the foreign currency swap markets. Where appropriate, operating entities are required to monitor stressed coverage ratios and ACF ratios for non-local currencies and set limits for them. Foreign currency swap markets in currency pairs settled through the Continuous Link Settlement Bank are considered to be extremely deep and liquid and it is assumed that capacity to access these markets is not exposed to idiosyncratic risks. The table below shows the ACF ratios by material currencies for the year ended 31 December 2015.
Advances to core funding ratios by material currency23
At 31 December | ||||||
| 2015 | ||||||
| % | ||||||
HSBC UK liquidity group19 | ||||||
Local currency (sterling) | 98 | |||||
US dollars | 128 | |||||
Euros | 111 | |||||
Consolidated | 101 | |||||
The Hongkong and Shanghai Banking Corporation20 | ||||||
Local currency (Hong Kong dollars) | 76 | |||||
US dollars | 60 | |||||
Consolidated | 69 | |||||
HSBC USA21 | ||||||
Local currency (US dollars) | 89 | |||||
Consolidated | 89 | |||||
Total of HSBC’s other principal entities24 | ||||||
Local currency | 96 | |||||
US dollars | 89 | |||||
Consolidated | 91 | |||||
For footnotes, see page 191.
For all HSBC’s operating entities, the only material currencies (those that exceed 5% of Group balance sheet liabilities) are the Hong Kong dollar, euro, sterling and US dollar.
HSBC HOLDINGS PLC
160 |
Table of Contents
Wholesale funding cash flows payable by HSBC under financial liabilities by remaining contractual maturities
Due not more than 1 month | Due over 1 month but not more than 3 months | Due over 3 months but not more than 6 months | Due over 6 months but not more than 9 months | Due over 9 months but not more than 1 year | Due over 1 year but not more than 2 years | Due over 2 years but not more than 5 years | Due over 5 years | Total | ||||||||||||||||||||||||||||||||||||||||||||||
| $m | $m | $m | $m | $m | $m | $m | $m | $m | ||||||||||||||||||||||||||||||||||||||||||||||
Debt securities issued | 19,447 | 11,803 | 20,565 | 6,712 | 5,274 | 20,150 | 43,463 | 27,398 | 154,812 | |||||||||||||||||||||||||||||||||||||||||||||
– unsecured CDs and CP | 5,830 | 8,426 | 11,250 | 2,944 | 1,224 | 955 | 108 | 10 | 30,747 | |||||||||||||||||||||||||||||||||||||||||||||
– unsecured senior MTNs | 4,229 | 2,240 | 7,130 | 2,687 | 1,711 | 10,850 | 27,239 | 18,407 | 74,493 | |||||||||||||||||||||||||||||||||||||||||||||
– unsecured senior structured notes | 883 | 964 | 1,544 | 875 | 2,166 | 4,158 | 9,741 | 5,262 | 25,593 | |||||||||||||||||||||||||||||||||||||||||||||
– secured covered bonds | – | – | – | – | – | 2,074 | 1,619 | 2,577 | 6,270 | |||||||||||||||||||||||||||||||||||||||||||||
– secured asset-backed commercial paper | 8,414 | – | – | – | – | – | – | – | 8,414 | |||||||||||||||||||||||||||||||||||||||||||||
– secured ABS | 20 | 173 | 195 | 206 | 173 | 313 | 1,554 | 114 | 2,748 | |||||||||||||||||||||||||||||||||||||||||||||
– others | 71 | – | 446 | – | – | 1,800 | 3,202 | 1,028 | 6,547 | |||||||||||||||||||||||||||||||||||||||||||||
Subordinated liabilities | – | 816 | – | – | 34 | 648 | 6,826 | 34,423 | 42,747 | |||||||||||||||||||||||||||||||||||||||||||||
– subordinated debt securities | – | – | – | – | 34 | 648 | 6,338 | 32,494 | 39,514 | |||||||||||||||||||||||||||||||||||||||||||||
– preferred securities | – | 816 | – | – | – | – | 488 | 1,929 | 3,233 | |||||||||||||||||||||||||||||||||||||||||||||
At 31 December 2015 | 19,447 | 12,619 | 20,565 | 6,712 | 5,308 | 20,798 | 50,289 | 61,821 | 197,559 | |||||||||||||||||||||||||||||||||||||||||||||
Debt securities issued | 17,336 | 17,161 | 19,030 | 9,352 | 9,055 | 27,312 | 40,855 | 31,928 | 172,029 | |||||||||||||||||||||||||||||||||||||||||||||
– unsecured CDs and CP | 5,637 | 9,337 | 9,237 | 4,793 | 3,010 | 3,506 | 4,158 | 185 | 39,863 | |||||||||||||||||||||||||||||||||||||||||||||
– unsecured senior MTNs | 1,300 | 5,679 | 7,684 | 2,922 | 4,794 | 17,676 | 23,523 | 20,715 | 84,293 | |||||||||||||||||||||||||||||||||||||||||||||
– unsecured senior structured notes | 1,363 | 1,082 | 2,049 | 1,149 | 979 | 4,757 | 8,444 | 6,789 | 26,612 | |||||||||||||||||||||||||||||||||||||||||||||
– secured covered bonds | – | – | – | 205 | – | – | 2,765 | 2,942 | 5,912 | |||||||||||||||||||||||||||||||||||||||||||||
– secured asset-backed commercial paper | 8,602 | – | – | – | – | – | – | – | 8,602 | |||||||||||||||||||||||||||||||||||||||||||||
– secured ABS | 212 | 1,063 | 60 | 283 | 272 | 915 | 1,562 | – | 4,367 | |||||||||||||||||||||||||||||||||||||||||||||
– others | 222 | – | – | – | – | 458 | 403 | 1,297 | 2,380 | |||||||||||||||||||||||||||||||||||||||||||||
Subordinated liabilities | – | 150 | – | 3 | 185 | 113 | 5,556 | 40,487 | 46,494 | |||||||||||||||||||||||||||||||||||||||||||||
– subordinated debt securities | – | 150 | – | 3 | 185 | 113 | 5,556 | 34,750 | 40,757 | |||||||||||||||||||||||||||||||||||||||||||||
– preferred securities | – | – | – | – | – | – | – | 5,737 | 5,737 | |||||||||||||||||||||||||||||||||||||||||||||
At 31 December 2014 | 17,336 | 17,311 | 19,030 | 9,355 | 9,240 | 27,425 | 46,411 | 72,415 | 218,523 | |||||||||||||||||||||||||||||||||||||||||||||
HSBC HOLDINGS PLC
161 |
Table of Contents
Report of the Directors: Risk(continued)
Liquidity and funding
Wholesale term debt maturity profile
The maturity profile of our wholesale term debt obligations is set out in the table on page 161, ‘Wholesale funding principal cash flows payable by HSBC under financial liabilities by remaining contractual maturities’.
The balances in the table do not agree directly with those in the consolidated balance sheet as the table presents gross cash flows relating to principal payments and not the balance sheet carrying value, which includes debt securities and subordinated liabilities measured at fair value.
Analysis of on-balance sheet encumbered and unencumbered assets and off-balance sheet collateral
On-balance sheet encumbered and unencumbered assets
The table on page 163, ‘Analysis of on-balance sheet encumbered and unencumbered assets’, summarises the total on-balance sheet assets that are capable of supporting future funding and collateral needs and shows the extent to which these assets are currently pledged for this purpose. The objective of this disclosure is to facilitate an understanding of available and unrestricted assets that could be used to support potential future funding and collateral needs.
Under ‘Off-balance sheet collateral’ below we discuss the off-balance sheet collateral received and re-pledged, and the level of available unencumbered off-balance sheet collateral.
The disclosure is not designed to identify assets which would be available to meet the claims of creditors or to predict assets that would be available to creditors in the event of a resolution or bankruptcy.
The table has been significantly updated since 2014 following the issuance of a ‘Dear CFO’ letter by the PRA, and acknowledgement by the Enhanced Disclosure Task Force that its Recommendation 19 and Figure 5 could be met without providing disclosure that has the potential to reveal the use or non-use of emergency liquidity assistance provided by central banks on a confidential basis. There are two key changes. The first is to segregate out any assets
positioned with central banks for the specific purpose of emergency liquidity provision irrespective of whether any liquidity has actually been drawn and assets encumbered. The second is to include an analysis of the source of encumbrance for those assets reported as encumbered.
An asset is defined as encumbered if it has been pledged as collateral against an existing liability and, as a result, is no longer available to the Group to secure funding, satisfy collateral needs or be sold to reduce our funding requirement. An asset is therefore categorised as unencumbered if it has not been pledged against an existing liability. Unencumbered assets are further analysed into four separate sub-categories: ‘Readily realisable assets’, ‘Other realisable assets’, ‘Reverse repo/stock borrowing receivables and derivative assets’ and ‘Cannot be pledged as collateral’.
For a summary of our policy on collateral management and definition of encumbrance, see the Appendix to Risk on page 209.
Off-balance sheet collateral received and pledged for reverse repo, stock borrowing and derivative transactions
The fair value of assets accepted as collateral that we are permitted to sell or repledge in the absence of default was $228bn at 31 December 2015 (2014: $257bn). The fair value of any such collateral actually sold or repledged was $150bn (2014: $176bn). We are obliged to return equivalent securities. These transactions are conducted under terms that are usual and customary to standard reverse repo, stock borrowing and derivative transactions.
The fair value of collateral received and repledged in relation to reverse repos, stock borrowing and derivatives is reported on a gross basis. The related balance sheet receivables and payables are reported on a net basis where required under IFRSs offset criteria.
As a consequence of reverse repo, stock borrowing and derivative transactions where the collateral received could be but had not been sold or repledged, we held $78bn (2014: $81bn) of unencumbered collateral available to support potential future funding and collateral needs at 31 December 2015.
HSBC HOLDINGS PLC
162 |
Table of Contents
Analysis of on-balance sheet encumbered and unencumbered assets
| Assets encumbered as a result of transactions with counterparties other than central banks | Unencumbered assets not positioned at central banks | |||||||||||||||||||||||||||||||||||||||||||||||||||||
As a covered bonds | As a result of securitisations | Other | Assets positioned at central banks (i.e. pre- positioned plus | Assets readily available for encumbrance | Other assets capable encumbered | Reverse repos/stock borrowing receivables and derivative assets | Assets that cannot be encumbered | Total | ||||||||||||||||||||||||||||||||||||||||||||||
| $m | $m | $m | $m | $m | $m | $m | $m | $m | ||||||||||||||||||||||||||||||||||||||||||||||
Cash and balances at central banks | – | – | – | 98 | 95,545 | 350 | – | 2,941 | 98,934 | |||||||||||||||||||||||||||||||||||||||||||||
Items in the course of collection from other banks | – | – | – | – | – | – | – | 5,768 | 5,768 | |||||||||||||||||||||||||||||||||||||||||||||
Hong Kong Government certificates of indebtedness | – | – | – | – | – | – | – | 28,410 | 28,410 | |||||||||||||||||||||||||||||||||||||||||||||
Trading assets | – | – | 31,605 | 1,573 | 138,070 | 8,269 | 7,520 | 37,800 | 224,837 | |||||||||||||||||||||||||||||||||||||||||||||
– Treasury and other eligible bills | – | – | 1,099 | 984 | 5,618 | 128 | – | – | 7,829 | |||||||||||||||||||||||||||||||||||||||||||||
– Debt securities | – | – | 25,890 | 492 | 72,377 | 233 | – | 46 | 99,038 | |||||||||||||||||||||||||||||||||||||||||||||
– Equity securities | – | – | 4,616 | – | 59,430 | 2,445 | – | – | 66,491 | |||||||||||||||||||||||||||||||||||||||||||||
– Loans and advances to banks | – | – | – | – | 456 | 2,890 | 2,763 | 16,194 | 22,303 | |||||||||||||||||||||||||||||||||||||||||||||
– Loans and advances to customers | – | – | – | 97 | 189 | 2,573 | 4,757 | 21,560 | 29,176 | |||||||||||||||||||||||||||||||||||||||||||||
Financial assets designated at fair value | – | – | – | – | 1,775 | 1,244 | – | 20,833 | 23,852 | |||||||||||||||||||||||||||||||||||||||||||||
– Treasury and other eligible bills | – | – | – | – | 258 | – | – | 138 | 396 | |||||||||||||||||||||||||||||||||||||||||||||
– Debt securities | – | – | – | – | 1,327 | 265 | – | 2,749 | 4,341 | |||||||||||||||||||||||||||||||||||||||||||||
– Equity securities | – | – | – | – | 178 | 979 | – | 17,838 | 18,995 | |||||||||||||||||||||||||||||||||||||||||||||
– Loans and advances to banks and customers | – | – | – | – | 12 | – | – | 108 | 120 | |||||||||||||||||||||||||||||||||||||||||||||
Derivatives | – | – | – | – | – | – | 288,476 | – | 288,476 | |||||||||||||||||||||||||||||||||||||||||||||
Loans and advances to banks | – | 1,329 | – | 1,702 | 2,054 | 61,992 | 815 | 22,509 | 90,401 | |||||||||||||||||||||||||||||||||||||||||||||
Loans and advances to customers | 6,947 | 15,288 | 6,848 | 20,683 | 60,031 | 792,650 | 1,531 | 20,476 | 924,454 | |||||||||||||||||||||||||||||||||||||||||||||
Reverse repurchase agreements - non-trading | – | – | – | – | – | – | 146,255 | – | 146,255 | |||||||||||||||||||||||||||||||||||||||||||||
Financial investments | – | – | 25,078 | 8,150 | 325,101 | 14,753 | – | 55,873 | 428,955 | |||||||||||||||||||||||||||||||||||||||||||||
– Treasury and other eligible bills | – | – | 509 | 3,675 | 98,866 | 1,177 | – | 324 | 104,551 | |||||||||||||||||||||||||||||||||||||||||||||
– Debt securities | – | – | 24,561 | 4,475 | 224,355 | 11,124 | – | 54,054 | 318,569 | |||||||||||||||||||||||||||||||||||||||||||||
– Equity securities | – | – | 8 | – | 1,880 | 2,452 | – | 1,495 | 5,835 | |||||||||||||||||||||||||||||||||||||||||||||
Prepayments, accrued income and other assets | – | – | 63 | – | 4,685 | 65,190 | – | 28,360 | 98,298 | |||||||||||||||||||||||||||||||||||||||||||||
Current tax assets | – | – | – | – | – | – | – | 1,221 | 1,221 | |||||||||||||||||||||||||||||||||||||||||||||
Interest in associates and joint ventures | – | – | – | – | 51 | 18,794 | – | 294 | 19,139 | |||||||||||||||||||||||||||||||||||||||||||||
Goodwill and intangible assets | – | – | – | – | – | – | – | 24,605 | 24,605 | |||||||||||||||||||||||||||||||||||||||||||||
Deferred tax | – | – | – | – | – | – | – | 6,051 | 6,051 | |||||||||||||||||||||||||||||||||||||||||||||
At 31 December 2015 | 6,947 | 16,617 | 63,594 | 32,206 | 627,312 | 963,242 | 444,597 | 255,141 | 2,409,656 | |||||||||||||||||||||||||||||||||||||||||||||
HSBC HOLDINGS PLC
163 |
Table of Contents
Report of the Directors: Risk(continued)
Liquidity and funding
Additional contractual obligations
Under the terms of our current collateral obligations under derivative contracts (which are ISDA compliant CSA contracts and contracts entered into for pension obligations and exclude the contracts entered for special purpose vehicles and additional termination events), and based on the positions at 31 December 2015, we estimate that we could be required to post additional collateral of up to $0.4bn (2014: $0.5bn) in the event of a one-notch downgrade in credit ratings, which would increase to $0.7bn (2014: $1.2bn) in the event of a two-notch downgrade.
Contractual maturity of financial liabilities
The balances in the table below do not agree directly with those in our consolidated balance sheet as the table incorporates, on an undiscounted basis, all cash flows relating to principal and future coupon payments (except
for trading liabilities and derivatives not treated as hedging derivatives). Undiscounted cash flows payable in relation to hedging derivative liabilities are classified according to their contractual maturities. Trading liabilities and derivatives not treated as hedging derivatives are included in the ‘On demand’ time bucket and not by contractual maturity.
A maturity analysis of repos and debt securities in issue included in trading liabilities is presented in Note 31 on the Financial Statements.
In addition, loans and other credit-related commitments and financial guarantees and similar contracts are generally not recognised on our balance sheet. The undiscounted cash flows potentially payable under financial guarantees and similar contracts are classified on the basis of the earliest date they can be called.
Cash flows payable by HSBC under financial liabilities by remaining contractual maturities
(Audited)
On demand $m | Due within 3 months $m | Due between 3 and 12 months $m | Due between 1 and 5 years $m | Due after 5 years $m | ||||||||||||||||||||||||||
Deposits by banks | 42,182 | 6,643 | 1,452 | 4,029 | 107 | |||||||||||||||||||||||||
Customer accounts | 1,076,595 | 160,368 | 43,289 | 10,964 | 263 | |||||||||||||||||||||||||
Repurchase agreements – non-trading | 13,181 | 64,109 | 2,144 | 535 | 543 | |||||||||||||||||||||||||
Trading liabilities | 141,614 | – | – | – | – | |||||||||||||||||||||||||
Financial liabilities designated at fair value | 327 | 4,077 | 6,149 | 24,642 | 41,365 | |||||||||||||||||||||||||
Derivatives | 276,141 | 255 | 970 | 1,721 | 1,652 | |||||||||||||||||||||||||
Debt securities in issue | 377 | 25,910 | 23,886 | 35,499 | 6,993 | |||||||||||||||||||||||||
Subordinated liabilities | – | 803 | 971 | 10,151 | 28,132 | |||||||||||||||||||||||||
Other financial liabilities | 59,298 | 17,476 | 7,226 | 10,188 | 1,014 | |||||||||||||||||||||||||
| 1,609,715 | 279,641 | 86,087 | 97,729 | 80,069 | ||||||||||||||||||||||||||
Loan and other credit-related commitments | 425,000 | 93,149 | 73,115 | 60,078 | 15,089 | |||||||||||||||||||||||||
Financial guarantees and similar contracts | 12,579 | 5,727 | 15,091 | 9,915 | 2,805 | |||||||||||||||||||||||||
At 31 December 2015 | 2,047,294 | 378,517 | 174,293 | 167,722 | 97,963 | |||||||||||||||||||||||||
Deposits by banks | 52,682 | 17,337 | 3,600 | 3,580 | 390 | |||||||||||||||||||||||||
Customer accounts | 1,088,769 | 187,207 | 61,687 | 15,826 | 390 | |||||||||||||||||||||||||
Repurchase agreements – non-trading | 8,727 | 91,542 | 6,180 | 23 | 1,057 | |||||||||||||||||||||||||
Trading liabilities | 190,572 | – | – | – | – | |||||||||||||||||||||||||
Financial liabilities designated at fair value | 365 | 2,201 | 9,192 | 28,260 | 39,397 | |||||||||||||||||||||||||
Derivatives | 335,168 | 375 | 1,257 | 4,231 | 1,517 | |||||||||||||||||||||||||
Debt securities in issue | 9 | 32,513 | 30,194 | 37,842 | 7,710 | |||||||||||||||||||||||||
Subordinated liabilities | – | 737 | 1,256 | 10,003 | 42,328 | |||||||||||||||||||||||||
Other financial liabilities | 41,517 | 23,228 | 4,740 | 1,893 | 988 | |||||||||||||||||||||||||
| 1,717,809 | 355,140 | 118,106 | 101,658 | 93,777 | ||||||||||||||||||||||||||
Loan and other credit-related commitments | 406,561 | 101,156 | 64,582 | 62,312 | 16,769 | |||||||||||||||||||||||||
Financial guarantees and similar contracts | 13,166 | 6,306 | 13,753 | 9,575 | 4,278 | |||||||||||||||||||||||||
At 31 December 2014 | 2,137,536 | 462,602 | 196,441 | 173,545 | 114,824 | |||||||||||||||||||||||||
HSBC HOLDINGS PLC
164 |
Table of Contents
Liquidity risk in HSBC Holdings is overseen by Holdings ALCO (‘HALCO’). Liquidity risk arises because of HSBC Holdings’ obligation to make payments to debt holders as they fall due. The liquidity risk related to these cash flows is managed by matching external debt obligations with internal loan cash flows and by maintaining an appropriate liquidity buffer that is monitored by HALCO.
At 31 December 2015, the Group had new issuance of $6.8bn of CRD IV compliant non-common equity capital instruments, of which $3.2bn were classified as tier 2 and $3.6bn were classified as additional tier 1 (for details on tier 2 and additional tier 1 instruments see Notes 30 and 35 on the Financial Statements).
The balances in the table below do not agree directly with those on the balance sheet of HSBC Holdings as the table incorporates, on an undiscounted basis, all cash flows relating to principal and future coupon payments (except for derivatives not treated as hedging derivatives). Undiscounted cash flows payable in relation to hedging derivative liabilities are classified according to their contractual maturities. Derivatives not treated as hedging derivatives are included in the ‘On demand’ time bucket.
In addition, loan commitments and financial guarantees and similar contracts are generally not recognised on our balance sheet. The undiscounted cash flows potentially payable under financial guarantees and similar contracts are classified on the basis of the earliest date on which they can be called.
Cash flows payable by HSBC Holdings under financial liabilities by remaining contractual maturities
(Audited)
On demand | Due within 3 months | Due between 3 and 12 | Due between 1 and 5 years | Due after 5 years | ||||||||||||||||||||||||||
| $m | $m | $m | $m | $m | ||||||||||||||||||||||||||
Amounts owed to HSBC undertakings | 257 | 1,375 | 424 | 110 | – | |||||||||||||||||||||||||
Financial liabilities designated at fair value | – | 1,145 | 655 | 5,202 | 20,779 | |||||||||||||||||||||||||
Derivatives | 2,065 | – | – | 213 | – | |||||||||||||||||||||||||
Debt securities in issue | – | 15 | 47 | 250 | 1,176 | |||||||||||||||||||||||||
Subordinated liabilities | – | 229 | 699 | 5,149 | 25,474 | |||||||||||||||||||||||||
Other financial liabilities | – | 1,426 | 152 | – | – | |||||||||||||||||||||||||
| 2,322 | 4,190 | 1,977 | 10,924 | 47,429 | ||||||||||||||||||||||||||
Loan commitments | – | – | – | – | – | |||||||||||||||||||||||||
Financial guarantees and similar contracts | 68,333 | – | – | – | – | |||||||||||||||||||||||||
At 31 December 2015 | 70,655 | 4,190 | 1,977 | 10,924 | 47,429 | |||||||||||||||||||||||||
Amounts owed to HSBC undertakings | 1,441 | 985 | 42 | 449 | – | |||||||||||||||||||||||||
Financial liabilities designated at fair value | – | 210 | 642 | 6,345 | 19,005 | |||||||||||||||||||||||||
Derivatives | 1,066 | – | – | 103 | – | |||||||||||||||||||||||||
Debt securities in issue | – | 16 | 50 | 263 | 1,303 | |||||||||||||||||||||||||
Subordinated liabilities | – | 252 | 770 | 5,815 | 28,961 | |||||||||||||||||||||||||
Other financial liabilities | – | 1,132 | 158 | – | – | |||||||||||||||||||||||||
| 2,507 | 2,595 | 1,662 | 12,975 | 49,269 | ||||||||||||||||||||||||||
Loan commitments | 16 | – | – | – | – | |||||||||||||||||||||||||
Financial guarantees and similar contracts | 52,023 | – | – | – | – | |||||||||||||||||||||||||
At 31 December 2014 | 54,546 | 2,595 | 1,662 | 12,975 | 49,269 | |||||||||||||||||||||||||
HSBC HOLDINGS PLC
165 |
Table of Contents
Report of the Directors: Risk(continued)
Market risk
Market risk
Page
| App1 | Tables | Page | |||||||||
| 167 | ||||||||||||
| 211 | 211 | |||||||||||
| 211 | ||||||||||||
| 212 | ||||||||||||
| 167 | 212 | |||||||||||
| 167 | 212 | |||||||||||
| 167 | 212 | |||||||||||
| 167 | 213 | 213 | ||||||||||
| 167 | 213 | |||||||||||
| 213 | ||||||||||||
| 167 | 168 | |||||||||||
| 168 | ||||||||||||
| 168 | 214 | Back-testing of trading VaR against hypothetical profit and loss for the Group | 168 | |||||||||
| 214 | ||||||||||||
| 214 | ||||||||||||
| 214 | ||||||||||||
| 169 | 214 | |||||||||||
| 169 | 169 | |||||||||||
| 169 | ||||||||||||
| 169 | 215 | 169 | ||||||||||
| 170 | 170 | |||||||||||
| 171 | ||||||||||||
| 171 | 215 | |||||||||||
| 171 | 215 | |||||||||||
| 172 | 215 | |||||||||||
| 216 | ||||||||||||
| 172 | 172 | |||||||||||
| 172 | 216 | 173 | ||||||||||
| 173 | Sensitivity of cash flow hedging reported reserves to interest rate movements | 173 | ||||||||||
| 174 | 216 | |||||||||||
Additional market risk measures applicable only to the parent company | 174 | 216 | ||||||||||
| 174 | 174 | |||||||||||
| 174 | Sensitivity of HSBC Holdings net interest income to interest rate movements | 174 | ||||||||||
| 175 | 175 | |||||||||||
| 1 Appendix to Risk – risk policies and practices. | ||||||||||||
HSBC HOLDINGS PLC
166 |
Table of Contents
Market risk is the risk that movements in market factors, such as foreign exchange rates, interest rates, credit spreads, equity prices and commodity prices, will reduce our income or the value of our portfolios.
There were no material changes to our policies and practices for the management of market risk in 2015.
A summary of our market risk management framework including current policies is provided in the Appendix to Risk on page 210.
Global economic growth remained subdued in 2015, with a number of headwinds present. The slowdown of the mainland Chinese economy dampened global trade flows and caused volatility in currency and global stock markets. Market concerns persist as to the scale of the slowdown and the potential for further depreciation of the renminbi.
Performance among developed markets was uneven, with the US and UK performing better than the eurozone, where the risk of a Greek exit faded in the second half of the year and ECB monetary policy remained supportive. Emerging market economies were affected by falling commodity prices as mainland Chinese demand slowed along with the prospect of monetary policy normalisation in the US. This led to capital outflows from emerging markets and a significant depreciation in several key currencies against the US dollar.
Against this backdrop, we maintained an overall defensive risk profile in our trading businesses. Defensive positions are characterised by low net open positions or the purchase of volatility protection via options trades. Non-trading VaR increased during the year as higher interest rates, especially in US dollars, caused the duration of non-trading assets to increase.
Value at risk of the trading portfolios
Trading VaR predominantly resides within Global Markets. This was lower at 31 December 2015 than at 31 December 2014 due to a decrease in interest rate trading VaR. During the year, trading VaR remained relatively stable trading in a tight range, with the effects of increased market volatility on VaR offset by reduced positions.
The daily levels of total trading VaR over the last year are set out in the graph below.
HSBC HOLDINGS PLC
167 |
Table of Contents
Report of the Directors: Risk(continued)
Market risk
Daily VaR (trading portfolios), 99% 1 day ($m)
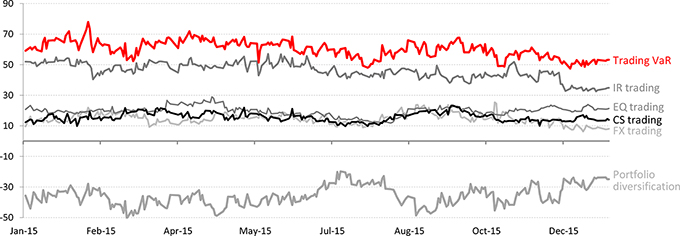
The Group trading VaR for the year is shown in the table below.
(Audited)
| Foreign exchange (FX) | Interest rate | Equity | Credit spread | Portfolio | ||||||||||||||||||||||
| and commodity | (IR) | (EQ) | (CS) | diversification | 30 | Total | 31 | |||||||||||||||||||
| $m | $m | $m | $m | $m | $m | |||||||||||||||||||||
At 31 December 2015 | 8.0 | 34.9 | 21.4 | 13.9 | (24.9 | ) | 53.3 | |||||||||||||||||||
Average | 14.7 | 46.0 | 19.6 | 15.5 | (35.7 | ) | 60.1 | |||||||||||||||||||
Maximum | 25.4 | 57.0 | 29.0 | 23.3 | 77.9 | |||||||||||||||||||||
Minimum | 6.3 | 32.6 | 11.9 | 9.8 | 47.5 | |||||||||||||||||||||
At 31 December 2014 | 9.8 | 45.4 | 7.3 | 12.5 | (14.3 | ) | 60.7 | |||||||||||||||||||
Average | 16.9 | 39.5 | 6.9 | 13.7 | (17.8 | ) | 59.2 | |||||||||||||||||||
Maximum | 34.2 | 50.6 | 15.6 | 20.9 | 77.8 | |||||||||||||||||||||
Minimum | 8.7 | 26.9 | 3.2 | 8.8 | 38.5 | |||||||||||||||||||||
For footnotes, see page 192.
The Risk not in VaR (‘RNIV’) framework captures risks from exposures in the HSBC trading book which are not captured well by the VaR model. For 2015, the VaR-based RNIVs are included within metrics for each asset class whereas in 2014 they were included within portfolio diversification. Adjusting for the impact of the RNIV reclassification, portfolio diversification reduced in comparison to 2014.
In 2015, the Group experienced one profit exception, due primarily to profits from increased volatility in foreign exchange currencies arising from the sharp fall in the Chinese stock market and its effect on global markets.
There was no evidence of model errors or control failures.
The graph below shows the daily trading VaR against hypothetical profit and loss for the Group during 2015. The back-testing result excludes exceptions due from changes in fair value adjustments.
Back-testing of trading VaR against hypothetical profit and loss for the Group ($m)
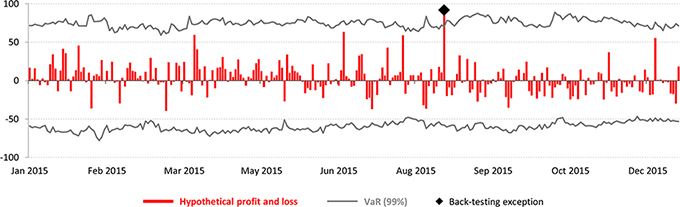
HSBC HOLDINGS PLC
168 |
Table of Contents
Value at risk of the non-trading portfolios
Non-trading VaR of the Group includes contributions from all global businesses. There is no commodity risk in the non-trading portfolios. The increase of non-trading VaR during 2015 was due primarily to the lengthening of the duration in the non-trading book from higher interest rates, especially US rates. There was no overall trend in the non-trading VaR during the year and no significant movements. The increase in non-trading interest rate and credit spread VaR components were offset by an increase in portfolio diversification effects.
Non-trading VaR also includes the interest rate risk of non-trading financial instruments held in portfolios managed by Balance Sheet Management (‘BSM’). The management of interest rate risk in the banking book is described further in ‘Non-trading interest rate risk’ below, including the role of BSM.
Non-trading VaR excludes the insurance operations which are discussed further on page 180.
The daily levels of total non-trading VaR over the last year are set out in the graph below.
Daily VaR (non-trading portfolios), 99% 1 day ($m)
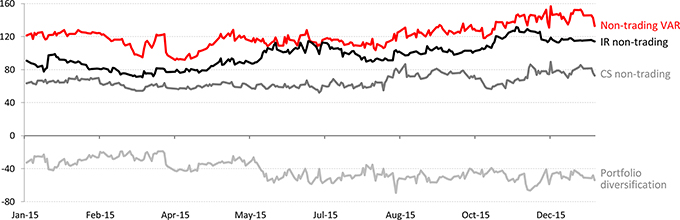
The Group non-trading VaR for the year is shown in the table below.
(Audited)
Interest Rate (IR) | Credit Spread (CS) | Portfolio diversification | Total | |||||||||||||||
| $m | $m | $m | $m | |||||||||||||||
At 31 December 2015 | 114.1 | 72.7 | (54.0 | ) | 132.8 | |||||||||||||
Average | 97.5 | 65.7 | (42.0 | ) | 121.2 | |||||||||||||
Maximum | 131.5 | 89.4 | 156.8 | |||||||||||||||
Minimum | 70.5 | 52.1 | 91.5 | |||||||||||||||
At 31 December 2014 | 88.2 | 62.5 | (28.5 | ) | 122.2 | |||||||||||||
Average | 103.3 | 73.3 | (37.4 | ) | 139.2 | |||||||||||||
Maximum | 147.7 | 91.9 | 189.0 | |||||||||||||||
Minimum | 83.3 | 49.6 | 92.3 | |||||||||||||||
Non-trading VaR excludes equity risk on available-for-sale securities, structural foreign exchange risk and interest rate risk on fixed-rate securities issued by HSBC Holdings. This section and the sections below describe the scope of HSBC’s management of market risks in non-trading books.
Equity securities classified as available for sale
Fair value of equity securities
(Audited)
| 2015 | 2014 | |||||||||||
| $bn | $bn | |||||||||||
Private equity holdings32 | 1.9 | 2.0 | ||||||||||
Investment to facilitate ongoing business33 | 1.9 | 1.2 | ||||||||||
Other strategic investments | 2.1 | 7.5 | ||||||||||
At 31 December | 5.9 | 10.7 | ||||||||||
For footnotes, see page 192.
HSBC HOLDINGS PLC
169 |
Table of Contents
Report of the Directors: Risk(continued)
Market risk
The table above sets out the maximum possible loss on shareholders’ equity from available-for-sale equity securities. The fair value of equity securities classified as available for sale reduced from $10.7bn to $5.9bn. The decrease in Other strategic investments was largely due to the disposal of the Industrial Bank investment.
Market risk balance sheet linkages
The information below and on page 171 aims to facilitate an understanding of linkages between line items in the balance sheet and positions included in our market risk disclosures, in line with recommendations made by the Enhanced Disclosure Task Force.
Balances included and not included in trading VaR
| Balance sheet | Balances included in trading VaR | Balances not included in trading VaR | Primary market risk sensitivities | |||||||||||||||
| $m | $m | $m | ||||||||||||||||
At 31 December 2015 | ||||||||||||||||||
Assets | ||||||||||||||||||
Cash and balances at central banks | 98,934 | 98,934 | B | |||||||||||||||
Trading assets | 224,837 | 203,194 | 21,643 | A | ||||||||||||||
Financial assets designated at fair value | 23,852 | 23,852 | A | |||||||||||||||
Derivatives | 288,476 | 282,972 | 5,504 | A | ||||||||||||||
Loans and advances to banks | 90,401 | 90,401 | B | |||||||||||||||
Loans and advances to customers | 924,454 | 924,454 | B | |||||||||||||||
Reverse repurchase agreements – non-trading | 146,255 | 146,255 | C | |||||||||||||||
Financial investments | 428,955 | 428,955 | A | |||||||||||||||
Liabilities | ||||||||||||||||||
Deposits by banks | 54,371 | 54,371 | B | |||||||||||||||
Customer accounts | 1,289,586 | 1,289,586 | B | |||||||||||||||
Repurchase agreements – non-trading | 80,400 | 80,400 | C | |||||||||||||||
Trading liabilities | 141,614 | 130,427 | 11,187 | A | ||||||||||||||
Financial liabilities designated at fair value | 66,408 | 66,408 | A | |||||||||||||||
Derivatives | 281,071 | 275,007 | 6,064 | A | ||||||||||||||
Debt securities in issue | 88,949 | 88,949 | C | |||||||||||||||
The table represents account lines where there is some exposure to market risk according to the following asset classes:
| A | Foreign exchange, interest rate, equity and credit spread. |
| B | Foreign exchange and interest rate. |
| C | Foreign exchange, interest rate and credit spread. |
The table above splits the assets and liabilities into two categories:
| • | those that are included in the trading book and are measured by VaR; and |
| • | those that are not in the trading book and/or are not measured by VaR. |
The breakdown of financial instruments included and not included in trading VaR provides a linkage with market risk to the extent that it is reflected in our risk framework.
However, it is important to highlight that the table does not reflect how we manage market risk, since we do not discriminate between assets and liabilities in our VaR model.
The assets and liabilities included in trading VaR give rise to a large proportion of the income included in net trading income. As set out on page 54, HSBC’s net trading income in 2015 was $8,723m (2014: $6,760m). Adjustments to trading income such as valuation adjustments do not feed the trading VaR model.
HSBC HOLDINGS PLC
170 |
Table of Contents
Market risk linkages to the accounting balance sheet
Trading assets and liabilities
The Group’s trading assets and liabilities are in almost all cases originated by GB&M. The assets and liabilities are classified as held for trading if they have been acquired or incurred principally for the purpose of selling or repurchasing in the near term, or form part of a portfolio of identified financial instruments that are managed together and for which there is evidence of a recent pattern of short-term profit-taking. These assets and liabilities are treated as traded risk for the purposes of market risk management, other than a limited number of exceptions, primarily in Global Banking where the short-term acquisition and disposal of the assets are linked to other non-trading related activities such as loan origination.
Financial assets designated at fair value
Financial assets designated at fair value within HSBC are predominantly held within the Insurance entities. The majority of these assets are linked to policyholder liabilities for either unit-linked or insurance and investment contracts with DPF. The risks of these assets largely offset the market risk on the liabilities under the policyholder contracts, and are risk managed on a non-trading basis.
Financial liabilities designated at fair value
Financial liabilities designated at fair value within HSBC are primarily fixed-rate securities issued by HSBC entities for funding purposes. An accounting mismatch would arise if the debt securities were accounted for at amortised cost because the derivatives which economically hedge market risks on the securities would be accounted for at fair value with changes recognised in the income statement. The market risks of these liabilities are treated as non-traded risk, the principal risks being interest rate and/or foreign exchange risks. We also incur liabilities to customers under investment contracts, where the liabilities on unit-linked contracts are based on the fair value of assets within the unit-linked funds. The exposures on these funds are treated as non-traded risk and the principal risks are those of the underlying assets in the funds.
Derivative assets and liabilities
We undertake derivative activity for three primary purposes; to create risk management solutions for clients, to manage the portfolio risks arising from client business and to manage and hedge our own risks. Most of our derivative exposures arise from sales and trading activities within GB&M and are treated as traded risk for market risk management purposes. Within derivative assets and liabilities there are portfolios of derivatives which are not risk managed on a trading intent basis and are treated as non-traded risk for VaR measurement | purposes. These arise when the derivative was entered into in order to manage risk arising from non-traded exposures. They include non-qualifying hedging derivatives and derivatives qualifying for fair value and cash flow hedge accounting. The use of non-qualifying hedges whose primary risks relate to interest rate and foreign exchange exposure is described on page 171. Details of derivatives in fair value and cash flow hedge accounting relationships are given in Note 16 on the Financial Statements. Our primary risks in respect of these instruments relate to interest rate and foreign exchange risks.
Loans and advances to customers
The primary risk on assets within loans and advances to customers is the credit risk of the borrower. The risk of these assets is treated as non-trading risk for market risk management purposes.
Financial investments
Financial investments include assets held on an available-for-sale and held-to-maturity basis. An analysis of the Group’s holdings of these securities by accounting classification and issuer type is provided in Note 17 on the Financial Statements and by business activity on page 398. The majority of these securities are mainly held within Balance Sheet Management in GB&M. The positions which are originated in order to manage structural interest rate and liquidity risk are treated as non-trading risk for the purposes of market risk management. Available-for-sale security holdings within insurance entities are treated as non-trading risk and are largely held to back non-linked insurance policyholder liabilities.
The other main holdings of available-for-sale assets are the ABSs within GB&M’s legacy credit business, which are treated as non-trading risk for market risk management purposes, the principal risk being the credit risk of the obligor.
The Group’s held-to-maturity securities are principally held within the Insurance business. Risks of held-to-maturity assets are treated as non-trading for risk management purposes.
Repurchase (repo) and reverse repurchase (reverse repo) agreements non-trading
Reverse repo agreements, classified as assets, are a form of collateralised lending. HSBC lends cash for the term of the reverse repo in exchange for receiving collateral (normally in the form of bonds).
Repo agreements, classified as liabilities, are the opposite of reverse repos, allowing HSBC to obtain funding by providing collateral to the lender.
Both transaction types are treated as non-trading risk for market risk management and the primary risk is counterparty credit risk.
| |
For information on the accounting policies applied to financial instruments at fair value, see Note 13 on the Financial Statements.
Structural foreign exchange exposures
For our policies and procedures for managing structural foreign exchange exposures, see page 215 of the Appendix to Risk.
For details of structural foreign exchange exposures see Note 33 on the Financial Statements.
Non-trading interest rate risk
For our policies regarding the funds transfer pricing process for non-trading interest rate risk and liquidity and funding risk, see page 207 of the Appendix to Risk.
Asset, Liability and Capital Management (‘ALCM’) is responsible for measuring and controlling non-trading interest rate risk under the supervision of the RMM. Its primary responsibilities are:
| • | to define the rules governing the transfer of non-trading interest rate risk from the global businesses to BSM; |
| • | to define the rules governing the interest rate risk behaviouralisation applied to non-trading assets/ liabilities (see below); |
| • | to ensure that all market interest rate risk that can be neutralised is transferred from the global businesses to BSM; and |
HSBC HOLDINGS PLC
171 |
Table of Contents
Report of the Directors: Risk(continued)
Market risk
| • | to define the rules and metrics for monitoring the residual interest rate risk in the global businesses, including any market risk that cannot be neutralised. |
The different types of non-trading interest rate risk and the controls which we use to quantify and limit exposure to these risks can be categorised as follows:
| • | risk which is transferred to BSM and managed by BSM within a defined market risk mandate, predominantly through the use of fixed-rate liquid assets (government bonds) held in held to maturity or available-for-sale portfolios and/or interest rate derivatives which are part of fair value hedging or cash flow hedging relationships. This non-trading interest rate risk is reflected in non-trading VaR, as well as in our net interest income (see below) or economic value of equity (‘EVE’) sensitivity; |
| • | risk which remains outside BSM because it cannot be hedged or which arises due to our behaviouralised transfer pricing assumptions. This risk is not reflected in non-trading VaR, but is captured by our net interest income or EVE sensitivity and corresponding limits are part of our global and regional risk appetite statements for non-trading interest rate risk. A typical example would be margin compression created by unusually low rates in key currencies; |
| • | basis risk which is transferred to BSM when it can be hedged. Any residual basis risk remaining in the global businesses is reported to ALCO. This risk is not reflected in non-trading VaR, but is captured by our net interest income or EVE sensitivity. A typical example would be a managed rate savings product transfer-priced using a Libor-based interest rate curve; and |
| • | model risks which cannot be captured by non-trading VaR, net interest income or EVE sensitivity, but are controlled by our stress testing framework. A typical example would be prepayment risk on residential mortgages or pipeline risk. |
Interest rate risk behaviouralisation
For our policies regarding interest risk behaviouralisation, see page 215 of the Appendix to Risk.
Third-party assets in Balance Sheet Management
For our BSM governance framework, see page 216 of the Appendix to Risk.
Third-party assets in BSM decreased by 9% during 2015. Deposits with central banks reduced by $32bn, predominantly in North America and Europe, in line with reduced repo and reverse repo activity. This reduced activity is also reflected in a reduction of $29bn in non-trading reverse repurchase agreements. Financial investments increased by $29bn mainly due to increased deployment of funds into securities in Asia.
Third-party assets in Balance Sheet Management
| 2015 $m | 2014 $m | |||||||||||
Cash and balances at central banks | 71,116 | 103,008 | ||||||||||
Trading assets | 639 | 4,610 | ||||||||||
Loans and advances: | ||||||||||||
– to banks | 42,059 | 53,842 | ||||||||||
– to customers | 2,773 | 1,931 | ||||||||||
Reverse repurchase agreements | 29,760 | 59,172 | ||||||||||
Financial investments | 335,543 | 306,763 | ||||||||||
Other | 4,277 | 2,470 | ||||||||||
At 31 December | 486,167 | 531,796 | ||||||||||
Sensitivity of net interest income
The table on the next page sets out the effect on our accounting net interest income (excluding insurance) projections of a series of four quarterly parallel shocks of 25 basis points to the current market-implied path of interest rates worldwide at the beginning of each quarter from 1 January 2016. The sensitivities shown represent the change in the expected base case net interest income that would be expected under the two rate scenarios assuming that all other non-interest rate risk variables remain constant, and there are no management actions. In deriving our base case net interest income projections, the re-pricing rates of assets and liabilities used are derived from current yield curves, thereby reflecting current market expectations of the future path of interest rates. The scenarios therefore represent interest rate shocks which occur to the current market implied path of rates. The interest rate sensitivities are indicative and based on simplified scenarios. The limitations of this analysis are discussed in the Appendix to Risk on page 216.
Assuming no management response, a sequence of such rises (‘up-shock’) would increase expected net interest income for 2016 by $1,251m (2015: $885m), while a sequence of such falls (‘down-shock’) would decrease planned net interest income by $2,258m (2015: $2,089m).
The net interest income (‘NII’) sensitivity of the Group can be split into three key components; the structural sensitivity arising from the four global businesses excluding BSM and Markets, the sensitivity of the funding of the trading book (Markets) and the sensitivity of BSM.
The structural sensitivity is positive in a rising rate environment and negative in a falling rate environment. The sensitivity of the funding of the trading book is negative in a rising rate environment and positive in a falling rate environment, and in terms of the impact on profit the change in NII would be expected to be offset by a similar change in net trading income. The sensitivity of BSM will depend on its position. Typically, assuming no management response, the sensitivity of BSM is negative in a rising rate environment and positive in a falling rate environment.
The NII sensitivity figures on the next page also incorporate the effect of any interest rate behaviouralisation applied and the effect of any assumed repricing across products under the specific interest rate scenario. They do not incorporate the effect of any management decision to change the HSBC balance sheet composition.
HSBC HOLDINGS PLC
172 |
Table of Contents
See page 215 in the Risk Appendix for more information about interest rate behaviouralisation and the role of BSM.
The NII sensitivity in BSM arises from a combination of the techniques that BSM use to mitigate the transferred interest rate risk and the methods they use to optimise net revenues in line with their defined risk mandate. The figures in the table below do not incorporate the effect of any management decisions within BSM, but in reality it is likely that there would be some short-term adjustment in BSM positioning to offset the NII effects of the specific interest rate scenario where necessary.
The NII sensitivity arising from the funding of the trading book is comprised of the expense of funding trading assets, while the revenue from these trading assets is reported in net trading income. This leads to an asymmetry in the NII sensitivity figures which is cancelled out in our global business results, where we include both net interest income and net trading income. It is likely, therefore, that the overall effect on profit before tax of the funding of the trading book will be much less pronounced than shown in the figures below.
Sensitivity of net interest income34
(Audited)
US dollar bloc $m | Rest of Americas bloc $m | Hong Kong dollar bloc $m | Rest of Asia bloc $m | Sterling bloc $m | Euro bloc $m | Total $m | ||||||||||||||||||||||||
Change in 2015 net interest income arising from a shift in yield curves of: | ||||||||||||||||||||||||||||||
+25 basis points at the beginning of each quarter | 410 | 72 | 217 | 369 | 135 | 49 | 1,251 | |||||||||||||||||||||||
–25 basis points at the beginning of each quarter | (691 | ) | (74 | ) | (645 | ) | (290 | ) | (528 | ) | (30 | ) | (2,258 | ) | ||||||||||||||||
Change in 2014 net interest income arising from a shift in yield curves of: | ||||||||||||||||||||||||||||||
+25 basis points at the beginning of each quarter | 209 | (9 | ) | 245 | 265 | 321 | (146 | ) | 885 | |||||||||||||||||||||
–25 basis points at the beginning of each quarter | (521 | ) | (1 | ) | (494 | ) | (259 | ) | (783 | ) | (31 | ) | (2,089 | ) | ||||||||||||||||
For footnote, see page 191.
These estimates are based on certain assumptions, principally:
| • | all non-interest rate risk variables remain constant; and |
| • | the size and composition of HSBC’s balance sheet remains as it was at 31 December 2015. |
We expect NII to rise in the rising rate scenario and fall in the falling rate scenario. This is due to a structural mismatch between our assets and liabilities (on balance we would expect our assets to reprice more quickly, and to a greater extent, than our liabilities).
We are more sensitive to both up and down shocks relative to 31 December 2014. In the up-shock we benefit from BSM positioning in US dollars. In the down-shock we lose due to larger rate decreases on deployment of US and HK dollar deposits given the higher rate environment.
Sensitivity of capital and reserves
Under CRD IV, available-for-sale (‘AFS’) reserves are
included as part of CET1 capital. We measure the potential downside risk to the CET1 ratio due to interest rate and credit spread risk in the AFS portfolio by the portfolio’s stressed VaR, using a 99% confidence level and an assumed holding period of one quarter. At December 2015, the stressed VaR of the portfolio was $2.8bn.
We monitor the sensitivity of reported cash flow hedging reserves to interest rate movements on a monthly basis by assessing the expected reduction in valuation of cash flow hedges due to parallel movements of plus or minus 100bps in all yield curves. These particular exposures form only a part of our overall interest rate exposures.
The table below describes the sensitivity of our cash flow hedge reported reserves to the stipulated movements in yield curves and the maximum and minimum month-end figures during the year. The sensitivities are indicative and based on simplified scenarios.
Sensitivity of cash flow hedging reported reserves to interest rate movements
| $m | Maximum impact $m | Minimum impact $m | ||||||||||||
At 31 December 2015 | ||||||||||||||
+ 100 basis point parallel move in all yield curves | (1,235 | ) | (1,259 | ) | (1,137 | ) | ||||||||
As a percentage of total shareholders’ equity | (0.66% | ) | (0.67% | ) | (0.60% | ) | ||||||||
– 100 basis point parallel move in all yield curves | 1,224 | 1,232 | 1,133 | |||||||||||
As a percentage of total shareholders’ equity | 0.65% | 0.65% | 0.60% | |||||||||||
At 31 December 2014 | ||||||||||||||
+ 100 basis point parallel move in all yield curves | (1,260 | ) | (1,478 | ) | (1,131 | ) | ||||||||
As a percentage of total shareholders’ equity | (0.66% | ) | (0.78% | ) | (0.60% | ) | ||||||||
– 100 basis point parallel move in all yield curves | 1,232 | 1,463 | 1,126 | |||||||||||
As a percentage of total shareholders’ equity | 0.65% | 0.77% | 0.59% | |||||||||||
HSBC HOLDINGS PLC
173 |
Table of Contents
Report of the Directors: Risk(continued)
Market risk
Defined benefit pension schemes
Market risk arises within our defined benefit pension schemes to the extent that the obligations of the schemes are not fully matched by assets with determinable cash flows.
For details of our defined benefit schemes, including asset allocation, see Note 6 on the Financial Statements, and for pension risk management see page 189.
Additional market risk measures applicable only to the parent company
The principal tools used in the management of market risk are VaR for foreign exchange rate risk and the projected sensitivity of HSBC Holdings’ net interest income to future changes in yield curves and interest rate gap repricing tables for interest rate risk.
Total foreign exchange VaR arising within HSBC Holdings in 2015 was as follows:
HSBC Holdings – foreign exchange VaR
2015 $m | 2014 $m | |||||||||
At 31 December | 45.6 | 29.3 | ||||||||
Average | 42.3 | 42.1 | ||||||||
Minimum | 32.9 | 29.3 | ||||||||
Maximum | 47.1 | 50.0 | ||||||||
The foreign exchange risk largely arises from loans to subsidiaries of a capital nature that are not denominated in the functional currency of either the provider or the recipient and which are accounted for as financial assets. Changes in the carrying amount of these loans due to foreign exchange rate differences are taken directly to HSBC Holdings’ income statement. These loans, and most of the associated foreign exchange exposures, are eliminated on consolidation.
Sensitivity of net interest income
HSBC Holdings monitors NII sensitivity over a five-year time horizon reflecting the longer-term perspective on interest rate risk management appropriate to a financial services holding company. These sensitivities assume that any issuance where HSBC Holdings has an option to reimburse at a future call date is called at this date. The table below sets out the effect on HSBC Holdings’ future NII over a five-year time horizon of incremental 25 basis point parallel falls or rises in all yield curves worldwide at the beginning of each quarter during the 12 months from 1 January 2015.
Assuming no management actions, a sequence of such rises would increase planned NII for the next five years by $247m (2014: increase of $600m), while a sequence of such falls would decrease planned NII by $266m (2014: decrease of $539m).
Sensitivity of HSBC Holdings’ net interest income to interest rate movements34
US dollar bloc | Sterling bloc | Euro bloc | Total | |||||||||||||||
| $m | $m | $m | $m | |||||||||||||||
Change in projected net interest income as at 31 December arising from a shift in yield curves | ||||||||||||||||||
2015 | ||||||||||||||||||
0-1 year | 57 | 15 | – | 72 | ||||||||||||||
2-3 years | 118 | 43 | 7 | 168 | ||||||||||||||
4-5 years | (23 | ) | 43 | (12 | ) | 8 | ||||||||||||
of – 25 basis points at the beginning of each quarter | ||||||||||||||||||
0-1 year | (57 | ) | (14 | ) | (6 | ) | (77 | ) | ||||||||||
2-3 years | (118 | ) | (43 | ) | (22 | ) | (183 | ) | ||||||||||
4-5 years | 23 | (43 | ) | 15 | (5 | ) | ||||||||||||
2014 | ||||||||||||||||||
0-1 year | 78 | 9 | 2 | 89 | ||||||||||||||
2-3 years | 281 | 17 | 34 | 332 | ||||||||||||||
4-5 years | 138 | 17 | 24 | 179 | ||||||||||||||
of – 25 basis points at the beginning of each quarter | ||||||||||||||||||
0-1 year | (58 | ) | (9 | ) | (1 | ) | (68 | ) | ||||||||||
2-3 years | (276 | ) | (16 | ) | (12 | ) | (304 | ) | ||||||||||
4-5 years | (138 | ) | (17 | ) | (12 | ) | (167 | ) | ||||||||||
For footnote, see page 191.
The interest rate sensitivities tabulated above are indicative and based on simplified scenarios. The figures represent hypothetical movements in NII based on our projected yield curve scenarios, HSBC Holdings’ current interest rate risk profile and assumed changes to that profile during the
next five years. Changes to assumptions concerning the risk profile over the next five years can have a significant impact on the NII sensitivity for that period. However, the figures do not take into account the effect of actions that could be taken to mitigate this interest rate risk.
HSBC HOLDINGS PLC
174 |
Table of Contents
Interest rate repricing gap table
The interest rate risk on the fixed-rate securities issued by HSBC Holdings is not included within the Group VaR but is managed on a
re-pricing gap basis. The interest rate re-pricing gap table below analyses the full-term structure of interest rate mismatches within HSBC Holdings’ balance sheet.
Repricing gap analysis of HSBC Holdings
| Total | Up to 1 year | From over 1 to 5 years | From over 5 to 10 years | More than 10 years | Non-interest bearing | |||||||||||||||||||||||||||||||
| $m | $m | $m | $m | $m | $m | |||||||||||||||||||||||||||||||
Cash at bank and in hand: | ||||||||||||||||||||||||||||||||||||
– balances with HSBC undertakings | 242 | 242 | – | – | – | – | ||||||||||||||||||||||||||||||
Derivatives | 2,467 | – | – | – | – | 2,467 | ||||||||||||||||||||||||||||||
Loans and advances to HSBC undertakings | 44,350 | 42,661 | 279 | 405 | – | 1,005 | ||||||||||||||||||||||||||||||
Financial investments in HSBC undertakings | 4,285 | 2,985 | – | 731 | – | 569 | ||||||||||||||||||||||||||||||
Investments in subsidiaries | 97,770 | – | – | – | – | 97,770 | ||||||||||||||||||||||||||||||
Other assets | 1,080 | – | 109 | – | – | 971 | ||||||||||||||||||||||||||||||
Total assets | 150,194 | 45,888 | 388 | 1,136 | 102,782 | |||||||||||||||||||||||||||||||
Amounts owed to HSBC undertakings | (2,152 | ) | (781 | ) | – | – | – | (1,371 | ) | |||||||||||||||||||||||||||
Financial liabilities designated at fair values | (19,853 | ) | (1,741 | ) | (3,239 | ) | (7,032 | ) | (4,312 | ) | (3,628 | ) | ||||||||||||||||||||||||
Derivatives | (2,278 | ) | – | – | – | – | (2,278 | ) | ||||||||||||||||||||||||||||
Debt securities in issue | (960 | ) | – | – | (963 | ) | – | 3 | ||||||||||||||||||||||||||||
Other liabilities | (15,895 | ) | – | (3,374 | ) | (3,500 | ) | (9,119 | ) | 98 | ||||||||||||||||||||||||||
Subordinated liabilities | (1,642 | ) | – | – | – | – | (1,642 | ) | ||||||||||||||||||||||||||||
Total equity | (107,414 | ) | – | – | – | – | (107,414 | ) | ||||||||||||||||||||||||||||
Total liabilities and equity | (150,194 | ) | (2,522 | ) | (6,613 | ) | (11,495 | ) | (13,332 | ) | (116,232 | ) | ||||||||||||||||||||||||
Off-balance sheet items attracting interest rate sensitivity | – | (22,748 | ) | 5,351 | 10,722 | 5,763 | 912 | |||||||||||||||||||||||||||||
Net interest rate risk gap at 31 December 2015 | – | 20,618 | (874 | ) | 363 | (7,569 | ) | (12,538 | ) | |||||||||||||||||||||||||||
Cumulative interest rate gap | – | 20,618 | 19,744 | 20,107 | 12,538 | – | ||||||||||||||||||||||||||||||
Cash at bank and in hand: | ||||||||||||||||||||||||||||||||||||
– balances with HSBC undertakings | 249 | – | – | – | – | 249 | ||||||||||||||||||||||||||||||
Derivatives | 2,771 | – | – | – | – | 2,771 | ||||||||||||||||||||||||||||||
Loans and advances to HSBC undertakings | 43,910 | 41,603 | 290 | 1,093 | – | 924 | ||||||||||||||||||||||||||||||
Financial investments in HSBC undertakings | 4,073 | 3,010 | – | 731 | – | 332 | ||||||||||||||||||||||||||||||
Investments in subsidiaries | 96,264 | – | – | – | – | 96,264 | ||||||||||||||||||||||||||||||
Other assets | 597 | – | – | – | – | 597 | ||||||||||||||||||||||||||||||
Total assets | 147,864 | 44,613 | 290 | 1,824 | – | 101,137 | ||||||||||||||||||||||||||||||
Amounts owed to HSBC undertakings | (2,892 | ) | (1,877 | ) | – | – | – | (1,015 | ) | |||||||||||||||||||||||||||
Financial liabilities designated at fair values | (18,679 | ) | (850 | ) | (5,472 | ) | (5,400 | ) | (4,263 | ) | (2,694 | ) | ||||||||||||||||||||||||
Derivatives | (1,169 | ) | – | – | – | – | (1,169 | ) | ||||||||||||||||||||||||||||
Debt securities in issue | (1,009 | ) | – | – | (1,013 | ) | – | 4 | ||||||||||||||||||||||||||||
Other liabilities | (1,415 | ) | – | – | – | – | (1,415 | ) | ||||||||||||||||||||||||||||
Subordinated liabilities | (17,255 | ) | (779 | ) | (3,766 | ) | (2,000 | ) | (10,195 | ) | (515 | ) | ||||||||||||||||||||||||
Total equity | (105,445 | ) | – | – | – | – | (105,445 | ) | ||||||||||||||||||||||||||||
Total liabilities and equity | (147,864 | ) | (3,506 | ) | (9,238 | ) | (8,413 | ) | (14,458 | ) | (112,249 | ) | ||||||||||||||||||||||||
Off-balance sheet items attracting interest rate sensitivity | – | (21,525 | ) | 7,295 | 7,400 | 5,763 | 1,067 | |||||||||||||||||||||||||||||
Net interest rate risk gap at 31 December 2014 | – | 19,582 | (1,653 | ) | 811 | (8,695 | ) | (10,045 | ) | |||||||||||||||||||||||||||
Cumulative interest rate gap | – | 19,582 | 17,929 | 18,740 | 10,045 | – | ||||||||||||||||||||||||||||||
HSBC HOLDINGS PLC
175 |
Table of Contents
Report of the Directors: Risk(continued)
Operational risk
Page
| App1 | Tables | Page | |||||||||||
| 176 | 217 | |||||||||||||
| 176 | 176 | |||||||||||||
| 177 | ||||||||||||||
| 177 | ||||||||||||||
| 177 | 178 | |||||||||||||
Distribution of operational risk losses in US dollars by risk category | 178 | |||||||||||||
| 178 | 217 | |||||||||||||
| 218 | ||||||||||||||
| 218 | ||||||||||||||
| 219 | ||||||||||||||
| 219 | ||||||||||||||
| 1 Appendix to Risk – risk policies and practices. | ||||||||||||||
Operational risk is the risk to achieving our strategy or objectives as a result of inadequate or failed internal processes, people and systems or from external events.
Responsibility for minimising operational risk lies with HSBC’s management and staff. All regional, global business, country, and functional staff are required to manage the operational risks of the business and operational activities for which they are responsible.
A summary of our current policies and practices regarding operational risk is provided in the Appendix to Risk on page 217.
Operational risk management framework
HSBC’s Operational Risk Management Framework (‘ORMF’) is our overarching approach for managing operational risk. The purpose of the ORMF is to make sure we fully identify and manage our operational risks in an effective manner
and remain within our targeted levels of operational risk within the Group’s risk appetite, as defined by the Board. Articulating our risk appetite for material operational risks helps the organisation understand the level of risk HSBC is willing to accept. Monitoring operational risk exposure against risk appetite on a regular basis and implementing our risk acceptance process drives risk awareness in a forward-looking manner and assists management in determining whether further action is required.
Activities to strengthen our risk culture and better embed the use of the ORMF continued in 2015. In particular, we continued to streamline our operational risk management processes, procedures and tool sets to provide more forward-looking risk insights and more effective operation of the ORMF. The ORMF comprises the 14 key components set below.
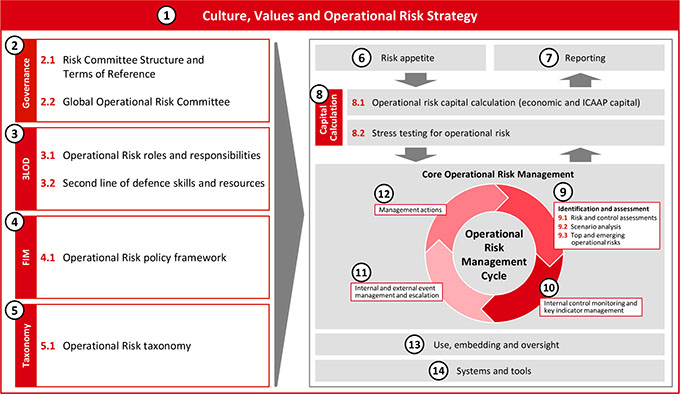
HSBC HOLDINGS PLC
176 |
Table of Contents
HSBC has implemented an activity-based ‘three lines of defence’ model (an industry best practice approach) to underpin our approach to managing operational risk using the ORMF. It makes clear who does what within HSBC to manage operational risks on a daily basis.
| • | The first line of defence owns the risks and is responsible for identifying, recording, reporting and managing them and ensuring that the right controls and assessments are in pace to mitigate these risks. |
| • | The second line of defence sets the policy and guidelines for managing the risks and provides advice, guidance and challenge to the first line of defence on effective risk management. |
| • | The third line of defence is Internal Audit which helps the Board and Executive Management to protect the assets, reputation and sustainability of the Group. |
During 2015, our operational risk profile continued to be dominated by compliance risk (mainly conduct-related) and we continued to incur losses relating to events from previous years. Conduct-related costs included in significant items are outlined in section 21. A range of mitigating actions are being taken to prevent future conduct-related incidents.
For further information see ‘Compliance risk’ on page 178 and for details of the investigations and legal proceedings see Note 40 on the Financial Statements.
Other operational risks included:
| • | compliance with regulatory agreements and orders: failure to implement our obligations under the US DPA could have a material adverse effect on our results and operations. The work of the Monitor is discussed on page 116, with compliance risk described below; |
| • | level of change creating operational complexity: the Global Risk function is engaged with business management in business transformation initiatives to ensure robust internal controls are maintained as we execute our change agenda; |
| • | fraud risks: our loss prevention performance remains strong in most markets, but the introduction of new technologies and ways of banking mean that we continue to be subject to fraud attacks as new attack vectors are developed. We continue to increase monitoring and enhance detective controls to mitigate these risks in accordance with our risk appetite; |
| • | information security: the security of our information and technology infrastructure is crucial for maintaining our banking services and protecting our customers and the HSBC brand. As with other financial institutions and multinational organisations, we continue to be exposed to cyber threats, and the focus of attacks such as ‘distribution of denial of service’ which can affect the availability of customer-facing websites. Programmes of work are ongoing to strengthen internal security controls to prevent unauthorised access to our systems and network, as well as improvements to the controls and security applied to protect our customers utilising digital channels. Strong engagement and support within the industry, government agencies and intelligence providers helps to ensure we keep abreast of the current developments; and |
| • | third-party risk management: we are strengthening our core third-party risk management capability particularly related to the management of vendor risks. A supplier performance management programme has been implemented with our most material suppliers and screening of suppliers is in place to help enable us to identify if any are on a sanctions list and if we should therefore exit the relationship. |
Other operational risks are also monitored and managed through the use of the ORMF.
Further information on the nature of these risks is provided in ‘Top and emerging risks’ on page 110.
Frequency and amount of operational risk losses
The profile of operational risk incidents and associated losses is summarised below, showing the distribution of operational incidents in terms of their frequency of occurrence and total loss amount in US dollars.
Operational losses were lower in 2015 than in 2014, reflecting a reduction in losses incurred relating to large legacy conduct-related events. Our total loss was driven primarily by provisions raised in respect of the mis-selling of the PPI policies, foreign exchange rate investigations and litigation.
As in previous years, the operational risk incident profile in 2015 comprised high frequency low impact events and high impact events that occurred much less frequently.
Losses due to external fraud, such as card fraud, occurred more often than other types of incident, but the amounts involved were often small in value. The value of fraud incidents in 2015 was lower than in 2014, due to the strengthened control environment.
HSBC HOLDINGS PLC
177 |
Table of Contents
Report of the Directors: Risk(continued)
Operational risk
Frequency of operational risk incidents by risk category
(individual loss³$10k)
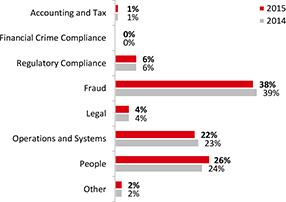
Distribution of operational risk losses in US dollars by risk category
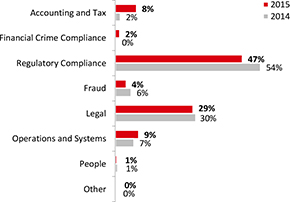
Compliance risk arises from activities subject to rules, regulations, Group policies and other formal standards, including those relating to AML, counter-terrorist and proliferation financing, sanctions compliance, anti-bribery and corruption, conduct of business and other regulations.
Anti-money laundering and sanctions
Revised global AML and sanctions policies were approved in 2014. During 2015, global businesses and countries introduced new AML and sanctions procedures arising from the new policies and focused on embedding the procedures required to effect these policies in our day to day business operations globally. This supported our ongoing effort to address the US DPA requirements. These actions were in line with our strategic target to implement the highest or most effective standards globally. The work of the Monitor, who was appointed to assess the effectiveness of our AML and sanctions compliance programme is discussed on page 116 and our progress on implementing Global Standards is detailed on page 21.
Anti-bribery and corruption
It is unethical, illegal, and contrary to good corporate governance to bribe or corrupt others. The Group is committed to preventing bribery and corruption, and to consistently applying the letter and spirit of applicable anti-bribery legislation in all markets and jurisdictions in which we operate. We have implemented a strategic programme to address bribery and corruption risks and are embedding a new global suite of policies that make it clear to all staff that Group members, employees or other associated persons or entities must not engage in, or otherwise facilitate, any form of bribery, whether direct or indirect.
The anti-bribery and corruption programme, from training to risk assessment, emphasises the importance of consistent and standardised procedures to drive the principles of ‘detect, deter and protect’ and ensure that they are incorporated into every aspect of business-as- usual activities.
Conduct of business
We recognise that delivering fair outcomes for our customers and upholding financial market integrity is critical to a sustainable business model. We have taken a number of steps to raise our standards and deal with historical incidents, including the following:
| • | we published a new Global Conduct Policy in 2015 (following the approval and implementation of the global conduct approach and framework in 2014) for the management of conduct designed to ensure that we meet our strategic commitment to deliver fair outcomes for our customers, and not disrupt the orderly and transparent operation of financial markets; |
| • | we launched communications programmes and global mandatory training in respect of conduct and the Group’s required values and behaviours; |
| • | we enhanced the product governance process to further ensure products are designed to meet customers’ needs and are sold to suitable customer groupings. Post implementation and regular reviews are undertaken to help ensure products remain appropriate; |
| • | we reviewed sales processes and sales incentive schemes, focusing on activity and rewards linked to values-based behaviour and good conduct; |
| • | we enhanced our surveillance capabilities and tested new technologies to strengthen our capabilities to detect suspicious trading activity and misconduct; |
| • | we undertook proactive reviews of our involvement in the benchmarking processes for rates and commodities; and |
| • | we reviewed our insights into customer experience, our analysis of the root cause of complaints and our complaint handling to ensure we continually improve and deliver better outcomes for our customers. |
HSBC HOLDINGS PLC
178 |
Table of Contents
The global businesses use a broad range of measures appropriate to their specific customer base and markets to assess ongoing effectiveness of the management of conduct, and enable action to be taken where potential conduct issues arise. The measures include information relating to sales quality, customer experience and market behaviour.
The CVC provides Board oversight of the Group’s multiple efforts to raise standards of conduct and embed the behavioural values the Group stands for.
For further information on the CVC, see page 272.
Further information on our conduct is provided in the Strategic Report on page 40 and for conduct-related costs relating to significant items, see page 97.
Whistleblowing
We actively encourage our employees to raise concerns and escalate issues so they can be dealt with effectively. In most cases, individuals will raise their concerns with line management or Global Human Resources. However, where
an individual believes that their normal reporting channels are unavailable or inappropriate, it is important that they have alternative channels available to them to raise concerns confidentially without fear of personal repercussions. This is referred to as ‘whistleblowing’.
To make whistleblowing simpler for our employees, we launched HSBC Confidential across the Group in August 2015 to provide a global platform offering telephone, email, web and mail options for whistleblowers to bring together all our existing whistleblowing channels. We also maintain an external email address for complaints regarding accounting and internal financial controls or auditing matters (accountingdisclosures@hsbc.com). Matters raised are independently investigated by appropriate subject matter teams and details of investigations and outcomes including remedial action taken are reported to the CVC. Matters raised in respect of audit, accounting and internal control over financial reporting are reported to the Group Audit Committee.
HSBC HOLDINGS PLC
179 |
Table of Contents
Report of the Directors: Risk(continued)
Risk management of insurance operations
Risk management of insurance operations
Page
| App1
| Tables
| Page
| |||||||||||
| 180 | ||||||||||||||
| 219 | ||||||||||||||
| 220 | ||||||||||||||
Risk management of insurance manufacturing operations in 2015 | 181 | |||||||||||||
| 181 | Balance sheet of insurance manufacturing subsidiaries by: | |||||||||||||
| 181 | ||||||||||||||
| 182 | ||||||||||||||
| 183 | ||||||||||||||
| 183 | 220 | Financial assets held by insurance manufacturing subsidiaries | 184 | |||||||||||
| 184 | 220 | 185 | ||||||||||||
Sensitivity of HSBC’s insurance manufacturing subsidiaries to market risk factors | 185 | |||||||||||||
| 185 | 222 | 186 | ||||||||||||
| 187 | ||||||||||||||
| 187 | 222 | 187 | ||||||||||||
Remaining contractual maturity of investment contract liabilities | 187 | |||||||||||||
| 188 | 223 | Analysis of insurance risk – liabilities under insurance contracts | 188 | |||||||||||
| 188 | 188 | |||||||||||||
1Appendix to Risk – policies and practices. | ||||||||||||||
The majority of the risk in our insurance business derives from manufacturing activities and can be categorised as financial risk and insurance risk. Financial risks include market risk, credit risk and liquidity risk. Insurance risk is the risk, other than financial risk, of loss transferred from the holder of the insurance contract to the issuer (HSBC).
There were no material changes to our policies and practices for the management of risks arising in the insurance operations in 2015.
A summary of HSBC’s policies and practice regarding the risk management of insurance operations and the main contracts we manufacture is provided in the Appendix to Risk on page 219.
We operate an integrated bancassurance model which provides insurance products principally for customers with whom we have a banking relationship. Insurance products are sold through all global businesses, but predominantly by RBWM and CMB through our branches and direct channels worldwide.
The insurance contracts we sell relate to the underlying needs of our banking customers, which we can identify from our point-of-sale contacts and customer knowledge. The majority of sales are of savings and investment products and term and credit life contracts.
By focusing largely on personal and SME lines of business we are able to optimise volumes and diversify individual insurance risks.
We choose to manufacture these insurance products in HSBC subsidiaries based on an assessment of operational scale and risk appetite. Manufacturing insurance allows us to retain the risks and rewards associated with writing insurance contracts by keeping part of the underwriting profit and investment income within the Group.
Where we do not have the risk appetite or operational scale to be an effective insurance manufacturer, we engage with a handful of leading external insurance companies in order to provide insurance products to our customers through our banking network and direct channels. These arrangements are generally structured with our exclusive strategic partners and earn the Group a combination of commissions, fees and a share of profits.
We distribute insurance products in all of our geographical regions. We have life insurance manufacturing subsidiaries in nine countries (Argentina, mainland China, France, Hong Kong, Malaysia, Malta, Mexico, Singapore and the UK). We also have a life insurance manufacturing associate in Saudi Arabia and a joint venture in India.
The life insurance manufacturing entities in Brazil were classified as held for sale during the period, following the announcement of our plan to sell our operations in the country.
The disposal of HSBC Life (UK)’s pensions business, which was agreed during 2014, was completed in August 2015.
HSBC HOLDINGS PLC
180 |
Table of Contents
Risk management of insurance manufacturing operations in 2015
We measure the risk profile of our insurance manufacturing businesses using an economic capital approach, where assets and liabilities are measured on a market value basis and a capital requirement is held to ensure that there is less than a 1 in 200 chance of insolvency over the next year, given the risks that the businesses are exposed to. The methodology for the economic capital calculation is largely aligned to the new pan-European Solvency II insurance capital regulations, which are applicable from 2016.
The risk profile of our life insurance manufacturing businesses did not change materially during 2015, however there was a decrease in liabilities under insurance contracts to $70bn (2014: $74bn) arising from the transfer to ‘Liabilities of disposal groups held for sale’ in respect of the planned disposal of our operations in Brazil.
(Audited)
A principal tool used to manage exposures to both financial and insurance risk, in particular for life insurance contracts, is asset and liability matching. In many markets in which we operate it is neither possible nor appropriate to follow a close asset and liability matching strategy. For long-datednon-linked contracts, in particular, this results in a duration mismatch between assets and liabilities. Portfolios are
structured to support these projected liabilities, with limits set to control the duration mismatch.
The tables below show the composition of assets and liabilities by contract and by geographical region and demonstrate that there were sufficient assets to cover the liabilities to policyholders in each case at the end of 2015.
The Brazilian insurance operations are reported as a disposal group held for sale at 31 December 2015. The assets and liabilities of this disposal group are included within ‘Other assets and liabilities’ in the table below. The UK pensions business was reported as a disposal group held for sale at 31 December 2014 and the sale of this business was completed during August 2015. As a result, $6.8bn of total assets and $6.7bn of total liabilities were derecognised.
Our most significant life insurance products are investment contracts with DPF issued in France and insurance contracts with DPF issued in Hong Kong.
Our exposure to financial risks arising in the balance sheet below varies depending on the type of contract issued. For unit-linked contracts, the policyholder bears the majority of the exposure to financial risks whereas for contracts with DPF, the shareholder (i.e. HSBC) is exposed to financial risks to the extent that the exposure cannot be managed by utilising any discretionary participation.
The majority of financial risks are borne by the shareholder for all other contract types.
Balance sheet of insurance manufacturing subsidiaries by type of contract
(Audited)
| Insurance contracts | Investment contracts | |||||||||||||||||||||||||||||||||||||||||||||||||||||
|
| With DPF |
| | Unit- linked | | Annuities | Other | 35 |
| With DPF | 36 |
| Unit- linked |
| Other |
| Other assets and liabilities |
37 | Total | |||||||||||||||||||||||||||||||||||
| $m | $m | $m | $m | $m | $m | $m | $m | $m | ||||||||||||||||||||||||||||||||||||||||||||||
Financial assets | 31,801 | 6,569 | 1,138 | 6,618 | 21,720 | 2,271 | 3,935 | 5,531 | 79,583 | |||||||||||||||||||||||||||||||||||||||||||||
– trading assets | – | – | 2 | – | – | – | – | – | 2 | |||||||||||||||||||||||||||||||||||||||||||||
– financial assets designated at fair value | 4,698 | 6,435 | 296 | 563 | 6,421 | 2,000 | 1,859 | 1,015 | 23,287 | |||||||||||||||||||||||||||||||||||||||||||||
– derivatives | 49 | – | – | 4 | 111 | 1 | 29 | 62 | 256 | |||||||||||||||||||||||||||||||||||||||||||||
– financial investments – HTM38 | 22,840 | – | 468 | 2,334 | – | – | 1,387 | 3,050 | 30,079 | |||||||||||||||||||||||||||||||||||||||||||||
– financial investments – AFS38 | 1,743 | – | 312 | 3,685 | 13,334 | – | 23 | 1,233 | 20,330 | |||||||||||||||||||||||||||||||||||||||||||||
– other financial assets39 | 2,471 | 134 | 60 | 32 | 1,854 | 270 | 637 | 171 | 5,629 | |||||||||||||||||||||||||||||||||||||||||||||
Reinsurance assets | 202 | 264 | – | 951 | – | – | – | – | 1,417 | |||||||||||||||||||||||||||||||||||||||||||||
PVIF40 | – | – | – | – | – | – | – | 5,685 | 5,685 | |||||||||||||||||||||||||||||||||||||||||||||
Other assets and investment properties | 838 | 1 | 11 | 105 | 888 | 6 | 23 | 4,576 | 6,448 | |||||||||||||||||||||||||||||||||||||||||||||
Total assets | 32,841 | 6,834 | 1,149 | 7,674 | 22,608 | 2,277 | 3,958 | 15,792 | 93,133 | |||||||||||||||||||||||||||||||||||||||||||||
Liabilities under investment contracts | – | – | – | – | – | 2,256 | 3,771 | – | 6,027 | |||||||||||||||||||||||||||||||||||||||||||||
– designated at fair value | – | – | – | – | – | 2,256 | 3,771 | – | 6,027 | |||||||||||||||||||||||||||||||||||||||||||||
– carried at amortised cost | – | – | – | – | – | – | – | – | – | |||||||||||||||||||||||||||||||||||||||||||||
Liabilities under insurance contracts | 32,414 | 6,791 | 1,082 | 7,042 | 22,609 | – | – | – | 69,938 | |||||||||||||||||||||||||||||||||||||||||||||
Deferred tax41 | 11 | – | 11 | 3 | – | – | – | 1,056 | 1,081 | |||||||||||||||||||||||||||||||||||||||||||||
Other liabilities | – | – | – | – | – | – | – | 5,553 | 5,553 | |||||||||||||||||||||||||||||||||||||||||||||
Total liabilities | 32,425 | 6,791 | 1,093 | 7,045 | 22,609 | 2,256 | 3,771 | 6,609 | 82,599 | |||||||||||||||||||||||||||||||||||||||||||||
Total equity | – | – | – | – | – | – | – | 10,534 | 10,534 | |||||||||||||||||||||||||||||||||||||||||||||
Total liabilities and equity at 31 December 201542 | 32,425 | 6,791 | 1,093 | 7,045 | 22,609 | 2,256 | 3,771 | 17,143 | 93,133 | |||||||||||||||||||||||||||||||||||||||||||||
HSBC HOLDINGS PLC
181 |
Table of Contents
Report of the Directors: Risk(continued)
Risk management of insurance operations
Balance sheet of insurance manufacturing subsidiaries by type of contract (continued)
| Insurance contracts | Investment contracts | |||||||||||||||||||||||||||||||||||||||||||||||||||||
|
| With DPF |
| | Unit- linked | | Annuities | Other | 35 |
| With DPF | 36 |
| Unit- linked |
| Other | | Other assets | | Total | |||||||||||||||||||||||||||||||||||
| $m | $m | $m | $m | $m | $m | $m | $m | $m | ||||||||||||||||||||||||||||||||||||||||||||||
Financial assets | 29,040 | 11,278 | 1,517 | 6,253 | 24,238 | 2,561 | 4,322 | 5,732 | 84,941 | |||||||||||||||||||||||||||||||||||||||||||||
– trading assets | – | – | 3 | – | – | – | – | – | 3 | |||||||||||||||||||||||||||||||||||||||||||||
– financial assets designated at fair value | 4,304 | 11,111 | 533 | 782 | 6,346 | 2,223 | 1,684 | 1,713 | 28,696 | |||||||||||||||||||||||||||||||||||||||||||||
– derivatives | 12 | 1 | – | 1 | 101 | 1 | 10 | 73 | 199 | |||||||||||||||||||||||||||||||||||||||||||||
– financial investments – HTM38 | 18,784 | – | 542 | 1,019 | – | – | 1,444 | 2,494 | 24,283 | |||||||||||||||||||||||||||||||||||||||||||||
– financial investments – AFS38 | 2,368 | – | 344 | 4,148 | 15,677 | – | 363 | 1,318 | 24,218 | |||||||||||||||||||||||||||||||||||||||||||||
– other financial assets39 | 3,572 | 166 | 95 | 303 | 2,114 | 337 | 821 | 134 | 7,542 | |||||||||||||||||||||||||||||||||||||||||||||
Reinsurance assets | 190 | 262 | – | 617 | – | – | – | 2 | 1,071 | |||||||||||||||||||||||||||||||||||||||||||||
PVIF40 | – | – | – | – | – | – | – | 5,307 | 5,307 | |||||||||||||||||||||||||||||||||||||||||||||
Other assets and investment properties | 698 | 328 | 23 | 107 | 831 | 7 | 26 | 7,383 | 9,403 | |||||||||||||||||||||||||||||||||||||||||||||
Total assets | 29,928 | 11,868 | 1,540 | 6,977 | 25,069 | 2,568 | 4,348 | 18,424 | 100,722 | |||||||||||||||||||||||||||||||||||||||||||||
Liabilities under investment contracts | – | – | – | – | – | 2,542 | 4,155 | – | 6,697 | |||||||||||||||||||||||||||||||||||||||||||||
– designated at fair value | – | – | – | – | – | 2,542 | 3,770 | – | 6,312 | |||||||||||||||||||||||||||||||||||||||||||||
– carried at amortised cost | – | – | – | – | – | – | 385 | – | 385 | |||||||||||||||||||||||||||||||||||||||||||||
Liabilities under insurance contracts | 29,479 | 11,820 | 1,473 | 6,021 | 25,068 | – | – | – | 73,861 | |||||||||||||||||||||||||||||||||||||||||||||
Deferred tax41 | 12 | – | 11 | 18 | – | – | – | 1,180 | 1,221 | |||||||||||||||||||||||||||||||||||||||||||||
Other liabilities | – | – | – | – | – | – | – | 8,577 | 8,577 | |||||||||||||||||||||||||||||||||||||||||||||
Total liabilities | 29,491 | 11,820 | 1,484 | 6,039 | 25,068 | 2,542 | 4,155 | 9,757 | 90,356 | |||||||||||||||||||||||||||||||||||||||||||||
Total equity | – | – | – | – | – | – | – | 10,366 | 10,366 | |||||||||||||||||||||||||||||||||||||||||||||
Total liabilities and equity at 31 December 201442 | 29,491 | 11,820 | 1,484 | 6,039 | 25,068 | 2,542 | 4,155 | 20,123 | 100,722 | |||||||||||||||||||||||||||||||||||||||||||||
For footnotes, see page 191.
Balance sheet of insurance manufacturing subsidiaries by geographical region43
(Audited)
| Europe | Asia | Latin America | Total | |||||||||||||||||||||
| $m | $m | $m | $m | |||||||||||||||||||||
Financial assets | 26,897 | 51,087 | 1,599 | 79,583 | ||||||||||||||||||||
– trading assets | – | – | 2 | 2 | ||||||||||||||||||||
– financial assets designated at fair value | 9,987 | 12,668 | 632 | 23,287 | ||||||||||||||||||||
– derivatives | 163 | 93 | – | 256 | ||||||||||||||||||||
– financial investments – HTM38 | – | 29,496 | 583 | 30,079 | ||||||||||||||||||||
– financial investments – AFS38 | 14,525 | 5,503 | 302 | 20,330 | ||||||||||||||||||||
– other financial assets39 | 2,222 | 3,327 | 80 | 5,629 | ||||||||||||||||||||
Reinsurance assets | 287 | 1,122 | 8 | 1,417 | ||||||||||||||||||||
PVIF40 | 807 | 4,761 | 117 | 5,685 | ||||||||||||||||||||
Other assets and investment properties | 919 | 1,358 | 4,171 | 6,448 | ||||||||||||||||||||
Total assets | 28,910 | 58,328 | 5,895 | 93,133 | ||||||||||||||||||||
Liabilities under investment contracts: | ||||||||||||||||||||||||
– designated at fair value | 1,376 | 4,651 | – | 6,027 | ||||||||||||||||||||
– carried at amortised cost | – | – | – | – | ||||||||||||||||||||
Liabilities under insurance contracts | 24,699 | 43,975 | 1,264 | 69,938 | ||||||||||||||||||||
Deferred tax41 | 274 | 767 | 40 | 1,081 | ||||||||||||||||||||
Other liabilities | 832 | 974 | 3,747 | 5,553 | ||||||||||||||||||||
Total liabilities | 27,181 | 50,367 | 5,051 | 82,599 | ||||||||||||||||||||
Total equity | 1,729 | 7,961 | 844 | 10,534 | ||||||||||||||||||||
Total liabilities and equity at 31 December 201542 | 28,910 | 58,328 | 5,895 | 93,133 | ||||||||||||||||||||
HSBC HOLDINGS PLC
182 |
Table of Contents
| Europe | Asia | Latin America | Total | |||||||||||||||||||||
| $m | $m | $m | $m | |||||||||||||||||||||
Financial assets | 30,178 | 47,443 | 7,320 | �� 84,941 | ||||||||||||||||||||
– trading assets | – | – | 3 | 3 | ||||||||||||||||||||
– financial assets designated at fair value | 10,610 | 12,497 | 5,589 | 28,696 | ||||||||||||||||||||
– derivatives | 172 | 27 | – | 199 | ||||||||||||||||||||
– financial investments – HTM38 | — | 23,546 | 737 | 24,283 | ||||||||||||||||||||
– financial investments – AFS38 | 16,947 | 6,464 | 807 | 24,218 | ||||||||||||||||||||
– other financial assets39 | 2,449 | 4,909 | 184 | 7,542 | ||||||||||||||||||||
Reinsurance assets | 308 | 748 | 15 | 1,071 | ||||||||||||||||||||
PVIF40 | 711 | 4,175 | 421 | 5,307 | ||||||||||||||||||||
Other assets and investment properties | 7,650 | 1,145 | 608 | 9,403 | ||||||||||||||||||||
Total assets | 38,847 | 53,511 | 8,364 | 100,722 | ||||||||||||||||||||
Liabilities under investment contracts: | ||||||||||||||||||||||||
– designated at fair value | 1,585 | 4,727 | – | 6,312 | ||||||||||||||||||||
– carried at amortised cost | – | – | 385 | 385 | ||||||||||||||||||||
Liabilities under insurance contracts | 27,312 | 39,990 | 6,559 | 73,861 | ||||||||||||||||||||
Deferred tax41 | 273 | 806 | 142 | 1,221 | ||||||||||||||||||||
Other liabilities | 7,932 | 460 | 185 | 8,577 | ||||||||||||||||||||
Total liabilities | 37,102 | 45,983 | 7,271 | 90,356 | ||||||||||||||||||||
Total equity | 1,745 | 7,528 | 1,093 | 10,366 | ||||||||||||||||||||
Total liabilities and equity at 31 December 201442 | 38,847 | 53,511 | 8,364 | 100,722 | ||||||||||||||||||||
For footnotes, see page 191.
Movement in total equity of insurance operations
(Audited)
| Total equity | ||||||||||||
| 2015 | 2014 | |||||||||||
| $m | $m | |||||||||||
At 1 January | 10,366 | 9,700 | ||||||||||
Movements in PVIF40 | 799 | 261 | ||||||||||
Return on net assets | 410 | 1,835 | ||||||||||
Capital transactions | (468 | ) | (673 | ) | ||||||||
Disposals of subsidiaries/portfolios | (13 | ) | 1 | |||||||||
Exchange differences and other | (560 | ) | (758 | ) | ||||||||
At 31 December | 10,534 | 10,366 | ||||||||||
For footnotes, see page 191.
(Audited)
Details on the nature of financial risks and how they are managed are provided in the Appendix to Risk on page 220.
Financial risks can be categorised into:
| • | market risk – risk arising from changes in the fair values of financial assets or their future cash flows from fluctuations in variables such as interest rates, credit spreads, foreign exchange rates and equity prices; |
| • | credit risk – the risk of financial loss following the failure of third parties to meet their obligations; and |
| • | liquidity risk – the risk of not being able to make payments to policyholders as they fall due as there are insufficient assets that can be realised as cash. |
The following table analyses the assets held in our insurance manufacturing subsidiaries at 31 December 2015 by type of contract, and provides a view of the exposure to financial risk. Forunit-linked contracts, which pay benefits to policyholders determined by reference to the value of the investments supporting the policies, we typically designate assets at fair value; for non-linked contracts, the classification of the assets is driven by the nature of the underlying contract.
HSBC HOLDINGS PLC
183 |
Table of Contents
Report of the Directors: Risk(continued)
Risk management of insurance operations
Financial assets held by insurance manufacturing subsidiaries
(Audited)
| Unit-linked | Non-linked | Other | ||||||||||||||||||||||
| contracts | 44 | contracts | 45 | assets | 39 | Total | ||||||||||||||||||
| $m | $m | $m | $m | |||||||||||||||||||||
Trading assets | ||||||||||||||||||||||||
Debt securities | – | 2 | – | 2 | ||||||||||||||||||||
Financial assets designated at fair value | 8,435 | 13,837 | 1,015 | 23,287 | ||||||||||||||||||||
Treasury bills | – | 146 | 56 | 202 | ||||||||||||||||||||
Debt securities | 448 | 3,547 | 228 | 4,223 | ||||||||||||||||||||
Equity securities | 7,987 | 10,144 | 731 | 18,862 | ||||||||||||||||||||
Financial investments | ||||||||||||||||||||||||
Held-to-maturity: debt securities | – | 27,029 | 3,050 | 30,079 | ||||||||||||||||||||
Available-for-sale: | – | 19,097 | 1,233 | 20,330 | ||||||||||||||||||||
– debt securities | – | 19,097 | 1,177 | 20,274 | ||||||||||||||||||||
– equity securities | – | – | 56 | 56 | ||||||||||||||||||||
Derivatives | 1 | 193 | 62 | 256 | ||||||||||||||||||||
Other financial assets39 | 404 | 5,054 | 171 | 5,629 | ||||||||||||||||||||
Total financial assets at 31 December 201542 | 8,840 | 65,212 | 5,531 | 79,583 | ||||||||||||||||||||
Trading assets | ||||||||||||||||||||||||
Debt securities | – | 3 | – | 3 | ||||||||||||||||||||
Financial assets designated at fair value | 13,334 | 13,649 | 1,713 | 28,696 | ||||||||||||||||||||
Treasury bills | – | 40 | 16 | 56 | ||||||||||||||||||||
Debt securities | 4,589 | 3,507 | 618 | 8,714 | ||||||||||||||||||||
Equity securities | 8,745 | 10,102 | 1,079 | 19,926 | ||||||||||||||||||||
Financial investments | ||||||||||||||||||||||||
Held-to-maturity: debt securities | – | 21,789 | 2,494 | 24,283 | ||||||||||||||||||||
Available-for-sale: | – | 22,899 | 1,319 | 24,218 | ||||||||||||||||||||
– debt securities | – | 22,899 | 1,290 | 24,189 | ||||||||||||||||||||
– equity securities | – | – | 29 | 29 | ||||||||||||||||||||
Derivatives | 2 | 124 | 73 | 199 | ||||||||||||||||||||
Other financial assets39 | 503 | 6,905 | 134 | 7,542 | ||||||||||||||||||||
Total financial assets at 31 December 201442 | 13,839 | 65,369 | 5,733 | 84,941 | ||||||||||||||||||||
For footnotes, see page 191.
Approximately 69% of financial assets were invested in debt securities at 31 December 2015 (2014: 67%) with 24% (2014: 24%) invested in equity securities.
Under unit-linked contracts, premium income less charges levied is invested in a portfolio of assets. We manage the financial risks of this product on behalf of the policyholders by holding appropriate assets in segregated funds or portfolios to which the liabilities are linked. These assets represented 11% (2014: 16%) of the total financial assets of our insurance manufacturing subsidiaries at the end of 2015.
The remaining assets of $71bn (2014: $71bn) are where financial risks are managed either solely on behalf of the shareholder, or jointly on behalf of the shareholder and policyholders where DPF exist. These assets relate primarily to operations in Asia and France.
(Audited)
Market risk arises when mismatches occur between product liabilities and the investment assets which back them. For example, mismatches between asset and liability yields and maturities give rise to interest rate risk.
The proceeds from insurance and investment products are primarily invested in bonds. A proportion is also allocated to other asset classes, such as equities, property, private equity and hedge funds to provide customers with the
potential for enhanced returns. Portfolios of such assets are exposed to the risk of changes in market prices and where not fully reflected in bonuses paid to policyholders, will affect shareholder funds.
Long-term insurance or investment products may incorporate benefits that are guaranteed. Fixed guaranteed benefits, for example for annuities in payment, are reserved for as part of the calculation of liabilities under insurance contracts.
The risk of shareholder capital being required to meet liabilities to policyholders increases in products that offer guaranteed financial returns where current yields fall below guaranteed levels for a prolonged period. Reserves are held against the cost of guarantees, calculated by stochastic modelling. Where local rules require, these reserves are held as part of liabilities under insurance contracts. Any remainder is accounted for as a deduction to PVIF on the relevant product. The table below shows the total reserve held for the cost of guarantees, the range of investment returns on assets supporting these products and the implied investment return that would enable the business to meet the guarantees.
The financial guarantees offered on some portfolios exceeded the current yield on the assets that back them. The cost of guarantees decreased to $748m (2014: $777m) primarily because of rising yields and updates to interest rate parameters in France during 2015. Following these
HSBC HOLDINGS PLC
184 |
Table of Contents
changes, the cost of guarantees on closed portfolios reported in the 2.0% to 4.0% and 4.1% to 5.0% categories decreased, driven principally by the increased reinvestment
yield assumptions. In addition, there was a closed portfolio in Hong Kong with a guaranteed rate of 5.0% compared with the current yield of 4.1%.
(Audited)
| 2015 | 2014 | |||||||||||||||||||||||||||
Investment returns implied by guarantee | Current yields | Cost of guarantees | Investment returns implied by guarantee | Current yields | Cost of guarantees | |||||||||||||||||||||||
| % | % | $m | % | % | $m | |||||||||||||||||||||||
Capital | 0.0 | 0.0 – 3.8 | 85 | 0.0 | 0.0 – 3.5 | 81 | ||||||||||||||||||||||
Nominal annual return | 0.1 – 1.9 | 3.9 – 3.9 | 4 | 0.1 – 2.0 | 3.6 – 3.6 | 6 | ||||||||||||||||||||||
Nominal annual return46 | 2.0 – 4.0 | 3.8 – 4.0 | 603 | 2.1 – 4.0 | 3.5 – 4.1 | 646 | ||||||||||||||||||||||
Nominal annual return | 4.1 – 5.0 | 3.8 – 4.1 | 28 | 4.1 – 5.0 | 3.5 – 4.1 | 30 | ||||||||||||||||||||||
Real annual return47 | 0.0 – 6.0 | 5.9 – 6.1 | 28 | 0.0 – 6.0 | 4.7 – 7.5 | 14 | ||||||||||||||||||||||
At 31 December | 748 | 777 | ||||||||||||||||||||||||||
For footnotes, see page 191.
The following table illustrates the effects of selected interest rate, equity price and foreign exchange rate scenarios on our profit for the year and the total equity of our insurance manufacturing subsidiaries.
Where appropriate, the effects of the sensitivity tests on profit after tax and equity incorporate the impact of the stress on the PVIF. The relationship between the profit and total equity and the risk factors is non-linear and, therefore, the results disclosed should not be extrapolated to measure sensitivities to different levels of stress. For the same reason, the impact of the stress is not symmetrical on the upside and downside. The sensitivities are stated before allowance for management actions which may
mitigate the effect of changes in the market environment. The sensitivities presented allow for adverse changes in policyholder behaviour that may arise in response to changes in market rates.
The effects on profit after tax of +/–100 basis points parallel shifts in yield curves have decreased from 2014 to 2015, driven mainly by rising yields and updates to interest rate parameters in France. In a low yield environment the projected cost of options and guarantees described above is particularly sensitive to yield curve movements. The market value of available-for-sale bonds is also sensitive to yield curve movements hence the larger opposite stresses on equity.
Sensitivity of HSBC’s insurance manufacturing subsidiaries to market risk factors
(Audited)
| 2015 | 2014 | |||||||||||||||||||
| Effect on profit after tax | Effect on total equity | Effect on after tax | Effect on total equity | |||||||||||||||||
| $m | $m | $m | $m | |||||||||||||||||
+100 basis points parallel shift in yield curves | 39 | (474 | ) | 290 | (345 | ) | ||||||||||||||
–100 basis points parallel shift in yield curves48 | (213 | ) | 404 | (549 | ) | 214 | ||||||||||||||
10% increase in equity prices | 176 | 176 | 180 | 180 | ||||||||||||||||
10% decrease in equity prices | (158 | ) | (158 | ) | (153 | ) | (153 | ) | ||||||||||||
10% increase in US dollar exchange rate compared to all currencies | 16 | 16 | 54 | 54 | ||||||||||||||||
10% decrease in US dollar exchange rate compared to all currencies | (16 | ) | (16 | ) | (54 | ) | (54 | ) | ||||||||||||
(Audited)
Credit risk can give rise to losses through default and can lead to volatility in our income statement and balance sheet figures through movements in credit spreads, principally on the $54bn (2014: $53bn) bond portfolio supporting non-linked contracts and shareholders’ funds.
The sensitivity of the profit after tax of our insurance subsidiaries to the effects on asset values of increases in credit spreads (as modelled in line with the methodology described below) was a reduction of $2m (2014: $7m). The sensitivity of total equity was a reduction of $10m (2014: $9m). The sensitivities are relatively small because the vast majority of the debt securities held by our insurance subsidiaries are classified as either held to maturity or available for sale, and consequently any changes in the fair value of these financial investments, absent impairment,
would have no effect on the profit after tax (or to total equity in the case of the held-to-maturity securities). We calculate the sensitivity based on a one-day movement in credit spreads over a two-year period. A confidence level of 99%, consistent with our Group VaR, is applied.
Credit quality
(Audited)
The following table presents an analysis of treasury bills, other eligible bills and debt securities within our insurance business by internal measures of credit quality.
Only assets supporting liabilities under non-linked insurance and investment contracts and shareholders’ funds are included in the table as financial risk on assets supporting unit-linked liabilities is predominantly borne by the policyholder. 85.4% (2014: 84.8%) of the assets
HSBC HOLDINGS PLC
185 |
Table of Contents
Report of the Directors: Risk(continued)
Risk management of insurance operations
included in the table are invested in investments rated as ‘strong’.
For a definition of the five credit quality classifications, see page 197.
Treasury bills, other eligible bills and debt securities in HSBC’s insurance manufacturing subsidiaries
(Audited)
| Neither past due nor impaired | ||||||||||||||||||||||||||||||
| Strong | Good | Satisfactory | Sub-standard | Total | ||||||||||||||||||||||||||
| $m | $m | $m | $m | $m | ||||||||||||||||||||||||||
Supporting liabilities under non-linked insurance and investment contracts | ||||||||||||||||||||||||||||||
Trading assets – debt securities | – | – | 2 | – | 2 | |||||||||||||||||||||||||
Financial assets designated at fair value | 2,719 | 406 | 300 | 268 | 3,693 | |||||||||||||||||||||||||
– treasury and other eligible bills | 130 | – | – | 16 | 146 | |||||||||||||||||||||||||
– debt securities | 2,589 | 406 | 300 | 252 | 3,547 | |||||||||||||||||||||||||
Financial investments – debt securities | 39,741 | 4,333 | 1,886 | 166 | 46,126 | |||||||||||||||||||||||||
| 42,460 | 4,739 | 2,188 | 434 | 49,821 | ||||||||||||||||||||||||||
Supporting shareholders’ funds49 | ||||||||||||||||||||||||||||||
Financial assets designated at fair value | 138 | 22 | 20 | 104 | 284 | |||||||||||||||||||||||||
– treasury and other eligible bills | 8 | – | – | 48 | 56 | |||||||||||||||||||||||||
– debt securities | 130 | 22 | 20 | 56 | 228 | |||||||||||||||||||||||||
Financial investments – debt securities | 3,827 | 201 | 199 | – | 4,227 | |||||||||||||||||||||||||
| 3,965 | 223 | 219 | 104 | 4,511 | ||||||||||||||||||||||||||
Total42 | ||||||||||||||||||||||||||||||
Trading assets – debt securities | – | – | 2 | – | 2 | |||||||||||||||||||||||||
Financial assets designated at fair value | 2,857 | 428 | 320 | 372 | 3,977 | |||||||||||||||||||||||||
– treasury and other eligible bills | 138 | – | – | 64 | 202 | |||||||||||||||||||||||||
– debt securities | 2,719 | 428 | 320 | 308 | 3,775 | |||||||||||||||||||||||||
Financial investments – debt securities | 43,568 | 4,534 | 2,085 | 166 | 50,353 | |||||||||||||||||||||||||
At 31 December 2015 | 46,425 | 4,962 | 2,407 | 538 | 54,332 | |||||||||||||||||||||||||
Supporting liabilities under non-linked insurance and investment contracts | ||||||||||||||||||||||||||||||
Trading assets – debt securities | 3 | – | – | – | 3 | |||||||||||||||||||||||||
Financial assets designated at fair value | 2,550 | 530 | 214 | 255 | 3,549 | |||||||||||||||||||||||||
– treasury and other eligible bills | 5 | – | – | 35 | 40 | |||||||||||||||||||||||||
– debt securities | 2,545 | 530 | 214 | 220 | 3,509 | |||||||||||||||||||||||||
Financial investments – debt securities | 38,515 | 4,312 | 1,662 | 200 | 44,689 | |||||||||||||||||||||||||
| 41,068 | 4,842 | 1,876 | 455 | 48,241 | ||||||||||||||||||||||||||
Supporting shareholders’ funds49 | ||||||||||||||||||||||||||||||
Financial assets designated at fair value | 214 | 322 | 30 | 69 | 635 | |||||||||||||||||||||||||
– treasury and other eligible bills | – | – | – | 16 | 16 | |||||||||||||||||||||||||
– debt securities | 214 | 322 | 30 | 53 | 619 | |||||||||||||||||||||||||
Financial investments – debt securities | 3,378 | 196 | 154 | 54 | 3,782 | |||||||||||||||||||||||||
| 3,592 | 518 | 184 | 123 | 4,417 | ||||||||||||||||||||||||||
Total42 | ||||||||||||||||||||||||||||||
Trading assets – debt securities | 3 | – | – | – | 3 | |||||||||||||||||||||||||
Financial assets designated at fair value | 2,764 | 852 | 244 | 324 | 4,184 | |||||||||||||||||||||||||
– treasury and other eligible bills | 5 | – | – | 51 | 56 | |||||||||||||||||||||||||
– debt securities | 2,759 | 852 | 244 | 273 | 4,128 | |||||||||||||||||||||||||
Financial investments – debt securities | 41,893 | 4,508 | 1,816 | 254 | 48,471 | |||||||||||||||||||||||||
At 31 December 2014 | 44,660 | 5,360 | 2,060 | 578 | 52,658 | |||||||||||||||||||||||||
For footnotes, see page 191.
Credit risk also arises when assumed insurance risk is ceded to reinsurers. The split of liabilities ceded to reinsurers and outstanding reinsurance recoveries, analysed by credit quality, is shown below. Our exposure to third parties
under the reinsurance agreements described in the Appendix to Risk on page 223 is included in this table.
HSBC HOLDINGS PLC
186 |
Table of Contents
Reinsurers’ share of liabilities under insurance contracts42
(Audited)
| Neither past due nor impaired | Past due but | |||||||||||||||||||||||||||||||||||
| Strong | Good | Satisfactory | Sub-standard | not impaired | Total | |||||||||||||||||||||||||||||||
| $m | $m | $m | $m | $m | $m | |||||||||||||||||||||||||||||||
Unit-linked insurance | 84 | 179 | – | – | – | 263 | ||||||||||||||||||||||||||||||
Non-linked insurance50 | 1,102 | 4 | 9 | – | – | 1,115 | ||||||||||||||||||||||||||||||
At 31 December 2015 | 1,186 | 183 | 9 | – | – | 1,378 | ||||||||||||||||||||||||||||||
Reinsurance debtors | 19 | 3 | – | – | 17 | 39 | ||||||||||||||||||||||||||||||
Unit-linked insurance | 75 | 185 | – | – | – | 260 | ||||||||||||||||||||||||||||||
Non-linked insurance50 | 751 | 11 | 10 | – | – | 772 | ||||||||||||||||||||||||||||||
At 31 December 2014 | 826 | 196 | 10 | – | – | 1,032 | ||||||||||||||||||||||||||||||
Reinsurance debtors | 11 | 6 | – | – | 21 | 38 | ||||||||||||||||||||||||||||||
For footnotes, see page 191.
(Audited)
The following tables show the expected undiscounted cash flows for insurance contract liabilities and the remaining contractual maturity of investment contract liabilities at 31 December 2015. The liquidity risk exposure is borne in conjunction with policyholders for the majority of our
business, and wholly borne by the policyholder in the case of unit-linked business.
The classification of Brazilian insurance operations as held for sale has reduced the undiscounted expected cash flows relating to insurance liabilities by $(5.1)bn. However, the profile of the expected maturity of the insurance contracts at 31 December 2015 remained comparable with 2014.
Expected maturity of insurance contract liabilities42
(Audited)
| Expected cash flows (undiscounted) | ||||||||||||||||||||||||||||||
| Within 1 year | 1-5 years | 5-15 years | Over 15 years | Total | ||||||||||||||||||||||||||
| $m | $m | $m | $m | $m | ||||||||||||||||||||||||||
Unit-linked insurance | 549 | 2,164 | 5,945 | 11,080 | 19,738 | |||||||||||||||||||||||||
Non-linked insurance50 | 3,715 | 15,131 | 30,596 | 32,336 | 81,778 | |||||||||||||||||||||||||
At 31 December 2015 | 4,264 | 17,295 | 36,541 | 43,416 | 101,516 | |||||||||||||||||||||||||
Unit-linked insurance | 709 | 3,280 | 9,243 | 14,544 | 27,776 | |||||||||||||||||||||||||
Non-linked insurance50 | 3,504 | 12,718 | 29,905 | 33,108 | 79,235 | |||||||||||||||||||||||||
At 31 December 2014 | 4,213 | 15,998 | 39,148 | 47,652 | 107,011 | |||||||||||||||||||||||||
For footnotes, see page 191.
Remaining contractual maturity of investment contract liabilities
(Audited)
| Liabilities under investment contracts issued by insurance manufacturing subsidiaries | ||||||||||||||||||||||||
| Unit-linked investment contracts | Investment contracts with DPF | Other investment contracts | Total | |||||||||||||||||||||
| $m | $m | $m | $m | |||||||||||||||||||||
Remaining contractual maturity: | ||||||||||||||||||||||||
– undated51 | 1,160 | 22,609 | 3,747 | 27,516 | ||||||||||||||||||||
– due within 1 year | 136 | – | 24 | 160 | ||||||||||||||||||||
– due over 1 year to 5 years | 117 | – | – | 117 | ||||||||||||||||||||
– due over 5 years to 10 years | 170 | – | – | 170 | ||||||||||||||||||||
– due after 10 years | 673 | – | – | 673 | ||||||||||||||||||||
At 31 December 2015 | 2,256 | 22,609 | 3,771 | 28,636 | ||||||||||||||||||||
Remaining contractual maturity: | ||||||||||||||||||||||||
– undated51 | 1,298 | 25,068 | 3,765 | 30,131 | ||||||||||||||||||||
– due within 1 year | 151 | – | 389 | 540 | ||||||||||||||||||||
– due over 1 year to 5 years | 133 | – | – | 133 | ||||||||||||||||||||
– due over 5 years to 10 years | 194 | – | – | 194 | ||||||||||||||||||||
– due after 10 years | 766 | – | – | 766 | ||||||||||||||||||||
At 31 December 2014 | 2,542 | 25,068 | 4,154 | 31,764 | ||||||||||||||||||||
In most cases, policyholders have the option to terminate their contracts at any time and receive the surrender values of their policies. These may be significantly lower than the amounts shown.
HSBC HOLDINGS PLC
187 |
Table of Contents
Report of the Directors: Risk(continued)
Risk management of insurance operations / Other material risks
Insurance risk is the risk, other than financial risk, of loss transferred from the holder of the insurance contract to the issuer (i.e. HSBC). It is principally measured in terms of liabilities under the contracts in force.
The principal risk we face is that, over time, the cost of the contract, including claims and benefits may exceed the
total amount of premiums and investment income received. The cost of claims and benefits can be influenced by many factors, including mortality and morbidity experience, lapse and surrender rates. The following table analyses our life insurance risk exposures by geographical region and by type of business. The insurance risk profile and related exposures remain largely consistent with those observed at 31 December 2014.
Analysis of insurance risk – liabilities under insurance contracts43
(Audited)
| Europe | Asia | Latin America | Total | |||||||||||||||||||||
| $m | $m | $m | $m | |||||||||||||||||||||
Non-linked insurance50 | 749 | 38,525 | 1,264 | 40,538 | ||||||||||||||||||||
– insurance contracts with DPF52 | 343 | 32,071 | – | 32,414 | ||||||||||||||||||||
– credit life | 49 | 80 | – | 129 | ||||||||||||||||||||
– annuities | 69 | 108 | 905 | 1,082 | ||||||||||||||||||||
– other53 | 288 | 6,266 | 359 | 6,913 | ||||||||||||||||||||
Unit-linked insurance | 1,341 | 5,450 | – | 6,791 | ||||||||||||||||||||
Investment contracts with DPF36,52 | 22,609 | – | – | 22,609 | ||||||||||||||||||||
Liabilities under insurance contracts at 31 December 2015 | 24,699 | 43,975 | 1,264 | 69,938 | ||||||||||||||||||||
Non-linked insurance50 | 829 | 34,261 | 1,883 | 36,973 | ||||||||||||||||||||
– insurance contracts with DPF52 | 367 | 29,112 | – | 29,479 | ||||||||||||||||||||
– credit life | 56 | 87 | – | 143 | ||||||||||||||||||||
– annuities | 71 | 127 | 1,275 | 1,473 | ||||||||||||||||||||
– other53 | 335 | 4,935 | 608 | 5,878 | ||||||||||||||||||||
Unit-linked insurance | 1,415 | 5,729 | 4,676 | 11,820 | ||||||||||||||||||||
Investment contracts with DPF36,52 | 25,068 | – | – | 25,068 | ||||||||||||||||||||
Liabilities under insurance contracts at 31 December 2014 | 27,312 | 39,990 | 6,559 | 73,861 | ||||||||||||||||||||
For footnotes, see page 191.
Our most significant life insurance products are insurance contracts with DPF issued in Hong Kong, investment contracts with DPF issued in France and unit-linked contracts issued in Latin America, Hong Kong and the UK.
Sensitivities to non-economic assumptions
(Audited)
Policyholder liabilities and PVIF for life manufacturers are determined by reference to non-economic assumptions including mortality and/or morbidity, lapse rates and expense rates. The table below shows the sensitivity of profit and total equity to reasonably possible changes in these non-economic assumptions at that date across all our insurance manufacturing subsidiaries.
Mortality and morbidity risk is typically associated with life insurance contracts. The effect on profit of an increase in mortality or morbidity depends on the type of business being written. Our largest exposures to mortality and morbidity risk exist in France and Hong Kong.
Sensitivity to lapse rates depends on the type of contracts being written. For insurance contracts, claims are funded by premiums received and income earned on the investment portfolio supporting the liabilities. For a portfolio of term assurance, an increase in lapse rates typically has a negative effect on profit due to the loss
of future income on the lapsed policies. However, some contract lapses have a positive effect on profit due to the existence of policy surrender charges. France, Hong Kong and Singapore are where we are most sensitive to a change in lapse rates.
Expense rate risk is the exposure to a change in the cost of administering insurance contracts. To the extent that increased expenses cannot be passed on to policyholders, an increase in expense rates will have a negative effect on our profits.
(Audited)
| 2015 | 2014 | |||||||||
| $m | $m | |||||||||
Effect on profit after tax and total equity at 31 December | ||||||||||
10% increase in mortality and/or morbidity rates | (70 | ) | (65 | ) | ||||||
10% decrease in mortality and/or morbidity rates | 75 | 72 | ||||||||
10% increase in lapse rates | (90 | ) | (108 | ) | ||||||
10% decrease in lapse rates | 102 | 122 | ||||||||
10% increase in expense rates | (85 | ) | (106 | ) | ||||||
10% decrease in expense rates | 83 | 106 | ||||||||
For footnote, see page 191.
HSBC HOLDINGS PLC
188 |
Table of Contents
A summary of our current policies and practices regarding reputational risk, fiduciary risk, pension risk and sustainability risk is provided in the Appendix to Risk on pages 224 to 226.
Reputational risk is the risk of failure to meet stakeholder expectations as a result of any event, behaviour, action or inaction, either by HSBC itself, our employees or those with whom we are associated, that might cause stakeholders to form a negative view of the Group. This may have financial or non-financial effects, resulting in a loss of confidence, or have other consequences.
Reputational risk relates to stakeholders’ perceptions, whether based on fact or otherwise. Stakeholders’ expectations are constantly changing and thus reputational risk is dynamic and varies between geographical regions, groups and individuals. As a global bank, HSBC has an unwavering commitment to operating to the high standards we have set for ourselves in every jurisdiction. Any lapse in standards of integrity, compliance, customer service or operating efficiency represents a potential reputational risk.
A number of measures to address the requirements of the US DPA and otherwise to enhance our AML, sanctions and other regulatory compliance frameworks have been taken and/or are ongoing. These measures should also serve over time to enhance our reputational risk management. For further details on the implementation of the Global Standards, see Strategic Report on page 21 and ‘Compliance risk’ on page 178.
We have a zero tolerance for knowingly engaging in any business, activity or association where foreseeable reputational risk or damage has not been considered and mitigated. There must be no barriers to open discussion and the escalation of issues that could affect the Group negatively. While there is a level of risk in every aspect of business activity, appropriate consideration of potential harm to HSBC’s good name must be a part of all business decisions.
In 2015, we restructured our Reputational Risk sub-function to increase our focus on the management of reputational risk. With an expanded mandate, the unit is better positioned to provide bespoke advisory services to the business on reputational risks to the Group and to work with the Financial Crime and Regulatory Compliance teams to mitigate such risks where possible.
Fiduciary risk is the risk to the Group of breaching our fiduciary duties when we act in a fiduciary capacity as trustee or investment manager or as mandated by law or regulation.
A fiduciary duty is one where HSBC holds, manages, oversees or has responsibility for assets on behalf of a third party that involves a legal and/or regulatory duty to act with a high standard of care and with good faith. A fiduciary must make decisions and act in the interests of
the third party and must place the wants and needs of the client first, above the needs of the Group.
We may be held liable for damages or other penalties caused by failure to act in accordance with these duties. Fiduciary duties may also arise in other circumstances, such as when we act as an agent for a principal, unless the fiduciary duties are specifically excluded (e.g. under the agency appointment contract).
Our principal fiduciary businesses (the ‘designated businesses’) have developed fiduciary limits, key risk indicators and key performance indicators to monitor their related risks.
We operate a number of defined benefit and defined contribution pension plans throughout the world. Most of our pension risk arises from defined benefit plans. The largest of these is the HSBC Bank (UK) Pension Scheme (‘the principal plan’).
At 31 December 2015, the Group’s aggregate defined benefit pension obligation was $38bn and the net asset on the balance sheet was $3.1bn (2014: $42bn and $2.7bn, respectively). The principal plan is the largest contributor to pension risk in the Group: it contributed $28bn to the Group’s defined benefit obligation and $5.0bn to the Group’s net asset.
The principal plan
The principal plan has a defined benefit section and a defined contribution section and is overseen by a corporate trustee. This trustee has a fiduciary responsibility to run the plan. Unless stated otherwise, this section relates to the defined benefit section.
The investment strategy of the principal plan is to hold the majority of assets in bonds, with the remainder in a diverse range of investments. It also includes some interest rate and inflation swaps to reduce the level of interest rate risk and inflation risk (see Note 41 in the Financial Statements). The target asset allocation of the principal plan at the year-end is shown in the table below.
The principal plan – target asset allocation
| 2015 | 2014 | |||||||||||
| % | % | |||||||||||
Equities54 | 19.4 | 19.4 | ||||||||||
Bonds | 64.5 | 64.5 | ||||||||||
Alternative assets55 | 10.6 | 10.6 | ||||||||||
Property | 5.5 | 5.5 | ||||||||||
Cash56 | – | – | ||||||||||
At 31 December | 100.0 | 100.0 | ||||||||||
For footnotes, see page 191.
The latest actuarial valuation of the principal plan was made as at 31 December 2011 by C G Singer, Fellow of the Institute and Faculty of Actuaries, of Willis Towers Watson Limited. At that date, the market value of the plan’s assets was £18bn ($28bn) (including assets relating to both the defined benefit and defined contribution sections, and additional voluntary contributions). This asset value was the same amount as the actuary said was needed to meet all future expected benefit payments, based on pensions earned to that date and
HSBC HOLDINGS PLC
189 |
Table of Contents
Report of the Directors: Risk(continued)
Other material risks / Footnotes
allowing for expected future salary increases. As there was no resulting surplus or deficit, there was no need for the Bank to pay any additional contributions.
In carrying out this assessment, the future expected pension payments out of the plan were valued with the following assumptions:
| • | future inflation was assumed to be in line with the Retail Price Index (‘RPI’) swap break-even curve at 31 December 2011; |
| • | salary increases were assumed to be 0.5% above the RPI each year; |
| • | pensions were assumed to increase in line with the RPI; |
| • | the projected cash flows were discounted at the Libor swap curve at 31 December 2011 plus a margin for the expected return on the investment strategy of 1.6% a year; |
| • | the mortality assumptions were set based on the SAPS S1 series of tables adjusted to reflect the plan’s actual mortality experience over the prior six years (2006 to 2011); and |
| • | mortality rates were also assumed to improve further in the future in line with standard tables of improvements, the Continuous Mortality Investigation core projections, but with the additional assumption that the long run improvement rate would not fall below 2% a year for men and 1.5% a year for women. |
The benefits expected to be paid from the defined benefit section from 2016 are shown in the chart below.
Future benefit payments ($m)
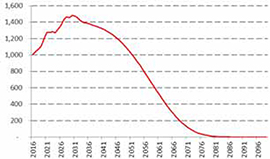
As part of the 31 December 2011 valuation, the actuary also assessed the amount needed to meet the obligations of the principal plan if the plan was stopped and an insurance company was asked to guarantee all future payments. Because the plan is large, it is unlikely that an insurance company would be able to do this for the whole plan, so in practice the Trustee would continue to manage the plan without further support from HSBC. The amount of assets needed under this approach was estimated to be £26bn ($41bn). This is larger than the previous amount because it assumes that people will live for even longer and that the Trustee would adopt a much less risky investment strategy, investing mainly in UK government bonds, which would have a lower expected investment return. It also included an explicit allowance for the future administrative expenses of the plan.
HSBC and the Trustee have developed a general framework which will see the principal plan’s investment strategy become less risky over time. This is referred to as the Target Matching Portfolio (‘TMP’), as it would contain investments that closely match the expected benefit payment profile. Progress towards the TMP can be achieved by investment returns or additional funding from HSBC. In 2013, HSBC agreed to make general framework contributions of £64m ($95m) in each of the calendar years 2013, 2014 and 2015 and £128m ($190m) in 2016. Further contributions had been agreed to be made in future years, which were linked to the continued implementation of the general framework.
The 31 December 2014 valuation has been agreed in principle with the Trustee, and is expected to be finalised by its statutory deadline of 31 March 2016. The final agreement should result in a surplus of circa £500m ($741m) as at the valuation date of 31 December 2014 and on the Trustee’s prudent actuarial assumptions. The general framework implementation has also continued such that the conditions on the future contributions would be removed. As a result the following payments would be payable in the future: £64m ($95m) in each of 2017, 2018, 2019, and £160m ($237m) in each of 2020 and 2021, which in addition to the amounts agreed before would give a total of £640m ($949m) payable from 2016 to 2021.
The principal plan changed in 2015 and from 30 June members stopped accruing future defined benefits. Defined benefit pensions accrued up to 30 June 2015 will retain their link to employee salaries, underpinned by the Consumer Price Index (‘CPI’), while members are still employees of the bank. To support the establishment of the ServCo group and to ensure that employees transferred retained existing pension benefits, a new section of the principal plan was created with segregated assets and liabilities. The new section provides ServCo group employees with their defined contribution pension and, where relevant, defined benefit pension benefits arising from future salary increases above CPI.
Defined contribution plans
Our global strategy is to move from defined benefit to defined contribution plans, where local law allows and it is considered competitive to do so. In defined contribution pension plans, the sponsor contributions are known, while the ultimate pension benefit will vary, typically with investment returns achieved by investment choices made by the employee. While the market risk of defined contribution plans is significantly less than that of defined benefit plans, the Bank is still exposed to operational and reputational risk.
Sustainability risk
Assessing the environmental and social impacts of providing finance to our customers is integral to our overall risk management processes.
In 2015, we continued to implement all of our sustainability risk policies. Our training for risk and relationship managers during the year focused on the new policies on agricultural commodities, forestry and World Heritage Sites and Ramsar Wetlands, issued in 2014. Following a recommendation by Internal Audit in 2015, we took steps to integrate the management of sustainability risk more fully into the Risk
HSBC HOLDINGS PLC
190 |
Table of Contents
Function. For example, we raised standards of risk analysis and policy implementation; updated internal instruction
manuals; and improved the way sustainability risk is recorded in our information management system.
Footnotes to Risk
Managing risk
| 1 | The sum of balances presented does not agree to consolidated amounts because inter-company eliminations are not presented here. |
Credit risk
| 2 | The amount of the loan commitments reflects, where relevant, the expected level of take-up of pre-approved loan offers made by mailshots to personal customers. In addition to those amounts, there is a further maximum possible exposure to credit risk of $59bn (2014: $71bn), reflecting the full take-up of loan commitments. The take-up of such offers is generally at low levels. At 31 December 2015, the credit quality of loan and other credit-related commitments was: $348bn strong, $180bn good, $129bn satisfactory, $9bn sub-standard and $1bn impaired. |
| 3 | ‘Other personal lending’ includes second lien mortgages and other property-related lending. |
| 4 | ‘Other commercial loans and advances’ includes advances in respect of agriculture, transport, energy utilities and ABS reclassified to ‘Loans and advances’. |
| 5 | Impairment allowances are not reported for financial instruments, for which the carrying amount is reduced directly for impairment and not through the use of an allowance account. |
| 6 | Impairment is not measured for assets held in trading portfolios or designated at fair value as assets in such portfolios are managed according to movements in fair value, and the fair value movement is taken directly to the income statement. Consequently, we report all such balances under ‘Neither past due nor impaired’. |
| 7 | Loans and advances to customers’ includes asset-backed securities that have been externally rated as strong (2015: $504m; 2014: $1.2bn), good (2015: $95m; 2014: $256m), satisfactory (2015: $107m; 2014: $332m), sub-standard (2015: $19m; 2014: $94m) and impaired (2015: $73m; 2014: $128m). |
| 8 | ‘Collection re-age’ includes loans that are reset to ‘current’ and any arrears are reset but does not involve any changes to the original terms and conditions of the loan, where the account is brought up-to-date without fully paying the outstanding arrears but after the demonstration of ongoing payment ability. |
| 9 | ‘Modification re-age’ includes loans where there are changes to the original terms and conditions of the loan, either temporarily or permanently, and also resets the contractual delinquency status of an account to current. |
| 10 | ‘Collectively assessed impairment allowances’ are allocated to geographical segments based on the location of the office booking the allowances or provisions. |
| 11 | Included within ‘Exchange and other movements’ is $2.1bn of impairment allowances reclassified to held for sale (2014: $0.4bn). |
| 12 | Of the $2,134m (2014: $2,724m) of renegotiated loans, $477m (2014: $608m) were neither past due nor impaired, $1m (2014: $1m) was past due but not impaired and $1,656m (2014: $2,115m) were impaired. |
| 13 | Includes balances in Middle East and North Africa that are impaired and past due and therefore considered due on demand. |
| 14 | French Banking Federation Master Agreement Relating to Transactions on Forward Financial Instruments plus CSA equivalent. |
| 15 | The German Master Agreement for Financial Derivative Transactions. |
| 16 | HSBC Finance lending is on a management basis and includes loans transferred to HSBC USA Inc. which are managed by HSBC Finance. |
| 17 | Included in this category are loans of $1.2bn (2014: $1.5bn) that have been re-aged once and were less than 60 days past due at the point of re-age. These loans are not classified as impaired following re-age due to the overall expectation that these customers will perform on the original contractual terms of their borrowing in the future. |
| 18 | ‘Currency translation’ is the effect of translating the results of subsidiaries and associates for the previous year at the average rates of exchange applicable in the current year. |
Liquidity and funding
| 19 | The HSBC UK Liquidity Group shown comprises four legal entities; HSBC Bank plc (including all overseas branches, and SPEs consolidated by HSBC Bank plc for Financial Statement purposes), Marks and Spencer Financial Services plc, HSBC Private Bank (UK) Ltd and HSBC Trust Company (UK) Limited, managed as a single operating entity, in line with the application of UK liquidity regulation as agreed with the UK PRA. |
| 20 | The Hongkong and Shanghai Banking Corporation – Hong Kong branch and The Hongkong and Shanghai Banking Corporation – Singapore branch represent the material activities of the Hongkong and Shanghai Banking Corporation. Each branch is monitored and controlled for liquidity and funding risk purposes as a stand-alone operating entity. |
| 21 | The HSBC USA principal entity shown represents the HSBC USA Inc consolidated group; predominantly HSBC USA Inc and HSBC Bank USA, NA. The HSBC USA Inc consolidated group is managed as a single operating entity. |
| 22 | HSBC France and HSBC Canada represent the consolidated banking operations of the Group in France and Canada respectively. HSBC France and HSBC Canada are each managed as single distinct operating entities for liquidity purposes. |
| 23 | The most favourable metrics are smaller advances to core funding and larger stressed one-month and three-month coverage ratios. |
| 24 | The total shown for other principal HSBC operating entities represents the combined position of all the other operating entities overseen directly by the Risk Management Meeting of the GMB. This coverage changed during 2015 and so comparative figures for 2014 have been re-stated to enable a like-for-like comparison. |
| 25 | Estimated liquidity value represents the expected realisable value of assets prior to management assumed haircuts. |
| 26 | The undrawn balance for the five largest committed liquidity facilities provided to customers other than facilities to conduits. |
| 27 | The undrawn balance for the total of all committed liquidity facilities provided to the largest market sector, other than facilities to conduits. |
| 28 | The residual contractual maturity profile of the balance sheet is set out on in Note 31 on the Financial Statements. |
HSBC HOLDINGS PLC
191 |
Table of Contents
Report of the Directors: Risk(continued)
Footnotes / Appendix to Risk – Policies and practices
Market risk
| 29 | Trading portfolios comprise positions arising from the market-making and warehousing of customer-derived positions. |
| 30 | Portfolio diversification is the market risk dispersion effect of holding a portfolio containing different risk types. It represents the reduction in unsystematic market risk that occurs when combining a number of different risk types, for example, interest rate, equity and foreign exchange, together in one portfolio. It is measured as the difference between the sum of the VaR by individual risk type and the combined total VaR. A negative number represents the benefit of portfolio diversification. As the maximum and minimum occurs on different days for different risk types, it is not meaningful to calculate a portfolio diversification benefit for these measures. |
| 31 | The total VaR is non-additive across risk types due to diversification effects. |
| 32 | Investments in private equity are primarily made through managed funds that are subject to limits on the amount of investment. Potential new commitments are subject to risk appraisal to ensure that industry and geographical concentrations remain within acceptable levels for the portfolio as a whole. Regular reviews are performed to substantiate the valuation of the investments within the portfolio. |
| 33 | Investments held to facilitate ongoing business include holdings in government-sponsored enterprises and local stock exchanges. |
| 34 | Instead of assuming that all interest rates move together, we group our interest rate exposures into currency blocs whose rates are considered likely to move together. See ‘Cautionary statement regarding forward-looking statements’. |
Risk management of insurance operations
| 35 | ‘Other’ includes term assurance, credit life insurance, universal life insurance and remaining non-life insurance. |
| 36 | Although investment contracts with discretionary participation features (‘DPF’) are financial investments, HSBC continues to account for them as insurance contracts as required by IFRS 4 ‘Insurance Contracts’. The corresponding liabilities are therefore recorded as ‘liabilities under insurance contracts’. |
| 37 | ‘Other assets and liabilities’ shows shareholder assets as well as assets and liabilities classified as held for sale. The majority of the assets for insurance businesses classified as held for sale are reported as ‘Other assets and investment properties’ and totalled $4.1bn at 31 December 2015 (2014: $6.8bn). The majority of these assets were debt and equity securities and PVIF. All liabilities for insurance businesses classified as held for sale are reported in ‘Other liabilities’ and totalled $3.7bn at 31 December 2015 (2014: $6.8bn). The majority of these liabilities were liabilities under insurance contracts and liabilities under investment contracts. |
| 38 | Financial investments held to maturity (HTM) and available for sale (AFS). |
| 39 | Comprise mainly loans and advances to banks, cash and intercompany balances with other non-insurance legal entities. |
| 40 | Present value of in-force long-term insurance contracts and investment contracts with DPF. |
| 41 | ‘Deferred tax’ includes the deferred tax liabilities arising on recognition of PVIF. |
| 42 | Does not include associated insurance company SABB Takaful Company or joint venture insurance company Canara HSBC Oriental Bank of Commerce Life Insurance Company Limited. |
| 43 | HSBC has no insurance manufacturing subsidiaries in Middle East and North Africa or North America. |
| 44 | Comprise unit-linked life insurance contracts and linked long-term investment contracts. |
| 45 | Comprise all insurance and long-term investment contracts other than those classified as unit-linked. |
| 46 | A block of contracts in France with guaranteed nominal annual returns in the range 1.25%-3.72% are reported entirely in the 2.0%-4.0% category in line with the average guaranteed return of 2.7% offered to policyholders by these contracts. |
| 47 | Real annual return guarantees provide the policyholder a guaranteed return in excess of the rate of inflation, and are supported by inflation-linked debt securities with yields that are also expressed in real terms. |
| 48 | Where a –100 basis point parallel shift in the yield curve would result in a negative interest rate, the effects on profit after tax and total equity have been calculated using a minimum rate of 0%. |
| 49 | Shareholders’ funds comprise solvency and unencumbered assets. |
| 50 | ‘Non-linked insurance’ comprises all insurance contracts other than unit-linked, including remaining non-life business. |
| 51 | In most cases, policyholders have the option to terminate their contracts at any time and receive the surrender values of their policies. These may be significantly lower than the amounts shown. |
| 52 | Insurance contracts and investment contracts with DPF can give policyholders the contractual right to receive, as a supplement to their guaranteed benefits, additional benefits that may be a significant portion of the total contractual benefits, but whose amount and timing are determined by HSBC. These additional benefits are contractually based on the performance of a specified pool of contracts or assets, or the profit of the company issuing the contracts. |
| 53 | ‘Other’ includes term assurance, universal life assurance and remaining non-life insurance. |
Pension risk
| 54 | In 2014, option overlay strategies which are expected to improve the risk/return profile of the equity allocation were implemented. |
| 55 | Alternative assets include ABSs, MBSs and infrastructure assets. |
| 56 | Whilst there is no target cash allocation, the amount of cash is expected to vary between 0%-5% depending upon the liquidity requirements of the scheme, which will affect the actual allocation of bonds correspondingly. |
HSBC HOLDINGS PLC
192 |
Table of Contents
Report of the Directors: Financial Review(continued)
Risk elements in the loan portfolio
| 57 | In addition to the numbers presented there were $2.1bn of impaired loans (2014: $0.5bn); nil unimpaired loans contractually more than 90 days past due as to principal or interest (2014: $1m); and $8m of troubled debt restructurings (not included in the classifications above) (2014: nil), all relating to assets held for sale at 31 December 2015. |
| 58 | Assets held for resale represent assets obtained by taking possession of collateral held as security for financial assets. |
| 59 | Ratio excludes trading loans classified as in default. |
Country distribution of outstandings and cross-border exposures
| 60 | These balances were between 0.75% and 1% of total assets. All other balances were above 1%. |
HSBC HOLDINGS PLC
192a |
Table of Contents
Appendix to Risk
Risk policies and practices
This appendix describes the significant policies and practices employed by HSBC in managing our credit risk, liquidity and funding, market risk, operational risk (including compliance risk, legal risk and fiduciary risk), insurance risk, reputational risk, pension risk and sustainability risk.
Our strong risk governance reflects the importance placed by the Board and the Group Risk Committee (‘GRC’) on shaping the Group’s risk strategy and managing risks effectively. It is supported by a clear policy framework of risk ownership, a risk appetite process through which the types and levels of risk that we are prepared to accept in executing our strategy are articulated and monitored, performance scorecards cascaded from the Group Management Board (‘GMB’) that align business and risk objectives, and the accountability of all staff for identifying, assessing and managing risks within the scope of their assigned responsibilities. This personal accountability, reinforced by the governance structure, mandatory learning and our approach to remuneration, helps to foster a disciplined and constructive culture of risk management and control throughout HSBC.
The executive and non-executive risk governance structures and their interactions are set out in the following table. Each major operating subsidiary has established a board committee with non-executive responsibility for oversight ofrisk-related matters and an executive meeting with responsibility for risk-related matters.
Governance structure for the management of risk
Authority |
Membership |
Responsibilities include:
| ||||||
| Board | Executive and non-executive Directors | • Approving risk appetite, strategy and performance targets for the Group
• Approving appointment of chief risk officers of subsidiary companies
• Encouraging a strong risk governance culture which shapes the Group’s attitude to risk
| ||||||
Group Risk Committee (‘GRC’) | Independent non-executive Directors | • Advising the Board on:
– risk appetite and alignment with strategy
– alignment of remuneration with risk appetite (through advice to the Group Remuneration Committee)
– risks associated with proposed strategic acquisitions and disposals
• Overseeing high-level risk related matters
• Reviewing the effectiveness of the Group’s systems of risk management and internal controls (other than over financial reporting)
• Overseeing the maintenance and development of a supportive culture in relation to the management of risk
| ||||||
Financial System Vulnerabilities Committee | Non-executive Directors, including the Chairman of the Group Remuneration Committee, and co-opted non-director members | • Overseeing controls and procedures designed to identify areas of exposure to financial crime or system abuse
• Overseeing matters relating to anti-money laundering, sanctions, terrorist financing and proliferation financing
• Reviewing policies and procedures to ensure continuing obligations to regulatory and law enforcement agencies are met
| ||||||
Conduct & Values Committee | Independent non-executive Directors | • Ensuring that in the conduct of its business, HSBC treats all stakeholders fairly
• Advising the Board on HSBC policies, procedures and standards to ensure that the Group conducts business responsibly and consistently adheres to the HSBC Values | ||||||
HSBC HOLDINGS PLC
193 |
Table of Contents
Report of the Directors: Risk(continued)
Appendix to Risk – Policies and practices
Authority
| Membership
| Responsibilities include:
| ||||||
Risk Management | Group Chief Risk Officer
Chief Legal Officer
Group Chief Executive
Group Finance Director
All other Group Managing Directors | • Formulating high-level global risk policy
• Supporting the Group Chief Risk Officer in exercising delegated risk management authority
• Overseeing implementation of risk appetite and controls
• Monitoring all categories of risk and determining appropriate mitigating action
• Promoting a supportive Group culture in relation to risk management and conduct
• Implementing Global Standards throughout the Group | ||||||
Global Risk Management Board | Group Chief Risk Officer
Chief Risk Officers of HSBC’s global businesses and regions
Heads of Global Risk sub-functions | • Supporting the RMM and the Group Chief Risk Officer in providing strategic direction for the Global Risk function, setting priorities and overseeing their execution
• Overseeing consistent approach to accountability for, and mitigation of, risk across the Global Risk function | ||||||
Global Business Risk Management Committees | Global Business Chief Risk Officer
Global Business Chief Executive
Global Business Chief Financial Officer
Heads of Global Risk sub-functions, as appropriate | • Forward looking assessment of changes in global business activities or the markets in which it operates, analysing the possible risk impact and taking appropriate action
• Overseeing the implementation of global business risk appetite and controls
• Monitoring all categories of risk and determining appropriate mitigating actions
• Promoting a strong risk culture | ||||||
Regional Risk Management Committees | Regional Chief Risk Officer
Regional Chief Executive Officer
Regional Chief Financial Officer
Regional Global Business Chief
Heads of Global Risk sub-functions, as appropriate | • Formulating regional specific risk policy
• Overseeing the implementation of regional risk appetite and controls
• Monitoring all categories of risk and determining appropriate mitigating actions
• Promoting a strong risk culture | ||||||
Subsidiary board committees responsible for risk-related matters and global business risk committees | Independent non-executive directors and/or HSBC employees with no line or functional responsibility for the activities of the relevant subsidiary or global business, as appropriate | • Providing reports to the GRC or intermediate risk committee on risk-related matters and internal controls (other than over financial reporting) of relevant subsidiaries or businesses, as requested | ||||||
The governance framework also defines the required structure for Risk sub-functions, stress testing and other key areas at Group, global business, regional and country level.
The Group’s Qualitative Risk Appetite Statement (‘RAS’) formally articulates our overarching risk appetite principles, serves as a guide in embedding our risk appetite framework and supports strategic and operational decision-making across the Group.
| • | Strong capital position: we are to have a strong capital position defined by robust regulatory and internal capital ratios. The progression of dividends should be consistent with the growth of the Group’s profitability and is predicated on the ability to meet all capital requirements in a timely manner. Both the Group and its individual legal entities must self-capitalise with capital generation, net of dividends, exceeding the capital needed to support organic growth in the entity’s risk-weighted assets; |
| • | Liquidity and funding management: operating entities are required to manage liquidity risk on a stand-alone basis with no implicit reliance on the Group or central banks and be able to withstand a Group-defined remote liquidity stress scenario. Customer assets and other illiquid assets must be funded with reliable and stable sources of funding; |
| • | Risk return relationship:we aim to generate returns in line with the risk taken and in alignment with strategic plans, strategic business outlooks and risk management policies; |
HSBC HOLDINGS PLC
194 |
Table of Contents
| • | Sustainable and diversified earnings mix:global businesses and regions must support sustainable, well diversified and non-volatile earning streams, delivering consistent returns for shareholders; |
| • | Reputation risk:we tolerate a limited degree of reputational risk arising from business activities or associations where the risk has been escalated to the appropriate level of management. We have zero tolerance for knowingly engaging in any business, activity or association where foreseeable reputational risk/damage has not been considered and/or mitigated; |
| • | Financial crime compliance:we will operate with integrity to the most effective financial crime risk management standards, address financial system vulnerability through a robust financial crime risk management framework, and ensure appropriate mitigating systems and controls are in place to prevent and detect financial crime. We have no appetite for deliberately or knowingly facilitating business that gives rise to illicit activity; and |
| • | Regulatory compliance:we have no appetite for deliberately or knowingly causing detriment to consumers arising from our products and services, or incurring a breach of the letter or spirit of regulatory requirements. We have no appetite for inappropriate market conduct by a member of staff or by any Group business. |
Credit risk
(Audited)
The role of independent credit control unit is fulfilled by the Global Risk function. Credit approval authorities are delegated by the Board to the Chief Executive Officer of HSBC Holdings together with the authority to sub-delegate them. Similar credit approval authorities are delegated by the boards of subsidiary companies to their respective executive officers. In each major subsidiary, a Chief Risk Officer reports to the local Chief Executive Officer on credit-related issues, while maintaining a direct functional reporting line to the Group Chief Risk Officer in Global Risk. Details of the roles and responsibilities of the credit risk management function and the policies and procedures for managing credit risk are set out below. There were no significant changes in 2015.
The high-level oversight and management of credit risk provided globally by the Credit Risk sub-function in Global Risk • to formulate Group credit policy. Compliance, subject to approved dispensations, is mandatory for all operating companies which must develop local credit policies consistent with Group policies;
• to guide operating companies on the Group’s appetite for credit risk exposure to specified market sectors, activities and banking products and controlling exposures to certain higher-risk sectors;
• to undertake an independent review and objective assessment of risk. Global Risk assesses all commercial non-bank credit facilities and exposures over designated limits, prior to the facilities being committed to customers or transactions being undertaken;
• to monitor the performance and management of portfolios across the Group;
• to control exposure to sovereign entities, banks and other financial institutions, and debt securities which are not held solely for the purpose of trading;
• to set Group policy on large credit exposures, ensuring that concentrations of exposure by counterparty, sector or geography do not become excessive in relation to our capital base, and remain within internal and regulatory limits;
• to control our cross-border exposures;
• to maintain and develop our risk rating framework and systems, the governance of which is under the general oversight of the Group Model Oversight Committee (‘MOC’). The Group MOC meets bi-monthly and reports to the RMM. It is chaired by the Global Risk function and its membership is drawn from Global Risk and relevant global functions or businesses;
• to report to the RMM, the GRC and the Board on high risk portfolios, risk concentrations, country limits and cross-border exposures, large impaired accounts, impairment allowances, stress testing results and recommendations and retail portfolio performance; and
• to act on behalf of HSBC Holdings as the primary interface, for credit-related issues, with the Bank of England, the PRA, local regulators, rating agencies, analysts and counterparts in major banks and non-bank financial institutions.
|
Principal objectives of our credit risk management
| • | to maintain across HSBC a strong culture of responsible lending and a robust risk policy and control framework; |
| • | to both partner and challenge our businesses in defining, implementing and continually re-evaluating our risk appetite under actual and scenario conditions; and |
| • | to ensure there is independent, expert scrutiny of credit risks, their costs and their mitigation. |
HSBC HOLDINGS PLC
195 |
Table of Contents
Report of the Directors: Risk(continued)
Appendix to Risk – Policies and practices
(Audited)
Concentrations of credit risk arise when a number of counterparties or exposures have comparable economic characteristics or such counterparties are engaged in similar activities or operate in the same geographical areas or industry sectors so that their collective ability to meet contractual obligations is uniformly affected by changes in economic, political or other conditions. We use a number of controls and measures to minimise undue concentration of exposure in our portfolios across industry, country and global business. These include portfolio and counterparty limits, approval and review controls, and stress testing.
Wrong-way risk occurs when a counterparty’s exposures are adversely correlated with its credit quality. There are two types of wrong-way risk:
| • | general wrong-way risk occurs when the probability of counterparty default is positively correlated with general risk factors such as, for example, where the counterparty is resident and/or incorporated in a higher-risk country and seeks to sell a non-domestic currency in exchange for its home currency; and |
| • | specific wrong-way risk occurs when the exposure to a particular counterparty is positively correlated with the probability of counterparty default, such as a reverse repo on the counterparty’s own bonds. It is our policy that specific wrong-way transactions are approved on a case-by-case basis. |
We use a range of tools to monitor and control wrong-way risk, including requiring the business to obtain prior approval before undertaking wrong-way risk transactions outside pre-agreed guidelines.
Credit quality of financial instruments
(Audited)
Our credit risk rating systems and processes differentiate exposures in order to highlight those with greater risk factors and higher potential severity of loss. In the case of individually significant accounts that are predominantly within our wholesale businesses, risk ratings are reviewed regularly and any amendments are implemented promptly. In our retail businesses, risk is assessed and managed using a wide range of risk and pricing models to generate portfolio data.
Our risk rating system facilitates the internal ratings-based approach under the Basel framework adopted by the Group to support calculation of our minimum credit regulatory capital requirement. Our credit quality classifications are defined below.
Special attention is paid to problem exposures in order to accelerate remedial action. When appropriate, our operating companies use specialist units to provide customers with support to help them avoid default if possible.
Group and regional Credit Review and Risk Identification teams regularly review exposures and processes in order to provide an independent, rigorous assessment of credit risk across the Group, reinforce secondary risk management controls and share best practice. Internal audit, as a third line control function, focuses on risks with a global perspective and on the design and effectiveness of primary and secondary controls, carrying out oversight audits via the sampling of global and regional control frameworks, themed audits of key or emerging risks and project audits to assess major change initiatives.
The five credit quality classifications defined below each encompass a range of granular internal credit rating grades assigned to wholesale and retail lending businesses and the external ratings attributed by external agencies to debt securities.
| Debt securities and other bills | Wholesale lending and derivatives | Retail lending | ||||||||||||||||||
External credit rating | Internal credit rating | 12 month probability of default % | Internal credit rating1 | Expected loss % | ||||||||||||||||
Quality classification | ||||||||||||||||||||
Strong | A–and above | CRR21 to CRR2 | 0 –0.169 | EL31 to EL2 | 0 –0.999 | |||||||||||||||
Good | BBB+ to BBB– | CRR3 | 0.170 –0.740 | EL3 | 1.000 –4.999 | |||||||||||||||
Satisfactory | | BB+ to B and unrated | | CRR4 to CRR5 | 0.741 –4.914 | EL4 to EL5 | 5.000 –19.999 | |||||||||||||
Sub-standard | B– to C | CRR6 to CRR8 | 4.915 –99.999 | EL6 to EL8 | 20.000 –99.999 | |||||||||||||||
Impaired | Default | CRR9 to CRR10 | 100 | EL9 to EL10 | 100+ or defaulted | 4 | ||||||||||||||
| 1 | We observe the disclosure convention that, in addition to those classified as EL9 to EL10, retail accounts classified EL1 to EL8 that are delinquent by 90 days or more are considered impaired, unless individually they have been assessed as not impaired (see page 127, ‘Past due but not impaired gross financial instruments’). |
| 2 | Customer risk rating. |
| 3 | Expected loss. |
| 4 | The EL percentage is derived through a combination of PD and LGD, and may exceed 100% in circumstances where the LGD is above 100% reflecting the cost of recoveries. |
HSBC HOLDINGS PLC 196 |
Table of Contents
Quality classification definitions
• ‘Strong’ exposures demonstrate a strong capacity to meet financial commitments, with negligible or low probability of default and/or low levels of expected loss. Retail accounts operate within product parameters and only exceptionally show any period of delinquency.
• ‘Good’ exposures require closer monitoring and demonstrate a good capacity to meet financial commitments, with low default risk. Retail accounts typically show only short periods of delinquency, with any losses expected to be minimal following the adoption of recovery processes.
• ‘Satisfactory’ exposures require closer monitoring and demonstrate an average to fair capacity to meet financial commitments, with moderate default risk. Retail accounts typically show only short periods of delinquency, with any losses expected to be minor following the adoption of recovery processes.
• ‘Sub-standard’ exposures require varying degrees of special attention and default risk is of greater concern. Retail portfolio segments show longer delinquency periods of generally up to 90 days past due and/or expected losses are higher due to a reduced ability to mitigate these through security realisation or other recovery processes.
• ‘Impaired’ exposures have been assessed as impaired. These include wholesale exposures where the bank considers that either the customer is unlikely to pay its credit obligations in full, without recourse by the bank to the actions such as realising security if held, or the customer is past due more than 90 days on any material credit obligation; retail accounts include loans and advances classified as EL9 to EL10, and for those classified EL1 to EL8 they are greater than 90 days past due unless individually they have been assessed as not impaired; and renegotiated loans that have met the requirements to be disclosed as impaired and have not yet met the criteria to be returned to the unimpaired portfolio (see below).
|
The customer risk rating (‘CRR’) 10-grade scale summarises a more granular underlying23-grade scale of obligor probability of default (‘PD’). All HSBC customers are rated using the 10- or 23-grade scale, depending on the degree of sophistication of the Basel II approach adopted for the exposure.
Each CRR band is associated with an external rating grade by reference to long-run default rates for that grade, represented by the average of issuer-weighted historical default rates. This mapping between internal and external ratings is indicative and may vary over time.
The expected loss (‘EL’) 10-grade scale for retail business summarises a more granular underlying EL scale for this customer segment; this combines obligor and facility/product risk factors in a composite measure.
For debt securities and certain other financial instruments, external ratings have been aligned to the five quality classifications based upon the mapping of related CRR to external credit grade.
Renegotiated loans and forbearance
(Audited)
A range of forbearance strategies is employed in order to improve the management of customer relationships, maximise collection opportunities and, if possible, avoid default, foreclosure or repossession. They include extended payment terms, a reduction in interest or principal repayments, approved external debt management plans, debt consolidations, the deferral of foreclosures and other forms of loan modifications and re-ageing.
Our policies and practices are based on criteria which enable local management to judge whether repayment is likely to continue. These typically provide a customer with terms and conditions that are more favourable than those provided initially. Loan forbearance is only granted in situations where the customer has showed a willingness to repay their loan and is expected to be able to meet the revised obligations.
Identifying renegotiated loans
The contractual terms of a loan may be modified for a number of reasons including changing market conditions, customer retention and other factors not related to the current or potential credit deterioration of a customer. When the contractual payment terms of a loan are modified because we have significant concerns about the borrower’s ability to meet contractual payments when due, these loans are classified as ‘renegotiated loans’.
For retail lending our credit risk management policy sets out restrictions on the number and frequency of renegotiations, the minimum period an account must have been opened before any renegotiation can be considered and the number of qualifying payments that must be received. The application of this policy varies according to the nature of the market, the product and the management of customer relationships through the occurrence of exceptional events. When considering whether there is significant concern regarding a customer’s ability to meet contractual loan repayments when due, we assess the customer’s delinquency status, account behaviour, repayment history, current financial situation and continued ability to repay. If the customer is not meeting contractual repayments or it is evident that they will be unable to do so without the renegotiation, there will be a significant concern regarding their ability to meet contractual payments, and the loan will be disclosed as impaired, unless the concession granted is insignificant as discussed below.
HSBC HOLDINGS PLC
197 |
Table of Contents
Report of the Directors: Risk(continued)
Appendix to Risk – Policies and practices
For loan restructurings in wholesale lending, indicators of significant concerns regarding a borrower’s ability to pay include:
| • | the debtor is currently in default on any of its debt; |
| • | the debtor has declared or is in the process of declaring bankruptcy or entering into a similar process; |
| • | there is significant doubt as to whether the debtor will continue to be a going concern; |
| • | currently, the debtor has securities that have been delisted, are in the process of being delisted, or are under threat of being delisted from an exchange as a result of trading or financial difficulties; |
| • | based on estimates and projections that only encompass current business capabilities, the Group forecasts that the debtor’s entity-specific cash flows will be insufficient to service the debt (both interest and principal) in accordance with the contractual terms of the existing agreement through maturity. In this instance, actual payment default may not yet have occurred; and |
| • | absent the modification, the debtor cannot obtain funds from sources other than its existing creditors at an effective interest rate equal to the current market interest rate for similar debt for a non-distressed debtor. |
Where the modification of a loan’s contractual payment terms represents a concession for economic or legal reasons relating to the borrower’s financial difficulty, and is a concession that we would not otherwise consider, then the renegotiated loan is disclosed as impaired in accordance with our impaired loan disclosure convention described in more detail on page 354, unless the concession is insignificant and there are no other indicators of impairment. Insignificant concessions are primarily restricted to our CML portfolio in HSBC Finance, where loans which are in the early stages of delinquency (less than 60 days delinquent) and typically have the equivalent of two payments deferred for the first time, are excluded from our impaired loan classification, as the contractual payment deferrals are deemed to be insignificant compared with payments due on the loan as a whole. For details of HSBC Finance’s loan renegotiation programmes and portfolios, see pages 129 and 145.
Credit quality classification of renegotiated loans
(Audited)
Under IFRSs, an entity is required to assess whether there is objective evidence that financial assets are impaired at the end of each reporting period. A loan is impaired and an impairment allowance is recognised when there is objective evidence of a loss event that has an effect on the cash flows of the loan which can be reliably estimated. Granting a concession to a customer that we would not otherwise consider, as a result of their financial difficulty, is objective evidence of impairment and impairment losses are measured accordingly.
A renegotiated loan is presented as impaired when:
| • | there has been a change in contractual cash flows as a result of a concession which the lender would otherwise not consider, and |
| • | it is probable that without the concession, the borrower would be unable to meet contractual payment obligations in full. |
This presentation applies unless the concession is insignificant and there are no other indicators of impairment.
The renegotiated loan will continue to be disclosed as impaired until there is sufficient evidence to demonstrate a significant reduction in the risk of non-payment of future cash flows, and there are no other indicators of impairment. For loans that are assessed for impairment on a collective basis, the evidence typically comprises a history of payment performance against the original or revised terms, as appropriate to the circumstances. For loans that are assessed for impairment on an individual basis, all available evidence is assessed on a case-by-case basis.
For corporate and commercial loans, which are individually assessed for impairment and where non-monthly payments are more commonly agreed, the history of payment performance will depend on the underlying structure of payments agreed as part of the restructuring.
For retail lending the minimum period of payment performance required depends on the nature of loans in the portfolio, but is typically between six and twelve months. Where portfolios have more significant levels of forbearance activity, such as that undertaken by HSBC Finance, the minimum repayment performance period required may be substantially more (for further details on HSBC Finance see page 145). Payment performance periods are monitored to ensure they remain appropriate to the levels of recidivism observed within the portfolio. These performance periods are in addition to a minimum of two payments which must be received within a 60-day period (in the case of HSBC Finance, in certain circumstances, for example where debt has been restructured in bankruptcy proceedings, fewer or no qualifying payments may be required). The qualifying payments are required in order to demonstrate that the renegotiated terms are sustainable for the borrower.
Renegotiated loans are classified as unimpaired where the renegotiation has resulted from significant concern about a borrower’s ability to meet their contractual payment terms but the concession is not significant and the contractual cash flows are expected to be collected in full following the renegotiation.
HSBC HOLDINGS PLC
198 |
Table of Contents
Derecognition of renegotiated loans
(Audited)
Loans that have been identified as renegotiated retain this designation until maturity or derecognition. When a loan is restructured as part of a forbearance strategy and the restructuring results in derecognition of the existing loan, the new loan is disclosed as renegotiated.
When determining whether a loan that is restructured should be derecognised and a new loan recognised, we consider the extent to which the changes to the original contractual terms result in the renegotiated loan, considered as a whole, being a substantially different financial instrument. The following are examples of circumstances that individually are likely to result in this test being met and derecognition accounting being applied:
| • | an uncollateralised loan becomes fully collateralised or vice versa; |
| • | removal or addition of debt-to-equity conversion features attached to the loan agreement that have substance; |
| • | a change in the currency in which the principal or interest is denominated, other than a conversion at a current market rate; or |
| • | a change in the obligor. |
The following are examples of factors that we consider may indicate that the revised loan is a substantially different financial instrument, but are unlikely to be conclusive in themselves:
| • | conditions added to the contract that substantially alter the credit risk of the loan (e.g. conditions on how the customer’s business will be conducted in order to meet the revised terms of the loan); |
| • | guarantees are put in place that are expected to substantially change the source of repayment and it is fully expected that the guarantees have value; |
| • | rate structure changes (that are not existing contractual features) or debt consolidation where these changes are not purely a concession to allow the obligor to pay a monthly amount that is affordable given its credit distressed circumstances; |
| • | a change in the liquidation preference or ranking of the instrument that is not a debt-to-equity conversion; or |
| • | the collateral level (as a % of the loan) has doubled and the resulting coverage is more than 50%. |
Renegotiated loans and recognition of impairment allowances
(Audited)
For retail lending, renegotiated loans are segregated from other parts of the loan portfolio for collective impairment assessment to reflect the higher rates of losses often encountered in these segments. When empirical evidence indicates an increased propensity to default and higher losses on such accounts, such as for re-aged loans in the US, the use of roll-rate (or discounted cash flow) methodology ensures these factors are taken into account when calculating impairment allowances by applying roll rates specifically calculated on the pool of loans subject to forbearance. When the portfolio size is small or when information is insufficient or not reliable enough to adopt a roll-rate (or discounted cash flow) methodology, a basic formulaic approach based on historical loss rate experience is used. As a result of our collective impairment methodology, we recognise collective impairment allowances on homogeneous groups of loans, including renegotiated loans, where there is historical evidence that there is a likelihood that loans in these groups will progress through the various stages of delinquency, and ultimately prove irrecoverable as a result of events occurring before the balance sheet date. This treatment applies irrespective of whether or not those loans are presented as impaired in accordance with our impaired loans disclosure convention.
In the corporate and commercial sectors, renegotiated loans are typically assessed individually. Credit risk ratings are intrinsic to the impairment assessment. A distressed restructuring is classified as an impaired loan. The individual impairment assessment takes into account the higher risk of the non-payment of future cash flows inherent in renegotiated loans.
Corporate and commercial forbearance
In the corporate and commercial sectors, forbearance activity is undertaken selectively where it has been identified that repayment difficulties against the original terms have already materialised, or are very likely to materialise. These cases are treated as impaired loans where:
| • | the customer is experiencing, or is very likely to experience, difficulty in meeting a payment obligation to the Group (i.e. due to current credit distress); and |
| • | the Group is offering to the customer revised payment arrangements which constitute a concession (i.e. it is offering terms it would not normally be prepared to offer). |
These cases are described as distressed restructurings. The agreement of a restructuring which meets the criteria above requires all loans, advances and counterparty exposures to the customer to be treated as impaired. Against the background of this requirement, as a customer approaches the point at which it becomes clear that there is an increasing risk that a restructuring of this kind might be necessary, the exposures will typically be regarded as sub-standard to reflect the
HSBC HOLDINGS PLC
199 |
Table of Contents
Report of the Directors: Risk(continued)
Appendix to Risk – Policies and practices
deteriorating credit risk profile and will be graded as impaired when the restructure is proposed for approval, or sooner if there is sufficient concern regarding the customer’s likeliness to pay.
For the purposes of determining whether changes to a customer’s agreement should be treated as a distressed restructuring the following types of modification are regarded as concessionary:
| • | transfers from the customer of receivables from third parties, real estate, or other assets to satisfy fully or partially a debt; |
| • | issuance or other granting of an equity interest to satisfy fully or partially a debt unless the equity interest is granted pursuant to existing terms for converting the debt into an equity interest; and |
| • | modification of the terms of a debt, such as one or more of the following: |
| – | reduction (absolute or contingent) of the stated interest rate for the remaining original life of the debt; |
| – | extension of the maturity date or dates at a stated interest rate lower than the current market rate for new debt with similar risk; |
| – | reduction (absolute or contingent) of the face amount or maturity amount of the debt; and |
| – | reduction (absolute or contingent) of accrued interest. |
Modifications that are unrelated to payment arrangements, such as the restructuring of collateral or security arrangements or the waiver of rights under covenants within documentation, are not regarded by themselves to be evidence of credit distress affecting payment capacity. Typically, covenants are in place to give the Group rights of repricing or acceleration, but they are frequently set at levels where payment capacity has yet to be affected, providing rights of action at earlier stages of credit deterioration. Such concessions do not directly affect the customer’s ability to service the original contractual debt and are not reported as renegotiated loans. However, where a customer requests a non-payment related covenant waiver, the significance of the underlying breach of covenant will be considered together with any other indicators of impairment, and where there is a degree of severity of credit distress indicating uncertainty of payment, all available evidence will be considered in determining whether a loss event has occurred. The waiver will not, however, trigger classification as a renegotiated loan as payment terms have not been modified.
When both payment-related and non-payment related modifications are made together as a result of significant concerns regarding the payment of contractual cash flows, the loan is treated as a distressed restructuring and disclosed as a renegotiated loan.
Where clauses are built into the contract in advance which allow for payment-related modifications, and are exercised under conditions of credit distress at a point where the modification provides a concession to the customer, these cases are treated as meeting the definition of a distressed restructuring.
In assessing whether payment-related forbearance is a satisfactory and sustainable strategy, the customer’s entire exposure and facilities will be reviewed and their ability to meet the terms of both the revised obligation and other credit facilities not amended in the renegotiation is assessed. Should this assessment identify that a renegotiation will not deal with a customer’s payment capacity issues satisfactorily, other special management options may be applied. This process may identify the need to provide assistance to a customer specifically to restructure their business operations and activities so as to restore satisfactory payment capacity.
When considering acceptable restructuring terms we consider the ability of the customer to be able to service the revised interest payments as a necessity. When principal payment modifications are considered, again we require the customer to be able to comply with the revised terms as a necessary pre-condition for the restructuring to proceed. When principal payments are modified resulting in permanent forgiveness, or when it is otherwise considered that there is no longer a realistic prospect of recovery of outstanding principal, the affected balances are written off. When principal repayments are postponed, it is expected that the customer will be capable of paying in line with the renegotiated terms, including instances when the postponed principal repayment is expected from refinancing. In all cases, a loan renegotiation is only granted when the customer is expected to be able to meet the revised terms.
Modifications may be made on a temporary basis when time is needed for the customer to make arrangements for payment, when deterioration in payment capacity is expected to be acute but short lived, or when more time is needed to accommodate discussions regarding a more permanent accommodation with other bankers, for example in syndicated facilities where multilateral negotiation commonly features.
If a restructuring proceeds and the customer demonstrates satisfactory performance over a period of time, the case may be returned to a non-impaired grade (CRR1-8) provided no other indicators of impairment remain. Such a case cannot be returned to a non-impaired grade when a specific impairment allowance remains against any of the customer’s credit facilities. The period of performance will vary depending on the underlying structure of payments to be made by the customer under the amended agreement and the extent to which the customer’s financial position is considered to have improved.
HSBC HOLDINGS PLC
200 |
Table of Contents
(Audited)
It is our policy that each operating company in HSBC creates impairment allowances for impaired loans promptly and appropriately, when there is objective evidence that impairment of a loan or portfolio of loans has occurred.
For details of our impairment policies on loans and advances and financial investments, see Note 1j on the Financial Statements.
Impairment and credit risk mitigation
The existence of collateral has an effect when calculating impairment on individually assessed impaired loans. When we no longer expect to recover the principal and interest due on a loan in full or in accordance with the original terms and conditions, it is assessed for impairment. If exposures are secured, the current net realisable value of the collateral is taken into account when assessing the need for an impairment allowance. No impairment allowance is recognised in cases where all amounts due are expected to be settled in full on realisation of the security.
Personal lending portfolios are generally assessed for impairment on a collective basis as the portfolios typically consist of large groups of homogeneous loans. Two methods are used to calculate allowances on a collective basis: a roll-rate methodology or a more basic formulaic approach based on historical losses. On a yearly basis, we review the impairment allowance methodology used for retail banking and small business portfolios across the Group to ensure that the assumptions used in our collective assessment models continued to appropriately reflect the period of time between a loss event occurring and the account proceeding to delinquency and eventual write-off.
| • | The historical loss methodology is typically used to calculate collective impairment allowances for secured or low default portfolios such as mortgages until the point at which they are individually identified and assessed as impaired. For loans that are collectively assessed using historical loss methodology, the historical loss rate is derived from the average contractual write-off net of recoveries over a defined period. The net contractual write-off rate is the actual amount of loss experienced after the realisation of collateral and receipt of recoveries. |
| • | A roll-rate methodology is more commonly adopted for unsecured portfolios when there are sufficient volumes of empirical data to develop robust statistical models. In certain circumstances mortgage portfolios have a statistically significant number of defaults and losses available, enabling reliable roll rates to be generated. In these cases a roll-rate methodology is applied until the point at which the loans are individually identified and assessed as impaired, and the average gross loss rates by delinquency bucket are adjusted to reflect the future expected cash flows after collateral and other recovery realisation. |
The nature of the collective allowance assessment prevents individual collateral values or loan-to-value (‘LTV’) ratios from being included within the calculation. However, the loss rates used in the collective assessment are adjusted for the collateral realisation experiences which will vary depending on the LTV composition of the portfolio. For example, mortgage portfolios under a historical loss rate methodology with lower LTV ratios will typically experience lower loss history and consequently a lesser net contractual write-off rate.
For wholesale collectively assessed loans, historical loss methodologies are applied to measure loss event impairments which have been incurred but not reported. Loss rates are derived from the historical impairment charges or losses recognised on impaired loans net of recoveries over a defined period, typically no less than 60 months. These historical loss rates are adjusted by an economic factor which amends the historical averages to better represent current economic conditions affecting the portfolio. In order to reflect the likelihood of a loss event not being identified and assessed an emergence period assumption is applied which reflects the period between a loss occurring and its identification. The emergence period is estimated by management for each identified portfolio. The factors that may influence this estimation include economic and market conditions, customer behaviour, portfolio management information, credit management techniques and collection and recovery experiences in the market. The emergence period is assessed empirically on a periodic basis and may vary over time as these factors change.
Write-off of loans and advances
(Audited)
For details of our policy on the write-off of loans and advances, see Note 1j on the Financial Statements.
In HSBC Finance, the carrying amounts of residential mortgage and second lien loans in excess of net realisable value are written off at or before the time foreclosure is completed or settlement is reached with the borrower. If there is no reasonable expectation of recovery, and foreclosure is pursued, the loan is normally written off no later than the end of the month in which the loan becomes 180 days contractually past due. We regularly obtain new appraisals for these collateral dependent loans (every 180 days) and adjust carrying values to the most recent appraisal if they have improved or deteriorated as the best estimate of the cash flows that will be received on the disposal of the collateral.
Unsecured personal facilities, including credit cards, are generally written off at between 150 and 210 days past due, the standard period being the end of the month in which the account becomes 180 days contractually delinquent. Write-off periods may be extended, generally to no more than 360 days past due but, in very exceptional circumstances, to longer than that figure in a few countries where local regulation or legislation constrain earlierwrite-off or where the realisation of
HSBC HOLDINGS PLC
201 |
Table of Contents
Report of the Directors: Risk(continued)
Appendix to Risk – Policies and practices
collateral for secured real estate lending takes this time.
For secured personal facilities, final write-off should generally occur within 60 months of the default at the latest.
In the event of bankruptcy or analogous proceedings, write-off may occur earlier than at the periods stated above. Collections procedures may continue after write-off.
Impairment methodologies
(Audited)
To identify objective evidence of impairment for available-for-sale ABSs, an industry standard valuation model is normally applied which uses data with reference to the underlying asset pools and models their projected future cash flows. The estimated future cash flows of the securities are assessed at the specific financial asset level to determine whether any of them are unlikely to be recovered as a result of loss events occurring on or before the reporting date.
The principal assumptions and inputs to the models are typically the delinquency status of the underlying loans, the probability of delinquent loans progressing to default, the prepayment profiles of the underlying assets and the loss severity in the event of default. However, the models utilise other variables relevant to specific classes of collateral to forecast future defaults and recovery rates. Management uses externally available data and applies judgement when determining the appropriate assumptions in respect of these factors. We use a modelling approach which incorporates historically observed progression rates to default to determine if the decline in aggregate projected cash flows from the underlying collateral will lead to a shortfall in contractual cash flows. In such cases, the security is considered to be impaired.
In respect of collateralised debt obligations (‘CDO’s), expected future cash flows for the underlying collateral are assessed to determine whether there is likely to be a shortfall in the contractual cash flows of the CDO.
When a security benefits from a contract provided by a monoline insurer that insures payments of principal and interest, the expected recovery on the contract is assessed in determining the total expected credit support available to the ABS.
The HSBC Loan Management Unit (‘LMU’) is a front line customer contact department within Wholesale Credit and Market Risk that assumes responsibility for managing business customer relationships requiring intensive and close control where the bank’s lending is at risk. LMU operates on a regional basis across the Group and is independent of the originating business management units. It reports locally to the Regional Head of Wholesale Credit and Market Risk. Customers are identified and transferred to LMU by business management or the Wholesale Credit and Market Risk approval teams.
Customers managed by LMU are normally operating outside the Group’s risk appetite. They typically show symptoms of significant financial difficulty, the management team displays limited experience of managing a business in distress and the management and financial information provided to the Group is insufficient and unreliable.
The levels of customer exposure under management and the size of the LMU team varies between countries depending on the breadth of business undertaken locally but LMU will always manage highly distressed situations where individual customer exposure exceeds $1.5m.
The primary focus of LMU is to protect the bank’s capital and minimise losses by working consensually with customers to promote and support viable recovery strategies wherever achievable, with the ultimate intention of returning the customer to front line relationship management. In some cases, rehabilitation is not possible and LMU will consider a range of options to protect the bank’s exposure and solvency of the customer. On occasion, it is not possible to find a satisfactory solution and the customer may file for insolvency or local equivalent. In all outcomes, LMU seeks to treat customers fairly, sympathetically and positively, in a professional way with transparent processes and procedures.
Remediation and restructuring strategies available in the business and LMU include granting a customer various types of concessions while seeking to enhance the ability of the customer to ultimately repay the Group which could include enhancing the overall security available to the Group. Any decision to approve a concession will be a function of the regions specific country and sector appetite, the key metrics of the customer, the market environment, the loan structure and security. Internal reviews on customers managed directly by LMU are performed on a scheduled basis in accordance with relevant accounting guidelines, credit policies and national banking regulations. Under certain circumstances, concessions granted may result in the loan being classified as a renegotiated loan.
Collateral and other credit enhancements held
(Audited)
Loans and advances held at amortised cost
The Group’s practice is to lend on the basis of customers’ ability to meet their obligations out of cash flow resources rather than rely on the value of security offered. Depending on a customer’s standing and the type of product, facilities may be provided without security. For other lending, a charge over collateral is obtained and considered in determining the credit decision and pricing. In the event of default, the bank may utilise the collateral as a source of repayment. Depending on its form, collateral can have a significant financial effect in mitigating our exposure to credit risk.
HSBC HOLDINGS PLC
202 |
Table of Contents
Additionally, risk may be managed by employing other types of collateral and credit risk enhancements such as second charges, other liens and unsupported guarantees, but the valuation of such mitigants is less certain and their financial effect has not been quantified.
Many types of lending require the repayment of a significant proportion of the principal at maturity. Typically, the mechanism of repayment for the customer is through the acquisition of a new loan to settle the existing debt. Refinance risk arises where a customer is unable to repay such term debt on maturity, or to refinance debt at commercial rates. When there is evidence that this risk may apply to a specific contract, HSBC may need to refinance the loan on concessionary terms that we would not otherwise have considered, in order to recoup the maximum possible cash flows from the contract and potentially avoid the customer defaulting on the repayment of principal. When there is sufficient evidence that borrowers, based on their current financial capabilities, may fail at maturity to repay or refinance their loans, these loans are disclosed as impaired with recognition of a corresponding impairment allowance where appropriate.
Nature of HSBC’s securitisation and other structured exposures
Mortgage-backed securities (‘MBS’s) are securities that represent interests in groups of mortgages and provide investors with the right to receive cash from future mortgage payments (interest and/or principal). An MBS which references mortgages with different risk profiles is classified according to the highest risk class.
Collateralised debt obligations (‘CDO’s) are securities backed by a pool of bonds, loans or other assets such as asset-backed securities (‘ABS’s). CDOs may include exposure to sub-prime or Alt-A mortgage assets where these are part of the underlying assets or reference assets. As there is often uncertainty surrounding the precise nature of the underlying collateral supporting CDOs, all CDOs supported by residential mortgage-related assets are classified as sub-prime. Our holdings of ABSs and CDOs and direct lending positions, and the categories of mortgage collateral and lending activity, are described below.
Our exposure to non-residential mortgage-related ABSs includes securities with collateral relating to commercial property mortgages, leveraged finance loans, student loans, and other assets such as securities with other receivable-related collateral.
Definitions and classifications of ABSs and CDOs
Categories of ABSs and CDOs
| Definition
| Classification
| ||
Sub-prime | Loans to customers who have limited credit histories, modest incomes or high debt-to-income ratios or have experienced credit problems caused by occasional delinquencies, prior charge-offs, bankruptcy or other credit-related actions.
| For US mortgages, a FICO score of 620 or less has primarily been used to determine whether a loan is sub-prime. For non-US mortgages, management judgement is used. | ||
US Home Equity Lines of Credit (‘HELoC’s) (categorised within ‘Sub-prime’) | A form of revolving credit facility provided to customers, which is supported in the majority of circumstances by a second lien or lower ranking charge over residential property.
| Holdings of HELoCs are classified as sub-prime. | ||
US Alt-A | Lower risk loans than sub-prime, but they share higher risk characteristics than lending under fully conforming standard criteria. | US credit scores and the completeness of documentation held (such as proof of income), are considered when determining whether an Alt-A classification is appropriate. Non sub-prime mortgages in the US are classified as Alt-A if they are not eligible for sale to the major US Government mortgage agencies or sponsored entities.
| ||
US Government agency and sponsored enterprises mortgage-related assets | Securities that are guaranteed by US Government agencies such as the Government National Mortgage Association (‘Ginnie Mae’), or by US Government sponsored entities including Fannie Mae and Freddie Mac.
| Holdings of US Government agency and US Government sponsored enterprises’ mortgage-related assets are classified as prime exposures. | ||
HSBC HOLDINGS PLC
203 |
Table of Contents
Report of the Directors: Risk(continued)
Appendix to Risk – Policies and practices
Categories of ABSs and CDOs
| Definition
| Classification
| ||
UK non-conforming mortgages (categorised within ‘Sub-prime’) | UK mortgages that do not meet normal lending criteria. Examples include mortgages where the expected level of documentation is not provided (such as income with self-certification), or where poor credit history increases risk and results in pricing at a higher than normal lending rate.
| UK non-conforming mortgages are treated as sub-prime exposures. | ||
Other residential mortgages | Residential mortgages, including prime mortgages, that do not meet any of the classifications described above.
| Prime residential mortgage-related assets are included in this category. | ||
The management of liquidity and funding is primarily undertaken locally (by country) in our operating entities in compliance with the Group’s Liquidity and Funding Risk Management Framework (the ‘LFRF’), and with practices and limits set by the GMB through the RMM and approved by the Board. These limits vary according to the depth and the liquidity of the markets in which the entities operate. Our general policy is that each defined operating entity should be self-sufficient in funding its own activities. Where transactions exist between operating entities, they are reflected symmetrically in both entities.
As part of our Asset, Liability and Capital Management (‘ALCM’) structure, we have established ALCOs at Group level, in the regions and in operating entities. The terms of reference of all ALCOs include the monitoring and control of liquidity and funding.
The primary responsibility for managing liquidity and funding within the Group’s framework and risk appetite resides with the local operating entities’ ALCOs. Our most significant operating entities are overseen by regional ALCOs, Group ALCO and the RMM. The remaining smaller operating entities are overseen by regional ALCOs, with appropriate escalation of significant issues to Group ALCO and the RMM.
Operating entities are predominately defined on a country basis to reflect our local management of liquidity and funding. Typically, an operating entity will be defined as a single legal entity. However, to take account of the situation where operations in a country are booked across multiple subsidiaries or branches:
| • | an operating entity may be defined as a wider sub-consolidated group of legal entities if they are incorporated in the same country, liquidity and funding are freely fungible between the entities and permitted by local regulation, and the definition reflects how liquidity and funding are managed locally; or |
| • | an operating entity may be defined more narrowly as a principal office (branch) of a wider legal entity operating in multiple countries, reflecting the local country management of liquidity and funding. |
The RMM reviews and agrees annually the list of entities it directly oversees and the composition of these entities.
Customer deposits in the form of current accounts and savings deposits payable on demand or at short notice form a significant part of our funding, and we place considerable importance on maintaining their stability. For deposits, stability depends upon maintaining depositor confidence in our capital strength and liquidity, and on competitive and transparent pricing.
We also access wholesale funding markets by issuing senior secured and unsecured debt securities (publically and privately) and borrowing from the secured repo markets against high quality collateral, in order to obtain funding for non-banking subsidiaries that do not accept deposits, to align asset and liability maturities and currencies and to maintain a presence in local wholesale markets.
The management of liquidity and funding risk
Inherent liquidity risk categorisation
We place our operating entities into one of two categories (low and medium) to reflect our assessment of their inherent liquidity risk considering political, economic and regulatory factors within the host country and factors specific to the operating entities themselves, such as their local market, market share and balance sheet strength. The categorisation involves management judgement and is based on the perceived liquidity risk of an operating entity relative to other entities in the Group. The categorisation is intended to reflect the possible impact of a liquidity event, not the probability of an event, and forms part of our risk appetite. It is used to determine the prescribed stress scenario that we require our operating entities to be able to withstand and manage to.
A key element of our internal framework is the classification of customer deposits into core and non-core based on our expectation of their behaviour during periods of liquidity stress. This characterisation takes into account the inherent liquidity
HSBC HOLDINGS PLC
204 |
Table of Contents
risk categorisation of the operating entity originating the deposit, the nature of the customer and the size and pricing of the deposit. No deposit is considered to be core in its entirety unless it is contractually collateralising a loan. The core deposit base in each operating entity is considered to be a long-term source of funding and therefore is assumed not to be withdrawn in the liquidity stress scenario that we use to calculate our principal liquidity risk metrics.
The three filters considered in assessing whether a deposit in any operating entity is core are:
| • | price: any deposit priced significantly above market or benchmark rates is generally treated as entirely non-core; |
| • | size: depositors with total funds above certain monetary thresholds are excluded. Thresholds are established by considering the business line and inherent liquidity risk categorisation; and |
| • | line of business: the element of any deposit remaining after the application of the price and size filters is assessed on the basis of the line of business with which the deposit is associated. The proportion of any customer deposit that can be considered core under this filter is between 35% and 90%. |
Repo transactions and bank deposits cannot be classified as core deposits.
Advances to core funding ratio
Core customer deposits are an important source of funding to finance lending to customers, and mitigate against reliance on short-term wholesale funding. Limits are placed on operating entities to restrict their ability to increase loans and advances to customers without corresponding growth in core customer deposits or long-term debt funding with a residual maturity beyond one year; this measure is referred to as the ‘advances to core funding’ ratio.
Advances to core funding ratio limits are set by the RMM for the most significant operating entities, and by regional ALCOs for smaller operating entities, and are monitored by ALCM teams. The ratio describes loans and advances to customers as a percentage of the total of core customer deposits and term funding with a remaining term to maturity in excess of one year. In general, customer loans are assumed to be renewed and are included in the numerator of the ratio, irrespective of the contractual maturity date. Reverse repo arrangements are excluded from the advances to core funding ratio.
Stressed coverage ratios are derived from stressed cash flow scenario analyses and express stressed cash inflows as a percentage of stressed cash outflows over one-month and three-month time horizons.
The stressed cash inflows include:
| • | inflows (net of assumed haircuts) expected to be generated from the realisation of liquid assets; and |
| • | contractual cash inflows from maturing assets that are not already reflected as a utilisation of liquid assets. |
In line with the approach adopted for the advances to core funding ratio, customer loans are generally assumed not to generate any cash inflows under stress scenarios and are therefore excluded from the numerator of the stressed coverage ratio, irrespective of the contractual maturity date.
A stressed coverage ratio of 100% or higher reflects a positive cumulative cash flow under the stress scenario being monitored. Group operating entities are required to maintain a ratio of 100% or more out to three months under the combined market-wide and HSBC-specific stress scenario defined by the inherent liquidity risk categorisation of the operating entity concerned.
Compliance with operating entity limits is monitored by ALCM teams and reported monthly to the RMM for the main operating entities and to regional ALCOs for the smaller operating entities.
We use a number of standard Group stress scenarios designed to model:
| • | combined market-wide and HSBC-specific liquidity crisis scenarios; and |
| • | market-wide liquidity crisis scenario. |
These scenarios are modelled by all operating entities. The appropriateness of the assumptions for each scenario is reviewed by ALCM regularly and formally approved by the RMM and the Board annually as part of the liquidity and funding risk appetite approval process.
Stressed cash outflows are determined by applying a standard set of prescribed stress assumptions to the Group’s cash flow model. Our framework prescribes the use of two market-wide scenarios and two further combined market-wide and HSBC-specific stress scenarios of increasing severity. In addition to our standard stress scenarios, individual operating entities are required to design their own scenarios to reflect specific local market conditions, products and funding bases.
The two combined market-wide and HSBC-specific scenarios model a more severe scenario than the market-wide scenario. The relevant combined market-wide and HSBC-specific stress scenario that an operating entity manages to is based upon its inherent liquidity risk categorisation. The key assumptions factored into the two combined market-wide and HSBC-specific stress scenarios are summarised as follows:
| • | all non-core deposits are deemed to be withdrawn within three months (80% within one month), with the level of non-core deposits dependent on the operating entity’s inherent liquidity risk categorisation; |
HSBC HOLDINGS PLC
205 |
Table of Contents
Report of the Directors: Risk(continued)
Appendix to Risk – Policies and practices
| • | the ability to access interbank funding and unsecured term debt markets ceases for the duration of the scenario; |
| • | the ability to generate funds from illiquid asset portfolios (securitisation and secured borrowing) is restricted to 25-75% of the lower of issues in the last six months or expected issues in the next six months. The restriction is based on current market conditions and is dependent on the operating entity’s inherent liquidity risk categorisation; |
| • | the ability to access repo funding ceases for any asset not classified as liquid under our liquid asset policy for the duration of the scenario; |
| • | drawdowns on committed lending facilities must be consistent with the severity of the market stress being modelled and dependent on the inherent liquidity risk categorisation of the operating entity; |
| • | outflows are triggered by a defined downgrade in long-term ratings. We maintain an ongoing assessment of the appropriate number of notches to reflect; |
| • | customer loans are assumed to be renewed at contractual maturity; |
| • | interbank loans and reverse repos are assumed to run off contractually; and |
| • | assets defined as liquid assets are assumed to be realised in cash ahead of their contractual maturity, after applying a defined stressed haircut of up to 20%. |
Liquid assets of HSBC’s principal operating entities
Stressed scenario analysis and the numerator of the coverage ratio include the assumed cash inflows that would be generated from the realisation of liquid assets, after applying the appropriate stressed haircut. These assumptions are made on the basis of management’s expectation of when an asset is deemed to be realisable.
Liquid assets are unencumbered assets that meet the Group’s definition of liquid assets and are either held outright or as a consequence of a reverse repo transaction with a residual contractual maturity beyond the time horizon of the stressed coverage ratio being monitored. Any unencumbered asset held as a result of reverse repo transactions with a contractual maturity within the time horizon of the stressed coverage ratio being monitored is excluded from the stock of liquid assets and is instead reflected as a contractual cash inflow.
Our framework defines the asset classes that can be assessed locally as high quality and realisable within one month and between one month and three months. Each local ALCO has to be satisfied that any asset which may be treated as liquid in accordance with the Group’s liquid asset policy will remain liquid under the stress scenario being managed to.
Inflows from the utilisation of liquid assets within one month can generally only be based on confirmed withdrawable central bank deposits or the sale or repo of government and quasi-government exposures generally restricted to those denominated in the sovereign’s domestic currency. High quality ABSs (predominantly US MBSs) and covered bonds are also included but inflows assumed for these assets are capped.
Inflows after one month are also reflected for high quality non-financial and non-structured corporate bonds and equities within the most liquid indices.
Internal categorisation
| Cash inflow recognised
| Asset classes
| ||
Level 1 | Within one month | • Central government
• Central bank (including confirmed withdrawable reserves)
• Supranationals
• Multilateral development banks
• Coins and banknotes
| ||
Level 2 | Within one month but capped | • Local and regional government
• Public sector entities
• Secured covered bonds and pass-through ABSs
• Gold
| ||
Level 3 | From one to three months | • Unsecured non-financial entity securities
• Equities listed on recognised exchanges and within liquid indices
| ||
Any entity owned and controlled by central or local/regional government but not explicitly guaranteed is treated as a public sector entity.
Any exposure explicitly guaranteed is reflected as an exposure to the ultimate guarantor.
In terms of the criteria used to ensure liquid assets are of a high quality, the Group’s liquid asset policy sets out the following additional criteria:
| 1. | Central bank and central government exposures: |
| • | denominated in the domestic currency of the related sovereign and held: |
| – | onshore in the domestic banking system, qualify as Level 1 liquid assets. |
HSBC HOLDINGS PLC
206 |
Table of Contents
| – | offshore, must be risk weighted 20% or lower under the Basel standardised risk weighting methodology to qualify as Level 1 liquid assets. |
| • | denominated in a currency other than the currency of the related sovereign (i.e. foreign currency) must be risk weighted 20% or lower under the Basel standardised risk weighting methodology and issued in a limited number of major currencies to qualify as Level 1 liquid assets. |
The treatment of eurozone countries using the euro as their domestic currency depends on whether the exposures are held onshore in the domestic banking system or offshore. Central bank and central government exposures held onshore in the domestic banking system qualify as Level 1 liquid assets under criteria 1, but central bank and central government exposures held offshore are considered to be denominated in a foreign currency under criteria 3.
| 2. | Local/regional government exposures held onshore and considered by the local regulator to be the same risk as central government exposures can be considered central government exposures. |
| 3. | Supranationals and multilateral development banks must be 0% risk weighted under the Basel standardised risk-weighting methodology to qualify as Level 1 liquid assets. |
| 4. | To qualify as a level 2 liquid asset, the exposure must be risk weighted 20% or lower under the Basel standardised risk-weighting methodology. |
| 5. | To qualify as a Level 3 liquid asset, an unsecured non-financial corporate debt exposure must satisfy a minimum internal rating requirement. |
On a case-by-case basis, operating entities are permitted to treat other assets as liquid if these assets are realistically assessed to be liquid under stress. These liquid assets are reported as ‘Other’, separately from Level 1, Level 2 and Level 3 liquid assets.
Net cash flow arising from interbank and intragroup loans and deposits
Under the LFRF, a net cash inflow within three months arising from interbank and intra-Group loans and deposits will give rise to a lower liquid asset requirement. Conversely, a net cash outflow within three months arising from interbank and intra-Group loans and deposits will give rise to a higher liquid assets requirement.
Net cash flow arising from reverse repo, repo, stock borrowing, stock lending and outright short positions (including intra-Group)
A net cash inflow represents liquid resources in addition to liquid assets because any unencumbered asset held as a consequence of a reverse repo transaction with a residual contractual maturity within the stressed coverage ratio time period is not reflected as a liquid asset.
The impact of net cash outflow depends on whether the underlying collateral encumbered as a result will qualify as a liquid asset when released at the maturity of the repo. The majority of the Group’s repo transactions are collateralised by liquid assets and, as such, any net cash outflow shown is offset by the return of liquid assets, which are excluded from the liquid asset table above.
Where wholesale debt term markets are accessed to raise funding, ALCO is required to establish cumulative rolling three-month and 12-month debt maturity limits to ensure no concentration of maturities within these timeframes.
Liquidity behaviouralisation is applied to reflect our assessment of the expected period for which we are confident that we will have access to our liabilities, even under a severe liquidity stress scenario, and the expected period for which we must assume that we will need to fund our assets. Behaviouralisation is applied when the contractual terms do not reflect the expected behaviour. Liquidity behaviouralisation is reviewed and approved by local ALCO in compliance with policies set by the RMM. Our approach to liquidity risk management will often mean different approaches are applied to assets and liabilities. For example, management may assume a shorter life for liabilities and a longer-term funding requirement for assets. All core deposits are assumed under the Group’s core/non-core and advances to core funding frameworks to have a liquidity behaviouralised life beyond one year and to represent a homogeneous source of core funding. The behaviouralisation of assets is far more granular and seeks to differentiate the period for which we must assume that we will need to fund the asset.
Our funds transfer pricing policies give rise to a two-stage funds transfer pricing approach, reflecting the fact that we separately manage interest rate risk and liquidity and funding risk under different assumptions. They have been developed to be consistent with our risk management frameworks. Each operating entity is required to apply the Group’s transfer pricing policy framework to determine for each material currency the most appropriate interest rate risk transfer pricing curve, a liquidity premium curve (which is the spread over the interest rate risk transfer pricing curve) and a liquidity recharge assessment (which is the spread under or over the interest rate risk transfer pricing curve).
HSBC HOLDINGS PLC
207 |
Table of Contents
Report of the Directors: Risk(continued)
Appendix to Risk – Policies and practices
The interest rate risk transfer pricing policy seeks to ensure that all market interest rate risk arising structurally from non-trading (banking book) assets and liabilities which is capable of being neutralised externally in the market or neutralised internally by off-setting transfers, is transferred to BSM to be managed centrally as non-trading market risk. For each material currency each operating entity employs a single interest rate risk transfer pricing curve. The transfer price curve used for this purpose reflects how BSM in each operating entity is best able to neutralise the interest rate risk in the market at the point of transfer. Where basis risk can be identified between the re-pricing basis of an external asset or external liability and the re-pricing basis of the interest rate risk transfer pricing curve, this basis risk may be transferred to BSM provided it can neutralise the basis risk in the market.
Liquidity and funding risk is transfer priced independently from interest rate risk because the liquidity and funding risk of an operating entity is transferred to ALCO to be managed centrally. ALCO monitors and manages the advances to core funding ratio and delegates the management of the liquid asset portfolio and execution of the wholesale term debt funding plan to BSM. This assists ALCO in ensuring the Group’s stressed coverage ratios remain above 100% out to three months.
The liquidity and funding risk transfer price consists of two components:
| • | Liquidity recharge: the cost of holding the benchmark liquid asset (the yield under the transfer price) to meet stressed cash outflows. The benchmark liquid asset is decided by ALCO and based on the weighted average duration that can be achieved by investing in level 1 liquid assets, with a residual duration of up to one year. |
| • | Liquidity premium: the assessed cost/value of term funding (the yield over the transfer price) to pay for term debt and core deposits. |
The assessed cost of holding liquid assets is allocated to the outflows modelled by the Group’s internal stressed coverage ratio framework.
Liquidity premium is charged to any asset that affects our three-month stressed coverage ratios based on the assessed behaviouralised liquidity life of the asset, with any asset affecting the Group’s advances to core funding metric required to have a minimum behaviouralised life of at least one year, and the prevailing liquidity premium curve rate set by ALCO and calibrated in line with Group’s calibration principles. Core deposits therefore share equally in the liquidity premiums charged to the assets they support, after deducting the cost of any term funding.
GB&M provides collateralised security financing services to its clients, providing them with cash financing or specific securities. When cash is provided to clients against collateral in the form of securities, the cash provided is recognised on the balance sheet as a reverse repo. When securities are provided to clients against cash collateral the cash received is recognised on the balance sheet as a repo or, if the securities are equity securities, as stock lending.
Each operating entity manages its collateral through a central collateral pool, in line with the LFRF. When specific securities need to be delivered and the entity does not have them currently available within the central collateral pool, the securities are borrowed on a collateralised basis. When securities are borrowed against cash collateral the cash provided is recognised on the balance sheet as a reverse repo or, if the securities are equity securities, as stock borrowing.
Operating entities may also borrow cash against collateral in the form of securities, using the securities available in the central collateral pool. Repos and stock lending can be used in this way to fund the cash requirement arising from securities owned outright by Markets to facilitate client business, and the net cash requirement arising from financing client securities activity.
Reverse repos, stock borrowing, repos and stock lending are reported net when the IFRSs offsetting criteria are met. In some cases transactions to borrow or lend securities are collateralised using securities. These transactions are off-balance sheet.
Any security accepted as collateral for a reverse repo or stock borrowing transaction must be of very high quality and its value subject to an appropriate haircut. Securities borrowed under reverse repo or stock borrowing transactions can only be recognised as part of the liquidity asset buffer for the duration of the transactions and only if the security received is eligible under the liquid asset policy within the LFRF.
Credit controls are in place to ensure that the fair value of any collateral received remains appropriate to collateralise the cash or fair value of securities given.
HSBC HOLDINGS PLC
208 |
Table of Contents
The effect of active collateral management
Collateral is managed on an operating entity basis, consistent with the approach adopted in managing liquidity and funding. Available collateral held by each operating entity is managed as a single collateral pool. In deciding which collateral to pledge, each operating entity seeks to optimise the use of the available collateral pool within the confines of the LFRF, irrespective of whether the collateral pledged is recognised on-balance sheet or was received in respect of reverse repo, stock borrowing or derivative transactions.
Managing collateral in this manner affects the presentation of asset encumbrance in that we may encumber on-balance sheet holdings while maintaining available unencumbered off-balance sheet holdings, even though we are not seeking to directly finance the on-balance sheet holdings pledged.
In quantifying the level of encumbrance of negotiable securities, the encumbrance is analysed by individual security. When a particular security is encumbered and we hold the security both on-balance sheet and off-balance sheet with the right to repledge, we assume for the purpose of this disclosure that the off-balance sheet holding received from the third party is encumbered ahead of the on-balance sheet holding.
An on-balance sheet encumbered and off-balance sheet unencumbered asset will occur, for example, if we receive a specific security as a result of a reverse repo/stock borrowing transaction, but finance the cash lent by pledging a generic collateral basket, even if the security received is eligible for the collateral basket pledged. It will also occur if we receive a generic collateral basket as a result of a reverse repo transaction but finance the cash lent by pledging specific securities, even if the securities pledged are eligible for the collateral basket.
Encumbered and unencumbered assets
Definitions of the categories included in the table ‘Analysis of on-balance sheet encumbered and unencumbered assets’:
• Assets encumbered as a result of transactions with counterparties other than central banks as a result of covered bonds are any assets on our balance sheet pledged against our covered bonds issuance with a counterparty which is not central bank and as a result the assets are unavailable to the bank to secure funding, satisfy collateral needs or be sold to reduce potential future funding requirements.
• Assets encumbered as a result of transactions with counterparties other than central banks as a result of securitisation are any assets on our balance sheet pledged against securitisations with a counterparty which is not central bank including asset-backed commercial paper, CDOs, residential mortgage-backed securities, or structured investment vehicles paper and as a result the assets are unavailable to the bank to secure funding, satisfy collateral needs or be sold to reduce potential future funding requirements.
• Assets encumbered as a result of transactions with counterparties other than central banks – Other are assets on our balance sheet (other than covered bonds and securitisation above) which have been pledged with a counterparty which is not central bank as a collateral against an existing liability, and as a result are assets which are unavailable to the bank to secure funding, satisfy collateral needs or be sold to reduce potential future funding requirements. Examples include assets pledged for sale and repurchase and stock lending transactions and certain property assets.
• Assets positioned at central banks (i.e. pre-positioned plus encumbered)are any assets that are eligible for emergency central bank liquidity/funding or under central bank pre-existing arrangements for funding without further due diligence work required. Any transferable customer loan that is central bank eligible such as pre-positioned central bank UK mortgages and US mortgages accepted by FHLB and assets on our balance sheet which have been pledged with central bank as collateral against an existing liability, and as a result are assets which are unavailable to the bank to secure funding, satisfy collateral needs or be sold to reduce potential future funding requirements.
• Unencumbered – readily available assets are assets regarded by the bank to be readily available in the normal course of business to secure funding, meet collateral needs, or be sold to reduce potential future funding requirements, and are not subject to any restrictions on their use for these purposes.
• Unencumbered – other assets capable of being encumberedare assets where there are no restrictions on their use to secure funding, meet collateral needs, or be sold to reduce potential future funding requirements, but they are not readily realisable in the normal course of business in their current form.
• Unencumbered – reverse repo/stock borrowing receivables and derivative assets are assets related specifically to reverse repo, stock borrowing and derivative transactions. They are shown separately as these on-balance sheet assets cannot be pledged but often give rise to the receipt of non-cash assets which are not recognised on the balance sheet, and can additionally be used to raise secured funding, meet additional collateral requirements or be sold.
• Unencumbered – cannot be encumberedare assets that have not been pledged and which we have assessed could not be pledged and therefore could not be used to secure funding, meet collateral needs, or be sold to reduce potential future funding requirements. An example is assets held by the Group’s insurance subsidiaries that back liabilities to policyholders and support the solvency of these entities.
Historically, the Group has not recognised any contingent liquidity value for assets other than those assets defined under the LFRF as being liquid assets, and any other negotiable instruments that under stress are assumed to be realisable after three months, even though they may currently be realisable. This approach has generally been driven by our risk appetite not to place any reliance on central banks. In a few cases, we have recognised the contingent value of discrete pools of assets, but the amounts involved are insignificant. As a result, we have reported the majority of our loans and advances to customers and banks in the category ‘Other realisable assets’ as management would need to perform additional actions in order to make the assets transferable and readily realisable.
|
HSBC HOLDINGS PLC
209 |
Table of Contents
Report of the Directors: Risk(continued)
Appendix to Risk – Policies and practices
Additional information
The amount of assets pledged to secure liabilities reported in Note 18 on the Financial Statements may be greater than the book value of assets reported as being encumbered in the table on page 163. Examples of where such differences occur are:
| • | ABSs and covered bonds, where the amount of liabilities issued plus the required mandatory over-collateralisation is lower than the book value of assets pledged to the pool. Any difference is categorised in the table above as ‘Unencumbered – readily realisable assets’; |
| • | negotiable securities held by custodians or settlement agents, where a floating charge has been given over the entire holding to secure intra-day settlement liabilities, are only reported as encumbered to the extent that we have a liability to the custodian or settlement agent at the reporting date, with the balance reported as ‘Unencumbered – readily realisable assets’; and |
| • | assets pre-positioned with central banks or government agencies are only reported as encumbered to the extent that we have secured funding with the collateral. The unutilisedpre-positioned collateral is reported as ‘Unencumbered – readily realisable assets’. |
Securities reflected on the balance sheet that are pledged as collateral against an existing liability or lent are reflected as encumbered for the duration of the transaction. When securities are received as collateral or borrowed, and when we have the right to sell or re-pledge these securities, they are reflected as available and unencumbered for the duration of the transaction, unless re-pledged or sold. Further analysis regarding the encumbrance of securities resulting from repos and stock lending and available unencumbered assets arising from reverse repos and stock borrowing is provided under the heading ‘Encumbered and unencumbered assets’ on page 162.
In the normal course of business we do not seek to utilise repo financing as a source of funding to finance customer assets, beyond the collateralised security financing activities within Markets described above.
The original contractual maturity of reverse repo, stock borrowing, repo and stock lending is short term with the vast majority of transactions being for less than 90 days.
Management of cross-currency liquidity and funding risk
Our liquidity and funding risk framework also considers the ability of each entity to continue to access foreign exchange markets under stress when a surplus in one currency is used to meet a deficit in another currency, for example, by the use of the foreign currency swap markets. Where appropriate, operating entities are required to monitor stressed coverage ratios and advances to core funding ratios for non-local currencies.
HSBC Holdings’ primary sources of cash are dividends received from subsidiaries, interest on and repayment of intra-group loans and securities with interest earned on its own liquid funds. HSBC Holdings also raises ancillary funds in the debt capital markets through subordinated and senior debt issuance. Cash is primarily used for the provision of capital and TLAC funding to subsidiaries, interest payments to debt holders and dividend payments to shareholders.
HSBC Holdings is also subject to contingent liquidity risk by virtue of credit-related commitments and guarantees and similar contracts issued. Such commitments and guarantees are only issued after due consideration of HSBC Holdings’ ability to finance the commitments and guarantees and the likelihood of the need arising.
HSBC Holdings actively manages the cash flows from its subsidiaries to optimise the amount of cash held at the holding company level. The ability of subsidiaries to pay dividends or advance monies to HSBC Holdings depends on, among other things, their respective local regulatory capital and banking requirements, exchange controls, statutory reserves, and financial and operating performance. During 2015, none of the Group’s subsidiaries experienced significant restrictions on paying dividends or repaying loans and advances. Also, there are no foreseen restrictions envisaged by our subsidiaries on paying dividends or repaying loans and advances, with the exception of HSBC North America Holdings Inc. None of the subsidiaries which are excluded from our regulatory consolidation has capital resources below its minimum regulatory requirement.
Market risk is the risk that movements in market factors, such as foreign exchange rates, interest rates, credit spreads, equity prices and commodity prices, will reduce our income or the value of our portfolios.
HSBC HOLDINGS PLC
210 |
Table of Contents
Market risk in global businesses
The diagram below summarises the main business areas where trading and non-trading market risks reside and the market risk measures used to monitor and limit exposures.
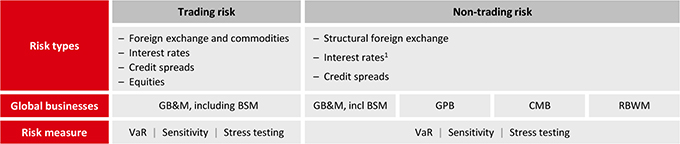
| 1 | The interest rate risk on the fixed-rate securities issued by HSBC Holdings is not included in the Group VaR. The management of this risk is described on page 171. |
Where appropriate, we apply similar risk management policies and measurement techniques to both trading and non-trading portfolios. Our objective is to manage and control market risk exposures in order to optimise return on risk while maintaining a market profile consistent with our status as one of the world’s largest banking and financial services organisations.
The nature of the hedging and risk mitigation strategies performed across the Group corresponds to the market risk management instruments available within each operating jurisdiction. These strategies range from the use of traditional market instruments, such as interest rate swaps, to more sophisticated hedging strategies to address a combination of risk factors arising at portfolio level.
(Audited)
Market risk is managed and controlled through limits approved by the RMM for HSBC Holdings and our various global businesses. These limits are allocated across business lines and to the Group’s legal entities.
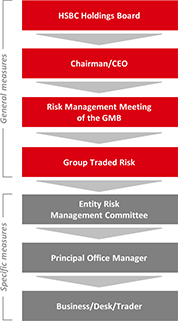 | The management of market risk is principally undertaken in GB&M, where 94% of the total value at risk of HSBC (excluding insurance) and almost all trading VaR resides, using risk limits approved by the GMB. VaR limits are set for portfolios, products and risk types, with market liquidity being a primary factor in determining the level of limits set.
Global Risk is responsible for setting market risk management policies and measurement techniques. Each major operating entity has an independent market risk management and control sub-function which is responsible for measuring market risk exposures in accordance with the policies defined by Global Risk, and monitoring and reporting these exposures against the prescribed limits on a daily basis. The market risk limits are governed according to the framework illustrated to the left.
Each operating entity is required to assess the market risks arising on each product in its business and to transfer them to either its local GB&M unit for management, or to separate books managed under the supervision of the local ALCO.
Our aim is to ensure that all market risks are consolidated within operations that have the necessary skills, tools, management and governance to manage them. In certain cases where the market risks cannot be fully transferred, we identify the effect of varying scenarios on valuations or on net interest income resulting from any residual risk positions. Further details on the control and management process for residual risks are provided on page 212. |
Model risk is governed through Model Oversight Committees (‘MOC’s) at the regional and global Wholesale Credit and Market Risk levels. They have direct oversight and approval responsibility for all traded risk models utilised for risk measurement and management and stress testing. The MOCs prioritise the development of models, methodologies and practices used for traded risk management within the Group and ensure that they remain within our risk appetite and business plans. The Markets MOC reports into the Group MOC, which oversees all model risk types at Group level. Group MOC informs the RMM about material issues at least on a bi-annual basis. The RMM is the Group’s ‘Designated Committee’ according to regulatory rules and has delegated day-to-day governance of all traded risk models to the Markets MOC.
Our control of market risk in the trading and non-trading portfolios is based on a policy of restricting individual operations to trading within a list of permissible instruments authorised for each site by Global Risk, of enforcing new product approval
HSBC HOLDINGS PLC
211 |
Table of Contents
Report of the Directors: Risk(continued)
Appendix to Risk – Policies and practices
procedures, and of restricting trading in the more complex derivative products only to offices with appropriate levels of product expertise and robust control systems.
Monitoring and limiting market risk exposures
Our objective is to manage and control market risk exposures while maintaining a market profile consistent with our risk appetite.
We use a range of tools to monitor and limit market risk exposures including sensitivity analysis, value at risk and stress testing.
Sensitivity analysis measures the impact of individual market factor movements on specific instruments or portfolios, including interest rates, foreign exchange rates and equity prices, such as the effect of a one basis point change in yield. We use sensitivity measures to monitor the market risk positions within each risk type. Sensitivity limits are set for portfolios, products and risk types, with the depth of the market being one of the principal factors in determining the level of limits set.
(Audited)
Value at risk (‘VaR’) is a technique that estimates the potential losses on risk positions as a result of movements in market rates and prices over a specified time horizon and to a given level of confidence. The use of VaR is integrated into market risk management and is calculated for all trading positions regardless of how we capitalise those exposures. Where there is not an approved internal model, we use the appropriate local rules to capitalise exposures.
In addition, we calculate VaR for non-trading portfolios to have a complete picture of risk. Our models are predominantly based on historical simulation. VaR is calculated at a 99% confidence level for a one-day holding period. Where we do not calculate VaR explicitly, we use alternative tools as summarised in the Market Risk Stress Testing table on page 213.
Our VaR models derive plausible future scenarios from past series of recorded market rates and prices, taking into account inter-relationships between different markets and rates such as interest rates and foreign exchange rates. The models also incorporate the effect of option features on the underlying exposures.
The historical simulation models used incorporate the following features:
| • | historical market rates and prices are calculated with reference to foreign exchange rates and commodity prices, interest rates, equity prices and the associated volatilities; |
| • | potential market movements utilised for VaR are calculated with reference to data from the past two years; and |
| • | VaR measures are calculated to a 99% confidence level and use a one-day holding period. |
The nature of the VaR models means that an increase in observed market volatility will lead to an increase in VaR without any changes in the underlying positions.
We are committed to the ongoing development of our in-house risk models.
VaR model limitations
Although a valuable guide to risk, VaR should always be viewed in the context of its limitations. For example:
| • | the use of historical data as a proxy for estimating future events may not encompass all potential events, particularly those which are extreme in nature; |
| • | the use of a holding period assumes that all positions can be liquidated or the risks offset during that period. This may not fully reflect the market risk arising at times of severe illiquidity, when the holding period may be insufficient to liquidate or hedge all positions fully; |
| • | the use of a 99% confidence level, by definition, does not take into account losses that might occur beyond this level of confidence; |
| • | VaR is calculated on the basis of exposures outstanding at the close of business and therefore does not necessarily reflect intra-day exposures; and |
| • | VaR is unlikely to reflect loss potential on exposures that only arise under conditions of significant market movement. |
Risk not in VaR framework
Our VaR model is designed to capture significant basis risks such as CDS versus bond, asset swap spreads and cross-currency basis. Other basis risks which are not completely covered in VaR, such as the Libor tenor basis, are complemented by our risk not in VaR (‘RNIV’) calculations, and are integrated into our capital framework.
HSBC HOLDINGS PLC
212 |
Table of Contents
The RNIV framework therefore aims to capture and capitalise material market risks that are not adequately covered in the VaR model. An example of this is Libor-overnight index swap basis risk for minor currencies. In such instances the RNIV framework uses stress tests to quantify the capital requirement. On average in 2015, the capital requirement derived from these stress tests represented 2.3% of the total internal model-based market risk requirement.
Risks covered by RNIV represented 19% of market risk RWAs for models with regulatory approval and included those resulting from underlying risk factors which are not observable on a daily basis across asset classes and products, such as dividend risk and implied correlation risks.
Risk factors are reviewed on a regular basis and either incorporated directly in the VaR models, where possible, or quantified through the VaR-based RNIV approach or a stress test approach within the RNIV framework. The severity of the scenarios is calibrated to be in line with the capital adequacy requirements. The outcome of the VaR-based RNIV is included in the VaR calculation and back-testing; a stressed VaR RNIV is also computed for the risk factors considered in the VaR-based RNIV approach.
Level 3 assets
The fair values of Level 3 assets and liabilities in trading portfolios are disclosed on page 382, and represent only a small proportion of the overall trading portfolio. Market risk arising from Level 3 instruments is managed by various market risk techniques such as stress testing and notional limits. The table on page 384 shows the movement in Level 3 financial instruments.
Stress testing is an important procedure that is integrated into our market risk management tool to evaluate the potential impact on portfolio values of more extreme, although plausible, events or movements in a set of financial variables. In such scenarios, losses can be much greater than those predicted by VaR modelling.
Stress testing is implemented at legal entity, regional and overall Group levels. A standard set of scenarios is utilised consistently across all regions within the Group. Scenarios are tailored to capture the relevant events or market movements at each level. The risk appetite around potential stress losses for the Group is set and monitored against referral limits.

Market risk reverse stress tests are undertaken on the premise that there is a fixed loss. The stress testing process identifies which scenarios lead to this loss. The rationale behind the reverse stress test is to understand scenarios which are beyond normal business settings that could have contagion and systemic implications.
Stressed VaR and stress testing, together with reverse stress testing and the management of gap risk, provide management with insights regarding the ‘tail risk’ beyond VaR for which HSBC’s appetite is limited.
Trading portfolios
In 2013, US regulators finalised the Volcker Rule. Section 619 of the Dodd-Frank Wall Street Reform and Consumer Protection Act and its final implementing rules (collectively referred to as the ‘Volcker Rule’) imposes broad restrictions on HSBC’s ability to engage in ‘proprietary trading’ or to own, sponsor, or have certain relationships with hedge funds, private equity funds, and certain other collective investment vehicles (broadly defined as ‘covered funds’). These restrictions are subject to a number of exemptions or exclusions, including market making, underwriting and risk-mitigating hedging, organising covered funds for customers and issuers of asset-backed securities, and underwriting or market making in covered fund interests.
The Volcker Rule broadly went into effect on 22 July 2015, with the exception of certain legacy fund activities that are able to rely on an extension of the conformance date.
HSBC has implemented a programme to comply with the Volcker Rule, including policies and procedures, internal controls, corporate governance, independent testing, training, and record keeping and, eventually, calculation and reporting of quantitative metrics for certain trading activities.
HSBC has completed training for all affected front office and control personnel, has conformance plans for those covered funds to which the extension applies, and believes that it is compliant in all material respects with the Volcker Rule.
HSBC HOLDINGS PLC
213 |
Table of Contents
Report of the Directors: Risk(continued)
Appendix to Risk – Policies and practices
We routinely validate the accuracy of our VaR models by back-testing them against both actual, which replaced clean profit and loss from 1 August 2015, and hypothetical profit and loss against the corresponding VaR numbers. Hypothetical profit and loss excludes non-modelled items such as fees, commissions and revenues of intra-day transactions.
We would expect on average to see two or three profits and two or three losses in excess of VaR at the 99% confidence level over a one-year period. The actual number of profits or losses in excess of VaR over this period can therefore be used to gauge how well the models are performing.
We back-test our Group VaR at various levels which reflect a full legal entity scope of HSBC, including entities that do not have local permission to use VaR for regulatory purposes.
Certain products, such as non-recourse margin loans, are not exposed to small day-to-day moves in market rates or prices, but are exposed large discontinuous moves. Such movements may occur, for example, when, in reaction to an adverse event or unexpected news announcement, some parts of the market move far beyond their normal volatility range and become temporarily illiquid. Products which exhibit exposure only to large discontinuous moves (gap risk) are not well captured by VaR measures or traditional market risk sensitivity measures. HSBC has implemented additional stress measurement and controls over such products.
In 2015, gap risk exposure was primarily due to non-recourse loan transactions, mostly for corporate clients, where the collateral against the loan is limited to the posted assets. Upon occurrence of a gap event, the value of the collateral could fall below the outstanding loan amount.
We did not incur any notable gap loss in 2015.
For certain currencies (pegged or managed) the spot exchange rate is pegged at a fixed-rate (typically to US dollars or euros), or managed within a predefined band around a pegged rate. De-peg risk is the risk of the peg or managed band changing or being abolished, and moving to a floating regime.
HSBC has extensive experience in managing fixed and managed currency regimes. Using stressed scenarios on spot rates, we are able to analyse how de-peg events would affect the positions held by HSBC. We monitor such scenarios to pegged or managed currencies, such as the Hong Kong dollar, renminbi and Middle Eastern currencies, and limit any potential losses that would occur. This historical VaR measures, which may not fully capture the risk involved in holding positions in pegged or managed currencies, as such currencies may not have experienced a de-peg event during the historical timeframe being considered.
The ABS/MBS (asset and mortgage-backed securities) exposures within the trading portfolios are managed within sensitivity and VaR limits as described on page 167, and are included within the stress testing scenarios described above.
(Audited)
Most of the Group’s non-trading VaR relates to Balance Sheet Management (‘BSM’) or local treasury management functions. Contributions to Group non-trading VaR are driven by interest rates and credit spread risks arising from all global businesses. There is no commodity market risk in the non-trading portfolios.
Non-trading VaR also includes the interest rate risk of non-trading financial instruments held by the global businesses and transferred into portfolios managed by BSM or local treasuries. In measuring, monitoring and managing risk in our non-trading portfolios, VaR is just one of the tools used. The management of interest rate risk in the banking book is described further in ‘Non-trading interest rate risk’ below, including the role of BSM.
Non-trading VaR excludes equity risk on available-for-sale securities, structural foreign exchange risk, and interest rate risk on fixed-rate securities issued by HSBC Holdings, the scope and management of which are described in the relevant sections below.
Our control of market risk in the non-trading portfolios is based on transferring the assessed market risk of non-trading assets and liabilities created outside BSM or Markets, to the books managed by BSM, provided the market risk can be neutralised. The net exposure is typically managed by BSM through the use of fixed-rate government bonds (liquid assets held in available-for-sale books) and interest rate swaps. The interest rate risk arising from fixed-rate government bonds held within available-for-sale portfolios is reflected within the Group’s non-traded VaR. Interest rate swaps used by BSM are typically classified as either a fair value hedge or a cash flow hedge and are included within the Group’s non-traded VaR. Any market risk that cannot be neutralised in the market is managed by local ALCOs in segregated ALCO books.
HSBC HOLDINGS PLC
214 |
Table of Contents
Equity securities classified as available for sale
Potential new commitments are subject to risk appraisal to ensure that industry and geographical concentrations remain within acceptable levels for the portfolio. Regular reviews are performed to substantiate the valuation of the investments within the portfolio and investments held to facilitate ongoing business, such as holdings in government-sponsored enterprises and local stock exchanges.
Structural foreign exchange exposures
Structural foreign exchange exposures represent net investments in subsidiaries, branches and associates, the functional currencies of which are currencies other than the US dollar. An entity’s functional currency is that of the primary economic environment in which the entity operates.
Exchange differences on structural exposures are recognised in ‘Other comprehensive income’. We use the US dollar as our presentation currency in our consolidated financial statements because the US dollar and currencies linked to it form the major currency bloc in which we transact and fund our business. Our consolidated balance sheet is, therefore, affected by exchange differences between the US dollar and all the non-US dollar functional currencies of underlying subsidiaries.
We hedge structural foreign exchange exposures only in limited circumstances. Our structural foreign exchange exposures are managed with the primary objective of ensuring, where practical, that our consolidated capital ratios and the capital ratios of individual banking subsidiaries are largely protected from the effect of changes in exchange rates. This is usually achieved by ensuring that, for each subsidiary bank, the ratio of structural exposures in a given currency to RWAs denominated in that currency is broadly equal to the capital ratio of the subsidiary in question.
We may also transact hedges where a currency in which we have structural exposures is considered likely to revalue adversely, and it is possible in practice to transact a hedge. Any hedging is undertaken using forward foreign exchange contracts which are accounted for under IFRSs as hedges of a net investment in a foreign operation, or by financing with borrowings in the same currencies as the functional currencies involved. We evaluate residual structural foreign exchange exposures using an expected shortfall method.
Non-trading interest rate risk
Non-trading book interest rate risk arises principally from mismatches between the future yield on assets and their funding cost, as a result of interest rate changes. Analysis of this risk is complicated by making assumptions on embedded optionality within certain product areas such as the incidence of mortgage prepayments, and from behavioural assumptions regarding the economic duration of liabilities which are contractually repayable on demand such as current accounts, and the re-pricing behaviour of managed rate products. These assumptions around behavioural features are captured in our interest rate risk behaviouralisation framework, which is described below.
We aim, through our management of market risk in non-trading portfolios, to mitigate the effect of prospective interest rate movements which could reduce future net interest income, while balancing the cost of such hedging activities on the current net revenue stream.
Our funds transfer pricing policies give rise to a two stage funds transfer pricing approach. For details see page 207.
Interest rate risk behaviouralisation
Unlike liquidity risk, which is assessed on the basis of a very severe stress scenario, non-trading interest rate risk is assessed and managed according to ‘business-as-usual’ conditions. In many cases the contractual profile of non-trading assets/liabilities arising from assets/liabilities created outside Markets or BSM does not reflect the behaviour observed.
Behaviouralisation is therefore used to assess the market interest rate risk of non-trading assets/liabilities and this assessed market risk is transferred to BSM, in accordance with the rules governing the transfer of interest rate risk from the global businesses to BSM.
Behaviouralisation is applied in three key areas:
| • | the assessed re-pricing frequency of managed rate balances; |
| • | the assessed duration of non-interest bearing balances, typically capital and current accounts; and |
| • | the base case expected prepayment behaviour or pipeline take-up rate for fixed-rate balances with embedded optionality. |
Interest rate behaviouralisation policies have to be formulated in line with the Group’s behaviouralisation policies and approved at least annually by local ALCOs and regional ALCMs, in conjunction with local, regional and Group market risk monitoring teams.
The extent to which balances can be behaviouralised is driven by:
| • | the amount of the current balance that can be assessed as ‘stable’ under business-as-usual conditions; and |
| • | for managed rate balances, the historical market interest rate re-pricing behaviour observed; or |
HSBC HOLDINGS PLC
215 |
Table of Contents
Report of the Directors: Risk(continued)
Appendix to Risk – Policies and practices
| • | for non-interest bearing balances, the duration for which the balance is expected to remain under business-as-usual conditions. This assessment is often driven by the re-investment tenors available to BSM to neutralise the risk through the use of fixed-rate government bonds or interest rate derivatives, and for derivatives the availability of cash flow hedging capacity. |
Effective governance across BSM is supported by the dual reporting lines it has to the CEO of GB&M and to the Group Treasurer. In each operating entity, BSM is responsible for managing liquidity and funding under the supervision of the local ALCO (which usually meets on a monthly basis). It also manages the non-trading interest rate positions transferred to it within a Markets limit structure.
In executing the management of the liquidity risk on behalf of ALCO, and managing the non-trading interest rate positions transferred to it, BSM invests in highly-rated liquid assets in line with the Group’s liquid asset policy. The majority of the liquidity is invested in central bank deposits and government, supranational and agency securities with most of the remainder held in short-term interbank and central bank loans.
Withdrawable central bank deposits are accounted for as cash balances. Interbank loans, statutory central bank reserves and loans to central banks are accounted for as loans and advances to banks. BSM’s holdings of securities are accounted for as available-for-sale or, to a lesser extent, held-to-maturity assets.
Statutory central bank reserves are not recognised as liquid assets. The statutory reserves that would be released in line with the Group’s stressed customer deposit outflow assumptions are reflected as stressed inflows.
BSM is permitted to use derivatives as part of its mandate to manage interest rate risk. Derivative activity is predominantly through the use of vanilla interest rate swaps which are part of cash flow hedging and fair value hedging relationships.
Credit risk in BSM is predominantly limited to short-term bank exposure created by interbank lending, exposure to central banks and high quality sovereigns, supranationals or agencies which constitute the majority of BSM’s liquidity portfolio. BSM does not manage the structural credit risk of any Group entity balance sheets.
BSM is permitted to enter into single name and index credit derivatives activity, but it does so to manage credit risk on the exposure specific to its securities portfolio in limited circumstances only. The risk limits are extremely limited and closely monitored. At 31 December 2015, BSM had no open credit derivative index risk.
VaR is calculated on both trading and non-trading positions held in BSM. It is calculated by applying the same methodology used for the Markets business and utilised as a tool for market risk control purposes.
BSM holds trading portfolio instruments in only very limited circumstances. Positions and the associated VaR were not significant during 2015.
Sensitivity of net interest income
A principal part of our management of market risk in non-trading portfolios is to monitor the sensitivity of expected net interest income under varying interest rate scenarios (simulation modelling). This monitoring is undertaken at an entity level by local ALCOs.
Entities apply a combination of scenarios and assumptions relevant to their local businesses, and standard scenarios which are required throughout HSBC. The latter are consolidated to illustrate the combined pro forma effect on our consolidated net interest income.
Projected net interest income sensitivity figures represent the effect of the pro forma movements in net interest income based on the projected yield curve scenarios and the Group’s current interest rate risk profile. This effect, however, does not incorporate actions which would probably be taken by BSM or in the business units to mitigate the effect of interest rate risk. In reality, BSM seeks proactively to change the interest rate risk profile to minimise losses and optimise net revenues. The net interest income sensitivity calculations assume that interest rates of all maturities move by the same amount in the ‘up-shock’ scenario. Rates are not assumed to become negative in the ‘down-shock’ scenario which may, in certain currencies, effectively result in non-parallel shock. In addition, the net interest income sensitivity calculations take account of the effect on net interest income of anticipated differences in changes between interbank interest rates and interest rates over which the entity has discretion in terms of the timing and extent of rate changes.
Defined benefit pension schemes
Market risk arises within our defined benefit pension schemes to the extent that the obligations of the schemes are not fully matched by assets with determinable cash flows. See ‘Pension risk’ on page 225 for additional information.
HSBC Holdings
As a financial services holding company, HSBC Holdings has limited market risk activity. Its activities predominantly involve maintaining sufficient capital resources to support the Group’s diverse activities; allocating these capital resources across our businesses; earning dividend and interest income on its investments in our businesses; providing dividend payments to its
HSBC HOLDINGS PLC
216 |
Table of Contents
equity shareholders and interest payments to providers of debt capital; and maintaining a supply of short-term capital resources for deployment under extraordinary circumstances. It does not take proprietary trading positions.
The main market risks to which HSBC Holdings is exposed are non-trading interest rate risk and foreign currency risk. Exposure to these risks arises from short-term cash balances, funding positions held, loans to subsidiaries, investments in long-term financial assets and financial liabilities including debt capital issued. The objective of HSBC Holdings’ market risk management strategy is to reduce exposure to these risks and minimise volatility in capital resources, cash flows and distributable reserves. Market risk for HSBC Holdings is monitored by HSBC Holdings ALCO in accordance with its risk appetite statement.
HSBC Holdings uses interest rate swaps and cross currency interest rate swaps to manage the interest rate risk and foreign currency risk arising from its long-term debt issues.
The objective of our operational risk management is to manage and control operational risk in a cost effective manner within targeted levels of operational risk consistent with our risk appetite, as defined by the GMB.
Operational risk is organised as a specific risk discipline within Global Risk, and a formal governance structure provides oversight over its management. The Global Operational Risk sub-function supports the Group Chief Risk Officer and the Global Operational Risk Committee. It is responsible for establishing and maintaining the Operational Risk Management Framework (‘ORMF’) and monitoring the level of operational losses and the effectiveness of the control environment. It is also responsible for operational risk reporting at Group level, including the preparation of reports for consideration by the RMM and the Group Risk Committee. The Global Operational Risk Committee meets at least quarterly to discuss key risk issues and review the effective implementation of the ORMF.
The ORMF defines minimum standards and processes and the governance structure for the management of operational risk and internal control in our geographical regions, global businesses and global functions. The ORMF has been codified in a high level standards manual supplemented with detailed policies which describes our approach to identifying, assessing, monitoring and controlling operational risk and gives guidance on mitigating action to be taken when weaknesses are identified.
Business managers throughout the Group are responsible for maintaining an acceptable level of internal control commensurate with the scale and nature of operations, and for identifying and assessing risks, designing controls and monitoring the effectiveness of these controls. The ORMF helps managers to fulfil these responsibilities by defining a standard risk assessment methodology and providing a tool for the systematic reporting of operational loss data.
A centralised database is used to record the results of the operational risk management process. Operational risk and control self-assessments are input and maintained by business units. Business and functional management and business risk and control managers monitor the progress of documented action plans to address shortcomings. To ensure that operational risk losses are consistently reported and monitored at Group level, all Group companies are required to report individual losses when the net loss is expected to exceed $10,000, and to aggregate all other operational risk losses under $10,000. Losses are entered into the Group Operational Risk database and are reported to the RMM on a monthly basis.
For further details, see thePillar 3 Disclosures 2015report.
Compliance risk falls within the definition of operational risk. All Group companies are required to observe the letter and spirit of all relevant laws, codes, rules, regulations and standards of good market practice. These rules, regulations, Group policies and formal standards include those relating to AML, counter-terrorist and proliferation financing, sanctions compliance, anti-bribery and corruption, conduct of business and other regulations.
The two Compliance sub-functions: Financial Crime Compliance (‘FCC’) and Regulatory Compliance (‘RC’), are appropriately supported by a shared Compliance Operating Office and Reputational Risk Management teams. The Global Head of Financial Crime Compliance and the Global Head of Regulatory Compliance both report to the Group Chief Risk Officer.
There are compliance teams in each of the countries where we operate and in all global businesses. These compliance teams are principally overseen by Heads of Financial Crime Compliance and Regulatory Compliance located in Europe, the US, Canada, Latin America, Asia and the Middle East and North Africa. The effectiveness of the regional and global business compliance teams are reviewed by the respective FCC and RC Assurance teams.
Global policies and procedures require the prompt identification and escalation to Financial Crime Compliance or Regulatory Compliance of all actual or suspected breaches of any law, rule, regulation, policy or other relevant requirement. Reportable events are reported to the relevant Risk Management Committees and those of Group significance are escalated to the RMM, the Group Risk Committee and the Board, as appropriate. They are disclosed in theAnnual Report and Accounts andInterim Report, as appropriate.
We published a new Global Conduct Policy in 2015 (following the approval and implementation of the global conduct approach and framework in 2014) for the management of conduct designed to ensure that we meet our strategic commitment to deliver fair outcomes for our customers, and not to disrupt the orderly and transparent operation of financial markets. It defines
HSBC HOLDINGS PLC
217 |
Table of Contents
Report of the Directors: Risk(continued)
Appendix to Risk – Policies and practices
responsibilities and ensures that business activity and decisions are underpinned by a robust consideration and management of associated risks supporting delivery of the required fair outcomes for customers and maintenance of market integrity. Our focus on compliance and conduct issues is further reinforced by the Financial System Vulnerabilities Committee, which reports to the Board on matters relating to financial crime and financial system abuse and provides a forward-looking perspective on financial crime risk. In addition, the Conduct & Values Committee reports to the Board on matters relating to delivery of the required global conduct outcomes for customers and the orderly and transparent operation of financial markets, together with adherence to HSBC’s Values.
Each legal department is required to have processes and procedures in place to manage legal risk that conform to Group standards.
Legal risk falls within the definition of operational risk and includes:
| • | contractual risk, which is the risk of a member of HSBC suffering financial loss, legal or regulatory action or reputational damage because its rights and/or obligations under a contract to which it is a party are technically defective; |
| • | dispute adjudication risk, which is the risk of a member of HSBC suffering financial loss or reputational damage due to an adverse dispute environment or a failure to take appropriate steps to defend, prosecute and/or resolve actual or threatened legal claims brought against or by a Group member, including for the avoidance of doubt, regulatory matters; |
| • | legislative risk, which is the risk that a Group member fails to or is unable to identify, analyse, track, assess or correctly interpret applicable legislation, case law or regulation, or new regulatory, legislative or doctrinal interpretations of existing laws or regulations, or decisions in the Courts or regulatory bodies; and |
| • | non-contractual rights risk, which is the risk that a Group member’s assets are not properly owned or protected or are infringed by others, or a Group member infringes another party’s rights. |
There are legal departments in 47 of the countries in which we operate. In addition to the Group Legal function, there are regional legal sub-functions in each of Europe, North America, Latin America, the Middle East and North Africa and Asia headed by Regional General Counsels, and a Global General Counsel responsible for each of the global businesses.
Global security and fraud risk
Security and fraud risk issues are managed at Group level by Global Security and Fraud Risk. This unit, which has responsibility for information, fraud, contingency, financial intelligence, physical and geopolitical risks is fully integrated within the central Global Risk function. This enables management to identify and mitigate the permutations of these and other non-financial risks to its business lines across the jurisdictions in which we operate.
| • | The Information Security Risk sub-function is responsible for defining the strategy and policy by which the organisation protects its information assets and services from compromise, corruption or loss, whether caused deliberately or inadvertently by internal or external parties. It provides independent advice, guidance and oversight to the business about the effectiveness of information security controls and practices in place or being proposed. |
| • | The Fraud Risk sub-function is responsible for ensuring that effective prevention, detection and investigation measures are in place against all forms of fraudulent activity, whether initiated internally or externally, and is available to support any part of the business. To achieve that and to attain the level of integration needed to face the threat, the management of all types of fraud (e.g. card fraud, non-card fraud and internal fraud, including investigations) is established within one management structure and is part of the Global Risk function. We use technology extensively to prevent and detect fraud. For example, customers’ credit and debit card spending is monitored continuously and suspicious transactions are highlighted for verification, internet banking sessions are reviewed and transactions monitored in a similar way and all new account applications are screened for fraud. We have a fraud systems strategy which is designed to provide minimum standards and allow easier sharing of best practices to detect fraud and minimise false alerts. We have developed a holistic and effective anti-fraud strategy which, in addition to the use of advanced technology, includes fraud prevention policies and practices, the implementation of strong internal controls, investigations response teams and liaison with law enforcement where appropriate. |
| • | The Contingency Risk sub-function is responsible for ensuring that the group’s critical systems, processes and functions have the resilience to maintain continuity in the face of major disruptive events. Within this wider risk, business continuity management covers the pre-planning for recovery, seeking to minimise the adverse effects of major business disruption, either globally, regionally or within country, against a range of actual or emerging risks. The pre-planning concentrates on the protection of customer services, our staff, revenue generation, the integrity of data and documents and meeting regulatory requirements. Each business has its own recovery plan, which is developed following the completion of a business impact analysis. This determines how much time the business could sustain an outage before the level of losses becomes unacceptable, i.e. its criticality. These plans are reviewed and tested every year. The planning is undertaken against Group policy and standards and each business confirms in an annual compliance certificate that all have been met. Should there be exceptions, these are raised and their short-term resolution is overseen by Group and regional business |
HSBC HOLDINGS PLC
218 |
Table of Contents
continuity teams. It is important that plans are dynamic and meet all risks, particularly those of an emerging nature such as possible pandemics and cyber attacks. The ORMF is used to measure our resilience to these risks, and is confirmed to Group and regional risk committees. Resilience is managed through various risk mitigation measures. These include agreeing with IT acceptable recovery times of systems, ensuring our critical buildings have the correct infrastructure to enable ongoing operations, requiring critical vendors to have their own recovery plans and arranging with Group Insurance appropriate cover for business interruption costs.
| • | The Financial Intelligence Unit is jointly administered by Security and Fraud Risk and Financial Crime Compliance. It uses advanced analytics and subject matter expertise to detect indicators of financial crime in the Group’s clients and counter-parties. |
| • | The Physical Security sub-function develops practical physical, electronic and operational counter-measures to ensure that the people, property and assets managed by the Group are protected from crime, theft, attack and groups hostile to HSBC’s interests. |
| • | The Geopolitical Risk Unit provides both regular and ad hoc reporting to business executives and senior security and fraud risk management on geopolitical risk profiles and evolving threats in countries in which the Group operates. This both enhances strategic business planning and provides an early view into developing security risks. Security travel controls and guidance are also maintained. |
Systems risk is the risk of failure or malfunction in the automated platforms that support the Group’s daily execution (application systems) and the systems infrastructure on which they reside (data centres, networks and distributed computers).
The management of systems risk is overseen globally by the HSBC Operations, Services and Technology (‘HOST’) organisation. Oversight is provided through monthly risk management committee meetings that provide a comprehensive overview of existing and emerging top risks.
HOST manages the control environment over systems risks using risk and control assessments and scenario analysis. Material risks are monitored through the periodic testing of associated key controls.
Business-critical services have been identified. Quantitative scorecards called risk appetite statements are used for monitoring performance, and have been established for each of these services.
Global availability monitoring (24x7) is in place to assist in determining systems health. Our incident management processes are linked to business and geographical major incident groups for recovery decision-making and communication to customers and regulators.
Our vendor risk management (‘VRM’) programme is a global framework for managing risk with third party vendors, especially where we are reliant on outsourced agreements to provide critical services to our customers. VRM contains a rigorous process to identify material contracts and their key risks and ensure controls are in place to manage and mitigate these risks. Global and regional governance structures have been implemented to oversee vendor third party service providers.
Risk management of insurance operations
Overview of insurance products
(Audited)
HSBC manufactures the following main classes of contract:
| • | life insurance contracts with discretionary participation features (‘DPF’); |
| • | credit life insurance business; |
| • | annuities; |
| • | term assurance and critical illness policies; |
| • | linked life insurance; |
| • | investment contracts with DPF; |
| • | unit-linked investment contracts; and |
| • | other investment contracts (including pension contracts written in Hong Kong). |
We additionally write a small amount of non-life insurance business primarily covering personal and commercial property.
(Audited)
The majority of the risks in our Insurance business derive from manufacturing activities and can be categorised between financial risks and insurance risk; financial risks include market risk, credit risk and liquidity risk. Operational and sustainability risks are also present and are covered by the Group’s respective overall risk management processes.
The following sections describe how financial risks and insurance risk are managed.
HSBC HOLDINGS PLC
219 |
Table of Contents
Report of the Directors: Risk(continued)
Appendix to Risk – Policies and practices
HSBC subsidiaries that manufacture insurance products establish control procedures complying with the guidelines and requirements issued by Group Insurance and local regulatory requirements. Country level oversight is exercised by local insurance risk management committees. Country Chief Risk Officers (‘CRO’s) have reporting lines locally and functional reporting lines into the Group Insurance CRO, who has overall accountability for risk management in insurance operations globally. The Group Insurance Risk Management Committee oversees the control framework globally and is accountable to the RBWM Risk Management Committee on risk matters.
In addition, local ALCOs monitor and review the duration and cash flow matching of insurance assets and liabilities.
All insurance products, whether manufactured internally or by a third party, are subjected to a product approval process prior to introduction.
Financial risks
(Audited)
Our insurance businesses are exposed to a range of financial risks, including market risk, credit risk and liquidity risk. Market risk includes interest rate, equity and foreign exchange risks. The nature and management of these risks is described below.
Manufacturing subsidiaries are exposed to financial risks when, for example, the proceeds from financial assets are not sufficient to fund the obligations arising from insurance and investment contracts. In many jurisdictions, local regulatory requirements prescribe the type, quality and concentration of assets that these subsidiaries must maintain to meet insurance liabilities. These requirements complement Group-wide policies.
Market risk
(Audited)
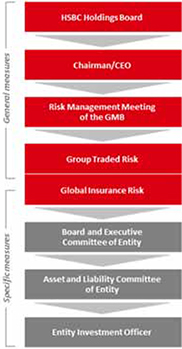 | Market risk is managed through limits approved by the RMM for HSBC Holdings. An allocation of the Group-wide market risk appetite is provided to the Insurance business by Group Traded Risk. These limits are then apportioned between different Insurance entities to support the strategic aims of the business.
The market risk team supporting insurance within Wholesale Market Risk and the Group Insurance CRO are responsible for setting market risk management policies and measurement techniques applied to the Insurance activities of HSBC.
At entity level the appetite for market risk is expressed through detailed market risk mandates. Investment Officers hold day-to-day responsibility for managing assets so as to remain within the mandates and are answerable to the local ALCOs. ALCOs hold wider responsibility over longer-term actions related to liabilities that are necessary to remain within the agreed mandates.
ALCOs act to implement the strategy of the Executive Committee which, in turn, is answerable to the Board. The Board holds ultimate accountability over the risk profile held and targeted within each company.
Description of market risk
The main features and exposures of products manufactured by our insurance manufacturing subsidiaries which generate market risk, and the market risk to which these features expose the Group, are discussed below. |
Interest rate risk arises from a mismatch between asset yields and the investment returns implied by the guarantees payable to policyholders by insurance manufacturing subsidiaries. When asset yields are below guaranteed yields, products may be closed to new business, repriced or restructured. A list of the different types of guarantees within our insurance contracts is outlined below.
HSBC HOLDINGS PLC
220 |
Table of Contents
Categories of guaranteed benefits
• implicit interest rate guarantees: when future policyholder benefits are defined as fixed monetary amounts, e.g. annuities in payment and endowment savings contracts;
• annual return: the annual return is guaranteed to be no lower than a specified rate. This may be the return credited to the policyholder every year, or the average annual return credited to the policyholder over the life of the policy, which may occur on the maturity date or the surrender date of the contract; and
• capital: policyholders are guaranteed to receive no less than the premiums paid plus declared bonuses less expenses.
|
The proceeds from insurance and investment products with DPF are primarily invested in bonds with a proportion allocated to other asset classes in order to provide customers with the potential for enhanced returns. Subsidiaries with portfolios of such products are exposed to the risk of falls in market prices which cannot be fully reflected in the discretionary bonuses. An increase in market volatility could also result in an increase in the value of the guarantee to the policyholder.
Long-term insurance and investment products typically permit the policyholder to surrender the policy or let it lapse at any time. When the surrender value is not linked to the value realised from the sale of the associated supporting assets, the subsidiary is exposed to market risk. In particular, when customers seek to surrender their policies when asset values are falling, assets may have to be sold at a loss to fund redemptions.
A subsidiary holding a portfolio of long-term insurance and investment products, especially with DPF, may attempt to reduce exposure to its local market by investing in assets in countries other than that in which it is based. These assets may be denominated in currencies other than the subsidiary’s local currency. Where the foreign exchange exposure associated with these assets is not hedged, for example because it is not cost effective to do so, this exposes the subsidiary to the risk of its local currency strengthening against the currency of the related assets.
For unit-linked contracts, market risk is substantially borne by the policyholder, but market risk exposure typically remains as fees earned for management are related to the market value of the linked assets.
Asset and liability matching
It is not always possible to match asset and liability durations, partly because there is uncertainty over policyholder behaviour which introduces uncertainty over the receipt of all future premiums and the timing of claims, and partly because the forecast payment dates of liabilities may exceed the duration of the longest dated investments available.
We use models to assess the effect of a range of future scenarios on the values of financial assets and associated liabilities, and ALCOs employ the outcomes in determining how to best structure asset holdings to support liabilities. The scenarios include stresses applied to factors which affect insurance risk such as mortality and lapse rates. Of particular importance is assessing the expected pattern of cash inflows against the benefits payable on the underlying contracts, which can extend for many years.
How market risk is managed
All our insurance manufacturing subsidiaries have market risk mandates which specify the investment instruments in which they are permitted to invest and the maximum quantum of market risk which they may retain. They manage market risk by using some or all of the techniques listed below, depending on the nature of the contracts they write.
Techniques for managing market risk
• for products with DPF, adjusting bonus rates to manage the liabilities to policyholders. The effect is that a significant portion of the market risk is borne by the policyholder;
• structuring asset portfolios to support projected liability cash flows;
• using derivatives to protect against adverse market movements or better match liability cash flows;
• for new products with investment guarantees, considering the cost when determining the level of premiums or the price structure;
• periodically reviewing products identified as higher risk, which contain investment guarantees and embedded optionality features linked to savings and investment products;
• designing new products to mitigate market risk, such as changing the investment return sharing portion between policyholders and the shareholder;
• exiting, to the extent possible, investment portfolios whose risk is considered unacceptable; and
• repricing premiums charged to policyholders.
|
In the product approval process, the risks embedded in new products are identified and assessed. When, for example, options and guarantees are embedded in new products, the due diligence process ensures that complete and appropriate risk management procedures are in place. Management reviews certain exposures more frequently when markets are more volatile to ensure that any matters arising are dealt with in a timely fashion.
HSBC HOLDINGS PLC
221 |
Table of Contents
Report of the Directors: Risk(continued)
Appendix to Risk – Policies and practices
How the exposure to market risk is measured
Our insurance manufacturing subsidiaries monitor exposures against mandated limits regularly and report them to Group Insurance.
In addition, large insurance manufacturing subsidiaries perform a high-level monthly assessment of market risk exposure against risk appetite. This is submitted to Group Insurance and a global assessment presented to the RBWM Risk Management Committee. Risk measures include statistics relating to IFRSs, regulatory solvency and economic capital.
Standard measures for quantifying market risks
• for interest rate risk, the sensitivities of the net present values of asset and expected liability cash flows, in total and by currency, to a one basis point parallel shift in the discount curves used to calculate the net present values;
• for equity price risk, the total market value of equity holdings and the market value of equity holdings by region and country; and
• for foreign exchange risk, the total net short foreign exchange position and the net foreign exchange positions by currency.
|
The standard measures are relatively straightforward to calculate and aggregate, but they have limitations. The most significant one is that a parallel shift in yield curves of one basis point does not capture the non-linear relationships between the values of certain assets and liabilities and interest rates. Non-linearity arises, for example, from investment guarantees and product features which enable policyholders to surrender their policies. We bear the shortfall if the yields on investments held to support contracts with guaranteed benefits are less than the investment returns implied by the guaranteed benefits.
We recognise these limitations and augment our standard measures with stress tests which examine the effect of a range of market rate scenarios on the aggregate annual profits and total equity of our insurance manufacturing subsidiaries, after taking into consideration tax and accounting treatments where material and relevant. The results of these tests are reported to Group Insurance and risk committees every quarter.
Similarly economic capital statistics are produced monthly, with a more detailed exercise undertaken on a quarterly basis. Economic capital measures estimate, on a market consistent economic value basis, the quantum of capital required given the exposures in the Insurance operation. Total exposures, a breakdown by risk class, and movement analysis are presented to the Insurance Risk Management Committee on a quarterly basis.
Credit risk
(Audited)
Description of credit risk
Credit risk arises in two main areas for our insurance manufacturers:
(i) risk of default by debt security counterparties after investing premiums to generate a return for policyholders and shareholders; and
(ii) risk of default by reinsurance counterparties and non-reimbursement for claims made after ceding insurance risk.
How credit risk is managed
Our insurance manufacturing subsidiaries are responsible for the credit risk, quality and performance of their investment portfolios. Our assessment of the creditworthiness of issuers and counterparties is based primarily upon internationally recognised credit ratings and other publicly available information.
Investment credit exposures are monitored against limits by our local insurance manufacturing subsidiaries, and are aggregated and reported to Group Insurance Credit Risk and Group Credit Risk. Stress testing is performed by Group Insurance on the investment credit exposures using credit spread sensitivities and default probabilities.
We use a number of tools to manage and monitor credit risk. These include a credit report which contains a watch-list of investments with current credit concerns and is circulated monthly to senior management in Group Insurance and the individual country CROs to identify investments which may be at risk of future impairment.
Liquidity risk
(Audited)
Description of liquidity risk
It is an inherent characteristic of almost all insurance contracts that there is uncertainty over the amount of claims liabilities that may arise and the timing of their settlement, and this creates liquidity risk.
There are three aspects to liquidity risk. The first arises in normal market conditions and is referred to as funding liquidity risk; specifically, the capacity to raise sufficient cash when needed to meet payment obligations. Secondly, market liquidity risk arises when the size of a particular holding may be so large that a sale cannot be completed around the market price. Finally, standby liquidity risk refers to the capacity to meet payment terms in abnormal conditions.
HSBC HOLDINGS PLC
222 |
Table of Contents
How liquidity risk is managed
Our insurance manufacturing subsidiaries primarily fund cash outflows arising from claim liabilities from the following sources of cash inflows:
| • | premiums from new business, policy renewals and recurring premium products; |
| • | interest and dividends on investments and principal repayments of maturing debt investments; |
| • | cash resources; and |
| • | the sale of investments. |
They manage liquidity risk by utilising some or all of the following techniques:
| • | matching cash inflows with expected cash outflows using specific cash flow projections or more general asset and liability matching techniques such as duration matching; |
| • | maintaining sufficient cash resources; |
| • | investing in good credit-quality investments with deep and liquid markets to the degree to which they exist; |
| • | monitoring investment concentrations and restricting them where appropriate, for example, by debt issues or issuers; and |
| • | establishing committed contingency borrowing facilities. |
Each of these techniques contributes to mitigating the three types of liquidity risk described above.
Every quarter, our insurance manufacturing subsidiaries are required to complete and submit liquidity risk reports to Group Insurance for collation and review. Liquidity risk is assessed in these reports by measuring changes in expected cumulative net cash flows under a series of stress scenarios designed to determine the effect of reducing expected available liquidity and accelerating cash outflows. This is achieved, for example, by assuming new business or renewals are lower, and surrenders or lapses are greater, than expected.
Insurance risk
(Audited)
Insurance risk is the risk, other than financial risk, of loss transferred from the holder of the insurance contract to the issuer (i.e. HSBC). The principal risk we face is that, over time, the cost of the contract, including claims and benefits may exceed the total amount of premiums and investment income received.
The cost of claims and benefits can be influenced by many factors, including mortality and morbidity experience, lapse and surrender rates.
Insurance risks are controlled by high-level policies and procedures set both centrally and locally, taking into account where appropriate local market conditions and regulatory requirements. Formal underwriting, reinsurance and claims-handling procedures designed to ensure compliance with regulations are applied, supplemented with stress testing.
As well as exercising underwriting controls, we use reinsurance as a means of mitigating exposure to insurance risk. Where we manage our exposure to insurance risk through the use of third-party reinsurers, the associated revenue and manufacturing profit is ceded to the reinsurers. Although reinsurance provides a means of managing insurance risk, such contracts expose us to credit risk, the risk of default by the reinsurer.
The principal drivers of our insurance risk are described below. The liabilities for long-term contracts are set by reference to a range of assumptions around these drivers. These typically reflect the issuers’ own experiences. The type and quantum of insurance risk arising from life insurance depends on the type of business, and varies considerably.
| • | mortality and morbidity: the main contracts which generate exposure to these risks are term assurance, whole life products, critical illness and income protection contracts and annuities. The risks are monitored on a regular basis, and are primarily mitigated by underwriting controls and reinsurance and by retaining the ability in certain cases to amend premiums in the light of experience; |
| • | lapses and surrenders: the risks associated with this are generally mitigated by product design, the application of surrender charges and management actions, for example, managing the level of bonus payments to policyholders. A detailed persistency analysis at a product level is carried out at least on an annual basis; and |
| • | expense risk is mitigated by pricing, for example, retaining the ability in certain cases to amend premiums and/or policyholder charges based on experience, and cost management discipline. |
Liabilities are affected by changes in assumptions (see ‘Sensitivity analysis’ on page 188).
HSBC HOLDINGS PLC
223 |
Table of Contents
Report of the Directors: Risk(continued)
Appendix to Risk – Policies and practices
The Global Head of Financial Crime Compliance and the Global Head of Regulatory Compliance are the risk stewards for reputational risk. The development of policies and an effective control environment for the identification, assessment, management and mitigation of reputational risk are co-ordinated through the Group Reputational Risk Policy Committee (‘GRRPC’), which is chaired by the Group Chairman. In parallel, the Global Risk Resolution Committee (‘GRRC’), chaired by the Chief Risk Officer, is the highest decision-making forum in the Group for dealing with matters arising from clients or transactions that either present a serious potential reputational risk to the Group or merit a Group-led decision to ensure a consistent risk management approach across the regions and global businesses. Both committees are responsible for keeping the RMM apprised of areas and activities presenting significant reputational risk and, where appropriate, for making recommendations to the RMM to mitigate such risk. Significant issues posing reputational risk are also reported to the Board and the Conduct & Values Committee, where appropriate.
Overseeing all reputational risk matters, the Reputational Risk sub-function is responsible for setting policies to guide the Group’s management of reputational risk, devising strategies to protect against reputational risk and advising the global businesses and global functions in helping them identify, assess and mitigate such risks, where possible. This sub-function is led by a central headquarters-based team and supported by teams within each business line and region who help to ensure that issues are directed to the appropriate forums, that decisions are made and implemented effectively, and that management information is generated to aid senior management in the businesses and regions in understanding where reputational risk exists within the Group. Each global business has established a governance process that empowers the Reputational Risk and Client Selection committees to address reputational risk issues at the appropriate level, escalating decisions where appropriate. The global functions manage and escalate reputational risks within established operational risk frameworks.
Standards for all major aspects of business are set for the Group and for individual subsidiaries, businesses and functions. Reputational risks, including environmental, social and governance matters, are considered and assessed by the Board, the GMB, the RMM, subsidiary company boards, Board committees and senior management during the formulation of policy and the establishment of our standards. These policies, which form an integral part of the internal control system (see page 275), are communicated through manuals and statements of policy and are promulgated through internal communications and training. The policies set out our risk appetite and operational procedures for all areas of reputational risk, including financial crime prevention (money laundering, terrorist and proliferation financing, sanctions-breaking and bribery and corruption deterrence), regulatory compliance, conduct-related concerns, environmental impacts, human rights matters and employee relations. The policy manuals address risk issues in detail and co-operation between Group departments and businesses is required to ensure a strong adherence to our risk management system and our sustainability practices.
Business activities in which fiduciary risk is inherent are only permitted within designated lines of business. Fiduciary risk is managed within the designated businesses via a comprehensive policy framework and monitoring of key indicators. The Group’s principal fiduciary businesses and activities (‘designated businesses and activities’) are:
| • | HSBC Securities Services, which is exposed to fiduciary risk through its funds services and corporate trust and loan agency activities; |
| • | HSBC Global Asset Management, which is exposed to fiduciary risks through its investment management activities on behalf of clients; |
| • | HSBC Global Private Banking, which is exposed to fiduciary risks through its private trust division and discretionary investment management; |
| • | HSBC Insurance, which is exposed to fiduciary risks through the investment management activities it undertakes when providing insurance products and services; |
| • | RBWM Trust Investment Wrappers, required by regulation for the provision of normal RBWM Wealth Management products and services; and |
| • | HSBC Employee Pension Scheme activities, where fiduciary duties may arise as part of carrying out a function of discretion or control over an HSBC employee pension scheme’s operations. |
The Group’s requirements for the management of fiduciary risk are laid down in the fiduciary section of the Global Risk Functional Instruction Manual, which is owned by Global Operational Risk. No business other than the designated businesses may undertake fiduciary activities without notifying Global Operational Risk and receiving specific dispensations from the relevant fiduciary policy requirements.
Other policies around the provision of advice, including investment advice and corporate advisory, and the management of potential conflicts of interest, also mitigate our fiduciary risks.
HSBC HOLDINGS PLC
224 |
Table of Contents
(Audited)
We operate a number of pension plans throughout the world, as described in the Pension risk section on page 189 and below. A global pension risk framework and accompanying global policies on the management of risks related to defined benefit and defined contribution plans is in place. The Global Pensions Oversight Committee is responsible for the governance and oversight of all pension plans sponsored by HSBC around the world.
In order to fund the benefits associated with defined benefit plans, sponsoring Group companies (and, in some instances, employees) make regular contributions in accordance with advice from actuaries and in consultation with the schemes’ trustees (where relevant). The defined benefit plans invest these contributions in a range of investments designed to meet their long-term liabilities.
The level of these contributions has a direct impact on HSBC’s cash flow and would normally be set to ensure that there are sufficient funds to meet the cost of the accruing benefits for the future service of active members. However, higher contributions are required when plan assets are considered insufficient to cover the existing pension liabilities. Contribution rates are typically revised annually or triennially, depending on the plan. The agreed contributions to the principal plan are revised triennially.
A deficit in a defined benefit plan may arise from a number of factors, including:
• investments delivering a return below that required to provide the projected plan benefits. This could arise, for example, when there is a fall in the market value of equities, or when increases in long-term interest rates cause a fall in the value of fixed income securities held;
• the prevailing economic environment leading to corporate failures, thus triggering write-downs in asset values (both equity and debt);
• a change in either interest rates or inflation which causes an increase in the value of the scheme liabilities; and
• scheme members living longer than expected (known as longevity risk).
|
A plan’s investment strategy is determined after taking into consideration the market risk inherent in the investments and its consequential impact on potential future contributions. The long-term investment objectives of both HSBC and, where relevant and appropriate, the trustees are:
| • | to limit the risk of the assets failing to meet the liabilities of the plans over the long term; and |
| • | to maximise returns consistent with an acceptable level of risk so as to control the long-term costs of the defined benefit plans. |
In pursuit of these long-term objectives, a benchmark is established for the allocation of the defined benefit plan assets between asset classes. In addition, each permitted asset class has its own benchmarks, such as stock market or property valuation indices and, where relevant, desired levels of out-performance. The benchmarks are reviewed at least triennially within 18 months of the date at which an actuarial valuation is made, or more frequently if required by local legislation or circumstances. The process generally involves an extensive asset and liability review.
Ultimate responsibility for investment strategy rests with either the trustees or, in certain circumstances, a management committee. The degree of independence of the trustees from HSBC varies in different jurisdictions, however all fiduciaries are required to put the plan members’ needs above all others.
Defined contribution plans result in far less exposure to market risk for the Group, but remain exposed to operational and reputational risks as they place the responsibility and flexibility more directly with employees. To manage these risks, the performance of defined contribution investment funds is monitored and local engagement with employees is actively promoted to ensure they are provided with sufficient information about the options available to them.
Pension plans in the UK
The HSBC Bank (UK) Pension Scheme (the principal plan) has both defined benefit and defined contribution sections. The defined benefit section accounts for approximately 72% of our total defined benefit obligations around the world. All new employees have joined the defined contribution section since 1996 and from 1 July 2015 the defined benefit section was fully closed to future accrual so that all future pension provision for all employees is provided by the defined contribution section. The principal plan is overseen by an independent corporate trustee who has a fiduciary responsibility for the operation of the pension plan. The trustee is responsible for monitoring and managing the investment strategy and administration of scheme benefits. The principal plan holds a diversified portfolio of investments to meet future cash flow liabilities arising from accrued benefits as they fall due to be paid. The trustee of the principal plan is required to produce a written Statement of Investment Principles which governs decision-making about how investments are made and the need for adequate diversification is taken into account in the choice of asset allocation and manager structure in the defined benefit section. Longevity risk in the principal plan is assessed as part of the measurement of the pension liability and managed through the funding process of the plan.
HSBC HOLDINGS PLC
225 |
Table of Contents
Report of the Directors: Risk / Capital
Appendix to Risk – Policies and practices / Capital
Sustainability risks arise from the provision of financial services to companies or projects which indirectly result in unacceptable impacts on people or on the environment. The Risk Function, with input from Global Corporate Sustainability, is mandated to manage these risks globally working through local offices as appropriate. Sustainability Risk Managers have regional or national responsibilities for advising on and managing environmental and social risks. The Risk Function’s responsibilities in relation to sustainability risk include:
| • | formulating sustainability risk policies. This includes overseeing our sustainability risk standards, our application of the Equator Principles and our sustainability policies (covering agricultural commodities, chemicals, defence, energy, forestry, freshwater infrastructure, mining and metals, and World Heritage Sites and Ramsar Wetlands); undertaking an independent review of transactions where sustainability risks are assessed to be high; and supporting our operating companies to assess similar risks of a lower magnitude; |
| • | building and implementing systems-based processes to ensure consistent application of policies, reduce the costs of sustainability risk reviews and capture management information to measure and report on the effect of our lending and investment activities on sustainable development; and |
| • | providing training and capacity building within our operating companies to ensure sustainability risks are identified and mitigated consistently to either our own standards, international standards or local regulations, whichever is higher. |
HSBC HOLDINGS PLC
226 |
Table of Contents
| Page
| App1
| Tables
| Page
| ||||
| 228 | 228 | |||||||
| 243 | 228 | |||||||
| 243 | ||||||||
| 243 | ||||||||
| 243 | ||||||||
| 244 | ||||||||
| 244 | ||||||||
| 244 | ||||||||
| 244 | ||||||||
| 244 | ||||||||
| 245 | ||||||||
| 246 | ||||||||
| 228 | Capital and RWA movements by major driver – CRD IV end point basis | 228 | ||||||
| 229 | 229 | |||||||
| 229 | ||||||||
| 229 | ||||||||
| 229 | 229 | |||||||
| 230 | ||||||||
RWA movement by geographical regions by key driver – credit risk – IRB only | 230 | |||||||
RWA movement by global businesses by key driver – credit risk – IRB only | 231 | |||||||
| 232 | 232 | |||||||
RWA movement by key driver – counterparty credit risk – advanced approach | 232 | |||||||
| 232 | ||||||||
RWA movement by key driver – market risk – internal model based | 232 | |||||||
| 232 | ||||||||
RWA movement by key driver – basis of preparation and supporting notes | 247 | |||||||
| 247 | ||||||||
| 248 | ||||||||
| 248 | ||||||||
| 233 | 233 | |||||||
| 234 | ||||||||
Reconciliation of regulatory capital from transitional basis to an estimated CRD IV end point basis | 235 | |||||||
| 236 | ||||||||
| 236 | Reconciliation of balance sheets – financial accounting to regulatory scope of consolidation | 236 | ||||||
| 239 | 239 | |||||||
| 239 | ||||||||
| 239 | 240 | |||||||
| 241 | ||||||||
| 241 | ||||||||
| 241 | ||||||||
| 242 | ||||||||
| 242 | ||||||||
1 Appendix to Capital.
| ||||||||
HSBC HOLDINGS PLC
227 |
Table of Contents
Report of the Directors: Capital(continued)
Capital overview / Movements by major drivers / RWAs
Our objective in the management of Group capital is to maintain appropriate levels of capital to support our business strategy and meet our regulatory and stress testing related requirements.
Capital highlights
• Our end point common equity tier 1 (‘CET1’) ratio of 11.9% was up from 11.1% at the end of 2014.
• We continue to generate capital from profit and our progress to achieve targeted RWA initiatives strengthened our CET1 ratio, creating capacity for growth.
• Our leverage ratio remained strong at 5.0%.
|
| At 31 December | ||||||||||||
| 2015 | 2014 | |||||||||||
| % | % | |||||||||||
CRD IV end point | ||||||||||||
Common equity tier 1 ratio1 | 11.9 | 11.1 | ||||||||||
CRD IV transitional | ||||||||||||
Common equity tier 1 ratio1 | 11.9 | 10.9 | ||||||||||
Tier 1 ratio | 13.9 | 12.5 | ||||||||||
Total capital ratio | 17.2 | 15.6 | ||||||||||
Total regulatory capital and risk-weighted assets
| At 31 December | ||||||||||||
| 2015 | 2014 | |||||||||||
| $m | $m | |||||||||||
CRD IV end point | ||||||||||||
Common equity tier 1 capital1 | 130,863 | 135,953 | ||||||||||
CRD IV transitional | ||||||||||||
Common equity tier 1 capital1 | 130,863 | 133,200 | ||||||||||
Additional tier 1 capital | 22,440 | 19,539 | ||||||||||
Tier 2 capital | 36,530 | 37,991 | ||||||||||
Total regulatory capital | 189,833 | 190,730 | ||||||||||
Risk-weighted assets | 1,102,995 | 1,219,765 | ||||||||||
For footnote, see page 243.
We manage Group capital to ensure that we exceed current regulatory requirements and that we respect the payment priority of our capital providers. Throughout 2015, we complied with the Prudential Regulation Authority’s (‘PRAs’) regulatory capital adequacy requirements, including those relating to stress testing. We are also well placed to meet our expected future capital requirements.
We continue to manage Group capital to meet a medium-term target for return on equity of more than 10% by 2017. This is modelled on a CET1 ratio on an end point basis in the range of 12% to 13%, which takes into account known and quantifiable end-point CET1 requirements and includes a regulatory and management buffer in the range of 1% to 2%, based on our estimate of the additional CET1 we will need to hold to cover the new time-varying buffers and other factors. The CET1 regulatory and management buffer will be kept under review until the details of the regulatory framework are finalised.
Capital and RWAs are calculated and presented according to the Group’s interpretation of CRD IV legislation and the PRA’s rules as set out in the PRA Rulebook.
Despite the rules published to date, there remains continued uncertainty around the amount of capital that UK banks will be required to hold. In December 2015, the Financial Policy Committee (‘FPC’) published its view of the capital framework as applicable to UK banks, which set out expectations in relation to CET1 and tier 1 capital across the industry. However, requirements applicable to individual banks are subject to the PRA’s determination. While there is emerging clarity around the interaction of the capital buffers and the PRA’s Pillar 2 framework, uncertainty remains around the broader capital framework, including revisions to the RWA requirements, capital floors, and global systemically important bank (‘G-SIB’) developments. Furthermore, there remain a number of draft and unpublished European Banking Authority (‘EBA’) technical and implementation standards due in 2016.
A summary of our policies and practices regarding capital management, measurement and allocation is provided in the Appendix to Capital on page 243.
Capital and RWA movements by major driver – CRD IV end point basis
CET1 capital | RWAs | |||||||||||
| $bn | $bn | |||||||||||
CRD IV end point basis at 1 January 2015 | 136.0 | 1,219.8 | ||||||||||
Capital generation from profit | 3.4 | |||||||||||
– consolidated profits attributable to shareholders of the parent company (including regulatory adjustments) | 11.3 | |||||||||||
– dividends net of scrip2 | (7.9 | ) | ||||||||||
RWA initiatives | (123.8 | ) | ||||||||||
Business growth including associates | 48.7 | |||||||||||
Foreign currency translation differences3 | (7.9 | ) | (52.2 | ) | ||||||||
Other movements | (0.6 | ) | 10.5 | |||||||||
CRD IV end point basis at 31 December 2015 | 130.9 | 1,103.0 | ||||||||||
For footnotes, see page 243.
Our CET1 capital was reduced by foreign currency translation differences of $7.9bn. This was partly offset by capital of $3.4bn generated from profits net of dividends (including the fourth interim dividend after planned scrip).
Included in profits was a $1.4bn gain on the partial sale of our shareholding in Industrial Bank. This included fair value gains reclassified to the income statement that has already been included in CET1 capital, resulting in no further impact. An additional impact on CET1 capital from the partial sale of our shareholding in Industrial Bank was lower allowable non-controlling interest.
Substantial progress has been made in achieving the Group’s 2017 RWA target. After foreign currency translation differences, RWAs reduced by $65bn in 2015, primarily driven by specific initiatives that saved $124bn of RWAs. The saving was partially offset by business growth of $49bn.
HSBC HOLDINGS PLC
228 |
Table of Contents
The following comments describe the key RWA movements excluding foreign currency translation differences.
RWA initiatives
The main drivers were:
| • | $38bn from reduced exposures, the partial disposal of our investment in Industrial Bank, a decrease in trading positions subject to the Incremental Risk Charge, client facility reductions and trade compressions; |
| • | $30bn from refining our calculations, including the further application of the small and medium-sized enterprise (‘SME’) supporting factor, a more refined application of credit conversion factors (‘CCFs’), increased usage of internal ratings-based (‘IRB’) models and the move of certain exposures from residual to cash flow weighted maturity; |
| • | $25bn from process improvements such as better linking of collateral and guarantees to facilities, enhanced risk parameters and the use of more granular data resulting in lower CCFs for off-balance sheet items; and |
| • | $30bn through the continued reduction in the GB&M legacy credit and US run-off portfolios. |
Business growth
Business growth increased RWAs by $49bn, principally in:
| • | CMB, from higher term lending to corporate customers, principally in Europe, North America and Asia, $23bn; |
| • | our associates, Bank of Communications and The Saudi British Bank, $14bn; and |
| • | GB&M, from higher general lending to corporates which increased RWAs by $10bn, mainly in Europe. |
| 2015 | 2014 | |||||||||||
| $bn | $bn | |||||||||||
Credit risk | 875.9 | 955.3 | ||||||||||
– standardised approach | 332.7 | 356.9 | ||||||||||
– IRB foundation approach | 27.4 | 16.8 | ||||||||||
– IRB advanced approach | 515.8 | 581.6 | ||||||||||
Counterparty credit risk | 69.2 | 90.7 | ||||||||||
– standardised approach | 19.1 | 25.2 | ||||||||||
– advanced approach | 50.1 | 65.5 | ||||||||||
Market risk | 42.5 | 56.0 | ||||||||||
– internal model based | 34.9 | 44.6 | ||||||||||
– standardised approach | 7.6 | 11.4 | ||||||||||
Operational risk | 115.4 | 117.8 | ||||||||||
At 31 December 2015 | 1,103.0 | 1,219.8 | ||||||||||
Of which: | ||||||||||||
Run-off portfolios | 69.3 | 99.2 | ||||||||||
– legacy credit in GB&M | 29.8 | 44.1 | ||||||||||
– US CML and Other | 39.5 | 55.1 | ||||||||||
| ||||||||||||
| 2015 | 2014 | |||||||||||
| $bn | $bn | |||||||||||
Retail Banking and Wealth Management4 | 189.5 | 207.2 | ||||||||||
Commercial Banking4 | 421.0 | 430.3 | ||||||||||
Global Banking and Markets | 440.6 | 516.1 | ||||||||||
Global Private Banking | 19.3 | 20.8 | ||||||||||
Other | 32.6 | 45.4 | ||||||||||
At 31 December 2015 | 1,103.0 | 1,219.8 | ||||||||||
| ||||||||||||
| 2015 | 2014 | |||||||||||
| $bn | $bn | |||||||||||
Europe | 337.4 | 375.4 | ||||||||||
Asia | 459.7 | 499.8 | ||||||||||
Middle East and North Africa | 60.4 | 63.0 | ||||||||||
North America | 191.6 | 221.4 | ||||||||||
Latin America | 73.4 | 88.8 | ||||||||||
At 31 December 2015 | 1,103.0 | 1,219.8 | ||||||||||
For footnotes, see page 243
Credit risk exposure – RWAs by geographical region
| Europe | Asia | MENA | North America | Latin America | Total | |||||||||||||||||||||||||||||||
| $bn | $bn | $bn | $bn | $bn | $bn | |||||||||||||||||||||||||||||||
IRB approach | 192.6 | 195.9 | 19.4 | 122.5 | 12.8 | 543.2 | ||||||||||||||||||||||||||||||
– IRB advanced approach | 175.1 | 195.9 | 9.5 | 122.5 | 12.8 | 515.8 | ||||||||||||||||||||||||||||||
– IRB foundation approach | 17.5 | – | 9.9 | – | – | 27.4 | ||||||||||||||||||||||||||||||
Standardised approach | 46.8 | 177.7 | 32.0 | 33.9 | 42.3 | 332.7 | ||||||||||||||||||||||||||||||
RWAs at 31 December 2015 | 239.4 | 373.6 | 51.4 | 156.4 | 55.1 | 875.9 | ||||||||||||||||||||||||||||||
IRB approach | 216.1 | 213.1 | 15.6 | 142.0 | 11.6 | 598.4 | ||||||||||||||||||||||||||||||
– IRB advanced approach | 203.3 | 213.1 | 11.6 | 142.0 | 11.6 | 581.6 | ||||||||||||||||||||||||||||||
– IRB foundation approach | 12.8 | – | 4.0 | – | – | 16.8 | ||||||||||||||||||||||||||||||
Standardised approach | 47.1 | 186.0 | 39.0 | 29.6 | 55.2 | 356.9 | ||||||||||||||||||||||||||||||
RWAs at 31 December 2014 | 263.2 | 399.1 | 54.6 | 171.6 | 66.8 | 955.3 | ||||||||||||||||||||||||||||||
HSBC HOLDINGS PLC
229 |
Table of Contents
Report of the Directors: Capital(continued)
RWAs
Credit risk exposure – RWAs by global businesses
|
| Principal RBWM | 4
|
| RBWM (US run-off portfolio) |
|
| Total RBWM |
| CMB | 4 | GB&M | GPB | Other | Total | ||||||||||||||||||||||||||||||||||
| $bn | $bn | $bn | $bn | $bn | $bn | $bn | $bn | |||||||||||||||||||||||||||||||||||||||||
IRB approach | 59.0 | 33.2 | 92.2 | 218.0 | 214.8 | 8.5 | 9.7 | 543.2 | ||||||||||||||||||||||||||||||||||||||||
– IRB advanced approach | 59.0 | 33.2 | 92.2 | 199.0 | 207.5 | 8.4 | 8.7 | 515.8 | ||||||||||||||||||||||||||||||||||||||||
– IRB foundation approach | – | – | – | 19.0 | 7.3 | 0.1 | 1.0 | 27.4 | ||||||||||||||||||||||||||||||||||||||||
Standardised approach | 57.6 | 3.8 | 61.4 | 172.0 | 69.7 | 7.2 | 22.4 | 332.7 | ||||||||||||||||||||||||||||||||||||||||
RWAs at 31 December 2015 | 116.6 | 37.0 | 153.6 | 390.0 | 284.5 | 15.7 | 32.1 | 875.9 | ||||||||||||||||||||||||||||||||||||||||
IRB approach | 56.1 | 47.3 | 103.4 | 217.2 | 255.6 | 10.2 | 12.0 | 598.4 | ||||||||||||||||||||||||||||||||||||||||
– IRB advanced approach | 56.1 | 47.3 | 103.4 | 209.2 | 248.1 | 10.0 | 10.9 | 581.6 | ||||||||||||||||||||||||||||||||||||||||
– IRB foundation approach | – | – | – | 8.0 | 7.5 | 0.2 | 1.1 | 16.8 | ||||||||||||||||||||||||||||||||||||||||
Standardised approach | 61.2 | 4.8 | 66.0 | 181.0 | 70.1 | 6.6 | 33.2 | 356.9 | ||||||||||||||||||||||||||||||||||||||||
RWAs at 31 December 2014 | 117.3 | 52.1 | 169.4 | 398.2 | 325.7 | 16.8 | 45.2 | 955.3 | ||||||||||||||||||||||||||||||||||||||||
For footnotes, see page 243.
Credit risk RWAs are calculated using three approaches, as permitted by the PRA. For consolidated Group reporting, we have adopted the advanced IRB approach for the
majority of our business, with a small proportion being on the foundation IRB approach and the remaining portfolios on the standardised approach.
RWA movement by geographical regions by key driver – credit risk – IRB only6
| Europe | Asia | MENA | North America | Latin America | Total | |||||||||||||||||||||||||||||||
| $bn | $bn | $bn | $bn | $bn | $bn | |||||||||||||||||||||||||||||||
RWAs at 1 January 2015 | 216.1 | 213.1 | 15.6 | 142.0 | 11.6 | 598.4 | ||||||||||||||||||||||||||||||
Foreign exchange movement | (10.4 | ) | (7.2 | ) | (0.6 | ) | (4.7 | ) | (3.4 | ) | (26.3 | ) | ||||||||||||||||||||||||
Acquisitions and disposals | (14.1 | ) | – | (0.1 | ) | (4.9 | ) | – | (19.1 | ) | ||||||||||||||||||||||||||
Book size | 11.4 | 2.9 | (0.5 | ) | (2.8 | ) | 0.4 | 11.4 | ||||||||||||||||||||||||||||
Book quality | (8.0 | ) | (6.9 | ) | (1.4 | ) | 0.7 | 3.9 | (11.7 | ) | ||||||||||||||||||||||||||
Model updates | 1.2 | (2.6 | ) | 4.7 | 0.2 | 0.1 | 3.6 | |||||||||||||||||||||||||||||
– portfolios moving onto IRB approach | (0.1 | ) | – | 4.7 | 0.2 | 0.1 | 4.9 | |||||||||||||||||||||||||||||
– new/updated models | 1.3 | (2.6 | ) | – | – | – | (1.3 | ) | ||||||||||||||||||||||||||||
Methodology and policy | (3.6 | ) | (3.4 | ) | 1.7 | (8.0 | ) | 0.2 | (13.1 | ) | ||||||||||||||||||||||||||
– internal updates | (6.2 | ) | (5.4 | ) | 1.6 | (8.0 | ) | 0.2 | (17.8 | ) | ||||||||||||||||||||||||||
– external updates – regulatory | 2.6 | 2.0 | 0.1 | – | – | 4.7 | ||||||||||||||||||||||||||||||
Total RWA movement | (23.5 | ) | (17.2 | ) | 3.8 | (19.5 | ) | 1.2 | (55.2 | ) | ||||||||||||||||||||||||||
RWAs at 31 December 2015 | 192.6 | 195.9 | 19.4 | 122.5 | 12.8 | 543.2 | ||||||||||||||||||||||||||||||
RWAs at 1 January 2014 on Basel 2.5 basis | 166.9 | 182.9 | 15.0 | 161.5 | 8.5 | 534.8 | ||||||||||||||||||||||||||||||
Foreign exchange movement | (11.6 | ) | (4.0 | ) | (0.2 | ) | (2.4 | ) | (1.9 | ) | (20.1 | ) | ||||||||||||||||||||||||
Acquisitions and disposals | (3.5 | ) | – | (0.7 | ) | (4.2 | ) | (0.1 | ) | (8.5 | ) | |||||||||||||||||||||||||
Book size | 11.4 | 19.5 | 1.8 | 2.9 | 2.0 | 37.6 | ||||||||||||||||||||||||||||||
Book quality | (1.5 | ) | – | (0.8 | ) | (10.3 | ) | 1.4 | (11.2 | ) | ||||||||||||||||||||||||||
Model updates | 19.4 | 0.3 | – | (6.1 | ) | – | 13.6 | |||||||||||||||||||||||||||||
Methodology and policy | 35.0 | 14.4 | 0.5 | 0.6 | 1.7 | 52.2 | ||||||||||||||||||||||||||||||
– internal updates | (11.7 | ) | (5.2 | ) | (0.2 | ) | (6.4 | ) | (0.1 | ) | (23.6 | ) | ||||||||||||||||||||||||
– external updates – regulatory | 2.2 | 8.5 | (0.2 | ) | 0.7 | 0.1 | 11.3 | |||||||||||||||||||||||||||||
– CRD IV impact | 37.0 | 5.7 | 0.4 | 4.9 | 0.2 | 48.2 | ||||||||||||||||||||||||||||||
– NCOA moving from STD to IRB | 7.5 | 5.4 | 0.5 | 1.4 | 1.5 | 16.3 | ||||||||||||||||||||||||||||||
Total RWA movement | 49.2 | 30.2 | 0.6 | (19.5 | ) | 3.1 | 63.6 | |||||||||||||||||||||||||||||
RWAs at 31 December 2014 on CRD IV basis | 216.1 | 213.1 | 15.6 | 142.0 | 11.6 | 598.4 | ||||||||||||||||||||||||||||||
For footnote, see page 243.
HSBC HOLDINGS PLC
230 |
Table of Contents
RWA movement by global businesses by key driver – credit risk – IRB only6
|
| Principal RBWM | 4
|
| RBWM (US run-off) |
|
| Total RBWM |
| CMB | 4 | GB&M | GPB | Other | Total | ||||||||||||||||||||||||||||||||||
| $bn | $bn | $bn | $bn | $bn | $bn | $bn | $bn | |||||||||||||||||||||||||||||||||||||||||
RWAs at 1 January 2015 | 56.1 | 47.3 | 103.4 | 217.2 | 255.6 | 10.2 | 12.0 | 598.4 | ||||||||||||||||||||||||||||||||||||||||
Foreign exchange movement | (2.9 | ) | – | (2.9 | ) | (11.7 | ) | (11.0 | ) | (0.3 | ) | (0.4 | ) | (26.3 | ) | |||||||||||||||||||||||||||||||||
Acquisitions and disposals | – | (4.9 | ) | (4.9 | ) | – | (14.2 | ) | – | – | (19.1 | ) | ||||||||||||||||||||||||||||||||||||
Book size | 3.7 | (5.6 | ) | (1.9 | ) | 15.8 | (0.8 | ) | (0.5 | ) | (1.2 | ) | 11.4 | |||||||||||||||||||||||||||||||||||
Book quality | (2.8 | ) | (3.7 | ) | (6.5 | ) | 6.0 | (10.5 | ) | (0.1 | ) | (0.6 | ) | (11.7 | ) | |||||||||||||||||||||||||||||||||
Model updates | 0.4 | – | 0.4 | 5.6 | (2.3 | ) | (0.1 | ) | – | 3.6 | ||||||||||||||||||||||||||||||||||||||
– portfolios moving onto IRB approach | – | – | – | 4.1 | 0.9 | (0.1 | ) | – | 4.9 | |||||||||||||||||||||||||||||||||||||||
– new/updated models | 0.4 | – | 0.4 | 1.5 | (3.2 | ) | – | – | (1.3 | ) | ||||||||||||||||||||||||||||||||||||||
Methodology and policy | 4.5 | 0.1 | 4.6 | (14.9 | ) | (2.0 | ) | (0.7 | ) | (0.1 | ) | (13.1 | ) | |||||||||||||||||||||||||||||||||||
– internal updates | 2.5 | 0.1 | 2.6 | (14.9 | ) | (4.7 | ) | (0.7 | ) | (0.1 | ) | (17.8 | ) | |||||||||||||||||||||||||||||||||||
– external updates – regulatory | 2.0 | – | 2.0 | – | 2.7 | – | – | 4.7 | ||||||||||||||||||||||||||||||||||||||||
Total RWA movement | 2.9 | (14.1 | ) | (11.2 | ) | 0.8 | (40.8 | ) | (1.7 | ) | (2.3 | ) | (55.2 | ) | ||||||||||||||||||||||||||||||||||
RWAs at 31 December 2015 | 59.0 | 33.2 | 92.2 | 218.0 | 214.8 | 8.5 | 9.7 | 543.2 | ||||||||||||||||||||||||||||||||||||||||
RWAs at 1 January 2014 on Basel 2.5 basis | 58.5 | 72.6 | 131.1 | 189.4 | 198.5 | 10.6 | 5.2 | 534.8 | ||||||||||||||||||||||||||||||||||||||||
Foreign exchange movement | (2.6 | ) | – | (2.6 | ) | (8.7 | ) | (8.1 | ) | (0.2 | ) | (0.5 | ) | (20.1 | ) | |||||||||||||||||||||||||||||||||
Acquisitions and disposals | – | – | – | – | (8.2 | ) | – | (0.3 | ) | (8.5 | ) | |||||||||||||||||||||||||||||||||||||
Book size | 1.9 | (6.9 | ) | (5.0 | ) | 23.1 | 21.1 | (0.5 | ) | (1.1 | ) | 37.6 | ||||||||||||||||||||||||||||||||||||
Book quality | (5.7 | ) | (8.6 | ) | (14.3 | ) | 2.8 | (0.2 | ) | (0.3 | ) | 0.8 | (11.2 | ) | ||||||||||||||||||||||||||||||||||
Model updates | 0.6 | (6.2 | ) | (5.6 | ) | 12.2 | 7.0 | – | – | 13.6 | ||||||||||||||||||||||||||||||||||||||
Methodology and policy | 3.4 | (3.6 | ) | (0.2 | ) | (1.6 | ) | 45.5 | 0.6 | 7.9 | 52.2 | |||||||||||||||||||||||||||||||||||||
– internal updates | (3.0 | ) | (3.9 | ) | (6.9 | ) | (5.0 | ) | (11.2 | ) | (0.5 | ) | – | (23.6 | ) | |||||||||||||||||||||||||||||||||
– external updates – regulatory | 1.8 | – | 1.8 | 2.5 | 6.3 | 0.5 | 0.2 | 11.3 | ||||||||||||||||||||||||||||||||||||||||
– CRD IV impact | – | – | – | (0.7 | ) | 48.6 | 0.2 | 0.1 | 48.2 | |||||||||||||||||||||||||||||||||||||||
– NCOA moving from STD to IRB | 4.6 | 0.3 | 4.9 | 1.6 | 1.8 | 0.4 | 7.6 | 16.3 | ||||||||||||||||||||||||||||||||||||||||
Total RWA movement | (2.4 | ) | (25.3 | ) | (27.7 | ) | 27.8 | 57.1 | (0.4 | ) | 6.8 | 63.6 | ||||||||||||||||||||||||||||||||||||
RWAs at 31 December 2014 on CRD IV basis | 56.1 | 47.3 | 103.4 | 217.2 | 255.6 | 10.2 | 12.0 | 598.4 | ||||||||||||||||||||||||||||||||||||||||
For footnotes, see page 243.
Internal ratings-based approach
For portfolios treated under the IRB approach, credit risk RWAs decreased by $55bn, which included a reduction of $26bn due to foreign exchange movements.
Acquisitions and disposals
| • | The disposal of US mortgage portfolios reduced RWAs by $4.9bn; and |
| • | the sale of securitisation positions in the GB&M legacy credit portfolio resulted in a RWA decrease of $14bn. |
Book size
| • | The book size grew from higher corporate lending, including term and trade-related lending which increased RWAs by $16bn, mainly in Europe and Asia for CMB. |
| • | In North America, in RBWM, the continued run-off of the US CML retail mortgage portfolios resulted in an RWA reduction of $5.6bn. |
Book quality
| • | RWAs reduced by $3.7bn in the US run-off portfolio, primarily due to continued run-off which led to an improvement in the book quality of the residual portfolio; |
| • | book quality improvements in the Principal RBWM business of $2.8bn mainly related to credit quality improvements in Europe; |
| • | in CMB, RWAs increased by $6.0bn, primarily as a result of corporate downgrades in Europe; |
| • | in GB&M, a decrease in RWAs of $10bn was mainly due to the implementation of netting agreements to new corporate counterparties in Europe, the securitisation of corporate loans and rating upgrades of institutions in Asia; and |
| • | the downgrade of Brazil’s rating increased RWAs by $3.7bn across businesses. |
Methodology and policy changes
| • | RWA initiatives were the main driver for the reduction of RWAs driven by changes in ‘internal updates’. Further details are provided on page 229. |
| • | They were offset by the change in RWA calculation on defaulted exposures in RBWM increasing RWAs by $2.0bn, the implementation of a risk-weight floor on mortgages in Hong Kong with an RWA impact of $2.0bn, |
HSBC HOLDINGS PLC
231 |
Table of Contents
Report of the Directors: Capital(continued)
RWAs / Capital
and the implementation of a 1.06 scaling factor on securitisation positions risk-weighted at 1,250% which increased RWAs by $2.1bn.
Standardised approach
For portfolios treated under the standardised approach, credit risk RWAs decreased by $24bn, which included a reduction of $27bn due to foreign exchange movements.
| • | RWAs increased by $23bn across all regions as a result of higher lending. Growth in our associate, BoCom, accounted for $15bn. |
| • | This was offset by RWA initiatives reducing RWAs by $29bn, mainly comprising portfolios moving to an IRB approach (reducing the standardised approach by $10.2bn and increasing the IRB approach by $7.2bn) and partial disposal of our investment in Industrial Bank reducing RWAs by $12.4bn. |
Counterparty credit risk and market risk RWAs
| 2015 | 2014 | |||||||||||
| $bn | $bn | |||||||||||
Advanced approach | 50.1 | 65.5 | ||||||||||
– CCR IRB approach | 46.8 | 62.0 | ||||||||||
– credit valuation adjustment | 3.3 | 3.5 | ||||||||||
Standardised approach | 19.1 | 25.2 | ||||||||||
– CCR standardised approach | 4.7 | 4.4 | ||||||||||
– credit valuation adjustment | 12.2 | 18.0 | ||||||||||
– central counterparty | 2.2 | 2.8 | ||||||||||
At 31 December | 69.2 | 90.7 | ||||||||||
RWA movement by key driver – counterparty credit risk – advanced approach
| 2015 | 2014 | |||||||||||
| $bn | $bn | |||||||||||
RWAs at 1 January | 65.5 | 42.2 | ||||||||||
Book size | (10.2 | ) | 1.6 | |||||||||
Book quality | (0.8 | ) | (0.6 | ) | ||||||||
Model updates | – | 0.1 | ||||||||||
Methodology and policy | (4.4 | ) | 22.2 | |||||||||
– internal updates | (4.4 | ) | (3.8 | ) | ||||||||
– external updates – regulatory | – | 9.0 | ||||||||||
– CRD IV impact | – | 17.0 | ||||||||||
Total RWA movement | (15.4 | ) | 23.3 | |||||||||
RWAs at 31 December | 50.1 | 65.5 | ||||||||||
| 2015 | 2014 | |||||||||||
| $bn | $bn | |||||||||||
Internal model based | 34.9 | 44.6 | ||||||||||
– VaR | 7.7 | 7.3 | ||||||||||
– stressed VaR | 9.8 | 10.4 | ||||||||||
– incremental risk charge | 11.4 | 20.1 | ||||||||||
– other VaR and stressed VaR | 6.0 | 6.8 | ||||||||||
Standardised approach | 7.6 | 11.4 | ||||||||||
At 31 December | 42.5 | 56.0 | ||||||||||
RWA movement by key driver – market risk – internal model based
| 2015 | 2014 | |||||||||||
| $bn | $bn | |||||||||||
RWAs at 1 January | 44.6 | 52.2 | ||||||||||
Acquisitions and disposals | – | (2.2 | ) | |||||||||
Movement in risk levels | (5.5 | ) | (4.2 | ) | ||||||||
Methodology and policy | (4.2 | ) | (1.2 | ) | ||||||||
– internal updates | (4.2 | ) | (3.8 | ) | ||||||||
– external updates – regulatory | – | 2.6 | ||||||||||
Total RWA movement | (9.7 | ) | (7.6 | ) | ||||||||
RWAs at 31 December | 34.9 | 44.6 | ||||||||||
Counterparty credit risk RWAs
Counterparty credit risk RWAs reduced by $21bn during 2015.
Standardised approach
A reduction of $6.1bn in RWAs in the standardised portfolio was mostly due to the impact of market movements and position reductions for derivatives held with counterparties eligible for the standardised credit value adjustment (‘CVA’) charge.
Advanced approach
The book size reduced by $10bn, mainly driven by market movements, particularly in foreign exchange derivatives, trade compression and portfolio management activities.
Further reductions in ‘Methodology and policy’ were mainly driven by savings from RWA initiatives.
Total market risk RWAs decreased by $13bn in 2015.
Standardised approach
The market risk RWAs in the standardised portfolio fell by $3.8bn, mainly driven by the reduction in the legacy credit portfolio.
Internal model based
The reduction in RWAs due to movements in risk levels of $5.5bn was driven by a combination of active management of the book and market movements, in particular within the incremental risk charge. In addition to these movements, there were savings of $4.2bn in ‘Methodology and policy’ due to the refinement of models used for the calculation of the incremental risk charge and risks not in VaR.
The reduction in operational risk RWAs of $2.4bn was mainly the result of currency exchange differences and a decline in income in Latin America.
HSBC HOLDINGS PLC
232 |
Table of Contents
Source and application of total regulatory capital
| Year to 31 December | ||||||||||||
2015 $m | 2014 $m | |||||||||||
Movement in total regulatory capital | ||||||||||||
Opening common equity tier 1 capital on a transitional basis7 | 133,200 | 131,233 | ||||||||||
Transitional adjustments | 2,753 | |||||||||||
– unrealised gains arising from revaluation of property | 1,375 | |||||||||||
– unrealised gains in available-for-sale debt and equities | 1,378 | |||||||||||
Opening common equity tier 1 capital on an end point basis1 | 135,953 | |||||||||||
Contribution to common equity tier 1 capital from profit for the period | 11,302 | 12,678 | ||||||||||
– consolidated profits attributable to shareholders of the parent company | 13,522 | 13,688 | ||||||||||
– removal of own credit spread net of tax | (912 | ) | (328 | ) | ||||||||
– debit valuation adjustment | (139 | ) | 254 | |||||||||
– deconsolidation of insurance entities and SPEs | (1,169 | ) | (936 | ) | ||||||||
Net dividends including foreseeable net dividends2 | (7,853 | ) | (7,541 | ) | ||||||||
– dividends net of scrip | (4,136 | ) | (4,179 | ) | ||||||||
– fourth interim dividend net of planned scrip | (3,717 | ) | (3,362 | ) | ||||||||
Increase in goodwill and intangible assets deducted3 | (227 | ) | 2,424 | |||||||||
Ordinary shares issued | 147 | 267 | ||||||||||
Foreign currency translation differences3 | (7,887 | ) | (8,356 | ) | ||||||||
Other, including regulatory adjustments | (572 | ) | 2,495 | |||||||||
Closing common equity tier 1 capital | 130,863 | 133,200 | ||||||||||
Opening additional tier 1 capital on a transitional basis7 | 19,539 | 14,408 | ||||||||||
Movement in additional tier 1 securities | 2,272 | 4,961 | ||||||||||
– new issuance | 3,580 | 5,681 | ||||||||||
– grandfathering adjustments | (1,308 | ) | (720 | ) | ||||||||
Other, including regulatory adjustments | 629 | 170 | ||||||||||
Closing tier 1 capital on a transitional basis | 153,303 | 152,739 | ||||||||||
Opening other tier 2 capital on a transitional basis7 | 37,991 | 35,538 | ||||||||||
Movement in tier 2 securities | (1,276 | ) | 2,414 | |||||||||
– new issuance | 3,180 | 3,500 | ||||||||||
– grandfathering adjustments | (2,996 | ) | – | |||||||||
– foreign currency transitional differences | (887 | ) | (1,066 | ) | ||||||||
– other movements | (573 | ) | (20 | ) | ||||||||
Other, including regulatory adjustments | (185 | ) | 39 | |||||||||
Closing total regulatory capital on a transitional basis | 189,833 | 190,730 | ||||||||||
For footnotes, see page 243.
HSBC HOLDINGS PLC
233 |
Table of Contents
Report of the Directors: Capital(continued)
Capital
Composition of regulatory capital
(Audited)
| At 31 December | ||||||||||||
| 2015 | 2014 | |||||||||||
| Ref | $m | $m | ||||||||||
Common equity tier 1 capital | ||||||||||||
Shareholders’ equity | 160,664 | 166,617 | ||||||||||
– shareholders’ equity per balance sheet8 | a | 188,460 | 190,447 | |||||||||
– foreseeable interim dividend2 | (3,717 | ) | (3,362 | ) | ||||||||
– preference share premium | b | (1,405 | ) | (1,405 | ) | |||||||
– other equity instruments | c | (15,112 | ) | (11,532 | ) | |||||||
– deconsolidation of special purpose entities9 | a | (91 | ) | (323 | ) | |||||||
– deconsolidation of insurance entities | a, h | (7,471 | ) | (7,208 | ) | |||||||
Non-controlling interests | 3,519 | 4,640 | ||||||||||
– non-controlling interests per balance sheet | d | 9,058 | 9,531 | |||||||||
– preference share non-controlling interests | e | (2,077 | ) | (2,127 | ) | |||||||
– non-controlling interests transferred to tier 2 capital | f | – | (473 | ) | ||||||||
– non-controlling interests in deconsolidated subsidiaries | d | (933 | ) | (851 | ) | |||||||
– surplus non-controlling interests disallowed in CET1 | (2,529 | ) | (1,440 | ) | ||||||||
Regulatory adjustments to the accounting basis | (4,556 | ) | (3,556 | ) | ||||||||
– own credit spread10 | (159 | ) | 767 | |||||||||
– debit valuation adjustment | (336 | ) | (197 | ) | ||||||||
– defined benefit pension fund adjustment | g | (4,009 | ) | (4,069 | ) | |||||||
– cash flow hedging reserve | (52 | ) | (57 | ) | ||||||||
Deductions | (28,764 | ) | (31,748 | ) | ||||||||
– goodwill and intangible assets | h | (20,650 | ) | (22,475 | ) | |||||||
– deferred tax assets that rely on future profitability (excludes those arising from temporary differences) | n | (1,204 | ) | (1,036 | ) | |||||||
– additional valuation adjustment (referred to as PVA) | (1,151 | ) | (1,341 | ) | ||||||||
– investments in own shares through the holding of composite products of which HSBC is a component (exchange traded funds, derivatives and index stock) | (839 | ) | (1,083 | ) | ||||||||
– negative amounts resulting from the calculation of expected loss amounts | i | (4,920 | ) | (5,813 | ) | |||||||
Common equity tier 1 capital on an end point basis | 130,863 | 135,953 | ||||||||||
Tier 1 and tier 2 capital on a transitional basis | ||||||||||||
Common equity tier 1 capital on an end point basis | 130,863 | 135,953 | ||||||||||
Transitional adjustments | (2,753 | ) | ||||||||||
– unrealised gains arising from revaluation of property | (1,375 | ) | ||||||||||
– unrealised gains in available-for-sale debt and equities | (1,378 | ) | ||||||||||
Common equity tier 1 capital on a transitional basis | 130,863 | 133,200 | ||||||||||
Additional tier 1 capital on a transitional basis | ||||||||||||
Other tier 1 capital before deductions | 22,621 | 19,687 | ||||||||||
– preference share premium | b | 1,015 | 1,160 | |||||||||
– preference share non-controlling interests | e | 1,711 | 1,955 | |||||||||
– allowable non-controlling interest in AT1 | d | 1,546 | 884 | |||||||||
– Hybrid capital securities | j | 18,349 | 15,688 | |||||||||
Deductions | (181 | ) | (148 | ) | ||||||||
– unconsolidated investments11 | (121 | ) | (148 | ) | ||||||||
– holding of own additional tier 1 instruments | (60 | ) | – | |||||||||
Tier 1 capital on a transitional basis | 153,303 | 152,739 | ||||||||||
Tier 2 capital on a transitional basis | ||||||||||||
Total qualifying tier 2 capital before deductions | 36,852 | 38,213 | ||||||||||
– allowable non-controlling interest in tier 2 | d | 14 | 99 | |||||||||
– perpetual subordinated debt | l | 1,941 | 2,218 | |||||||||
– term subordinated debt | m | 34,897 | 35,656 | |||||||||
– non-controlling interests in tier 2 capital | f | – | 240 | |||||||||
Total deductions other than from tier 1 capital | (322 | ) | (222 | ) | ||||||||
– unconsolidated investments11 | (282 | ) | (222 | ) | ||||||||
– holding of own tier 2 instruments | (40 | ) | – | |||||||||
Total regulatory capital on a transitional basis | 189,833 | 190,730 | ||||||||||
For footnotes, see page 243.
The references (a) – (n) identify balance sheet components on page 236 which are used in the calculation of regulatory capital.
HSBC HOLDINGS PLC
234 |
Table of Contents
Reconciliation of regulatory capital from transitional basis to an estimated CRD IV end point basis
| At 31 December | ||||||||||||
| 2015 | 2014 | |||||||||||
| $m | $m | |||||||||||
Common equity tier 1 capital on a transitional basis | 130,863 | 133,200 | ||||||||||
Unrealised gains arising from revaluation of property | 1,375 | |||||||||||
Unrealised gains in available-for-sale debt and equities | 1,378 | |||||||||||
Common equity tier 1 capital on an end point basis | 130,863 | 135,953 | ||||||||||
Additional tier 1 capital on a transitional basis | 22,440 | 19,539 | ||||||||||
Grandfathered instruments: Preference share premium | (1,015 | ) | (1,160 | ) | ||||||||
Preference share non-controlling interests | (1,711 | ) | (1,955 | ) | ||||||||
Hybrid capital securities | (9,088 | ) | (10,007 | ) | ||||||||
Transitional provisions: | ||||||||||||
Allowable non-controlling interest in AT1 | (1,377 | ) | (487 | ) | ||||||||
Unconsolidated investments11 | 121 | 148 | ||||||||||
Additional tier 1 capital end point basis | 9,370 | 6,078 | ||||||||||
Tier 1 capital on an end point basis | 140,233 | 142,031 | ||||||||||
Tier 2 capital on a transitional basis | 36,530 | 37,991 | ||||||||||
Grandfathered instruments: | ||||||||||||
Perpetual subordinated debt | (1,941 | ) | (2,218 | ) | ||||||||
Term subordinated debt | (19,034 | ) | (21,513 | ) | ||||||||
Transitional provisions: | ||||||||||||
Non-controlling interest in tier 2 capital | – | (240 | ) | |||||||||
Allowable non-controlling interest in tier 2 | 21 | 396 | ||||||||||
Unconsolidated investments11 | (121 | ) | (148 | ) | ||||||||
Tier 2 capital on an end point basis | 15,455 | 14,268 | ||||||||||
Total regulatory capital on an end point basis | 155,688 | 156,299 | ||||||||||
For footnote, see page 243.
The capital position presented on a CRD IV transitional basis follows the Group’s interpretation of CRD IV legislation and the PRA’s rules as set out in the PRA Rulebook.
The effects of draft EBA technical standards are not generally captured in our numbers.
While CRD IV allows for the majority of regulatory adjustments and deductions from CET1 to be implemented on a gradual basis from 1 January 2014 to 1 January 2018, the PRA has largely decided not to make use of these transitional provisions. From 1 January 2015, unrealised gains on investment property and available-for-sale securities were recognised in CET1 capital. As a result our end point and transitional CET1 capital and ratios are now aligned.
For additional tier 1 and tier 2 capital, the PRA has followed the transitional provisions timing as set out in CRD IV to apply the necessary regulatory adjustments and deductions. The effect of these adjustments is being phased in at 20% per annum from 1 January 2014 to 1 January 2018.
Non-CRD IV compliant additional tier 1 and tier 2 instruments also benefit from a grandfathering period. This progressively reduces the eligible amount by 10% annually, following an initial reduction of 20% on 1 January 2014, until they are fully phased out by 1 January 2022.
Under CRD IV, as implemented in the UK, banks are required to meet a minimum CET1 ratio of 4.5% of RWAs, a minimum tier 1 ratio of 6% of RWAs and a total capital ratio of 8% of RWAs. In addition to the Pillar 1 minimum ratios, the PRA sets Pillar 2A capital requirements, which together are considered the minimum level of regulatory capital to be maintained at all times. Pillar 2A is to be met with at least 56% CET1 capital and the remaining with non-common equity capital.
In addition to minimum requirements, CRD IV establishes a number of capital buffers to be met with CET1 capital, which largely phase-in from 1 January 2016. To the extent our CET1 capital is insufficient to meet these buffer requirements, the Group would suffer automatic restrictions on capital distributions.
Going forward, as the grandfathering provisions fall away, we intend to meet our overall regulatory minima in an economically efficient manner by issuing non-common equity capital as necessary. At 31 December 2015, the Group had $25.1bn of CRD IV compliant non-common equity capital instruments, of which $3.2bn of tier 2 and $3.6bn of additional tier 1 were issued during the year (for details on the additional tier 1 instruments issued during the year see Note 35 on the Financial Statements). At 31 December 2015, the Group also had $32.8bn of non-common equity capital instruments qualifying as eligible capital under CRD IV by virtue of the application of the grandfathering provisions, after applying a 30% reduction as outlined above.
HSBC HOLDINGS PLC
235 |
Table of Contents
Report of the Directors: Capital(continued)
Regulatory balance sheet
Regulatory and accounting consolidations
The basis of consolidation for the purpose of financial accounting under IFRS, described in Note 1 on the Financial Statements, differs from that used for regulatory purposes as described in ‘Structure of the regulatory group’ on page 12 of thePillar 3 Disclosures 2015 report. The table below provides a reconciliation of the financial accounting balance sheet to the regulatory scope of consolidation.
Interests in banking associates are equity accounted in the financial accounting consolidation, whereas their exposures are proportionally consolidated for regulatory purposes by including our share of assets, liabilities, profit and loss and RWAs in accordance with the PRA’s application of CRD IV.
Subsidiaries engaged in insurance activities are excluded from the regulatory consolidation by excluding assets, liabilities and post-acquisition reserves, leaving the investment of these insurance subsidiaries to be recorded at cost and deducted from CET1 (subject to thresholds).
The regulatory consolidation also excludes special purpose entities (‘SPEs’) where significant risk has been transferred to third parties. Exposures to these SPEs are risk-weighted as securitisation positions for regulatory purposes.
Entities in respect of which the basis of consolidation for financial accounting purposes differs from that used for regulatory purposes can be found in table 5 of thePillar 3 Disclosures 2015 report.
Reconciliation of balance sheets – financial accounting to regulatory scope of consolidation
| Ref | Accounting balance sheet $m | Deconsolidation of insurance/ other entities | �� | Consolidation of banking associates | Regulatory balance | |||||||||||||||||||||
Assets | ||||||||||||||||||||||||||
Cash and balances at central banks | 98,934 | (2 | ) | 28,784 | 127,716 | |||||||||||||||||||||
Items in the course of collection from other banks | 5,768 | – | 22 | 5,790 | ||||||||||||||||||||||
Hong Kong Government certificates of indebtedness | 28,410 | – | – | 28,410 | ||||||||||||||||||||||
Trading assets | 224,837 | 340 | 4,390 | 229,567 | ||||||||||||||||||||||
Financial assets designated at fair value | 23,852 | (23,521 | ) | 2,034 | 2,365 | |||||||||||||||||||||
Derivatives | 288,476 | (146 | ) | 495 | 288,825 | |||||||||||||||||||||
Loans and advances to banks | 90,401 | (3,008 | ) | 16,413 | 103,806 | |||||||||||||||||||||
Loans and advances to customers | 924,454 | (7,427 | ) | 120,016 | 1,037,043 | |||||||||||||||||||||
of which: | ||||||||||||||||||||||||||
– impairment allowances on IRB portfolios | i | (6,291 | ) | – | – | (6,291 | ) | |||||||||||||||||||
– impairment allowances on standardised portfolios | (3,263 | ) | – | (2,780 | ) | (6,043 | ) | |||||||||||||||||||
Reverse repurchase agreements – non-trading | 146,255 | 711 | 5,935 | 152,901 | ||||||||||||||||||||||
Financial investments | 428,955 | (51,684 | ) | 42,732 | 420,003 | |||||||||||||||||||||
Assets held for sale | 43,900 | (4,107 | ) | – | 39,793 | |||||||||||||||||||||
of which: | ||||||||||||||||||||||||||
– goodwill and intangible assets | h | 1,680 | (219 | ) | – | 1,461 | ||||||||||||||||||||
– impairment allowances of disposal groups held for sale | (1,454 | ) | – | – | (1,454 | ) | ||||||||||||||||||||
of which: | ||||||||||||||||||||||||||
– IRB portfolios | i | (7 | ) | – | – | (7 | ) | |||||||||||||||||||
– standardised portfolios | (1,447 | ) | – | – | (1,447 | ) | ||||||||||||||||||||
Capital invested in insurance and other entities | – | 2,371 | – | 2,371 | ||||||||||||||||||||||
Current tax assets | 1,221 | (15 | ) | – | 1,206 | |||||||||||||||||||||
Prepayments, accrued income and other assets | 54,398 | (2,539 | ) | 9,692 | 61,551 | |||||||||||||||||||||
of which: | ||||||||||||||||||||||||||
– retirement benefit assets | g | 5,272 | – | – | 5,272 | |||||||||||||||||||||
Interests in associates and joint ventures | 19,139 | – | (18,571 | ) | 568 | |||||||||||||||||||||
of which: | ||||||||||||||||||||||||||
– positive goodwill on acquisition | h | 593 | – | (579 | ) | 14 | ||||||||||||||||||||
Goodwill and intangible assets | h | 24,605 | (6,068 | ) | 623 | 19,160 | ||||||||||||||||||||
Deferred tax assets | n | 6,051 | 195 | 518 | 6,764 | |||||||||||||||||||||
Total assets at 31 December 2015 | 2,409,656 | (94,900 | ) | 213,083 | 2,527,839 | |||||||||||||||||||||
Liabilities and equity | ||||||||||||||||||||||||||
Hong Kong currency notes in circulation | 28,410 | – | – | 28,410 | ||||||||||||||||||||||
Deposits by banks | 54,371 | (97 | ) | 50,005 | 104,279 | |||||||||||||||||||||
Customer accounts | 1,289,586 | (119 | ) | 147,522 | 1,436,989 | |||||||||||||||||||||
Repurchase agreements – non-trading | 80,400 | – | – | 80,400 | ||||||||||||||||||||||
Items in course of transmission to other banks | 5,638 | – | – | 5,638 | ||||||||||||||||||||||
Trading liabilities | 141,614 | (66 | ) | 59 | 141,607 | |||||||||||||||||||||
Financial liabilities designated at fair value | 66,408 | (6,046 | ) | – | 60,362 | |||||||||||||||||||||
of which: | ||||||||||||||||||||||||||
– term subordinated debt included in tier 2 capital | m | 21,168 | – | – | 21,168 | |||||||||||||||||||||
– hybrid capital securities included in tier 1 capital | j | 1,342 | – | – | 1,342 | |||||||||||||||||||||
HSBC HOLDINGS PLC
236 |
Table of Contents
| Ref | Accounting balance $m | Deconsolidation of insurance/ other entities | Consolidation of banking associates $m | Regulatory balance $m | ||||||||||||||||||||||||
Derivatives | 281,071 | 87 | 508 | 281,666 | ||||||||||||||||||||||||
Debt securities in issue | 88,949 | (7,885 | ) | 5,065 | 86,129 | |||||||||||||||||||||||
Liabilities of disposal groups held for sale | 36,840 | (3,690 | ) | – | 33,150 | |||||||||||||||||||||||
Current tax liabilities | 783 | (84 | ) | 409 | 1,108 | |||||||||||||||||||||||
Liabilities under insurance contracts | 69,938 | (69,938 | ) | – | – | |||||||||||||||||||||||
Accruals, deferred income and other liabilities | 38,116 | 2,326 | 6,669 | 47,111 | ||||||||||||||||||||||||
of which: | ||||||||||||||||||||||||||||
– retirement benefit liabilities | 2,809 | (2 | ) | 61 | 2,868 | |||||||||||||||||||||||
Provisions | 5,552 | (25 | ) | – | 5,527 | |||||||||||||||||||||||
of which: | ||||||||||||||||||||||||||||
– contingent liabilities and contractual commitments | 240 | – | – | 240 | ||||||||||||||||||||||||
of which: | ||||||||||||||||||||||||||||
– credit-related provisions on IRB portfolios | i | 201 | – | – | 201 | |||||||||||||||||||||||
– credit-related provisions on standardised portfolios | 39 | – | – | 39 | ||||||||||||||||||||||||
Deferred tax liabilities | 1,760 | (868 | ) | 5 | 897 | |||||||||||||||||||||||
Subordinated liabilities | 22,702 | – | 2,841 | 25,543 | ||||||||||||||||||||||||
of which: | ||||||||||||||||||||||||||||
– hybrid capital securities included in tier 1 capital | j | 1,929 | – | – | 1,929 | |||||||||||||||||||||||
– perpetual subordinated debt included in tier 2 capital | l | 2,368 | – | – | 2,368 | |||||||||||||||||||||||
– term subordinated debt included in tier 2 capital | m | 18,405 | – | – | 18,405 | |||||||||||||||||||||||
Total shareholders’ equity | a | 188,460 | (7,562 | ) | – | 180,898 | ||||||||||||||||||||||
of which: | ||||||||||||||||||||||||||||
– other equity instruments included in tier 1 capital | c, j | 15,112 | – | – | 15,112 | |||||||||||||||||||||||
– preference share premium included in tier 1 capital | b | 1,405 | – | – | 1,405 | |||||||||||||||||||||||
Non-controlling interests | d | 9,058 | (933 | ) | – | 8,125 | ||||||||||||||||||||||
of which: | ||||||||||||||||||||||||||||
– non-cumulative preference shares issued by subsidiaries included in tier 1 capital | e | 2,077 | – | – | 2,077 | |||||||||||||||||||||||
– non-controlling interests included in tier 2 capital, cumulative preferred stock | f | – | – | – | – | |||||||||||||||||||||||
– non-controlling interests attributable to holders of ordinary shares in subsidiaries included in tier 2 capital | f, m | – | – | – | – | |||||||||||||||||||||||
Total liabilities and equity at 31 December 2015 | 2,409,656 | (94,900 | ) | 213,083 | 2,527,839 | |||||||||||||||||||||||
Assets | ||||||||||||||||||||||||||||
Cash and balances at central banks | 129,957 | – | 30,731 | 160,688 | ||||||||||||||||||||||||
Items in the course of collection from other banks | 4,927 | – | 80 | 5,007 | ||||||||||||||||||||||||
Hong Kong Government certificates of indebtedness | 27,674 | – | – | 27,674 | ||||||||||||||||||||||||
Trading assets | 304,193 | (720 | ) | 2,357 | 305,830 | |||||||||||||||||||||||
Financial assets designated at fair value | 29,037 | (28,791 | ) | 3,312 | 3,558 | |||||||||||||||||||||||
Derivatives | 345,008 | (94 | ) | 353 | 345,267 | |||||||||||||||||||||||
Loans and advances to banks | 112,149 | (2,727 | ) | 7,992 | 117,414 | |||||||||||||||||||||||
Loans and advances to customers | 974,660 | (10,809 | ) | 116,484 | 1,080,335 | |||||||||||||||||||||||
of which: | ||||||||||||||||||||||||||||
– impairment allowances on IRB portfolios | i | (6,942 | ) | – | – | (6,942 | ) | |||||||||||||||||||||
– impairment allowances on standardised portfolios | (5,395 | ) | – | (2,744 | ) | (8,139 | ) | |||||||||||||||||||||
Reverse repurchase agreements – non-trading | 161,713 | (30 | ) | 7,510 | 169,193 | |||||||||||||||||||||||
Financial investments | 415,467 | (50,420 | ) | 33,123 | 398,170 | |||||||||||||||||||||||
Capital invested in insurance and other entities | – | 2,542 | – | 2,542 | ||||||||||||||||||||||||
Current tax assets | 1,309 | (16 | ) | – | 1,293 | |||||||||||||||||||||||
Prepayments, accrued income and other assets | 75,176 | (5,295 | ) | 8,501 | 78,382 | |||||||||||||||||||||||
of which: | ||||||||||||||||||||||||||||
– goodwill and intangible assets of disposal groups held for sale | h | 8 | – | – | 8 | |||||||||||||||||||||||
– retirement benefit assets | g | 5,028 | – | – | 5,028 | |||||||||||||||||||||||
– impairment allowances on assets held for sale | (16 | ) | – | – | (16 | ) | ||||||||||||||||||||||
of which: | ||||||||||||||||||||||||||||
– IRB portfolios | i | (16 | ) | – | – | (16 | ) | |||||||||||||||||||||
– standardised portfolios | – | – | – | – | ||||||||||||||||||||||||
Interests in associates and joint ventures | 18,181 | – | (17,479 | ) | 702 | |||||||||||||||||||||||
of which: | ||||||||||||||||||||||||||||
– positive goodwill on acquisition | h | 621 | – | (606 | ) | 15 | ||||||||||||||||||||||
Goodwill and intangible assets | h | 27,577 | (5,593 | ) | 571 | 22,555 | ||||||||||||||||||||||
Deferred tax assets | n | 7,111 | 163 | 474 | 7,748 | |||||||||||||||||||||||
Total assets at 31 December 2014 | 2,634,139 | (101,790 | ) | 194,009 | 2,726,358 | |||||||||||||||||||||||
HSBC HOLDINGS PLC
237 |
Table of Contents
Report of the Directors: Capital(continued)
Regulatory balance sheet / Leverage ratio / Regulatory developments
Reconciliation of balance sheets – financial accounting to regulatory scope of consolidation (continued)
| Ref | Accounting balance sheet $m | Deconsolidation of insurance/ other entities | Consolidation of banking associates | Regulatory balance sheet $m | ||||||||||||||||||||||
Liabilities and equity | ||||||||||||||||||||||||||
Hong Kong currency notes in circulation | 27,674 | – | – | 27,674 | ||||||||||||||||||||||
Deposits by banks | 77,426 | (21 | ) | 40,530 | 117,935 | |||||||||||||||||||||
Customer accounts | 1,350,642 | (535 | ) | 141,858 | 1,491,965 | |||||||||||||||||||||
Repurchase agreements – non-trading | 107,432 | – | – | 107,432 | ||||||||||||||||||||||
Items in course of transmission to other banks | 5,990 | (3 | ) | – | 5,987 | |||||||||||||||||||||
Trading liabilities | 190,572 | (42 | ) | 50 | 190,580 | |||||||||||||||||||||
Financial liabilities designated at fair value | 76,153 | (6,317 | ) | – | 69,836 | |||||||||||||||||||||
of which: | ||||||||||||||||||||||||||
– term subordinated debt included in tier 2 capital | m | 21,822 | – | – | 21,822 | |||||||||||||||||||||
– hybrid capital securities included in tier 1 capital | j | 1,495 | – | – | 1,495 | |||||||||||||||||||||
Derivatives | 340,669 | 37 | 331 | 341,037 | ||||||||||||||||||||||
Debt securities in issue | 95,947 | (7,797 | ) | 3,720 | 91,870 | |||||||||||||||||||||
Current tax liabilities | 1,213 | (138 | ) | 317 | 1,392 | |||||||||||||||||||||
Liabilities under insurance contracts | 73,861 | (73,861 | ) | – | – | |||||||||||||||||||||
Accruals, deferred income and other liabilities | 53,396 | (3,659 | ) | 5,145 | 54,882 | |||||||||||||||||||||
of which: | ||||||||||||||||||||||||||
– retirement benefit liabilities | 3,208 | (2 | ) | 56 | 3,262 | |||||||||||||||||||||
Provisions | 4,998 | (63 | ) | – | 4,935 | |||||||||||||||||||||
of which: | ||||||||||||||||||||||||||
– contingent liabilities and contractual commitments | 234 | – | – | 234 | ||||||||||||||||||||||
of which: | ||||||||||||||||||||||||||
– credit-related provisions on IRB portfolios | i | 132 | – | – | 132 | |||||||||||||||||||||
– credit-related provisions on standardised portfolios | 102 | – | – | 102 | ||||||||||||||||||||||
Deferred tax liabilities | 1,524 | (1,009 | ) | 2 | 517 | |||||||||||||||||||||
Subordinated liabilities | 26,664 | – | 2,056 | 28,720 | ||||||||||||||||||||||
of which: | ||||||||||||||||||||||||||
– hybrid capital securities included in tier 1 capital | j | 2,761 | – | – | 2,761 | |||||||||||||||||||||
– perpetual subordinated debt included in tier 2 capital | l | 2,773 | – | – | 2,773 | |||||||||||||||||||||
– term subordinated debt included in tier 2 capital | m | 21,130 | – | – | 21,130 | |||||||||||||||||||||
Total shareholders’ equity | a | 190,447 | (7,531 | ) | – | 182,916 | ||||||||||||||||||||
of which: | ||||||||||||||||||||||||||
– other equity instruments included in tier 1 capital | c, j | 11,532 | – | – | 11,532 | |||||||||||||||||||||
– preference share premium included in tier 1 capital | b | 1,405 | – | – | 1,405 | |||||||||||||||||||||
Non-controlling interests | d | 9,531 | (851 | ) | – | 8,680 | ||||||||||||||||||||
of which: | ||||||||||||||||||||||||||
– non-cumulative preference shares issued by subsidiaries included in tier 1 capital | e | 2,127 | – | – | 2,127 | |||||||||||||||||||||
– non-controlling interests included in tier 2 capital, cumulative preferred stock | f | 300 | – | – | 300 | |||||||||||||||||||||
– non-controlling interests attributable to holders of ordinary shares in subsidiaries included in tier 2 capital | f, m | 173 | – | – | 173 | |||||||||||||||||||||
Total liabilities and equity at 31 December 2014 | 2,634,139 | (101,790 | ) | 194,009 | 2,726,358 | |||||||||||||||||||||
The references (a) – (n) identify balance sheet components which are used in the calculation of regulatory capital on page 234.
HSBC HOLDINGS PLC
238 |
Table of Contents
| EU Delegated Act basis at 31 December | ||||||||||||
2015 $bn | 2014 $bn | |||||||||||
Total assets per accounting balance sheet | 2,410 | 2,634 | ||||||||||
Deconsolidation of insurance/other entities | (95 | ) | (102 | ) | ||||||||
Consolidation of banking associates | 213 | 194 | ||||||||||
Total assets per regulatory/accounting balance sheet | 2,528 | 2,726 | ||||||||||
Adjustments to reverse netting of loans and deposits allowable under IFRS | 32 | 38 | ||||||||||
Reversal of accounting values including assets classified as held for sale: | (456 | ) | (525 | ) | ||||||||
– derivatives | (290 | ) | (345 | ) | ||||||||
– repurchase agreement and securities finance | (166 | ) | (180 | ) | ||||||||
Replaced with the regulatory rules: | ||||||||||||
Derivatives including assets classified as held for sale: | 149 | 166 | ||||||||||
– mark-to-market | 69 | 81 | ||||||||||
– deductions of receivables assets for cash variation margin | (65 | ) | (82 | ) | ||||||||
– add-on amounts for potential future exposure | 125 | 148 | ||||||||||
– exposure amount resulting from the additional treatment for written credit derivatives | 20 | 19 | ||||||||||
Repurchase agreement and securities finance including assets classified as held for sale: | 173 | 188 | ||||||||||
– gross securities financing transactions assets | 243 | 269 | ||||||||||
– netted amounts of cash payables and cash receivables of gross securities financing transactions assets | (78 | ) | (89 | ) | ||||||||
– measurement of counterparty risk | 8 | 8 | ||||||||||
Addition of off-balance sheet commitments and guarantees | 401 | 396 | ||||||||||
– guarantees and contingent liabilities | 67 | 67 | ||||||||||
– commitments | 326 | 321 | ||||||||||
– others | 8 | 8 | ||||||||||
Exclusion of items already deducted from the capital measure | (33 | ) | (36 | ) | ||||||||
Exposure measure after regulatory adjustments | 2,794 | 2,953 | ||||||||||
Tier 1 capital under CRD IV (end point) | 140 | 142 | ||||||||||
Leverage ratio | 5.0% | 4.8% | ||||||||||
The numerator of the leverage ratio is calculated using the final CRD IV end point tier 1 capital definition while the exposure measure is now calculated based on the Commission Delegated Regulation (EU) 2015/62, published in January 2015.
Regulatory capital requirements
The regulatory capital requirements comprise a Pillar 1 minimum, individual capital guidance (‘ICG’) set by the PRA in the form of Pillar 2A, a number of capital buffers established by CRD IV and any PRA buffer that the PRA may set in addition to ICG.
The Pillar 1 minimum ratio and the capital conservation buffer (‘CCB’) rates are certain. The macro-prudential tools, Pillar 2A, the PRA buffer and the systemic buffers are time-varying elements. This uncertainty is reflected in the regulatory and management buffer we have included in the 12% to 13% CET1 range that is used to model our medium-term target for return on equity of more than 10% by 2017. This buffer is currently in the range of 1% to 2%.
In December 2015, the FPC published its end point view of the calibration of the capital framework as applicable to UK
banks. This set out the FPC’s final expectations in relation to the levels of capital across the industry, while specific requirements for individual banks will vary at the PRA’s determination. These expectations do not include time-varying additional requirements such as the countercyclical capital buffer (‘CCyB’) and are based on the assumption that existing deficiencies in the definition and measurement of RWAs under Pillar 1 requirements will be addressed over time. These deficiencies in Pillar 1 are currently compensated through additional Pillar 2 requirements. The FPC stated its expectation that by 2019, once such deficiencies were corrected, Pillar 2A requirements would reduce.
In addition to the above, consideration of the finalised Financial Stability Board (‘FSB’) proposals in relation to total loss absorbing capacity (‘TLAC’) requirements, and the UK implementation of the EU minimum requirement for own funds and eligible liabilities (‘MREL’) will also be required.
Based on the known and quantifiable requirements to date, including the announced CCyB rates and current ICG, the overall capital requirements applicable to the Group on an end-point basis (at 1 January 2019) are presented in the table below.
HSBC HOLDINGS PLC
239 |
Table of Contents
Report of the Directors: Capital(continued)
Regulatory developments
Capital requirements framework (end point)
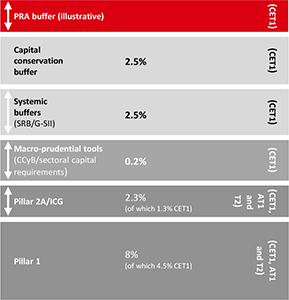
CRD IV capital buffers
CRD IV established a number of capital buffers, to be met with CET1 capital, broadly aligned with the Basel III framework. In the UK, with the exception of the CCyB which applied with immediate effect, CRD IV capital buffers are being phased in from 1 January 2016.
Automatic restrictions on capital distributions apply if a bank’s CET1 capital falls below the level of its CRD IV combined buffer. The CRD IV combined buffer is defined as the total of the CCB, the CCyB, the global systemically important institutions (‘G-SII’s) buffer and the systemic risk buffer (‘SRB’), as these become applicable.
At 31 December 2015, the applicable CCyB rates in force were 1% set by Norway and Sweden. Relevant credit exposures located in Norway and Sweden were $2.4bn and $1.5bn respectively. At 31 December 2015, this resulted in an immaterial Group institution-specific CCyB requirement.
The Hong Kong Monetary Authority (‘HKMA’) CCyB rate of 0.625% was implemented on 27 January 2016 in respect of Hong Kong exposures, following communication from the FPC. The impact of the HKMA CCyB rate on our Group institution-specific CCyB rate is expected to be 7bps (based on RWAs at 31 December 2015).
The CCyB rates introduced by Norway and Sweden will increase to 1.5% from June 2016. In January 2016, the HKMA also announced that the CCyB rate applied to exposures in Hong Kong will be increased to 1.25% from 1 January 2017.
In December 2015, the FPC maintained a 0% CCyB rate for UK exposures. At the same time, the FPC published the final calibration of the capital framework for UK banks. Within this, the FPC indicated that going forward it would apply a more active use of the CCyB and stated that it intends to publish a revised policy statement on the use of the CCyB in March 2016. The FPC also noted that it expects to set a countercyclical buffer rate for UK exposures, in the region of 1% when risks are judged to be neither subdued
nor elevated. The CCyB rate will be informed by the annual UK concurrent stress test of major UK banks. If a rate change is introduced it is expected to come into effect 12 months later.
In December 2015, the PRA confirmed our applicable G-SII buffer as 2.5%. The G-SII buffer together with the CCB of 2.5%, came into effect on 1 January 2016. These are being phased in until 2019 in increments of 25% of the end point buffer requirement. Therefore, as of 1 January 2016, the requirement for each buffer is 0.625% of RWAs.
Alongside CRD IV requirements, since 2014, the PRA has expected major UK banks and building societies to meet a 7% CET1 ratio using the CRD IV end point definition. At 1 January 2016, with the introduction of the G-SII buffer and the CCB, our minimum CET1 capital requirements and combined buffer requirement taken together amount to 7.1% (based on RWAs at 31 December 2015), effectively superseding the previous PRA guidance on the CET1 ratio.
In January 2016, the FPC published a consultation on its proposed framework for the SRB. It is proposed that it will apply to ring-fenced banks and large building societies and will be implemented from 1 January 2019. The buffer to be applied to HSBC’s ring-fenced bank has yet to be determined.
Further details of the aforementioned CRD IV buffers are set out in the Appendix to Capital on page 246.
Pillar 2 and the ‘PRA buffer’
The Pillar 2 framework requires banks to hold capital in respect of risks not captured in the Pillar 1 framework and to assess risks which banks may become exposed to over a forward-looking planning horizon. The PRA’s assessment results in the determination of ICG/Pillar 2A and Pillar 2B, respectively.
Pillar 2A was previously required to be met by total capital but, since 1 January 2015, must be met with at least 56% CET1. Furthermore, the PRA expects firms not to meet the CRD IV buffers with any CET1 required to meet its ICG.
The Pillar 2A requirement is a point in time assessment of the amount of capital the PRA considers that a bank should hold to meet the overall financial adequacy rule. It is therefore subject to change as part of the PRA’s supervisory review process. In November 2015, our Pillar 2A requirement was set at 2.3% of RWAs, of which 1.3% is met by CET1.
In July 2015, the PRA published a final policy statement PS17/15, setting out amendments to the PRA Rulebook and Supervisory Statements in relation to the Pillar 2 framework. The revised framework became effective on 1 January 2016. The PRA’s Statement of Policy sets out the methodologies that it will use to inform its setting of firms’ Pillar 2 capital requirements, including new approaches for determining Pillar 2 requirements for credit risk, operational risk, credit concentration risk and pension obligation risk.
In parallel, in July 2015, the PRA also issued its supervisory statement SS31/15 in which it introduced a PRA buffer to replace the capital planning buffer determined under
HSBC HOLDINGS PLC
240 |
Table of Contents
Pillar 2B, from 1 January 2016. This is to be met in the form of CET1 capital.
The statement sets out that the PRA buffer is intended to avoid duplication with CRD IV buffers and will be set for a particular firm depending on its vulnerability in a stress scenario. In order to address significant weaknesses in risk management and governance, a scalar may be applied to firms’ CET1 Pillar 1 and Pillar 2A capital requirements. This will also form part of the PRA Buffer.
Where the PRA considers there is overlap between the CRD IV buffers and the PRA buffer assessment, the PRA buffer will be set as the excess capital required over and above the CRD IV combined buffer. From 1 January 2016, the CCB and the systemic buffers are permitted to offset against the PRA buffer with the exception of any risk management and governance scalar where applicable. The use of the PRA buffer will not result in automatic restrictions to distributions.
The Group is subject to supervisory stress testing in many jurisdictions. These requirements are increasing in frequency and granularity. As such, stress testing represents a key focus for the Group.
The Bank of England published the results of the 2015 UK stress test in December 2015 confirming that these tests did not reveal any capital inadequacies for HSBC. At the European level, the EBA did not undertake a stress testing exercise in 2015 but instead carried out a transparency exercise, the results of which were published in November 2015.
In July 2015, the EBA also disclosed a timeline for the 2016 EU wide stress test exercise. The EBA expects to publish the 2016 stress test scenario and methodology in the first quarter of 2016, with results published in the third quarter of 2016.
In October 2015, the Bank of England published its approach to stress testing in the UK. This set out that the outcome of the UK stress testing exercise will be considered by the FPC when determining the UK CCyB rate, and will also inform the PRA buffer. Furthermore, from 2016, the applicable hurdle rate which is the amount of capital that banks are expected to maintain under a stress, is to include Pillar 1, Pillar 2A and G-SII buffer requirements.
In 2015, Group entities also participated in regional stress testing exercises. For further details on stress testing exercises, see page 116.
Throughout 2015, UK, EU and international regulators issued a series of consultations designed to revise the various components of the RWA regime and increase related reporting and disclosures. In particular, the Basel Committee on Banking Supervision (‘the Basel Committee’) published proposals relating to certain Pillar 1 risk types to update standardised, non-modelled approaches for
calculating capital requirements. Details of the most significant consultations are set out below.
In December 2015 the Basel Committee published its second consultation paper on a revised standardised approach for credit risk. This included proposals to reintroduce external credit ratings, moderated by internal due diligence, as the basis for calculating risk weights for banks and corporates. The risk weights for other assets are to be determined by a variety of treatments tailored for each exposure class, which are designed to increase risk sensitivity and comparability.
In January 2016, the Basel Committee published the final rules arising from the Fundamental Review of the Trading Book, with implementation planned for 2019. The new regime includes amendments to the trading book boundary and new market risk capital calculations for both the modelled and standardised approaches. The Basel Committee acknowledges that there is considerable ongoing work which could require further revisions to the framework.
The final changes to the CVA capital charge are expected to be published in 2016. Following the finalisation of the CVA capital regime, the EU is expected to review the exemptions to the CVA charge currently applied to corporates, sovereigns and intragroup exposures. In the interim, the EU has consulted upon a methodology for calculating a Pillar 2 charge for excessive CVA risk resulting from exempted transactions.
The revised consultations for standardised operational risk and the design and calibration of a capital floor based on the standardised approaches, are expected by the end of 2016.
All of the Basel Committee’s consultations will need to be transposed into EU law before coming into effect. This includes the finalised changes that relate to the counterparty risk and securitisation regimes.
Following consultations in 2014, secondary legislation came into force in April 2015 to provide the FPC with direction powers in relation to the UK leverage ratio framework. In July 2015, the FPC published its final policy statement setting out its intention to use its new powers of direction. As a result the PRA issued a consultation paper to introduce requirements for the UK leverage ratio framework. This established a minimum tier 1 leverage ratio of 3%, an additional leverage ratio buffer (‘ALRB’) for G-SIIs and a countercyclical leverage ratio buffer (‘CCLB’), and was implemented on 1 January 2016. The ALRB and CCLB are to be met entirely with CET1 capital and will be set at 35% of the relevant buffers in the risk-weighted capital framework. At 1 January 2016, our minimum leverage ratio requirement of 3% was supplemented with an ALRB of 0.2% and a CCLB which rounds to 0%. We comfortably exceed these leverage requirements.
HSBC HOLDINGS PLC
241 |
Table of Contents
Report of the Directors: Capital(continued)
Regulatory developments / Appendix to Capital
It is anticipated that a minimum leverage ratio requirement, including potential buffers for G-SIBs, will be consulted upon by the Basel Committee in 2016 and a formal Pillar 1 measure finalised by 1 January 2018.
Total loss absorbing capacity proposals
As part of Recovery and Resolution frameworks both in the EU and internationally, there have been various developments in relation to TLAC. In the EU, the Bank Recovery and Resolution Directive introduces an MREL.
In July 2015, the EBA published a final draft Regulatory Technical Standard (‘RTS’) for MREL which seeks to provide additional clarity on the criteria that resolution authorities should take into account when setting a firm specific MREL requirement. The EBA notes that it aims to implement the MREL in a way which is consistent with the finalised international standard on TLAC.
In November 2015, the FSB published finalised proposals on TLAC for G-SIBs to be applied in accordance with individual bank resolution strategies. This set out a requirement of 16% of RWAs and a TLAC leverage ratio of 6% to be met from 1 January 2019, increasing to 18% and 6.75% respectively, from 1 January 2022. Existing regulatory capital buffers will need to be met in addition to the minimum TLAC requirement. A breach of TLAC will be treated as severely as a breach of minimum capital requirements.
In November 2015, the Basel Committee also published a consultation on the treatment of banks’ holdings of TLAC instruments issued by a G-SIB, which proposed new deductions from regulatory capital. Once finalised, any additional requirements in relation to TLAC are expected to be reflected in MREL and to be implemented in the UK.
In December 2015, the Bank of England published a consultation paper on the UK’s implementation of MREL. The Bank of England stated that it intends to set MREL consistent with both TLAC and the final EBA RTS expected to be published later this year. The MREL is expected to comprise a loss absorption amount which reflects existing regulatory capital requirements and a recapitalisation amount which reflects the capital that a firm is likely to need post resolution. The latter can be met with both regulatory capital and eligible liabilities.
While MREL is to be set on an individual basis, the Bank of England generally expects MREL for banks whose appropriate resolution strategy is bail-in, to be equivalent to twice the current minimum capital requirements. A finalised Statement of Policy is expected by mid-2016. The Bank of England is also expected to provide firms with an indication of their prospective 2020 MREL during 2016, and will set MREL on a transitional basis until then. For G-SIBs, MREL is proposed to apply from 2019, consistent with FSB timelines.
In parallel to the above, the PRA separately published a consultation paper on the interaction between MREL and capital buffers and how it would treat a breach of MREL
requirements. This proposed that banks should not be able to meet MREL requirements with CET1 used to meet existing capital and leverage ratio buffers.
Structural reform and recovery and resolution planning
Globally there have been a number of developments relating to banking structural reform and the introduction of recovery and resolution regimes. As part of recovery and resolution planning, some regulators and national authorities have also required changes to the corporate structures of banks. These include requiring the local incorporation of banks or ring-fencing of certain businesses.
In 2013 and 2014, UK legislation was enacted requiring large banking groups to ring-fence UK retail and SME banking activity in a separately incorporated banking subsidiary (a ‘ring-fenced bank’) that is prohibited from engaging in significant trading activity. Ring-fencing is to be completed by 1 January 2019. The legislation also detailed the applicable individual customers to be transferred to the ring-fenced bank. In addition, the legislation places restrictions on the activities and geographical scope of ring-fenced banks. Throughout 2015 the PRA published a number of consultations on the implementation of ring-fencing requirements and the finalisation of rules is expected to continue in 2016.
The key proposals included near final rules published in May 2015 on legal structure, corporate governance, and continuity of services and facilities.
Additionally, in October 2015, the PRA issued a consultation on the application of capital and liquidity rules for ring-fenced banks, management of intra-group exposures, and use of financial market infrastructures. The PRA intends to undertake a further consultation in 2016 in respect of reporting and disclosure, and publish finalised rules and supervisory statements thereafter, with implementation by 1 January 2019.
We are working with our primary regulators to develop and agree a resolution strategy for HSBC. It is our view that a strategy by which the Group breaks up at a subsidiary bank level at the point of resolution (referred to as a Multiple Point of Entry) is the optimal approach, as it is aligned to our existing legal and business structure. Similarly to allG-SIBs, we are working with our regulators to mitigate or remove critical inter-dependencies between our subsidiaries to further facilitate the resolution of the Group. In particular, in order to remove operational dependencies (where one subsidiary bank provides critical services to another), we are in the process of transferring critical services from our subsidiary banks to a separate internal group of service companies (‘ServCo group’).
During 2015, more than 18,000 employees performing shared services in the UK were transferred to the ServCo group. Further transfers of employees, critical shared services and assets in the UK, Hong Kong and other jurisdictions will occur in due course.
HSBC HOLDINGS PLC
242 |
Table of Contents
Footnotes to Capital
| 1 | From 1 January 2015 the CRD IV transitional CET1 and end point CET1 capital ratios became aligned for HSBC Holdings plc due to the recognition of unrealised gains on investment property and available-for-sale securities. |
| 2 | This includes dividends on ordinary shares, quarterly dividends on preference shares and coupons on capital securities, classified as equity. |
| 3 | The basis of presentation for foreign currency translation differences has changed to reflect the total amount in CET1 capital. Previously this only included foreign currency translation differences recognised in other comprehensive income. The comparative period, where applicable, has not been updated to reflect the change. |
| 4 | In the first half of 2015, a portfolio of customers was transferred from CMB to RBWM in Latin America in order to better align the combined banking needs of the customers with our established global businesses. Comparative data have been re-presented accordingly. |
| 5 | RWAs are non-additive across geographical regions due to market risk diversification effects within the Group. |
| 6 | For the basis of preparation, see page 247. |
| 7 | CRD IV balances as at 31 December 2013 were estimated based on the Group’s interpretation of final CRD IV legislation and final rules issued by the PRA, details of which can be found in the basis of preparation on page 324 of the Annual Report and Accounts 2013. |
| 8 | Includes externally verified profits for the year to 31 December 2015. |
| 9 | Mainly comprises unrealised gains/losses in available-for-sale debt securities related to SPEs. |
| 10 | Includes own credit spread on trading liabilities. |
| 11 | Mainly comprise investments in insurance entities. |
Appendix to Capital
(Audited)
Our approach to capital management is driven by our strategic and organisational requirements, taking into account the regulatory, economic and commercial environment in which we operate. Pre-tax return on risk-weighted assets (‘RoRWA’) is an operational metric by which the global businesses are managed on a day-to-day basis. The metric is calibrated against return on equity and our capital requirements to ensure we are best placed to achieve capital strength and business profitability, combined with regulatory capital efficiency objectives. It is our objective to maintain a strong capital base to support the risks inherent in our business and invest in accordance with our strategy, exceeding both consolidated and local regulatory capital requirements at all times.
Our policy on capital management is underpinned by a capital management framework and our internal capital adequacy assessment process, which enables us to manage our capital in a consistent manner. The framework, which is approved by the Group Management Board (‘GMB’) annually, incorporates a number of different capital measures including market capitalisation, shareholders’ equity, economic capital and regulatory capital. During 2015, we continued to manage Group capital to meet a medium-term target for return on equity of more than 10%. This is modelled on a CET1 ratio on an end point basis in the range of 12% to 13%.
Capital measures
• shareholders’ equity is the equity capital invested in HSBC by our shareholders, adjusted for certain reserves and goodwill previously amortised or written-off;
• economic capital is the internally calculated capital requirement which we deem necessary to support the risks to which we are exposed; and
• regulatory capital is the capital which we are required to hold in accordance with the rules established by the PRA for the consolidated Group and by our local regulators for individual Group companies. This comprises common equity tier 1, additional tier 1 and tier 2 capital.
|
Our assessment of capital adequacy is aligned to our assessment of risks, including: credit, market, operational, interest rate risk in the banking book, pensions, insurance, structural foreign exchange risk and residual risks.
In addition to our annual group internal stress test, the Group is subject to supervisory stress testing in many jurisdictions. Supervisory requirements are increasing in frequency and in the granularity with which the results are required. These exercises include the programmes of the PRA, the FRB, the EBA, the ECB and the HKMA, as well as stress tests undertaken in other jurisdictions. We take into account the results of all such regulatory stress testing and our internal stress test when assessing our internal capital requirements. The outcome of stress testing exercises carried out by the PRA, will also feed into a PRA buffer under the Pillar 2 requirements, where required.
Outside of the stress-testing framework, a list of top and emerging risks is regularly evaluated for their effect on our CET1 capital ratio. As a result, other risks may be identified which have the potential to affect our RWAs and/or capital position. These risks are also included in the evaluation of risks to capital. The downside or upside scenarios are assessed against our capital management objectives and mitigating actions are assigned as necessary. The responsibility for global capital allocation principles and decisions rests with the GMB. Through our internal governance processes, we seek to maintain discipline over
HSBC HOLDINGS PLC
243 |
Table of Contents
Report of the Directors: Capital(continued)
Appendix to Capital
our investment and capital allocation decisions and seek to ensure that returns on investment meet the Group’s management objectives. Our strategy is to allocate capital to businesses and entities on the basis of their ability to achieve established RoRWA objectives and their regulatory and economic capital requirements.
RWA plans form part of the Annual Operating Plan that is approved by the Board. Revised forecasts are submitted to the GMB on a monthly basis and reported RWAs are monitored against plan.
Our global businesses are set targets in line with the priorities outlined in last June’s strategy update including RWA efficiency and return on RWAs. Business performance against RWA targets is monitored through regular reporting to the Holding Company ALCO as well as the GMB. Performance measures are aligned to the Group’s strategic actions. The management of regulatory capital deductions is also addressed in the RWA monitoring framework through additional notional charges for these items.
Analysis is undertaken within the RWA monitoring framework to identify the key drivers of movements. Particular attention is paid to identifying and segmenting items within the day-to-day control of the business and those items that are driven by changes in risk models or regulatory methodology. Analysis is also undertaken to recognise and report specific actions that are targeted RWA reduction initiatives.
HSBC Holdings is the primary provider of equity capital to its subsidiaries and also provides them with non-equity capital where necessary. These investments are substantially funded by HSBC Holdings’ own capital issuance and profit retention. As part of its capital management process, HSBC Holdings seeks to maintain a prudent balance between the composition of its capital and its investment in subsidiaries.
Capital measurement and allocation
The PRA supervises HSBC on a consolidated basis and therefore receives information on the capital adequacy of, and sets capital requirements for, the Group as a whole. Individual banking subsidiaries are directly regulated by their local banking supervisors, who set and monitor their capital adequacy requirements. Our capital at Group level is calculated under CRD IV and supplemented by the PRA’s rules to effect the transposition of directive requirements.
Our policy and practice in capital measurement and allocation at Group level is underpinned by the CRD IV rules. In most jurisdictions, non-banking financial subsidiaries are also subject to the supervision and capital requirements of local regulatory authorities.
The Basel III framework, similarly to Basel II, is structured around three ‘pillars’: minimum capital requirements, supervisory review process and market discipline. The CRD IV legislation implemented Basel III in the EU and, in the UK, the ‘PRA Rulebook’ for CRR Firms transposed the various national discretions under the CRD IV legislation into UK requirements. CRDIV also introduces a number of capital buffers, including the CCB, CCyB, and other systemic buffers such as the G-SII buffer.
For regulatory purposes, our capital base is divided into three main categories, namely CET1, additional tier 1 and tier 2, depending on their characteristics.
| • | CET1 capital is the highest quality form of capital, comprising shareholders’ equity and related non-controlling interests (subject to limits). Under CRD IV various capital deductions and regulatory adjustments are made to these items which are treated differently for the purposes of capital adequacy – these include deductions for goodwill and intangible assets, deferred tax assets that rely on future profitability, negative amounts resulting from the calculation of expected loss amounts under IRB, holdings of capital securities of financial sector entities and surplus defined benefit pension fund assets. |
| • | Additional tier 1 capital comprises eligible non-common equity capital securities and any related share premium; it also includes qualifying securities issued by subsidiaries subject to certain limits. Holdings of additional tier 1 securities of financial sector entities are deducted. |
| • | Tier 2 capital comprises eligible capital securities and any related share premium and qualifying tier 2 capital securities issued by subsidiaries subject to limits. Holdings of tier 2 capital securities of financial sector entities are deducted. |
Pillar 1 is comprised of the capital resources requirements for credit risk, market risk and operational risk. Credit risk includes counterparty credit risk and securitisation requirements. These requirements are expressed in terms of RWAs.
Credit risk capital requirements
CRD IV applies three approaches of increasing sophistication to the calculation of Pillar 1 credit risk capital requirements. The most basic, the standardised approach, requires banks to use external credit ratings to determine the risk weightings applied
HSBC HOLDINGS PLC
244 |
Table of Contents
to rated counterparties. Other counterparties are grouped into broad categories and standardised risk weightings are applied to these categories. The next level, the internal ratings-based (‘IRB’) foundation approach, allows banks to calculate their credit risk capital requirements on the basis of their internal assessment of a counterparty’s probability of default (‘PD’), but the estimates of exposure at default (‘EAD’) and loss given default (‘LGD’) are subject to standard supervisory parameters. Finally, the IRB advanced approach allows banks to use their own internal assessment in both determining PD and quantifying EAD and LGD.
The capital resources requirement, which is intended to cover unexpected losses, is derived from a formula specified in the regulatory rules which incorporates PD, LGD, EAD and other variables such as maturity and correlation. Expected losses are calculated by multiplying PD by EAD and LGD. Expected losses are deducted from capital to the extent that they exceed total accounting impairment allowances. For credit risk we have adopted the IRB advanced approach for the majority of our portfolios, with the remainder on either IRB foundation or standardised approaches.
At the end of 2015, a number of portfolios in Europe, Asia and North America were on the advanced IRB approach as well as our sovereigns, banks and large corporate exposures globally. Others remain on the standardised or foundation approach pending definition of local regulations or model approval, or under exemptions from IRB treatment. In some instances, regulators have allowed us to transition from advanced to standardised approaches for a limited number of portfolios.
| • | Counterparty credit risk |
Counterparty credit risk (‘CCR’) arises for derivatives and securities financing transactions. It is calculated for both the trading and non-trading books and is the risk that the counterparty to a transaction may default before completing the satisfactory settlement of the transaction. Three approaches to calculating CCR and determining exposure values are defined by CRD IV: mark-to-market, standardised and internal model method. These exposure values are used to determine capital requirements under one of the credit risk approaches: standardised, IRB foundation and IRB advanced.
We use the mark-to-market and internal model method approaches for CCR.
In addition, CRD IV introduced a regulatory capital charge to cover CVA risk, the risk of adverse movements in the credit valuation adjustments taken for expected credit losses on derivative transactions. Where we have both specific risk VaR approval and internal model method approval for a product, the CVA VaR approach has been used to calculate the CVA capital charge. Where we do not hold both approvals, the standardised approach has been applied. Certain counterparty exposures are exempt from CVA, such as non-financial counterparties and sovereigns.
| • | Securitisation |
Securitisation positions are held in both the trading and non-trading books. For non-trading book securitisation positions, CRD IV specifies two methods for calculating credit risk requirements, the standardised and the IRB approaches. Both rely on the mapping of rating agency credit ratings to risk weights, which range from 7% to 1,250%.
Within the IRB approach, we use the ratings-based method for the majority of our non-trading book securitisation positions, and the internal assessment approach for exposures arising from asset-backed commercial paper programmes, mainly related to liquidity facilities and programme wide credit enhancement.
The majority of securitisation positions in the trading book are risk weighted for capital purposes as though they are held in the non-trading book under the standardised or IRB approaches.
Market risk capital requirement
The market risk capital requirement is measured using internal market risk models where approved by the PRA, or the standard rules of CRD IV. Our internal market risk models are VaR, stressed VaR and Incremental Risk. Since the sale of our correlation portfolio in September 2014, there has been no market risk capital requirement associated with the comprehensive risk measure.
Operational risk capital requirement
CRD IV includes a capital requirement for operational risk, again utilising three levels of sophistication. The capital required under the basic indicator approach is a simple percentage of gross revenues, whereas under the standardised approach the calculation is applied to the same measure with varying percentages by business line. Both these approaches use an average of the last three financial years’ revenues. Finally, the advanced measurement approach uses banks’ own statistical analysis and modelling of operational risk data to determine capital requirements. We have adopted the standardised approach in determining our operational risk capital requirements.
We conduct an annual internal capital adequacy assessment process (‘ICAAP’) to determine a forward looking assessment of our capital requirements given our business strategy, risk profile, risk appetite and capital plan. This process incorporates the Group’s risk management processes and governance framework. As a part of our ICAAP, we carry out internal stress testing of our base capital plan where both the PRA released stress scenario and concurrent scenario in the context of our business and
HSBC HOLDINGS PLC
245 |
Table of Contents
Report of the Directors: Capital(continued)
Appendix to Capital
specific risk drivers are taken into account. These, coupled with our economic capital framework and other risk management practices, are used to assess our internal capital adequacy requirements.
The ICAAP is examined by the PRA as part of its supervisory review and evaluation process (‘SREP’), which occurs periodically to enable the regulator to define the individual capital guidance or minimum capital requirements for HSBC and our capital planning buffer where required. Under the revised Pillar 2 PRA regime, which came into effect from 1 January 2016, the capital planning buffer was replaced with a PRA buffer. The PRA states this is not intended to duplicate the CRD IV buffers, and will be set according to vulnerability in a stress scenario, as assessed through the annual PRA stress testing exercise.
CRD IV capital buffers
CRD IV introduced a number of capital buffers which apply in addition to Pillar 1 and Pillar 2 requirements and are broadly aligned with the Basel III framework. This includes the CCB, CCyB, and G-SII which are all currently applicable to the Group. These are to be met with CET1 and, with the exception of the CCyB which applies with immediate effect, are being phased in from 1 January 2016. The CRD IV includes other capital buffers such as the systemic risk buffer which has not yet been fully implemented by the PRA.
| • | CCB |
The CCB is designed to ensure banks build up capital outside periods of stress that can be drawn down when losses are incurred. It is set at 2.5% of RWAs across all banks, and is being phased in from 1 January 2016. At 1 January 2016, our CCB was 0.625%.
| • | G-SII |
The Group is designated as a G-SII by the PRA, and is currently subject to a G-SII buffer of 2.5% of RWAs. This is being phased in from 1 January 2016. The G-SII buffer is intended to address systemic risk, which is assessed on an annual basis according to a number of indicators such as: the size of a bank, its interconnectedness, the lack of readily available substitutes or financial institution infrastructure for the services it provides, its global cross-jurisdictional activity, and the complexity of its business model. At 1 January 2016, our G-SII buffer was 0.625%.
| • | CCyB |
The CCyB is a countercyclical buffer which is set on an institution specific basis and calculated according to the geographic location of relevant exposures. It is designed to protect against future losses where unsustainable levels of leverage, debt or credit growth pose a systemic threat. Our institution-specific CCyB for the Group is calculated as the weighted average of the CCyB rates that apply in the jurisdictions where our relevant credit exposures are located. At 31 December 2015 our institution specific CCyB applicable on a group basis, was close to 0%.
| • | Combined buffer |
As a result of the above requirements, at 1 January 2016, the combined buffer applicable to HSBC Group was estimated as 1.25%.
Leverage ratio requirements
In addition to risk-based capital requirements, the Group is subject to a non-risk sensitive, minimum leverage ratio requirement of 3%, as set by the PRA. This is calculated in accordance with the Commission Delegated Regulation (EU) 2015/62, published in January 2015, which implemented the revised Basel III 2014 exposure measure. Since 1 January 2016, the minimum leverage ratio of 3% has been supplemented with an ALRB for G-SIIs and a CCLB, both of which are set at 35% of the relevant buffers in the risk-weighted capital framework. As a result, at 1 January 2016, our minimum leverage ratio requirement of 3% was supplemented with an ALRB of 0.2% and a CCLB which rounds to 0%.
Pillar 3 disclosure requirements
Pillar 3 of the Basel regulatory framework is related to market discipline and aims to make firms more transparent by requiring publication, at least annually, of wide-ranging information on their risks, capital and management. OurPillar 3 Disclosures 2015 are published on our website, www.hsbc.com, under Investor Relations.
HSBC HOLDINGS PLC
246 |
Table of Contents
RWA movement by key driver – basis of preparation and supporting notes
Credit risk drivers – definitions and quantification
The causal analysis of RWA movements splits the total movement in IRB RWAs into six drivers, described below. The first four relate to specific, identifiable and measurable changes. The remaining two, book size and book quality, are derived after accounting for movements in the first four specific drivers.
1. Foreign exchange movements
This is the movement in RWAs as a result of changes in the exchange rate between the functional currency of the HSBC company owning each portfolio and US dollars, being our presentation currency for consolidated reporting. Our structural foreign exchange exposures are managed with the primary objective of ensuring, where practical, that our consolidated capital ratios and the capital ratios of individual banking subsidiaries are largely protected from the effect of changes in exchange rates. This is usually achieved by ensuring that, for each subsidiary bank, the ratio of structural exposures in a given currency to risk-weighted assets denominated in that currency is broadly equal to the capital ratio of the subsidiary in question. We hedge structural foreign exchange exposures only in limited circumstances.
2. Acquisitions and disposals
This is the movement in RWAs as a result of the disposal or acquisition of business operations. This can be whole businesses or parts of a business. The movement in RWAs is quantified based on the credit risk exposures as at the end of the month preceding a disposal or following an acquisition.
3. Model updates
RWA movements arising from the implementation of new models and from changes to existing parameter models are allocated to this driver. This figure will also include changes which arise following review of modelling assumptions. Where a model recalibration reflects an update to more recent performance data, the resulting RWA changes are not assigned here, but instead reported under book quality.
RWA changes are estimated based on the impact assessments made in the testing phase prior to implementation. These values are used to simulate the effect of new or updated models on the portfolio at the point of implementation, assuming there were no major changes in the portfolio from the testing phase to implementation phase.
RWA movement arising from portfolios moving from the standardised approach to the IRB approach are also allocated to this driver. The RWA movement by key driver statement shows the increase in IRB RWAs, but does not show the corresponding reduction in standardised approach RWAs as its scope is limited to IRB only.
The movement in RWAs is quantified at the date at which the IRB approach is applied, and not during the testing phase as with a new/updated model.
4. Methodology and policy
Internal updates
This captures the effect on RWAs of changing the internal treatment of exposures. This may include, but is not limited to, a portfolio or a part of one moving from an existing IRB model onto a standardised model, identification of netting and credit risk mitigation.
External updates – regulatory
This specifies the effect of additional or changing regulatory requirements. This includes, but is not limited to, regulatory-prescribed changes to the RWA calculation. The movement in RWAs is quantified by comparing the RWAs calculated for that portfolio under the old and the new requirements.
5. Book size
RWA movements attributed to this driver are those we would expect to experience for the given movement in exposure, as measured by EAD, assuming a stable risk profile. These RWA movements arise in the normal course of business, such as growth in credit exposures or reduction in book size from run-offs and write-offs.
The RWA movement is quantified as follows:
| • | RWA and EAD changes captured in the four drivers above are excluded from the total movements to create an adjusted movement in EAD and RWA for the period. |
| • | The average RWA to EAD percentage is calculated for the opening position and is applied to the adjusted movement in EAD. This results in an estimated book size RWA movement based on the assumption that the EAD to RWA percentage is constant throughout the period. |
As the calculation relies on averaging, the output is dependent upon the degree of portfolio aggregation and the number of discrete time periods for which the calculation is undertaken. For each quarter of 2015 this calculation was performed for each
HSBC HOLDINGS PLC
247 |
Table of Contents
Report of the Directors: Capital / Corporate Governance
Appendix to Capital / Corporate Governance Report / Biographies
HSBC company with an IRB portfolio by global businesses, split by the main Basel categories of credit exposures, as described in the table below:
CRD IV categories of IRB credit exposures within HSBC
| ||||
| Central governments and central banks | Corporates – Other | Retail – Qualifying revolving | ||
| Institutions | Retail – Secured by real estate SME | Retail – Other SME | ||
| Corporates – SME | Retail – Secured by retail estate non-SME | Retail – Other non-SME | ||
| Corporates – Specialised Lending | ||||
The total of the results is shown in book size within the RWA movement by key driver table.
6. Book quality
This represents RWA movements resulting from changes in the underlying credit quality of customers. These are caused by changes to IRB risk parameters which arise from actions such as, but not limited to, model recalibration, change in counterparty external rating, or the influence of new lending on the average quality of the book. The change in RWAs attributable to book quality is calculated as the balance of RWA movements after taking account of all drivers described above.
The RWA movement by key driver statement includes only movements which are calculated under the IRB approach. Certain classes of credit risk exposure are treated as capital deductions and therefore reductions are not shown in this statement. If the treatment of a credit risk exposure changes from RWA to capital deduction in the period, then only the reduction in RWAs would appear in the RWA movement by key driver tables. In this instance, a reduction in RWAs does not necessarily indicate an improvement in the capital position.
Counterparty risk drivers – definitions and quantification
The RWA movement by key driver for counterparty credit risk calculates the credit risk drivers 5 and 6 at a more granular level, by using transaction level details provided by regional sites. ‘Foreign exchange movement’ is not a reported layer for counterparty risk drivers, as there is cross currency netting across the portfolio.
Market risk drivers – definitions and quantification
The RWA movement by key driver for market risk combines the credit risk drivers 5 and 6 into a single driver called ‘Movements in risk levels’.
HSBC HOLDINGS PLC
248 |
Table of Contents
Corporate Governance
|
| Page
|
|
| App
| 1
| ||
| 249 | ||||||||
| 249 | ||||||||
| 254 | ||||||||
| 254 | ||||||||
| 256 | ||||||||
| 256 | ||||||||
| 262 | ||||||||
| 262 | ||||||||
| 266 | ||||||||
| 268 | ||||||||
| 270 | ||||||||
| 270 | ||||||||
| 272 | ||||||||
| 274 | ||||||||
| 274 | ||||||||
| 275 | ||||||||
| 277 | ||||||||
| 278 | ||||||||
| 278 | ||||||||
| 278 | ||||||||
| 278 | ||||||||
| 278 | ||||||||
| 278 | ||||||||
| 279 | ||||||||
| 279 | ||||||||
| 280 | ||||||||
| 281 | ||||||||
| 282 | ||||||||
| 283 | ||||||||
| 280 | ||||||||
1Appendix to Report of the Directors. | ||||||||
The statement of corporate governance practices set out on pages 249 to 335 and information incorporated by reference constitutes the Corporate Governance Report of HSBC Holdings. The reports of Board Committees are contained within the Corporate Governance Report.

Skills and experience: Douglas has extensive board-level experience and knowledge of governance primarily gained through membership of the boards of HSBC and BP plc and his time as a partner of KPMG. He has considerable knowledge of finance and risk management in banking, multinational financial reporting, treasury and securities trading operations and has chaired and been a member of highly influential bodies which set standards for taxation, governance, accounting and risk management. He joined HSBC as Group Finance Director in 1995, which broadened to that of Chief Financial Officer, Executive Director Risk and Regulation.
He is a member of the Institute of Chartered Accountants of Scotland and the Association of Corporate Treasurers and also a Fellow of the Chartered Institute of Management Accountants. In 2006, he was honoured with a CBE in recognition of his services to the finance industry. Former appointments include non-executive director and chairman of the Audit Committee of BP plc and an independent external member of the UK Government’s Financial Services Trade and Investment Board.
Current appointments include: Douglas is Chairman of the Institute of International Finance and serves on the International Business Leaders Advisory Councils of the mayors of both Beijing and Shanghai. At the invitation of the Prime Minister he serves as a UK Business Ambassador.

Skills and experience: Stuart joined HSBC in 1980. He is a career banker with over 35 years’ international experience. He has held a number of key roles in the Group’s operations worldwide, including in London, Hong Kong, Tokyo, Kuala Lumpur and the United Arab Emirates. Stuart played a leading role in developing and expanding Global Banking and Markets. Other former appointments include serving as Chairman of Europe, Middle East and Global Businesses and of HSBC Bank plc, HSBC Bank Middle East Limited, HSBC Private Banking Holdings (Suisse) SA and HSBC France and Deputy Chairman of HSBC Trinkaus & Burkhardt AG and a member of its supervisory board. He was Head of Global Banking and Markets;Co-Head of Global Banking and Markets; Head of Global Markets; and Head of Treasury and Capital Markets in Asia-Pacific.
HSBC HOLDINGS PLC
249 |
Table of Contents
Report of the Directors: Corporate Governance(continued)
Biographies
Current appointments include: Stuart is Chairman of The Hongkong and Shanghai Banking Corporation Limited and of the Group Management Board.

Member of the Group Audit Committee.
Skills and experience: As a Certified Public Accountant with extensive financial and accounting experience, Phil served as Vice President, Comptroller, and Principal Accounting Officer of General Electric Company (‘GE’). Prior to joining GE, he was a partner in KPMG. He also has a depth of technical knowledge from his participation in accounting standards setting. Other former appointments include serving on the International Financial Reporting Interpretations Committee of the International Accounting Standards Board, the Accounting Standards Executive Committee of the American Institute of Certified Public Accountants and the Financial Accounting Standards Board Emerging Issues Task Force, and he was Chair of the Committee on Corporate Reporting of Financial Executives International and a Trustee of the Financial Accounting Foundation.
Current appointments include: Phillip is a non-executive director of HSBC North America Holdings Inc., HSBC Bank USA N.A., HSBC Finance Corporation and HSBC USA Inc. He is also Chairman of Skyonic Corporation.

Member of the Group Audit Committee and the Financial System Vulnerabilities Committee.
Skills and experience: Kathleen has extensive financial regulatory policy experience. She is a former Commissioner of the US Securities and Exchange Commission, acting as the regulator’s principal representative in multilateral and bilateral regulatory dialogues, the G-20 Financial Stability Board and the International Organisation of Securities Commissions. Other former appointments include serving as a Staff Director and Counsel of the United States Senate Committee on Banking, Housing, and Urban Affairs and Legislative Director and Chief of Staff for a US Senator.
Current appointments include: Kathleen is chair of the Alternative Investment Management Association and a senior adviser to Patomak Global Partners and to a number of public bodies in the US.

Chairman of the Philanthropic & Community Investment Oversight Committee, member of the Conduct & Values Committee and the Nomination Committee.
Skills and experience: Laura has extensive regulatory and policy making experience in the finance and securities sector in Hong Kong and mainland China. She is the former Vice Chairman of the China Securities Regulatory Commission. Other former appointments include serving as a non-executive director of Bank of Communications Co., Ltd., Hong Kong Exchanges and Clearing Limited and Tata Consultancy Services Limited. She also served as chair of the University Grants Committee in Hong Kong and was deputy chair of the Securities and Futures Commission in Hong Kong.
Current appointments include: Laura is non-executive Deputy Chairman of The Hongkong and Shanghai Banking Corporation Limited. She is Chairman of the Financial Services Development Council, Hong Kong and a non-executive director of China Telecom Corporation Limited, Unilever PLC and Unilever N.V.

Skills and experience:Henri has more than 25 years of international experience in the finance industry. He joined AXA in 1989 where his roles included responsibility for the group’s asset management, financial and real-estate businesses, the oversight of North American and UK operations, as well as the preparation and the execution of all the major mergers and acquisitions undertaken by the insurance group during the 1990s.
Current appointments include: Henri is Chairman and Chief Executive Officer of AXA. He is also Chairman of the French leading think-tank Institut Montaigne and of AXA Hearts in Action, AXA’s volunteer community outreach programme. He also serves as a non-executive director of Nestlé S.A. and of the French National Foundation for Political Science (FNSP). He is a member of the Advisory Board of Tsinghua University School of Economics and Management.
HSBC HOLDINGS PLC
250 |
Table of Contents

Chairman of the Financial System Vulnerabilities Committee and a member of the Conduct & Values Committee and the Philanthropic & Community Investment Oversight Committee.
Skills and experience:Jonathan has extensive experience in national security policy and operations. He was formerly Director General of MI5 with responsibility for the leadership, policy and strategy of the Security Service, including international and domestic counter-terrorism, counter-espionage and counter-proliferation activities and cyber security. Jonathan has held various positions in the UK Security Service over a 30-year career with responsibility for the oversight of the Joint Terrorist Analysis Centre and the Centre for the Protection of National Infrastructure and attended the National Security Council.
Current appointments include: Jonathan is a director of Ark Data Centres and serves in an advisory capacity to various cybersecurity and technology companies.

Chairman of the Group Risk Committee.
Skills and experience:Joachim has experience in banking and asset management with significant international experience, having worked in Germany, Tokyo, New York and London. He is a former Chief Executive Officer of Allianz Global Investors AG and is a member of the management board of Allianz SE. He spent 14 years with Citigroup Inc., holding positions in Trading and Project Finance and as Head of Capital Markets for Europe, North America and Japan. Other former appointments include serving as chairman of various Allianz subsidiaries. He was previously a member of the supervisory board and chairman of the audit and risk committee of OSRAM Licht AG. He was also a member of the German Council for Sustainable Development and a member of the advisory board of the Siemens Group Pension Board.
Current appointments include: Joachim is Chairman of the supervisory board of Deutsche Börse AG and of the Shareholder Committee of Joh A. Benckiser SARL. He is an independent director of Coty Inc. and a director of Allianz France S.A.

Member of the Financial System Vulnerabilities Committee and the Nomination Committee.
Skills and experience: Rona has a background in international industry, publishing, finance and general management. She was a former chair and Chief Executive Officer of the Financial Times Group Limited responsible for its strategy, management and operations and was Finance Director of Pearson plc with responsibility for the finance function, global financial reporting and control, tax and treasury. Other former appointments include serving as an Executive Vice President, Strategy and Group Control of Imperial Chemical Industries plc and Chairman and director of Interactive Data Corporation. She was a member of the board of the UK Government’s Cabinet Office and a non-executive director of The Economist Newspaper Limited.
Current appointments include: Rona is a non-executive director of PepsiCo Inc. and chair of the BBC Trust. She handed over her responsibility as chair of HSBC North American Holdings Inc. to Heidi Miller on 1 January 2016 and will remain on its board as a non-executive director until she retires from the HSBC Holdings Board on 22 April 2016.

Chairman of the Group Remuneration Committee and the Nomination Committee.
Skills and experience: Sam has international experience, particularly in the energy sector, having had responsibility for businesses in four continents. He is a qualified solicitor with a Master’s in Business Administration. Former appointments include serving as Chief Executive Officer of Centrica plc and the lead non-executive board member of the UK Department for Transport. Sam was also an Executive Vice President of Chevron Corporation and a member of the UK Prime Minister’s Business Advisory Group.
Current appointments include: Sam is the chair of National Centre for Universities and Business and Executive Chairman of Neptune Oil & Gas Limited.
HSBC HOLDINGS PLC
251 |
Table of Contents
Report of the Directors: Corporate Governance(continued)
Biographies

Skills and experience: Irene has over 30 years of finance industry experience. She has held senior positions in investment banking and fund management in the UK, USA and Australia including Citibank and the Commonwealth Bank of Australia. Other former appointments include serving as a member of the Advisory Council of JP Morgan Australia and the Australian Takeovers Panel.
Current appointments include: Irene is Executive Chairman of Hysan Development Company Limited. She is also a non-executive director of The Hongkong and Shanghai Banking Corporation Limited and Hang Seng Bank Limited. She is a non-executive director of Cathay Pacific Airways Limited, China Light & Power Holdings Limited and Noble Group Limited.

Member of the Group Risk Committee, the Nomination Committee
and the Group Remuneration Committee.
Skills and experience: John has international experience having worked for JPMorgan in Chile, New York, Washington and London and interacted with financial institutions, central banks and governments in many countries. He served at the International Monetary Fund as First Deputy Managing Director, Acting Managing Director and as Special Adviser. Other former appointments include serving as a trustee of the Economic Club of New York, and a Global Policy Adviser for Anderson Global Macro, LLC and as Chairman of the World Economic Forum’s Global Agenda Council on the International Monetary System.
Current appointments include: John holds a number of senior appointments and advisory positions in international economic research organisations.

Chairman of the Conduct & Values Committee and a member of the Group Audit Committee, Group Risk Committee and the Nomination Committee.
Skills and experience: Rachel has experience in both the public and private sectors and knowledge of the operation of the UK government and financial system. Her former
appointments include serving as Deputy Governor of the Bank of England and Permanent Secretary at the UK Government Departments for Transport and Work and Pensions and the Welsh Office. She was a non-executive director of Reinsurance Group of America Inc. and The Scottish American Investment Company PLC.
Current appointments include: Rachel is anon-executive director of Arcus European Infrastructure Fund GP LLP, and Heathrow Airport Holdings Limited. She is also anon-executive director and chairman of the corporate responsibility committee of Serco Group plc.

Skills and experience: Iain joined HSBC in 2007 as Chief Financial Officer of HSBC North America Holdings Inc. He has extensive financial and international experience, having worked in London, Paris, the US, Africa and Asia. Iain is a member of the Institute of Chartered Accountants of Scotland. Other former appointments include serving as a director of Hang Seng Bank Limited, Chief Financial Officer, Asia-Pacific, Vice President and Chief Financial Officer of GE Global Consumer Finance and Vice President and Chief Financial Officer of GE Healthcare – Global Diagnostic Imaging.
Current appointments include: Iain is Chairman of the audit and risk committee of the British Heart Foundation.

Member of the Group Risk Committee.
Skills and experience: Heidi has extensive international banking and finance experience. She is a former President of International at JPMorgan Chase, and was responsible for leading the global expansion and the international business strategy across the investment bank, asset management, and treasury and securities services divisions. Former appointments include serving as non-executive director of Merck & Co. Inc. and Progressive Corp.; Executive Vice President and Chief Financial Officer of Bank One Corporation; Senior Executive Vice President of Priceline.com Inc.; and Executive Vice President and Chief Financial Officer of Citigroup Inc.
Current appointments include: Heidi was appointed chair of HSBC North American Holdings Inc. on 1 January 2016. She is a non-executive director of First Data Corporation, General Mills Inc. and advisory director of SRS Acquiom LLC.
HSBC HOLDINGS PLC
252 |
Table of Contents

Skills and experience: Marc joined HSBC in 2005 as Chief Financial and Risk Officer, Global Banking and Markets and in December 2010 became Group Chief Risk Officer. He has extensive risk management and financial experience. Marc is a Fellow of the Institute of Chartered Accountants in England and Wales. He was a European chief financial officer at JP Morgan and an audit partner at PricewaterhouseCoopers.

Member of the Group Remuneration Committee.
Skills and experience: Simon has a background in international corporate advisory work with a wealth of experience in mergers and acquisitions, merchant banking, investment banking and financial markets. Other former appointments include serving as non-executive chair of Rolls-Royce Holdings plc, non-executive director of the Royal Opera House Covent Garden Limited and NewShore Partners Limited and trustee of the Eden Project Trust.
Current appointments include: Simon is the founding member of Simon Robertson Associates LLP. He is anon-executive director of Berry Bros. & Rudd Limited, The Economist Newspaper Limited, Troy Asset Management and is a director of Immodulon Therapeutics Limited.

Chairman of the Group Audit Committee and a member of the Conduct & Values Committee.
Skills and experience: Jonathan has extensive international financial experience, having worked in the UK, US and Switzerland. He served as Chief Financial Officer of Novartis AG and AstraZeneca plc. Jonathan is a Fellow of the Institute of Chartered Accountants in England and Wales. Other former appointments include serving as partner and Managing Director of Goldman Sachs, and a partner of KPMG. He was a non-executive director and chair of the Audit Committee of Diageo plc.
Current appointments include: Jonathan is Chairman of HSBC Bank plc, Innocoll AG and Proteus Digital Health Inc. and is a non-executive director of Genomics England Limited.

With effect from 1 January 2016: Member of the Group Remuneration Committee and the Conduct & Values Committee
Skills and experience: Pauline has extensive legal and human resources experience across a number of different sectors, and contributed to the Dutch Banking Code Monitoring Commission. Other former appointments include serving as President of Erasmus University Rotterdam, Senior Executive Vice President and Head of Group Human Resources at ABN AMRO Bank NV, Group Human Resources Director at TNT NV, HR Director, Information Technology, Royal Dutch Shell Group and Senior Legal Counsel, Shell International.
Current appointments include: Pauline is Chairman of the supervisory board of EY Netherlands. She is also a member of the supervisory boards of ASML Holding NV and Royal DSM NV.

Member of the Group Remuneration Committee.
Skills and experience: Paul has extensive international business experience gained as Group Chief Executive of Diageo plc for 12 years, having originally joined the Board of its predecessor, Grand Metropolitan plc, in 1995. He was also a non-executive director of Unilever PLC, United Spirits Limited and Centrica plc. Paul is a Fellow of the Chartered Institute of Management Accountants.
Current appointments include: Paul is Chairman of Compass Group PLC, Avanti Communications Group Plc and Chime Communications Limited and a non-executive director of FedEx Corporation, RM2 International S.A. and Simpsons Malt Limited.
HSBC HOLDINGS PLC
253 |
Table of Contents
Report of the Directors: Corporate Governance(continued)
Biographies

Skills and experience: Safra has a background in international business leadership, having helped transform Oracle into the largest producer of business management software and the world’s leading supplier of software for information management.
Current appointments include: Safra is joint Chief Executive Officer of Oracle Corporation.

Ben joined HSBC in June 2013 and became Group Company Secretary in July 2013. He is a Fellow of the Institute of Chartered Secretaries and Administrators. Former appointments include: Group Company Secretary of Rio Tinto plc and of BG Group plc.
Mohammad Al Tuwaijri,49 Deputy Chairman and Chief Executive, HSBC Bank Middle East Limited
|
Mohammad joined HSBC in 2010 and became a Group Managing Director on 1 February 2016. Former appointments include: Group Head of Treasury and Head of Risk Management at HSBC associate The Saudi British Bank and Country Head of Saudi Arabia at JP Morgan Chase.
Samir Assaf,55 Chief Executive, Global Banking and Markets
|
Samir joined HSBC in 1994 and became a Group Managing Director in 2011. He is Chairman and non-executive director of HSBC France, a director of HSBC Trinkaus & Burkhardt AG and of HSBC Bank plc. He is Chairman of the Global Financial Markets Association (GFMA). Former appointments include: director of HSBC Global Asset Management Limited and of HSBC Bank Egypt S.A.E.; Head of Global Markets and Head of Global Markets for Europe, Middle East and Africa.
Peter Boyles,60 Chief Executive of Global Private Banking
|
Peter joined HSBC in 1975 and became a Group Managing Director in 2013. He is Chairman of HSBC Private Bank (Monaco) SA and was appointed a director of HSBC Global Asset Management Limited on 26 March 2015. Former appointments include: Chief Executive of HSBC France and Continental Europe and a director of HSBC Bank plc; HSBC Bank Malta p.l.c.; and of HSBC Trinkaus & Burkhardt AG.
Patrick Burke,54 President and Chief Executive of HSBC US
|
Patrick joined HSBC in 1989 and became a Group Managing Director on 1 August 2015. He is Chairman of HSBC Bank USA, N.A., HSBC Finance Corporation, HSBC USA Inc. and HSBC Global Asset Management (USA) Inc.
HSBC HOLDINGS PLC
254 |
Table of Contents
John Flint,47 Chief Executive, Retail Banking and Wealth Management
|
John joined HSBC in 1989 and became a Group Managing Director in 2013. He is a director of HSBC Private Banking Holdings (Suisse) SA. Former appointments include: a Director of HSBC Bank Canada; Chief of Staff to the Group Chief Executive and Group Head of Strategy and Planning; Chief Executive Officer HSBC Global Asset Management; Group Treasurer; and Deputy Head of Global Markets.
Pierre Goad,54 Group Head of Human Resources
|
Pierre first joined HSBC in 2001 and became a Group Managing Director on 1 August 2015. He is a director of HSBC Bank Canada. Former appointments include: Global Head of Communications; Head of Communications at Zurich Insurance Group; and Head of Corporate Development, Europe, Middle East and Global Businesses.
Pam Kaur,52 Group Head of Internal Audit
|
Pam joined HSBC and became a Group Managing Director in 2013. She is a co-opted member of The Institute of Chartered Accountants in England & Wales. Former appointments include: Global Head of Group Audit for Deutsche Bank AG; Chief Financial Officer and Chief Operating Officer, Restructuring and Risk Division, Royal Bank of Scotland Group plc; Group Head of Compliance and Anti-Money Laundering, Lloyds TSB; and Global Director of Compliance, Global Consumer Group, Citigroup.
Stuart Levey,52 Chief Legal Officer
|
Stuart joined HSBC and became a Group Managing Director in 2012. Former appointments include: Under Secretary for Terrorism and Financial Intelligence in the US Department of the Treasury; Senior Fellow for National Security and Financial Integrity at the Council on Foreign Relations; Principal Associate Deputy Attorney General at the US Department of Justice; and Partner at Miller, Cassidy, Larroca & Lewin LLP and Baker Botts LLP.
Andy Maguire,49 Group Chief Operating Officer
|
Andy joined HSBC in November 2014 as Group Chief Operating Officer and became a Group Managing Director on 1 August 2015. Former appointments include Managing Partner (UK and Ireland) of the Boston Consulting Group.
Paulo Maia,57 Chief Executive, Latin America
|
Paulo joined HSBC in 1993 and became a Group Managing Director on 1 February 2016. Former appointments include: Chief Executive of HSBC Bank Canada and HSBC Bank Australia.
Antonio Simoes,40 Chief Executive, HSBC Bank plc
|
Antonio joined HSBC in 2007 and became a Group Managing Director on 1 February 2016. He is a director of HSBC France. Former appointments include: Head of RBWM, Europe; Chairman of HSBC Global Asset Management (UK) Limited; and Group Head of Strategy & Planning.
Peter Wong,64 Deputy Chairman and Chief Executive, The Hongkong and Shanghai Banking Corporation Limited
|
Peter joined HSBC in 2005 and became a Group Managing Director in 2010. He is Chairman of HSBC Bank (China) Company Limited and HSBC Bank Malaysia Berhad, and a non-executive director of Hang Seng Bank Limited and Bank of Communications Co., Ltd. He is also an independentnon-executive director of Cathay Pacific Airways Limited. Former appointments include: Vice Chairman of HSBC Bank (Vietnam) Ltd; director of HSBC Bank Australia Limited; and director of Ping An Insurance (Group) Company of China, Ltd.
HSBC HOLDINGS PLC
255 |
Table of Contents
Report of the Directors: Corporate Governance(continued)
Corporate governance codes / Board of Directors
HSBC is committed to high standards of corporate governance.
During 2015, HSBC complied with the applicable code provisions of: (i) the UK Corporate Governance Code issued by the Financial Reporting Council in September 2014; and (ii) the Hong Kong Corporate Governance Code set out in Appendix 14 to the Rules Governing the Listing of Securities on The Stock Exchange of Hong Kong Limited. The UK Corporate Governance Code is available at www.frc.org.uk and the Hong Kong Corporate Governance Code is available at www.hkex.com.hk.1
The Board has adopted a dealing code for transactions in HSBC Group securities by Directors (Code for Dealing in HSBC Group Securities). This code of conduct meets the requirements of the FCA Listing Rules and the Rules Governing the Listing of Securities on The Stock Exchange of Hong Kong Limited, save that The Stock Exchange of Hong Kong Limited has granted waivers from strict compliance with the Rules which take into account accepted practices in the UK, particularly in respect of employee share plans. Following specific enquiry, each Director has confirmed that he or she has complied with the code of conduct throughout the year. All Directors are routinely reminded of their obligations under the Code for Dealing in HSBC Group securities.
| 1 | The Group Risk Committee is responsible for the oversight of internal control (other than internal control over financial reporting) and risk management systems (Hong Kong Corporate Governance Code provision C.3.3 paragraphs (f), (g) and (h)). If there were no Group Risk Committee, these matters would be the responsibility of the Group Audit Committee. |
The Board of Directors of HSBC Holdings (the ‘Board’) aims to promote the long-term success of the Company and deliver sustainable value to its shareholders.
Led by the Group Chairman, the Board sets the strategy and risk appetite for the Group and approves capital and operating plans presented by management for the achievement of the strategic objectives. Implementation of the strategy is delegated to the Group Chief Executive.
Directors
The names and brief biographical details of the Directors are included on pages 249 to 254.
Executive Directors
The Group Chairman, Group Chief Executive, Group Finance Director and Group Chief Risk Officer are HSBC employees.
Non-executive Directors
Non-executive Directors are not HSBC employees and do not participate in the daily management of HSBC; they bring an independent perspective, constructively challenge and help develop proposals on strategy, scrutinise the performance of management in meeting agreed goals and objectives and monitor the Group’s risk profile and the reporting of performance. The non-executive Directors bring a wide variety of experience from the public and private sectors, including the leadership of large complex multinational enterprises.
Non-executive Directors’ terms of appointment
The Board has determined the minimum time commitment expected of non-executive Directors to be about 30 days per annum. Time devoted to the Company could be considerably more, particularly if serving on Board committees.
Non-executive Directors are appointed for an initial three-year term and, subject to re-election by shareholders at annual general meetings, are typically expected to serve two three-year terms. The Board may invite a director to serve additional periods. All Directors are subject to annual election by shareholders.
Letters setting out the terms of appointment of each of the non-executive Directors are available for inspection at the Company’s registered office in London.
Group Chairman and Group Chief Executive
The roles of Group Chairman and Group Chief Executive are separate, with a clear division of responsibilities between the running of the Board and the executive responsibility for running HSBC’s business. Descriptions of the roles and responsibilities of the Group Chairman and the Group Chief Executive are available at www.hsbc.com/about-hsbc/corporate-governance/board-committees. Their key responsibilities are set out below.
HSBC HOLDINGS PLC
256 |
Table of Contents
Key responsibilities
Group Chairman – Douglas Flint
• Leads the Board and ensures its effectiveness
• Develops relationships with governments, regulators and investors
• Leads the Group’s interactions on matters of public policy and regulatory reform with regard to the banking and financial services industry
• Maintains corporate reputation and character
• Undertakes performance management of the Group Chief Executive
Group Chief Executive – Stuart Gulliver
• Develops, and delivers performance against, business plans
• Develops Group strategy, in agreement with the Group Chairman, for recommendation to the Board
• Drives performance within strategic goals and commercial objectives agreed by the Board with support from the Group Management Board
|
Senior independentnon-executive Director and Deputy Chairman
Descriptions of the roles and responsibilities of the senior independent non-executive Director and Deputy Chairman are available at www.hsbc.com/about-hsbc/corporate-governance/board-committees. Their key responsibilities are set out below.
Key responsibilities
Senior Independent non-executive Director – Rachel Lomax
• Acts as an intermediary for other non-executive Directors when necessary.
• Leads the non-executive Directors in the oversight of the Group Chairman.
Deputy Chairman – Sir Simon Robertson
• Deputises for the Group Chairman at meetings of the Board or shareholders and supports the Group Chairman in his role.
|
Appointment, retirement and re-election of Directors
The Board may at any time appoint any person who is willing to act as a Director, either to fill a vacancy or as an addition to the existing Board. The total number of Directors shall not be less than five nor should it exceed 25. Newly-appointed Directors retire at the Annual General Meeting (‘AGM’) following appointment and shall be eligible for election. The Board may appoint any Director to hold any employment or executive office and may revoke or terminate any such appointment. Shareholders may, by ordinary resolution, appoint a person as a Director or remove any Director before the expiration of his or her period of office. Under the UK Corporate Governance Code all of the Directors are subject to annual re-election by shareholders.
During the year Irene Lee and Pauline van der Meer Mohr were appointed to the Board. Additionally, Paul Walsh and Henri de Castries have been appointed to the Board with effect from 1 January 2016 and 1 March 2016 respectively. Further details on Paul Walsh and Henri de Castries skills and experience can be found in the biographies on pages 250 and 253.
Powers of the Board
The Board is responsible for overseeing the management of HSBC globally and, in so doing, may exercise its powers, subject to any relevant laws and regulations and to the Articles. The Board has adopted terms of reference which are available at www.hsbc.com/about-hsbc/leadership. The Board reviews its terms of reference annually.
In particular, the Board may exercise all the powers of the Company to borrow money and to mortgage or charge all or any part of the undertaking, property or assets (present or future) of HSBC Holdings and exercise any of the powers conferred on it by the Companies Act 2006 and/or by shareholders. The Board is able to delegate and confer on any executive Director any of its powers, authorities and discretions for such time and on such terms as it thinks fit. In addition, the Board may establish any local or divisional boards or agencies for managing the business of HSBC Holdings in any specified locality and delegate and confer on any local or divisional board, manager or agent so appointed any of its powers, authorities and discretions for such time and on such terms as it thinks fit. The Board may also appoint any person or persons to be an agent of HSBC Holdings and may delegate to any such person or persons any of its powers, authorities and discretions on such terms as it thinks fit.
The Board delegates the day-to-day management of HSBC Holdings to the Chief Executive Officer but reserves to itself approval of certain matters including operating plans, risk appetite and performance targets, procedures for monitoring and controlling operations, credit, market risk limits, acquisitions, disposals, investments, capital expenditure or realisation or creation of a new venture, specified senior appointments and any substantial change in balance sheet management policy.
Board meetings
Seven Board meetings and four strategy meetings were held in 2015. At least one Board meeting each year is held in a key strategic location outside the UK. During 2015, Board meetings were held in Hong Kong and mainland China.
The table below shows each Director’s attendance at meetings of all Board and Committee meetings during 2015.
During 2015, the non-executive Directors and the senior independent Director met regularly without the executive Directors, including to appraise the Group Chairman’s performance.
HSBC HOLDINGS PLC
257 |
Table of Contents
Report of the Directors: Corporate Governance(continued)
Board of Directors
2015 Board and committee attendance
| AGM | Board | Group Audit Committee | Group Risk Committee | Group Remuneration | Nomination Committee | Financial System Vulnerabilities Committee | Conduct & Values Committee | Philanthropic & Community Investment Oversight Committee | ||||||||||||||||||||||||||||||
Number of meetings held | 1 | 7 | 7 | 10 | 10 | 5 | 7 | 5 | 3 | |||||||||||||||||||||||||||||
Group Chairman | ||||||||||||||||||||||||||||||||||||||
Douglas Flint | 1 | 7 | – | – | – | – | – | – | – | |||||||||||||||||||||||||||||
Executive Directors | ||||||||||||||||||||||||||||||||||||||
Stuart Gulliver | 1 | 7 | – | – | – | – | – | – | – | |||||||||||||||||||||||||||||
Iain Mackay | 1 | 7 | – | – | – | – | – | – | – | |||||||||||||||||||||||||||||
Marc Moses | 1 | 7 | – | – | – | – | – | – | – | |||||||||||||||||||||||||||||
Non-executive Directors | ||||||||||||||||||||||||||||||||||||||
Phillip Ameen | 1 | 7 | 7 | – | – | – | – | – | – | |||||||||||||||||||||||||||||
Kathleen Casey | 1 | 7 | 7 | – | – | – | 7 | – | – | |||||||||||||||||||||||||||||
Safra Catz1 | 1 | 7 | – | – | – | – | – | – | – | |||||||||||||||||||||||||||||
Laura Cha | 1 | 7 | – | – | – | 4/5 | – | 4/5 | 3 | |||||||||||||||||||||||||||||
Lord Evans of Weardale | 1 | 7 | – | – | – | – | 7 | 5 | 3 | |||||||||||||||||||||||||||||
Joachim Faber | 1 | 7 | – | 10 | – | – | – | – | – | |||||||||||||||||||||||||||||
Rona Fairhead | 1 | 7 | – | – | – | 4/5 | 7 | – | – | |||||||||||||||||||||||||||||
Sam Laidlaw | 1 | 7 | – | – | 10 | 5 | – | – | – | |||||||||||||||||||||||||||||
Irene Lee2 | – | 3/3 | – | – | – | – | – | – | – | |||||||||||||||||||||||||||||
John Lipsky | 1 | 7 | – | 10 | 10 | 5 | – | – | – | |||||||||||||||||||||||||||||
Rachel Lomax3 | 1 | 7 | 7 | 10 | – | 2/2 | – | 5 | – | |||||||||||||||||||||||||||||
Heidi Miller | 1 | 7 | – | 10 | – | – | – | 3/5 | – | |||||||||||||||||||||||||||||
Sir Simon Robertson5 | 1 | 7 | – | – | 10 | 3/3 | 2/2 | – | – | |||||||||||||||||||||||||||||
Jonathan Symonds | 1 | 7 | 7 | – | – | – | – | 5 | – | |||||||||||||||||||||||||||||
Pauline van der Meer Mohr4 | – | 2/2 | – | – | – | – | – | – | – | |||||||||||||||||||||||||||||
| 1 | Resigned from the Board 31 December 2015. |
| 2 | Appointed to the Board 1 July 2015. |
| 3 | Appointed to the Nomination Committee 24 April 2015. |
| 4 | Appointed to the Board 1 September 2015. |
| 5 | Resigned from the Financial System Vulnerabilities Committee and the Nomination Committee 24 April 2015 . |
Board balance and independence of Directors
The Board comprises a majority of independent non-executive Directors. At the conclusion of the 2016 AGM, the Board is expected to comprise 18 Directors (the Group Chairman, the executive Directors and 14 independentnon-executive Directors). The size of the Board is considered to be appropriate given the complexity and geographical spread of the business and the significant time demands placed on the Directors arising from the various Board committees that exist to underpin the Group’s corporate governance framework.
The Nomination Committee regularly reviews the structure, size and composition of the Board (including skills, knowledge, experience, independence and diversity) and makes recommendations to the Board with regard to any changes.
The Board has adopted a policy on Board diversity which is consistent with the Group’s strategic focus on ethnicity, age and gender diversity for the employee base. Further information on the Board diversity policy can be found on page 271.
The Board considers all of the non-executive Directors to be independent. When determining independence the Board considers that calculation of the length of service of a non-executive Director begins on the date of his or her election by shareholders following appointment as a Director of HSBC Holdings. Sam Laidlaw, has served on the Board for more than seven years and Rona Fairhead and Sir Simon Robertson have served on the Board for more than nine years and, in that respect only, do not meet the usual criteria for independence set out in the UK Corporate Governance Code and the Hong Kong Corporate Governance Code. The Board has determined Sam Laidlaw, Rona Fairhead and Simon Robertson to be independent in character and judgement, notwithstanding their length of service, taking into account their continuing level of constructive challenge of management and strong contribution to Board discussions. Rona Fairhead and Sir Simon Robertson will retire from the Board at the 2016 Annual General Meeting.
The Board has concluded that there are no relationships or circumstances which are likely to affect a non-executive Director’s judgement and any relationships or circumstances which could appear to do so are not considered to be material.
HSBC HOLDINGS PLC
258 |
Table of Contents
In accordance with the Rules Governing the Listing of Securities on the Stock Exchange of Hong Kong Limited, each non-executive Director determined by the Board to be independent has provided an annual confirmation of his or her independence.
Information and support
The Board regularly reviews reports on performance against financial and other strategic objectives, business developments and investor and external relations. The chairmen of Board committees report to each meeting of the Board on the activities of the committees since the previous Board meeting. The Board receives regular reports and presentations on strategy and developments in the global businesses and principal geographical areas. Regular reports are also provided on the Group’s risk appetite, top and emerging risks, risk management, credit exposures and the Group’s loan portfolio, asset and liability management, liquidity, litigation, financial and regulatory compliance and reputational issues.
The Directors have free and open contact with management at all levels. When attending Board offsite meetings and when travelling for other reasons, non-executive Directors are encouraged to take opportunities to visit local business operations at first hand and to meet local management.
Role of the Group Company Secretary
All Directors have access to the advice and services of the Group Company Secretary, who is responsible to the Board for ensuring that Board procedures and all applicable rules and regulations are complied with.
Under the direction of the Group Chairman, the Group Company Secretary’s responsibilities include ensuring good information flows within the Board and its committees and between senior management and non-executive Directors, as well as facilitating induction and assisting with professional development as required.
The Group Company Secretary is responsible for advising the Board on corporate governance matters.
The agenda and supporting papers are distributed in advance of all Board and Board committee meetings to allow time for appropriate review and to facilitate full discussion at the meetings. All Directors have full and timely access to all relevant information and may take independent professional advice if necessary at HSBC Holdings’ expense.
Induction
Formal, tailored induction programmes are arranged for newly appointed Directors. The programmes are based on an individual Director’s needs and vary according to the skills and experience of each Director. Typical induction programmes consist of a series of meetings with other Directors and senior executives to enable new Directors to familiarise themselves with the business. Directors also receive comprehensive guidance from the Group Company Secretary on Directors’ duties and liabilities.
Training and development
Training and development is provided for Directors. Executive Directors develop and refresh their skills and knowledge through day-to-day interactions and briefings with senior management of the Group’s businesses and functions. Non-executive Directors have access to internal training and development resources and personalised training is provided, where necessary. The Chairman, with support from the Group Company Secretary, regularly reviews the training and development of each Director.
During the year, Directors received training on the following topics:
| • | The Volcker Rule covering the investment activities of certain US banks; |
| • | UK Financial Services (Banking Reform) Act 2014 including the Senior Managers’ Regime; and |
| • | the changing financial and regulatory reporting landscape. |
The table below shows a summary of training and development undertaken by each Director during 2015.
HSBC HOLDINGS PLC
259 |
Table of Contents
Report of the Directors: Corporate Governance(continued)
Board of Directors
Training and development
| Training areas | ||||||||||
Regulatory updates | Corporate Governance | Financial industry | Briefings on Board committee related topics | |||||||
Executive Directors | ||||||||||
Douglas Flint | ü | ü | ü | ü | ||||||
Stuart Gulliver | ü | ü | ü | ü | ||||||
Iain Mackay | ü | ü | ü | ü | ||||||
Marc Moses | ü | ü | ü | ü | ||||||
Non-executive Directors | ||||||||||
Phillip Ameen | ü | ü | ü | ü | ||||||
Kathleen Casey | ü | ü | ü | ü | ||||||
Safra Catz | ü | ü | ü | ü | ||||||
Laura Cha | ü | ü | ü | ü | ||||||
Lord Evans of Weardale | ü | ü | ü | |||||||
Joachim Faber | ü | ü | ü | ü | ||||||
Rona Fairhead | ü | ü | ü | ü | ||||||
Sam Laidlaw | ü | ü | ü | ü | ||||||
Irene Lee | ü | ü | ü | |||||||
John Lipsky | ü | ü | ü | ü | ||||||
Rachel Lomax | ü | ü | ü | ü | ||||||
Heidi Miller | ü | ü | ü | ü | ||||||
Sir Simon Robertson | ü | ü | ü | ü | ||||||
Jonathan Symonds | ü | ü | ü | ü | ||||||
Pauline van der Meer Mohr | ü | ü | ü | ü | ||||||
Board performance evaluation
The Board is committed to regular evaluation of its own effectiveness and that of its committees. In 2014, the review of the effectiveness of the Board and its committees was undertaken by Bvalco Ltd1, an independent third-party firm.
The findings of the 2014 review were presented to the Board, an action plan developed and progress against these actions reported to the Board during 2015. The themes emerging from the 2014 review and the actions taken included:
2014 Review of Board effectiveness
Theme
| Action taken
| |
Harmonising interactions between Group and subsidiaries | The governance arrangements for the regional risk committees and the audit committees for principal subsidiaries and certain global businesses have been enhanced to provide better transparency in the reporting of significant issues to the GAC and GRC and to provide better communication between the committees.
| |
Increasing diversity on the Board of Directors, consider recruitment of a director with an Asian/Chinese business background
| Irene Lee was appointed to the Board in July 2015. | |
Continuing efforts to balance the agenda at Board meetings, focusing on priority strategic issues and in particular technology
| Additional time has continued to be provided for the debate of these issues at meetings. The Group Chief Operating Officer delivered updates on the Group’s global change programme priorities, and the Chief Technology Officer also presented a new technology strategy in 2015.
| |
Allocating time in Board meetings to address the transition processes relating to the Senior Managers’ Regime | Preparations for the Senior Managers’ Regime have become a regular Board agenda item.
| |
Senior Independent Director to build on relationships with regulators and with all members of the Board
| Meetings held with regulators, Board members and shareholders during the period. | |
| 1 | A legal firm which is engaged from time to time by the Company to provide legal services holds a 20% shareholding in Bvalco Ltd. Bvalco Ltd has confirmed that it does not have any other connection with the Company. |
HSBC HOLDINGS PLC
260 |
Table of Contents
Director performance evaluation
Evaluation of the individual performance of each non-executive Director is undertaken annually by the Group Chairman. During this evaluation, the Group Chairman discusses the individual contribution of the Director, explores training and development needs, seeks input on areas where the Director feels he or she could make a greater contribution and discusses whether the time commitment required of the Director can continue to be delivered. Based upon their individual evaluation, the Group Chairman has confirmed that all of the non-executive Directors continue to perform effectively, contribute positively to the governance of HSBC and demonstrate full commitment to their roles.
Evaluation of the individual performance of each executive Director is undertaken as part of the performance management process for all employees, the results of which are considered by the Group Remuneration Committee when determining variable pay awards each year.
The non-executive Directors, led by the senior independent non-executive Director, were responsible for the evaluation of the performance of the Group Chairman.
The Board monitors the implementation of actions arising from each performance evaluation.
It is the intention of the Board to continue to undertake an evaluation of its performance and that of its committees and individual Directors annually, with independent external input to the process, as appropriate, at least every third year. The 2015 performance evaluation review process is being undertaken currently by the JCA Group, an independent third-party firm.
Relations with shareholders
All Directors are encouraged to develop an understanding of the views of major shareholders.Non-executive Directors are invited to attend analyst presentations and other meetings with institutional investors and their representative bodies. During the year, a corporate governance seminar, hosted by the Group Chairman and the principal committee chairs, was held in London to which a number of institutional shareholders and their representative bodies were invited.
All executive Directors and certain other senior executives hold regular meetings with institutional investors. The Board receives a regular investor relations activity report which provides feedback from meetings with institutional shareholders and brokers, analysts’ forecasts, information from research reports and share price performance data. The Board also receives regular reports from its corporate brokers.
The Group’s shareholder communication policy is available on www.hsbc.com/about-hsbc/corporate-governance/ corporate-governance-codes.
On several occasions during 2015, non-executive Directors, including the senior independent non-executive Director, chair of the Nomination Committee and chair of the Remuneration Committee, met or corresponded with institutional investors and their representatives to discuss corporate governance topics and executive remuneration.
As senior independent non-executive Director, Rachel Lomax is available to shareholders should they have concerns which cannot be resolved or for which such contact would be inappropriate through the normal channels of Group Chairman, Group Chief Executive, Group Finance Director, Group Chief Risk Officer, or other executives. Ms Lomax may be contacted through the Group Company Secretary at 8 Canada Square, London E14 5HQ.
Conflicts of interest, indemnification of Directors and contracts of significance
The Board has adopted a policy and procedures relating to Directors’ conflicts of interest and can determine the terms of authorisation for such situations. Should they arise, the Board’s powers to authorise conflicts are operating effectively and the procedures are being followed. A review of situational conflicts which have been authorised from time-to-time and the terms of those authorisations are undertaken by the Board annually.
The Articles of Association provide that Directors are entitled to be indemnified out of the assets of HSBC Holdings against claims from third parties in respect of certain liabilities. All Directors have the benefit of directors’ and officers’ liability insurance.
None of the Directors had, during the year or at the end of the year, a material interest, directly or indirectly, in any contract of significance with any HSBC company.
HSBC HOLDINGS PLC
261 |
Table of Contents
Report of the Directors: Corporate Governance(continued)
Board committees
The Board has established a number of committees consisting of Directors, Group Managing Directors and, in the case of the Financial System Vulnerabilities Committee and the Philanthropic & Community Investment Oversight Committee, co-opted non-director members. The key roles of the Board committees are described above. The Chairman of each non-executive Board committee gives an oral report at each meeting of the Board on the activities of the committee since the previous Board meeting.
The Group Management Board (‘GMB’), chaired by the Group CEO, is a management forum providing recommendations and advice requested by the Group CEO, to assist him in his management of the day-to-day operations of HSBC Holdings plc and its subsidiaries pursuant to the authority delegated to him by the Board of Directors.
The Group Chief Risk Officer, operating under the delegated authority of the Group CEO, chairs regular Risk Management Meetings of the GMB (‘RMM’). The RMMs provide strategic direction and oversight of enterprise-wide management of all risks and establish, maintain and periodically review the policy and guidelines for the management of risk within the Group.
I am pleased to present the 2015 report of the Group Audit Committee (‘GAC’).
The GAC has been very active during 2015, successfully completing the transition of the external auditor to PwC, who formally took office during the year. The GAC has instituted a process across the Group Committees to ensure clarity of accountability and an enhanced reporting protocol with the audit committees of the Group’s major operating subsidiaries. This ensures clear lines of accountability at a Group, regional, country and business line level. In addition to financial reporting the GAC has taken accountability for recovery and resolution planning.
During the year the GAC has closely monitored the transition to the Committee of Sponsoring Organisations of the Treadway Commission 2013 (‘COSO’) internal control framework as detailed in this report. The completion of this transition, which has occupied a considerable amount of time, and the remediation of entity level controls has supported the Board’s ability to assess the effectiveness of the system of internal controls over financial reporting as detailed more fully on page 277. The GAC also considered the enhanced governance requirements associated with a new regulatory requirement for a viability statement, as now set out on page 277 of this Report.
In 2016, the GAC’s work will include overseeing improvements to the internal control framework and environment over financial reporting, the controls around the Group’s resolution and recovery plans, as well as the ring fencing of the retail banking operations in the UK. We will continue working closely with the Group Risk Committee including where necessary, joint meetings, to ensure continued alignment of our respective accountabilities.
I should like to thank members of the Committee, Internal Audit and PwC, as well as management, for their assistance and expertise during the year.
Jonathan SymondsChairman Group Audit Committee 22 February 2016
|
HSBC HOLDINGS PLC
262 |
Table of Contents
Members
Jonathan Symonds (Chairman)
Phillip Ameen
Kathleen Casey
Rachel Lomax
Based upon a review that has been undertaken, the Board has confirmed that it is satisfied that each member of the GAC is independent according to SEC criteria, may be regarded as audit committee financial experts for the purposes of section 407 of the Sarbanes-Oxley Act and has recent and relevant financial experience for the purposes of the UK and Hong Kong Corporate Governance Codes.
The Committee has complied with the relevant parts of the Competition and Markets Authority Final Order on the statutory audit market for the year ended 31 December 2015.
Role and responsibilities
The role and responsibilities of the GAC are set out in its terms of reference which can be found on our website at www.hsbc.com/about-hsbc/corporate-governance/board-committees.
The key areas of responsibility for the GAC include:
| • | monitoring the integrity of financial statements; |
| • | overseeing the internal controls systems relating to financial reporting; |
| • | monitoring and reviewing the effectiveness of the Global Internal Audit function; |
| • | reviewing the Company’s financial and accounting policies and practices; |
| • | oversight and remuneration of the external auditor and making recommendations to the Board on the appointment of the external auditor; and |
| • | reviewing with management steps for recovery and resolution planning. |
Governance
During 2015, the GAC held seven meetings, including a joint meeting with GRC. Attendance of the current GAC members is set out in the table on page 258. The Group Finance Director, Group Chief Accounting Officer, Group Head of Internal Audit and other members of senior management attended meetings of the GAC, by invitation, to contribute to the discussions relating to their respective areas of expertise. The external auditor, PwC, also attended all meetings and in camera sessions with internal and external audit were held at every meeting. The Chairman of the GAC had regular meetings with a number of the attendees separately to discuss agenda planning and specific issues as they arose during the year. The GAC Chairman reported matters of significance to the Board after each meeting and the minutes of the GAC meetings were made available to all Board members.
During 2015, an accounting and control maturity map was developed as a means of focusing accountabilities across the various Board Committees and to allow the escalation of issues relating to financial reporting or internal controls.
The GAC worked closely with the Group Risk Committee (‘GRC’) and met jointly during 2015 to define and draw out areas of commonality between the GAC and the GRC and thereby avoid duplication between the two committees. From this work, it was concluded that the GAC would have accountability for recovery and resolution planning. The GRC has accountability for data integrity and quality, stress testing and the operational risk framework, which is a critical part of the internal control framework.
The annual forum for the chairs of the major subsidiary audit and risk committees was held in June 2015 which resulted in an enhanced reporting protocol, providing clearer understanding of the roles and lines of accountability at Group, regional, country and business line levels. The operation of this enhanced engagement protocol will be closely monitored during 2016 and reviewed at the next annual forum.
How the Committee discharged its responsibilities
Financial reporting
The table on page 265 shows the key areas considered during the year and the action taken.
The GAC reviewed HSBC’s financial and accounting judgements and their application to the quarterly and annual reporting of the Group’s activities and financial performance. In addition, the GAC reviewed the external analysts’ presentations and the key financial metrics included in the 10 strategic actions, particularly the planning of risk-weighted assets.
The legal and regulatory environment was monitored and consideration given to changes in law, regulation, accounting policies and practices including developments in programmes to implement IFRS 9 Financial Instruments and Basel III/CRD IV.
Internal control and risk management
Pursuant to the requirement of section 404 of the Sarbanes-Oxley Act, the Group undertook an annual assessment of the effectiveness of internal control over financial reporting.
The GAC reviewed the Group’s system of internal control over financial reporting and the developments affecting it over the course of 2015. The GAC considered the process used to evaluate the effectiveness of the system, overseeing the transition by management to the COSO framework. The transition included a comprehensive programme of upgrades across all entity level controls. This work focused on those entity level controls that did not meet the required standards and the GAC received progress updates from management at each meeting. In addition, particular emphasis was given to the remediation of controls over access management in IT and the financial controls necessary to mitigate the impact on financial reporting. Applying this new framework, the GAC assessed the effectiveness of the internal control system over financial reporting as part of the Board’s overall assessment of internal controls. The Board’s assessment can be found on page 275 under the heading ‘Internal Control’.
HSBC HOLDINGS PLC
263 |
Table of Contents
Report of the Directors: Corporate Governance(continued)
Board committees
Internal Audit
The GAC approved Internal Audit’s annual plan, resource and budget, and considered the performance of the Group Head of Internal Audit. As this role reports to the Chairman of GAC, frequent meetings were held during the year. The GAC regularly met with the Group Head of Internal Audit without the presence of management.
The GAC annually assesses the performance and effectiveness of the Global Internal Audit function. The GAC’s effectiveness review encompassed the scope of the function’s work and the adequacy of the skills of its team. The GAC considered that the Global Internal Audit function remained effective. The Global Internal Audit Charter is available on the HSBC website at www.hsbc.com/investor-relations/governance/internal-control.
During the year, work was undertaken to streamline Global Internal Audit reporting across committees and to ensure key thematic issues were appropriately highlighted. These items included, for example, entity level controls remediation, financial crime compliance project execution and systems and data security. Enhancement was also made to the management information in relation to audit conclusions and the tracking-to-resolution of outstanding audit recommendations. This enhancement better aligned audit recommendations to the individual accountabilities of senior managers.
Additional resources were granted to internal audit during the year to increase assurance to all the Board committees on the execution of critical projects.
External audit
Following a competitive tender process undertaken in 2013, PricewaterhouseCoopers LLP (‘PwC’) was formally appointed as the Group’s external auditors at the 2015 AGM. The GAC met privately with the external auditor whilst the GAC Chairman maintained regular contact with the audit partner throughout the year.
The GAC reviewed PwC’s audit approach and strategy for 2015.
The fees paid to PwC for the year ended 31 December 2015 amounted to $98.4m of which $35m was payable in respect of non-audit services. Non-audit services accounted for 35.6% of the total fees payable. All non-audit services provided by PwC during 2015 were pre-approved by the GAC in accordance with the audit independence policy. The policy provides a framework for confirming that services do not create a mutual or conflicting interest and to not place PwC in the position of auditing their own work.
A further breakdown of the fees paid to the auditors for each of the last three financial years can be found in Note 7 on the Financial Statements.
The GAC considered PwC to be independent and PwC, in accordance with professional ethical standards, has provided the GAC with written confirmation of its independence for the duration of the financial year ended 31 December 2015.
The GAC has therefore recommended to the Board that PwC be re-appointed as the auditors. Resolutions concerning the re-appointment of PwC and their audit fee for 2016 will be proposed to shareholders at the 2016 AGM.
Whistleblowing
The GAC and the Conduct & Values Committee are responsible for reviewing the Group’s whistleblowing procedures. The GAC received regular updates on concerns raised under these procedures which related to accounting, internal accounting controls or auditing matters, as well as management actions taken in response.
Ongoing development
Throughout the year, the GAC received presentations on a range of topics including IFRSs financial accounting developments, new reporting requirements and briefings on developments in the regulatory environment.
Committee effectiveness
The effectiveness of the GAC was evaluated as part of the overall performance evaluation of the Board.
Governance structure for the oversight of financial reporting
Authority
| Membership
| Responsibilities include:
| ||
Board | Executive and non-executive Directors | • Financial reporting
• Appointing senior financial officers
| ||
Disclosure Committee |
The Group’s Finance Director, Chief Risk Officer, Chief Legal Officer, Chief Accounting Officer, Company Secretary, Chief Operating Officer, Head of Investor Relations, Head of Communications and Head of Strategy and Planning | • Reviewing the Group’s material communications with investors
• Assisting the Group Chief Executive and Group Finance Director to discharge their obligations relating to financial reporting under the Securities Exchange Act of 1934
• Monitoring and reviewing the effectiveness of controls and procedures established to ensure that information is disclosed appropriately and on a timely basis
• Reporting findings and making recommendations to the Group Chief Executive, Group Finance Director and the GAC
| ||
Major operating subsidiaries audit committees (or equivalent) |
Independent non-executive directors and/or HSBC Group employees with no line of functional responsibility for the activities of relevant subsidiary or global business, as appropriate | • Providing twice yearly assurance to the GAC on financial statements and internal controls over financial reporting of relevant subsidiaries or businesses, as requested
• Regular reporting to the GAC in connection with any material issues regarding controls over financial reporting
| ||
HSBC HOLDINGS PLC
264 |
Table of Contents
Principal activities undertaken during 2015 include:
Key area
| Action taken
| |
External auditor |
Overseeing and assessing the effectiveness of PricewaterhouseCoopers LLP during its first year as the Group’s external auditor. In assessing the effectiveness of the external auditor an audit assessment questionnaire is used to obtain feedback on the audit process. In addition, an assessment against best practice is undertaken. The assessment focuses on the overall audit process, its effectiveness and the quality of output.
| |
Implementation of COSO Framework |
GAC closely monitored the transition to the COSO Internal control framework. The transition involved a comprehensive programme of upgrading entity level controls.
| |
Controls over IT access management |
A significant issue for the GAC in 2015 was the tracking of progress over access rights to operating systems, applications and data used in the financial reporting process. This was an area identified by Internal Audit as requiring improvement and a substantial programme of work has been under way involving HSBC Operations, Services and Technology and Finance functions.
| |
Hedge accounting review |
GAC has overseen remediation work to address issues identified in relation to certain hedge accounting activities in a number of countries.
| |
Significant accounting judgements considered during 2015 included:
| ||
Key area
| Action taken
| |
Appropriateness of provisioning for legal proceedings and regulatory matters |
The GAC received reports from management on the recognition and amounts of provisions, the existence of contingent liabilities, and the disclosures relating to provisions and contingent liabilities for legal proceedings and regulatory matters. Specific areas addressed included provisioning arising from investigations by US regulators and law enforcement agencies relating to trading activities in the foreign exchange market and competition law investigations relating to foreign exchange trading activities in a number of jurisdictions. The GAC also considered management’s judgements regarding provisions and contingent liabilities in connection with investigations of HSBC’s Swiss Private Bank by a number of tax administration, regulatory and law enforcement authorities, and the measurement of the provision in relation to US Securities litigation (‘Jaffe’).
| |
Quarterly and annual reporting |
The GAC reviewed key judgements in relation to the quarterly and annual reporting. In addition, the GAC considered external analysts’ presentations and other key financial metrics included in the 10 strategic actions.
| |
Loan impairment, allowances and charges |
The GAC reviewed loan impairment allowances for personal and wholesale lending. Significant judgements and estimates for personal lending included a review of loss emergence periods across the retail loan portfolios. For wholesale lending, the effects on potential wholesale loan impairments of lower oil and gas prices, the VW vehicle emissions scandal, and trends in economic factors affecting credit quality in mainland China were considered, along with judgemental allowance adjustments for economic factors and notable individual cases of impairment. In particular, the GAC considered management’s judgements and assumptions informing the recognition of a judgemental collective impairment allowance for oil and gas exposures, additional to impairment allowances recognised for individual identified cases, as at 31 December 2015.
| |
Valuation of financial instruments |
The GAC reviewed the key valuation metrics and judgements involved in the determination of fair value of financial instruments. The GAC considered the valuation control framework, valuation metrics, significantyear-end judgements and emerging valuation topics.
| |
Viability statement |
The Directors now have an obligation under the UK Corporate Governance Code to state whether they believe the Group and parent company will be able to continue in operation and meet liabilities as they fall due over the next three years. During the year, the GAC considered the enhanced governance requirements surrounding the publication of the Viability Statement.
| |
UK customer remediation |
The GAC considered the provisions for redress for mis-selling of payment protection insurance (‘PPI’) policies, in the UK, including management’s judgements regarding the effect of the proposed time-bar for claims, on which the UK Financial Conduct Authority (‘FCA’) is to consult. The GAC also considered the implications of the 2014 UK court case (‘Plevin’) for the non-disclosure of levels of commission in relation to the historical sales of PPI products, and liabilities in respect of breaches of the UK Consumer Credit Act.
| |
Bank of Communications Co., Limited (‘BoCom’) impairment testing |
During the year the GAC considered the regular impairment reviews of HSBC’s investment in BoCom and management’s conclusions that the investment is not impaired. When testing investments in associates for impairment, IFRS require the carrying amount to be compared with the higher of fair value and value in use. The GAC reviewed a number of aspects of management’s work in this area including the sensitivity of the result of the impairment review to estimates and assumptions of projected future cash flows and the discount rate.
| |
Goodwill impairment testing |
The GAC noted that no impairment was identified as a result of the annual goodwill impairment test as at 1 July 2015. However, the review for indicators of impairment as at 31 December 2015 identified indicators of impairment which resulted in a formal re-test of GPB Europe and GB&M North America. The results for these CGU’s are sensitive to key assumptions and are subject to enhanced disclosure.
| |
Recognition of deferred tax assets |
In considering the recoverability of the Group’s deferred tax assets, the GAC reviewed the recognition of deferred tax assets in the US and Brazil and the associated projections of future taxable income.
| |
HSBC HOLDINGS PLC
265 |
Table of Contents
Report of the Directors: Corporate Governance(continued)
Board committees
I am pleased to present the 2015 report of the Group Risk Committee (‘GRC’). 2015 was a particularly busy year for the GRC. In addition to its regular reviews of the Group’s risk map, risk appetite and top and emerging risks, the GRC focused on the management of current and forward-looking risks, programmes to implement comprehensive reforms to the ways financial crime compliance is managed and the execution of Global Standards.
The GRC has closely monitored the strengthening of the risk framework for managing and mitigating operational risk, as this now represents a greater proportion of the Group’s capital demands.
The GRC held three additional meetings during the year dedicated to reviewing the results of BoE’s stress tests, reviewing the lessons learned from the BoE and internal stress testing exercises and proposals for enhancing the Group’s stress testing capability.
During the year, the GRC also reviewed management’s assessment of information security, cyber-crime and data management risks and management’s mitigating actions.
Like the Group Audit Committee, the GRC has taken steps to enhance its governance arrangements with the regional and business risk committees to ensure closer interaction and dialogue across the Group.
I should like to thank my colleagues on the Committee and senior management for their contribution to the Committee’s activities.
Joachim FaberChairman Group Risk Committee 22 February 2016
|
Members
Joachim Faber (Chairman)
John Lipsky
Rachel Lomax
Heidi Miller
Role and responsibilities
The role and responsibilities of the GRC are set out in its terms of reference. Its terms of reference can be found on our website at http://www.hsbc.com/about-hsbc/corporate-governance/board-committees.
The key areas of responsibility for the GRC include:
| • | advising the Board on high-level risk-related matters and risk governance, including current and forward looking risk exposures, future risk strategy and management of risk within the Group; |
| • | advising the Board on risk appetite and risk tolerance; |
| • | reviewing the effectiveness of the Group’s risk management systems framework and internal control systems (other than internal financial control systems which is the responsibility of the GAC); |
| • | monitoring executive control and management of risk including top and emerging risks; and |
| • | advising the Group Remuneration Committee on the alignment of remuneration with risk appetite. |
Governance
The GRC has overall non-executive responsibility for the oversight of risk across the Group.
All of HSBC’s activities involve the measurement, evaluation, acceptance and management of risk or combinations of risks. The Board, advised by the GRC, requires and promotes a strong risk governance culture which shapes the Group’s attitude to risk. The Board and the GRC oversee the maintenance and development of a strong risk management framework by continually monitoring the risk environment, top and emerging risks facing the Group and mitigating actions planned and taken.
Oversight of specific areas of risk is undertaken by the Conduct & Values Committee (page 272) to ensure that HSBC conducts business responsibly and consistently adheres to HSBC Values and by the Financial System Vulnerabilities Committee (page 268) for matters relating to anti-money laundering, sanctions, terrorist financing and proliferation financing. Both committees regularly update the GRC on their responsibilities.
The GRC, together with the GAC, has set core terms of reference for subsidiary company non-executive risk and audit committees.
During 2015, the GRC held 10 meetings and attendance of the current GRC members is set out in the table on page 258. The Group Chief Risk Officer, Group Finance Director, Chief Legal Officer, Group Head of Internal Audit, Global Head of Regulatory Compliance, Global Head of Financial Crime Compliance and other members of senior management attended meetings of the GRC by invitation to contribute to discussions relating to their respective areas of expertise. The Chairman of the GRC had meetings with a number of these attendees separately to discuss specific issues.
The GRC has worked closely with the GAC to ensure that any areas of significant overlap are appropriately addressed. The GRC and the GAC met jointly during 2015 to address areas of commonality between the committees and to avoid unnecessary duplication. The committees also discussed the importance of building strong alignment with the major regional and global business risk and audit committees and implemented proposals to improve inter-committee communication.
A forum for the chairs of the major regional and global businesses’ audit and risk committees was held in June 2015 which resulted in an enhanced reporting protocol, providing clearer lines of accountability at Group, regional, country and business line levels. The operation of this enhanced protocol will be closely monitored during the year and reviewed at the next annual forum.
The GRC met with the Group Chief Risk Officer and Group Head of Internal Audit without the presence of management. The GRC Chairman reported matters of significance to the Board after each meeting and the minutes of the meetings were made available to all Board members.
How the Committee discharged its responsibilities
The GRC reviewed the Group Risk Appetite Statement, the risk map (which describes the Group’s risk profile by risk type across the global businesses) and monitored the top and emerging risks (together with mitigating actions for identified risks) with management at each of its meetings.
HSBC HOLDINGS PLC
266 |
Table of Contents
Page 102 provides further information on the top and emerging risks, the risk map and the risk appetite for the Group.
The GRC requested reports and updates from management on risk-related issues identified for in-depth consideration and received regular reports on matters discussed at the RMM. In addition, during 2015 the GRC invited senior management from the global businesses to present their respective risk control frameworks. The GRC welcomed, as a result, the enhanced discussions on the risk environment and will continue this cycle of presentations throughout 2016.
A particular focus for the GRC during 2015 was the Group’s exposure to execution risk. Regular reports were received from the Group Chief Operating Officer, who attended the GRC meetings, updating the GRC on the status of the Group’s highest priority programmes and mitigating measures being put in place to manage the identified risks appropriately.
In addition to addressing the matters noted above, the GRC focused on a number of key areas including those set out in the table below.
Internal control and risk management
The GRC reviewed the Group’s risk management framework and system of internal control (other than
internal financial control systems, which covered by the GAC) and the developments affecting them over the course of 2015. In carrying out its review, the GRC received regular business and operational risk assessments, regular reports from the Group Chief Risk Officer and the Group Head of Internal Audit, reports on the annual reviews of the risk control framework of the global businesses which cover all internal controls, half yearly confirmations to the GRC from risk committees of principal subsidiary companies and reports confirming if there have been any material losses, contingencies or uncertainties caused by weaknesses in internal controls. In light of these findings, the GRC assessed the statement of internal controls systems prior to its endorsement by the Board. The Board’s assessment as to the effectiveness of the system can be found on page 275 under the heading ‘Internal Control’.
Ongoing development
Throughout the year, the GRC received presentations on a range of topics, including Volcker Rule governance and briefings on developments in the regulatory environment.
Committee effectiveness
The effectiveness of the GRC was evaluated as part of the overall performance evaluation of the Board.
Principal activities and significant issues considered include:
Key area
| Action taken
| |
The Group Risk Appetite Statement (‘RAS’) and monitoring of the Group risk profile against the RAS |
The GRC reviewed management proposals for revisions to the Group RAS metrics for 2015. Following review, the Committee recommended the Group RAS, which contained a number of refinements including the cost efficiency, common equity tier 1 capital and sovereign exposure ratio, to the Board.
The GRC regularly reviews the Group’s risk profile against the key performance metrics set out in the RAS. It reviewed management’s assessment of risk and provided scrutiny of management’s proposed mitigating actions.
| |
BoE stress test |
The GRC monitored the BoE stress testing exercise and reviewed the results of stress testing prior to submission to the regulator. It received reports over the course of the BoE stress testing exercise and met three times during the year solely to consider stress testing related matters.
Top and emerging risks were reviewed at every GRC meeting and areas identified where management needed to assess vulnerabilities via stress testing.
The GRC oversaw a review of the lessons learned from this stress testing exercise and proposals for enhancing the Group’s stress testing capability. Internal Audit assessed progress on the regulatory stress tests programmes and reported its conclusions and recommendations to the GRC.
| |
Execution risk |
Execution risk is the risk relating to the delivery of the Group strategy and the progress and status of high priority programmes is a standing agenda item for the GRC. Monitoring of this risk and challenging management’s assessment of execution risk and corresponding mitigating actions remain a priority for the GRC.
In addition to the regular reports received and ‘deep-dive reviews’ conducted on specific issues identified, the GRC requested reports from Internal Audit on the themes identified during the course of its work.
| |
Legal and regulatory risks |
The GRC received regular reports on legal and regulatory risks, reviewed management actions to mitigate these risks and considered the potential impact of future developments in this area on the Group. In 2015, these included reports concerning risks related to investigations of HSBC’s Swiss Private Bank by a number of tax administration, regulatory and law enforcement authorities.
| |
IT and data-related risks |
During the year, the GRC considered a number of IT and data-related risks including internet crime and fraud, data management and aggregation, and information security. The GRC reviewed management’s assessment of these risks and management actions to mitigate them.
IT and data-related risks are expected to remain an area of focus for the GRC during the course of 2016.
| |
HSBC HOLDINGS PLC
267 |
Table of Contents
Report of the Directors: Corporate Governance(continued)
Board committees
Geopolitical risk |
The GRC received regular reports on geopolitical risks including the crises in the Middle East, slowdown in mainland China and redenomination risk of Greece exiting the eurozone. Management provided regular updates on the implementation of mitigating actions in response to these matters which included the augmentation of anti-money laundering, sanctions and financial crime compliance controls. The GRC also held a joint meeting with the GAC which focused on areas of mutual interests including entity level controls, operational risk and subsidiary governance.
|
Further information on the identification, management and mitigation of our material risks types, and on our top and emerging risk is provided on pages 105 and 110, respectively.
Financial System Vulnerabilities Committee
I am pleased to present the 2015 report of the Financial System Vulnerabilities Committee (‘FSVC’). The FSVC oversees the implementation by management of policies aimed at mitigating financial crime and system abuse risks which HSBC faces in the execution of its strategy. In doing so, it provides thought leadership, governance, oversight and policy guidance over the framework of controls and procedures which has been designed to address these risks to which HSBC and the financial system more broadly, may be exposed.
In 2015, the FSVC continued to focus on the controls and procedures which underpin Global Standards and mitigate our financial crime risks. The interactions with the Monitor1 have been a key part of the FSVC’s agenda as the Committee continues to oversee the compliance-related initiatives being implemented by the Group to address its obligations under its Deferred Prosecution Agreement (‘US DPA’), and the Monitor and his team have attended a number of FSVC meetings during the course of the year. These meetings have also included private meetings with the non-executive members of the FSVC. Other areas of focus have included oversight of HSBC’s cyber security framework and monitoring significant developments in the information security environment and the sanctions control framework in the light of heightened geopolitical risk. During 2015, the FSVC has taken a more holistic approach to identifying potential financial crime compliance (‘FCC’) issues. The heads of business units and country heads have routinely been invited to meetings to provide insights on the implementation of Global Standards and key FCC issues for their areas.
In 2016, the FSVC will continue to focus on Global Standards and Financial Crime Compliance (FCC) through the monitoring and tracking of the FCC plan and engaging with the Monitor to ensure his recommendations are acted on. The Committee will continue its programme of reporting by country heads on FCC. The FSVC will also retain its focus on FCC controls in the Private Bank.
Cyber security will remain a key area of focus for the Committee.
During the course of the year we welcomed Nehchal Sandhu as an additional adviser member to the Committee. Nehchal brings extensive experience in leading the national cyber security strategy and architecture in India and advising senior government officials on national security matters. I should like to thank Sir Simon Robertson, who resigned from the Committee at the conclusion of the 2015 Annual General Meeting, and Rona Fairhead, who steps down as a member of the Committee at the conclusion of the 2016 Annual General Meeting, for their contributions to the work of the Committee.
Lord Evans of WeardaleChairman Financial System Vulnerabilities Committee 22 February 2016
1See page 116 for further details on the Monitor. |
Members
Lord Evans of Weardale (Chairman)
Kathleen Casey
Rona Fairhead
Nick Fishwick, CMG1
Dave Hartnett, CB1
William Hughes, CBE QPM1
Nehchal Sandhu1
Leonard Schrank1
The Honourable Juan Zarate1
1Adviser members
Six adviser members have been appointed to the Committee to support its work and between them have extensive experience in geopolitical risk, financial crime risk, international security, cyber security and law enforcement matters.
Role and responsibilities
The role and responsibilities of the FSVC are set out in its terms of reference. The terms of reference can be found on our website at www.hsbc.com/about-hsbc/corporate-governance/board-committees.
The key areas of responsibility for the FSVC include:
| • | governance, oversight and policy guidance over the framework of controls and procedures designed to identify areas where HSBC and the financial system more broadly may become exposed to financial crime or system abuse; |
| • | oversight of matters relating to anti-money laundering, sanctions, terrorist financing and proliferation financing, including the establishment, implementation, maintenance and review of adequate policies and procedures sufficient to ensure the continuing obligations to regulatory and law enforcement agencies are met and oversight of implementation of the actions necessary to build assurance in these areas; |
| • | provision of advice as applicable on the implementation of the Global Standards programme; |
| • | oversight of matters relating to HSBC’s information security environment and cyber security framework; and |
| • | providing a forward-looking perspective to the Board on financial crime risk. |
In 2016, the FSVC will assume responsibility for oversight of controls relating to anti-bribery and corruption.
During 2015, the FSVC held seven meetings. Attendance is set out in the table on page 258.
HSBC HOLDINGS PLC
268 |
Table of Contents
How the FSVC discharged its responsibilities
The FSVC has focused its activity on areas where HSBC and the financial system more broadly may become exposed to financial crime or system abuse, working closely with the GRC which has broader responsibility for risk governance.
The principal activities and significant issues considered by the FSVC are provided in the table below.
Committee effectiveness
The effectiveness of the FSVC was evaluated as part of the overall performance evaluation of the Board.
Principal activities and significant issues considered include:
Key area
| Action taken
| |
Oversight of obligations under the US and UK agreements and updates on HSBC’s interactions with the Monitor |
The FSVC has monitored developments between HSBC and the US regulators. Interactions with the Monitor have been a key part of the Committee’s agenda, including oversight of HSBC’s response to the Monitor’s work programme and management’s action to embed Global Standards. The FSVC received regular reports from the Monitor and his team on reviews undertaken and the results of the Monitor’s First Annual Follow-up Review Report, agreeing recommendations and actions in response to this report.
| |
Financial crime compliance and related issues |
The FSVC oversaw the anti-money laundering and compliance-related initiatives being implemented by the Group to address obligations under the US DPA and related agreements, including forward-looking risks to HSBC and the financial system more widely, de-risking activities in relation to correspondent banking, and anti-money laundering risks associated with affiliates.
| |
Compliance resourcing |
The FSVC reviewed and discussed reports from Compliance in relation to resourcing. A particular area of focus was on recruitment activities, resourcing levels and people development. The ability of the Compliance function to attract and retain talent has and will continue to be a key area of focus for the Committee.
| |
Sanctions |
The Group has in place a Global Sanctions Policy. The FSVC receives updates on both sanctions-related matters and compliance with the Group’s sanctions programme.
| |
Technology and data systems |
The FSVC received reports on implementation of the FCC IT strategy. A progress tracker providing an update on the information security risk framework was routinely monitored by the FSVC throughout the year, with particular focus on cyber security and the Group’s information security risk framework.
| |
Reporting |
The FSVC provides a quarterly report to the Board on its activities and updates the Group Risk Committee and the Remuneration Committee on specified matters for its consideration as appropriate and reports to the Core and Global College of Regulators on key activities undertaken.
| |
Global Standards |
The FSVC received reports from management including heads of business units and from Internal Audit concerning implementation of the Global Standards programme.
| |
Cyber/Information security |
The FSVC continued its focus on cyber and information security matters. It received reports from representatives in the first and second lines of defence on developments in HSBC’s information security environment and monitored the proactive steps to address emerging risks. The Committee also oversaw the progress of the projects to improve HSBC’s cyber security framework and cyber incident response preparedness.
| |
Reports from adviser members |
The Committee received updates from the Committee’s adviser members on the activities they have each undertaken in their role as advisers to HSBC Holdings plc with specific focus on geopolitical risk, emerging financial crime and information security issues.
| |
HSBC HOLDINGS PLC
269 |
Table of Contents
Report of the Directors: Corporate Governance(continued)
Board committees
Members1
Sam Laidlaw (Chairman)
John Lipsky
Pauline van der Meer Mohr (from 1 January 2016)
Sir Simon Robertson1
Paul Walsh (from 1 January 2016)
| 1 | Sir Simon Robertson will be retiring from the Board at the April 2016 Annual General Meeting. |
Role and responsibilities
The role and responsibilities of the Group Remuneration Committee are set out in its terms of reference. The terms of reference can be found on our website at www.hsbc.com/about-hsbc/corporate-governance/board-committees.
The Committee is responsible for setting the over-arching principles, parameters and governance framework of the Group’s remuneration policy and the remuneration of executive Directors and other senior Group employees. The Committee regularly reviews the effectiveness of the remuneration policy of the Company and its subsidiaries in the context of consistent and effective risk management. No Directors are involved in deciding their own remuneration.
Further details on the remuneration arrangements for Directors may be found in the Directors’ Remuneration Report on pages 285 to 321.
During 2015, the Group Remuneration Committee held 10 meetings. Attendance is set out in the table on page 258.
Committee effectiveness
The effectiveness of the Group Remuneration Committee was evaluated as part of the overall performance evaluation of the Board. More information can be found under the Performance Evaluation section on page 260.
I am pleased to present the 2015 report of the Nomination Committee. During 2015, HSBC appointed two new independent non-executive Directors, Irene Lee and Pauline van der Meer Mohr. The appointments of Paul Walsh and Henri de Castries as two further independent non-executive Directors were announced in 2015. Paul Walsh joined the Board on 1 January 2016 and we look forward to welcoming Henri de Castries on 1 March 2016. As I outline overleaf, these appointments bring substantial additional strength to the Board and have further broadened its existing expertise and experience.
The Committee continually seeks to ensure that the Board’s composition is aligned to the Group’s strategic priorities. A matrix of Directors’ skills and experience, also reflecting the diversity of the Board’s composition, including gender, is regularly reviewed by the Committee and is central to the succession planning process for non-executive Director appointments. HSBC has been active in promoting gender diversity, such that women currently make up 33% of the Board although the Committee will continue to focus on initiatives towards achieving a greater gender balance, both at Board level and below.
The Committee has also conducted an annual review of the Group’s executive succession plan. This aspect of the Committee’s succession planning responsibilities has become an increasingly important area for both management and the Committee, reflecting the people risk to which a group of HSBC’s size and scale is exposed.
During the year, membership of the Board’s committees has been refreshed to ensure that there are clear linkages between them. The work of each committee is reported to the Board by the respective committee chair and cross-committee membership of non-executive directors helps to ensure a more cohesive governance structure.
During the course of the year we welcomed Rachel Lomax onto the Committee. I should like to thank Sir Simon Robertson, who stepped down as its Chairman at the conclusion of the 2015 AGM for his contribution to the Committee and who, together with Rona Fairhead, leaves the Board at the conclusion of the 2016 AGM. Their wisdom and counsel will be much missed.
Sam LaidlawChairman Nomination Committee 22 February 2016
|
Members
Sam Laidlaw (Chairman)
Laura Cha
Rona Fairhead
John Lipsky
Rachel Lomax
Role and responsibilities
The role and responsibilities of the Nomination Committee are set out in its terms of reference, which can be found on our website at www.hsbc.com/about-hsbc/corporate-governance/board-committees.
The Nomination Committee has non-executive responsibility for leading the process for Board appointments and for identifying and nominating, for approval by the Board, candidates for appointment to the Board. The Committee is responsible for succession planning for both executive and non-executive directors and membership of Board
HSBC HOLDINGS PLC
270 |
Table of Contents
committees. The Committee regularly reviews the structure, size and composition of the Board including the balance of skills, knowledge, experience and diversity.
Governance
During 2015, the Nomination Committee held five meetings. Attendance is set out in the table on page 258.
The Chairman reports matters of significance to the Board after each meeting.
Committee effectiveness
The effectiveness of the Nomination Committee was evaluated as part of the overall performance evaluation of the Board.
Principal activities and significant issues considered
| Action taken | |
Appointments of new |
Following an external and rigorous selection process, the Committee recommended to the Board the appointment of four non-executive Directors during 2015: Irene Lee and Pauline van der Meer Mohr, who joined the Board on 1 July and 1 September, respectively, Paul Walsh, who joined the Board on 1 January 2016, and Henri de Castries, who joins the Board on 1 March 2016.
An external search consultancy, MWM Consulting, is used in relation to the appointment of non-executive Directors. MWM Consulting has no additional connection with HSBC other than as search consultant for certain senior executive hires.
The Committee recommended Irene Lee for appointment to the Board because of her extensive experience in financial services, and her leadership roles in a number of Asian businesses. Pauline van der Meer Mohr was recommended by the Committee due to her leadership experience in human resources and legal affairs, together with her regulatory experience. Paul Walsh brings to the Board strategic and commercial insight and experience from running multiple global consumer businesses.
Henri de Castries brings broad international experience, running one of the world’s largest insurance companies and a deep understanding of the financial services industry and regulation.
| |
Forward planning |
The Nomination Committee takes into account the needs and development of the Group’s businesses and the expected retirement dates of current Directors when considering candidates to join the Board, ensuring that skills, experience and diversity requirements are satisfied as far as possible.
| |
Board and Committee |
The Nomination Committee routinely monitors the size, structure and composition of the Board including the skills, knowledge, experience, diversity and independence of its non-executive Directors.
The Committee recommended to the Board that all Directors should stand for election or re-election at the 2016 AGM, with the exception of Rona Fairhead and Simon Robertson whose retirement was announced during the year. Safra Catz, after eight years of dedicated service as a non-executive Director, elected to retire at the end of 2015. A number of changes were made to the composition of Committees during the year to reflect tenure of service and the appointment of new non-executive Directors to the Board.
| |
Regulatory and policy |
The Nomination Committee monitors HSBC’s policies and regulatory developments in relation to Board composition. Additionally, during 2015 the Committee considered the corporate governance arrangements for the UK Ring-Fenced Bank, reviewed the Board’s diversity policy and the outcomes of the Board effectiveness review of its principal subsidiaries.
| |
Diversity |
The Nomination Committee believes that one of its important duties is to ensure that there is a proper balance on the Board to reflect diversity and the geographical nature of its business. Appointments to the Board are made on merit and candidates are considered against objective criteria, having due regard to the benefits of diversity on the Board. The Board diversity policy is available at
The Nomination Committee regularly monitors the implementation of the Board’s diversity policy using the following measurable objectives: only external search consultants who are signatories to the Executive Search Firms Voluntary Code of Conduct should be engaged by the Nomination Committee; and at least 30% of candidates, proposed by search firms for consideration as non-executive Directors, should be women. We comply with these requirements and, as at the conclusion of the 2016 AGM, 33% of the Board will be female.
| |
Director training and |
The Nomination Committee reviews and monitors the training and continuous professional development of Directors and senior management.
| |
Time commitment and | The Nomination Committee assessed the independence of, and time required from, non-executive Directors, and is satisfied that all non-executive Directors have the time to fulfil their fiduciary responsibilities to provide oversight of the business of the Group and serve on the relevant committees of the Board. All Directors are asked to identify any other significant commitments they may have and confirm they have sufficient time to discharge what is expected of them as members of the Board.
| |
HSBC HOLDINGS PLC
271 |
Table of Contents
Report of the Directors: Corporate Governance(continued)
Board committees
I am pleased to present the 2015 report of the Conduct & Values Committee (‘CVC’). The CVC has non-executive responsibility for overseeing the Group’s continuing efforts to raise standards in the way it conducts business, consistent with HSBC’s values.
In this, the second year of its operation, the Committee has focused particularly on the implementation of the Group’s global programme for ensuring that it delivers fair outcomes for customers and upholds market integrity, as the basis for the long-term success of its business.
This has involved a thorough review of Group policies, processes and procedures to assess how far they meet the required standards and, where necessary, to implement remedial action. A key challenge has been to develop measures that will enable management to identify and resolve emerging conduct issues in a timely way. The CVC is monitoring progress in developing useful management information in each of the global businesses and across the different geographies.
The Committee recognises that the success of any programme of cultural change depends critically on how people are recruited, trained, incentivised and led. It is taking a close interest in the many initiatives that are being developed to ensure that the Group sends consistent messages to employees about what is expected of them, equips them to do their jobs in the right way, and rewards and penalises them appropriately.
It is particularly important to foster a culture in which people are empowered to speak up if they become aware of problems.
During 2015 the CVC has overseen a significant improvement in the Group’s whistleblowing arrangements. HSBC Confidential, launched in August, provides simplified access to whistleblowing channels which will enable more timely and consistent reporting of cases.
Looking ahead, the CVC will remain focused on how the Group’s conduct approach is being implemented. It will pay particular attention to how effectively global programmes are being cascaded through the organisation, especially in the Group’s key locations, using staff surveys, site visits and internal audits as appropriate.
As part of its remit to ensure that the Group acts responsibly towards the communities within which it operates, the Committee intends to review how effectively the Group seeks to satisfy itself that it is meeting its sustainability commitments.
I should like to take this opportunity to thank all Committee members and management for their contributions during the year. Heidi Miller stepped down from the Committee on 31 December and Pauline van der Meer Mohr joined with effect from 1 January: my warm thanks to Heidi for her lively participation in the Committee’s work, and a hearty welcome to Pauline.
Rachel Lomax Chairman, Conduct & Values Committee 22 February 2016
|
Members
Rachel Lomax (Chairman)
Laura Cha
Lord Evans of Weardale
Heidi Miller (until 31 December 2015)
Jonathan Symonds
Pauline van der Meer Mohr (from 1 January 2016)
Role and responsibilities
The role and responsibilities of the CVC are set out in its terms of reference which can be found on our website at www.hsbc.com/about-hsbc/corporate-governance/board-committees.
The CVC is responsible for:
| • | policies, procedures and standards to ensure that the Group conducts business responsibly and consistently adheres to HSBC Values. It aims to align its work to HSBC’s purpose of connecting customers to opportunities, enabling businesses to thrive and economies to prosper, and ultimately helping people to fulfil their hopes and realise their ambitions; and |
| • | ensuring that in the conduct of its business, the Group treats customers fairly and openly, does business with the right clients and in the right way, is a responsible employer, acts responsibly towards the communities in which it operates and treats other stakeholders fairly. |
The CVC oversees the promotion and embedding by management of HSBC Values and its required global conduct outcomes. The CVC also provides inputs, as appropriate, to the Group Remuneration Committee on the alignment of remuneration with conduct.
In 2016, the CVC will relinquish, and the Financial System Vulnerabilities Committee will assume, responsibility for oversight of controls relating to anti-bribery and corruption.
Governance
During 2015, the CVC held five meetings. Attendance is set out in the table on page 258.
The Chairman reports matters of significance to the Board after each meeting and the minutes of the meetings are made available to all Board members.
How the CVC discharged its responsibilities
During the course of 2015 the CVC received regular reports and presentations from global business and functional heads.
The chief executives of the global businesses provide regular reports to the CVC, including an analysis of customer complaint trends, at each meeting. The CVC also receives reports on whistleblowing cases, the outcomes of internal audits and initiatives to embed values-based leadership as part of the Group’s ongoing cultural transformation.
Committee effectiveness
The effectiveness of the CVC was evaluated as part of the overall performance evaluation of the Board.
HSBC HOLDINGS PLC
272 |
Table of Contents
Principal activities and significant issues considered
| Action taken | |
Global approach to conduct |
The CVC received reports from the Global Head of Regulatory Compliance on how the Group approach to conduct is being managed to deliver the required conduct outcomes. Each global business is requested to present plans to close out any gaps identified against the required outcomes and progress on implementation of key conduct-related programmes. These plans provide improved training and development of staff. Each Global Business produced conduct-related management information during 2015. It is now used at management level by each business to track any conduct-related issues.
| |
Values |
The CVC oversees the promotion and embedding of HSBC Values. The CVC reviewed with management various values and culture initiatives and contributed to action plans. It focused on the embedding of conduct-related training and the development of a new Group-wide code of conduct, and reviewed options to create an HSBC University. It is also working closely with management to define a comprehensive but pragmatic framework that lays out in practical, concrete language the do’s and don’ts of desirable behaviour at HSBC.
| |
Sustainability |
The CVC led a project to put in place a simple, considered statement on the Group’s policy with respect to human rights. This was approved in July 2015. It can be found at www.hsbc.com/citizenship/our-values.
The CVC has also held discussions with management regarding the developments, potential changes and future agenda of sustainability as an area of focus for HSBC. This will continue into 2016.
| |
Whistleblowing |
The CVC has responsibility for the governance of the Group’s whistleblowing policies and procedures, including the protection of whistleblowers. The CVC oversaw the successful launch of a new global channel to enable employees to raise concerns when they are not comfortable with their normal routes of escalation. This workstream also produced centralised reporting of whistleblowing cases and standardisation of reporting and tracking of investigation and consequences.
| |
Employee engagement | The CVC monitored employee engagement across the Group and received the results of the Group People Survey conducted during 2015. Areas requiring attention were highlighted and the Committee requested that management provide regular updates on plans to address these.
| |
HSBC HOLDINGS PLC
273 |
Table of Contents
Report of the Directors: Corporate Governance(continued)
Board committees
Philanthropic & Community Investment Oversight Committee
I am pleased to present the first report of the Philanthropic & Community Investment Oversight Committee (‘PCIOC’) which was established in December 2014. The PCIOC is expected to oversee the Group’s philanthropic and community investment activities on behalf of the Board and to provide greater visibility and oversight of the Group’s corporate sustainability objectives.
As highlighted in the table of principal activities below, the PCIOC has mainly focused on ensuring that the procedures and processes around the approval of charitable donations are appropriate and has endorsed the community investment budget for 2016.
I have chaired the PCIOC since its establishment, with Lord Evans of Weardale as the other non-executive Director member. In addition, the committee has non-Director members, each of whom brings valuable and relevant philanthropic and community-focused experience to the committee: Sir Malcolm Grant, who is the Chairman of NHS England and former President and Provost of University College London, and Stephen Moss, who is Group Head of Strategy & Planning.
In 2016, the Committee will additionally benefit from the membership of Lord Robin Janvrin, former Private Secretary to Queen Elizabeth II and chairman of trustees of The Royal Foundation of The Duke and Duchess of Cambridge and Prince Harry.
Laura ChaChairman Philanthropic & Community Investment Oversight Committee 22 February 2016
|
Members
Laura Cha (Chairman)
Lord Evans of Weardale
Sir Malcolm Grant(non-Director member)
Stephen Moss(non-Director member)
Lord Janvrin (non-Director member)
Role and responsibilities
The role and responsibilities of the PCIOC are set out in its terms of reference. The terms of reference can be found on our website at www.hsbc.com/about-hsbc/corporate-governance/board-committees.
The PCIOC oversees philanthropic and community investment initiatives, including both monetary donations and employee volunteering activities and reports thereon to the Board semi-annually.
How the PCIOC discharged its responsibilities
During the course of 2015, the PCIOC received regular reports and presentations from the Global Head of Marketing and the Head of Group Corporate Sustainability.
Principal activities and significant issues considered
| Action taken | |
Governance of |
Given that the PCIOC was newly established in 2015, it has been keen to fully understand the Group’s community investment policy and how decisions are made, how charities are vetted, the avoidance of conflicts of interest, the recording and reporting of donations made by the Group and the assurance process following up on these decisions.
| |
Community | The PCIOC received reports from the Global Sustainability function regarding the annual community investment budget and how it is decided, and endorsed the 2016 budget put forward by management. As a result of the 150th Anniversary Fund, the Group’s community Investment budget has been increased by $50m a year from 2015-2017.
| |
Governance
The PCIOC was established at the end of 2014 and held three meetings during the year. Attendance is set out in the table on page 258.
The Chairman reports on matters of significance to the Board after each meeting and the minutes of the meetings are made available to all Board members.
The Chairman’s Committee has the power to act on behalf of the Board between scheduled Board meetings to facilitate ad hoc business requiring Board approval. The Committee meets with such frequency and at such times as it may determine, the quorum for meetings is dependent upon the nature of the business to be transacted, as set out in its terms of reference.
HSBC HOLDINGS PLC
274 |
Table of Contents
The Board is responsible for maintaining and reviewing the effectiveness of risk management and internal control systems and for determining the aggregate level and types of risks it is willing to take in achieving its strategic objectives.
Procedures
To meet this requirement and to discharge its obligations under the FCA Handbook and PRA Handbook, procedures have been designed for safeguarding assets against unauthorised use or disposal; for maintaining proper accounting records; and for ensuring the reliability and usefulness of financial information used within the business or for publication.
These procedures can only provide reasonable but not absolute assurance against material mis-statement, errors, losses or fraud. They are designed to provide effective internal control within HSBC and accord with the Financial Reporting Council’s guidance for directors issued in 2014, internal control and related financial and business reporting. Our procedures have been in place throughout the year and up to 22 February 2016, the date of approval of theAnnual Report and Accounts 2015.
In 2014, the GAC endorsed the adoption of the COSO 2013 framework for the monitoring of risk management and internal control systems to satisfy the requirements of Section 404 of the Sarbanes-Oxley Act of 2002. Additionally, the risk management framework enabled the GRC to monitor controls over principal risks to meet the requirements of the UK Corporate Governance Code and the Hong Kong Corporate Governance Code.
HSBC’s key risk management and internal control procedures include the following:
| • | Group Standards. The Global Standards Manual (‘GSM’) brings together the common standards and principles used in the conduct of all business, whatever its location or nature. The GSM overlays all other manuals throughout the Group and is a fundamental component of the Group’s risk management structure. It establishes the high level standards and policies by which, and within which, all members of the Group conduct their businesses. The GSM is mandatory and applies to, and must be observed by, all businesses within the Group, regardless of the nature or location of their activities. |
| • | Delegation of authority within limits set by the Board. Subject to certain matters reserved for the Board, the Group Chief Executive has been delegated authority limits and powers within which to manage the day-to-day affairs of the Group, including the right to sub-delegate those limits and powers. Each relevant Group Managing Director or Group Executive Director has delegated authority within which to manage the day-to-day affairs of the business or function for which he or she is accountable. Delegation of authority from the Board requires those individuals to maintain a clear and appropriate apportionment of significant responsibilities and to oversee the establishment and maintenance of systems of control that are appropriate to their business |
or function. Appointments to the most senior positions within HSBC require the approval of the Board. |
| • | Risk identification and monitoring.Systems and procedures are in place to identify, control and report on the material risk types facing HSBC as set out below: |
| – | wholesale credit risk; |
| – | retail credit risk; |
| – | insurance risk; |
| – | asset, liability and capital management risk; |
| – | market risk; |
| – | financial management risk; |
| – | model risk; |
| – | reputational risk; |
| – | pension risk; |
| – | strategic risk; |
| – | sustainability risk; and |
| – | operational risk (including accounting, tax, legal, regulatory compliance, financial crime compliance, fiduciary, political, physical, internal, external, contingency, information security, systems, operations, project and people risks). |
Exposure to these risks is monitored by risk management committees, asset, liability and capital management committees and executive committees in subsidiaries and, for the Group, in Risk Management Meetings of the GMB (‘RMM’) which are chaired by the Group Chief Risk Officer. The RMM meets regularly to discuss enterprise-wide risk management matters. Asset, liability and capital management matters are monitored by the Group ALCO, which reports to the RMM.
HSBC’s operational risk profile and the effective implementation of the Group’s operational risk management framework are monitored by the Global Operational Risk Committee, which reports to the RMM.
Model risks are monitored by the Model Oversight Committee which also reports to the RMM.
| • | Changes in market conditions/practices. Processes are in place to identify new risks arising from changes in market conditions/practices or customer behaviours, which could expose HSBC to heightened risk of loss or reputational damage. The Group employs a top and emerging risks framework at all levels of the organisation, which enables it to identify current and forward-looking risks and to take action which either prevents them materialising or limits their impact. During 2015, attention was focused on: |
| – | economic outlook and capital flows; |
| – | geopolitical risk; |
| – | turning of the credit cycle; |
| – | regulatory developments affecting the business model and profitability; |
| – | regulatory commitments and consent orders; |
HSBC HOLDINGS PLC
275 |
Table of Contents
Report of the Directors: Corporate Governance(continued)
Internal control / Going concern and viability
| – | regulatory focus on conduct of business and financial crime; |
| – | dispute risk; |
| – | people risk; |
| – | execution risk; |
| – | third-party risk management; |
| – | model risk; |
| – | cyber threat and unauthorised access to systems; and |
| – | data management. |
| • | Strategic plans. Strategic plans are prepared for global businesses, global functions and geographical regions within the framework of the Group’s overall strategy. Annual Operating Plans, informed by detailed analysis of risk appetite describing the types and quantum of risk that the Group is prepared to take in executing its strategy, are prepared and adopted by all major HSBC operating companies and set out the key business initiatives and the likely financial effects of those initiatives. |
| • | Disclosure Committee. The Disclosure Committee reviews material public disclosures made by HSBC Holdings for any material errors, misstatements or omissions. The membership of the Disclosure Committee, which is chaired by the Group Company Secretary, includes the heads of Finance, Legal, Risk, Communications and Investor Relations. The integrity of disclosures is underpinned by structures and processes within the Global Finance and Global Risk functions that support expert and rigorous analytical review of financial reporting complemented by certified reviews by heads of global businesses, global functions and certain legal entities. |
| • | Financial reporting. The Group’s financial reporting process for preparing the consolidatedAnnual Report and Accounts 2015 is controlled using documented accounting policies and reporting formats, supported by a chart of accounts with detailed instructions and guidance on reporting requirements, issued by Group Finance to all reporting entities within HSBC in advance of each reporting period end. The submission of financial information from each reporting entity to Group Finance is subject to certification by the responsible financial officer, and analytical review procedures at reporting entity and Group levels. |
| • | Responsibility for risk management.Management are primarily accountable for measuring, monitoring, mitigating and managing the risks and controls in their areas of responsibility. Processes are in place to ensure weaknesses are escalated to senior management and addressed, supported by the three lines of defence model. |
| • | IT operations. Centralised control is exercised over all IT developments and operations. Common systems are employed for similar business processes wherever practicable. |
| • | Global function management. Management of the global functions are responsible for setting policies, procedures and standards to control the principal risks detailed under ‘Risk identification and monitoring’ above. |
Authorities to enter into credit and market risk exposures are delegated with limits to line management of Group companies. The concurrence of the appropriate global function is required, however, to credit proposals with specified higher risk characteristics. Credit and market risks are measured and reported at subsidiary company level and aggregated for risk concentration analysis on a Group-wide basis.
| • | Internal Audit. The establishment and maintenance of appropriate systems of risk management and internal control is the responsibility of business management. The Global Internal Audit function, which is centrally controlled, provides independent and objective assurance in respect of the adequacy of the design and operating effectiveness of the Group’s framework of risk management, control and governance processes across the Group, focusing on the areas of greatest risk to HSBC using a risk-based approach. The Group Head of Internal Audit reports to the Chairman of the GAC and administratively to the Group Chief Executive. Executive management is responsible for ensuring that issues raised by the Global Internal Audit function are addressed within an appropriate and agreed timetable. Confirmation to this effect must be provided to Global Internal Audit. |
Role of Board Committees
On behalf of the Board, the GAC has responsibility for overseeing risk management and internal controls over financial reporting and the GRC has responsibility for overseeing risk management and internal controls, other than over financial reporting.
During the year, the GRC and the GAC have kept under review the effectiveness of this system of internal control and have reported regularly to the Board. In carrying out their reviews, the GRC and the GAC received:
| • | regular business and operational risk assessments; |
| • | regular reports from the Group Chief Risk Officer and the Group Head of Internal Audit; |
| • | reports on the annual reviews of the risk control framework of HSBC Holdings which cover all internal controls, both financial andnon-financial; |
| • | half yearly confirmations to the GAC and GRC from audit and risk committees of principal subsidiary companies regarding, in relation to audit committees, whether their financial statements have been prepared in accordance with Group policies, present fairly the state of affairs of the relevant principal subsidiary and are prepared on a going concern basis; |
| • | reports confirming if there have been any material losses, contingencies or uncertainties caused by weaknesses in internal controls; |
| • | internal audit reports; |
HSBC HOLDINGS PLC
276 |
Table of Contents
| • | external audit reports; |
| • | prudential reviews; and |
| • | regulatory reports. |
The GRC and GAC have separately established governance frameworks for their respective oversight and interaction with the audit and risk committees of key entities within the Group. These provide for regular reporting, issues escalation and processes for the nomination and endorsement of subsidiary committee appointments. These principles and processes have in turn been cascaded by these key entities to their respective subsidiaries to provide clear vertical channels of governance.
The internal control responsibilities of the GAC and GRC are complemented by the activities of the Conduct & Values Committee (‘CVC’) and the Financial System Vulnerabilities Committee (‘FSVC’) which, respectively, oversee internal controls over conduct-related matters and financial crime compliance. The GRC receives regular reports at each of its meetings on the activities of both the CVC and the FSVC. The GRC monitors the status of top and emerging risks and considers whether the mitigating actions put in place are appropriate. In addition, when unexpected losses have arisen or when incidents have occurred which indicate gaps in the control framework or in adherence to Group policies, the GRC and the GAC review special reports, prepared at the instigation of management, which analyse the cause of the issue, the lessons learned and the actions proposed by management to address the issue.
Effectiveness of internal controls
The Directors, through the GRC and the GAC, have conducted an annual review of the effectiveness of our system of risk management and internal control covering all material controls, including financial, operational and compliance controls, risk management systems, the adequacy of resources, qualifications and experience of staff of the accounting and financial reporting teams and the Global Risk function, and their training programmes and budget. The annual review of effectiveness of our system of risk management and internal control over financial reporting was conducted with reference to the COSO framework. The annual review of other controls was undertaken using the risk management framework on pages 102 to 103.
The GRC and the GAC have received confirmation that executive management has taken or is taking the necessary actions to remedy any failings or weaknesses identified through the operation of our framework of controls. In particular, during the year it was determined that the control environment associated with IT privileged access required significant improvement. Deficiencies were noted in the design and operation of controls for the granting, release and monitoring of privileged access in a number of systems. For the identified deficiencies management responded by implementing a programme to determine the scale and nature of the deficiencies, remediate identified control deficiencies and determine if privileged access had been misused during 2015. Management also identified and assessed the effectiveness of relevant IT, business, monitoring and period-end mitigating controls.
The financial statements are prepared on a going concern basis, as the Directors are satisfied that the Group and Parent Company have the resources to continue in business for the foreseeable future.
In making the going concern assessment, the Directors have considered a wide range of information relating to present and future conditions, including future projections of profitability, cash flows, capital requirements and capital resources.
Information relevant to the assessment of going concern can be found in the following sections:
| • | HSBC’s principal activities, business and operating models, strategic direction and top and emerging risks are described in the ‘Strategic Report’; |
| • | a financial summary, including a review of the consolidated income statement and the consolidated balance sheet, is provided in the ‘Financial Review’; |
| • | HSBC’s objectives, policies and processes for managing credit, liquidity and market risk are described under ‘Risk’; and |
| • | the capital position of the Group, regulatory developments, and the approach to management and allocation of capital are set out in the ‘Capital’ section. |
HSBC HOLDINGS PLC
277 |
Table of Contents
Report of the Directors: Corporate Governance(continued)
Going concern and viability / Employees
At 31 December 2015 we had a total workforce of 264,000 full-time and part-time employees compared with 266,000 at the end of 2014 and 263,000 at the end of 2013.
Our main centres of employment were the UK with approximately 47,000 employees, India 33,000, Hong Kong 30,000, mainland China 22,000, Brazil 21,000, Mexico 16,000, the US 14,000 and France 9,000.
Employees performing at their best and the environment we create to make that possible are critical. We encourage employees to speak up, and reflect our purpose and values in the decisions we make and how we make them, as these decisions shape the future of our customers and colleagues.
We consult with and, where appropriate, negotiate with employee representative bodies. It is our policy to maintain well-developed communications and consultation programmes with all employee representative bodies and there have been no material disruptions to our operations from labour disputes during the past five years.
HSBC is committed to building a culture where all employees are valued and respected and where their opinions count. We remain committed to meritocracy, which requires a diverse and inclusive culture where employees believe that their views are heard, their concerns are attended to and they work in an environment where bias, discrimination and harassment on any matter, including gender, age, ethnicity, religion, sexual orientation and disability, are not tolerated and where advancement is based on objective criteria. An inclusive culture helps us respond to our diverse customer base, while developing and retaining a secure supply of skilled, committed employees. Our culture will be strengthened by employing the best people and optimising their ideas, abilities and differences.
Oversight of our diversity and inclusion agenda and related activities resides with the Global Diversity and Inclusion sub-function.
The development of our employees is essential to the future strength of our business. We continue to develop and implement practices that build employee capability, and identify, develop and deploy talented employees to ensure an appropriate supply of high calibre individuals with the values, skills and experience for current and future senior management positions.
In 2015, we focused on developing technical skills, experiences and behaviours necessary to deliver against our Global Standards commitments, along with several Group-wide programmes on individual leadership, team management and on-boarding employees into HSBC.
Employment of disabled persons
We believe in providing equal opportunities for all employees. The employment of disabled persons is included in this commitment and the recruitment, training, career development and promotion of disabled persons is based on the aptitudes and abilities of the individual. Should employees become disabled during their employment with us, efforts are made to continue their employment and, if necessary, appropriate training and reasonable equipment and facilities are provided.
HSBC is committed to providing a safe and healthy environment for our employees, customers and visitors. We aim always to meet the minimum health and safety standards required by law wherever we operate and, where reasonably practical, to exceed them.
HSBC HOLDINGS PLC
278 |
Table of Contents
Everyone at HSBC has a responsibility for helping to create a safe working environment. Employees are expected to take ownership of their safety and are encouraged and empowered to report any concerns.
Corporate Real Estate has overall responsibility for setting global health and safety policies and standards. Achieving these policies and standards is the responsibility of each country’s Chief Operating Officer. A global programme in 2015 involved the review of 1,850 premises in high and medium risk earthquake zones resulting in training and awareness for staff and the development of risk reduction programmes.
In terms of physical and geopolitical risk, Global Security and Fraud Risk provides regular security risk assessments to assist management in judging the level of terrorist and violent criminal threat. Its regional equivalents conduct biannual security reviews of all critical Group buildings to ensure measures to protect our staff, buildings, assets and information are appropriate to the level of threat. HSBC remains committed to the effective management of health and safety and protecting employees, customers and visitors to HSBC.
Employee health and safety
| 2015 | 2014 | 2013 | ||||||||||||
Number of employee workplace fatalities | – | 2 | 1 | – | ||||||||||
Accidents involving more than three days’ absence | 110 | 96 | 101 | |||||||||||
All accident rate per 100,000 employees | 274 | 388 | 355 | |||||||||||
| 1 | Non-HSBC staff working on HSBC-related activity. |
The quality and commitment of our employees is fundamental to our success and accordingly the Board aims to attract, retain and motivate the very best people. As trust and relationships are vital in our business our goal is to recruit those who are committed to making a long-term career with the Group.
HSBC’s reward strategy supports this objective through balancing both short-term and sustainable performance. Our reward strategy aims to reward success, not failure, and be properly aligned with our risk framework and related outcomes. In order to ensure alignment between remuneration and our business strategy, individual remuneration is determined through assessment of performance delivered against both annual and long-term objectives summarised in performance scorecards, and adherence to the HSBC Values of being ‘open, connected and dependable’ and acting with ‘courageous integrity’. Altogether, performance is judged, not only on what is achieved over the short- and long-term, but also on how it is achieved, as the latter contributes to the sustainability of the Group.
Further information on the Group’s approach to remuneration is given on page 285.
The financial and non-financial measures incorporated in the annual and long-term scorecards are carefully considered to ensure alignment with the long-term strategy of the Group.
Share options and discretionary awards of shares granted under HSBC share plans align the interests of employees with the creation of shareholder value. The tables on the following pages set out the particulars of outstanding options, including those held by employees working under employment contracts that are regarded as ‘continuous contracts’ for the purposes of the Hong Kong Employment Ordinance. The options were granted at nil consideration. No options have been granted to substantial shareholders and suppliers of goods or services, nor in excess of the individual limit for each share plan. No options were cancelled by HSBC during the year.
A summary for each plan of the total number of the options which were granted, exercised or lapsed during 2015 is shown in the following tables. Further details required to be disclosed pursuant to Chapter 17 of the Rules Governing the Listing of Securities on The Stock Exchange of Hong Kong Limited are available on our website at www.hsbc.com/investor-relations/governance/ share-plans and on the website of The Stock Exchange of Hong Kong Limited at www.hkex.com.hk, or can be obtained upon request from the Group Company Secretary, 8 Canada Square, London E14 5HQ. Particulars of options held by Directors of HSBC Holdings are set out on page 314.
Note 6 on the Financial Statements gives details of share-based payments, including discretionary awards of shares granted under HSBC share plans.
All-employee share plans
HSBC operates all-employee share option plans under which options are granted over HSBC ordinary shares. Subject to leaver provisions, options are normally exercisable after three to five years. During 2015, options were granted at the middle market closing price for HSBC Holdings ordinary shares quoted on the London Stock Exchange which, as derived from the Daily Official List on 21 September 2015, the day prior to grant, was £4.95.
The all-employee share option plans will terminate on 23 May 2025 unless the Directors resolve to terminate the plans at an earlier date. There will be no further grants under the HSBC Holdings Savings-Related Share Option Plan: International.
The HSBC International Employee Share Purchase Plan was introduced in 2013 and now includes employees based in 25 jurisdictions.
HSBC HOLDINGS PLC
279 |
Table of Contents
Report of the Directors: Corporate Governance(continued)
Employees / Other disclosures / Annual General Meeting / Appendix to Corporate Governance
HSBC Holdings All-employee Share Option Plans
| �� | HSBC Holdings ordinary shares | |||||||||||||||||||||||||||||||||||||||
| Dates of awards | Exercise price | Exercisable | At | Granted | Exercised | Lapsed | At | |||||||||||||||||||||||||||||||||
| from | to | from | to | from | to | 1 Jan 2015 | during year | during year | during year | 31 Dec 2015 | ||||||||||||||||||||||||||||||
Savings-Related Share Option Plan1 | ||||||||||||||||||||||||||||||||||||||||
29 Apr 2009 | 22 Sep 2015 | (£) 3.3116 |
| (£) 5.4738 |
| | 1 Aug 2014 | | 30 April 2021 | 53,743,955 | 52,629,208 | 12,450,711 | 22,212,633 | 71,709,819 | ||||||||||||||||||||||||||
Savings-Related Share Option Plan: International2 | ||||||||||||||||||||||||||||||||||||||||
29 Apr 2009 | 24 Apr 2012 | (£) 3.3116 |
| (£) 5.4573 |
| | 1 Aug 2014 | | 31 Jan 2018 | 3,714,059 | – | 2,250,853 | 332,215 | 1,130,991 | ||||||||||||||||||||||||||
29 Apr 2009 | 24 Apr 2012 | ($) 4.8876 |
| ($) 8.2094 |
| | 1 Aug 2014 | | 31 Jan 2018 | 1,867,328 | – | 907,523 | 294,360 | 665,445 | ||||||||||||||||||||||||||
29 Apr 2009 | 24 Apr 2012 | (€) 3.6361 |
| (€) 6.0657 |
| | 1 Aug 2014 | | 31 Jan 2018 | 571,502 | – | 376,331 | 41,561 | 153,610 | ||||||||||||||||||||||||||
29 Apr 2009 | 24 Apr 2012 | (HK$) 37.8797 |
| (HK$) 63.9864 |
| | 1 Aug 2014 | | 31 Jan 2018 | 6,468,782 | – | 5,134,394 | 219,558 | 1,114,830 | ||||||||||||||||||||||||||
| 1 | The weighted average closing price of the shares immediately before the dates on which options were exercised was £5.72. |
| 2 | The weighted average closing price of the shares immediately before the dates on which options were exercised was £5.73. |
Discretionary share option plans
There have been no grants of discretionary share options under employee share plans since 30 September 2005.
| HSBC Holdings ordinary shares | ||||||||||||||||||||||||||||
| Dates of awards | Exercise price (£) | Exercisable | At | Exercised | Lapsed | At | ||||||||||||||||||||||
| from | to | 1 Jan 2015 | during year | during year | 31 Dec 2015 | |||||||||||||||||||||||
HSBC Holdings Group Share Option Plan1 | ||||||||||||||||||||||||||||
20 Apr 2005 | 7.2869 | 20 Apr 2008 | 20 Apr 2015 | 6,373,982 | – | 6,373,982 | – | |||||||||||||||||||||
HSBC Share Plan1 | ||||||||||||||||||||||||||||
30 Sep 2005 | 7.9911 | 30 Sep 2008 | 30 Sep 2015 | 86,046 | – | 86,046 | – | |||||||||||||||||||||
| 1 | The HSBC Holdings Group Share Option Plan expired on 26 May 2005 and the HSBC Share Plan expired on 27 May 2011. No options have been granted under the Plans since that date. |
Further information about share capital, Directors’ interests, dividends and shareholders is set out in the Appendix to this section on page 281.
The Annual General Meeting (‘AGM’) will be held at the Queen Elizabeth II Conference Centre, Broad Sanctuary, Westminster, London SW1P 3EE on Friday 22 April 2016 at 11.00am.
An informal meeting of shareholders will be held at 1 Queen’s Road Central, Hong Kong on Monday 18 April 2016 at 4.30pm.
A live webcast of the AGM will be available on www.hsbc.com. A recording of the proceedings will be available shortly after the conclusion of the AGM until 22 May 2016 on www.hsbc.com.
On behalf of the Board

Douglas Flint,Group Chairman
HSBC Holdings plc
Registered number 617987
22 February 2016
HSBC HOLDINGS PLC
280 |
Table of Contents
Appendix to Corporate Governance – Other disclosures
Issued share capital
The nominal value of HSBC Holdings’ issued share capital paid up at 31 December 2015 was $9,842,562,967 divided into 19,685,096,934 ordinary shares of $0.50 each, 1,450,000 non-cumulative preference shares of $0.01 each and1 non-cumulative preference share of £0.01, representing approximately 99.9999%, 0.0001%, and 0%, respectively, of the nominal value of HSBC Holdings’ total issued share capital paid up at 31 December 2015.
Rights and obligations attaching to shares
The rights and obligations attaching to each class of ordinary and non-cumulative preference shares in our share capital are set out in full in our Articles of Association. The Articles of Association may be amended by special resolution of the shareholders and can be found on our website at www.hsbc.com/about-hsbc/corporate-governance/corporate-governance-codes.
Ordinary shares
HSBC Holdings has one class of ordinary share, which carries no right to fixed income. There are no voting restrictions on the issued ordinary shares, all of which are fully paid. On a show of hands, each member present has the right to one vote at general meetings. On a poll, each member present or voting by proxy is entitled to one vote for every $0.50 nominal value of share capital held. There are no specific restrictions on the transfer of ordinary shares which are governed by the general provisions of the Articles of Association and prevailing legislation.
At the 2012 AGM, shareholders gave authority to the Directors to offer a scrip dividend alternative until the earlier of the conclusion of the AGM in 2017 or 24 May 2017. In line with the Investment Association guidelines, shareholders’ approval is being sought at the 2016 AGM to renew this authority for a further three-year period, expiring on the earlier of the conclusion of the AGM in 2019 or 21 April 2019.
Information on the policy adopted by the Board for paying interim dividends on the ordinary shares may be found on page 470, under the heading ‘Shareholder Information’.
Preference shares
The preference shares, which have preferential rights to income and capital, do not, in general, confer a right to attend and vote at general meetings.
There are three classes of preference shares in the share capital of HSBC Holdings; non-cumulative preference shares of $0.01 each (the ‘dollar preference shares’); non-cumulative preference shares of £0.01 each (the ‘sterling preference shares’); and non-cumulative preference shares of€0.01 (the ‘euro preference shares’). The dollar preference shares in issue are Series A dollar preference shares and the sterling preference share in issue is a Series A sterling preference share. There are no euro preference shares in issue.
Information on dividends declared for 2015 and 2016 may be found on page 283, under the heading ‘Dividends and shareholders’ and in Note 9 to the Financial Statements.
Further details of the rights and obligations attaching to the HSBC Holdings’ issued share capital may be found in Note 35 to the Financial Statements.
Share capital changes in 2015
The following events occurred during the year in relation to the ordinary share capital of HSBC Holdings:
Scrip dividends
HSBC Holdings ordinary shares issued | Aggregate nominal value | Market value per share | ||||||||||||||||||||||
| Issued in lieu of | on | number | $ | $ | £ | |||||||||||||||||||
Fourth interim dividend for 2014 | 30 April 2015 | 236,223,184 | 118,111,592 | 8.5121 | 5.6536 | |||||||||||||||||||
First interim dividend for 2015 | 8 July 2015 | 24,351,484 | 12,175,742 | 9.4959 | 6.2020 | |||||||||||||||||||
Second interim dividend for 2015 | 2 October 2015 | 18,425,272 | 9,212,636 | 8.6907 | 5.5464 | |||||||||||||||||||
Third interim dividend for 2015 | 3 December 2015 | 96,956,825 | 48,478,413 | 7.8417 | 5.1270 | |||||||||||||||||||
HSBC HOLDINGS PLC
281 |
Table of Contents
Report of the Directors: Corporate Governance(continued)
Appendix to Corporate Governance
All-employee share plans
| Number | Aggregate nominal value | Exercise price | ||||||||||||||||||||
| $ | from | to | ||||||||||||||||||||
HSBC Holdings savings-related share option plans | ||||||||||||||||||||||
HSBC ordinary shares issued in £ | 14,701,564 | 7,350,782 | £ | 3.3116 | 5.4738 | |||||||||||||||||
HSBC ordinary shares issued in HK$ | 5,134,394 | 2,567,197 | HK$ | 37.8797 | 63.9864 | |||||||||||||||||
HSBC ordinary shares issued in $ | 907,523 | 453,762 | US$ | 4.8876 | 8.2094 | |||||||||||||||||
HSBC ordinary shares issued in€ | 376,331 | 188,166 | € | 3.6361 | 6.0657 | |||||||||||||||||
Options over HSBC ordinary shares lapsed | 23,100,327 | 11,550,164 | ||||||||||||||||||||
Options over HSBC ordinary shares granted in response to approximately 28,000 applications from HSBC employees in the UK on 22 September 2015 | 52,629,208 | |||||||||||||||||||||
HSBC International Employee Share Purchase Plan | 39,763 | 19,882 | £ | 4.8740 | 6.2590 | |||||||||||||||||
Plan d’Epargne | ||||||||||||||||||||||
HSBC ordinary shares issued for the benefit of non-UK resident employees of HSBC France and its subsidiaries | 1,497,450 | 748,725 | € | 7.4221 | ||||||||||||||||||
HSBC share plans
| HSBC Holdings ordinary shares | Aggregate nominal value | Market value per share | ||||||||||||||||
| issued | $ | from (£) | to (£) | |||||||||||||||
Vesting of awards under the HSBC Share Plan and HSBC Share Plan 2011 | 68,608,884 | 34,304,442 | 4.8555 | 6.4110 | ||||||||||||||
Authorities to allot and to purchase shares and pre-emption rights
At the AGM in 2015, shareholders renewed the general authority for the Directors to allot new shares up to 12,823,397,868 ordinary shares, 15,000,000 non-cumulative preference shares of £0.01 each, 15,000,000 non-cumulative preference shares of $0.01 each and 15,000,000 non-cumulative preference shares of €0.01 each. Within this, the Directors have authority to allot up to a maximum of 961,754,840 ordinary shares wholly for cash to persons other than existing shareholders. Shareholders also renewed the authority for the Directors to make market purchases of up to 1,923,509,680 ordinary shares. The Directors have not exercised this authority.
In addition, shareholders gave authority for the Directors to grant rights to subscribe for, or to convert any security into, no more than 3,627,000,000 ordinary shares in relation to any issue by HSBC Holdings or any member of the Group of contingent convertible securities that automatically convert into or are exchanged for ordinary shares in HSBC Holdings in prescribed circumstances. Further details about the issue of contingent convertible securities may be found in Note 35 on the Financial Statements.
Other than as disclosed in the table above headed ‘Share capital changes in 2015’, the Directors did not allot any shares during 2015.
Treasury shares
In accordance with the terms of a waiver granted by the Hong Kong Stock Exchange on 19 December 2005, HSBC Holdings will comply with the applicable law and regulation in the UK in relation to the holding of any shares in treasury and with the conditions of the waiver in connection with any shares it may hold in treasury. Pursuant to Chapter 6 of the UK Companies Act 2006, no shares are currently held in treasury.
Pursuant to the requirements of the UK Listing Rules and according to the register of Directors’ interests maintained by HSBC Holdings pursuant to section 352 of the Securities and Futures Ordinance of Hong Kong, the Directors of HSBC Holdings at 31 December 2015 had interests, all beneficial unless otherwise stated, in the shares or debentures of HSBC Holdings and its associated corporations as tabulated overleaf.
Irene Lee and Pauline van der Meer Mohr did not hold any shares or debentures of HSBC Holdings plc or its associated corporations during the year.
No Directors held any short position as defined in the Securities and Futures Ordinance of Hong Kong in the shares or debentures of HSBC Holdings and its associated corporations. Save as stated above, none of the Directors had an interest in any shares or debentures of HSBC Holdings or any associated corporation at the beginning or at the end of the year, and none of the Directors or their connected persons were awarded or exercised any right to subscribe for any shares or debentures in any HSBC corporation during the year.
HSBC HOLDINGS PLC
282 |
Table of Contents
Directors’ interests – shares and debentures
| At 31 December 2015 | ||||||||||||||||||||||||||
|
| At 1 January 2015 |
|
| Beneficial owner |
|
| Child under 18 or spouse |
| | Jointly with another person | | Trustee |
| Total interests | 1 | |||||||||||
HSBC Holdings ordinary shares | ||||||||||||||||||||||||||
Phillip Ameen3 | – | 5,000 | – | – | – | 5,000 | ||||||||||||||||||||
Kathleen Casey3 | – | 3,540 | – | – | – | 3,540 | ||||||||||||||||||||
Safra Catz3 | 20,045 | 20,970 | – | – | – | 20,970 | ||||||||||||||||||||
Laura Cha | – | 5,200 | – | – | – | 5,200 | ||||||||||||||||||||
Lord Evans of Weardale | 5,519 | 7,416 | – | – | – | 7,416 | ||||||||||||||||||||
Joachim Faber | 24,105 | 45,778 | – | – | – | 45,778 | ||||||||||||||||||||
Rona Fairhead | 76,524 | – | – | 77,888 | – | 77,888 | ||||||||||||||||||||
Douglas Flint | 400,748 | 401,450 | – | – | – | 401,450 | ||||||||||||||||||||
Stuart Gulliver | 2,611,188 | 2,684,380 | 176,885 | – | – | 2,861,265 | ||||||||||||||||||||
Sam Laidlaw | 36,768 | 36,596 | – | – | 1,416 | 2 | 38,012 | |||||||||||||||||||
John Lipsky3 | 15,820 | 16,165 | – | – | – | 16,165 | ||||||||||||||||||||
Rachel Lomax | 15,500 | 18,900 | – | – | – | 18,900 | ||||||||||||||||||||
Iain Mackay | 79,933 | 223,872 | – | – | – | 223,872 | ||||||||||||||||||||
Heidi Miller3 | 3,575 | 3,695 | – | – | – | 3,695 | ||||||||||||||||||||
Marc Moses | 480,423 | 624,643 | – | – | – | 624,643 | ||||||||||||||||||||
Sir Simon Robertson | 22,981 | 34,118 | – | – | – | 34,118 | ||||||||||||||||||||
Jonathan Symonds | 20,553 | 16,886 | 4,885 | – | – | 21,771 | ||||||||||||||||||||
HSBC USA Inc. $2.8575 Cumulative Preferred Shares, Series Z | ||||||||||||||||||||||||||
Phillip Ameen | 31 | – | – | – | – | – | ||||||||||||||||||||
| RMBm | RMBm | RMBm | RMBm | RMBm | RMBm | |||||||||||||||||||||
HSBC Bank 2.875% Notes 2015 | ||||||||||||||||||||||||||
Joachim Faber4 | 5.1 | – | – | – | – | – | ||||||||||||||||||||
| 1 | Executive Directors’ other interests in HSBC Holdings ordinary shares arising from the HSBC Holdings savings-related share option plans and the HSBC Share Plan 2011 are set out in the Scheme interests in the Directors’ Remuneration Report on page 312. At 31 December 2015, the aggregate interests under the Securities and Futures Ordinance of Hong Kong in HSBC Holdings ordinary shares, including interests arising through employee share plans were: Douglas Flint – 404,369; Stuart Gulliver – 5,909,069; Iain Mackay – 1,478,507; and Marc Moses – 2,171,463. Each Director’s total interests represents less than 0.03% of the shares in issue. |
| 2 | Non-beneficial. |
| 3 | Phillip Ameen has an interest in 1,000, Kathleen Casey has an interest in 708, Safra Catz has an interest in 4,194, John Lipsky has an interest in 3,233 and Heidi Miller has an interest in 739 listed American Depositary Shares (‘ADS’), which are categorised as equity derivatives under Part XV of the Securities and Futures Ordinance of Hong Kong. Each ADS represents five HSBC Holdings ordinary shares. |
| 4 | Non-beneficial interest in renminbi (‘RMB’) 1.2m 2.875% Notes 2015 which were redeemed on the due date of 30 April 2015. |
Since the end of the year, the aggregate interests of the following Director have increased by the number of HSBC Holdings ordinary shares shown against his name:
HSBC Holdings ordinary shares | ||||||
Douglas Flint (beneficial owner) | 31 | 1 |
| 1 | The acquisition of shares in the HSBC Holdings UK Share Incentive Plan through regular monthly contributions. |
There have been no other changes in the shares or debentures of the Directors from 31 December 2015 to the date of this report. Any subsequent changes up to the last practicable date before the publication of the Notice of Annual General Meeting will be set out in the notes to that notice.
At 31 December 2015, non-executive Directors and senior management (being executive Directors and Group Managing Directors of HSBC Holdings) held, in aggregate, beneficial interests in 18,959,851 HSBC Holdings ordinary shares (0.10% of the issued ordinary shares). At 31 December 2015, executive Directors and senior management held, in aggregate, options to subscribe for 29,128 HSBC Holdings ordinary shares under the HSBC Holdings savings-related share option plans. These options are exercisable between 2017 and 2021 at prices ranging from £4.0472 to £5.1887 per ordinary share.
Dividends for 2015
First, second and third interim dividends for 2015, each of $0.10 per ordinary share, were paid on 8 July 2015, 2 October 2015 and 3 December 2015, respectively. Note 9 on the Financial Statements gives more information on the dividends declared in 2015. On 22 February 2016, the Directors declared a fourth interim dividend for 2015 of $0.21 per ordinary share in lieu of a final dividend, which will be payable on 20 April 2016 in cash in US dollars, or in sterling or Hong Kong dollars at exchange rates to be determined on 11 April 2016, with a scrip dividend alternative. As the fourth interim dividend for 2015 was declared after 31 December 2015 it has not been included in the balance sheet of HSBC as a debt. The reserves available for distribution at 31 December 2015 were $46,591m.
HSBC HOLDINGS PLC
283 |
Table of Contents
Report of the Directors: Corporate Governance / Directors’ Remuneration Report
Appendix to Corporate Governance / Statement from Group Remuneration Committee Chairman
A quarterly dividend of $15.50 per 6.20% non-cumulative US dollar preference share, Series A (‘Series A dollar preference share’), (equivalent to a dividend of $0.3875 per Series A American Depositary Share, each of which represents one-fortieth of a Series A dollar preference share), was paid on 16 March, 15 June, 15 September and 15 December 2015.
Dividends for 2016
Quarterly dividends of $15.50 per Series A dollar preference share (equivalent to a dividend of $0.3875 per Series A American Depositary Share, each of which represents one-fortieth of a Series A dollar preference share) and £0.01 per Series A sterling preference share were declared on 5 February 2016 for payment on 15 March 2016.
Communication with shareholders
Communication with shareholders is given high priority. The Board has adopted a shareholder communication policy which is available on www.hsbc.com. Extensive information about our activities is provided to shareholders in theAnnual Report and Accounts, theStrategic Report and theInterim Report which are available on www.hsbc.com. There is regular dialogue with institutional investors, and enquiries from individuals on matters relating to their shareholdings and our business are welcomed and are dealt with in an informative and timely manner. All shareholders are encouraged to attend the Annual General Meeting or the informal meeting of shareholders held in Hong Kong to discuss our progress. Shareholders may send enquiries to the Board in writing to the Group Company Secretary, HSBC Holdings plc, 8 Canada Square, London E14 5HQ or by sending an email to shareholderquestions@hsbc.com.
Shareholders may require the Directors to call a general meeting other than an annual general meeting as provided by the UK Companies Act 2006. Requests to call a general meeting may be made by members representing at least 5% of the paid-up capital of the Company as carries the right of voting at general meetings of HSBC Holdings (excluding any paid-up capital held as treasury shares). A request must state the general nature of the business to be dealt with at the meeting and may include the text of a resolution that may properly be moved and is intended to be moved at the meeting. A request may be in hard copy form or in electronic form and must be authenticated by the person or persons making it. A request may be made in writing to the postal address referred to in the paragraph above or by sending an email to shareholderquestions@hsbc.com. At any general meeting convened on such request no business shall be transacted except that stated by the requisition or proposed by the Board.
Notifiable interests in share capital
At 31 December 2015, HSBC Holdings had received the following notification of major holdings of voting rights pursuant to the requirements of Rule 5 of the Disclosure Rules and Transparency Rules:
| • | BlackRock, Inc. gave notice on 9 December 2009 that on 7 December 2009 it had the following: an indirect interest in HSBC Holdings ordinary shares of 1,142,439,457; qualifying financial instruments with 705,100 voting rights that may be acquired if the instruments are exercised or converted; and financial instruments with similar economic effect to qualifying financial instruments which refer to 234,880 voting rights, each representing 6.56%, 0.0041% and 0.0013%, respectively, of the total voting rights at that date. |
At 31 December 2015, according to the register maintained by HSBC Holdings pursuant to section 336 of the Securities and Futures Ordinance of Hong Kong:
| • | JPMorgan Chase & Co. gave notice on 24 December 2015 that on 22 December 2015 it had the following interests in HSBC Holdings ordinary shares: a long position of 1,018,886,506 shares; a short position of 191,280,267 shares; and a lending pool of 577,920,072 shares, each representing 5.17%, 0.97% and 2.93%, respectively, of the ordinary shares in issue at that date. Since 31 December 2015 and following interim notifications on 13 and 19 January, JPMorgan Chase & Co. gave notice on 21 January 2016 that on 19 January 2016 it had the following interests in HSBC Holdings ordinary shares: a long position of 1,031,430,337 shares; a short position of 202,548,058 shares; and a lending pool of 570,470,431 shares, each representing 5.23%, 1.02% and 2.89%, respectively, of the ordinary shares in issue at that date; and |
| • | BlackRock, Inc. gave notice on 23 December 2015 that on 20 October 2015 it had the following interests in HSBC Holdings ordinary shares: a long position of 1,266,331,205 shares and a short position of 4,177,847 shares, each representing 6.60% and 0.02%, respectively, of the ordinary shares in issue at that date. Since 31 December 2015 and following interim notifications on 22 January, BlackRock, Inc. gave notice on 26 January 2016 that on 21 January 2016 it had the following interests in HSBC Holdings ordinary shares: a long position of 1,375,525,890 shares and a short position of 7,428,578 shares, each representing 6.99% and 0.04%, respectively, of the ordinary shares in issue at that date. |
Sufficiency of float
In compliance with the Rules Governing the Listing of Securities on The Stock Exchange of Hong Kong Limited at least 25% of the total issued share capital has been held by the public at all times during 2015 and up to the date of this report.
Dealings in HSBC Holdings listed securities
Except for dealings as intermediaries by subsidiaries of HSBC Holdings plc, neither HSBC Holdings plc nor any of its subsidiaries purchased, sold or redeemed any of its securities listed on the Stock Exchange of Hong Kong Limited during the year ended 31 December 2015.
HSBC HOLDINGS PLC
284 |
Table of Contents
| ||||||||
Report
| Page
| App1
| ||||||
Annual Statement from the Group Remuneration Committee Chairman | 285 | |||||||
| 285 | ||||||||
| 286 | ||||||||
| 286 | ||||||||
| 287 | ||||||||
| 287 | ||||||||
| 288 | ||||||||
| 288 | ||||||||
| 289 | ||||||||
| 299 | ||||||||
| 300 | ||||||||
| 300 | ||||||||
| 301 | ||||||||
| 302 | ||||||||
| 302 | ||||||||
| 303 | ||||||||
| 305 | ||||||||
| 307 | ||||||||
| 310 | ||||||||
| 311 | ||||||||
| 311 | ||||||||
| 312 | ||||||||
| 312 | ||||||||
| 312 | ||||||||
| 312 | ||||||||
| 313 | ||||||||
| 314 | ||||||||
| 315 | ||||||||
Implementation of remuneration policy in 2016 for executive Directors | 315 | |||||||
| 315 | ||||||||
Implementation of remuneration policy for non-executive Directors | 317 | |||||||
| 318 | ||||||||
| 318 | ||||||||
| 319 | ||||||||
| 1 | Appendix to Directors’ Remuneration Report. |
All disclosures in the Directors’ Remuneration Report are unaudited unless otherwise stated.
Disclosures marked as audited should be considered audited in the context of financial statements taken as a whole.
Annual Statement from the Group Remuneration Committee Chairman
Dear Shareholder,
This report sets out HSBC’s remuneration policy for executive Directors, what we paid our Directors in 2015 and why.
This is my first year as Group Remuneration Committee (the ‘Committee’) Chairman, although I have been a member since 30 May 2008.
I have set out below how the Group has performed during 2015, how the remuneration policy was applied in determining the remuneration outcome for our executive Directors, and the new remuneration policy we are putting forward for shareholder approval to give effect to the new Remuneration Rules of the PRA and, to the extent we can at this stage, the new European Banking Authority (‘EBA’) guidelines.
Management laid out its strategy in June 2015, which sets out the plan to reshape our business, capture future growth opportunities and adapt to structural changes in the operating environment. Delivering these strategic objectives will create value for our customers and shareholders and contribute to the long-term sustainability of HSBC. Our executives are focused on delivering on these strategic objectives.
Although adjusted profit before tax fell in 2015, we strengthened our capital position and increased our dividends per ordinary share. We also increased our revenue and, although operating expenses increased from 2014, we made progress in implementing our cost reduction programmes and cost growth slowed in the second half of the year.
Return on equity (%)
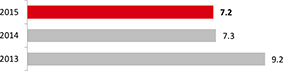
Adjusted profit before tax ($bn)
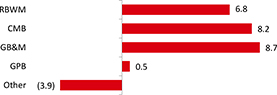
HSBC HOLDINGS PLC
285 |
Table of Contents
Directors’ Remuneration Report(continued)
Statement from Group Remuneration Committee Chairman
Overall performance summary/business context
We grew adjusted revenue, strengthened our capital position and increased our dividend payable to shareholders.
• Reported PBT for 2015 was up 1% at $18,867m compared with $18,680m for 2014.
• Adjusted PBT was down 7% for 2015 at $20,418m compared with $21,976m for 2014. Adjusted PBT was up in two of five regions.
• Adjusted revenue increased by $538m or 1% in 2015 to $57,765m compared with $57,227m for 2014, driven by revenue growth in client-facing GB&M, principally in Equities and Foreign Exchange. Revenue also increased in CMB and Principal RBWM.
• Adjusted LICs increased by $553m or 17% to $3,721m compared with $3,168m in 2014. LICs increased in CMB and in RBWM.
• Adjusted operating expenses increased by $1,606m or 5% to $36,182m compared with $34,576m for 2014, reflecting investment in growth, and regulatory programmes and compliance costs. Excluding the bank levy which is booked in the fourth quarter each year, operating expenses in the second half of 2015 were broadly in line with the first half of the year. This was despite investment and inflationary pressures, and partly reflects the initial effect of our cost saving initiatives and a strong focus on cost management.
• Dividends in respect of 2015 increased from $0.50 per ordinary share in 2014 to $0.51 per ordinary share.
• Our CRD IV end point CET1 capital ratio of 11.9% at 31 December 2015 was up from 11.1% at 31 December 2014. We continue to generate capital from profit and our progress to achieve targeted RWA initiatives strengthened our CET1 ratio, creating capacity for growth.
• The leverage ratio remained strong at 5.0%.
|
For further information on financial performance, see the Financial Summary and pages 22 to 27 of the Strategic Report.
Group variable pay pool and risk adjustments
Remuneration is an important tool for instilling the right behaviours, driving and encouraging actions that are aligned to organisational values and expectations. I believe there should be a positive reward for achieving results in the right way – and a penalty when they are not.
To drive positive change and influence the correct behaviour, we launched a global At Our Best recognition programme in July 2015, to be fully implemented by April 2016. This global programme enables everyone at HSBC to recognise colleagues around the world who bring our values to life in the way they think and act. It provides a global shared understanding of what HSBC Values look like in practice, and a consistent way of recognising people who demonstrate them.
Where our aim to drive positive change is unsuccessful, we have a process under which we apply downward adjustments both at the variable pay pool level and at the individual employee level. The 2015 variable pay was determined after taking an automatic adjustment of $431m to reflect fines, penalties and the cost of customer redress. The Committee also reduced the payout ratio from a target of 18.25% to 16%. This resulted in a further adjustment of $398m to the variable pay pool. Additionally, there were a number of actions taken, to reduce variable pay proposed for 2015 for Group employees by $11m, including members of senior management on account of certain notable events that took place in the period.
The Group’s policy is for the vast majority of post-tax profits to be allocated to capital retention and to dividends, as described on page 304.
The Committee also reviewed the recommendation on performance management and incentives in a report issued by the G30:Banking Conduct and Culture: A Call for Sustained and Comprehensive Reform. The review confirmed that our practice on remuneration and performance management is aligned with the recommendations in the G30 report.
How our remuneration policy was applied in 2015
Based on performance of the executive Directors against their 2015 scorecards, the Committee approved 2015 annual incentive awards at 45% of the maximum for Stuart Gulliver, 80.1% of the maximum for Iain Mackay and 62% of the maximum for Marc Moses (details of the performance outcomes are on page 307).
In respect of the Group Performance Share Plan (‘GPSP’), we determined that 41.3% of the maximum award should be granted (details of the performance outcomes are on page 310).
In aggregate, total compensation for the Group Chief Executive (‘CEO’) is down from 2014 reflecting the weaker financial performance of the Group and the progress towards implementation of Global Standards during the year.
Before confirming the total variable pay to be awarded to the executive Directors, we took into account reports from the independent Monitor and received inputs from the Financial System Vulnerabilities Committee on the progress on the implementation of the Monitor’s recommendations on AML and sanctions compliance and other Global Standards-related initiatives. Based on the inputs received and each executive Directors’ HSBC Values rating, we assessed that no further downward override adjustment is required in respect of the executive Directors or senior executives.
A significant portion of the variable pay awards for executive Directors is deferred and subject to malus during the vesting period. In addition, all variable pay awards are subject to clawback for a minimum period of seven years from the date of grant. The breakdown of the variable pay award and the period over which the awards are paid are set out on page 294.
HSBC HOLDINGS PLC
286 |
Table of Contents
The following graph illustrates when the variable pay awards for 2015 will be paid to our executive Directors.
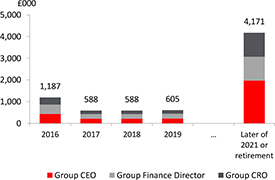
New remuneration policy for 2016
We will be seeking approval for a new remuneration policy at the AGM on 22 April 2016. The policy on pages 288 to 299 takes into account the new PRA Remuneration Rules, which require deferral of variable pay over a longer period
of seven years, rather than three as is currently the case. It also takes into account changes based on the EBA’s Guidelines published in December 2015.
Changes to the policy also address shareholder feedback, mainly the desire to implement a long-term incentive structure in line with that of other FTSE companies and to introduce forward-looking performance conditions. The performance measures for both the annual incentive and the long-term incentive have also been revised to reflect the strategic and financial objectives set out in the update presented to investors in June 2015.
First awards under the new policy will be granted in March 2017, in respect of the 2016 performance year.
We have discussed the proposed changes to our remuneration policy with a number of our large shareholders and proxy advisory bodies, and overall they have been broadly supportive of the changes.
I hope you will support the new remuneration policy, which requires your approval to take effect, by voting for the resolution.
Key changes
Element of pay
|
Changes
| |
Cash in lieu of pension
|
• Reduced from 50% of base salary to 30% of base salary. | |
Fixed pay allowance
|
• To be released on a pro rata basis over five years. | |
Annual incentive |
• To be delivered in shares, subject to a minimum six-month retention period. • The Committee will retain the discretion to apply longer retention periods or apply deferral to a proportion of the award (with vesting aligned to the long-term incentive). | |
Long-term incentives |
• Prior performance will be taken into consideration when determining the value of the grant. • Awarded in shares, subject to a three-year forward-looking performance period commencing from the start of the financial year in which the awards are granted. • Awards will commence vesting after the end of the three-year performance period. Awards will vest in five equal instalments with the first vesting on or around the third anniversary of the date of grant and the last instalment vesting on or around the seventh anniversary of grant. • A retention period may be applied to ensure compliance with regulatory requirements.
| |
Shareholding requirement
|
• Expressed as a percentage of base salary.
|
The new PRA Remuneration Rules are more stringent than the rules in force in the EU, US and Asia-Pacific, making it challenging for UK banks to attract talent with transferable skills or from other industries. We believe more regulator co-ordination is required to ensure there are globally consistent remuneration standards and a level playing field.
The Committee will monitor the impact of the changes to our remuneration policy to ensure it continues to be aligned with our strategy, protects our business and delivers shareholder value.
Sam LaidlawChairman
Group Remuneration Committee
22 February 2016
HSBC HOLDINGS PLC
287 |
Table of Contents
Directors’ Remuneration Report(continued)
Directors’ remuneration policy
Directors’ remuneration policy
Our new remuneration policy for executive and non-executive Directors is subject to shareholder approval.
The policy has been amended to take into account the new PRA Remuneration Rules, EBA guidelines and shareholder feedback. We will seek approval at the Annual General Meeting on 22 April 2016 and if approved, the policy is intended to apply immediately, for three years to the end of the AGM in 2019.
Material factors taken into account when setting remuneration policy
The Committee takes into account a variety of factors when determining the remuneration policy for Directors.
 | Group strategy and objectives | • The Group strategic objectives are the key drivers for measuring performance and form the basis of the annual scorecard and long term incentive scorecard for our executive Directors.
• The targets set for the scorecards are aligned to the strategic targets of the Group. | ||
| Pay and employment conditions within the Group | • In considering individual awards, a comparison of the pay and employment conditions of our employees and senior executives is considered by the Committee.
• The Group Head of Performance and Reward presents proposals for remuneration for the wider employee population and consults with the Committee on the extent to which the different elements of remuneration are provided to other employees.
• Feedback from employee engagement surveys and HSBC Exchange meetings are taken into account in determining the Group’s remuneration policy.
• Given the size of the Group’s employee base and its geographical presence, the Committee did not consider it appropriate to consult all employees on the Directors’ remuneration policy. | |||
| Reinforcing the Group’s values | • The remuneration policy is designed to reinforce the Group’s values and behaviours and to drive sustainable performance.
• The Committee receives input from the Group Risk Committee, the Financial System Vulnerabilities Committee and the Conduct and Values Committee to ensure such behaviours are taken into account. | |||
 | Regulation | • There is still a wide divergence in local regulations governing remuneration structures globally. This presents significant challenges to HSBC, which operates in over 70 countries worldwide.
• In order to deliver long-term sustainable performance, it is important to have market-competitive remuneration which is broadly equivalent across geographical boundaries in order to attract, motivate and retain talented and committed employees around the world.
• We aim to ensure that our remuneration policy is aligned with regulatory practices and the interests of shareholders. HSBC is fully compliant with the FSB, FCA, PRA, EBA and HKMA principles and rules on remuneration which apply at the date of this report. | ||
| Comparator group | • The Committee considers market data for executive Directors’ remuneration packages from a defined remuneration comparator group: Australia and New Zealand Banking Group Limited, Bank of America, Barclays, BNP Paribas, Citigroup, Deutsche Bank, JPMorgan Chase & Co, Santander, Standard Chartered and UBS.
• These ten global financial services companies were selected for 2015 on the basis of their business coverage, size and international scope, and are subject to annual review for continuing relevance.
• The Committee can also review other companies where relevant in determining the remuneration policy. | |||
| Shareholder views | • The Chairman of the Committee, the Group Head of Performance and Reward and the Group Company Secretary meet with key institutional shareholders and other representative bodies to discuss our remuneration policy design, impact of regulatory changes and any key changes introduced.
• We consider these meetings important to gather views on our current and developing remuneration practices to ensure that our reward strategy continues to be aligned with the long-term interests of our shareholders.
• We also took on board views expressed by our shareholders on our remuneration policy at previous annual general meetings. We have changed our approach on the provision of cash in lieu of pension and long-term incentive awards as a result. |
HSBC HOLDINGS PLC
288 |
Table of Contents
Remuneration policy – executive Directors
Our remuneration policy supports the achievement of our strategic objectives through balancing reward for both short-term and long-term sustainable performance. Our strategy is designed to reward success, and to align employees’ remuneration with our Values risk framework
and risk outcomes. For our most senior employees, the majority of their reward is deferred, subject to malus, and clawback.
The policy will apply to all executive Directors with the exception of Douglas Flint, who is not eligible for a fixed pay allowance or variable pay awards.
Remuneration policy – executive Directors
Purpose and link to strategy
|
Operation
|
Maximum opportunity
| ||
Fixed pay
| These elements of remuneration are not subject to performance metrics. | |||
Base salary
| ||||
To attract and retain key talent by being market competitive and rewarding on-going contribution to role. |
Base salary reflects the individual’s role, experience and responsibility. The Committee reviews and approves changes within the context of local requirements and market competitiveness.
Base salaries are benchmarked on an annual basis against relevant comparator groups as set out on page 288. Base salaries may be reviewed more frequently at the discretion of the Committee. |
The annual base salary for each executive Director is set out in the table on page 315.
Other than in exceptional circumstances, the base salary for the current executive Directors will not increase by more than 15% above the current levels during the duration of this policy. | ||
Fixed pay allowance (‘FPA’)
| ||||
To deliver fixed pay required to reflect the role, skills, and experience of the Directors and to maintain a competitive total remuneration package for the retention of key talent. |
Fixed pay allowances are non-pensionable and will be granted in shares that vest immediately on a quarterly basis or at any other frequency that the Committee deems appropriate.
These shares (net of shares sold to cover any income tax and social security) will be subject to a retention period. Shares will be released annually on a pro rata basis over five years, starting from the March immediately following the end of the financial year in which the shares are granted in respect of.
Dividends will be paid on the vested shares held during the retention period.
The Committee retains the discretion to pay the fixed pay allowance in cash if required to do so by regulation.
|
Fixed pay allowances are determined based on the role and responsibility of each individual.
The fixed pay allowance for the duration of this policy will be capped at 150% of base salary levels at the start of this policy. | ||
Cash in lieu of pension
| ||||
To attract and retain key talent by being market competitive.
| Directors receive a cash allowance in lieu of a pension entitlement. | 30% of base salary. | ||
HSBC HOLDINGS PLC
289 |
Table of Contents
Directors’ Remuneration Report(continued)
Directors’ remuneration policy
Purpose and link to strategy
|
Operation
|
Maximum opportunity
|
Performance metrics
| |||
Variable pay |
Adhering to the HSBC Values is a prerequisite to be considered for any variable pay. The HSBC Values are key to running the bank on a sound, sustainable basis. Executive Directors have an HSBC Values rating that is considered by the Committee following the financial year end.
| |||||
Annual incentive
| ||||||
To drive and reward performance against annual financial, non-financial and personal objectives which are consistent with the strategy and align to shareholder interests. |
Awards are discretionary and are generally delivered in the form of shares.
On vesting, the shares (net of shares sold to cover any income tax and social security) will be subject to a minimum retention period of at least six months.
Awards are subject to clawback for a period of seven years from the date of award. This may be extended to ten years in the event of an ongoing internal/regulatory investigation at the end of the seven-year period.
The Committee retains the discretion to:
• apply a longer retention period;
• grant the award partially in cash, as long as at least 50% of the award is in shares; and
• defer a portion of the awards, which will be subject to malus during the deferral period.
Dividend equivalents will be paid on the vested deferred shares, equal to the dividends paid or payable between the grant and vesting date. These will normally be paid in the form of additional, i.e. scrip, shares. If not permissible under regulatory requirements, the number of shares to be awarded may be based on a share price discounted based on a historical dividend yield. |
The maximum opportunity for annual incentive award is up to 215% of base salary.
The Committee will assess and judge performance against the targets set to determine the level of achievement.
The overall payout of the annual incentive could be between 0% and 100% of the maximum.
25% of the maximum award opportunity will vest at threshold performance and up to 50% will vest for target performance. 100% of the award will pay out for maximum performance.
The Committee can reduce (to zero if appropriate) the annual incentive payout based on the outcome of the performance measures, if it considers that the payout determined does not appropriately reflect the overall position and performance of the Company during the performance period. |
Performance is measured against an annual scorecard, based on targets set for financial outcomes and non-financial outcomes (including risk-related measures and personal objectives). The scorecards vary by individual. Examples of the types of measures are shown on page 294.
The financial measures will have a weighting of 60% for the Group CEO, 50% for the Group Chief Financial Officer and 25% for the Group CRO.
The Committee has the discretion to:
• change the overall weighting of the financial and non-financial measures;
• vary the measures and their respective weightings within each category. The specific performance measures will be disclosed in the ‘Annual report on remuneration’ for the relevant year; and
• make adjustments to performance targets to reflect significant one-off items which occur during the measurement period. Full and clear disclosure of any such adjustments will be made within the ‘Annual report on remuneration’ at the end of the performance year, subject to commercial confidentiality.
| |||
HSBC HOLDINGS PLC
290 |
Table of Contents
Purpose and link to strategy
|
Operation
|
Maximum opportunity
|
Performance metrics
| |||
Long-term incentive (‘LTI’)
| ||||||
To incentivise sustainable long-term performance and long-term alignment with shareholder interests. |
Awards are discretionary and are awarded in shares under the HSBC Share Plan 2011, subject to a forward-looking three-year performance period from the start of the financial year in which the awards are granted.
At the end of the performance period, the performance outcomes will be used to assess what percentage of the awards will vest. These awards will vest in five equal instalments with the first vesting on or around the third anniversary of the grant and the last instalment vesting on or around the seventh anniversary of the grant date. This is based on the PRA’s requirements.
On each vesting, the shares (net of shares sold to cover any income tax and social security) will be subject to a minimum retention period of six months if required by regulators.
Awards are discretionary and are subject to malus during the vesting period and clawback for a period of seven to ten years from the date of award.
Dividend equivalents will be paid on the vested deferred shares, equal to the dividends paid or payable between the grant and vesting date. These will normally be paid in the form of additional, i.e. scrip, shares. If not permissible under regulatory requirements, the number of shares to be awarded may be based on a share price discounted based on a historical dividend yield.
The Committee may adjust and amend awards in accordance with the rules of the HSBC Share Plan 2011.
|
The maximum opportunity for LTI award is up to 320% of base salary.
The Committee will assess and judge performance against the targets set to determine the level of achievement.
The overall payout level could be between 0% and 100% of the maximum.
25% of the maximum award opportunity will vest at threshold performance and up to 50% will vest for target performance. 100% of the award will vest for maximum performance.
The Committee can reduce (to zero if appropriate) the LTI payout based on the outcome of the performance measures, if it considers that the payout determined does not appropriately reflect the overall position and performance of the Company during the performance period. |
The Committee will take into consideration prior performance when assessing the value of the LTI grant.
Forward-looking performance is measured against a long-term scorecard with financial outcomes (60% weighting) and non-financial outcome, including risk and strategy-related measures (40% weighting).
Relative Total Shareholder Return (‘TSR’) will have a weighting of one-third of the total financial measures. One-third will be based on achieving return on equity targets and one-third will be based on the attainment of cost-efficiency targets.
Performance targets are set annually for each three-year cycle by the Committee. The Committee has the discretion to:
• change the overall weighting of the financial and non-financial measures;
• vary the measures and their respective weightings within each category. The specific performance measures will be disclosed in the ‘Annual report on remuneration’ for the relevant year; and
• make adjustments to performance targets to reflect significant one-off items which occur during the measurement period. Full and clear disclosure of any such adjustments will be made within the ‘Annual report on remuneration’, subject to commercial confidentiality. | |||
HSBC HOLDINGS PLC
291 |
Table of Contents
Directors’ Remuneration Report(continued)
Directors’ remuneration policy
Purpose and link to strategy
|
Operation
|
Maximum opportunity
| ||
Other
|
These elements are not subject to performance metrics.
| |||
Benefits
| ||||
To provide benefits in accordance with local market practice. |
Benefits take account of local market practice and include, but are not restricted to, the provision of medical insurance, income protection insurance, health assessment, life assurance, club membership, tax return assistance, car benefit (including any tax due on the benefit) and travel assistance.
Stuart Gulliver is also provided with accommodation and car benefit in Hong Kong. HSBC pay any tax due on this benefit.
Additional benefits may also be provided where an executive is relocated or spends a substantial proportion of his/her time in more than one jurisdiction based on business needs. Such benefits could include, but are not restricted to, airfare, accommodation, shipment, storage, utilities and any tax and social security that may be due in respect of such benefits. |
Determined by the nature of the benefit provided. The benefit amount will be disclosed in the Single Figure Table of Remuneration for the relevant year. | ||
Shareholding guidelines
| ||||
To ensure appropriate alignment with the interest of our shareholders. |
Executive Directors and other senior executives are subject to shareholding guidelines.
The shareholding guidelines as a percentage of base salary are:
• Group Chairman: 100%
• Group CEO : 400%
• Group Finance Director: 300%
• Group CRO: 300%
Individuals are given five years from 2014 or (if later) their appointment to build up the recommended levels of shareholding. The shareholding guideline does not count unvested share-based incentives.
The Committee reviews compliance with the shareholding guidelines. The Committee has full discretion in determining any penalties in cases of non-compliance, which could include a reduction of future awards and/or an increase in the proportion of the annual variable pay that is deferred into shares.
HSBC operates an anti-hedging policy and executive Directors are required to certify each year that they have not entered into any personal hedging strategies in relation to their holdings of HSBC shares. |
N/A | ||
All employee share plans
| ||||
To promote share ownership by all employees. |
Executive Directors are also entitled to participate in all employee share plans, such as the HSBC Sharesave, on the same basis as all other employees.
Under the Sharesave, executive Directors can make monthly savings over a period of three or five years towards the grant of an option over HSBC shares. The option price can be at a discount, currently of up to 20%, on the share price at the start of the savings period. |
The number of options determined by maximum savings set by HM Revenue and Customs per month, currently £500. | ||
HSBC HOLDINGS PLC
292 |
Table of Contents
Purpose and link to strategy
|
Operation
|
Maximum opportunity
|
Performance metrics
| |||
Provisions of previous policy that will continue to apply:
| ||||||
2011 – 2015 Group Performance Share Plan (‘GPSP’), deferred cash and share awards.
|
Vesting of outstanding deferred cash and share-based awards granted in prior years, including 2016. This includes deferred shares and GPSP awards granted under the HSBC Share Plan 2011 and HSBC Share Plan, which will continue to form part of the remuneration policy until vesting.
The awards normally vest over a period of up to five years from the date of grant. On vesting, shares (net of any shares sold to cover income tax and social security) will be subject to the applicable retention period set out at the time of the award.
Dividend equivalents will be paid on the vested shares. A notional return will be paid for vested deferred cash awards. |
Award levels have already been determined based on the outcome of relevant performance measures in the relevant prior year. |
The vesting of these awards is subject to a service condition.
In respect of performance year 2012, vesting of the deferred shares portion of the annual incentive awards granted in March 2013 is subject to satisfactory conclusion of the Deferred Prosecution Agreement with the US Department of Justice (‘US DPA’). No further performance conditions apply for any other awards.
The US DPA condition ends on the fifth anniversary of the award date unless it is extended or otherwise continues beyond that date, in which case the awards will vest on the date on which the US DPA expires and otherwise ceases to operate. | |||
The Committee reserves the right to make any remuneration payments and payments for loss of office, notwithstanding that they are not in line with the policy set out above where the terms of the payment were agreed:
| (i) | before the policy set out above, or any previous policy came into effect; |
| (ii) | at a time where a previous policy, approved by shareholders, was in place provided the payment is in line with the terms of that policy; or |
| (iii) | at a time when the relevant individual was not a director of the Company and the payment was not in consideration for the individual becoming a Director of the Company. |
Differences in policy applied to employees generally
The following table illustrates the differences in policy that apply to different groups of employees. For further details, see Remuneration policy for all employees on pages 300 to 301.
Elements of remuneration applied to employees
| Executive Directors | Group Managing Directors | Other Employees | ||||||||||||
Base salary | ü | ü | ü | |||||||||||
Fixed pay allowance | ü | ü | ü | |||||||||||
Annual incentive | ü | ü | ü | |||||||||||
GPSP/long-term incentive | ü | ü | – | |||||||||||
Benefits and pension | ü | ü | ü | |||||||||||
HSBC HOLDINGS PLC
293 |
Table of Contents
Directors’ Remuneration Report(continued)
Directors’ remuneration policy
Release profile of total compensation
The following chart provides an illustrative release profile of target performance total compensation for the Group CEO based on the new remuneration policy.
Illustration of release profile at target total compensation
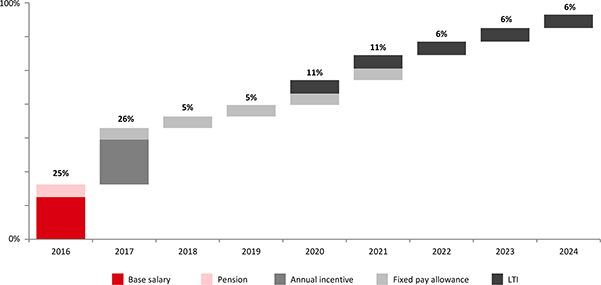
Choice of performance measures and targets
The performance measures were selected as they reflect the Group’s financial targets and strategy. The measures were determined in consultation with major shareholders.
The targets take into account a number of factors,
including the economic environment, market conditions and expectations, the Group’s strategic actions and risk appetite.
Further details of the measures and targets under the policy are in the tables below.
Performance measures for annual incentive
Financial measures
|
Global Standards, including risk and compliance
|
Personal objectives
| ||
Will be aligned to achievement of our annual operating plan targets and linked to the key Group’s key strategic actions.
Measures may include but are not limited to:
• profit before tax;
• reduction of Group risk-weighted assets (‘RWA’s);
• delivery of cost savings; and
• strategic growth.
Targets for threshold and maximum vesting will be based on various factors including each year’s annual operating plan targets.
|
Drive implementation of our Global Standards and risk and compliance policies.
Measures may include but are not limited to:
• progress and embedding of anti-money laundering and sanctions policies;
• implementation of enhanced customer due diligence programmes worldwide; and
• implementation and embedding of conduct programmes.
The targets set will be linked to milestones agreed with the Monitor, regulators and overall Group objectives.
|
Progress made on delivering key non-financial milestones aligned to the Group’s strategic actions, leadership and people metrics. |
HSBC HOLDINGS PLC
294 |
Table of Contents
Performance measures for long-term incentives
Financial measures
|
Global Standards, including risk and compliance
|
Strategy
| ||
Will be strongly aligned to the business strategy and based on primary long-term financial goals.
Measures may include but are not limited to:
• return on equity;
• cost efficiency (jaws); and
• relative TSR against a global financial services peer group.
Targets set for threshold and maximum vesting will be based on long-term financial goals. |
Will be used in line with the Monitor’s guidance and as part of regulatory requirement to use non-financial measures as part of a balanced scorecard.
Measures may include but are not limited to:
• completion of US DPA commitments;
• management of key risks; and
• regulatory transparency.
Targets set will be based on achievement of key long-term commitments and achievement of a successful Global Standards roll-out.
|
Will drive delivery of long-term Group strategic actions. |
Changes in remuneration policy for 2016
The following table provides a summary of key changes to the remuneration policy for 2016.
Remuneration component
|
Policy changes
|
Rationale for change
| ||
Base salary
|
No change
|
N/A
| ||
Fixed pay allowance |
Released pro rata over a period of five years. |
Retention period changed to be consistent with market practice and to reflect longer deferral requirements.
| ||
Cash in lieu of pension |
Maximum reduced from 50% of base salary to 30% of base salary. |
Feedback from shareholders that cash in lieu of pension was high relative to large FTSE companies.
| ||
Annual incentive |
Maximum is 215% of base salary.
Delivered 100% in shares, subject to a retention period. |
The Committee considered it appropriate to have the annual incentive subject to a retention period, to align with the overall variable pay structure of the PRA Remuneration Rules and to take into account the overall time horizons of the total remuneration package of the executive Directors.
| ||
Long-term incentive |
Maximum is 320% of base salary.
Prior performance will be taken into consideration when assessing the value of the grant.
Performance targets set annually for each three-year forward-looking performance period.
Introduction of relative TSR as a performance measure.
Awards to vest, subject to the outcome of the performance conditions at the end of the three-year performance period, in equal instalments between the third and seventh anniversary of the grant date.
A retention period may be applied to ensure compliance with regulatory requirements.
|
Shareholder feedback on preference to have a more conventional long-term incentive structure, with a forward-looking performance period in line with FTSE practice.
Longer deferral period required under the PRA Remuneration Rules. |
HSBC HOLDINGS PLC
295 |
Table of Contents
Directors’ Remuneration Report(continued)
Directors’ remuneration policy
Remuneration scenarios
For the proposed new remuneration policy, the total remuneration opportunity for target and maximum performance has been reduced for executive Directors.
The following charts show how the total value of remuneration (excluding benefits) and its composition would vary under different performance scenarios for executive Directors. ‘Previous’ models the policy in place prior to shareholder approval in 2014. ‘Current’ models the policy approved at the 2014 AGM. ‘New’ models the proposed policy, which will be effective from the date of the 2016 AGM, subject to shareholders’ approval. Target is set at 50% of maximum variable pay.
There is no chart for Douglas Flint, who is not eligible for variable pay awards.
Stuart Gulliver
Amounts in £’000
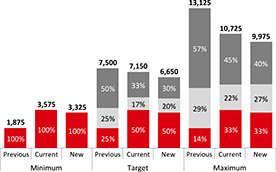
Iain Mackay
Amounts in £’000
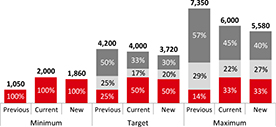
Marc Moses
Amounts in £’000
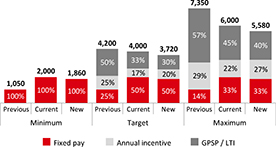
Other directorships
Executive Directors may accept appointments as non-executive directors of companies which are not part of HSBC if so authorised by either the Board or the Nomination Committee.
When considering a request to accept a non-executive appointment, the Board or the Nomination Committee will take into account, amongst other things, the expected time commitment associated with the proposed appointment. The time commitment for external appointments is also routinely reviewed to ensure that they will not compromise the Directors’ commitment to HSBC. The Directors’ biographies as set out on pages 294 to 254 includes those directorships provided for under CRD IV.
Any remuneration receivable in respect of an external appointment of an executive Director is normally paid to the Group, unless otherwise approved by the Nomination Committee or the Board.
Approach to recruitment remuneration – executive Directors
On the recruitment or appointment of a new executive Director, the Committee would adhere to the following principles:
| • | remuneration packages should be in line with the approved policy for executive Directors; |
| • | remuneration packages must meet any applicable local regulatory requirements; and |
| • | where necessary, compensation may be provided in respect of forfeiture of awards from an existing employer (buyout awards). |
Outlined in the following table are all components that would be considered for inclusion in the remuneration package of a new executive Director and, for each, the approach that would be adopted.
In the case of an internal appointment, any variable element awarded in respect of the prior role may be allowed to pay out according to its terms on grant.
HSBC HOLDINGS PLC
296 |
Table of Contents
Components of remuneration package of a new executive Director
Component
|
Approach taken to each component of remuneration
| |
Fixed pay |
Base salary and fixed pay allowance to reflect the individual’s role, experience and responsibility and be set in the context of market practice.
Pension in line with policy as set out in the ‘Remuneration policy’ table on page 289.
| |
Benefits |
Benefits to be provided will be dependent on circumstances but in line with Group policy and the ‘Remuneration policy’ table, including the global mobility policy, where applicable, and local regulations.
| |
Annual incentive |
New joiners will be eligible to be considered for an annual incentive award as set out in the ‘Remuneration policy’ table on page 290.
Guaranteed bonuses are only permitted by exception and must be limited to the first year of service, subject to the Group Deferral Policy and performance requirements.
| |
Long-term incentive
|
May be considered for LTI award in year as set out in the ‘Remuneration policy’ table on page 291.
| |
Buyout |
May be offered if the individual holds any outstanding unvested awards which are forfeited on resignation from the previous employer.
Group buyout policy is in line with the PRA Remuneration Rules which states that both the terms and amount of any replacement awards will not be more generous than the award forfeited on departure from the former employer.
Delivered as HSBC deferred shares with vesting and retention periods to match the terms of forfeited awards with previous employer as closely as possible, subject to proof of forfeiture and other relevant documentation. Where the time to vesting is less than 60 days, cash or deferred cash may be awarded for administrative purposes.
Where appropriate, the Committee retains the discretion to utilise the provisions provided in the Listing Rules for the purpose of making buy-out awards.
|
Service contracts and policy on payments on loss of office – executive Directors
Our policy is to employ executive Directors on service agreements with 12 months’ notice period.
Service contracts
Contract date (rolling) | Notice period (Director & HSBC) | |||||||||
Director | ||||||||||
Douglas Flint | 14 February 2011 | 12 months | ||||||||
Stuart Gulliver | 10 February 2011 | 12 months | ||||||||
Iain Mackay | 4 February 2011 | 12 months | ||||||||
Marc Moses | 27 November 2014 | 12 months | ||||||||
Letters setting out the terms of appointment of each of the executive Directors are available for inspection at the Company’s registered office. Consistent with the best interests of the Group, the Committee will seek to minimise termination payments. Directors may be eligible for a payment in relation to statutory rights.
The following table sets out the basis on which payments on loss of office may be made. Other than as set out in the table, there are no further obligations which could give rise to remuneration payments or payments for loss of office:
HSBC HOLDINGS PLC
297 |
Table of Contents
Directors’ Remuneration Report(continued)
Directors’ remuneration policy
Payments on loss of office
Component of remuneration
| Approach taken
| |
Fixed pay and benefits | Executive Directors may be entitled to payments in lieu of:
• notice, which shall consist of base salary, pension entitlements and other contractual benefits, or an amount in lieu of; and/or
• accrued but untaken holiday entitlement. | |
Annual incentives and long-term incentives | In exceptional circumstances as determined by the Committee, the executive Director may be eligible for annual incentives and long-term incentives based on the time worked in the performance year and on the individual executive Director’s contribution. | |
Unvested deferred awards | All unvested awards will be forfeited when an executive Director ceases employment voluntarily and is not deemed a good leaver. An executive Director may be considered a good leaver at the discretion of the Committee and the following will apply:
• unvested awards will continue to vest in line with the applicable vesting dates, subject to the original performance conditions, the share plan rules, malus and clawback provisions; or
• vested shares, subject to retention, will be released to the executive Director on cessation of employment.
In the event of death unvested awards will vest and will be released to the executive Director’s estate as soon as practicable.
In respect of outstanding unvested awards, for an individual to be considered as a good leaver, the Committee needs to be satisfied that the executive has no current or future intention at the date of leaving HSBC of being employed by any competitor financial services firm. The Committee determines the list of competitor firms and length of time this restriction applies. If the Committee becomes aware of any evidence to the contrary before vesting, the award will lapse.
If the executive Director is not deemed a good leaver for purposes of the GPSP, vested shares, subject to retention, will be released to the executive Director in three equal tranches on each of the first, second and third anniversary of cessation of employment. | |
Repatriation | Where an executive Director has been relocated as part of their employment, the Committee retains the discretion to pay the repatriation costs. This may include, but are not restricted to, airfare, accommodation, shipment, storage, utilities and any tax and social security that may be due in respect of such benefits. | |
Post-departure benefits | Applicable for the duration of the clawback period, up to a maximum of seven years from date of departure for those who depart under good leaver provisions under the HSBC Share Plan and subject to non-compete provisions, in accordance with the terms of the policy. Benefits may include medical coverage, tax return preparation assistance and legal expenses for the duration of the clawback period.
The Committee also has the discretion to extend the post-departure benefit of medical coverage to former executive Directors, up to a maximum of seven years from their date of departure. | |
Legal claims | The Committee retains the discretion to make payments (including professional and outplacement fees) to mitigate against legal claims, subject to any such payments being made in accordance with the terms of an appropriate agreement waiving all claims against the Group. | |
Change of control | In the event of a change of control, outstanding awards will be treated in line with the provisions set out in the respective plan rules. | |
HSBC HOLDINGS PLC
298 |
Table of Contents
Remuneration policy – non-executive Directors
Purpose and link to strategy
| Operation
| Maximum opportunity
| ||
Fees | ||||
The fee levels payable reflect the time commitment and responsibilities of a non-executive Director of HSBC Holdings. | The policy for non-executive Directors is to pay:
• base fees; and
• further fees for additional Board duties such as chairmanship, membership of a committee, or acting as the senior independent Director or deputy Chairman acting as one.
Fees are paid in cash. The Board retains the discretion to pay in shares rather than cash where appropriate.
Any non-executive Chairman would be paid a fixed annual fee for all Board responsibilities based on their experience and the time commitments expected for the role, together with such other benefits as the Committee may in its absolute discretion determine.
Any newly appointed non-executive Director would be paid in line with the policy on a time apportioned basis in the first year as necessary. No sign-on payments are offered to non-executive Directors.
The Board (excluding the non-executive Directors) has discretion to approve changes to the fees. The Board may also introduce any new component of fee fornon-executive Directors subject to the principles, parameters and other requirements set out in this remuneration policy.
Certain non-executive Directors may be entitled to receive fees for their services as directors of subsidiary companies of HSBC Holdings plc. Such additional remuneration is determined by the board of directors of each relevant subsidiary within a framework set by the Group Remuneration Committee. | The Board will review the amount of each component of fees periodically to assess whether, individually and in aggregate, they remain competitive and appropriate in light of changes in roles, responsibilities, and/or time commitment of the non-executive Directors and to ensure that individuals of the appropriate calibre are able to be retained or appointed.
Other than in exceptional circumstances, fees will not increase by more than 20% above the current fee levels during the duration of this policy. | ||
Expenses | Reimbursed for any expenses incurred in performing their role and any related tax cost on such reimbursement. | |||
Shareholding guidelines | To ensure appropriate alignment with the interests of our shareholders, non-executive Directors, individually or with their connected persons, are expected to satisfy a shareholding guideline of 15,000 shares within five years from 2014 or (if later) their appointment.
The Committee reviews compliance with the guidelines annually. The Committee has full discretion in determining any consequences in cases of non-compliance. | |||
Service contracts and policy on payments on loss of office – non-executive Directors
Non-executive Directors are appointed for fixed terms not exceeding three years, which may be renewed subject to their re-election by shareholders at annual general meetings. Non-executive Directors do not have service contracts, but are bound by letters of appointment issued for and on behalf of HSBC Holdings plc. Other than as set out above, there are no obligations in the non-executive Directors’ letters of appointment which could give rise to remuneration payments or payments for loss of office.
Non-executive Directors’ current terms of appointment will expire as follows:
| • | in 2016, Rona Fairhead and Sir Simon Robertson, who are not seeking reappointment; |
| • | in 2017, Kathleen Casey, Laura Cha, Lord Evans of Weardale, Sam Laidlaw and Jonathan Symonds; |
| • | in 2018, Phillip Ameen, Joachim Faber, John Lipsky, Rachel Lomax and Heidi Miller; and |
| • | in 2019, Henri de Castries, Irene Lee, Pauline van der Meer Mohr and Paul Walsh. |
HSBC HOLDINGS PLC
299 |
Table of Contents
Directors’ Remuneration Report(continued)
Directors’ remuneration policy for all employees
Remuneration policy for all employees
The Committee oversees the Group’s remuneration policy and its application to the wider employee population.
The Committee periodically reviews the adequacy and effectiveness of the policy and ensures that it:
| • | meets the commercial requirement to remain competitive; |
| • | is affordable; |
| • | allows flexibility in response to prevailing circumstances; and |
| • | is consistent with effective risk management. |
The mix of fixed and variable pay granted to an employee corresponds to the individual’s role, local market factors and regulatory requirements. The variable pay for all material risk takers (‘MRT’s) is restricted to a maximum of 200% of their fixed pay.
The table provides an overview of the different remuneration elements and how this is operated for our employees:
Component of remuneration
| Approach taken
| |
Base salary | Market competitive pay for the role, skills and experience required for the business. Used to attract and retain employees. | |
Fixed pay allowances | Given where a rebalancing of the fixed and variable pay components of remuneration is appropriate. The criteria used for determining fixed pay allowances include: the role, skills, experience, technical expertise, market compensation and other remuneration that the employee may receive in the year. Allowances may be in cash and/or vested shares.
The shares (net of shares sold to cover any income tax and social security) would be subject to a retention period. | |
Pension and benefits | Provided in accordance with local market practice. This includes but is not limited to the provision of pensions, medical coverage, life insurance, health assessment, tax return preparation, legal fees and relocation allowances. | |
Annual incentives | Awards to drive and reward performance based on annual financial and non-financial measures consistent with the medium to long-term strategy, shareholder interests and adherence to HSBC Values.
For MRTs , awards are normally subject to a 40% or 60% deferral. Normally delivered in cash and/or shares, subject to a minimum six-month retention period. The vesting schedule is normally over 3 years. For 2016, it could be 3 years, 5 years or 3-7 years, depending on the regulatory status of the employee. Deferred awards are subject to malus and all awards are subject to clawback.
MRTs who meet thede minimis requirements of the PRA are subject to the normal deferral rates applicable to all other employees.
For all other employees, awards can be in the form of cash and/or shares. Awards above a specified threshold are subject to deferral based on a deferral table. All deferred awards are subject to malus. HSBC operates an anti-hedging policy for all employees. As part of this all employees are required to certify each year that they have not entered into any personal hedging strategies in relation to their unvested awards and holdings of HSBC shares subject to a retention period. | |
Long-term incentives | Share awards made to incentivise sustainable long-term performance and align to shareholder interests.
OnlyGroup Managing Directors are eligible to receive long-term incentives. All awards are subject to malus and clawback. | |
Link between pay and performance
Under our remuneration framework, pay decisions are made based on the following factors: business results, performance against scorecard objectives, general individual performance of the role, and adherence to HSBC Values, business principles, risk-related policies, procedures and Global Standards.
At the end of each performance year, performance against scorecard objectives, including risk objectives, form the basis of remuneration decisions. This ensures risk management is embedded and forms an integral part of all our activities. This is especially important for senior executives and MRTs as risk and compliance measures in their scorecards ensure that their individual remuneration has been appropriately assessed with regard to risk.
The performance and remuneration of individuals in control functions is assessed according to a balanced scorecard of
objectives specific to the functional role they undertake, to ensure their remuneration is determined independent of the performance of the business areas they control.
HSBC Values are key to the running of a sound, sustainable bank. All employees have a separate behavioural rating, which informs their eligibility for variable pay and influences their variable pay determinations.
Regular reviews are undertaken to assess instances of non-compliance with risk procedures and expected behaviours. Instances of non-compliance are escalated for consideration in variable pay decisions, using the adjustment, malus and clawback policies described in the next section. For MRTs, the Committee has oversight of such decisions.
HSBC HOLDINGS PLC
300 |
Table of Contents
Adjustment, malus and clawback
Where there are instances of conduct breaches, the following actions can be taken. The Committee has exclusive discretion to apply the malus and clawback under the policies that it has adopted, taking into consideration
an individual’s proximity to, and responsibility for, the issue in question. Where possible, an adjustment will be made to current year variable pay, before the application of malus, then clawback.
This is in line with the PRA and FCA regulatory requirements.
Type of action
| Type of variable pay award affected
| Circumstances where it may apply (including, but not limited to):
| ||
Adjustment | Current year variable pay | • Detrimental conduct or conduct which brings the business into disrepute.
• Involvement in Group-wide events resulting in significant operational losses, including events which have caused or have the potential to cause significant harm to HSBC.
• Non-compliance with HSBC Values and other mandatory requirements. | ||
Adjustment under the downward override policy | Current year variable pay for executive Directors and other senior executives | • Based on the recommendations received from the independent Monitor, the Committee introduced the policy in 2014.
• The criteria used to determine the downward adjustment will include:
– insufficient yearly progress in developing an effective AML and sanctions compliance programme; or
– non-compliance with the US DPA and other relevant orders.
• In deciding the application and degree of any such downward override to reduce variable pay awards, the Committee will factor in the Financial System Vulnerabilities Committee’s recommendations and the feedback from the Monitor in relation to cooperation with their review and progress in developing an effective AML and sanctions compliance programme. | ||
Malus | Unvested deferred awards granted in prior years | • Detrimental conduct or conduct which brings the business into disrepute.
• Past performance being materially worse than originally reported.
• Restatement, correction or amendment of any financial statements.
• Improper or inadequate risk management. | ||
Clawback | Vested or paid awards | • Applicable only to awards granted to MRTs on or after 1 January 2015 for seven years. May be extended to ten years for employees under the Senior Manager Regime in the event of ongoing internal/regulatory investigation at the end of the seven-year period.
• Participation in or responsibility for conduct which results in significant losses.
• Failing to meet appropriate standards of fitness and propriety.
• Reasonable evidence of misconduct or material error that would justify, or would have justified, summary termination of a contract of employment.
• HSBC or a business unit suffers a material failure of risk management within the context of Group-risk management standards, policies and procedures. | ||
HSBC HOLDINGS PLC
301 |
Table of Contents
Directors’ Remuneration Report(continued)
Annual report on remuneration
Role
Within the authority delegated by the Board, the Committee is responsible for approving the Group’s remuneration policy. The Committee also determines the remuneration of executive Directors, senior employees, and employees whose activities have or could have a material impact on our risk profile. No executive Directors are involved in deciding their own remuneration.
Membership
The members of the Group Remuneration Committee during 2015 were Sir Simon Robertson (stepped down as Chairman of this Committee on 24 April 2015), Sam Laidlaw (appointed Chairman on 24 April 2015), and John Lipsky. Pauline van der Meer and Paul Walsh joined the Group Remuneration Committee on 1 January 2016.
Activities
The Committee met 11 times during 2015. The following is a summary of the Committee’s key activities during 2015.
Details of the Committee’s key activities
Month
| Activities
| Month
| Activities
| |||||
| January | • 2014 performance year pay review matters • Directors’ Remuneration report • Share Plan – HSBC UK Share Incentive Plan • Governance matters | May | • Remuneration policy review • 2015 Material Risk Taker review • Update on notable events • Regulatory updates • Country/business policies and practice • Governance reports
| |||||
| February | • 2014 performance year pay review matters • 2015 GPSP and Group CEO Annual Scorecards • Update on notable events • Downward Override Policy • 2014 Directors’ Remuneration Report and Strategic Report • Regulatory submissions and disclosures • Governance matters
| July | • Country/business policies and practice • Regulatory updates • Update on notable events • Remuneration policy design considerations • Governance matters | |||||
| March | • 2015 Monitor’s report on remuneration-related matters • Downward Override Policy • Final regulatory submissions and disclosures • Review of draft EBA remuneration guidelines • 2014 performance year pay review matters • Country/business policies and practice • Governance matters | September | • Regulatory updates and submissions • Update on notable events • Remuneration policy design considerations • 2015 performance year pay review matters • Group share plans • Governance matters
| |||||
October |
• G30 study on banking conduct and culture • Remuneration policy design considerations • Country/business policies and practice • Governance matters
| |||||||
| April | • Performance management and reward survey • Regulatory update on EBA guidelines and FCA guidance on ex-post risk adjustment • Group share plans • Country/business policies and practice • Governance matters | November | • 2015 performance year pay review matters • 2015 regulatory submissions • Update on notable events • Remuneration policy design considerations • Shareholder consultation on new remuneration policy ��� Governance matters
| |||||
| December | • 2015 performance year pay review matters • 2015 regulatory submissions • Governance matters • Country/business policies and practice • Group share plans
| |||||||
Advisers
The Committee received input and advice from different advisers on specific topics during 2015. In 2015, Deloitte was appointed as an objective, independent adviser to support the Committee on a one-off basis with respect to the new remuneration policy.
Deloitte LLP provided benchmarking data on remuneration policy design considerations and independent advice to the Committee. Deloitte also provided tax compliance and other advisory services to the Group. To ensure the advice from Deloitte was objective, the Committee required the advice to be independent and distinct from any internal review and analysis on remuneration policy matters.
HSBC HOLDINGS PLC
302 |
Table of Contents
During 2015, total fees of £116,200 were paid to Deloitte in relation to the remuneration related advice provided to the Committee. This was based on a fixed fee agreed on an estimated time spent basis.
During the year, the Group CEO provided regular briefings to the Committee. In addition, the Committee received advice from the following employees as part of their executive role as employees of HSBC:
| • | Ann Almeida, former Group Head of Human Resources and Corporate Sustainability (last meeting attended February 2015), |
| • | Pierre Goad, Group Head of Human Resources, |
| • | Alexander Lowen, Group Head of Performance and Reward, |
| • | Marc Moses, Group Chief Risk Officer, |
| • | Robert Werner, Global Head of Financial Crime Compliance and Group Money Laundering Reporting Officer, and |
| • | John Flint, Chief Executive Retail Banking and Wealth Management. |
The Committee also received feedback and input from the Group Risk Committee, Financial System Vulnerabilities Committee and Conduct & Values Committee on risk and compliance-related matters relevant to remuneration. This included the input from Financial System Vulnerabilities Committee on the implementation and annual assessment of progress on the implementation and progress on the AML and sanctions compliance programme for the purposes of the Committee’s determination on any adjustments to be made under the downward override policy.
Variable pay pool determination
The Committee considers many factors in determining the Group’s variable pay pool funding. Both the annual incentive and GPSP are funded from a single annual variable pay pool from which individual awards are considered.
Variable pay pool determination
Performance and risk appetite statement | • The variable pay pool takes into account the performance of the Group considered within the context of our risk appetite statement (‘RAS’) which includes a number of earnings/capital related metrics, such as return on equity, return on notional risk weighted assets, common equity tier 1 capital ratio and the leverage ratio. This ensures that the variable pay pool is both economic and shaped by risk considerations and any Group-wide notable events. • Additionally, individual RAS has been developed for Financial Crime Compliance and Regulatory Compliance to reflect the current regulatory focus on these risks. • The Group CRO regularly updates the Committee on the Group’s performance against the risk appetite statement and summarises the notable issues for the various business lines. • The Committee uses these updates along with feedback from the Group Risk Committee as delivered by the Group CRO when determining the annual variable pay pool to ensure that return, risk and remuneration are aligned.
| |
Countercyclical funding methodology | • We use a countercyclical funding methodology which is categorised by both a floor and a ceiling and the payout ratio reduces as performance increases to avoid pro-cyclicality risk. • The floor recognises that even in challenging times, remaining in a competitive position is important. • The ceiling recognises that at higher levels of performance it is possible to limit reward as it is not necessary to continue to increase the variable pay pool, thereby limiting the risk of inappropriate behaviour to drive financial performance.
| |
Distribution of profits | • In addition, our funding methodology considers the relationship between capital, dividends and variable pay to ensure that the distribution of post-tax profits between these three elements is considered appropriate (see next page for the 2015 and 2014 split). • It is deemed fundamental that the majority of post-tax profits should be allocated to capital and to shareholders, particularly when strong performance is delivered.
| |
Commerciality and affordability | • Finally, we consider the commercial requirement to remain competitive in the market and overall affordability. Funding of the Group’s annual variable pay pool is determined in the context of Group profitability, capital strength, shareholder returns and the overall compensation and benefits expense. This approach ensures that performance-related awards for individual global businesses, global functions, geographical regions and levels of staff are considered in a holistic fashion. • Market competiveness is also considered in determining the variable pay pool. This allows us to address any gaps to market identified when comparing total reward with our global peers. This also recognises the challenges which arise from being headquartered in the UK and having to apply more stringent reward practices than those in all other markets. We need to retain a competitive market position in Asia, the Middle East and the US in attracting and retaining talent, where our competitors are not subject to discounts applied by employees on their pay due to regulatory requirements including a variable pay cap, higher and longer deferrals, malus and clawback.
| |
HSBC HOLDINGS PLC
303 |
Table of Contents
Directors’ Remuneration Report(continued)
Annual report on remuneration
2015 variable pay pool
This year’s variable pay pool is established by reference to the Group’s reported profit before tax, which is adjusted to exclude movements in the fair value of own debt attributable to credit spread, the gains and losses from disposals, and debit valuation adjustment. Reported profit before tax includes the costs of fines, penalties and other items of redress.
The Committee has taken into account all of the factors in the previous table to determine the outcome below:
Variable pay pool outcome ($m)
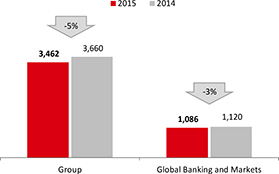
| Group | Global Banking and Markets | |||||||||||||||
| 2015 | 2014 | 2015 | 2014 | |||||||||||||
Variable compensation incentive pool as a % of pre-tax profit (pre-variable | 16% | 16% | 12% | 15% | ||||||||||||
% of variable pay pool deferred2 | 15% | 14% | 26% | 25% | ||||||||||||
| 1 | The 2015 Group pre-tax pre-variable pay profit calculation as described above. |
| 2 | The percentage of variable pay deferred for 2015 material risk-taker population is 51%. |
Relative importance of spend on pay
The chart below provides a breakdown of total staff pay relative to the amount paid out in dividends.
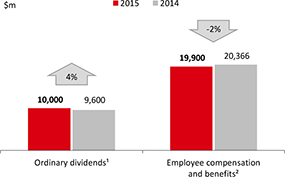
| 1 | Dividends per ordinary share in respect of that year. For 2015, this includes the first, second and third interim dividends paid in 2015 of $5.9bn (gross of scrip) and a fourth interim dividend of $4.1bn. |
| 2 | Employee compensation and benefits in 2015 and 2014 includes fixed pay, benefits and variable pay as outlined on page 16. |
Pro-forma post-tax profits allocation
On a pro-forma basis, attributable post-tax profits (excluding the movements in the fair value of own debt and before pay distributions) for 2015 were allocated in the proportions shown in the chart below. The overall compensation benefits expense to net revenue was 33% for 2015.
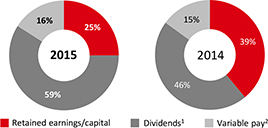
| 1 | Inclusive of dividends to holders of other equity instruments and net of scrip issuance based on an assumption of scrip take up for the fourth quarter of 2015 of 20%. Dividends per ordinary share declared in respect of 2015 were $0.51, an increase of 2% compared with 2014. The post-tax profits allocation figures shown in theAnnual Report and Accounts 2014 in respect of that year assumed a scrip take up of 20%. The figures shown above in relation to 2014 have been calculated based on an actual scrip take up of 52%. |
| 2 | Total variable pay pool net of tax and portion to be delivered by the award of HSBC shares. |
HSBC HOLDINGS PLC
304 |
Table of Contents
Executive Directors
| Douglas Flint | Stuart Gulliver | Iain Mackay | Marc Moses | |||||||||||||||||||||||||||||||||||||||||||||
| 2015 | 2014 | 2015 | 2014 | 2015 | 2014 | 2015 | 2014 | |||||||||||||||||||||||||||||||||||||||||
| £000 | £000 | £000 | £000 | £000 | £000 | £000 | £000 | |||||||||||||||||||||||||||||||||||||||||
Fixed pay | ||||||||||||||||||||||||||||||||||||||||||||||||
Base salary | 1,500 | 1,500 | 1,250 | 1,250 | 700 | 700 | 700 | 700 | ||||||||||||||||||||||||||||||||||||||||
Fixed pay allowance | – | – | 1,700 | 1,700 | 950 | 950 | 950 | 950 | ||||||||||||||||||||||||||||||||||||||||
Pension | 750 | 750 | 625 | 625 | 350 | 350 | 350 | 350 | ||||||||||||||||||||||||||||||||||||||||
| 2,250 | 2,250 | 3,575 | 3,575 | 2,000 | 2,000 | 2,000 | 2,000 | |||||||||||||||||||||||||||||||||||||||||
Variable pay | ||||||||||||||||||||||||||||||||||||||||||||||||
Annual incentive | – | – | 1,072 | 1,290 | 1,068 | 867 | 827 | 1,033 | ||||||||||||||||||||||||||||||||||||||||
GPSP | – | – | 1,969 | 2,112 | 1,101 | 1,131 | 1,101 | 1,131 | ||||||||||||||||||||||||||||||||||||||||
| – | – | 3,041 | 3,402 | 2,169 | 1,998 | 1,928 | 2,164 | |||||||||||||||||||||||||||||||||||||||||
Total fixed and variable pay | 2,250 | 2,250 | 6,616 | 6,977 | 4,169 | 3,998 | 3,928 | 4,164 | ||||||||||||||||||||||||||||||||||||||||
Benefits | 151 | 136 | 662 | 589 | 54 | 43 | 6 | 6 | ||||||||||||||||||||||||||||||||||||||||
Non-taxable benefits | 95 | 105 | 53 | 53 | 28 | 28 | 29 | 33 | ||||||||||||||||||||||||||||||||||||||||
Notional return on deferred cash | – | 41 | 9 | – | 5 | 11 | 5 | 36 | ||||||||||||||||||||||||||||||||||||||||
Total single figure of remuneration | 2,496 | 2,532 | 7,340 | 7,619 | 4,256 | 4,080 | 3,968 | 4,239 | ||||||||||||||||||||||||||||||||||||||||
Notes to the single figure of remuneration
Base salary
| • | Salary paid in year for executive Directors. No fees were paid to executive Directors. |
Fixed pay allowance
| • | Fixed pay allowance granted in immediately vested shares in the year for executive Directors. |
| • | The shares are subject to a retention period. 20% released in the March immediately following the end of the financial year. 80% released after a period of five years from the date of the first release. |
| • | Dividends will be paid on the vested shares held during the retention period. |
Pension
| • | The amounts consist of an allowance of 50% of annual base salary in lieu of personal pension arrangements. |
| • | No other benefits were received by the executive Directors from the Group pension plans. |
Benefits
| • | All taxable benefits (gross value before payment of tax). Benefits include provision of medical insurance, accommodation and car, club membership, tax gross-up for accommodation and car benefit, and car allowance. |
| • | Non-taxable benefits include the provision of life assurance and other insurance cover. |
The values of the significant benefits in the above table were as follows:
| Douglas Flint | Stuart Gulliver | Iain Mackay | Marc Moses | |||||||||||||||||||||||||||||||||||||||||||||
| 2015 | 2014 | 2015 | 2014 | 2015 | 2014 | 2015 | 2014 | |||||||||||||||||||||||||||||||||||||||||
| £000 | £000 | £000 | £000 | £000 | £000 | £000 | £000 | |||||||||||||||||||||||||||||||||||||||||
Car benefit (UK and Hong Kong) | 69 | 70 | 87 | 88 | – | 1 | – | 1 | – | 1 | – | |||||||||||||||||||||||||||||||||||||
Hong Kong bank-owned accommodation2 | – | – | 281 | 246 | – | – | – | – | ||||||||||||||||||||||||||||||||||||||||
Tax expense on car benefit and Hong Kong bank-owned accommodation | 57 | 58 | 275 | 239 | – | 1 | – | 1 | – | 1 | – | |||||||||||||||||||||||||||||||||||||
Insurance benefit (non-taxable) | 80 | 80 | – | 1 | – | 1 | – | 1 | – | 1 | – | 1 | – | |||||||||||||||||||||||||||||||||||
| 1 | The car benefit and tax on car benefit for Iain Mackay and Marc Moses is not included in the above table as it was not significant. The insurance benefit for Stuart Gulliver, Iain Mackay and Marc Moses is not included in the above table as it was not significant. |
| 2 | Based on the current market rental value of the bank-owned property in Hong Kong, as estimated by an external lease service provider, plus utility costs, rates, the taxable value of furniture and taking into account the business use of the property. The taxable value of the accommodation is considered to be 70% of the total of these amounts. |
Annual incentive
| • | Annual incentive awarded (including deferred amounts) as a result of achievement of performance measures for the relevant financial year. 60% of the award is deferred. 50% of both the deferred and non-deferred component of the award is payable in cash and the remaining 50% in shares, subject to a six-month retention period on vesting. |
| • | The deferred element of the 2015 award pays out over a period of three years, subject to service and malus conditions: 33% vests on or around the first and second anniversary of grant and 34% on or around the third anniversary of grant. For the 2015 award the performance measures and the outcomes of the performance conditions can be found on page 307. Outcomes for the 2014 award can be found in the Directors’ Remuneration Report in theAnnual Report and Accounts 2014. |
| • | The deferred share awards also include a right to receive dividend equivalents. Dividend equivalents are delivered in the form of additional shares, in the same time, manner and proportion as the original deferred award at vesting. The expected value of these dividend equivalents is included in the value of deferred share awards. |
HSBC HOLDINGS PLC
305 |
Table of Contents
Directors’ Remuneration Report(continued)
Annual report on remuneration
Illustration of annual incentives
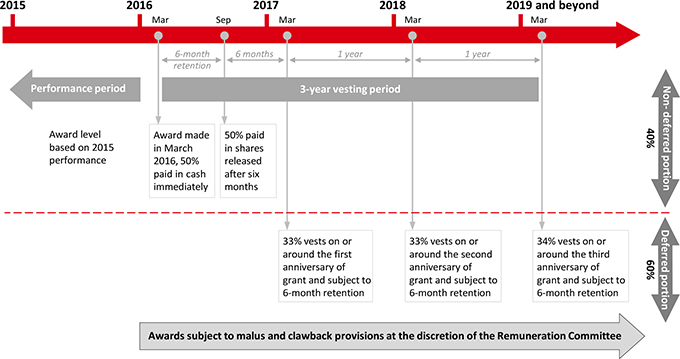
GPSP
| • | GPSP awarded as a result of achievement of sustainable long-term performance. Figures shown reflect the face value of awards granted in 2015 and 2014, respectively. |
| • | Award levels are determined by considering performance against enduring performance measures set out in the long-term performance scorecard. There are no post-grant performance conditions. |
| • | The award is subject to a five-year cliff vesting period during which the Committee has the authority to cancel all or part of the award. On vesting, the shares (net of tax) must be retained for the duration of the participant’s employment. |
| • | For the 2015 award the outcomes of the performance conditions can be found in the section titled ‘Awards under the GPSP’ on page 310. Outcomes for the 2014 award can be found in the Directors’ Remuneration Report in theAnnual Report and Accounts 2014. |
| • | For the 2014 award, the Committee used their discretion to reduce the executive Directors’ GPSP awards by £500,000 for Stuart Gulliver, and by £330,000 each for Iain Mackay and Marc Moses. |
| • | The GPSP awards also include a right to receive dividend equivalents for the period between the grant and the vesting date. Dividend equivalents on the GPSP awards will be delivered when the GPSP awards vest. There was no vesting of historical GPSP awards in 2015. The expected value of these dividend equivalents is included in the value of GPSP awards. |
Illustration of GPSP
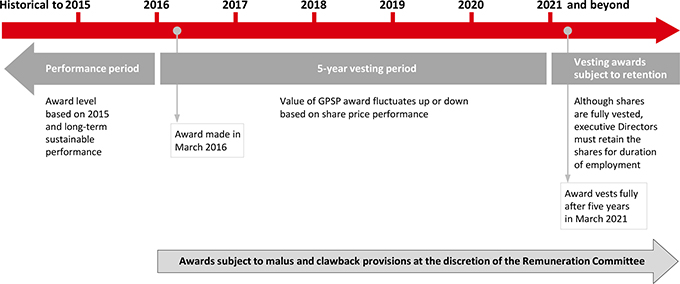
Notional return on deferred cash
| • | The deferred cash award portion of the annual incentive also includes a right to receive notional returns for the period between grant date and vesting date and is determined by reference to the dividend yield on HSBC shares, determined annually. |
| • | A payment of notional return is made annually in the same proportion as the vesting of the deferred awards on each vesting date. The amount is disclosed on a paid basis in the year in which the payment is made. |
HSBC HOLDINGS PLC
306 |
Table of Contents
Determining executive Directors’ annual performance
Awards made to executive Directors reflected the Committee’s assessment of the extent to which they had achieved personal and corporate objectives set within their performance scorecard as agreed by the Board at the beginning of the year, which had been set to reflect the risk appetite and strategic priorities. In addition, in accordance with the downward override policy, the Committee also consulted the Financial System Vulnerabilities Committee and took into consideration their feedback in relation to progress on enhancing AML
and sanctions compliance along with progress in meeting the Group’s obligations under the US DPA and other relevant orders. The Committee also took into consideration the report of the independent Monitor in determining the scorecard outcomes.
In order for any award of annual incentive to be made under the above performance scorecard, each executive Director must meet a required behavioural rating which is assessed around HSBC Values of being ‘open, connected and dependable’ and acting with ‘courageous integrity’. For 2015, all executive Directors met the required behavioural rating.
Value of annual incentives awarded to each executive Director
| Stuart Gulliver | Iain Mackay | Marc Moses | ||||||||||||||||
Fixed pay | ||||||||||||||||||
Value (£000) | 3,575 | 2,000 | 2,000 | |||||||||||||||
Annual incentive | ||||||||||||||||||
Maximum multiple of fixed pay | 0.67 | 0.67 | 0.67 | |||||||||||||||
Performance outcome | 45.0% | 80.1% | 62.0% | |||||||||||||||
Multiple awarded | 0.30 | 0.53 | 0.41 | |||||||||||||||
Value (£000) | 1,072 | 1,068 | 827 | |||||||||||||||
Stuart Gulliver
Stuart Gulliver achieved a performance outcome for the year of 45% against his annual scorecard.
The chart shows the value and composition of Stuart Gulliver’s remuneration based on the current policy in comparison with the actual 2015 variable pay outcomes.
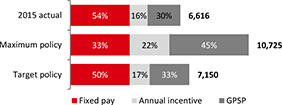
Annual assessment
Weighting % | Target | Performance | Assessment % | Outcome % | ||||||||||||||||||||||
Measure | ||||||||||||||||||||||||||
Profit before tax1 | 15 | $ | 21.2bn | $ | 21.1bn | 50 | 7.5 | |||||||||||||||||||
Return on equity | 15 | 7.3 | 7.2% | – | – | |||||||||||||||||||||
Jaws2 | 15 | – | (3.7% | ) | – | – | ||||||||||||||||||||
Grow dividends3 | 15 | 0.50 | 0.51 | 75 | 11.2 | |||||||||||||||||||||
Financial | 60 | 18.7 | ||||||||||||||||||||||||
Strategy execution | 15 | Judgement – see commentary | 75 | 11.3 | ||||||||||||||||||||||
Global Standards including risk and compliance | 25 | Judgement – see commentary | 60 | 15.0 | ||||||||||||||||||||||
Non-financial | 40 | 26.3 | ||||||||||||||||||||||||
Promoting HSBC Values | Over-riding test | Met | ||||||||||||||||||||||||
Total | 100 | 45.0 | ||||||||||||||||||||||||
| 1 | Profit before tax, as defined for the Group variable pay pool. |
| 2 | Revenue growth less operating expense, on an adjusted basis. |
| 3 | Dividend per ordinary share (US dollar) in respect of the year, measured year on year; consistent with the growth of the overall profitability of the Group, predicated on the continued ability to meet with regulatory capital requirements. |
| Profit before tax | • Although the target was not fully met, profit before tax fell marginally short of the baseline. In acknowledgement of a resilient performance in difficult market conditions, an assessment of 50% was awarded.
| ||
| Return on equity | • Return on equity for 2015 was 7.2%, 190 basis points lower than 2014, impacted by low revenue growth as well as significant items. While the Committee acknowledged efforts to improve medium-term returns, it decided to not make an award under this opportunity.
| |||
HSBC HOLDINGS PLC
307 |
Table of Contents
Directors’ Remuneration Report(continued)
Annual report on remuneration
 | Jaws | • The Group targeted the achievement of positive adjusted jaws in 2015. Based on the profile of the Group’s revenues and cost base, it was judged that no award should be made under this element of the scorecard.
| ||
| Grow dividends | • The Group is committed to paying out progressive dividends to shareholders, predicated on the growth of overall profitability and the continuing ability to meet regulatory capital requirements. Prospective dividend growth remains dependent upon the long term overall profitability of the Group and delivering further release of less efficiently deployed capital.
• The Group was able to increase the dividend per ordinary share in 2015 as well as improve its capital position.
| |||
 | Strategy execution | • Committee reviewed the progress to date in driving the Strategic Actions announced during the June 2015 Investor Update, particularly around re-sizing and simplifying the Group, and re-deploying capital to invest in higher-return businesses.
• The Group had achieved $124bn reduction in RWAs in the year, ahead of the 2015 target and accounting for 45% of the total RWA reduction to be achieved by the end of 2017 to drive improved profitability.
• The Committee further recognised favourable progress in optimising the global network with the planned sale of our operations in Brazil. The Committee acknowledged the work under way to re-build profitability in the United States, although noted that underlying revenue growth remains challenged. The Committee also noted the implementation of several initiatives to control costs, improve efficiency, and shift the Group’s front office to back office ratio towards customer facing activities.
• There were advances made in re-deploying capital to invest in higher-return businesses. The Committee recognised the Group’s progress in leveraging its global network to drive growth from global connectivity, in particular through its range of transaction banking products, and to deliver revenue synergies from its universal banking model. The Pivot to Asia strategy is being executed to capture growth opportunities in China’s Pearl River Delta, in the Association of Southeast Asian Nations, and in the Asian Asset Management and Insurance businesses.
• The Group continues to play a leading role in the Internationalisation of the renminbi, being able to grow revenues and demonstrate several market firsts during 2015, such as the first Panda bond issued by a foreign bank in mainland China.
| ||
| Global Standards including risk and compliance | • The Committee was advised that the Group has continued to make progress in the implementation of Global Standards, including completion of certain milestones related to customer due diligence, transaction monitoring and sanctions screening. In addition, the global businesses are focusing on increasing operational impact and improving consistency across geographies to support the implementation of global AML and sanctions policies.
• During 2015, the Global Standards programme assurance function has been strengthened to provide additional insight into programme outcomes and effectiveness. This has resulted in enhanced visibility of potential risks and compliance weaknesses and has enabled proactive mitigating actions.
• The Committee recognised that the Group had progressed with the implementation of other compliance and regulatory programmes in addition to Global Standards, including global stress testing, ring-fencing and global conduct (e.g. development of Conduct Management Information Dashboard). The Committee further noted favourable trends in customer redress, regulatory fines and regulatory provisions.
• However, the Committee exercised its discretion and reduced the assessment from 75% to 60%. This was based on feedback received from the Monitor, matters arising from risk and compliance incidents, and the number and extent of unsatisfactory internal audits covering AML and sanctions related issues.
| |||
Iain Mackay
Iain Mackay achieved a performance outcome for the year of 80.1% against his annual scorecard.
The chart shows the value and composition of Iain Mackay’s remuneration based on the current policy in comparison with the actual 2015 variable pay outcomes.
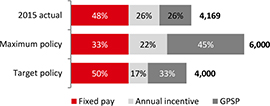
Annual assessment
Weighting % | Target | Performance | Assessment % | Outcome % | ||||||||||||||||||
Measure | ||||||||||||||||||||||
Grow both business and dividends | 15 | Judgement – see commentary | 90 | 13.5 | ||||||||||||||||||
Global Standards including risk and compliance | 50 | Judgement – see commentary | 75 | 37.5 | ||||||||||||||||||
Streamline processes and procedures | 25 | Judgement – see commentary | 88 | 21.9 | ||||||||||||||||||
Strategic priorities | 90 | 72.9 | ||||||||||||||||||||
People | 10 | Judgement – see commentary | 72 | 7.2 | ||||||||||||||||||
Promoting HSBC Values | Over-riding test | Met | ||||||||||||||||||||
Total | 100 | 80.1 | ||||||||||||||||||||
HSBC HOLDINGS PLC
308 |
Table of Contents
 | Grow both business and dividends | • Assessed the contribution of the Global Finance function in setting the framework to track progress against the 10 Strategic Actions, and its on-going partnership and support to global businesses on initiatives orientated to the reduction of Group RWAs and revenue generation programmes.
| ||
Global Standards including risk and compliance
| • Noted the progress towards compliance with regulatory requirements and implementing Global Standards. This was evidenced by the successful execution of the 2015 PRA stress test and the reporting on revised ‘Delegated Act’ basis of the liquidity coverage ratio, as well as by Finance’s tax transparency engagement with global businesses’ clients.
| |||
Streamline processes and procedures
| • Recognised the support that the Global Finance function has provided to global businesses and functions on key streamlining and cost saving initiatives, as well as the progress on its own Finance Transformation Programme.
| |||
| People | • Noted the full implementation of the revised Finance Operating Model as well as the delivery of accelerated development programmes to targeted Finance populations.
• The sustained work of the Global Finance function on improving gender diversity was also noted.
| |||
Marc Moses
Marc Moses achieved a performance outcome for the year of 62% against his annual scorecard.
The chart shows the value and composition of Marc Moses’ remuneration based on the current policy in comparison with the actual 2015 variable pay outcomes.
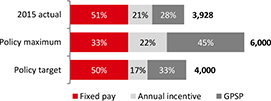
Annual assessment
Weighting % | Target $bn | Performance $bn | Assessment % | Outcome % | ||||||||||||||||||
Measure | ||||||||||||||||||||||
Grow both business and dividends | 20 | Judgement – see commentary | 85 | 17.0 | ||||||||||||||||||
Global Standards including risk and compliance | 50 | Judgement – see commentary | 45 | 22.5 | ||||||||||||||||||
Streamline processes and procedures | 20 | Judgement – see commentary | 75 | 15.0 | ||||||||||||||||||
Strategic priorities | 90 | 54.5 | ||||||||||||||||||||
People | 10 | Judgement – see commentary | 75 | 7.5 | ||||||||||||||||||
Promoting HSBC Values | Over-riding test | Met | ||||||||||||||||||||
Total | 100 | 62.0 | ||||||||||||||||||||
| | Grow both business and dividends | • Recognised the use of risk appetite statements to enable a sustainable business, and the provision of resources to support business growth (e.g., each global business has a formal governance process around the management of RWAs).
| ||
| Global Standards including risk and compliance | • Continued progress towards driving strategic priorities for Global Standards, progressing compliance with regulatory requirements, and de-risking the organisation. Activity has continued at pace ensuring delivery of the Regulatory Compliance Framework.
• We continue to prioritise our efforts on material inherent risk areas and implement targeted governance and remediation efforts.
• However, the Committee exercised its discretion and reduced the assessment from 75% to 45%. This was based on feedback received from the Monitor, matters arising from risk and compliance incidents, and the number and extent of unsatisfactory internal audits covering AML and sanctions related issues.
| |||
| Streamline processes and procedures | • These objectives have progressed, supported by the management of business performance, delivery of key transformation initiatives, and re-engineering of policies, procedures and systems.
• For example, credit risk management was significantly strengthened through the implementation of multiple new policies on collections, allowances, stress testing, approval authorities and products.
• One significant structural change was the announcement of a new development in risk analytics at HSBC: the creation of a centralised team called Global Risk Analytics
| |||
| People | • The execution of the pay and performance plans, as well as the learning and development plans which were part of the comprehensive people strategy for the Global Risk function were noted.
• Key initiatives include the first Aspiring CRO programme and further investment in the three lines of defence.
| |||
HSBC HOLDINGS PLC
309 |
Table of Contents
Directors’ Remuneration Report(continued)
Annual report on remuneration
Awards in respect of 2015 were assessed against the 2015 long-term scorecard published in theAnnual Report and Accounts 2014 and reproduced below, the objectives of which were set within the context of the risk appetite and strategic direction agreed by the Board.
As per the annual incentive, in order for GPSP awards to be made, each executive Director must meet a required behavioural rating. For 2015, all executive Directors met the required behavioural rating.
Value of the GPSP awarded to each executive Director
| Stuart Gulliver | Iain Mackay | Marc Moses | ||||||||||||||||
Fixed pay | ||||||||||||||||||
Value (£000) | 3,575 | 2,000 | 2,000 | |||||||||||||||
GPSP | ||||||||||||||||||
Maximum multiple of fixed pay | 1.33 | 1.33 | 1.33 | |||||||||||||||
Performance outcome | 41.3% | 41.3% | 41.3% | |||||||||||||||
Multiple awarded | 0.55 | 0.55 | 0.55 | |||||||||||||||
Value (£000) | 1,969 | 1,101 | 1,101 | |||||||||||||||
Assessment – GPSP
Weighting % | Long-term target range | Actual 2015 performance | Assessment % | Outcome % | ||||||||||||||||||||||
Measure | ||||||||||||||||||||||||||
Return on equity | 20 | >10% | 7.2% | – | – | |||||||||||||||||||||
Jaws1 | 20 | Positive adjusted | (3.7% | ) | – | – | ||||||||||||||||||||
Grow dividends2 | 20 | Progressive | Progressive | 75 | 15.0 | |||||||||||||||||||||
Financial | 60 | 15.0 | ||||||||||||||||||||||||
Strategy execution | 15 | 75 | 11.3 | |||||||||||||||||||||||
Global standards including risk and compliance | 25 | 60 | 15.0 | |||||||||||||||||||||||
Non-financial | 40 | 26.3 | ||||||||||||||||||||||||
Total performance outcome | 100 | 41.3 | ||||||||||||||||||||||||
| 1 | Revenue growth less operating expense, on an adjusted basis. |
| 2 | Dividend per ordinary share (US dollar) in respect of the year, measured year on year; consistent with the growth of the overall profitability of the Group, predicated on the continued ability to meet with regulatory capital requirements. |
| | Return on equity | • In February 2015, the Group announced an updated medium-term return on equity target of greater than 10%. The Group did not achieve the stated target in 2015, with return on equity decreasing from 7.3% in 2014 to 7.2% for the year.
• Significant items, including fines, penalties, UK customer redress and associated provisions, as well as the UK bank levy, continue to have a significant effect, reducing our return on equity in 2015 by 190 basis points.
• The Committee acknowledged the progress being made to implement the 10 strategic actions announced at the June 2015 Investor Update which are being undertaken to improve the return on equity. However, the Committee decided not to make any award under this opportunity.
| ||
| Jaws | • The Group targeted the achievement of positive adjusted jaws in 2015. As this target was not met, the Committee judged that no award should be made under this element of the scorecard.
• The Group’s ability to generate revenue growth was affected by a slowdown in global trade, reflecting reduced commodity prices, and weaker investor sentiment in the second half of 2015 following stock market corrections in Asia. Operating expenses increased, as expected, reflecting wage inflation, continuing investment in strategic growth areas and in regulatory programmes and compliance.
• The Committee noted positive momentum on costs in the second half of the year, with cost growth slowing and a reduction in staff numbers. This was achieved through a strong focus on cost management and the initial effect of our cost saving programmes.
| |||
| Grow dividends | • The Group is committed to increasing the dividends we pay to shareholders each year, measured by dividends per ordinary share in respect of the year. Prospective dividend growth remains dependent upon the long term overall profitability of the Group and delivering further release of less efficiently deployed capital. Actions to address these points are core elements of the Investor Update provided in June 2015.
• The Group was able to increase the dividend per ordinary share in 2015 as well as improve its capital position. The Group’s strong capital position supports its capacity to generate dividend growth, despite a challenging operating environment.
| |||
HSBC HOLDINGS PLC
310 |
Table of Contents
| | Strategy execution | • The Group outlined 10 Strategic Actions at the June 2015 Investor Update to re-size and simplify the Group and redeploy resources to capture future growth opportunities.
• There was strong progress in driving reductions in RWAs, with 45% of the targeted 2017 RWA reduction delivered to date. The Group is implementing several transformation programmes to streamline the cost base, and it was noted that more work is required to meet related medium-term targets in this regard.
• The Group has set the foundations for further growth in Asia, investing in select locations, for example, the Pearl River Delta in mainland China and in products, including Insurance and asset management. The Committee also noted the Group’s role in driving the internationalisation of the renminbi and business scale in ASEAN.
| ||
| Global Standards including risk and compliance | • The Group published Global Standards for AML and sanctions compliance in all countries and progressed the implementation of enhanced controls and related data initiatives. Significant effort continues towards embedding the enhanced standards and controls and improving operational effectiveness.
• The Committee noted progress made, and that material work remains to comply fully with enhanced Global Standards by the end of 2017.
• However, the Committee exercised its discretion and the assessment was reduced from 75% to 60%. This was based on feedback received from the Monitor, matters arising from risk and compliance incidents, and the number and extent of unsatisfactory internal audits covering AML and sanctions related issues.
| |||
Fees and benefits
| Fees | Benefits9 | Total | ||||||||||||||||||||||||||||||||||
| 2015 | 2014 | 2015 | 2014 | 2015 | 2014 | |||||||||||||||||||||||||||||||
| £000 | £000 | £000 | £000 | £000 | £000 | |||||||||||||||||||||||||||||||
Phillip Ameen1 | 403 | – | 13 | – | 416 | – | ||||||||||||||||||||||||||||||
Kathleen Casey | 155 | 129 | 29 | 12 | 184 | 141 | ||||||||||||||||||||||||||||||
Safra Catz2 | 95 | 95 | 4 | 4 | 99 | 99 | ||||||||||||||||||||||||||||||
Laura Cha3 | 238 | 197 | 14 | 22 | 252 | 219 | ||||||||||||||||||||||||||||||
Lord Evans of Weardale | 190 | 167 | 9 | 14 | 199 | 181 | ||||||||||||||||||||||||||||||
Joachim Faber | 145 | 145 | 14 | 10 | 159 | 155 | ||||||||||||||||||||||||||||||
Rona Fairhead4 | 510 | 494 | 14 | 19 | 524 | 513 | ||||||||||||||||||||||||||||||
Sam Laidlaw | 174 | 140 | 13 | – | 187 | 140 | ||||||||||||||||||||||||||||||
Irene Lee5 | 184 | – | 2 | – | 186 | – | ||||||||||||||||||||||||||||||
John Lipsky | 180 | 168 | 49 | 27 | 229 | 195 | ||||||||||||||||||||||||||||||
Rachel Lomax | 253 | 205 | 11 | 21 | 264 | 226 | ||||||||||||||||||||||||||||||
Heidi Miller6 | 175 | 52 | 31 | – | 206 | 52 | ||||||||||||||||||||||||||||||
Sir Simon Robertson | 195 | 260 | 12 | 6 | 207 | 266 | ||||||||||||||||||||||||||||||
Jonathan Symonds7 | 520 | 365 | 1 | 3 | 521 | 368 | ||||||||||||||||||||||||||||||
Pauline van der Meer Mohr8 | 32 | – | 5 | – | 37 | – | ||||||||||||||||||||||||||||||
Total | 3,449 | 2,417 | 221 | 138 | 3,670 | 2,555 | ||||||||||||||||||||||||||||||
Total ($000) | 5,274 | 3,979 | 338 | 229 | 5,609 | 4,208 | ||||||||||||||||||||||||||||||
| 1 | Appointed as a non-executive Director of HSBC Holdings plc on 1 January 2015. Includes fees of £278,000 in 2015 as Director, Chairman of the Audit Committee and member of the Risk Committee of HSBC North America Holdings Inc. |
| 2 | Retired as a Director on 31 December 2015. |
| 3 | Includes fees of £63,000 in 2015 (£57,000 for 2014) as Director, Deputy Chairman and member of the Nomination Committee of The Hongkong and Shanghai Banking Corporation Limited. |
| 4 | Includes a fee of £360,000 in 2015 (£334,000 for 2014) as non-executive Chairman of HSBC North America Holdings Inc. |
| 5 | Appointed as a non-executive Director of HSBC Holdings plc on 1 July 2015. Includes fees of £137,000 in 2015 as Director and member of the Audit Committee of The Hongkong and Shanghai Banking Corporation Limited and as Director, member of the Audit Committee and Chairman of the Risk Committee of Hang Seng Bank Limited. |
| 6 | Includes a fee of £20,000 as a non-executive Director and member of the Nominating and Governance Committee of HSBC North America Holdings Inc. following appointment on 1 October 2015. |
| 7 | Includes a fee of £345,000 in 2015 (£247,000 for 2014) as non-executive Chairman of HSBC Bank plc. |
| 8 | Appointed on 1 September 2015. |
| 9 | Benefits include accommodation and travel-related expenses relating to the attendance at Board and other meetings at HSBC Holdings registered office. Amounts disclosed have been grossed up using a tax rate of 45%, where relevant. |
Alexander Flockhart
Mr Flockhart’s employment with HSBC ended on 30 April 2012. The Directors’ Remuneration Report in the 2012 ARA provided details of the remuneration arrangements that applied to Mr Flockhart at the time of his retirement. The former executive Director moved from Hong Kong to the UK on 1 January 2011 to undertake his appointment as executive Director, Chairman of Europe, MENA, LAM and
CMB. Due to the number of visits he was required to make to the UK prior to his appointment, additional UK tax relating to the period prior to his appointment and relocation to the UK became due. This liability is in addition to the Hong Kong taxes paid and borne by Mr Flockhart in respect of the same employment related income, i.e. it was subject to double taxation both in Hong Kong and the UK, therefore does not represent any additional remuneration payable to Mr Flockhart in relation to services provided to HSBC. A payment of £155,503 was made to Mr Flockhart in
HSBC HOLDINGS PLC
311 |
Table of Contents
Directors’ Remuneration Report(continued)
Annual report on remuneration
2015 in relation to the tax incurred in this respect and the professional services provided by Deloitte LLP in resolving this matter.
This report does not include details of payments made to past Directors below thede minimis limit set by the company of £50,000.
No employees who served as executive Directors during the year have a right to amounts under any HSBC final salary pension schemes for their services as executive Directors or are entitled to additional benefits in the event of early retirement. There is no
retirement age set for Directors, but the normal retirement age for employees is 65.
No payments for loss of office were made in 2015 to any person serving as a Director in the year or any previous years.
Scheme interests awarded during 2015
The table below sets out the scheme interests awarded to Directors in 2015 (for performance in 2014) as disclosed in the 2014 Directors’ Remuneration Report. No non-executive Directors received scheme interests during the financial year.
Scheme awards in 2015
Type of interest awarded | Basis on which award made |
| Dates of award |
|
| Face value awarded £000 | 1
|
| Percentage receivable for minimum performance |
2 |
| Number of shares awarded |
|
| Share price on date of grant |
1 |
| End of performance period |
| |||||||||||
Stuart Gulliver | Deferred cash | Annual incentive 2014 | 2 Mar 2015 | 387 | – | n/a | n/a | 31 Dec 2014 | ||||||||||||||||||||||
Stuart Gulliver | Deferred shares | Annual incentive 2014 | 2 Mar 2015 | 387 | – | 67,016 | £5.773 | 31 Dec 2014 | ||||||||||||||||||||||
Stuart Gulliver | Deferred shares | GPSP 2014 | 2 Mar 2015 | 2,112 | – | 365,864 | £5.773 | 31 Dec 2014 | ||||||||||||||||||||||
Iain Mackay | Deferred cash | Annual incentive 2014 | 2 Mar 2015 | 260 | – | n/a | n/a | 31 Dec 2014 | ||||||||||||||||||||||
Iain Mackay | Deferred shares | Annual incentive 2014 | 2 Mar 2015 | 260 | – | 45,037 | £5.773 | 31 Dec 2014 | ||||||||||||||||||||||
Iain Mackay | Deferred shares | GPSP 2014 | 2 Mar 2015 | 1,131 | – | 195,969 | £5.773 | 31 Dec 2014 | ||||||||||||||||||||||
Marc Moses | Deferred cash | Annual incentive 2014 | 2 Mar 2015 | 310 | – | n/a | n/a | 31 Dec 2014 | ||||||||||||||||||||||
Marc Moses | Deferred shares | Annual incentive 2014 | 2 Mar 2015 | 310 | – | 53,698 | £5.773 | 31 Dec 2014 | ||||||||||||||||||||||
Marc Moses | Deferred shares | GPSP 2014 | 2 Mar 2015 | 1,131 | – | 195,969 | £5.773 | 31 Dec 2014 | ||||||||||||||||||||||
GPSP awards made based on performance up to the financial year-end preceding the grant date with no further performance conditions after grant. Vesting occurs five years after grant date and is normally subject to the Director remaining an employee on the vesting date. Any shares (net of tax) which the director becomes entitled to on the vesting date are subject to a retention requirement.
The above table does not include details of shares issued as part of the Fixed Pay Allowances, as those shares vest immediately and are not subject to any service or performance conditions.
| 1 | Share price used is the closing mid-market price on the last working day preceding the date of grant. |
| 2 | Awards determined based on performance achieved during the period to 31 December 2014. The overall award level could have been 0% of the maximum opportunity if minimum performance was achieved for the period to 31 December 2014. After grant, awards are subject to service condition and malus provisions. |
HSBC TSR and FTSE 100 Index
The graph shows the TSR performance against the FTSE 100 Index for the seven-year period that ended on 31 December 2015. The FTSE 100 Index has been chosen as this is a recognised broad equity market index of which HSBC Holdings is a member.
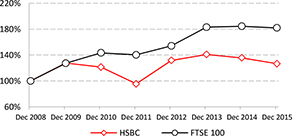
Source: Datastream
HSBC HOLDINGS PLC
312 |
Table of Contents
Historical CEO remuneration
The table below summarises the CEO’s single figure remuneration over the past seven years together with the outcomes of the respective annual incentive and long-term incentive awards.
|
| Single figure of remuneration |
|
| Annual incentive maximum |
2 |
| Annual incentive paid |
2 |
| Long-term incentive maximum |
4 |
| Long-term incentive paid |
4 | ||||||||||
| (£000) | (% of fixed pay) | 3 | (% of maximum) | (% of fixed pay) | 3 | (% of maximum) | ||||||||||||||||||
2015 | Stuart Gulliver | 7,340 | 67 | 45.0 | 133 | 41.3 | ||||||||||||||||||
2014 | Stuart Gulliver | 7,619 | 67 | 54.1 | 133 | 44.3 | ||||||||||||||||||
2013 | Stuart Gulliver | 8,033 | 300 | 49.0 | 600 | 49.0 | ||||||||||||||||||
2012 | Stuart Gulliver | 7,532 | 300 | 52.0 | 600 | 40.0 | ||||||||||||||||||
2011 | Stuart Gulliver | 8,047 | 300 | 57.5 | 600 | 50.0 | ||||||||||||||||||
20101 | Michael Geoghegan | 7,932 | 400 | 81.6 | 700 | 19.1 | ||||||||||||||||||
20091 | Michael Geoghegan | 7,580 | 400 | 93.5 | 700 | 25.4 | ||||||||||||||||||
| 1 | The GPSP was introduced in 2011. Prior to this, values shown relate to awards of Performance Shares under the HSBC Share Plan. Under this plan Performance Share awards vest three years after grant subject to performance conditions of total shareholder return, economic profit and earnings per share, and an over-riding ‘sustained improvement’ judgement by the committee. |
| 2 | The 2012 annual incentive figure for Stuart Gulliver used for this table includes 60% of the annual incentive disclosed in the 2012 Directors’ Remuneration Report which was deferred for five years. The vesting of these awards is subject to service condition and satisfactory completion of the US DPA. The US DPA condition ends on or around the fifth anniversary of the award date unless the DPA is extended or otherwise continues beyond that date, in which case the awards will vest on or around the date on which it expires and otherwise ceases to operate. |
| 3 | For 2014 and 2015, fixed pay includes base salary, fixed pay allowance and pension allowance for the year, and excludes benefits. For 2013 and earlier, fixed pay includes base salary only. |
| 4 | Long-term incentive awards are shown in the year where the performance period is deemed to be substantially completed. For performance share awards this is at the end of the third financial year following the date of grant (Performance Share awards shown in 2010 therefore relate to awards granted in 2008). For GPSP awards this is at the end of the financial year preceding the date of grant (GPSP awards shown in 2011 to 2015 therefore relate to awards granted in 2012 to 2016). |
Comparison of Group CEO and all-employee pay
The following table compares the changes in Group CEO pay to changes in employee pay between 2014 and 2015:
Percentage change in remuneration
|
| Base salary |
| Benefits |
| Annual incentive | 5 | ||||||
Group CEO | – | 1 | 12% | 3 | (17) | % | ||||||
Employee group | 8% | 2 | (5)% | 4 | (5) | % | ||||||
| 1 | Group CEO’s total fixed pay has not increased since 1 January 2014. |
| 2 | The comparator group has been changed to local full-time UK employees as representative of employees from the different business and functions across the Group. During 2015, certain allowances and other benefits were rolled up into base salaries, resulting in an overall increase in the average base salary per employee. |
| 3 | There has been no change in the benefits provided to the Group CEO or any new benefit provided to the Group CEO during 2015. The benefit value of the bank-owned property in Hong Kong is based on the current market rental value as estimated by an external lease service provider. As the market value of the accommodation has increased in 2015 this has resulted in a higher reportable value of this benefit in the single figure table. |
| 4 | Employee group consists of UK employees eligible for taxable benefits only as it was deemed the most appropriate comparison for the Group CEO given varying local requirements. There has been no change in the benefit coverage from 2014 to 2015 and the reduction in the average cost of benefit per employee is reflective of the decrease in the cost of providing such benefit on average. During 2015, approximately 20,000 more employees became eligible for these benefits and the overall cost per employee reduced. |
| 5 | Employee group consists of all employees globally, based on annual incentive pool less GPSP as disclosed in financial reports and staff numbers(full-time equivalents at the financial year-end). |
HSBC HOLDINGS PLC
313 |
Table of Contents
Directors’ Remuneration Report(continued)
Annual report on remuneration
Directors’ interests in shares
The shareholdings of all persons who were Directors in 2015 (including the shareholdings of their connected
persons) at 31 December 2015 are set out below. The table below shows the comparison of shareholdings to the company shareholding guidelines.
Shares
| At 31 December 2015 | ||||||||||||||||||||||
| Scheme interests | ||||||||||||||||||||||
|
| Shareholding guidelines (number of shares) |
2 |
| Share interests (number of |
| Shares awarded subject to deferral1 | ||||||||||||||||
|
| Share options | 3 |
| without performance conditions | 4 | | with performance | | ||||||||||||||
Executive Directors | ||||||||||||||||||||||
Douglas Flint | 400,000 | 401,450 | 2,919 | – | – | |||||||||||||||||
Stuart Gulliver | 750,000 | 2,861,265 | – | 2,955,619 | 92,185 | |||||||||||||||||
Iain Mackay | 450,000 | 223,872 | 3,469 | 1,187,436 | 63,730 | |||||||||||||||||
Marc Moses | 450,000 | 624,643 | – | 1,484,903 | 61,917 | |||||||||||||||||
Group Managing Directors5 | 250,000 | n/a | n/a | n/a | n/a | |||||||||||||||||
Non-executive Directors6 | ||||||||||||||||||||||
Phillip Ameen | 15,000 | 5,000 | n/a | n/a | n/a | |||||||||||||||||
Kathleen Casey | 15,000 | 3,540 | n/a | n/a | n/a | |||||||||||||||||
Safra Catz7 | 15,000 | 20,970 | n/a | n/a | n/a | |||||||||||||||||
Laura Cha | 15,000 | 5,200 | n/a | n/a | n/a | |||||||||||||||||
Lord Evans of Weardale | 15,000 | 7,416 | n/a | n/a | n/a | |||||||||||||||||
Joachim Faber | 15,000 | 45,778 | n/a | n/a | n/a | |||||||||||||||||
Rona Fairhead | 15,000 | 77,888 | n/a | n/a | n/a | |||||||||||||||||
Sam Laidlaw | 15,000 | 38,012 | n/a | n/a | n/a | |||||||||||||||||
John Lipsky | 15,000 | 16,165 | n/a | n/a | n/a | |||||||||||||||||
Rachel Lomax | 15,000 | 18,900 | n/a | n/a | n/a | |||||||||||||||||
Heidi Miller | 15,000 | 3,695 | n/a | n/a | n/a | |||||||||||||||||
Sir Simon Robertson | 15,000 | 34,118 | n/a | n/a | n/a | |||||||||||||||||
Jonathan Symonds | 15,000 | 21,771 | n/a | n/a | n/a | |||||||||||||||||
| 1 | The gross number of shares is disclosed. A portion of these shares will be sold at vesting to cover any income tax and social security which falls due at the time of vesting. |
| 2 | The current shareholding guideline does not count unvested share-based incentives. |
| 3 | All share options are unvested and unexercised. |
| 4 | Includes GPSP awards which are made following an assessment of performance over the relevant period ending on 31 December immediately before the grant date but are subject to a five-year vesting period. |
| 5 | All of the Group Managing Directors are expected to meet their minimum shareholding guideline by 2019 or within five years of the date of their appointment, whichever is later. |
| 6 | Irene Lee and Pauline van der Meer Mohr did not hold any HSBC Holdings plc shares during the year. |
| 7 | Retired as a Director on 31 December 2015. |
Share options
| Exercisable | At 1 Jan | Exercised | At 31 Dec | |||||||||||||||||||||||||||
| Date of award | Exercise price | From | 1 | until | 2015 | in year | 2015 | |||||||||||||||||||||||
Douglas Flint | 24 Apr 2012 | 4.4621 | 1 Aug 2015 | 1 Feb 2016 | 2,016 | 2,016 | – | |||||||||||||||||||||||
Douglas Flint | 23 Sep 2014 | 5.1887 | 1 Nov 2019 | 1 May 2020 | 2,919 | – | 2,919 | |||||||||||||||||||||||
Iain Mackay | 23 Sep 2014 | 5.1887 | 1 Nov 2017 | 1 May 2018 | 3,469 | – | 3,469 | |||||||||||||||||||||||
| 1 | May be advanced to an earlier date in certain circumstances, e.g. retirement. |
The HSBC Sharesave is an all-employee share plan under which eligible employees may be granted options to acquire HSBC Holdings ordinary shares. Employees may make contributions of up to £500 (or equivalent) each month over a period of three or five years which may be used on or around the third or fifth anniversary of the commencement of the relevant savings contract, at the employee’s election, to exercise the options. The plans help align the interests of employees with the creation of shareholder value. The options were awarded for nil consideration and are exercisable at a 20% discount to the average market value of the ordinary shares on the five business days immediately preceding the invitation date.
There are no performance criteria conditional upon which the outstanding options are exercisable and there have been no variations to the terms and conditions since the awards were made. The market value per ordinary share at 31 December 2015 was £5.3620. The market value per ordinary share at the time Douglas Flint exercised his options during the year was £5.5620. Market value is the mid-market price derived from the London Stock Exchange Daily Official List on the relevant date. Under the Securities and Futures Ordinance of Hong Kong, the options are categorised as unlisted physically settled equity derivatives.
HSBC HOLDINGS PLC
314 |
Table of Contents
The table below shows the outcome of the remuneration-related votes at the AGM held on 24 April 2015 and the last policy vote at the AGM held on 23 May 2014.
Number of votes cast | For | Against | Withheld | |||||||||||||||
Advisory vote on 2014 Remuneration Report | 8,808,959,472 |
| 6,720,428,674 (76.29% | ) |
| 2,088,530,798 (23.71% | ) | 677,821,869 | ||||||||||
Binding vote on the Remuneration Policy | 9,781,954,191 |
| 7,762,051,505 (79.35% | ) |
| 2,019,902,686 (20.65% | ) | 167,509,544 | ||||||||||
At the AGM on 24 April 2015, investors who voted against the 2014 remuneration report expressed concerns with the level of cash in lieu of pension and the structure and measurement of performance outcome in the annual incentive and GPSP scorecard. The Committee chairman met with representative group of shareholders to discuss these concerns.
Taking on board investor concerns, the Committee reduced the cash in lieu of pension for executive Directors from 50% of base salary to 30% of base salary from 1 January 2016. This reduces the fixed pay of all executive Directors and
also the maximum variable pay potential for the executive Directors due to the regulatory variable pay cap limiting the variable pay to 200% of fixed pay.
We have also changed the approach to our long-term incentive going forward so that awards are subject to three-year forward-looking performance period in line with FTSE practice. This change in approach brings clearer and greater alignment between the scorecard outcome and the achievement of our group strategic objectives, our performance and shareholder value creation. The annual and long-term incentive scorecards are provided below.
Implementation of remuneration policy in 2016 for executive Directors
The table below summarises how each element of pay will be implemented in 2016.
Operation and planned changes to policy
| ||||||||||
| Douglas Flint | Stuart Gulliver | Iain Mackay | Marc Moses | |||||||
Element of pay | ||||||||||
Fixed pay | ||||||||||
Base salary | £1,500,000 | £1,250,000 | £700,000 | £700,000 | ||||||
Fixed pay allowance | Nil | £1,700,000 | £950,000 | £950,000 | ||||||
Pension | 30% of base salary | 30% of base salary | 30% of base salary | 30% of base salary | ||||||
Benefits | ||||||||||
Benefits | Addition of post-departure benefits to support obligations under the Senior Managers Regime for up to seven years from departure. | |||||||||
Variable pay | ||||||||||
Annual incentive | Not eligible | • Awards delivered in shares, subject into a minimum six-month retention period.
• Maximum opportunity will be 213% of base salary.
| ||||||||
Long-term incentive | Not eligible | • Awards made in shares, subject to a three-year performance period from 1 January 2017.
• Awards will vest pro rata over five years, with the first vesting in 2020.
• A retention period may be applied to ensure compliance with regulatory requirements.
• Maximum opportunity will be 319% of base salary.
| ||||||||
The weightings and performance measures to apply to the 2016 annual incentive for Stuart Gulliver, Iain Mackay and Marc Moses are disclosed. These align to the Group’s strategic and financial objectives set out in June 2015.
The performance targets for the annual incentive are commercially sensitive and it would be detrimental to the interests of the Group to disclose them before the start of the financial year. Subject to commercial sensitivity, we will disclose the targets after the end of the relevant financial year in that year’s remuneration report.
HSBC HOLDINGS PLC
315 |
Table of Contents
Directors’ Remuneration Report(continued)
Annual report on remuneration
2016 annual incentive scorecards
Stuart Gulliver
Measures
| Description
| Weighting
| ||||||
Profit before tax | • Group’s reported profit before tax1 | 20% | ||||||
Deliver cost savings | • Group adjusted cost base | 20% | ||||||
Reduce Group RWA | • Reduction of Group RWAs | 10% | ||||||
Strategic growth | • Asia growth
– Pearl River Delta revenue, ASEAN revenue, RMB revenue
• International (ex-Asia) growth
– Rebuild profitability in Mexico and US
– Revenue growth from international network | 10% | ||||||
Total financial outcomes | 60% | |||||||
Global Standards including risk and compliance | • Embedding of AML, Sanctions and Anti-Bribery and Corruption policies
• Enhancement of customer due diligence
• Implementation and embedding of global conduct programme
• Progress on embedding Global Standards | 25% | ||||||
Personal objectives | • Progress transactions in Brazil and Turkey
• Progress key milestones on set-up of UK ring-fenced bank
• Delivery of other high priority projects
• People development including diversity | 15% | ||||||
Total risk | 40% | |||||||
Total2 | 100% | |||||||
Iain Mackay
| ||||||||
Measures
| Description
| Weighting
| ||||||
Profit before tax | • Group’s reported profit before tax1 | 20% | ||||||
Deliver cost savings | • Group adjusted cost base | 20% | ||||||
Reduce Group RWA | • Reduction of Group RWAs | 10% | ||||||
Total financial outcomes | 50% | |||||||
Global Standards including risk and compliance | • Strengthen governance and control around financial processes
• Delivery of controls optimisation project
• Implementation and embedding of global conduct programme
• Enhancement of operational risk management framework
• Successful delivery of stress testing in key markets | 25% | ||||||
Personal objectives | • Deliver cost savings
• Implementation of consistent capital management framework
• Progress key milestones on set-up of UK ring-fenced bank
• People development including diversity | 25% | ||||||
Total risk | 50% | |||||||
Total2 | 100% | |||||||
Marc Moses
| ||||||||
Measures
| Description
| Weighting
| ||||||
Profit before tax | • Group’s reported profit before tax1 | 10% | ||||||
Reduce Group RWA | • Reduction of Group RWAs | 15% | ||||||
Total financial outcomes | 25% | |||||||
Global Standards including risk and compliance | • Embedding of AML, Sanctions and Anti-Bribery and Corruption policies
• Enhancement of customer due diligence
• Implementation and embedding of global conduct programme
• Enhancement of operational risk management framework
• Implementation of US risk management measures | 50% | ||||||
Personal objectives | • Deliver cost savings
• Successful delivery of stress testing
• Support business growth and improve RWA effectiveness/efficiency
• People development including diversity | 25% | ||||||
Total risk | 75% | |||||||
Total2 | 100% | |||||||
HSBC HOLDINGS PLC
316 |
Table of Contents
Group long-term incentive scorecard
The measures and weightings of the performance measures to apply to the long-term incentives for Stuart Gulliver, Iain Mackay and Marc Moses are given below. The first grant will be in March 2017, as such the performance period will run from 1 January 2017 to 31 December 2019.
As the performance period does not start until 1 January 2017, the performance targets for this award have not yet been set. The targets set will be disclosed in the Directors’ Remuneration Report in theAnnual Report and Accounts 2016.
Measures
| Description
| Weighting
| ||||||
Return on equity | • Target strongly aligned to the business strategy and a primary financial goal of the Group based on expected capital requirements | 20% | ||||||
Cost efficiency (jaws) | • Focuses management on driving revenue growth while managing operating expense | 20% | ||||||
Relative total shareholder return | • Ensures alignment with shareholder value creation • Measured by ranking against a global financial services peer group | 20% | ||||||
Total financial outcomes | 60% | |||||||
Global Standards including risk and compliance | • Successfully embed Global Standards across the Group | 25% | ||||||
Strategy | • Progress on Group strategic objectives | 15% | ||||||
Total risk | 40% | |||||||
Total2 | 100% | |||||||
| 1 | Adjusted to exclude movements in fair value of own debt attributable to credit spread, the gains and losses from disposals and the debit valuation adjustment. |
| 2 | Eligibility for an annual incentive and long-term incentive award requires confirmation of adherence to HSBC Values through a minimum behavioural rating. |
Implementation of remuneration policy in 2016 for non-executive Directors
The Committee has reviewed the fee levels payable to the non-executive Directors. No changes have been made to the fees for 2016.
Category
| Current
| |||||
Base fee
| £
| 95,000
|
| |||
Senior Independent Director
| £
| 45,000
|
| |||
Audit, Risk, Remuneration, Financial System Vulnerabilities Committee and Conduct & Values Committee |
Chairman
|
£
|
50,000
|
| ||
| Member | £
| 30,000
|
| |||
Nomination Committee |
Chairman
|
£
|
40,000
|
| ||
| Member
| £
| 25,000
|
| |||
Philanthropic & Community Investment Oversight Committee |
Chairman
|
£
|
25,000
|
| ||
| Member
| £
| 15,000
|
| |||
HSBC HOLDINGS PLC
317 |
Table of Contents
Directors’ Remuneration Report(continued)
Appendix
Appendix to Directors’ Remuneration Report
Additional disclosures
This appendix provides disclosures required under the Hong Kong Ordinances, Hong Kong Listing Rules, Project Merlin agreement, Financial Conduct Authority’s Prudential Sourcebook for Banks and the US Securities and Exchange Commission Form 20-F disclosures.
Employee compensation and benefits
Emoluments of Directors
Set out below are details of emoluments paid to executive Directors for the year ended 31 December 2015.
| Douglas Flint | Stuart Gulliver | Iain Mackay | Marc Moses | |||||||||||||||||||||||||||||||||||||||||||||
| 2015 | 2014 | 2015 | 2014 | 2015 | 2014 | 2015 | 2014 | |||||||||||||||||||||||||||||||||||||||||
| £000 | £000 | £000 | £000 | £000 | £000 | £000 | £000 | |||||||||||||||||||||||||||||||||||||||||
Basic salaries, allowances and benefits in kind | 2,496 | 2,491 | 4,290 | 4,217 | 2,082 | 2,071 | 2,035 | 2,039 | ||||||||||||||||||||||||||||||||||||||||
Pension contributions | – | – | – | – | – | – | – | – | ||||||||||||||||||||||||||||||||||||||||
Performance-related pay paid or receivable | – | – | 3,041 | 3,402 | 2,169 | 1,998 | 1,928 | 2,164 | ||||||||||||||||||||||||||||||||||||||||
Inducements to join paid or receivable | – | – | – | – | – | – | – | – | ||||||||||||||||||||||||||||||||||||||||
Compensation for loss of office | – | – | – | – | – | – | – | – | ||||||||||||||||||||||||||||||||||||||||
Total | 2,496 | 2,491 | 7,331 | 7,619 | 4,251 | 4,069 | 3,963 | 4,203 | ||||||||||||||||||||||||||||||||||||||||
Total ($000) | 3,815 | 4,101 | 11,204 | 12,545 | 6,497 | 6,700 | 6,057 | 6,922 | ||||||||||||||||||||||||||||||||||||||||
The aggregate amount of Directors emoluments as defined above (including both executive Directors and non-executive Directors) for the year ended 2015 was $33,182,072. Additionally, the aggregate amount of payments in relation to notional return on deferred cash for the year ended 2015 was $29,339. As per policy, benefits in kind may include, but are not limited to, the provision of medical insurance, income protection insurance, health assessment, life assurance, club membership, tax assistance, Hong Kong accommodation for Stuart Gulliver, car benefit, travel assistance, and relocation costs (including any tax due on the benefit, where applicable). Amounts are converted into US dollars based on the average year-to-date exchange rates for the respective year.
Emoluments of senior management
Set out below are details of emoluments paid to senior management (being executive Directors and Group Managing Directors of HSBC Holdings) for the year ended 31 December 2015 or for the period of appointment as a Director or Group Managing Director.
Emoluments of senior management
Senior management £000 | ||||||
Basic salaries, allowances and benefits in kind | 31,713 | |||||
Pension contributions | 408 | |||||
Performance-related pay paid or receivable | 26,858 | |||||
Inducements to join paid or receivable | – | |||||
Compensation for loss of office | – | |||||
Total | 58,979 | |||||
Total ($000) | 90,142 | |||||
The aggregate emoluments of senior management for the year ended 31 December 2015 was $89,415,897. The emoluments of senior management were within the following bands:
Number of management | ||||||
£0 – £1,000,000 | 5 | |||||
£1,000,001 – £2,000,000 | 1 | |||||
£2,000,001 – £3,000,000 | 5 | |||||
£3,000,001 – £4,000,000 | 1 | |||||
£4,000,001 – £5,000,000 | 2 | |||||
£5,000,001 – £6,000,000 | 2 | |||||
£6,000,001 – £7,000,000 | 1 | |||||
£7,000,001 – £8,000,000 | 1 | |||||
The aggregate amount set aside or accrued to provide pension, retirement or similar benefits for executive Directors and senior management for the year ended 31 December 2015 was $624,072.
HSBC HOLDINGS PLC
318 |
Table of Contents
Emoluments of five highest paid employees
Set out below are details of remuneration paid to the five individuals whose emoluments were the highest in HSBC (including two executive Directors and three Group Managing Directors of HSBC Holdings), for the year ended 31 December 2015.
Emoluments of the five highest paid employees
5 highest paid employees £000 | ||||||
Basic salaries, allowances and benefits in kind | 16,108 | |||||
Pension contributions | 117 | |||||
Performance-related pay paid or receivable | 12,700 | |||||
Inducements to join paid or receivable | – | |||||
Compensation for loss of office | – | |||||
Total | 28,925 | |||||
Total ($000) | 44,207 | |||||
The emoluments of the five highest paid employees were within the following bands:
Number of 5 highest paid employees | ||||||
£4,200,001 – £4,300,000 | 1 | |||||
£5,200,001 – £5,300,000 | 2 | |||||
£6,800,001 – £6,900,000 | 1 | |||||
£7,300,001 – £7,400,000 | 1 | |||||
Remuneration of eight highest paid senior executives
Set out below are details of the remuneration of the eight highest paid senior executives (including members of the GMB, but not Directors of HSBC Holdings):
| Employee | ||||||||||||||||||||||||||||||||||||||||||||||||
| 1 | 2 | 3 | 4 | 5 | 6 | 7 | 8 | |||||||||||||||||||||||||||||||||||||||||
| £000 | £000 | £000 | £000 | £000 | £000 | £000 | £000 | |||||||||||||||||||||||||||||||||||||||||
Fixed | ||||||||||||||||||||||||||||||||||||||||||||||||
Cash based | 655 | 656 | 655 | 667 | 276 | 654 | 354 | 655 | ||||||||||||||||||||||||||||||||||||||||
Shares-based | 3,016 | 1,678 | 904 | 786 | 449 | 327 | 444 | 224 | ||||||||||||||||||||||||||||||||||||||||
Total fixed | 3,671 | 2,333 | 1,559 | 1,453 | 725 | 981 | 797 | 879 | ||||||||||||||||||||||||||||||||||||||||
Annual incentive1 | ||||||||||||||||||||||||||||||||||||||||||||||||
Cash | 549 | 375 | 424 | 394 | 271 | 216 | 227 | 194 | ||||||||||||||||||||||||||||||||||||||||
Non-deferred shares2 | 549 | 375 | 424 | 394 | 271 | 216 | 227 | 194 | ||||||||||||||||||||||||||||||||||||||||
Deferred cash3 | 824 | 563 | 635 | 590 | 407 | 323 | 341 | 290 | ||||||||||||||||||||||||||||||||||||||||
Deferred shares3 | 824 | 563 | 635 | 590 | 407 | 323 | 341 | 290 | ||||||||||||||||||||||||||||||||||||||||
Total annual incentive | 2,746 | 1,876 | 2,118 | 1,968 | 1,356 | 1,078 | 1,136 | 968 | ||||||||||||||||||||||||||||||||||||||||
GPSP | ||||||||||||||||||||||||||||||||||||||||||||||||
Deferred shares | 305 | 209 | 235 | 219 | 151 | 120 | 126 | 108 | ||||||||||||||||||||||||||||||||||||||||
Total variable pay | 3,051 | 2,085 | 2,353 | 2,187 | 1,507 | 1,198 | 1,262 | 1,076 | ||||||||||||||||||||||||||||||||||||||||
Total remuneration | 6,722 | 4,418 | 3,912 | 3,640 | 2,232 | 2,179 | 2,059 | 1,955 | ||||||||||||||||||||||||||||||||||||||||
Total remuneration ($000) | 10,272 | 6,754 | 5,979 | 5,563 | 3,410 | 3,330 | 3,148 | 2,986 | ||||||||||||||||||||||||||||||||||||||||
| 1 | Annual incentive in respect of performance year 2015. |
| 2 | Awards vested, subject to a six-month retention period. |
| 3 | Awards vest over a three-year period, 33% vests on or around the first and second anniversary of grant and 34% on or around third anniversary of grant. |
Pillar 3 remuneration disclosures
The following tables show the remuneration awards made by HSBC to its Identified Staff and MRTs for 2015. Individuals have been identified as MRTs based on the qualitative and quantitative criteria set out in the Regulatory Technical Standard EU 604/2014 and additional criteria determined by the Committee. Given this, the total number of MRTs for 2015 has increased from 2014.
These disclosures reflect the requirements of the FCA’s Prudential Sourcebook for Banks.
HSBC HOLDINGS PLC
319 |
Table of Contents
Directors’ remuneration Report(continued)
Appendix
Aggregate remuneration expenditure
| Global business aligned | ||||||||||||||||||||||||||||||||||||
| Retail Banking and Wealth Management | Commercial Banking | Global Banking and Markets | Global Private Banking | Non-global business aligned | Total | |||||||||||||||||||||||||||||||
| $m | $m | $m | $m | $m | $m | |||||||||||||||||||||||||||||||
Aggregate remuneration expenditure1 | ||||||||||||||||||||||||||||||||||||
2015 | 106.9 | 77.6 | 797.8 | 76.2 | 411.9 | 1,470.4 | ||||||||||||||||||||||||||||||
2014 | 94.3 | 61.7 | 741.3 | 70.2 | 374.4 | 1,341.9 | ||||||||||||||||||||||||||||||
| 1 | Includes salary and incentives awarded in respect of performance in the years 2014 and 2015 (including deferred component) and any pension or benefits outside of policy. |
Remuneration – fixed and variable amounts – Group-wide
| 2015 | 2014 | |||||||||||||||||||||||||||||||||||
|
| Senior manage- ment |
1 |
| MRTs (non-senior manage- ment) |
| Total |
| Senior manage- ment |
1 |
| MRTs (non-senior manage- ment) |
| Total | |||||||||||||||||||||||
Number of MRTs | 101 | 1,208 | 1,309 | 98 | 1,080 | 1,178 | ||||||||||||||||||||||||||||||
| $m | $m | $m | $m | $m | $m | |||||||||||||||||||||||||||||||
Fixed | ||||||||||||||||||||||||||||||||||||
Cash-based | 67.9 | 567.3 | 635.2 | 64.1 | 517.0 | 581.1 | ||||||||||||||||||||||||||||||
Shares-based | 51.3 | 82.8 | 134.1 | 51.8 | 88.7 | 140.5 | ||||||||||||||||||||||||||||||
Total fixed | 119.2 | 650.1 | 769.3 | 115.9 | 605.7 | 721.6 | ||||||||||||||||||||||||||||||
Variable2 | ||||||||||||||||||||||||||||||||||||
Cash | 20.0 | 157.5 | 177.5 | 18.5 | 138.9 | 157.4 | ||||||||||||||||||||||||||||||
Non-deferred shares3 | 20.0 | 147.8 | 167.8 | 18.5 | 132.0 | 150.5 | ||||||||||||||||||||||||||||||
Deferred cash | 27.5 | 135.1 | 162.6 | 24.9 | 119.5 | 144.4 | ||||||||||||||||||||||||||||||
Deferred shares | 47.1 | 146.0 | 193.1 | 41.5 | 126.4 | 167.9 | ||||||||||||||||||||||||||||||
Total variable pay4 | 114.6 | 586.4 | 701.0 | 103.4 | 516.8 | 620.2 | ||||||||||||||||||||||||||||||
| 1 | Definition of senior management includes members of the GMB, Group General Managers and non-executive Directors. |
| 2 | Variable pay awarded in respect of performance in the years 2014 and 2015. |
| 3 | Vested shares, subject to a six-month retention period. |
| 4 | In accordance with shareholder approval received on 23 May 2014, for each material risk-taker the variable component of remuneration for any one year is limited to 200% of fixed component of total remuneration of the material risk-taker. |
Remuneration – fixed and variable amounts – UK based
| 2015 | 2014 | |||||||||||||||||||||||||||||||||||
Senior manage- ment | MRTs (non-senior manage- | Total | Senior manage- ment | MRTs (non-senior manage- | Total | |||||||||||||||||||||||||||||||
Number of MRTs | 67 | 505 | 572 | 64 | 446 | 510 | ||||||||||||||||||||||||||||||
| $m | $m | $m | $m | $m | $m | |||||||||||||||||||||||||||||||
Total fixed | 77.6 | 274.1 | 351.7 | 73.1 | 244.5 | 317.6 | ||||||||||||||||||||||||||||||
Total variable pay1 | 68.5 | 238.4 | 306.9 | 60.7 | 205.2 | 265.9 | ||||||||||||||||||||||||||||||
| 1 | Variable pay awarded in respect of performance in the years 2014 and 2015. |
HSBC HOLDINGS PLC
320 |
Table of Contents
Deferred remuneration1
| 2015 | 2014 | |||||||||||||||||||||||||||||||||||
Senior manage- ment | MRTs (non-senior manage- ment) | Total | Senior manage- ment | MRTs (non-senior manage- ment) | Total | |||||||||||||||||||||||||||||||
| $m | $m | $m | $m | $m | $m | |||||||||||||||||||||||||||||||
Deferred remuneration at 31 December | ||||||||||||||||||||||||||||||||||||
Outstanding, unvested | 254.9 | 591.8 | 846.7 | 270.2 | 691.8 | 962.0 | ||||||||||||||||||||||||||||||
Awarded during the year | 67.3 | 286.5 | 353.8 | 112.6 | 353.8 | 466.4 | ||||||||||||||||||||||||||||||
Paid out2 | 73.6 | 408.8 | 482.4 | 33.9 | 210.3 | 244.2 | ||||||||||||||||||||||||||||||
Reduced through malus | – | – | – | – | – | – | ||||||||||||||||||||||||||||||
| 1 | This table provides details of actions taken during the performance years 2014 and 2015. For details of variable pay awards granted for the performance years 2014 and 2015, please refer to both the Remuneration tables above. |
| 2 | Vested shares are valued using share price as at day of vesting. |
Sign-on and severance payments
| 2015 | 2014 | |||||||||||||||||||||||||||||||||||
Senior manage- ment | MRTs (non-senior manage- ment) | Total | Senior manage- ment | MRTs (non-senior manage- ment) | Total | |||||||||||||||||||||||||||||||
Sign-on payments1 | ||||||||||||||||||||||||||||||||||||
Made during year ($m) | – | 14.0 | 14.0 | 1.9 | 2.6 | 4.5 | ||||||||||||||||||||||||||||||
Number of beneficiaries | – | 22 | 22 | 1 | 5 | 6 | ||||||||||||||||||||||||||||||
Severance payments2 | ||||||||||||||||||||||||||||||||||||
Awarded and paid during year ($m) | – | 0.9 | 0.9 | – | 4.1 | 4.1 | ||||||||||||||||||||||||||||||
Number of beneficiaries | – | 6 | 6 | – | 13 | 13 | ||||||||||||||||||||||||||||||
Highest such award to single person ($m) | – | 0.3 | 0.3 | – | 0.5 | 0.5 | ||||||||||||||||||||||||||||||
| 1 | Guaranteed variable pay awards granted to new hires and limited to their first year of service. |
| 2 | Represents non-standard termination payments made in excess of any local policies, standards or statutory amounts. |
Material risk takers’ remuneration by band1
| Number of 2015 MRTs | Number of 2014 MRTs | |||||||||||||||||||||||||||||||||||
Senior manage- ment | MRTs (non-senior manage- ment) | Total | Senior manage- ment | MRTs (non-senior manage- ment) | Total | |||||||||||||||||||||||||||||||
€0 –€1,000,000 | 29 | 827 | 856 | 29 | 829 | 858 | ||||||||||||||||||||||||||||||
€1,000,001 –€1,500,000 | 11 | 236 | 247 | 20 | 150 | 170 | ||||||||||||||||||||||||||||||
€1,500,001 –€2,000,000 | 19 | 71 | 90 | 10 | 54 | 64 | ||||||||||||||||||||||||||||||
€2,000,001 –€2,500,000 | 9 | 38 | 47 | 13 | 23 | 36 | ||||||||||||||||||||||||||||||
€2,500,001 –€3,000,000 | 7 | 15 | 22 | 10 | 12 | 22 | ||||||||||||||||||||||||||||||
€3,000,001 –€3,500,000 | 8 | 11 | 19 | 6 | 7 | 13 | ||||||||||||||||||||||||||||||
€3,500,001 –€4,000,000 | 4 | 3 | 7 | 3 | 3 | 6 | ||||||||||||||||||||||||||||||
€4,000,001 –€4,500,000 | 2 | 2 | 4 | 2 | 1 | 3 | ||||||||||||||||||||||||||||||
€4,500,001 –€5,000,000 | 4 | 4 | 8 | 2 | 1 | 3 | ||||||||||||||||||||||||||||||
€5,000,001 –€6,000,000 | 5 | 1 | 6 | 1 | – | 1 | ||||||||||||||||||||||||||||||
€6,000,001 –€7,000,000 | 1 | – | 1 | – | – | – | ||||||||||||||||||||||||||||||
€7,000,001 –€8,000,000 | – | – | – | 1 | – | 1 | ||||||||||||||||||||||||||||||
€8,000,001 –€9,000,000 | 1 | – | 1 | 1 | – | 1 | ||||||||||||||||||||||||||||||
€9,000,001 –€10,000,000 | 1 | – | 1 | – | – | – | ||||||||||||||||||||||||||||||
| 1 | Table prepared in euros in accordance with Article 450 of the Capital Requirements Regulation, using the rates published by the European Commission for financial programming and budget for December of the reported year as published on their website. |
HSBC HOLDINGS PLC
321 |
Table of Contents
This page is intentionally left blank.
HSBC HOLDINGS PLC
322 |
Table of Contents
Report of the Independent Registered Public Accounting
Firm to the Board of Directors and Shareholders of
HSBC Holdings plc
In our opinion, the accompanying consolidated balance sheet as of 31 December 2015 and the related consolidated statements of income, comprehensive income, changes in equity, and cash flows for the year then ended present fairly, in all material respects, the financial position of HSBC Holdings plc and its subsidiaries as of 31 December 2015 and the results of their operations and their cash flows for the year then ended in conformity with International Financial Reporting Standards as issued by the International Accounting Standards Board.
We also have audited the adjustments to the 2014 and 2013 financial statements to retrospectively apply the changes in disclosure as described in Note 1A. In our opinion, such adjustments are appropriate and have been properly applied. We were not engaged to audit, review, or apply any procedures to the 2014 or 2013 financial statements of the Company other than with respect to the adjustments and, accordingly, we do not express an opinion or any other form of assurance on the 2014 or 2013 financial statements taken as a whole.
Also in our opinion, the Company maintained, in all material respects, effective internal control over financial reporting as of 31 December 2015, based on criteria established inInternal Control – Integrated Framework (2013) issued by the Committee of Sponsoring Organisations of the Treadway Commission (COSO). The Company’s management is responsible for these financial statements, for maintaining effective internal control over financial reporting and for its assessment of the effectiveness of internal control over financial reporting, included in Management’s assessment of internal controls over financial reporting appearing on page 98a. Our responsibility is to express an opinion on these financial statements and on the Company’s internal control over financial reporting based on our integrated audit. We conducted our audit in accordance with the standards of the Public Company Accounting Oversight Board (United States). Those standards require that we plan and perform the audit to obtain reasonable assurance about whether the financial statements are free of material misstatement and whether effective internal control over financial reporting was maintained in all material respects. Our audit of the financial statements included examining, on a test basis, evidence supporting the amounts and disclosures in the financial statements, assessing the accounting principles used and significant estimates made by management, and evaluating the overall financial statement presentation. Our audit of internal control over financial reporting included obtaining an understanding of internal control over financial reporting, assessing the risk that a material weakness exists, and testing and evaluating the design and operating effectiveness of internal control based on the assessed risk. Our audit also included performing such other procedures as we considered necessary in the circumstances. We believe that our audit provides a reasonable basis for our opinions.
A company’s internal control over financial reporting is a process designed to provide reasonable assurance regarding the reliability of financial reporting and the preparation of financial statements for external purposes in accordance with generally accepted accounting principles. A company’s internal control over financial reporting includes those policies and procedures that (i) pertain to the maintenance of records that, in reasonable detail, accurately and fairly reflect the transactions and dispositions of the assets of the company; (ii) provide reasonable assurance that transactions are recorded as necessary to permit preparation of financial statements in accordance with generally accepted accounting principles, and that receipts and expenditures of the company are being made only in accordance with authorisations of management and directors of the company; and (iii) provide reasonable assurance regarding prevention or timely detection of unauthorised acquisition, use, or disposition of the company’s assets that could have a material effect on the financial statements.
Because of its inherent limitations, internal control over financial reporting may not prevent or detect misstatements. Also, projections of any evaluation of effectiveness to future periods are subject to the risk that controls may become inadequate because of changes in conditions, or that the degree of compliance with the policies or procedures may deteriorate.
PricewaterhouseCoopers LLP
London, United Kingdom
22 February 2016
HSBC HOLDINGS PLC
323 |
Table of Contents
This page is intentionally left blank.
HSBC HOLDINGS PLC
324 |
Table of Contents
This page is intentionally left blank.
HSBC HOLDINGS PLC
325 |
Table of Contents
This page is intentionally left blank.
HSBC HOLDINGS PLC
326 |
Table of Contents
This page is intentionally left blank.
HSBC HOLDINGS PLC
327 |
Table of Contents
This page is intentionally left blank.
HSBC HOLDINGS PLC
328 |
Table of Contents
This page is intentionally left blank.
HSBC HOLDINGS PLC
329 |
Table of Contents
This page is intentionally left blank.
HSBC HOLDINGS PLC
330 |
Table of Contents
This page is intentionally left blank.
HSBC HOLDINGS PLC
331 |
Table of Contents
This page is intentionally left blank.
HSBC HOLDINGS PLC
332 |
Table of Contents
This page is intentionally left blank.
HSBC HOLDINGS PLC
333 |
Table of Contents
This page is intentionally left blank.
HSBC HOLDINGS PLC
334 |
Table of Contents
Report of the Independent Registered Public Accounting
Firm to the Board of Directors and Shareholders of
HSBC Holdings plc
We have audited the accompanying consolidated financial statements of HSBC Holdings plc and its subsidiaries (together “HSBC”) on pages 337 to 469, before the effects of certain adjustments as described in Note 1A, which comprise the consolidated balance sheet as of 31 December 2014, and the related consolidated income statements, consolidated statements of comprehensive income, consolidated statements of cash flows and consolidated statements of changes in equity for each of the years in the two-year period ended 31 December 2014, including the disclosures marked ‘audited’ within the ‘Report of the Directors: Risk’ section on pages 101 to 226 and the ‘Report of the Directors: Capital’ section on pages 227 to 248. HSBC’s management is responsible for these consolidated financial statements. Our responsibility is to express an opinion on these consolidated financial statements based on our audits.
We conducted our audit in accordance with the standards of the Public Company Accounting Oversight Board (United States). Those standards require that we plan and perform the audit to obtain reasonable assurance about whether the financial statements are free of material misstatement. Our audit of the consolidated financial statements included examining, on a test basis, evidence supporting the amounts and disclosures in the financial statements, assessing the accounting principles used and significant estimates made by management, and evaluating the overall financial statement presentation. Our audit also included performing such other procedures as we considered necessary in the circumstances. We believe that our audit provides a reasonable basis for our opinion.
In our opinion, the consolidated financial statements referred to above, before the effects of certain adjustments as described in Note 1A, present fairly, in all material respects, the financial position of HSBC as of 31 December 2014, and the results of its operations and its cash flows for each of the years in the two-year period ended 31 December 2014, in conformity with International Financial Reporting Standards (‘IFRSs’) as adopted by the European Union (‘EU’) and IFRSs as issued by the International Accounting Standards Board (‘IASB’).
We were not engaged to audit, review, or apply any procedures to the adjustments of certain information as described in Note 1A, and, accordingly, we do not express an opinion or any other form of assurance about whether such adjustments are appropriate and have been properly applied. Those adjustments were audited by a successor auditor.
KPMG Audit Plc
London, England
23 February 2015
HSBC HOLDINGS PLC
335 |
Table of Contents
Financial Statement/Notes on the Financial Statements
| Financial Statements | ||||
|
| 337
|
| |
Consolidated statement of comprehensive income
|
| 338
|
| |
|
| 339
|
| |
Consolidated statement of cash flows
|
| 340
|
| |
Consolidated statement of changes in equity
|
| 341
|
| |
|
| 343
|
| |
HSBC Holdings statement of cash flows
|
| 344
|
| |
HSBC Holdings statement of changes in equity
|
| 345
|
| |
| Notes on the Financial Statements | ||||||
1
| Basis of preparation and significant accounting policies
|
| 347
|
| ||
2
| Net income from financial instruments designated at fair value
|
| 359
|
| ||
3
|
|
| 359
|
| ||
4
| Net insurance claims and benefits paid and movement in liabilities to policyholders
|
| 360
|
| ||
5
|
|
| 361
|
| ||
6
| Employee compensation and benefits
|
| 361
|
| ||
7
|
|
| 368
|
| ||
8
|
|
| 369
|
| ||
9
|
|
| 371
|
| ||
10
|
|
| 372
|
| ||
11
|
|
| 373
|
| ||
12
|
|
| 377
|
| ||
13
| Fair values of financial instruments carried at fair value
|
| 378
|
| ||
14
| Fair values of financial instruments not carried at fair value
|
| 390
|
| ||
15
| Financial assets designated at fair value
|
| 393
|
| ||
16
|
|
| 394
|
| ||
17
|
|
| 398
|
| ||
18
|
|
| 401
|
| ||
19
| Interests in associates and joint ventures
|
| 402
|
| ||
20
| Goodwill and intangible assets
|
| 406
|
| ||
21
|
|
| 414
|
| ||
22
| Prepayments, accrued income and other assets
|
| 416
|
| ||
23
| Assets held for sale and liabilities of disposal groups held for sale
|
| 416
|
| ||
24
|
|
| 417
|
| ||
25
| Financial liabilities designated at fair value
|
| 418
|
| ||
26
|
|
| 418
|
| ||
27
| Accruals, deferred income and other liabilities
|
| 419
|
| ||
28
| Liabilities under insurance contracts
|
| 419
|
| ||
29
|
|
| 421
|
| ||
30
|
|
| 423
|
| ||
31
| Maturity analysis of assets, liabilities andoff-balance sheet commitments
|
| 426
|
| ||
32
| Offsetting of financial assets and financial liabilities
|
| 434
|
| ||
33
|
|
| 436
|
| ||
34
|
|
| 436
|
| ||
35
| Called up share capital and other equity instruments
|
| 437
|
| ||
36
| Notes on the statement of cash flows
|
| 439
|
| ||
37
| Contingent liabilities, contractual commitments and guarantees
|
| 441
|
| ||
38
|
|
| 442
|
| ||
39
|
|
| 442
|
| ||
40
| Legal proceedings and regulatory matters
|
| 445
|
| ||
41
|
|
| 455
|
| ||
42
| Events after the balance sheet date
|
| 457
|
| ||
43
| HSBC Holdings’ subsidiaries, joint ventures and associates
|
| 457
|
| ||
44
|
|
| 469
|
| ||
HSBC HOLDINGS PLC
336 |
Table of Contents
for the year ended 31 December 2015
| 2015 | 2014 | 2013 | ||||||||||||||||||||
| Notes | $m | $m | $m | |||||||||||||||||||
Interest income | 47,189 | 50,955 | 51,192 | |||||||||||||||||||
Interest expense | (14,658 | ) | (16,250 | ) | (15,653 | ) | ||||||||||||||||
Net interest income | 32,531 | 34,705 | 35,539 | |||||||||||||||||||
Fee income | 18,016 | 19,545 | 19,973 | |||||||||||||||||||
Fee expense | (3,311 | ) | (3,588 | ) | (3,539 | ) | ||||||||||||||||
Net fee income | 14,705 | 15,957 | 16,434 | |||||||||||||||||||
Trading income excluding net interest income | 6,948 | 4,853 | 6,643 | |||||||||||||||||||
Net interest income on trading activities | 1,775 | 1,907 | 2,047 | |||||||||||||||||||
Net trading income | 8,723 | 6,760 | 8,690 | |||||||||||||||||||
Changes in fair value of long-term debt issued and related derivatives | 863 | 508 | (1,228 | ) | ||||||||||||||||||
Net income from other financial instruments designated at fair value | 669 | 1,965 | 1,996 | |||||||||||||||||||
Net income from financial instruments designated at fair value | 2 | 1,532 | 2,473 | 768 | ||||||||||||||||||
Gains less losses from financial investments | 2,068 | 1,335 | 2,012 | |||||||||||||||||||
Dividend income | 123 | 311 | 322 | |||||||||||||||||||
Net insurance premium income | 3 | 10,355 | 11,921 | 11,940 | ||||||||||||||||||
Other operating income | 1,055 | 1,131 | 2,632 | |||||||||||||||||||
Total operating income | 71,092 | 74,593 | 78,337 | |||||||||||||||||||
Net insurance claims and benefits paid and movement in liabilities to policyholders | 4 | (11,292 | ) | (13,345 | ) | (13,692 | ) | |||||||||||||||
Net operating income before loan impairment charges and other credit risk provisions | 59,800 | 61,248 | 64,645 | |||||||||||||||||||
Loan impairment charges and other credit risk provisions | 5 | (3,721 | ) | (3,851 | ) | (5,849 | ) | |||||||||||||||
Net operating income | 56,079 | 57,397 | 58,796 | |||||||||||||||||||
Employee compensation and benefits | 6 | (19,900 | ) | (20,366 | ) | (19,196 | ) | |||||||||||||||
General and administrative expenses | (17,662 | ) | (18,565 | ) | (17,065 | ) | ||||||||||||||||
Depreciation and impairment of property, plant and equipment | (1,269 | ) | (1,382 | ) | (1,364 | ) | ||||||||||||||||
Amortisation and impairment of intangible assets | 20 | (937 | ) | (936 | ) | (931 | ) | |||||||||||||||
Total operating expenses | (39,768 | ) | (41,249 | ) | (38,556 | ) | ||||||||||||||||
Operating profit | 5 | 16,311 | 16,148 | 20,240 | ||||||||||||||||||
Share of profit in associates and joint ventures | 19 | 2,556 | 2,532 | 2,325 | ||||||||||||||||||
Profit before tax | 18,867 | 18,680 | 22,565 | |||||||||||||||||||
Tax expense | 8 | (3,771 | ) | (3,975 | ) | (4,765 | ) | |||||||||||||||
Profit for the year | 15,096 | 14,705 | 17,800 | |||||||||||||||||||
Profit attributable to shareholders of the parent company | 13,522 | 13,688 | 16,204 | |||||||||||||||||||
Profit attributable to non-controlling interests | 1,574 | 1,017 | 1,596 | |||||||||||||||||||
| $ | $ | $ | ||||||||||||||||||||
Basic earnings per ordinary share | 10 | 0.65 | 0.69 | 0.84 | ||||||||||||||||||
Diluted earnings per ordinary share | 10 | 0.64 | 0.69 | 0.84 | ||||||||||||||||||
The accompanying notes on pages 347 to 469 form an integral part of these financial statements1.
For footnote, see page 346.
HSBC HOLDINGS PLC
337 |
Table of Contents
Financial Statement(continued)
Consolidated statement of comprehensive income / Consolidated balance sheet
Consolidated statement of comprehensive income
for the year ended 31 December 2015
| 2015 | 2014 | 2013 | ||||||||||||||||||
| $m | $m | $m | ||||||||||||||||||
Profit for the year | 15,096 | 14,705 | 17,800 | |||||||||||||||||
Other comprehensive income/(expense) | ||||||||||||||||||||
Items that will be reclassified subsequently to profit or loss when specific conditions are met: | ||||||||||||||||||||
Available-for-sale investments | (3,072 | ) | 2,972 | (1,718 | ) | |||||||||||||||
– fair value gains/(losses) | (1,231 | ) | 4,794 | (1,787 | ) | |||||||||||||||
– fair value gains reclassified to the income statement | (2,437 | ) | (1,672 | ) | (1,277 | ) | ||||||||||||||
– amounts reclassified to the income statement in respect of impairment losses | 127 | 374 | 286 | |||||||||||||||||
– income taxes | 469 | (524 | ) | 1,060 | ||||||||||||||||
Cash flow hedges | (24 | ) | 188 | (128 | ) | |||||||||||||||
– fair value gains | 704 | 1,512 | 776 | |||||||||||||||||
– fair value gains reclassified to the income statement | (705 | ) | (1,244 | ) | (894 | ) | ||||||||||||||
– income taxes | (23 | ) | (80 | ) | (10 | ) | ||||||||||||||
Share of other comprehensive income/(expense) of associates and joint ventures | (9 | ) | 80 | (71 | ) | |||||||||||||||
– share for the year | (9 | ) | 78 | (35 | ) | |||||||||||||||
– reclassified to income statement on disposal | – | 2 | (36 | ) | ||||||||||||||||
Exchange differences | (10,945 | ) | (8,903 | ) | (1,372 | ) | ||||||||||||||
– foreign exchange gains reclassified to income statement on disposal of a foreign operation | – | (21 | ) | (290 | ) | |||||||||||||||
– other exchange differences | (11,112 | ) | (8,917 | ) | (1,154 | ) | ||||||||||||||
– Income tax attributable to exchange differences | 167 | 35 | 72 | |||||||||||||||||
Items that will not be reclassified subsequently to profit or loss: | ||||||||||||||||||||
Remeasurement of defined benefit asset/liability | 101 | 1,985 | (458 | ) | ||||||||||||||||
– before income taxes | 130 | 2,419 | (601 | ) | ||||||||||||||||
– income taxes | (29 | ) | (434 | ) | 143 | |||||||||||||||
Other comprehensive income for the year, net of tax | (13,949 | ) | (3,678 | ) | (3,747 | ) | ||||||||||||||
Total comprehensive income for the year | 1,147 | 11,027 | 14,053 | |||||||||||||||||
Attributable to: | ||||||||||||||||||||
– shareholders of the parent company | 460 | 9,245 | 12,644 | |||||||||||||||||
– non-controlling interests | 687 | 1,782 | 1,409 | |||||||||||||||||
Total comprehensive income for the year | 1,147 | 11,027 | 14,053 | |||||||||||||||||
The accompanying notes on pages 347 to 469 form an integral part of these financial statements1.
For footnote, see page 346.
HSBC HOLDINGS PLC
338 |
Table of Contents
at 31 December 2015
| 2015 | 2014 | |||||||||||||||
| Notes | $m | $m | ||||||||||||||
| Assets | ||||||||||||||||
Cash and balances at central banks | 98,934 | 129,957 | ||||||||||||||
Items in the course of collection from other banks | 5,768 | 4,927 | ||||||||||||||
Hong Kong Government certificates of indebtedness | 28,410 | 27,674 | ||||||||||||||
Trading assets | 12 | 224,837 | 304,193 | |||||||||||||
Financial assets designated at fair value | 15 | 23,852 | 29,037 | |||||||||||||
Derivatives | 16 | 288,476 | 345,008 | |||||||||||||
Loans and advances to banks | 90,401 | 112,149 | ||||||||||||||
Loans and advances to customers | 924,454 | 974,660 | ||||||||||||||
Reverse repurchase agreements – non-trading | 146,255 | 161,713 | ||||||||||||||
Financial investments | 17 | 428,955 | 415,467 | |||||||||||||
Assets held for sale | 23 | 43,900 | 7,647 | |||||||||||||
Prepayments, accrued income and other assets | 22 | 54,398 | 67,529 | |||||||||||||
Current tax assets | 1,221 | 1,309 | ||||||||||||||
Interests in associates and joint ventures | 19 | 19,139 | 18,181 | |||||||||||||
Goodwill and intangible assets | 20 | 24,605 | 27,577 | |||||||||||||
Deferred tax assets | 8 | 6,051 | 7,111 | |||||||||||||
Total assets at 31 December | 2,409,656 | 2,634,139 | ||||||||||||||
| Liabilities and equity | ||||||||||||||||
Liabilities | ||||||||||||||||
Hong Kong currency notes in circulation | 28,410 | 27,674 | ||||||||||||||
Deposits by banks | 54,371 | 77,426 | ||||||||||||||
Customer accounts | 1,289,586 | 1,350,642 | ||||||||||||||
Repurchase agreements – non-trading | 80,400 | 107,432 | ||||||||||||||
Items in the course of transmission to other banks | 5,638 | 5,990 | ||||||||||||||
Trading liabilities | 24 | 141,614 | 190,572 | |||||||||||||
Financial liabilities designated at fair value | 25 | 66,408 | 76,153 | |||||||||||||
Derivatives | 16 | 281,071 | 340,669 | |||||||||||||
Debt securities in issue | 26 | 88,949 | 95,947 | |||||||||||||
Liabilities of disposal groups held for sale | 23 | 36,840 | 6,934 | |||||||||||||
Accruals, deferred income and other liabilities | 27 | 38,116 | 46,462 | |||||||||||||
Current tax liabilities | 783 | 1,213 | ||||||||||||||
Liabilities under insurance contracts | 28 | 69,938 | 73,861 | |||||||||||||
Provisions | 29 | 5,552 | 4,998 | |||||||||||||
Deferred tax liabilities | 8 | 1,760 | 1,524 | |||||||||||||
Subordinated liabilities | 30 | 22,702 | 26,664 | |||||||||||||
Total liabilities at 31 December | 2,212,138 | 2,434,161 | ||||||||||||||
Equity | ||||||||||||||||
Called up share capital | 35 | 9,842 | 9,609 | |||||||||||||
Share premium account | 12,421 | 11,918 | ||||||||||||||
Other equity instruments | 15,112 | 11,532 | ||||||||||||||
Other reserves | 7,109 | 20,244 | ||||||||||||||
Retained earnings | 143,976 | 137,144 | ||||||||||||||
Total shareholders’ equity | 188,460 | 190,447 | ||||||||||||||
Non-controlling interests | 34 | 9,058 | 9,531 | |||||||||||||
Total equity at 31 December | 197,518 | 199,978 | ||||||||||||||
Total liabilities and equity at 31 December | 2,409,656 | 2,634,139 | ||||||||||||||
The accompanying notes on pages 347 to 469 form an integral part of these financial statements1.
For footnote, see page 346.
Douglas Flint,Group Chairman |
Iain Mackay,Group Finance Director |

HSBC HOLDINGS PLC
339 |
Table of Contents
Financial Statements(continued)
Consolidated statement of cash flows / Consolidated statement of changes in equity
Consolidated statement of cash flows
for the year ended 31 December 2015
| 2015 | 2014 | 2013 | ||||||||||||||||||||
| Notes | $m | $m | $m | |||||||||||||||||||
Cash flows from operating activities | ||||||||||||||||||||||
Profit before tax | 18,867 | 18,680 | 22,565 | |||||||||||||||||||
Adjustments for: | ||||||||||||||||||||||
– net gain from investing activities | (1,935 | ) | (1,928 | ) | (1,458 | ) | ||||||||||||||||
– share of profits in associates and joint ventures | (2,556 | ) | (2,532 | ) | (2,325 | ) | ||||||||||||||||
– (gain)/loss on disposal of associates, joint ventures, subsidiaries and businesses | – | 9 | (1,173 | ) | ||||||||||||||||||
– other non-cash items included in profit before tax | 36 | 10,765 | 11,262 | 11,995 | ||||||||||||||||||
– change in operating assets | 36 | 65,828 | 25,877 | (148,899 | ) | |||||||||||||||||
– change in operating liabilities | 36 | (106,762 | ) | (93,814 | ) | 164,757 | ||||||||||||||||
– elimination of exchange differences3 | 18,308 | 24,571 | 4,479 | |||||||||||||||||||
– dividends received from associates | 879 | 757 | 694 | |||||||||||||||||||
– contributions paid to defined benefit plans | (664 | ) | (681 | ) | (962 | ) | ||||||||||||||||
– tax paid | (3,852 | ) | (3,573 | ) | (4,696 | ) | ||||||||||||||||
Net cash generated from/(used in) operating activities | (1,122 | ) | (21,372 | ) | 44,977 | |||||||||||||||||
Cash flows from investing activities | ||||||||||||||||||||||
Purchase of financial investments | (438,376 | ) | (384,199 | ) | (363,979 | ) | ||||||||||||||||
Proceeds from the sale and maturity of financial investments | 399,636 | 382,837 | 342,539 | |||||||||||||||||||
Purchase of property, plant and equipment | (1,352 | ) | (1,477 | ) | (1,952 | ) | ||||||||||||||||
Proceeds from the sale of property, plant and equipment | 103 | 88 | 441 | |||||||||||||||||||
Net cash inflow/(outflow) from disposal of customer and loan portfolios | 2,023 | (1,035 | ) | 6,518 | ||||||||||||||||||
Net investment in intangible assets | (954 | ) | (903 | ) | (834 | ) | ||||||||||||||||
Proceeds from disposal of Ping An | – | – | 7,413 | |||||||||||||||||||
Net cash inflow/(outflow) from disposal of other subsidiaries, businesses, associates and joint ventures | 8 | (272 | ) | 3,269 | ||||||||||||||||||
Net cash generated from/(used in) investing activities | (38,912 | ) | (4,961 | ) | (6,585 | ) | ||||||||||||||||
Cash flows from financing activities | ||||||||||||||||||||||
Issue of ordinary share capital | 147 | 267 | 297 | |||||||||||||||||||
Net sales/(purchases) of own shares for market-making and investment purposes | 331 | (96 | ) | (32 | ) | |||||||||||||||||
Issue of other equity instruments | 3,580 | 5,681 | – | |||||||||||||||||||
Redemption of preference shares and other equity instruments | (463 | ) | (234 | ) | – | |||||||||||||||||
Subordinated loan capital issued | 3,180 | 3,500 | 1,989 | |||||||||||||||||||
Subordinated loan capital repaid | (2,157 | ) | (3,163 | ) | (1,662 | ) | ||||||||||||||||
Dividends paid to shareholders of the parent company | (6,548 | ) | (6,611 | ) | (6,414 | ) | ||||||||||||||||
Dividends paid to non-controlling interests | (697 | ) | (639 | ) | (586 | ) | ||||||||||||||||
Dividends paid to holders of other equity instruments | (950 | ) | (573 | ) | (573 | ) | ||||||||||||||||
Net cash used in financing activities | (3,577 | ) | (1,868 | ) | (6,981 | ) | ||||||||||||||||
Net increase/(decrease) in cash and cash equivalents | (43,611 | ) | (28,201 | ) | 31,411 | |||||||||||||||||
Cash and cash equivalents at 1 January | 301,301 | 346,281 | 315,308 | |||||||||||||||||||
Exchange differences in respect of cash and cash equivalents | (13,827 | ) | (16,779 | ) | (438 | ) | ||||||||||||||||
Cash and cash equivalents at 31 December | 36 | 243,863 | 301,301 | 346,281 | ||||||||||||||||||
The accompanying notes on pages 347 to 469 form an integral part of these financial statements1.
For footnotes, see page 346.
HSBC HOLDINGS PLC
340 |
Table of Contents
Consolidated statement of changes in equity
for the year ended 31 December 2015
| Other reserves | ||||||||||||||||||||||||||||||||||||||||||||||||||||||||||||||||||
| | Called up share capital | |
| Share premium |
|
| Other equity instru- ments | 2 |
| Retained Earnings | 4,6 |
| Available- for-sale fair value reserve | 5 |
| Cash flow hedging reserve |
5 |
| Foreign exchange reserve |
5 |
| Merger reserve | 6,7 | | Total share- holders’ equity | |
| Non- controlling interests |
|
| Total equity |
| ||||||||||||||||||||||||||||||||||
| $m | $m | $m | $m | $m | $m | $m | $m | $m | $m | $m | ||||||||||||||||||||||||||||||||||||||||||||||||||||||||
At 1 January 2015 | 9,609 | 11,918 | 11,532 | 137,144 | 2,143 | 58 | (9,265 | ) | 27,308 | 190,447 | 9,531 | 199,978 | ||||||||||||||||||||||||||||||||||||||||||||||||||||||
Profit for the year | – | – |
| – |
| 13,522 | – | – | – | – | 13,522 | 1,574 | 15,096 | |||||||||||||||||||||||||||||||||||||||||||||||||||||
Other comprehensive income (net of tax) | – | – | – | 73 | (2,332 | ) | (24 | ) | (10,779 | ) | – | (13,062 | ) | (887 | ) | (13,949 | ) | |||||||||||||||||||||||||||||||||||||||||||||||||
– available-for-sale investments | – | – | – | – | (2,332 | ) | – | – | – | (2,332 | ) | (740 | ) | (3,072 | ) | |||||||||||||||||||||||||||||||||||||||||||||||||||
– cash flow hedges | – | – | – | – | – | (24 | ) | – | – | (24 | ) | – | (24 | ) | ||||||||||||||||||||||||||||||||||||||||||||||||||||
– remeasurement of defined benefit asset/liability | – | – | – | 82 | – | – | – | – | 82 | 19 | 101 | |||||||||||||||||||||||||||||||||||||||||||||||||||||||
– share of other comprehensive income of associates and joint ventures | – | – | – | (9 | ) | – | – | – | – | (9 | ) | – | (9 | ) | ||||||||||||||||||||||||||||||||||||||||||||||||||||
– exchange differences | – | – | – | – | – | – | (10,779 | ) | – | (10,779 | ) | (166 | ) | (10,945 | ) | |||||||||||||||||||||||||||||||||||||||||||||||||||
Total comprehensive income for the year | – | – | – | 13,595 | (2,332 | ) | (24 | ) | (10,779 | ) | – | 460 | 687 | 1,147 | ||||||||||||||||||||||||||||||||||||||||||||||||||||
Shares issued under employee remuneration and share plans | 45 | 691 | – | (589 | ) | – | – | – | – | 147 | – | 147 | ||||||||||||||||||||||||||||||||||||||||||||||||||||||
Shares issued in lieu of dividends and amounts arising thereon | 188 | (188 | ) | – | 3,162 | – | – | – | – | 3,162 | – | 3,162 | ||||||||||||||||||||||||||||||||||||||||||||||||||||||
Capital securities issued | – | – | 3,580 | – | – | – | – | – | 3,580 | – | 3,580 | |||||||||||||||||||||||||||||||||||||||||||||||||||||||
Dividends to shareholders | – | – | – | (10,660 | ) | – | – | – | – | (10,660 | ) | (697 | ) | (11,357 | ) | |||||||||||||||||||||||||||||||||||||||||||||||||||
Cost of share-based payment arrangements | – | – | – | 757 | – | – | – | – | 757 | – | 757 | |||||||||||||||||||||||||||||||||||||||||||||||||||||||
Other movements | – | – | – | 567 | – | – | – | – | 567 | (463 | ) | 104 | ||||||||||||||||||||||||||||||||||||||||||||||||||||||
At 31 December 2015 | 9,842 | 12,421 | 15,112 | 143,976 | (189 | ) | 34 | (20,044 | ) | 27,308 | 188,460 | 9,058 | 197,518 | |||||||||||||||||||||||||||||||||||||||||||||||||||||
At 1 January 2014 | 9,415 | 11,135 | 5,851 | 128,728 | 97 | (121 | ) | (542 | ) | 27,308 | 181,871 | 8,588 | 190,459 | |||||||||||||||||||||||||||||||||||||||||||||||||||||
Profit for the year | – | – | – | 13,688 | – | – | – | – | 13,688 | 1,017 | 14,705 | |||||||||||||||||||||||||||||||||||||||||||||||||||||||
Other comprehensive income (net of tax) | – | – | – | 2,066 | 2,025 | 189 | (8,723 | ) | – | (4,443 | ) | 765 | (3,678 | ) | ||||||||||||||||||||||||||||||||||||||||||||||||||||
– available-for-sale investments | – | – | – | – | 2,025 | – | – | – | 2,025 | 947 | 2,972 | |||||||||||||||||||||||||||||||||||||||||||||||||||||||
– cash flow hedges | – | – | – | – | – | 189 | – | – | 189 | (1 | ) | 188 | ||||||||||||||||||||||||||||||||||||||||||||||||||||||
– remeasurement of defined benefit asset/liability | – | – | – | 1,986 | – | – | – | – | 1,986 | (1 | ) | 1,985 | ||||||||||||||||||||||||||||||||||||||||||||||||||||||
– share of other comprehensive income of associates and joint ventures | – | – | – | 80 | – | – | – | – | 80 | – | 80 | |||||||||||||||||||||||||||||||||||||||||||||||||||||||
– exchange differences | – | – | – | – | – | – | (8,723 | ) | – | (8,723 | ) | (180 | ) | (8,903 | ) | |||||||||||||||||||||||||||||||||||||||||||||||||||
Total comprehensive income for the year | – | – | – | 15,754 | 2,025 | 189 | (8,723 | ) | – | 9,245 | 1,782 | 11,027 | ||||||||||||||||||||||||||||||||||||||||||||||||||||||
Shares issued under employee remuneration and share plans | 60 | 917 | – | (710 | ) | – | – | – | – | 267 | – | 267 | ||||||||||||||||||||||||||||||||||||||||||||||||||||||
Shares issued in lieu of dividends and amounts arising thereon | 134 | (134 | ) | – | 2,709 | – | – | – | – | 2,709 | – | 2,709 | ||||||||||||||||||||||||||||||||||||||||||||||||||||||
Capital securities issued | – | – | 5,681 | – | – | – | – | – | 5,681 | – | 5,681 | |||||||||||||||||||||||||||||||||||||||||||||||||||||||
Dividends to shareholders | – | – | – | (9,893 | ) | – | – | – | – | �� | (9,893 | ) | (712 | ) | (10,605 | ) | ||||||||||||||||||||||||||||||||||||||||||||||||||
Cost of share-based payment arrangements | – | – | – | 732 | – | – | – | – | 732 | – | 732 | |||||||||||||||||||||||||||||||||||||||||||||||||||||||
Other movements | – | – | – | (176 | ) | 21 | (10 | ) | – | – | (165 | ) | (127 | ) | (292 | ) | ||||||||||||||||||||||||||||||||||||||||||||||||||
At 31 December 2014 | 9,609 | 11,918 | 11,532 | 137,144 | 2,143 | 58 | (9,265 | ) | 27,308 | 190,447 | 9,531 | 199,978 | ||||||||||||||||||||||||||||||||||||||||||||||||||||||
HSBC HOLDINGS PLC
341 |
Table of Contents
Financial Statements(continued)
Consolidated statement of changes in equity / HSBC Holdings balance sheet
Consolidated statement of changes in equity(continued)
| Other reserves | ||||||||||||||||||||||||||||||||||||||||||||||||||||||||||||||||||
| | Called up share capital | |
| Share premium |
|
| Other equity instru- ments |
|
| Retained Earnings | 4,6 | | Available- for-sale fair value reserve | |
| Cash flow hedging reserve |
| | Foreign exchange reserve | |
| Merger reserve | 6,7 | | Total share- holders’ equity | |
| Non- controlling interests |
| | Total equity | | ||||||||||||||||||||||||||||||||||
| $m | $m | $m | $m | $m | $m | $m | $m | $m | $m | $m | ||||||||||||||||||||||||||||||||||||||||||||||||||||||||
At 1 January 2013 | 9,238 | 10,084 | 5,851 | 120,347 | 1,649 | 13 | 752 | 27,308 | 175,242 | 7,887 | 183,129 | |||||||||||||||||||||||||||||||||||||||||||||||||||||||
Profit for the year | – | – | – | 16,204 | – | – | – | – | 16,204 | 1,596 | 17,800 | |||||||||||||||||||||||||||||||||||||||||||||||||||||||
Other comprehensive income (net of tax) | – | – | – | (561 | ) | (1,577 | ) | (128 | ) | (1,294 | ) | – | (3,560 | ) | (187 | ) | (3,747 | ) | ||||||||||||||||||||||||||||||||||||||||||||||||
– available-for-sale investments | – | – | – | – | (1,577 | ) | – | – | – | (1,577 | ) | (141 | ) | (1,718 | ) | |||||||||||||||||||||||||||||||||||||||||||||||||||
– cash flow hedges | – | – | – | – | – | (128 | ) | – | – | (128 | ) | – | (128 | ) | ||||||||||||||||||||||||||||||||||||||||||||||||||||
– remeasurement of defined benefit asset/liability | – | – | – | (490 | ) | – | – | – | – | (490 | ) | 32 | (458 | ) | ||||||||||||||||||||||||||||||||||||||||||||||||||||
– share of other comprehensive income of associates and joint ventures | – | – | – | (71 | ) | – | – | – | – | (71 | ) | – | (71 | ) | ||||||||||||||||||||||||||||||||||||||||||||||||||||
– exchange differences | – | – | – | – | – | – | (1,294 | ) | – | (1,294 | ) | (78 | ) | (1,372 | ) | |||||||||||||||||||||||||||||||||||||||||||||||||||
Total comprehensive income for the year | – | – | – | 15,643 | (1,577 | ) | (128 | ) | (1,294 | ) | – | 12,644 | 1,409 | 14,053 | ||||||||||||||||||||||||||||||||||||||||||||||||||||
Shares issued under employee remuneration and share plans | 60 | 1,168 | – | (931 | ) | – | – | – | – | 297 | – | 297 | ||||||||||||||||||||||||||||||||||||||||||||||||||||||
Shares issued in lieu of dividends and amounts arising thereon | 117 | (117 | ) | – | 2,523 | – | – | – | – | 2,523 | – | 2,523 | ||||||||||||||||||||||||||||||||||||||||||||||||||||||
Dividends to shareholders | – | – | – | (9,510 | ) | – | – | – | – | (9,510 | ) | (718 | ) | (10,228 | ) | |||||||||||||||||||||||||||||||||||||||||||||||||||
Cost of share-based payment arrangements | – | – | – | 630 | – | – | – | – | 630 | – | 630 | |||||||||||||||||||||||||||||||||||||||||||||||||||||||
Other movements | – | – | – | 26 | 25 | (6 | ) | – | – | 45 | 10 | 55 | ||||||||||||||||||||||||||||||||||||||||||||||||||||||
At 31 December 2013 | 9,415 | 11,135 | 5,851 | 128,728 | 97 | (121 | ) | (542 | ) | 27,308 | 181,871 | 8,588 | 190,459 | |||||||||||||||||||||||||||||||||||||||||||||||||||||
The accompanying notes on pages 347 to 469 form an integral part of these financial statements1.
For footnotes, see page 346.
HSBC HOLDINGS PLC
342 |
Table of Contents
at 31 December 2015
| 2015 | 2014 | |||||||||||||
| Notes | $m | $m | ||||||||||||
Assets | ||||||||||||||
Cash at bank and in hand: | ||||||||||||||
– balances with HSBC undertakings | 242 | 249 | ||||||||||||
Derivatives | 16 | 2,467 | 2,771 | |||||||||||
Loans and advances to HSBC undertakings | 44,350 | 43,910 | ||||||||||||
Financial investments in HSBC undertakings | 4,285 | 4,073 | ||||||||||||
Prepayments, accrued income and other assets | 265 | 125 | ||||||||||||
Current tax assets | 723 | 472 | ||||||||||||
Investments in subsidiaries | 21 | 97,770 | 96,264 | |||||||||||
Intangible assets | 75 | – | ||||||||||||
Deferred tax assets | 17 | – | ||||||||||||
Total assets at 31 December | 150,194 | 147,864 | ||||||||||||
| Liabilities and equity | ||||||||||||||
Liabilities | ||||||||||||||
Amounts owed to HSBC undertakings | 2,152 | 2,892 | ||||||||||||
Financial liabilities designated at fair value | 25 | 19,853 | 18,679 | |||||||||||
Derivatives | 16 | 2,278 | 1,169 | |||||||||||
Debt securities in issue | 26 | 960 | 1,009 | |||||||||||
Accruals, deferred income and other liabilities | 1,642 | 1,398 | ||||||||||||
Deferred tax liabilities | – | 17 | ||||||||||||
Subordinated liabilities | 30 | 15,895 | 17,255 | |||||||||||
Total liabilities | 42,780 | 42,419 | ||||||||||||
Equity | ||||||||||||||
Called up share capital | 35 | 9,842 | 9,609 | |||||||||||
Share premium account | 12,421 | 11,918 | ||||||||||||
Other equity instruments | 15,020 | 11,476 | ||||||||||||
Other reserves | 37,907 | 37,456 | ||||||||||||
Retained earnings | 32,224 | 34,986 | ||||||||||||
Total equity | 107,414 | 105,445 | ||||||||||||
Total liabilities and equity at 31 December | 150,194 | 147,864 | ||||||||||||
The accompanying notes on pages 347 to 469 form an integral part of these financial statements1.
For footnote, see page 346.
Douglas Flint Group Chairman |
Iain Mackay Group Finance Director |


HSBC HOLDINGS PLC
343 |
Table of Contents
Financial Statements(continued)
HSBC Holdings statement of cash flows / HSBC Holdings statement of changes in equity
HSBC Holdings statement of cash flows
for the year ended 31 December 2015
| 2015 | 2014 | |||||||||||||
| Notes | $m | $m | ||||||||||||
Cash flows from operating activities | ||||||||||||||
Profit before tax | 4,282 | 6,228 | ||||||||||||
Adjustments for: | ||||||||||||||
– non-cash items included in profit before tax | 36 | 114 | 52 | |||||||||||
– change in operating assets | 36 | 543 | 1,854 | |||||||||||
– change in operating liabilities | 36 | (2,342 | ) | (9,914 | ) | |||||||||
– tax received | 470 | 133 | ||||||||||||
Net cash generated from/(used in) operating activities | 3,067 | (1,647 | ) | |||||||||||
Cash flows from investing activities | ||||||||||||||
Net cash outflow from acquisition of or increase in stake of subsidiaries | (2,118 | ) | (1,603 | ) | ||||||||||
Repayment of capital from subsidiaries | 790 | 3,505 | ||||||||||||
Net investment in intangible assets | (79 | ) | – | |||||||||||
Net cash generated from/(used in) investing activities | (1,407 | ) | 1,902 | |||||||||||
Cash flows from financing activities | ||||||||||||||
Issue of ordinary share capital | 678 | 924 | ||||||||||||
Issue of other equity instruments | 3,538 | 5,635 | ||||||||||||
Subordinated loan capital issued | 3,180 | 3,500 | ||||||||||||
Subordinated loan capital repaid | (1,565 | ) | (1,654 | ) | ||||||||||
Debt securities repaid | – | (1,634 | ) | |||||||||||
Dividends paid on ordinary shares | (6,548 | ) | (6,611 | ) | ||||||||||
Dividends paid to holders of other equity instruments | (950 | ) | (573 | ) | ||||||||||
Net cash used in financing activities | (1,667 | ) | (413 | ) | ||||||||||
Net decrease in cash and cash equivalents | (7 | ) | (158 | ) | ||||||||||
Cash and cash equivalents at 1 January | 249 | 407 | ||||||||||||
Cash and cash equivalents at 31 December | 36 | 242 | 249 | |||||||||||
The accompanying notes on pages 347 to 469 form an integral part of these financial statements1.
For footnote, see page 346.
HSBC HOLDINGS PLC
344 |
Table of Contents
HSBC Holdings statement of changes in equity
for the year ended 31 December 2015
| Other reserves | ||||||||||||||||||||||||||||||||||||||||||||||||
| | Called up share capital | |
| Share premium |
|
| Other equity instru- ments |
|
| Retained earnings | 8 |
| Available- for-sale fair value |
|
| Other paid-in capital |
9 |
| Merger and other reserves | 7 | | Total share- holders’ equity | | |||||||||||||||||||||||||
| $m | $m | $m | $m | $m | $m | $m | $m | |||||||||||||||||||||||||||||||||||||||||
At 1 January 2015 | 9,609 | 11,918 | 11,476 | 34,986 | 240 | 2,089 | 35,127 | 105,445 | ||||||||||||||||||||||||||||||||||||||||
Profit for the year | – | – | – | 4,853 | – | – | – | 4,853 | ||||||||||||||||||||||||||||||||||||||||
Other comprehensive income (net of tax) | – | – | – | – | (57 | ) | – | – | (57 | ) | ||||||||||||||||||||||||||||||||||||||
– available-for-sale investments | – | – | – | – | (77 | ) | – | – | (77 | ) | ||||||||||||||||||||||||||||||||||||||
– income tax | – | – | – | – | 20 | – | – | 20 | ||||||||||||||||||||||||||||||||||||||||
Total comprehensive income for the year | – | – | – | 4,853 | (57 | ) | – | – | 4,796 | |||||||||||||||||||||||||||||||||||||||
Shares issued under employee share plans | 45 | 691 | – | (59 | ) | – | – | – | 677 | |||||||||||||||||||||||||||||||||||||||
Shares issued in lieu of dividends and amounts arising thereon | 188 | (188 | ) | – | 3,162 | – | – | – | 3,162 | |||||||||||||||||||||||||||||||||||||||
Capital securities issued | – | – | 3,544 | – | – | – | – | 3,544 | ||||||||||||||||||||||||||||||||||||||||
Dividends to shareholders | – | – | – | (10,660 | ) | – | – | – | (10,660 | ) | ||||||||||||||||||||||||||||||||||||||
Tax credit on distributions | – | – | – | 157 | – | – | – | 157 | ||||||||||||||||||||||||||||||||||||||||
Own shares adjustment | – | – | – | 180 | – | – | – | 180 | ||||||||||||||||||||||||||||||||||||||||
Exercise and lapse of share options | – | – | – | (508 | ) | – | 508 | – | – | |||||||||||||||||||||||||||||||||||||||
Cost of share-based payment arrangements | – | – | – | 86 | – | – | – | 86 | ||||||||||||||||||||||||||||||||||||||||
Income taxes on share-based payments | – | – | – | 1 | – | – | – | 1 | ||||||||||||||||||||||||||||||||||||||||
Equity investments granted to employees of subsidiaries under employee share plans | – | – | – | 26 | – | – | – | 26 | ||||||||||||||||||||||||||||||||||||||||
At 31 December 2015 | 9,842 | 12,421 | 15,020 | 32,224 | 183 | 2,597 | 35,127 | 107,414 | ||||||||||||||||||||||||||||||||||||||||
At 1 January 2014 | 9,415 | 11,135 | 5,828 | 35,406 | 124 | 2,052 | 35,127 | 99,087 | ||||||||||||||||||||||||||||||||||||||||
Profit for the year | – | – | – | 6,527 | – | – | – | 6,527 | ||||||||||||||||||||||||||||||||||||||||
Other comprehensive income (net of tax) | – | – | – | – | 116 | – | – | 116 | ||||||||||||||||||||||||||||||||||||||||
– available-for-sale investments | – | – | – | – | 152 | – | – | 152 | ||||||||||||||||||||||||||||||||||||||||
– income tax | – | – | – | – | (36 | ) | – | – | (36 | ) | ||||||||||||||||||||||||||||||||||||||
Total comprehensive income for the year | – | – | – | 6,527 | 116 | – | – | 6,643 | ||||||||||||||||||||||||||||||||||||||||
Shares issued under employee share plans | 60 | 917 | – | (53 | ) | – | – | – | 924 | |||||||||||||||||||||||||||||||||||||||
Shares issued in lieu of dividends and amounts arising thereon | 134 | (134 | ) | – | 2,709 | – | – | – | 2,709 | |||||||||||||||||||||||||||||||||||||||
Capital securities issued | – | – | 5,648 | – | – | – | – | 5,648 | ||||||||||||||||||||||||||||||||||||||||
Dividends to shareholders | – | – | – | (9,893 | ) | – | – | – | (9,893 | ) | ||||||||||||||||||||||||||||||||||||||
Tax credit on distributions | – | – | – | 104 | – | – | – | 104 | ||||||||||||||||||||||||||||||||||||||||
Own shares adjustment | – | – | – | 103 | – | – | – | 103 | ||||||||||||||||||||||||||||||||||||||||
Exercise and lapse of share options | – | – | – | (37 | ) | – | 37 | – | – | |||||||||||||||||||||||||||||||||||||||
Cost of share-based payment arrangements | – | – | – | 74 | – | – | – | 74 | ||||||||||||||||||||||||||||||||||||||||
Income taxes on share-based payments | – | – | – | (2 | ) | – | – | – | (2 | ) | ||||||||||||||||||||||||||||||||||||||
Equity investments granted to employees of subsidiaries under employee share plans | – | – | – | 48 | – | – | – | 48 | ||||||||||||||||||||||||||||||||||||||||
At 31 December 2014 | 9,609 | 11,918 | 11,476 | 34,986 | 240 | 2,089 | 35,127 | 105,445 | ||||||||||||||||||||||||||||||||||||||||
Dividends per ordinary share at 31 December 2015 were $0.50 (2014: $0.49; 2013: $0.48).
The accompanying notes on pages 347 to 469 form an integral part of these financial statements1.
For footnotes, see page 346.
HSBC HOLDINGS PLC
345 |
Table of Contents
Financial Statements(continued)
Footnotes
Footnotes to the Financial Statements
| 1 | The audited sections of ‘Risk’ on pages 101 to 226, the audited sections of ‘Capital’ on pages 227 to 248 and the audited sections of ‘Directors’ Remuneration Report’ on pages 285 to 321 are also an integral part of these financial statements. |
| 2 | During 2015, HSBC Holdings issued $2,450m and €1,000 of Perpetual Subordinated Contingent Convertible Capital Securities, on which there were $12m of external issuance costs, $25m of intra-group issuance costs and $19m of tax. In 2014, HSBC Holdings issued $2,250m, $1,500m and €1,500m of Perpetual Subordinated Contingent Convertible Capital Securities, on which there were $13m of external issuance costs and $33m of intra-group issuance costs.Under IFRSs these issuance costs and tax benefits are classified as equity. |
| 3 | Adjustment to bring changes between opening and closing balance sheet amounts to average rates. This is not done on a line-by-line basis, as details cannot be determined without unreasonable expense. |
| 4 | Retained earnings include 81,580,180 ($1,604m) of own shares held within HSBC’s Insurance business, retirement funds for the benefit of policyholders or beneficiaries within employee trusts for the settlement of shares expected to be delivered under employee share schemes or bonus plans, and the market-making activities in Markets (2014: 85,337,430 ($641m); 2013: 85,997,271 ($915m)). |
| 5 | At 31 December 2015, our operations in Brazil were classified as held for sale (see Note 23). The cumulative amount of other reserves attributable to these operations were as follows: available-for-sale fair value reserve debit of $176m, cash flow hedging reserve credit of $34m and foreign exchange reserve debit of $2.6bn. |
| 6 | Cumulative goodwill amounting to $5,138m has been charged against reserves in respect of acquisitions of subsidiaries prior to 1 January 1998, including $3,469m charged against the merger reserve arising on the acquisition of HSBC Bank plc. The balance of $1,669m has been charged against retained earnings. |
| 7 | Statutory share premium relief under Section 131 of the Companies Act 1985 (the ‘Act’) was taken in respect of the acquisition of HSBC Bank plc in 1992, HSBC France in 2000 and HSBC Finance Corporation in 2003 and the shares issued were recorded at their nominal value only. In HSBC’s consolidated financial statements the fair value differences of $8,290m in respect of HSBC France and $12,768m in respect of HSBC Finance Corporation were recognised in the merger reserve. The merger reserve created on the acquisition of HSBC Finance Corporation subsequently became attached to HSBC Overseas Holdings (UK) Limited (‘HOHU’), following a number of intra-group reorganisations. During 2009, pursuant to Section 131 of the Companies Act 1985, statutory share premium relief was taken in respect of the rights issue and $15,796m was recognised in the merger reserve. The merger reserve includes the deduction of $614m in respect of costs relating to the rights issue, of which $149m was subsequently transferred to the income statement. Of this $149m, $121m was a loss arising from accounting for the agreement with the underwriters as a contingent forward contract. The merger reserve excludes the loss of $344m on a forward foreign exchange contract associated with hedging the proceeds of the rights issue. |
| 8 | Retained earnings include 67,881 ($1m) (2014: 179,419 ($3m)) of own shares held to fund employee share plans. |
| 9 | Other paid-in capital arises from the exercise and lapse of share options granted to employees of HSBC Holdings subsidiaries. |
HSBC HOLDINGS PLC
346 |
Table of Contents
Notes on the Financial Statements
1 – Basis of preparation and significant accounting policies
1 Basis of preparation and significant accounting policies
(a) Compliance with International Financial Reporting Standards
International Financial Reporting Standards (‘IFRSs’) comprise accounting standards issued or adopted by the International Accounting Standards Board (‘IASB’) and interpretations issued or adopted by the IFRS Interpretations Committee (‘IFRS IC’).
The consolidated financial statements of HSBC and the separate financial statements of HSBC Holdings have been prepared in accordance with IFRSs as issued by the IASB and as endorsed by the European Union (‘EU’). EU-endorsed IFRSs could differ from IFRSs as issued by the IASB if, at any point in time, new or amended IFRSs were not to be endorsed by the EU.
At 31 December 2015, there were no unendorsed standards effective for the year ended 31 December 2015 affecting these consolidated and separate financial statements, and there was no difference between IFRSs endorsed by the EU and IFRSs issued by the IASB in terms of their application to HSBC. Accordingly, HSBC’s financial statements for the year ended 31 December 2015 are prepared in accordance with IFRSs as issued by the IASB.
Standards adopted during the year ended 31 December 2015
There were no new standards applied during the year ended 31 December 2015.
During 2015, HSBC adopted a number of interpretations and amendments to standards which had an insignificant effect on the consolidated financial statements of HSBC and the separate financial statements of HSBC Holdings.
(b) Differences between IFRSs and Hong Kong Financial Reporting Standards
There are no significant differences between IFRSs and Hong Kong Financial Reporting Standards in terms of their application to HSBC and consequently there would be no significant differences had the financial statements been prepared in accordance with Hong Kong Financial Reporting Standards. The Notes on the Financial Statements, taken together with the Report of the Directors, include the aggregate of all disclosures necessary to satisfy IFRSs and Hong Kong reporting requirements.
(c) Future accounting developments
In addition to completing its projects on financial instrument accounting, revenue recognition and leasing, discussed below, the IASB is working on a project on insurance accounting which could represent significant changes to accounting requirements in the future.
Minor amendments to IFRSs
The IASB has published a number of minor amendments to IFRSs through the Annual Improvements to IFRSs 2012–2014 cycle and in a series of stand-alone amendments, one of which has not yet been endorsed for use in the EU. HSBC has not early applied any of the amendments effective after 31 December 2015 and it expects they will have an insignificant effect, when applied, on the consolidated financial statements of HSBC and the separate financial statements of HSBC Holdings.
Major new IFRSs
The IASB has published IFRS 9 ‘Financial Instruments’, IFRS 15 ‘Revenue from Contracts with Customers’ and IFRS 16 ‘Leases’. None of these IFRSs have yet been endorsed for use in the EU.
IFRS 9 ‘Financial Instruments’
In July 2014, the IASB issued IFRS 9 ‘Financial Instruments’, which is the comprehensive standard to replace IAS 39 ‘Financial Instruments: Recognition and Measurement’, and includes requirements for classification and measurement of financial assets and liabilities, impairment of financial assets and hedge accounting.
Classification and measurement
The classification and measurement of financial assets will depend on how these are managed (the entity’s business model) and their contractual cash flow characteristics. These factors determine whether the financial assets are measured at amortised cost, fair value through other comprehensive income (‘FVOCI’) or fair value through profit or loss (‘FVPL’). In many instances, the classification and measurement outcomes will be similar to IAS 39, although differences will arise. For example, under IFRS 9, embedded derivatives are not separated from host financial assets and equity securities are measured at FVPL or, in limited circumstances, fair value movements will be shown in OCI. The combined effect of the application of the business model and the contractual cash flow characteristics tests may result in some differences in the population of financial assets measured at amortised cost or fair value compared with IAS 39. The classification of financial liabilities is essentially unchanged. For certain liabilities measured at fair value, gains or losses relating to changes in the entity’s own credit risk are to be included in other comprehensive income.
HSBC conducted an assessment of potential classification and measurement changes to financial assets based on the composition of the balance sheet as at 31 December 2014. This may not be fully representative of the impact as at 1 January 2018 because IFRS 9 requires that business models be assessed based on the facts and circumstances from the date of initial application. In addition, the contractual terms and conditions of the financial assets assessed as at 31 December 2014 may not reflect the contractual terms and conditions of HSBC’s financial assets at transition. However, based on the assessment
HSBC HOLDINGS PLC
347 |
Table of Contents
Notes on the Financial Statements(continued)
1 – Basis of preparation and significant accounting policies
of financial assets as at 31 December 2014 and expectations around changes to balance sheet composition, HSBC expects that generally:
| • | loans and advances to banks and to customers and non-trading reverse repurchase agreements that are classified as loans and receivables under IAS 39 will be measured at amortised cost under IFRS 9; |
| • | financial assets designated at FVPL will remain at FVPL, because it is required under IFRS 9 or designation will continue; |
| • | debt securities classified as available for sale will primarily be measured at amortised cost or FVOCI, with a small minority at FVPL either because of their contractual cash flow characteristics or the business model within which they are held; |
| • | debt securities classified as held to maturity will be measured at amortised cost; |
| • | Treasury and other eligible bills classified as available for sale will be measured at amortised cost or FVOCI depending upon the business model in which they are held; and |
| • | all equity securities will remain measured at fair value. A significant majority will have fair value movements shown in profit or loss, while a minority will have fair value movements presented in other comprehensive income. The equity securities for which fair value movements will be shown in other comprehensive income are business facilitation and other similar investments where HSBC holds the investments other than to generate a capital return. |
Impairment
The impairment requirements apply to financial assets measured at amortised cost and FVOCI, and lease receivables and certain loan commitments and financial guarantee contracts. At initial recognition, allowance (or provision in the case of commitments and guarantees) is required for expected credit losses (‘ECL’) resulting from default events that are possible within the next 12 months (’12-month ECL’). In the event of a significant increase in credit risk, allowance (or provision) is required for ECL resulting from all possible default events over the expected life of the financial instrument (‘lifetime ECL’). Financial assets where 12-month ECL is recognised are considered to be ‘stage 1’; financial assets which are considered to have experienced a significant increase in credit risk are in ‘stage 2’; and financial assets for which there is objective evidence of impairment so are considered to be in default or otherwise credit impaired are in ‘stage 3’.
The assessment of whether credit risk has increased significantly since initial recognition is performed for each reporting period by considering the change in the risk of default occurring over the remaining life of the financial instrument, rather than by considering an increase in ECL.
The assessment of credit risk and the estimation of ECL are required to be unbiased and probability-weighted, and should incorporate all available information which is relevant to the assessment including information about past events, current conditions and reasonable and supportable forecasts of economic conditions at the reporting date. In addition, the estimation of ECL should take into account the time value of money. As a result, the recognition and measurement of impairment is intended to be more forward-looking than under IAS 39 and the resulting impairment charge will tend to be more volatile. It will also tend to result in an increase in the total level of impairment allowances, since all financial assets will be assessed for at least 12-month ECL and the population of financial assets to which lifetime ECL applies is likely to be larger than the population for which there is objective evidence of impairment in accordance with IAS 39.
Hedge accounting
The general hedge accounting requirements aim to simplify hedge accounting, creating a stronger link with risk management strategy and permitting hedge accounting to be applied to a greater variety of hedging instruments and risks. The standard does not explicitly address macro hedge accounting strategies, which are being considered in a separate project. To remove the risk of any conflict between existing macro hedge accounting practice and the new general hedge accounting requirements, IFRS 9 includes an accounting policy choice to remain with IAS 39 hedge accounting.
Based on the analysis performed to date, HSBC expects to exercise the accounting policy choice to continue IAS 39 hedge accounting and therefore is not currently planning to change hedge accounting, although it will implement the revised hedge accounting disclosures required by the related amendments to IFRS 7 ‘Financial Instruments: Disclosures’.
Transition
The classification and measurement and impairment requirements are applied retrospectively by adjusting the opening balance sheet at the date of initial application, with no requirement to restate comparative periods.
The mandatory application date for the standard as a whole is 1 January 2018, but it is possible to apply the revised presentation for certain liabilities measured at fair value from an earlier date. HSBC intends to revise the presentation of fair value gains and losses relating to the entity’s own credit risk on certain liabilities as soon as permitted by EU law. If this presentation was applied at 31 December 2015, the effect would be to decrease profit before tax with the opposite effect on other comprehensive income based on the change in fair value attributable to changes in HSBC’s credit risk for the year, with no effect on net assets. Further information on the change in fair value attributable to changes in credit risk, including HSBC’s credit risk, is disclosed in Note 25.
HSBC HOLDINGS PLC
348 |
Table of Contents
HSBC is assessing the impact that the financial asset classification and impairment requirements will have on the financial statements.
IFRS 9 implementation programme
Within HSBC, a joint Global Risk and Global Finance IFRS 9 Implementation Programme (‘the Programme’) has been set up to prepare for implementation of IFRS 9 since 2012 and significant preparatory and design work has taken place. The Programme is sponsored by the Group Chief Risk Officer and Group Finance Director. A Steering Committee comprising senior management from Risk, Finance and HSBC Operations, Services and Technology has been established. In common with all significant change programmes in HSBC, the Programme is managed according to the Group’s business transformation framework. Delivery of the required changes will be undertaken by individual workstreams, with Global Risk leading the work to calculate impairments and Global Finance leading the development of financial reporting systems and processes. Significant legal entities in the Group have established steering committees to manage implementation locally, within this global framework. Global businesses have been engaged but are not themselves responsible for the implementation activity.
To date, the Programme has been directed towards preliminary impact analysis, documenting Group accounting policy, developing the operating and system target operating models and developing risk modelling methodologies for the calculation of impairment. In addition, an impact assessment of the classification and measurement requirements was performed during 2015. The Programme’s focus is now on the impairment models and processes which need to be developed by the end of 2016 as HSBC intends to perform a parallel run during 2017 to gain a better understanding of the potential effect of the new standard. The Programme has a defined governance framework to operate over the impairment process once it becomes live. The framework includes dedicated committees to review, challenge and sign off the assumptions used and the results in each significant legal entity, and second-line assurance capabilities for each key step in the process. An expert panel will be established to govern the setting of forward-looking economic assumptions used in the process. Governance over the impairment process is the responsibility of the Global Risk and Global Finance functions, operating within each member company of the Group. Global businesses are consulted but are not granted decision making power.
HSBC intends to quantify the potential impact of IFRS 9 once it is practicable to provide reliable estimates, which will be no later than in theAnnual Report and Accounts 2017.
Until sufficient models have been developed and tested, HSBC will not have a reliable understanding of the potential impact on its financial statements and any consequential effects on regulatory capital requirements. In the absence of information on whether there will be any changes to the regulatory requirements, assumptions will have to be made about how the existing regulatory requirements will be interpreted when IFRS 9 is adopted. For example, the relationship between specific and general credit risk adjustments in accordance with Basel requirements and the IFRS 9 stages is unclear. The Basel Committee is considering the implications of the new accounting requirements for existing regulatory requirements.
Comparison of IAS 39 accounting policies with IFRS 9
The accounting policies and critical accounting estimates and judgements for the impairment of loans and advances and available-for-sale financial assets (in accordance with IAS 39 ‘Financial Instruments’) are set out in Note 1(j). Their equivalents for financial assets at amortised cost and at FVOCI (in accordance with IFRS 9) are being developed, but the following similarities and differences are likely to be important to understanding the potential effect of the change in accounting policy resulting from the implementation of IFRS 9 ‘Financial Instruments’:
| • | Amortised cost |
The accounting policies in accordance with IAS 39 generally make a distinction between individually significant loans and homogeneous groups of loans which are assessed collectively. This distinction has less relevance in developing IFRS 9 accounting policies. However, under IFRS 9, whether the loans are managed through wholesale credit risk systems or retail credit risk systems becomes the more relevant distinction because of differences in the types of information available and the way credit risk is managed.
| • | Stage 3 |
Financial assets will be included in stage 3 when there is objective evidence that the loan is credit impaired. The objective evidence that is used is the same as the criteria used by HSBC to determine whether an individually significant loan is impaired in accordance with IAS 39 and is set out on page 355. Therefore, the population included in stage 3 is expected to be consistent with impaired loans under IAS 39 which are considered individually significant.
For wholesale loans, individual discounted cash flow calculations will continue to be performed and impairment losses determined as set out on page 355. Changes may be made to these calculations to ensure the measurement requirements of IFRS 9 are met. For example, the net realisable value of security will be adjusted for expected future changes in market prices.
In accordance with IAS 39, statistical methods are used to determine impairment losses on a collective basis for homogeneous groups of loans that are not considered individually significant using either roll rate methodologies or historical loss rate experience for loans. Under these methodologies, impairment allowances are recognised at a portfolio level. However, loans are classified as impaired for presentation purposes when they are more than 90 days past due or have been renegotiated for
HSBC HOLDINGS PLC
349 |
Table of Contents
Notes on the Financial Statements(continued)
1 – Basis of preparation and significant accounting policies
credit risk reasons. For retail loans, an exception is made for individual loans that are in arrears by more than 90 days but have been individually assessed to have no indications of impairment, and these are not classified as impaired. Under IFRS 9, HSBC expects to determine stage 3 for these populations by considering the relevant objective evidence, primarily whether contractual payments of either principal or interest are past due for more than 90 days, or a concession has been granted to the borrower for economic or legal reasons relating to the borrower’s financial condition, or the loan is otherwise considered to be in default. HSBC does not expect to rebut the presumption in IFRS 9 that loans which are 90 days past due are in default for retail loans, even where regulatory rules permit default to be defined based on 180 days past due. The impairment allowance is expected to be determined by the same calculation used for stage 2, with the probability of default set to 1. The result may, therefore, not be the same as that determined by the current statistical methods and the population disclosed as stage 3 will not necessarily correspond with that disclosed as impaired in accordance with IAS 39.
Except for retail portfolios with regulatory default definitions of 180 days, HSBC’s intention is to align the definition of default with the regulatory definition as far as possible and for stage 3 to represent all loans which are considered defaulted or otherwise credit impaired.
The policy on the write-off of loans and advances included on page 357 is expected to remain unchanged.
As described on page 197, the contractual terms of a loan may be modified for a number of reasons, which include forbearance. Only some of the forbearance strategies result in loans being ‘renegotiated’. For such modifications, the current treatment as described on pages 197-198 and 357 will remain the same under IFRS 9, except for new loans recognised as a result of the original loan being derecognised following a renegotiation. These loans will be classified as originated credit-impaired and will retain this classification until derecognition. For all other modifications, the general policy on derecognition as described on page 401 will apply.
Other than originated credit-impaired loans, all other modified loans could be transferred out of stage 3 if they no longer exhibit any evidence of being credit impaired or, in the case of renegotiated loans, there is sufficient evidence to demonstrate a significant reduction in the risk of non-payment of future cash flows and there are no other indicators of impairment, as described on page 198. These loans could be transferred to stages 1 or 2 based on the mechanism as described below by comparing the risk of a default occurring at the reporting date (based on the modified contractual terms) and the risk of a default occurring at initial recognition (based on the original, unmodified contractual terms). Any amount written off as a result of the modification of contractual terms would not be reversed.
| • | Stage 2 |
In accordance with IFRS 9, financial assets are considered to be in stage 2 when their credit risk has increased significantly since initial recognition so it is appropriate to recognise lifetime ECL. Since this is not a concept in IAS 39, it is likely to result in increased allowance as the result of the recognition of lifetime ECL for populations that are not considered to be credit impaired.
The analysis of credit risk is multifactor and the determination of whether a specific factor is relevant and its weight compared with other factors will depend on the type of product, the characteristics of the financial instrument and the borrower, and the geographical region. Therefore, it is not possible to provide a single set of criteria that will determine what is considered to be a significant increase in credit risk. Since the concept is relative and significance in part depends on the credit risk at initial recognition, credit quality disclosures that report credit grades as at the balance sheet date may not reflect the populations in stage 2 or those that are at risk of moving to stage 2.
For wholesale portfolios and significant retail portfolios, HSBC intends to consider whether credit risk has increased significantly since initial recognition using a combination of individual and collective information, and will reflect the increase in credit risk at the individual loan level to the extent practicable.
The main factor that will be considered is a lifetime probability of default (‘PD’) or a 12-month PD where this provides a reasonable approximation of changes in the lifetime risk of default, adjusted to be consistent with the current economic conditions and the expected future economic conditions which are expected to affect credit risk. The PD will be derived from the customer risk rating for wholesale portfolios and from the credit scores for retail portfolios. The PD for wholesale is determined on an obligor level and for retail at the level of the individual facility. In situations where a 12-month PD would not be appropriate, for example, where the financial instrument only has significant payment obligations beyond the next 12 months, additional factors will be considered or adjustments made to ensure that the lifetime credit risk is appropriately considered.
The PDs will also be adjusted to incorporate the effect of economic assumptions, such as interest rates, unemployment rates and GDP forecasts that can be statistically related to changes in PD which have an impact beyond the next 12 months. These statistical relationships are expected to be established through the processes developed for stress testing. In addition, other relevant factors which may not be adequately reflected in the information used to derive PDs, including past due status and whether the financial asset is subject to additional monitoring through the watch list process for wholesale portfolios, will be taken into account.
HSBC HOLDINGS PLC
350 |
Table of Contents
HSBC is in the process of calibrating and testing the thresholds or magnitude of change required and mechanisms for transfer from stage 1 to stage 2 (and vice versa) across different portfolios so it is not possible to provide further detail at this time. The aim is to establish the points where the change in credit risk is considered meaningful in risk management terms and to test these points against subsequent stage movements and defaults. Where less sophisticated default metrics are used or credit scores are not available, as tends to apply with the less significant retail portfolios, a consistent but simplified approach is expected to be used. In particular, for any retail portfolio, days past due will be considered in determining loans transferred to stage 2 and the more significant portfolios will supplement this information with additional mechanisms linked to PDs. HSBC expects to finalise the transfer criteria for the more significant portfolios during 2016.
| • | Stage 1 |
In accordance with IAS 39 (see page 356), incurred but not yet identified impairment is recognised on individually assessed loans for which no evidence of impairment has been specifically identified by estimating a collective allowance determined after taking into account factors including the estimated period between impairment occurring and the loss being identified. This is assessed empirically on a periodic basis and may vary over time. Similarly, for homogeneous groups of loans and advances which are assessed under IAS 39 on a collective basis, the inherent loss is determined using risk factors including the period of time between loss identification and write-off which is regularly benchmarked against actual outcomes. Under IFRS 9, financial assets which are not considered to have significantly increased in credit risk have loss allowances measured at an amount equal to 12 months ECL. This 12-month time horizon is likely to be equal to or longer than the period estimated under IAS 39 (typically between 6 and 12 months), which will tend to result in IFRS 9 allowances being larger. In the absence of models able to calculate IFRS 9 allowances, it is not possible to estimate the difference.
Methodologies applied to measure 12-month and lifetime expected credit losses
ECLs are calculated using three main components, i.e. a probability of default (‘PD’), a loss given default (‘LGD’) and the exposure at default (‘EAD’). For accounting purposes, the 12-month and lifetime PDs represent the probability of a default occurring over the next 12 months or the lifetime of the financial instruments, respectively, based on conditions existing at the balance sheet date and future economic conditions that affect credit risk. The LGD represents losses expected on default, taking into account the mitigating effect of collateral, its expected value when realised and the time value of money. The EAD represents the expected balance at default, taking into account the repayment of principal and interest from the balance sheet date to the default event together with any expected drawdown of a committed facility.
12-month ECL is calculated by multiplying the 12-month PD, LGD and EAD. Lifetime ECL is calculated using the lifetime PD rather than the 12-month PD.
Credit loss modelling techniques
HSBC plans to base the ECL calculations on the systems used to calculate Basel expected losses (‘EL’s). This is considered to be most efficient given the similarities in the calculations. However, certain adjustments need to be made to the Basel risk components (PD, LGD, and EAD) to meet IFRS 9 requirements.
For wholesale portfolios and material residential mortgage and fixed-term loan portfolios, ECL will be calculated at the individual loan level. The main adjustments necessary to Basel risk components are explained in the table below:
Model
|
Regulatory capital
|
IFRS 9
| ||
| PD | • Through the cycle (represents long-run average PD throughout a full economic cycle) • The definition of default includes a backstop of 90+ days past due, although this has been modified to 180+ days past due for some portfolios, particularly UK and US mortgages | • Point in time (based on current conditions, adjusted to take into account estimates of future conditions that will impact PD) • Default backstop of 90+ days past due for all portfolios | ||
| EAD | • Cannot be lower than current balance | • Amortisation captured for term products | ||
| LGD | • Downturn LGD (consistent losses expected to be suffered during a severe but plausible economic downturn) • Regulatory floors may apply to mitigate risk of underestimating downturn LGD due to lack of historical data • Discounted using cost of capital • All collection costs included | • Expected LGD (based on estimate of loss given default including the expected impact of future economic conditions such as changes in value of collateral) • No floors • Discounted using the original effective interest rate of the loan • Only costs associated with obtaining/selling collateral included
| ||
| Other | • Discounted back from point of default to balance sheet date | |||
IFRS 9 PD and LGD estimates also have to be flexed to capture the effects of forward-looking macroeconomic variables. The aim is to use existing stress testing models to measure these effects. Transferring between stages will be applied at individual loan level and will also capture the effects of forward-looking macroeconomic variables.
HSBC HOLDINGS PLC
351 |
Table of Contents
Notes on the Financial Statements(continued)
1 – Basis of preparation and significant accounting policies
For material non-term retail loans, transfer between stages will also be applied at individual loan level. However, loans will be aggregated into segments based on PD or other risk drivers for the purpose of ECL measurement, to make the calculations more efficient. For smaller portfolios where less information is available, simplified approaches will be applied which will result in more aggregated transfers between stages and ECL calculation. Such aggregation will affect the granularity of disclosure.
A new global committee, supported by Global Risk Strategy, internal economics experts and external economic forecasting services, will be established to consider and approve the forward-looking macroeconomic assumptions that should be applied, with the objective of developing unbiased internally coherent economic scenarios for each jurisdiction. This committee will also be charged with ensuring that ECL allowance meets the IFRS 9 measurement principle for unbiased and probability-weighted amounts derived by evaluating a range of possible outcomes. The calculation methodologies to meet this principle and review and challenge structures are in the process of being developed. In addition, local risk committees will review and challenge the impairment allowances recognised in the individual legal entity’s financial statements.
Fair value through other comprehensive income
For financial assets measured at FVOCI, impairment determined in accordance with the policies and processes outlined above is recognised in profit or loss. The financial assets are recognised on the balance sheet at fair value so the amortised cost impairment allowance balance is disclosed as a memorandum item.
IFRS 15 ‘Revenue from Contracts with Customers’
In May 2014, the IASB issued IFRS 15 ‘Revenue from Contracts with Customers’. The original effective date of IFRS 15 has been delayed by one year and the standard is now effective for annual periods beginning on or after 1 January 2018 with early application permitted. IFRS 15 provides a principles-based approach for revenue recognition, and introduces the concept of recognising revenue for obligations as they are satisfied. The standard should be applied retrospectively, with certain practical expedients available. HSBC has assessed the impact of IFRS 15 and it expects that the standard will have no significant effect, when applied, on the consolidated financial statements of HSBC and the separate financial statements of HSBC Holdings.
IFRS 16 ‘Leases’
In January 2016, the IASB issued IFRS 16 ‘Leases’ with an effective date of annual periods beginning on or after 1 January 2019. IFRS 16 results in lessees accounting for most leases within the scope of the standard in a manner similar to the way in which finance leases are currently accounted for under IAS 17 ‘Leases’. Lessees will recognise a ‘right of use’ asset and a corresponding financial liability on the balance sheet. The asset will be amortised over the length of the lease and the financial liability measured at amortised cost. Lessor accounting remains substantially the same as in IAS 17. HSBC is currently assessing the impact of IFRS 16 and it is not practicable to quantify the effect as at the date of the publication of these financial statements.
(d) Presentation of information
Disclosures under IFRS 4 ‘Insurance Contracts’ and IFRS 7 ‘Financial Instruments: Disclosures’ concerning the nature and extent of risks relating to insurance contracts and financial instruments are included in the audited sections of the ‘Report of the Directors: Risk’ on pages 101 to 226.
Capital disclosures under IAS 1 ‘Presentation of Financial Statements’ are included in the audited sections of ‘Report of the Directors: Capital’ on pages 227 to 248.
Disclosures relating to HSBC’s securitisation activities and structured products are included in the audited section of ‘Report of the Directors: Risk’ on pages 101 to 226.
In accordance with HSBC’s policy to provide disclosures that help investors and other stakeholders understand the Group’s performance, financial position and changes thereto, the information provided in the Notes on the Financial Statements and the Report of the Directors goes beyond the minimum levels required by accounting standards, statutory and regulatory requirements and listing rules. In particular, HSBC provides additional disclosures having regard to the recommendations of the Enhanced Disclosures Task Force report ‘Enhancing the Risk Disclosures of Banks’ issued in October 2012 and ‘Impact of Expected Credit Loss Approaches on Bank Risk Disclosures’ issued in December 2015. The report aims to help financial institutions identify areas that investors had highlighted as needing better and more transparent information about banks’ risks, and how these risks relate to performance measurement and reporting. In addition, HSBC follows the British Bankers’ Association Code for Financial Reporting Disclosure (‘the BBA Code’). The BBA Code aims to increase the quality and comparability of UK banks’ disclosures and sets out five disclosure principles together with supporting guidance. In line with the principles of the BBA Code, HSBC assesses good practice recommendations issued from time to time by relevant regulators and standard setters and will assess the applicability and relevance of such guidance, enhancing disclosures where appropriate.
In publishing the parent company financial statements together with the Group financial statements, HSBC Holdings has taken advantage of the exemption in section 408(3) of the Companies Act 2006 not to present its individual income statement and related notes.
HSBC’s consolidated financial statements are presented in US dollars because the US dollar and currencies linked to it form the major currency bloc in which HSBC transacts and funds its business. The US dollar is also HSBC Holdings’ functional currency because the US dollar and currencies linked to it are the most significant currencies relevant to the underlying transactions, events and conditions of its subsidiaries, as well as representing a significant proportion of its funds generated from financing activities.
HSBC HOLDINGS PLC
352 |
Table of Contents
(e) Critical accounting estimates and judgements
The preparation of financial information requires the use of estimates and judgements about future conditions. In view of the inherent uncertainties and the high level of subjectivity involved in the recognition or measurement of items listed below, it is possible that the outcomes in the next financial year could differ from those on which management’s estimates are based, resulting in materially different conclusions from those reached by management for the purposes of the 2015 Financial Statements. Management’s selection of HSBC’s accounting policies which contain critical estimates and judgements is listed below; it reflects the materiality of the items to which the policies are applied and the high degree of judgement and estimation uncertainty involved:
| • | Impairment of loans and advances: Note 1(j); |
| • | Deferred tax assets: Note 8; |
| • | Valuation of financial instruments: Note 13; |
| • | Impairment of interests in associates: Note 19; |
| • | Goodwill impairment: Note 20; |
| • | Provisions: Note 29. |
(f) Going concern
The financial statements are prepared on a going concern basis, as the Directors are satisfied that the Group and parent company have the resources to continue in business for the foreseeable future. In making this assessment, the Directors have considered a wide range of information relating to present and future conditions, including future projections of profitability, cash flows and capital resources.
(g) Consolidation and related disclosures
HSBC controls and consequently consolidates an entity when it is exposed, or has rights, to variable returns from its involvement with the entity and has the ability to affect those returns through its power over the entity. Control is initially assessed based on consideration of all facts and circumstances, and is subsequently reassessed when there are significant changes to the initial setup.
Where an entity is governed by voting rights, HSBC would consolidate when it holds, directly or indirectly, the necessary voting rights to pass resolutions by the governing body. In all other cases, the assessment of control is more complex and requires judgement of other factors, including having exposure to variability of returns, power over relevant activities or holding the power as agent or principal.
Business combinations are accounted for using the acquisition method. The cost of an acquisition is measured at the fair value of the consideration, including contingent consideration, given at the date of exchange. Acquisition-related costs are recognised as an expense in the income statement in the period in which they are incurred. The acquired identifiable assets, liabilities and contingent liabilities are generally measured at their fair values at the date of acquisition. Goodwill is measured as the excess of the aggregate of the consideration transferred, the amount of non-controlling interest and the fair value of HSBC’s previously held equity interest, if any, over the net of the amounts of the identifiable assets acquired and the liabilities assumed. The amount of non-controlling interest is measured either at fair value or at the non-controlling interest’s proportionate share of the acquiree’s identifiable net assets. For acquisitions achieved in stages, the previously held equity interest is remeasured at the acquisition-date fair value with the resulting gain or loss recognised in the income statement.
All intra-HSBC transactions are eliminated on consolidation.
The consolidated financial statements of HSBC also include the attributable share of the results and reserves of joint ventures and associates, based on either financial statements made up to 31 December or pro-rated amounts adjusted for any material transactions or events occurring between the date of financial statements available and 31 December.
(h) Foreign currencies
Transactions in foreign currencies are recorded in the functional currency at the rate of exchange prevailing on the date of the transaction. Monetary assets and liabilities denominated in foreign currencies are translated into the functional currency at the rate of exchange at the balance sheet date. Any resulting exchange differences are included in the income statement.Non-monetary assets and liabilities that are measured at historical cost in a foreign currency are translated into the functional currency using the rate of exchange at the date of the initial transaction. Non-monetary assets and liabilities measured at fair value in a foreign currency are translated into the functional currency using the rate of exchange at the date the fair value was determined. Any foreign exchange component of a gain or loss on a non-monetary item is recognised either in other comprehensive income or in the income statement depending on where the gain or loss on the underlying non-monetary item is recognised.
HSBC HOLDINGS PLC
353 |
Table of Contents
Notes on the Financial Statements(continued)
1 - Basis of preparation and significant accounting policies
In the consolidated financial statements, the assets and liabilities of branches, subsidiaries, joint ventures and associates whose functional currency is not US dollars are translated into the Group’s presentation currency at the rate of exchange at the balance sheet date, while their results are translated into US dollars at the average rates of exchange for the reporting period. Exchange differences arising from the retranslation of opening foreign currency net assets, and the retranslation of the results for the reporting period from the average rate to the exchange rate at the period end, are recognised in other comprehensive income. Exchange differences on a monetary item that is part of a net investment in a foreign operation are recognised in the income statement of the separate financial statements and in other comprehensive income in consolidated financial statements. On disposal of a foreign operation, exchange differences previously recognised in other comprehensive income are reclassified to the income statement as a reclassification adjustment.
(i) Loans and advances to banks and customers
These include loans and advances originated by HSBC, not classified as held for trading or designated at fair value. They are recognised when cash is advanced to a borrower and are derecognised when either the borrower repays its obligations or the loans are sold or substantially all the risks and rewards of ownership are transferred. They are initially recorded at fair value plus any directly attributable transaction costs and are subsequently measured at amortised cost using the effective interest method, less impairment allowance.
Loans and advances are reclassified to ‘Assets held for sale’ when they meet the criteria presented in Note 23, though their measurement remains in accordance with this policy.
HSBC may commit to underwrite loans on fixed contractual terms for specified periods of time. When the loan arising from the lending commitment is expected to be held for trading, the commitment to lend is recorded as a derivative. On drawdown, the loan is classified as held for trading. When HSBC intends to hold the loan, a provision on the loan commitment is only recorded where it is probable that HSBC will incur a loss. On inception, the loan to be held is recorded at its fair value and subsequently measured at amortised cost. For certain transactions, such as leveraged finance and syndicated lending activities, the cash advanced may not be the best evidence of the fair value of the loan. For these loans, where the initial fair value is lower than the cash amount advanced, the difference is charged to the income statement in other operating income. The write-down is recovered over the life of the loan through the recognition of interest income, unless the loan becomes impaired.
(j) Impairment of loans and advances and available-for-sale financial assets
Critical accounting estimates and judgements
Impairment of loans and advances
Loan impairment allowances represent management’s best estimate of losses incurred in the loan portfolios at the balance sheet date. Management is required to exercise judgement in making assumptions and estimates when calculating loan impairment allowances on both individually and collectively assessed loans and advances. See the ‘Movement in impairment allowances by industry sector and by geographical region’ table on page 134 for a breakdown of individual and collective impairment allowances.
Collective impairment allowances are subject to estimation uncertainty, in part because it is not practicable to identify losses on an individual loan basis due to the large number of individually insignificant loans in the portfolio. The estimation methods include the use of statistical analyses of historical information, supplemented with significant management judgement, to assess whether current economic and credit conditions are such that the actual level of incurred losses is likely to be greater or less than historical experience.
Where changes in economic, regulatory or behavioural conditions result in the most recent trends in portfolio risk factors being not fully reflected in the statistical models, risk factors are taken into account by adjusting the impairment allowances derived solely from historical loss experience.
Risk factors include loan portfolio growth, product mix, unemployment rates, bankruptcy trends, geographical concentrations, loan product features, economic conditions such as national and local trends in housing markets, the level of interest rates, portfolio seasoning, account management policies and practices, changes in laws and regulations and other influences on customer payment patterns. Different factors are applied in different regions and countries to reflect local economic conditions, laws and regulations. The methodology and the assumptions used in calculating impairment losses are reviewed regularly in the light of differences between loss estimates and actual loss experience. For example, roll rates, loss rates and the expected timing of future recoveries are regularly benchmarked against actual outcomes to ensure they remain appropriate.
|
For individually assessed loans, judgement is required in determining whether there is objective evidence that a loss event has occurred and, if so, the measurement of the impairment allowance. In determining whether there is objective evidence that a loss event has occurred, judgement is exercised in evaluating all relevant information on indicators of impairment, including the consideration of whether payments are contractually past-due and the consideration of other factors indicating deterioration in the financial condition and outlook of borrowers affecting their ability to pay. A higher level of judgement is required for loans to borrowers showing signs of financial difficulty in market sectors experiencing economic stress, particularly where the likelihood of repayment is affected by the prospects for refinancing or the sale of a specified asset. For those loans where objective evidence of impairment exists, management determine the size of the allowance required based on a range of factors such as the realisable value of security, the likely dividend available on liquidation or bankruptcy, the viability of the customer’s business model and the capacity to trade successfully out of financial difficulties and generate sufficient cash flow to service debt obligations.
HSBC might provide loan forbearance to borrowers experiencing financial difficulties by agreeing to modify the contractual payment terms of loans in order to improve the management of customer relationships, maximise collection opportunities or avoid default or repossession. Where forbearance activities are significant, higher levels of judgement and estimation uncertainty are involved in determining their effects on loan impairment allowances. Judgements are involved in differentiating the credit risk characteristics of forbearance cases, including
|
HSBC HOLDINGS PLC
354 |
Table of Contents
those which return to performing status following renegotiation. Where collectively assessed loan portfolios include significant levels of loan forbearance, portfolios are segmented to reflect the different credit risk characteristics of forbearance cases, and estimates are made of the incurred losses inherent within each forbearance portfolio segment. Forbearance activities take place in both retail and wholesale loan portfolios, but our largest concentration is in the US, in HSBC Finance’s CML portfolio.
The exercise of judgement requires the use of assumptions which are highly subjective and very sensitive to the risk factors, in particular to changes in economic and credit conditions across a large number of geographical areas. Many of the factors have a high degree of interdependency and there is no single factor to which our loan impairment allowances as a whole are sensitive.
|
Impairment of loans and advances
Losses for impaired loans are recognised when there is objective evidence that impairment of a loan or portfolio of loans has occurred. Impairment allowances that are calculated on individual loans or on groups of loans assessed collectively are recorded as charges to the income statement and are recorded against the carrying amount of impaired loans on the balance sheet. Losses which may arise from future events are not recognised.
Individually assessed loans and advances
The factors considered in determining whether a loan is individually significant for the purposes of assessing impairment include the size of the loan, the number of loans in the portfolio, the importance of the individual loan relationship and how this is managed. Loans that are determined to be individually significant based on the above and other relevant factors will be individually assessed for impairment, except when volumes of defaults and losses are sufficient to justify treatment under a collective methodology.
Loans considered as individually significant are typically to corporate and commercial customers, are for larger amounts and are managed on an individual basis. For these loans, HSBC considers on a case-by-case basis at each balance sheet date whether there is any objective evidence that a loan is impaired. The criteria used to make this assessment include:
| • | known cash flow difficulties experienced by the borrower; |
| • | contractual payments of either principal or interest being past due for more than 90 days; |
| • | the probability that the borrower will enter bankruptcy or other financial realisation; |
| • | a concession granted to the borrower for economic or legal reasons relating to the borrower’s financial difficulty that results in forgiveness or postponement of principal, interest or fees, where the concession is not insignificant; and |
| • | there has been deterioration in the financial condition or outlook of the borrower such that its ability to repay is considered doubtful. |
For loans where objective evidence of impairment exists, impairment losses are determined considering the following factors:
| • | HSBC’s aggregate exposure to the customer; |
| • | the viability of the customer’s business model and its capacity to trade successfully out of financial difficulties and generate sufficient cash flow to service debt obligations; |
| • | the amount and timing of expected receipts and recoveries; |
| • | the likely dividend available on liquidation or bankruptcy; |
| • | the extent of other creditors’ commitments ranking ahead of, orpari passu with, HSBC and the likelihood of other creditors continuing to support the company; |
| • | the complexity of determining the aggregate amount and ranking of all creditor claims and the extent to which legal and insurance uncertainties are evident; |
| • | the realisable value of security (or other credit mitigants) and likelihood of successful repossession; |
| • | the likely costs of obtaining and selling collateral as part of foreclosure; |
| • | the ability of the borrower to obtain, and make payments in, the currency of the loan if not denominated in local currency; and |
| • | when available, the secondary market price of the debt. |
The determination of the realisable value of security is based on the most recently updated market value at the time the impairment assessment is performed. The value is not adjusted for expected future changes in market prices, though adjustments are made to reflect local conditions such as forced sale discounts.
Impairment losses are calculated by discounting the expected future cash flows of a loan, which include expected future receipts of contractual interest, at the loan’s original effective interest rate or an approximation thereof, and comparing the resultant present value with the loan’s current carrying amount. The impairment allowances on individually significant accounts are reviewed at least quarterly and more regularly when circumstances require.
HSBC HOLDINGS PLC
355 |
Table of Contents
Notes on the Financial Statements(continued)
1 - Basis of preparation and significant accounting policies
Collectively assessed loans and advances
Impairment is assessed collectively to cover losses which have been incurred but have not yet been identified on loans subject to individual assessment or for homogeneous groups of loans that are not considered individually significant. Retail lending portfolios are generally assessed for impairment collectively as the portfolios are generally large homogeneous loan pools.
Incurred but not yet identified impairment
Individually assessed loans for which no evidence of impairment has been specifically identified on an individual basis are grouped together according to their credit risk characteristics for a collective impairment assessment. These credit risk characteristics may include country of origination, type of business involved, type of products offered, security obtained or other relevant factors. This assessment captures impairment losses that HSBC has incurred as a result of events occurring before the balance sheet date which HSBC is not able to identify on an individual loan basis, and that can be reliably estimated. When information becomes available which identifies losses on individual loans within a group, those loans are removed from the group and assessed individually.
The collective impairment allowance is determined after taking into account:
| • | historical loss experience in portfolios of similar credit risk characteristics (for example, by industry sector, loan grade or product); |
| • | the estimated period between a loss occurring and the loss being identified and evidenced by the establishment of an appropriate allowance against the individual loan; and |
| • | management’s judgement as to whether current economic and credit conditions are such that the actual level of inherent losses at the balance sheet date is likely to be greater or less than that suggested by historical experience. |
The period between a loss occurring and its identification is estimated by management for each identified portfolio based on economic and market conditions, customer behaviour, portfolio management information, credit management techniques and collection and recovery experiences in the market. As it is assessed empirically on a periodic basis, the estimated period may vary over time as these factors change.
Homogeneous groups of loans and advances
Statistical methods are used to determine collective impairment losses for homogeneous groups of loans not considered individually significant. The methods that are used to calculate collective allowances are:
| • | When appropriate empirical information is available, HSBC utilises roll-rate methodology, which employs statistical analyses of historical data and experience of delinquency and default to reliably estimate the amount of the loans that will eventually be written off as a result of the events occurring before the balance sheet date but which HSBC is not able to identify individually. Individual loans are grouped using ranges of past due days; statistical analysis is then used to estimate the likelihood that loans in each range will progress through the various stages of delinquency and become irrecoverable. Additionally, individual loans are segmented based on their credit characteristics as described above. In applying this methodology, adjustments are made to estimate the periods of time between a loss event occurring and its discovery, for example through a missed payment (known as the emergence period) and the period of time between discovery and write-off (known as the outcome period). Current economic conditions are also evaluated when calculating the appropriate level of allowance required to cover inherent loss. In certain highly-developed markets, sophisticated models also take into account behavioural and account management trends as revealed in, for example, bankruptcy and rescheduling statistics. |
| • | When the portfolio size is small or when information is insufficient or not reliable enough to adopt a roll-rate methodology, HSBC adopts a basic formulaic approach based on historical loss rate experience, or a discounted cash flow model. Where a basic formulaic approach is undertaken, the period between a loss event occurring and its identification is explicitly estimated by local management, and is typically between six and twelve months. |
The inherent loss within each portfolio is assessed on the basis of statistical models using historical data observations which are updated periodically to reflect recent portfolio and economic trends. When the most recent trends arising from changes in economic, regulatory or behavioural conditions are not fully reflected in the statistical models, they are taken into account by adjusting the impairment allowances derived from the statistical models to reflect these changes as at the balance sheet date.
Write-off of loans and advances
Loans (and the related impairment allowance accounts) are normally written off, either partially or in full, when there is no realistic prospect of recovery. Where loans are secured, this is generally after receipt of any proceeds from the realisation of security. In circumstances where the net realisable value of any collateral has been determined and there is no reasonable expectation of further recovery, write-off may be earlier.
HSBC HOLDINGS PLC
356 |
Table of Contents
Reversals of impairment
If the amount of an impairment loss decreases in a subsequent period, and the decrease can be related objectively to an event occurring after the impairment was recognised, the excess is written back by reducing the loan impairment allowance account accordingly. The write-back is recognised in the income statement.
Assets acquired in exchange for loans
Non-financial assets acquired in exchange for loans as part of an orderly realisation are recorded as ‘Assets held for sale’ and reported in ‘Other assets’ if those assets are classified as held for sale. The asset acquired is recorded at the lower of its fair value less costs to sell and the carrying amount of the loan (net of impairment allowance) at the date of exchange. No depreciation is charged in respect of assets held for sale. Write-downs of the acquired asset to fair value less cost to sell and any reversals of previous write-downs are recognised in the income statement in ‘Other operating income’, together with any realised gains or losses on disposal.
Renegotiated loans
Loans subject to collective impairment assessment whose terms have been renegotiated are no longer considered past due, but are treated as up to date loans for measurement purposes once a minimum number of payments required have been received. Where collectively assessed loan portfolios include significant levels of renegotiated loans, these loans are segregated from other parts of the loan portfolio for the purposes of collective impairment assessment to reflect their risk profile. Loans subject to individual impairment assessment, whose terms have been renegotiated, are subject to ongoing review to determine whether they remain impaired. The carrying amounts of loans that have been classified as renegotiated retain this classification until maturity or derecognition.
A loan that is renegotiated is derecognised if the existing agreement is cancelled and a new agreement made on substantially different terms or if the terms of an existing agreement are modified such that the renegotiated loan is substantially a different financial instrument. Any new loans that arise following derecognition events will continue to be disclosed as renegotiated loans and are assessed for impairment as above.
Impairment of available-for-sale financial assets
Available-for-sale financial assets are assessed at each balance sheet date for objective evidence of impairment. If such evidence exists as a result of one or more events that occurred after the initial recognition of the financial asset (a ‘loss event’), and that loss event has an impact which can be reliably measured on the estimated future cash flows of the financial asset, an impairment loss is recognised.
If the available-for-sale financial asset is impaired, the difference between its acquisition cost (net of any principal repayments and amortisation) and its current fair value, less any previous impairment loss recognised in the income statement, is recognised in the income statement.
Impairment losses are recognised in the income statement within ‘Loan impairment charges and other credit risk provisions’ for debt instruments and within ‘Gains less losses from financial investments’ for equities. The impairment methodologies for available-for-sale financial assets are set out as follows:
| • | Available-for-sale debt securities.In assessing objective evidence of impairment at the reporting date, HSBC considers all available evidence, including observable data or information about events specifically relating to the securities which may result in a shortfall in the recovery of future cash flows. Financial difficulties of the issuer, as well as other factors such as information about the issuers’ liquidity, business and financial risk exposures, levels of and trends in default for similar financial assets, national and local economic trends and conditions, and the fair value of collateral and guarantees may be considered individually, or in combination, to determine if there is objective evidence of impairment. |
In addition, the performance of underlying collateral and the extent and depth of market price declines is relevant when assessing objective evidence of impairment of available-for-sale ABSs. The primary indicators of potential impairment are considered to be adverse fair value movements and the disappearance of an active market for a security, while changes in credit ratings are of secondary importance.
| • | Available-for-sale equity securities. Objective evidence of impairment may include specific information about the issuer as detailed above, but may also include information about significant changes in technology, markets, economics or the law that provides evidence that the cost of the equity securities may not be recovered. |
A significant or prolonged decline in the fair value of the equity below its cost is also objective evidence of impairment. In assessing whether it is significant, the decline in fair value is evaluated against the original cost of the asset at initial recognition. In assessing whether it is prolonged, the decline is evaluated against the continuous period in which the fair value of the asset has been below its original cost at initial recognition.
HSBC HOLDINGS PLC
357 |
Table of Contents
Notes on the Financial Statements(continued)
1 - Significant accounting policies / 2 - Net income from financial instruments at FV / 3 - Net insurance premium income
Once an impairment loss has been recognised, the subsequent accounting treatment for changes in the fair value of that asset depends on the type of asset:
| • | for an available-for-sale debt security, a subsequent decline in the fair value of the instrument is recognised in the income statement when there is objective evidence of impairment as a result of further decreases in the estimated future cash flows of the financial asset. Where there is no further objective evidence of impairment, the decline in the fair value of the financial asset is recognised in other comprehensive income. If the fair value of a debt security increases in a subsequent period, and the increase can be objectively related to an event occurring after the impairment loss was recognised in the income statement, or the instrument is no longer impaired, the impairment loss is reversed through the income statement; |
| • | for an available-for-sale equity security, all subsequent increases in the fair value of the instrument are treated as a revaluation and are recognised in other comprehensive income. Impairment losses recognised on the equity security are not reversed through the income statement. Subsequent decreases in the fair value of the available-for-sale equity security are recognised in the income statement to the extent that further cumulative impairment losses have been incurred. |
(k) Non-trading reverse repurchase and repurchase agreements
When securities are sold subject to a commitment to repurchase them at a predetermined price (‘repos’), they remain on the balance sheet and a liability is recorded in respect of the consideration received. Securities purchased under commitments to resell (‘reverse repos’) are not recognised on the balance sheet and an asset is recorded in respect of the initial consideration paid.
Non-trading repos and reverse repos are measured at amortised cost. The difference between the sale and repurchase price or between the purchase and resale price is treated as interest and recognised in net interest income over the life of the agreement.
(l) Operating income
Interest income and expense
Interest income and expense for all financial instruments except for those classified as held for trading or designated at fair value (except for debt securities issued by HSBC and derivatives managed in conjunction with those debt securities) are recognised in ‘Interest income’ and ‘Interest expense’ in the income statement using the effective interest method. The effective interest rate is the rate that exactly discounts estimated future cash receipts or payments through the expected life of the financial instrument or, where appropriate, a shorter period, to the net carrying amount of the financial asset or financial liability.
Interest on impaired financial assets is recognised using the rate of interest used to discount the future cash flows for the purpose of measuring the impairment loss.
Non-interest income and expense
Fee income is earned from a diverse range of services provided by HSBC to its customers. Fee income is accounted for as follows:
| • | income earned on the execution of a significant act is recognised as revenue when the act is completed (for example, fees arising from negotiating or participating in the negotiation of a transaction for a third party, such as an arrangement for the acquisition of shares or other securities); |
| • | income earned from the provision of services is recognised as revenue as the services are provided (for example, asset management, portfolio and other management advisory and service fees); and |
| • | income which forms an integral part of the effective interest rate of a financial instrument is recognised as an adjustment to the effective interest rate (for example, certain loan commitment fees) and recorded in ‘Interest income’. |
Net trading income comprises all gains and losses from changes in the fair value of financial assets and financial liabilities held for trading, together with the related interest income, expense and dividends.
Dividend income is recognised when the right to receive payment is established. This is the ex-dividend date for listed equity securities, and usually the date when shareholders approve the dividend for unlisted equity securities.
The accounting policies fornet income/(expense) from financial instruments designated at fair valueand for net insurance premium income are disclosed in Note 2 and Note 3.
HSBC HOLDINGS PLC
358 |
Table of Contents
Report of the Directors: Financial Review
1A Changes to comparative data
The following sets out changes to comparative data from those presented in our 2014 Form 20-F.
Note 11 – Segmental analysis
Net operating income by global business
In the first half of 2015, a portfolio of customers was transferred from CMB to RBWM in Latin America in order to better align the combined banking needs of the customers with our established global businesses. Comparative data have been re-presented accordingly.
As reported in 2015
| RBWM | CMB | GB&M | GPB | Other | Intra-HSBC items | Total | ||||||||||||||||||||||||||||||||||||||
| $m | $m | $m | $m | $m | $m | $m | ||||||||||||||||||||||||||||||||||||||
2014 | ||||||||||||||||||||||||||||||||||||||||||||
Net operating income | 25,149 | 15,748 | 17,778 | 2,377 | 6,365 | (6,169 | ) | 61,248 | ||||||||||||||||||||||||||||||||||||
– external | 23,202 | 16,369 | 20,055 | 1,980 | (358 | ) | – | 61,248 | ||||||||||||||||||||||||||||||||||||
– internal | 1,947 | (621 | ) | (2,277 | ) | 397 | 6,723 | (6,169 | ) | – | ||||||||||||||||||||||||||||||||||
2013 | ||||||||||||||||||||||||||||||||||||||||||||
Net operating income | 27,453 | 15,652 | 19,176 | 2,439 | 5,651 | (5,726 | ) | 64,645 | ||||||||||||||||||||||||||||||||||||
– external | 25,702 | 16,577 | 20,767 | 1,955 | (356 | ) | – | 64,645 | ||||||||||||||||||||||||||||||||||||
– internal | 1,751 | (925 | ) | (1,591 | ) | 484 | 6,007 | (5,726 | ) | – | ||||||||||||||||||||||||||||||||||
| Adjustments | ||||||||||||||||||||||||||||||||||||||||||||
| RBWM | CMB | GB&M | GPB | Other | Intra- HSBC items | Total | ||||||||||||||||||||||||||||||||||||||
| $m | $m | $m | $m | $m | $m | $m | ||||||||||||||||||||||||||||||||||||||
2014 | ||||||||||||||||||||||||||||||||||||||||||||
Net operating income | 555 | (555 | ) | – | – | – | – | – | ||||||||||||||||||||||||||||||||||||
– external | 510 | (510 | ) | – | – | – | – | – | ||||||||||||||||||||||||||||||||||||
– internal | 45 | (45 | ) | – | – | – | – | – | ||||||||||||||||||||||||||||||||||||
2013 | ||||||||||||||||||||||||||||||||||||||||||||
Net operating income | 713 | (713 | ) | – | – | – | – | – | ||||||||||||||||||||||||||||||||||||
– external | 664 | (664 | ) | – | – | – | – | – | ||||||||||||||||||||||||||||||||||||
– internal | 49 | (49 | ) | – | – | – | – | – | ||||||||||||||||||||||||||||||||||||
| As reported in 2014 | ||||||||||||||||||||||||||||||||||||||||||||
| RBWM | CMB | GB&M | GPB | Other | Intra- HSBC items | Total | ||||||||||||||||||||||||||||||||||||||
| $m | $m | $m | $m | $m | $m | $m | ||||||||||||||||||||||||||||||||||||||
2014 | ||||||||||||||||||||||||||||||||||||||||||||
Net operating income | 24,594 | 16,303 | 17,778 | 2,377 | 6,365 | (6,169 | ) | 61,248 | ||||||||||||||||||||||||||||||||||||
– external | 22,692 | 16,879 | 20,055 | 1,980 | (358 | ) | – | 61,248 | ||||||||||||||||||||||||||||||||||||
– internal | 1,902 | (576 | ) | (2,277 | ) | 397 | 6,723 | (6,169 | ) | – | ||||||||||||||||||||||||||||||||||
2013 | ||||||||||||||||||||||||||||||||||||||||||||
Net operating income | 26,740 | 16,365 | 19,176 | 2,439 | 5,651 | (5,726 | ) | 64,645 | ||||||||||||||||||||||||||||||||||||
– external | 25,038 | 17,241 | 20,767 | 1,955 | (356 | ) | – | 64,645 | ||||||||||||||||||||||||||||||||||||
– internal | 1,702 | (876 | ) | (1,591 | ) | 484 | 6,007 | (5,726 | ) | – | ||||||||||||||||||||||||||||||||||
Note 32 – Offsetting of financial assets and liabilities
The disclosure has been enhanced this year with ‘Amounts not subject to enforceable netting arrangements’ being separately identified and presented. Collateral not determined to be currently enforceable has also been excluded. This resulted in a change in the basis of preparation. Prior period data have been adjusted impacting all columns other than amounts offset in the balance sheet in the disclosure. Set out below are the 2014 disclosures as reported in 2015, adjustments made to the 2014 balances, and the disclosure as reported in 2014.
HSBC HOLDINGS PLC
358a |
Table of Contents
Report of the Directors: Financial Review
Financial assets
As reported in 2015
| Amounts subject to enforceable netting arrangements | ||||||||||||||||||||||||||||||||||||||||||||||||||||||
Net amounts in | Amounts not set off in the balance sheet | Amounts not subject to | ||||||||||||||||||||||||||||||||||||||||||||||||||||
Gross amounts | Amounts offset | the balance sheet | Financial instruments | Non-cash collateral | Cash collateral | Net amount | enforceable netting | Total | ||||||||||||||||||||||||||||||||||||||||||||||
| $m | $m | $m | $m | $m | $m | $m | $m | $m | ||||||||||||||||||||||||||||||||||||||||||||||
31 December 2014 | ||||||||||||||||||||||||||||||||||||||||||||||||||||||
Derivatives | 584,359 | (250,465 | ) | 333,894 | (262,856 | ) | (7,655 | ) | (41,750 | ) | 21,633 | 11,114 | 345,008 | |||||||||||||||||||||||||||||||||||||||||
Reverse repos, stock borrowing and similar agreements | 208,893 | (88,676 | ) | 120,217 | (5,117 | ) | (114,394 | ) | (249 | ) | 457 | 50,762 | 170,979 | |||||||||||||||||||||||||||||||||||||||||
Classified as: | ||||||||||||||||||||||||||||||||||||||||||||||||||||||
– trading assets | 9,341 | (390 | ) | 8,951 | – | (8,951 | ) | – | – | 315 | 9,266 | |||||||||||||||||||||||||||||||||||||||||||
– non-trading assets | 199,552 | (88,286 | ) | 111,266 | (5,117 | ) | (105,443 | ) | (249 | ) | 457 | 50,447 | 161,713 | |||||||||||||||||||||||||||||||||||||||||
Loans and advances to customers | ||||||||||||||||||||||||||||||||||||||||||||||||||||||
– at amortised cost | 99,623 | (37,527 | ) | 62,096 | (55,989 | ) | – | – | 6,107 | 1,597 | 63,693 | |||||||||||||||||||||||||||||||||||||||||||
At 31 December 2014 | 892,875 | (376,668 | ) | 516,207 | (323,962 | ) | (122,049 | ) | (41,999 | ) | 28,197 | 63,473 | 579,680 | |||||||||||||||||||||||||||||||||||||||||
| Adjustments | ||||||||||||||||||||||||||||||||||||||||||||||||||||||
Net amounts in | Amounts not set off in the balance sheet | Amounts not subject to | ||||||||||||||||||||||||||||||||||||||||||||||||||||
|
| Gross amounts |
|
| Amounts offset |
|
| the balance sheet |
|
| Financial instruments |
|
| Non-cash collateral |
|
| Cash collateral |
|
| Net amount |
|
| enforceable netting |
| Total | 1 | |||||||||||||||||||||||||||||
| $m | $m | $m | $m | $m | $m | $m | $m | $m | ||||||||||||||||||||||||||||||||||||||||||||||
Derivatives | (11,114 | ) | – | (11,114 | ) | 8,184 | (7,655 | ) | 510 | (10,075 | ) | 11,114 | ||||||||||||||||||||||||||||||||||||||||||
Reverse repos, stock borrowing and similar agreements | (50,762 | ) | – | (50,762 | ) | 161,841 | (114,394 | ) | – | (3,315 | ) | 50,762 | ||||||||||||||||||||||||||||||||||||||||||
Classified as: | ||||||||||||||||||||||||||||||||||||||||||||||||||||||
– trading assets | (315 | ) | – | (315 | ) | 9,256 | (8,951 | ) | – | (10 | ) | 315 | ||||||||||||||||||||||||||||||||||||||||||
– non-trading assets | (50,447 | ) | – | (50,447 | ) | 152,585 | (105,443 | ) | – | (3,305 | ) | 50,447 | ||||||||||||||||||||||||||||||||||||||||||
Loans and advances to customers | ||||||||||||||||||||||||||||||||||||||||||||||||||||||
– at amortised cost | (1,597 | ) | – | (1,597 | ) | – | – | 310 | (1,287 | ) | 1,597 | |||||||||||||||||||||||||||||||||||||||||||
At 31 December 2014 | (63,473 | ) | – | (63,473 | ) | 170,025 | (122,049 | ) | 820 | (14,677 | ) | 63,473 | ||||||||||||||||||||||||||||||||||||||||||
| As reported in 2014 | ||||||||||||||||||||||||||||||||||||||||||||||||||||||
| Gross | Gross | Amounts presented | Amounts not set off in the balance sheet | |||||||||||||||||||||||||||||||||||||||||||||||||||
|
| amounts of recognised financial assets/ Gross amounts |
1 |
| amounts offset in the balance sheet/ Amounts offset |
1 |
| in the balance sheet/Net amounts in the balance sheet |
1 |
| Financial instruments |
| | Non-cash | |
| Cash collateral received/ Cash collateral |
1 |
| Net amount |
| | Amounts | | Total | 1 | |||||||||||||||||||||||||||||
| $m | $m | $m | $m | $m | $m | $m | $m | $m | ||||||||||||||||||||||||||||||||||||||||||||||
31 December 2014 | ||||||||||||||||||||||||||||||||||||||||||||||||||||||
Derivatives | 595,473 | (250,465 | ) | 345,008 | (271,040 | ) | (42,260 | ) | 31,708 | |||||||||||||||||||||||||||||||||||||||||||||
Reverse repos, stock borrowing and similar agreements | 259,655 | (88,676 | ) | 170,979 | (166,958 | ) | (249 | ) | 3,772 | |||||||||||||||||||||||||||||||||||||||||||||
Classified as: | ||||||||||||||||||||||||||||||||||||||||||||||||||||||
– trading assets | 9,656 | (390 | ) | 9,266 | (9,256 | ) | – | 10 | ||||||||||||||||||||||||||||||||||||||||||||||
– non-trading assets | 249,999 | (88,286 | ) | 161,713 | (157,702 | ) | (249 | ) | 3,762 | |||||||||||||||||||||||||||||||||||||||||||||
Loans and advances to customers | ||||||||||||||||||||||||||||||||||||||||||||||||||||||
– at amortised cost | 101,220 | (37,527 | ) | 63,693 | (55,989 | ) | (310 | ) | 7,394 | |||||||||||||||||||||||||||||||||||||||||||||
At 31 December 2014 | 956,348 | (376,668 | ) | 579,680 | (493,987 | ) | (42,819 | ) | 42,874 | |||||||||||||||||||||||||||||||||||||||||||||
| 1 | Wording in italics represents column headings as presented in 2015. |
Footnotes presented on page 434 have also been updated to reflect the revised presentation.
HSBC HOLDINGS PLC
358b |
Table of Contents
Report of the Directors: Financial Review
Financial liabilities
As reported in 2015
| Amounts subject to enforceable netting arrangements | ||||||||||||||||||||||||||||||||||||||||||||||||||||||||
Net amounts in | Amounts not set off in the balance sheet | Amounts not subject to | ||||||||||||||||||||||||||||||||||||||||||||||||||||||
Gross amounts | Amounts offset | the balance sheet | Financial instruments | Non-cash collateral | Cash collateral | Net amount | enforceable netting | Total | ||||||||||||||||||||||||||||||||||||||||||||||||
| $m | $m | $m | $m | $m | $m | $m | $m | $m | ||||||||||||||||||||||||||||||||||||||||||||||||
31 December 2014 | ||||||||||||||||||||||||||||||||||||||||||||||||||||||||
Derivatives | 580,644 | (250,465 | ) | 330,179 | (262,864 | ) | (9,465 | ) | (39,571 | ) | 18,279 | 10,490 | 340,669 | |||||||||||||||||||||||||||||||||||||||||||
Reverse repos, stock borrowing and similar agreements | 165,514 | (88,676 | ) | 76,838 | (8,934 | ) | (67,793 | ) | (105 | ) | 6 | 46,424 | 123,262 | |||||||||||||||||||||||||||||||||||||||||||
Classified as: | ||||||||||||||||||||||||||||||||||||||||||||||||||||||||
– trading assets | 16,206 | (390 | ) | 15,816 | – | (15,813 | ) | – | 3 | 14 | 15,830 | |||||||||||||||||||||||||||||||||||||||||||||
– non-trading assets | 149,308 | (88,286 | ) | 61,022 | (8,934 | ) | (51,980 | ) | (105 | ) | 3 | 46,410 | 107,432 | |||||||||||||||||||||||||||||||||||||||||||
Customer accounts at amortised cost | 106,609 | (37,527 | ) | 69,082 | (55,989 | ) | – | – | 13,093 | 479 | 69,561 | |||||||||||||||||||||||||||||||||||||||||||||
At 31 December 2014 | 852,767 | (376,668 | ) | 476,099 | (327,787 | ) | (77,258 | ) | (39,676 | ) | 31,378 | 57,393 | 533,492 | |||||||||||||||||||||||||||||||||||||||||||
| Adjustments | ||||||||||||||||||||||||||||||||||||||||||||||||||||||||
Net amounts in | Amounts not set off in the balance sheet | Amounts not subject to | ||||||||||||||||||||||||||||||||||||||||||||||||||||||
|
| Gross amounts |
|
| Amounts offset |
|
| the balance sheet |
|
| Financial instruments |
|
| Non-cash collateral |
|
| Cash collateral |
|
| Net amount |
|
| enforceable netting |
| Total | 1 | |||||||||||||||||||||||||||||||
| $m | $m | $m | $m | $m | $m | $m | $m | $m | ||||||||||||||||||||||||||||||||||||||||||||||||
Derivatives | (10,490 | ) | – | (10,490 | ) | 9,951 | (9,465 | ) | 720 | (9,289 | ) | 10,490 | ||||||||||||||||||||||||||||||||||||||||||||
Repos, stock lending and similar agreements | (46,424 | ) | – | (46,424 | ) | 112,788 | (67,793 | ) | – | (1,429 | ) | 46,424 | ||||||||||||||||||||||||||||||||||||||||||||
Classified as: | ||||||||||||||||||||||||||||||||||||||||||||||||||||||||
– trading liabilities | (14 | ) | – | (14 | ) | 15,828 | (15,813 | ) | – | 1 | 14 | |||||||||||||||||||||||||||||||||||||||||||||
– non-trading liabilities | (46,410 | ) | – | (46,410 | ) | 96,960 | (51,980 | ) | – | (1,430 | ) | 46,410 | ||||||||||||||||||||||||||||||||||||||||||||
Customer accounts at amortised cost | (479 | ) | – | (479 | ) | – | – | – | (479 | ) | (479 | ) | ||||||||||||||||||||||||||||||||||||||||||||
At 31 December 2014 | (57,393 | ) | – | (57,393 | ) | 122,739 | (77,258 | ) | 720 | (11,192 | ) | 57,393 | ||||||||||||||||||||||||||||||||||||||||||||
| As reported in 2014 | ||||||||||||||||||||||||||||||||||||||||||||||||||||||||
| Gross | Gross | Amounts presented | Amounts not set off in the balance sheet | |||||||||||||||||||||||||||||||||||||||||||||||||||||
|
| amounts of recognised financial liabilities/ amounts |
1 |
| amounts offset in the balance sheet/ Amounts offset |
1 |
| in the balance sheet/Net amounts in the balance sheet |
1 |
| Financial instruments |
|
| Non-cash collateral | 1 |
| Cash collateral pledged/ Cash collateral |
1 |
| Net amount |
|
| Amounts not subject to enforceable netting |
1 | Total | 1 | |||||||||||||||||||||||||||||||
| $m | $m | $m | $m | $m | $m | $m | $m | $m | ||||||||||||||||||||||||||||||||||||||||||||||||
31 December 2014 | ||||||||||||||||||||||||||||||||||||||||||||||||||||||||
Derivatives | 591,134 | (250,465 | ) | 340,669 | (272,815 | ) | (40,291 | ) | 27,563 | |||||||||||||||||||||||||||||||||||||||||||||||
Repos, stock lending and similar agreements | 211,938 | (88,676 | ) | 123,262 | (121,722 | ) | (105 | ) | 1,435 | |||||||||||||||||||||||||||||||||||||||||||||||
Classified as: | ||||||||||||||||||||||||||||||||||||||||||||||||||||||||
– trading liabilities | 16,220 | (390 | ) | 15,830 | (15,828 | ) | – | 2 | ||||||||||||||||||||||||||||||||||||||||||||||||
– non-trading liabilities | 195,718 | (88,286 | ) | 107,432 | (105,894 | ) | (105 | ) | 1,433 | |||||||||||||||||||||||||||||||||||||||||||||||
Customer accounts at amortised costs | 107,088 | (37,527 | ) | 69,561 | (55,989 | ) | – | 13,572 | ||||||||||||||||||||||||||||||||||||||||||||||||
At 31 December 2014 | 910,160 | (376,668 | ) | 533,492 | (450,526 | ) | (40,396 | ) | 42,570 | |||||||||||||||||||||||||||||||||||||||||||||||
| 1 | Wording in italics represents column headings as presented in 2015. |
Footnotes presented on page 434 have also been updated to reflect the revised presentation
HSBC HOLDINGS PLC
358c |
Table of Contents
Report of the Directors: Financial Review
Note 41 – Related party transactions
Transactions and balances during the year with Key Management Personnel
Certain balances with Key Management Personnel were inadvertently omitted from our 2014 Form 20-F. Comparative balances have been adjusted accordingly. Advances and credits at 31 December 2014 and the highest amounts outstanding during the year have increased by $115m and $120m, respectively ($194m and $227m were previously disclosed). Guarantees at 31 December 2014 and the highest amounts outstanding during the year have increased by $78m and $79m, respectively (no amounts were previously disclosed).
HSBC HOLDINGS PLC
358d |
Table of Contents
2 Net income from financial instruments designated at fair value
Accounting policy
Net income from financial instruments designated at fair value includes all gains and losses from changes in the fair value of financial assets and liabilities designated at fair value through profit or loss, including derivatives that are managed in conjunction with those financial assets and liabilities, and liabilities under investment contracts. Interest income, interest expense and dividend income in respect of those financial instruments are also included, except for interest arising from debt securities issued by HSBC and derivatives managed in conjunction with those debt securities, which is recognised in ‘Interest expense’.
| ||
Net income from financial instruments designated at fair value
| 2015 | 2014 | 2013 | ||||||||||||||||
| $m | $m | $m | ||||||||||||||||
Net income/(expense) arising on: | ||||||||||||||||||
– financial assets held to meet liabilities under insurance and investment contracts | 531 | 2,300 | 3,170 | |||||||||||||||
– other financial assets designated at fair value | 89 | 131 | 118 | |||||||||||||||
– derivatives managed in conjunction with other financial assets designated at fair value | 13 | (19 | ) | (26 | ) | |||||||||||||
| 633 | 2,412 | 3,262 | ||||||||||||||||
– liabilities to customers under investment contracts | 34 | (435 | ) | (1,237 | ) | |||||||||||||
– HSBC’s long-term debt issued and related derivatives | 863 | 508 | (1,228 | ) | ||||||||||||||
– changes in own credit spread on long-term debt | 1,002 | 417 | (1,246 | ) | ||||||||||||||
– derivatives managed in conjunction with HSBC’s issued debt securities | (1,997 | ) | 333 | (3,743 | ) | |||||||||||||
– other changes in fair value | 1,858 | (242 | ) | 3,761 | ||||||||||||||
– other financial liabilities designated at fair value | 3 | (23 | ) | (39 | ) | |||||||||||||
– derivatives managed in conjunction with other financial liabilities designated at fair value | (1 | ) | 11 | 10 | ||||||||||||||
| 899 | 61 | (2,494 | ) | |||||||||||||||
Year ended 31 December | 1,532 | 2,473 | 768 | |||||||||||||||
HSBC Holdings
Net income/(expense) arising on HSBC Holdings long-term debt issued and related derivatives
| 2015 | 2014 | 2013 | ||||||||||||||||
| $m | $m | $m | ||||||||||||||||
Net income/(expense) arising on: | ||||||||||||||||||
– changes in own credit spread on long-term debt | 348 | 339 | (695 | ) | ||||||||||||||
– derivatives managed in conjunction with HSBC Holdings issued debt securities | (927 | ) | 126 | (1,558 | ) | |||||||||||||
– other changes in fair value | 855 | (27 | ) | 1,213 | ||||||||||||||
Year ended 31 December | 276 | 438 | (1,040 | ) | ||||||||||||||
3 Net insurance premium income
Accounting policy
Premiums for life insurance contracts are accounted for when receivable, except in unit-linked insurance contracts where premiums are accounted for when liabilities are established.
Reinsurance premiums are accounted for in the same accounting period as the premiums for the direct insurance contracts to which they relate.
| ||
Net insurance premium income
|
| Non-linked insurance | 1 |
| Linked life insurance |
|
| Investment contracts with DPF |
2 | Total | |||||||||||||||
| $m | $m | $m | $m | |||||||||||||||||||||
Gross insurance premium income | 7,506 | 1,409 | 2,097 | 11,012 | ||||||||||||||||||||
Reinsurers’ share of gross insurance premium income | (648 | ) | (9 | ) | – | (657 | ) | |||||||||||||||||
Year ended 31 December 2015 | 6,858 | 1,400 | 2,097 | 10,355 | ||||||||||||||||||||
HSBC HOLDINGS PLC
359 |
Table of Contents
Notes on the Financial Statements(continued)
4 – Net insurance claims / 5 – Operating profit / 6 – Employee compensation and benefits
Net insurance premium income(continued)
|
| Non-linked insurance | 1 |
| Linked life insurance |
|
| Investment contracts with DPF |
2 | Total | |||||||||||||||
| $m | $m | $m | $m | |||||||||||||||||||||
Gross insurance premium income | 7,705 | 2,195 | 2,470 | 12,370 | ||||||||||||||||||||
Reinsurers’ share of gross insurance premium income | (441 | ) | (8 | ) | – | (449 | ) | |||||||||||||||||
Year ended 31 December 2014 | 7,264 | 2,187 | 2,470 | 11,921 | ||||||||||||||||||||
Gross insurance premium income | 7,002 | 3,012 | 2,384 | 12,398 | ||||||||||||||||||||
Reinsurers’ share of gross insurance premium income | (450 | ) | (8 | ) | – | (458 | ) | |||||||||||||||||
Year ended 31 December 2013 | 6,552 | 3,004 | 2,384 | 11,940 | ||||||||||||||||||||
| 1 | Includes non-life insurance. |
| 2 | Discretionary participation features. |
4 Net insurance claims and benefits paid and movement in liabilities to policyholders
Accounting policy
Gross insurance claims for life insurance contracts reflect the total cost of claims arising during the year, including claim handling costs and any policyholder bonuses allocated in anticipation of a bonus declaration.
Maturity claims are recognised when due for payment. Surrenders are recognised when paid or at an earlier date on which, following notification, the policy ceases to be included within the calculation of the related insurance liabilities. Death claims are recognised when notified.
Reinsurance recoveries are accounted for in the same period as the related claim.
| ||
Net insurance claims and benefits paid and movement in liabilities to policyholders
|
| Non-linked insurance | 1 |
| Linked life insurance |
|
| Investment contracts with DPF |
2 | Total | |||||||||||||||
| $m | $m | $m | $m | |||||||||||||||||||||
Gross claims and benefits paid and movement in liabilities | 7,746 | 1,398 | 2,728 | 11,872 | ||||||||||||||||||||
– claims, benefits and surrenders paid | 3,200 | 1,869 | 2,101 | 7,170 | ||||||||||||||||||||
– movement in liabilities | 4,546 | (471 | ) | 627 | 4,702 | |||||||||||||||||||
Reinsurers’ share of claims and benefits paid and movement in liabilities | (575 | ) | (5 | ) | – | (580 | ) | |||||||||||||||||
– claims, benefits and surrenders paid | (153 | ) | �� | (64 | ) | – | (217 | ) | ||||||||||||||||
– movement in liabilities | (422 | ) | 59 | – | (363 | ) | ||||||||||||||||||
Year ended 31 December 2015 | 7,171 | 1,393 | 2,728 | 11,292 | ||||||||||||||||||||
Gross claims and benefits paid and movement in liabilities | 7,770 | 2,765 | 3,188 | 13,723 | ||||||||||||||||||||
– claims, benefits and surrenders paid | 3,575 | 1,499 | 2,215 | 7,289 | ||||||||||||||||||||
– movement in liabilities | 4,195 | 1,266 | 973 | 6,434 | ||||||||||||||||||||
Reinsurers’ share of claims and benefits paid and movement in liabilities | (411 | ) | 33 | – | (378 | ) | ||||||||||||||||||
– claims, benefits and surrenders paid | (176 | ) | (88 | ) | – | (264 | ) | |||||||||||||||||
– movement in liabilities | (235 | ) | 121 | – | (114 | ) | ||||||||||||||||||
Year ended 31 December 2014 | 7,359 | 2,798 | 3,188 | 13,345 | ||||||||||||||||||||
Gross claims and benefits paid and movement in liabilities | 6,892 | 3,379 | 3,677 | 13,948 | ||||||||||||||||||||
– claims, benefits and surrenders paid | 3,014 | 1,976 | 2,308 | 7,298 | ||||||||||||||||||||
– movement in liabilities | 3,878 | 1,403 | 1,369 | 6,650 | ||||||||||||||||||||
Reinsurers’ share of claims and benefits paid and movement in liabilities | (367 | ) | 111 | – | (256 | ) | ||||||||||||||||||
– claims, benefits and surrenders paid | (164 | ) | (426 | ) | – | (590 | ) | |||||||||||||||||
– movement in liabilities | (203 | ) | 537 | – | 334 | |||||||||||||||||||
Year ended 31 December 2013 | 6,525 | 3,490 | 3,677 | 13,692 | ||||||||||||||||||||
| 1 | Includes non-life insurance. |
| 2 | Discretionary participation features. |
HSBC HOLDINGS PLC
360 |
Table of Contents
Operating profit is stated after the following items of income, expense, gains and losses, and loan impairment charges and other credit risk provisions:
| 2015 | 2014 | 2013 | ||||||||||||||||
| $m | $m | $m | ||||||||||||||||
Income | ||||||||||||||||||
Interest recognised on impaired financial assets | 934 | 1,137 | 1,261 | |||||||||||||||
Fees earned on financial assets or liabilities not held for trading nor designated at fair value, other than fees included in effective interest rate calculations on these types of assets and liabilities | 8,736 | 9,438 | 9,799 | |||||||||||||||
Fees earned on trust and other fiduciary activities where HSBC holds or invests assets on behalf of its customers | 3,052 | 3,253 | 3,176 | |||||||||||||||
Income from listed investments | 5,760 | 6,726 | 5,432 | |||||||||||||||
Income from unlisted investments | 5,581 | 5,874 | 6,860 | |||||||||||||||
Expense | ||||||||||||||||||
Interest on financial instruments, excluding interest on financial liabilities held for trading or designated at fair value | (13,680 | ) | (15,322 | ) | (14,610 | ) | ||||||||||||
Fees payable on financial assets or liabilities not held for trading nor designated at fair value, other than fees included in effective interest rate calculations on these types of assets and liabilities | (1,251 | ) | (1,427 | ) | (1,396 | ) | ||||||||||||
Fees payable relating to trust and other fiduciary activities where HSBC holds or invests assets on behalf of its customers | (166 | ) | (185 | ) | (171 | ) | ||||||||||||
Payments under lease and sublease agreements | (1,190 | ) | (1,548 | ) | (1,425 | ) | ||||||||||||
– minimum lease payments | (1,058 | ) | (1,199 | ) | (1,098 | ) | ||||||||||||
– contingent rents and sublease payments | (132 | ) | (349 | ) | (327 | ) | ||||||||||||
UK bank levy | (1,421 | ) | (1,066 | ) | (916 | ) | ||||||||||||
Restructuring provisions | (430 | ) | (147 | ) | (179 | ) | ||||||||||||
Gains/(losses) | ||||||||||||||||||
Impairment of available-for-sale equity securities | (111 | ) | (373 | ) | (175 | ) | ||||||||||||
Gains/(losses) recognised on assets held for sale | (244 | ) | 220 | (729 | ) | |||||||||||||
Gains on the partial sale of shareholding in Industrial Bank | 1,372 | – | – | |||||||||||||||
Gains/(losses) arising from dilution of interest in Industrial Bank and other associates and joint ventures | – | (32 | ) | 1,051 | ||||||||||||||
Gains on disposal of HSBC Bank (Panama) S.A. | – | – | 1,107 | |||||||||||||||
Loan impairment charges and other credit risk provisions | (3,721 | ) | (3,851 | ) | (5,849 | ) | ||||||||||||
– net impairment charge on loans and advances | (3,592 | ) | (4,055 | ) | (6,048 | ) | ||||||||||||
– release of available-for-sale debt securities | 17 | 319 | 211 | |||||||||||||||
– impairment in respect of other credit risk provisions | (146 | ) | (115 | ) | (12 | ) | ||||||||||||
6 Employee compensation and benefits
| 2015 | 2014 | 2013 | ||||||||||||||||
| $m | $m | $m | ||||||||||||||||
Wages and salaries | 17,245 | 17,477 | 16,879 | |||||||||||||||
Social security costs | 1,600 | 1,666 | 1,594 | |||||||||||||||
Post-employment benefits | 1,055 | 1,223 | 723 | |||||||||||||||
Year ended 31 December | 19,900 | 20,366 | 19,196 | |||||||||||||||
Average number of persons employed by HSBC during the year
| 2015 | 2014 | 2013 | ||||||||||||||||
Europe | 73,868 | 74,024 | 75,334 | |||||||||||||||
Asia | 121,438 | 116,492 | 114,216 | |||||||||||||||
Middle East and North Africa | 9,007 | 8,616 | 9,181 | |||||||||||||||
North America | 21,506 | 21,983 | 22,568 | |||||||||||||||
Latin America | 42,614 | 43,652 | 47,496 | |||||||||||||||
Year ended 31 December | 268,433 | 264,767 | 268,795 | |||||||||||||||
HSBC HOLDINGS PLC
361 |
Table of Contents
Notes on the Financial Statements(continued)
6 – Employee compensation and benefits
Reconciliation of total incentive awards granted to incentive awards in employee compensation and benefits
| 2015 | 2014 | 2013 | ||||||||||||||||
| $m | $m | $m | ||||||||||||||||
Total incentive awards approved and granted for the current year1 | 3,462 | 3,660 | 3,920 | |||||||||||||||
Less: deferred bonuses awarded for the current year, expected to be recognised in future periods | (387 | ) | (359 | ) | (436 | ) | ||||||||||||
Total incentives awarded and recognised in the current year | 3,075 | 3,301 | 3,484 | |||||||||||||||
Current year charges for deferred bonuses from previous years | 483 | 425 | 427 | |||||||||||||||
Other | (40 | ) | (114 | ) | (164 | ) | ||||||||||||
Total incentive awards for the current year included in employee compensation and benefits | 3,518 | 3,612 | 3,747 | |||||||||||||||
| 1 | This represents the amount of the Group variable pay pool that has been approved and granted. The total amount of Group variable pay pool approved by the Group Remuneration Committee is disclosed in the Directors’ Remuneration Report on page 304. |
Income statement charge: deferred bonuses
Current year bonus pool | Prior year bonus pools | Total | ||||||||||||||||
| $m | $m | $m | ||||||||||||||||
2015 | ||||||||||||||||||
Charge recognised in 2015 | 253 | 483 | 736 | |||||||||||||||
– deferred share awards | 186 | 382 | 568 | |||||||||||||||
– deferred cash awards | 67 | 101 | 168 | |||||||||||||||
Charge expected to be recognised in 2016 or later | 387 | 346 | 733 | |||||||||||||||
– deferred share awards | 260 | 279 | 539 | |||||||||||||||
– deferred cash awards | 127 | 67 | 194 | |||||||||||||||
2014 | ||||||||||||||||||
Charge recognised in 2014 | 245 | 425 | 670 | |||||||||||||||
– deferred share awards | 147 | 373 | 520 | |||||||||||||||
– deferred cash awards | 98 | 52 | 150 | |||||||||||||||
Charge expected to be recognised in 2015 or later | 359 | 381 | 740 | |||||||||||||||
– deferred share awards | 250 | 334 | 584 | |||||||||||||||
– deferred cash awards | 109 | 47 | 156 | |||||||||||||||
2013 | ||||||||||||||||||
Charge recognised in 2013 | 269 | 427 | 696 | |||||||||||||||
– deferred share awards | 188 | 354 | 542 | |||||||||||||||
– deferred cash awards | 81 | 73 | 154 | |||||||||||||||
Charge expected to be recognised in 2014 or later | 436 | 306 | 742 | |||||||||||||||
– deferred share awards | 356 | 259 | 615 | |||||||||||||||
– deferred cash awards | 80 | 47 | 127 | |||||||||||||||
Share-based payments
Accounting policy
HSBC enters into both equity-settled and cash-settled share-based payment arrangements with its employees as compensation for services provided by employees. The cost of equity-settled share-based payment arrangements with employees is measured by reference to the fair value of equity instruments on the date they are granted and recognised as an expense on a straight-line basis over the vesting period, with a corresponding credit to ‘Retained earnings’.
For cash-settled share-based payment arrangements, the services acquired and liability incurred are measured at the fair value of the liability and recognised as the employees render service. Until settlement, the fair value of the liability is re-measured, with changes in fair value recognised in the income statement.
Fair value is determined by using appropriate valuation models. Vesting conditions include service conditions and performance conditions; any other features of the arrangement are non-vesting conditions. Market performance conditions and non-vesting conditions are taken into account when estimating the fair value of the award at the date of grant. Vesting conditions other than market performance conditions are not taken into account in the initial estimate of the fair value at the grant date. They are taken into account by adjusting the number of equity instruments included in the measurement of the transaction.
A cancellation that occurs during the vesting period is treated as an acceleration of vesting and is recognised immediately for the amount that would otherwise have been recognised for services over the vesting period.
Where HSBC Holdings enters into share-based payment arrangements involving employees of subsidiaries for which the subsidiaries are re-charged, the difference between the cost of the share-based payment arrangement and the fair value of the equity instruments expected to be issued to satisfy those arrangements is recognised as an adjustment to ‘Investment in subsidiaries’ over the vesting period.
| ||
HSBC HOLDINGS PLC
362 |
Table of Contents
‘Wages and salaries’ include the effect of share-based payments arrangements, of which $757m were equity settled (2014: $732m; 2013: $630m), as follows:
| 2015 | 2014 | 2013 | ||||||||||||||||
| $m | $m | $m | ||||||||||||||||
Restricted share awards | 748 | 738 | 599 | |||||||||||||||
Savings-related and other share award option plans | 43 | 36 | 63 | |||||||||||||||
Year ended 31 December | 791 | 774 | 662 | |||||||||||||||
HSBC share awards
Award
| Policy
| Purpose
| ||
Restricted share awards (including annual incentive awards delivered in shares) and GPSP | • An assessment of performance over the relevant period ending on 31 December is used to determine the amount of the award to be granted.
• Deferred awards generally require employees to remain in employment over the vesting period and are not subject to performance conditions after the grant date.
• Deferred share awards generally vest over a period of three years and GPSP awards vest after five years.
• Vested shares may be subject to a retention requirement (restriction) post-vesting. GPSP awards are retained until cessation of employment.
• Awards granted from 2010 onwards are subject to a malus provision prior to vesting.
• Awards granted to Material Risk Takers from 2015 onwards are subject to clawback post vesting. | • To drive and reward performance consistent with strategy and align to shareholder interests.
• Deferral provides an incentive for a longer-term commitment and the ability to apply malus. | ||
International Employee Share Purchase Plan (‘ShareMatch’) | • The plan was first introduced in Hong Kong in 2013 and now includes employees based in 25 jurisdictions.
• Shares are purchased in the market each quarter up to a maximum value of £750, or the equivalent in local currency.
• Matching awards are added at a ratio of one free share for every three purchased.
• Matching awards vest subject to continued employment and the retention of the purchased shares for a maximum period of two years and nine months. | • To align the interests of employees with the creation of shareholder value. | ||
Movement on HSBC share awards
| 2015 | 2014 | |||||||||||
Number (000s) | Number (000s) | |||||||||||
Restricted share awards outstanding at 1 January | 116,483 | 116,932 | ||||||||||
Additions during the year | 80,749 | 82,871 | ||||||||||
Released in the year | (75,235 | ) | (78,224 | ) | ||||||||
Forfeited in the year | (3,332 | ) | (5,096 | ) | ||||||||
Restricted share awards outstanding at 31 December | 118,665 | 116,483 | ||||||||||
Weighted average fair value of awards granted ($) | 9.67 | 10.18 | ||||||||||
HSBC HOLDINGS PLC
363 |
Table of Contents
Notes on the Financial Statements(continued)
6 – Employee compensation and benefits
HSBC share option plans
Main plans
| Policy
| Purpose
| ||
Savings-related share option plans (‘Sharesave’) | • Two plans: the UK Plan and the International Plan. The last grant of options under the International Plan was in 2012.
• From 2014, eligible employees can save up to £500 per month with the option to use the savings to acquire shares.
• Exercisable within six months following either the third or fifth anniversaries of the commencement of a three-year or five-year contract, respectively.
• The exercise price is set at a 20% (2014: 20%) discount to the market value immediately preceding the date of invitation. | • To align the interests of employees with the creation of shareholder value. | ||
HSBC Holdings Group share option plan | • Plan ceased in May 2005.
• Exercisable between the third and tenth anniversaries of the date of grant. | • Long-term incentive plan between 2000 and 2005 during which certain HSBC employees were awarded share options. | ||
Calculation of fair values
The fair values of share options are calculated using a Black-Scholes model. The fair value of a share award is based on the share price at the date of the grant.
Movement on HSBC share option plans
| Savings-related share option plans | HSBC Holdings Group share option plan | |||||||||||||||||||||||
|
| Number (000s) |
|
| WAEP £ | 1
|
| Number (000s) |
|
| WAEP £ | 1
| |||||||||||||
Outstanding at 1 January 2015 | 66,366 | 4.89 | 6,374 | 7.29 | ||||||||||||||||||||
Granted during the year2 | 52,629 | 4.05 | – | – | ||||||||||||||||||||
Exercised during the year3 | (21,120 | ) | 4.45 | – | – | |||||||||||||||||||
Expired during the year | (23,100 | ) | 5.11 | (6,374 | ) | 7.29 | ||||||||||||||||||
Outstanding at 31 December 2015 | 74,775 | 4.36 | – | – | ||||||||||||||||||||
Weighted average remaining contractual life (years) | 3.92 | – | ||||||||||||||||||||||
Outstanding at 1 January 2014 | 93,760 | 4.04 | 55,026 | 7.23 | ||||||||||||||||||||
Granted during the year2 | 28,689 | 5.19 | – | – | ||||||||||||||||||||
Exercised during the year3 | (50,393 | ) | 3.48 | (1 | ) | 7.22 | ||||||||||||||||||
Expired during the year | (5,690 | ) | 4.81 | (48,651 | ) | 7.22 | ||||||||||||||||||
Outstanding at 31 December 2014 | 66,366 | 4.89 | 6,374 | 7.29 | ||||||||||||||||||||
Weighted average remaining contractual life (years) | 2.66 | 0.30 | ||||||||||||||||||||||
| 1 | Weighted average exercise price. |
| 2 | The weighted average fair value of options granted during the year was $1.09 (2014: $1.90). |
| 3 | The weighted average share price at the date the options were exercised was $8.50 (2014: $9.91) and $0 (2014: $9.49) for the savings-related share option plans and HSBC Holdings Group share option plan, respectively. |
Post-employment benefit plans
Accounting policy
HSBC operates a number of pension and other post-employment benefit plans throughout the world. These plans include both defined benefit and defined contribution plans and various other post-employment benefits such as post-employment healthcare.
Payments to defined contribution plans and state-managed retirement benefit plans, where HSBC’s obligations under the plans are equivalent to a defined contribution plan, are charged as an expense as the employees render service.
The defined benefit pension costs and the present value of defined benefit obligations are calculated at the reporting date by the schemes’ actuaries using the projected unit credit method. The net charge to the income statement mainly comprises the service cost and the net interest on the net defined benefit asset or liability and is presented in operating expenses.
The past service cost, which is charged immediately to the income statement, is the change in the present value of the defined benefit obligation for employee service in prior periods resulting from a plan amendment (the introduction or withdrawal of, or changes to, a defined benefit plan) or curtailment (a significant reduction by the entity in the number of employees covered by a plan). A settlement is a transaction that eliminates all further legal and constructive obligations for part or all of the benefits provided under a defined benefit plan, other than a payment of benefits to, or on behalf of, employees that is set out in the terms of the plan and included in the actuarial assumptions.
Re-measurements of the net defined benefit asset or liability, which comprise actuarial gains and losses, return on plan assets (excluding interest) and the effect of the asset ceiling (if any, excluding interest), are recognised immediately in other comprehensive income.
| ||
HSBC HOLDINGS PLC
364 |
Table of Contents
Actuarial gains and losses comprise experience adjustments (the effects of differences between the previous actuarial assumptions and what has actually occurred), as well as the effects of changes in actuarial assumptions.
The net defined benefit asset or liability represents the present value of defined benefit obligations reduced by the fair value of plan assets. Any net defined benefit surplus is limited to the present value of available refunds and reductions in future contributions to the plan.
The cost of obligations arising from other post-employment defined benefit plans, such as defined benefit health-care plans, are accounted for on the same basis as defined benefit pension plans.
| ||
The Group operates a number of pension plans throughout the world. Some are defined benefit plans, of which the largest is the HSBC Bank (UK) Pension Scheme (‘the principal plan’). The Pension Risk section on page 189 and the Appendix to Risk on page 225 contain details about the characteristics, risks and amount, timing and uncertainty of future cash flows and policies and practices associated with the principal plan.
Income statement charge
| 2015 | 2014 | 2013 | ||||||||||||||||||
| $m | $m | $m | ||||||||||||||||||
Defined benefit pension plans | 256 | 469 | 54 | |||||||||||||||||
Defined contribution pension plans | 793 | 687 | 597 | |||||||||||||||||
Pension plans | 1,049 | 1,156 | 651 | |||||||||||||||||
Defined benefit and contribution healthcare plans | 6 | 67 | 72 | |||||||||||||||||
Year ended 31 December | 1,055 | 1,223 | 723 | |||||||||||||||||
Net assets/(liabilities) recognised on the balance sheet in respect of defined benefit plans
|
| Fair value of plan assets |
|
| Present value of defined benefit obligations |
|
| Effect of limit on plan surpluses |
| Total | |||||||||||||||||
| $m | $m | $m | $m | |||||||||||||||||||||||
Defined benefit pension plans | 41,424 | (38,326 | ) | (14 | ) | 3,084 | ||||||||||||||||||||
Defined benefit healthcare plans | 141 | (762 | ) | – | (621 | ) | ||||||||||||||||||||
At 31 December 2015 | 41,565 | (39,088 | ) | (14 | ) | 2,463 | ||||||||||||||||||||
Total employee benefit liabilities | (2,809 | ) | ||||||||||||||||||||||||
Total employee benefit assets | 5,272 | |||||||||||||||||||||||||
Defined benefit pension plans | 44,824 | (42,062 | ) | (17 | ) | 2,745 | ||||||||||||||||||||
Defined benefit healthcare plans | 179 | (1,104 | ) | – | (925 | ) | ||||||||||||||||||||
At 31 December 2014 | 45,003 | (43,166 | ) | (17 | ) | 1,820 | ||||||||||||||||||||
Total employee benefit liabilities | (3,208 | ) | ||||||||||||||||||||||||
Total employee benefit assets | 5,028 | |||||||||||||||||||||||||
Cumulative actuarial gains/(losses) recognised in other comprehensive income
| 2015 | 2014 | 2013 | ||||||||||||||||||
| $m | $m | $m | ||||||||||||||||||
At 1 January | (2,026 | ) | (4,445 | ) | (3,844 | ) | ||||||||||||||
HSBC Bank (UK) Pension Scheme | 121 | 2,764 | (1,524 | ) | ||||||||||||||||
Other plans | (55 | ) | (274 | ) | 796 | |||||||||||||||
Healthcare plans | 94 | (88 | ) | 143 | ||||||||||||||||
Change in the effect of limit on plan surpluses | (30 | ) | 17 | (16 | ) | |||||||||||||||
Total actuarial gains/(losses) recognised in other comprehensive income | 130 | 2,419 | (601 | ) | ||||||||||||||||
At 31 December | (1,896 | ) | (2,026 | ) | (4,445 | ) | ||||||||||||||
HSBC pension plans
| 2015 | 2014 | 2013 | ||||||||||||||||||
| % | % | % | ||||||||||||||||||
Percentage of HSBC employees: | ||||||||||||||||||||
– enrolled in defined contribution plans | 66 | 66 | 64 | |||||||||||||||||
– enrolled in defined benefit plans | 22 | 22 | 23 | |||||||||||||||||
– covered by HSBC pension plans | 88 | 88 | 87 | |||||||||||||||||
HSBC HOLDINGS PLC
365 |
Table of Contents
Notes on the Financial Statements(continued)
6 – Employee compensation and benefits
Defined benefit pension plans
Net asset/(liability) under defined benefit pension plans
| Fair value of plan assets | Present value of defined benefit obligations | Effect of the asset ceiling | Net defined benefit asset/(liability) | |||||||||||||||||||||||||||||||||||||||||||||
The principal plan | Other plans | The principal plan | Other plans | The principal plan | Other plans | The principal plan | Other plans | |||||||||||||||||||||||||||||||||||||||||
| $m | $m | $m | $m | $m | $m | $m | $m | |||||||||||||||||||||||||||||||||||||||||
At 1 January 2015 | 35,244 | 9,580 | (30,480 | ) | (11,582 | ) | – | (17 | ) | 4,764 | (2,019 | ) | ||||||||||||||||||||||||||||||||||||
Current service cost | – | – | (129 | ) | (268 | ) | – | – | (129 | ) | (268 | ) | ||||||||||||||||||||||||||||||||||||
Past service cost and gains/(losses) from settlements | – | (3 | ) | (53 | ) | 71 | – | – | (53 | ) | 68 | |||||||||||||||||||||||||||||||||||||
Service cost | – | (3 | ) | (182 | ) | (197 | ) | – | – | (182 | ) | (200 | ) | |||||||||||||||||||||||||||||||||||
Net interest income/(cost) on the net defined benefit asset/(liability) | 1,265 | 322 | (1,088 | ) | (371 | ) | – | (2 | ) | 177 | (51 | ) | ||||||||||||||||||||||||||||||||||||
Re-measurement effects recognised in other comprehensive income | (1,521 | ) | (394 | ) | 1,642 | 339 | – | (30 | ) | 121 | (85 | ) | ||||||||||||||||||||||||||||||||||||
– return on plan assets (excluding interest income) | (1,521 | ) | (394 | ) | – | – | – | – | (1,521 | ) | (394 | ) | ||||||||||||||||||||||||||||||||||||
– actuarial gains/(losses) | – | – | 1,392 | 339 | – | (30 | ) | 1,392 | 309 | |||||||||||||||||||||||||||||||||||||||
– other changes | – | – | 250 | – | – | – | 250 | – | ||||||||||||||||||||||||||||||||||||||||
Exchange differences | (1,704 | ) | (458 | ) | 1,443 | 529 | – | 35 | (261 | ) | 106 | |||||||||||||||||||||||||||||||||||||
Contributions by HSBC | 376 | 279 | – | – | – | – | 376 | 279 | ||||||||||||||||||||||||||||||||||||||||
– normal | 159 | 227 | – | – | – | – | 159 | 227 | ||||||||||||||||||||||||||||||||||||||||
– special | 217 | 52 | – | – | – | – | 217 | 52 | ||||||||||||||||||||||||||||||||||||||||
Contributions by employees | 17 | 35 | (17 | ) | (35 | ) | – | – | – | – | ||||||||||||||||||||||||||||||||||||||
Benefits paid | (970 | ) | (590 | ) | 970 | 649 | – | – | – | 59 | ||||||||||||||||||||||||||||||||||||||
Administrative costs and taxes paid by plan | (37 | ) | (17 | ) | 37 | 17 | – | – | – | – | ||||||||||||||||||||||||||||||||||||||
At 31 December 2015 | 32,670 | 8,754 | (27,675 | ) | (10,651 | ) | – | (14 | ) | 4,995 | (1,911 | ) | ||||||||||||||||||||||||||||||||||||
Present value of defined benefit obligation relating to: | ||||||||||||||||||||||||||||||||||||||||||||||||
– actives | (6,310 | ) | (5,350 | ) | ||||||||||||||||||||||||||||||||||||||||||||
– deferreds | (7,919 | ) | (2,239 | ) | ||||||||||||||||||||||||||||||||||||||||||||
– pensioners | (13,446 | ) | (3,062 | ) | ||||||||||||||||||||||||||||||||||||||||||||
At 1 January 2014 | 31,665 | 8,957 | (29,629 | ) | (10,838 | ) | – | (30 | ) | 2,036 | (1,911 | ) | ||||||||||||||||||||||||||||||||||||
Current service cost | – | – | (228 | ) | (257 | ) | – | – | (228 | ) | (257 | ) | ||||||||||||||||||||||||||||||||||||
Past service cost and gains/(losses) from settlements | – | (5 | ) | (26 | ) | 11 | – | – | (26 | ) | 6 | |||||||||||||||||||||||||||||||||||||
Service cost | – | (5 | ) | (254 | ) | (246 | ) | – | – | (254 | ) | (251 | ) | |||||||||||||||||||||||||||||||||||
Net interest income/(cost) on the net defined benefit asset/(liability) | 1,386 | 370 | (1,291 | ) | (425 | ) | – | (4 | ) | 95 | (59 | ) | ||||||||||||||||||||||||||||||||||||
Re-measurement effects recognised in other comprehensive income | 4,864 | 845 | (2,100 | ) | (1,034 | ) | – | 17 | 2,764 | (172 | ) | |||||||||||||||||||||||||||||||||||||
– return on plan assets (excluding interest income) | 4,864 | 845 | – | – | – | – | 4,864 | 845 | ||||||||||||||||||||||||||||||||||||||||
– actuarial losses | – | – | (2,317 | ) | (987 | ) | – | – | (2,317 | ) | (987 | ) | ||||||||||||||||||||||||||||||||||||
– other changes | – | – | 217 | (47 | ) | – | 17 | 217 | (30 | ) | ||||||||||||||||||||||||||||||||||||||
Exchange differences | (2,112 | ) | (316 | ) | 1,838 | 357 | – | – | (274 | ) | 41 | |||||||||||||||||||||||||||||||||||||
Contributions by HSBC | 397 | 278 | – | – | – | – | 397 | 278 | ||||||||||||||||||||||||||||||||||||||||
– normal | 265 | 239 | – | – | – | – | 265 | 239 | ||||||||||||||||||||||||||||||||||||||||
– special | 132 | 39 | – | – | – | – | 132 | 39 | ||||||||||||||||||||||||||||||||||||||||
Contributions by employees | 38 | 17 | (38 | ) | (17 | ) | – | – | – | – | ||||||||||||||||||||||||||||||||||||||
Benefits paid | (954 | ) | (543 | ) | 954 | 598 | – | – | – | 55 | ||||||||||||||||||||||||||||||||||||||
Administrative costs and taxes paid by plan | (40 | ) | (23 | ) | 40 | 23 | – | – | – | – | ||||||||||||||||||||||||||||||||||||||
At 31 December 2014 | 35,244 | 9,580 | (30,480 | ) | (11,582 | ) | – | (17 | ) | 4,764 | (2,019 | ) | ||||||||||||||||||||||||||||||||||||
Present value of defined benefit obligation relating to: | ||||||||||||||||||||||||||||||||||||||||||||||||
– actives | (9,782 | ) | (5,605 | ) | ||||||||||||||||||||||||||||||||||||||||||||
– deferreds | (8,799 | ) | (2,498 | ) | ||||||||||||||||||||||||||||||||||||||||||||
– pensioners | (11,899 | ) | (3,479 | ) | ||||||||||||||||||||||||||||||||||||||||||||
HSBC HOLDINGS PLC
366 |
Table of Contents
HSBC expects to make $458m of contributions to defined benefit pension plans during 2016. Benefits expected to be paid from the plans to retirees over each of the next five years, and in aggregate for the five years thereafter, are as follows:
Benefits expected to be paid from plans
| 2016 | 2017 | 2018 | 2019 | 2020 | 2021-2025 | |||||||||||||||||||||
| $m | $m | $m | $m | $m | $m | |||||||||||||||||||||
The principal plan1 | 1,006 | 1,040 | 1,075 | 1,109 | 1,204 | 6,425 | ||||||||||||||||||||
Other plans1 | 482 | 466 | 476 | 511 | 530 | 2,692 | ||||||||||||||||||||
| 1 | The duration of the defined benefit obligation is 17.0 years for the principal plan under the disclosure assumptions adopted (2014: 19.8 years) and 13.9 years for all other plans combined (2014: 14.2 years). |
Fair value of plan assets by asset classes
| 31 December 2015 | 31 December 2014 | |||||||||||||||||||||||||||||||||||||||||||||||||
| Value |
| Quoted market price in active market |
|
| No quoted market price in active market |
|
| Thereof HSBC | 1 | Value |
| Quoted market price in active market |
|
| No quoted market price in active market |
|
| Thereof HSBC | 1 | |||||||||||||||||||||||||||||||
| $m | $m | $m | $m | $m | $m | $m | $m | |||||||||||||||||||||||||||||||||||||||||||
The principal plan | ||||||||||||||||||||||||||||||||||||||||||||||||||
Fair value of plan assets | 32,670 | 29,370 | 3,300 | 513 | 35,244 | 31,355 | 3,889 | 930 | ||||||||||||||||||||||||||||||||||||||||||
– equities | 5,730 | 4,990 | 740 | – | 5,502 | 4,557 | 945 | – | ||||||||||||||||||||||||||||||||||||||||||
– bonds | 22,704 | 22,704 | – | – | 22,965 | 22,965 | – | – | ||||||||||||||||||||||||||||||||||||||||||
– derivatives | 1,011 | – | 1,011 | 513 | 1,369 | 52 | 1,317 | 930 | ||||||||||||||||||||||||||||||||||||||||||
– other | 3,225 | 1,676 | 1,549 | – | 5,408 | 3,781 | 1,627 | – | ||||||||||||||||||||||||||||||||||||||||||
Other plans | ||||||||||||||||||||||||||||||||||||||||||||||||||
Fair value of plan assets | 8,754 | 7,882 | 872 | 148 | 9,580 | 6,390 | 3,190 | (13 | ) | |||||||||||||||||||||||||||||||||||||||||
– equities | 2,434 | 1,900 | 534 | 1 | 2,534 | 1,778 | 756 | 11 | ||||||||||||||||||||||||||||||||||||||||||
– bonds | 5,719 | 5,458 | 261 | 2 | 6,376 | 4,109 | 2,267 | 7 | ||||||||||||||||||||||||||||||||||||||||||
– derivatives | 7 | – | 7 | 1 | (100 | ) | (8 | ) | (92 | ) | (107 | ) | ||||||||||||||||||||||||||||||||||||||
– other | 594 | 524 | 70 | 144 | 770 | 511 | 259 | 76 | ||||||||||||||||||||||||||||||||||||||||||
| 1 | The fair value of plan assets includes derivatives entered into with HSBC Bank plc as detailed in Note 41. |
Post-employment defined benefit plans’ principal actuarial financial assumptions
HSBC determines the discount rates to be applied to its obligations in consultation with the plans’ local actuaries, on the basis of current average yields of high quality (AA-rated or equivalent) debt instruments with maturities consistent with those of the defined benefit obligations.
Key actuarial assumptions for the principal plan
Discount rate | Inflation rate | Rate of increase for pensions | Rate of pay increase | Interest credit rate | ||||||||||||||||||||||||||||
| % | % | % | % | % | ||||||||||||||||||||||||||||
UK | ||||||||||||||||||||||||||||||||
At 31 December 2015 | 3.70 | 3.20 | 3.00 | 3.70 | n/a | |||||||||||||||||||||||||||
At 31 December 2014 | 3.70 | 3.20 | 3.00 | 3.70 | n/a | |||||||||||||||||||||||||||
At 31 December 2013 | 4.45 | 3.60 | 3.30 | 4.10 | n/a | |||||||||||||||||||||||||||
Mortality tables and average life expectancy at age 65 for the principal plan
|
| |||||||||||||||||||||||||||||||
Mortality table | Life expectancy at age 65 for a male member currently: | Life expectancy at age 65 for a female member currently: | ||||||||||||||||||||||||||||||
| Aged 65 | Aged 45 | Aged 65 | Aged 45 | |||||||||||||||||||||||||||||
UK | ||||||||||||||||||||||||||||||||
At 31 December 2015 | SAPS S1 | 1 | 23.6 | 25.0 | 24.9 | 26.7 | ||||||||||||||||||||||||||
At 31 December 2014 | SAPS S1 | 1 | 23.6 | 25.2 | 25.0 | 26.9 | ||||||||||||||||||||||||||
| 1 | Self-administered Pension Scheme (‘SAPS’) Light Table with a multiplier of 1.01 for male pensioners and 1.02 for female pensioners. Improvements are projected in accordance with Continuous Mortality Investigation (‘CMI’) core projection model 2015 (2014: CMI 2014) with a long-term rate of improvement of 1.25% pa. |
HSBC HOLDINGS PLC
367 |
Table of Contents
Notes on the Financial Statements(continued)
6 – Employee compensation and benefits / 7 – Auditors’ remuneration / 8 – Tax
Actuarial assumption sensitivities
The effect of changes in key assumptions on the principal plan
| HSBC Bank (UK) Pension Scheme | ||||||||||||
| 2015 | 2014 | |||||||||||
| $m | $m | |||||||||||
Discount rate | ||||||||||||
Change in pension obligation at year-end from a 25bps increase | (1,107 | ) | (1,420 | ) | ||||||||
Change in pension obligation at year-end from a 25bps decrease | 1,180 | 1,523 | ||||||||||
Change in 2016 pension cost from a 25bps increase | (58 | ) | (75 | ) | ||||||||
Change in 2016 pension cost from a 25bps decrease | 55 | 73 | ||||||||||
Rate of inflation | ||||||||||||
Change in pension obligation at year-end from a 25bps increase | 747 | 1,026 | ||||||||||
Change in pension obligation at year-end from a 25bps decrease | (855 | ) | (1,184 | ) | ||||||||
Change in 2016 pension cost from a 25bps increase | 28 | 44 | ||||||||||
Change in 2016 pension cost from a 25bps decrease | (31 | ) | (48 | ) | ||||||||
Rate of increase for pensions in payment and deferred pensions | ||||||||||||
Change in pension obligation at year-end from a 25bps increase | 990 | 1,188 | ||||||||||
Change in pension obligation at year-end from a 25bps decrease | (937 | ) | (1,127 | ) | ||||||||
Change in 2016 pension cost from a 25bps increase | 37 | 50 | ||||||||||
Change in 2016 pension cost from a 25bps decrease | (34 | ) | (45 | ) | ||||||||
Rate of pay increase | ||||||||||||
Change in pension obligation at year-end from a 25bps increase | 119 | 237 | ||||||||||
Change in pension obligation at year-end from a 25bps decrease | (119 | ) | (232 | ) | ||||||||
Change in 2016 pension cost from a 25bps increase | 4 | 12 | ||||||||||
Change in 2016 pension cost from a 25bps decrease | (4 | ) | (11 | ) | ||||||||
Mortality | ||||||||||||
Change in pension obligation from each additional year of longevity assumed | 670 | 768 | ||||||||||
HSBC Holdings
Employee compensation and benefit expense in respect of HSBC Holdings’ employees in 2015 amounted to $908m (2014: $681m). The average number of persons employed during 2015 was 2,656 (2014: 2,070). Employees who are members of defined benefit pension plans are principally members of either the HSBC Bank (UK) Pension Scheme or the HSBC International Staff Retirement Benefits Scheme. HSBC Holdings pays contributions to such plans for its own employees in accordance with the schedules of contributions determined by the trustees of the plans and recognises these contributions as an expense as they fall due. During 2015, most employees were transferred to the ServCo group (see page 242). Their remuneration and numbers have been included in the narrative above as they have been seconded back to HSBC Holdings on an interim basis.
Directors’ emoluments
Details of directors’ emoluments, pensions and their interests are disclosed in the Director’ Remuneration Report on page 318.
| 2015 | 2014 | 2013 | ||||||||||||||||||
| $m | $m | $m | ||||||||||||||||||
Audit fees payable to PwC/KPMG1 | 62.0 | 40.6 | 43.4 | |||||||||||||||||
Other audit fees payable | 1.2 | 1.2 | 1.1 | |||||||||||||||||
Year ended 31 December | 63.2 | 41.8 | 44.5 | |||||||||||||||||
| 1 | PwC became the Group’s principal auditor in 2015. KPMG was the principal auditor during 2014. |
The following fees were payable by HSBC to the Group’s principal auditor:
Fees payable by HSBC to PwC/KPMG1
| 2015 | 2014 | 2013 | ||||||||||||||||||
| $m | $m | $m | ||||||||||||||||||
Fees for HSBC Holdings’ statutory audit2 | 13.1 | 13.4 | 12.9 | |||||||||||||||||
– relating to current year | 13.1 | 13.4 | 12.6 | |||||||||||||||||
– relating to prior year | – | – | 0.3 | |||||||||||||||||
Fees for other services provided to HSBC | 85.1 | 62.5 | 67.5 | |||||||||||||||||
Audit of HSBC’s subsidiaries3 | 48.9 | 27.2 | 30.5 | |||||||||||||||||
Audit-related assurance services4 | 16.6 | 22.6 | 27.4 | |||||||||||||||||
Taxation-related services: | ||||||||||||||||||||
– taxation compliance services | 1.0 | 1.5 | 1.3 | |||||||||||||||||
– taxation advisory services | 0.9 | 0.8 | 1.3 | |||||||||||||||||
Other assurance services5 | 2.8 | 0.7 | 0.5 | |||||||||||||||||
Other non-audit services5 | 14.9 | 9.7 | 6.5 | |||||||||||||||||
Year ended 31 December | 98.2 | 75.9 | 80.4 | |||||||||||||||||
| 1 | PwC became the Group’s principal auditor in 2015. KPMG was the principal auditor during 2014. |
HSBC HOLDINGS PLC
368 |
Table of Contents
| 2 | Fees payable to KPMG and PwC for the statutory audit of the consolidated financial statements of HSBC and the separate financial statements of HSBC Holdings. They include amounts payable for services relating to the consolidation returns of HSBC Holdings’ subsidiaries which are clearly identifiable as being in support of the Group audit opinion. Excluded from fees are those payable to KPMG related to the transition of the audit to PwC of $1.2m. |
| 3 | Fees payable for the statutory audit of the financial statements of HSBC’s subsidiaries, including the 2015 changes in scope and additional procedures performed due to the technology systems and data access controls matter. |
| 4 | Including services for assurance and other services that relate to statutory and regulatory filings, including comfort letters and interim reviews. |
| 5 | Including other permitted services relating to advisory, corporate finance transactions, etc. |
No fees were payable by HSBC to PwC or KPMG as principal auditor for the following types of services: internal audit services and services related to litigation, recruitment and remuneration.
Fees payable by HSBC’s associated pension schemes to PwC/KPMG1
| 2015 | 2014 | 2013 | ||||||||||||||||
| $000 | $000 | $000 | ||||||||||||||||
Audit of HSBC’s associated pension schemes | 352 | 322 | 379 | |||||||||||||||
Audit related assurance services | 5 | 5 | 5 | |||||||||||||||
Year ended 31 December | 357 | 327 | 384 | |||||||||||||||
| 1 | PwC became the Group’s principal auditor in 2015. KPMG was the principal auditor during 2014. |
No fees were payable by HSBC’s associated pension schemes to PwC or KPMG as principal auditor for the following types of services: audit-related assurance services, internal audit services, other assurance services, services related to corporate finance transactions, valuation and actuarial services, litigation, recruitment and remuneration, and information technology.
In addition to the above, the estimated fees paid to PwC by third parties other than HSBC amount to $2.4m (KPMG 2014: $3.6m; KPMG 2013: $5.3m). In these cases, HSBC is connected with the contracting party and may therefore be involved in appointing PwC. These fees arise from services such as auditing mutual funds managed by HSBC and reviewing the financial position of corporate concerns which borrow from HSBC.
Fees payable for non-audit services for HSBC Holdings are not disclosed separately because such fees are disclosed on a consolidated basis for the HSBC Group.
Accounting policy
Income tax comprises current tax and deferred tax. Income tax is recognised in the income statement except to the extent that it relates to items recognised in other comprehensive income or directly in equity, in which case it is recognised in the same statement in which the related item appears.
Current tax is the tax expected to be payable on the taxable profit for the year, calculated using tax rates enacted or substantively enacted by the balance sheet date, and any adjustment to tax payable in respect of previous years. HSBC provides for potential current tax liabilities that may arise on the basis of the amounts expected to be paid to the tax authorities. Current tax assets and liabilities are offset when HSBC intends to settle on a net basis and the legal right to offset exists.
Deferred tax is recognised on temporary differences between the carrying amounts of assets and liabilities in the balance sheet and the amounts attributed to such assets and liabilities for tax purposes. Deferred tax liabilities are generally recognised for all taxable temporary differences and deferred tax assets are recognised to the extent that it is probable that future taxable profits will be available against which deductible temporary differences can be utilised.
Deferred tax is calculated using the tax rates expected to apply in the periods in which the assets will be realised or the liabilities settled, based on tax rates and laws enacted, or substantively enacted, by the balance sheet date. Deferred tax assets and liabilities are offset when they arise in the same tax reporting group and relate to income taxes levied by the same taxation authority, and when HSBC has a legal right to offset.
Deferred tax relating to actuarial gains and losses on post-employment benefits is recognised in other comprehensive income. Deferred tax relating to share-based payment transactions is recognised directly in equity to the extent that the amount of the estimated future tax deduction exceeds the amount of the related cumulative remuneration expense. Deferred tax relating to fair value re-measurements of available-for-sale investments and cash flow hedging instruments is charged or credited directly to other comprehensive income and is subsequently recognised in the income statement when the deferred fair value gain or loss is recognised in the income statement.
|
HSBC HOLDINGS PLC
369 |
Table of Contents
Notes on the Financial Statements(continued)
8 – Tax / 9 – Dividends
Critical accounting estimates and judgements
Deferred tax assets
The recognition of a deferred tax asset relies on an assessment of the probability and sufficiency of future taxable profits, future reversals of existing taxable temporary differences and ongoing tax planning strategies. In the absence of a history of taxable profits, the most significant judgements relate to expected future profitability and to the applicability of tax planning strategies, including corporate reorganisations.
In previous years the US deferred tax recognition relied on capital support from HSBC Holdings plc due to significant losses in the past. The US has been profitable in recent years and the improved performance is expected to continue, so the US deferred tax recognition is now based on projections of future business profits.
|
Tax expense
2015 $m | 2014 $m | 2013 $m | ||||||||||||||||||||
Current tax | ||||||||||||||||||||||
– for this year | 3,882 | 4,477 | 4,050 | |||||||||||||||||||
– adjustments in respect of prior years | (85 | ) | (527 | ) | (109 | ) | ||||||||||||||||
| 3,797 | 3,950 | 3,941 | ||||||||||||||||||||
Deferred tax | (26 | ) | 25 | 824 | ||||||||||||||||||
– origination and reversal of temporary differences | (153 | ) | (477 | ) | 739 | |||||||||||||||||
– effect of changes in tax rates | 110 | 83 | 93 | |||||||||||||||||||
– adjustments in respect of prior years | 17 | 419 | (8 | ) | ||||||||||||||||||
Year ended 31 December | 3,771 | 3,975 | 4,765 | |||||||||||||||||||
| 1 | Current tax included Hong Kong profits tax of $1,294m (2014: $1,135m; 2013: $1,133m). The Hong Kong tax rate applying to the profits of subsidiaries assessable in Hong Kong was 16.5% (2014: 16.5%; 2013: 16.5%). Other overseas subsidiaries and overseas branches provided for taxation at the appropriate rates in the countries in which they operated. |
Tax reconciliation
The tax charged to the income statement differs from the tax charge that would apply if all profits had been taxed at the UK corporation tax rate as follows:
| 2015 | 2014 | 2013 | ||||||||||||||||||||||||||||||||||||||
| $m | % | $m | % | $m | % | |||||||||||||||||||||||||||||||||||
Profit before tax | 18,867 | 18,680 | 22,565 | |||||||||||||||||||||||||||||||||||||
Tax expense | ||||||||||||||||||||||||||||||||||||||||
Tax at 20.25% (2014: 21.5%; 2013: 23.25%) | 3,821 | 20.25 | 4,016 | 21.5 | 5,246 | 23.25 | ||||||||||||||||||||||||||||||||||
Effect of differently taxed overseas profits | 71 | 0.4 | 33 | 0.2 | (177 | ) | (0.8 | ) | ||||||||||||||||||||||||||||||||
Adjustments in respect of prior period liabilities | (68 | ) | (0.4 | ) | (108 | ) | (0.6 | ) | (117 | ) | (0.5 | ) | ||||||||||||||||||||||||||||
Deferred tax temporary differences not recognised/(previously not recognised) | (205 | ) | (1.1 | ) | (154 | ) | (0.8 | ) | 332 | 1.5 | ||||||||||||||||||||||||||||||
Effect of profits in associates and joint ventures | (508 | ) | (2.7 | ) | (547 | ) | (2.9 | ) | (543 | ) | (2.4 | ) | ||||||||||||||||||||||||||||
Tax effect of disposal of Ping An | – | – | – | – | (111 | ) | (0.5 | ) | ||||||||||||||||||||||||||||||||
Tax effect of reclassification of Industrial Bank | – | – | – | – | (317 | ) | (1.4 | ) | ||||||||||||||||||||||||||||||||
Non-taxable income and gains | (728 | ) | (3.9 | ) | (668 | ) | (3.5 | ) | (871 | ) | (3.9 | ) | ||||||||||||||||||||||||||||
Permanent disallowables | 978 | 5.2 | 969 | 5.1 | 647 | 2.9 | ||||||||||||||||||||||||||||||||||
Change in tax rates | 110 | 0.6 | 22 | 0.1 | 93 | 0.4 | ||||||||||||||||||||||||||||||||||
Local taxes and overseas withholding taxes | 416 | 2.2 | 434 | 2.3 | 551 | 2.4 | ||||||||||||||||||||||||||||||||||
Other items | (116 | ) | (0.6 | ) | (22 | ) | (0.1 | ) | 32 | 0.1 | ||||||||||||||||||||||||||||||
Year ended 31 December | 3,771 | 20.0 | 3,975 | 21.3 | 4,765 | 21.1 | ||||||||||||||||||||||||||||||||||
The Group’s profits are taxed at different rates depending on the country in which the profits arise. The key applicable tax rates include Hong Kong (16.5%), USA (35%) and UK (20.25%). If the Group’s profits were taxed at the statutory rates of the countries in which the profits arise then the tax rate for the year would have been 20.65%. The effective tax rate for the year was 20.0% (2014: 21.3%) and is in line with expectations. We expect the effective tax rate to increase due to the introduction of the 8% surcharge on UK banking profits in 2016.
Accounting for taxes involves some estimation because the tax law is uncertain and the application requires a degree of judgement, which authorities may dispute. Liabilities are recognised based on best estimates of the probable outcome, taking into account external advice where appropriate. We do not expect significant liabilities to arise in excess of the amounts provided. HSBC only recognises current and deferred tax assets where recovery is probable.
HSBC HOLDINGS PLC
370 |
Table of Contents
Movement of deferred tax assets and liabilities
|
| Loan impairment provisions $m |
|
| Unused tax losses and tax credits $m |
|
| Derivatives, FVOD and other investments $m | 1
|
| Insurance business $m |
|
| Expense provisions $m |
|
| Other $m |
|
| Total $m |
| ||||||||||||||||||||||||
Assets | 2,264 | 1,332 | 1,764 | – | 1,244 | 836 | 7,440 | |||||||||||||||||||||||||||||||||||||
Liabilities | – | – | (233 | ) | (861 | ) | – | (759 | ) | (1,853 | ) | |||||||||||||||||||||||||||||||||
At 1 January 2015 | 2,264 | 1,332 | 1,531 | (861 | ) | 1,244 | 77 | 5,587 | ||||||||||||||||||||||||||||||||||||
Income statement | 45 | 379 | (557 | ) | (143 | ) | 418 | (116 | ) | 26 | ||||||||||||||||||||||||||||||||||
Other comprehensive income | 22 | 156 | 321 | 499 | ||||||||||||||||||||||||||||||||||||||||
Equity | 4 | 4 | ||||||||||||||||||||||||||||||||||||||||||
Reclassification to Assets Held for Sale | (673 | ) | (186 | ) | 76 | 87 | (386 | ) | (136 | ) | (1,218 | ) | ||||||||||||||||||||||||||||||||
Foreign exchange and other adjustments | (285 | ) | (137 | ) | 98 | (139 | ) | (161 | ) | 17 | (607 | ) | ||||||||||||||||||||||||||||||||
At 31 December 2015 | 1,351 | 1,388 | 1,170 | (1,056 | ) | 1,271 | 167 | 4,291 | ||||||||||||||||||||||||||||||||||||
Assets | 1,351 | 1,388 | 1,400 | – | 1,271 | 1,050 | 6,460 | 2 | ||||||||||||||||||||||||||||||||||||
Liabilities | – | – | (230 | ) | (1,056 | ) | – | (883 | ) | (2,169 | )2 | |||||||||||||||||||||||||||||||||
Assets | 2,837 | 978 | 1,383 | – | 1,398 | 1,748 | 8,344 | |||||||||||||||||||||||||||||||||||||
Liabilities | – | – | (213 | ) | (840 | ) | – | (745 | ) | (1,798 | ) | |||||||||||||||||||||||||||||||||
At 1 January 2014 | 2,837 | 978 | 1,170 | (840 | ) | 1,398 | 1,003 | 6,546 | ||||||||||||||||||||||||||||||||||||
Income statement | (408 | ) | 396 | 361 | (76 | ) | (86 | ) | (212 | ) | (25 | ) | ||||||||||||||||||||||||||||||||
Other comprehensive income | – | – | (12 | ) | – | – | (680 | ) | (692 | ) | ||||||||||||||||||||||||||||||||||
Equity | – | – | – | – | – | (20 | ) | (20 | ) | |||||||||||||||||||||||||||||||||||
Foreign exchange and other adjustments | (165 | ) | (42 | ) | 12 | 55 | (68 | ) | (14 | ) | (222 | ) | ||||||||||||||||||||||||||||||||
At 31 December 2014 | 2,264 | 1,332 | 1,531 | (861 | ) | 1,244 | 77 | 5,587 | ||||||||||||||||||||||||||||||||||||
Assets | 2,264 | 1,332 | 1,764 | – | 1,244 | 836 | 7,440 | 2 | ||||||||||||||||||||||||||||||||||||
Liabilities | – | – | (233 | ) | (861 | ) | – | (759 | ) | (1,853 | )2 | |||||||||||||||||||||||||||||||||
| 1 | Fair value of own debt. |
| 2 | After netting off balances within countries, the balances as disclosed in the accounts are as follows: deferred tax assets $6,051m (2014: $7,111m); and deferred tax liabilities $1,760m (2014:$1,524m). |
The net deferred tax asset of $4.3bn (2014: $5.6bn) includes $4.5bn (2014: $4.1bn) deferred tax assets relating to the US. In applying judgement in recognising deferred tax assets, management has critically assessed all available information, including future business profit projections and the track record of meeting forecasts. On the basis of this assessment, management expects substantially all the US deferred tax assets to be utilised by 2021. The fall in net deferred tax assets since 31 December 2014 is mainly attributable to the reclassification of $1.2bn Brazilian net deferred tax balances to assets held for sale.
Unrecognised deferred tax
The amount of temporary differences, unused tax losses and tax credits for which no deferred tax asset is recognised in the balance sheet was $15.5bn (2014: $22.6bn). These amounts included unused state losses arising in the Group’s US operations of $11.3bn (2014: $14.1bn). Of the total amounts unrecognised, $3.1bn (2014: $4.2bn) had no expiry date, $0.9bn (2014: $0.9bn) was scheduled to expire within 10 years and the remaining is expected to expire after 10 years.
Deferred tax is not recognised in respect of the Group’s investments in subsidiaries and branches where HSBC is able to control the timing of remittance or other realisation and where remittance or realisation is not probable in the foreseeable future. The aggregate temporary differences relating to unrecognised deferred tax liabilities arising on investments in subsidiaries and branches is $9.1bn – the corresponding unrecognised deferred tax liability is $0.6bn.
Dividends to shareholders of the parent company
| 2015 | 2014 | 2013 | ||||||||||||||||||||||||||||||||||||||||||||||||||||||
Per share $ | Total $m | Settled in scrip | Per share $ | Total $m | Settled in scrip $m | Per share $ | Total $m | Settled in scrip $m | ||||||||||||||||||||||||||||||||||||||||||||||||
Dividends paid on ordinary shares | ||||||||||||||||||||||||||||||||||||||||||||||||||||||||
In respect of previous year: | ||||||||||||||||||||||||||||||||||||||||||||||||||||||||
– fourth interim dividend | 0.20 | 3,845 | 2,011 | 0.19 | 3,582 | 1,827 | 0.18 | 3,339 | 540 | |||||||||||||||||||||||||||||||||||||||||||||||
In respect of current year: | ||||||||||||||||||||||||||||||||||||||||||||||||||||||||
– first interim dividend | 0.10 | 1,951 | 231 | 0.10 | 1,906 | 284 | 0.10 | 1,861 | 167 | |||||||||||||||||||||||||||||||||||||||||||||||
– second interim dividend | 0.10 | 1,956 | 160 | 0.10 | 1,914 | 372 | 0.10 | 1,864 | 952 | |||||||||||||||||||||||||||||||||||||||||||||||
– third interim dividend | 0.10 | 1,958 | 760 | 0.10 | 1,918 | 226 | 0.10 | 1,873 | 864 | |||||||||||||||||||||||||||||||||||||||||||||||
Total | 0.50 | 9,710 | 3,162 | 0.49 | 9,320 | 2,709 | 0.48 | 8,937 | 2,523 | |||||||||||||||||||||||||||||||||||||||||||||||
Total dividends on preference shares classified as equity (paid quarterly) | 62.00 | 90 | 62.00 | 90 | 62.00 | 90 | ||||||||||||||||||||||||||||||||||||||||||||||||||
HSBC HOLDINGS PLC
371 |
Table of Contents
Notes on the Financial Statements(continued)
9 – Dividends / 10 – Earnings per share / 11 – Segmental analysis
Total coupons on capital securities classified as equity
| 2015 | 2014 | 2013 | ||||||||||||||||||||||||||||
| First | Per security | Total | Total | Total | ||||||||||||||||||||||||||
| call date | $m | $m | $m | |||||||||||||||||||||||||||
Perpetual subordinated capital securities1,3 | �� | |||||||||||||||||||||||||||||
– $2,200m | Apr 2013 | $2.032 | 179 | 179 | 179 | |||||||||||||||||||||||||
– $3,800m | Dec 2015 | $2.000 | 304 | 304 | 304 | |||||||||||||||||||||||||
Perpetual subordinated contingent convertible securities2,3 | ||||||||||||||||||||||||||||||
– $2,250m | Sep 2024 | $63.750 | 143 | – | – | |||||||||||||||||||||||||
– $1,500m | Jan 2020 | $56.250 | 70 | – | – | |||||||||||||||||||||||||
–€1,500m | Sep 2022 | €52.500 | 86 | – | – | |||||||||||||||||||||||||
– $2,450m | Mar 2025 | $63.750 | 78 | – | – | |||||||||||||||||||||||||
Total | 860 | 483 | 483 | |||||||||||||||||||||||||||
| 1 | Discretionary coupons are paid quarterly on the perpetual subordinated capital securities, in denominations of $25 per security. |
| 2 | Discretionary coupons are paid semi-annually on the perpetual subordinated contingent convertible securities, in denominations of 1,000 per security. |
| 3 | Further details of these securities can be found in Note 35. |
The Directors declared after the end of the year a fourth interim dividend in respect of the financial year ended 31 December 2015 of $0.21 per ordinary share, a distribution of approximately $4,134m. The fourth interim dividend will be payable on 20 April 2016 to holders of record on 4 March 2016 on the Principal Register in the UK, the Hong Kong or the Bermuda Overseas Branch registers. No liability was recorded in the financial statements in respect of the fourth interim dividend for 2015.
On 15 January 2016, HSBC paid a coupon on the $2,200m subordinated capital securities of $0.508 per security, a distribution of $45m. On 19 January 2016, HSBC paid a coupon on the $1,500m subordinated contingent convertible securities of $28.125 per security, a distribution of $42m. No liability was recorded in the balance sheet at 31 December 2015 in respect of these coupon payments.
In September 2015, HSBC issued a€1,000m subordinated contingent convertible securities as set out in Note 35 which is classified as equity under IFRSs. Coupons are paid semi-annually and to date no payments have fallen due.
‘Basic earnings per ordinary share’ is calculated by dividing the profit attributable to ordinary shareholders of the parent company by the weighted average number of ordinary shares outstanding, excluding own shares held. ‘Diluted earnings per ordinary share’ is calculated by dividing the basic earnings, which require no adjustment for the effects of dilutive potential ordinary shares, by the weighted average number of ordinary shares outstanding, excluding own shares held, plus the weighted average number of ordinary shares that would be issued on conversion of dilutive potential ordinary shares.
Profit attributable to the ordinary shareholders of the parent company
| 2015 | 2014 | 2013 | ||||||||||||||||
| $m | $m | $m | ||||||||||||||||
Profit attributable to shareholders of the parent company | 13,522 | 13,688 | 16,204 | |||||||||||||||
Dividend payable on preference shares classified as equity | (90 | ) | (90 | ) | (90 | ) | ||||||||||||
Coupon payable on capital securities classified as equity | (860 | ) | (483 | ) | (483 | ) | ||||||||||||
Year ended 31 December | 12,572 | 13,115 | 15,631 | |||||||||||||||
Basic and diluted earnings per share
| 2015 | 2014 | 2013 | ||||||||||||||||||||||||||||||||||||||||||||||||||||
| Profit $m | Number of��shares (millions) | Per share $ | Profit $m | Number of shares (millions) | Per share $ | Profit $m | Number of shares (millions) | Per Share $ | ||||||||||||||||||||||||||||||||||||||||||||||
Basic1 | 12,572 | 19,380 | 0.65 | 13,115 | 18,960 | 0.69 | 15,631 | 18,530 | 0.84 | |||||||||||||||||||||||||||||||||||||||||||||
Effect of dilutive potential ordinary shares | – | 137 | – | – | 96 | – | – | 124 | – | |||||||||||||||||||||||||||||||||||||||||||||
Diluted1 | 12,572 | 19,517 | 0.64 | 13,115 | 19,056 | 0.69 | 15,631 | 18,654 | 0.84 | |||||||||||||||||||||||||||||||||||||||||||||
| 1 | Weighted average number of ordinary shares outstanding (basic) or assuming dilution (diluted). |
The weighted average number of dilutive potential ordinary shares excluded 7m employee share options that wereanti-dilutive (2014: 6m; 2013: 60m).
HSBC HOLDINGS PLC
372 |
Table of Contents
Accounting policy
HSBC has a matrix management structure. HSBC’s chief operating decision-maker is the Group Management Board (‘GMB’) which operates as a general management committee under the direct authority of the Board. The GMB regularly reviews operating activity on a number of bases, including by geographical region and by global business. HSBC considers that geographical operating segments represent the most appropriate information for the users of the financial statements to best evaluate the nature and financial effects of the business activities in which HSBC engages, and the economic environments in which it operates. This reflects the importance of geographical factors on business strategy and performance, the allocation of capital resources, and the role of geographical regional management in executing strategy. As a result, HSBC’s operating segments are considered to be geographical regions.
Geographical information is classified by the location of the principal operations of the subsidiary or, for The Hongkong and Shanghai Banking Corporation, HSBC Bank plc, HSBC Bank Middle East and HSBC Bank USA, by the location of the branch responsible for reporting the results or providing funding.
Measurement of segmental assets, liabilities, income and expenses is in accordance with the Group’s accounting policies. Segmental income and expenses include transfers between segments and these transfers are conducted at arm’s length. Shared costs are included in segments on the basis of the actual recharges made. The expense of the UK bank levy is included in the Europe geographical region as HSBC regards the levy as a cost of carrying on business and being headquartered in the UK.
|
Products and services
HSBC provides a comprehensive range of banking and related financial services to its customers in its five geographical regions. HSBC’s operating segments are Europe, Asia, Middle East and North Africa, North America and Latin America. The products and services offered to customers are organised by global business.
| • | Retail Banking and Wealth Management (‘RBWM’) offers a broad range of products and services to meet the personal banking and wealth management needs of individual customers. Typically, customer offerings include personal banking products (current and savings accounts, mortgages and personal loans, credit cards, debit cards and local and international payment services) and wealth management services (insurance and investment products, global asset management services and financial planning services). |
| • | Commercial Banking (‘CMB’) offers a broad range of products and services to serve the needs of our commercial customers, including small and medium-sized enterprises, mid-market enterprises and corporates. These include credit and lending, international trade and receivables finance, treasury management and liquidity solutions (payments and cash management and commercial cards), commercial insurance and investments. CMB also offers its customers access to products and services offered by other global businesses, for example Global Banking and Markets (‘GB&M’), which include foreign exchange products, raising capital on debt and equity markets and advisory services. |
| • | GB&M provides tailored financial solutions to major government, corporate and institutional clients and private investors worldwide. The client-focused business lines deliver a full range of banking capabilities including financing, advisory and transaction services, a markets business that provides services in credit, rates, foreign exchange, equities, money markets and securities services, and principal investment activities. |
| • | Global Private Banking (‘GPB’) provides a range of services to high net worth individuals and families with complex and international needs within the Group’s priority markets. |
HSBC HOLDINGS PLC
373 |
Table of Contents
Notes on the Financial Statements(continued)
11 – Segmental analysis
Profit/(loss) for the year
| Europe | Asia | MENA | North America | Latin America | Intra- HSBC items | Total | ||||||||||||||||||||||||||||||||||||
| $m | $m | $m | $m | $m | $m | $m | ||||||||||||||||||||||||||||||||||||
2015 | ||||||||||||||||||||||||||||||||||||||||||
Net interest income | 10,005 | 12,184 | 1,531 | 4,532 | 4,318 | (39 | ) | 32,531 | ||||||||||||||||||||||||||||||||||
Net fee income | 4,891 | 6,032 | 633 | 2,018 | 1,131 | – | 14,705 | |||||||||||||||||||||||||||||||||||
Net trading income | 4,060 | 3,090 | 325 | 545 | 664 | 39 | 8,723 | |||||||||||||||||||||||||||||||||||
Other income | 2,102 | 3,997 | 76 | 562 | 479 | (3,375 | ) | 3,841 | ||||||||||||||||||||||||||||||||||
Net operating income1 | 21,058 | 25,303 | 2,565 | 7,657 | 6,592 | (3,375 | ) | 59,800 | ||||||||||||||||||||||||||||||||||
Loan impairment (charges)/recoveries and other credit risk provisions | (690 | ) | (693 | ) | (299 | ) | (544 | ) | (1,495 | ) | – | (3,721 | ) | |||||||||||||||||||||||||||||
Net operating income | 20,368 | 24,610 | 2,266 | 7,113 | 5,097 | (3,375 | ) | 56,079 | ||||||||||||||||||||||||||||||||||
Employee compensation and benefits | (7,872 | ) | (6,105 | ) | (718 | ) | (3,113 | ) | (2,092 | ) | – | (19,900 | ) | |||||||||||||||||||||||||||||
General and administrative expenses | (10,849 | ) | (4,164 | ) | (478 | ) | (3,168 | ) | (2,378 | ) | 3,375 | (17,662 | ) | |||||||||||||||||||||||||||||
Depreciation and impairment of property, plant and equipment | (552 | ) | (410 | ) | (26 | ) | (165 | ) | (116 | ) | – | (1,269 | ) | |||||||||||||||||||||||||||||
Amortisation and impairment of intangible assets | (460 | ) | (210 | ) | (12 | ) | (55 | ) | (200 | ) | – | (937 | ) | |||||||||||||||||||||||||||||
Total operating expenses | (19,733 | ) | (10,889 | ) | (1,234 | ) | (6,501 | ) | (4,786 | ) | 3,375 | (39,768 | ) | |||||||||||||||||||||||||||||
Operating profit | 635 | 13,721 | 1,032 | 612 | 311 | – | 16,311 | |||||||||||||||||||||||||||||||||||
Share of profit in associates and joint ventures | 8 | 2,042 | 505 | 2 | (1 | ) | – | 2,556 | ||||||||||||||||||||||||||||||||||
Profit before tax | 643 | 15,763 | 1,537 | 614 | 310 | – | 18,867 | |||||||||||||||||||||||||||||||||||
Tax expense | (1,095 | ) | (2,346 | ) | (336 | ) | 80 | (74 | ) | – | (3,771 | ) | ||||||||||||||||||||||||||||||
Profit/(loss) for the year | (452 | ) | 13,417 | 1,201 | 694 | 236 | – | 15,096 | ||||||||||||||||||||||||||||||||||
2014 | ||||||||||||||||||||||||||||||||||||||||||
Net interest income | 10,611 | 12,273 | 1,519 | 5,015 | 5,310 | (23 | ) | 34,705 | ||||||||||||||||||||||||||||||||||
Net fee income | 6,042 | 5,910 | 650 | 1,940 | 1,415 | – | 15,957 | |||||||||||||||||||||||||||||||||||
Net trading income | 2,534 | 2,622 | 314 | 411 | 856 | 23 | 6,760 | |||||||||||||||||||||||||||||||||||
Other income | 2,384 | 2,872 | 65 | 786 | 691 | (2,972 | ) | 3,826 | ||||||||||||||||||||||||||||||||||
Net operating income1 | 21,571 | 23,677 | 2,548 | 8,152 | 8,272 | (2,972 | ) | 61,248 | ||||||||||||||||||||||||||||||||||
Loan impairment (charges)/recoveries and other credit risk provisions | (764 | ) | (647 | ) | 6 | (322 | ) | (2,124 | ) | – | (3,851 | ) | ||||||||||||||||||||||||||||||
Net operating income | 20,807 | 23,030 | 2,554 | 7,830 | 6,148 | (2,972 | ) | 57,397 | ||||||||||||||||||||||||||||||||||
Employee compensation and benefits | (8,191 | ) | (5,862 | ) | (676 | ) | (3,072 | ) | (2,565 | ) | – | (20,366 | ) | |||||||||||||||||||||||||||||
General and administrative expenses | (11,076 | ) | (3,959 | ) | (500 | ) | (3,108 | ) | (2,894 | ) | 2,972 | (18,565 | ) | |||||||||||||||||||||||||||||
Depreciation and impairment of property, plant and equipment | (543 | ) | (389 | ) | (28 | ) | (180 | ) | (242 | ) | – | (1,382 | ) | |||||||||||||||||||||||||||||
Amortisation and impairment of intangible assets | (407 | ) | (217 | ) | (12 | ) | (69 | ) | (231 | ) | – | (936 | ) | |||||||||||||||||||||||||||||
Total operating expenses | (20,217 | ) | (10,427 | ) | (1,216 | ) | (6,429 | ) | (5,932 | ) | 2,972 | (41,249 | ) | |||||||||||||||||||||||||||||
Operating profit | 590 | 12,603 | 1,338 | 1,401 | 216 | – | 16,148 | |||||||||||||||||||||||||||||||||||
Share of profit in associates and joint ventures | 6 | 2,022 | 488 | 16 | – | – | 2,532 | |||||||||||||||||||||||||||||||||||
Profit before tax | 596 | 14,625 | 1,826 | 1,417 | 216 | – | 18,680 | |||||||||||||||||||||||||||||||||||
Tax expense | (853 | ) | (2,542 | ) | (339 | ) | (195 | ) | (46 | ) | – | (3,975 | ) | |||||||||||||||||||||||||||||
Profit/(loss) for the year | (257 | ) | 12,083 | 1,487 | 1,222 | 170 | – | 14,705 | ||||||||||||||||||||||||||||||||||
HSBC HOLDINGS PLC
374 |
Table of Contents
Profit/(loss) for the year (continued)
| Europe | Asia | MENA | North America | Latin America | Intra- HSBC items | Total | ||||||||||||||||||||||||||||||||||||
| $m | $m | $m | $m | $m | $m | $m | ||||||||||||||||||||||||||||||||||||
2013 | ||||||||||||||||||||||||||||||||||||||||||
Net interest income | 10,693 | 11,432 | 1,486 | 5,742 | 6,186 | – | 35,539 | |||||||||||||||||||||||||||||||||||
Net fee income | 6,032 | 5,936 | 622 | 2,143 | 1,701 | – | 16,434 | |||||||||||||||||||||||||||||||||||
Net trading income | 4,423 | 2,026 | 357 | 948 | 936 | – | 8,690 | |||||||||||||||||||||||||||||||||||
Other income/(expense) | (181 | ) | 5,038 | 38 | (30 | ) | 1,745 | (2,628 | ) | 3,982 | ||||||||||||||||||||||||||||||||
Net operating income1 | 20,967 | 24,432 | 2,503 | 8,803 | 10,568 | (2,628 | ) | 64,645 | ||||||||||||||||||||||||||||||||||
Loan impairment (charges)/recoveries and other credit risk provisions | (1,530 | ) | (498 | ) | 42 | (1,197 | ) | (2,666 | ) | – | (5,849 | ) | ||||||||||||||||||||||||||||||
Net operating income | 19,437 | 23,934 | 2,545 | 7,606 | 7,902 | (2,628 | ) | 58,796 | ||||||||||||||||||||||||||||||||||
Employee compensation and benefits | (7,175 | ) | (5,666 | ) | (634 | ) | (3,098 | ) | (2,623 | ) | – | (19,196 | ) | |||||||||||||||||||||||||||||
General and administrative expenses | (9,479 | ) | (3,660 | ) | (607 | ) | (3,051 | ) | (2,896 | ) | 2,628 | (17,065 | ) | |||||||||||||||||||||||||||||
Depreciation and impairment of property, plant and equipment | (559 | ) | (392 | ) | (35 | ) | (176 | ) | (202 | ) | – | (1,364 | ) | |||||||||||||||||||||||||||||
Amortisation and impairment of intangible assets | (400 | ) | (218 | ) | (13 | ) | (91 | ) | (209 | ) | – | (931 | ) | |||||||||||||||||||||||||||||
Total operating expenses | (17,613 | ) | (9,936 | ) | (1,289 | ) | (6,416 | ) | (5,930 | ) | 2,628 | (38,556 | ) | |||||||||||||||||||||||||||||
Operating profit | 1,824 | 13,998 | 1,256 | 1,190 | 1,972 | – | 20,240 | |||||||||||||||||||||||||||||||||||
Share of profit in associates and joint ventures | 1 | 1,855 | 438 | 31 | – | – | 2,325 | |||||||||||||||||||||||||||||||||||
Profit before tax | 1,825 | 15,853 | 1,694 | 1,221 | 1,972 | – | 22,565 | |||||||||||||||||||||||||||||||||||
Tax expense | (1,279 | ) | (2,170 | ) | (328 | ) | (313 | ) | (675 | ) | – | (4,765 | ) | |||||||||||||||||||||||||||||
Profit for the year | 546 | 13,683 | 1,366 | 908 | 1,297 | – | 17,800 | |||||||||||||||||||||||||||||||||||
1 Net operating income before loan impairment charges and other credit risk provisions, also referred to as revenue.
Other information about the profit/(loss) for the year
|
| |||||||||||||||||||||||||||||||||||||||||
| Europe | Asia | MENA | North America | Latin America | Intra- HSBC items | Total | ||||||||||||||||||||||||||||||||||||
| $m | $m | $m | $m | $m | $m | $m | ||||||||||||||||||||||||||||||||||||
2015 | ||||||||||||||||||||||||||||||||||||||||||
Net operating income1 | 21,058 | 25,303 | 2,565 | 7,657 | 6,592 | (3,375 | ) | 59,800 | ||||||||||||||||||||||||||||||||||
– external | 19,778 | 23,477 | 2,559 | 7,386 | 6,600 | – | 59,800 | |||||||||||||||||||||||||||||||||||
– inter-segment | 1,280 | 1,826 | 6 | 271 | (8 | ) | (3,375 | ) | – | |||||||||||||||||||||||||||||||||
Profit for the year includes the following significant non-cash items: | ||||||||||||||||||||||||||||||||||||||||||
Depreciation, amortisation and impairment | 1,013 | 620 | 38 | 195 | 315 | – | 2,181 | |||||||||||||||||||||||||||||||||||
Loan impairment losses gross of recoveries and other credit risk provisions | 1,082 | 858 | 331 | 618 | 1,641 | – | 4,530 | |||||||||||||||||||||||||||||||||||
Changes in fair value of long-term debt and related derivatives | 671 | 5 | 6 | 181 | – | – | 863 | |||||||||||||||||||||||||||||||||||
2014 | ||||||||||||||||||||||||||||||||||||||||||
Net operating income1 | 21,571 | 23,677 | 2,548 | 8,152 | 8,272 | (2,972 | ) | 61,248 | ||||||||||||||||||||||||||||||||||
– external | 20,450 | 22,071 | 2,524 | 7,937 | 8,266 | – | 61,248 | |||||||||||||||||||||||||||||||||||
– inter-segment | 1,121 | 1,606 | 24 | 215 | 6 | (2,972 | ) | – | ||||||||||||||||||||||||||||||||||
Profit for the year includes the following significant non-cash items: | ||||||||||||||||||||||||||||||||||||||||||
Depreciation, amortisation and impairment | 950 | 606 | 40 | 182 | 473 | – | 2,251 | |||||||||||||||||||||||||||||||||||
Loan impairment losses gross of recoveries and other credit risk provisions | 1,066 | 800 | 37 | 437 | 2,466 | – | 4,806 | |||||||||||||||||||||||||||||||||||
Changes in fair value of long-term debt and related derivatives | 614 | (4 | ) | (3 | ) | (99 | ) | – | – | 508 | ||||||||||||||||||||||||||||||||
2013 | ||||||||||||||||||||||||||||||||||||||||||
Net operating income1 | 20,967 | 24,432 | 2,503 | 8,803 | 10,568 | (2,628 | ) | 64,645 | ||||||||||||||||||||||||||||||||||
– external | 20,108 | 22,853 | 2,497 | 8,569 | 10,618 | – | 64,645 | |||||||||||||||||||||||||||||||||||
– inter-segment | 859 | 1,579 | 6 | 234 | (50 | ) | (2,628 | ) | – | |||||||||||||||||||||||||||||||||
Profit for the year includes the following significant non-cash items: | ||||||||||||||||||||||||||||||||||||||||||
Depreciation, amortisation and impairment | 957 | 610 | 48 | 303 | 412 | – | 2,330 | |||||||||||||||||||||||||||||||||||
Loan impairment losses gross of recoveries and other credit risk provisions | 2,165 | 665 | 45 | 1,321 | 2,949 | – | 7,145 | |||||||||||||||||||||||||||||||||||
Changes in fair value of long-term debt and related derivatives | (936 | ) | (1 | ) | (3 | ) | (288 | ) | – | – | (1,228 | ) | ||||||||||||||||||||||||||||||
| 1 | Net operating income before loan impairment charges and other credit risk provisions, also referred to as revenue. |
HSBC HOLDINGS PLC
375 |
Table of Contents
Notes on the Financial Statements(continued)
11 – Segmental analysis / 12 – Trading assets
Balance sheet information
| Europe | Asia | MENA | North America | Latin America | Intra- HSBC items | Total | ||||||||||||||||||||||||||||||||||||
| $m | $m | $m | $m | $m | $m | $m | ||||||||||||||||||||||||||||||||||||
At 31 December 2015 | ||||||||||||||||||||||||||||||||||||||||||
Loans and advances to customers | 392,041 | 356,375 | 29,894 | 128,851 | 17,293 | – | 924,454 | |||||||||||||||||||||||||||||||||||
Interests in associates and joint ventures | 198 | 15,720 | 3,176 | 45 | – | – | 19,139 | |||||||||||||||||||||||||||||||||||
Total assets | 1,129,365 | 889,747 | 59,236 | 393,960 | 86,262 | (148,914 | ) | 2,409,656 | ||||||||||||||||||||||||||||||||||
Customer accounts | 497,876 | 598,620 | 36,468 | 135,152 | 21,470 | – | 1,289,586 | |||||||||||||||||||||||||||||||||||
Total liabilities | 1,067,127 | 813,466 | 49,126 | 355,506 | 75,827 | (148,914 | ) | 2,212,138 | ||||||||||||||||||||||||||||||||||
Capital expenditure incurred1 | 1,182 | 725 | 34 | 198 | 187 | – | 2,326 | |||||||||||||||||||||||||||||||||||
At 31 December 2014 | ||||||||||||||||||||||||||||||||||||||||||
Loans and advances to customers | 409,733 | 362,955 | 29,063 | 129,787 | 43,122 | – | 974,660 | |||||||||||||||||||||||||||||||||||
Interests in associates and joint ventures | 175 | 14,958 | 2,955 | 83 | 10 | – | 18,181 | |||||||||||||||||||||||||||||||||||
Total assets | 1,290,926 | 878,723 | 62,417 | 436,859 | 115,354 | (150,140 | ) | 2,634,139 | ||||||||||||||||||||||||||||||||||
Customer accounts | 545,959 | 577,491 | 39,720 | 138,884 | 48,588 | – | 1,350,642 | |||||||||||||||||||||||||||||||||||
Total liabilities | 1,223,371 | 807,998 | 52,569 | 398,356 | 102,007 | (150,140 | ) | 2,434,161 | ||||||||||||||||||||||||||||||||||
Capital expenditure incurred1 | 1,168 | 637 | 25 | 208 | 348 | – | 2,386 | |||||||||||||||||||||||||||||||||||
At 31 December 2013 | ||||||||||||||||||||||||||||||||||||||||||
Loans and advances to customers | 456,110 | 336,897 | 27,211 | 127,953 | 43,918 | – | 992,089 | |||||||||||||||||||||||||||||||||||
Interests in associates and joint ventures | 169 | 13,822 | 2,575 | 74 | – | – | 16,640 | |||||||||||||||||||||||||||||||||||
Total assets | 1,392,959 | 831,791 | 60,810 | 432,035 | 113,999 | (160,276 | ) | 2,671,318 | ||||||||||||||||||||||||||||||||||
Customer accounts | 581,933 | 548,483 | 38,683 | 140,809 | 51,389 | – | 1,361,297 | |||||||||||||||||||||||||||||||||||
Total liabilities | 1,326,537 | 770,938 | 50,706 | 393,635 | 99,319 | (160,276 | ) | 2,480,859 | ||||||||||||||||||||||||||||||||||
Capital expenditure incurred1 | 907 | 1,236 | 32 | 265 | 385 | – | 2,825 | |||||||||||||||||||||||||||||||||||
1 Expenditure incurred on property, plant and equipment and other intangible assets. Excludes assets acquired as part of business combinations and goodwill.
Other financial information
Net operating income by global business
|
| |||||||||||||||||||||||||||||||||||||||||
| RBWM3 | CMB3 | GB&M | GPB | Other1 | Intra-HSBC items | Total | ||||||||||||||||||||||||||||||||||||
| $m | $m | $m | $m | $m | $m | $m | ||||||||||||||||||||||||||||||||||||
2015 | ||||||||||||||||||||||||||||||||||||||||||
Net operating income2 | 23,516 | 14,870 | 18,233 | 2,172 | 7,604 | (6,595 | ) | 59,800 | ||||||||||||||||||||||||||||||||||
– external | 20,941 | 15,021 | 20,994 | 1,888 | 956 | – | 59,800 | |||||||||||||||||||||||||||||||||||
– internal | 2,575 | (151 | ) | (2,761 | ) | 284 | 6,648 | (6,595 | ) | – | ||||||||||||||||||||||||||||||||
2014 | ||||||||||||||||||||||||||||||||||||||||||
Net operating income2 | 25,149 | 15,748 | 17,778 | 2,377 | 6,365 | (6,169 | ) | 61,248 | ||||||||||||||||||||||||||||||||||
– external | 23,202 | 16,369 | 20,055 | 1,980 | (358 | ) | – | 61,248 | ||||||||||||||||||||||||||||||||||
– internal | 1,947 | (621 | ) | (2,277 | ) | 397 | 6,723 | (6,169 | ) | – | ||||||||||||||||||||||||||||||||
2013 | ||||||||||||||||||||||||||||||||||||||||||
Net operating income2 | 27,453 | 15,652 | 19,176 | 2,439 | 5,651 | (5,726 | ) | 64,645 | ||||||||||||||||||||||||||||||||||
– external | 25,702 | 16,577 | 20,767 | 1,955 | (356 | ) | – | 64,645 | ||||||||||||||||||||||||||||||||||
– internal | 1,751 | (925 | ) | (1,591 | ) | 484 | 6,007 | (5,726 | ) | – | ||||||||||||||||||||||||||||||||
Information by country
| 2015 | 2014 | 2013 | ||||||||||||||||||||||||||||||||||
External net income2,4 | Non- current assets5 | External net operating income2,4 | Non- assets5 | External net operating income2,4 | Non- assets5 | |||||||||||||||||||||||||||||||
| $m | $m | $m | $m | $m | $m | |||||||||||||||||||||||||||||||
UK | 14,132 | 7,581 | 14,392 | 8,671 | 13,347 | 17,481 | ||||||||||||||||||||||||||||||
Hong Kong | 14,447 | 10,979 | 12,656 | 12,376 | 12,031 | 12,170 | ||||||||||||||||||||||||||||||
USA | 5,541 | 4,066 | 5,736 | 5,685 | 6,121 | 4,189 | ||||||||||||||||||||||||||||||
France | 2,706 | 9,326 | 2,538 | 10,301 | 3,111 | 11,565 | ||||||||||||||||||||||||||||||
Brazil | 3,546 | 28 | 4,817 | 1,403 | 5,364 | 1,715 | ||||||||||||||||||||||||||||||
Other countries | 19,428 | 27,503 | 21,109 | 28,273 | 24,671 | 27,879 | ||||||||||||||||||||||||||||||
Year ended/at 31 December | 59,800 | 59,483 | 61,248 | 66,709 | 64,645 | 74,999 | ||||||||||||||||||||||||||||||
| 1 | The main items reported in ‘Other’ are certain property activities, unallocated investment activities, centrally held investment companies, movements in fair value of own debt and HSBC’s holding company and financing operations. ‘Other’ also includes gains and losses on the disposal of certain significant subsidiaries or business units. |
| 2 | Net operating income before loan impairment charges and other credit risk provisions, also referred to as revenue. |
| 3 | In the first half of 2015, a portfolio of customers was transferred from CMB to RBWM in Latin America in order to better align the combined banking needs of the customers with our established global businesses. Comparative data have been re-presented accordingly. |
| 4 | External net operating income is attributed to countries on the basis of the location of the branch responsible for reporting the results or advancing the funds. |
| 5 | Non-current assets consist of property, plant and equipment, goodwill, other intangible assets, interests in associates and joint ventures and certain other assets expected to be recovered more than 12 months after the reporting period. |
HSBC HOLDINGS PLC
376 |
Table of Contents
Accounting policy
Financial assets are classified as held for trading if they have been acquired principally for the purpose of selling in the near term, or form part of a portfolio of identified financial instruments that are managed together and for which there is evidence of a recent pattern of short-term profit-taking. They are recognised on trade date, when HSBC enters into contractual arrangements with counterparties, and are normally derecognised when sold. They are initially measured at fair value, with transaction costs taken to the income statement. Subsequent changes in their fair values and interest are recognised in the income statement in ‘Net trading income’.
|
Trading assets
| 2015 | 2014 | |||||||||||
| $m | $m | |||||||||||
Trading assets: | ||||||||||||
– not subject to repledge or resale by counterparties | 192,204 | 247,586 | ||||||||||
– which may be repledged or resold by counterparties | 32,633 | 56,607 | ||||||||||
At 31 December | 224,837 | 304,193 | ||||||||||
Treasury and other eligible bills | 7,829 | 16,170 | ||||||||||
Debt securities | 99,038 | 141,532 | ||||||||||
Equity securities | 66,491 | 75,249 | ||||||||||
Trading securities at fair value | 173,358 | 232,951 | ||||||||||
Loans and advances to banks1 | 22,303 | 27,581 | ||||||||||
Loans and advances to customers1 | 29,176 | 43,661 | ||||||||||
At 31 December | 224,837 | 304,193 | ||||||||||
| 1 | Loans and advances to banks and customers include settlement accounts, stock borrowing, reverse repos and other amounts. |
Trading securities valued at fair value1
| 2015 | 2014 | |||||||||||
| $m | $m | |||||||||||
US Treasury and US Government agencies2 | 14,833 | 25,880 | ||||||||||
UK Government | 10,177 | 9,280 | ||||||||||
Hong Kong Government | 6,495 | 6,946 | ||||||||||
Other government | 48,567 | 78,774 | ||||||||||
Asset-backed securities3 | 3,135 | 3,494 | ||||||||||
Corporate debt and other securities | 23,660 | 33,328 | ||||||||||
Equity securities | 66,491 | 75,249 | ||||||||||
At 31 December | 173,358 | 232,951 | ||||||||||
| 1 | Included within these figures are debt securities issued by banks and other financial institutions of $16,403m (2014: $22,399m), of which $1,034m (2014: $2,949m) are guaranteed by various governments. |
| 2 | Includes securities that are supported by an explicit guarantee issued by the US Government. |
| 3 | Excludes asset-backed securities included under US Treasury and US Government agencies. |
Trading securities listed on a recognised exchange and unlisted
Treasury and other eligible bills | Debt securities | Equity securities | Total | |||||||||||||||||||||
| $m | $m | $m | $m | |||||||||||||||||||||
Fair value | ||||||||||||||||||||||||
Listed1 | 295 | 71,184 | 66,152 | 137,631 | ||||||||||||||||||||
Unlisted2 | 7,534 | 27,854 | 339 | 35,727 | ||||||||||||||||||||
At 31 December 2015 | 7,829 | 99,038 | 66,491 | 173,358 | ||||||||||||||||||||
Fair value | ||||||||||||||||||||||||
Listed1 | 1,311 | 98,028 | 74,542 | 173,881 | ||||||||||||||||||||
Unlisted2 | 14,859 | 43,504 | 707 | 59,070 | ||||||||||||||||||||
At 31 December 2014 | 16,170 | 141,532 | 75,249 | 232,951 | ||||||||||||||||||||
| 1 | Included within listed investments are $5,722m (2014: $5,956m) of securities listed in Hong Kong. |
| 2 | Unlisted treasury and other eligible bills primarily comprise treasury bills not listed on an exchange but for which there is a liquid market. |
HSBC HOLDINGS PLC
377 |
Table of Contents
Notes on the Financial Statements(continued)
13 – Fair values of financial instruments carried at fair value
13 Fair values of financial instruments carried at fair value
Accounting policy
All financial instruments are recognised initially at fair value. Fair value is the price that would be received to sell an asset or paid to transfer a liability in an orderly transaction between market participants at the measurement date. The fair value of a financial instrument on initial recognition is generally its transaction price (that is, the fair value of the consideration given or received). However, sometimes the fair value will be based on other observable current market transactions in the same instrument, without modification or repackaging, or on a valuation technique whose variables include only data from observable markets, such as interest rate yield curves, option volatilities and currency rates. When such evidence exists, HSBC recognises a trading gain or loss at inception (‘day 1 gain or loss’), being the difference between the transaction price and the fair value. When significant unobservable parameters are used, the entire day 1 gain or loss is deferred and is recognised in the income statement over the life of the transaction until the transaction matures or is closed out, the valuation inputs become observable or HSBC enters into an offsetting transaction.
The fair value of financial instruments is generally measured on an individual basis. However, in cases where HSBC manages a group of financial assets and liabilities according to its net market or credit risk exposure, the fair value of the group of financial instruments is measured on a net basis but the underlying financial assets and liabilities are presented separately in the financial statements, unless they satisfy the IFRSs offsetting criteria as described in Note 32.
|
Critical accounting estimates and judgements
Valuation of financial instruments
The best evidence of fair value is a quoted price in an actively traded principal market. The fair values of financial instruments that are quoted in active markets are based on bid prices for assets held and offer prices for liabilities issued. When a financial instrument has a quoted price in an active market, the fair value of the total holding of the financial instrument is calculated as the product of the number of units and the quoted price. The judgement as to whether a market is active may include, but is not restricted to, consideration of factors such as the magnitude and frequency of trading activity, the availability of prices and the size of bid/offer spreads. The bid/offer spread represents the difference in prices at which a market participant would be willing to buy compared with the price at which they would be willing to sell. Valuation techniques may incorporate assumptions about factors that other market participants would use in their valuations, including:
• the likelihood and expected timing of future cash flows on the instrument. Judgement may be required to assess the counterparty’s ability to service the instrument in accordance with its contractual terms. Future cash flows may be sensitive to changes in market rates;
• selecting an appropriate discount rate for the instrument. Judgement is required to assess what a market participant would regard as the appropriate spread of the rate for an instrument over the appropriate risk-free rate; and
• judgement to determine what model to use to calculate fair value in areas where the choice of valuation model is particularly subjective, for example, when valuing complex derivative products.
A range of valuation techniques is employed, dependent on the instrument type and available market data. Most valuation techniques are based upon discounted cash flow analyses, in which expected future cash flows are calculated and discounted to present value using a discounting curve. Prior to considering credit risk, the expected future cash flows may be known, as would be the case for the fixed leg of an interest rate swap, or may be uncertain and require projection, as would be the case for the floating leg of an interest rate swap. ‘Projection’ utilises market forward curves, if available. In option models, the probability of different potential future outcomes must be considered. In addition, the value of some products is dependent on more than one market factor, and in these cases it will typically be necessary to consider how movements in one market factor may affect the other market factors. The model inputs necessary to perform such calculations include interest rate yield curves, exchange rates, volatilities, correlations and prepayment and default rates. For interest rate derivatives with collateralised counterparties and in significant currencies, HSBC uses a discounting curve that reflects the overnight interest rate.
The majority of valuation techniques employ only observable market data. However, certain financial instruments are valued on the basis of valuation techniques that feature one or more significant market inputs that are unobservable, and for them the measurement of fair value is more judgemental. An instrument in its entirety is classified as valued using significant unobservable inputs if, in the opinion of management, a significant proportion of the instrument’s inception profit or greater than 5% of the instrument’s valuation is driven by unobservable inputs. ‘Unobservable’ in this context means that there is little or no current market data available from which to determine the price at which an arm’s length transaction would be likely to occur. It generally does not mean that there is no data available at all upon which to base a determination of fair value (consensus pricing data may, for example, be used).
|
Control framework
Fair values are subject to a control framework designed to ensure that they are either determined or validated by a function independent of the risk taker.
For all financial instruments where fair values are determined by reference to externally quoted prices or observable pricing inputs to models, independent price determination or validation is utilised. In inactive markets HSBC will source alternative market information to validate the financial instrument’s fair value, with greater weight given to information that is considered to be more relevant and reliable. The factors that are considered in this regard are,inter alia:
| • | the extent to which prices may be expected to represent genuine traded or tradeable prices; |
| • | the degree of similarity between financial instruments; |
| • | the degree of consistency between different sources; |
| • | the process followed by the pricing provider to derive the data; |
| • | the elapsed time between the date to which the market data relates and the balance sheet date; and |
| • | the manner in which the data was sourced. |
HSBC HOLDINGS PLC
378 |
Table of Contents
For fair values determined using valuation models, the control framework may include, as applicable, development or validation by independent support functions of (i) the logic within valuation models; (ii) the inputs to these models; (iii) any adjustments required outside the valuation models; and (iv) where possible, model outputs. Valuation models are subject to a process of due diligence and calibration before becoming operational and are calibrated against external market data on an ongoing basis.
Changes in fair value are generally subject to a profit and loss analysis process. This process disaggregates changes in fair value into three high level categories; (i) portfolio changes, such as new transactions or maturing transactions, (ii) market movements, such as changes in foreign exchange rates or equity prices, and (iii) other, such as changes in fair value adjustments (see further below).
The majority of financial instruments measured at fair value are in GB&M. GB&M’s fair value governance structure is illustrated below as an example:
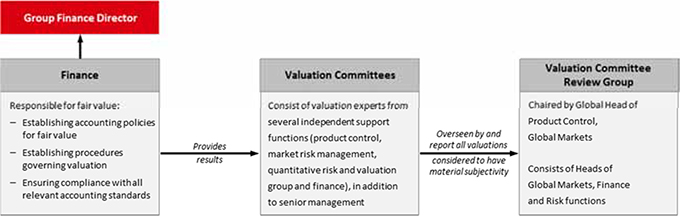
Financial liabilities measured at fair value
In certain circumstances, HSBC records its own debt in issue at fair value, based on quoted prices in an active market for the specific instrument concerned, where available. An example of this is where own debt in issue is hedged with interest rate derivatives. When quoted market prices are unavailable, the own debt in issue is valued using valuation techniques, the inputs for which are either based upon quoted prices in an inactive market for the instrument or are estimated by comparison with quoted prices in an active market for similar instruments. In both cases, the fair value includes the effect of applying the credit spread which is appropriate to HSBC’s liabilities. The change in fair value of issued debt securities attributable to the Group’s own credit spread is computed as follows: for each security at each reporting date, an externally verifiable price is obtained or a price is derived using credit spreads for similar securities for the same issuer. Then, using discounted cash flow, each security is valued using a Libor-based discount curve. The difference in the valuations is attributable to the Group’s own credit spread. This methodology is applied consistently across all securities.
Structured notes issued and certain other hybrid instrument liabilities are included within trading liabilities and are measured at fair value. The credit spread applied to these instruments is derived from the spreads at which HSBC issues structured notes.
Gains and losses arising from changes in the credit spread of liabilities issued by HSBC reverse over the contractual life of the debt, provided that the debt is not repaid at a premium or a discount.
Fair value hierarchy
Fair values of financial assets and liabilities are determined according to the following hierarchy:
| • | Level 1 – valuation technique using quoted market price: financial instruments with quoted prices for identical instruments in active markets that HSBC can access at the measurement date. |
| • | Level 2 – valuation technique using observable inputs: financial instruments with quoted prices for similar instruments in active markets or quoted prices for identical or similar instruments in inactive markets and financial instruments valued using models where all significant inputs are observable. |
| • | Level 3 – valuation technique with significant unobservable inputs: financial instruments valued using valuation techniques where one or more significant inputs are unobservable. |
HSBC HOLDINGS PLC
379 |
Table of Contents
Notes on the Financial Statements(continued)
13 – Fair values of financial instruments carried at fair value
The following table sets out the financial instruments by fair value hierarchy.
Financial instruments carried at fair value and bases of valuation
| Valuation techniques | ||||||||||||||||||||||||
Quoted market price Level 1 | Using observable inputs Level 2 | With significant unobservable inputs Level 3 | Total | |||||||||||||||||||||
| $m | $m | $m | $m | |||||||||||||||||||||
Recurring fair value measurements at 31 December 2015 | ||||||||||||||||||||||||
Assets | ||||||||||||||||||||||||
Trading assets | 133,095 | 84,886 | 6,856 | 224,837 | ||||||||||||||||||||
Financial assets designated at fair value | 18,947 | 4,431 | 474 | 23,852 | ||||||||||||||||||||
Derivatives | 1,922 | 284,292 | 2,262 | 288,476 | ||||||||||||||||||||
Financial investments: available for sale | 262,929 | 117,197 | 4,727 | 384,853 | ||||||||||||||||||||
Liabilities | ||||||||||||||||||||||||
Trading liabilities | 41,462 | 95,867 | 4,285 | 141,614 | ||||||||||||||||||||
Financial liabilities designated at fair value | 5,260 | 61,145 | 3 | 66,408 | ||||||||||||||||||||
Derivatives | 2,243 | 277,618 | 1,210 | 281,071 | ||||||||||||||||||||
Recurring fair value measurements at 31 December 2014 | ||||||||||||||||||||||||
Assets | ||||||||||||||||||||||||
Trading assets | 180,446 | 117,279 | 6,468 | 304,193 | ||||||||||||||||||||
Financial assets designated at fair value | 23,697 | 4,614 | 726 | 29,037 | ||||||||||||||||||||
Derivatives | 4,366 | 337,718 | 2,924 | 345,008 | ||||||||||||||||||||
Financial investments: available for sale | 241,464 | 131,264 | 4,988 | 377,716 | ||||||||||||||||||||
Liabilities | ||||||||||||||||||||||||
Trading liabilities | 62,385 | 122,048 | 6,139 | 190,572 | ||||||||||||||||||||
Financial liabilities designated at fair value | 3,792 | 72,361 | – | 76,153 | ||||||||||||||||||||
Derivatives | 4,649 | 334,113 | 1,907 | 340,669 | ||||||||||||||||||||
The decrease in Level 1 and Level 2 trading assets and liabilities during the period reflects a decrease in inventory across a wide range of securities. The decrease in Level 2 derivative assets and liabilities is driven by participation in ‘portfolio compression’ exercises and market movement.
Transfers between Level 1 and Level 2 fair values
| Assets | Liabilities | |||||||||||||||||||||||||||||||||||||||||
Available for sale | Held for trading | Designated at fair value through profit or loss | Derivatives | Held for trading | Designated at fair value through profit or loss | Derivatives | ||||||||||||||||||||||||||||||||||||
| $m | $m | $m | $m | $m | $m | $m | ||||||||||||||||||||||||||||||||||||
At 31 December 2015 | ||||||||||||||||||||||||||||||||||||||||||
Transfers from Level 1 to Level 2 | – | 67 | – | 56 | 1,563 | 857 | 100 | |||||||||||||||||||||||||||||||||||
Transfers from Level 2 to Level 1 | – | 487 | – | 2 | 515 | 2 | – | |||||||||||||||||||||||||||||||||||
At 31 December 2014 | ||||||||||||||||||||||||||||||||||||||||||
Transfers from Level 1 to Level 2 | 2,702 | 18,149 | – | – | 22,964 | – | – | |||||||||||||||||||||||||||||||||||
Transfers from Level 2 to Level 1 | – | – | – | – | – | – | – | |||||||||||||||||||||||||||||||||||
Fair value adjustments
Fair value adjustments are adopted when HSBC considers that there are additional factors that would be considered by a market participant which are not incorporated within the valuation model. HSBC classifies fair value adjustments as either ‘risk-related’ or ‘model-related’. The majority of these adjustments relate to GB&M.
Movements in the level of fair value adjustments do not necessarily result in the recognition of profits or losses within the income statement. For example, as models are enhanced, fair value adjustments may no longer be required. Similarly, fair value adjustments will decrease when the related positions are unwound, but this may not result in profit or loss.
HSBC HOLDINGS PLC
380 |
Table of Contents
Global Banking and Markets fair value adjustments
| 2015 | 2014 | |||||||||||
| $m | $m | |||||||||||
Type of adjustment | ||||||||||||
Risk-related | 1,402 | 1,958 | ||||||||||
– bid-offer | 477 | 539 | ||||||||||
– uncertainty | 95 | 357 | ||||||||||
– credit valuation adjustment | 853 | 871 | ||||||||||
– debit valuation adjustment | (465 | ) | (270 | ) | ||||||||
– funding fair value adjustment | 442 | 460 | ||||||||||
– other | 0 | 1 | ||||||||||
Model-related | 97 | 57 | ||||||||||
– model limitation | 92 | 52 | ||||||||||
– other | 5 | 5 | ||||||||||
Inception profit (Day 1 P&L reserves) (Note 16) | 97 | 114 | ||||||||||
At 31 December | 1,596 | 2,129 | ||||||||||
Fair value adjustments declined by $533m during the year. The most significant movement was a decline of $262m in respect of the uncertainty category, driven by the reclassification to model limitation of an adjustment relating to derivative discounting assumptions. This adjustment reduced significantly following contract renegotiations with certain counterparties. The debit valuation adjustment increased by $195m as a result of the widening of HSBC’s credit spreads.
Risk-related adjustments
Bid-offer
IFRS 13 ‘Fair value measurement’ requires use of the price within the bid-offer spread that is most representative of fair value. Valuation models will typically generate mid-market values. The bid-offer adjustment reflects the extent to which bid-offer costs would be incurred if substantially all residual net portfolio market risks were closed using available hedging instruments or by disposing of or unwinding the position.
Uncertainty
Certain model inputs may be less readily determinable from market data, and/or the choice of model itself may be more subjective. In these circumstances, there exists a range of possible values that the financial instrument or market parameter may assume and an adjustment may be necessary to reflect the likelihood that in estimating the fair value of the financial instrument, market participants would adopt more conservative values for uncertain parameters and/or model assumptions than those used in the valuation model.
Credit valuation adjustment
The CVA is an adjustment to the valuation of over-the-counter (‘OTC’) derivative contracts to reflect within fair value the possibility that the counterparty may default and that HSBC may not receive the full market value of the transactions (see below).
Debit valuation adjustment
The DVA is an adjustment to the valuation of OTC derivative contracts to reflect within fair value the possibility that HSBC may default, and that HSBC may not pay full market value of the transactions (see below).
Funding fair value adjustment
The funding fair value adjustment (‘FFVA’) is calculated by applying future market funding spreads to the expected future funding exposure of any uncollateralised component of the OTC derivative portfolio. This includes the uncollateralised component of collateralised derivatives in addition to derivatives that are fully uncollateralised. The expected future funding exposure is calculated by a simulation methodology, where available. The expected future funding exposure is adjusted for events that may terminate the exposure such as the default of HSBC or the counterparty. The FFVA and DVA are calculated independently.
Model-related adjustments
Model limitation
Models used for portfolio valuation purposes may be based upon a simplifying set of assumptions that do not capture all material market characteristics. Additionally, markets evolve, and models that were adequate in the past may require development to capture all material market characteristics in current market conditions. In these circumstances, model limitation adjustments are adopted. As model development progresses, model limitations are addressed within the valuation models and a model limitation adjustment is no longer needed.
HSBC HOLDINGS PLC
381 |
Table of Contents
Notes on the Financial Statements(continued)
13 – Fair values of financial instruments carried at fair value
Inception profit (Day 1 P&L reserves)
Inception profit adjustments are adopted when the fair value estimated by a valuation model is based on one or more significant unobservable inputs. The accounting for inception profit adjustments is discussed on page 378.
Credit valuation adjustment/debit valuation adjustment methodology
HSBC calculates a separate CVA and DVA for each HSBC legal entity, and within each entity for each counterparty to which the entity has exposure. HSBC calculates the CVA by applying the probability of default (‘PD’) of the counterparty, conditional on the non-default of HSBC, to HSBC’s expected positive exposure to the counterparty and multiplying the result by the loss expected in the event of default. Conversely, HSBC calculates the DVA by applying the PD of HSBC, conditional on the non-default of the counterparty, to the expected positive exposure of the counterparty to HSBC and multiplying the result by the loss expected in the event of default. Both calculations are performed over the life of the potential exposure.
For most products HSBC uses a simulation methodology to calculate the expected positive exposure to a counterparty. This incorporates a range of potential exposures across the portfolio of transactions with the counterparty over the life of the portfolio. The simulation methodology includes credit mitigants such as counterparty netting agreements and collateral agreements with the counterparty.
For certain types of exotic derivatives where the products are not currently supported by the simulation, or for derivative exposures in smaller trading locations where the simulation tool is not yet available, HSBC adopts alternative methodologies.
The methodologies do not, in general, account for ‘wrong-way risk’. Wrong-way risk arises when the underlying value of the derivative prior to any CVA is positively correlated to the probability of default by the counterparty. When there is significant wrong-way risk, a trade-specific approach is applied to reflect the wrong-way risk within the valuation.
With the exception of certain central clearing parties, we include all third-party counterparties in the CVA and DVA calculations and do not net these adjustments across Group entities. We review and refine the CVA and DVA methodologies on an ongoing basis.
Fair value valuation bases
Financial instruments measured at fair value using a valuation technique with significant unobservable inputs – Level 3
| Assets | Liabilities | |||||||||||||||||||||||||||||||||||||||||||||||||||||
Available for sale | Held for trading | At fair value1 | Deriva- tives | Total | Held for trading | At fair value1 | Deriva- tives | Total | ||||||||||||||||||||||||||||||||||||||||||||||
| $m | $m | $m | $m | $m | $m | $m | $m | $m | ||||||||||||||||||||||||||||||||||||||||||||||
Private equity including strategic investments | 3,443 | 55 | 453 | – | 3,951 | 35 | – | – | 35 | |||||||||||||||||||||||||||||||||||||||||||||
Asset-backed securities | 1,053 | 531 | – | – | 1,584 | – | – | – | – | |||||||||||||||||||||||||||||||||||||||||||||
Loans held for securitisation | – | 30 | – | – | 30 | – | – | – | – | |||||||||||||||||||||||||||||||||||||||||||||
Structured notes | – | 4 | – | – | 4 | 4,250 | – | – | 4,250 | |||||||||||||||||||||||||||||||||||||||||||||
Derivatives with monolines | – | – | – | 196 | 196 | – | – | – | – | |||||||||||||||||||||||||||||||||||||||||||||
Other derivatives | – | – | – | 2,066 | 2,066 | – | – | 1,210 | 1,210 | |||||||||||||||||||||||||||||||||||||||||||||
Other portfolios | 231 | 6,236 | 21 | – | 6,488 | – | 3 | – | 3 | |||||||||||||||||||||||||||||||||||||||||||||
At 31 December 2015 | 4,727 | 6,856 | 474 | 2,262 | 14,319 | 4,285 | 3 | 1,210 | 5,498 | |||||||||||||||||||||||||||||||||||||||||||||
Private equity including strategic investments | 3,120 | 164 | 432 | – | 3,716 | 47 | – | – | 47 | |||||||||||||||||||||||||||||||||||||||||||||
Asset-backed securities | 1,462 | 616 | – | – | 2,078 | – | – | – | – | |||||||||||||||||||||||||||||||||||||||||||||
Loans held for securitisation | – | 39 | – | – | 39 | – | – | – | – | |||||||||||||||||||||||||||||||||||||||||||||
Structured notes | – | 2 | – | – | 2 | 6,092 | – | – | 6,092 | |||||||||||||||||||||||||||||||||||||||||||||
Derivatives with monolines | – | – | – | 239 | 239 | – | – | 1 | 1 | |||||||||||||||||||||||||||||||||||||||||||||
Other derivatives | – | – | – | 2,685 | 2,685 | – | – | 1,906 | 1,906 | |||||||||||||||||||||||||||||||||||||||||||||
Other portfolios | 406 | 5,647 | 294 | – | 6,347 | – | – | – | – | |||||||||||||||||||||||||||||||||||||||||||||
At 31 December 2014 | 4,988 | 6,468 | 726 | 2,924 | 15,106 | 6,139 | – | 1,907 | 8,046 | |||||||||||||||||||||||||||||||||||||||||||||
| 1 | Designated at fair value through profit or loss. |
Level 3 instruments are present in both ongoing and legacy businesses. Loans held for securitisation, derivatives with monolines, certain ‘other derivatives’ and predominantly all Level 3 ABSs are legacy positions. HSBC has the capability to hold these positions.
Private equity including strategic investments
HSBC’s private equity and strategic investments are generally classified as available for sale and are not traded in active markets. In the absence of an active market, an investment’s fair value is estimated on the basis of an analysis of the investee’s financial position and results, risk profile, prospects and other factors, as well as by reference to market valuations for similar entities quoted in an active market, or the price at which similar companies have changed ownership.
HSBC HOLDINGS PLC
382 |
Table of Contents
Asset-backed securities
While quoted market prices are generally used to determine the fair value of these securities, valuation models are used to substantiate the reliability of the limited market data available and to identify whether any adjustments to quoted market prices are required. For ABSs including residential mortgage-backed securities, the valuation uses an industry standard model and the assumptions relating to prepayment speeds, default rates and loss severity based on collateral type, and performance, as appropriate. The valuations output is benchmarked for consistency against observable data for securities of a similar nature.
Loans, including leveraged finance and loans held for securitisation
Loans held at fair value are valued from broker quotes and/or market data consensus providers when available. In the absence of an observable market, the fair value is determined using alternative valuation techniques. These techniques include discounted cash flow models, which incorporate assumptions regarding an appropriate credit spread for the loan, derived from other market instruments issued by the same or comparable entities.
Structured notes
The fair value of structured notes valued using a valuation technique with significant unobservable inputs is derived from the fair value of the underlying debt security, and the fair value of the embedded derivative is determined as described in the paragraph below on derivatives.
Level 3 structured notes principally comprise equity-linked notes which are issued by HSBC and provide the counterparty with a return that is linked to the performance of certain equity securities, and other portfolios. The notes are classified as Level 3 due to the unobservability of parameters such as long-dated equity volatilities and correlations between equity prices, between equity prices and interest rates and between interest rates and foreign exchange rates.
Derivatives
OTC (i.e. non-exchange traded) derivatives are valued using valuation models. Valuation models calculate the present value of expected future cash flows, based upon ‘no-arbitrage’ principles. For many vanilla derivative products, such as interest rate swaps and European options, the modelling approaches used are standard across the industry. For more complex derivative products, there may be some differences in market practice. Inputs to valuation models are determined from observable market data wherever possible, including prices available from exchanges, dealers, brokers or providers of consensus pricing. Certain inputs may not be observable in the market directly, but can be determined from observable prices via model calibration procedures or estimated from historical data or other sources. Examples of inputs that may be unobservable include volatility surfaces, in whole or in part, for less commonly traded option products, and correlations between market factors such as foreign exchange rates, interest rates and equity prices.
Derivative products valued using valuation techniques with significant unobservable inputs include certain types of correlation products, such as foreign exchange basket options, equity basket options, foreign exchange interest rate hybrid transactions and long-dated option transactions. Examples of the latter are equity options, interest rate and foreign exchange options and certain credit derivatives. Credit derivatives include certain tranched CDS transactions.
HSBC HOLDINGS PLC
383 |
Table of Contents
Notes on the Financial Statements(continued)
13 – Fair values of financial instruments carried at fair value
Reconciliation of fair value measurements in Level 3 of the fair value hierarchy
The following table provides a reconciliation of the movement between opening and closing balances of Level 3 financial instruments, measured at fair value using a valuation technique with significant unobservable inputs:
Movement in Level 3 financial instruments
| Assets | Liabilities | |||||||||||||||||||||||||||||||||||||||||||
Available for sale $m | Held for $m | Designated at fair value through profit or loss $m | Derivatives $m | Held for $m | Designated $m | Derivatives $m | ||||||||||||||||||||||||||||||||||||||
At 1 January 2015 | 4,988 | 6,468 | 726 | 2,924 | 6,139 | – | 1,907 | |||||||||||||||||||||||||||||||||||||
Total gains/(losses) recognised in profit or loss | (34 | ) | 109 | 30 | 95 | (573 | ) | (1 | ) | (209 | ) | |||||||||||||||||||||||||||||||||
– trading income/(expense) excluding net interest income | – | 109 | – | 95 | (573 | ) | – | (209 | ) | |||||||||||||||||||||||||||||||||||
– net income from other financial instruments designated at fair value | – | – | 30 | – | – | (1 | ) | – | ||||||||||||||||||||||||||||||||||||
– gains less losses from financial investments | (269 | ) | – | – | – | – | – | – | ||||||||||||||||||||||||||||||||||||
– loan impairment charges and other credit risk provisions | 235 | – | – | – | – | – | – | |||||||||||||||||||||||||||||||||||||
Total gains/(losses) recognised in other comprehensive income1 | 226 | (192 | ) | (11 | ) | (126 | ) | (118 | ) | (1 | ) | (64 | ) | |||||||||||||||||||||||||||||||
– available-for-sale investments: | 393 | – | – | – | – | – | – | |||||||||||||||||||||||||||||||||||||
– cash flow hedges: fair value gains/(losses) | – | – | – | (4 | ) | – | – | – | ||||||||||||||||||||||||||||||||||||
– exchange differences | (167 | ) | (192 | ) | (11 | ) | (122 | ) | (118 | ) | (1 | ) | (64 | ) | ||||||||||||||||||||||||||||||
Purchases | 594 | 1,745 | 250 | – | 2 | 9 | – | |||||||||||||||||||||||||||||||||||||
New issuances | – | – | – | – | 1,471 | – | – | |||||||||||||||||||||||||||||||||||||
Sales | (757 | ) | (1,206 | ) | (50 | ) | – | (66 | ) | (4 | ) | – | ||||||||||||||||||||||||||||||||
Settlements | (32 | ) | (146 | ) | (135 | ) | (38 | ) | (1,260 | ) | – | (241 | ) | |||||||||||||||||||||||||||||||
Transfers out | (1,471 | ) | (206 | ) | (336 | ) | (1,015 | ) | (1,743 | ) | – | (283 | ) | |||||||||||||||||||||||||||||||
Transfers in | 1,213 | 284 | – | 422 | 433 | – | 100 | |||||||||||||||||||||||||||||||||||||
At 31 December 2015 | 4,727 | 6,856 | 474 | 2,262 | 4,285 | 3 | 1,210 | |||||||||||||||||||||||||||||||||||||
Unrealised gains/(losses) recognised in profit or loss relating to assets and liabilities held at 31 December 2015 | 235 | (9 | ) | 12 | 89 | 384 | (1 | ) | 267 | |||||||||||||||||||||||||||||||||||
– trading income/(expense) excluding net interest income | – | (9 | ) | – | 89 | 384 | – | 267 | ||||||||||||||||||||||||||||||||||||
– net income/(expense) from other financial instruments designated at fair value | – | – | 12 | – | – | (1 | ) | – | ||||||||||||||||||||||||||||||||||||
– loan impairment charges and other credit risk provisions | 235 | – | – | – | – | – | – | |||||||||||||||||||||||||||||||||||||
HSBC HOLDINGS PLC
384 |
Table of Contents
| Assets | Liabilities | |||||||||||||||||||||||||||||||||||||||||||
Available for sale $m | Held for $m | Designated at fair value through profit or loss | Derivatives $m | Held for $m | Designated at fair value through profit or loss $m | Derivatives $m | ||||||||||||||||||||||||||||||||||||||
At 1 January 2014 | 7,245 | 5,347 | 608 | 2,502 | 7,514 | – | 2,335 | |||||||||||||||||||||||||||||||||||||
Total gains/(losses) recognised in profit or loss | 174 | 194 | 56 | 959 | (25 | ) | – | (5 | ) | |||||||||||||||||||||||||||||||||||
– trading income/(expense) excluding net interest income | – | 194 | – | 959 | (25 | ) | – | (5 | ) | |||||||||||||||||||||||||||||||||||
– net income from other financial instruments designated at fair value | – | – | 56 | – | – | – | – | |||||||||||||||||||||||||||||||||||||
– gains less losses from financial investments | 198 | |||||||||||||||||||||||||||||||||||||||||||
– loan impairment charges and other credit risk provisions | (24 | ) | ||||||||||||||||||||||||||||||||||||||||||
Total gains/(losses) recognised in other comprehensive income1 | 126 | (178 | ) | (16 | ) | (126 | ) | (123 | ) | – | 54 | |||||||||||||||||||||||||||||||||
– available-for-sale investments: | 208 | – | – | – | – | – | – | |||||||||||||||||||||||||||||||||||||
– cash flow hedges: fair value gains/(losses) | – | – | – | (9 | ) | – | – | 34 | ||||||||||||||||||||||||||||||||||||
– exchange differences | (82 | ) | (178 | ) | (16 | ) | (117 | ) | (123 | ) | – | 20 | ||||||||||||||||||||||||||||||||
Purchases | 1,505 | 705 | 273 | – | (31 | ) | – | – | ||||||||||||||||||||||||||||||||||||
New issuances | – | – | – | – | 2,067 | – | – | |||||||||||||||||||||||||||||||||||||
Sales | (1,237 | ) | (481 | ) | (149 | ) | – | – | – | – | ||||||||||||||||||||||||||||||||||
Settlements | (1,255 | ) | (49 | ) | (78 | ) | 27 | (1,655 | ) | – | (69 | ) | ||||||||||||||||||||||||||||||||
Transfers out | (3,027 | ) | (112 | ) | – | (544 | ) | (1,918 | ) | – | (527 | ) | ||||||||||||||||||||||||||||||||
Transfers in | 1,457 | 1,042 | 32 | 106 | 310 | – | 119 | |||||||||||||||||||||||||||||||||||||
At 31 December 2014 | 4,988 | 6,468 | 726 | 2,924 | 6,139 | – | 1,907 | |||||||||||||||||||||||||||||||||||||
Unrealised gains/(losses) recognised in profit or loss relating to assets and liabilities held at 31 December 2014 | (24 | ) | 1 | 46 | 946 | (122 | ) | – | 134 | |||||||||||||||||||||||||||||||||||
– trading income/(expense) excluding net interest income | – | 1 | – | 946 | (122 | ) | – | 134 | ||||||||||||||||||||||||||||||||||||
– net income from other financial instruments designated at fair value | – | – | 46 | – | – | – | – | |||||||||||||||||||||||||||||||||||||
– loan impairment charges and other credit risk provisions | (24 | ) | – | – | – | – | – | – | ||||||||||||||||||||||||||||||||||||
| 1 | Included in ‘Available-for-sale investments: fair value gains/(losses)’ and ‘Exchange differences’ in the consolidated statement of comprehensive income. |
In 2015 movement of Level 3 available-for-sale assets are driven by ABS activity, predominantly in the securities investment conduits. Transfers out of Level 3 available-for-sale assets demonstrates increased confidence in pricing and price coverage, and transfers in reflect limited availability of third-party prices. Increase in Level 3 held for trading assets is driven by an increase in recently-issued syndicated loans. The decline in Level 3 held for trading liabilities reflects a decline in the outstanding balance of Level 3 equity-linked notes, both as a result of market movement and reduced issuance. The decline in Level 3 derivative assets and liabilities reflects market movement.
HSBC HOLDINGS PLC
385 |
Table of Contents
Notes on the Financial Statements(continued)
13 – Fair values of financial instruments carried at fair value
Effect of changes in significant unobservable assumptions to reasonably possible alternatives
Sensitivity of Level 3 fair values to reasonably possible alternative assumptions
Reflected in profit or loss | Reflected in other comprehensive income | |||||||||||||||||||||||
Favourable changes $m | Unfavourable changes $m | Favourable changes $m | Unfavourable changes $m | |||||||||||||||||||||
Derivatives, trading assets and trading liabilities1 | 335 | (215 | ) | – | – | |||||||||||||||||||
Financial assets and liabilities designated at fair value | 24 | (24 | ) | – | – | |||||||||||||||||||
Financial investments: available for sale | 35 | (30 | ) | 230 | (243 | ) | ||||||||||||||||||
At 31 December 2015 | 394 | (269 | ) | 230 | (243 | ) | ||||||||||||||||||
Derivatives, trading assets and trading liabilities1 | 296 | (276 | ) | – | – | |||||||||||||||||||
Financial assets and liabilities designated at fair value | 37 | (47 | ) | – | – | |||||||||||||||||||
Financial investments: available for sale | 51 | (67 | ) | 270 | (350 | ) | ||||||||||||||||||
At 31 December 2014 | 384 | (390 | ) | 270 | (350 | ) | ||||||||||||||||||
1 Derivatives, trading assets and trading liabilities are presented as one category to reflect the manner in which these financial instruments are risk managed.
The effect of favourable changes is broadly unchanged over the period. The decrease in the effect of unfavourable changes reflects increased price certainty in respect of private equity and certain legacy funding structures, offset by greater syndicated loan uncertainty as a result of the increased Level 3 balance.
Sensitivity of fair values to reasonably possible alternative assumptions by Level 3 instrument type
|
| |||||||||||||||||||||||
| Reflected in profit or loss | Reflected in other comprehensive income | |||||||||||||||||||||||
Favourable changes | Unfavourable changes | Favourable changes | Unfavourable changes | |||||||||||||||||||||
Private equity including strategic investments | 54 | (53 | ) | 152 | (171 | ) | ||||||||||||||||||
Asset-backed securities | 18 | (12 | ) | 57 | (51 | ) | ||||||||||||||||||
Loans held for securitisation | 1 | (1 | ) | – | – | |||||||||||||||||||
Structured notes | 15 | (11 | ) | – | – | |||||||||||||||||||
Derivatives with monolines | 11 | (11 | ) | – | – | |||||||||||||||||||
Other derivatives | 179 | (87 | ) | – | – | |||||||||||||||||||
Other portfolios | 116 | (94 | ) | 21 | (21 | ) | ||||||||||||||||||
At 31 December 2015 | 394 | (269 | ) | 230 | (243 | ) | ||||||||||||||||||
Private equity including strategic investments | 77 | (110 | ) | 172 | (255 | ) | ||||||||||||||||||
Asset-backed securities | 49 | (22 | ) | 60 | (55 | ) | ||||||||||||||||||
Loans held for securitisation | 1 | (1 | ) | – | – | |||||||||||||||||||
Structured notes | 14 | (9 | ) | – | – | |||||||||||||||||||
Derivatives with monolines | 11 | (11 | ) | – | – | |||||||||||||||||||
Other derivatives | 129 | (155 | ) | – | – | |||||||||||||||||||
Other portfolios | 103 | (82 | ) | 38 | (40 | ) | ||||||||||||||||||
At 31 December 2014 | 384 | (390 | ) | 270 | (350 | ) | ||||||||||||||||||
Favourable and unfavourable changes are determined on the basis of sensitivity analysis. The sensitivity analysis aims to measure a range of fair values consistent with the application of a 95% confidence interval. Methodologies take account of the nature of the valuation technique employed, as well as the availability and reliability of observable proxy and historical data. When the available data is not amenable to statistical analysis, the quantification of uncertainty is judgemental, but remains guided by the 95% confidence interval.
When the fair value of a financial instrument is affected by more than one unobservable assumption, the above table reflects the most favourable or the most unfavourable change from varying the assumptions individually.
Key unobservable inputs to Level 3 financial instruments
The table below lists key unobservable inputs to Level 3 financial instruments, and provides the range of those inputs as at 31 December 2015. The core range of inputs is the estimated range within which 90% of the inputs fall. A further description of the categories of key unobservable inputs is given below.
HSBC HOLDINGS PLC
386 |
Table of Contents
Quantitative information about significant unobservable inputs in Level 3 valuations
| Fair value | Key unobservable | |||||||||||||||||||||||||||||||||||||
| Assets | Liabilities | Valuation technique | inputs | Full range of inputs | Core range of inputs | |||||||||||||||||||||||||||||||||
| $m | $m | Lower | Higher | Lower | Higher | |||||||||||||||||||||||||||||||||
Private equity including strategic investments | 3,951 | 35 | See notes on page 389 | See notes on page 389 | n/a | n/a | n/a | n/a | ||||||||||||||||||||||||||||||
Asset-backed securities | 1,584 | – | ||||||||||||||||||||||||||||||||||||
– CLO/CDO1 | 511 | – | Model – Discounted cash flow Market proxy | Prepayment rate Bid quotes |
| 1% 3 |
| | 6% 147 | | | 1% 54 | | | 6% 117 | | ||||||||||||||||||||||
Other ABSs | 1,073 | – | ||||||||||||||||||||||||||||||||||||
Loans held for securitisation | 30 | – | ||||||||||||||||||||||||||||||||||||
Structured notes | 4 | 4,250 | ||||||||||||||||||||||||||||||||||||
– equity-linked notes | – | 3,719 | Model – Option model | Equity volatility | 12% | 72% | 19% | 43% | ||||||||||||||||||||||||||||||
| Model – Option model | Equity correlation | 35% | 93% | 43% | 79% | |||||||||||||||||||||||||||||||||
– fund-linked notes | – | 13 | Model – Option model | Fund volatility | 6% | 8% | 6% | 8% | ||||||||||||||||||||||||||||||
– FX-linked notes | – | 166 | Model – Option model | FX volatility | 5% | 35% | 5% | 20% | ||||||||||||||||||||||||||||||
– other | 4 | 352 | ||||||||||||||||||||||||||||||||||||
Derivatives with monolines | 196 | – | Model – Discounted cash flow | Credit spread | 4% | 4% | 4% | 4% | ||||||||||||||||||||||||||||||
Other derivatives | 2,066 | 1,210 | ||||||||||||||||||||||||||||||||||||
Interest rate derivatives: | ||||||||||||||||||||||||||||||||||||||
– securitisation swaps | 250 | 455 | Model – Discounted cash flow | Prepayment rate | 0% | 90% | 14% | 71% | ||||||||||||||||||||||||||||||
– long-dated swaptions | 1,237 | 119 | Model – Option model | IR volatility | 3% | 66% | 20% | 41% | ||||||||||||||||||||||||||||||
– other | 176 | 65 | ||||||||||||||||||||||||||||||||||||
FX derivatives: | ||||||||||||||||||||||||||||||||||||||
– FX options | 180 | 186 | Model – Option model | FX volatility | 0.5% | 35% | 5% | 14% | ||||||||||||||||||||||||||||||
– other | 10 | 5 | ||||||||||||||||||||||||||||||||||||
Equity derivatives: | ||||||||||||||||||||||||||||||||||||||
– long-dated single stock options | 135 | 191 | Model – Option model | Equity volatility | 8% | 104% | 18% | 44% | ||||||||||||||||||||||||||||||
– other | 39 | 170 | ||||||||||||||||||||||||||||||||||||
Credit derivatives: | ||||||||||||||||||||||||||||||||||||||
– other | 39 | 19 | ||||||||||||||||||||||||||||||||||||
Other portfolios | 6,488 | 3 | ||||||||||||||||||||||||||||||||||||
– structured certificates | 4,434 | – | Model – Discounted cash flow | Credit volatility | 2% | 4% | 2% | 4% | ||||||||||||||||||||||||||||||
– EM corporate debt | 210 | – | ||||||||||||||||||||||||||||||||||||
| Market proxy | Bid quotes | 70 | 124 | 100 | 123 | |||||||||||||||||||||||||||||||||
– other2 | 1,844 | 3 | ||||||||||||||||||||||||||||||||||||
At 31 December 2015 | 14,319 | 5,498 | ||||||||||||||||||||||||||||||||||||
HSBC HOLDINGS PLC
387 |
Table of Contents
Notes on the Financial Statements(continued)
13 – Fair values of financial instruments carried at fair value
Quantitative information about significant unobservable inputs in Level 3 valuations (continued)
| Fair value | Key unobservable | |||||||||||||||||||||||||||||||||||
| Assets | Liabilities | Valuation technique | inputs | Full range of inputs | Core range of inputs | |||||||||||||||||||||||||||||||
| $m | $m | Lower | Higher | Lower | Higher | |||||||||||||||||||||||||||||||
Private equity including strategic investments | 3,716 | 47 | See notes on page 389 | See notes on page 389 | n/a | n/a | n/a | n/a | ||||||||||||||||||||||||||||
Asset-backed securities | 2,078 | – | ||||||||||||||||||||||||||||||||||
– CLO/CDO1 | 1,122 | – | Model – Discounted cash flow Market proxy | Prepayment rate Bid quotes |
| 1% 0 |
| | 6% 100 | | | 1% 54 | | | 6% 85 | | ||||||||||||||||||||
Other ABSs | 956 | – | ||||||||||||||||||||||||||||||||||
Loans held for securitisation | 39 | – | ||||||||||||||||||||||||||||||||||
Structured notes | 2 | 6,092 | ||||||||||||||||||||||||||||||||||
– equity-linked notes | – | 4,744 | Model – Option model | Equity volatility | 0.2% | 65% | 18% | 38% | ||||||||||||||||||||||||||||
| Model – Option model | Equity correlation | 27% | 92% | 44% | 79% | |||||||||||||||||||||||||||||||
– fund-linked notes | – | 562 | Model – Option model | Fund volatility | 6% | 8% | 6% | 8% | ||||||||||||||||||||||||||||
– FX-linked notes | 2 | 477 | Model – Option model | FX volatility | 2% | 70% | 4% | 16% | ||||||||||||||||||||||||||||
– other | – | 309 | ||||||||||||||||||||||||||||||||||
Derivatives with monolines | 239 | 1 | Model – Discounted cash flow | Credit spread | 3% | 5% | 4% | 4% | ||||||||||||||||||||||||||||
Other derivatives | 2,685 | 1,906 | ||||||||||||||||||||||||||||||||||
Interest rate derivatives: | ||||||||||||||||||||||||||||||||||||
– securitisation swaps | 449 | 1,023 | Model – Discounted cash flow | Prepayment rate | 0% | 50% | 6% | 18% | ||||||||||||||||||||||||||||
– long-dated swaptions | 1,044 | 152 | Model – Option model | IR volatility | 2% | 59% | 16% | 36% | ||||||||||||||||||||||||||||
– other | 755 | 151 | ||||||||||||||||||||||||||||||||||
FX derivatives: | ||||||||||||||||||||||||||||||||||||
– FX options | 89 | 95 | Model – Option model | FX volatility | 0.1% | 70% | 4% | 14% | ||||||||||||||||||||||||||||
– other | 7 | 7 | ||||||||||||||||||||||||||||||||||
Equity derivatives: | ||||||||||||||||||||||||||||||||||||
– long-dated single stock options | 192 | 256 | Model – Option model | Equity volatility | 9% | 65% | 16% | 40% | ||||||||||||||||||||||||||||
– other | 34 | 162 | ||||||||||||||||||||||||||||||||||
Credit derivatives: | ||||||||||||||||||||||||||||||||||||
– other | 115 | 60 | ||||||||||||||||||||||||||||||||||
Other portfolios | 6,347 | – | ||||||||||||||||||||||||||||||||||
– structured certificates | 4,420 | – | Model – Discounted cash flow | Credit volatility | 0.8% | 3% | 0.8% | 3% | ||||||||||||||||||||||||||||
– EM corporate debt | 372 | – | Market proxy | Credit spread | 1% | 4% | 1% | 3% | ||||||||||||||||||||||||||||
| Market proxy | Bid quotes | 58 | 131 | 106 | 130 | |||||||||||||||||||||||||||||||
– other2 | 1,555 | – | ||||||||||||||||||||||||||||||||||
At 31 December 2014 | 15,106 | 8,046 | ||||||||||||||||||||||||||||||||||
| 1 | Collateralised loan obligation/collateralised debt obligation. |
| 2 | Includes a range of smaller asset holdings. |
HSBC HOLDINGS PLC
388 |
Table of Contents
Private equity including strategic investments
Given the bespoke nature of the analysis in respect of each holding, it is not practical to quote a range of key unobservable inputs.
Prepayment rates
Prepayment rates are a measure of the anticipated future speed at which a loan portfolio will be repaid in advance of the due date. They are an important input into modelled values of ABSs. A modelled price may be used where insufficient observable market prices exist to enable a market price to be determined directly. Prepayment rates are also an important input into the valuation of derivatives linked to securitisations. They vary according to the nature of the loan portfolio and expectations of future market conditions, and may be estimated using a variety of evidence, such as prepayment rates implied from proxy observable security prices, current or historical prepayment rates and macroeconomic modelling.
Market proxy
Market proxy pricing may be used for an instrument for which specific market pricing is not available, but evidence is available in respect of instruments that have some characteristics in common. In some cases it might be possible to identify a specific proxy, but more generally evidence across a wider range of instruments will be used to understand the factors that influence current market pricing and the manner of that influence.
The range of prices used as inputs into a market proxy pricing methodology may therefore be wide. This range is not indicative of the uncertainty associated with the price derived for an individual security.
Volatility
Volatility is a measure of the anticipated future variability of a market price, tending to increase in stressed market conditions and decrease in calmer market conditions. It is an important input in the pricing of options. In general, the higher the volatility, the more expensive the option will be. This reflects both the higher probability of an increased return from the option and the potentially higher costs that HSBC may incur in hedging the risks associated with the option. If option prices become more expensive, this increases the value of HSBC’s long option positions (i.e. the positions in which HSBC has purchased options), while HSBC’s short option positions (i.e. the positions in which HSBC has sold options) suffer losses.
Volatility varies by underlying reference market price, and by strike and maturity of the option. Volatility also varies over time. As a result, it is difficult to make general statements regarding volatility levels.
Certain volatilities, typically those of a longer-dated nature, are unobservable. The unobservable volatility is then estimated from observable data. The range of unobservable volatilities quoted in the table on page 387 reflects the wide variation in volatility inputs by reference market price. The core range is significantly narrower than the full range because these examples with extreme volatilities occur relatively rarely within the HSBC portfolio. For any single unobservable volatility, the uncertainty in the volatility determination is significantly less than the range quoted above.
Correlation
Correlation is a measure of the inter-relationship between two market prices and is expressed as a number between minus one and one. A positive correlation implies that the two market prices tend to move in the same direction, with a correlation of one implying that they always move in the same direction. A negative correlation implies that the two market prices tend to move in opposite directions, with a correlation of minus one implying that the two market prices always move in opposite directions. Correlation is used to value more complex instruments where the payout is dependent upon more than one market price. There is a wide range of instruments for which correlation is an input, and consequently a wide range of both same-asset correlations (e.g. equity-equity correlation) and cross-asset correlations (e.g. foreign exchange rate-interest rate correlation) is used. In general, the range of same-asset correlations will be narrower than the range of cross-asset correlations.
Correlation may be unobservable. Unobservable correlations may be estimated based upon a range of evidence, including consensus pricing services, HSBC trade prices, proxy correlations and examination of historical price relationships.
The range of unobservable correlations quoted in the table reflects the wide variation in correlation inputs by market price pair. For any single unobservable correlation, the uncertainty in the correlation determination is likely to be less than the range quoted above.
Credit spread
Credit spread is the premium over a benchmark interest rate required by the market to accept lower credit quality. In a discounted cash flow model, the credit spread increases the discount factors applied to future cash flows, thereby reducing the value of an asset. Credit spreads may be implied from market prices. Credit spreads may not be observable in more illiquid markets.
HSBC HOLDINGS PLC
389 |
Table of Contents
Notes on the Financial Statements(continued)
14 – Fair values of financial instruments not carried at fair value
Inter-relationships between key unobservable inputs
Key unobservable inputs to Level 3 financial instruments may not be independent of each other. As described above, market variables may be correlated. This correlation typically reflects the manner in which different markets tend to react to macroeconomic or other events. Furthermore, the effect of changing market variables upon the HSBC portfolio will depend on HSBC’s net risk position in respect of each variable.
HSBC Holdings
The following table provides an analysis of the basis for valuing financial assets and financial liabilities measured at fair value in the financial statements:
Basis of valuing HSBC Holdings’ financial assets and liabilities measured at fair value
| 2015 | 2014 | |||||||||||
| $m | $m | |||||||||||
Valuation technique using observable inputs: Level 2 | ||||||||||||
Assets at 31 December | ||||||||||||
Derivatives | 2,467 | 2,771 | ||||||||||
Available for sale | 4,285 | 4,073 | ||||||||||
Liabilities at 31 December | ||||||||||||
Designated at fair value | 19,853 | 18,679 | ||||||||||
Derivatives | 2,278 | 1,169 | ||||||||||
14Fair values of financial instruments not carried at fair value
Fair values of financial instruments not carried at fair value and bases of valuation
| Fair value | ||||||||||||||||||||||||||||||||
| Valuation techniques | ||||||||||||||||||||||||||||||||
Carrying amount | Quoted market price Level 1 | Using observable inputs Level 2 | With significant unobservable inputs Level 3 | Total | ||||||||||||||||||||||||||||
| $m | $m | $m | $m | $m | ||||||||||||||||||||||||||||
Assets and liabilities not held for sale at 31 December 2015 | ||||||||||||||||||||||||||||||||
Assets | ||||||||||||||||||||||||||||||||
Loans and advances to banks | 90,401 | – | 88,156 | 2,255 | 90,411 | |||||||||||||||||||||||||||
Loans and advances to customers | 924,454 | – | 12,412 | 910,057 | 922,469 | |||||||||||||||||||||||||||
Reverse repurchase agreements – non-trading | 146,255 | – | 145,307 | 959 | 146,266 | |||||||||||||||||||||||||||
Financial investments: debt securities | 44,102 | 1,163 | 44,076 | 19 | 45,258 | |||||||||||||||||||||||||||
Liabilities | ||||||||||||||||||||||||||||||||
Deposits by banks | 54,371 | – | 54,295 | 76 | 54,371 | |||||||||||||||||||||||||||
Customer accounts | 1,289,586 | – | 1,280,368 | 9,421 | 1,289,789 | |||||||||||||||||||||||||||
Repurchase agreements – non-trading | 80,400 | – | 80,400 | – | 80,400 | |||||||||||||||||||||||||||
Debt securities in issue | 88,949 | – | 89,023 | – | 89,023 | |||||||||||||||||||||||||||
Subordinated liabilities | 22,702 | – | 24,344 | 649 | 24,993 | |||||||||||||||||||||||||||
Assets and liabilities not held for sale at 31 December 2014 | ||||||||||||||||||||||||||||||||
Assets | ||||||||||||||||||||||||||||||||
Loans and advances to banks | 112,149 | – | 109,087 | 3,046 | 112,133 | |||||||||||||||||||||||||||
Loans and advances to customers | 974,660 | – | 13,598 | 959,239 | 972,837 | |||||||||||||||||||||||||||
Reverse repurchase agreements – non-trading | 161,713 | – | 160,600 | 1,123 | 161,723 | |||||||||||||||||||||||||||
Financial investments: debt securities | 37,751 | 1,418 | 37,671 | 74 | 39,163 | |||||||||||||||||||||||||||
Liabilities | ||||||||||||||||||||||||||||||||
Deposits by banks | 77,426 | – | 77,300 | 98 | 77,398 | |||||||||||||||||||||||||||
Customer accounts | 1,350,642 | – | 1,336,865 | 13,730 | 1,350,595 | |||||||||||||||||||||||||||
Repurchase agreements – non-trading | 107,432 | – | 107,432 | – | 107,432 | |||||||||||||||||||||||||||
Debt securities in issue | 95,947 | 146 | 94,325 | 1,932 | 96,403 | |||||||||||||||||||||||||||
Subordinated liabilities | 26,664 | – | 28,806 | 1,248 | 30,054 | |||||||||||||||||||||||||||
Fair values are determined according to the hierarchy set out in Note 13.
Other financial instruments not carried at fair value are typically short-term in nature and re-price to current market rates frequently. Accordingly, their carrying amount is a reasonable approximation of fair value. This includes cash and balances at central banks, items in the course of collection from and transmission to other banks, Hong Kong Government certificates of indebtedness and Hong Kong currency notes in circulation, all of which are measured at amortised cost.
HSBC HOLDINGS PLC
390 |
Table of Contents
Carrying amount and fair value of loans and advances to customers by industry sector
| Carrying amount at 31 December | ||||||||||||||||||||
Not impaired $m | Impaired $m | Total $m | ||||||||||||||||||
2015 | ||||||||||||||||||||
Loans and advances to customers | 907,698 | 16,756 | 924,454 | |||||||||||||||||
– personal | 361,716 | 9,487 | 371,203 | |||||||||||||||||
– corporate and commercial | 485,933 | 7,145 | 493,078 | |||||||||||||||||
– financial | 60,049 | 124 | 60,173 | |||||||||||||||||
2014 | ||||||||||||||||||||
Loans and advances to customers | 954,710 | 19,950 | 974,660 | |||||||||||||||||
– personal | 377,154 | 11,800 | 388,954 | |||||||||||||||||
– corporate and commercial | 527,168 | 8,016 | 535,184 | |||||||||||||||||
– financial | 50,388 | 134 | 50,522 | |||||||||||||||||
| Fair value at 31 December | ||||||||||||||||||||
Not impaired $m | Impaired $m | Total $m | ||||||||||||||||||
2015 | ||||||||||||||||||||
Loans and advances to customers | 906,696 | 15,773 | 922,469 | |||||||||||||||||
– personal | 359,559 | 9,024 | 368,583 | |||||||||||||||||
– corporate and commercial | 487,196 | 6,592 | 493,788 | |||||||||||||||||
– financial | 59,941 | 157 | 60,098 | |||||||||||||||||
2014 | ||||||||||||||||||||
Loans and advances to customers | 954,347 | 18,490 | 972,837 | |||||||||||||||||
– personal | 375,615 | 10,721 | 386,336 | |||||||||||||||||
– corporate and commercial | 528,361 | 7,642 | 536,003 | |||||||||||||||||
– financial | 50,371 | 127 | 50,498 | |||||||||||||||||
Loans and advances to customers are classified as not impaired or impaired in accordance with the criteria described on page 128.
Analysis of loans and advances to customers by geographical segment
| 2015 | 2014 | |||||||||||||||||||||||
| Carrying amount $m | Fair value $m | Carrying amount $m | Fair value $m | |||||||||||||||||||||
Loans and advances to customers | ||||||||||||||||||||||||
Europe | 392,041 | 392,540 | 409,733 | 413,373 | ||||||||||||||||||||
Asia | 356,375 | 355,249 | 362,955 | 361,412 | ||||||||||||||||||||
Middle East and North Africa | 29,894 | 29,614 | 29,063 | 28,658 | ||||||||||||||||||||
North America | 128,851 | 127,532 | 129,787 | 126,232 | ||||||||||||||||||||
Latin America | 17,293 | 17,534 | 43,122 | 43,162 | ||||||||||||||||||||
At 31 December | 924,454 | 922,469 | 974,660 | 972,837 | ||||||||||||||||||||
Valuation
The fair value measurement is HSBC’s estimate of the price that would be received to sell an asset or paid to transfer a liability in an orderly transaction between market participants at the measurement date. It does not reflect the economic benefits and costs that HSBC expects to flow from the instruments’ cash flows over their expected future lives. Other reporting entities may use different valuation methodologies and assumptions in determining fair values for which no observable market prices are available.
Fair values of the following assets and liabilities are estimated for the purpose of disclosure as described below:
Loans and advances to banks and customers
The fair value of loans and advances is based on observable market transactions, where available. In the absence of observable market transactions, fair value is estimated using valuation models that incorporate a range of input assumptions. These assumptions may include value estimates from third-party brokers which reflect over-the-counter trading activity, forward looking discounted cash flow models using assumptions which HSBC believes are consistent with those which would be used by market participants in valuing such loans, and trading inputs from other market participants which include observed primary and secondary trades.
HSBC HOLDINGS PLC
391 |
Table of Contents
Notes on the Financial Statements(continued)
14 – Fair values of financial instruments not carried at fair value / 15 – Financial assets designated at fair value
Loans are grouped, as far as possible, into homogeneous groups and stratified by loans with similar characteristics to improve the accuracy of estimated valuation outputs. The stratification of a loan book considers all material factors including vintage, origination period, estimates of future interest rates, prepayment speeds, delinquency rates, loan-to-value ratios, the quality of collateral, default probability, and internal credit risk ratings.
The fair value of a loan reflects both loan impairments at the balance sheet date and estimates of market participants’ expectations of credit losses over the life of the loans, and the fair value effect of re-pricing between origination and the balance sheet date.
The fair value of loans and advances to customers in North America was lower than the carrying amount, primarily in the US, reflecting the market conditions at the balance sheet date. This was due to the challenging economic conditions during the past number of years, including house price depreciation, rising unemployment, changes in consumer behaviour, changes in discount rates and the lack of financing options available to support the purchase of loans and advances. The relative fair values increased during 2015, largely due to improved conditions in the housing industry driven by increased property values and, to a lesser extent, lower required market yields and increased investor demand for these types of loans and advances.
The fair value of loans and advances to customers in Europe is now broadly in line with carrying value, as new business from both new and existing customers reflects the current low interest rate environment.
Financial investments
The fair values of listed financial investments are determined using bid market prices. The fair values of unlisted financial investments are determined using valuation techniques that take into consideration the prices and future earnings streams of equivalent quoted securities.
Deposits by banks and customer accounts
Fair values are estimated using discounted cash flows, applying current rates offered for deposits of similar remaining maturities. The fair value of a deposit repayable on demand is approximated by its carrying value.
Debt securities in issue and subordinated liabilities
Fair values are determined using quoted market prices at the balance sheet date where available, or by reference to quoted market prices for similar instruments.
Repurchase and reverse repurchase agreements – non-trading
Fair values are estimated by using discounted cash flows, applying current rates. Fair values approximate carrying amounts as their balances are generally short dated.
HSBC Holdings
The methods used by HSBC Holdings to determine fair values of financial instruments for the purpose of measurement and disclosure are described above.
Fair values of HSBC Holdings’ financial instruments not carried at fair value on the balance sheet
| 2015 | 2014 | |||||||||||||||||||||||
|
| Carrying amount |
|
| Fair value | 1 |
| Carrying amount |
|
| Fair value | 1 | |||||||||||||
| $m | $m | $m | $m | |||||||||||||||||||||
Assets at 31 December | ||||||||||||||||||||||||
Loans and advances to HSBC undertakings | 44,350 | 45,180 | 43,910 | 45,091 | ||||||||||||||||||||
Liabilities at 31 December | ||||||||||||||||||||||||
Amounts owed to HSBC undertakings | 2,152 | 2,152 | 2,892 | 2,906 | ||||||||||||||||||||
Debt securities in issue | 960 | 1,224 | 1,009 | 1,357 | ||||||||||||||||||||
Subordinated liabilities | 15,895 | 18,297 | 17,255 | 20,501 | ||||||||||||||||||||
| 1 | Fair values were determined using valuation techniques with observable inputs (Level 2). |
HSBC HOLDINGS PLC
392 |
Table of Contents
15Financial assets designated at fair value
Accounting policy
Financial instruments, other than those held for trading, are classified in this category if they meet one or more of the criteria set out below, and are so designated irrevocably at inception. HSBC may designate financial instruments at fair value when the designation:
• eliminates or significantly reduces measurement or recognition inconsistencies that would otherwise arise from measuring financial instruments or recognising gains and losses on different bases from related positions. Under this criterion, the main class of financial assets designated by HSBC are financial assets under unit-linked insurance and unit-linked investment contracts. Liabilities to customers under linked contracts are determined based on the fair value of the assets held in the linked funds. If no fair value designation was made for the related assets, the assets would be classified as available for sale, with changes in fair value recorded in other comprehensive income. The related financial assets and liabilities are managed and reported to management on a fair value basis. Designation at fair value of the financial assets and related liabilities allows the changes in fair values to be recorded in the income statement and presented in the same line;
• applies to groups of financial instruments that are managed, and their performance evaluated, on a fair value basis in accordance with a documented risk management or investment strategy, and where information about the groups of financial instruments is reported to management on that basis. For example, certain financial assets are held to meet liabilities under non-linked insurance contracts. HSBC has documented risk management and investment strategies designed to manage and monitor the market risk of those assets on a net basis, after considering non-linked liabilities. Fair value measurement is also consistent with the regulatory reporting requirements under the appropriate regulations for those insurance operations; and
• relates to financial instruments containing one or more non-closely related embedded derivatives.
Designated financial assets are recognised at fair value when HSBC enters into contracts with counterparties, which is generally on trade date, and are normally derecognised when sold. Subsequent changes in fair values are recognised in the income statement in ‘Net income from financial instruments designated at fair value’.
|
Financial assets designated at fair value
| 2015 | 2014 | |||||||||||
| $m | $m | |||||||||||
Financial assets designated at fair value: | ||||||||||||
– not subject to repledge or resale by counterparties | 23,852 | 28,357 | ||||||||||
– which may be repledged or resold by counterparties | – | 680 | ||||||||||
At 31 December | 23,852 | 29,037 | ||||||||||
Treasury and other eligible bills | 396 | 56 | ||||||||||
Debt securities | 4,341 | 8,891 | ||||||||||
Equity securities | 18,995 | 20,006 | ||||||||||
Securities designated at fair value | 23,732 | 28,953 | ||||||||||
Loans and advances to banks and customers | 120 | 84 | ||||||||||
At 31 December | 23,852 | 29,037 | ||||||||||
Securities designated at fair value1
| 2015 | 2014 | |||||||||||
| $m | $m | |||||||||||
US Treasury and US Government agencies2 | 145 | 8 | ||||||||||
UK Government | 103 | 140 | ||||||||||
Hong Kong Government | 33 | 40 | ||||||||||
Other government | 1,020 | 4,088 | ||||||||||
Asset-backed securities3 | 25 | 18 | ||||||||||
Corporate debt and other securities | 3,411 | 4,653 | ||||||||||
Equities | 18,995 | 20,006 | ||||||||||
At 31 December | 23,732 | 28,953 | ||||||||||
| 1 | Included within these figures are debt securities issued by banks and other financial institutions of $1,536m (2014: $1,388m), of which $35m (2014: $24m) are guaranteed by various governments. |
| 2 | Includes securities that are supported by an explicit guarantee issued by the US Government. |
| 3 | Excludes asset-backed securities included under US Treasury and US Government agencies. |
Securities listed on a recognised exchange and unlisted
Treasury and other eligible bills | Debt securities | Equity securities | Total | |||||||||||||||||||||
| $m | $m | $m | $m | |||||||||||||||||||||
Fair value | ||||||||||||||||||||||||
Listed1 | – | 2,458 | 11,690 | 14,148 | ||||||||||||||||||||
Unlisted | 396 | 1,883 | 7,305 | 9,584 | ||||||||||||||||||||
At 31 December 2015 | 396 | 4,341 | 18,995 | 23,732 | ||||||||||||||||||||
HSBC HOLDINGS PLC
393 |
Table of Contents
Notes on the Financial Statements(continued)
16 – Derivatives
Securities listed on a recognised exchange and unlisted(continued)
Treasury and other eligible bills | Debt securities | Equity securities $m | Total $m | |||||||||||||||||||||
Fair value | ||||||||||||||||||||||||
Listed1 | 5 | 2,731 | 13,837 | 16,573 | ||||||||||||||||||||
Unlisted | 51 | 6,160 | 6,169 | 12,380 | ||||||||||||||||||||
At 31 December 2014 | 56 | 8,891 | 20,006 | 28,953 | ||||||||||||||||||||
| 1 | Included within listed investments are $1,181m of investments listed on a recognised exchange in Hong Kong (2014: $1,361m). |
Accounting policy
Derivatives
Derivatives are financial instruments that derive their value from the price of underlying items such as equities, bonds, interest rates, foreign exchange, credit spreads, commodities and equity or other indices. Derivatives are recognised initially, and are subsequently measured, at fair value. Fair values of derivatives are obtained either from quoted market prices or by using valuation techniques. Derivatives are classified as assets when their fair value is positive or as liabilities when their fair value is negative.
Embedded derivatives are bifurcated from the host contract when their economic characteristics and risks are not clearly and closely related to those of the host non-derivative contract, their terms would otherwise meet the definition of a stand-alone derivative and the combined contract is not held for trading or designated at fair value. The bifurcated embedded derivatives are measured at fair value with changes therein recognised in the income statement.
Derivative assets and liabilities arising from different transactions are only offset for accounting purposes if the offsetting criteria presented in Note 32 are met.
Gains and losses from changes in the fair value of derivatives, that do not qualify for hedge accounting are reported in ‘Net trading income’. Gains and losses on derivatives managed in conjunction with financial instruments designated at fair value are reported in ‘Net income from financial instruments designated at fair value’ together with the gains and losses on the economically hedged items. Where the derivatives are managed with debt securities issued by HSBC that are designated at fair value, the contractual interest is shown in ‘Interest expense’ together with the interest payable on the issued debt.
Hedge accounting
When derivatives are designated in hedge relationships, HSBC classifies them as either: (i) hedges of the change in fair value of recognised assets or liabilities or firm commitments (‘fair value hedges’); (ii) hedges of the variability in highly probable future cash flows attributable to a recognised asset or liability, or a forecast transaction (‘cash flow hedges’); or (iii) a hedge of a net investment in a foreign operation (‘net investment hedges’).
HSBC formally designates and documents each hedge relationship from inception, setting out the risk management objective and strategy for undertaking the hedge along with the specifically identified hedging instrument, hedged item or transaction, the nature of the risk being hedged and the method for assessing hedge effectiveness. The method selected to assess hedge effectiveness will depend on the risk management strategy.
To qualify for hedge accounting, HSBC requires that a hedge must be expected to be highly effective at inception and on an ongoing basis for the duration of the hedge relationship with each hedge relationship subject to an ongoing retrospective and prospective hedge effectiveness assessment.
Fair value hedge
Changes in the fair value of derivatives that are designated and qualify as fair value hedges are recorded in the income statement, along with changes in the fair value of the hedged assets or liabilities attributable to the hedged risk.
If a hedge relationship no longer meets the criteria for hedge accounting, hedge accounting is discontinued; the cumulative adjustment to the carrying amount of the hedged item is amortised to the income statement on a recalculated effective interest rate over the residual period to maturity, unless the hedged item has been derecognised, in which case it is recognised in the income statement immediately.
Cash flow hedge
The effective portion of changes in the fair value of derivatives that are designated and qualify as cash flow hedges is recognised in other comprehensive income; the ineffective portion of the change in fair value is recognised immediately in the income statement within ‘Net trading income’.
The accumulated gains and losses recognised in other comprehensive income are reclassified to the income statement in the same periods in which the hedged item affects profit or loss. In hedges of forecast transactions that result in recognition of a non-financial asset or liability, previous gains and losses recognised in other comprehensive income are included in the initial measurement of the asset or liability.
When a hedge relationship is discontinued, any cumulative gain or loss recognised in other comprehensive income remains in equity until the forecast transaction is recognised in the income statement. When a forecast transaction is no longer expected to occur, the cumulative gain or loss previously recognised in other comprehensive income is immediately reclassified to the income statement.
|
HSBC HOLDINGS PLC
394 |
Table of Contents
Net investment hedge
Hedges of net investments in foreign operations are accounted for in a similar way to cash flow hedges. A gain or loss on the effective portion of the hedging instrument is recognised in other comprehensive income; the residual change in fair value is recognised immediately in the income statement. Gains and losses previously recognised in other comprehensive income are reclassified to the income statement on the disposal, or part disposal, of the foreign operation.
Derivatives that do not qualify for hedge accounting
Non-qualifying hedges are derivatives entered into as economic hedges of assets and liabilities for which hedge accounting was not applied.
|
Fair values of derivatives by product contract type held by HSBC
| Assets | Liabilities | |||||||||||||||||||||||||||||||||||
| Trading | Hedging | Total | Trading | Hedging | Total | |||||||||||||||||||||||||||||||
| $m | $m | $m | $m | $m | $m | |||||||||||||||||||||||||||||||
Foreign exchange | 95,201 | 1,140 | 96,341 | 94,843 | 755 | 95,598 | ||||||||||||||||||||||||||||||
Interest rate | 277,496 | 1,658 | 279,154 | 267,609 | 3,758 | 271,367 | ||||||||||||||||||||||||||||||
Equities | 8,732 | – | 8,732 | 10,383 | – | 10,383 | ||||||||||||||||||||||||||||||
Credit | 6,961 | – | 6,961 | 6,884 | – | 6,884 | ||||||||||||||||||||||||||||||
Commodity and other | 3,148 | – | 3,148 | 2,699 | – | 2,699 | ||||||||||||||||||||||||||||||
Gross total fair values | 391,538 | 2,798 | 394,336 | 382,418 | 4,513 | 386,931 | ||||||||||||||||||||||||||||||
Offset (Note 32) | (105,860 | ) | (105,860 | ) | ||||||||||||||||||||||||||||||||
At 31 December 2015 | 288,476 | 281,071 | ||||||||||||||||||||||||||||||||||
Foreign exchange | 95,584 | 1,728 | 97,312 | 95,187 | 572 | 95,759 | ||||||||||||||||||||||||||||||
Interest rate | 471,379 | 1,864 | 473,243 | 463,456 | 4,696 | 468,152 | ||||||||||||||||||||||||||||||
Equities | 11,694 | – | 11,694 | 13,654 | – | 13,654 | ||||||||||||||||||||||||||||||
Credit | 9,340 | – | 9,340 | 10,061 | – | 10,061 | ||||||||||||||||||||||||||||||
Commodity and other | 3,884 | – | 3,884 | 3,508 | – | 3,508 | ||||||||||||||||||||||||||||||
Gross total fair values | 591,881 | 3,592 | 595,473 | 585,866 | 5,268 | 591,134 | ||||||||||||||||||||||||||||||
Offset (Note 32) | (250,465 | ) | (250,465 | ) | ||||||||||||||||||||||||||||||||
At 31 December 2014 | 345,008 | 340,669 | ||||||||||||||||||||||||||||||||||
Derivative assets and liabilities decreased during 2015, primarily driven by ‘portfolio compression’ exercises, with a corresponding decrease in the offset amount.
Fair values of derivatives by product contract type held by HSBC Holdings with subsidiaries
| Assets | Liabilities | |||||||||||||||||||||||||||||||||||
| Trading | Hedging | Total | Trading | Hedging | Total | |||||||||||||||||||||||||||||||
| $m | $m | $m | $m | $m | $m | |||||||||||||||||||||||||||||||
Foreign exchange | 390 | – | 390 | 2,065 | 213 | 2,278 | ||||||||||||||||||||||||||||||
Interest rate | 1,600 | 477 | 2,077 | – | – | – | ||||||||||||||||||||||||||||||
At 31 December 2015 | 1,990 | 477 | 2,467 | 2,065 | 213 | 2,278 | ||||||||||||||||||||||||||||||
Foreign exchange | 680 | – | 680 | 1,066 | 103 | 1,169 | ||||||||||||||||||||||||||||||
Interest rate | 1,607 | 484 | 2,091 | – | – | – | ||||||||||||||||||||||||||||||
At 31 December 2014 | 2,287 | 484 | 2,771 | 1,066 | 103 | 1,169 | ||||||||||||||||||||||||||||||
Use of derivatives
For details regarding use of derivatives, see page 171 under Market Risk.
Trading derivatives
Most of HSBC’s derivative transactions relate to sales and trading activities. Sales activities include the structuring and marketing of derivative products to customers to enable them to take, transfer, modify or reduce current or expected risks. Trading activities include market-making and risk management. Market-making entails quoting bid and offer prices to other market participants for the purpose of generating revenues based on spread and volume. Risk management activity is undertaken to manage the risk arising from client transactions, with the principal purpose of retaining client margin. Other derivatives classified as held for trading include non-qualifying hedging derivatives.
Substantially all of HSBC Holdings’ derivatives entered into with subsidiaries are managed in conjunction with financial liabilities designated at fair value.
The notional contract amounts of derivatives held for trading purposes indicate the nominal value of transactions outstanding at the balance sheet date; they do not represent amounts at risk.
HSBC HOLDINGS PLC
395 |
Table of Contents
Notes on the Financial Statements(continued)
16 – Derivatives
Notional contract amounts of derivatives held for trading purposes by product type
| HSBC | HSBC Holdings | |||||||||||||||||||||||
| 2015 | 2014 | 2015 | 2014 | |||||||||||||||||||||
| $m | $m | $m | $m | |||||||||||||||||||||
Foreign exchange | 5,658,030 | 5,548,075 | 19,036 | 15,595 | ||||||||||||||||||||
Interest rate | 14,462,113 | 22,047,278 | 10,150 | 8,650 | ||||||||||||||||||||
Equities | 501,834 | 568,932 | – | – | ||||||||||||||||||||
Credit | 463,344 | 550,197 | – | – | ||||||||||||||||||||
Commodity and other | 51,683 | 77,565 | – | – | ||||||||||||||||||||
At 31 December | 21,137,004 | 28,792,047 | 29,186 | 24,245 | ||||||||||||||||||||
Credit derivatives
HSBC trades credit derivatives through its principal dealing operations and acts as a principal counterparty to a broad range of users, structuring transactions to produce risk management products for its customers or making markets in certain products. Risk is typically controlled through entering into offsetting credit derivative contracts with other counterparties.
HSBC manages the credit risk arising on buying and selling credit derivative protection by including the related credit exposures within its overall credit limit structure for the relevant counterparty. Trading of credit derivatives is restricted to a small number of offices within the major centres which have the control infrastructure and market skills to manage effectively the credit risk inherent in the products.
Credit derivatives are also deployed to a limited extent for the risk management of the Group’s loan portfolios. The notional contract amount of credit derivatives of $463bn (2014: $550bn) consisted of protection bought of $237bn (2014: $272bn) and protection sold of $226bn (2014: $278bn). The credit derivative business operates within the market risk management framework described on page 211.
Derivatives valued using models with unobservable inputs
The difference between the fair value at initial recognition (the transaction price) and the value that would have been derived had valuation techniques used for subsequent measurement been applied at initial recognition, less subsequent releases, is as follows:
Unamortised balance of derivatives valued using models with significant unobservable inputs
| 2015 | 2014 | |||||||||||
| $m | $m | |||||||||||
Unamortised balance at 1 January | 114 | 167 | ||||||||||
Deferral on new transactions | 196 | 177 | ||||||||||
Recognised in the income statement during the year: | (207 | ) | (234 | ) | ||||||||
– amortisation | (121 | ) | (114 | ) | ||||||||
– subsequent to unobservable inputs becoming observable | (2 | ) | (13 | ) | ||||||||
– maturity, termination or offsetting derivative | (84 | ) | (107 | ) | ||||||||
– risk hedged | – | – | ||||||||||
Exchange differences | (6 | ) | 4 | |||||||||
Unamortised balance at 31 December1 | 97 | 114 | ||||||||||
| 1 | This amount is yet to be recognised in the consolidated income statement. |
Hedge accounting derivatives
HSBC uses derivatives (principally interest rate swaps) for hedging purposes in the management of its asset and liability portfolios and structural positions. This enables HSBC to optimise the overall cost to the Group of accessing debt capital markets, and to mitigate the market risk which would otherwise arise from structural imbalances in the maturity and other profiles of its assets and liabilities.
The notional contract amounts of derivatives designated in qualifying hedge accounting relationships indicate the nominal value of transactions outstanding at the balance sheet date; they do not represent amounts at risk.
HSBC HOLDINGS PLC
396 |
Table of Contents
Notional contract amounts of derivatives designated in qualifying hedge accounting relationships by product type
| HSBC | HSBC Holdings | |||||||||||||||||||||||||||||||||||
| 2015 | 2014 | 2015 | 2014 | |||||||||||||||||||||||||||||||||
Cash flow hedge | Fair value hedge | Cash flow hedge | Fair value hedge | Fair value hedge | Fair value hedge | |||||||||||||||||||||||||||||||
| $m | $m | $m | $m | $m | $m | |||||||||||||||||||||||||||||||
Foreign exchange | 32,128 | 196 | 25,340 | – | 1,120 | 1,120 | ||||||||||||||||||||||||||||||
Interest rate | 107,796 | 105,127 | 190,902 | 90,338 | 5,132 | 5,477 | ||||||||||||||||||||||||||||||
At 31 December | 139,924 | 105,323 | 216,242 | 90,338 | 6,252 | 6,597 | ||||||||||||||||||||||||||||||
Fair value hedges
HSBC’s fair value hedges principally consist of interest rate swaps that are used to protect against changes in the fair value of fixed-rate long-term financial instruments due to movements in market interest rates.
Fair values of derivatives designated as fair value hedges
| 2015 | 2014 | |||||||||||||||||||||||
| Assets | Liabilities | Assets | Liabilities | |||||||||||||||||||||
| $m | $m | $m | $m | |||||||||||||||||||||
HSBC | ||||||||||||||||||||||||
Foreign exchange | 2 | – | – | – | ||||||||||||||||||||
Interest rate | 672 | 3,395 | 387 | 4,012 | ||||||||||||||||||||
At 31 December | 674 | 3,395 | 387 | 4,012 | ||||||||||||||||||||
HSBC Holdings | ||||||||||||||||||||||||
Foreign exchange | – | 213 | – | 103 | ||||||||||||||||||||
Interest rate | 477 | – | 484 | – | ||||||||||||||||||||
At 31 December | 477 | 213 | 484 | 103 | ||||||||||||||||||||
Gains or losses arising from fair value hedges
| 2015 | 2014 | 2013 | ||||||||||||||||
| $m | $m | $m | ||||||||||||||||
HSBC | ||||||||||||||||||
Gains/(losses): | ||||||||||||||||||
– on hedging instruments | 40 | (2,542 | ) | 1,997 | ||||||||||||||
– on the hedged items attributable to the hedged risk | (51 | ) | 2,561 | (1,932 | ) | |||||||||||||
Year ended 31 December | (11 | ) | 19 | 65 | ||||||||||||||
HSBC Holdings | ||||||||||||||||||
Gains/(losses): | ||||||||||||||||||
– on hedging instruments | (4 | ) | 423 | 14 | ||||||||||||||
– on the hedged items attributable to the hedged risk | 6 | (422 | ) | (21 | ) | |||||||||||||
Year ended 31 December | 2 | 1 | (7 | ) | ||||||||||||||
Cash flow hedges
HSBC’s cash flow hedges consist principally of interest rate swaps, futures and cross-currency swaps that are used to protect against exposures to variability in future interest cash flows on non-trading assets and liabilities which bear interest at variable rates or which are expected to be re-funded or reinvested in the future. The amounts and timing of future cash flows, representing both principal and interest flows, are projected for each portfolio of financial assets and liabilities on the basis of their contractual terms and other relevant factors, including estimates of prepayments and defaults. The aggregate principal balances and interest cash flows across all portfolios over time form the basis for identifying gains and losses on the effective portions of derivatives designated as cash flow hedges of forecast transactions.
Fair values of derivatives designated as cash flow hedges
| 2015 | 2014 | |||||||||||||||||||||||
| Assets | Liabilities | Assets | Liabilities | |||||||||||||||||||||
| $m | $m | $m | $m | |||||||||||||||||||||
Foreign exchange | 1,027 | 748 | 1,673 | 572 | ||||||||||||||||||||
Interest rate | 986 | 363 | 1,477 | 684 | ||||||||||||||||||||
At 31 December | 2,013 | 1,111 | 3,150 | 1,256 | ||||||||||||||||||||
HSBC HOLDINGS PLC
397 |
Table of Contents
Notes on the Financial Statements(continued)
16 – Derivatives / 17 – Financial investments
Forecast principal balances on which interest cash flows are expected to arise
3 months $m | More than 3 $m | 5 years or less $m | More than $m | |||||||||||||||||||||
Net cash inflows/(outflows) exposure | ||||||||||||||||||||||||
Assets | 94,256 | 93,528 | 62,664 | 971 | ||||||||||||||||||||
Liabilities | (16,241 | ) | (17,179 | ) | (11,681 | ) | (3,326 | ) | ||||||||||||||||
At 31 December 2015 | 78,015 | 76,349 | 50,983 | (2,355 | ) | |||||||||||||||||||
Net cash inflows/(outflows) exposure | ||||||||||||||||||||||||
Assets | 131,694 | 122,728 | 79,529 | 959 | ||||||||||||||||||||
Liabilities | (60,814 | ) | (46,582 | ) | (36,371 | ) | (8,169 | ) | ||||||||||||||||
At 31 December 2014 | 70,880 | 76,146 | 43,158 | (7,210 | ) | |||||||||||||||||||
This table reflects the interest rate repricing profile of the underlying hedged items.
During the year to 31 December 2015 a gain of $15m (2014: gain of $34m; 2013: gain of $22m) was recognised due to hedge ineffectiveness.
Hedges of net investments in foreign operations
The Group applies hedge accounting in respect of certain consolidated net investments. Hedging is undertaken using forward foreign exchange contracts or by financing with foreign currency borrowings.
At 31 December 2015, the fair values of outstanding financial instruments designated as hedges of net investments in foreign operations were assets of $111m (2014: $55m), liabilities of $12m (2014: $1m) and notional contract values of $4,210m (2014: $3,525m).
Ineffectiveness recognised in ‘Net trading income’ in the year ended 31 December 2015 was nil (2014 and 2013: nil).
Accounting policy
Treasury bills, debt securities and equity securities intended to be held on a continuing basis, other than those designated at fair value, are classified as available for sale or held to maturity. They are recognised on the trade date when HSBC enters into contractual arrangements to purchase those instruments, and are normally derecognised when either the securities are sold or redeemed.
(i) Available-for-sale financial assets are initially measured at fair value plus direct and incremental transaction costs. They are subsequently remeasured at fair value, and changes therein are recognised in other comprehensive income until the assets are either sold or become impaired. When available-for-sale financial assets are sold, cumulative gains or losses previously recognised in other comprehensive income are recognised in the income statement as ‘Gains less losses from financial investments’.
Interest income is recognised over a debt security’s expected life. Premiums and/or discounts arising on the purchase of dated debt securities are included in the interest recognised. Dividends from equity assets are recognised in the income statement when the right to receive payment is established.
(ii) Held-to-maturity investments are non-derivative financial assets with fixed or determinable payments and fixed maturities that HSBC positively intends and is able to hold to maturity. Held-to-maturity investments are initially recorded at fair value plus any directly attributable transaction costs, and are subsequently measured at amortised cost, less any impairment losses.
The accounting policy relating to impairments of available-for-sale securities is presented in Note 1.
Available-for-sale financial assets are reclassified to held to maturity if there is a change in intention or ability to hold those assets to maturity due to a change in the way they are managed. The fair value on reclassification becomes the new amortised cost and the assets are subsequently carried at amortised cost rather than fair value.
|
Financial investments
2015 $m | 2014 $m | |||||||||||
Financial investments: | ||||||||||||
– not subject to repledge or resale by counterparties | 420,905 | 380,419 | ||||||||||
– which may be repledged or resold by counterparties | 8,050 | 35,048 | ||||||||||
At 31 December | 428,955 | 415,467 | ||||||||||
HSBC HOLDINGS PLC
398 |
Table of Contents
Carrying amount and fair value of financial investments
| 2015 | 2014 | |||||||||||||||||||||||
Carrying amount | Fair value | Carrying amount | Fair value | |||||||||||||||||||||
| $m | $m | $m | $m | |||||||||||||||||||||
Treasury and other eligible bills | 104,551 | 104,551 | 81,517 | 81,517 | ||||||||||||||||||||
– available for sale | 104,551 | 104,551 | 81,517 | 81,517 | ||||||||||||||||||||
Debt securities | 318,569 | 319,725 | 323,256 | 324,668 | ||||||||||||||||||||
– available for sale | 274,467 | 274,467 | 285,505 | 285,505 | ||||||||||||||||||||
– held to maturity | 44,102 | 45,258 | 37,751 | 39,163 | ||||||||||||||||||||
Equity securities | 5,835 | 5,835 | 10,694 | 10,694 | ||||||||||||||||||||
– available for sale | 5,835 | 5,835 | 10,694 | 10,694 | ||||||||||||||||||||
At 31 December | 428,955 | 430,111 | 415,467 | 416,879 | ||||||||||||||||||||
Financial investments at amortised cost and fair value
|
| Amortised cost | 1 |
| Fair value | 2 | |||||||
| $m | $m | |||||||||||
US Treasury | 61,585 | 61,779 | ||||||||||
US Government agencies3 | 22,910 | 22,843 | ||||||||||
US Government sponsored entities3 | 10,365 | 10,627 | ||||||||||
UK Government | 27,250 | 27,316 | ||||||||||
Hong Kong Government | 53,676 | 53,674 | ||||||||||
Other government | 141,329 | 143,370 | ||||||||||
Asset-backed securities4 | 14,239 | 13,375 | ||||||||||
Corporate debt and other securities | 89,860 | 91,292 | ||||||||||
Equities | 4,057 | 5,835 | ||||||||||
At 31 December 2015 | 425,271 | 430,111 | ||||||||||
US Treasury | 33,931 | 34,745 | ||||||||||
US Government agencies3 | 18,326 | 18,516 | ||||||||||
US Government sponsored entities3 | 9,339 | 9,761 | ||||||||||
UK Government | 28,680 | 29,758 | ||||||||||
Hong Kong Government | 43,573 | 43,574 | ||||||||||
Other government | 159,846 | 163,402 | ||||||||||
Asset-backed securities4 | 20,911 | 19,177 | ||||||||||
Corporate debt and other securities | 84,387 | 87,252 | ||||||||||
Equities | 7,421 | 10,694 | ||||||||||
At 31 December 2014 | 406,414 | 416,879 | ||||||||||
US Treasury | 50,369 | 50,421 | ||||||||||
US Government agencies3 | 19,211 | 18,771 | ||||||||||
US Government sponsored entities3 | 5,263 | 5,445 | ||||||||||
UK Government | 23,565 | 23,580 | ||||||||||
Hong Kong Government | 49,570 | 49,579 | ||||||||||
Other government | 153,619 | 156,208 | ||||||||||
Asset-backed securities4 | 25,961 | 24,115 | ||||||||||
Corporate debt and other securities | 87,469 | 88,999 | ||||||||||
Equities | 8,081 | 9,140 | ||||||||||
At 31 December 2013 | 423,108 | 426,258 | ||||||||||
| 1 | Represents the amortised cost or cost basis of the financial investment. |
| 2 | Included within ‘Fair value’ figures are debt securities issued by banks and other financial institutions of $61bn (2014: $54bn; 2013: $55bn), of which $18bn (2014: $9bn; 2013: $9bn) are guaranteed by various governments. |
| 3 | Includes securities that are supported by an explicit guarantee issued by the US Government. |
| 4 | Excludes asset-backed securities included under US Government agencies and sponsored entities. |
HSBC HOLDINGS PLC
399 |
Table of Contents
Notes on the Financial Statements(continued)
17 – Financial investments / 18 – Assets charges as security and collateral accepted
Financial investments listed and unlisted
Treasury and other eligible bills available for sale | Debt securities available for sale | Debt securities held to maturity | Equity securities | Total | ||||||||||||||||||||||||||
| $m | $m | $m | $m | $m | ||||||||||||||||||||||||||
Carrying amount | ||||||||||||||||||||||||||||||
Listed1 | 6,151 | 170,271 | 9,565 | 842 | 186,829 | |||||||||||||||||||||||||
Unlisted2 | 98,400 | 104,196 | 34,537 | 4,993 | 242,126 | |||||||||||||||||||||||||
At 31 December 2015 | 104,551 | 274,467 | 44,102 | 5,835 | 428,955 | |||||||||||||||||||||||||
Carrying amount | ||||||||||||||||||||||||||||||
Listed1 | 4,101 | 168,879 | 6,037 | 5,928 | 184,945 | |||||||||||||||||||||||||
Unlisted2 | 77,416 | 116,626 | 31,714 | 4,766 | 230,522 | |||||||||||||||||||||||||
At 31 December 2014 | 81,517 | 285,505 | 37,751 | 10,694 | 415,467 | |||||||||||||||||||||||||
| 1 | The fair value of listed held-to-maturity debt securities as at 31 December 2015 was $10bn (2014: $6bn). Included within listed investments were $5bn (2014: $4bn) of investments listed on a recognised exchange in Hong Kong. |
| 2 | Unlisted treasury and other eligible bills available for sale primarily comprise treasury bills not listed on an exchange but for which there is a liquid market. |
Maturities of investments in debt securities at their carrying amount
| 1 year or less | 5 years or less but over 1 year | 10 years or less but over 5 years | Over 10 years | Total | ||||||||||||||||||||||||||
| $m | $m | $m | $m | $m | ||||||||||||||||||||||||||
Available for sale | 61,664 | 131,023 | 42,140 | 39,640 | 274,467 | |||||||||||||||||||||||||
Held to maturity | 2,428 | 10,242 | 8,881 | 22,551 | 44,102 | |||||||||||||||||||||||||
At 31 December 2015 | 64,092 | 141,265 | 51,021 | 62,191 | 318,569 | |||||||||||||||||||||||||
Available for sale | 68,344 | 134,815 | 44,938 | 37,408 | 285,505 | |||||||||||||||||||||||||
Held to maturity | 1,396 | 9,622 | 7,087 | 19,646 | 37,751 | |||||||||||||||||||||||||
At 31 December 2014 | 69,740 | 144,437 | 52,025 | 57,054 | 323,256 | |||||||||||||||||||||||||
Contractual maturities and weighted average yields of investment debt securities
| Within one year | After one year but within five years | After five years but within ten years | After ten years | |||||||||||||||||||||||||||||||||||||||||||||
| Amount | Yield | Amount | Yield | Amount | Yield | Amount | Yield | |||||||||||||||||||||||||||||||||||||||||
| $m | % | $m | % | $m | % | $m | % | |||||||||||||||||||||||||||||||||||||||||
Available for sale | ||||||||||||||||||||||||||||||||||||||||||||||||
US Treasury | 9,316 | 0.5 | 20,352 | 1.2 | 12,805 | 2.1 | 3,594 | 3.3 | ||||||||||||||||||||||||||||||||||||||||
US Government agencies | – | – | 6 | 4.2 | 33 | 3.9 | 13,575 | 2.5 | ||||||||||||||||||||||||||||||||||||||||
US Government-sponsored agencies | 8 | 5.3 | 3,029 | 3.0 | 911 | 2.2 | 1,716 | 3.0 | ||||||||||||||||||||||||||||||||||||||||
UK Government | 2,479 | 1.7 | 8,005 | 1.3 | 8,518 | 1.4 | 1,215 | 0.1 | ||||||||||||||||||||||||||||||||||||||||
Hong Kong Government | 674 | 0.5 | 1,408 | 1.1 | – | – | – | – | ||||||||||||||||||||||||||||||||||||||||
Other governments | 37,197 | 2.0 | 60,899 | 2.4 | 10,312 | 2.9 | 2,543 | 3.0 | ||||||||||||||||||||||||||||||||||||||||
Asset-backed securities | 18 | 1.4 | 657 | 1.4 | 2,530 | 1.3 | 11,027 | 1.3 | ||||||||||||||||||||||||||||||||||||||||
Corporate debt and other securities | 12,285 | 1.5 | 35,210 | 1.4 | 5,937 | 1.9 | 6,287 | 3.0 | ||||||||||||||||||||||||||||||||||||||||
Total amortised cost at 31 December 2015 | 61,977 | 129,566 | 41,046 | 39,957 | ||||||||||||||||||||||||||||||||||||||||||||
Total carrying value | 61,664 | 131,023 | 42,140 | 39,640 | ||||||||||||||||||||||||||||||||||||||||||||
Held to maturity | ||||||||||||||||||||||||||||||||||||||||||||||||
US Treasury | 2 | 0.9 | 76 | 4.9 | 46 | 4.8 | 119 | 4.2 | ||||||||||||||||||||||||||||||||||||||||
US Government agencies | – | – | 13 | 1.4 | 30 | 4.0 | 9,254 | 2.4 | ||||||||||||||||||||||||||||||||||||||||
US Government-sponsored agencies | – | – | 112 | 1.3 | 597 | 2.7 | 3,991 | 2.9 | ||||||||||||||||||||||||||||||||||||||||
Hong Kong Government | 4 | 0.7 | 44 | 1.4 | 16 | 1.8 | 9 | 1.4 | ||||||||||||||||||||||||||||||||||||||||
Other governments | 59 | 5.5 | 217 | 4.7 | 184 | 5.3 | 725 | 4.6 | ||||||||||||||||||||||||||||||||||||||||
Asset-backed securities | – | – | – | – | – | – | 7 | 6.5 | ||||||||||||||||||||||||||||||||||||||||
Corporate debt and other securities | 2,363 | 3.0 | 9,780 | 3.5 | 8,008 | 3.7 | 8,446 | 4.1 | ||||||||||||||||||||||||||||||||||||||||
Total amortised cost at 31 December 2015 | 2,428 | 10,242 | 8,881 | 22,551 | ||||||||||||||||||||||||||||||||||||||||||||
Total carrying value | 2,428 | 10,242 | 8,881 | 22,551 | ||||||||||||||||||||||||||||||||||||||||||||
The maturity distributions of ABSs are presented in the above table on the basis of contractual maturity dates. The weighted average yield for each range of maturities is calculated by dividing the annualised interest income for the year ended 31 December 2015 by the book amount of available-for-sale debt securities at that date. The yields do not include the effect of related derivatives.
HSBC HOLDINGS PLC
400 |
Table of Contents
18Assets charged as security for liabilities, assets transferred and collateral accepted as security for assets
Financial assets pledged to secure liabilities
2015 $m | 2014 $m | |||||||||||
Treasury bills and other eligible securities | 5,941 | 5,170 | ||||||||||
Loans and advances to banks | 15,582 | 17,294 | ||||||||||
Loans and advances to customers | 88,927 | 77,960 | ||||||||||
Debt securities | 69,470 | 138,991 | ||||||||||
Equity securities | 4,644 | 11,373 | ||||||||||
Other | 213 | 6,079 | ||||||||||
Assets pledged at 31 December | 184,777 | 256,867 | ||||||||||
The above table shows assets over which a charge has been granted to secure liabilities on a legal and contractual basis. The total amount may be greater than the book value of assets utilised as collateral for funding purposes or to cover liabilities, for example, in the case of securitisations and covered bonds where the amount of liabilities issued plus any mandatory over-collateralisation is less than the book value of financial assets available for funding or collateral purposes in the relevant pool of assets. This is also the case where financial assets are placed with a custodian or a settlement agent which has a floating charge over all the financial assets placed to secure any liabilities under settlement accounts.
These transactions are conducted under terms that are usual and customary to collateralised transactions including, where relevant, standard securities lending, repurchase agreements and derivative margining. HSBC places both cash and non-cash collateral in relation to derivative transactions.
Assets transferred
Accounting policy
Derecognition of financial assets
Financial assets are derecognised when the contractual rights to receive cash flows from the assets have expired; or when HSBC has transferred its contractual right to receive the cash flows of the financial assets, and either:
• substantially all the risks and rewards of ownership have been transferred; or
• HSBC has neither retained nor transferred substantially all the risks and rewards, but has not retained control.
|
The financial assets shown above include amounts transferred to third parties that do not qualify for derecognition, notably debt securities held by counterparties as collateral under repurchase agreements and equity securities lent under securities lending agreements. As the substance of these transactions is secured borrowings, the asset collateral continues to be recognised in full and the related liability reflecting the Group’s obligation to repurchase the transferred assets for a fixed price at a future date is also recognised on the balance sheet. As a result of these transactions, the Group is unable to use, sell or pledge the transferred assets for the duration of the transaction. The Group remains exposed to interest rate risk and credit risk on these pledged instruments. The counterparty’s recourse is not limited to the transferred assets.
Transferred financial assets not qualifying for full derecognition and associated financial liabilities
Carrying amount of assets before transfer | Carrying amount of transferred assets | Carrying amount of associated liabilities | Fair value of transferred assets | Fair value of associated liabilities | Net position | |||||||||||||||||||
| $m | $m | $m | $m | $m | $m | |||||||||||||||||||
At 31 December 2015 | ||||||||||||||||||||||||
Repurchase agreements | 36,153 | 35,913 | ||||||||||||||||||||||
Securities lending agreements | 5,275 | 5,704 | ||||||||||||||||||||||
Other sales (recourse to transferred asset only) | 2,717 | 2,768 | 2,720 | 2,726 | (6 | ) | ||||||||||||||||||
Securitisations recognised to the extent of continuing involvement | 17,427 | 5 | 2 | 5 | 2 | 3 | ||||||||||||||||||
At 31 December 2014 | ||||||||||||||||||||||||
Repurchase agreements | 78,541 | 79,141 | ||||||||||||||||||||||
Securities lending agreements | 13,177 | 10,643 | ||||||||||||||||||||||
Other sales (recourse to transferred asset only) | 3,775 | 4,049 | 4,007 | 4,018 | (11 | ) | ||||||||||||||||||
Securitisations recognised to the extent of continuing involvement | 17,427 | 11 | 5 | 11 | 5 | 6 | ||||||||||||||||||
HSBC HOLDINGS PLC
401 |
Table of Contents
Notes on the Financial Statements(continued)
19 – Interests in associates and joint ventures
Collateral accepted as security for assets
The fair value of assets accepted as collateral in relation to reverse repo, securities borrowing and derivative margining that HSBC is permitted to sell or repledge in the absence of default was $222,065m (2014: $269,019m). The fair value of any such collateral sold or repledged was $139,532m (2014: $163,342m). HSBC is obliged to return equivalent securities.
These transactions are conducted under terms that are usual and customary to standard securities borrowing, reverse repurchase agreements and derivative margining.
19Interests in associates and joint ventures
Accounting policy
Investments in which HSBC, together with one or more parties, has joint control of an arrangement set up to undertake an economic activity are classified as joint ventures. HSBC classifies investments in entities over which it has significant influence, and that are neither subsidiaries (Note 21) nor joint ventures, as associates.
Investments in associates and interests in joint ventures are recognised using the equity method. Under this method, such investments are initially stated at cost, including attributable goodwill, and are adjusted thereafter for the post-acquisition change in HSBC’s share of net assets. Goodwill arises on the acquisition of interests in joint ventures and associates when the cost of investment exceeds HSBC’s share of the net fair value of the associate’s or joint venture’s identifiable assets and liabilities.
Investments in associates and joint ventures are tested for impairment when there is an indication that the investment may be impaired. Goodwill on acquisitions of interests in joint ventures and associates is not tested separately for impairment.
Profits on transactions between HSBC and its associates and joint ventures are eliminated to the extent of HSBC’s interest in the respective associates or joint ventures. Losses are also eliminated to the extent of HSBC’s interest in the associates or joint ventures unless the transaction provides evidence of an impairment of the asset transferred.
|
Critical accounting estimates and judgements
Impairment of interests in associates
Impairment testing involves significant judgement in determining the value in use, and in particular estimating the present values of cash flows expected to arise from continuing to hold the investment.
The most significant judgements relate to the impairment testing of our investment in Bank of Communications (‘BoCom’). Key assumptions used in estimating BoCom’s value in use, the sensitivity of the value in use calculation to different assumptions and a sensitivity analysis that shows the changes in key assumptions that would reduce the excess of value in use over the carrying amount (the ‘headroom’) to nil are described below.
|
Associates
At 31 December 2015, the carrying amount of HSBC’s interests in associates was $18,900m (2014: $17,940m).
Principal associates of HSBC
| 2015 | 2014 | |||||||||||||||||||||||
Carrying $m | Fair value1 $m | Carrying $m | Fair value1 $m | |||||||||||||||||||||
Listed | ||||||||||||||||||||||||
Bank of Communications Co., Limited | 15,344 | 9,940 | 14,590 | 13,140 | ||||||||||||||||||||
The Saudi British Bank | 3,021 | 3,957 | 2,811 | 6,220 | ||||||||||||||||||||
At 31 December | 18,365 | 13,897 | 17,401 | 19,360 | ||||||||||||||||||||
| 1 | Principal associates are listed on recognised stock exchanges. The fair values are based on the quoted market prices of the shares held (Level 1 in the fair value hierarchy). |
| At 31 December 2015 | ||||||||||||||||||
Country of incorporation and principal place of business | Principal activity | HSBC’s interest in equity capital | Issued equity capital | |||||||||||||||
Bank of Communications Co., Limited | PRC | 1 | Banking services | 19.03 | % | RMB74,263m | ||||||||||||
The Saudi British Bank | Saudi Arabia | Banking services | 40.00 | % | SR15,000m | |||||||||||||
| 1 | People’s Republic of China. |
Details of all HSBC associates and joint ventures, as required under Section 409 of the Companies Act 2006, are set out on pages 468 to 469.
HSBC had $15,344m (2014: $14,590m) of interests in associates listed in Hong Kong.
HSBC HOLDINGS PLC
402 |
Table of Contents
Bank of Communications Co., Limited
HSBC’s investment in BoCom was equity accounted with effect from August 2004. Its significant influence in BoCom was established as a result of representation on the Board of Directors and, in accordance with the Technical Cooperation and Exchange Programme, HSBC is assisting in the maintenance of financial and operating policies and a number of staff have been seconded to assist in this process.
Impairment testing
At 31 December 2015, the fair value of HSBC’s investment in BoCom had been below the carrying amount for approximately 44 months, apart from a short period in 2013 and briefly during the first half of 2015. As a result, the Group performed an impairment test on the carrying amount of the investment in BoCom. The test confirmed that there was no impairment at 31 December 2015.
| At 31 December 2015 | At 31 December 2014 | |||||||||||||||||||||||||||||||||||
| VIU | Carrying value | Fair value | VIU | Carrying value | Fair value | |||||||||||||||||||||||||||||||
| $bn | $bn | $bn | $bn | $bn | $bn | |||||||||||||||||||||||||||||||
Bank of Communications Co., Limited | 17.0 | 15.3 | 9.9 | 15.7 | 14.6 | 13.1 | ||||||||||||||||||||||||||||||
Basis of recoverable amount
The impairment test was performed by comparing the recoverable amount of BoCom, determined by a value in use (‘VIU’) calculation, with its carrying amount. The VIU calculation uses discounted cash flow projections based on management’s estimates of earnings. Cash flows beyond the short- to medium-term are then extrapolated in perpetuity using a long-term growth rate. An imputed capital maintenance charge (‘CMC’) is calculated to reflect the expected regulatory capital requirements, and is calculated as a deduction from forecast cash flows. The principal inputs to the CMC calculation include estimates of asset growth, the ratio of risk-weighted assets to total assets, and the expected regulatory capital requirements. Management judgement is required in estimating the future cash flows of BoCom.
Key assumptions in VIU calculation
Long-term growth rate: the growth rate used was 5% (2014: 5%) for periods after 2018 and does not exceed forecast GDP growth in mainland China.
Long-term asset growth rate: the growth rate used was 4% (2014: 4%) for periods after 2018 and this is the rate of growth required for an assumed 5% long-term growth rate in profit.
Discount rate: the discount rate of 13% (2014: 13%) is derived from a range of values obtained by applying a Capital Asset Pricing Model (‘CAPM’) calculation for BoCom, using market data. Management supplements this by comparing the rates derived from the CAPM with discount rates available from external sources, and HSBC’s discount rate for evaluating investments in mainland China. The discount rate used is within the range of 10.1% to 14.2% (2014: 11.4% to 14.2%) indicated by the CAPM and external sources.
Loan impairment charge as a percentage of customer advances: the ratio used ranges from 0.71% to 0.78% (2014: 0.73% to 1%) in the short- to medium-term and is based on the forecasts disclosed by external analysts. It was assumed that thelong-term ratio will stabilise at a rate of 0.70% (2014: 0.65%) which is slightly higher than the historical rate of 0.65%.
Risk-weighted assets as a percentage of total assets: the ratio used was 67% for all forecast periods (2014: 70% to 72% in the short- to medium-term and 70% in the long-term). This is consistent with the forecasts disclosed by external analysts.
Cost-income ratio: the ratio used was 41% (2014: ranged from 40.0% to 42.4%) in the short- to medium-term. The ratios were consistent with the short- to medium-term range forecasts of 40.3% to 40.7% (2014: 37.2% to 44.5%) disclosed by external analysts.
Sensitivity analyses were performed on each key assumption to ascertain the impact of reasonably possible changes in assumptions. The following change to each key assumption used on its own in the VIU calculation would reduce the headroom to nil.
Key assumption
| Changes to key assumption to reduce headroom to nil
| |
• Long-term growth rate • Long-term asset growth rate • Discount rate • Loan impairment charge as a percentage of customer advances • Risk-weighted assets as a percentage of total assets • Cost-income ratio
| • Decrease by 62 basis points • Increase by 62 basis points • Increase by 82 basis points • Increase by 13 basis points • Increase by 5.4% • Increase by 2.8% | |
HSBC HOLDINGS PLC
403 |
Table of Contents
Notes on the Financial Statements(continued)
19 – Interests in associates and joint ventures
The following table illustrates the effect on VIU of reasonably possible changes to key assumptions. This reflects the sensitivity of VIU to each key assumption on its own and it is possible that more than one favourable and/or unfavourable change will occur at the same time.
| Favourable change | Current model | Unfavourable change | ||||||||||||||||||||||
| $bn | $bn | $bn | $bn | $bn | ||||||||||||||||||||
At 31 December 2015 | ||||||||||||||||||||||||
Carrying amount: $15.3bn | ||||||||||||||||||||||||
Long-term growth rate | +100bps | 5% | -210bps | |||||||||||||||||||||
VIU | 20.3 | 17.0 | 12.3 | |||||||||||||||||||||
Increase/(decrease) in VIU | 3.2 | (4.7 | ) | |||||||||||||||||||||
Long-term asset growth rate | -50bps | 4% | +100bps | |||||||||||||||||||||
VIU | 18.2 | 17.0 | 14.3 | |||||||||||||||||||||
Increase/(decrease) in VIU | 1.2 | (2.8 | ) | |||||||||||||||||||||
Discount rate | -150bps | 13% | +110bps | |||||||||||||||||||||
VIU | 21.2 | 17.0 | 14.9 | |||||||||||||||||||||
Increase/(decrease) in VIU | 4.2 | (2.1 | ) | |||||||||||||||||||||
Loan impairment charge as a percentage of customer advances | 70bps throughout | 2015-18: 0.71% – 0.78% 2019 onwards: 0.70% |
| 2015-18: 0.85% 2019 onwards: 0.75% |
| |||||||||||||||||||
VIU | 17.2 | 17.0 | 16.4 | |||||||||||||||||||||
Increase/(decrease) in VIU | 0.1 | (0.7 | ) | |||||||||||||||||||||
Risk-weighted assets as a percentage of total assets | -350bps | 67% throughout | +10bps | |||||||||||||||||||||
VIU | 18.2 | 17.0 | 17.0 | |||||||||||||||||||||
Increase/(decrease) in VIU | 1.2 | (0.0 | ) | |||||||||||||||||||||
Cost income ratio | -250bps | 41% throughout | +120bps | |||||||||||||||||||||
VIU | 18.5 | 17.0 | 16.35 | |||||||||||||||||||||
Increase/(decrease) in VIU | 1.5 | (0.7 | ) | |||||||||||||||||||||
At 31 December 2014 | ||||||||||||||||||||||||
Carrying amount: $14.6bn | ||||||||||||||||||||||||
Long-term growth rate | +50bp | +100bp | 5% | -50bp | -100bp | |||||||||||||||||||
VIU | 17.0 | 18.6 | 15.7 | 14.5 | 13.4 | |||||||||||||||||||
Increase/(decrease) in VIU | 1.3 | 2.9 | (1.2 | ) | (2.3 | ) | ||||||||||||||||||
Discount rate | -50bp | -100bp | 13% | +50bp | +100bp | |||||||||||||||||||
VIU | 16.8 | 18.1 | 15.7 | 14.7 | 13.9 | |||||||||||||||||||
Increase/(decrease) in VIU | 1.1 | 2.4 | (1.0 | ) | (1.8 | ) | ||||||||||||||||||
Loan impairment charge as a percentage of customer advances | 0.65% throughout | 2014-18: 0.73% – 1% 2019 onwards: 0.65% |
| 1% from 2014-18 2019 onwards: 0.65% |
| |||||||||||||||||||
VIU | 16.2 | 15.7 | 14.9 | |||||||||||||||||||||
Increase/(decrease) in VIU | 0.5 | (0.8) | ||||||||||||||||||||||
Risk-weighted assets as a percentage of total assets | -100bp | -200bp | 2014-18: 70% – 72% 2019 onwards: 70.0% | +100bp | +200bp | |||||||||||||||||||
VIU | 16.0 | 16.3 | 15.7 | 15.4 | 15.1 | |||||||||||||||||||
Increase/(decrease) in VIU | 0.3 | 0.6 | (0.3 | ) | (0.6 | ) | ||||||||||||||||||
Cost income ratio | -50bp | -100bp | 2014-18: 40.0% – 42.4% 2019 onwards: 42.4% | +50bp | +100bp | |||||||||||||||||||
VIU | 16.0 | 16.3 | 15.7 | 15.4 | 15.1 | |||||||||||||||||||
Increase/(decrease) in VIU | 0.3 | 0.6 | (0.3 | ) | (0.6 | ) | ||||||||||||||||||
Based on the forecasts disclosed by external analysts, management estimates that the reasonably possible range of VIU is $12.4bn to $22.7bn.
Selected financial information of BoCom
The statutory accounting reference date of BoCom is 31 December. For the year ended 31 December 2015, HSBC included the associate’s results on the basis of financial statements made up for the 12 months ended 30 September 2015, taking into account changes in the subsequent period from 1 October 2015 to 31 December 2015 that would have materially affected the results.
HSBC HOLDINGS PLC
404 |
Table of Contents
Selected balance sheet information of BoCom
| At 30 September | ||||||||||||
| 2015 | 2014 | |||||||||||
| $m | $m | |||||||||||
Cash and balances at central banks | 144,702 | 150,306 | ||||||||||
Loans and advances to banks and other financial institutions | 110,915 | 79,960 | ||||||||||
Loans and advances to customers | 560,503 | 547,706 | ||||||||||
Other financial assets | 244,722 | 178,883 | ||||||||||
Other assets | 49,246 | 45,140 | ||||||||||
Total assets | 1,110,088 | 1,001,995 | ||||||||||
Deposits by banks and other financial institutions | 261,211 | 209,935 | ||||||||||
Customer accounts | 691,959 | 663,745 | ||||||||||
Other financial liabilities | 46,932 | 28,860 | ||||||||||
Other liabilities | 29,329 | 25,361 | ||||||||||
Total liabilities | 1,029,431 | 927,901 | ||||||||||
Total equity | 80,657 | 74,094 | ||||||||||
Reconciliation of BoCom’s total shareholders’ equity to the carrying amount in HSBC’s consolidated financial statements as at 31 December
| At 30 September | ||||||||||||
| 2015 | 2014 | |||||||||||
| $m | $m | |||||||||||
HSBC’s share of total shareholders’ equity | 14,824 | 14,040 | ||||||||||
Add: Goodwill and other intangible assets | 520 | 550 | ||||||||||
Carrying amount | 15,344 | 14,590 | ||||||||||
Selected income statement information of BoCom
For the 12 months ended 30 September | ||||||||||||
| 2015 | 2014 | |||||||||||
| $m | $m | |||||||||||
Net interest income | 22,397 | 22,030 | ||||||||||
Net fee and commission income | 5,432 | 4,792 | ||||||||||
Loan impairment charges | (3,772 | ) | (3,509 | ) | ||||||||
Depreciation and amortisation | (1,012 | ) | (920 | ) | ||||||||
Tax expense | (2,976 | ) | (3,102 | ) | ||||||||
Profit for the year | 10,634 | 10,626 | ||||||||||
Other comprehensive income | 377 | 217 | ||||||||||
Total comprehensive income | 11,011 | 10,843 | ||||||||||
Dividends received from BoCom | 624 | 597 | ||||||||||
Summarised aggregate financial information in respect of all associates excluding BoCom
| 2015 | 2014 | |||||||||||
| $m | $m | |||||||||||
Carrying amount | 3,556 | 3,350 | ||||||||||
HSBC’s share of: | ||||||||||||
– total assets | 21,645 | 20,099 | ||||||||||
– total liabilities | 18,166 | 16,837 | ||||||||||
– revenues | 821 | 801 | ||||||||||
– profit or loss from continuing operations | 508 | 519 | ||||||||||
– other comprehensive income | – | 2 | ||||||||||
– total comprehensive income | 508 | 521 | ||||||||||
Joint ventures
At 31 December 2015, the carrying amount of HSBC’s interests in joint ventures was $239m (2014: $241m).
Associates and joint ventures
For the year ended 31 December 2015, HSBC’s share of associates and joint ventures’ tax on profit was $575m (2014: $600m). This is included within ‘Share of profit in associates and joint ventures’ in the income statement.
HSBC HOLDINGS PLC
405 |
Table of Contents
Notes on the Financial Statements(continued)
20 – Goodwill and intangible assets
Movements in interests in associates and joint ventures
| 2015 | 2014 | |||||||||||
| $m | $m | |||||||||||
At 1 January | 18,181 | 16,640 | ||||||||||
Additions | 3 | 30 | ||||||||||
Disposals | (8 | ) | (133 | ) | ||||||||
Share of results | 2,556 | 2,532 | ||||||||||
Dividends | (879 | ) | (757 | ) | ||||||||
Exchange differences | (718 | ) | (212 | ) | ||||||||
Share of other comprehensive income of associates and joint ventures | (9 | ) | 78 | |||||||||
Other movements | 13 | 3 | ||||||||||
At 31 December1 | 19,139 | 18,181 | ||||||||||
| 1 | Includes goodwill of $593m (2014: $621m). |
20Goodwill and intangible assets
| 2015 | 2014 | |||||||||||
| $m | $m | |||||||||||
Goodwill | 16,294 | 19,169 | ||||||||||
Present value of in-force long-term insurance business | 5,685 | 5,307 | ||||||||||
Other intangible assets | 2,626 | 3,101 | ||||||||||
At 31 December | 24,605 | 27,577 | ||||||||||
Goodwill
Accounting policy
Goodwill arises on the acquisition of subsidiaries, when the aggregate of the fair value of the consideration transferred, the amount of any non-controlling interest and the fair value of any previously held equity interest in the acquiree exceed the amount of the identifiable assets acquired and liabilities assumed. If the amount of the identifiable assets and liabilities acquired is greater, the difference is recognised immediately in the income statement.
Goodwill is allocated to cash-generating units (‘CGU’s) for the purpose of impairment testing, which is undertaken at the lowest level at which goodwill is monitored for internal management purposes. HSBC’s CGU’s are based on geographical regions subdivided by global business. Impairment testing is performed at least annually, or whenever there is an indication of impairment, by comparing the recoverable amount of a CGU with its carrying amount. The carrying amount of a CGU is based on its assets and liabilities, including attributable goodwill. The recoverable amount of a CGU is the higher of its fair value less cost to sell and its value in use. VIU is the present value of the expected future CGU cash flows. If the recoverable amount is less than the carrying value, an impairment loss is charged to the income statement. Goodwill is carried on the balance sheet at cost less accumulated impairment losses.
Goodwill is included in a disposal group if the disposal group is a CGU to which goodwill has been allocated or it is an operation within such a CGU. The amount of goodwill included in a disposal group is measured on the basis of the relative values of the operation disposed of and the portion of the CGU retained.
At the date of disposal of a business, attributable goodwill is included in HSBC’s share of net assets in the calculation of the gain or loss on disposal.
|
Critical accounting estimates and judgements
Goodwill impairment
The review of goodwill for impairment reflects management’s best estimate of the future cash flows of the CGUs and the rates used to discount these cash flows, both of which are subject to uncertain factors as follows:
• the future cash flows of the CGUs are sensitive to the cash flows projected for the periods for which detailed forecasts are available and to assumptions regarding the long-term pattern of sustainable cash flows thereafter. Forecasts are compared with actual performance and verifiable economic data, but they reflect management’s view of future business prospects at the time of the assessment; and
• the rates used to discount future expected cash flows can have a significant effect on their valuation and are based on the costs of capital assigned to individual CGUs. The cost of capital percentage is generally derived from a CAPM, which incorporates inputs reflecting a number of financial and economic variables, including the risk-free interest rate in the country concerned and a premium for the risk of the business being evaluated. These variables are subject to fluctuations in external market rates and economic conditions beyond management’s control, are subject to uncertainty and require the exercise of significant judgement.
The accuracy of forecast cash flows is subject to a high degree of uncertainty in volatile market conditions. In such circumstances, management retests goodwill for impairment more frequently than annually when indicators of impairment exist to ensure that the assumptions on which the cash flow forecasts are based continue to reflect current market conditions and management’s best estimate of future business prospects.
|
HSBC HOLDINGS PLC
406 |
Table of Contents
Movement analysis of goodwill
| Europe | Asia | MENA | North America | Latin America | Total | |||||||||||||||||||||||||||||||
| $m | $m | $m | $m | $m | $m | |||||||||||||||||||||||||||||||
Gross amount | ||||||||||||||||||||||||||||||||||||
At 1 January 2015 | 13,207 | 1,009 | 54 | 7,815 | 3,007 | 25,092 | ||||||||||||||||||||||||||||||
Exchange differences | (1,237 | ) | (73 | ) | (4 | ) | 4 | (300 | ) | (1,610 | ) | |||||||||||||||||||||||||
Reclassified to held for sale1 | – | – | – | – | (1,319 | ) | (1,319 | ) | ||||||||||||||||||||||||||||
Other | 1 | 59 | (5 | ) | (30 | ) | (1 | ) | 24 | |||||||||||||||||||||||||||
At 31 December 2015 | 11,971 | 995 | 45 | 7,789 | 1,387 | 22,187 | ||||||||||||||||||||||||||||||
Accumulated impairment losses | ||||||||||||||||||||||||||||||||||||
At 1 January 2015 | – | – | – | (5,923 | ) | – | (5,923 | ) | ||||||||||||||||||||||||||||
Other | – | – | – | 30 | – | 30 | ||||||||||||||||||||||||||||||
At 31 December 2015 | – | – | – | (5,893 | ) | – | (5,893 | ) | ||||||||||||||||||||||||||||
Net carrying amount at 31 December 2015 | 11,971 | 995 | 45 | 1,896 | 1,387 | 16,294 | ||||||||||||||||||||||||||||||
Gross amount | ||||||||||||||||||||||||||||||||||||
At 1 January 2014 | 14,977 | 1,016 | 55 | 7,861 | 3,241 | 27,150 | ||||||||||||||||||||||||||||||
Disposals | (168 | ) | – | – | – | – | (168 | ) | ||||||||||||||||||||||||||||
Exchange differences | (1,594 | ) | (30 | ) | (1 | ) | 1 | (240 | ) | (1,864 | ) | |||||||||||||||||||||||||
Reclassified to held for sale | (8 | ) | – | – | – | 24 | 16 | |||||||||||||||||||||||||||||
Other | – | 23 | – | (47 | ) | (18 | ) | (42 | ) | |||||||||||||||||||||||||||
At 31 December 2014 | 13,207 | 1,009 | 54 | 7,815 | 3,007 | 25,092 | ||||||||||||||||||||||||||||||
Accumulated impairment losses | ||||||||||||||||||||||||||||||||||||
At 1 January 2014 | – | – | – | (5,971 | ) | – | (5,971 | ) | ||||||||||||||||||||||||||||
Exchange differences | – | – | – | 1 | – | 1 | ||||||||||||||||||||||||||||||
Other | – | – | – | 47 | – | 47 | ||||||||||||||||||||||||||||||
At 31 December 2014 | – | – | – | (5,923 | ) | – | (5,923 | ) | ||||||||||||||||||||||||||||
Net carrying amount at 31 December 2014 | 13,207 | 1,009 | 54 | 1,892 | 3,007 | 19,169 | ||||||||||||||||||||||||||||||
| 1 | During 2015, $1.3bn of goodwill was reclassified to held for sale following the decision to sell our Brazilian operations. Goodwill was allocated based on the relative carrying value of the operations in Brazil to the cash generating units in Latin America. See Note 23 for further details. |
Impairment testing
HSBC’s impairment test in respect of goodwill allocated to each CGU is performed as at 1 July each year. A review for indicators of impairment is undertaken at each subsequent quarter end and, as at 31 December 2015, this review identified indicators of impairment for two CGUs, recognised as sensitive in the annual test performed as at 1 July. As a result, an impairment test has been performed for Global Private Banking – Europe and Global Banking and Markets – North America as at 31 December 2015 and the goodwill balances, key assumptions and results of this test are included in the disclosures below. For all other CGUs the annual test performed as at 1 July remains the latest impairment test and the disclosures given are as at 1 July. The testing at both 1 July and 31 December resulted in no impairment of goodwill.
Basis of the recoverable amount
The recoverable amount of all CGUs to which goodwill has been allocated was equal to its VIU at each respective testing date for 2014 and 2015.
For each significant CGU, the VIU is calculated by discounting management’s cash flow projections for the CGU. The discount rate used is based on the cost of capital HSBC allocates to investments in the countries within which the CGU operates. The long-term growth rate is used to extrapolate the cash flows in perpetuity because of the long-term perspective within the Group of the business units making up the CGUs. For the goodwill impairment test conducted at 1 July 2015, management’s cash flow projections until the end of 2019 were used. For the goodwill impairment test conducted at 31 December 2015, management’s cash flow projections until the end of 2020 were used.
HSBC HOLDINGS PLC
407 |
Table of Contents
Notes on the Financial Statements(continued)
20 – Goodwill and intangible assets
Key assumptions in VIU calculation
| Goodwill at: | Discount | Nominal growth rate | ||||||||||||||||||||||
| 1 Jul 2015 | 31 Dec 2015 | rate | flow projections | |||||||||||||||||||||
| $m | $m | % | % | |||||||||||||||||||||
Cash-generating unit | ||||||||||||||||||||||||
Retail Banking and Wealth Management – Europe | 3,562 | 6.9 | 3.3 | |||||||||||||||||||||
Global Private Banking – Europe | 3,414 | 3,343 | 8.4 | 2.5 | ||||||||||||||||||||
Global Banking and Markets – Europe | 2,690 | 9.9 | 3.5 | |||||||||||||||||||||
Commercial Banking – Europe | 2,603 | 9.0 | 3.6 | |||||||||||||||||||||
Global Banking and Markets – North America | 929 | 931 | 10.0 | 4.3 | ||||||||||||||||||||
Retail Banking and Wealth Management – Latin America | 792 | 11.0 | 6.9 | |||||||||||||||||||||
| 1 Jul 2014 | ||||||||||||||||||||||||
| $m | ||||||||||||||||||||||||
Cash-generating unit | ||||||||||||||||||||||||
Retail Banking and Wealth Management – Europe | 4,298 | 9.1 | 4.5 | |||||||||||||||||||||
Global Private Banking – Europe | 3,808 | 7.1 | 3.4 | |||||||||||||||||||||
Global Banking and Markets – Europe | 3,296 | 11.0 | 4.2 | |||||||||||||||||||||
Commercial Banking – Europe | 3,214 | 10.1 | 4.2 | |||||||||||||||||||||
Global Banking and Markets – North America | 917 | 9.8 | 4.6 | |||||||||||||||||||||
Retail Banking and Wealth Management – Latin America | 1,762 | 12.8 | 7.9 | |||||||||||||||||||||
At 1 July 2015, aggregate goodwill of $2,787m (1 July 2014: $3,610m) had been allocated to CGUs that were not considered individually significant. The Group’s CGUs do not carry on their balance sheets any significant intangible assets with indefinite useful lives, other than goodwill.
Management’s judgement in estimating the cash flows of a CGU: the cash flow projections for each CGU are based on plans approved by the GMB.
Nominal long-term growth rate: this growth rate reflects GDP and inflation for the countries within which the CGU operates or derives revenue from. The rates are based on IMF forecast growth rates as they represent an objective estimate of likely future trends. The rates used for 2014 and 2015 do not exceed the long-term growth rates for the countries within which the CGUs operate or derive revenue from.
Discount rate: the discount rate used to discount the cash flows is based on the cost of capital assigned to each CGU, which is derived using a CAPM. The CAPM depends on inputs reflecting a number of financial and economic variables including the risk-free rate and a premium to reflect the inherent risk of the business being evaluated. These variables are based on the market’s assessment of the economic variables and management’s judgement. The discount rates for each CGU are refined to reflect the rates of inflation for the countries within which the CGU operates. In addition, for the purposes of testing goodwill for impairment, management supplements this process by comparing the discount rates derived using the internally generated CAPM with cost of capital rates produced by external sources for businesses operating in similar markets. For 2014 and 2015, internal cost of capital rates were consistent with externally sourced rates. For the purpose of goodwill testing during 2015, internal rates were adjusted to reflect the uncertainty of the cash flows used in the test.
Sensitivities of key assumptions in calculating VIU
At 1 July 2015 Global Banking and Markets – Europe, and as at 31 December Global Banking and Markets – North America and Global Private Banking – Europe, were all sensitive to reasonably possible changes in the key assumptions supporting the recoverable amount. In making an estimate of reasonably possible changes to assumptions management considers the available evidence in respect of each input to the model such as: the external range of discount rates observable; historical performance against forecast; and risks attaching to the key assumptions underlying cash flow projections.
For Global Banking and Markets – North America, a reasonably possible adverse change in any one of the discount rate, growth rate or management’s projections of cash flows could cause an impairment to be recognised. For Global Private Banking – Europe, a reasonably possible adverse change in management’s projections of cash flows, or changes in more than one assumption, could cause an impairment to be recognised. Global Banking and Markets – Europe, would require reasonably possible adverse changes in more than one assumption to cause an impairment.
The following table presents a summary of the key assumptions underlying the most sensitive inputs to the model for each CGU; the key risks attaching to each; and details of a reasonably possible change to assumptions where, in the opinion of management, these could result in an impairment.
HSBC HOLDINGS PLC
408 |
Table of Contents
Reasonably possible changes in key assumptions
| Input | Key assumptions | Associated risks | Reasonably possible change | |||||||
| Cash-generating unit | ||||||||||
Retail Banking and Wealth Management – Europe and Commercial Banking – Europe | Cash flow projections | • Level of interest rates; • Competitors’ positions within the market; and • Level and change in unemployment rates. | • Uncertain regulatory environment; and • Customer remediation and regulatory actions. | • Management has determined that a reasonably possible change in any of the key assumptions would not cause an impairment to be recognised. | ||||||
| Global Private Banking – Europe | Cash flow projections | • Achievement of planned strategic repositioning; • Level of assets under management; • Return on assets; • Central bank interest rate rises; and • Cost savings from recent investment in new platforms. | • Challenges achieving strategic repositioning; • Deferral or non-occurrence of forecast interest rate rises; and • Slower than expected growth in assets under management. | • Cash flow projections decrease by 20%. | ||||||
Discount rate | • Discount rate used is a reasonable estimate of a suitable market rate for the profile of the business. | • External evidence arises to suggest that the rate used is not appropriate to the business. | • Discount rate increases by 60bps based on observable broker estimates for private banking focused institutions. | |||||||
| Long-term growth rates | • Business growth will reflect GDP growth rates in the long term. | • Growth does not match GDP or GDP forecasts fall. | • Real GDP growth does not occur or is not reflected in performance. | |||||||
| Global Banking and Markets – Europe | Cash flow projections | • Level of interest rates; and • Recovery of European markets over the forecast period. | • Deferral or non-occurrence of forecast interest rate rises; • Lower than expected growth in key markets; and • The impact of regulatory changes, including the ring fencing of the UK retail bank. | • Cash flow projections decrease by 20%. | ||||||
Discount rate | • Discount rate used is a reasonable estimate of a suitable market rate for the profile of the business. | • External evidence arises to suggest that the rate used is not appropriate to the business. | • Discount rate increases by 110 basis points, based on the high end of the range of broker estimates for comparator European banks with significant investment banking operations. | |||||||
| Long-term growth rates | • Business growth will reflect GDP growth rates in the long term. | • Growth does not match GDP or GDP forecasts fall. | • Real GDP growth does not occur or is not reflected in performance. | |||||||
| Global Banking and Markets – North America | Cash flow projections | • Level of interest rates; • Growth in NAFTA, China, and other major trade corridors; • Product and sales enhancements to increase market share; and • Increased collaboration with the CMB business to capture further opportunities from existing clients. | • Deferral or non-occurrence of forecast interest rate rises; and • Lower than expected growth in key markets. | • Cash flow projections decrease by 20%. | ||||||
Discount rate | • Discount rate used is a reasonable estimate of a suitable market rate for the profile of the business. | • External evidence arises to suggest that the rate used is not appropriate to the business. | • Discount rate increases by 100 basis points, based on the high end of the range of broker estimates for comparator US banks with significant investment banking operations. | |||||||
| Long-term growth rates | • Business growth will reflect GDP growth rates in the long term. | • Growth does not match GDP or GDP forecasts fall. | • Real GDP growth does not occur or is not reflected in performance. | |||||||
| Retail Banking and Wealth Management – Latin America | Cash flow projections | • Growth in lending and deposit volumes; and • Credit quality of loan portfolios. | • Unfavourable economic conditions; and • Competitive pricing constraining margins. | • Management has determined that a reasonably possible change in any of the key assumptions would not cause an impairment to be recognised. | ||||||
HSBC HOLDINGS PLC
409 |
Table of Contents
Notes on the Financial Statements(continued)
20 – Goodwill and intangible assets
The following table presents the sensitivities of the VIU for each sensitive CGU to the reasonably possible adverse changes in the assumptions set out above:
Sensitivity of VIU to reasonably possible changes in key assumptions
| Reasonably possible change in key assumptions and impact on VIU | ||||||||||||||||||||||||||||||||||||||
Carrying amount $bn | Value in use $bn | Discount rate bps | Impact on VIU $bn | Cash flows % | Impact on VIU $bn | Long-term growth rate bps | Impact on VIU $bn | Cumulative impact of all changes $bn | ||||||||||||||||||||||||||||||
Cash-generating unit | ||||||||||||||||||||||||||||||||||||||
Global Private Banking | ||||||||||||||||||||||||||||||||||||||
– Europe1 | 4.6 | 5.2 | 60 | (0.5 | ) | (20 | ) | (1.0 | ) | (76 | ) | (0.5 | ) | (1.8 | ) | |||||||||||||||||||||||
Global Banking and Markets | ||||||||||||||||||||||||||||||||||||||
– Europe2 | 20.9 | 27.1 | 110 | (3.9 | ) | (20 | ) | (5.4 | ) | (213 | ) | (5.6 | ) | (11.9 | ) | |||||||||||||||||||||||
Global Banking and Markets | ||||||||||||||||||||||||||||||||||||||
– North America1 | 13.8 | 14.8 | 100 | (2.2 | ) | (20 | ) | (3.0 | ) | (215 | ) | (3.3 | ) | (6.6 | ) | |||||||||||||||||||||||
| 1 | As at 31 December 2015. |
| 2 | As at 1 July 2015. |
The following table presents for each sensitive CGU, the change required to individual current assumptions to reduce headroom to nil (breakeven).
Changes to current assumptions to achieve nil headroom
| Increase/(decrease) | ||||||||||||||
Discount rate bps | Cash flow % | Long-term growth rate bps | ||||||||||||
Cash-generating unit | ||||||||||||||
Global Private Banking – Europe1 | 69 | (11.2 | ) | (86 | ) | |||||||||
Global Banking and Markets – Europe2 | 193 | (23.0 | ) | (245 | ) | |||||||||
Global Banking and Markets – North America1 | 41 | (6.7 | ) | (50 | ) | |||||||||
| 1 | As at 31 December 2015. |
| 2 | As at 1 July 2015. |
Intangible assets
Accounting policy
Intangible assets are recognised, and those that are acquired in a business combination are distinguished from goodwill, when they are separable or arise from contractual or other legal rights, and it is probable that future economic benefits will flow to HSBC, the cost of which can be measured reliably.
Intangible assets include the present value of in-force long-term insurance business and long-term investment contracts with discretionary participating features (‘PVIF’), computer software, trade names, mortgage servicing rights, customer lists, core deposit relationships, credit card customer relationships and merchant or other loan relationships. Computer software includes both purchased and internally generated software. The cost of internally generated software comprises all directly attributable costs necessary to create, produce and prepare the software to be capable of operating in the manner intended by management. Costs incurred in the ongoing maintenance of software are expensed immediately as incurred.
Intangible assets are subject to impairment review if there are events or changes in circumstances that indicate that the carrying amount may not be recoverable. Where:
• intangible assets have an indefinite useful life, or are not yet ready for use, they are tested for impairment annually. An intangible asset recognised during the current period is tested before the end of the current year; and where
• intangible assets have a finite useful life, except for PVIF, they are stated at cost less amortisation and accumulated impairment losses and are amortised over their estimated useful lives. Estimated useful life is the lower of legal duration and expected useful life.
Intangible assets with finite useful lives are generally amortised, on a straight-line basis, over their useful lives as follows: | ||
Trade names | 10 years | |
Mortgage servicing rights | between 5 and 12 years | |
Internally generated software |
between 3 and 5 years | |
Purchased software | between 3 and 5 years | |
Customer/merchant relationships
| between 3 and 10 years
| |
Other
| 10 years
| |
HSBC HOLDINGS PLC
410 |
Table of Contents
Present value of in-force long-term insurance business
The value placed on insurance contracts that are classified as long-term insurance business or long-term investment contracts with discretionary participating features (‘DPF’) and are in force at the balance sheet date is recognised as an asset. The asset represents the present value of the equity holders’ interest in the issuing insurance companies’ profits expected to emerge from these contracts written at the balance sheet date. The PVIF is determined by discounting the equity holders’ interest in future profits expected to emerge from business currently in force using appropriate assumptions in assessing factors such as future mortality, lapse rates and levels of expenses, and a risk discount rate that reflects the risk premium attributable to the respective contracts. The PVIF incorporates allowances for both non-market risk and the value of financial options and guarantees. The PVIF asset is presented gross of attributable tax in the balance sheet and movements in the PVIF asset are included in ‘Other operating income’ on a gross of tax basis.
|
Present value of in-force long-term insurance business
Movements in PVIF
| 2015 | 2014 | |||||||||||
| $m | $m | |||||||||||
PVIF at 1 January | 5,307 | 5,335 | ||||||||||
Change in PVIF of long-term insurance business | 799 | 261 | ||||||||||
Value of new business written during the year1 | 809 | 870 | ||||||||||
Movements arising from in-force business: | ||||||||||||
– expected return | (552 | ) | (545 | ) | ||||||||
– experience variances2 | 15 | 62 | ||||||||||
– changes in operating assumptions | 129 | (69 | ) | |||||||||
Investment return variances | 222 | (34 | ) | |||||||||
Changes in investment assumptions | 138 | (75 | ) | |||||||||
Other adjustments | 38 | 52 | ||||||||||
Transfer of assets classified as held for sale3 | (219 | ) | (122 | ) | ||||||||
Exchange differences and other | (202 | ) | (167 | ) | ||||||||
PVIF at 31 December | 5,685 | 5,307 | ||||||||||
| 1 | ‘Value of new business written during the year’ is the present value of the projected stream of profits from the business. |
| 2 | ‘Experience variances’ includes the effect of the difference between demographic, expense and persistency assumptions used in the previous PVIF calculation and actual experience observed during the year to the extent this affects profits on future business. |
| 3 | Relates to the Brazilian insurance operations and the UK pensions business which were classified as held for sale in the first half of 2015 and 2014 respectively. See page 180 for further details. |
In the PVIF calculation, expected cash flows are projected after adjusting for a variety of assumptions made by each insurance operation to reflect local market conditions and management’s judgement of future trends, and after applying risk margins to reflect any uncertainty in the underlying assumptions. Variations in actual experience and changes to assumptions can contribute to volatility in the results of the insurance business.
The key drivers of the movement in the value of the PVIF asset are the expected cash flows from:
| • | new business adjusted for anticipated maturities and assumptions relating to policyholder behaviour (‘value of new business written during the year’); |
| • | unwind of the discount rate less the reversal of expected cash flows for the period (‘expected return’); |
| • | changes in non-economic operating assumptions such as mortality or lapse rates (‘changes in operating assumptions’); |
| • | the effects of changes in projected future cash flows associated with operating assumption experience variances compared with those assumed at the start of the period (‘experience variances’); |
| • | changes related to future investment returns (‘changes in investment assumptions’); and |
| • | the effect of actual investment experience on existing assets compared with the assumptions at the start of the period (‘investment return variances’). |
The valuation of the PVIF asset includes explicit risk margins for non-economic risks in the projection assumptions and explicit allowances for financial options and guarantees using stochastic methods. Risk discount rates are set on an active basis with reference to market risk-free yields.
HSBC HOLDINGS PLC
411 |
Table of Contents
Notes on the Financial Statements(continued)
20 – Goodwill and intangible assets
Key assumptions used in the computation of PVIF for main life insurance operations
Economic assumptions are either set in a way that is consistent with observable market values or, in certain markets (including those where the risk free curve is not observable at tenors matching the duration of our insurance contract liabilities) use is made of long-term economic assumptions. Setting such assumptions involves the projection of long-term interest rates and the time horizon over which observable rates tend towards these long-term assumptions. The assumptions are informed by relevant historical data and by research and analysis performed by the Group’s Economic Research team and external experts, including regulatory bodies. The valuation of PVIF will be sensitive to any changes in these long-term assumptions in the same way that it is sensitive to observed market movements, and the impact of such changes is included in the sensitivities presented below.
| 2015 | 2014 | |||||||||||||||||||||||||||
| UK | Hong Kong | France1 | UK | Hong Kong | France1 | |||||||||||||||||||||||
| % | % | % | % | % | % | |||||||||||||||||||||||
Weighted average risk free rate | 1.75 | 1.82 | 1.57 | 1.65 | 1.86 | 1.21 | ||||||||||||||||||||||
Weighted average risk discount rate | 2.25 | 6.81 | 2.55 | 2.15 | 7.42 | 1.73 | ||||||||||||||||||||||
Expense inflation | 4.56 | 3.00 | 1.70 | 4.67 | 3.00 | 2.00 | ||||||||||||||||||||||
| 1 | For 2015, the calculation of France’s PVIF assumes a risk discount rate of 2.55% (2014: 1.73%) plus a risk margin of $51m (2014: $63m). |
Sensitivity to changes in economic assumptions
The Group sets the risk discount rate applied to the PVIF calculation by starting from a risk-free rate curve and adding explicit allowances for risks not reflected in the best estimate cash flow modelling. Where shareholders provide options and guarantees to policyholders the cost of these options and guarantees is an explicit reduction to PVIF, unless it is already allowed for as an explicit addition to the technical provisions required by regulators. See page 184 for further details of these guarantees.
The following table shows the effect on the PVIF of reasonably possible changes in the main economic assumption,risk-free rates, across all insurance manufacturing subsidiaries. Due to certain characteristics of the contracts, the relationships are non-linear and the results of the sensitivity testing should not be extrapolated to higher levels of stress. For the same reason, the impact of the stress is not symmetrical on the upside and downside. The sensitivities shown are before actions that could be taken by management to mitigate effects and allow for adverse changes in policyholder behaviour. The sensitivities have decreased from 2014 to 2015, driven mainly by rising yields and updates to interest rate parameters in France during 2015. In a low yield environment the PVIF asset is particularly sensitive to yield curve movements driven by the projected cost of options and guarantees described on page 184.
| 2015 | 2014 | |||||||||||
| $m | $m | |||||||||||
Effect on PVIF at 31 December of: | ||||||||||||
+100 basis point shift in risk-free rate | (3 | ) | 320 | |||||||||
–100 basis point shift in risk-free rate1 | (139 | ) | (589 | ) | ||||||||
| 1 | Where a–100 basis point parallel shift in the risk-free rate would result in a negative rate, the effect on PVIF has been calculated using a minimum rate of 0%. |
Sensitivity to changes in non-economic assumptions
Policyholder liabilities and PVIF for life manufacturers are determined by reference to non-economic assumptions including mortality and/or morbidity, lapse rates and expense rates. The table below shows the sensitivity of PVIF to reasonably possible changes in these non-economic assumptions at 31 December across all our insurance manufacturing subsidiaries.
| 2015 | 2014 | |||||||||||
| $m | $m | |||||||||||
Effect on PVIF at 31 December of: | ||||||||||||
10% increase in mortality and/or morbidity rates | (73 | ) | (66 | ) | ||||||||
10% decrease in mortality and/or morbidity rates | 77 | 70 | ||||||||||
10% increase in lapse rates | (127 | ) | (146 | ) | ||||||||
10% decrease in lapse rates | 144 | 165 | ||||||||||
10% increase in expense rates | (83 | ) | (93 | ) | ||||||||
10% decrease in expense rates | 83 | 94 | ||||||||||
HSBC HOLDINGS PLC
412 |
Table of Contents
Other intangible assets
Movement of intangible assets excluding goodwill and the PVIF
Internally generated software | Other | Total | ||||||||||||||||
| $m | $m | $m | ||||||||||||||||
Cost | ||||||||||||||||||
At 1 January 2015 | 6,413 | 2,863 | 9,276 | |||||||||||||||
Additions | 857 | 114 | 971 | |||||||||||||||
Disposals | (134 | ) | (159 | ) | (293 | ) | ||||||||||||
Amount written off | (238 | ) | (2 | ) | (240 | ) | ||||||||||||
Reclassified to held for sale | (239 | ) | (452 | ) | (691 | ) | ||||||||||||
Other changes | (292 | ) | (184 | ) | (476 | ) | ||||||||||||
At 31 December 2015 | 6,367 | 2,180 | 8,547 | |||||||||||||||
Accumulated amortisation | ||||||||||||||||||
At 1 January 2015 | (4,286 | ) | (1,889 | ) | (6,175 | ) | ||||||||||||
Charge for the year1 | (686 | ) | (142 | ) | (828 | ) | ||||||||||||
Impairment | (149 | ) | 15 | (134 | ) | |||||||||||||
Disposals | 128 | 147 | 275 | |||||||||||||||
Amount written off | 238 | 2 | 240 | |||||||||||||||
Reclassified to held for sale | 141 | 250 | 391 | |||||||||||||||
Other changes | 181 | 120 | 301 | |||||||||||||||
At 31 December 2015 | (4,433 | ) | (1,497 | ) | (5,930 | ) | ||||||||||||
Net carrying amount at 31 December 2015 | 1,934 | 683 | 2,617 | |||||||||||||||
Cost | ||||||||||||||||||
At 1 January 2014 | 5,999 | 2,975 | 8,974 | |||||||||||||||
Additions | 732 | 177 | 909 | |||||||||||||||
Disposals | (35 | ) | (80 | ) | (115 | ) | ||||||||||||
Amount written off | (24 | ) | (53 | ) | (77 | ) | ||||||||||||
Other changes | (259 | ) | (156 | ) | (415 | ) | ||||||||||||
At 31 December 2014 | 6,413 | 2,863 | 9,276 | |||||||||||||||
Accumulated amortisation | ||||||||||||||||||
At 1 January 2014 | (3,809 | ) | (1,761 | ) | (5,570 | ) | ||||||||||||
Charge for the year1 | (677 | ) | (261 | ) | (938 | ) | ||||||||||||
Impairment | (11 | ) | (54 | ) | (65 | ) | ||||||||||||
Disposals | 32 | 77 | 109 | |||||||||||||||
Amount written off | 24 | 53 | 77 | |||||||||||||||
Other changes | 155 | 57 | 212 | |||||||||||||||
At 31 December 2014 | (4,286 | ) | (1,889 | ) | (6,175 | ) | ||||||||||||
Net carrying amount at 31 December 2014 | 2,127 | 974 | 3,101 | |||||||||||||||
| 1 | The amortisation charge for the year is recognised within the income statement under ‘Amortisation and impairment of intangible assets’, with the exception of the amortisation of mortgage servicing rights which is recognised in ‘Net fee income’. The revaluation net of amortisation charge for mortgage servicing rights was $25m in 2015 (2014: charge of $67m). |
HSBC HOLDINGS PLC
413 |
Table of Contents
Notes on the Financial Statements(continued)
21 – Investments in subsidiaries
21 Investments in subsidiaries
Accounting policy
HSBC classifies investments in entities which it controls as subsidiaries. HSBC’s consolidation policy is described in Note 1(g). Subsidiaries which are structured entities are covered in Note 39.
HSBC Holdings’ investments in subsidiaries are stated at cost less impairment losses. Impairment losses recognised in prior periods are reversed through the income statement if there has been a change in the estimates used to determine the investment’s recoverable amount since the last impairment loss was recognised.
|
Principal subsidiaries of HSBC Holdings
| At 31 December 2015 | ||||||||||||||||||
Country of incorporation or registration | HSBC’s interest in equity capital % | Issued equity capital | Share class | |||||||||||||||
Europe | ||||||||||||||||||
HSBC Bank plc | England | 100 | £797m | Ordinary £1 Preferred Ordinary £1 Series 2 Third Dollar Preference $0.01 Third Dollar Preference $0.01 | ||||||||||||||
HSBC France | France | 99.99 | €337m | Shares €5.00 | ||||||||||||||
HSBC Private Banking Holdings (Suisse) SA | Switzerland | 100 | CHF1,363m | Ordinary CHF1,000 | ||||||||||||||
HSBC Trinkaus & Burkhardt AG | Germany | 80.65 | €75.4m | Shares of no par value | ||||||||||||||
Asia | ||||||||||||||||||
Hang Seng Bank Limited1 | Hong Kong | 62.14 | HK$9,658m | Ordinary no par value | ||||||||||||||
HSBC Bank Australia Limited | Australia | 100 | A$811m | Ordinary no par value | ||||||||||||||
HSBC Bank (China) Company Limited | PRC | 5 | 100 | RMB15,400m | Ordinary CNY1.00 | |||||||||||||
HSBC Bank Malaysia Berhad | Malaysia | 100 | RM115m | Ordinary RM0.50 | ||||||||||||||
HSBC Bank (Taiwan) Limited | Taiwan | 100 | TWD34,800m | Ordinary TWD10.00 | ||||||||||||||
HSBC Life (International) Limited | Bermuda | 100 | HK$4,178m | Ordinary HK$1.00 | ||||||||||||||
The Hongkong and Shanghai Banking Corporation Limited | Hong Kong | 100 | HK$96,052m | Ordinary no par value CIP2 $1.00 CRP3 $1.00 NIP4 $1.00 | ||||||||||||||
Middle East and North Africa | ||||||||||||||||||
HSBC Bank Middle East Limited | Jersey | 100 | $931m | Ordinary $1.00 CRP3 $1.00 | ||||||||||||||
HSBC Bank Egypt S.A.E. | Egypt | 94.53 | EGP2,796m | Ordinary EGP84.00 | ||||||||||||||
North America | ||||||||||||||||||
HSBC Bank Canada | Canada | 100 | C$1,225m | Common shares of no par value | ||||||||||||||
| C$500m | Preference shares of no par value | |||||||||||||||||
HSBC Bank USA, N.A. | USA | 100 | $2m | Common $100 | ||||||||||||||
HSBC Finance Corporation | USA | 100 | – | 6 | Common $0.01 | |||||||||||||
HSBC Securities (USA) Inc. | USA | 100 | – | 6 | Common $0.05 | |||||||||||||
Latin America | ||||||||||||||||||
HSBC Bank Brasil S.A. – Banco Múltiplo | Brazil | 100 | BRL6,402m | Shares of no par value | ||||||||||||||
HSBC Mexico, S.A., Institución de Banca Múltiple, Grupo Financiero HSBC | Mexico | 99.99 | MXN5,681m | Ordinary MXN2.00 | ||||||||||||||
1 Listed in Hong Kong. | 3 Cumulative Redeemable Preference shares. | 5 People’s Republic of China. | ||
2 Cumulative Irredeemable Preference shares. | 4 Non-cumulative Irredeemable Preference shares. | 6 Issued equity capital is less than $1m. |
Details of the debt, subordinated debt and preference shares issued by the principal subsidiaries to parties external to the Group are included in Notes 26 ‘Debt securities in issue’, 30 ‘Subordinated liabilities’ and 34 ‘Non-controlling interests’, respectively.
All the above subsidiaries are included in the HSBC consolidated financial statements.
HSBC HOLDINGS PLC
414 |
Table of Contents
Details of all HSBC subsidiaries, as required under Section 409 of the Companies Act 2006, are set out on pages 458 to 469. The principal countries of operation are the same as the countries of incorporation except for HSBC Bank Middle East Limited, which operates mainly in the Middle East and North Africa, and HSBC Life (International) Limited, which operates mainly in Hong Kong.
HSBC is structured as a network of regional banks and locally incorporated regulated banking entities. Each bank is separately capitalised in accordance with applicable prudential requirements and maintains a capital buffer consistent with the Group’s risk appetite for the relevant country or region. HSBC’s capital management process culminates in the annual Group capital plan, which is approved by the Board.
HSBC Holdings is the primary provider of equity capital to its subsidiaries and also provides them with non-equity capital where necessary. These investments are substantially funded by HSBC Holdings’ issuance of equity and non-equity capital and by profit retention. As part of its capital management process, HSBC Holdings seeks to maintain a balance between the composition of its capital and its investment in subsidiaries. Subject to this, there is no current or foreseen impediment to HSBC Holdings’ ability to provide funding for such investments. The ability of subsidiaries to pay dividends or advance monies to HSBC Holdings depends on, among other things, their respective local regulatory capital and banking requirements, exchange controls, statutory reserves, and financial and operating performance. During 2015, none of the Group’s subsidiaries experienced significant restrictions on paying dividends or repaying loans and advances. Also, there are no foreseen restrictions envisaged by our subsidiaries, with the exception of HSBC North America Holdings Inc., on paying dividends or repaying loans and advances.
The amount of guarantees by HSBC Holdings in favour of other HSBC Group entities is set out in Note 37.
Structured entities consolidated by HSBC where HSBC owns less than 50% of the voting rights
| Carrying value of total consolidated assets | Nature of SPE | |||||||||||||||
| 2015 | 2014 | |||||||||||||||
| $bn | $bn | |||||||||||||||
Solitaire Funding Ltd | 7.3 | 9.0 | Securities investment conduit | |||||||||||||
Mazarin Funding Limited | 1.9 | 3.9 | Securities investment conduit | |||||||||||||
Barion Funding Limited | 1.1 | 2.0 | Securities investment conduit | |||||||||||||
Malachite Funding Limited | 0.4 | 1.4 | Securities investment conduit | |||||||||||||
HSBC Home Equity Loan Corporation I | – | 1.9 | Securitisation | |||||||||||||
HSBC Home Equity Loan Corporation II | 1.6 | 0.9 | Securitisation | |||||||||||||
Regency Assets Limited | 15.2 | 11.0 | Conduit | |||||||||||||
In addition to the above, HSBC consolidates a number of individually insignificant structured entities with total assets of $17.9bn (2014: $22.9bn). For further details, see Note 39.
In each of the above cases, HSBC controls and consolidates an entity when it is exposed, or has rights, to variable returns from its involvement with the entity and has the ability to affect those returns through its power over the entity.
Subsidiaries with significant non-controlling interests
| 2015 | 2014 | |||||||||||
Hang Seng Bank Limited | ||||||||||||
Proportion of ownership interests and voting rights held by non-controlling interests | 37.86 | % | 37.86 | % | ||||||||
Place of business | Hong Kong | Hong Kong | ||||||||||
| $m | $m | |||||||||||
Profit attributable to non-controlling interests | 1,364 | 760 | ||||||||||
Accumulated non-controlling interests of the subsidiary | 5,866 | 5,765 | ||||||||||
Dividends paid to non-controlling interests | 523 | 513 | ||||||||||
Summarised financial information: | ||||||||||||
– total assets | 169,813 | 160,769 | ||||||||||
– total liabilities | 153,458 | 144,642 | ||||||||||
– net operating income before loan impairment | 5,411 | 3,687 | ||||||||||
– profit for the year | 3,604 | 2,007 | ||||||||||
– total comprehensive income for the year | 1,636 | 4,460 | ||||||||||
HSBC HOLDINGS PLC
415 |
Table of Contents
Notes on the Financial Statements(continued)
22 – Prepayments / 23 – Assets held for sale and disposal groups / 24 – Trading liabilities
22Prepayments, accrued income and other assets
| 2015 | 2014 | |||||||||||
| $m | $m | |||||||||||
Prepayments and accrued income | 7,765 | 10,554 | ||||||||||
Bullion | 11,501 | 15,726 | ||||||||||
Endorsements and acceptances | 9,149 | 10,775 | ||||||||||
Reinsurers’ share of liabilities under insurance contracts (Note 28) | 1,378 | 1,032 | ||||||||||
Employee benefit assets (Note 6) | 5,272 | 5,028 | ||||||||||
Other accounts | 9,410 | 13,882 | ||||||||||
Property, plant and equipment | 9,923 | 10,532 | ||||||||||
At 31 December | 54,398 | 67,529 | ||||||||||
Prepayments, accrued income and other assets included $25,310m (2014: $33,889m) of financial assets, the majority of which were measured at amortised cost.
23Assets held for sale and liabilities of disposal groups held for sale
Accounting policy
Assets held for sale
Assets and liabilities of disposal groups and non-current assets are classified as held for sale when their carrying amounts will be recovered
Immediately before the initial classification as held for sale, the carrying amounts of the relevant assets and liabilities are measured in accordance
|
| 2015 | 2014 | |||||||||||
| $m | $m | |||||||||||
Held for sale at 31 December | ||||||||||||
Disposal groups | 41,715 | 6,883 | ||||||||||
Non-current assets held for sale | 2,185 | 764 | ||||||||||
Total assets | 43,900 | 7,647 | ||||||||||
Liabilities of disposal groups | 36,840 | 6,934 | ||||||||||
Disposal groups
Brazil
In the first half of 2015, we announced the plan to sell our operations in Brazil. At 31 December 2015, the sale was considered highly probable and therefore the assets and liabilities of the disposal group were classified as held for sale. The disposal group includes the assets and liabilities expected to be sold plus allocated goodwill as set out in the table on page 417.
The disposal group is measured at its carrying amount at 31 December 2015, which is lower than its fair value less cost to sell. The carrying amount includes a $1.3bn deferred tax asset and $1.3bn of allocated goodwill (see Note 20). The assets and liabilities of the disposal group have been reclassified from their individual lines in the consolidated balance sheet and are presented in separate ‘Held for sale’ lines at 31 December 2015. There is no change to the comparative balance sheet presentation and there is no separate presentation in the income statement.
At 31 December 2015, there were no significant accounting implications in respect of the planned sale although this may evolve as it progresses. The disposal group represents a foreign operation and when the disposal completes the cumulative amount of associated exchange differences previously recognised in other comprehensive income will be reclassified to the income statement. At 31 December 2015, there was a cumulative loss of $2.6bn in the Group’s foreign exchange reserve attributable to the Brazilian operations.
HSBC HOLDINGS PLC
416 |
Table of Contents
The major classes of assets and associated liabilities of disposal groups held for sale are as follows:
| Brazil | Other | Total | ||||||||||||||||
| $m | $m | $m | ||||||||||||||||
Assets of disposal groups held for sale | ||||||||||||||||||
Trading assets | 55 | – | 55 | |||||||||||||||
Fair value of financial assets designated at fair value | 3,123 | – | 3,123 | |||||||||||||||
Loans and advances to banks | 4,068 | – | 4,068 | |||||||||||||||
Loans and advances to customers | 17,001 | 40 | 17,041 | |||||||||||||||
Reverse repurchase agreements | 3,511 | – | 3,511 | |||||||||||||||
Financial investments | 6,238 | – | 6,238 | |||||||||||||||
Goodwill and intangible assets | 1,680 | – | 1,680 | |||||||||||||||
Deferred tax asset1 | 1,325 | – | 1,325 | |||||||||||||||
Prepayments, accrued income and other assets | 4,674 | – | 4,674 | |||||||||||||||
Total assets at 31 December 2015 | 41,675 | 40 | 41,715 | |||||||||||||||
Liabilities of disposal groups held for sale | ||||||||||||||||||
Deposits by banks | 1,521 | – | 1,521 | |||||||||||||||
Customer accounts | 15,094 | 1,588 | 16,682 | |||||||||||||||
Debt securities in issue | 7,957 | – | 7,957 | |||||||||||||||
Liabilities under insurance contracts | 3,338 | – | 3,338 | |||||||||||||||
Accruals, deferred income and other liabilities | 7,335 | 7 | 7,342 | |||||||||||||||
Total liabilities at 31 December 2015 | 35,245 | 1,595 | 36,840 | |||||||||||||||
Expected date of completion | First Half of 2016 | First Half of 2016 | ||||||||||||||||
Operating segment | Latin America | North America | ||||||||||||||||
Fair value of selected financial instruments which are not carried at fair value on the balance sheet at 31 December 2015 | ||||||||||||||||||
Loans and advances to banks and customers | 20,912 | 40 | 20,952 | |||||||||||||||
Customer accounts | 15,094 | 1,588 | 16,682 | |||||||||||||||
| 1 | The recognition of deferred tax assets relies on an assessment of the probability and sufficiency of future taxable profits and future reversals of existing taxable temporary differences. In recognising the deferred tax asset management has critically assessed all available information, including sufficiency of future taxable profits using internal and external benchmarks, and historical performance. |
Accounting policy
Financial liabilities are classified as held for trading if they have been acquired or incurred principally for the purpose of selling or repurchasing in the
Liabilities arising from the sale of borrowed securities are classified as held for trading.
|
Trading liabilities
2015 $m | 2014 $m | |||||||||||
Deposits by banks1 | 27,054 | 41,453 | ||||||||||
Customer accounts1,2 | 40,208 | 50,600 | ||||||||||
Other debt securities in issue (Note 26)3 | 30,525 | 33,602 | ||||||||||
Other liabilities – net short positions in securities | 43,827 | 64,917 | ||||||||||
At 31 December | 141,614 | 190,572 | ||||||||||
| 1 | ‘Deposits by banks’ and ‘Customer accounts’ include repos, settlement accounts, stock lending and other amounts. |
| 2 | Structured deposits placed at HSBC Bank USA and HSBC Trust Company (Delaware) National Association are insured by the Federal Deposit Insurance Corporation, a US government agency, up to $250,000 per depositor. |
| 3 | ‘Other debt securities in issue’ comprises structured notes issued by HSBC for which market risks are actively managed as part of trading portfolios. |
At 31 December 2015, the cumulative amount of change in fair value attributable to changes in HSBC’s credit risk was a gain of $122m (2014: loss of $79m).
HSBC HOLDINGS PLC
417 |
Table of Contents
Notes on the Financial Statements(continued)
25 – Financial liabilities at FV / 26 – Debt securities / 27 – Accruals / 28 – Liabilities under insurance contracts
25Financial liabilities designated at fair value
Accounting policy
The criteria for designating instruments at fair value and their measurement are described in Note 15. The fair value designation, once made, is irrevocable. Designated financial liabilities are recognised when HSBC enters into contracts with counterparties and are normally derecognised when extinguished. Examples of such designations include:
Long-term debt issues
The interest and/or foreign exchange exposure on certain fixed rate debt securities issued has been matched with the interest and/or foreign exchange exposure on certain swaps as part of a documented risk management strategy. An accounting mismatch would arise if the debt securities issued were accounted for at amortised cost, and this mismatch is eliminated through the fair value designation.
Financial liabilities under unit-linked and non-linked investment contracts
HSBC issues contracts to customers that contain insurance risk, financial risk or a combination thereof. A contract under which HSBC accepts insignificant insurance risk from another party is not classified as an insurance contract, but is accounted for as a financial liability. See Note 28 for contracts where HSBC accepts significant insurance risk.
Customer liabilities under linked and certain non-linked investment contracts issued by insurance subsidiaries and the corresponding financial assets are designated at fair value. Liabilities are at least equivalent to the surrender or transfer value which is calculated by reference to the value of the relevant underlying funds or indices. Premiums receivable and amounts withdrawn are accounted for as increases or decreases in the liability recorded in respect of investment contracts. The incremental costs directly related to the acquisition of new investment contracts or renewing existing investment contracts are deferred and amortised over the period during which the investment management services are provided.
|
Financial liabilities designated at fair value – HSBC
| 2015 | 2014 | |||||||||||
| $m | $m | |||||||||||
Deposits by banks and customer accounts | 193 | 160 | ||||||||||
Liabilities to customers under investment contracts | 6,027 | 6,312 | ||||||||||
Debt securities in issue (Note 26) | 37,678 | 46,364 | ||||||||||
Subordinated liabilities (Note 30) | 21,168 | 21,822 | ||||||||||
Preferred securities (Note 30) | 1,342 | 1,495 | ||||||||||
At 31 December | 66,408 | 76,153 | ||||||||||
The carrying amount at 31 December 2015 of financial liabilities designated at fair value was $4,147m more than the contractual amount at maturity (2014: $5,813m more). The cumulative amount of the change in fair value attributable to changes in credit risk was a gain of $158m (2014: loss of $870m).
Financial liabilities designated at fair value – HSBC Holdings
| 2015 | 2014 | |||||||||||
| $m | $m | |||||||||||
Debt securities in issue (Note 26): | ||||||||||||
– owed to third parties | 7,897 | 8,185 | ||||||||||
Subordinated liabilities (Note 30): | ||||||||||||
– owed to third parties | 11,100 | 9,513 | ||||||||||
– owed to HSBC undertakings | 856 | 981 | ||||||||||
At 31 December | 19,853 | 18,679 | ||||||||||
The carrying amount at 31 December 2015 of financial liabilities designated at fair value was $2,127m more than the contractual amount at maturity (2014: $2,694m more). The cumulative amount of the change in fair value attributable to changes in credit risk was a loss of $172m (2014: loss of $520m).
Accounting policy
Financial liabilities for debt securities issued are recognised when HSBC enters into contractual arrangements with counterparties and are initially measured at fair value, which is normally the consideration received, net of directly attributable transaction costs incurred. The subsequent measurement of financial liabilities, other than those measured at fair value through profit or loss and financial guarantees, is at amortised cost, using the effective interest method to amortise the difference between proceeds received, net of directly attributable transaction costs incurred, and the redemption amount over their expected life.
|
HSBC HOLDINGS PLC
418 |
Table of Contents
Debt securities in issue – HSBC
| 2015 | 2014 | |||||||||||
| $m | $m | |||||||||||
Bonds and medium-term notes | 128,348 | 132,539 | ||||||||||
Other debt securities in issue | 28,804 | 43,374 | ||||||||||
| 157,152 | 175,913 | |||||||||||
Of which debt securities in issue reported as: | ||||||||||||
– trading liabilities (Note 24) | (30,525 | ) | (33,602 | ) | ||||||||
– financial liabilities designated at fair value (Note 25) | (37,678 | ) | (46,364 | ) | ||||||||
At 31 December | 88,949 | 95,947 | ||||||||||
Debt securities in issue – HSBC Holdings
| 2015 | 2014 | |||||||||||
| $m | $m | |||||||||||
Debt securities | 8,857 | 9,194 | ||||||||||
Of which debt securities in issue reported as: | ||||||||||||
– financial liabilities designated at fair value (Note 25) | (7,897 | ) | (8,185 | ) | ||||||||
At 31 December | 960 | 1,009 | ||||||||||
27Accruals, deferred income and other liabilities
| 2015 | 2014 | |||||||||||
| $m | $m | |||||||||||
Accruals and deferred income | 11,129 | 15,075 | ||||||||||
Amounts due to investors in funds consolidated by HSBC | 474 | 782 | ||||||||||
Obligations under finance leases | 37 | 67 | ||||||||||
Endorsements and acceptances | 9,135 | 10,760 | ||||||||||
Employee benefit liabilities (Note 6) | 2,809 | 3,208 | ||||||||||
Other liabilities | 14,532 | 16,570 | ||||||||||
At 31 December | 38,116 | 46,462 | ||||||||||
Accruals, deferred income and other liabilities include $29,358m (2014: $39,846m) of financial liabilities, the majority of which are measured at amortised cost.
28Liabilities under insurance contracts
Accounting policy
HSBC issues contracts to customers that contain insurance risk, financial risk or a combination thereof. A contract under which HSBC accepts significant insurance risk from another party by agreeing to compensate that party on the occurrence of a specified uncertain future event, is classified as an insurance contract. An insurance contract may also transfer financial risk, but is accounted for as an insurance contract if the insurance risk is significant.
Liabilities under insurance contracts
Liabilities under non-linked life insurance contracts are calculated by each life insurance operation based on local actuarial principles. Liabilities under unit-linked life insurance contracts are at least equivalent to the surrender or transfer value, which is calculated by reference to the value of the relevant underlying funds or indices.
A liability adequacy test is carried out on insurance liabilities to ensure that the carrying amount of the liabilities is sufficient in the light of current estimates of future cash flows. When performing the liability adequacy test, all contractual cash flows are discounted and compared with the carrying value of the liability. When a shortfall is identified it is charged immediately to the income statement.
Future profit participation on insurance contracts with DPF
Where contracts provide discretionary profit participation benefits to policyholders, liabilities for these contracts include provisions for the future discretionary benefits to policyholders. These provisions reflect the actual performance of the investment portfolio to date and management’s expectation of the future performance of the assets backing the contracts, as well as other experience factors such as mortality, lapses and operational efficiency, where appropriate. This benefit may arise from the contractual terms, regulation, or past distribution policy.
Investment contracts with DPF
While investment contracts with DPF are financial instruments, they continue to be treated as insurance contracts as permitted by IFRS 4 ‘Insurance Contracts’. The Group therefore recognises the premiums for those contracts as revenue and recognises as an expense the resulting increase in the carrying amount of the liability.
In the case of net unrealised investment gains on these contracts, whose discretionary benefits principally reflect the actual performance of the investment portfolio, the corresponding increase in the liabilities is recognised in either the income statement or other comprehensive income, following the treatment of the unrealised gains on the relevant assets. In the case of net unrealised losses, a deferred participating asset is recognised only to the extent that its recoverability is highly probable. Movements in the liabilities arising from realised gains and losses on relevant assets are recognised in the income statement.
|
HSBC HOLDINGS PLC
419 |
Table of Contents
Notes on the Financial Statements(continued)
28 – Liabilities under insurance contracts / 29 – Provisions
Liabilities under insurance contracts
| Gross | Reinsurers’ share | Net | ||||||||||||||||
| $m | $m | $m | ||||||||||||||||
Non-linked insurance contracts1 | ||||||||||||||||||
At 1 January 2015 | 36,973 | (772 | ) | 36,201 | ||||||||||||||
Claims and benefits paid | (3,200 | ) | 153 | (3,047 | ) | |||||||||||||
Increase in liabilities to policyholders | 7,746 | (575 | ) | 7,171 | ||||||||||||||
Disposals/transfers to held-for-sale | (443 | ) | 6 | (437 | ) | |||||||||||||
Exchange differences and other movements | (538 | ) | 73 | (465 | ) | |||||||||||||
At 31 December 2015 | 40,538 | (1,115 | ) | 39,423 | ||||||||||||||
Investment contracts with DPF | ||||||||||||||||||
At 1 January 2015 | 25,068 | – | 25,068 | |||||||||||||||
Claims and benefits paid | (2,101 | ) | – | (2,101 | ) | |||||||||||||
Increase in liabilities to policyholders | 2,728 | – | 2,728 | |||||||||||||||
Exchange differences and other movements2 | (3,086 | ) | – | (3,086 | ) | |||||||||||||
At 31 December 2015 | 22,609 | – | 22,609 | |||||||||||||||
Linked life insurance contracts | ||||||||||||||||||
At 1 January 2015 | 11,820 | (260 | ) | 11,560 | ||||||||||||||
Claims and benefits paid | (1,869 | ) | 64 | (1,805 | ) | |||||||||||||
Increase in liabilities to policyholders | 1,398 | (5 | ) | 1,393 | ||||||||||||||
Disposals/transfers to held-for-sale | (4,594 | ) | – | (4,594 | ) | |||||||||||||
Exchange differences and other movements3 | 36 | (62 | ) | (26 | ) | |||||||||||||
At 31 December 2015 | 6,791 | (263 | ) | 6,528 | ||||||||||||||
Total liabilities to policyholders at 31 December 2015 | 69,938 | (1,378 | ) | 68,560 | ||||||||||||||
Non-linked insurance contracts1 | ||||||||||||||||||
At 1 January 2014 | 33,950 | (1,118 | ) | 32,832 | ||||||||||||||
Claims and benefits paid | (3,575 | ) | 175 | (3,400 | ) | |||||||||||||
Increase in liabilities to policyholders | 7,764 | (409 | ) | 7,355 | ||||||||||||||
Disposals/transfers to held-for-sale | (589 | ) | 527 | (62 | ) | |||||||||||||
Exchange differences and other movements | (577 | ) | 53 | (524 | ) | |||||||||||||
At 31 December 2014 | 36,973 | (772 | ) | 36,201 | ||||||||||||||
Investment contracts with DPF | ||||||||||||||||||
At 1 January 2014 | 26,427 | – | 26,427 | |||||||||||||||
Claims and benefits paid | (2,175 | ) | – | (2,175 | ) | |||||||||||||
Increase in liabilities to policyholders | 3,188 | – | 3,188 | |||||||||||||||
Exchange differences and other movements2 | (2,372 | ) | – | (2,372 | ) | |||||||||||||
At 31 December 2014 | 25,068 | – | 25,068 | |||||||||||||||
Linked life insurance contracts | ||||||||||||||||||
At 1 January 2014 | 13,804 | (290 | ) | 13,514 | ||||||||||||||
Claims and benefits paid | (1,499 | ) | 88 | (1,411 | ) | |||||||||||||
Increase in liabilities to policyholders | 2,762 | 33 | 2,795 | |||||||||||||||
Disposals/transfers to held-for-sale | (2,547 | ) | 74 | (2,473 | ) | |||||||||||||
Exchange differences and other movements3 | (700 | ) | (165 | ) | (865 | ) | ||||||||||||
At 31 December 2014 | 11,820 | (260 | ) | 11,560 | ||||||||||||||
Total liabilities to policyholders at 31 December 2014 | 73,861 | (1,032 | ) | 72,829 | ||||||||||||||
| 1 | ‘Non-linked insurance contracts’ includes liabilities under non-life insurance contracts. |
| 2 | ‘Exchange differences and other movements’ includes movement in liabilities relating to discretionary profit participation benefits due to policyholders arising from net unrealised investment gains recognised in other comprehensive income. |
| 3 | ‘Exchange differences and other movements’ includes amounts arising under reinsurance agreements. |
The increase in liabilities to policyholders represents the aggregate of all events giving rise to additional liabilities to policyholders in the year. The key factors contributing to the movement in liabilities to policyholders included death claims, surrenders, lapses, liabilities to policyholders created at the initial inception of the policies, the declaration of bonuses and other amounts attributable to policyholders.
HSBC HOLDINGS PLC
420 |
Table of Contents
Accounting policy
Provisions are recognised when it is probable that an outflow of economic benefits will be required to settle a present legal or constructive obligation which has arisen as a result of past events and for which a reliable estimate can be made.
| ||||
Critical accounting estimates and judgements
Provisions
Judgement is involved in determining whether a present obligation exists and in estimating the probability, timing and amount of any outflows. Professional expert advice is taken on the assessment of litigation, property (including onerous contracts) and similar obligations.
Provisions for legal proceedings and regulatory matters typically require a higher degree of judgement than other types of provisions. When matters are at an early stage, accounting judgements can be difficult because of the high degree of uncertainty associated with determining whether a present obligation exists, and estimating the probability and amount of any outflows that may arise. As matters progress, management and legal advisers evaluate on an ongoing basis whether provisions should be recognised, revising previous judgements and estimates as appropriate. At more advanced stages, it is typically easier to make judgements and estimates around a better defined set of possible outcomes. However, the amount provisioned can remain very sensitive to the assumptions used. There could be a wide range of possible outcomes for any pending legal proceedings, investigations or inquiries. As a result, it is often not practicable to quantify a range of possible outcomes for individual matters. It is also not practicable to meaningfully quantify ranges of potential outcomes in aggregate for these types of provisions because of the diverse nature and circumstances of such matters and the wide range of uncertainties involved.
Provisions for customer remediation also require significant levels of estimation and judgement. The amounts of provisions recognised depend on a number of different assumptions, for example, the volume of inbound complaints, the projected period of inbound complaint volumes, the decay rate of complaint volumes, the population identified as systemically mis-sold and the number of policies per customer complaint.
| ||||
Provisions
Restructuring costs | Contractual commitments | Legal proceedings and regulatory matters | Customer remediation | Other provisions | Total | |||||||||||||||||||||||||||||||
| $m | $m | $m | $m | $m | $m | |||||||||||||||||||||||||||||||
At 1 January 2015 | 197 | 234 | 2,184 | 1,831 | 552 | 4,998 | ||||||||||||||||||||||||||||||
Additional provisions/increase in provisions | 430 | 120 | 2,153 | 765 | 138 | 3,606 | ||||||||||||||||||||||||||||||
Provisions utilised | (95 | ) | (2 | ) | (619 | ) | (856 | ) | (159 | ) | (1,731 | ) | ||||||||||||||||||||||||
Amounts reversed | (29 | ) | (15 | ) | (95 | ) | (170 | ) | (133 | ) | (442 | ) | ||||||||||||||||||||||||
Unwinding of discounts | – | – | 40 | 6 | – | 46 | ||||||||||||||||||||||||||||||
Exchange differences and other movements | (40 | ) | (97 | ) | (489 | ) | (236 | ) | (63 | ) | (925 | ) | ||||||||||||||||||||||||
At 31 December 2015 | 463 | 240 | 3,174 | 1,340 | 335 | 5,552 | ||||||||||||||||||||||||||||||
At 1 January 2014 | 271 | 177 | 1,832 | 2,382 | 555 | 5,217 | ||||||||||||||||||||||||||||||
Additional provisions/increase in provisions | 147 | 136 | 1,752 | 1,440 | 154 | 3,629 | ||||||||||||||||||||||||||||||
Provisions utilised | (143 | ) | (2 | ) | (1,109 | ) | (1,769 | ) | (112 | ) | (3,135 | ) | ||||||||||||||||||||||||
Amounts reversed | (43 | ) | (46 | ) | (281 | ) | (184 | ) | (66 | ) | (620 | ) | ||||||||||||||||||||||||
Unwinding of discounts | – | 1 | 43 | 10 | 11 | 65 | ||||||||||||||||||||||||||||||
Exchange differences and other movements | (35 | ) | (32 | ) | (53 | ) | (48 | ) | 10 | (158 | ) | |||||||||||||||||||||||||
At 31 December 2014 | 197 | 234 | 2,184 | 1,831 | 552 | 4,998 | ||||||||||||||||||||||||||||||
Further details of ‘Legal proceedings and regulatory matters’ are set out in Note 40. Legal proceedings include civil court, arbitration or tribunal proceedings brought against HSBC companies (whether by way of claim or counterclaim) or civil disputes that may, if not settled, result in court, arbitration or tribunal proceedings. Regulatory matters refer to investigations, reviews and other actions carried out by, or in response to the actions of, regulators or law enforcement agencies in connection with alleged wrongdoing by HSBC.
Further details of ‘Customer remediation’ are set out in this note. ‘Customer remediation’ refers to activities (root cause analysis, customer contact, case reviews, decision making and redress calculations) carried out by HSBC to compensate customers for losses or damages associated with a failure to comply with regulations or to treat customers fairly. Customer remediation is often initiated by HSBC in response to customer complaints and/or industry developments in sales practices, and is not necessarily initiated by regulatory action.
Payment protection insurance
At 31 December 2015, a provision of $1,039m (2014: $1,079m) was held relating to the estimated liability for redress in respect of the possible mis-selling of payment protection insurance (‘PPI’) policies in previous years. An increase in provisions of $549m was recognised during the year, primarily reflecting an increase in inbound complaints by claims management
HSBC HOLDINGS PLC
421 |
Table of Contents
Notes on the Financial Statements(continued)
29 – Provisions / 30 – Subordinated liabilities
companies compared with previous forecasts and management’s current best estimate of the impact on provisions of the FCA consultation on the introduction of a time bar and the 2014 decision of the UK Supreme Court (‘Plevin’). The current projected trend of inbound complaint volumes implies that the redress programme will be completed by the first half of 2018 taking into account the likely impact of a time bar. (2014 assumption: first quarter of 2018). Cumulative provisions made since the Judicial Review ruling in the first half of 2011 amounted to $4.7bn of which $3.6bn had been paid as at 31 December 2015.
The estimated liability for redress is calculated on the basis of total premiums paid by the customer plus simple interest of 8% per annum (or the rate inherent in the related loan product where higher). The basis for calculating the redress liability is the same for single premium and regular premium policies. Future estimated redress levels are based on historically observed redress per policy.
A total of 5.4m PPI policies have been sold by HSBC since 2000, generating estimated revenues of approximately $4.0bn at 2015 average exchange rates. The gross written premiums on these policies was approximately $5.2bn. At 31 December 2015, the estimated total complaints expected to be received was 1.9m, representing 35% of total policies sold. It is estimated that contact will be made with regard to 2.3m policies, representing 42% of total policies sold. This estimate includes inbound complaints as well as HSBC’s proactive contact exercise on certain policies (‘outbound contact’).
The cumulative number of PPI complaints received to 31 December 2015 and the number of future claims expected
| Cumulative to 31 December 2015 | Future expected | |||||||||||
Inbound complaints1 (000s of policies) | 1,215 | 336 | ||||||||||
Outbound contact (000s of policies) | 624 | 101 | ||||||||||
Response rate to outbound contact | 44% | 52% | ||||||||||
Average uphold rate per claim2 | 74% | 81% | ||||||||||
Average redress per claim ($) | 3,058 | 2,844 | ||||||||||
Complaints to FOS (000s of policies) | 121 | 51 | ||||||||||
Average uphold rate per FOS claim | 36% | 53% | ||||||||||
| 1 | Excludes invalid claims where the complainant has not held a PPI policy. |
| 2 | Claims include inbound and responses to outbound contact. |
The main assumptions involved in calculating the redress liability are the volume of inbound complaints, the projected period of inbound complaints, the decay rate of complaint volumes, the population identified as systemically mis-sold and the number of policies per customer complaint. The main assumptions are likely to evolve over time as root cause analysis continues, more experience is available regarding customer-initiated complaint volumes received, and we handle responses to our ongoing outbound contact.
A 100,000 increase/decrease in the total inbound complaints would increase/decrease the redress provision by approximately $221m at 2015 average exchange rates. Each 1% increase/decrease in the response rate to our outbound contact exercise would increase/decrease the redress provision by approximately $15m.
The decision under Plevin held that, judged on its own facts, non-disclosure of the amount of commissions payable in connection with the sale of PPI to a customer created an unfair relationship under the provisions of the UK Consumer Credit Act (‘CCA’). The FCA has issued a consultation on proposed rules and guidelines in relation to the application of this ruling, together with a proposal for the introduction of a time bar. HSBC has reflected its current best estimate of the impact of these matters in the provision held as at 31 December 2015. There remains uncertainty as to what the eventual outcome of the consultation will be: HSBC will continue to review provisioning levels as further facts become known.
In addition to these factors and assumptions, the extent of the required redress will also depend on the facts and circumstances of each individual customer’s case. For these reasons, there is currently a high degree of uncertainty as to the eventual costs of redress.
Interest rate derivatives
At 31 December 2015, a provision of $87m (2014: $312m) was held relating to the estimated liability for redress in respect of the possible mis-selling of interest rate derivatives in the UK. The provision relates to the estimated redress payable to customers in respect of historical payments under derivative contracts. A release to the provision of $38m (2014: $288m increase) was recorded during the year.
UK Consumer Credit Act
HSBC has undertaken a review of compliance with the fixed-sum unsecured loan agreement requirements of the CCA. $167m was recognised at 31 December 2015 within ‘Accruals, deferred income and other liabilities’ for the repayment of interest to customers (2014: $379m), primarily where annual statements did not remind them of their right to partially prepay the loan, notwithstanding that the customer loan documentation did refer to this right. The cumulative liability to date was $569m (2014: $591m), of which payments of $414m (2014: $212m) have been made to customers. There is uncertainty as to whether other technical requirements of the CCA have been met.
HSBC HOLDINGS PLC
422 |
Table of Contents
Brazilian labour, civil and fiscal claims
Brazilian labour, civil and fiscal litigation provisions were $363m (2014: $501m) as at 31 December 2015. Of these provisions, $168m (2014: $246m) was in respect of labour and overtime litigation claims brought by past employees against HSBC operations in Brazil following their departure from the bank. The main assumptions involved in estimating the liability are the expected number of departing employees, individual salary levels and the facts and circumstances of each individual case. These provisions form part of the Brazilian disposal group and were classified as ‘held for sale’ at 31 December 2015 (see Note 23).
HSBC
| 2015 | 2014 | |||||||||||||
| $m | $m | |||||||||||||
Subordinated liabilities | ||||||||||||||
At amortised cost | 22,702 | 26,664 | ||||||||||||
– subordinated liabilities | 20,773 | 22,355 | ||||||||||||
– preferred securities | 1,929 | 4,309 | ||||||||||||
Designated at fair value (Note 25) | 22,510 | 23,317 | ||||||||||||
– subordinated liabilities | 21,168 | 21,822 | ||||||||||||
– preferred securities | 1,342 | 1,495 | ||||||||||||
At 31 December | 45,212 | 49,981 | ||||||||||||
HSBC Holdings | 26,062 | 25,277 | ||||||||||||
Other HSBC | 19,150 | 24,704 | ||||||||||||
At 31 December | 45,212 | 49,981 | ||||||||||||
HSBC’s subordinated liabilities
Subordinated liabilities rank behind senior obligations and generally count towards the capital base of HSBC. Where applicable, capital securities may be called and redeemed by HSBC subject to prior notification to the PRA and, where relevant, the consent of the local banking regulator. If not redeemed at the first call date, coupons payable may step-up or become floating rate based on interbank rates.
Interest rates on the floating rate capital securities are generally related to interbank offered rates. On the remaining capital securities, interest is payable at fixed rates of up to 10.176%.
The balance sheet amounts disclosed below are presented on an IFRSs basis and do not reflect the amount that the instruments contribute to regulatory capital due to the inclusion of issuance costs, regulatory amortisation and regulatory eligibility limits prescribed in the grandfathering provisions under CRD IV.
HSBC’s subordinated liabilities in issue
First call date | Maturity date | 2015 $m | 2014 $m | |||||||||||||||||||||||
Additional tier 1 capital securities guaranteed by HSBC Holdings plc1 | ||||||||||||||||||||||||||
£500m | 8.208% non-cumulative step-up perpetual preferred securities2 | Jun 2015 | – | 779 | ||||||||||||||||||||||
€750m | 5.13% non-cumulative step-up perpetual preferred securities3 | Mar 2016 | 856 | 979 | ||||||||||||||||||||||
$900m | 10.176% non-cumulative step-up perpetual preferred securities, series 2 | Jun 2030 | 891 | 891 | ||||||||||||||||||||||
| 1,747 | 2,649 | |||||||||||||||||||||||||
Additional tier 1 capital securities guaranteed by HSBC Bank plc1 | ||||||||||||||||||||||||||
£300m | 5.862% non-cumulative step-up perpetual preferred securities | Apr 2020 | 488 | 515 | ||||||||||||||||||||||
£700m | 5.844% non-cumulative step-up perpetual preferred securities | Nov 2031 | 1,038 | 1,091 | ||||||||||||||||||||||
| 1,526 | 1,606 | |||||||||||||||||||||||||
Tier 2 securities issued by HSBC Bank plc | ||||||||||||||||||||||||||
£500m | 4.75% callable subordinated notes4 | Sep 2015 | Sep 2020 | – | 802 | |||||||||||||||||||||
£350m | 5.00% callable subordinated notes5 | Mar 2018 | Mar 2023 | 562 | 605 | |||||||||||||||||||||
£300m | 6.50% subordinated notes | – | Jul 2023 | 444 | 466 | |||||||||||||||||||||
£350m | 5.375% callable subordinated step-up notes6 | Nov 2025 | Nov 2030 | 569 | 620 | |||||||||||||||||||||
£500m | 5.375% subordinated notes | – | Aug 2033 | 846 | 905 | |||||||||||||||||||||
£225m | 6.25% subordinated notes | – | Jan 2041 | 332 | 349 | |||||||||||||||||||||
£600m | 4.75% subordinated notes | – | Mar 2046 | 879 | 924 | |||||||||||||||||||||
€500m | Callable subordinated floating rate notes4 | Sep 2015 | Sep 2020 | – | 588 | |||||||||||||||||||||
$300m | 7.65% subordinated notes | – | May 2025 | 386 | 400 | |||||||||||||||||||||
$750m | Undated floating rate primary capital notes | Jun 1990 | 750 | 750 | ||||||||||||||||||||||
$500m | Undated floating rate primary capital notes | Sep 1990 | 500 | 500 | ||||||||||||||||||||||
$300m | Undated floating rate primary capital notes, series 3 | Jun 1992 | 300 | 300 | ||||||||||||||||||||||
| 5,568 | 7,209 | |||||||||||||||||||||||||
HSBC HOLDINGS PLC
423 |
Table of Contents
Notes on the Financial Statements(continued)
30 – Subordinated liabilities
First call date | Maturity date | 2015 $m | 2014 $m | |||||||||||||||||||
Tier 2 securities issued by The Hongkong and Shanghai Banking Corporation Ltd |
| |||||||||||||||||||||
$400m | Primary capital undated floating rate notes7 | Aug 1990 | 401 | 403 | ||||||||||||||||||
$400m | Primary capital undated floating rate notes (second series)8 | Dec 1990 | – | 401 | ||||||||||||||||||
$400m | Primary capital undated floating rate notes (third series) | Jul 1991 | 400 | 400 | ||||||||||||||||||
| 801 | 1,204 | |||||||||||||||||||||
Tier 2 securities issued by HSBC Bank Australia Limited | ||||||||||||||||||||||
AUD200m | Callable subordinated floating rate notes9 | Nov 2015 | Nov 2020 | – | 164 | |||||||||||||||||
| – | 164 | |||||||||||||||||||||
Tier 2 securities issued by HSBC Bank Malaysia Berhad | ||||||||||||||||||||||
MYR500m | 4.35% subordinated bonds | Jun 2017 | Jun 2022 | 116 | 143 | |||||||||||||||||
MYR500m | 5.05% subordinated bonds | Nov 2022 | Nov 2027 | 116 | 144 | |||||||||||||||||
| 232 | 287 | |||||||||||||||||||||
Tier 2 securities issued by HSBC USA Inc. | ||||||||||||||||||||||
$200m | 7.808% capital securities10 | Dec 2006 | Dec 2026 | – | 200 | |||||||||||||||||
$200m | 8.38% capital securities10 | May 2007 | May 2027 | – | 200 | |||||||||||||||||
$150m | 7.75% Capital Trust pass through securities10 | Nov 2006 | Nov 2026 | – | 150 | |||||||||||||||||
$750m | 5.00% subordinated notes | – | Sep 2020 | 747 | 738 | |||||||||||||||||
$250m | 7.20% subordinated debentures | – | Jul 2097 | 220 | 216 | |||||||||||||||||
| Other subordinated liabilities each less than $150m11 | 299 | 297 | ||||||||||||||||||||
| 1,266 | 1,801 | |||||||||||||||||||||
Tier 2 securities issued by HSBC Bank USA, N.A. | ||||||||||||||||||||||
$500m | 6.00% subordinated notes | – | Aug 2017 | 502 | 508 | |||||||||||||||||
$1,250m | 4.875% subordinated notes | – | Aug 2020 | 1,258 | 1,210 | |||||||||||||||||
$1,000m | 5.875% subordinated notes | – | Nov 2034 | 1,142 | 1,245 | |||||||||||||||||
$750m | 5.625% subordinated notes | – | Aug 2035 | 850 | 934 | |||||||||||||||||
$700m | 7.00% subordinated notes | – | Jan 2039 | 691 | 676 | |||||||||||||||||
| 4,443 | 4,573 | |||||||||||||||||||||
Tier 2 securities issued by HSBC Finance Corporation | ||||||||||||||||||||||
$1,000m | 5.911% trust preferred securities9 | Nov 2015 | Nov 2035 | – | 998 | |||||||||||||||||
$2,939m | 6.676% senior subordinated notes12 | – | Jan 2021 | 2,188 | 2,185 | |||||||||||||||||
| 2,188 | 3,183 | |||||||||||||||||||||
Tier 2 securities issued by HSBC Bank Brazil S.A.13 | ||||||||||||||||||||||
BRL383m | Subordinated certificates of deposit | – | Feb 2015 | – | 144 | |||||||||||||||||
BRL500m | Subordinated floating rate certificates of deposit | – | Dec 2016 | – | 188 | |||||||||||||||||
| Other subordinated liabilities each less than $150m11 | – | 81 | ||||||||||||||||||||
| – | 413 | |||||||||||||||||||||
Tier 2 securities issued by HSBC Bank Canada | ||||||||||||||||||||||
CAD400m | 4.80% subordinated debentures | Apr 2017 | Apr 2022 | 298 | 367 | |||||||||||||||||
CAD200m | 4.94% subordinated debentures7 | Mar 2016 | Mar 2021 | 144 | 172 | |||||||||||||||||
CAD39m | Floating rate debentures | Oct 1996 | Nov 2083 | 29 | 34 | |||||||||||||||||
| 471 | 573 | |||||||||||||||||||||
Securities issued by HSBC Mexico, S.A. | ||||||||||||||||||||||
MXN1,818m | Non-convertible subordinated obligations14 | Sep 2013 | Sep 2018 | 105 | 124 | |||||||||||||||||
MXN2,273m | Non-convertible subordinated obligations14 | Dec 2013 | Dec 2018 | 131 | 154 | |||||||||||||||||
$300m | Non-convertible subordinated obligations14,15 | Jun 2014 | Jun 2019 | 240 | 240 | |||||||||||||||||
| 476 | 518 | |||||||||||||||||||||
Securities issued by other HSBC subsidiaries | ||||||||||||||||||||||
Other subordinated liabilities each less than $200m11 |
| 432 | 524 | |||||||||||||||||||
Subordinated liabilities issued by HSBC subsidiaries at 31 December |
| 19,150 | 24,704 | |||||||||||||||||||
| 1 | See paragraph below, ‘Guaranteed by HSBC Holdings or HSBC Bank plc’. |
| 2 | In June 2015, HSBC called and redeemed £500m 8.208% non-cumulative step-up perpetual preferred securities at par. |
| 3 | In February 2016, HSBC gave notice that it will call and redeem the €750m 5.13% non-cumulative step-up perpetual preferred securities. |
| 4 | In September 2015, HSBC called and redeemed £500m 4.75% callable subordinated notes and €500m callable subordinated floating rate notes at par. |
| 5 | The interest rate payable after March 2018 is the sum of the gross redemption yield of the then prevailing five-year UK gilt plus 1.80%. |
| 6 | The interest rate payable after November 2025 is the sum of the three-month sterling Libor plus 1.50%. |
| 7 | In January 2016, HSBC gave notice that it will call and redeem the $400m Primary capital undated floating rate notes and CAD200m 4.94% subordinated debentures. |
| 8 | In December 2015, HSBC called and redeemed $400m Primary capital undated floating rate notes at par. |
| 9 | In November 2015, HSBC called and redeemed $1,000m 5.911% trust preferred securities and AUD 200m callable subordinated floating rate notes at par. |
| 10 | In June 2015, HSBC called and redeemed $200m 7.808% capital securities, $200m 8.38% capital securities, and $150m 7.75% Capital Trust pass through securities at par. |
| 11 | Some securities included here are ineligible for inclusion in the capital base of HSBC in accordance with CRD IV rules. |
| 12 | Approximately $731m of the senior subordinated notes are held by HSBC Holdings. |
| 13 | Included in Note 23, Assets held for sale and liabilities of disposal groups held for sale. |
HSBC HOLDINGS PLC
424 |
Table of Contents
| 14 | These securities are ineligible for inclusion in the capital base of HSBC in accordance with CRD IV rules. |
| 15 | Approximately $60m of the subordinated obligations are held by HSBC Holdings. |
HSBC Holdings
| 2015 | 2014 | |||||||||||
| $m | $m | |||||||||||
Subordinated liabilities: | ||||||||||||
– at amortised cost | 15,895 | 17,255 | ||||||||||
– designated at fair value (Note 25) | 11,956 | 10,494 | ||||||||||
At 31 December | 27,851 | 27,749 | ||||||||||
HSBC Holdings’ subordinated liabilities
| First call date | Maturity date | 2015 $m | 2014 $m | |||||||||||||||||||
Tier 2 securities issued by HSBC Holdings plc | ||||||||||||||||||||||
Amounts owed to third parties | ||||||||||||||||||||||
$488m | 7.625% subordinated notes1 | – | May 2032 | 531 | 538 | |||||||||||||||||
$222m | 7.35% subordinated notes1 | – | Nov 2032 | 278 | 278 | |||||||||||||||||
$2,000m | 6.5% subordinated notes1 | – | May 2036 | 2,029 | 2,029 | |||||||||||||||||
$2,500m | 6.5% subordinated notes1 | – | Sep 2037 | 3,085 | 3,278 | |||||||||||||||||
$1,500m | 6.8% subordinated notes1 | – | Jun 2038 | 1,487 | 1,487 | |||||||||||||||||
$2,000m | 4.25% subordinated notes2,5 | – | Mar 2024 | 2,078 | 2,069 | |||||||||||||||||
$1,500m | 5.25% subordinated notes2,5 | – | Mar 2044 | 1,735 | 1,735 | |||||||||||||||||
$1,500m | 4.25% subordinated notes2 | – | Aug 2025 | 1,529 | – | |||||||||||||||||
£900m | 6.375% callable subordinated notes1,3 | Oct 2017 | Oct 2022 | 1,432 | 1,558 | |||||||||||||||||
£650m | 5.75% subordinated notes2 | – | Dec 2027 | 1,079 | 1,176 | |||||||||||||||||
£650m | 6.75% subordinated notes2 | – | Sep 2028 | 955 | 1,005 | |||||||||||||||||
£750m | 7.0% subordinated notes2 | – | Apr 2038 | 1,159 | 1,217 | |||||||||||||||||
£900m | 6.0% subordinated notes2 | – | Mar 2040 | 1,310 | 1,379 | |||||||||||||||||
€1,600m | 6.25% subordinated notes2 | – | Mar 2018 | 1,748 | 1,950 | |||||||||||||||||
€1,750m | 6.0% subordinated notes2 | – | Jun 2019 | 2,284 | 2,623 | |||||||||||||||||
€700m | 3.625% callable subordinated notes1,4 | Jun 2015 | Jun 2020 | – | 878 | |||||||||||||||||
€1,500m | 3.375% callable subordinated notes2,5 | Jan 2019 | Jan 2024 | 1,694 | 1,898 | |||||||||||||||||
€1,500m | 3.0% subordinated notes2 | – | Jun 2025 | 1,691 | – | |||||||||||||||||
| 26,104 | 25,098 | |||||||||||||||||||||
Amounts owed to HSBC undertakings | ||||||||||||||||||||||
£500m | 8.208% subordinated step-up cumulative notes4 | Jun 2015 | Jun 2040 | – | 779 | |||||||||||||||||
€750m | 5.13% fixed/floating subordinated notes | Mar 2016 | Dec 2044 | 856 | 981 | |||||||||||||||||
$900m | 10.176% subordinated step-up cumulative notes | Jun 2030 | Jun 2040 | 891 | 891 | |||||||||||||||||
| 1,747 | 2,651 | |||||||||||||||||||||
At 31 December | 27,851 | 27,749 | ||||||||||||||||||||
| 1 | Amounts owed to third parties represent securities included in the capital base of HSBC as tier 2 securities in accordance with the grandfathering provisions under CRD IV rules. |
| 2 | These securities are included in the capital base of HSBC as fully CRD IV compliant tier 2 securities on an end point basis. |
| 3 | The interest rate payable after October 2017 is the sum of the three-month sterling Libor plus 1.3%. |
| 4 | In June 2015, HSBC Holdings called and redeemed the €700m 3.625% callable subordinated notes and £500m 8.208% non-cumulative step-up perpetual preferred securities at par. |
| 5 | These subordinated notes are measured at amortised cost in HSBC Holdings, where the interest rate risk is hedged using a fair value hedge, while they are measured at fair value in the Group. |
Additional tier 1 capital securities
HSBC has included three types of additional tier 1 capital securities in its tier 1 capital. Additional tier 1 capital securities are perpetual subordinated securities on which coupon payments may be deferred or cancelled at the discretion of HSBC Holdings. The securities presented in this Note are accounted for as liabilities because HSBC has an obligation to pay dividends in perpetuity. See Note 35 for the other two types of additional tier 1 capital securities accounted for as equity.
The additional tier 1 securities presented in this section do not meet the identifying criteria in full for recognition as tier 1 capital under CRD IV but are eligible as regulatory capital subject to grandfathering limits and progressive phase-out.
Guaranteed by HSBC Holdings or HSBC Bank plc
The five capital securities above that are guaranteed on a subordinated basis by HSBC Holdings or HSBC Bank plc (‘HSBC Bank’) and are non-cumulative step-up perpetual preferred securities issued by Jersey limited partnerships. The proceeds of the issues were on-lent to the respective guarantors by the limited partnerships in the form of subordinated notes. These preferred securities qualify as additional tier 1 capital for HSBC under CRD IV by virtue of the application of grandfathering provisions, and the two capital securities guaranteed by HSBC Bank also qualify as additional tier 1 capital for HSBC Bank (on a solo and a consolidated basis) under CRD IV by virtue of the same grandfathering process.
HSBC HOLDINGS PLC
425 |
Table of Contents
Notes on the Financial Statements(continued)
30 – Subordinated liabilities / 31 – Maturity analysis
These preferred securities, together with the guarantee, are intended to provide investors with economic rights equivalent to the rights that they would have had if they had purchased non-cumulative perpetual preference shares of the relevant issuer. There are limitations on the payment of distributions if such payments are prohibited under UK banking regulations or other requirements, if a payment would cause a breach of HSBC’s capital adequacy requirements or if HSBC Holdings or HSBC Bank have insufficient distributable reserves (as defined).
HSBC Holdings and HSBC Bank have individually covenanted that if prevented under certain circumstances from paying distributions on the preferred securities in full, they will not pay dividends or other distributions in respect of their ordinary shares, or effect repurchases or redemptions of their ordinary shares, until the distribution on the preferred securities has been paid in full.
With respect to preferred securities guaranteed by HSBC Holdings, if (i) HSBC’s total capital ratio falls below the regulatory minimum ratio required or (ii) the Directors expect, in view of the deteriorating financial condition of HSBC Holdings, that (i) will occur in the near term, then the preferred securities will be substituted by preference shares of HSBC Holdings which have economic terms which are in all material respects equivalent to those of the preferred securities and the guarantee taken together.
With respect to preferred securities guaranteed by HSBC Bank, if (i) any of the two issues of preferred securities are outstanding in April 2049 or November 2048, respectively, or (ii) the total capital ratio of HSBC Bank on a solo and consolidated basis falls below the regulatory minimum ratio required or (iii) in view of the deteriorating financial condition of HSBC Bank, the Directors expect (ii) to occur in the near term, then the preferred securities will be substituted by preference shares of HSBC Bank having economic terms which are in all material respects equivalent to those of the preferred securities and the guarantee taken together.
Tier 2 capital securities
These capital securities are included within HSBC’s regulatory capital base as tier 2 capital under CRD IV by virtue of the application of grandfathering provisions (with the exception of identified HSBC Holding securities which are compliant with CRD IV end point rules). Tier 2 capital securities are either perpetual subordinated securities or dated securities on which there is an obligation to pay coupons. In accordance with CRD IV, the capital contribution of all tier 2 securities is amortised for regulatory purposes in their final five years before maturity.
31Maturity analysis of assets, liabilities and off-balance sheet commitments
The table on page 427 provides an analysis of consolidated total assets, liabilities and off-balance sheet commitments by residual contractual maturity at the balance sheet date. Asset and liability balances are included in the maturity analysis as follows:
| • | except for reverse repos, repos and debt securities in issue, trading assets and liabilities (including trading derivatives) are included in the ‘Due not more than 1 month’ time bucket, and not by contractual maturity because trading balances are typically held for short periods of time; |
| • | financial assets and liabilities with no contractual maturity (such as equity securities) are included in the ‘Due over 5 years’ time bucket. Undated or perpetual instruments are classified based on the contractual notice period which the counterparty of the instrument is entitled to give. Where there is no contractual notice period, undated or perpetual contracts are included in the ‘Due over 5 years’ time bucket; |
| • | non-financial assets and liabilities with no contractual maturity (such as property, plant and equipment, goodwill and intangible assets, current and deferred tax assets and liabilities and retirement benefit liabilities) are included in the ‘Due over 5 years’ time bucket; |
| • | financial instruments included within assets and liabilities of disposal groups held for sale are classified on the basis of the contractual maturity of the underlying instruments and not on the basis of the disposal transaction; and |
| • | liabilities under insurance contracts are included in the ‘Due over 5 years’ time bucket. Liabilities under investment contracts are classified in accordance with their contractual maturity. Undated investment contracts are classified based on the contractual notice period investors are entitled to give. Where there is no contractual notice period, undated contracts are included in the ‘Due over 5 years’ time bucket. |
Loan and other credit-related commitments are classified on the basis of the earliest date they can be drawn down.
HSBC HOLDINGS PLC
426 |
Table of Contents
HSBC
Maturity analysis of assets and liabilities
Due not more than 1 month | Due over 1 month but not more than 3 months | Due over 3 months but not more than 6 months | Due over 6 months but not more than 9 months | Due over 9 months but not more than 1 year | Due over 1 year but not more than 2 years | Due over 2 years but not more than 5 years | Due over 5 years | Total | ||||||||||||||||||||||||||||||||||||||||||||||
| $m | $m | $m | $m | $m | $m | $m | $m | $m | ||||||||||||||||||||||||||||||||||||||||||||||
Financial assets | ||||||||||||||||||||||||||||||||||||||||||||||||||||||
Cash and balances at central banks | 98,934 | – | – | – | – | – | – | – | 98,934 | |||||||||||||||||||||||||||||||||||||||||||||
Items in the course of collection from other banks | 5,768 | – | – | – | – | – | – | – | 5,768 | |||||||||||||||||||||||||||||||||||||||||||||
Hong Kong Government certificates of indebtedness | 28,410 | – | – | – | – | – | – | – | 28,410 | |||||||||||||||||||||||||||||||||||||||||||||
Trading assets | 224,691 | 34 | – | – | – | 112 | – | – | 224,837 | |||||||||||||||||||||||||||||||||||||||||||||
– reverse repos | 292 | 34 | – | – | – | 112 | – | – | 438 | |||||||||||||||||||||||||||||||||||||||||||||
– other trading assets | 224,399 | – | – | – | – | – | – | – | 224,399 | |||||||||||||||||||||||||||||||||||||||||||||
Financial assets designated at fair value | 429 | 194 | 222 | 83 | 390 | 896 | 2,603 | 19,035 | 23,852 | |||||||||||||||||||||||||||||||||||||||||||||
Derivatives | 285,797 | 215 | 223 | 198 | 33 | 499 | 841 | 670 | 288,476 | |||||||||||||||||||||||||||||||||||||||||||||
– trading | 285,678 | – | – | – | – | – | – | – | 285,678 | |||||||||||||||||||||||||||||||||||||||||||||
– non-trading | 119 | 215 | 223 | 198 | 33 | 499 | 841 | 670 | 2,798 | |||||||||||||||||||||||||||||||||||||||||||||
Loans and advances to banks | 57,296 | 14,530 | 4,063 | 1,964 | 2,499 | 5,134 | 3,274 | 1,641 | 90,401 | |||||||||||||||||||||||||||||||||||||||||||||
Loans and advances to customers | 176,862 | 69,638 | 54,730 | 33,095 | 34,774 | 81,560 | 201,253 | 272,542 | 924,454 | |||||||||||||||||||||||||||||||||||||||||||||
– personal | 39,191 | 8,328 | 8,510 | 7,457 | 9,350 | 22,438 | 57,283 | 218,646 | 371,203 | |||||||||||||||||||||||||||||||||||||||||||||
– corporate and commercial | 123,901 | 54,711 | 40,489 | 21,081 | 21,811 | 50,355 | 131,166 | 49,564 | 493,078 | |||||||||||||||||||||||||||||||||||||||||||||
– financial | 13,770 | 6,599 | 5,731 | 4,557 | 3,613 | 8,767 | 12,804 | 4,332 | 60,173 | |||||||||||||||||||||||||||||||||||||||||||||
Reverse repurchase agreements – non-trading | 110,478 | 21,978 | 7,220 | 2,786 | 580 | 2,985 | 228 | – | 146,255 | |||||||||||||||||||||||||||||||||||||||||||||
Financial investments | 35,104 | 59,098 | 36,897 | 19,102 | 17,293 | 48,634 | 94,549 | 118,278 | 428,955 | |||||||||||||||||||||||||||||||||||||||||||||
Assets held for sale | 15,816 | 2,628 | 2,544 | 1,218 | 2,611 | 4,675 | 6,365 | 4,422 | 40,279 | |||||||||||||||||||||||||||||||||||||||||||||
Accrued income and other financial assets | 12,732 | 6,682 | 1,995 | 483 | 395 | 463 | 445 | 2,115 | 25,310 | |||||||||||||||||||||||||||||||||||||||||||||
Financial assets at 31 December 2015 | 1,052,317 | 174,997 | 107,894 | 58,929 | 58,575 | 144,958 | 309,558 | 418,703 | 2,325,931 | |||||||||||||||||||||||||||||||||||||||||||||
Non-financial assets | – | – | – | – | – | – | – | 83,725 | 83,725 | |||||||||||||||||||||||||||||||||||||||||||||
Total assets at 31 December 2015 | 1,052,317 | 174,997 | 107,894 | 58,929 | 58,575 | 144,958 | 309,558 | 502,428 | 2,409,656 | |||||||||||||||||||||||||||||||||||||||||||||
HSBC HOLDINGS PLC
427 |
Table of Contents
Notes on the Financial Statements(continued)
31 – Maturity analysis
Maturity analysis of assets and liabilities(continued)
Due not more than 1 month | Due over 1 month but not more than 3 months | Due over 3 months but not more than 6 months | Due over 6 months but not more than 9 months | Due over 9 months but not more than 1 year | Due over 1 year but not more than 2 years | Due over 2 years but not more than 5 years | Due over 5 years | Total | ||||||||||||||||||||||||||||||||||||||||||||||
| $m | $m | $m | $m | $m | $m | $m | $m | $m | ||||||||||||||||||||||||||||||||||||||||||||||
Financial liabilities | ||||||||||||||||||||||||||||||||||||||||||||||||||||||
Hong Kong currency notes in circulation | 28,410 | – | – | – | – | – | – | – | 28,410 | |||||||||||||||||||||||||||||||||||||||||||||
Deposits by banks | 46,693 | 2,225 | 1,049 | 325 | 116 | 712 | 3,182 | 69 | 54,371 | |||||||||||||||||||||||||||||||||||||||||||||
Customer accounts1 | 1,185,091 | 50,831 | 21,397 | 10,421 | 10,869 | 6,596 | 3,852 | 529 | 1,289,586 | |||||||||||||||||||||||||||||||||||||||||||||
– personal | 574,468 | 27,646 | 13,032 | 7,371 | 7,990 | 3,566 | 2,920 | 354 | 637,347 | |||||||||||||||||||||||||||||||||||||||||||||
– corporate and commercial | 459,813 | 18,802 | 7,314 | 2,479 | 2,495 | 2,926 | 828 | 156 | 494,813 | |||||||||||||||||||||||||||||||||||||||||||||
– financial | 150,810 | 4,383 | 1,051 | 571 | 384 | 104 | 104 | 19 | 157,426 | |||||||||||||||||||||||||||||||||||||||||||||
Repurchase agreements – non-trading | 73,478 | 3,788 | 1,816 | 164 | 154 | – | 500 | 500 | 80,400 | |||||||||||||||||||||||||||||||||||||||||||||
Items in the course of transmission to other banks | 5,638 | – | – | – | – | – | – | – | 5,638 | |||||||||||||||||||||||||||||||||||||||||||||
Trading liabilities | 111,691 | 1,471 | 1,529 | 882 | 2,184 | 4,344 | 10,105 | 9,408 | 141,614 | |||||||||||||||||||||||||||||||||||||||||||||
– repos | 77 | 365 | – | – | – | – | – | – | 442 | |||||||||||||||||||||||||||||||||||||||||||||
– debt securities in issue | 967 | 1,106 | 1,529 | 882 | 2,184 | 4,344 | 10,105 | 9,408 | 30,525 | |||||||||||||||||||||||||||||||||||||||||||||
– other trading liabilities | 110,647 | – | – | – | – | – | – | – | 110,647 | |||||||||||||||||||||||||||||||||||||||||||||
Financial liabilities designated at fair value | 2,036 | 1,822 | 2,943 | 342 | 1,900 | 4,930 | 14,316 | 38,119 | 66,408 | |||||||||||||||||||||||||||||||||||||||||||||
– debt securities in issue: covered bonds | – | – | – | – | – | 2,012 | 1,608 | 2,577 | 6,197 | |||||||||||||||||||||||||||||||||||||||||||||
– debt securities in issue: otherwise secured | – | – | – | – | – | – | – | – | – | |||||||||||||||||||||||||||||||||||||||||||||
– debt securities in issue: unsecured | 1,972 | 973 | 2,926 | 342 | 1,786 | 2,918 | 9,819 | 10,745 | 31,481 | |||||||||||||||||||||||||||||||||||||||||||||
– subordinated liabilities and preferred securities | – | 848 | – | – | – | – | 2,773 | 18,889 | 22,510 | |||||||||||||||||||||||||||||||||||||||||||||
– other | 64 | 1 | 17 | – | 114 | – | 116 | 5,908 | 6,220 | |||||||||||||||||||||||||||||||||||||||||||||
Derivatives | 276,765 | 34 | 251 | 213 | 52 | 524 | 1,063 | 2,169 | 281,071 | |||||||||||||||||||||||||||||||||||||||||||||
– trading | 276,558 | – | – | – | – | – | – | – | 276,558 | |||||||||||||||||||||||||||||||||||||||||||||
– non-trading | 207 | 34 | 251 | 213 | 52 | 524 | 1,063 | 2,169 | 4,513 | |||||||||||||||||||||||||||||||||||||||||||||
Debt securities in issue | 16,536 | 9,326 | 16,295 | 5,542 | 1,365 | 10,754 | 22,866 | 6,265 | 88,949 | |||||||||||||||||||||||||||||||||||||||||||||
– covered bonds | – | – | 1 | – | 1 | 83 | 17 | 33 | 135 | |||||||||||||||||||||||||||||||||||||||||||||
– otherwise secured | 8,436 | 173 | 195 | 206 | 173 | 2,082 | 4,354 | 1,118 | 16,737 | |||||||||||||||||||||||||||||||||||||||||||||
– unsecured | 8,100 | 9,153 | 16,099 | 5,336 | 1,191 | 8,589 | 18,495 | 5,114 | 72,077 | |||||||||||||||||||||||||||||||||||||||||||||
Liabilities of disposal groups held for sale | 20,350 | 1,416 | 1,548 | 1,344 | 1,246 | 5,050 | 1,484 | 115 | 32,553 | |||||||||||||||||||||||||||||||||||||||||||||
Accruals and other financial liabilities | 14,802 | 7,965 | 2,467 | 659 | 421 | 925 | 1,454 | 665 | 29,358 | �� | ||||||||||||||||||||||||||||||||||||||||||||
Subordinated liabilities | – | 401 | – | – | 34 | 650 | 4,579 | 17,038 | 22,702 | |||||||||||||||||||||||||||||||||||||||||||||
Total financial liabilities at 31 December 2015 | 1,781,490 | 79,279 | 49,295 | 19,892 | 18,341 | 34,485 | 63,401 | 74,877 | 2,121,060 | |||||||||||||||||||||||||||||||||||||||||||||
Non-financial liabilities | – | – | – | – | – | – | – | 91,078 | 91,078 | |||||||||||||||||||||||||||||||||||||||||||||
Total liabilities at 31 December 2015 | 1,781,490 | 79,279 | 49,295 | 19,892 | 18,341 | 34,485 | 63,401 | 165,955 | 2,212,138 | |||||||||||||||||||||||||||||||||||||||||||||
HSBC HOLDINGS PLC
428 |
Table of Contents
Due not more than 1 month | Due over 1 month but not more than 3 months | Due over 3 months but not more than 6 months | Due over 6 months but not more than 9 months | Due over 9 months but not more than 1 year | Due over 1 year but not more than 2 years | Due over 2 years but not more than 5 years | Due over 5 years | Total | ||||||||||||||||||||||||||||||||||||||||||||||
| $m | $m | $m | $m | $m | $m | $m | $m | $m | ||||||||||||||||||||||||||||||||||||||||||||||
Financial assets | ||||||||||||||||||||||||||||||||||||||||||||||||||||||
Cash and balances at central banks | 129,957 | – | – | – | – | – | – | – | 129,957 | |||||||||||||||||||||||||||||||||||||||||||||
Items in the course of collection from other banks | 4,927 | – | – | – | – | – | – | – | 4,927 | |||||||||||||||||||||||||||||||||||||||||||||
Hong Kong Government certificates of indebtedness | 27,674 | – | – | – | – | – | – | – | 27,674 | |||||||||||||||||||||||||||||||||||||||||||||
Trading assets | 303,463 | – | – | – | – | – | 730 | – | 304,193 | |||||||||||||||||||||||||||||||||||||||||||||
– reverse repos | 567 | – | – | – | – | – | 730 | – | 1,297 | |||||||||||||||||||||||||||||||||||||||||||||
– other trading assets | 302,896 | – | – | – | – | – | – | – | 302,896 | |||||||||||||||||||||||||||||||||||||||||||||
Financial assets designated at fair value | 244 | 399 | 417 | 346 | 208 | 1,825 | 4,634 | 20,964 | 29,037 | |||||||||||||||||||||||||||||||||||||||||||||
Derivatives | 341,558 | 56 | 463 | 220 | 32 | 1,003 | 1,033 | 643 | 345,008 | |||||||||||||||||||||||||||||||||||||||||||||
– trading | 341,416 | – | – | – | – | – | – | – | 341,416 | |||||||||||||||||||||||||||||||||||||||||||||
– non-trading | 142 | 56 | 463 | 220 | 32 | 1,003 | 1,033 | 643 | 3,592 | |||||||||||||||||||||||||||||||||||||||||||||
Loans and advances to banks | 73,758 | 17,649 | 5,682 | 1,934 | 1,850 | 7,371 | 1,981 | 1,924 | 112,149 | |||||||||||||||||||||||||||||||||||||||||||||
Loans and advances to customers | 203,130 | 76,236 | 55,018 | 35,347 | 37,674 | 91,300 | 187,728 | 288,227 | 974,660 | |||||||||||||||||||||||||||||||||||||||||||||
– personal | 42,170 | 9,673 | 8,911 | 7,486 | 8,672 | 27,305 | 54,439 | 230,298 | 388,954 | |||||||||||||||||||||||||||||||||||||||||||||
– corporate and commercial | 146,250 | 61,809 | 41,924 | 23,720 | 23,697 | 56,398 | 124,796 | 56,590 | 535,184 | |||||||||||||||||||||||||||||||||||||||||||||
– financial | 14,710 | 4,754 | 4,183 | 4,141 | 5,305 | 7,597 | 8,493 | 1,339 | 50,522 | |||||||||||||||||||||||||||||||||||||||||||||
Reverse repurchase agreements – non-trading | 116,002 | 30,490 | 9,076 | 2,230 | 582 | 868 | 2,465 | – | 161,713 | |||||||||||||||||||||||||||||||||||||||||||||
Financial investments | 28,237 | 50,445 | 41,503 | 14,577 | 17,011 | 48,392 | 96,891 | 118,411 | 415,467 | |||||||||||||||||||||||||||||||||||||||||||||
Assets held for sale | 114 | 186 | 13 | 18 | 10 | 41 | 126 | 6,224 | 6,732 | |||||||||||||||||||||||||||||||||||||||||||||
Accrued income and other financial assets | 17,756 | 7,386 | 2,402 | 587 | 317 | 707 | 1,156 | 3,579 | 33,890 | |||||||||||||||||||||||||||||||||||||||||||||
Financial assets at 31 December 2014 | 1,246,820 | 182,847 | 114,574 | 55,259 | 57,684 | 151,507 | 296,744 | 439,972 | 2,545,407 | |||||||||||||||||||||||||||||||||||||||||||||
Non-financial assets | – | – | – | – | – | – | – | 88,732 | 88,732 | |||||||||||||||||||||||||||||||||||||||||||||
Total assets at 31 December 2014 | 1,246,820 | 182,847 | 114,574 | 55,259 | 57,684 | 151,507 | 296,744 | 528,704 | 2,634,139 | |||||||||||||||||||||||||||||||||||||||||||||
HSBC HOLDINGS PLC
429 |
Table of Contents
Notes on the Financial Statements(continued)
31 – Maturity analysis
Maturity analysis of assets and liabilities(continued)
Due not 1 month | Due over 1 month but not more than 3 months | Due over 3 months but not more than 6 months | Due over 6 months but not more than 9 months | Due over 9 months but not more than 1 year | Due over 1 year but not more than 2 years | Due over 2 years but not more than 5 years | Due over 5 years | Total | ||||||||||||||||||||||||||||||||||||||||||||||
| $m | $m | $m | $m | $m | $m | $m | $m | $m | ||||||||||||||||||||||||||||||||||||||||||||||
Financial liabilities | ||||||||||||||||||||||||||||||||||||||||||||||||||||||
Hong Kong currency notes in circulation | 27,674 | – | – | – | – | – | – | – | 27,674 | |||||||||||||||||||||||||||||||||||||||||||||
Deposits by banks | 66,829 | 2,890 | 2,539 | 511 | 810 | 621 | 2,963 | 263 | 77,426 | |||||||||||||||||||||||||||||||||||||||||||||
Customer accounts1 | 1,216,574 | 57,127 | 32,925 | 15,023 | 13,586 | 9,278 | 5,819 | 310 | 1,350,642 | |||||||||||||||||||||||||||||||||||||||||||||
– personal | 572,459 | 28,580 | 16,728 | 10,609 | 9,625 | 7,220 | 3,967 | 125 | 649,313 | |||||||||||||||||||||||||||||||||||||||||||||
– corporate and commercial | 465,990 | 21,841 | 10,688 | 3,716 | 2,894 | 1,615 | 1,316 | 150 | 508,210 | |||||||||||||||||||||||||||||||||||||||||||||
– financial | 178,125 | 6,706 | 5,509 | 698 | 1,067 | 443 | 536 | 35 | 193,119 | |||||||||||||||||||||||||||||||||||||||||||||
Repurchase agreements – non-trading | 95,243 | 5,029 | 4,054 | 1,392 | 714 | – | – | 1,000 | 107,432 | |||||||||||||||||||||||||||||||||||||||||||||
Items in the course of transmission to other banks | 5,990 | – | – | – | – | – | – | – | 5,990 | |||||||||||||||||||||||||||||||||||||||||||||
Trading liabilities | 155,604 | 2,041 | 2,636 | 1,439 | 2,918 | 5,744 | 9,603 | 10,587 | 190,572 | |||||||||||||||||||||||||||||||||||||||||||||
– repos | 746 | 909 | 224 | 264 | 1,249 | 406 | – | – | 3,798 | |||||||||||||||||||||||||||||||||||||||||||||
– debt securities in issue | 1,686 | 1,132 | 2,412 | 1,175 | 1,669 | 5,338 | 9,603 | 10,587 | 33,602 | |||||||||||||||||||||||||||||||||||||||||||||
– other trading liabilities | 153,172 | – | – | – | – | – | – | – | 153,172 | |||||||||||||||||||||||||||||||||||||||||||||
Financial liabilities designated at fair value | 981 | 912 | 4,264 | 972 | 1,557 | 8,500 | 15,037 | 43,930 | 76,153 | |||||||||||||||||||||||||||||||||||||||||||||
– debt securities in issue: covered bonds | – | – | – | 205 | – | – | 2,705 | 2,942 | 5,852 | |||||||||||||||||||||||||||||||||||||||||||||
– debt securities in issue: otherwise secured | – | – | – | – | – | – | – | – | – | |||||||||||||||||||||||||||||||||||||||||||||
– debt securities in issue: unsecured | 942 | 868 | 4,242 | 742 | 1,409 | 8,500 | 9,576 | 14,233 | 40,512 | |||||||||||||||||||||||||||||||||||||||||||||
– subordinated liabilities and preferred securities | – | 36 | – | – | 18 | – | 2,623 | 20,640 | 23,317 | |||||||||||||||||||||||||||||||||||||||||||||
– other | 39 | 8 | 22 | 25 | 130 | – | 133 | 6,115 | 6,472 | |||||||||||||||||||||||||||||||||||||||||||||
Derivatives | 335,802 | 23 | 86 | 223 | 54 | 621 | 1,121 | 2,739 | 340,669 | |||||||||||||||||||||||||||||||||||||||||||||
– trading | 335,400 | – | – | – | – | – | – | – | 335,400 | |||||||||||||||||||||||||||||||||||||||||||||
– non-trading | 402 | 23 | 86 | 223 | 54 | 621 | 1,121 | 2,739 | 5,269 | |||||||||||||||||||||||||||||||||||||||||||||
Debt securities in issue | 14,741 | 15,424 | 13,027 | 7,854 | 6,050 | 14,209 | 19,481 | 5,161 | 95,947 | |||||||||||||||||||||||||||||||||||||||||||||
– covered bonds | – | – | – | – | – | – | 81 | – | 81 | |||||||||||||||||||||||||||||||||||||||||||||
– otherwise secured | 8,807 | 1,063 | 60 | 283 | 272 | 912 | 1,562 | 1,008 | 13,967 | |||||||||||||||||||||||||||||||||||||||||||||
– unsecured | 5,934 | 14,361 | 12,967 | 7,571 | 5,778 | 13,297 | 17,838 | 4,153 | 81,899 | |||||||||||||||||||||||||||||||||||||||||||||
Liabilities of disposal groups held for sale | 191 | 28 | 56 | 55 | 63 | 213 | 551 | 2,837 | 3,994 | |||||||||||||||||||||||||||||||||||||||||||||
Accruals and other financial liabilities | 20,893 | 9,170 | 3,013 | 1,166 | 1,757 | 1,355 | 1,674 | 818 | 39,846 | |||||||||||||||||||||||||||||||||||||||||||||
Subordinated liabilities | – | 150 | – | 3 | 167 | 113 | 3,607 | 22,624 | 26,664 | |||||||||||||||||||||||||||||||||||||||||||||
Total financial liabilities at 31 December 2014 | 1,940,522 | 92,794 | 62,600 | 28,638 | 27,676 | 40,654 | 59,856 | 90,269 | 2,343,009 | |||||||||||||||||||||||||||||||||||||||||||||
Non-financial liabilities | – | – | – | – | – | – | – | 91,152 | 91,152 | |||||||||||||||||||||||||||||||||||||||||||||
Total liabilities at 31 December 2014 | 1,940,522 | 92,794 | 62,600 | 28,638 | 27,676 | 40,654 | 59,856 | 181,421 | 2,434,161 | |||||||||||||||||||||||||||||||||||||||||||||
| 1 | ‘Customer accounts’ includes $342,908m (2014: $342,927m) insured by guarantee schemes. |
HSBC HOLDINGS PLC
430 |
Table of Contents
Maturity analysis of off-balance sheet commitments received
Due not more than 1 month | Due over 1 month but not more than 3 months | Due over 3 months but not more than 6 months | Due over 6 months but not more than 9 months | Due over 9 months but not more than 1 year | Due over 1 year but not more than 2 years | Due over 2 years but not more than 5 years | Due over 5 years | Total | ||||||||||||||||||||||||||||||||||||||||||||||
| $m | $m | $m | $m | $m | $m | $m | $m | $m | ||||||||||||||||||||||||||||||||||||||||||||||
At 31 December 2015 | ||||||||||||||||||||||||||||||||||||||||||||||||||||||
Loan and other credit-related commitments | 3,472 | – | 2,149 | – | – | 111 | – | – | 5,732 | |||||||||||||||||||||||||||||||||||||||||||||
At 31 December 2014 | ||||||||||||||||||||||||||||||||||||||||||||||||||||||
Loan and other credit-related commitments | 3,313 | – | 4,312 | 607 | – | – | – | – | 8,232 | |||||||||||||||||||||||||||||||||||||||||||||
Maturity analysis of off-balance sheet commitments given |
| |||||||||||||||||||||||||||||||||||||||||||||||||||||
Due not more than 1 month | Due over 1 month but not more than 3 months | Due over 3 months but not more than 6 months | Due over 6 months but not more than 9 months | Due over 9 months but not more than 1 year | Due over 1 year but not more than 2 years | Due over 2 years but not more than 5 years | Due over 5 years | Total | ||||||||||||||||||||||||||||||||||||||||||||||
| $m | $m | $m | $m | $m | $m | $m | $m | $m | ||||||||||||||||||||||||||||||||||||||||||||||
At 31 December 2015 | �� | |||||||||||||||||||||||||||||||||||||||||||||||||||||
Loan and other credit-related commitments | 472,277 | 45,792 | 16,271 | 9,798 | 47,122 | 11,325 | 48,756 | 15,089 | 666,430 | |||||||||||||||||||||||||||||||||||||||||||||
Of which: | ||||||||||||||||||||||||||||||||||||||||||||||||||||||
– personal | 161,843 | 11,547 | 6,333 | 963 | 19,607 | 1,207 | 425 | 1,018 | 202,943 | |||||||||||||||||||||||||||||||||||||||||||||
– corporate and commercial | 272,044 | 32,764 | 9,126 | 8,372 | 23,984 | 8,227 | 38,838 | 12,558 | 405,913 | |||||||||||||||||||||||||||||||||||||||||||||
– financial | 38,390 | 1,481 | 812 | 463 | 3,531 | 1,891 | 9,493 | 1,513 | 57,574 | |||||||||||||||||||||||||||||||||||||||||||||
At 31 December 2014 | ||||||||||||||||||||||||||||||||||||||||||||||||||||||
Loan and other credit-related commitments | 455,319 | 52,398 | 8,919 | 14,163 | 41,500 | 13,979 | 48,333 | 16,769 | 651,380 | |||||||||||||||||||||||||||||||||||||||||||||
Of which: | ||||||||||||||||||||||||||||||||||||||||||||||||||||||
– personal | 179,088 | 15,784 | 452 | 305 | 14,036 | 1,432 | 1,003 | 955 | 213,055 | |||||||||||||||||||||||||||||||||||||||||||||
– corporate and commercial | 239,646 | 34,657 | 7,595 | 12,556 | 23,519 | 9,926 | 36,918 | 12,185 | 377,002 | |||||||||||||||||||||||||||||||||||||||||||||
– financial | 36,585 | 1,957 | 872 | 1,302 | 3,945 | 2,621 | 10,412 | 3,629 | 61,323 | |||||||||||||||||||||||||||||||||||||||||||||
HSBC HOLDINGS PLC
431 |
Table of Contents
Notes on the Financial Statements(continued)
31 – Maturity analysis
HSBC Holdings
Maturity analysis of assets, liabilities and off-balance sheet commitments
Due not more than 1 month | Due over 1 month but not more than 3 months | Due over 3 months but not more than 6 months | Due over 6 months but not more than 9 months | Due over 9 months but not more than 1 year | Due over 1 year but not more than 2 years | Due over 2 years but not more than 5 years | Due over 5 years | Total | ||||||||||||||||||||||||||||||||||||||||||||||
| $m | $m | $m | $m | $m | $m | $m | $m | $m | ||||||||||||||||||||||||||||||||||||||||||||||
Financial assets | ||||||||||||||||||||||||||||||||||||||||||||||||||||||
Cash at bank and in hand: | ||||||||||||||||||||||||||||||||||||||||||||||||||||||
– balances with HSBC undertakings | 242 | – | – | – | – | – | – | – | 242 | |||||||||||||||||||||||||||||||||||||||||||||
Derivatives | 1,990 | – | – | – | – | – | 109 | 368 | 2,467 | |||||||||||||||||||||||||||||||||||||||||||||
– trading | 1,990 | – | – | – | – | – | – | – | 1,990 | |||||||||||||||||||||||||||||||||||||||||||||
– non-trading | – | – | – | – | – | – | 109 | 368 | 477 | |||||||||||||||||||||||||||||||||||||||||||||
Loans and advances to HSBC undertakings | 7,805 | 2,629 | 4,618 | – | – | – | – | 29,298 | 44,350 | |||||||||||||||||||||||||||||||||||||||||||||
Financial investments in HSBC undertakings | 40 | 6 | – | – | – | – | – | 4,239 | 4,285 | |||||||||||||||||||||||||||||||||||||||||||||
Accrued income and other financial assets | 7 | – | – | – | – | – | – | 109 | 116 | |||||||||||||||||||||||||||||||||||||||||||||
Total financial assets at 31 December 2015 | 10,084 | 2,635 | 4,618 | – | – | – | 109 | 34,014 | 51,460 | |||||||||||||||||||||||||||||||||||||||||||||
Non-financial assets | – | – | – | – | – | – | – | 98,734 | 98,734 | |||||||||||||||||||||||||||||||||||||||||||||
Total assets at 31 December 2015 | 10,084 | 2,635 | 4,618 | – | – | – | 109 | 132,748 | 150,194 | |||||||||||||||||||||||||||||||||||||||||||||
Financial liabilities | ||||||||||||||||||||||||||||||||||||||||||||||||||||||
Amounts owed to HSBC undertakings | 1,629 | – | – | – | – | 415 | – | 108 | 2,152 | |||||||||||||||||||||||||||||||||||||||||||||
Financial liabilities designated at fair value | – | 960 | – | – | – | – | 2,285 | 16,608 | 19,853 | |||||||||||||||||||||||||||||||||||||||||||||
– debt securities in issue | – | 960 | – | – | – | – | – | 6,937 | 7,897 | |||||||||||||||||||||||||||||||||||||||||||||
– subordinated liabilities and preferred securities | – | – | – | – | – | – | 2,285 | 9,671 | 11,956 | |||||||||||||||||||||||||||||||||||||||||||||
Derivatives | 2,065 | – | – | – | – | – | 213 | – | 2,278 | |||||||||||||||||||||||||||||||||||||||||||||
– trading | 2,065 | – | – | – | – | – | – | – | 2,065 | |||||||||||||||||||||||||||||||||||||||||||||
– non-trading | – | – | – | – | – | – | 213 | – | 213 | |||||||||||||||||||||||||||||||||||||||||||||
Debt securities in issue | – | – | – | – | – | – | – | 960 | 960 | |||||||||||||||||||||||||||||||||||||||||||||
Accruals and other financial liabilities | 1,231 | 195 | 132 | 20 | – | – | – | – | 1,578 | |||||||||||||||||||||||||||||||||||||||||||||
Subordinated liabilities | – | – | – | – | – | – | 1,749 | 14,146 | 15,895 | |||||||||||||||||||||||||||||||||||||||||||||
Total financial liabilities at 31 December 2015 | 4,925 | 1,155 | 132 | 20 | – | 415 | 4,247 | 31,822 | 42,716 | |||||||||||||||||||||||||||||||||||||||||||||
Non-financial liabilities | – | – | – | – | – | – | – | 64 | 64 | |||||||||||||||||||||||||||||||||||||||||||||
Total liabilities at 31 December 2015 | 4,925 | 1,155 | 132 | 20 | – | 415 | 4,247 | 31,886 | 42,780 | |||||||||||||||||||||||||||||||||||||||||||||
Off-balance sheet commitments given | ||||||||||||||||||||||||||||||||||||||||||||||||||||||
Undrawn formal standby facilities, credit lines and other commitments to lend | – | – | – | – | – | – | – | – | – | |||||||||||||||||||||||||||||||||||||||||||||
HSBC HOLDINGS PLC
432 |
Table of Contents
Due not more than 1 month | Due over 1 month but not more than 3 months | Due over 3 months but not more than 6 months | Due over 6 months but not more than 9 months | Due over 9 months but not more than 1 year | Due over 1 year but not more than 2 years | Due over 2 years but not more than 5 years | Due over 5 years | Total | ||||||||||||||||||||||||||||||||||||||||||||||
| $m | $m | $m | $m | $m | $m | $m | $m | $m | ||||||||||||||||||||||||||||||||||||||||||||||
Financial assets | ||||||||||||||||||||||||||||||||||||||||||||||||||||||
Cash at bank and in hand: | ||||||||||||||||||||||||||||||||||||||||||||||||||||||
– balances with HSBC undertakings | 249 | – | – | – | – | – | – | – | 249 | |||||||||||||||||||||||||||||||||||||||||||||
Derivatives | 2,287 | – | – | – | – | – | 127 | 357 | 2,771 | |||||||||||||||||||||||||||||||||||||||||||||
– trading | 2,287 | – | – | – | – | – | – | – | 2,287 | |||||||||||||||||||||||||||||||||||||||||||||
– non-trading | – | – | – | – | – | – | 127 | 357 | 484 | |||||||||||||||||||||||||||||||||||||||||||||
Loans and advances to HSBC undertakings | 7,007 | 858 | 7,676 | – | 14 | – | – | 28,355 | 43,910 | |||||||||||||||||||||||||||||||||||||||||||||
Financial investments in HSBC undertakings | 26 | 6 | – | – | – | – | – | 4,041 | 4,073 | |||||||||||||||||||||||||||||||||||||||||||||
Accrued income and other financial assets | 8 | – | – | – | – | – | – | – | 8 | |||||||||||||||||||||||||||||||||||||||||||||
Total financial assets at 31 December 2014 | 9,577 | 864 | 7,676 | – | 14 | – | 127 | 32,753 | 51,011 | |||||||||||||||||||||||||||||||||||||||||||||
Non-financial assets | – | – | – | – | – | – | – | 96,853 | 96,853 | |||||||||||||||||||||||||||||||||||||||||||||
Total assets at 31 December 2014 | 9,577 | 864 | 7,676 | – | 14 | – | 127 | 129,606 | 147,864 | |||||||||||||||||||||||||||||||||||||||||||||
Financial liabilities | ||||||||||||||||||||||||||||||||||||||||||||||||||||||
Amounts owed to HSBC undertakings | 2,423 | – | 32 | – | 1 | 436 | – | – | 2,892 | |||||||||||||||||||||||||||||||||||||||||||||
Financial liabilities designated at fair value | – | – | – | – | – | 1,110 | 2,623 | 14,946 | 18,679 | |||||||||||||||||||||||||||||||||||||||||||||
– debt securities in issue | – | – | – | – | – | 1,110 | – | 7,075 | 8,185 | |||||||||||||||||||||||||||||||||||||||||||||
– subordinated liabilities and preferred securities | – | – | – | – | – | – | 2,623 | 7,871 | 10,494 | |||||||||||||||||||||||||||||||||||||||||||||
Derivatives | 1,066 | – | – | – | – | – | 103 | – | 1,169 | |||||||||||||||||||||||||||||||||||||||||||||
– trading | 1,066 | – | – | – | – | – | – | – | 1,066 | |||||||||||||||||||||||||||||||||||||||||||||
– non-trading | – | – | – | – | – | – | 103 | – | 103 | |||||||||||||||||||||||||||||||||||||||||||||
Debt securities in issue | – | – | – | – | – | – | – | 1,009 | 1,009 | |||||||||||||||||||||||||||||||||||||||||||||
Accruals and other financial liabilities | 924 | 208 | 137 | 21 | – | – | – | – | 1,290 | |||||||||||||||||||||||||||||||||||||||||||||
Subordinated liabilities | – | – | – | – | – | – | 1,951 | 15,304 | 17,255 | |||||||||||||||||||||||||||||||||||||||||||||
Total financial liabilities at 31 December 2014 | 4,413 | 208 | 169 | 21 | 1 | 1,546 | 4,677 | 31,259 | 42,294 | |||||||||||||||||||||||||||||||||||||||||||||
Non-financial liabilities | – | – | – | – | – | – | – | 125 | 125 | |||||||||||||||||||||||||||||||||||||||||||||
Total liabilities at 31 December 2014 | 4,413 | 208 | 169 | 21 | 1 | 1,546 | 4,677 | 31,384 | 42,419 | |||||||||||||||||||||||||||||||||||||||||||||
Off-balance sheet commitments given | ||||||||||||||||||||||||||||||||||||||||||||||||||||||
Undrawn formal standby facilities, credit lines and other commitments to lend | 16 | – | – | – | – | – | – | – | 16 | |||||||||||||||||||||||||||||||||||||||||||||
HSBC HOLDINGS PLC
433 |
Table of Contents
Notes on the Financial Statements(continued)
32 – Offsetting of financial assets and financial liabilities
32Offsetting of financial assets and financial liabilities
Accounting policy
Financial assets and financial liabilities are offset and the net amount is reported in the balance sheet when there is a legally enforceable right to offset the recognised amounts and there is an intention to settle on a net basis, or realise the asset and settle the liability simultaneously (‘the offset criteria’).
|
The disclosure below has been enhanced this year with the inclusion of ‘Amounts not subject to enforceable netting arrangements’ resulting in a change in the basis of preparation from the prior period. Prior period data have been represented accordingly.
The ‘Amounts not set off in the balance sheet’ in the following table for derivatives and reverse repurchase/repurchase, stock borrowing/lending and similar agreements include transactions where:
| • | the counterparty has an offsetting exposure with HSBC and a master netting or similar arrangement is in place with a right of set off only in the event of default, insolvency or bankruptcy, or the offset criteria are otherwise not satisfied; and |
| • | cash and non-cash collateral has been received/pledged in respect of the transactions described above. |
For loans and advances to customers and customer accounts at amortised cost the amounts included in the table below typically relate to transactions entered into with corporate and commercial customers for working capital management purposes. The ‘Amounts not set off in the balance sheet’ relate to transactions where the customer has an offsetting exposure with HSBC and an agreement is in place with the right of offset but the offset criteria are otherwise not satisfied. For risk management purposes, the net amounts of such exposures are subject to limits which are monitored and the relevant customer agreements are subject to review and updated, as necessary, to ensure that the legal right of offset remains appropriate.
Footnotes to the table on page 435 are set out below:
| 1 | At 31 December 2015, the amount of cash margin received that has been offset against the gross derivatives assets is $4,135m (2014: $606m). The amount of cash margin paid that has been offset against the gross derivatives liabilities is $4,224m (2014: $190m). |
| 2 | For the amount of reverse repos, stock borrowing and similar agreements recognised in the balance sheet, see the ‘Funding sources and uses; table on page 160. In the analysis below, the $7,556m (2014: $9,266m) of trading assets presented in the balance sheet comprised $438m of reverse repos (2014: $1,297m) and $7,118m of stock borrowing (2014: $7,969m). |
| 3 | At 31 December 2015, the total amount of loans and advances to customers at amortised cost was $924,454m (2014: $974,660m) of which $45,904m (2014: $62,096m) was subject to offsetting. For the amount of loans and advances to customers at amortised cost recognised in the balance sheet, see the ‘Funding sources and uses’ table on page 160. |
| 4 | For the amount of repos, stock lending and similar agreements recognised in the balance sheet, see the ‘Funding sources and uses’ table on page 160. In the analysis below, the $9,301m (2014: $15,830m) of trading liabilities presented in the balance sheet comprised $442m of repos (2014: $3,798m) and $8,859m of stock lending (2014: $12,032m). |
| 5 | At 31 December 2015, the total amount of customer accounts at amortised cost was $1,289,586m (2014: $1,350,642m) of which $51,442m (2014: $69,082m) was subject to offsetting. For the amount of customer accounts at amortised cost recognised in the balance sheet, see the ‘Funding sources and uses’ table on page 160. |
| 6 | These exposures continue to be secured by financial collateral, but we may not have sought or been able to obtain a legal opinion evidencing enforceability of the right of offset. |
HSBC HOLDINGS PLC
434 |
Table of Contents
Financial assets subject to offsetting, enforceable master netting arrangements and similar agreements
| Amounts subject to enforceable netting arrangements | Amounts not | |||||||||||||||||||||||||||||||||||||||||||||||||||||
| Amounts not set off in the balance sheet | subject to | |||||||||||||||||||||||||||||||||||||||||||||||||||||
|
| Gross amounts |
|
| Amounts offset |
| | Net amounts in the | |
| Financial instruments |
|
| Non-cash collateral |
| | Cash collateral | |
| Net amount |
|
| enforceable netting arrangements |
6 | Total | ||||||||||||||||||||||||||||||
| $m | $m | $m | $m | $m | $m | $m | $m | $m | ||||||||||||||||||||||||||||||||||||||||||||||
Financial assets | ||||||||||||||||||||||||||||||||||||||||||||||||||||||
Derivatives (Note 16)1 | 385,682 | (105,860 | ) | 279,822 | (215,531 | ) | (8,621 | ) | (34,040 | ) | 21,630 | 8,654 | 288,476 | |||||||||||||||||||||||||||||||||||||||||
Reverse repos, stock borrowing and similar agreements2 | 208,417 | (77,925 | ) | 130,492 | (544 | ) | (129,476 | ) | (270 | ) | 202 | 23,319 | 153,811 | |||||||||||||||||||||||||||||||||||||||||
Classified as: | ||||||||||||||||||||||||||||||||||||||||||||||||||||||
– trading assets | 7,496 | – | 7,496 | – | (7,495 | ) | – | 1 | 60 | 7,556 | ||||||||||||||||||||||||||||||||||||||||||||
– non-trading assets | 200,921 | (77,925 | ) | 122,996 | (544 | ) | (121,981 | ) | (270 | ) | 201 | 23,259 | 146,255 | |||||||||||||||||||||||||||||||||||||||||
Loans and advances to customers at amortised cost3 | 77,547 | (31,643 | ) | 45,904 | (40,790 | ) | – | – | 5,114 | 1,487 | 47,391 | |||||||||||||||||||||||||||||||||||||||||||
At 31 December 2015 | 671,646 | (215,428 | ) | 456,218 | (256,865 | ) | (138,097 | ) | (34,310 | ) | 26,946 | 33,460 | 489,678 | |||||||||||||||||||||||||||||||||||||||||
Derivatives (Note 16)1 | 584,359 | (250,465 | ) | 333,894 | (262,856 | ) | (7,655 | ) | (41,750 | ) | 21,633 | 11,114 | 345,008 | |||||||||||||||||||||||||||||||||||||||||
Reverse repos, stock borrowing and similar agreements2 | 208,893 | (88,676 | ) | 120,217 | (5,117 | ) | (114,394 | ) | (249 | ) | 457 | 50,762 | 170,979 | |||||||||||||||||||||||||||||||||||||||||
Classified as: | ||||||||||||||||||||||||||||||||||||||||||||||||||||||
– trading assets | 9,341 | (390 | ) | 8,951 | – | (8,951 | ) | – | – | 315 | 9,266 | |||||||||||||||||||||||||||||||||||||||||||
– non-trading assets | 199,552 | (88,286 | ) | 111,266 | (5,117 | ) | (105,443 | ) | (249 | ) | 457 | 50,447 | 161,713 | |||||||||||||||||||||||||||||||||||||||||
Loans and advances to customers at amortised cost3 | 99,623 | (37,527 | ) | 62,096 | (55,989 | ) | – | – | 6,107 | 1,597 | 63,693 | |||||||||||||||||||||||||||||||||||||||||||
At 31 December 2014 | 892,875 | (376,668 | ) | 516,207 | (323,962 | ) | (122,049 | ) | (41,999 | ) | 28,197 | 63,473 | 579,680 | |||||||||||||||||||||||||||||||||||||||||
Financial liabilities | ||||||||||||||||||||||||||||||||||||||||||||||||||||||
Derivatives (Note 16)1 | 377,930 | (105,860 | ) | 272,070 | (215,508 | ) | (13,629 | ) | (30,063 | ) | 12,870 | 9,001 | 281,071 | |||||||||||||||||||||||||||||||||||||||||
Repos, stock lending and similar agreements4 | 136,040 | (77,925 | ) | 58,115 | (2,034 | ) | (56,030 | ) | (26 | ) | 25 | 31,586 | 89,701 | |||||||||||||||||||||||||||||||||||||||||
Classified as: | ||||||||||||||||||||||||||||||||||||||||||||||||||||||
– trading liabilities | 9,300 | – | 9,300 | – | (9,299 | ) | – | 1 | 1 | 9,301 | ||||||||||||||||||||||||||||||||||||||||||||
– non-trading liabilities | 126,740 | (77,925 | ) | 48,815 | (2,034 | ) | (46,731 | ) | (26 | ) | 24 | 31,585 | 80,400 | |||||||||||||||||||||||||||||||||||||||||
Customer accounts at amortised cost5 | 83,085 | (31,643 | ) | 51,442 | (40,790 | ) | – | (1 | ) | 10,651 | 729 | 52,171 | ||||||||||||||||||||||||||||||||||||||||||
At 31 December 2015 | 597,055 | (215,428 | ) | 381,627 | (258,332 | ) | (69,659 | ) | (30,090 | ) | 23,546 | 41,316 | 422,943 | |||||||||||||||||||||||||||||||||||||||||
Derivatives (Note 16)1 | 580,644 | (250,465 | ) | 330,179 | (262,864 | ) | (9,465 | ) | (39,571 | ) | 18,279 | 10,490 | 340,669 | |||||||||||||||||||||||||||||||||||||||||
Repos, stock lending and similar agreements4 | 165,514 | (88,676 | ) | 76,838 | (8,934 | ) | (67,793 | ) | (105 | ) | 6 | 46,424 | 123,262 | |||||||||||||||||||||||||||||||||||||||||
Classified as: | ||||||||||||||||||||||||||||||||||||||||||||||||||||||
– trading liabilities | 16,206 | (390 | ) | 15,816 | – | (15,813 | ) | – | 3 | 14 | 15,830 | |||||||||||||||||||||||||||||||||||||||||||
– non-trading liabilities | 149,308 | (88,286 | ) | 61,022 | (8,934 | ) | (51,980 | ) | (105 | ) | 3 | 46,410 | 107,432 | |||||||||||||||||||||||||||||||||||||||||
Customer accounts at amortised cost5 | 106,609 | (37,527 | ) | 69,082 | (55,989 | ) | – | – | 13,093 | 479 | 69,561 | |||||||||||||||||||||||||||||||||||||||||||
At 31 December 2014 | 852,767 | (376,668 | ) | 476,099 | (327,787 | ) | (77,258 | ) | (39,676 | ) | 31,378 | 57,393 | 533,492 | |||||||||||||||||||||||||||||||||||||||||
For footnotes, see page 434.
HSBC HOLDINGS PLC
435 |
Table of Contents
Notes on the Financial Statements(continued)
33 – Foreign exchange exposures / 34 – Non-controlling interests / 35 – Share capital
Structural foreign exchange exposures
HSBC’s structural foreign exchange exposures are represented by the net asset value of its foreign exchange equity and subordinated debt investments in subsidiaries, branches, joint ventures and associates with non-US dollar functional currencies. Gains or losses on structural foreign exchange exposures are recognised in other comprehensive income. HSBC’s management of its structural foreign exchange exposures is discussed on page 171.
Net structural foreign exchange exposures
| 2015 | 2014 | |||||||||||
| $m | $m | |||||||||||
Currency of structural exposure | ||||||||||||
Pound sterling1 | 32,701 | 30,071 | ||||||||||
Hong Kong dollars | 28,270 | 24,028 | ||||||||||
Chinese renminbi | 24,117 | 24,578 | ||||||||||
Euros | 19,966 | 20,378 | ||||||||||
Mexican pesos | 4,228 | 5,249 | ||||||||||
Indian rupees | 3,645 | 3,466 | ||||||||||
Canadian dollars | 3,595 | 4,187 | ||||||||||
Saudi riyals | 3,109 | 2,910 | ||||||||||
Brazilian real | 2,865 | 4,910 | ||||||||||
Swiss francs | 2,642 | 1,864 | ||||||||||
Malaysian ringgit | 1,994 | 2,219 | ||||||||||
UAE dirhams | 1,898 | 2,199 | ||||||||||
Taiwanese dollars | 1,702 | 1,721 | ||||||||||
Singapore dollars | 1,454 | 1,185 | ||||||||||
Australian dollars | 1,396 | 1,516 | ||||||||||
Indonesian rupiah | 1,303 | 1,352 | ||||||||||
Korean won | 1,296 | 1,360 | ||||||||||
Turkish lira | 1,006 | 1,366 | ||||||||||
Egyptian pounds | 925 | 868 | ||||||||||
Argentine pesos | 875 | 1,059 | ||||||||||
Others, each less than $700m | 5,775 | 5,918 | ||||||||||
At 31 December | 144,762 | 142,404 | ||||||||||
| 1 | During 2015, we entered into new forward exchange contracts amounting to $2.6bn (2014: $1.6bn) in order to manage our sterling structural foreign exchange exposure. |
Shareholders’ equity would decrease by $2,633m (2014: $2,522m) if euro and sterling foreign currency exchange rates weakened by 5% relative to the US dollar.
| 2015 | 2014 | |||||||||||
| $m | $m | |||||||||||
Non-controlling interests attributable to holders of ordinary shares in subsidiaries | 6,981 | 7,104 | ||||||||||
Preferred securities issued by subsidiaries | 2,077 | 2,427 | ||||||||||
At 31 December | 9,058 | 9,531 | ||||||||||
Preferred securities issued by subsidiaries
Preferred securities are securities for which there is no obligation to pay a dividend and, if the dividend is not paid, it may not be cumulative. Such securities do not generally carry voting rights but rank higher than ordinary shares for dividend payments and in the event of a winding-up. These securities have no stated maturity date but may be called and redeemed by the issuer, subject to prior notification to the PRA and, where relevant, the consent of the local banking regulator. Dividends on floating rate preferred securities are generally related to interbank offer rates.
Included in the capital base of HSBC are non-cumulative preferred securities classified as additional tier 1 capital and cumulative preferred securities classified as tier 2 capital in accordance with CRD IV rules, by virtue of the application of grandfathering provisions.
HSBC HOLDINGS PLC
436 |
Table of Contents
Preferred securities issued by HSBC’s subsidiaries
First call date | 2015 $m | 2014 $m | ||||||||||||||||
HSBC USA Inc. | ||||||||||||||||||
$150m1 | Depositary shares each representing 25% interest in a share of adjustable-rate cumulative preferred stock, series D | Jul 1999 | – | 150 | ||||||||||||||
$150m2 | Cumulative preferred stock | Oct 2007 | – | 150 | ||||||||||||||
$518m | Floating rate non-cumulative preferred stock, series F | Apr 2010 | 518 | 518 | ||||||||||||||
$374m | Floating rate non-cumulative preferred stock, series G | Jan 2011 | 374 | 374 | ||||||||||||||
$374m | 6.50% non-cumulative preferred stock, series H | Jul 2011 | 374 | 374 | ||||||||||||||
HSBC Finance Corporation | ||||||||||||||||||
$575m | 6.36% non-cumulative preferred stock, series B | Jun 2010 | 559 | 559 | ||||||||||||||
HSBC Bank Canada | ||||||||||||||||||
CAD175m | Non-cumulative redeemable class 1 preferred shares, series C | Jun 2010 | 126 | 151 | ||||||||||||||
CAD175m | Non-cumulative class 1 preferred shares, series D | Dec 2010 | 126 | 151 | ||||||||||||||
At 31 December | 2,077 | 2,427 | ||||||||||||||||
| 1 | In May 2015, HSBC redeemed its depositary shares representing 25% interest in a share of adjustable-rate cumulative preferred stock, series D for $152m. |
| 2 | In May 2015, HSBC redeemed its cumulative preferred stock for $152m. |
35Called up share capital and other equity instruments
Accounting policy
Financial instruments issued are classified as equity when there is no contractual obligation to transfer cash or other financial assets or issue a variable number of own equity instruments. Incremental costs directly attributable to the issue of equity instruments are shown in equity as a deduction from the proceeds, net of tax.
HSBC Holdings equity instruments held by HSBC are recognised in equity as a deduction from retained earnings until they are cancelled. When such instruments are subsequently sold, reissued or otherwise disposed of, any consideration received is included in equity, net of any directly attributable incremental transaction costs and related income tax effects. |
Issued and fully paid
HSBC Holdings ordinary shares of $0.50 each
| HSBC Holdings ordinary shares1 at 31 December | 2015 $m
9,842 | 2014 $m
9,609 | ||||||||||
| Number | $m | |||||||||||
At 1 January 2015 | 19,217,874,260 | 9,609 | ||||||||||
Shares issued under HSBC employee share plans | 91,265,909 | 45 | ||||||||||
Shares issued in lieu of dividends | 375,956,765 | 188 | ||||||||||
At 31 December 2015 | 19,685,096,934 | 9,842 | ||||||||||
At 1 January 2014 | 18,830,007,039 | 9,415 | ||||||||||
Shares issued under HSBC employee share plans | 119,391,238 | 60 | ||||||||||
Shares issued in lieu of dividends | 268,475,983 | 134 | ||||||||||
At 31 December 2014 | 19,217,874,260 | 9,609 | ||||||||||
HSBC Holdings non-cumulative preference shares of $0.01 each
| Number | $m | |||||||||||
At 1 January 2015 and 31 December 20152 | 1,450,000 | – | ||||||||||
At 1 January 2014 and 31 December 2014 | 1,450,000 | – | ||||||||||
| 1 | All HSBC Holdings ordinary shares in issue confer identical rights, including in respect of capital, dividends and voting. |
| 2 | Included in the capital base of HSBC as additional tier 1 capital in accordance with the CRD IV rules, by virtue of the application of grandfathering provisions. |
Dividends on the HSBC Holdings non-cumulative dollar preference shares in issue (‘dollar preference shares’) are paid quarterly at the sole and absolute discretion of the Board of Directors. The Board of Directors will not declare a dividend on the dollar preference shares if payment of the dividend would cause HSBC Holdings not to meet the applicable capital adequacy requirements of the PRA or the profit of HSBC Holdings available for distribution as dividends is not sufficient to enable HSBC Holdings to pay in full both dividends on the dollar preference shares and dividends on any other shares that are scheduled to be paid on the same date and that have an equal right to dividends. HSBC Holdings may not declare or pay dividends on any class of its shares ranking lower in the right to dividends than the dollar preference shares nor redeem nor purchase in any manner any of its other shares ranking equal with or lower than the dollar preference shares unless it has paid in full, or set aside an amount to provide for payment in full, the dividends on the dollar preference shares for the then current dividend
HSBC HOLDINGS PLC
437 |
Table of Contents
Notes on the Financial Statements(continued)
35 – Share capital / 36 – Notes on the statement of cash flows
period. The dollar preference shares carry no rights to conversion into ordinary shares of HSBC Holdings. Holders of the dollar preference shares will only be entitled to attend and vote at general meetings of shareholders of HSBC Holdings if the dividend payable on the dollar preference shares has not been paid in full for four consecutive dividend payment dates. In such circumstances, holders of the dollar preference shares will be entitled to vote on all matters put to general meetings until such time as HSBC Holdings has paid a full dividend on the dollar preference shares. HSBC Holdings may redeem the dollar preference shares in whole at any time on or after 16 December 2010, subject to prior notification to the PRA.
HSBC Holdings non-cumulative preference share of £0.01
The one non-cumulative sterling preference share of £0.01 in issue (‘sterling preference share’) has been in issue since 29 December 2010 and is held by a subsidiary of HSBC Holdings. Dividends on the sterling preference share are paid quarterly at the sole and absolute discretion of the Board. The sterling preference share carries no rights of conversion into ordinary shares of HSBC Holdings and no rights to attend and vote at general meetings of shareholders of HSBC Holdings. HSBC Holdings may redeem it in whole at any time at the option of the Company.
Other equity instruments
HSBC has included three types of additional tier 1 capital securities in its tier 1 capital. The two types of additional tier 1 securities presented in this Note are accounted for as equity because HSBC does not have an obligation to transfer cash or a variable number of its own ordinary shares to holders under any circumstances outside its control. See Note 30 for additional tier 1 securities accounted for as liabilities.
Other equity instruments which have been included in the regulatory capital base of HSBC comprise additional tier 1 capital securities and additional tier 1 contingent convertible securities.
Additional tier 1 capital securities
Additional tier 1 capital securities are perpetual subordinated securities on which coupon payments may be deferred at the discretion of HSBC Holdings. While any coupon payments are unpaid or deferred, HSBC Holdings will not declare, pay dividends or make distributions or similar periodic payments in respect of, or repurchase, redeem or otherwise acquire any securities of lower or equal rank. Such securities do not generally carry voting rights but rank higher than ordinary shares for coupon payments and in the event of a winding-up. These securities do not meet the identifying criteria in full for recognition as tier 1 capital under CRD IV but are eligible as regulatory capital subject to grandfathering limits and progressive phase-out.
At HSBC Holdings’ discretion, and subject to certain conditions being satisfied, the capital securities may be exchanged on any coupon payment date for non-cumulative preference shares to be issued by HSBC Holdings and rankingpari passuwith the dollar and sterling preference shares in issue. The preference shares would be issued at a nominal value of $0.01 per share and a premium of $24.99 per share, with both such amounts being subscribed and fully paid. These securities may be called and redeemed by HSBC subject to prior notification to the PRA.
HSBC’s additional tier 1 capital securities in issue which are accounted for in equity
First call date | 2015 $m | 2014 $m | ||||||||||||||||
$2,200m | 8.125% perpetual subordinated capital securities | Apr 2013 | 2,133 | 2,133 | ||||||||||||||
$3,800m | 8.00% perpetual subordinated capital securities, Series 2 | Dec 2015 | 3,718 | 3,718 | ||||||||||||||
At 31 December | 5,851 | 5,851 | ||||||||||||||||
Additional tier 1 capital – contingent convertible securities
During 2015, HSBC continued to issue contingent convertible securities that are included in HSBC’s capital base as fully CRD IV compliant additional tier 1 capital securities on an end point basis. The net proceeds of the issuances will be used for general corporate purposes and to further strengthen the capital base pursuant to requirements under CRD IV. These securities bear a fixed rate of interest until their initial call dates. After the initial call dates, in the event they are not redeemed, the securities will bear interest at rates which are fixed periodically in advance for five-year periods based on prevailing market rates. Interest on the contingent convertible securities will be due and payable only at the sole discretion of HSBC, and HSBC has sole and absolute discretion at all times and for any reason to cancel (in whole or in part) any interest payment that would otherwise be payable on any interest payment date. There are limitations on the payment of distributions if such payments are prohibited under UK banking regulations, or other requirements, if HSBC Holdings has insufficient reserves available for distribution or if HSBC fails to satisfy the solvency condition as defined in the securities’ terms.
The contingent convertible securities are undated and are repayable, at the option of HSBC, in whole at the initial call date, or on any fifth anniversary after the initial call date. In addition, the securities are repayable at the option of HSBC in whole for certain regulatory or tax reasons. Any repayments require the prior consent of the PRA. These securities rankpari passu with HSBC’s dollar and sterling preference shares and are therefore ahead of ordinary shares. The contingent convertible securities will be converted into fully paid ordinary shares of HSBC at a pre-determined price should HSBC’s consolidated end point CET1 ratio fall below 7.0%. Therefore, in accordance with the terms of the securities, if the end point CET1 ratio breaches the 7.0% trigger the securities will convert into ordinary shares at fixed contractual conversion prices in the issuance currencies of the
HSBC HOLDINGS PLC
438 |
Table of Contents
relevant securities equivalent to £2.70 at the prevailing rate of exchange on the issuance date subject to certain anti-dilution adjustments.
HSBC’s additional tier 1 capital – contingent convertible securities in issue which are accounted for in equity
First call date | 2015 $m | 2014 $m | ||||||||||||||||
$2,250m | 6.375% perpetual subordinated contingent convertible securities | Sep 2024 | 2,244 | 2,244 | ||||||||||||||
$1,500m | 5.625% perpetual subordinated contingent convertible securities | Jan 2020 | 1,494 | 1,494 | ||||||||||||||
€1,500m | 5.25% perpetual subordinated contingent convertible securities | Sep 2022 | 1,943 | 1,943 | ||||||||||||||
$2,450m | 6.375% perpetual subordinated contingent convertible securities | Mar 2025 | 2,459 | – | ||||||||||||||
€1,000m | 6.000% perpetual subordinated contingent convertible securities | Sep 2023 | 1,121 | – | ||||||||||||||
At 31 December |
| 9,261 | 5,681 | |||||||||||||||
Shares under option
For details of the options outstanding to subscribe for HSBC Holdings ordinary shares under the HSBC Holdings savings-related share option plans, see Note 6.
Aggregate options outstanding under these plans
Number of HSBC Holdings | Period of exercise | Exercise price | ||||||||||||
31 December 2015 | 72,840,810 | 2015 to 2021 | £4.0472 – 5.4738 | |||||||||||
| 1,114,830 | 2015 to 2018 | HK$55.4701 – 63.9864 | ||||||||||||
| 153,610 | 2015 to 2018 | €5.3532 – 6.0657 | ||||||||||||
| 665,445 | 2015 to 2018 | $7.1456 – 8.2094 | ||||||||||||
31 December 2014 | 63,918,042 | 2014 to 2020 | £3.3116 – 7.9911 | |||||||||||
| 6,468,782 | 2014 to 2018 | HK$37.8797 – 63.9864 | ||||||||||||
| 571,502 | 2014 to 2018 | €3.6361 – 6.0657 | ||||||||||||
| 1,867,328 | 2014 to 2018 | $4.8876 – 8.2094 | ||||||||||||
31 December 2013 | 119,085,250 | 2013 to 2019 | £3.3116 – 7.9911 | |||||||||||
| 24,215,341 | 2013 to 2018 | HK$37.8797 – 92.5881 | ||||||||||||
| 1,574,652 | 2013 to 2018 | €3.6361 – 7.5571 | ||||||||||||
| 3,997,069 | 2013 to 2018 | $4.8876 – 11.8824 | ||||||||||||
Maximum obligation to deliver HSBC Holdings ordinary shares
At 31 December 2015, the maximum obligation to deliver HSBC Holdings ordinary shares under all of the above option arrangements and the HSBC International Employee Share Purchase Plan, together with GPSP awards and restricted share awards granted under the HSBC Share Plan and/or the HSBC Share Plan 2011, was 193,178,906 (2014: 193,154,512). The total number of shares at 31 December 2015 held by employee benefit trusts that may be used to satisfy such obligations to deliver HSBC Holdings ordinary shares was 4,753,747 (2014: 7,943,191).
36Notes on the statement of cash flows
Other non-cash items included in profit before tax
| HSBC | HSBC Holdings | |||||||||||||||||||||||||||||
| 2015 | 2014 | 2013 | 2015 | 2014 | ||||||||||||||||||||||||||
| $m | $m | $m | $m | $m | ||||||||||||||||||||||||||
Depreciation, amortisation and impairment | 2,181 | 2,251 | 2,330 | 30 | 39 | |||||||||||||||||||||||||
(Gains)/losses arising from dilution of interests in associates | – | 32 | (1,051) | – | – | |||||||||||||||||||||||||
Revaluations on investment property | (61 | ) | (120 | ) | (113) | – | – | |||||||||||||||||||||||
Share-based payment expense | 757 | 732 | 630 | 86 | 74 | |||||||||||||||||||||||||
Loan impairment losses gross of recoveries and other credit risk provisions | 4,546 | 5,125 | 7,356 | – | – | |||||||||||||||||||||||||
Provisions | 3,210 | 3,074 | 2,578 | – | – | |||||||||||||||||||||||||
Impairment/(release of impairment) of financial investments | 94 | 54 | (36) | – | – | |||||||||||||||||||||||||
Charge for defined benefit plans | 262 | 535 | 121 | – | – | |||||||||||||||||||||||||
Accretion of discounts and amortisation of premiums | (224 | ) | (421 | ) | 180 | (2 | ) | (61) | ||||||||||||||||||||||
Year ended 31 December | 10,765 | 11,262 | 11,995 | 114 | 52 | |||||||||||||||||||||||||
HSBC HOLDINGS PLC
439 |
Table of Contents
Notes on the Financial Statements(continued)
36 – Notes on the statement of cash flows / 37 – Contingent liabilities
Change in operating assets
| HSBC | HSBC Holdings | |||||||||||||||||||||||||||||
| 2015 | 2014 | 2013 | 2015 | 2014 | ||||||||||||||||||||||||||
| $m | $m | $m | $m | $m | ||||||||||||||||||||||||||
Change in loans to HSBC undertakings | – | – | – | (729 | ) | 1,364 | ||||||||||||||||||||||||
Change in net trading securities and net derivatives | 24,384 | (18,498 | ) | (24,870 | ) | 1,413 | 483 | |||||||||||||||||||||||
Change in loans and advances to banks | 1,218 | 5,147 | (4,739 | ) | – | – | ||||||||||||||||||||||||
Change in loans and advances to customers | 31,753 | 12,666 | (46,551 | ) | – | – | ||||||||||||||||||||||||
Change in reverse repurchase agreements – non-trading | (3,011 | ) | 18,900 | (70,403 | ) | – | – | |||||||||||||||||||||||
Change in financial assets designated at fair value | 2,394 | 3,269 | (4,922 | ) | – | – | ||||||||||||||||||||||||
Change in other assets | 9,090 | 4,393 | 2,586 | (141 | ) | 7 | ||||||||||||||||||||||||
Year ended 31 December | 65,828 | 25,877 | (148,899 | ) | 543 | 1,854 | ||||||||||||||||||||||||
Change in operating liabilities
|
| |||||||||||||||||||||||||||||
| HSBC | HSBC Holdings | |||||||||||||||||||||||||||||
| 2015 | 2014 | 2013 | 2015 | 2014 | ||||||||||||||||||||||||||
| $m | $m | $m | $m | $m | ||||||||||||||||||||||||||
Change in deposits by banks | (21,534 | ) | (9,081 | ) | (7,781 | ) | – | – | ||||||||||||||||||||||
Change in customer accounts | (44,373 | ) | (8,362 | ) | 57,365 | – | – | |||||||||||||||||||||||
Change in repurchase agreements – non-trading | (26,481 | ) | (56,788 | ) | 123,653 | – | – | |||||||||||||||||||||||
Change in debt securities in issue | 960 | (8,133 | ) | (15,381 | ) | (49 | ) | (149 | ) | |||||||||||||||||||||
Change in financial liabilities designated at fair value | (10,785 | ) | (10,734 | ) | 994 | (1,228 | ) | (694 | ) | |||||||||||||||||||||
Change in other liabilities | (4,549 | ) | (716 | ) | 5,907 | (1,065 | ) | (9,071 | ) | |||||||||||||||||||||
Year ended 31 December | (106,762 | ) | (93,814 | ) | 164,757 | (2,342 | ) | (9,914 | ) | |||||||||||||||||||||
Interest and dividends
|
| |||||||||||||||||||||||||||||
| HSBC | HSBC Holdings | |||||||||||||||||||||||||||||
| 2015 | 2014 | 2013 | 2015 | 2014 | ||||||||||||||||||||||||||
| $m | $m | $m | $m | $m | ||||||||||||||||||||||||||
Interest paid | (14,559 | ) | (15,633 | ) | (17,262 | ) | (2,309 | ) | (2,463 | ) | ||||||||||||||||||||
Interest received | 47,623 | 51,522 | 50,823 | 2,026 | 1,945 | |||||||||||||||||||||||||
Dividends received | 914 | 1,199 | 1,133 | 8,469 | 9,077 | |||||||||||||||||||||||||
Cash and cash equivalents
Accounting policy
Cash and cash equivalents include highly liquid investments that are readily convertible to known amounts of cash and which are subject to an insignificant risk of change in value. Such investments are normally those with less than three months’ maturity from the date of acquisition.
|
Cash and cash equivalents
| HSBC | HSBC Holdings | |||||||||||||||||||||||||||||
| 2015 | 2014 | 2013 | 2015 | 2014 | ||||||||||||||||||||||||||
| $m | $m | $m | $m | $m | ||||||||||||||||||||||||||
Cash at bank with HSBC undertakings | – | – | – | 242 | 249 | |||||||||||||||||||||||||
Cash and balances at central banks | 98,934 | 129,957 | 166,599 | – | – | |||||||||||||||||||||||||
Items in the course of collection from other banks | 5,768 | 4,927 | 6,021 | – | – | |||||||||||||||||||||||||
Loans and advances to banks of one month or less | 70,985 | 89,285 | 96,584 | – | – | |||||||||||||||||||||||||
Reverse repurchase agreements with banks of one month or less | 53,971 | 68,930 | 68,007 | – | – | |||||||||||||||||||||||||
Treasury bills, other bills and certificates of deposit less than three months | 19,843 | 14,192 | 15,980 | – | – | |||||||||||||||||||||||||
Less: items in the course of transmission to other banks | (5,638 | ) | (5,990 | ) | (6,910 | ) | – | – | ||||||||||||||||||||||
At 31 December | 243,863 | 301,301 | 346,281 | 242 | 249 | |||||||||||||||||||||||||
The amount of cash and cash equivalents not available for use by HSBC at 31 December 2015 was $33,744m (2014: $43,738m), of which $21,773m (2014: $29,883m) related to mandatory deposits at central banks.
Disposal of subsidiaries and businesses
During 2014, we completed the disposals of HSBC Bank Middle East Limited’s banking business in Jordan and operations in Pakistan. This resulted in a net $303m outflow of cash and cash equivalents which is included under ‘Cash flow from investing activities’ in the consolidated statement of cash flows on page 340.
In October 2013, we completed the disposal of HSBC Bank (Panama) S.A., receiving total cash consideration of $2,210m which is included under ‘Cash flow from investing activities’ in the consolidated statement of cash flows on page 340.
HSBC HOLDINGS PLC
440 |
Table of Contents
37Contingent liabilities, contractual commitments and guarantees
Accounting policy
Contingent liabilities
Contingent liabilities, which include certain guarantees and letters of credit pledged as collateral security and contingent liabilities related to legal proceedings or regulatory matters (see Note 40), are possible obligations that arise from past events whose existence will be confirmed only by the occurrence, or non-occurrence, of one or more uncertain future events not wholly within the control of HSBC; or are present obligations that have arisen from past events but are not recognised because it is not probable that settlement will require the outflow of economic benefits, or because the amount of the obligations cannot be reliably measured. Contingent liabilities are not recognised in the financial statements but are disclosed unless the probability of settlement is remote.
Financial guarantee contracts
Financial guarantee contracts are contracts that require HSBC to make specified payments to reimburse the holder for a loss incurred because a specified debtor fails to make payment when due. Liabilities under financial guarantee contracts which are not classified as insurance contracts are recorded initially at their fair value, which is generally the fee received or present value of the fee receivable. Subsequently, financial guarantee liabilities are measured at the higher of the initial fair value, less cumulative amortisation, and the best estimate of the expenditure required to settle the obligations.
HSBC Holdings has issued financial guarantees and similar contracts to other Group entities. HSBC elects to account for certain guarantees as insurance contracts in HSBC Holdings’ financial statements, in which case they are measured and recognised as insurance liabilities. This election is made on a contract by contract basis, and is irrevocable.
|
Contingent liabilities, contractual commitments and guarantees
| HSBC | HSBC Holdings | |||||||||||||||||||||||
| 2015 | 2014 | 2015 | 2014 | |||||||||||||||||||||
| $m | $m | $m | $m | |||||||||||||||||||||
Guarantees and contingent liabilities | ||||||||||||||||||||||||
Guarantees | 85,855 | 86,385 | 68,333 | 52,023 | ||||||||||||||||||||
Other contingent liabilities | 490 | 346 | – | – | ||||||||||||||||||||
At 31 December | 86,345 | 86,731 | 68,333 | 52,023 | ||||||||||||||||||||
Commitments | ||||||||||||||||||||||||
Documentary credits and short-term trade-related transactions | 10,168 | 12,082 | – | – | ||||||||||||||||||||
Forward asset purchases and forward forward deposits placed | 981 | 823 | – | – | ||||||||||||||||||||
Undrawn formal standby facilities, credit lines and other commitments to lend | 655,281 | 638,475 | – | 16 | ||||||||||||||||||||
At 31 December | 666,430 | 651,380 | – | 16 | ||||||||||||||||||||
The above table discloses the nominal principal amounts of commitments, guarantees and other contingent liabilities. Contingent liabilities arising from legal proceedings, regulatory and other matters against Group companies are disclosed in Notes 29 and 40. Nominal principal amounts represent the amounts at risk should the contracts be fully drawn upon and clients default. As a significant portion of guarantees and commitments is expected to expire without being drawn upon, the total of the nominal principal amounts is not indicative of future liquidity requirements.
Guarantees
| 2015 | 2014 | |||||||||||||||||||||||
Guarantees in favour of third parties | Guarantees by HSBC Holdings in favour of other Group entities | Guarantees in favour of third parties | Guarantees by HSBC Holdings in favour of other Group entities | |||||||||||||||||||||
| $m | $m | $m | $m | |||||||||||||||||||||
Guarantee type | ||||||||||||||||||||||||
Financial guarantees | 27,643 | 55,000 | 30,406 | 36,800 | ||||||||||||||||||||
Credit-related guarantees1 | 18,473 | 13,333 | 16,672 | 15,223 | ||||||||||||||||||||
Other guarantees | 39,739 | – | 39,307 | – | ||||||||||||||||||||
At 31 December | 85,855 | 68,333 | 86,385 | 52,023 | ||||||||||||||||||||
| 1 | Credit-related guarantees are contracts that have similar features to financial guarantee contracts but fail to meet the definition of a financial guarantee contract under IAS 39. |
The amounts disclosed in the above table are nominal principal amounts and reflect HSBC’s maximum exposure under a large number of individual guarantee undertakings. The risks and exposures arising from guarantees are captured and managed in accordance with HSBC’s overall credit risk management policies and procedures. Approximately half the above guarantees have a term of less than one year. Guarantees with terms of more than one year are subject to HSBC’s annual credit review process.
HSBC HOLDINGS PLC
441 |
Table of Contents
Notes on the Financial Statements(continued)
38 – Lease commitments / 39 – Structured entities
Financial Services Compensation Scheme
The Financial Services Compensation Scheme (‘FSCS’) has provided compensation to consumers following the collapse of a number of deposit takers. The compensation paid out to consumers is currently funded through loans from HM Treasury which at 31 December 2015 stood at approximately £16bn ($23.7bn).
The Group could be liable to pay a proportion of the outstanding amount that the FSCS has borrowed from HM Treasury. The ultimate FSCS levy to the industry as a result of the collapses cannot currently be estimated reliably as it is dependent on various uncertain factors including the potential recoveries of assets by the FSCS and changes in the level of protected deposits and the population of FSCS members at the time.
Capital commitments
In addition to the commitments disclosed on page 441, at 31 December 2015 HSBC had $468m (2014: $656m) of capital commitments contracted but not provided for and $100m (2014: $101m) of capital commitments authorised but not contracted for.
Associates
HSBC’s share of associates’ contingent liabilities amounted to $39,222m at 31 December 2015 (2014: $47,593m). No matters arose where HSBC was severally liable.
Accounting policy
Agreements which transfer substantially all the risks and rewards incidental to the ownership of assets are classified as finance leases. As a lessor under finance leases, HSBC presents the amounts due under the leases after deduction of unearned charges in ‘Loans and advances to banks’ or ‘Loans and advances to customers’. As a lessee under finance leases, HSBC presents the leased assets in ‘Property, plant and equipment’ with the corresponding liability included in ‘Other liabilities’. A finance lease asset and its corresponding liability are recognised initially at the fair value of the asset or, if lower, the present value of the minimum lease payments.
All other leases are classified as operating leases. As lessor, HSBC presents assets subject to operating leases in ‘Property, plant and equipment’. Impairment losses are recognised to the extent that carrying values are not fully recoverable. As a lessee, leased assets are not recognised on the balance sheet.
Finance income or charges on finance leases are recognised in ‘Net interest income’ over the lease periods so as to give a constant rate of return. Rentals payable or receivable under operating leases are spread on a straight-line basis over the lease periods and are recognised in ‘General and administrative expenses’ or in ‘Other operating income’.
|
Operating lease commitments
At 31 December 2015, future minimum lease payments under non-cancellable operating leases for land, buildings and equipment were $5,333m (2014: $5,372m).
Finance lease receivables
HSBC leases a variety of assets to third parties under finance leases, including transport assets (such as aircraft), property and general plant and machinery. At the end of lease terms, assets may be sold to third parties or leased for further terms. Rentals are calculated to recover the cost of assets less their residual value, and earn finance income.
| 2015 | 2014 | |||||||||||||||||||||||||||||||||||
Total future payments | Unearned finance income | Present value | Total future payments | Unearned finance income | Present value | |||||||||||||||||||||||||||||||
| $m | $m | $m | $m | $m | $m | |||||||||||||||||||||||||||||||
Lease receivables: | ||||||||||||||||||||||||||||||||||||
– no later than one year | 3,382 | (332 | ) | 3,050 | 3,383 | (374 | ) | 3,009 | ||||||||||||||||||||||||||||
– later than one year and no later than five years | 7,219 | (837 | ) | 6,382 | 8,089 | (980 | ) | 7,109 | ||||||||||||||||||||||||||||
– later than five years | 4,897 | (702 | ) | 4,195 | 5,013 | (744 | ) | 4,269 | ||||||||||||||||||||||||||||
At 31 December | 15,498 | (1,871 | ) | 13,627 | 16,485 | (2,098 | ) | 14,387 | ||||||||||||||||||||||||||||
Accounting policy
A structured entity is an entity that has been designed so that voting or similar rights are not the dominant factor in deciding who controls the entity, for example when any voting rights relate to administrative tasks only, and key activities are directed by contractual arrangements. Structured entities often have restricted activities and a narrow and well defined objective.
Structured entities are assessed for consolidation in accordance with the accounting policy set out in Note 1.
|
HSBC is mainly involved with structured entities through the securitisation of financial assets, conduits and investment funds.
HSBC HOLDINGS PLC
442 |
Table of Contents
HSBC’s arrangements that involve structured entities are authorised centrally when they are established to ensure appropriate purpose and governance. The activities of structured entities administered by HSBC are closely monitored by senior management. The Group is involved with both consolidated and unconsolidated structured entities which are established either by HSBC or a third party, as detailed below.
Consolidated structured entities
Total assets of HSBC’s consolidated structured entities, split by entity type
| Conduits | Securitisations | HSBC managed funds | Other | Total | ||||||||||||||||||||||||||
| $bn | $bn | $bn | $bn | $bn | ||||||||||||||||||||||||||
At 31 December 2015 | 25.9 | 5.6 | 8.2 | 5.7 | 45.4 | |||||||||||||||||||||||||
At 31 December 2014 | 27.2 | 7.9 | 11.2 | 6.7 | 53.0 | |||||||||||||||||||||||||
Conduits
HSBC has established and manages two types of conduits: securities investment conduits (‘SIC’s) and multi-seller conduits. These entities have been designed so that voting or similar rights are not the dominant factor in deciding who has control: in such cases, the relevant activities are directed by means of contractual arrangement. The conduits are consolidated as HSBC is exposed to or has the right to variable returns from its involvement with the entity and has the ability to affect its returns through its power over the entity.
Securities investment conduits
Solitaire, HSBC’s principal SIC, purchases highly rated ABSs to facilitate tailored investment opportunities. At 31 December 2015, Solitaire held $6.2bn of ABSs (2014: $8.0bn). These are included within the disclosures of ABSs ‘held through consolidated structured entities’ on page 153. HSBC’s other SICs, Mazarin, Barion and Malachite, evolved from the restructuring of the Group’s structured investment vehicles in 2008.
| • | Solitaire – Solitaire is currently funded entirely by commercial paper (‘CP’) issued to HSBC. Although HSBC continues to provide a liquidity facility, Solitaire has no need to draw on it as long as HSBC purchases its issued CP, which HSBC intends to do for the foreseeable future. At 31 December 2015, HSBC held $8bn of CP (2014: $9.5bn). |
| • | Mazarin – HSBC is exposed to the par value of Mazarin’s assets through the provision of a liquidity facility equal to the lesser of the amortised cost of issued senior debt and the amortised cost of non-defaulted assets. At 31 December 2015, this amounted to $1.8bn (2014: $3.9bn). First loss protection is provided through the capital notes issued by Mazarin, which are substantially all held by third parties. |
At 31 December 2015, HSBC held 2.7% of Mazarin’s capital notes (2014: 1.2%) with a par value of $13m (2014: $10m) and a carrying amount of $4m (2014: $1.4m).
| • | Barion and Malachite – HSBC’s primary exposure to these SICs is represented by the amortised cost of the debt required to support the non-cash assets of the vehicles. At 31 December 2015, this amounted to $1.4bn (2014: $3.0bn). First loss protection is provided through the capital notes issued by these vehicles, which are substantially all held by third parties. |
At 31 December 2015, HSBC held 13.7% of the capital notes (2014: 9.9%) issued by these vehicles with a par value of $42.2m (2014: $54.8m) and a carrying amount of $20.3m (2014: $10.1m).
Multi-seller conduits
Multi-seller conduits were established for the purpose of providing access to flexible market-based sources of finance for HSBC’s clients. HSBC bears risk equal to the transaction-specific liquidity facilities offered to the multi-seller conduits amounting to $19.8bn at 31 December 2015 (2014: $15.4bn). First loss protection is provided by the originator of the assets, and not by HSBC, through transaction-specific credit enhancements. A layer of secondary loss protection is provided by HSBC in the form of programme-wide enhancement facilities.
Securitisations
HSBC uses structured entities to securitise customer loans and advances that it has originated in order to diversify its sources of funding for asset origination and capital efficiency purposes. The loans and advances are transferred by HSBC to the structured entities for cash or synthetically through credit default swaps, and the structured entities issue debt securities to investors.
HSBC managed funds
HSBC has established a number of money market and non-money market funds. Where it is deemed to be acting as principal rather than agent in its role as investment manager, HSBC controls and hence consolidates these funds.
HSBC HOLDINGS PLC
443 |
Table of Contents
Notes on the Financial Statements(continued)
39 – Structured entities / 40 – Legal proceedings and regulatory matters
Other
HSBC has also entered into a number of transactions in the normal course of business which include asset and structured finance transactions where it has control of the structured entity. In addition, HSBC is deemed to control a number of third-party managed funds through its involvement as a principal in the funds.
Unconsolidated structured entities
The term ‘unconsolidated structured entities’ refers to all structured entities that are not controlled by HSBC. The Group enters into transactions with unconsolidated structured entities in the normal course of business to facilitate customer transactions and for specific investment opportunities.
The table below shows the total assets of unconsolidated structured entities in which HSBC had an interest at the reporting date and its maximum exposure to loss in relation to those interests.
Nature and risks associated with HSBC interests in unconsolidated structured entities
| Securitisations | HSBC managed funds | Non-HSBC managed funds | Other | Total | ||||||||||||||||||||||||||
| $bn | $bn | $bn | $bn | $bn | ||||||||||||||||||||||||||
Total assets of the entities | 12.9 | 227.9 | 2,003.1 | 139.9 | 2,383.8 | |||||||||||||||||||||||||
Total assets in relation to HSBC’s interests in the unconsolidated structured entities | 1.4 | 5.6 | 8.0 | 9.8 | 24.8 | |||||||||||||||||||||||||
– trading assets | – | 0.1 | 0.2 | 2.6 | 2.9 | |||||||||||||||||||||||||
– financial assets designated at fair value | – | 5.3 | 6.6 | – | 11.9 | |||||||||||||||||||||||||
– derivatives | – | – | – | 3.8 | 3.8 | |||||||||||||||||||||||||
– loans and advances to banks | – | – | – | 0.1 | 0.1 | |||||||||||||||||||||||||
– loans and advances to customers | 1.1 | – | 0.1 | 2.9 | 4.1 | |||||||||||||||||||||||||
– financial investments | 0.3 | 0.2 | 1.1 | 0.2 | 1.8 | |||||||||||||||||||||||||
– other assets | – | – | – | 0.2 | 0.2 | |||||||||||||||||||||||||
Total liabilities in relation to HSBC’s interests in the unconsolidated structured entities | – | – | – | (0.1 | ) | (0.1 | ) | |||||||||||||||||||||||
Other liabilities | – | – | – | (0.1 | ) | (0.1 | ) | |||||||||||||||||||||||
| ||||||||||||||||||||||||||||||
HSBC’s maximum exposure at 31 December 2015 | 3.5 | 5.6 | 8.0 | 14.6 | 31.7 | |||||||||||||||||||||||||
Total assets of the entities | 11.0 | 308.5 | 2,899.9 | 32.8 | 3,252.2 | |||||||||||||||||||||||||
Total assets in relation to HSBC’s interests in the unconsolidated structured entities | 0.8 | 7.8 | 8.3 | 7.7 | 24.6 | |||||||||||||||||||||||||
– trading assets | – | 0.1 | 0.1 | 4.6 | 4.8 | |||||||||||||||||||||||||
– financial assets designated at fair value | – | 5.2 | 2.3 | – | 7.5 | |||||||||||||||||||||||||
– derivatives | – | – | – | 1.3 | 1.3 | |||||||||||||||||||||||||
– loans and advances to banks | – | – | – | 0.1 | 0.1 | |||||||||||||||||||||||||
– loans and advances to customers | 0.8 | – | – | 1.5 | 2.3 | |||||||||||||||||||||||||
– financial investments | – | 2.5 | 5.9 | 0.1 | 8.5 | |||||||||||||||||||||||||
– other assets | – | – | – | 0.1 | 0.1 | |||||||||||||||||||||||||
Total liabilities in relation to HSBC’s interests in the unconsolidated structured entities | – | – | – | 0.1 | 0.1 | |||||||||||||||||||||||||
Other liabilities | – | – | – | 0.1 | 0.1 | |||||||||||||||||||||||||
| ||||||||||||||||||||||||||||||
HSBC’s maximum exposure at 31 December 2014 | 0.8 | 7.8 | 8.3 | 11.1 | 28.0 | |||||||||||||||||||||||||
The maximum exposure to loss from HSBC’s interests in unconsolidated structured entities represents the maximum loss that HSBC could incur as a result of its involvement with unconsolidated structured entities regardless of the probability of the loss being incurred.
| • | For commitments, guarantees and written credit default swaps, the maximum exposure to loss is the notional amount of potential future losses. |
| • | For retained and purchased investments in and loans to unconsolidated structured entities, the maximum exposure to loss is the carrying value of these interests at the balance sheet reporting date. |
The maximum exposure to loss is stated gross of the effects of hedging and collateral arrangements entered into to mitigate HSBC’s exposure to loss.
Securitisations
HSBC has interests in unconsolidated securitisation vehicles through holding notes issued by these entities. In addition, HSBC has investments in ABSs issued by third party structured entities as set out on page 153.
HSBC HOLDINGS PLC
444 |
Table of Contents
HSBC managed funds
HSBC establishes and manages money market funds and non-money market investment funds to provide customers with investment opportunities. Further information on funds under management is provided on page 96.
HSBC, as fund manager, may be entitled to receive management and performance fees based on the assets under management. HSBC may also retain units in these funds.
Non-HSBC managed funds
HSBC purchases and holds units of third-party managed funds in order to facilitate both business and customer needs. In addition, HSBC enters into derivative contracts to facilitate risk management solutions for non-HSBC managed funds. Note 16 provides information on derivatives entered into by HSBC.
Other
HSBC has established structured entities in the normal course of business, such as structured credit transactions for customers, to provide finance to public and private sector infrastructure projects, and for asset and structured finance transactions.
HSBC sponsored structured entities
Accounting policy
HSBC is considered to sponsor another entity if, in addition to ongoing involvement with the entity, it had a key role in establishing that entity or in bringing together the relevant counterparties so that the transaction which is the purpose of the entity could occur. HSBC is generally not considered a sponsor if the only involvement with the entity is merely administrative in nature.
|
The amount of assets transferred to and income received from such sponsored entities during 2015 and 2014 was not significant.
40Legal proceedings and regulatory matters
HSBC is party to legal proceedings and regulatory matters in a number of jurisdictions arising out of its normal business operations. Apart from the matters described below, HSBC considers that none of these matters are material. The recognition of provisions is determined in accordance with the accounting policies set out in Note 29. While the outcome of legal proceedings and regulatory matters is inherently uncertain, management believes that, based on the information available to it, appropriate provisions have been made in respect of these matters as at 31 December 2015 (see Note 29). Where an individual provision is material, the fact that a provision has been made is stated and quantified, except to the extent doing so would be seriously prejudicial. Any provision recognised does not constitute an admission of wrongdoing or legal liability. It is not practicable to provide an aggregate estimate of potential liability for our legal proceedings and regulatory matters as a class of contingent liabilities.
Securities litigation
As a result of an August 2002 restatement of previously reported consolidated financial statements and other corporate events, including the 2002 settlement with 46 states and the District of Columbia relating to real estate lending practices, Household International, Inc. (‘Household International’) and certain former officers were named as defendants in a class action lawsuit,Jaffe v. Household International, Inc., et al., filed in August 2002 in the US District Court for the Northern District of Illinois (the ‘Illinois District Court’). The complaint asserted claims under the US Securities Exchange Act and alleged that the defendants knowingly or recklessly made false and misleading statements of material fact relating to Household International’s Consumer Lending operations, including collections, sales and lending practices, some of which ultimately led to the 2002 state settlement agreement, and facts relating to accounting practices evidenced by the financial restatement. Ultimately, a class was certified on behalf of all persons who acquired and disposed of Household International common stock between July 1999 and October 2002.
A jury trial concluded in April 2009, which was decided partly in favour of the plaintiffs. Various legal challenges to the verdict were raised in post-trial briefing.
In December 2011, following the submission of claim forms by class members, the court-appointed claims administrator reported to the Illinois District Court that the total number of claims that generated an allowed loss was 45,921, and that the aggregate amount of those claims was approximately $2.2bn. The Illinois District Court directed further proceedings before a court-appointed Special Master to address certain issues and objections regarding the remaining claims.
In October 2013, the Illinois District Court entered a partial final judgement against the defendants in the amount of approximately $2.5bn (including pre-judgement interest). The defendants appealed that partial final judgement.
In addition to the partial judgement that has been entered, there are also approximately $625m in remaining claims, prior to the imposition of pre-judgement interest, that are still subject to objections that have not yet been ruled upon by the Illinois District Court.
HSBC HOLDINGS PLC
445 |
Table of Contents
Notes on the Financial Statements(continued)
40 – Legal proceedings and regulatory matters
In May 2015, the US Court of Appeals for the Seventh Circuit issued a decision reversing the partial final judgement of the Illinois District Court and remanding the case for a new trial on loss causation, which may entail a reassessment of the quantum of damages. On remand to the Illinois District Court, the case was reassigned to a different judge, who has issued various rulings on certain preliminary issues and has entered a scheduling order that includes a trial date in June 2016.
The timing and ultimate resolution of this matter remains highly uncertain, and given the complexity and uncertainties associated with a new trial on loss causation and a reassessment of the quantum of damages, there continues to be a wide range of possible outcomes. Depending on whether and to what extent the plaintiffs are able to demonstrate loss causation, the amount of damages, based upon the claims included in the reversed partial final judgement and the other remaining claims, as well as the application of pre-judgement interest, may be up to or exceeding $3.6bn. A provision has been recognised based on management’s best estimate of probable outflows, but the amount of such provision is not disclosed as it would seriously prejudice the position of HSBC in the resolution of this matter.
Bernard L. Madoff Investment Securities LLC
Bernard L. Madoff (‘Madoff’) was arrested in December 2008 and later pleaded guilty to running a Ponzi scheme. He has acknowledged, in essence, that while purporting to invest his customers’ money in securities, he in fact never invested in securities and used other customers’ money to fulfil requests to return investments. His firm, Bernard L. Madoff Investment Securities LLC (‘Madoff Securities’), is being liquidated in the US by a trustee (the ‘Trustee’).
Various non-US HSBC companies provided custodial, administration and similar services to a number of funds incorporated outside the US whose assets were invested with Madoff Securities. Based on information provided by Madoff Securities, as at 30 November 2008, the purported aggregate value of these funds was $8.4bn, an amount that includes fictitious profits reported by Madoff. Based on information available to HSBC, we have estimated that the funds’ actual transfers to Madoff Securities minus their actual withdrawals from Madoff Securities during the time that HSBC serviced the funds totalled approximately $4bn. Various HSBC companies have been named as defendants in lawsuits arising out of Madoff Securities’ fraud.
US/UK litigation: The Trustee has brought lawsuits against various HSBC companies in the US Bankruptcy Court and in the English High Court. The Trustee’s ongoing US claims seek recovery of prepetition transfers pursuant to US bankruptcy law. The amount of these claims has not been pleaded or determined as against HSBC. The Trustee’s English action seeks recovery of unspecified transfers from Madoff Securities to or through HSBC. HSBC has not yet been served with the Trustee’s English action. The Trustee’s deadline for serving the claim has been extended through the third quarter of 2016.
Alpha Prime Fund Ltd (‘Alpha Prime’) and Senator Fund SPC (‘Senator’), co-defendants in the Trustee’s US actions, have each brought cross-claims against HSBC. These funds have also sued HSBC in Luxembourg (discussed below). In June 2015, the US Bankruptcy Court heard HSBC’s motion to dismiss Alpha Prime and Senator’s cross-claims and a decision on that motion is pending.
Fairfield Sentry Limited, Fairfield Sigma Limited and Fairfield Lambda Limited (together, ‘Fairfield’), funds whose assets were invested with Madoff Securities, commenced multiple lawsuits in the US and the British Virgin Islands (‘BVI’) against fund shareholders, including various HSBC companies that acted as nominees for HSBC clients, seeking restitution of payments made in connection with share redemptions. Fairfield’s US actions are stayed pending the outcome of the cases in the BVI (discussed below).
In September 2013, the US Court of Appeals for the Second Circuit affirmed the dismissal of purported class action claims against HSBC and others brought by investors in three Madoff-invested funds on grounds offorum non conveniens.In May 2015, plaintiffs filed a motion asking the Court of Appeals to restore their class action claims on the basis of an alleged change of law. Plaintiffs’ motion was denied by the Court of Appeals in June 2015.
In December 2014, three additional actions were filed in the US. The first is a purported class action brought in the United States District Court for the Southern District of New York (the ‘New York District Court’) by direct investors in Madoff Securities who were holding their investments as of December 2008, asserting various common law claims and seeking to recover damages lost to Madoff Securities’ fraud on account of HSBC’s purported knowledge and alleged furtherance of the fraud. HSBC moved to dismiss this action in November 2015 and a decision on that motion is pending. The other two actions were both filed by SPV Optimal SUS Ltd (‘SPV OSUS’), the purported assignee of the Madoff-invested company, Optimal Strategic US Equity Ltd. One of these actions was filed in New York state court and the other in New York District Court. In January 2015, SPV OSUS dismissedits federal lawsuit against HSBC. The state court action against HSBC remains pending.
In May 2015, an action was filed in New York District Court by two investors in the Madoff-invested fund Hermes International Fund Limited (‘Hermes’), asserting various common law claims against HSBC and seeking to recover damages lost to Madoff Securities’ fraud. HSBC’s motion to dismiss the action was filed in January 2016 and a decision on that motion is pending.
BVI litigation: Beginning in October 2009, Fairfield commenced multiple lawsuits in the BVI against numerous fund shareholders, including various HSBC companies that acted as nominees for clients of HSBC’s private banking business and other clients who invested in Fairfield. Fairfield is seeking restitution of redemption payments made by the funds to defendants on the grounds that they were mistakenly based on inflated net asset values. In April 2014, the UK Privy Council issued a ruling in favour of other defendants in the BVI actions, and issued its order in October 2014. The Privy Council ruling found in effect that Fairfield should not be entitled to recover share redemptions that were calculated on a net asset value per
HSBC HOLDINGS PLC
446 |
Table of Contents
share based on fictitious profits, and were paid to shareholders prior to the collapse of Madoff Securities. Separately, a motion was brought by defendants before the BVI court challenging the authorisation of the Fairfield liquidator (appointed in July 2009) to pursue its claims in the US. That motion was heard in March 2015 and a decision is pending.
Bermuda litigation: In January 2009, Kingate Global Fund Limited and Kingate Euro Fund Limited (together, ‘Kingate’), funds whose assets were invested with Madoff Securities, commenced an action in Bermuda against HSBC Bank Bermuda Limited for recovery of funds held in Kingate’s accounts, fees and dividends. This action is currently pending, but is not expected to move forward until there is a resolution as to the Trustee’s separate US actions against Kingate and HSBC Bank Bermuda Limited.
Thema Fund Limited (‘Thema’) and Hermes, funds whose assets were invested with Madoff Securities, each also brought three actions in Bermuda in 2009. The first set of actions was brought against HSBC Institutional Trust Services (Bermuda) Limited and seeks recovery of funds in frozen accounts held at HSBC. The second set of actions asserts liability against HSBC Institutional Trust Services (Bermuda) Limited in relation to claims for mistake, recovery of fees and damages for breach of contract. The third set of actions seeks return of fees from HSBC Bank Bermuda Limited and HSBC Securities Services (Bermuda). There has been little progress in these actions for several years, although in January 2015, Thema and Hermes served notice of intent to proceed in respect of the second set of actions referred to above.
Cayman Islands litigation: In February 2013, Primeo Fund (in official liquidation since April 2009), a Cayman Islands-based fund whose assets were invested with Madoff Securities, brought an action against the fund administrator, Bank of Bermuda (Cayman), and the fund custodian, HSBC Securities Services (Luxembourg) (‘HSSL’), alleging breach of contract by the defendants and breach of fiduciary duty by HSSL. Primeo Fund claims damages from defendants (and equitable compensation from HSSL) to compensate it for alleged losses, including loss of profit. Trial is scheduled to begin in November 2016.
Luxembourg litigation: In April 2009, Herald Fund SPC (‘Herald’) (in official liquidation since July 2013) commenced action against HSSL before the Luxembourg District Court seeking restitution of all cash and securities Herald purportedly lost because of Madoff Securities’ fraud, or in the alternative, money damages in the same amount. In March 2013, the Luxembourg District Court dismissed Herald’s restitution claim for the return of the securities, although Herald’s restitution claim for return of the cash and its claim for money damages were reserved. Herald appealed this judgement in May 2013. Written submissions on the merits are due to be filed by the parties in March 2016.
In October 2009, Alpha Prime commenced an action against HSSL before the Luxembourg District Court, alleging breach of contract and negligence in the appointment of Madoff Securities as a sub-custodian of Alpha Prime’s assets. Alpha Prime requested a stay of these proceedings pending its negotiations with the Trustee in the US proceedings. The matter has been temporarily suspended at Alpha Prime’s request.
In March 2010, Herald (Lux) SICAV (‘Herald (Lux)’) (in official liquidation since April 2009) commenced an action against HSSL before the Luxembourg District Court seeking restitution of securities, or the cash equivalent, or money damages in the alternative. Herald (Lux) has also requested the restitution of fees paid to HSSL as custodian and service agent of the fund. Written submissions on the merits are due to be filed by Herald (Lux) in March 2016.
In December 2014, Senator commenced a separate action against HSSL before the Luxembourg District Court, seeking the restitution of securities held as of the latest net asset value statement from November 2008, or in the alternative, money damages. The matter has been temporarily suspended at Senator’s request.
In April 2015, Senator commenced a separate action against the Luxembourg branch of HSBC Bank plc before the Luxembourg District Court asserting identical claims to those asserted in Senator’s action against HSSL. This action remains ongoing.
HSSL has been sued in various actions by shareholders in the Primeo Select Fund, Herald, Herald (Lux), and Hermes. These actions are in different stages, most of which have been dismissed, suspended or postponed.
Ireland litigation: In November 2013, Defender Limited, a fund whose assets were invested with Madoff Securities, commenced an action against HSBC Institutional Trust Services (Ireland) Limited (‘HTIE’) and others, alleging breach of the custodian agreement and claiming damages and indemnification for fund losses. A trial date has not yet been scheduled.
In May 2013 and November 2013, settlements were reached in respect of claims filed against HTIE in the Irish High Court by Thema International Fund plc (‘Thema International’) and Alternative Advantage Plc (‘AA’), respectively. Only two actions by individual Thema International shareholders against HTIE and Thema International remain active. An application to dismiss the two remaining shareholder claims was heard in December 2015 and a decision is pending.
In December 2014, a new proceeding against HTIE and HSBC Securities Services (Ireland) Limited was brought by SPV OSUS, alleging breach of the custodian agreement and claiming damages and indemnification for fund losses. In July 2015, HTIE brought a preliminary application to challenge the standing of SPV OSUS to bring proceedings against its service providers. Judgement was rendered in favour of HTIE in October 2015, resulting in the dismissal of the action. SPV OSUS filed an appeal, which is scheduled for hearing in January 2017.
There are many factors that may affect the range of possible outcomes, and the resulting financial impact, of the various Madoff-related proceedings described above, including but not limited to the multiple jurisdictions in which the proceedings have been brought and the number of different plaintiffs and defendants in such proceedings. Based upon the information currently available, management’s estimate of possible aggregate damages that might arise as a result of all claims in the various Madoff-related proceedings is up to or exceeding $800m. Due to uncertainties and limitations of this estimate, the ultimate damages could differ significantly from this amount.
HSBC HOLDINGS PLC
447 |
Table of Contents
Notes on the Financial Statements(continued)
40 – Legal proceedings and regulatory matters
US mortgage-related investigations
In April 2011, following completion of a broad horizontal review of industry foreclosure practices, HSBC Bank USA N.A. (‘HSBC Bank USA’) entered into a consent cease-and-desist order with the Office of the Comptroller of the Currency (‘OCC’), and HSBC Finance Corporation (‘HSBC Finance’) and HSBC North America Holdings Inc. (‘HNAH’) entered into a similar consent order with the Federal Reserve Board (‘FRB’) (together with the OCC order, the ‘Servicing Consent Orders’). The Servicing Consent Orders require prescribed actions to address the foreclosure practice deficiencies noted in the joint examination and described in the Servicing Consent Orders. HSBC Bank USA, HSBC Finance and HNAH continue to work with the OCC and the FRB to align their processes with the requirements of the Servicing Consent Orders and to implement operational changes as required; however, as set forth in a June 2015 amended consent order between HSBC Bank USA and the OCC (the ‘Amended Consent Order’), HSBC Bank USA is not yet in compliance with all of the requirements of the OCC order. A failure to satisfy all requirements of the OCC order may result in a variety of regulatory consequences for HSBC Bank USA, including the imposition of civil money penalties. The Amended Consent Order includes business restrictions related to residential mortgage servicing that will remain in place until the OCC order is terminated. The restrictions include a prohibition against the bulk acquisition of residential mortgage servicing or residential mortgage servicing rights and a requirement to seek OCC supervisory non-objection to outsource any residential mortgage servicing activities that are not already outsourced as of the date of the Amended Consent Order.
The Servicing Consent Orders required an independent review of foreclosures pending or completed between January 2009 and December 2010 to determine if any borrower was financially injured as a result of an error in the foreclosure process (the ‘Independent Foreclosure Review’). As required by the Servicing Consent Orders, an independent consultant was retained to conduct that review. In February 2013, HSBC Bank USA entered into an agreement with the OCC, and HSBC Finance and HNAH entered into an agreement with the FRB (together, the ‘IFR Settlement Agreements’), pursuant to which the Independent Foreclosure Review ceased and was replaced by a broader framework under which HSBC and 12 other participating servicers agreed to provide, in the aggregate, over $9.3bn in cash payments and other assistance to help eligible borrowers. Pursuant to the IFR Settlement Agreements, HNAH made a cash payment of $96m into a fund used to make payments to borrowers that were in active foreclosure during 2009 and 2010 and is also providing other assistance, such as loan modifications, to help eligible borrowers. Borrowers who receive compensation will not be required to execute a release or waiver of rights and will not be precluded from pursuing litigation concerning foreclosure or other mortgage servicing practices. For participating servicers, including HSBC Bank USA and HSBC Finance, fulfilment of the terms of the IFR Settlement Agreements will satisfy the Independent Foreclosure Review requirements of the Servicing Consent Orders, including the wind-down of the Independent Foreclosure Review.
The Servicing Consent Orders do not preclude additional enforcement actions against HSBC Bank USA, HSBC Finance or HNAH by regulatory, governmental or law enforcement agencies, such as the DoJ or state Attorneys General, which could include the imposition of civil money penalties and other sanctions relating to the activities that are the subject of the Servicing Consent Orders. In addition, the IFR Settlement Agreements do not preclude future private litigation concerning these practices.
Separate from the Servicing Consent Orders and the settlement related to the Independent Foreclosure Review discussed above, in February 2016, HSBC Bank USA, HSBC Finance, HSBC Mortgage Services Inc. and HNAH entered into an agreement with the DoJ, the US Department of Housing and Urban Development, the Consumer Financial Protection Bureau, other federal agencies (the ‘Federal Parties’) and the Attorneys General of 49 states and the District of Columbia (the ‘State Parties’) to resolve civil claims related to past residential mortgage loan origination and servicing practices (the ‘National Mortgage Settlement Agreement’). The National Mortgage Settlement Agreement is similar to prior settlements reached with other US mortgage servicers and includes payment of $100m to be allocated among participating Federal and State Parties, and $370m in consumer relief provided through HSBC’s loan modification programmes. The National Mortgage Settlement Agreement also sets forth national mortgage servicing standards to which HSBC will adhere.
In addition, in February 2016, the FRB announced the imposition against HSBC Finance and HNAH of a $131m civil money penalty in connection with the FRB’s Servicing Consent Order of April 2011. Pursuant to the terms of the FRB order, the penalty will be satisfied by the cash payments made to the Federal Parties and the consumer relief provided pursuant to the National Mortgage Settlement Agreement.
The National Mortgage Settlement Agreement and the FRB order do not completely preclude other enforcement actions by regulatory, governmental or law enforcement agencies related to foreclosure and other mortgage servicing practices, including, but not limited to, matters relating to the securitisation of mortgages for investors, which could include the imposition of civil money penalties, criminal fines or other sanctions. In addition, these practices have in the past resulted in private litigation, and the National Mortgage Settlement Agreement would not preclude further private litigation concerning these practices.
US mortgage securitisation activity and litigation
HSBC Bank USA was a sponsor/seller of loans used to facilitate whole loan securitisations underwritten by HSBC Securities (USA) Inc. (‘HSI’). From 2005 to 2007, HSBC Bank USA purchased and sold $24bn of such loans to HSI, which were subsequently securitised and sold by HSI to third parties. The outstanding principal balance on these loans was approximately $5.2bn as at 31 December 2015.
HSBC HOLDINGS PLC
448 |
Table of Contents
Participants in the US mortgage securitisation market that purchased and repackaged whole loans have been the subject of lawsuits and governmental and regulatory inquiries, which have been directed at groups within the US mortgage market such as servicers, originators, underwriters, trustees or sponsors of securitisations, and at particular participants within these groups. As the industry’s residential mortgage foreclosure issues continue, HSBC Bank USA has taken title to an increasing number of foreclosed homes as trustee on behalf of various mortgage securitisation trusts. As nominal record owner of these properties, HSBC Bank USA has been sued by municipalities and tenants alleging various violations of law, including laws regarding property upkeep and tenants’ rights. While HSBC believes and continues to maintain that the obligations at issue and any related liabilities are properly those of the servicer of each trust, HSBC continues to receive significant adverse publicity in connection with these and similar matters, including foreclosures that are serviced by others in the name of ‘HSBC, as trustee’.
Between June and December 2014, a number of lawsuits were filed in state and federal court in New York and Ohio against HSBC Bank USA as trustee of over 280 mortgage securitisation trusts. These lawsuits are brought on behalf of the trusts by a putative class of investors including, amongst others, BlackRock and PIMCO funds. Similar lawsuits were filed simultaneously against other non-HSBC financial institutions that served as mortgage securitisation pool trustees. The complaints against HSBC Bank USA allege that the trusts have sustained losses in collateral value of approximately $38bn. The lawsuits seek unspecified damages resulting from alleged breaches of the US Trust Indenture Act, breach of fiduciary duties, negligence, breach of contract and breach of the common law duty of trust. HSBC filed motions to dismiss in several of these lawsuits, which were, for the most part, denied. In December 2015, three new actions containing similar allegations were filed in state and federal court in New York against HSBC Bank USA as trustee of over 40 mortgage securitisation trusts, many of which are at issue in the previously filed trustee cases. The complaints in the new actions against HSBC Bank USA allege that the trusts have sustained losses in collateral value of approximately $285m.
Various HSBC companies have also been named as defendants in a number of actions in connection with residential mortgage-backed security (‘RMBS’) offerings, which generally allege that the offering documents for securities issued by mortgage securitisation trusts contained material misstatements and omissions, including statements regarding the underwriting standards governing the underlying mortgage loans.
HSBC Bank USA, HSBC Finance and Decision One Mortgage Company LLC (an indirect subsidiary of HSBC Finance) have been named as defendants in various mortgage loan repurchase actions brought by trustees of mortgage securitisation trusts. In the aggregate, these actions seek to have the HSBC defendants repurchase mortgage loans, or pay compensatory damages in lieu of repurchase, totalling at least $1bn.
In addition to actions brought by trustees of securitisation trusts, HSBC Mortgage Corporation (USA) Inc. and Decision One Mortgage Company LLC have been named as defendants in two separate actions filed by Residential Funding Company LLC (‘RFC’), a mortgage loan purchase counterparty. These actions seek unspecified damages in relation to alleged losses suffered by RFC as a result of approximately 25,000 mortgage loans purchased from HSBC between 1986 and 2007. Discovery is in progress in both of these actions.
Since 2010, various HSBC entities have received subpoenas and requests for information from the DoJ and the Massachusetts state Attorney General seeking the production of documents and information regarding HSBC’s involvement in specific private-label RMBS transactions as an issuer, sponsor, underwriter, depositor, trustee, custodian or servicer. In November 2014, HNAH, on behalf of itself and various subsidiaries including, but not limited to, HSBC Bank USA, HSI Asset Securitization Corp., HSI, HSBC Mortgage Corporation (USA), HSBC Finance and Decision One Mortgage Company LLC, received a subpoena from the US Attorney’s Office for the District of Colorado, pursuant to the Financial Industry Reform, Recovery and Enforcement Act (‘FIRREA’), concerning the origination, financing, purchase, securitisation and servicing of subprime and non-subprime residential mortgages. Five non-HSBC banks have previously reported settlements with the DoJ of FIRREA and other mortgage-backed securities-related matters. HSBC is cooperating with the US authorities and is continuing to produce documents and information responsive to their requests.
HSBC expects the focus on mortgage securitisations to continue. As a result, HSBC companies may be subject to additional claims, litigation and governmental or regulatory scrutiny relating to its participation in the US mortgage securitisation market.
There are many factors that may affect the range of possible outcomes, and the resulting financial impact of these matters. Based upon the information currently available, it is possible that any liabilities that might arise as a result of these matters could be significant.
Anti-money laundering and sanctions-related matters
In October 2010, HSBC Bank USA entered into a consent cease-and-desist order with the OCC, and HNAH entered into a consent cease-and-desist order with the FRB (the ‘Orders’). These Orders required improvements to establish an effective compliance risk management programme across HSBC’s US businesses, including risk management related to the Bank Secrecy Act (‘BSA’) and AML compliance. Steps continue to be taken to address the requirements of the Orders.
HSBC HOLDINGS PLC
449 |
Table of Contents
Notes on the Financial Statements(continued)
40 – Legal proceedings and regulatory matters
In December 2012, HSBC Holdings, HNAH and HSBC Bank USA entered into agreements with US and UK government agencies regarding past inadequate compliance with the BSA, AML and sanctions laws. Among those agreements, HSBC Holdings and HSBC Bank USA entered into a five-year deferred prosecution agreement with the DoJ, the US Attorney’s Office for the Eastern District of New York, and the US Attorney’s Office for the Northern District of West Virginia (the ‘US DPA’); and HSBC Holdings consented to a cease-and-desist order, and HSBC Holdings and HNAH consented to a civil money penalty order with the FRB. HSBC Holdings also entered into an agreement with the Office of Foreign Assets Control (‘OFAC’) regarding historical transactions involving parties subject to OFAC sanctions, as well as an undertaking with the UK FCA to comply with certain forward-looking AML and sanctions-related obligations. In addition, HSBC Bank USA entered into a civil money penalty order with the Financial Crimes Enforcement Network (‘FinCEN’) of the US Treasury Department and a separate civil money penalty order with the OCC.
Under these agreements, HSBC Holdings and HSBC Bank USA made payments totalling $1.9bn to US authorities. In July 2013, the US District Court for the Eastern District of New York approved the US DPA and retained authority to oversee implementation of that agreement. An independent compliance monitor (the ‘Monitor’) was appointed in 2013 under the agreements entered into with the DoJ and the FCA to produce annual assessments of the effectiveness of HSBC’s AML and sanctions compliance programme. Additionally, the Monitor is serving as HSBC’s independent consultant under the consent order of the FRB. In January 2016, the Monitor delivered his second annual follow-up review report as required by the US DPA. The Monitor’s report is discussed on page 116.
Under the terms of the US DPA, upon notice and an opportunity to be heard, the DoJ has sole discretion to determine whether HSBC has breached the US DPA. Potential consequences of breaching the US DPA could include the imposition of additional terms and conditions on HSBC, an extension of the agreement, including its monitorship, or the criminal prosecution of HSBC, which could, in turn, entail further financial penalties and collateral consequences.
HSBC Bank USA also entered into a separate consent order with the OCC, requiring it to correct the circumstances and conditions as noted in the OCC’s then-most recent report of examination, and imposing certain restrictions on HSBC Bank USA directly or indirectly acquiring control of, or holding an interest in, any new financial subsidiary, or commencing a new activity in its existing financial subsidiary, unless it receives prior approval from the OCC. HSBC Bank USA also entered into a separate consent order with the OCC requiring it to adopt an enterprise-wide compliance programme.
These settlements with US and UK authorities have led to private litigation, and do not preclude further private litigation related to HSBC’s compliance with applicable BSA, AML and sanctions laws or other regulatory or law enforcement actions for BSA, AML, sanctions or other matters not covered by the various agreements.
In May 2014, a shareholder derivative action was filed by a shareholder of HSBC Holdings purportedly on behalf of HSBC Holdings, HSBC Bank USA, HNAH and HSBC USA Inc. (the ‘Nominal Corporate Defendants’) in New York state court against certain current and former directors and officers of those HSBC companies (the ‘Individual Defendants’). The complaint alleges that the Individual Defendants breached their fiduciary duties to the Nominal Corporate Defendants and caused a waste of corporate assets by allegedly permitting and/or causing the conduct underlying the US DPA. In March 2015, the Nominal Corporate Defendants moved to dismiss the action, and the Individual Defendants who had been served also responded to the complaint. In November 2015, the New York state court granted the motion to dismiss. The plaintiff has appealed that decision.
In July 2014, a claim was filed in the Ontario Superior Court of Justice against HSBC Holdings and a former employee purportedly on behalf of a class of persons who purchased HSBC common shares and American Depositary Shares between July 2006 and July 2012. The complaint, which seeks monetary damages of up to CA$20bn, alleges that the defendants made statutory and common law misrepresentations in documents released by HSBC Holdings and its wholly owned subsidiary, HSBC Bank Canada, relating to HSBC’s compliance with BSA, AML, sanctions and other laws.
In November 2014, a complaint was filed in the US District Court for the Eastern District of New York on behalf of representatives of US persons alleged to have been killed or injured in Iraq between April 2004 and November 2011. The complaint was filed against HSBC Holdings, HSBC Bank plc, HSBC Bank USA and HSBC Bank Middle East, as well as other non-HSBC banks and the Islamic Republic of Iran. The plaintiffs allege that defendants violated the US Anti-Terrorism Act (‘US ATA’) by altering or falsifying payment messages involving Iran, Iranian parties and Iranian banks for transactions processed through the US. Defendants filed a motion to dismiss in May 2015, and a decision on that motion is pending.
In November 2015, a complaint was filed in the US District Court for the Northern District of Illinois on behalf of representatives of four US persons alleged to have been killed or injured in terrorist attacks on three hotels in Amman, Jordan in 2005. The complaint was filed against HSBC Holdings, HSBC Bank USA, HNAH, HSI, HSBC Finance, HSBC USA Inc. and HSBC Bank Middle East, as well as a non-HSBC bank. The plaintiffs allege that the HSBC defendants violated the US ATA by failing to enforce due diligence methods to prevent its financial services from being used to support the terrorist attacks.
In February 2016, a complaint was filed in the US District Court for the Southern District of Texas by representatives of US persons alleged to have been killed or injured in Mexico by Mexican drug cartels. The complaint was filed against HSBC Holdings, HSBC Bank USA, HSBC México SA, and Grupo Financiero HSBC. The plaintiffs allege that defendants violated the US ATA by providing financial services to individuals and entities associated with the Mexican drug cartels. Defendants have not yet been served with process.
HSBC HOLDINGS PLC
450 |
Table of Contents
Based on the facts currently known, it is not practicable at this time for HSBC to predict the resolution of these lawsuits, including the timing or any possible impact on HSBC, which could be significant.
Tax-related investigations
HSBC continues to cooperate in ongoing investigations by the DoJ and the US Internal Revenue Service regarding whether certain HSBC companies and employees, including those associated with HSBC Private Bank (Suisse) SA (‘HSBC Swiss Private Bank’) and an HSBC company in India, acted appropriately in relation to certain customers who had US tax reporting obligations. In connection with these investigations, HSBC Swiss Private Bank, with due regard for Swiss law, has produced records and other documents to the DoJ. In August 2013, the DoJ informed HSBC Swiss Private Bank that it was not eligible for the ‘Program for Non-Prosecution Agreements or Non-Target Letters for Swiss Banks’ since a formal investigation had previously been authorised.
In addition, various tax administration, regulatory and law enforcement authorities around the world, including in Belgium, France, Argentina and India, are conducting investigations and reviews of HSBC Swiss Private Bank and other HSBC entities in connection with allegations of tax evasion or tax fraud, money laundering and unlawful cross-border banking solicitation. HSBC Swiss Private Bank has been placed under formal criminal examination by magistrates in both Belgium and France. In February 2015, HSBC was informed that the French magistrates are of the view that they have completed their investigation with respect to HSBC Swiss Private Bank and have referred the matter to the public prosecutor for a recommendation on any potential charges to be brought, whilst reserving the right to continue investigating other conduct at HSBC. In April 2015, HSBC Holdings was informed that it has been placed under formal criminal investigation by the French magistrates in connection with the conduct of HSBC Swiss Private Bank in 2006 and 2007 for alleged tax offences, and a€1bn bail was imposed. HSBC Holdings appealed the magistrates’ decision and, in June 2015, bail was reduced to€100m. The ultimate financial impact of this matter could differ significantly, however, from the bail amount of€100m.
In Argentina, in November 2014, the Argentine tax authority filed a complaint against various individuals, including current and former HSBC employees, alleging tax evasion and an unlawful association amongst HSBC Swiss Private Bank, HSBC Bank Argentina, HSBC Bank USA and certain HSBC employees, which allegedly enabled numerous HSBC customers to evade their Argentine tax obligations. In addition, the Argentine Congress convened a special committee to investigate similar allegations, as well as issues related to allegations of Argentine income tax evasion more broadly. The committee issued its final report in December 2015.
In India, in February 2015, the Indian tax authority issued a summons and request for information to an HSBC company in India. In August 2015 and November 2015, HSBC entities received notices issued by two offices of the Indian tax authority, alleging that the Indian tax authority had sufficient evidence to initiate prosecution against HSBC Swiss Private Bank and its Dubai entity for abetting tax evasion of four different Indian individuals and/or families and requesting that the HSBC entities show why such prosecution should not be initiated.
With respect to each of these ongoing matters, HSBC is cooperating with the relevant authorities in a manner consistent with relevant laws. There are many factors that may affect the range of outcomes, and the resulting financial impact, of these investigations and reviews, which could be significant.
In light of the media attention regarding these matters, it is possible that other tax administration, regulatory or law enforcement authorities will also initiate or enlarge similar investigations or regulatory proceedings.
London interbank offered rates, European interbank offered rates and other benchmark interest rate investigations and litigation
Various regulators and competition and law enforcement authorities around the world, including in the UK, the US, the EU, Switzerland, South Korea and elsewhere, are conducting investigations and reviews related to certain past submissions made by panel banks and the processes for making submissions in connection with the setting of Libor, Euribor and other benchmark interest rates. As certain HSBC companies are members of such panels, HSBC has been the subject of regulatory demands for information and is cooperating with those investigations and reviews.
In May 2014, HSBC received a Statement of Objections from the European Commission (the ‘Commission’), alleging anti-competitive practices in connection with the pricing of euro interest rate derivatives. The Statement of Objections sets out the Commission’s preliminary views and does not prejudge the final outcome of its investigation. HSBC responded to the Commission’s Statement of Objections in March 2015, and a hearing before the Commission took place in June 2015. A decision by the Commission is pending.
In addition, HSBC and other US dollar Libor panel banks have been named as defendants in a number of private lawsuits filed in the US with respect to the setting of US dollar Libor. The complaints assert claims under various US laws, including US antitrust and racketeering laws, the US Commodity Exchange Act (‘CEA’), and state law. The lawsuits include individual and putative class actions, most of which have been transferred and/or consolidated for pre-trial purposes before the United States District Court for the Southern District of New York (the ‘New York District Court’).
In March 2013, the New York District Court overseeing the consolidated proceedings related to US dollar Libor issued a decision in the six oldest actions, dismissing the plaintiffs’ federal and state antitrust claims, racketeering claims, and unjust enrichment claims in their entirety, but allowing certain of their CEA claims that were not barred by the applicable statute of
HSBC HOLDINGS PLC
451 |
Table of Contents
Notes on the Financial Statements(continued)
40 – Legal proceedings and regulatory matters
limitations to proceed. Some of those plaintiffs appealed the New York District Court’s decision to the US Court of Appeals for the Second Circuit, which later dismissed those appeals as premature. In January 2015, the US Supreme Court reversed the Court of Appeals’ decision and remanded the case to the Court of Appeals for consideration on the merits of the plaintiffs’ appeal. Oral argument in the Court of Appeals was held in November 2015, and the parties are awaiting a decision.
Other plaintiffs sought to file amended complaints in the New York District Court to assert additional allegations. In June 2014, the New York District Court issued a decision that, amongst other things, denied the plaintiffs’ request for leave to amend their complaints to assert additional theories of Libor manipulation against HSBC and certain non-HSBC banks, but granted leave to assert such manipulation claims against two other banks; and granted defendants’ motion to dismiss certain additional claims under the CEA as barred by the applicable statute of limitations. Proceedings with respect to all other actions in the consolidated proceedings were stayed pending this decision. The stay was lifted in September 2014, and amended complaints were filed in certain other individual and class actions thereafter. The defendants filed motions to dismiss, and in August 2015 and November 2015, the court issued decisions granting the motions in part, although it has not yet entered an order specifying which particular claims are dismissed against which defendants.
Separately, HSBC and other panel banks have also been named as defendants in two putative class actions filed in the New York District Court on behalf of persons who transacted in financial instruments allegedly related to the euroyen Tokyo interbank offered rate (‘Tibor’) and/or Japanese yen Libor. The complaints allege, amongst other things, misconduct related to euroyen Tibor, although HSBC is not a member of the Japanese Bankers Association’s euroyen Tibor panel, as well as Japanese yen Libor, in violation of US antitrust laws, the CEA, and state law.
The first of the two actions was filed in April 2012, and HSBC responded by filing a motion to dismiss. In March 2014, the New York District Court dismissed the plaintiffs’ claims under US antitrust law and state law, but sustained their claims under the CEA. In June 2014, the plaintiffs then moved for leave to file an amended complaint adding new claims and parties. That motion was denied in March 2015, except insofar as it granted leave to add certain defendants not affiliated with HSBC and reserving on the question of whether the California State Teachers Retirement System (‘CALSTRS’) may intervene and be added as a plaintiff. In October 2015, the New York District Court denied the motion of CALSTRS to intervene. In November 2015, CALSTRS filed an appeal of that ruling to the United States Court of Appeals for the Second Circuit, which remains pending.
The second action was filed in July 2015. In February 2016, HSBC and the other banks named in the complaint filed a motion to dismiss the action, and a decision on that motion is pending.
In November 2013, HSBC and other panel banks were also named as defendants in a putative class action filed in the New York District Court on behalf of persons who transacted in euro futures contracts and other financial instruments allegedly related to Euribor. The complaint alleges, amongst other things, misconduct related to Euribor in violation of US antitrust laws, the CEA and state law. The court previously stayed proceedings until May 2015. After the stay expired, the plaintiffs filed an amended complaint. In October 2015, HSBC filed a motion to dismiss the action, which remains pending.
In September and October 2014, HSBC Bank plc and other panel banks were named as defendants in a number of putative class actions that were filed and consolidated in the New York District Court on behalf of persons who transacted in interest rate derivatives or purchased or sold financial instruments that were either tied to US dollar International Swaps and Derivatives Association fix (‘ISDAfix’) rates or were executed shortly before, during, or after the time of the daily ISDAfix setting window. The complaint alleges, amongst other things, misconduct related to these activities in violation of US antitrust laws, the CEA and state law. In February 2015, plaintiffs filed a second consolidated amended complaint replacing HSBC Bank plc with HSBC Bank USA. A motion to dismiss that complaint was filed in April 2015, and a decision is pending.
There are many factors that may affect the range of possible outcomes, and the resulting financial impact, of these lawsuits. Based upon the information currently available, it is possible that any liabilities that might arise as a result of the claims in these actions could be significant.
Foreign exchange rate investigations and litigation
Various regulators and competition and law enforcement authorities around the world, including in the US, the EU, Brazil, South Korea and elsewhere, are conducting investigations and reviews into trading by HSBC and others on the foreign exchange markets. HSBC has been cooperating with these ongoing investigations and reviews.
In May 2015, the DoJ resolved its investigations with respect to five non-HSBC financial institutions, four of whom agreed to plead guilty to criminal charges of conspiring to manipulate prices in the foreign exchange spot market, and resulting in the imposition of criminal fines in the aggregate of more than $2.5bn. Additional penalties were imposed at the same time by the FRB and other banking regulators. HSBC was not a party to these resolutions, and investigations into HSBC by the DoJ, FRB and others around the world continue.
In addition, in late 2013 and early 2014, HSBC Holdings, HSBC Bank plc, HNAH and HSBC Bank USA were named as defendants, amongst other banks, in various putative class actions filed in the New York District Court. In March 2014, the plaintiffs filed a consolidated amended complaint alleging, amongst other things, that defendants conspired to manipulate the WM/Reuters foreign exchange benchmark rates (the ‘Consolidated Action’). Separate putative class actions were also brought on behalf of non-US plaintiffs (the ‘Foreign Actions’). Defendants moved to dismiss all actions. In January 2015, the court denied defendants’
HSBC HOLDINGS PLC
452 |
Table of Contents
motion to dismiss the Consolidated Action, but granted defendants’ motion to dismiss the Foreign Actions. Five additional putative class actions were subsequently filed in the New York District Court making similar allegations on behalf of persons who engaged in foreign exchange futures transactions on a US exchange, and those additional actions were subsequently consolidated with the Consolidated Action. In July 2015, the plaintiffs in the Consolidated Action filed a further amended complaint that, amongst other things, added new claims and parties, including HSBC Securities (USA), Inc. In September 2015, HSBC reached an agreement with plaintiffs to resolve the Consolidated Action, subject to court approval. In December 2015, the court granted preliminary approval of the settlement, and HSBC made payment of the agreed settlement amount into an escrow account. The court has not yet set a date for the final approval hearing.
In addition to the above actions, a putative class action was filed in the New York District Court in June 2015 making similar allegations on behalf of Employee Retirement Income Security Act of 1974 (‘ERISA’) plan participants, and another complaint was filed in the US District Court for the Northern District of California in May 2015. HSBC filed a motion to transfer the California action to New York, which was granted in November 2015.
In September 2015, two additional putative class actions making similar allegations under Canadian law were issued in Canada against various HSBC entities, including HSBC Bank Canada, and numerous other financial institutions.
As at 31 December 2015, HSBC has recognised a provision in the amount of $1.2bn. There are many factors that may affect the range of outcomes, and the resulting financial impact, of these matters. Due to uncertainties and limitations of these estimates, the ultimate penalties could differ significantly from the amount provided.
Precious metals fix-related litigation and investigations
Beginning in March 2014, numerous putative class actions were filed in the US District Courts for the Southern District of New York, the District of New Jersey and the Northern District of California, naming HSBC and other members of The London Gold Market Fixing Limited as defendants. The complaints allege that, from January 2004 to the present, defendants conspired to manipulate the price of gold and gold derivatives during the afternoon London gold fix for their collective benefit in violation of US antitrust laws, the CEA and New York state law. The actions were subsequently consolidated in the New York District Court. An amended complaint was filed in March 2015, which defendants moved to dismiss. A hearing has been scheduled for March 2016.
Beginning in July 2014, numerous putative class actions were filed in the US District Courts for the Southern and Eastern Districts of New York, naming HSBC and other members of The London Silver Market Fixing Ltd as defendants. The complaints allege that, from January 1999 to the present, defendants conspired to manipulate the price of silver and silver derivatives for their collective benefit in violation of US antitrust laws, the CEA and New York state law. The actions were subsequently consolidated in the New York District Court. An amended complaint was filed in April 2015, which defendants moved to dismiss. A hearing has been scheduled for March 2016.
Between late 2014 and early 2015, numerous putative class actions were filed in the US District Court for the Southern District of New York, naming HSBC, and other members of The London Platinum and Palladium Fixing Company Limited as defendants. The complaints allege that, from January 2008 to the present, defendants conspired to manipulate the price of platinum group metals (‘PGM’) and PGM-based financial products for their collective benefit in violation of US antitrust laws and the CEA. An amended complaint was filed in August 2015, which defendants moved to dismiss.
Additionally, in December 2015, a putative class action under Canadian law was filed in the Ontario Superior Court of Justice against various HSBC entities, including HSBC Bank Canada, and other financial institutions. Plaintiffs allege that, from January 2004 to March 2014, defendants conspired to manipulate the price of gold and gold-related investment instruments in violation of the Canadian Competition Act and common law.
Various regulators and competition and law enforcement authorities, including in the US and the EU, are conducting investigations and reviews relating to HSBC’s precious metals operations. HSBC has been cooperating with these ongoing investigations. In November 2014, the Antitrust Division and Criminal Fraud Section of the DoJ issued a document request to HSBC Holdings, seeking the voluntary production of certain documents in connection with a criminal investigation that the DoJ is conducting of alleged anti-competitive and manipulative conduct in precious metals trading. In January 2016, the Antitrust Division of the DoJ informed HSBC that it was closing its investigation; however, the Criminal Fraud Section’s investigation remains ongoing.
Based on the facts currently known, it is not practicable at this time for HSBC to predict the resolution of these matters, including the timing or any possible impact on HSBC, which could be significant.
Credit default swap regulatory investigation and litigation
In July 2013, HSBC received a Statement of Objections from the Commission relating to its ongoing investigation of alleged anti-competitive activity by a number of banks and other market participants in the credit derivatives market between 2006 and 2009. The Statement of Objections sets out the Commission’s preliminary views and does not prejudge the final outcome of its investigation. HSBC submitted a response and attended a hearing in May 2014. Following the hearing, the Commission decided in December 2015 to close the case against all 13 banks, including all of the HSBC entities; however, the Commission’s investigation relating to Markit and ISDA is ongoing.
HSBC HOLDINGS PLC
453 |
Table of Contents
Notes on the Financial Statements(continued)
40 – Legal proceedings and regulatory matters / 41 – Related party transactions
In addition, HSBC Holdings, HSBC Bank plc and HSBC Bank USA were named as defendants, amongst others, in numerous putative class actions filed in the New York District Court and the Illinois District Court. These class actions allege that the defendants, which include ISDA, Markit and several other financial institutions, conspired to restrain trade in violation of US antitrust laws by, amongst other things, restricting access to credit default swap pricing exchanges and blocking new entrants into the exchange market. The plaintiffs in these suits purport to represent a class of all persons who purchased credit default swaps from or sold credit default swaps to defendants primarily in the US.
In October 2013, these cases were consolidated in the New York District Court (the ‘Consolidated Action’). In September 2015, the HSBC defendants reached an agreement with plaintiffs to resolve the Consolidated Action, subject to court approval. In October 2015, the court granted preliminary approval of the settlement. The final settlement approval hearing is scheduled for April 2016.
Economic plans: HSBC Bank Brasil S.A.
In the mid-1980s and early 1990s, certain economic plans were introduced by the government of Brazil to reduce escalating inflation. The implementation of these plans adversely impacted savings account holders, thousands of which consequently commenced legal proceedings against financial institutions in Brazil, including HSBC Bank Brasil S.A. (‘HSBC Brazil’), alleging, amongst other things, that savings account balances were adjusted by a different price index than that contractually agreed, which caused them a loss of income. Certain of these cases have reached the Brazilian Supreme Court. The Supreme Court has suspended all cases pending before lower courts until it delivers a final judgement on the constitutionality of the changes resulting from the economic plans. It is anticipated that the outcome of the Supreme Court’s final judgement will set a precedent for all cases pending before the lower courts. Separately, the Brazilian Superior Civil Court is considering matters relating to, amongst other things, contractual and punitive interest rates to be applied to calculate any loss of income.
There is a high degree of uncertainty as to the terms on which the proceedings in the Supreme Court and Superior Civil Court will be resolved and the timing of such resolutions, including the amount of losses that HSBC Brazil may be liable to pay in the event of an unfavourable judgement. Such losses may lie in a range from a relatively insignificant amount to an amount up to $564m (based on the exchange rate between the USD and the BRL as at 31 December 2015), although the upper end of this range is considered unlikely.
Regulatory review of consumer ‘enhancement services products’
HSBC Finance, through its legacy Cards and Retail Services business, offered or participated in the marketing, distribution, or servicing of products, such as identity theft protection and credit monitoring products, that were ancillary to the provision of credit to the consumer. HSBC Finance ceased offering these products by May 2012. The offering and administration of these and other enhancement services products, such as debt protection products, has been the subject of enforcement actions against other institutions by regulators, including the Consumer Financial Protection Bureau, the OCC, and the Federal Deposit Insurance Corporation. Such enforcement actions have resulted in orders to pay restitution to customers and the assessment of penalties in substantial amounts. We have made restitution to certain customers in connection with certain enhancement services products, and we continue to cooperate with our regulators in connection with their ongoing review. In light of the actions that regulators have taken in relation to other non-HSBC credit card issuers regarding their enhancement services products, one or more regulators may order us to pay additional restitution to customers and/or impose civil money penalties or other relief arising from the prior offering and administration of such enhancement services products by HSBC Finance; however, management no longer expects the resulting financial impact to be material.
Fédération Internationale de Football Association (‘FIFA’) related investigations
HSBC has received inquiries from the DoJ regarding its banking relationships with certain individuals and entities that are or may be associated with FIFA. The DoJ is investigating whether multiple financial institutions, including HSBC, permitted the processing of suspicious or otherwise improper transactions, or failed to observe applicable AML laws and regulations. HSBC is cooperating with the DoJ’s investigation.
Based on the facts currently known, it is not practicable at this time for HSBC to predict the resolution of this matter, including the timing or any possible impact on HSBC, which could be significant.
Hiring practices investigation
The US Securities and Exchange Commission (the ‘SEC’) is investigating multiple financial institutions, including HSBC, in relation to hiring practices of candidates referred by or related to government officials or employees of state-owned enterprises in Asia-Pacific. HSBC has received various requests for information and is cooperating with the SEC’s investigation.
Based on the facts currently known, it is not practicable at this time for HSBC to predict the resolution of this matter, including the timing or any possible impact on HSBC, which could be significant.
Related parties of the Group and HSBC Holdings include subsidiaries, associates, joint ventures, post-employment benefit plans for HSBC employees, Key Management Personnel, close family members of Key Management Personnel and entities which are controlled or jointly controlled by Key Management Personnel or their close family members.
HSBC HOLDINGS PLC
454 |
Table of Contents
Particulars of transactions with related parties, disclosed pursuant to the requirements of IAS 24 ‘Related Party Disclosures’, are tabulated below. The disclosure of the year-end balance and the highest amounts outstanding during the year is considered to be the most meaningful information to represent the amount of the transactions and the amount of outstanding balances during the year.
Key Management Personnel are defined as those persons having authority and responsibility for planning, directing and controlling the activities of HSBC Holdings, being the Directors and Group Managing Directors of HSBC Holdings.
Key Management Personnel
Compensation of Key Management Personnel
| 2015 | 2014 | 2013 | ||||||||||||||||
| $m | $m | $m | ||||||||||||||||
Short-term employee benefits | 40 | 41 | 38 | |||||||||||||||
Post-employment benefits | 1 | 1 | 2 | |||||||||||||||
Other long-term employee benefits | 9 | 7 | 10 | |||||||||||||||
Share-based payments | 51 | 54 | 35 | |||||||||||||||
Year ended 31 December | 101 | 103 | 85 | |||||||||||||||
Transactions, arrangements and agreements involving related parties
Particulars of advances (loans and quasi-loans), credits and guarantees entered into by subsidiaries of HSBC Holdings during 2015 with Directors, disclosed pursuant to section 413 of the Companies Act 2006, are shown below:
| 2015 | 2014 | |||||||||||
| $m | $m | |||||||||||
Advances and credits at 31 December | 4 | 5 | ||||||||||
Transactions and balances during the year with Key Management Personnel
| 2015 | 2014 | |||||||||||||||||||
| Balance at 31 December | Highest amounts during year | Balance at 31 December | Highest amounts during year | |||||||||||||||||
| $m | $m | $m | $m | |||||||||||||||||
Key Management Personnel1 | ||||||||||||||||||||
Advances and credits2 | 218 | 411 | 309 | 347 | ||||||||||||||||
Guarantees3 | 67 | 91 | 78 | 79 | ||||||||||||||||
| 1 | Includes Key Management Personnel, close family members of Key Management Personnel and entities which are controlled or jointly controlled by Key Management Personnel or their close family members. |
| 2 | The 2014 year-end balance has been restated from $194m to $309m and the 2014 highest amount outstanding during the year has been restated from $227m to $347m. |
| 3 | The 2014 year-end balance has been restated from nil to $78m and the 2014 highest amount outstanding during the year has been restated from nil to $79m. |
Some of the transactions were connected transactions as defined by the Rules Governing The Listing of Securities on The Stock Exchange of Hong Kong Limited, but were exempt from any disclosure requirements under the provisions of those rules. The above transactions were made in the ordinary course of business and on substantially the same terms, including interest rates and security, as for comparable transactions with persons of a similar standing or, where applicable, with other employees. The transactions did not involve more than the normal risk of repayment or present other unfavourable features.
HSBC HOLDINGS PLC
455 |
Table of Contents
Notes on the Financial Statements(continued)
41 – Related party transactions / 42 – Events after the balance sheet date / 43 – HSBC’s subsidiaries
Shareholdings, options and other securities of Key Management Personnel
| 2015 (000s) | 2014 (000s) | |||||||||||
Number of options held over HSBC Holdings ordinary shares under employee share plans | 29 | 28 | ||||||||||
Number of HSBC Holdings ordinary shares held beneficially and non-beneficially | 18,961 | 17,533 | ||||||||||
Number of HSBC Bank 2.875% Notes 2015 due 30 April 2015 held beneficially and non-beneficially | – | 5 | ||||||||||
At 31 December | 18,990 | 17,566 | ||||||||||
Associates and joint ventures
The Group provides certain banking and financial services to associates and joint ventures including loans, overdrafts, interest and non-interest bearing deposits and current accounts. Details of the interests in associates and joint ventures are given in Note 19.
Transactions and balances during the year with associates and joint ventures
| 2015 | 2014 | |||||||||||||||||||||||
| Highest balance during the year | Balance at 31 December | Highest balance during the year | Balance at 31 December | |||||||||||||||||||||
| $m | $m | $m | $m | |||||||||||||||||||||
Amounts due from joint ventures: | ||||||||||||||||||||||||
– unsubordinated | 195 | 151 | 205 | 205 | ||||||||||||||||||||
Amounts due from associates: | ||||||||||||||||||||||||
– subordinated | – | – | 58 | – | ||||||||||||||||||||
– unsubordinated | 4,209 | 2,035 | 5,451 | 4,273 | ||||||||||||||||||||
| 4,404 | 2,186 | 5,714 | 4,478 | |||||||||||||||||||||
Amounts due to associates | 1,047 | 92 | 650 | 162 | ||||||||||||||||||||
Guarantees | 905 | 904 | 952 | 952 | ||||||||||||||||||||
Commitments | – | – | 17 | – | ||||||||||||||||||||
The above outstanding balances arose in the ordinary course of business and on substantially the same terms, including interest rates and security, as for comparable transactions with third-party counterparties.
Post-employment benefit plans
At 31 December 2015, $4.3bn (2014: $4.5bn) of HSBC post-employment benefit plan assets were under management by HSBC companies, earning management fees of $8m in 2015 (2014: $12m). At 31 December 2015 HSBC’s post-employment benefit plans had placed deposits of $811m (2014: $223m) with its banking subsidiaries, earning interest payable to the schemes of nil (2014: $6m). The above outstanding balances arose from the ordinary course of business and on substantially the same terms, including interest rates and security, as for comparable transactions with third-party counterparties.
HSBC Bank (UK) Pension Scheme enters into swap transactions with HSBC to help manage inflation and interest rate sensitivity of its liabilities. At 31 December 2015 the gross notional value of these swaps was $13.3bn (2014: $24bn), the swaps had a positive fair value to the scheme of $0.5bn (2014: $0.9bn positive); and HSBC had delivered collateral of $1.1bn (2014: $2.0bn) to the scheme in respect of these arrangements. This earned HSBC interest of nil (2014: $5m). All swaps were executed at prevailing market rates and within standard market bid/offer spreads. Over the year, the scheme reduced its level of swap transactions with HSBC.
The International Staff Retirement Benefit Scheme enters into swap transactions with HSBC to manage the inflation and interest rate sensitivity of its liabilities and selected assets. At 31 December 2015, the gross notional value of the swaps was $1.7bn (2014: $1.9bn) and the swaps had a net negative fair value to the scheme of $96m (2014: $107m negative). All swaps were executed at prevailing market rates and within standard market bid/offer spreads.
HSBC Holdings
Details of HSBC Holdings’ subsidiaries are shown in Note 43.
HSBC HOLDINGS PLC
456 |
Table of Contents
Transactions and balances during the year with subsidiaries
| 2015 | 2014 | |||||||||||||||||||||||
| Highest balance during the year | Balance at 31 December | Highest balance during the year | Balance at 31 December | |||||||||||||||||||||
| $m | $m | $m | $m | |||||||||||||||||||||
Assets | ||||||||||||||||||||||||
Cash at bank | 620 | 242 | 436 | 249 | ||||||||||||||||||||
Derivatives | 3,409 | 2,466 | 3,179 | 2,771 | ||||||||||||||||||||
Loans and advances | 47,229 | 44,350 | 55,026 | 43,910 | ||||||||||||||||||||
Financial investments | 4,427 | 4,285 | 4,073 | 4,073 | ||||||||||||||||||||
Investments in subsidiaries | 97,770 | 97,770 | 96,264 | 96,264 | ||||||||||||||||||||
Total related party assets at 31 December | 153,455 | 149,113 | 158,978 | 147,267 | ||||||||||||||||||||
Liabilities | ||||||||||||||||||||||||
Amounts owed to HSBC undertakings | 2,892 | 2,152 | 12,046 | 2,892 | ||||||||||||||||||||
Derivatives | 2,459 | 2,277 | 1,169 | 1,169 | ||||||||||||||||||||
Subordinated liabilities: | ||||||||||||||||||||||||
– at amortised cost | 1,670 | 891 | 1,743 | 1,670 | ||||||||||||||||||||
– designated at fair value | 982 | 855 | 3,186 | 981 | ||||||||||||||||||||
Total related party liabilities at 31 December | 8,003 | 6,175 | 18,144 | 6,712 | ||||||||||||||||||||
Guarantees | 68,333 | 68,333 | 53,180 | 52,023 | ||||||||||||||||||||
Commitments | 16 | – | 1,245 | 16 | ||||||||||||||||||||
The above outstanding balances arose in the ordinary course of business and on substantially the same terms, including interest rates and security, as for comparable transactions with third-party counterparties.
Some employees of HSBC Holdings are members of the HSBC Bank (UK) Pension Scheme, which is sponsored by a separate Group company. HSBC Holdings incurs a charge for these employees equal to the contributions paid into the scheme on their behalf. Disclosure in relation to the scheme is made in Note 6.
42Events after the balance sheet date
A fourth interim dividend for 2015 of $0.21 per ordinary share (a distribution of approximately $4,134m) was declared by the Directors after 31 December 2015.
These accounts were approved by the Board of Directors on 22 February 2016 and authorised for issue.
43HSBC Holdings’ subsidiaries, joint ventures and associates
In accordance with Section 409 of the Companies Act 2006 a list of HSBC Holdings plc’s subsidiaries, joint ventures and associates, the country of incorporation and the effective percentage of equity owned at 31 December 2015 is disclosed below.
| Subsidiaries | Country | Security | Direct (%) | Total (%) | ||||||
0866101 B.C. Ltd | Canada | C$ Common shares | 100 | |||||||
0866102 B.C. Ltd | Canada | C$ Common shares | 100 | |||||||
ACN 087 652 113 Pty Limited | Australia | A$0.16667 Ordinary shares | 100 | |||||||
Albouys Nominees Limited | England and Wales | £1.00 Ordinary shares | 100 | |||||||
Allblack Investments Limited | Jersey | £0.0037 Ordinary and £0.0037 Preference shares | 100 | |||||||
AMP Client HSBC Custody Nominee (UK) Limited | England and Wales | £1.00 Ordinary shares | 100 | |||||||
Assetfinance December (A) Limited | England and Wales | £1.00 Ordinary shares | 100 | |||||||
Assetfinance December (E) Limited | England and Wales | £1.00 Ordinary shares | 100 | |||||||
Assetfinance December (F) Limited | England and Wales | £1.00 Ordinary shares | 100 | |||||||
Assetfinance December (H) Limited | England and Wales | £1.00 Ordinary shares | 100 | |||||||
Assetfinance December (M) Limited | England and Wales | £1.00 Ordinary shares | 100 | |||||||
Assetfinance December (P) Limited | England and Wales | £1.00 Ordinary shares | 100 | |||||||
Assetfinance December (R) Limited | England and Wales | £1.00 Ordinary shares | 100 | |||||||
Assetfinance December (W) Limited | England and Wales | £1.00 Ordinary shares | 100 | |||||||
Assetfinance June (A) Limited | England and Wales | £1.00 Ordinary shares | 100 | |||||||
Assetfinance June (D) Limited | England and Wales | £1.00 Ordinary shares | 100 | |||||||
Assetfinance June (E) Limited | England and Wales | £1.00 Ordinary shares | 100 | |||||||
Assetfinance Limited | England and Wales | £1.00 Ordinary shares | 100 | |||||||
Assetfinance March (B) Limited | Northern Ireland | £1.00 Ordinary shares | 100 | |||||||
Assetfinance March (D) Limited | England and Wales | £1.00 Ordinary shares | 100 | |||||||
Assetfinance March (F) Limited | England and Wales | £1.00 Ordinary shares | 100 | |||||||
Assetfinance September (F) Limited | England and Wales | £1.00 Ordinary shares | 100 | |||||||
Assetfinance September (G) Limited | England and Wales | £1.00 Ordinary shares | 100 | |||||||
B&Q Financial Services Limited | England and Wales | £1.00 Ordinary shares | 100 | |||||||
HSBC HOLDINGS PLC
457 |
Table of Contents
Notes on the Financial Statements(continued)
43 – HSBC Holdings’ subsidiaries, joint ventures and associates
| Subsidiaries(continued) | Country | Security | Direct (%) | Total (%) | ||||||
Banco Losango S.A Banco Multiplo | Brazil | BRL Ordinary shares | 100 | |||||||
Banco Nominees (Guernsey) Limited | Guernsey | £1.00 Ordinary shares | 100 | |||||||
Banco Nominees 2 (Guernsey) Limited | Guernsey | £1.00 Ordinary shares | 100 | |||||||
Banco Nominees Limited | Bermuda | BMD2.40 Ordinary shares | 100 | |||||||
Bank of Bermuda (Cayman) Limited | Cayman Islands | $1.00 Ordinary shares | 100 | |||||||
Bank of Bermuda (Insurance Brokers) Limited | Bermuda | BMD1.00 Common shares | 100 | |||||||
Beijing Miyun HSBC Rural Bank Company Limited | China | CNY1.00 Registered Capital shares | 100 | |||||||
Beneficial Commercial Holding Corporation | United States | $100.00 Common shares | 100 | |||||||
Beneficial Company LLC | United States | Limited liability company – no shares | 100 | |||||||
Beneficial Consumer Discount Company | United States | $100.00 Common shares | 100 | |||||||
Beneficial Direct, Inc. | United States | $100.00 Ordinary shares | 100 | |||||||
Beneficial Financial I Inc. | United States | $1.00 Common shares | 100 | |||||||
Beneficial Florida Inc. | United States | $100.00 Common shares | 100 | |||||||
Beneficial Kentucky Inc. | United States | $100.00 Common shares | 100 | |||||||
Beneficial Loan & Thrift Co. | United States | $25.00 Common shares | 100 | |||||||
Beneficial Louisiana Inc. | United States | $100.00 Common shares | 100 | |||||||
Beneficial Maine Inc. | United States | $100.00 Common shares | 100 | |||||||
Beneficial Management Corporation of America | United States | $10.00 Common shares | 100 | |||||||
Beneficial Massachusetts Inc. | United States | $100.00 Common shares | 100 | |||||||
Beneficial Michigan Inc. | United States | $ Common shares | 100 | |||||||
Beneficial Mortgage Corporation | United States | $100.00 Common shares | 100 | |||||||
Beneficial New Hampshire Inc. | United States | $100.00 Common shares | 100 | |||||||
Beneficial New York Inc. | United States | $100.00 Common shares | 100 | |||||||
Beneficial Oregon Inc. | United States | $100.00 Common shares | 100 | |||||||
Beneficial Rhode Island Inc. | United States | $100.00 Common shares | 100 | |||||||
Beneficial South Dakota Inc. | United States | $ Common shares | 100 | |||||||
Beneficial Tennessee Inc. | United States | $100.00 Common shares | 100 | |||||||
Beneficial West Virginia, Inc. | United States | $1.00 Common shares | 100 | |||||||
Beneficial Wyoming Inc. | United States | $100.00 Common shares | 100 | |||||||
BerCay Holdings Limited | Cayman Islands | $20.00 Ordinary shares | 100 | |||||||
Bermuda Asia Pacific Holdings Limited | Cook Islands | $1.00 Ordinary shares | 100 | |||||||
Bermuda International Securities Limited | Bermuda | BMD1.00 Ordinary shares | 100 | |||||||
Bermuda Trust (St Helier) Limited | Jersey | $1.00 Ordinary shares | 100 | |||||||
Bermuda Trust Company Limited | Bermuda | BMD1.00 Common shares | 100 | |||||||
Bermuda Trust Executors (Jersey) Limited | Jersey | £1.00 Shares | 100 | |||||||
BFC Insurance Agency of Nevada | United States | $ Ordinary shares | 100 | |||||||
Billingsgate City Securities Public Limited Company | England and Wales | £0.01 Ordinary shares | 100 | |||||||
Billingsgate Nominees Limited | England and Wales | £1.00 Issued shares | 100 | |||||||
Cabot Park Holdings, Inc. | United States | $1.00 Common shares | 100 | |||||||
Cal-Pacific Services, Inc. | United States | $100.00 Ordinary shares | 100 | |||||||
Canada Crescent Nominees (UK) Limited | England and Wales | £1.00 Ordinary shares | 100 | |||||||
Canada Square Nominees (UK) Limited | England and Wales | £1.00 Ordinary shares | 100 | |||||||
Canada Square Property Participations Limited | England and Wales | £1.00 Ordinary shares | 100 | |||||||
Canada Water Nominees (UK) Limited | England and Wales | £1.00 Ordinary shares | 100 | |||||||
Capco/Cove, Inc. | United States | $1.00 Common shares | 100 | |||||||
Capital Financial Services Inc. | United States | $1.00 Common shares | 100 | |||||||
Card-Flo #1, Inc. | United States | $1.00 Common shares | 100 | |||||||
Card-Flo #3, Inc. | United States | $0.01 Common shares | 100 | |||||||
Castlewood Limited | Cook Islands | $ Ordinary shares | 100 | |||||||
Cayman International Finance Limited | Cayman Islands | $1.20 Ordinary shares | 100 | |||||||
Cayman Nominees Limited | Cayman Islands | KYD2.00 Ordinary shares | 100 | |||||||
CBS/Holdings, Inc. | United States | $1.00 Common shares | 100 | |||||||
CC&H Holdings LLC | United States | Limited liability company – no shares | 100 | |||||||
CCF & Partners Asset Management Limited | England and Wales | £1.00 Ordinary shares | 100 | |||||||
CCF Charterhouse GmbH | Germany | €1.00 Actions shares | 100 | |||||||
CCF Charterhouse GmbH & Co Asset Leasing KG | Germany | Limited partnership – no shares | 100 | |||||||
Charterhouse Administrators (D.T.) Limited | England and Wales | £1.00 Ordinary shares | 100 | |||||||
Charterhouse Development Limited | England and Wales | £1.00 Ordinary shares | 100 | |||||||
Charterhouse Finance Corporation Limited | Scotland | £1.00 Ordinary shares | 100 | |||||||
Charterhouse Management Services Limited | England and Wales | £1.00 Ordinary shares | 100 | |||||||
Charterhouse Pensions Limited | England and Wales | £1.00 Ordinary shares | 100 | |||||||
Chemi and Cotex Industries Limited | Tanzania, United Rep. of | TZS1.00 Ordinary shares | 100 | |||||||
Chongqing Dazu HSBC Rural Bank Company Limited | China | CNY1.00 Registered Capital shares | 100 | |||||||
Chongqing Fengdu HSBC Rural Bank Company Limited | China | CNY1.00 Registered Capital shares | 100 | |||||||
Chongqing Rongchang HSBC Rural Bank Company Limited | China | CNY1.00 Registered Capital shares | 100 | |||||||
CL Residential Limited | England and Wales | £1.00 Ordinary shares | 100 | |||||||
Compass Nominees Limited | Bermuda | BMD1.00 Common shares | 100 | |||||||
Compass Services Limited | Bermuda | $1.00 Ordinary shares | 100 | |||||||
Cordico Management AG | Switzerland | CHF1,000.00 Ordinary shares | 100 | |||||||
Corhold Limited | Virgin Islands, British | $1.00 Bearer shares | 100 | |||||||
Credival Participacoes Administracao e Assessoria Ltda | Brazil | BRL0.01 Quota shares | 100 | |||||||
Crewfleet Limited | England and Wales | £1.00 Ordinary shares | 100 | |||||||
Dalian Pulandian HSBC Rural Bank Company Limited | China | CNY1.00 Registered Capital shares | 100 | |||||||
HSBC HOLDINGS PLC
458 |
Table of Contents
| Subsidiaries(continued) | Country | Security | Direct (%) | Total (%) | ||||||
Decision One Mortgage Company, LLC | United States | Limited liability company – no shares | 100 | |||||||
Dem 25 | France | €1.00 Actions shares | 100 | |||||||
Dem 5 | France | €16.00 Actions shares | 100 | |||||||
Dem 9 | France | €8.50 Actions shares | 100 | |||||||
Dempar 1 | France | Actions shares no par value | 100 | |||||||
Dempar 4 | France | Actions shares no par value | 100 | |||||||
Eagle Rock Holdings, Inc. | United States | $1.00 Common shares | 100 | |||||||
Ellenville Holdings, Inc. | United States | $1.00 Common shares | 100 | |||||||
Elysees GmbH | Germany | € Ordinary shares | 100 | |||||||
Elysées Immo Invest | France | €16.00 Actions shares | 100 | |||||||
Emerging Growth Real Estate II GP Limited | Guernsey | £ Ordinary shares | 100 | |||||||
EMTT Limited | England and Wales | £1.00 Ordinary shares | 100 | |||||||
Endeavour Personal Finance Limited | England and Wales | £1.00 Ordinary shares | 100 | |||||||
Equator Holdings Limited | England and Wales | $1.00 Ordinary shares | 100 | |||||||
Eton Corporate Services Limited | Guernsey | $1.00 Ordinary shares | 100 | |||||||
Eton Management Ltd | Virgin Islands, British | $1.00 Ordinary shares | 100 | |||||||
Far East Leasing SA | Panama | $1,000.00 Ordinary shares | 100 | |||||||
Fdm 5 SAS | France | €10.00 Actions shares | 100 | |||||||
Fdm 6 SAS | France | €10.00 Actions shares | 100 | |||||||
FEPC Leasing Ltd. | Cayman Islands | $0.001 Ordinary and $0.001 Preference shares | 100 | |||||||
Finanpar 2 | France | Actions shares no par value | 100 | |||||||
Finanpar 7 | France | Actions shares no par value | 100 | |||||||
First Corporate Director Inc. | Virgin Islands, British | $1.00 Ordinary shares | 100 | |||||||
First Direct Investments (UK) Limited | England and Wales | £1.00 Ordinary shares | 100 | |||||||
Flandres Contentieux S.A. | France | €0.16 Actions shares | 100 | |||||||
Foncière Elysées | France | €77.00 Actions shares | 100 | |||||||
Forward Trust Rail Services Limited | England and Wales | £0.1 Ordinary shares | 100 | |||||||
F-Street Holdings, Inc. | United States | $1.00 Common shares | 100 | |||||||
Fujian Yongan HSBC Rural Bank Company Limited | China | CNY1.00 Registered Capital shares | 100 | |||||||
Fundo de Investimento Multimercado Credito Privado Investimento no Exterior Orion1 | Brazil | BRL1.14267 Redeemable Preference shares | 100 | |||||||
Fundo de Investimento Multimercado Credito Privado Sirius1 | Brazil | BRL Ordinary shares | 100 | |||||||
Fundo de Investimento Multimercado Investimento no Exterior Tellus1 | Brazil | BRL1.07374 Redeemable Preference shares | 100 | |||||||
G.M. Gilt-Edged Nominees Limited | England and Wales | £1.00 Ordinary shares | 100 | |||||||
Gesellschaft fur Industrielle Beteiligungen und Finanzierung mbH | Germany | €1.00 Common shares | 100 | |||||||
Giller Ltd. | United States | $1.00 Common shares | 100 | |||||||
GPIF-I Equity Co., Ltd.1 | Cayman Islands | KYD0.001 Liquidating Share Class shares | 100 | |||||||
GPIF-I Finance Co., Ltd.1 | Cayman Islands | $0.001 Liquidating Share Class shares | 100 | |||||||
Griffin International Limited | England and Wales | £1.00 Ordinary shares | 100 | |||||||
Grundstuecksgesellschaft Trinkausstrasse Kommanditgesellschaft | Germany | DEM1.00 Common shares | 100 | |||||||
Grupo Financiero HSBC, S. A. de C. V. | Mexico | MXN2.00 Ordinary shares | 100 | |||||||
Guangdong Enping HSBC Rural Bank Company Limited | China | CNY1.00 Registered Capital shares | 100 | |||||||
GWML Holdings, Inc. | United States | $1.00 Common shares | 100 | |||||||
GZ Trust Corporation | Virgin Islands, British | $1.00 Ordinary shares | 100 | |||||||
HBL Nominees Limited | England and Wales | £1.00 Ordinary shares | 100 | |||||||
HDSAP GP Limited | Guernsey | £ Ordinary shares | 100 | |||||||
Henderson Limited | Cook Islands | $1.00 Ordinary shares | 100 | |||||||
HFC Bank Limited | England and Wales | £1.00 Ordinary and £1.00 Ordinary-A shares | 100 | |||||||
HFC Commercial Realty, Inc. | United States | $100.00 Common shares | 100 | |||||||
HFC Company LLC | United States | Limited liability company – no shares | 100 | |||||||
HFC Leasing Inc. | United States | $100.00 Ordinary shares | 100 | |||||||
High Meadow Management, Inc. | United States | $1.00 Common shares | 100 | |||||||
Hilaga Investments Limited | England and Wales | £1.00 Issued shares | 100 | |||||||
HITG Administration GmbH | Germany | €25,000.00 Ordinary shares | 100 | |||||||
HITG, Inc. | United States | $1.00 Common shares | 100 | |||||||
Honey Green Enterprises Ltd. | Virgin Islands, British | $1.00 Ordinary shares | 100 | |||||||
Hongkong International Trade Finance (Holdings) Limited | England and Wales | £1.00 Ordinary ‘A’ and £1.00 Ordinary ‘B’ shares | 100 | |||||||
Hongkong International Trade Finance (U.S.A.) Inc. | United States | $1.00 Common shares | 100 | |||||||
Household Capital Markets LLC | United States | Limited liability company – no shares | 100 | |||||||
Household Commercial Financial Services, Inc. | United States | $100.00 Ordinary shares | 100 | |||||||
Household Finance Consumer Discount Company | United States | $100.00 Common shares | 100 | |||||||
Household Finance Corporation II | United States | $100.00 Common shares | 100 | |||||||
Household Finance Corporation III | United States | $100.00 Common shares | 100 | |||||||
Household Finance Corporation of Alabama | United States | $100.00 Common shares | 100 | |||||||
Household Finance Corporation of California | United States | $100.00 Common shares | 100 | |||||||
Household Finance Corporation of Nevada | United States | $100.00 Common shares | 100 | |||||||
Household Finance Corporation of West Virginia | United States | $100.00 Common shares | 100 | |||||||
Household Finance Industrial Loan Company of Iowa | United States | $100.00 Common shares | 100 | |||||||
Household Finance Realty Corporation of Nevada | United States | $100.00 Common shares | 100 | |||||||
Household Finance Realty Corporation of New York | United States | $100.00 Ordinary shares | 100 | |||||||
HSBC HOLDINGS PLC
459 |
Table of Contents
Notes on the Financial Statements(continued)
43 – HSBC Holdings’ subsidiaries, joint ventures and associates
| Subsidiaries(continued) | Country | Security | Direct (%) | Total (%) | ||||||
Household Financial Center Inc. | United States | $100.00 Common shares | 100 | |||||||
Household Industrial Finance Company | United States | $25.00 Common shares | 100 | |||||||
Household Industrial Loan Company of Kentucky | United States | $100.00 Common shares | 100 | |||||||
Household Insurance Group Holding Company | United States | $1.00 Ordinary shares | 100 | |||||||
Household International Europe Limited | England and Wales | £1 Ordinary, £1 Red Vot Preference & £1 Red Vot shares | 100 | |||||||
Household Pooling Corporation | United States | $1.00 Common shares | 100 | |||||||
Household Realty Corporation | United States | $100.00 Common shares | 100 | |||||||
HPUT A Limited | England and Wales | £1.00 Ordinary shares | 100 | |||||||
HPUT B Limited | England and Wales | £1.00 Ordinary shares | 100 | |||||||
HRMG Nominees Limited | Guernsey | £1.00 Ordinary shares | 100 | |||||||
HSBC (BGF) Investments Limited | England and Wales | £1.00 Ordinary shares | 100 | |||||||
HSBC (Brasil) Administradora de Consorcio Ltda. | Brazil | BRL Ordinary shares | 100 | |||||||
HSBC (General Partner) Limited | Jersey | £1.00 Ordinary shares | 100 | 100 | ||||||
HSBC (Kuala Lumpur) Nominees Sdn Bhd | Malaysia | RM10.00 Ordinary shares | 100 | |||||||
HSBC (Malaysia) Trustee Berhad | Malaysia | RM10.00 Ordinary shares | 100 | |||||||
HSBC (Singapore) Nominees Pte Ltd | Singapore | SGD Ordinary shares | 100 | |||||||
HSBC Administracao de Servicos para Fundos de Pensao (Brasil) Ltda | Brazil | BRL0.01 and BRL1.00 Quota shares | 100 | |||||||
HSBC Administradora de Inversiones S.A. | Argentina | ARS Ordinary shares | 100 | |||||||
HSBC AFS (USA) LLC | United States | Limited liability company – no shares | 100 | |||||||
HSBC Agency (India) Private Limited | India | INR1,000,000.00 Ordinary shares | 100 | |||||||
HSBC Alpha Funding (UK) Holdings | Cayman Islands | $0.001 Limited and Unlimited. Liability shares | 100 | |||||||
HSBC Alternative Investments Limited | England and Wales | £1.00 Ordinary shares | 100 | |||||||
HSBC Amanah Malaysia Berhad | Malaysia | RM0.50 Ordinary shares | 100 | |||||||
HSBC Americas Corporation (Delaware) | United States | $1.00 Common shares | 100 | |||||||
HSBC Argentina Holdings S.A. | Argentina | ARS1.00 Ordinary shares | 100 | |||||||
HSBC Asia Holdings (UK) Limited | England and Wales | $1.00 Ordinary shares | 100 | |||||||
HSBC Asia Holdings B.V. | Netherlands | €1,000 A, B, C, D, E, F. G & H Preference shares | 100 | |||||||
€50.00 Ordinary shares | ||||||||||
HSBC Asia Pacific Holdings (UK) Limited | England and Wales | £1.00 Ordinary and $100.00 Red Preference shares | 100 | |||||||
HSBC Asset Finance (UK) Limited | England and Wales | £1.00 Ordinary shares | 100 | |||||||
HSBC Asset Finance Holdings Limited | England and Wales | £1.00 Ordinary shares | 100 | |||||||
HSBC Asset Finance M.O.G. Holdings (UK) Limited | England and Wales | £1.00 Ordinary shares | 100 | |||||||
HSBC Asset Management (India) Private Limited | India | INR10.00 Equity shares | 100 | |||||||
HSBC Assistencia Previdenciaria | Brazil | BRL0.01 Quota shares | 100 | |||||||
HSBC Assurances Vie (France) | France | €287.50 Actions shares | 100 | |||||||
HSBC Australia Holdings Pty Limited | Australia | A$ Ordinary and A$ Preference shares | 100 | |||||||
HSBC Bank (Chile) | Chile | CLP Ordinary shares | 100 | |||||||
HSBC Bank (China) Company Limited | China | CNY1.00 Registered Capital shares | 100 | |||||||
HSBC Bank (General Partner) Limited | Jersey | £1.00 Ordinary shares | 100 | |||||||
HSBC Bank (RR) (Limited Liability Company) | Russian Federation | Russian limited liability company shares NPV | 100 | |||||||
HSBC Bank (Singapore) Limited | Singapore | SGD Ordinary shares | 100 | |||||||
HSBC Bank (Taiwan) Limited | Taiwan | TWD10.00 Ordinary shares | 100 | |||||||
HSBC Bank (Uruguay) S.A. | Uruguay | UYU1.00 Ordinary shares | 100 | |||||||
HSBC Bank (Vietnam) Ltd. | Vietnam | VND1.00 Ordinary shares | 100 | |||||||
HSBC Bank A.S. | Turkey | TRL1.00 A and TRL1.00B Common shares | 100 | |||||||
HSBC Bank Australia Limited | Australia | A$ Ordinary shares | 100 | |||||||
HSBC Bank Bermuda Limited | Bermuda | BMD1.00 Common shares | 100 | |||||||
HSBC Bank Brasil S.A. - Banco Multiplo | Brazil | BRL Ordinary shares | 100 | |||||||
HSBC Bank Canada | Canada | C$ Common and Class 1 Preferred Shares | 100 | |||||||
HSBC Bank Capital Funding (Sterling 1) LP1 | Jersey | Limited partnership – no shares | 100 | |||||||
HSBC Bank Capital Funding (Sterling 2) LP1 | Jersey | Limited partnership – no shares | 100 | |||||||
HSBC Bank International Limited | Jersey | £1.00 Ordinary shares | 100 | |||||||
HSBC Bank Malaysia Berhad | Malaysia | RM0.50 Ordinary shares | 100 | |||||||
HSBC Bank Middle East Limited | Jersey | $1 Ordinary and $1 Cum Red Preference shares | 100 | |||||||
HSBC Bank Nominee (Jersey) Limited | Jersey | £1.00 Ordinary shares | 100 | |||||||
HSBC Bank Pension Trust (UK) Limited | England and Wales | £1.00 Ordinary shares | 100 | |||||||
HSBC Bank plc | England and Wales | £1.00 Ordinary and Preference Ordinary shares $0.01 Third Dollar and Series 2 Preference shares | 100 | 100 | ||||||
HSBC Bank Polska S.A. | Poland | PLN1.00 Ordinary and PLN1.00 Preference shares | 100 | |||||||
HSBC Bank USA, National Association | United States | $100 Common and $0.01 Preference shares | 100 | |||||||
HSBC Branch Nominee (UK) Limited | England and Wales | £1.00 Ordinary shares | 100 | |||||||
HSBC Brasil Holding S.A. | Brazil | BRL Ordinary shares | 100 | |||||||
HSBC Brasil S.A. Banco de Investmento | Brazil | BRL Ordinary shares | 100 | |||||||
HSBC HOLDINGS PLC
460 |
Table of Contents
| Subsidiaries(continued) | Country | Security | Direct (%) | Total (%) | ||||||
HSBC Broking Forex (Asia) Limited | Hong Kong | HK$10.00 Ordinary shares | 100 | |||||||
HSBC Broking Futures (Asia) Limited | Hong Kong | HK$10.00 Ordinary and $2.00 Deferred shares | 100 | |||||||
HSBC Broking Futures (Hong Kong) Limited | Hong Kong | HK$10.00 Ordinary shares | 100 | |||||||
HSBC Broking Nominees (Asia) Limited | Hong Kong | HK$10.00 Ordinary shares | 100 | |||||||
HSBC Broking Securities (Asia) Limited | Hong Kong | HK$10.00 Ordinary shares | 100 | |||||||
HSBC Broking Securities (Hong Kong) Limited | Hong Kong | HK$10.00 Ordinary shares | 100 | |||||||
HSBC Broking Services (Asia) Limited | Hong Kong | HK$10.00 Ordinary shares | 100 | |||||||
HSBC Canada Holdings (UK) Limited | England and Wales | $1.00 Ordinary shares | 100 | |||||||
HSBC Capital (Canada) Inc. | Canada | C$ Common shares | 100 | |||||||
HSBC Capital (USA), Inc. | United States | $1.00 Common shares | 100 | |||||||
HSBC Capital Funding (Dollar 1) L.P. | Jersey | Limited partnership – no shares | 100 | |||||||
HSBC Capital Funding (Euro 3) L.P. | Jersey | Limited partnership – no shares | 100 | |||||||
HSBC Capital Funding (Sterling 1) L.P. | Jersey | Limited partnership – no shares | 100 | |||||||
HSBC Capital Limited | Hong Kong | HK$10.00 Ordinary shares | 100 | |||||||
HSBC Capital Services Inc. | Canada | C$ Common shares | 100 | |||||||
HSBC Card Services Inc. | United States | $100.00 Common shares | 100 | |||||||
HSBC Casa de Bolsa, S.A. de C.V., Grupo Financiero HSBC | Mexico | MXN Share Class 1 and Class 2 shares | 100 | |||||||
HSBC Cayman Services Limited | Cayman Islands | $1.00 Ordinary shares | 100 | |||||||
HSBC City Funding Holdings | England and Wales | £1.00 Ordinary shares | 100 | |||||||
HSBC Client Holdings Nominee (UK) Limited | England and Wales | £1.00 Ordinary shares | 100 | |||||||
HSBC Client Share Offer Nominee (UK) Limited | England and Wales | £1.00 Ordinary shares | 100 | |||||||
HSBC Columbia Funding, LLC | United States | Limited liability company – no shares | 100 | |||||||
HSBC Consumer Lending (USA) Inc. | United States | $1.00 Common shares | 100 | |||||||
HSBC Corporate Advisory (Malaysia) Sdn Bhd | Malaysia | RM1.00 Ordinary shares | 100 | |||||||
HSBC Corporate Finance (Hong Kong) Limited | Hong Kong | HK$10.00 Ordinary shares | 100 | |||||||
HSBC Corporate Trustee Company (UK) Limited | England and Wales | £1.00 Ordinary shares | 100 | |||||||
HSBC Credit Center, Inc. | United States | $1,000.00 Common shares | 100 | |||||||
HSBC Custody Nominees (Australia) Limited | Australia | AUD1.00 Ordinary shares | 100 | |||||||
HSBC Custody Services (Guernsey) Limited | Guernsey | £1.00 Ordinary shares | 100 | |||||||
HSBC Daisy Investments (Mauritius) Limited | Mauritius | $10.00 Ordinary shares | 100 | |||||||
HSBC Diamond (USA) LP | United States | Limited partnership – no shares | 100 | |||||||
HSBC Electronic Data Processing (Guangdong) Limited | China | HK$1.00 Registered Capital shares | 100 | |||||||
HSBC Electronic Data Processing (Malaysia) Sdn Bhd | Malaysia | RM1.00 Ordinary shares | 100 | |||||||
HSBC Electronic Data Processing (Philippines), Inc. | Philippines | PHP100.00 Ordinary and Red Preference shares | 100 | |||||||
HSBC Electronic Data Processing India Private Limited | India | INR100.00 Equity shares | 100 | |||||||
HSBC Electronic Data Processing Lanka (Private) Limited | Sri Lanka | LKR10.00 Ordinary shares | 100 | |||||||
HSBC Electronic Data Service Delivery (Egypt) S.A.E. | Egypt | EGP1.00 Ordinary shares | 100 | |||||||
HSBC Enterprise Investment Company (UK) Limited | England and Wales | £1.00 Ordinary shares | 100 | |||||||
HSBC Epargne Entreprise (France) | France | €16.00 Actions shares | 100 | |||||||
HSBC Equator (UK) Limited | England and Wales | $1.00 Ordinary and £1.00 Non-Vot Def shares | 100 | |||||||
HSBC Equipment Finance (UK) Limited | England and Wales | £1.00 Ordinary shares | 100 | |||||||
HSBC Equities (Luxembourg) S.a r.l. | Luxembourg | €1.00 Ordinary shares | 100 | |||||||
HSBC Equity (UK) Limited | England and Wales | £1.00 Ordinary shares | 100 | |||||||
HSBC Europe B.V. | Netherlands | €50.00 Ordinary and€50.00 Preference A & C shares | 100 | |||||||
HSBC European Clients Depositary Receipts Nominee (UK) Limited | England and Wales | £1.00 Ordinary shares | 100 | |||||||
HSBC Executor & Trustee Company (UK) Limited | England and Wales | £1.00 Ordinary (£0.40 paid) shares | 100 | |||||||
HSBC Factoring (France) | France | €16.00 Actions shares | 100 | |||||||
HSBC Finance (Brunei) Berhad | Brunei Darussalam | BND1,000.00 Ordinary shares | 100 | |||||||
HSBC Finance (Netherlands) | England and Wales | £1.00 Ordinary shares and £1.00 Ordinary Red shares | 100 | 100 | ||||||
HSBC Finance Corporation | United States | $0.01 Common shares | 100 | |||||||
HSBC Finance Holdings (Australia) Pty Limited | Australia | A$1.00 Ordinary shares | 100 | |||||||
HSBC Finance Limited | England and Wales | £1.00 Ordinary shares | 100 | |||||||
HSBC Finance Mortgages Inc. | Canada | C$ Common shares | 100 | |||||||
HSBC Finance Transformation (UK) Limited | £1.00 Ordinary shares | 100 | 100 | |||||||
HSBC Financial Services (Middle East) Limited | United Arab Emirates | AED1,000.00 Ordinary shares | 100 | |||||||
HSBC Fondo 1, S.A. de C.V., Sociedad de Inversion de Renta Variable1 | Mexico | MXN1.00 Series A shares | 100 | |||||||
HSBC Fondo 3, S.A. de C.V., Sociedad de Inversion de Renta Variable1 | Mexico | MXN1.00 Series A shares | 100 | |||||||
HSBC Fondo 4, S.A. de C.V., Sociedad de Inversion de Renta Variable1 | Mexico | MXN1.00 Series A shares | 100 | |||||||
HSBC Fondo 5, S.A. de C.V., Sociedad de Inversion de Renta Variable1 | Mexico | MXN1.00 Series A shares | 100 | |||||||
HSBC Fondo 6, S.A. de C.V., Sociedad de Inversion de Renta Variable1 | Mexico | MXN1.00 Series A shares | 100 | |||||||
HSBC Fondo Global 1, S.A. de C.V., Sociedad de Inversion de Renta Variable1 | Mexico | MXN1.00 Series A shares | 100 | |||||||
HSBC Fund Administration (Jersey) Limited | Jersey | £1.00 Ordinary shares | 100 | |||||||
HSBC Funding (UK) Holdings | England and Wales | £1.00 Ordinary shares | 100 | |||||||
HSBC Funds Nominee (Jersey) Limited | Jersey | £1.00 Ordinary shares | 100 | |||||||
HSBC Germany Holdings GmbH | Germany | €1.00 Common shares | 100 | |||||||
HSBC Gestao de Recursos Ltda | Brazil | BRL1.00 Quota shares | 100 | |||||||
HSBC Global Asset Management (Bermuda) Limited | Bermuda | BMD1.00 Common and BMD1.00 Preference shares | 100 | |||||||
HSBC Global Asset Management (Canada) Limited | Canada | C$ Common shares | 100 | |||||||
HSBC Global Asset Management (Deutschland) GmbH | Germany | €1.00 Common shares | 100 | |||||||
HSBC Global Asset Management (France) | France | €16.00 Actions shares | 100 | |||||||
HSBC HOLDINGS PLC
461 |
Table of Contents
Notes on the Financial Statements(continued)
43 – HSBC Holdings’ subsidiaries, joint ventures and associates
| Subsidiaries(continued) | Country | Security | Direct (%) | Total (%) | ||||
HSBC Global Asset Management (Hong Kong) Limited | Hong Kong | HK$100.00 Ordinary shares | 100 | |||||
HSBC Global Asset Management (International) Limited | Jersey | £1.00 Ordinary shares | 100 | |||||
HSBC Global Asset Management (Japan) K. K. | Japan | JPY Ordinary shares | 100 | |||||
HSBC Global Asset Management (Mexico), S.A. de C.V., Grupo Financiero HSBC | Mexico | MXN1,000.00 Ordinary shares | 100 | |||||
HSBC Global Asset Management (Oesterreich) GmbH | Austria | €1.00 GmbH Anteil shares | 100 | |||||
HSBC Global Asset Management (Singapore) Limited | Singapore | SGD Ordinary shares | 100 | |||||
HSBC GLOBAL ASSET MANAGEMENT (Switzerland) AG | Switzerland | CHF10.00 Actions shares | 100 | |||||
HSBC Global Asset Management (Taiwan) Limited | Taiwan | TWD10.00 Ordinary shares | 100 | |||||
HSBC Global Asset Management (UK) Limited | England and Wales | £0.25 Ordinary shares | 100 | |||||
HSBC Global Asset Management (USA) Inc. | United States | $1.00 Common shares | 100 | |||||
HSBC Global Asset Management Holdings (Bahamas) Limited | Bahamas | $1.00 Ordinary shares | 100 | |||||
HSBC Global Asset Management Limited | England and Wales | £1.00 Ordinary shares | 100 | |||||
HSBC Global Custody Nominee (UK) Limited | England and Wales | £1.00 Ordinary shares | 100 | |||||
HSBC Global Custody Proprietary Nominee (UK) Limited | England and Wales | £1.00 Ordinary shares | 100 | |||||
HSBC Global Services (UK) Limited | England and Wales | £1.00 Ordinary shares | 100 | |||||
HSBC Global Services Limited | England and Wales | $1.00 Ordinary shares | 100 | 100 | ||||
HSBC Global Shared Services (India) Private Limited | India | INR10.00 Ordinary shares | 100 | |||||
HSBC Group Management Services Limited | England and Wales | £1.00 Ordinary shares | 100 | |||||
HSBC Group Nominees UK Limited | England and Wales | £1.00 Ordinary shares | 100 | 100 | ||||
HSBC Guyerzeller Trust Company | Cayman Islands | $1.00 Ordinary shares | 100 | |||||
HSBC Holdings B.V. | Netherlands | €453.78 Ordinary and Preference C, D, E, H & I shares | 100 | |||||
HSBC Home Equity Loan Corporation I | United States | $1.00 Common shares | 100 | |||||
HSBC Home Equity Loan Corporation II | United States | $100.00 Common shares | 100 | |||||
HSBC IM Pension Trust Limited | England and Wales | £1.00 Ordinary shares | 100 | |||||
HSBC Infrastructure Limited | England and Wales | £1.00 Ordinary shares | 100 | |||||
HSBC INKA Investment-AG TGV | Germany | €1.00 Stückaktien shares | 100 | |||||
HSBC Institutional Trust Services (Asia) Limited | Hong Kong | HK$100.00 Ordinary shares | 100 | |||||
HSBC Institutional Trust Services (Bermuda) Limited | Bermuda | BMD1.00 Common shares | 100 | |||||
HSBC Institutional Trust Services (Ireland) Limited | Ireland | $1.00 Ordinary shares | 100 | |||||
HSBC Institutional Trust Services (Mauritius) Limited | Mauritius | $1.00 Ordinary shares | 100 | |||||
HSBC Institutional Trust Services (Singapore) Limited | Singapore | SGD Ordinary shares | 100 | |||||
HSBC Insurance (Asia) Limited | Hong Kong | HK$1,000.00 Ordinary shares | 100 | |||||
HSBC Insurance (Asia-Pacific) Holdings Limited | Hong Kong | HK$10.00 Ordinary & Cum Red Class A Preference shares | 100 | |||||
HK$10.00 Cum Red Class B and C Preference shares | ||||||||
HK$10.00 Cum Red Class D and E Preference shares | ||||||||
HK$10.00 Cum Red Class F and G Preference shares | ||||||||
HSBC Insurance (Bermuda) Limited | Bermuda | $1.96345 Ordinary shares | 100 | |||||
HSBC Insurance (Singapore) Pte. Limited | Singapore | SGD Ordinary NPV shares | 100 | |||||
HSBC Insurance Agency (USA) Inc. | United States | $1.00 Common shares | 100 | |||||
HSBC Insurance Brokers (Philippines) Inc | Philippines | PHP1.00 Ordinary shares | 100 | |||||
HSBC Insurance Brokers (Taiwan) Limited | Taiwan | TWD10.00 Ordinary shares | 100 | |||||
HSBC Insurance Holdings Limited | England and Wales | £1.00 Ordinary shares | 100 | 100 | ||||
HSBC Insurance Services Holdings Limited | England and Wales | £0.10 Ordinary shares | 100 | |||||
HSBC Intermediate Leasing (UK) Limited | England and Wales | £1,000.00 Issued shares | 100 | |||||
HSBC International Finance Corporation (Delaware) | United States | $1.000.00 Common shares | 100 | |||||
HSBC International Financial Services (UK) Limited | England and Wales | £1.00 ‘A’, ‘B’, ‘C’ and £1.00 Non-Vot Red shares | 100 | |||||
HSBC International Holdings (Jersey) Limited | Jersey | £1.00 Ordinary shares | 100 | |||||
HSBC International Nominees Limited | Virgin Islands, British | $1.00 Ordinary shares | 100 | |||||
HSBC International Trade Finance Limited | England and Wales | £1.00 Ordinary shares | 100 | |||||
HSBC International Trustee (BVI) Limited | Virgin Islands, British | $0.01 Class A Non-Voting shares | 100 | |||||
$6,000.00 Non-Part Voting shares | ||||||||
HSBC International Trustee (Holdings) Pte. Limited1 | Singapore | SGD Ordinary shares | 100 | |||||
HSBC International Trustee Limited | Virgin Islands, British | $1.00 Ordinary shares | 100 | |||||
HSBC Inversiones S.A. | Chile | CLP402.14 Ordinary shares | 100 | |||||
HSBC Inversiones y Servicios Financieros Limitada | Chile | CLP Ordinary shares | 100 | |||||
HSBC InvestDirect Financial Services (India) Limited | India | INR10.00 Ordinary shares | 100 | |||||
HSBC InvestDirect Securities (India) Private Limited | India | INR10.00 Ordinary shares | 100 | |||||
HSBC Investment Asia Holdings Limited | Hong Kong | HK$10.00 Ordinary shares | 100 | |||||
HSBC Investment Bank Holdings B.V. | Netherlands | €50.00 Ordinary shares | 100 | |||||
HSBC Investment Bank Holdings Limited | England and Wales | £1.00 Ordinary shares | 100 | 100 | ||||
HSBC Investment Funds (Canada) Inc. | Canada | C$ Common and C$ Red Preference shares | 100 | |||||
HSBC Investment Funds (Hong Kong) Limited | Hong Kong | HK$10.00 Ordinary shares | 100 | |||||
HSBC Investment Funds (Luxembourg) SA | Luxembourg | £1.00 Ordinary shares | 100 | |||||
HSBC Investment Holdings (Guernsey) Limited | Guernsey | $1.00 Ordinary shares | 100 | |||||
HSBC Investment Services (Africa) (Pty) Limited | South Africa | ZAR1.00 Ordinary shares | 100 | |||||
HSBC Investments (Bahamas) Limited | Bahamas | BSD100.00 Ordinary shares | 100 | |||||
HSBC Investments (North America) Inc. | United States | $1.00 Common shares | 100 | |||||
HSBC Invoice Finance (UK) Limited | England and Wales | £1.00 Ordinary shares | 100 | |||||
HSBC Issuer Services Common Depositary Nominee (UK) Limited | England and Wales | £1.00 Ordinary shares | 100 | |||||
HSBC Issuer Services Depositary Nominee (UK) Limited | England and Wales | £1.00 Ordinary shares | 100 | |||||
HSBC Jade Limited Partnership | United States | Limited partnership – no shares | 100 | |||||
HSBC HOLDINGS PLC
462 |
Table of Contents
| Subsidiaries(continued) | Country | Security | Direct (%) | Total (%) | ||||
HSBC Latin America B.V. | Netherlands | Ordinary€500 Cl-A€250 Cl-B€50 Cl-C shares | 100 | |||||
HSBC Latin America Holdings (UK) Limited | England and Wales | £1.00 Ordinary shares | 100 | 100 | ||||
HSBC Leasing (Asia) Limited | Hong Kong | HK$100.00 Ordinary shares | 100 | |||||
HSBC Leasing (France) | France | €9.57 Actions shares | 100 | |||||
HSBC Life (International) Limited | Bermuda | HK$1.00 Ordinary shares | 100 | |||||
HSBC Life (UK) Limited | England and Wales | £1.00 Ordinary shares | 100 | |||||
HSBC Lodge Funding (UK) Holdings | England and Wales | £1.00 Ordinary shares | 100 | |||||
HSBC Logan Holdings USA, LLC | United States | Limited liability company – no shares | 100 | |||||
HSBC London Holdings Limited | England and Wales | £1.00 Ordinary shares | 100 | 100 | ||||
HSBC LU Nominees Limited | England and Wales | £1.00 Ordinary shares | 100 | |||||
HSBC Management (Guernsey) Limited | Guernsey | £1.00 Ordinary shares | 100 | |||||
HSBC Markets (NY) Inc. | United States | $4.00 Common shares | 100 | |||||
HSBC Markets (USA) Inc. | United States | $1.00 Common shares | 100 | |||||
HSBC Marking Name Nominee (UK) Limited | England and Wales | £1.00 Ordinary shares | 100 | |||||
HSBC Middle East Holdings B.V. | Netherlands | €500 Ordinary &€1,000 Preference – Class A shares | 100 | |||||
HSBC Middle East Leasing Partnership | United Arab Emirates | Partnership – no shares | 100 | |||||
HSBC Mortgage Corporation (Canada) | Canada | C$ Common & Class A Preferred Shares | 100 | |||||
HSBC Mortgage Corporation (USA) | United States | $1.00 Common shares | 100 | |||||
HSBC Mortgage Services Inc. | United States | $100.00 Common shares | 100 | |||||
HSBC Nominees (Asing) Sdn Bhd | Malaysia | RM1.00 Ordinary shares | 100 | |||||
HSBC Nominees (Hong Kong) Limited | Hong Kong | HK$10.00 Ordinary shares | 100 | |||||
HSBC Nominees (New Zealand) Limited | New Zealand | NZD1.00 Ordinary shares | 100 | |||||
HSBC Nominees (Tempatan) Sdn Bhd | Malaysia | RM1.00 Ordinary shares | 100 | |||||
HSBC North America Holdings Inc. | United States | $0.01 Common & Preferred Series B shares | 100 | |||||
HSBC North America Inc. | United States | $1.00 Common shares | 100 | |||||
HSBC Odeme Sistemleri Bilgisayar Teknolojileri Basin Yayin Ve Musteri Hizmetleri | Turkey | TRL1.00 Ordinary shares | 100 | |||||
HSBC Overseas Holdings (UK) Limited | England and Wales | £1.00 Ordinary shares | 100 | 100 | ||||
HSBC Overseas Investments (UK) Limited | England and Wales | £1.00 Ordinary shares | 100 | 100 | ||||
HSBC Overseas Investments Corporation (New York) | United States | $0.01 Common shares | 100 | |||||
HSBC Overseas Nominee (UK) Limited | England and Wales | £1.00 Ordinary shares | 100 | |||||
HSBC Participaciones (Argentina) S.A. | Argentina | ARS1.00 Ordinary shares | 100 | |||||
HSBC Participacoes e Investimentos Ltda | Brazil | BRL0.01 Quota shares | 100 | |||||
HSBC PB Corporate Services 1 Limited | Jersey | £1.00 Ordinary shares | 100 | |||||
HSBC PB Corporate Services 2 Limited | Jersey | £1.00 Ordinary shares | 100 | |||||
HSBC PB Services (Suisse) SA | Switzerland | CHF1,000.00 Ordinary shares | 100 | |||||
HSBC Pension Trust (Ireland) Limited | Ireland | €1.26974 Ordinary shares | 100 | |||||
HSBC Pensiones, S.A. | Mexico | MXN Ordinary shares | 100 | |||||
HSBC Pensions (Jersey) Limited | Jersey | £1.00 Ordinary shares | 100 | |||||
HSBC PH Investments (UK) Limited | England and Wales | £1.00 Ordinary shares | 100 | |||||
HSBC PI Holdings (Mauritius) Limited | Mauritius | $1.00 Ordinary shares | 100 | |||||
HSBC Portfoy Yonetimi A.S. | Turkey | TRL1.00 A Common shares | 100 | |||||
HSBC Preferential LP (UK) | England and Wales | £1.00 Ordinary shares | 100 | |||||
HSBC Private Bank (C.I.) Limited | Guernsey | $1.00 Ordinary shares | 100 | |||||
HSBC Private Bank (Luxembourg) S.A. | Luxembourg | €1,000.00 Ordinary shares | 100 | |||||
HSBC Private Bank (Monaco) SA | Monaco | €155.00 Actions shares | 100 | |||||
HSBC Private Bank (Suisse) SA | Switzerland | CHF1,000.00 Ordinary shares | 100 | |||||
HSBC Private Bank (UK) Limited | England and Wales | £10.00 Issued shares | 100 | |||||
HSBC Private Bank International | United States | $1,000.00 Common shares | 100 | |||||
HSBC Private Banking Holdings (Suisse) SA | Switzerland | CHF1,000.00 Ordinary shares | 100 | |||||
HSBC Private Banking Nominee 1 (Jersey) Limited | Jersey | £1.00 Ordinary shares | 100 | |||||
HSBC Private Banking Nominee 2 (Jersey) Limited | Jersey | £1.00 Ordinary shares | 100 | |||||
HSBC Private Banking Nominee 3 (Jersey) Limited | Jersey | £1.00 Ordinary shares | 100 | |||||
HSBC Private Equity Advisors LLC | United States | Limited liability company – no shares | 100 | |||||
HSBC Private Equity Investments (UK) Limited | England and Wales | £1.00 Issued shares | 100 | |||||
HSBC Private Trustee (Hong Kong) Limited | Hong Kong | HK$10.00 Ordinary shares | 100 | |||||
HSBC Private Wealth Services (Canada) Inc. | Canada | C$ Common and C$ Preference shares | 100 | |||||
HSBC Procyon Fund Ltd | Cayman Islands | BRL2,618.38127 Red Preference shares | 100 | |||||
HSBC Professional Services (India) Private Limited | India | INR10.00 Ordinary shares | 100 | |||||
HSBC Property (UK) Limited | England and Wales | £1.00 Ordinary shares | 100 | |||||
HSBC Property Funds (Holding) Limited | England and Wales | £1.00 Ordinary shares | 100 | |||||
HSBC Property Funds Investment Limited | England and Wales | £1.00 Ordinary shares | 100 | |||||
HSBC Property Investments Limited | England and Wales | £1.00 Ordinary shares | 100 | |||||
HSBC Provident Fund Trustee (Hong Kong) Limited | Hong Kong | HK$10.00 Ordinary shares | 100 | |||||
HSBC QUEST Trustee (UK) Limited | England and Wales | £1.00 Ordinary shares | 100 | 100 | ||||
HSBC Rail (UK) Limited | England and Wales | £1.00 Ordinary shares | 100 | |||||
HSBC Real Estate Leasing (France) | France | €15.24 Actions shares | 100 | |||||
HSBC Realty Credit Corporation (USA) | United States | $1.00 Common & $500 Preferred shares | 100 | |||||
HSBC REIM (France) | France | €92.00 Actions shares | 100 | |||||
HSBC HOLDINGS PLC
463 |
Table of Contents
Notes on the Financial Statements(continued)
43 – HSBC Holdings’ subsidiaries, joint ventures and associates
| Subsidiaries(continued) | Country | Security | Direct (%) | Total (%) | ||||
HSBC Representative Office (Nigeria) Limited | Nigeria | Ordinary shares no par value | 100 | |||||
HSBC Republic Management Services (Guernsey) Limited | Guernsey | $0.10 Ordinary shares | 100 | |||||
HSBC Retail Services Inc. | United States | $100.00 Common shares | 100 | |||||
HSBC Retirement Benefits Trustee (UK) Limited | England and Wales | £1.00 Issued shares | 100 | 100 | ||||
HSBC Savings Bank (Philippines) Inc. | Philippines | PHP10.00 Ordinary shares | 100 | |||||
HSBC Securities (Asia) Limited | Hong Kong | HK$10.00 Ordinary and HK$10.00 Deferred shares | 100 | |||||
HSBC Securities (B) Berhad | Brunei Darussalam | BND1.00 Ordinary shares | 100 | |||||
HSBC Securities (Canada) Inc. | Canada | Common – C$ Class A & $ Class B shares | 100 | |||||
HSBC Securities (Japan) Limited | England and Wales | £1.00 Ordinary shares | 100 | |||||
HSBC Securities (Philippines) Inc. | Philippines | PHP10.00 Nominal shares | 100 | |||||
HSBC Securities (Singapore) Pte Limited | Singapore | SGD Ordinary shares | 100 | |||||
HSBC Securities (South Africa) (Pty) Limited | South Africa | ZAR1.00 Ordinary shares | 100 | |||||
HSBC Securities (Taiwan) Corporation Limited | Taiwan | TWD10.00 Ordinary shares | 100 | |||||
HSBC Securities (USA) Inc. | United States | $0.05 Common shares | 100 | |||||
HSBC Securities and Capital Markets (India) Private Limited | India | INR100.00 Ordinary and INR100.00 Red Preference shares | 100 | |||||
HSBC Securities Asia International Nominees Limited | Virgin Islands, British | $1.00 Ordinary shares | 100 | |||||
HSBC Securities Asia Nominees Limited | Hong Kong | HK$1.00 Ordinary shares | 100 | |||||
HSBC Securities Brokers (Asia) Limited | Hong Kong | HK$10.00 Ordinary shares | 100 | |||||
HSBC Securities Investments (Asia) Limited | Hong Kong | HK$10.00 Ordinary shares | 100 | |||||
HSBC Securities Services (Bermuda) Limited | Bermuda | BMD1.00 Common shares | 100 | |||||
HSBC Securities Services (Guernsey) Limited | Guernsey | £1.00 Ordinary Shares | 100 | |||||
HSBC Securities Services (Ireland) Limited | Ireland | €1.25 and $1.00 Ordinary shares | 100 | |||||
HSBC Securities Services (Luxembourg) S.A. | Luxembourg | $100.00 Ordinary shares | 100 | |||||
HSBC Securities Services (USA) Inc. | United States | $0.001 Common shares | 100 | |||||
HSBC Securities Services Holding Limited | Virgin Islands, British | $1.00 Ordinary shares | 100 | |||||
HSBC Securities Services Holdings (Ireland) Limited | Ireland | €1.25 and $1.00 Ordinary shares | 100 | |||||
HSBC Seguros de Retiro (Argentina) S.A. | Argentina | ARS1.00 Ordinary A and Ordinary B shares | 100 | |||||
HSBC Seguros de Vida (Argentina) S.A. | Argentina | ARS1.00 Ordinary shares | 100 | |||||
HSBC Seguros, S.A de C.V., Grupo Financiero HSBC | Mexico | MXN Class I and Class II shares | 100 | |||||
HSBC Service Delivery (Polska) Sp. z o.o. | Poland | PLN500.00 Ordinary shares | 100 | |||||
HSBC Services (France) | France | €18.50 Actions shares | 100 | |||||
HSBC Services Japan Limited | Bahamas | $1.00 Ordinary shares | 100 | |||||
HSBC Servicios Financieros, S.A. de C.V | Mexico | MXN1.00 Share Class 1 and 2 shares | 100 | |||||
HSBC Servicios, S.A. DE C.V., Grupo Financiero HSBC | Mexico | MXN500 Series ‘A’ and MXN Ordinary B shares | 100 | |||||
HSBC Servicos e Participacoes Ltda | Brazil | BRL0.01 Ordinary shares | 100 | |||||
HSBC SFH (France) | France | €15.00 Actions shares | 100 | |||||
HSBC Software Development (Brasil) - Prestacao de Servicos Tecnologicos Ltda | Brazil | BRL1.00 Quota shares | 100 | |||||
HSBC Software Development (Canada) Inc | Canada | CAD1.00 Common shares | 100 | |||||
HSBC Software Development (Guangdong) Limited | China | $1.00 Registered Capital shares | 100 | |||||
HSBC Software Development (India) Private Limited | India | INR10.00 Equity shares | 100 | |||||
HSBC Software Development (Malaysia) Sdn Bhd | Malaysia | RM1.00 Ordinary shares | 100 | |||||
HSBC South Point Investments (Barbados) LLP | England and Wales | Limited liability partnership – no shares | 100 | |||||
HSBC Specialist Investments Limited | England and Wales | £1.00 Ordinary and £1.00 Red Preference shares | 100 | |||||
HSBC Stockbroker Services (Client Assets) Nominees Limited | England and Wales | £1.00 Ordinary shares | 100 | |||||
HSBC Stockbrokers Nominee (UK) Limited | England and Wales | £1.00 Ordinary shares | 100 | |||||
HSBC Structured Funds (Asia) Limited | Hong Kong | HK$10.00 Ordinary shares | 100 | |||||
HSBC Taxpayer Financial Services Inc. | United States | $100.00 Common shares | 100 | |||||
HSBC Technology & Services (China) Limited | China | $1.00 Registered Capital shares | 100 | |||||
HSBC Technology & Services (USA) Inc. | United States | $1.00 Common shares | 100 | |||||
HSBC TFS I 2005 LLC | United States | Limited liability company – no shares | 100 | |||||
HSBC TKM Limited | England and Wales | £0.01 Ordinary shares | 100 | |||||
HSBC Trust Company (BVI) Limited | Virgin Islands, British | $1.00 Ordinary-A shares | 100 | |||||
HSBC Trust Company (Canada) | Canada | C$ Common shares | 100 | |||||
HSBC Trust Company (Delaware), National Association | United States | $100.00 Ordinary shares | 100 | |||||
HSBC Trust Company (UK) Limited | England and Wales | £5.00 Ordinary shares | 100 | |||||
HSBC Trust Company AG | Switzerland | CHF1,000.00 Ordinary shares | 100 | |||||
HSBC Trustee (C.I.) Limited | Jersey | £1.00 Ordinary shares | 100 | |||||
HSBC Trustee (Cayman) Limited | Cayman Islands | $1,000.00 Ordinary shares | 100 | |||||
HSBC Trustee (Cook Islands) Limited | Cook Islands | NZD Ordinary shares | 100 | |||||
HSBC Trustee (Guernsey) Limited | Guernsey | $1.00 Ordinary shares | 100 | |||||
HSBC Trustee (Hong Kong) Limited | Hong Kong | HK$10.00 Ordinary (HK$5.00 pt pd) shares | 100 | |||||
HSBC Trustee (Mauritius) Limited | Mauritius | $1.00 Ordinary shares | 100 | |||||
HSBC Trustee (Singapore) Limited | Singapore | SGD Ordinary shares | 100 | |||||
HSBC Tulip Funding (UK) | England and Wales | £1.00 Ordinary shares | 100 | |||||
HSBC UK RFB Limited1 | England and Wales | £1.00 Ordinary shares | 100 | 100 | ||||
HSBC USA Inc. | United States | $5.00 Common shares | 100 | |||||
HSBC Valores S.A. Sociedad de Bolsa | Argentina | ARS1.00 Ordinary shares | 100 | |||||
HSBC Vida e Previdencia (Brasil) SA | Brazil | BRL Ordinary shares | 100 | |||||
HSBC HOLDINGS PLC
464 |
Table of Contents
| Subsidiaries(continued) | Country | Security | Direct (%) | Total (%) | ||||
HSBC Violet Investments (Mauritius) Limited | Mauritius | $10.00 Ordinary shares | 100 | |||||
HSBC Wealth Advisory Israel Ltd | Israel | ILS1.00 Ordinary shares | 100 | |||||
HSBC Wealth Client Nominee Limited | England and Wales | £1.00 Ordinary shares | 100 | |||||
HSBC Workplace Retirement Services Fund Platform Nominee Company Limited | England and Wales | £1.00 Ordinary shares | 100 | |||||
HSBC Yatirim Menkul Degerler A.S. | Turkey | TRL1.00 Ordinary-A shares | 100 | |||||
HSBC-D1, S.A. de C.V., Sociedad de Inversion en Instrumentos de Deuda1 | Mexico | MXN2.00 Ordinary shares | 100 | |||||
HSBC-D10, S.A. de C.V., Sociedad de Inversion en Instrumentos de Deuda1 | Mexico | MXN1.00 Ordinary-A shares | 100 | |||||
HSBC-D2, S.A. de C.V., Sociedad de Inversion en Instrumentos de Deuda1 | Mexico | MXN1.00 Ordinary shares | 100 | |||||
HSBC-D7, S.A. de C.V., Sociedad de Inversion en Instrumentos de Deuda1 | Mexico | MXN10.00 Ordinary shares | 100 | |||||
HSBC-D9, S.A. de C.V., Sociedad de Inversion en Instrumentos de Deuda1 | Mexico | MXN1.40 Ordinary shares | 100 | |||||
HSBC-DE, S.A. de C.V., Sociedad de Inversion en Instrumentos de Deuda1 | Mexico | MXN1.098 Ordinary shares | 100 | |||||
HSBC-DG, S.A. de C.V., Sociedad de Inversion en Instrumentos de Deuda1 | Mexico | MXN10.00 Ordinary shares | 100 | |||||
HSBC-DH, S.A. de C.V., Sociedad de Inversion en Instrumentos de Deuda1 | Mexico | MXN1.00 Ordinary A shares | 100 | |||||
HSBC-DL, S.A. de C.V., Sociedad de Inversion en Instrumentos de Deuda1 | Mexico | MXN1.00 Ordinary A shares | 100 | |||||
HSBC-E2, S.A. de C.V., Sociedad de Inversion de Renta Variable1 | Mexico | MXN1.00 Ordinary A shares | 100 | |||||
HSBC-E3, S.A. de C.V., Sociedad de Inversion en Instrumentos de Deuda1 | Mexico | MXN1.00 Ordinary A shares | 100 | |||||
HSBC-FF, S.A. de C.V., Sociedad de Inversion de Renta Variable1 | Mexico | MXN1.00 Ordinary shares | 100 | |||||
HSBC-V2, S.A. de C.V., Sociedad de Inversion de Renta Variable1 | Mexico | MXN1.00 Ordinary shares | 100 | |||||
HSBC-V3, S.A. de C.V., Sociedad de Inversion de Renta Variable1 | Mexico | MXN1.66 Ordinary shares | 100 | |||||
HSI Asset Securitization Corporation | United States | $0.01 Common shares | 100 | |||||
HSIL Investments Limited | England and Wales | £1.00 Ordinary shares | 100 | |||||
Hubei Macheng HSBC Rural Bank Company Limited | China | CNY1.00 Registered Capital shares | 100 | |||||
Hubei Suizhou Cengdu HSBC Rural Bank Company Limited | China | CNY1.00 Registered Capital shares | 100 | |||||
Hubei Tianmen HSBC Rural Bank Company Limited | China | CNY1.00 Registered Capital shares | 100 | |||||
Hunan Pingjiang HSBC Rural Bank Company Limited | China | CNY1.00 Registered Capital shares | 100 | |||||
Inmobiliaria Bisa, S.A. de C.V. | Mexico | MXN1.00 Serie ‘A’ and ‘B’ shares | 100 | |||||
Inmobiliaria Grufin, S.A. de C.V. | Mexico | MXN1.00 Serie ‘A’ and ‘B’ shares | 100 | |||||
Inmobiliaria Guatusi, S.A. de C.V. | Mexico | MXN10.00 Class I and II shares | 100 | |||||
IRERE French Offices 1 | France | €0.10 Ordinary shares | 100 | |||||
IRERE French Offices 2 | France | €0.10 Ordinary shares | 100 | |||||
IRERE French Offices 4 | France | €0.10 Ordinary shares | 100 | |||||
IRERE French Offices Holdings | France | €1.00 Ordinary shares | 100 | |||||
IRERE French Offices Holdings 3 | France | €1.00 Ordinary shares | 100 | |||||
IRERE Property Investments (French Offices) Sarl | Luxembourg | €25.00 Ordinary shares | 100 | |||||
James Capel & Co. Limited | England and Wales | £1.00 Issued shares | 100 | |||||
James Capel (Channel Islands) Nominees Limited | Jersey | £1.00 Ordinary shares | 100 | |||||
James Capel (Custodian) Nominees Limited | United Kingdom | £1.00 Issued shares | 100 | |||||
James Capel (Nominees) Limited | England and Wales | £1.00 Ordinary shares | 100 | |||||
James Capel (Second Nominees) Limited | England and Wales | £1.00 Issued shares | 100 | |||||
James Capel (Taiwan) Nominees Limited | England and Wales | £1.00 Issued shares | 100 | |||||
James Capel (Third Nominees) Limited | England and Wales | £1.00 Issued shares | 100 | |||||
John Lewis Financial Services Limited | England and Wales | £1.00 Ordinary shares | 100 | |||||
Katonah Close Corp. | United States | $1.00 Common shares | 100 | |||||
Keyser Ullmann Limited | England and Wales | £1.00 Ordinary shares | 100 | |||||
Kings Meadow Nominees Limited | England and Wales | £1.00 Ordinary shares | 100 | |||||
Legend Estates Limited | England and Wales | £1.00 Ordinary shares | 100 | |||||
Lemasco Nominees Limited | Jersey | £1.00 Ordinary shares | 100 | |||||
Lion Corporate Services Limited | Hong Kong | HK$10.00 Ordinary shares | 100 | |||||
Lion International Corporate Services Limited | Virgin Islands, British | $1.00 Ordinary shares | 100 | |||||
Lion International Management Limited | Virgin Islands, British | $1.00 Ordinary shares | 100 | |||||
Lion Management (Hong Kong) Limited | Hong Kong | HK$10.00 Ordinary shares | 100 | |||||
Lyndholme Limited | Hong Kong | HK$10.00 Ordinary shares | 100 | |||||
MAGIM Client HSBC GIS Nominee (UK) Limited | England and Wales | £1.00 Ordinary shares | 100 | |||||
Marks and Spencer Financial Services plc | England and Wales | £1.00 Ordinary shares | 100 | |||||
Marks and Spencer Retail Financial Services Holdings Limited | England and Wales | £1.00 Ordinary shares | 100 | |||||
Marks and Spencer Savings and Investments Limited | England and Wales | £1.00 Ordinary shares | 100 | |||||
Marks and Spencer Unit Trust Management Limited | England and Wales | £1.00 Ordinary shares | 100 | |||||
Maxima S.A. AFJP | Argentina | ARS0.25 Ordinary shares | 100 | |||||
Mercantile Company Limited | England and Wales | £1.00 Ordinary and £1.00 Deferred shares | 100 | |||||
Midcorp Limited | England and Wales | £1.00 Ordinary and £1.00 Non-Cum Red Preference shares | 100 | 100 | ||||
Midland Australia Pty Limited | Australia | AUD1.00 Ordinary shares | 100 | |||||
Midland Bank (Branch Nominees) Limited | England and Wales | £1.00 Ordinary shares | 100 | |||||
Midland Nominees Limited | England and Wales | £1.00 Ordinary shares | 100 | |||||
MIL (Cayman) Limited | Cayman Islands | $1.00 Ordinary shares | 100 | |||||
MIL (Jersey) Limited | Jersey | £1.00 Ordinary shares | 100 | |||||
MIL Properties (Cook Islands) Limited | Cook Islands | NZD1.00 Ordinary shares | 100 | |||||
MM Mooring #2 Corp. | United States | $1.00 Common shares | 100 | |||||
Mortgage One Corporation | United States | $100.00 Common shares | 100 | |||||
Mortgage Two Corporation | United States | $100.00 Common shares | 100 | |||||
MW Gestion SA | Argentina | ARS12,000.00 Ordinary shares | 100 | |||||
Neil Corporation | United States | $1.00 Common shares | 100 | |||||
Neuilly Valeurs | France | €15.24 Parts shares | 100 | |||||
Oakwood Holdings, Inc. | United States | $1.00 Common shares | 100 | |||||
One Main Street, Inc. | United States | $1.00 Common shares | 100 | |||||
HSBC HOLDINGS PLC
465 |
Table of Contents
Notes on the Financial Statements (continued)
43 – HSBC Holdings’ subsidiaries, joint ventures and associates
| Subsidiaries(continued) | Country | Security | Direct (%) | Total (%) | ||||||
Promocion en Bienes Raices, S.A. de C.V. | Mexico | MXN1 Class ‘I’ and ‘II’ and Preference shares | 100 | |||||||
Prudential Client HSBC GIS Nominee (UK) Limited | England and Wales | £1.00 Ordinary shares | 100 | |||||||
PTC New LLC | United States | Limited liability company – no shares | 100 | |||||||
R/CLIP Corp. | United States | $100.00 Common shares | 100 | |||||||
Real Estate Collateral Management Company | United States | $10.00 Ordinary shares | 100 | |||||||
Republic Nominees Limited | Guernsey | £1.00 Ordinary shares | 100 | |||||||
Republic Overseas Capital Corporation | United States | $10.00 Common shares | 100 | |||||||
S.A.P.C. – Ufipro Recouvrement | France | €46.00 Parts shares | 100 | |||||||
Saf Baiyun | France | €10.00 Actions shares | 100 | |||||||
Saf Chang Jiang | France | €10.00 Actions shares | 100 | |||||||
Saf Chang Jiang Ba | France | €10.00 Actions shares | 100 | |||||||
Saf Chang Jiang Er | France | €10.00 Actions shares | 100 | |||||||
Saf Chang Jiang Jiu | France | €10.00 Actions shares | 100 | |||||||
Saf Chang Jiang Liu | France | €10.00 Actions shares | 100 | |||||||
Saf Chang Jiang Qi | France | €10.00 Actions shares | 100 | |||||||
Saf Chang Jiang San | France | €10.00 Actions shares | 100 | |||||||
Saf Chang Jiang Shi | France | €10.00 Actions shares | 100 | |||||||
Saf Chang Jiang Shi Liu | France | €1.00 Actions shares | 100 | |||||||
Saf Chang Jiang Shi Wu | France | €1.00 Actions shares | 100 | |||||||
Saf Chang Jiang Shi’Er | France | €10.00 Actions shares | 100 | |||||||
Saf Chang Jiang Shiyi | France | €10.00 Actions shares | 100 | |||||||
Saf Chang Jiang Wu | France | €10.00 Actions shares | 100 | |||||||
Saf Chang Jiang Yi | France | €10.00 Actions shares | 100 | |||||||
Saf Guangzhou | France | €10.00 Actions shares | 100 | |||||||
Saf Palissandre | France | €10.00 Actions shares | 100 | |||||||
Saf Zhu Jiang | France | €10.00 Actions shares | 100 | |||||||
Saf Zhu Jiang Ba | France | €10.00 Actions shares | 100 | |||||||
Saf Zhu Jiang Er | France | €10.00 Actions shares | 100 | |||||||
Saf Zhu Jiang Jiu | France | €10.00 Actions shares | 100 | |||||||
Saf Zhu Jiang Liu | France | €10.00 Actions shares | 100 | |||||||
Saf Zhu Jiang Qi | France | €10.00 Actions shares | 100 | |||||||
Saf Zhu Jiang San | France | €10.00 Actions shares | 100 | |||||||
Saf Zhu Jiang Shi | France | €10.00 Actions shares | 100 | |||||||
Saf Zhu Jiang Shi Ba | France | €1.00 Actions shares | 100 | |||||||
Saf Zhu Jiang Shi Er | France | €1.00 Actions shares | 100 | |||||||
Saf Zhu Jiang Shi Jiu | France | €1.00 Actions shares | 100 | |||||||
Saf Zhu Jiang Shi Liu | France | €1.00 Actions shares | 100 | |||||||
Saf Zhu Jiang Shi Qi | France | €1.00 Actions shares | 100 | |||||||
Saf Zhu Jiang Shi Wu | France | €1.00 Actions shares | 100 | |||||||
Saf Zhu Jiang Shiyi | France | €10.00 Actions shares | 100 | |||||||
Saf Zhu Jiang Wu | France | €10.00 Actions shares | 100 | |||||||
Saf Zhu Jiang Yi | France | €10.00 Actions shares | 100 | |||||||
Samada Limited | Jersey | £1.00 Ordinary shares | 100 | |||||||
Samuel Montagu & Co. Limited | England and Wales | £1.00 Ordinary shares | 100 | |||||||
SCI Hervet Mathurins | France | €15.24 Parts shares | 100 | |||||||
SCI HSBC Assurances Immo | France | €152.44 Parts shares | 100 | |||||||
Second Corporate Director Inc. | Virgin Islands, British | $1.00 Ordinary shares | 100 | |||||||
Secondary Club Deal I GP Limited | Guernsey | £ Ordinary shares | 100 | |||||||
Secondary Club Deal II GP Limited | Guernsey | $ Ordinary shares | 100 | |||||||
SFSS Nominees (Pty) Limited | South Africa | ZAR1.00 Ordinary shares | 100 | |||||||
Shandong Rongcheng HSBC Rural Bank Company Limited | China | CNY1.00 Registered Capital shares | 100 | |||||||
Shenfield Nominees Limited | England and Wales | £1.00 Ordinary shares | 100 | |||||||
Shuttle Developments Limited | England and Wales | £1.00 Ordinary shares | 100 | |||||||
Sico Limited | Virgin Islands, British | $1.00 Ordinary shares | 100 | |||||||
Silliman Associates Limited Partnership | United States | Limited partnership – no shares | 100 | |||||||
Silliman Corporation | United States | $1.00 Common shares | 100 | |||||||
SNC Dorique | Reunion | €1.00 Parts shares | 100 | |||||||
SNC Kerouan | France | €1.00 Parts shares | 100 | |||||||
SNC Les Mercuriales | France | €1.00 Parts shares | 100 | |||||||
SNC Makala | France | €1.00 Parts shares | 100 | |||||||
SNC Nuku-Hiva Bail | France | €0.01 Parts shares | 100 | |||||||
SNCB/M6-2008 A | France | €1.00 Actions shares | 100 | |||||||
SNCB/M6-2007 A | France | €10.00 Actions shares | 100 | |||||||
SNCB/M6-2007 B | France | €10.00 Actions shares | 100 | |||||||
Société Financière et Mobilière | France | €16.00 Actions shares | 100 | |||||||
Société Française et Suisse | France | €1.00 Actions shares | 100 | |||||||
Societe Immobiliere Atlas S.A. | Switzerland | CHF1,000.00 Ordinary shares | 100 | |||||||
Société Immobilière Malesherbes-Anjou | France | €70.00 Actions shares | 100 | |||||||
Solandra 3 | France | €100.00 Actions shares | 100 | |||||||
Somers & Co | United States | Partnership – no shares | 100 | |||||||
Somers (U.K.) Limited | England and Wales | £1.00 Ordinary shares | 100 | |||||||
Somers Dublin Limited | Ireland | €1.25 Ordinary shares | 100 | |||||||
Somers Nominees (Far East) Limited | Bermuda | $1.00 Common shares | 100 | |||||||
Sopingest | France | Ordinary shares no par value | 100 | |||||||
South Yorkshire Light Rail Limited | England and Wales | £0.10 Ordinary shares | 100 | |||||||
SPE 1 2005 Manager Inc. | United States | $1.00 Common shares | 100 | |||||||
HSBC HOLDINGS PLC
466 |
Table of Contents
| Subsidiaries(continued) | Country | Security | Direct (%) | Total (%) | ||||||
St Cross Trustees Limited | England and Wales | £1.00 Ordinary shares | 100 | |||||||
Sterling Credit Limited | England and Wales | £1.00 Ordinary shares | 100 | |||||||
Sun Hung Kai Development (Lujiazui III) Limited | China | $1.00 Registered Capital shares | 100 | |||||||
Swan National Leasing (Commercials) Limited | England and Wales | £1 Ordinary | 100 | |||||||
Swan National Limited | England and Wales | £1 Ordinary | 100 | |||||||
Tayside Holdings Limited | Bahamas | $1.00 Ordinary shares | 100 | |||||||
Tempus Management AG | Switzerland | CHF100.00 Ordinary shares | 100 | |||||||
Thasosfin | France | €15.00 Actions shares | 100 | |||||||
The Hongkong and Shanghai Banking Corporation Limited | Hong Kong | HK$2.50 Ordinary and $1 Cumulative Redeemable Preference shares, | 100 | |||||||
$1 Cumulative and $1 Non-cumulative Irredeemable Preference shares | ||||||||||
The Venture Catalysts Limited | England and Wales | £1.00 Ordinary shares | 100 | |||||||
Third Corporate Director Inc. | Virgin Islands, British | $1.00 Ordinary shares | 100 | |||||||
Timberlink Settlement Services (USA) Inc. | United States | $1.00 Common shares | 100 | |||||||
TKM International Limited | England and Wales | £1.00 Ordinary shares | 100 | |||||||
Tooley Street View Limited | United Kingdom | £1.00 Ordinary shares | 100 | 100 | ||||||
Tower Investment Management | Cayman Islands | $1,000 Ordinary shares | 100 | |||||||
TPBC Acquisition Corp. | United States | $1.00 Common shares | 100 | |||||||
Trinkaus Canada 1 GP LTD | Canada | C$100 Common shares | 100 | |||||||
Tropical Nominees Limited | Cayman Islands | KYD1.00 Ordinary shares | 100 | |||||||
Trumball Management, Inc. | United States | $1.00 Common shares | 100 | |||||||
Turnsonic (Nominees) Limited | England and Wales | £1.00 Ordinary shares | 100 | |||||||
Vadep Holding AG | Switzerland | CHF1,000.00 Ordinary shares | 100 | |||||||
Valeurs Mobilières Elysées | France | €16.00 Actions shares | 100 | |||||||
Vintage I Secondary GP Limited | Guernsey | £ Ordinary shares | 100 | |||||||
Vintage III Special Situations GP Limited | Guernsey | $ Ordinary shares | 100 | |||||||
Wardley Limited | Hong Kong | HK$200.00 Ordinary shares | 100 | |||||||
Wayfoong Credit Limited | Hong Kong | HK$100.00 Ordinary shares | 100 | |||||||
Wayfoong Finance Limited | Hong Kong | HK$1,000.00 Ordinary shares | 100 | |||||||
Wayfoong Nominees Limited | Hong Kong | HK$1.00 Ordinary shares | 100 | |||||||
Westminster House, LLC | United States | Limited liability company – no shares | 100 | |||||||
Woodex Limited | Bermuda | BMD1.00 Common shares | 100 | |||||||
XDP, Inc. | United States | $1.00 Common shares | 100 | |||||||
HSBC Bank Argentina S.A. | Argentina | ARS1.00 Ordinary A and Ordinary B shares | 99.99 | |||||||
HSBC France | France | €5.00 Actions shares | 99.99 | |||||||
HSBC Mexico, S.A., Institucion de Banca Multiple, Grupo Financiero HSBC | Mexico | MXN2.00 Ordinary shares | 99.99 | |||||||
HSBC Empresa de Capitalizacao (Brasil) S.A. | Brazil | BRL Ordinary shares | 99.97 | |||||||
HSBC Corretora de Titulos e Valores Mobiliarios S.A. | Brazil | BRL Ordinary shares | 99.96 | |||||||
HSBC Inmobiliaria (Mexico), S.A. de C.V. | Mexico | MXN1,000.00 Series A and Series B shares | 99.96 | |||||||
HSBC Seguros (Brasil) S.A. | Brazil | BRL Ordinary and BRL Preference shares | 99.77 | |||||||
HSBC Corretora de Seguros (Brasil) S.A. | Brazil | BRL Ordinary shares | 99.75 | |||||||
HSBC Financial Services (Lebanon) s.a.l. | Lebanon | LBP1,000,000.00 Ordinary B shares | 99.65 | |||||||
HSBC InvestDirect (India) Limited | India | INR10.00 Ordinary shares | 99.54 | |||||||
PT Bank Ekonomi Raharja | Indonesia | IRD100.00 and IRD1,000.00 Ordinary shares | 98.81 | |||||||
SAS Orona | New Caledonia | Franc Pacific 10,000 Actions | 94.93 | |||||||
HSBC Bank Egypt S.A.E. | Egypt | EGP84.00 Ordinary shares | 94.53 | |||||||
SAS Bosquet -Audrain | New Caledonia | Franc Pacific 10,000 Actions | 94.90 | |||||||
HSBC Securities (Egypt) S.A.E. | Egypt | EGP100.00 Ordinary shares | 94.64 | |||||||
SAS Cyatheas Pasteur | France | €10.00 Action shares | 94.00 | |||||||
HSBC Fund Services (Korea) Limited | Korea, Republic of | KRW5,000.00 Ordinary shares | 92.96 | |||||||
HSBC Transaction Services GmbH | Germany | €1.00 GmbH Anteil shares | 90.20 | |||||||
HSBC Gestion (Monaco) S.A. | Monaco | Ordinary shares | 86.59 | �� | ||||||
Beau Soleil Limited Partnership | Hong Kong | Limited partnership – no shares | 85.00 | |||||||
PT HSBC Securities Indonesia | Indonesia | IDR1,000,000.00 Common shares | 85.00 | |||||||
HSBC Trinkaus & Burkhardt (International) S.A. | Luxembourg | €1.00 Common shares | 80.65 | |||||||
HSBC Trinkaus & Burkhardt AG | Germany | Stückaktien shares no par value | 80.65 | |||||||
HSBC Trinkaus & Burkhardt Gesellschaft fur Bankbeteiligungen mbH | Germany | DEM1.00 Common shares | 80.65 | |||||||
HSBC Trinkaus Consult GmbH | Germany | DEM1.00 Common shares | 80.65 | |||||||
HSBC Trinkaus Europa Immobilien-Fonds Nr. 5 GmbH | Germany | Ordinary shares no par value | 80.65 | |||||||
HSBC Trinkaus Family Office GmbH | Germany | €1.00 GmbH Anteil shares | 80.65 | |||||||
HSBC Trinkaus Immobilien Beteiligungs KG | Germany | €1.00 Ordinary shares | 80.65 | |||||||
HSBC Trinkaus Real Estate GmbH | Germany | DEM1.00 Common shares | 80.65 | |||||||
Trinkaus Australien Immobilien Fonds Nr. 1 Brisbane GmbH & Co. KG | Germany | €1.00 Ordinary shares | 80.65 | |||||||
Trinkaus Australien Immobilien Fonds Nr. 1 Treuhand-GmbH | Germany | €1.00 GmbH Anteil shares | 80.65 | |||||||
Trinkaus Canada Immobilien-Fonds Nr. 1 Verwaltungs-GmbH | Germany | €1.00 Ordinary shares | 80.65 | |||||||
Trinkaus Europa Immobilien-Fonds Nr.3 Objekt Utrecht Verwaltungs-GmbH | Germany | DEM1.00 Ordinary shares | 80.65 | |||||||
Trinkaus Immobilien-Fonds Geschaeftsfuehrungs-GmbH | Germany | €1.00 GmbH Anteil shares | 80.65 | |||||||
Trinkaus Immobilien-Fonds Verwaltungs-GmbH | Germany | €1.00 GmbH-Anteil shares | 80.65 | |||||||
Trinkaus Private Equity Management GmbH | Germany | €1.00 Ordinary shares | 80.65 | |||||||
Trinkaus Private Equity Verwaltungs GmbH | Germany | €1.00 GmbH Anteil shares | 80.65 | |||||||
HSBC HOLDINGS PLC
467 |
Table of Contents
Notes on the Financial Statements(continued)
43 – HSBC Holdings’ subsidiaries, joint ventures and associates
| Subsidiaries(continued) | Country | Security | Direct (%) | Total (%) | ||||||
INKA Internationale Kapitalanlagegesellschaft mbH | Germany | €1.00 Common shares | 80.65 | |||||||
GPIF Co-Investment, LLC | United States | Limited liability company – no shares | 80.00 | |||||||
HSBC Middle East Finance Company Limited | United Arab Emirates | AED1.00 Ordinary shares | 80.00 | |||||||
HSBC Bank (Mauritius) Limited | Mauritius | $ Ordinary No Par Value shares | 72.96 | |||||||
HSBC Bank Malta p.l.c. | Malta | €0.30 Ordinary shares | 70.03 | |||||||
HSBC Global Asset Management (Malta) Limited | Malta | €2.32937 Ordinary shares | 70.03 | |||||||
HSBC Insurance Management Services (Europe) Limited | Malta | €1.00 Ordinary A and Ordinary B shares | 70.03 | |||||||
HSBC Life Assurance (Malta) Limited | Malta | €1.16469 Ordinary shares | 70.03 | |||||||
HSBC Bank Armenia cjsc | Armenia | AMD30,250.00 Ordinary shares | 70.00 | |||||||
Mexanicana de Fomento S.A. de C.V. | Mexico | MXN1.00 Series A and B shares | 69.80 | |||||||
HSBC Saudi Arabia Limited | Saudi Arabia | SAR50,000.00 Ordinary shares | 69.40 | |||||||
Fulcher Enterprises Company Limited | Hong Kong | HK$10.00 Ordinary shares | 62.14 | |||||||
Hang Seng (Nominee) Limited | Hong Kong | HK$100.00 Ordinary shares | 62.14 | |||||||
Hang Seng Bank (China) Limited | China | CNY1.00 Registered Capital shares | 62.14 | |||||||
Hang Seng Bank (Trustee) Limited | Hong Kong | HK$10.00 Ordinary shares | 62.14 | |||||||
Hang Seng Bank Limited | Hong Kong | HK$5.00 Ordinary shares | 62.14 | |||||||
Hang Seng Bullion Company Limited | Hong Kong | HK$100.00 Ordinary shares | 62.14 | |||||||
Hang Seng Credit Limited | Hong Kong | HK$100.00 Ordinary shares | 62.14 | |||||||
Hang Seng Data Services Limited | Hong Kong | HK$10.00 Ordinary shares | 62.14 | |||||||
Hang Seng Finance Limited | Hong Kong | HK$100.00 Ordinary shares | 62.14 | |||||||
Hang Seng Financial Information Limited | Hong Kong | HK$10.00 Ordinary shares | 62.14 | |||||||
Hang Seng Futures Limited | Hong Kong | HK$100.00 Ordinary shares | 62.14 | |||||||
Hang Seng Indexes Company Limited | Hong Kong | HK$10.00 Ordinary shares | 62.14 | |||||||
Hang Seng Insurance Company Limited | Hong Kong | HK$10.00 Ordinary shares | 62.14 | |||||||
Hang Seng Investment Management Limited | Hong Kong | HK$100.00 Ordinary shares | 62.14 | |||||||
Hang Seng Investment Services Limited | Hong Kong | HK$100.00 Ordinary shares | 62.14 | |||||||
Hang Seng Life Limited | Hong Kong | HK$1,000.00 Ordinary shares | 62.14 | |||||||
Hang Seng Real Estate Management Limited | Hong Kong | HK$100.00 Ordinary shares | 62.14 | |||||||
Hang Seng Securities Limited | Hong Kong | HK$100.00 Ordinary shares | 62.14 | |||||||
Hang Seng Security Management Limited | Hong Kong | HK$1.00 Ordinary shares | 62.14 | |||||||
Haseba Investment Company Limited | Hong Kong | HK$100.00 Ordinary shares | 62.14 | |||||||
High Time Investments Limited | Hong Kong | HK$1.00 Ordinary shares | 62.14 | |||||||
HSI International Limited | Hong Kong | HK$1.00 Ordinary shares | 62.14 | |||||||
Imenson Limited | Hong Kong | HK$10.00 Ordinary shares | 62.14 | |||||||
Yan Nin Development Company Limited | Hong Kong | HK$100.00 Ordinary shares | 62.14 | |||||||
Fundacion HSBC, A.C.1 | Mexico | Parts shares | 60.00 | |||||||
SNC Les Oliviers D’Antibes | France | €15.00 Parts shares | 60.00 | |||||||
HSBC Land Title Agency (USA) LLC | United States | Limited liability company – no shares | 55.00 | |||||||
The Malta Development Fund Limited | Malta | €2.32937 Ordinary shares | 53.07 | |||||||
HSBC Bank Oman S.A.O.G. | Oman | OMR0.10 Ordinary shares | 51.00 | |||||||
Beneficial Homeowner Service Corporation | United States | $100.00 Common shares | 50.00 | |||||||
Electronic Payment Services Company (Hong Kong) Limited | Hong Kong | HK$1.00 Ordinary shares | 50.00 | |||||||
ProServe Bermuda Limited | Bermuda | BMD1.00 Common shares | 50.00 | |||||||
REDUS Halifax Landing, LLC | United States | Limited liability company – no shares | 50.00 | |||||||
Urban Solutions (Cardiff) Limited | England and Wales | £1 Ordinary shares | 50.00 | |||||||
Vaultex Isle of Man Insurance Limited | Isle of Man | £1 Ordinary shares | 50.00 | |||||||
| Joint ventures | ||||||||||
HCM Holdings Limited | England and Wales | £0.01 Ordinary shares | 51.00 | |||||||
GSI Retail Property Holdings Limited | Guernsey | €1.00 Ordinary shares | 50.00 | |||||||
HSBC Life Insurance Company Limited | China | CNY1.00 Ordinary shares | 50.00 | |||||||
HSBC Kingdom Africa Investments (Cayman) Limited | Cayman Islands | $1.00 Ordinary shares | 50.00 | |||||||
Urban Solutions Cardiff Holdings Limited | England and Wales | £1.00 Ordinary B shares | 50.00 | |||||||
Urban Solutions Greenwich Holdings Limited | England and Wales | £1.00 Ordinary B shares | 50.00 | |||||||
Urban Solutions (Greenwich) Limited | England and Wales | £1.00 Ordinary shares | 50.00 | |||||||
Vaultex UK Limited | England and Wales | £1.00 Ordinary shares | 50.00 | |||||||
HSBC Jintrust Fund Management Company Limited | China | CNY1.00 Registered Capital shares | 49.00 | |||||||
Canara HSBC Oriental Bank of Commerce Life Insurance Company Limited | India | INR10.00 Ordinary shares | 26.00 | |||||||
| Associates | ||||||||||
HSBC Amanah Takaful (Malaysia) Berhad | Malaysia | RM50.00 Ordinary shares | 49.00 | |||||||
HSBC Middle East Securities L.L.C | United Arab Emirates | AED1,000.00 Ordinary shares | 49.00 | |||||||
Spire Topco Hotels Limited | England and Wales | £0.01 A and £0.01 B shares | 46.79 | |||||||
SABB Takaful | Saudi Arabia | SAR10.00 Ordinary shares | 45.50 | |||||||
AREIT Management Ltd | Cayman Islands | $1.00 Ordinary A shares | 41.90 | |||||||
Rewards Management Middle East FZ LLC | United Arab Emirates | AED1,000.00 Ordinary shares | 40.00 | |||||||
The Saudi British Bank | Saudi Arabia | SAR10.00 Ordinary shares | 40.00 | |||||||
EPS Company (Hong Kong) Limited | Hong Kong | HK$250,000 Ordinary shares | 38.66 | |||||||
Jeppe Star Limited | Virgin Islands, British | £1.00 Ordinary shares | 34.00 | |||||||
Novo Star Limited | Virgin Islands, British | $100.00 Ordinary shares | 34.00 | |||||||
Chemi & Cotex (Rwanda) Limited | Rwanda | RWF1,000 Ordinary shares | 34.00 | |||||||
Chemi & Cotex Kenya Limited | Kenya | KES100 Ordinary shares | 33.33 | |||||||
MENA Infrastructure Fund (GP) Ltd | United Arab Emirates | $1.00 Ordinary shares | 33.33 | |||||||
SCI Karuvefa | Guadeloupe | €1.00 Parts shares | 33.33 | |||||||
HSBC HOLDINGS PLC
468 |
Table of Contents
| Associates(continued) | Country | Security | Direct (%) | Total (%) | ||||||
CFAC Payment Scheme Limited | England and Wales | £1.00 Preference shares | 33.33 | |||||||
Trinkaus Europa Immobilien-Fonds Nr. 7 Frankfurt Mertonviertel KG | Germany | Limited partnership with no shares | 33.10 | |||||||
GZHS Research Co Ltd | China | RMB Common stock | 33.00 | |||||||
Hampton Owners LLC | United States | Limited liability company – no shares | 25.82 | |||||||
Trinkaus Europa Immobilien-Fonds Nr. 4 Objekte Basel Nauenstrasse KG | Germany | Limited partnership with no shares | 25.11 | |||||||
Ashwood Energy Limited | Virgin Islands, British | US$1.00 Ordinary shares | 25.00 | |||||||
House Network Sdn Bhd | Malaysia | RM1.00 Ordinary shares | 25.00 | |||||||
Rosimian Limited | England and Wales | £0.01 B shares | 25.00 | |||||||
The London Gold Market Fixing Limited | England and Wales | Limited by guarantee – no share capital | 25.00 | |||||||
GIE GNIFI | New Caledonia | No shares | 25.00 | |||||||
sino AG | Germany | €1.00 Common stock | 25.00 | |||||||
Icon Brickell LLC | United States | Limited liability company – no shares | 24.90 | |||||||
Business Growth Fund plc | England and Wales | £1.00 Ordinary shares | 23.98 | |||||||
NAS Holding Limited | Virgin Islands, British | Ordinary share of no par value | 22.13 | |||||||
NAS United Healthcare Services LLC | Virgin Islands, British | Ordinary share of no par value | 22.13 | |||||||
Bank of Communications Co., Ltd | China | CNY1.00 H shares | 19.03 | |||||||
| 1 | Management has determined that these subsidiaries are excluded from consolidation in the Group accounts as these entities do not meet the definition of subsidiaries in accordance with IFRSs. HSBC’s consolidation policy is described in Note 1(g). |
The information set out in these accounts does not constitute the Company’s statutory accounts for the years ended 31 December 2015 or 2014. Those accounts have been reported on by the Company’s auditors: their reports were unqualified and did not contain a statement under Section 498(2) or (3) of the Companies Act 2006. The accounts for 2014 have been delivered to the Registrar of Companies and those for 2015 will be delivered in due course.
HSBC HOLDINGS PLC
469 |
Table of Contents
Shareholder information
Interim dividends / Shareholder profile / 2015 AGM
Fourth interim dividend for 2015
The Directors have declared a fourth interim dividend for 2015 of $0.21 per ordinary share. Information on the scrip dividend scheme and currencies in which shareholders may elect to have the cash dividend paid will be sent to shareholders on or about 18 March 2016. The timetable for the dividend is:
Announcement | 22 February 2016 | |||||
ADSs quoted ex-dividend in New York | 2 March 2016 | |||||
Shares quoted ex-dividend in London, Hong Kong, Paris and Bermuda | 3 March 2016 | |||||
Record date – London, Hong Kong, New York, Paris, Bermuda1 | 4 March 2016 | |||||
Mailing ofAnnual Report and Accounts 2015and/orStrategic Report 2015, Notice of Annual General Meeting and dividend documentation | 18 March 2016 | |||||
Final date for receipt by registrars of forms of election, Investor Centre electronic instructions and revocations of standing instructions for scrip dividends | 7 April 2016 | |||||
Exchange rate determined for payment of dividends in sterling and Hong Kong dollars | 11 April 2016 | |||||
Payment date: dividend warrants, new share certificates or transaction advices and notional tax vouchers mailed and shares credited to stock accounts in CREST | 20 April 2016 |
| 1 | Removals to and from the Overseas Branch register of shareholders in Hong Kong will not be permitted on this date. |
The Board has adopted a policy of paying quarterly interim dividends on the ordinary shares. Under this policy it is intended to have a pattern of three equal interim dividends with a variable fourth interim dividend. It is envisaged that the first interim dividend in respect of 2016 will be $0.10 per ordinary share.
Dividends are declared in US dollars and, at the election of the shareholder, paid in cash in one of, or in a combination of, US dollars, sterling and Hong Kong dollars, or, subject to the Board’s determination that a scrip dividend is to be offered in respect of that dividend, may be satisfied in whole or in part by the issue of new shares in lieu of a cash dividend.
At 31 December 2015 the share register recorded the following details:
Number of shareholders | Total ordinary shares held | |||||||||||
1- 100 | 37,523 | 1,085,635 | ||||||||||
101- 400 | 28,065 | 6,881,465 | ||||||||||
401- 500 | 6,920 | 3,123,382 | ||||||||||
501- 1,000 | 29,735 | 21,946,539 | ||||||||||
1,001- 5,000 | 69,484 | 165,002,520 | ||||||||||
5,001- 10,000 | 18,535 | 131,138,146 | ||||||||||
10,001- 20,000 | 11,071 | 154,448,067 | ||||||||||
20,001- 50,000 | 6,682 | 205,478,608 | ||||||||||
50,001- 200,000 | 3,298 | 302,670,569 | ||||||||||
200,001- 500,000 | 704 | 222,265,765 | ||||||||||
500,001 and above | 1,037 | 18,471,056,238 | ||||||||||
Total | 213,054 | 19,685,096,934 | ||||||||||
HSBC HOLDINGS PLC
470 |
Table of Contents
All resolutions considered at the 2015 Annual General Meeting held at 11.00am on 24 April 2015 at the Queen Elizabeth II Conference Centre, London SW1P 3EE were passed on a poll as follows:
| Votes | ||||||||||||||||||||||||||||||||||||||||||||||
| Resolution | For | 1 | % | Against | % | Total | %2 | Withheld3 | ||||||||||||||||||||||||||||||||||||||
| 1 | To receive theAnnual Report and Accounts 2014 | 9,340,160,307 | 98.80 | 113,682,546 | 1.20 | 9,453,842,853 | 49.04 | 41,294,402 | ||||||||||||||||||||||||||||||||||||||
| 2 | To approve the Directors’ Remuneration Report | 6,720,428,674 | 76.29 | 2,088,530,798 | 23.71 | 8,808,959,472 | 45.70 | 677,821,869 | ||||||||||||||||||||||||||||||||||||||
| 3 | To elect or re-elect the following as Directors: | |||||||||||||||||||||||||||||||||||||||||||||
(a) Phillip Ameen | 9,459,023,817 | 99.90 | 9,012,480 | 0.10 | 9,468,036,297 | 49.12 | 32,680,294 | |||||||||||||||||||||||||||||||||||||||
(b) Heidi Miller | 9,443,905,977 | 99.75 | 23,496,531 | 0.25 | 9,467,402,508 | 49.11 | 32,543,484 | |||||||||||||||||||||||||||||||||||||||
(c) Kathleen Casey | 9,458,891,803 | 99.91 | 8,547,866 | 0.09 | 9,467,439,669 | 49.11 | 32,438,260 | |||||||||||||||||||||||||||||||||||||||
(d) Safra Catz | 9,455,583,709 | 99.88 | 11,671,079 | 0.12 | 9,467,254,788 | 49.11 | 32,567,538 | |||||||||||||||||||||||||||||||||||||||
(e) Laura Cha | 9,303,056,308 | 99.10 | 84,065,631 | 0.90 | 9,387,121,939 | 48.70 | 111,291,419 | |||||||||||||||||||||||||||||||||||||||
(f) Lord Evans of Weardale | 9,455,524,737 | 99.87 | 11,874,993 | 0.13 | 9,467,399,730 | 49.11 | 32,622,299 | |||||||||||||||||||||||||||||||||||||||
(g) Joachim Faber | 9,452,953,492 | 99.85 | 14,364,873 | 0.15 | 9,467,318,365 | 49.11 | 32,561,965 | |||||||||||||||||||||||||||||||||||||||
(h) Rona Fairhead | 9,144,120,186 | 96.59 | 322,607,648 | 3.41 | 9,466,727,834 | 49.11 | 33,199,339 | |||||||||||||||||||||||||||||||||||||||
(i) Douglas Flint | 9,067,875,368 | 95.90 | 387,864,445 | 4.10 | 9,455,739,813 | 49.05 | 36,832,078 | |||||||||||||||||||||||||||||||||||||||
(j) Stuart Gulliver | 9,438,909,453 | 99.69 | 29,360,384 | 0.31 | 9,468,269,837 | 49.12 | 31,483,615 | |||||||||||||||||||||||||||||||||||||||
(k) Sam Laidlaw | 8,317,803,050 | 87.86 | 1,149,583,204 | 12.14 | 9,467,386,254 | 49.11 | 32,573,081 | |||||||||||||||||||||||||||||||||||||||
(l) John Lipsky | 8,335,050,210 | 88.04 | 1,132,173,688 | 11.96 | 9,467,223,898 | 49.11 | 32,614,861 | |||||||||||||||||||||||||||||||||||||||
(m) Rachel Lomax | 9,458,328,102 | 99.90 | 9,132,745 | 0.10 | 9,467,460,847 | 49.11 | 32,443,782 | |||||||||||||||||||||||||||||||||||||||
(n) Iain Mackay | 9,436,045,734 | 99.67 | 31,438,641 | 0.33 | 9,467,484,375 | 49.11 | 32,469,588 | |||||||||||||||||||||||||||||||||||||||
(o) Marc Moses | 9,442,355,344 | 99.73 | 25,127,084 | 0.27 | 9,467,482,428 | 49.11 | 32,464,337 | |||||||||||||||||||||||||||||||||||||||
(p) Sir Simon Robertson | 8,191,676,916 | 87.13 | 1,209,918,157 | 12.87 | 9,401,595,073 | 48.77 | 97,700,820 | |||||||||||||||||||||||||||||||||||||||
(q) Jonathan Symonds | 9,451,337,959 | 99.83 | 16,111,584 | 0.17 | 9,467,449,543 | 49.11 | 32,484,172 | |||||||||||||||||||||||||||||||||||||||
| 4 | To appoint PricewaterhouseCoopers LLP as auditor to the Company | 9,443,723,129 | 99.73 | 25,734,330 | 0.27 | 9,469,457,459 | 49.12 | 30,213,375 | ||||||||||||||||||||||||||||||||||||||
| 5 | To authorise the Group Audit Committee to determine the auditor’s remuneration | 9,454,699,721 | 99.85 | 14,212,868 | 0.15 | 9,468,912,589 | 49.12 | 30,815,356 | ||||||||||||||||||||||||||||||||||||||
| 6 | To authorise the Directors to allot shares | 8,747,667,960 | 92.46 | 713,487,303 | 7.54 | 9,461,155,263 | 49.08 | 38,420,820 | ||||||||||||||||||||||||||||||||||||||
| 7 | To disapply pre-emption rights | 8,729,514,669 | 92.32 | 726,423,494 | 7.68 | 9,455,938,163 | 49.05 | 43,771,078 | ||||||||||||||||||||||||||||||||||||||
| 8 | To authorise the Directors to allot repurchased shares | 9,154,217,028 | 96.74 | 308,482,870 | 3.26 | 9,462,699,898 | 49.09 | 34,698,581 | ||||||||||||||||||||||||||||||||||||||
| 9 | To authorise the Company to purchase its own ordinary shares | 9,348,078,869 | 99.49 | 47,795,315 | 0.51 | 9,395,874,184 | 48.74 | 102,258,468 | ||||||||||||||||||||||||||||||||||||||
| 10 | To authorise the Directors to allot equity securities in relation to Contingent Convertible Securities | 9,149,392,011 | 96.80 | 302,391,205 | 3.20 | 9,451,783,216 | 49.03 | 45,584,992 | ||||||||||||||||||||||||||||||||||||||
| 11 | To disapply pre-emption rights in relation to the issue of Contingent Convertible Securities | 8,570,088,097 | 90.69 | 879,490,094 | 9.31 | 9,449,578,191 | 49.02 | 45,737,225 | ||||||||||||||||||||||||||||||||||||||
| 12 | To extend the final date on which options may be granted under UK Sharesave | 9,373,459,127 | 99.02 | 92,544,476 | 0.98 | 9,466,003,603 | 49.11 | 33,019,920 | ||||||||||||||||||||||||||||||||||||||
| 13 | To approve general meetings other than annual general meetings being called on a minimum of 14 clear days’ notice | 8,386,696,695 | 88.59 | 1,080,639,157 | 11.41 | 9,467,335,852 | 49.11 | 31,742,417 | ||||||||||||||||||||||||||||||||||||||
| 1 | Includes discretionary votes. |
| 2 | Percentage of Issued Share Capital voted. |
| 3 | A ‘vote withheld’ is not a vote in law and is not counted in the calculation of the votes ‘For’ and ‘Against’ the resolution. |
HSBC HOLDINGS PLC
471 |
Table of Contents
Shareholder information(continued)
Earnings Releases and Interim Results / Shareholder enquiries and communications / Stock symbols / Investor relations / Information
Earnings Releases and Interim Results
Earnings Releases are expected to be issued on or around 3 May 2016 and 7 November 2016. The Interim Results for the six months to 30 June 2016 are expected to be issued on 5 August 2016.
Shareholder enquiries and communications
Enquiries
Any enquiries relating to shareholdings on the share register (for example transfers of shares, change of name or address, lost share certificates or dividend cheques) should be sent to the Registrars at the address given below. The Registrars offer an online facility, Investor Centre, which enables shareholders to manage their shareholding electronically.
| Principal Register: | Hong Kong Overseas Branch Register: | Bermuda Overseas Branch Register: | ||
| Computershare Investor Services PLC | Computershare Hong Kong Investor | Investors Relations Team | ||
| The Pavilions | Services Limited | HSBC Bank Bermuda Limited | ||
| Bridgwater Road | Rooms 1712-1716, 17thFloor | 6 Front Street | ||
| Bristol BS99 6ZZ | Hopewell Centre | Hamilton HM 11 | ||
| United Kingdom | 183 Queen’s Road East | Bermuda | ||
| Telephone: 44 (0) 370 702 0137 | Hong Kong | Telephone: 1 441 299 6737 | ||
| Email via website: | Telephone: 852 2862 8555 | Email: hbbm.shareholder.services@hsbc.bm | ||
| www.investorcentre.co.uk/contactus | Email: hsbc.ecom@computershare.com.hk | |||
Investor Centre: |
Investor Centre: |
Investor Centre: | ||
| www.investorcentre.co.uk | www.investorcentre.com/hk | www.investorcentre.com/bm | ||
Any enquiries relating to ADSs should be sent to the depositary:
The Bank of New York Mellon
Depositary Receipts
PO Box 30170
College Station, TX 77842-3170
USA
Telephone (US): 1 877 283 5786
Telephone (International): 1 201 680 6825
Email: shrrelations@bnymellon.com
Website: www.computershare.com/us/contact/Pages/default.aspx
Any enquiries relating to shares held through Euroclear France, the settlement and central depositary system for NYSE Euronext Paris, should be sent to the paying agent:
HSBC France
103, avenue des Champs Elysées
75419 Paris Cedex 08
France
Telephone: 33 1 40 70 22 56
Email: ost-agence-des-titres-hsbc-reims.hbfr-do@hsbc.fr
Website: www.hsbc.fr
If you have elected to receive general shareholder communications directly from HSBC Holdings, it is important to remember that your main contact for all matters relating to your investment remains the registered shareholder, or perhaps custodian or broker, who administers the investment on your behalf. Therefore any changes or queries relating to your personal details and holding (including any administration thereof) must continue to be directed to your existing contact at your investment manager or custodian. HSBC Holdings cannot guarantee dealing with matters directed to it in error.
Further copies of thisAnnual Report and Accounts 2015 may be obtained by writing to the following departments:
| For those in Europe, the Middle East and Africa: | For those in Asia-Pacific: | For those in the Americas: | ||
| Public Affairs | Communications (Asia) | Global Publishing Services | ||
| HSBC Holdings plc | The Hongkong and Shanghai Banking | HSBC – North America | ||
| 8 Canada Square | Corporation Limited | SC1 Level, 452 Fifth Avenue | ||
| London E14 5HQ | 1 Queen’s Road Central | New York, NY 10018 | ||
| United Kingdom | Hong Kong | USA | ||
HSBC HOLDINGS PLC
472 |
Table of Contents
Electronic communications
Shareholders may at any time choose to receive corporate communications in printed form or to receive notifications of their availability on HSBC’s website. To receive future notifications of the availability of a corporate communication on HSBC’s website by email, or revoke or amend an instruction to receive such notifications by email, go to www.hsbc.com/ecomms. If you provide an email address to receive electronic communications from HSBC, we will also send notifications of your dividend entitlements by email. If you received a notification of the availability of this document on HSBC’s website and would like to receive a printed copy or, if you would like to receive future corporate communications in printed form, please write or send an email (quoting your shareholder reference number) to the appropriate Registrars at the address given above. Printed copies will be provided without charge.
Chinese translation
A Chinese translation of thisAnnual Report and Accounts 2015is available upon request after 18 March 2016 from the Registrars:
Computershare Hong Kong Investor Services Limited Rooms 1712-1716, 17th Floor Hopewell Centre 183 Queen’s Road East Hong Kong | Computershare Investor Services PLC The Pavilions Bridgwater Road Bristol BS99 6ZZ United Kingdom |
Please also contact the Registrars if you wish to receive Chinese translations of future documents or if you have received a Chinese translation of this document and do not wish to receive such translations in future.

HSBC Holdings ordinary shares trade under the following stock symbols:
| London Stock Exchange | HSBA | Euronext Paris | HSB | |||
| Hong Kong Stock Exchange | 5 | Bermuda Stock Exchange | HSBC.BH | |||
| New York Stock Exchange (ADS) | HSBC |
Enquiries relating to HSBC’s strategy or operations may be directed to:
Senior Manager Investor Relations HSBC Holdings plc 8 Canada Square London E14 5HQ United Kingdom | Head of Investor Relations Asia-Pacific The Hongkong and Shanghai Banking Corporation Limited 1 Queen’s Road Central Hong Kong | |
| Telephone: 44 (0) 20 7991 3643 | 852 2822 4908 | |
| Email: investorrelations@hsbc.com | investorrelations@hsbc.com.hk |
Where more information about HSBC is available
ThisAnnual Report and Accounts 2015, and other information on HSBC, may be viewed on HSBC’s website: www.hsbc.com.
Reports, statements and information that HSBC Holdings files with the Securities and Exchange Commission are available at www.sec.gov. Investors can also request hard copies of these documents upon payment of a duplicating fee by writing to the SEC at the Office of Investor Education and Advocacy, 100 F Street N.E., Washington, DC 20549-0213 or by emailing PublicInfo@sec.gov. Investors should call the Commission at (202) 551 8090 if they require further assistance. Investors may also obtain the reports and other information that HSBC Holdings files at www.nyse.com (telephone number (1) 212 656 3000).
HM Treasury has transposed the requirements set out under CRD IV and issued the Capital Requirements Country-by-Country Reporting Regulations 2013. The legislation requires HSBC Holdings to publish additional information in respect of the year ended 31 December 2015 by 31 December 2016. This information will be available at the time on HSBC’s website: www.hsbc.com.
HSBC HOLDINGS PLC
473 |
Table of Contents
Shareholder information(continued)
Organisation chart / Taxation of shares and dividends
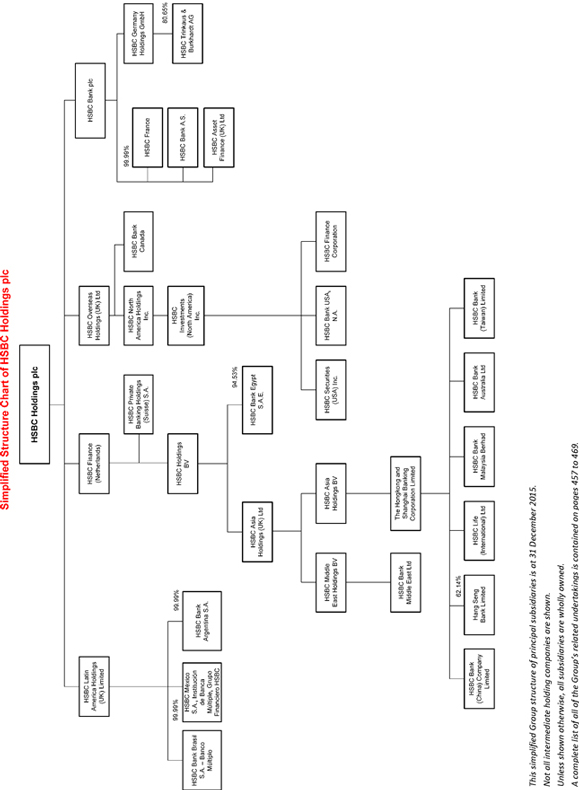
HSBC HOLDINGS PLC
474
Table of Contents
Taxation of shares and dividends
Taxation – UK residents
The following is a summary, under current law, of certain UK tax considerations that are likely to be material to the ownership and disposition of HSBC Holdings ordinary shares. The summary does not purport to be a comprehensive description of all the tax considerations that may be relevant to a holder of shares. In particular, the summary deals with shareholders who are resident solely in the UK for UK tax purposes and only with holders who hold the shares as investments and who are the beneficial owners of the shares, and does not address the tax treatment of certain classes of holders such as dealers in securities. Holders and prospective purchasers should consult their own advisers regarding the tax consequences of an investment in shares in light of their particular circumstances, including the effect of any national, state or local laws.
Taxation of dividends
Currently no tax is withheld from dividends paid by HSBC Holdings.
UK resident individuals: periods to 5 April 2016
For periods up to 5 April 2016 dividends are paid with an associated tax credit which is available for set-off by certain individual shareholders against any liability they may have to UK income tax. Currently, the associated tax credit is equivalent to 10% of the combined cash dividend and tax credit, i.e. one-ninth of the cash dividend.
For individual shareholders who are resident in the UK for taxation purposes and liable to UK income tax at the basic rate, no further UK income tax liability arises on the receipt of a dividend from HSBC Holdings. Individual shareholders who are liable to UK income tax at the higher rate or additional rate are taxed on the combined amount of the dividend and the tax credit at the dividend upper rate (currently 32.5%) and the dividend additional rate (currently 37.5%), respectively. The tax credit is available for set-off against the dividend upper rate and the dividend additional rate liability. Individual UK resident shareholders are not entitled to any tax credit repayment.
UK resident individuals: periods from 6 April 2016
If draft legislation for the Finance Bill 2016 is enacted in its current form, the dividend tax credit will be abolished from 6 April 2016, to be replaced by a £5,000 annual exemption for dividend income received by individual shareholders. In addition, the income tax rates on dividend income outside the £5,000 annual allowance would change to 7.5% for basic rate taxpayers, 32.5% for higher rate taxpayers and 38.1% for additional rate taxpayers.
UK resident companies
Shareholders that are within the charge to UK corporation tax should generally be entitled to an exemption from UK corporation tax on any dividends received from HSBC Holdings. However, the exemptions are not comprehensive and are subject to anti-avoidance rules. Shareholders
within the charge to UK corporation tax are also not entitled to tax credits on any dividends received (even if received before 6 April 2016).
If the conditions for exemption are not met or cease to be satisfied, or a shareholder within the charge to UK corporation tax elects for an otherwise exempt dividend to be taxable, the shareholder will be subject to UK corporation tax on dividends received from HSBC Holdings at the rate of corporation tax applicable to that shareholder.
Scrip dividends
Information on the taxation consequences of the HSBC Holdings scrip dividends offered in lieu of the 2014 fourth interim dividend and the first, second and third interim dividends for 2015 was set out in the Secretary’s letters to shareholders of 20 March, 5 June, 26 August and 4 November 2015. In no case was the difference between the cash dividend foregone and the market value of the scrip dividend in excess of 15% of the market value. Accordingly, for individual shareholders, the amount of the dividend income chargeable to tax, and, the acquisition price of the HSBC Holdings ordinary shares for UK capital gains tax purposes, was the cash dividend foregone.
Taxation of capital gains
The computation of the capital gains tax liability arising on disposals of shares in HSBC Holdings by shareholders subject to UK tax on capital gains can be complex, partly depending on whether, for example, the shares were purchased since April 1991, acquired in 1991 in exchange for shares in The Hongkong and Shanghai Banking Corporation Limited, or acquired subsequent to 1991 in exchange for shares in other companies.
For capital gains tax purposes, the acquisition cost for ordinary shares is adjusted to take account of subsequent rights and capitalisation issues. Any capital gain arising on a disposal by a UK company may also be adjusted to take account of indexation allowance. If in doubt, shareholders are recommended to consult their professional advisers.
Stamp duty and stamp duty reserve tax
Transfers of shares by a written instrument of transfer generally will be subject to UK stamp duty at the rate of 0.5% of the consideration paid for the transfer, and such stamp duty is generally payable by the transferee.
An agreement to transfer shares, or any interest therein, normally will give rise to a charge to stamp duty reserve tax at the rate of 0.5% of the consideration. However, provided an instrument of transfer of the shares is executed pursuant to the agreement and duly stamped before the date on which the stamp duty reserve tax becomes payable, under the current practice of UK HM Revenue and Customs (‘HMRC’) it will not be necessary to pay the stamp duty reserve tax, nor to apply for such tax to be cancelled. Stamp duty reserve tax is generally payable by the transferee.
Paperless transfers of shares within CREST, the UK’s paperless share transfer system, are liable to stamp duty reserve tax at the rate of 0.5% of the consideration. In CREST transactions, the tax is calculated and payment made automatically.
HSBC HOLDINGS PLC
475 |
Table of Contents
Shareholder information(continued)
Taxation of shares and dividends
Deposits of shares into CREST generally will not be subject to stamp duty reserve tax, unless the transfer into CREST is itself for consideration. Following the case HSBC pursued before the European Court of Justice (Case C-569/07 HSBC Holdings plc and Vidacos Nominees Ltd v The Commissioners for HM Revenue & Customs) and a subsequent case in relation to depositary receipts, HMRC now accepts that the charge to stamp duty reserve tax at 1.5% on the issue of shares to a depositary receipt issuer or a clearance service is prohibited.
Taxation – US residents
The following is a summary, under current law, of the principal UK tax and US federal income tax considerations that are likely to be material to the ownership and disposition of shares or American Depositary Shares (‘ADS’s) by a holder that is a resident of the US for US federal income tax purposes (a ‘US holder’) and who is not resident in the UK for UK tax purposes.
The summary does not purport to be a comprehensive description of all of the tax considerations that may be relevant to a holder of shares or ADSs. In particular, the summary deals only with US holders that hold shares or ADSs as capital assets, and does not address the tax treatment of holders that are subject to special tax rules, such as banks, tax-exempt entities, insurance companies, dealers in securities or currencies, persons that hold shares or ADSs as part of an integrated investment (including a ‘straddle’) comprised of a share or ADS and one or more other positions, and persons that own, directly or indirectly, 10% or more of the voting stock of HSBC Holdings. This discussion is based on laws, treaties, judicial decisions and regulatory interpretations in effect on the date hereof, all of which are subject to change.
Holders and prospective purchasers should consult their own advisers regarding the tax consequences of an investment in shares or ADSs in light of their particular circumstances, including the effect of any national, state or local laws.
Any US federal tax advice included in thisAnnual Report and Accounts 2015is for informational purposes only; it was not intended or written to be used, and cannot be used, for the purpose of avoiding US federal tax penalties.
Taxation of dividends
Currently no tax is withheld from dividends paid by HSBC Holdings. For US tax purposes, a US holder must include cash dividends paid on the shares or ADSs in ordinary income on the date that such holder or the ADS depositary receives them, translating dividends paid in UK pounds sterling into US dollars using the exchange rate in effect on the date of receipt. A US holder that elects to receive shares in lieu of a cash dividend must include in ordinary income the fair market value of such shares on the dividend payment date, and the tax basis of those shares will equal such fair market value.
Subject to certain exceptions for positions that are held for less than 61 days or are hedged, and subject to a foreign corporation being considered a ‘qualified foreign corporation’ (which includes not being classified for US federal income tax purposes as a passive foreign investment company), certain dividends (‘qualified dividends’) received by an individual US
holder generally will be subject to US taxation at preferential rates. Based on the company’s audited financial statements and relevant market and shareholder data, HSBC Holdings does not anticipate being classified as a passive foreign investment company. Accordingly, dividends paid on the shares or ADSs generally should be treated as qualified dividends.
Taxation of capital gains
Gains realised by a US holder on the sale or other disposition of shares or ADSs normally will not be subject to UK taxation unless at the time of the sale or other disposition the holder carries on a trade, profession or vocation in the UK through a branch or agency or permanent establishment and the shares or ADSs are or have been used, held or acquired for the purposes of such trade, profession, vocation, branch or agency or permanent establishment. Such gains will be included in income for US tax purposes, and will be long-term capital gains if the shares or ADSs were held for more than one year. A long-term capital gain realised by an individual US holder generally will be subject to US tax at preferential rates.
Inheritance tax
Shares or ADSs held by an individual whose domicile is determined to be the US for the purposes of the United States-United Kingdom Double Taxation Convention relating to estate and gift taxes (the ‘Estate Tax Treaty’) and who is not for such purposes a national of the UK will not, provided any US federal estate or gift tax chargeable has been paid, be subject to UK inheritance tax on the individual’s death or on a lifetime transfer of shares or ADSs except in certain cases where the shares or ADSs (i) are comprised in a settlement (unless, at the time of the settlement, the settlor was domiciled in the US and was not a national of the UK), (ii) are part of the business property of a UK permanent establishment of an enterprise, or (iii) pertain to a UK fixed base of an individual used for the performance of independent personal services. In such cases, the Estate Tax Treaty generally provides a credit against US federal tax liability for the amount of any tax paid in the UK in a case where the shares or ADSs are subject to both UK inheritance tax and to US federal estate or gift tax.
Stamp duty and stamp duty reserve tax – ADSs
If shares are transferred to a clearance service or American Depositary Receipt (‘ADR’) issuer (which will include a transfer of shares to the Depositary) under the current HMRC practice UK stamp duty and/or stamp duty reserve tax will be payable. The stamp duty or stamp duty reserve tax is generally payable on the consideration for the transfer and is payable at the aggregate rate of 1.5%.
The amount of stamp duty reserve tax payable on such a transfer will be reduced by any stamp duty paid in connection with the same transfer.
No stamp duty will be payable on the transfer of, or agreement to transfer, an ADS, provided that the ADR and any separate instrument of transfer or written agreement to transfer remain at all times outside the UK, and provided further that any such transfer or written agreement to transfer is not executed in the UK. No stamp duty reserve tax will be payable on a transfer of, or agreement to transfer, an ADS effected by the transfer of an ADR.
HSBC HOLDINGS PLC
476 |
Table of Contents
US backup withholding tax and information reporting
Distributions made on shares or ADSs and proceeds from the sale of shares or ADSs that are paid within the US, or through certain financial intermediaries to US holders, are subject to information reporting and may be subject to a US ‘backup’ withholding tax unless, in general, the US holder complies with certain certification procedures or is a corporation or other person exempt from such withholding. Holders that are not US persons generally are not subject to information reporting or backup withholding tax, but may be required to comply with applicable certification procedures to establish that they are not US persons in order to avoid the application of such information reporting requirements or backup withholding tax to payments received within the US or through certain financial intermediaries.
HSBC HOLDINGS PLC
477 |
Table of Contents
Shareholder information(continued)
Cautionary statement / Certain defined terms / Abbreviations
This page is intentionally left blank.
HSBC HOLDINGS PLC
478
Table of Contents
Shareholder Information(continued)
Information about the enforceability of judgements made in the US
HSBC Holdings is a public limited company incorporated in England and Wales. Most of the Directors and executive officers live outside the US. As a result, it may not be possible to serve process on such persons or HSBC Holdings in the US or to enforce judgements obtained in US courts against them or HSBC Holdings based on civil liability provisions of the securities laws of the US. There is doubt as to whether English courts would enforce:
| • | civil liabilities under US securities laws in original actions; or |
| • | judgements of US courts based upon these civil liability provisions. |
In addition, awards of punitive damages in actions brought in the US or elsewhere may be unenforceable in the UK. The enforceability of any judgement in the UK will depend on the particular facts of the case as well as the laws and treaties in effect at the time.
Exchange controls and other limitations affecting equity security holders
Other than certain economic sanctions which may be in force from time to time, there are currently no UK laws, decrees or regulations which would prevent the import or export of capital or remittance of distributable profits by way of dividends and other payments to holders of HSBC Holdings’ equity securities who are not residents of the UK. There are also no restrictions under the laws of the UK or the terms of the Memorandum and Articles of Association concerning the right of non-resident or foreign owners to hold HSBC Holdings’ equity securities or, when entitled to vote, to do so.
Dividends on the ordinary shares of HSBC Holdings
HSBC Holdings has paid dividends on its ordinary shares every year without interruption since it became the HSBC Group holding company by a scheme of arrangement in 1991. The dividends declared, per ordinary share, in respect of each of the last five years were:
| | First interim | |
| Second interim |
|
| Third interim |
|
| Fourth interim | 1 | Total | 2 | |||||||||||
2015 | $ | 0.100 | 0.100 | 0.100 | 0.210 | 0.510 | ||||||||||||||||||
£ | 0.064 | 0.064 | 0.066 | 0.142 | 0.336 | |||||||||||||||||||
HK$ | 0.775 | 0.775 | 0.775 | 1.628 | 3.953 | |||||||||||||||||||
2014 | $ | 0.100 | 0.100 | 0.100 | 0.200 | 0.500 | ||||||||||||||||||
£ | 0.059 | 0.062 | 0.064 | 0.128 | 0.313 | |||||||||||||||||||
HK$ | 0.775 | 0.777 | 0.776 | 1.551 | 3.879 | |||||||||||||||||||
2013 | $ | 0.100 | 0.100 | 0.100 | 0.190 | 0.490 | ||||||||||||||||||
£ | 0.066 | 0.064 | 0.062 | 0.114 | 0.306 | |||||||||||||||||||
HK$ | 0.776 | 0.775 | 0.775 | 1.473 | 3.799 | |||||||||||||||||||
2012 | $ | 0.090 | 0.090 | 0.090 | 0.180 | 0.450 | ||||||||||||||||||
£ | 0.058 | 0.056 | 0.056 | 0.111 | 0.281 | |||||||||||||||||||
HK$ | 0.698 | 0.698 | 0.698 | 1.395 | 3.489 | |||||||||||||||||||
2011 | $ | 0.090 | 0.090 | 0.090 | 0.140 | 0.410 | ||||||||||||||||||
£ | 0.056 | 0.058 | 0.058 | 0.090 | 0.262 | |||||||||||||||||||
HK$ | 0.701 | 0.702 | 0.699 | 1.088 | 3.190 | |||||||||||||||||||
| 1 | The fourth interim dividends have been translated into pounds sterling and Hong Kong dollars at the closing rate on 31 December. The fourth interim dividend for 2015 of $0.21 per ordinary share will be paid on 20 April 2016. |
| 2 | The above dividends declared are accounted for as disclosed in Note 9 on the Financial Statements. |
HSBC HOLDINGS PLC
478a
Table of Contents
Shareholder Information(continued)
A holder of HSBC Holdings’ American Depositary Shares (‘ADSs’) may have to pay, either directly or indirectly (via the intermediary through whom their ADSs are held) fees to the Bank of New York Mellon as depositary. Fees may be paid or recovered in several ways: by deduction
from amounts distributed; by selling a portion of distributable property; by deduction from dividend distributions; by directly invoicing the holder; or by charging the intermediaries who act for them. The fees for which the holders of the HSBC ADSs will be responsible include:
| For: | HSBC ADS holders must pay: | |
Each issuance of HSBC ADSs, including as a result of a distribution of shares (including through a stock dividend, stock split or distribution of rights or other property) | $5.00 (or less) per 100 HSBC ADSs or portion thereof | |
Each cancellation of HSBC ADSs, including if the deposit agreement terminates | $5.00 (or less) per 100 HSBC ADSs or portion thereof | |
Transfer and registration of shares on our share register to/from the holder’s name to/from the name of The Bank of New York Mellon or its agent when the holder deposits or withdraws shares | Registration or transfer fees (of which there currently are none) | |
| Conversion of non-US currency to US dollars | Charges and expenses incurred by The Bank of New York Mellon with respect to the conversion | |
| Each cash distribution to HSBC ADS holders | $0.02 or less per ADS | |
Transfers of HSBC ordinary shares to the depositary in exchange for HSBC ADSs | Any applicable taxes and/or other governmental charges | |
| Distribution of securities by the Depository to HSBC ADS holders | A fee equivalent to the fee that would be payable if securities distributed to you had been shares and those shares had been deposited for issuance of ADSs | |
Any other charges incurred by the depositary or its agents for servicing shares or other securities deposited | As applicable | |
The depositary may generally refuse to provide fee-attracting services until its fees for those services are paid.
The depositary has agreed to reimburse us for expenses we incur, and to pay certain out-of-pocket expenses and waive certain fees, in connection with the administration, servicing and maintenance of our ADS programme. There are limits on the amount of expenses for which the depositary will reimburse us. The amount of reimbursement available is not tied to the amount of fees the depositary collects from holders of ADSs. During the year ended 31 December 2015, the depositary reimbursed, paid and/or waived fees and expenses totalling $386,557 in connection with the administration, servicing and maintenance of the programme.
HSBC Holdings ordinary shares are listed or admitted to trading on the London Stock Exchange (‘LSE’), the Hong Kong Stock Exchange (‘HKSE’), Euronext Paris, the Bermuda Stock Exchange, and on the New York Stock Exchange (‘NYSE’) in the form of ADSs. HSBC Holdings maintains its principal share register in England and overseas branch share registers in Hong Kong and Bermuda (collectively, the ‘share register’).
As at 31 December 2015, there were a total of 213,054 holders of record of HSBC Holdings ordinary shares on the share register.
As at 31 December 2015, a total of 18,989,257 of the HSBC Holdings ordinary shares were registered in the HSBC Holdings’ share register in the name of 13,976 holders of record with addresses in the US. These shares represented 0.10% of the total HSBC Holdings ordinary shares in issue.
As at 31 December 2015, there were 6,830 holders of record of ADSs holding approximately 160.1m ADSs, representing approximately 800.5m HSBC Holdings ordinary shares, 6,685 of these holders had addresses in the US, holding approximately 160m ADSs, representing 800.3m HSBC Holdings ordinary shares. At 31 December 2015, approximately 4.1% of the HSBC Holdings ordinary shares were represented by ADSs held by holders of record with addresses in the US.
The following table shows, for the years, calendar quarters and months indicated, the highest and lowest prices for the HSBC Holdings ordinary shares and ADSs. These are based on mid-market prices at close of business on the LSE, HKSE, Euronext Paris, NYSE and the Bermuda Stock Exchange. Past share price performance should not be regarded as a guide to future performance.
HSBC HOLDINGS PLC
478b
Table of Contents
Shareholder Information(continued)
High and low mid-market closing prices
| London | Hong Kong | New York | Paris | Bermuda | ||||||||||||||||||||||||||||||||||||||||||||||
| $0.50 shares | $0.50 shares | ADSs1 | $0.50 shares | $0.50 shares2 | ||||||||||||||||||||||||||||||||||||||||||||||
| High pence | Low pence | High HK$ | Low HK$ | High $ | Low $ | High euro | Low euro | High $ | Low $ | |||||||||||||||||||||||||||||||||||||||||
2015 |
|
649 |
| 486 | 77.5 | 57.1 | 50.2 | 37.0 | 9.1 | 6.6 | 9.6 | 7.6 | ||||||||||||||||||||||||||||||||||||||
2014 | 681 | 589 | 86.1 | 72.2 | 56.0 | 46.5 | 8.4 | 7.1 | 11.0 | 9.4 | ||||||||||||||||||||||||||||||||||||||||
2013 | 770 | 647 | 90.4 | 79.3 | 58.6 | 50.7 | 9.1 | 7.7 | 11.4 | 10.5 | ||||||||||||||||||||||||||||||||||||||||
2012 | 655 | 491 | 82.0 | 59.5 | 53.1 | 38.3 | 8.0 | 5.8 | 10.5 | 7.6 | ||||||||||||||||||||||||||||||||||||||||
2011 | 731 | 464 | 91.8 | 56.1 | 59.0 | 35.8 | 8.7 | 5.4 | 11.8 | 7.0 | ||||||||||||||||||||||||||||||||||||||||
2015 | ||||||||||||||||||||||||||||||||||||||||||||||||||
4th Quarter | 545 | 494 | 63.3 | 58.9 | 40.8 | 37.9 | 7.7 | 6.7 | 8.1 | 7.6 | ||||||||||||||||||||||||||||||||||||||||
3rd Quarter | 595 | 486 | 71.4 | 57.1 | 46.2 | 37.0 | 8.5 | 6.6 | 9.2 | 8.5 | ||||||||||||||||||||||||||||||||||||||||
2nd Quarter | 649 | 570 | 77.5 | 66.6 | 50.2 | 42.9 | 9.1 | 7.9 | 9.6 | 8.6 | ||||||||||||||||||||||||||||||||||||||||
1st Quarter | 627 | 560 | 74.0 | 64.7 | 47.3 | 41.6 | 8.4 | 7.5 | 9.2 | 8.3 | ||||||||||||||||||||||||||||||||||||||||
2014 | ||||||||||||||||||||||||||||||||||||||||||||||||||
4th Quarter | 643 | 592 | 79.8 | 72.2 | 51.4 | 46.5 | 8.2 | 7.4 | 10.6 | 9.4 | ||||||||||||||||||||||||||||||||||||||||
3rd Quarter | 664 | 589 | 84.2 | 78.6 | 54.3 | 50.6 | 8.4 | 7.4 | 10.7 | 10.1 | ||||||||||||||||||||||||||||||||||||||||
2nd Quarter | 633 | 593 | 82.5 | 77.9 | 53.2 | 50.3 | 7.8 | 7.2 | 10.4 | 10.0 | ||||||||||||||||||||||||||||||||||||||||
1st Quarter | 681 | 592 | 86.1 | 76.0 | 56.0 | 49.2 | 8.2 | 7.1 | 11.0 | 9.9 | ||||||||||||||||||||||||||||||||||||||||
2016 | ||||||||||||||||||||||||||||||||||||||||||||||||||
January | 523 | 466 | 60.4 | 51.8 | 38.6 | 33.5 | 7.2 | 6.1 | 7.6 | 6.6 | ||||||||||||||||||||||||||||||||||||||||
2015 | ||||||||||||||||||||||||||||||||||||||||||||||||||
December | 545 | 494 | 63.0 | 58.9 | 40.7 | 37.9 | 7.6 | 6.8 | 7.6 | 7.6 | ||||||||||||||||||||||||||||||||||||||||
November | 540 | 504 | 63.0 | 60.3 | 40.4 | 38.9 | 7.7 | 7.0 | – | – | ||||||||||||||||||||||||||||||||||||||||
October | 532 | 503 | 63.3 | 59.4 | 40.8 | 38.2 | 7.2 | 6.7 | 8.1 | 8.1 | ||||||||||||||||||||||||||||||||||||||||
September | 519 | 486 | 62.2 | 57.1 | 39.9 | 37.0 | 7.2 | 6.6 | – | – | ||||||||||||||||||||||||||||||||||||||||
August | 595 | 488 | 71.4 | 60.6 | 46.2 | 38.4 | 8.5 | 6.6 | 9.2 | 8.6 | ||||||||||||||||||||||||||||||||||||||||
July | 587 | 559 | 70.9 | 65.8 | 45.6 | 42.6 | 8.4 | 7.7 | 9.0 | 8.5 | ||||||||||||||||||||||||||||||||||||||||
| 1 | In New York each ADS represents five underlying ordinary shares. |
| 2 | No trades were made on the Bermuda Stock Exchange during September and November 2015. |
Memorandum and Articles of Association
The disclosure under the caption ‘Memorandum and Articles of Association’ contained in Form 20-F for the years ended 31 December 2000, 2001 and 2014 is incorporated by reference herein.
History and development of HSBC
| 1865 | The founding member of the HSBC Group, The Hongkong and Shanghai Banking Corporation, is established in both Hong Kong and Shanghai. | |
| 1959 | The Mercantile Bank of India Limited and The British Bank of the Middle East, now HSBC Bank Middle East Limited, are purchased. | |
| 1965 | We acquire a 51% interest (subsequently increased to 62.14%) in Hang Seng Bank Limited. Hang Seng Bank is the fourth-largest listed bank in Hong Kong by market capitalisation. | |
| 1980 | We acquire a 51% interest in Marine Midland Banks, Inc., now HSBC USA, Inc, (with the remaining interest acquired in 1987). | |
| 1981 | The Hongkong and Shanghai Banking Corporation incorporates its then existing Canadian operations. HSBC Bank Canada subsequently makes numerous acquisitions, expanding rapidly to become the largest foreign-owned bank in Canada. | |
| 1987 | We purchase a 14.9% interest in Midland Bank plc, now HSBC Bank plc, one of the UK’s principal clearing banks. | |
| 1991 | HSBC Holdings plc is established as the parent company of the HSBC Group. | |
| 1992 | We purchase the remaining interest in Midland Bank plc. | |
| 1993 | As a consequence of the Midland acquisition, our Head Office | |
| is transferred from Hong Kong to London in January. | ||
| 1997 | We assume selected assets, liabilities and subsidiaries of Banco Bamerindus do Brasil S.A., now HSBC Bank Brazil, following the intervention of the Central Bank of Brazil, and in Argentina complete the acquisition of Grupo Roberts, now part of HSBC Bank Argentina S.A. | |
| 1999 | We acquire Republic New York Corporation, subsequently merged with HSBC USA, Inc., and Safra Republic Holdings S.A. | |
| 2000 | We complete our acquisition of 99.99% of the issued share capital of Crédit Commercial de France S.A., now HSBC France. | |
| 2002 | We acquire 99.59% of Grupo Financiero Bital, S.A. de C.V., the holding company of what is now HSBC Mexico. | |
| 2003 | We acquire Household International, Inc., now HSBC Finance Corporation. | |
| 2003 | We acquire Banco Lloyds TSB S.A.–Banco Múltiplo in Brazil and the country’s leading consumer finance company, Losango Promotora de Vendas Limitada. | |
| 2004 | HSBC Bank USA, Inc. merges with HSBC Bank & Trust (Delaware) N.A. to form HSBC Bank USA, N.A. | |
| 2004 | We complete the acquisition of The Bank of Bermuda Limited. | |
| 2004 | We acquire Marks and Spencer Retail Financial Services Holdings Limited, which trades as Marks and Spencer Money (‘M&S Money’) in the UK. | |
| 2004 | We acquire 19.9% of Bank of Communications, and Hang Seng Bank acquires 15.98% of Industrial Bank. | |
| 2005 | We increase our holding in Ping An to 19.9%, having made our initial investment in 2002. Ping An is the second-largest life insurer and the third-largest property and casualty insurer in mainland China. | |
| 2005 | HSBC Finance completes the acquisition of Metris Companies Inc., making HSBC the fifth-largest issuer of MasterCard and Visa cards in the USA. | |
| 2006 | We acquire Grupo Banistmo S.A. (‘Banistmo’), the leading banking group in Central America, through a tender offer to acquire 99.98% of the outstanding shares of Banistmo. | |
HSBC HOLDINGS PLC
478c |
Table of Contents
Shareholder Information(continued)
| 2007 | Our three associates in mainland China, Industrial Bank, Ping An and Bank of Communications, issue new shares. We do not subscribe and, as a result, our interests in the associates’ equity decrease. | |
| 2008 | We acquire the assets, liabilities and operations of The Chinese Bank in Taiwan. | |
| 2008 | We complete the sale of our seven French regional banks. | |
| 2009 | We complete the acquisition of 98.96% of PT Bank Ekonomi Raharja Tbk in Indonesia. | |
| 2012 | In May, we complete the sale of our US Card and Retail Services business, together with certain real estate and other assets and liabilities. | |
| 2012 | In May, we complete the sale of 195 retail branches in upstate New York. To First Niagara Bank, N.A. for $0.9bn. | |
Differences in HSBC Holdings/New York Stock Exchange corporate governance practices
Under the NYSE’s corporate governance rules for listed companies and the applicable rules of the SEC, as a NYSE-listed foreign private issuer, HSBC Holdings must disclose any significant ways in which its corporate governance practices differ from those followed by US companies subject to NYSE listing standards. HSBC Holdings believes the following to be the significant differences between its corporate governance practices and NYSE corporate governance rules applicable to US companies.
US companies listed on the NYSE are required to adopt and disclose corporate governance guidelines. The Listing Rules of the FCA require each listed company incorporated in the UK to include in itsAnnual Report and Accounts a statement of how it has applied the principles of The UK Corporate Governance Code issued by the Financial Reporting Council and a statement as to whether or not it has complied with the code provisions of The UK Corporate Governance Code throughout the accounting period covered by theAnnual Report and Accounts. A company that has not complied with the code provisions, or complied with only some of the code provisions or (in the case of provisions whose requirements are of a continuing nature) complied for only part of an accounting period covered by the report, must specify the code provisions with which it has not complied, and (where relevant) for what part of the reporting period such non-compliance continued, and give reasons for any non-compliance. As stated above, HSBC Holdings complied throughout 2015 with the applicable code provisions of The UK Corporate Governance Code. The UK Corporate Governance Code does not require HSBC Holdings to disclose the full range of corporate governance guidelines with which it complies.
Under NYSE standards, companies are required to have a nominating/corporate governance committee composed entirely of directors determined to be independent in accordance with the NYSE’s corporate governance rules. All of the members of the Nomination Committee during 2015 were independent non-executive Directors, as determined in accordance with the UK Corporate
| 2012 | In December, we complete the sale of our businesses in Costa Rica, El Salvador and Honduras to the Colombian banking group, Banco Davivienda, for $801m. | |
| 2012 | In December, we announce the disposal of our shares in Ping An to Charoen Pokphand Group Company for $9,385m in cash. | |
| 2013 | In November, we complete the sale of HSBC Bank (Panama) S.A. to Bancolombia S.A. for $2.1bn in cash. | |
| 2015 | In February, Hang Seng Bank sells approximately 5% of the ordinary shares of Industrial Bank Co., Ltd for $2.0bn in cash to institutional investors. | |
| 2015 | In May, Hang Seng Bank sells to institutional investors a second tranche of up to 4.99% of the ordinary shares in Industrial Bank Co., Ltd for $2.71bn in cash. | |
| 2015 | In August, we announce the sale of our entire business in Brazil to Banco Bradesco S.A. for $5.2bn in cash. | |
Governance Code. The terms of reference of our Nomination Committee, which comply with the UK Corporate Governance Code, require a majority of members to be independent, non-executive Directors. In addition to identifying individuals qualified to become Board members, a nominating/corporate governance committee must develop and recommend to the Board a set of corporate governance principles. The Nomination Committee’s terms of reference do not require it to develop and recommend corporate governance principles for HSBC Holdings, as HSBC Holdings is subject to the corporate governance principles of The UK Corporate Governance Code. The Board of Directors is responsible under its terms of reference for the development and review of Group policies and practices on corporate governance.
Under the NYSE standards, companies are required to have a compensation committee composed entirely of directors determined to be independent in accordance with the NYSE’s corporate governance rules. All of the members of the Group Remuneration Committee during 2015 were independent non-executive Directors, as determined in accordance with the UK Corporate Governance Code. The terms of reference of our Group Remuneration Committee, which comply with the UK Corporate Governance Code, require at least three members to be independent, non-executive Directors. A compensation committee must review and approve corporate goals and objectives relevant to chief executive officer compensation and evaluate a chief executive officer’s performance in light of these goals and objectives. The Group Remuneration Committee’s terms of reference require it to review and approve performance-based remuneration of the executive Directors by reference to corporate goals and objectives which are set by the Board of Directors.
Pursuant to NYSE listing standards, non-management directors must meet on a regular basis without management present and independent directors must meet separately at least once per year.
During 2015, the non-executive Directors and the Group Chairman met seven times without the other executive Directors. The non-executive Directors also met seven times without the Group Chairman, including to appraise the Group Chairman’s performance. HSBC Holdings’ practice, in this regard, complies with The UK Corporate Governance Code.
HSBC HOLDINGS PLC
478d |
Table of Contents
Shareholder Information(continued)
In accordance with the requirements of The UK Corporate Governance Code, HSBC Holdings discloses in itsAnnual Report and Accounts how the Board, its committees and the Directors are evaluated (on page 260) and provides extensive information regarding Directors’ compensation in the Directors’ Remuneration Report (on page 285). The terms of reference of HSBC Holdings’ Group Audit, Group Nomination, Group Remuneration and Group Risk Committees are available at www.hsbc.com/investor-relations/governance/board-committees.
NYSE listing standards require US companies to adopt a code of business conduct and ethics for directors, officers and employees, and promptly disclose any waivers of the code for directors or executive officers. In 2009, the Board endorsed three HSBC Values statements underpinned by the continued use of our Business Principles, in replacement of the Group Business Principles and Values. In addition to the HSBC Values statements and Business Principles (and previously the Group Business Principles and Values), which apply to the employees of all our companies, pursuant to the requirements of the Sarbanes-Oxley Act the Board of HSBC Holdings has adopted a Code of Ethics applicable to the Group Chairman and the Group Chief Executive, as the principal executive officers, and to the Group Finance Director and Group Chief Accounting Officer. HSBC Holdings’ Code of Ethics is available on http://www.hsbc.com/about-hsbc/corporate-governance/obligations-of-senior-financial-officers or from the Group Company Secretary at 8 Canada Square, London E14 5HQ. If the Board amends or waives the provisions of the Code of Ethics, details of the amendment or waiver will appear at the same website address. During 2015, HSBC Holdings made no amendments to its Code of Ethics and granted no waivers from its provisions. The references to the standards to be followed by all employees reflect the
Board’s endorsement of HSBC Values statements underpinned by the continued use of our Business Principles. The HSBC Values statements and Business Principles are available onwww.hsbc.com/citizenship/our-values.
Under NYSE listing rules applicable to US companies, independent directors must comprise a majority of the board of directors. Currently, more than three-quarters of HSBC Holdings’ Directors are independent.
Under The UK Corporate Governance Code the HSBC Holdings Board determines whether a Director is independent in character and judgement and whether there are relationships or circumstances which are likely to affect, or could appear to affect, the Director’s judgement. Under the NYSE rules a director cannot qualify as independent unless the board affirmatively determines that the director has no material relationship with the listed company; in addition the NYSE rules prescribe a list of circumstances in which a director cannot be independent. The UK Corporate Governance Code requires a company’s board to assess director independence by affirmatively concluding that the director is independent of management and free from any business or other relationship that could materially interfere with the exercise of independent judgement. Lastly, a chief executive officer of a US company listed on the NYSE must annually certify that he or she is not aware of any violation by the company of NYSE corporate governance standards. In accordance with NYSE listing rules applicable to foreign private issuers, HSBC Holdings’ Group Chief Executive is not required to provide the NYSE with this annual compliance certification. However, in accordance with rules applicable to both US companies and foreign private issuers, the Group Chief Executive is required promptly to notify the NYSE in writing after any executive officer becomes aware of any material non-compliance with the NYSE corporate governance standards applicable to HSBC Holdings.
HSBC Holdings is required to submit annual and interim written affirmations of compliance with applicable NYSE corporate governance standards, similar to the affirmations required of NYSE-listed US companies.
HSBC HOLDINGS PLC
478e |
Table of Contents
Shareholder information(continued)
Glossary of accounting terms and US equivalents
| Accounting term | US equivalent or brief description | |
Accounts | Financial Statements | |
Articles of Association | Articles of incorporation | |
Called up share capital | Shares issued and fully paid | |
Creditors | Payables | |
Debtors | Receivables | |
Deferred tax | Deferred income tax | |
Finance lease | Capital lease | |
Freehold | Ownership with absolute rights in perpetuity | |
Interests in associates and joint ventures | Interests in entities over which we have significant influence or joint control, which are accounted for using the equity method | |
Loans and advances | Loans | |
Loan capital | Long-term debt | |
Nominal value | Par value | |
One-off | Non-recurring | |
Ordinary shares | Common stock | |
Overdraft | A line of credit, contractually repayable on demand unless a fixed-term has been agreed, established through a customer’s current account | |
Preference shares | Preferred stock | |
Premises | Property | |
Provisions | Liabilities of uncertain timing or amount | |
Share premium account | Additional paid-in capital | |
Shares in issue | Shares outstanding | |
Write-offs | Charge-offs | |
HSBC HOLDINGS PLC
478f |
Table of Contents
| Form 20-F Item Number and Caption | Location | Page | ||||
PART I | ||||||
1. Identity of Directors, Senior Management and Advisers | Not required for Annual Report | — | ||||
2. Offer Statistics and Expected Timetable | Not required for Annual Report | — | ||||
3. Key Information | ||||||
A. Selected Financial Data | Consolidated income statement, Consolidated balance sheet, Shareholder information | 50, 61, 470 | ||||
B. Capitalisation and Indebtedness | Not required for Annual Report | — | ||||
C. Reasons for the Offer and use of Proceeds | Not required for Annual Report | — | ||||
D. Risk Factors | Report of the Directors: Financial Review | 109a-109l | ||||
4. Information on the Company | ||||||
A. History and Development of the Company | Strategic Report | 12-21 | ||||
Report of the Directors: Financial Review | 48-100l | |||||
Shareholder Information | 470-471, 498, 478e | |||||
B. Business Overview | Strategic Report | 12-41 | ||||
Financial Review: Regulation and Supervision | 100b-100j | |||||
Report of the Directors: Financial Review | 48-100l | |||||
C. Organisational Structure | Note 21 – Notes on the Financial Statements | 414 | ||||
Strategic Report | 28-33 | |||||
Shareholder Information – Simplified structure chart of HSBC Holdings | 474 | |||||
D. Property, Plants and Equipment | Financial Review –Property | 98 | ||||
Note 22 – Notes on the Financial Statements | 416 | |||||
4 A. Unresolved Staff Comments | Not Applicable | — | ||||
5. Operating and Financial Review and Prospects | ||||||
A. Operating Results | Report of the Directors: Financial Review | 48-100l | ||||
B. Liquidity and Capital Resources | Financial Review: Liquidity and Funding Financial Review: Risk management of insurance operations Financial Review: Appendix to Risk |
| 154-165 187-188 204-210 |
| ||
C. Research and Development, Patents and Licences, etc. | Not Applicable | — | ||||
D. Trend Information | Strategic Report | 12 | ||||
Report of the Directors: Financial Review | 48-100l | |||||
E. Off-Balance Sheet Arrangements | Note 31 – Notes on the Financial Statements | 426-433 | ||||
Note 37 – Notes on the Financial Statements | 441-442 | |||||
Note 39 – Notes on the Financial Statements | 442-445 | |||||
F. Tabular disclosure of Contractual Obligations | Report of the Directors: Financial Review | 63j | ||||
6. Directors, Senior Management and Employees | ||||||
A. Directors and Senior Management | Report of the Directors: Corporate Governance | 249-255 | ||||
B. Compensation | Directors’ Remuneration Report | 285-321 | ||||
C. Board Practices | Report of the Directors: Corporate Governance | 249-254, 262-265, 270 | ||||
Directors’ Remuneration Report | 297-299 | |||||
D. Employees | Strategic Report | 38 | ||||
E. Share Ownership | Report of the Directors: Corporate Governance | 279-280, 282-283 | ||||
Directors’ Remuneration Report Note 6 – Notes on the Financial Statements Note 35 – Notes on the Financial Statements |
| 288-317 361-368 437-439 |
| |||
7. Major Shareholders and Related Party Transactions | ||||||
A. Major Shareholders | Report of the Directors: Corporate Governance | 283-284 | ||||
B. Related Party Transactions | Note 41 – Notes on the Financial Statements | 454-457 | ||||
C. Interests of Experts and Counsel | Not required for Annual Report | — | ||||
8. Financial Information | ||||||
A. Consolidated Statements and Other Financial Information | Financial Statements | 335-469 | ||||
Shareholder Information | 470 | |||||
B. Significant Changes | Not Applicable | — | ||||
9. The Offer and Listing | ||||||
A. Offer and Listing Details | Shareholder Information | 478b-478c | ||||
B. Plan of Distribution | Not required for Annual Report | — | ||||
C. Markets | Shareholder Information | 478b-478c | ||||
D. Selling Shareholders | Not required for Annual Report | — | ||||
E. Dilution | Not required for Annual Report | — | ||||
F. Expenses of the Issue | Not required for Annual Report | — | ||||
HSBC HOLDINGS PLC
478g
Table of Contents
Reconciliations(continued)
| Form 20-F Item Number and Caption | Location | Page | ||||
10. Additional Information | ||||||
A. Share Capital | Not required for Annual Report | — | ||||
B. Memorandum and Articles of Association | Shareholder Information | 478c | ||||
C. Material Contracts | Note 40 – Notes on the Financial Statements | 449-450 | ||||
D. Exchange Controls | Shareholder Information | 478a | ||||
E. Taxation | Shareholder Information | 475-477 | ||||
F. Dividends and Paying Agents | Not required for Annual Report | — | ||||
G. Statements by Experts | Not required for Annual Report | — | ||||
H. Documents on Display | Shareholder Information | 473 | ||||
I. Subsidiary Information | Not Applicable | — | ||||
11. Quantitative and Qualitative Disclosures About Market Risk | Report of the Directors: Financial Review | 166-175 | ||||
Note 16 and 33 – Notes on the Financial Statements | 394-398, 436 | |||||
12. Description of Securities Other than Equity Securities | ||||||
A. Debt Securities | Not required for Annual Report | — | ||||
B. Warrants and Rights | Not required for Annual Report | — | ||||
C. Other Securities | Not required for Annual Report | — | ||||
D. American Depositary Shares | Shareholder Information | 478b | ||||
PART II | ||||||
13. Defaults, Dividends Arrearages and Delinquencies | Not Applicable | — | ||||
14. Material Modifications to the Rights of Securities Holders and Use of Proceeds | Not Applicable | — | ||||
15. Controls and Procedures | Report of Independent Registered Public Accounting Firm to the Board of Directors and Shareholders of HSBC Holdings plc | 335 | ||||
Report of the Directors: Financial Review | 98a | |||||
16. [Reserved] | ||||||
A. Audit Committee Financial Expert | Report of the Directors: Corporate Governance | 263 | ||||
B. Code of Ethics | Shareholder Information | 478e | ||||
C. Principal Accountant Fees and Services | Report of the Directors: Corporate Governance | 264 | ||||
Note 7 – Notes on the Financial Statements | 368-369 | |||||
D. Exemptions from the Listing Standards for Audit Committees | Not Applicable | — | ||||
E. Purchases of Equity Securities by the Issuer and Affiliated Purchasers | Report of the Directors: Corporate Governance | 284 | ||||
F. Change in Registrant’s Certifying Accountant | Report of the Directors: Financial Review | 98a-98b | ||||
G. Corporate Governance | Shareholder Information | 478d-478e | ||||
PART III | ||||||
17. Financial Statements | Not Applicable | — | ||||
18. Financial Statements | Financial Statements | 335-469 | ||||
19. Exhibits (including Certifications) | * | |||||
HSBC HOLDINGS PLC
478h
Table of Contents
| Abbreviation | Brief description | |
| A | ||
| A$ | Australian dollar | |
| ABS1 | Asset-backed security | |
| ACF | Advances to core funding | |
| ADR | American Depositary Receipt | |
| ADS | American Depositary Share | |
| AIEA | Average interest-earning assets | |
| ALCM | Asset, Liability and Capital Management | |
| ALCO | Asset and Liability Management Committee | |
| AML | Anti-money laundering | |
| ARM1 | Adjustable-rate mortgage | |
| ARS | Argentine peso | |
| AUM | Assets under management | |
| B | ||
| Barion | Barion Funding Limited, a term-funding vehicle | |
| Basel Committee | Basel Committee on Banking Supervision | |
| Basel II1 | 2006 Basel Capital Accord | |
| Basel III1 | Basel Committee’s reforms to strengthen global capital and liquidity rules | |
| BBA | British Bankers’ Association | |
| BoCom | Bank of Communications Co., Limited, one of China’s largest banks | |
| BoE | Bank of England | |
| Bps1 | Basis points. One basis point is equal to one-hundredth of a percentage point | |
| BRL | Brazilian real | |
| BSA | Bank Secrecy Act (US) | |
| BSM | Balance Sheet Management | |
| BVI | British Virgin Islands | |
| C | ||
| CA$ | Canadian dollar | |
| CAPM | Capital Asset Pricing Model | |
| CCA | Consumer Credit Act (UK) | |
| CCB1 | Capital conservation buffer | |
| CCR1 | Counterparty credit risk | |
| CCyB1 | Countercyclical capital buffer | |
| CDS1 | Credit default swap | |
| CEA | Commodities Exchange Act (US) | |
| CET11 | Common equity tier 1 | |
| CGU | Cash-generating unit | |
| CMB | Commercial Banking, a global business | |
| CML1 | Consumer and Mortgage Lending (US) | |
| COSO | 2013 Committee of the Sponsors of the Treadway Commission (US) | |
| CP1 | Commercial paper | |
| CRD1 | Capital Requirements Directive | |
| CRR1 | Customer risk rating | |
| CRR/CRD IV | Capital Requirements Regulation and Directive | |
| CVA1 | Credit valuation adjustment | |
| D | ||
| DANY DPA | Two-year deferred prosecution agreement with the New York County District Attorney (US) | |
| Decision One | Decision One Mortgage Company LLC | |
| Deferred Shares | Awards of Deferred Shares define the number of HSBC Holdings ordinary shares to which the employee will become entitled, generally between one and three years from the date of the award, and normally subject to the individual remaining in employment | |
| Dodd-Frank | Dodd-Frank Wall Street Reform and Consumer Protection Act (US) | |
| DoJ | Department of Justice (US) | |
| DPA | Deferred Prosecution Agreement (US) | |
| DPF | Discretionary participation feature of insurance and investment contracts | |
| DVA1 | Debit valuation adjustment | |
| E | ||
| EAD1 | Exposure at default | |
| EBA | European Banking Authority | |
| EC | European Commission | |
| ECB | European Central Bank | |
| EGP | Egyptian pound | |
| EL1 | Expected loss | |
| EMIR | European Market Infrastructure Regulation (EU) | |
HSBC HOLDINGS PLC
479 |
Table of Contents
Shareholder information(continued)
Abbreviations
Abbreviation
| Brief description
| |
| EU | European Union | |
| Euribor | European Interbank Offered Rate | |
| F | ||
| Fannie Mae | Federal National Mortgage Association (US) | |
| FCA Direction | Undertaking originally with the Financial Services Authority (subsequently with the Financial Conduct Authority) to comply with certain forward-looking obligations with respect to AML and sanctions requirements | |
| FFVA | Funding fair value adjustment estimation methodology on derivative contracts | |
| First Direct | A division of HSBC Bank plc | |
| FPA | Fixed pay allowance | |
| FPC | Financial Policy Committee (UK) | |
| FRB | Federal Reserve Board (US) | |
| Freddie Mac | Federal Home Loan Mortgage Corporation (US) | |
| FSB | Financial Stability Board | |
| FSVC | Financial System Vulnerabilities Committee | |
| FTE | Full-time equivalent staff | |
| FTSE | Financial Times – Stock Exchange index | |
| FuM | Funds under management | |
| G | ||
| GAAP | Generally accepted accounting principles | |
| GAC | Group Audit Committee | |
| GB&M | Global Banking and Markets, a global business | |
| GDP | Gross domestic product | |
| GMB | Group Management Board | |
| GPB | Global Private Banking, a global business | |
| GPSP | Group Performance Share Plan | |
| GRC | Group Risk Committee | |
| Group | HSBC Holdings together with its subsidiary undertakings | |
| G-SIB1 | Global systemically important bank | |
| G-SII | Global systemically important institution | |
| H | ||
| Hang Seng Bank | Hang Seng Bank Limited, one of Hong Kong’s largest banks | |
| HK$ | Hong Kong dollar | |
| HKMA | Hong Kong Monetary Authority | |
| HNAH | HSBC North America Holdings Inc. | |
| Hong Kong | Hong Kong Special Administrative Region of the People’s Republic of China | |
| HSBC | HSBC Holdings together with its subsidiary undertakings | |
| HSBC Bank | HSBC Bank plc | |
| HSBC Bank Middle East | HSBC Bank Middle East Limited | |
| HSBC Bank USA | HSBC Bank USA, N.A., HSBC’s retail bank in the US | |
| HSBC Canada | The sub-group, HSBC Bank Canada, HSBC Trust Company Canada, HSBC Mortgage Corporation Canada and HSBC Securities Canada, consolidated for liquidity purposes | |
| HSBC Finance | HSBC Finance Corporation, the US consumer finance company (formerly Household International, Inc.) | |
| HSBC France | HSBC’s French banking subsidiary, formerly CCF S.A. | |
| HSBC Holdings | HSBC Holdings plc, the parent company of HSBC | |
| HSBC Premier | HSBC’s premium personal global banking service | |
| HSBC Private Bank (Suisse) | HSBC Private Bank (Suisse) SA, HSBC’s private bank in Switzerland | |
| HSBC USA | The sub-group, HSBC USA Inc (the holding company of HSBC Bank USA) and HSBC Bank USA, consolidated for liquidity purposes | |
| HSI | HSBC Securities (USA) Inc. | |
| HSSL | HSBC Securities Services (Luxembourg) | |
| HTIE | HSBC International Trust Services (Ireland) Limited | |
| I | ||
| IAS | International Accounting Standards | |
| IASB | International Accounting Standards Board | |
| IFRSs | International Financial Reporting Standards | |
| Industrial Bank | Industrial Bank Co. Limited, a national joint-stock bank in mainland China in which Hang Seng Bank Limited has a shareholding | |
| Investor Update | The Investor Update in June 2015 | |
| IRB1 | Internal ratings-based | |
| ISDA | International Swaps and Derivatives Association | |
| K | ||
| KPMG | KPMG Audit Plc and its affiliates | |
HSBC HOLDINGS PLC
480 |
Table of Contents
| Abbreviation | Brief description | |
| L | ||
| LCR | Liquidity coverage ratio | |
| LFRF | Liquidity and funding risk management framework | |
| LGD1 | Loss given default | |
| Libor | London Interbank Offered Rate | |
| LICs | Loan impairment charge and other credit risk provisions | |
| LMU | Loan Management Unit, part of Wholesale Credit and Market Risk | |
| LTV1 | Loan-to-value ratio | |
| M | ||
| Madoff Securities | Bernard L. Madoff Investment Securities LLC | |
| Mainland China | People’s Republic of China excluding Hong Kong | |
| Malachite | Malachite Funding Limited, a term-funding vehicle | |
| Markets | HSBC’s treasury and capital markets services in Global Banking and Markets | |
| Mazarin | Mazarin Funding Limited, an asset-backed CP conduit | |
| MBS | US mortgage-backed security | |
| MENA | Middle East and North Africa | |
| Monoline | Monoline insurance company | |
| MREL | EU minimum requirements for own funds and eligible liabilities | |
| MXN | Mexican peso | |
| N | ||
| NII | Net interest income | |
| NSFR | Net stable funding ratio | |
| NYSE | New York Stock Exchange | |
| O | ||
| OCC | Office of the Comptroller of the Currency (US) | |
| ORMF | Operational risk management framework | |
| OTC1 | Over-the-counter | |
| P | ||
| PCM | Payments and Cash Management | |
| PD1 | Probability of default | |
| Performance Shares1 | Awards of HSBC Holdings ordinary shares under employee share plans that are subject to corporate performance conditions | |
| Ping An | Ping An Insurance (Group) Company of China, Ltd, the second-largest life insurer in the PRC | |
| PPI | Payment protection insurance product | |
| PRA | Prudential Regulation Authority (UK) | |
| PRC | People’s Republic of China | |
| Premier | HSBC Premier, HSBC’s premium personal global banking service | |
| Principal plan | HSBC Bank (UK) Pension Scheme | |
| PVIF | Present value of in-force long-term insurance business and long-term investment contracts with DPF | |
| PwC | PricewaterhouseCoopers LLP and its network of firms | |
| R | ||
| RBWM | Retail Banking and Wealth Management, a global business | |
| Repo1 | Sale and repurchase transaction | |
| Reverse repo | Security purchased under commitments to sell | |
| RMB | Renminbi | |
| RMM | Risk Management Meeting of the Group Management Board | |
| RNIV | Risk not in VaR | |
| RoRWA | Return on average risk-weighted assets | |
| RTS | Regulatory Technical Standards | |
| RWA1 | Risk-weighted assets | |
| S | ||
| SE1 | Structured entity | |
| SEC | Securities and Exchange Commission (US) | |
| ServCo group | Separately incorporated group of service companies planned in response to UK ring-fencing proposals | |
| SIC | Securities investment conduit | |
| SME | Small and medium-sized enterprise | |
| Solitaire | Solitaire Funding Limited, a special purpose entity managed by HSBC | |
| SPE1 | Special purpose entity | |
| SRB1 | Systemic Risk Buffer | |
| T | ||
| The Hongkong and Shanghai Banking Corporation | The Hongkong and Shanghai Banking Corporation Limited, the founding member of HSBC | |
| TLAC1 | Total loss absorbing capacity | |
| TRL | Turkish lira | |
HSBC HOLDINGS PLC
481 |
Table of Contents
Shareholder information(continued)
Abbreviations / Glossary
Abbreviation
| Brief description
| |
| TSR | Total shareholder return | |
| U | ||
| UAE | United Arab Emirates | |
| UK | United Kingdom | |
| $ | United States dollar | |
| US | United States of America | |
| US DPA | Five-year deferred prosecution agreement with the Department of Justice and others (US) | |
| US run-off portfolio | Includes our CML, vehicle finance and Taxpayer Financial Services businesses and insurance, commercial, corporate and treasury activities in HSBC Finance on an IFRSs management basis | |
| V | ||
| VaR1 | Value at risk | |
| VIU | Value in use | |
| 1 | Full definition included in Glossary on page 483. |
HSBC HOLDINGS PLC
482 |
Table of Contents
| Term | Definition | |
| A | ||
| Adjustable-rate mortgages (‘ARM’s) | Mortgage loans in the US on which the interest rate is periodically changed based on a reference price. These are included within ‘affordability mortgages’. | |
| Affordability mortgages | Mortgage loans where the customer’s monthly payments are set out at a low initial rate, either variable or fixed, before resetting to a higher rate once the introductory period is over. | |
| Agency exposures | Exposures to near or quasi-government agencies including public sector entities fully owned by government carrying out non-commercial activities, provincial and local government authorities, development banks and funds set up by government. | |
| Alt-A | A US description for loans regarded as lower risk than sub-prime, but with higher risk characteristics than lending under normal criteria. | |
| Arrears | Customers are said to be in arrears (or in a state of delinquency) when they are behind in fulfilling their obligations, with the result that an outstanding loan is unpaid or overdue. When a customer is in arrears, the total outstanding loans on which payments are overdue are described as delinquent. | |
| Asset-backed securities (‘ABS’s) | Securities that represent an interest in an underlying pool of referenced assets. The referenced pool can comprise any assets which attract a set of associated cash flows but are commonly pools of residential or commercial mortgages. | |
| B | ||
| Back-testing | A statistical technique used to monitor and assess the accuracy of a model, and how that model would have performed had it been applied in the past. | |
| Bail-inable debt | Bail-in refers to imposition of losses at the point of non-viability (but before insolvency) on bank liabilities (bail-inable debt) that are not exposed to losses while the institution remains a viable, going concern. Whether by way of write-down or conversion into equity, this has the effect of recapitalising the bank (although it does not provide any new funding). | |
| Bank levy | A levy that applies to UK banks, building societies and the UK operations of foreign banks from 1 January 2011. The amount payable is based on a percentage of the group’s consolidated liabilities and equity as at 31 December after deducting certain items the most material of which are those related to insured deposit balances, tier 1 capital, insurance liabilities, high quality liquid assets and items subject to a legally enforceable net settlement agreement. | |
Bank Recovery and Resolution Directive (‘BRRD’) | A European legislative package issued by the European Commission and adopted by EU Member States. This directive was finalised in July 2014 and the majority of provisions came into effect on 1 January 2015. This introduces a common EU framework for how authorities should intervene to address banks which are failing or are likely to fail. The framework includes early intervention and measures designed to prevent failure and in the event of bank failure for authorities to ensure an orderly resolution. | |
| Basel II | The capital adequacy framework issued by the Basel Committee on Banking Supervision in June 2006 in the form of the ‘International Convergence of Capital Measurement and Capital Standards’, amended by subsequent changes to the capital requirements for market risk and re-securitisations, commonly known as Basel 2.5, which took effect from 31 December 2011. | |
| Basel III | In December 2010, the Basel Committee issued ‘Basel III rules: a global regulatory framework for more resilient banks and banking systems’ and ‘International framework for liquidity risk measurement, standards and monitoring’. Together these documents present the Basel Committee’s reforms to strengthen global capital and liquidity rules with the goal of promoting a more resilient banking sector. In June 2011, the Basel Committee issued a revision to the former document setting out the finalised capital treatment for counterparty credit risk in bilateral trades. | |
| Basis point (‘bps’) | One hundredth of a per cent (0.01%), so 100 basis points is 1%. For example, this is used in quoting movements in interest rates or yields on securities. | |
| Business model | A term describing how we organise our business activities to create value. HSBC has four global businesses serving five geographical regions, supported by eleven global functions. Together these operations provide a comprehensive range of banking and related financial services designed to meet the needs of customers ranging from individuals to the largest of companies. HSBC operates in many countries, and its services are primarily delivered by domestic banks, typically with local deposit bases. | |
| C | ||
| Capital conservation buffer (‘CCB’) | A capital buffer prescribed by regulators under Basel III and designed to ensure banks build up capital buffers outside periods of stress which can be drawn down as losses are incurred. Should a bank’s capital levels fall within the capital conservation buffer range, capital distributions will be constrained by the regulators. | |
| Capital requirements directive (‘CRD’) | A capital adequacy legislative package adopted by EU member states. The CRD IV package comprises a recast Capital Requirements Directive and a new Capital Requirements Regulation. The package implements the Basel III capital proposals together with transitional arrangements for some of its requirements. CRD IV came into force on 1 January 2014. | |
| Capital securities | Capital securities include perpetual subordinated capital securities and contingent convertible capital securities. | |
| Central counterparty (‘CCP’) | An intermediary between a buyer and a seller (generally a clearing house). | |
| Clawback | Remuneration already paid to an individual, which has to be returned to an organisation under certain circumstances. | |
HSBC HOLDINGS PLC
483 |
Table of Contents
Shareholder information(continued)
Glossary
Term
| Definition
| |
| Collateralised debt obligation (‘CDO’) | A security issued by a third-party which references ABSs and/or certain other related assets purchased by the issuer. CDOs may feature exposure to sub-prime mortgage assets through the underlying assets. | |
| Collectively assessed impairment | Impairment assessment on a collective basis for homogeneous groups of loans that are not considered individually significant and to cover losses which have been incurred but have not yet been identified on loans subject to individual assessment. | |
| Commercial paper (‘CP’) | An unsecured, short-term debt instrument issued by a corporation, typically for the financing of accounts receivable, inventories and meeting short-term liabilities. The debt is usually issued at a discount, reflecting prevailing market interest rates. | |
| Commercial real estate | Any real estate, comprising buildings or land, intended to generate a profit, either from capital gain or rental income. | |
| Common equity tier 1 capital (‘CET1’) | The highest quality form of regulatory capital under Basel III that comprises common shares issued and related share premium, retained earnings and other reserves excluding the cash flow hedging reserve, less specified regulatory adjustments. | |
| CET 1 ratio | A Basel III measure of CET 1 capital expressed as percentage of total risk exposure amount. | |
| Compliance risk | The risk that the Group fails to observe the letter and spirit of all relevant laws, codes, rules, regulations and standards of good market practice, and incurs fines and penalties and suffers damage to its business as a consequence. | |
| Comprehensive Capital Analysis and Review (‘CCAR’) | CCAR is an annual exercise by the FRB to ensure that institutions have robust, forward-looking capital planning processes that account for their unique risks and sufficient capital to continue operations throughout times of economic and financial stress. | |
| Conduits | HSBC sponsors and manages multi-seller conduits and ‘SIC’s. The multi-seller conduits hold interests in diversified pools of third-party assets such as vehicle loans, trade receivables and credit card receivables funded through the issuance of short-dated commercial paper and supported by a liquidity facility. The SICs hold predominantly asset-backed securities referencing such items as commercial and residential mortgages, vehicle loans and credit card receivables funded through the issuance of both long-term and short-term debt. | |
| Constant currency | A non-GAAP financial measure that adjusts for the year-on-year effects of foreign currency translation differences by comparing reported results for the reported period with reported results for comparative period retranslated at exchange rates for the reported period. The foreign currency translation differences reflect the movements of the US dollar against most major currencies during the reported period. | |
| Constant net asset value fund (‘CNAV’) | A fund that prices its assets on an amortised cost basis, subject to the amortised book value of the portfolio remaining within 50 basis points of its market value. | |
| Consumer and Mortgage Lending (‘CML’) | In the US, the CML portfolio consists of our Consumer Lending and Mortgage Services businesses, which are in run-off. The Consumer Lending business offered secured and unsecured loan products, such as first and second lien mortgage loans, open-ended home equity loans and personal non-credit card loans through branch locations and direct mail. The majority of the mortgage lending products were for refinancing and debt consolidation rather than home purchases. In the first quarter of 2009, we discontinued all originations by our Consumer Lending business. Prior to the first quarter of 2007, when we ceased loan purchase activity, the Mortgage Services business purchased non-conforming first and second lien real estate secured loans from unaffiliated third parties. The business also included the operations of Decision One Mortgage Company (‘Decision One’), which historically originated mortgage loans sourced by independent mortgage brokers and sold these to secondary market purchasers. Decision One ceased originations in September 2007. | |
| Contractual maturities | The date on which the final payment (principal or interest) of any financial instrument is due to be paid, at which point all the remaining outstanding principal and interest have been repaid. | |
| Countercyclical capital buffer (‘CCyB’) | A capital buffer prescribed by regulators under Basel III which aims to ensure that capital requirements take account of the macro-financial environment in which banks operate. This will provide the banking sector with additional capital to protect it against potential future losses, when excess credit growth in the financial system as a whole is associated with an increase in system-wide risk. | |
| Counterparty credit risk (‘CCR’) | Counterparty credit risk, in both the trading and non-trading books, is the risk that the counterparty to a transaction may default before completing the satisfactory settlement of the transaction. | |
| Credit default swap (‘CDS’) | A derivative contract whereby a buyer pays a fee to a seller in return for receiving a payment in the event of a defined credit event (e.g. bankruptcy, payment default on a reference asset or assets, or downgrades by a rating agency) on an underlying obligation (which may or may not be held by the buyer). | |
| Credit enhancements | Facilities used to enhance the creditworthiness of financial obligations and cover losses due to asset default. | |
| Credit risk | Risk of financial loss if a customer or counterparty fails to meet an obligation under a contract. It arises mainly from direct lending, trade finance and leasing business, but also from products such as guarantees, derivatives and debt securities. | |
| Credit risk mitigation | A technique to reduce the credit risk associated with an exposure by application of credit risk mitigants such as collateral, guarantee and credit derivatives. | |
| Credit risk spread | The premium over the benchmark or risk-free rate required by the market to accept a lower credit quality. The yield spread between securities with the same coupon rate and maturity structure but with different associated credit risks. The yield spread rises as the credit rating worsens. | |
| Credit spread risk | The risk that movements in credit spreads will affect the value of financial instruments. | |
| Credit valuation adjustment (‘CVA’) | An adjustment to the valuation of OTC derivative contracts to reflect the creditworthiness of OTC derivative counterparties. |
HSBC HOLDINGS PLC
484 |
Table of Contents
Term
| Definition
| |
| Cross-border revenue | Client revenue generated from serving the international subsidiaries of clients outside of the market where the parent is based; tracked using HSBC internal client data. | |
| Customer deposits | Money deposited by account holders. Such funds are recorded as liabilities. | |
| Customer remediation | Activities carried out by HSBC to compensate customers for losses or damages associated with a failure to comply with regulations. Customer remediation is initiated by HSBC in response to customer complaints, and not specifically initiated by regulatory action. | |
| Customer risk rating (‘CRR’) | A scale of 23 grades measuring obligor PD. | |
| CVA risk capital charge | A capital charge under CRDIV to cover the risk of mark-to-market losses on expected counterparty risk to derivatives. | |
| D | ||
| Debit valuation adjustment (‘DVA’) | An adjustment made by an entity to the valuation of OTC derivative liabilities to reflect within fair value the entity’s own credit risk. | |
| Debt restructuring | A restructuring by which the terms and provisions of outstanding debt agreements are changed. This is often done in order to improve cash flow and the ability of the borrower to repay the debt. It can involve altering the repayment schedule as well as debt or interest charge reduction. | |
| Debt securities | Financial assets on the Group’s balance sheet representing certificates of indebtedness of credit institutions, public bodies or other undertakings, excluding those issued by central banks. | |
| Debt securities in issue | Transferable certificates of indebtedness of the Group to the bearer of the certificates. These are liabilities of the Group and include certificates of deposits. | |
| Deed-in-lieu | An arrangement in which a borrower surrenders the deed for a property to the lender without going through foreclosure proceedings and is subsequently released from any further obligations on the loan. | |
| Defined benefit obligation | The present value of expected future payments required to settle the obligations of a defined benefit plan resulting from employee service. | |
| Deposits by banks | All deposits received from domestic and foreign banks, excluding deposits or liabilities in the form of debt securities or for which transferable certificates have been issued. | |
| Down-shock | Term given to the effect on our future net interest income of an incremental parallel fall in all yield curves worldwide at the beginning of each quarter during the 12 months from 1 January 2015, assuming no management response. An equivalent rise in yield curves is referred to as an up-shock. | |
| E | ||
| Economic capital | The internally calculated capital requirement which is deemed necessary by HSBC to support the risks to which it is exposed. | |
| Economic profit | The difference between the return on financial capital invested by shareholders and the cost of that capital. Economic profit may be expressed as a whole number or as a percentage. | |
| Economic Value of Equity (‘EVE’) sensitivity | Considers all re-pricing mismatches in the current balance sheet and calculates the change in market value that would result from a set of defined interest rate shocks. | |
| Encumbered assets | Assets on our balance sheet which have been pledged as collateral against an existing liability. | |
| Enhanced Variable Net Asset Value Fund (‘ENAV’) | A fund that prices its assets on a fair value basis. Consequently, process may change from one day to the next. | |
| Equator Principles | The Equator Principles are used by financial institutions to reduce the potential impact of large projects, which they finance, on people or on the environment. | |
| Equity risk | The risk arising from positions, either long or short, in equities or equity-based instruments, which create exposure to a change in the market price of the equities or equity instruments. | |
| Eurozone | The 18 European Union countries using the euro as their common currency. The 18 countries are Austria, Belgium, Cyprus, Estonia, Finland, France, Germany, Greece, Ireland, Italy, Latvia, Luxembourg, Malta, Netherlands, Portugal, Slovakia, Slovenia and Spain. | |
| Expected loss (‘EL’) | A regulatory calculation of the amount expected to be lost on an exposure using a 12-month time horizon and downturn loss estimates. EL is calculated by multiplying the PD (a percentage) by the EAD (an amount) and LGD (a percentage). | |
| Exposure | A claim, contingent claim or position which carries a risk of financial loss. | |
| Exposure at default (‘EAD’) | Under the standardised approach, the amount expected to be outstanding after any credit risk mitigation, if and when the counterparty defaults. Under IRB, the amount outstanding if and when the counterparty defaults. EAD reflects drawn balances as well as allowances for undrawn amounts of commitments and contingent exposures. | |
| F | ||
| Fair value adjustment | An adjustment to the fair value of a financial instrument which is determined using a valuation technique (level 2 and level 3) to include additional factors that would be considered by a market participant that are not incorporated within the valuation model. | |
| Fiduciary risk | The risk to the Group of breaching its fiduciary duties where it acts in a fiduciary capacity as trustee, investment manager or as mandated by law or regulation. | |
| Financial Conduct Authority (‘FCA’) | The Financial Conduct Authority regulates the conduct of financial firms and, for certain firms, prudential standards in the UK. It has a strategic objective to ensure that the relevant markets function well. | |
| Financial Policy Committee (‘FPC’) | The Financial Policy Committee at the BoE is charged with a primary objective of identifying, monitoring and taking action to remove or reduce systemic risks with a view to protecting and enhancing the resilience of the UK financial system. The FPC has a secondary objective to support the economic policy of the UK Government. | |
HSBC HOLDINGS PLC
485 |
Table of Contents
Shareholder information(continued)
Glossary
Term
| Definition
| |
| First lien | A security interest granted over an item of property to secure the repayment of a debt that places its holder first in line to collect repayment from the sale of the underlying collateral in the event of a default on the debt. | |
| Forbearance strategies | Employed in order to improve the management of customer relationships, maximise collection opportunities and, if possible, avoid default, foreclosure or repossession. Such arrangements include extended payment terms, a reduction in interest or principal repayments, approved external debt management plans, debt consolidations, the deferral of foreclosures, other modifications andre-ages. | |
| Funded exposure | A situation where the notional amount of a contract is or has been exchanged. | |
| Funding risk | A form of liquidity risk arising when the liquidity needed to fund illiquid asset positions cannot be obtained at the expected terms and when required. | |
| G | ||
| Gap risk | The risk of financial loss arising from a significant change in market price with no accompanying trading opportunity. | |
| Global functions | Global functions establish and manage all policies, processes and delivery platforms relevant to their activities. There are 11: Global Communications; Global Company Secretary; Global Finance; Global HR; Global Internal Audit; Global Legal; Global Marketing; Global Risk (including Compliance); Global Sustainability; HSBC Operations, Services and Technology; and Strategy and Planning. | |
| Global systemically important bank(‘G-SIB’) | The FSB established in November 2011 a methodology to identify G-SIBs based on 12 principal indicators. Designation will result in the application of a CET1 buffer between 1% and 3.5%, to be phased in by 1 January 2019. The list of G-SIBs is re-assessed through annual re-scoring of banks and a triennial review of the methodology. National regulators have discretion to introduce higher charges than the minima. In CRD IV this is implemented via the Global Systemically Important Institutions(G-SII) Buffer. The requirements, initially for those banks identified in November 2014 as G-SIBs, are being phased in from 1 January 2016, becoming fully effective on 1 January 2019. National regulators have discretion to introduce higher thresholds than the minima. | |
| Government-sponsored enterprises (‘GSE’s) | A group of financial services enterprises created by the US Congress to reduce the cost of capital for certain borrowing sectors of the economy, and to make them more efficient and transparent. Examples in the residential mortgage borrowing segment are Freddie Mac and Fannie Mae. GSEs carry the implicit backing, but are not direct obligations, of the US government. | |
| GPSP Awards | Awards that define the number of HSBC Holdings ordinary shares to which the employee will become entitled, generally five years from the date of the award, and normally subject to individual remaining in employment. The shares to which the employee becomes entitled are subject to a retention requirement until cessation of employment. | |
| Guarantee | An undertaking by a party to pay a creditor should a debtor fail to do so. | |
| H | ||
| Haircut | A discount applied by management when determining the amount at which an asset can be realised. The discount takes into account the method of realisation including the extent to which an active market for the asset exists. With respect to credit risk mitigation, a downward adjustment to collateral value to reflect any currency or maturity mismatches between the credit risk mitigant and the underlying exposure to which it is being applied. Also a valuation adjustment to reflect any fall in value between the date the collateral was called and the date of liquidation or enforcement. | |
| Historical rating transition matrices | The probability of a counterparty with a particular rating moving to a different rating over a defined time horizon. | |
| Home equity lines of credit (‘HELoC’s) | A form of revolving credit facility provided to US customers, which is supported in the majority of cases by a second lien or lower ranking charge over residential property. Holdings of HELoCs are classified as sub-prime. | |
| I | ||
| Impaired loans | Loans where the Group does not expect to collect all the contractual cash flows or expects to collect them later than they are contractually due. | |
| Impairment allowances | Management’s best estimate of losses incurred in the loan portfolios at the balance sheet date. | |
| Individually assessed impairment | Exposure to loss is assessed on all individually significant accounts and all other accounts that do not qualify for collective assessment. | |
| Insurance manufacturing | The writing of contracts that fall within the scope of insurance regulation by a Group subsidiary authorised to write such business. The risks and rewards of writing the insurance business are retained by HSBC (or reinsured in line with our reinsurance strategy). The balance sheet analysis presented in the Risk Management of Insurance Operations section shows the aggregated full balance sheets of these entities. | |
| Insurance risk | A risk, other than a financial risk, transferred from the holder of a contract to the insurance provider. The principal insurance risk is that, over time, the cost of the contract, including claims and benefits may exceed the total amount of premiums and investment income received. | |
| Internal Capital Adequacy Assessment Process | The Group’s own assessment of the levels of capital that it needs to hold through an examination of its risk profile from regulatory and economic capital viewpoints. | |
| Internal Model Method | One of three approaches defined in the Basel Framework to determine exposure values for counterparty credit risk. | |
| Internal ratings-based approach (‘IRB’) | A method of calculating credit risk capital requirements using internal, rather than supervisory, estimates of risk parameters. | |
HSBC HOLDINGS PLC
486 |
Table of Contents
Term
| Definition
| |
| Invested capital | Equity capital invested in HSBC by its shareholders, adjusted for certain reserves and goodwill previously amortised or written off. | |
| Investment grade | Represents a risk profile similar to a rating of BBB- or better, as defined by an external rating agency. | |
| IRB advanced approach (‘AIRB’) | A method of calculating credit risk capital requirements using internal PD, LGD and EAD models. | |
| IRB foundation approach (‘FIRB’) | A method of calculating credit risk capital requirements using internal PD models but with supervisory estimates of LGD and conversion factors for the calculation of EAD. | |
| ISDA Master agreement | Standardised contract developed by ISDA used as an umbrella contract under which bilateral derivatives contracts are entered into. | |
| K | ||
| Key management personnel | Directors and Group Managing Directors of HSBC Holdings. | |
| L | ||
| Legacy credit in GB&M | A separately identifiable, discretely managed business comprising Solitaire Funding Limited, the securities investment conduits, the asset-backed securities trading portfolios and credit correlation portfolios, derivative transactions entered into directly with monoline insurers, and certain other structured credit transactions. | |
| Legal proceedings | Civil court, arbitration or tribunal proceedings brought against HSBC companies (whether by way of claim or counterclaim) or civil disputes that may, if not settled, result in court, arbitration or tribunal proceedings. | |
| Legal risk | The risk of financial loss, sanction and/or reputational damage resulting from contractual risk (the risk that the rights and/or obligations of a Group member within a contractual relationship are defective); dispute risk (the risk due to an adverse dispute environment or the management of potential or actual disputes); legislative risk (the risk that a Group member fails to adhere to laws of the jurisdiction in which it operates); and non-contractual rights risk (the risk that a Group member’s assets are not properly owned or are infringed by others or the infringement by a Group member of another party’s rights). | |
| Level 1 – quoted market price | Financial instruments with quoted prices for identical instruments in active markets. | |
| Level 2 – valuation technique using observable inputs | Financial instruments with quoted prices for similar instruments in active markets or quoted prices for identical or similar instruments in inactive markets and financial instruments valued using models where all significant inputs are observable. | |
| Level 3 – valuation technique with significant unobservable inputs | Financial instruments valued using valuation techniques where one or more significant inputs are unobservable. | |
| Leveraged finance | Funding provided for entities with higher than average indebtedness, which typically arises from sub-investment grade acquisitions or event-driven financing. | |
| Leverage ratio | A measure which is the ratio of tier 1 capital to total exposures. Total exposures include on-balance sheet items, off-balance sheet items and derivatives, and should generally follow the accounting measure of exposure. This supplementary measure to the risk-based capital requirements is intended to constrain the build-up of excess leverage in the banking sector. | |
| Liquidity coverage ratio (‘LCR’) | The ratio of the stock of high quality liquid assets to expected net cash outflows over the following 30 days. High quality liquid assets should be unencumbered, liquid in markets during a time of stress and, ideally, be central bank eligible. | |
| Liquidity enhancement | Liquidity enhancement makes funds available if required for reasons other than asset default, e.g. to ensure timely repayment of maturing commercial paper. | |
| Liquidity risk | The risk that HSBC does not have sufficient financial resources to meet its obligations as they fall due, or will have to do so at an excessive cost. This risk arises from mismatches in the timing of cash flows. | |
| Loan modification | An account management action that results in a change to the original terms and conditions of a loan either temporarily or permanently without resetting its delinquency status, except in case of a ‘modification re-age’ where delinquency status is also reset to up-to-date. Account modifications may include revisions to one or more terms of the loan including, but not limited to, a change in interest rate, extension of the amortisation period, reduction in payment amount and partial forgiveness or deferment of principal. | |
| Loan re-age | An account management action that results in the resetting of the contractual delinquency status of an account to up-to-date upon fulfilment of certain requirements which indicate that payments are expected to be made in accordance with the contractual terms. | |
| Loans past due | Loans on which repayments are overdue. | |
| Loan-to-value ratio (‘LTV’) | A mathematical calculation that expresses the amount of the loan as a percentage of the value of security. A high LTV indicates that there is less cushion to protect the lender against house price falls or increases in the loan if repayments are not made and interest is added to the outstanding loan balance. | |
| Loss given default (‘LGD’) | The estimated ratio (percentage) of the loss on an exposure to the amount outstanding at default (EAD) upon default of a counterparty. | |
| Loss severity | The realised amount of losses incurred (including ancillary amounts owed) when a loan is foreclosed or disposed of through the arrangement with the borrower. The loss severity is represented as a percentage of the outstanding loan balance. | |
| M | ||
| Malus | An arrangement that permits an organisation to prevent vesting of all or part of the amount of a deferred remuneration award in relation to risk outcomes or performance. | |
HSBC HOLDINGS PLC
487 |
Table of Contents
Shareholder information(continued)
Glossary
Term
| Definition
| |
| Market risk | The risk that movements in market risk factors, including foreign exchange rates and commodity prices, interest rates, credit spreads and equity prices will reduce income or portfolio values. | |
| Medium term notes (‘MTN’s) | Issued by corporates across a range of maturities. Under MTN Programmes notes are offered on a regular and continuous basis to investors. | |
| Mortgage-backed securities (‘MBS’s) | Securities that represent interests in groups of mortgages, which may be on residential or commercial properties. Investors in these securities have the right to cash received from future mortgage payments (interest and/or principal). When the MBS references mortgages with different risk profiles, the MBS is classified according to the highest risk class. | |
| Mortgage-related assets | Referenced to underlying mortgages. | |
| Mortgage vintage | The year a mortgage was originated. | |
| N | ||
| Negative equity mortgages | Equity is the value of the asset less the outstanding balance on the loan. Negative equity arises when the value of the property purchased is below the balance outstanding on the loan. | |
| Net asset value per share | Total shareholders’ equity, less non-cumulative preference shares and capital securities, divided by the number of ordinary shares in issue. | |
| Net interest income | The amount of interest received or receivable on assets net of interest paid or payable on liabilities. | |
| Net interest income sensitivity | Considers all pricing mismatches in the current balance sheet, with suitable assumptions for balance sheet growth in the future, and calculates the change in net interest income that would result from a set of defined interest rate shocks. | |
| Net principal exposure | The gross principal amount of a financial asset after taking account of credit protection purchased but excluding the effect of any counterparty credit valuation adjustment to that protection. It includes assets that benefit from monoline protection, except where this protection is purchased with a CDS. | |
| Net stable funding ratio (‘NSFR’) | The ratio of available stable funding to required stable funding over a one year time horizon, assuming a stressed scenario. Available stable funding would include items such as equity capital, preferred stock with a maturity of over one year and liabilities with an assessed maturity of over one year. The Basel III rules require this ratio to be over 100% with effect from 2018. The NSFR is still subject to an observation period and review to address any unintended consequences. | |
| Non-conforming mortgages | US mortgages that do not meet normal lending criteria. Examples include mortgages where the expected level of documentation is not provided (such as with income self-certification), or where poor credit history increases the risk and results in pricing at a higher than normal lending rate. | |
| Non-trading portfolios | Portfolios that comprise positions that primarily arise from the interest rate management of our retail and commercial banking assets and liabilities, financial investments designated as available for sale and held to maturity, and exposures arising from our insurance operations. | |
| Non-trading risk | The market risk arising from non-trading portfolios. | |
| O | ||
| Offset mortgages | A flexible type of mortgage where a borrower’s savings balance(s) held at the same institution can be used to offset the mortgage balance outstanding. The borrower pays interest on the net balance which is calculated by subtracting the credit balance(s) from the debit balance. As part of the offset mortgage a total facility limit is agreed and the borrower may redraw up to a pre-agreed limit. | |
| Overnight Index Swap discounting | A method of valuing collateralised interest rate derivatives which uses a discount curve that reflects the overnight interest rate typically earned or paid in respect of collateral received. | |
| Operational risk | The risk of loss resulting from inadequate or failed internal processes, people and systems or from external events, including legal risk. | |
| Over-the-counter (‘OTC’) | A bilateral transaction (e.g. derivatives) that is not exchange traded and that is valued using valuation models. | |
| P | ||
| Pension risk | The risk that contributions from Group companies and members fail to generate sufficient funds to meet the cost of accruing benefits for the future service of active members, and the risk that the performance of assets held in pension funds is insufficient to cover existing pension liabilities. | |
| Performance shares | Awards of HSBC Holdings ordinary shares under employee share plans that are subject to the achievement of corporate performance conditions. | |
| Personal lending | See ‘Retail loans’. | |
| PRA standard rules | The method prescribed by the PRA for calculating market risk capital requirements in the absence of VaR model approval. | |
| Prime | A US description for mortgages granted to the most creditworthy category of borrowers. | |
| Private equity investments | Equity securities in operating companies not quoted on a public exchange, often involving the investment of capital in private companies or the acquisition of a public company that results in its delisting. | |
| Probability of default (‘PD’) | The probability that an obligor will default within one year. | |
| Profit participation contribution (‘PIS’) | A federal tax which is imposed monthly on gross revenue earned by legal entities in Brazil. It is a mandatory employer contribution to an employee savings initiative. | |
| Prudential Regulation Authority (‘PRA’) | The Prudential Regulation Authority in the UK is responsible for prudential regulation and supervision of banks, building societies, credit unions, insurers and major investment firms. | |
HSBC HOLDINGS PLC
488 |
Table of Contents
| Term | Definition | |
| R | ||
| Refi rate | The refi (or refinancing) rate is set by the European Central Bank (‘ECB’) and is the price banks pay to borrow from ECB. | |
| Regulatory capital | The capital which HSBC holds, determined in accordance with CRDIV as implemented by the PRA for the consolidated Group and by local regulators for individual Group companies. | |
| Regulatory matters | Investigations, reviews and other actions carried out by, or in response to the actions of, regulators or law enforcement agencies in connection with alleged wrongdoing by HSBC. | |
| Renegotiated loans | Loans for which the contractual payment terms have been changed because of significant concerns about the borrower’s ability to meet the contractual payments when due. | |
| Repo/reverse repo (or sale and repurchase agreement) | A short-term funding agreement that allows a borrower to create a collateralised loan by selling a financial asset to a lender. As part of the agreement the borrower commits to repurchase the security at a date in the future repaying the proceeds of the loan. For the party on the other end of the transaction (buying the security and agreeing to sell in the future) it is reverse repurchase agreement or a reverse repo. | |
| Reputational risk | The risk that illegal, unethical or inappropriate behaviour by the Group itself, members of staff or clients or representatives of the Group will damage HSBC’s reputation, leading, potentially, to a loss of business, fines or penalties. | |
| Restricted Shares | Awards that define the number of HSBC Holdings ordinary shares to which the employee will become entitled, generally between one and three years from the date of the award, and normally subject to the individual remaining in employment. The shares to which the employee becomes entitled may be subject to retention requirement. | |
| Retail loans | Money lent to individuals rather than institutions. This includes both secured and unsecured loans such as mortgages and credit card balances. | |
| Return on equity | Profit attributable to ordinary shareholders of the parent company divided by average ordinary shareholders’ equity. | |
Return on tangible equity (‘ROTE’) | Profit attributable to ordinary shareholders of the parent company, adjusted for movements in PVIF and impairments of goodwill divided by average ordinary shareholders’ equity, adjusted for PVIF, goodwill and other intangibles (net of deferred tax). | |
| Risk appetite | The aggregate level and types of risk a firm is willing to assume within its risk capacity to achieve its strategic objectives and business plan. | |
| Risk capacity | The maximum level of risk the firm can assume before breaching constraints determined by regulatory capital and liquidity needs and its obligations, also from a conduct perspective, to depositors, policyholders, other customers and shareholders. | |
| Risk-weighted assets (‘RWAs’) | Calculated by assigning a degree of risk expressed as a percentage (risk weight) to an exposure value. | |
| Run-off portfolios | Legacy credit in GB&M, the US CML portfolio and other US run-off portfolios, including the treasury services related to the US CML businesses and commercial operations in run-off. Origination of new business in the run-off portfolios has been discontinued and balances are being managed down through attrition and sale. | |
| S | ||
| Sale and repurchase agreement | See repo above. | |
| Second lien | A security interest granted over an item of property to secure the repayment of a debt that is issued against the same collateral as a first lien but that is subordinate to it. In the case of default, repayment for this debt will only be received after the first lien has been repaid. | |
| Securitisation | A transaction or scheme whereby the credit risk associated with an exposure, or pool of exposures, is tranched and where payments to investors in the transaction or scheme are dependent upon the performance of the exposure or pool of exposures. A traditional securitisation involves the transfer of the exposures being securitised to a SPE which issues securities. In a synthetic securitisation, the tranching is achieved by the use of credit derivatives and the exposures are not removed from the balance sheet of the originator. | |
| Securitisation swap | An interest rate or cross currency swap with notional linked to the size of the outstanding asset portfolio in a securitisation. Securitisation swaps are typically executed by securitisation vehicles to hedge interest rate risk arising from mismatches between the interest rate risk profile of the asset portfolio and that of the securities issued by the vehicle. | |
| Short sale | In relation to credit risk management, a ‘short sale’ is an arrangement in which a bank permits the borrower to sell the property for less than the amount outstanding under a loan agreement. The proceeds are used to reduce the outstanding loan balance and the borrower is subsequently released from any further obligations on the loan. | |
| Single-issuer liquidity facility | A liquidity or stand-by line provided to a corporate customer which is different from a similar line provided to a conduit funding vehicle. | |
| Social security financing contribution (‘COFINS’) | A federal tax imposed monthly on gross revenue earned by legal entities in Brazil. It is a contribution to finance the social security system. | |
| Sovereign exposures | Exposures to governments, ministries, departments of governments, embassies, consulates and exposures on account of cash balances and deposits with central banks. | |
| Special Purpose Entity (‘SPE’) | A corporation, trust or other non-bank entity, established for a narrowly defined purpose, including for carrying on securitisation activities. The structure of the SPE and its activities are intended to isolate its obligations from those of the originator and the holders of the beneficial interests in the securitisation. | |
HSBC HOLDINGS PLC
489 |
Table of Contents
Shareholder information(continued)
Glossary
Term
| Definition
| |
| Standardised approach (‘STD’) | In relation to credit risk, a method for calculating credit risk capital requirements using ratings agencies and supervisory risk weights. In relation to operational risk, a method of calculating the operational capital requirement by the application of a supervisory defined percentage charge to the gross income of eight specified business lines. | |
| Stressed VaR | A market risk measure based on potential market movements for a continuous one-year period of stress for a trading portfolio | |
| Structured entities (‘SE’s) | An entity that has been designed so that voting or similar rights are not the dominant factor in deciding who controls the entity, such as when voting rights relate to administrative tasks only and the relevant activities are directed by means of contractual arrangements. | |
| Structured finance/notes | An instrument whose return is linked to the level of a specified index or the level of a specified asset. The return on a structured note can be linked to equities, interest rates, foreign exchange, commodities or credit. Structured notes may or may not offer full or partial capital protection in the event of a decline in the underlying index or asset. | |
| Student loan-related assets | Securities with collateral relating to student loans. | |
| Subordinated liabilities | Liabilities which rank after the claims of other creditors of the issuer in the event of insolvency or liquidation. | |
| Sub-prime | A US description for customers with high credit risk, for example those who have limited credit histories, modest incomes, high debt-to-income ratios, high loan-to-value ratios (for real estate secured products) or have experienced credit problems caused by occasional delinquencies, prior charge-offs, bankruptcy or other credit-related problems. | |
| Sustainability risk | The risk that the environmental and social effects of providing financial services outweigh the economic benefits. | |
| Systemic Risk Buffer (‘SRB’) | A capital buffer prescribed in the EU under CRD IV, to address risks in the financial sector as a whole, or one or more sub-sectors, to be deployed as necessary by each EU member state with a view to mitigate structural macro-prudential risk. In the UK this was transposed in January 2015 and is intended to apply to ring-fenced banks and building societies over a certain threshold. | |
| Systems risk | The risk of failure or other deficiency in the automated platforms that support the Group’s daily execution and the systems infrastructure on which they reside, including data centres, networks and distributed computers. | |
| T | ||
| Tier 1 capital | A component of regulatory capital, as defined in CRDIV, comprising common equity tier 1 and additional tier 1. Additional tier 1 capital includes eligible non-common equity capital securities and any related share premium. | |
| Tier 2 capital | A component of regulatory capital, as defined in CRDIV, comprising eligible capital securities and any related share premium. | |
| Total Loss Absorbing Capacity (‘TLAC’) | Requirements set out by the FSB for global systemically important banks to have a sufficient amount of specific types of liabilities which can be used to absorb losses and recapitalise a bank in resolution. These requirements were finalised in November 2015 and are intended to facilitate an orderly resolution that minimises any impact on financial stability, ensures the continuity of critical functions, and avoids exposing taxpayers to loss. | |
| Trading portfolios | Positions arising from market-making and warehousing of customer-derived positions. | |
| Trading risk | Market risk arising from trading portfolios. | |
| Troubled debt restructuring | A US description for restructuring a debt whereby the creditor for economic or legal reasons related to a debtor’s financial difficulties grants a concession to the debtor that it would not otherwise consider. | |
| U | ||
| Unencumbered assets | Assets on our balance sheet which have not been pledged as collateral against an existing liability. | |
| Unfunded exposures | An exposure where the notional amount of a contract has not been exchanged. | |
| Up-shock | See down-shock. | |
| US government agency and US government sponsored enterprises mortgage-related assets | Securities that are guaranteed by US government agencies such as Ginnie Mae, or by US government sponsored entities including Fannie Mae and Freddie Mac. | |
| V | ||
| Value at risk (‘VaR’) | A measure of the loss that could occur on risk positions as a result of adverse movements in market risk factors (e.g. rates, prices, volatilities) over a specified time horizon and to a given level of confidence. | |
| W | ||
| Wholesale loans | Money lent to sovereign borrowers, banks, non-bank financial institutions and corporate entities. | |
| Write-down/write-off | When a financial asset is written down or written off, a customer balance is partially or fully removed, respectively, from the balance sheet. Loans (and related impairment allowance accounts) are normally written off, either partially or in full, when there is no realistic prospect of recovery. Where loans are secured, this is generally after receipt of any proceeds from the realisation of security. In circumstances where the net realisable value of any collateral has been determined and there is no reasonable expectation of further recovery, write-off may be earlier. | |
| Wrong-way risk | An adverse correlation between the counterparty’s PD and the mark-to-market value of the underlying transaction. | |
HSBC HOLDINGS PLC
490 |
Table of Contents
A
Abbreviations 479
Accounting
developments (future) 347 estimates and judgements 64, 353, 354, 378, 402, 406, 421
policies 354, 357, 358, 359, 360, 362, 364, 369, 373, 377, 378, 393, 394, 398, 401, 402, 406, 410, 414, 416, 417, 418, 419, 421, 434, 437, 440, 441, 442, 445
Accounts
approval 457
basis of preparation 65, 347
consolidation and related disclosures 353
presentation of information 352
Accruals, deferred income and other liabilities 419
Acquisitions and disposals 231, 247
Actuarial assumptions 367
Adapting HSBC 11
Adjusted performance 23, 48
Advances to core funding ratio 156, 205
Ageing analysis 127
American Depositary Shares 478b
Annual General Meeting 280
resolutions 471
Anniversary (150th) 9
Anti-money laundering and sanctions 100i, 449
Areas of special interest 116
Asia 21, 82
adjusted performance 3
adjusted/reported reconciliation 77, 78a
balance sheet data 84, 376
Certificates of deposit 63a
collateral 139
Commentary 83a
country/business highlights 32
customer accounts 63, 63m
deposits by banks 63l
financial overview 32
goodwill 407
impaired loans 128
lending 123, 124, 127, 137, 139, 147, 391
loan impairment charges/allowances 32, 132, 134
mortgage loans 147
operating expenses 82
personal lending 143
principal operations 82
profit 32, 76, 82, 84
profit/(loss) by country 82, 83
renegotiated loans 130
reverse repos 143
risk-weighted assets 3
staff numbers 60, 82
total assets 76
wholesale lending 136
Asset-backed securities 203, 383
Assets
average balance sheet 51, 63a
by country 376
by geographical region 76, 80, 84, 87, 90, 94, 376
by global business 65, 80, 84, 87, 90, 94
charged as security 401
customer accounts 63
deferred tax 371
distribution 63f
encumbered/unencumbered 162, 209
financial accounting/regulatory reconciliation 236
five years 61
held for sale 121, 122, 416
held in custody and under administration 96
intangible 410, 413
interest earning 63c
liquid assets of principal operating entities 157, 206
maturity analysis 426
movement in 2015 62
other 416
risk-weighted 2, 26, 63, 64, 228, 229, 247
total 26, 61, 65, 80, 339, 376
trading 124, 377
transferred (accounting policy) 401
Associates and joint ventures 402
accounting policy 402
Bank of Communications 403
contingent liabilities 442
critical accounting estimates and judgements 402
interests in 402
reported/adjusted 22, 25
reconciliation 49
share of profit in 60, 60f, 49a, 66, 68a, 77
transactions with other related parties 456
Auditor
arrangements 264
remuneration 368
report 323, 335
B
Back-testing 168, 214
Balance sheet
average 51, 63a
consolidated 61, 339
data 74, 80, 84, 87, 90, 94
HSBC Holdings 343
insurance manufacturing subsidiaries 181
linkages 170, 171
movement in 2015 62
regulatory 236
Balance Sheet Management 172, 216
Bancassurance 180
Basel Committee 112, 115, 241
Behaviouralisation 207, 215
Board of Directors 256
balance and independence 258
changes 8
committees 193, 262
information and support 259
meetings 257, 258
performance evaluation 260
powers 257
Borrowings (short-term) 63j
Brand 36, 114
Brazil
economic plans 454
labour claims 423
Buffers (capital) 240
Business synergies 16, 28, 29, 30, 31
C
Capital 227
buffers 240
five years 61
generation 228, 244
management 243
measurement and allocation 244
movements by major drivers 228
overview 228
ratios 26, 228
regulatory 228, 233, 239
resources 61
risks to capital 243
sensitivity 173
strength 26
Carbon dioxide emissions 98
Cash and cash equivalents 440
accounting policy 440
Cash flow
consolidated statement 340
hedges 397
HSBC Holdings 344
notes 439
payable by contractual maturities 164
Cautionary statement regarding forward-looking statements 01a
Certificates of deposit 63n
Chairman’s Committee 274
Change in registrant’s certifying accountant 98a
China (mainland) 83, 117
Chinese translation 473
Client assets 72
Climate business 37
HSBC HOLDINGS PLC
491 |
Table of Contents
Shareholder information(continued)
Index
| Collateral and credit enhancements 138, 147, 162 |
management 202, 209 |
Commercial Banking 70 adjusted performance 2, 24 adjusted/reported reconciliation 66, 68a areas of focus 28 business synergies 28 customers 28 products and services 28 risk-weighted assets 2 |
| Commercial real estate 137 |
| Committees (Board) 262, 276 |
| Communication with shareholders 284, 472 |
| Communities (investing in) 39 |
| Comparative data (changes to) 358a |
| Compliance risk 106, 178, 217 |
| Concentration of exposure 123, 196 |
| Conduct 40, 97, 332 |
| Conduct & Values committee 193, 272 |
| Conduits 443 |
| Consent orders 113, 448 |
| Constant currency 48 |
| Consumer Credit Act 422 |
| Contents 1 |
| Contingent convertible securities 438 |
Contingent liabilities, contractual commitments and guarantees 441 accounting policy 441 |
| Contractual maturity of financial liabilities 164 |
| Contractual obligations 63j |
Corporate governance 249 codes report 256 |
| Cost efficiency ratio 60, 79, 82, 86, 89, 92 |
| Cost savings 21 |
| Counterparty credit risk 232 |
| Country distribution of outstandings 153d |
| Credit default swap regulatory investigation 453 |
| Credit exposure 122 |
Credit quality 125 classifications 196, 198 |
Credit risk 118 description 105 in 2015 120 insurance 185, 222 management thereof 195 policies and practices 193 risk-weighted assets 229 |
| Credit valuation adjustment 382 |
| Critical accounting estimates and judgements 64, 353, 354, 378, 402, 406, 421 |
| Customer accounts 51, 61, 62, 63, 63d, 63h, 63m, 74, 80, 84, 87, 90, 94, 160, 339, 376, 390, 405, 417, 428, 435 |
| Customers 28, 29, 30, 31 |
| Customer lending and deposit (combined) 62 |
D |
| Dealings in HSBC Holdings plc securities 284 |
| Debit valuation adjustment 382 |
Debt securities in issue 63e, 418 accounting policy 418 |
| Defined terms 01a |
Deposits 51, 61, 62, 63d, 63h, 63l, 164 combined view 62 core 205 average balances and average rates 51 |
Derivatives accounting policy 394 assets 124 credit 141, 142, 396 interest rate 422 market risk linkages 171 trading 395 |
Differences in HSBC Holdings/New York Stock Exchange corporate governance practices 478d |
Directors appointments and re-election 257 benefits 311 biographies 249 conflicts of interest 261 emoluments 368 executive 256 |
exit payments 312 fees 311 induction 259 interests 282, 314 loss of office 312 non-executive 256 other directorships 296 payments to past Directors 311 pensions 312 performance evaluation 260, 307 relations with shareholders 261 remuneration (executive) 44, 289 remuneration (non-executive) 299, 317 service contracts 297 training and development 259 variable pay 45, 290, 303, 305 |
| Disclosure controls 98a |
| Disclosure philosophy 96 |
| Disclosures pursuant to Section 13(r) of the Securities Exchange Act 100j |
| Disposal gains/groups 416 |
| Disposals 440 |
| Dispute risk 113 |
| Diversity and inclusion 38, 278 |
Dividends 283, 371, 470, 478a income 50, 74, 337, 358 payout ratio 50 per share 27 |
E |
| Earnings per share 50, 372 |
| Earnings releases 472 |
Employees 278 compensation and benefits 318, 361 development 278 disabled 278 diversity and inclusion 38, 278 engagement 273 gender balance 38 health, welfare and safety 278 highest paid 319 material risk takers 300, 321 numbers 60, 79, 82, 86, 89, 92, 361 relations 278 remuneration policy 279, 300 reward 38 risk 104 share plans 279, 364 sign-on and severance 321 volunteering 5 whistleblowing 179 |
| Encumbered assets 162, 209 |
| Enforceability of judgements in the US 478a |
| Enhanced Disclosure Task Force 96 |
| Enquiries (from shareholders) 472 |
Equity 63c five year 61 movement in 2015 63 |
| Equity securities 169, 215 |
Europe 79 adjusted performance 3 adjusted/reported reconciliation 77, 78a balance sheet data 80, 376 certificates of deposit 63n collateral 139 commentary 79a country/business highlights 32 customer accounts 63, 63m deposits by banks 63l financial overview 32 goodwill 407 impaired loans 128 lending 123, 124, 127, 137, 139, 147, 391 loan impairment charges/allowances 32, 132, 134 mortgage loans 147 operating expenses 79 personal lending 143 principal operations 79 profit 32, 76, 79 profit/(loss) by country 79 regulation 100i |
HSBC HOLDINGS PLC
492 |
Table of Contents
renegotiated loans 130 |
reverse repos 143 risk-weighted assets 3 staff numbers 60, 79 total assets 76 wholesale lending 136 |
| Events after the balance sheet date 457 |
| Exchange controls 478a |
F |
Fair value accounting policy 378 adjustments 380 control framework 378 derivatives 395 reconciliation 384 valuation bases 382 |
| Fee income (net) 53, 60b |
| Fiduciary risk 106, 189, 224 |
| FIFA investigation 454 |
Financial assets accounting policy 357 designated at fair value 393 offsetting 358b, 434 |
| Financial crime compliance and regulatory compliance 116 |
Financial guarantee contracts 441 accounting policy 441 |
Financial instruments 359 accounting policy (fair value) 359 accounting policy (valuation) 378 at fair value 378 control framework 378 credit quality 125, 196 critical accounting estimates and judgements (valuation) 378 net income from 54, 60c not at fair value 390 past due but not impaired 127 |
Financial investments 63b, 63h, 398 accounting policy 398 gains less losses from 55, 60c |
Financial liabilities accounting policy 418 contractual maturities 164 designated at fair value 63d, 63i, 379, 418 offsetting 434 |
| Financial overview 22 |
| Financial risks (insurance) 183, 220 |
| Financial Services Compensation Scheme 442 |
| Financial System Vulnerabilities Committee 193, 268 |
| Financial statements 336 |
| Five-year comparisons 50, 61, 121, 148, 150 |
| Fixed pay 44, 287, 289, 305, 310, 315 |
| Footnotes 99, 191, 243, 346 |
| Forbearance 129, 197 |
Foreign currencies/exchange 436 exposures 436 investigations and litigation 452 rates 50, 61 translation differences 48 |
| Funding sources 160 |
| Funds transfer pricing 207 |
| Funds under management 96 |
G |
Geographical regions 3, 76 adjusted/reported reconciliation 77, 78a |
Global businesses 2, 65 adjusted/reported reconciliation 66, 68a market risk 211 |
Global Banking and Markets 71 adjusted performance 2, 24 adjusted/reported reconciliation 66, 68a areas of focus 29 business synergies 29 customers 29 fair value adjustments 381 products and services 29 risk-weighted assets 2 |
Global Private Banking 72 adjusted performance 2, 24 |
adjusted/reported reconciliation 66, 68a areas of focus 31 business synergies 31 customers 31 products and services 31 risk-weighted assets 2 |
| Global Standards 21 |
| Glossary 478f, 483 |
| Going concern 277 |
Goodwill 406 accounting policy 406 critical accounting estimates and judgements 406 impairment 407 |
| Group Audit Committee 262 |
Group Chief Executive annual assessment 307 biography 249 interests in shares 314 remuneration 313 remuneration history 313 responsibilities 256 review 10 scorecard 316 |
Group Chairman biography 249 interest in shares 314 responsibilities 256 statement 6 |
Group Chief Risk Officer annual assessment 307 biography 253 interests in shares 314 remuneration 309 scorecard 316 |
Group Company Secretary biography 254 role 259 |
Group Finance Director annual assessment 307 biography 252 interests in shares 314 remuneration 308 scorecard 316 |
| Group Management Board 262 |
| Group Managing Directors 254 |
| Group Remuneration Committee 270, 285, 302 |
| Group Risk Committee 193, 266 |
| Guarantees 441 |
H |
| Headquarters 8 |
| Health and safety 278 |
Held for sale assets 121, 122, 416 accounting policy 416 |
| Highlights 2 |
| Hiring practices investigation 455 |
| History and development 478c |
| Hong Kong regulation and supervision 100c |
| HSBC at a glance 2 |
HSBC Finance 145 foreclosures 197 loan modifications 146 |
HSBC Holdings plc balance sheet 343 cash flow 344 credit risk 152 dealing in securities 284 |
Directors’ emoluments 368 dividends 371 employee compensation 368 financial assets and liabilities 390 financial instruments not at fair value 392 foreign exchange VaR 174 |
Interest rate repricing gap 175 liquidity and funding 165, 210 market risk 174, 216 maturity analysis of assets and liabilities 432 net income from financial instruments 359 repricing gap maturities 175 share capital 281 |
HSBC HOLDINGS PLC
493 |
Table of Contents
Shareholder information(continued)
Index
statement of changes in equity 345 |
structural foreign exchange exposures 436 |
subordinated liabilities 425 |
subsidiaries, joint ventures, associates and other substantial holdings 457 |
transactions and balances with subsidiaries 457 |
| HSBC 20F reconciliation table 478g |
| Human rights 39 |
I |
| IFRSs compliance 347 |
| Impairment |
accounting policy 354 |
allowances 121, 134 |
assessment 201 |
available-for-sale financial assets 357 |
by industry and geographical region 132, 134 |
charges 22, 25, 49, 57, 121, 122 |
constant currency/reported reconciliation 149 |
critical accounting estimates and judgements 354 |
five years 150 |
goodwill 407 |
impaired loans 128, 153a |
methodologies 202 |
reported/adjusted reconciliation 49 |
| Income statement (consolidated) 50, 337 |
| Information on HSBC (availability thereof) 473 |
| Insurance |
accounting policy 359, 360 |
asset and liability matching 181 |
balance sheet of manufacturing subsidiaries 181 |
bancassurance model 180 |
claims incurred (net) and movements in liabilities to policyholders 57, 60d, 360 |
in 2015 181 |
net earned premium income 56, 60d, 359 |
products 219 |
PVIF business 411 |
reinsurers’ share of liabilities 187 |
risk 107, 180, 188, 219, 223 |
sensitivities to non-economic assumptions 188 |
| Intangible assets 410 |
accounting policy 410 |
movements 413 |
| Interest income/expense (net) 51, 60a, 63g, 63h |
accounting policy 358 |
average balance sheet 51 |
margin 63f |
sensitivities 12, 216 |
| Interest rate derivatives 422 |
| Interim results 472 |
| Internal control 275 |
effectiveness 277 |
| Internet crime 43 |
| IFRSs and Hong Kong Financial Reporting Standards comparison 347 |
| Investor relations 473 |
J |
| Jaws 27 |
| Joint ventures 405 |
K |
| Key management personnel 358d, 455 |
| Key performance indicators 19 |
L |
| Latin America |
adjusted performance 3 |
adjusted/reported reconciliation 77, 78a |
balance sheet data 94, 376 |
certificates of deposit 63n |
collateral 139 |
commentary 93a |
country/business highlights 33 |
customer accounts 63, 63m |
deposits by banks 63l |
financial overview 33 |
goodwill 407 |
impaired loans 128 |
lending 123, 124, 127, 137, 139, 147, 391 |
loan impairment charges/allowances 33, 132, 134 |
mortgage loans 147 |
operating expenses 92 |
personal lending 143 |
principal operations 92 |
profit 33, 76 |
profit/(loss) by country 93 |
renegotiated loans 130 |
reverse repos 143 |
risk-weighted assets 3 |
staff numbers 60, 92 |
total assets 76 |
wholesale lending 136 |
| Lease commitments 442 |
accounting policy 442 |
| Legal |
proceedings and regulatory matters 445 |
risk 218 |
| Lending – combined view 62 |
| Leverage ratio 239, 246 |
| Liabilities |
average balance sheet 51, 63c |
by geographical region 376 |
deferred tax 371 |
financial accounting/regulatory reconciliations 236 |
five years 61 |
interest bearing 63e |
maturity analysis 426 |
movement in 2015 62 |
offsetting 358c, 434 |
subordinated 423 |
total 61, 339 |
trading 417 |
under insurance contracts 419 |
| Libor, Euribor and other rates investigations 451 |
| LICs 22, 25, 49, 57, 60d |
by geographical regions 33, 77 |
by global business 28, 29, 30 |
reported/adjusted reconciliation 49, 49a, 66, 68a, 77 |
| Liquidity and funding 154, 204 |
assets 157, 206 |
behaviouralisation 207 |
contingent liquidity risk 159 |
description 105 |
funds transfer pricing 207 |
in 2015 155 |
insurance 187, 222 |
management of risk 156, 204 |
net contractual cash flows 158 |
policies and procedures 204 |
regulation 155 |
sources of funding 159, 204 |
| Loans and advances |
accounting policy 354 |
by country 151 |
by geographical region 123, 124 |
by industry over five years 148 |
collateral 138, 147, 202 |
commercial real estate 137 |
concentration of exposure 123 |
credit quality of 125 |
impairment 121 |
in held for sale 122 |
maturity and interest sensitivity 63k |
past due but not impaired 127 |
renegotiated 129 |
risk elements 153a |
to banks 63a, 63g, 354, 391 |
to customers 26, 63b, 63g, 121, 354, 391 |
write-off 201 |
| Loan Management Unit 202 |
M |
| Madoff 446 |
| Management’s assessment of internal controls over financial reporting 98a |
| Market risk 166, 210 |
balance sheet linkages 170 |
description 105 |
governance 211 |
in 2015 167 |
insurance 184 |
measures 212 |
HSBC HOLDINGS PLC
494 |
Table of Contents
| risk-weighting assets 232 |
sensitivity analysis 172, 173 |
capital and reserves 173 |
net interest income 172 |
| Material risk takers 321 |
| Maturity analysis of assets and liabilities 426 |
| Maximum exposure to credit risk 122 |
| Metals and mining 117 |
| Memorandum and Articles of Association 478c |
| Middle East and North Africa |
adjusted performance 3 |
adjusted/reported reconciliation 77, 78a |
balance sheet data 87, 376 |
certificates of deposit 63n |
collateral 139 |
commentary 86a |
country/business highlights 33 |
customer accounts 63, 63m |
deposits by banks 63l |
financial overview 33 |
goodwill 407 |
impaired loans 128 |
lending 123, 124, 127, 137, 139, 147, 391 |
loan impairment charges/allowances 132, 134 |
mortgage loans 147 |
operating expenses 86 |
personal lending 143 |
principal operations 86 |
profit 33, 76, 86 |
profit/(loss) by country 86 |
renegotiated loans 130 |
reverse repos 143 |
risk-weighted assets 3 |
staff numbers 60, 86 |
total assets 76 |
wholesale lending 136 |
| Model risk 115 |
| Monitor 116 |
| Mortgages |
lending 144 |
mortgage-backed securities 203 |
US mortgage-related investigations 448 |
N |
| Network |
delivery 14 |
value 16 |
| Nomination Committee 270 |
| Non-controlling interests 436 |
| Non-GAAP measures 48 |
| Non-interest income 358 |
| Non-statutory accounts 46a |
| Non-trading portfolios 169, 214 |
| North America |
adjusted performance 3 |
adjusted/reported reconciliation 77, 78a |
balance sheet data 90, 376 |
certificates of deposit 63n |
collateral 139 |
commentary 89a |
country/business highlights 33 |
customer accounts 63, 63m |
deposits by banks 63l |
financial overview 33 |
goodwill 407 |
impaired loans 128 |
lending 123, 124, 127, 137, 139, 147, 391 |
loan impairment charges/allowances 33, 132, 134 |
mortgage loans 147 |
operating expenses 89 |
personal lending 143 |
principal operations 89 |
profit 33, 76, 89, 90 |
profit/(loss) by country 89 |
renegotiated loans 130 |
reverse repos 143 |
risk-weighted assets 3 |
staff numbers 60, 89 |
total assets 76 |
wholesale lending 136 |
O |
| Offsetting 358b, 434 |
accounting policy 434 |
| Oil and gas prices 117 |
| Operating expenses 58, 60e |
by geographical region 77, 82, 86, 89, 92 |
by global business 28, 29, 30, 31 |
reported/adjusted 22, 25 |
reconciliation 49, 49a, 66, 68a, 77 |
| Operating income 56, 60d, 358, 358a, 376 |
| Operating profit 361 |
| Operational risk 176, 217 |
description 106 |
in 2015 177 |
losses/incidents 177 |
management framework 176 |
| Ordinary shares 281 |
| Organisational structure chart 474 |
| Other 73 |
| Outlook 9, 11 |
P |
| Payment protection insurance 421 |
| Pension plans |
accounting policy 364 |
defined benefit plans 174, 216, 366 |
for directors 312 |
risk 107, 189, 225 |
| People |
empowering 38 |
risk 43, 114 |
| Performance 285 |
adjusted 23, 48 |
reported 22 |
| Perpetual subordinated capital securities 372 |
| Personal lending 143 |
| Philanthropic & Community Investment Oversight Committee 274 |
| Pillar I, II and III 240, 246 |
| Post-employment benefit plans 364, 456 |
accounting policy 364 |
| Precious metals fix-related litigation and investigations 453 |
| Preference shares 437 |
| Preferred securities 61 |
| Prepayments, accrued income and other assets 416 |
| Products and services 28, 29, 30, 31, 373 |
| Profit before tax |
adjusted 3, 23, 285 |
by country 79, 83, 86, 89, 93 |
by geographical region 3, 76, 82, 86, 89, 92 |
by global business 2, 28, 29, 30, 31, 65, 74, 80, 84, 87, 90, 94 |
consolidated 50, 337 |
five years 50 |
reported 3, 22 |
reported/adjusted reconciliation 49, 49a, 66, 68a, 77 |
| Profit for the year 50 |
| Property 98 |
| Provisions 421 |
accounting policy 421 |
critical accounting estimates and judgements 421 |
| Prudential and other regulatory developments 100h |
| PVIF 57, 411 |
R |
| Ratios |
advances to core funding 156, 205 |
capital 26, 228 |
capital strength 26 |
common equity tier 1 26, 42, 228 |
core tier 1 (CET 1) 26 |
cost efficiency 60, 79, 82, 86, 89, 92 |
dividend payout 50 |
dividends per share 50, 371 |
earnings per share 50, 372 |
earnings to fixed charges 63o |
leverage 239, 246 |
liquidity coverage 155 |
net asset value per ordinary share 61 |
return on average ordinary shareholders’ equity 27, 50, 285 |
return on average total assets 50 |
HSBC HOLDINGS PLC
495 |
Table of Contents
Shareholder information(continued)
Index
return on equity 49b
return on risk-weighted assets 64, 79, 82, 86, 89, 92
return on tangible equity 49b
stressed coverage 157, 205
Reconciliation of reported and adjusted items 49, 66, 77
Reconciliation of RoRWA 64
Recovery and resolution 100h, 242
Registered office 497
Registrars 497
Regulation and supervision 100b
Regulatory
balance sheet 236
capital 233, 234, 244
capital buffers 239
developments 239
landscape 7
reconciliation to financial accounting 236
review of consumer enhancement services products 454
source and application 233
stress tests 116, 241
Related party transactions 358d, 455
Remuneration
adjustment, malus and clawback 301
benefits 305
bonus scorecards 315
business context 286
committee 270
committee members 270
directors 44, 289, 299, 317
fixed pay 44, 289, 295, 305, 310
GPSP 310
in 2015 286
in 2016/17 287, 295
incentive scorecards 316, 317
letter 285
Pillar 3 remuneration 319
policy 45, 288, 315
principles 44
recruitment 296
release profile 294
report 302
reward strategy 279
scenarios 296
single figure 44, 305
variable pay 286, 303
Renegotiated loans 129, 197
Renewable energy 37
Repricing gap 175
Repurchase and reverse repurchase agreements 63b, 63d, 63g, 63i, 63j, 208 accounting policy 358
Reputational risk 106, 189, 225
Resolution strategy 242
Retail Banking and Wealth Management 68
adjusted performance 2, 24
adjusted/reported reconciliation 66, 68a
areas of focus 30
business synergies 30
customers 30
principal RBWM business 68
products and services 30
risk-weighted assets 2
Revenue
by country 79, 82, 86, 89, 92
by geographical region 77, 79, 82, 86, 89, 92
by global business 28, 29, 30, 31, 66
reported/adjusted 22, 24
reconciliation 49, 49a, 66, 68a, 77
Ring-fencing (UK) 111, 242
Risk
appetite 102, 194
assessment 278
banking risks 105
business, operations, governance and internal control systems 109f
committee 266
compliance 106, 178, 217
conduct of business 112
contingent liquidity 159
counterparty 232
credit 105, 120, 195
credit cycle 111
credit spread 173, 214
cross-currency 210
cyber 114
data management 115
de-peg 214
dispute 113
economic outlook 110
elements 153a
eurozone 110
execution 114
factors 108, 109a
fiduciary 106, 189, 224
financial (insurance) 107, 183, 220
foreign exchange 174
gap 214
geopolitical 110
governance 102, 193
in 2015 42
information security 218, 269
insurance operations 107, 108, 180, 188, 219, 223
interest rate 208, 220
internet crime 267
legal 218
liquidity and funding 105, 154, 204
macroeconomic and geopolitical 109a
macro-prudential 109b
management of 42, 101
market 105, 166, 210
model 115
non-trading interest rate 215
oil and gas prices 117
operational 106, 176, 217
overview 42
people 43, 104, 114
pension 107, 189, 224
policies and practices 193
refinance 203
regulatory 111
reputational 106, 189, 225
security and fraud 218
stress testing 42, 103, 243
sustainability 107, 190, 226
systems 219
third party 115
top and emerging 43, 103, 110
US deferred prosecution agreement 113
vendor 219
Risk Management Meeting 194
Risk-weighted assets 26, 229
basis of preparation 247
by geographical region 3, 76, 229
by global businesses 2, 65, 229
counterparty 232
developments 241
five years 61
market risk 232
movement in 2015 20, 63
run-off portfolios 64, 229
targets 20
Role in society 4
RoRWA (reconciliation of measures) 64
S
Securities litigation 445
Securitisation 443
exposures 152, 203
litigation 449
Security and fraud risk 218
Segmental analysis 358a, 373
accounting policy 373
Senior management
biographies 254
emoluments 318
Sensitivities to non-economic assumptions (insurance) 188
Share-based payments 362
accounting policy 362
Share capital 281, 437
accounting policy 437
five years 61
HSBC HOLDINGS PLC
496 |
Table of Contents
in 2015 281 |
notifiable interests 284 |
rights and obligations 281 |
treasury shares 282 |
| Share options 364, 439 |
| Share plans |
for directors 282, 314 |
for employees 279, 282, 363 |
| Shareholder (communications with) 284, 472 |
numbers 470 |
profile 470 |
votes 315 |
| Significant items 49, 52, 53, 54, 55, 56, 57, 59 |
| Sources of funds 160 |
| Standards (Global) 275 |
| Statement of changes in equity 341, 345 |
| Statement of comprehensive income (consolidated) 338 |
| Stockbrokers 497 |
| Stock symbols 473 |
| Strategy 7, 12, 276 |
progress on strategic actions 20 |
| Stress testing 205, 213 |
| Stressed coverage ratios 157, 205 |
| Structural foreign exchange exposure 215 |
| Structured entities 442 |
accounting policy 442, 445 |
HSBC sponsored 445 |
| Subordinated loan capital 61, 340, 344 |
| Subsidiaries 414 |
accounting policy 414 |
| Sufficiency of float 284 |
| Sustainability 39 |
risk 107, 190, 226 |
| Systems risk 219 |
T |
| Targets 27 |
| Tax |
accounting policy 369 |
approach to 39 |
critical accounting estimates and judgements 370 |
deferred tax 371 |
expense 60, 60f, 370 |
of shares and dividends 475 |
paid by region and country 97 |
reconciliation 370 |
tax-related investigations 451 |
| Three lines of defence 104, 177 |
| Tier 1 securities 438 |
| Tier 2 securities 426 |
| Total loss absorbing capacity 242 |
| Total shareholder return 312 |
| Trade corridors 14 |
| Trading assets 124, 377 |
accounting policy 377 |
| Trading income (net) 54, 60b |
| Trading liabilities 417 |
accounting policy 417 |
| Trading market (nature) 478b |
| Trading portfolios 167, 213 |
| Troubled debt restructurings 153a |
U |
| UK leverage ratio framework 241 |
| UK regulation and supervision 100b |
| Unobservable inputs 386 |
| US 20 |
| US regulation and supervision 100d |
V |
| Value at risk 167, 212 |
| Value of the network 14, 46 |
| Values (HSBC) 4, 34 |
| Vendor risk management 219 |
| Viability 277 |
| Volunteering 5 |
W |
| Whistleblowing 179 |
| Wholesale funding 155, 207 |
| Wholesale lending 135 |
HSBC HOLDINGS PLC
497 |
Table of Contents
HSBC HOLDINGS PLC
Incorporated in England on 1 January 1959 with limited
liability under the UK Companies Act
Registered in England: number 617987
REGISTERED OFFICE AND
GROUP HEAD OFFICE
8 Canada Square
London E14 5HQ
United Kingdom
Telephone: 44 020 7991 8888
Facsimile: 44 020 7992 4880
Web: www.hsbc.com
REGISTRARS
Principal Register
Computershare Investor Services PLC
The Pavilions
Bridgwater Road
Bristol BS99 6ZZ
United Kingdom
Telephone: 44 0870 702 0137
Email: via website
Web: www.investorcentre.co.uk/contactus
Hong Kong Overseas Branch Register
Computershare Hong Kong Investor Services
Limited
Rooms 1712-1716, 17th floor
Hopewell Centre
183 Queen’s Road East
Hong Kong
Telephone: 852 2862 8555
Email: hsbc.ecom@computershare.com.hk
Web: www.computershare.com/hk/investors
Bermuda Overseas Branch Register
Investor Relations Team
HSBC Bank Bermuda Limited
6 Front Street
Hamilton HM11
Bermuda
Telephone: 1 441 299 6737
Email: hbbm.shareholder.services@hsbc.bm
Web: www.computershare.com/investor/bm
ADR Depositary
The Bank of New York Mellon
Depositary Receipts
PO Box 30170
College Station, TX 77842-3170
USA
Telephone (US): 1 877 283 5786
Telephone (International): 1 201 680 6825
Email: shrrelations@bnymellon.com
Web: www.computershare.com/us/contact/ Pages/default.aspx
Paying Agent (France)
HSBC France
103 avenue des Champs Elysées
75419 Paris Cedex 08
France
Telephone: 33 1 40 70 22 56
Email: ost-agence-des-titres-hsbc-reims.hbfr-do@hsbc.fr
Web: www.hsbc.fr
STOCKBROKERS
Goldman Sachs International
Peterborough Court
133 Fleet Street
London EC4A 2BB
United Kingdom
Credit Suisse Securities (Europe) Limited
1 Cabot Square
London E14 4QT
United Kingdom
HSBC Bank plc
8 Canada Square
London E14 5HQ
United Kingdom
HSBC HOLDINGS PLC
498 |
Table of Contents
Item 19. Exhibits
Documents files as exhibits to this Form 20-F:
| Exhibit Number | Description | |
| 1.1 | Memorandum and Articles of Association of HSBC Holdings plc (incorporated by reference to Exhibit 1.1 to HSBC Holdings plc’s Form 20-F filed with the Securities and Exchange Commission on March 8, 2011). | |
| 2.1 | The total amount of long-term debt securities of HSBC Holdings plc authorized under any instrument does not exceed 10 percent of the total assets of the Group on a consolidated basis. HSBC Holdings plc hereby agrees to furnish to the Commission, upon its request, a copy of any instrument defining the rights of holders of long-term debt of HSBC Holdings plc or of its subsidiaries for which consolidated or unconsolidated financial statements are required to be filed. | |
| 4.1 | Service Agreement dated December 9, 2010 between HSBC Holdings plc and Marc Moses, as amended by a letter agreement dated November 1, 2013 by HSBC Holdings plc (incorporated by reference to Exhibit 4.1 to HSBC Holdings plc’s Form 20-F filed with the Securities and Exchange Commission on February 28, 2014). | |
| 4.2 | Deferred Prosecution Agreement dated December 11, 2012, between HSBC Holdings plc, HSBC Bank USA, N.A., HSBC North America Holdings, Inc., the United States Department of Justice, the United States Attorney’s Office for the Eastern District of New York and the United States Attorney’s Office for the Northern District of West Virginia (incorporated by reference to Exhibit 99.1 to HSBC Holdings plc’s Form 6-K filed with the Securities and Exchange Commission on December 12, 2012). | |
| 4.3 | Consent to the Assessment of a Civil Money Penalty dated December 11, 2012, of the United States Department of Treasury Financial Crimes Enforcement Network in the Matter of HSBC Bank USA, N.A. (incorporated by reference to Exhibit 99.2 to HSBC Holdings plc’s Form 6-K filed with the Securities and Exchange Commission on December 12, 2012). | |
| 4.4 | Undertaking by HSBC Holdings plc to the Financial Services Authority (incorporated by reference to Exhibit 99.3 to HSBC Holdings plc’s Form 6-K filed with the Securities and Exchange Commission on December 12, 2012), as replaced by the Direction by the Financial Conduct Authority to HSBC Holdings plc (incorporated by reference to HSBC Holdings plc’s Form 6-K filed with the Securities and Exchange Commission on April 12, 2013). | |
| 4.5 | Cease and Desist Order issued by the Board of Governors of the United States Federal Reserve System in the Matter of HSBC Holdings plc (incorporated by reference to Exhibit 99.5 to HSBC Holdings plc’s Form 6-K filed with the Securities and Exchange Commission on December 12, 2012). | |
| 4.6 | Order of Assessment of a Civil Money Penalty Issued Upon Consent Issued by the Board of Governors of the U.S. Federal Reserve System in the Matter of HSBC Holdings plc and HSBC North America Holdings, Inc. (incorporated by reference to Exhibit 99.6 to HSBC Holdings plc’s Form 6-K filed with the Securities and Exchange Commission on December 12, 2012). | |
Table of Contents
| 4.7 | Settlement Agreement between HSBC Holdings plc, and the United States Department of the Treasury’s Office of Foreign Assets Control (incorporated by reference to Exhibit 99.7 to HSBC Holdings plc’s Form 6-K filed with the Securities and Exchange Commission on December 12, 2012). | |
| 4.8 | Consent Order dated December 11, 2012, of the Comptroller of the Currency of the United States in the Matter of HSBC Bank USA, N.A. (incorporated by reference to Exhibit 99.8 to HSBC Holdings plc’s Form 6-K filed with the Securities and Exchange Commission on December 12, 2012). | |
| 4.9 | Consent Order for the Assessment of a Civil Money Penalty dated December 11, 2012, of the Comptroller of the Currency of the United States in the Matter of HSBC Bank USA, N.A. (incorporated by reference to Exhibit 99.9 to HSBC Holdings plc’s Form 6-K filed with the Securities and Exchange Commission on December 12, 2012). | |
| 4.10 | Agreement by and between HSBC Bank USA, N.A. McLean, Virginia and the Office of the Comptroller of the Currency dated December 11, 2012 (incorporated by reference to Exhibit 99.10 to HSBC Holdings plc’s Form 6-K filed with the Securities and Exchange Commission on December 12, 2012). | |
| 4.11 | Final Notice from the Financial Conduct Authority to HSBC Bank plc dated November 11, 2014 (incorporated by reference to Exhibit 99.1 to HSBC Holdings plc’s Form 6-K filed with the Securities and Exchange Commission on November 13, 2014). | |
| 4.12 | Order Instituting Proceedings Pursuant to Sections 6(c)(4)(A) and 6(d) of the Commodity Exchange Act, Making Findings, and Imposing Remedial Sanctions dated 11 November 2014 of the CFTC in the Matter of HSBC Bank plc (incorporated by reference to Exhibit 99.2 to HSBC Holdings plc’s Form 6-K filed with the Securities and Exchange Commission on November 13, 2014). | |
| 7.1 | Computation of ratios of earnings to combined fixed charges (and preference share dividends). | |
| 8.1 | Subsidiaries of HSBC Holdings plc (set forth in Note 21 to the consolidated financial statements included in this Form 20-F). | |
| 12.1 | Certificate of HSBC Holdings plc’s Group Chief Executive pursuant to Section 302 of the Sarbanes-Oxley Act of 2002. | |
| 12.2 | Certificate of HSBC Holdings plc’s Group Finance Director pursuant to Section 302 of the Sarbanes-Oxley Act of 2002. | |
| 13.1 | Annual Certification of HSBC Holdings plc’s Group Chief Executive and Group Finance Director pursuant to Section 906 of the Sarbanes-Oxley Act of 2002. | |
| 15.1 | Consent of PricewaterhouseCoopers LLP | |
| 15.2 | Consent of KPMG Audit Plc. | |
| 15.3 | Pages of HSBC Holdings plc’s 2000 Form 20-F/A dated February 26, 2001 relating to the Memorandum and Articles of Association of HSBC Holdings plc (incorporated by reference to Exhibit 14.2 to HSBC Holdings plc’s Form 20-F filed with the Securities and Exchange Commission on March 20, 2006). | |
| 15.4 | Pages of HSBC Holdings plc’s 2001 Form 20-F dated March 13, 2002 relating to the Memorandum and Articles of Association of HSBC Holdings plc (incorporated by reference to Exhibit 14.3 to HSBC Holdings plc’s Form 20-F filed with the Securities and Exchange Commission on March 20, 2006). | |
| 15.5 | Consent of C G Singer. | |
Table of Contents
SIGNATURES
The registrant hereby certifies that it meets all of the requirements for filing on Form 20-F and that it has duly caused and authorized the undersigned to sign this annual report on its behalf.
| HSBC Holdings plc | ||
| By: | /s/ Iain J Mackay | |
| Name: Iain J Mackay | ||
| Title: Group Finance Director | ||
Dated: 25 February 2016